UNITED STATES
SECURITIES AND EXCHANGE COMMISSION
Washington, D.C. 20549
FORM N-CSR
CERTIFIED SHAREHOLDER REPORT OF REGISTERED
MANAGEMENT INVESTMENT COMPANIES
Investment Company Act file number 811-5018
Legg Mason Partners Investment Series
(Exact name of registrant as specified in charter)
| | |
125 Broad Street, New York, NY | | 10004 |
(Address of principal executive offices) | | (Zip code) |
Robert I. Frenkel, Esq.
Legg Mason & Co., LLC
300 First Stamford Place, 4th Fl.
Stamford, CT 06902
(Name and address of agent for service)
Registrant’s telephone number, including area code: (800) 451-2010
Date of fiscal year end: October 31
Date of reporting period: October 31, 2006
ITEM 1. REPORT TO STOCKHOLDERS.
The Annual Report to Stockholders is filed herewith.
ANNUAL REPORT
OCTOBER 31, 2006


Legg Mason Partners Investment Series
Legg Mason Partners Variable Premier Selections All Cap Growth Portfolio
Legg Mason Partners Variable Dividend Strategy Portfolio
Legg Mason Partners Variable Growth and Income Portfolio
Legg Mason Partners Variable Government Portfolio
INVESTMENT PRODUCTS: NOT FDIC INSURED Ÿ NO BANK GUARANTEE Ÿ MAY LOSE VALUE
Legg Mason Partners Investment Series
Annual Report Ÿ October 31, 2006
What’s
Inside
Letter from the Chairman

R. JAY GERKEN
Chairman, President and Chief Executive Officer
Dear Shareholder,
While the U.S. economy continued to expand, it weakened considerably as the reporting period progressed. After expanding 4.1% in the third quarter of 2005, gross domestic product (“GDP”)i increased a modest 1.7% during the last three months of the year. The economy then rebounded sharply in the first quarter of 2006. Over this period, GDP rose 5.6%, its highest reading since the third quarter of 2003. The economy then took a step backwards in the second quarter 2006, as GDP growth was 2.6% according to the U.S. Commerce Department. The preliminary estimate for third quarter GDP growth was 2.2%.
After increasing the federal funds rateii to 5.25% in June—its 17th consecutive rate hike—the Federal Reserve Board (“Fed”)iii paused from raising rates at its next four meetings. In its statement accompanying the December meeting, the Fed stated, “Economic growth has slowed over the course of the year, partly reflecting a substantial cooling of the housing market. Although recent indicators have been mixed, the economy seems likely to expand at a moderate pace on balance over coming quarters.” The Fed’s next meeting is at the end of January, and we believe any further rate movements will likely be data dependent.
For the 12-month period ended October 31, 2006, the U.S. stock market generated solid results, with the S&P 500 Indexiv returning 16.33%. For much of the period, stock prices moved in fits and starts due to continued interest rate hikes, high oil prices and inflationary pressures. However, toward the end of the period, several of these overhangs were removed, as the Fed paused from tightening rates and, after peaking at $78 a barrel in mid-July, subsequently, oil prices fell 15%.v
Both short- and long-term yields rose over the reporting period. However, after peaking in late June—with two- and 10-year Treasuries hitting 5.29% and 5.25%, respectively—rates fell sharply as the Fed paused from its tightening cycle. In addition, inflationary pressures eased as oil prices declined. Overall, during the 12 months ended October 31, 2006, two-year Treasury yields increased from 4.40% to 4.71%.
Legg Mason Partners Investment Series I
Over the same period, 10-year Treasury yields moved from 4.57% to 4.61%. Looking at the 12-month period as a whole, the overall bond market, as measured by the Lehman Brothers U.S. Aggregate Index,vi returned 5.19%.
Within this environment, the Portfolios performed as follows:
| | | | |
| Performance Snapshot as of October 31, 2006 (unaudited) | | |
| | |
| | | 6 months | | 12 months |
Legg Mason Partners Variable Premier Selections
All Cap Growth Portfolio1 | | 0.22% | | 9.77% |
| |
Russell 1000 Growth Index | | 3.53% | | 10.84% |
| |
Russell 2000 Growth Index | | -2.69% | | 17.07% |
| |
S&P Midcap 400 Index | | -1.59% | | 13.43% |
| |
Lipper Variable Multi-Cap Growth Funds Category Average | | -0.69% | | 10.51% |
| |
Legg Mason Partners Variable Dividend Strategy Portfolio1 | | 7.21% | | 16.89% |
| |
S&P 500 Index | | 6.10% | | 16.33% |
| |
Lipper Variable Large-Cap Core Funds Category Average | | 4.34% | | 14.24% |
| |
Legg Mason Partners Variable Growth and Income Portfolio1 | | 2.51% | | 13.13% |
| |
S&P 500 Index | | 6.10% | | 16.33% |
| |
Lipper Variable Large-Cap Core Funds Category Average | | 4.34% | | 14.24% |
| |
Legg Mason Partners Variable Government Portfolio1 | | 4.42% | | 4.66% |
| |
Lehman Brothers Government Bond Index | | 4.39% | | 4.58% |
| |
Lipper Variable General U.S. Government Funds Category Average | | 4.15% | | 3.90% |
| |
| The performance shown represents past performance. Past performance is no guarantee of future results and current performance may be higher or lower than the performance shown above. Principal value and investment returns will fluctuate and investors’ shares, when redeemed, may be worth more or less than their original cost. |
| Portfolio returns assume the reinvestment of all distributions including returns of capital, if any, at net asset value and the deduction of all fund expenses. |
| Lipper, Inc. is a major independent mutual-fund tracking organization. |
| Returns were calculated among the 166 funds for the six-month period and among the 157 funds for the 12-month period in the Lipper Variable Multi-Cap Growth Funds Category. |
| Returns were calculated among the 227 funds for the six-month period and among the 224 funds for the 12-month period in the Lipper Variable Large-Cap Core Funds Category. |
| Returns were calculated among the 68 funds for the six-month period and among the 64 funds for the 12-month period in the Lipper Variable General U.S. Government Funds Category. |
| 1 | | The Portfolio is an underlying investment option of various variable annuity and variable life insurance products. The Portfolio’s performance returns do not reflect the deduction of initial sales charges and expenses imposed in connection with investing in variable annuity or variable life insurance contracts, such as administrative fees, account charges, and surrender charges, which, if reflected, would reduce the performance of the Portfolio. Past performance is no guarantee of future results. |
II Legg Mason Partners Investment Series
Please read on for a more detailed look at prevailing economic and market conditions during the Portfolios’ fiscal year and to learn how those conditions have affected performance.
Special Shareholder Notices
As part of the continuing effort to integrate investment products managed by the advisers acquired with Citigroup Inc.’s asset management business, Legg Mason, Inc. (“Legg Mason”) recommended various Portfolio actions in order to streamline product offerings, eliminate redundancies and improve efficiencies within the organization. At Board meetings held during June and July 2006, the Portfolio’s Board reviewed and approved these recommendations, and provided authorization to move ahead with proxy solicitations for those matters needing shareholder approval.
Legg Mason Partners Variable Premier Selections All Cap Growth Portfolio
Effective August 1, 2006, Legg Mason Partners Fund Advisor, LLC (“LMPFA”) became the Portfolio’s investment manager and ClearBridge Advisors, LLC (“ClearBridge”), formerly CAM North America, LLC, became the Portfolio’s subadviser. The portfolio managers who are responsible for the day-to-day management of the Portfolio remain the same immediately prior to and immediately after the date of these changes. LMPFA and ClearBridge are wholly-owned subsidiaries of Legg Mason.
The Portfolio’s Board also approved a reorganization pursuant to which the Portfolio’s assets would be acquired, and its liabilities assumed by the Legg Mason Partners Variable Portfolios III—Legg Mason Partners Variable Aggressive Growth Portfolio (the “Acquiring Portfolio”), in exchange for shares of the Acquiring Portfolio. The Portfolio would then be liquidated, and shares of the Acquiring Portfolio would be distributed to Portfolio shareholders. If shareholder approval is obtained, Portfolio actions are generally expected to be implemented on or about May 1, 2007.
Effective June 30, 2006, Brian M. Angerame and Derek J. Deutsch, CFA, each of whom is a Director and Portfolio Manager for ClearBridge, manage the day-to-day operating
Legg Mason Partners Investment Series III
of the Portfolio’s Mid-Cap Growth segment, including initiating buy/sell orders and coordinating with research personnel. Mr. Angerame joined the manager or its affiliates or predecessor firms in 2000; Mr. Deutsch joined in 1999.
The Portfolio was formerly known as Smith Barney Premier Selections All Cap Growth Portfolio.
Legg Mason Partners Variable Dividend Strategy Portfolio
Effective August 1, 2006, Legg Mason Partners Fund Advisor, LLC (“LMPFA”) became the Portfolio’s investment manager and ClearBridge Advisors, LLC (“ClearBridge”), formerly CAM North America, LLC, became the Portfolio’s subadviser. The portfolio managers who are responsible for the day-to-day management of the Portfolio remain the same immediately prior to and immediately after the date of these changes. LMPFA and ClearBridge are wholly-owned subsidiaries of Legg Mason.
The Fund was formerly known as Smith Barney Dividend Strategy Portfolio.
Legg Mason Partners Variable Growth and Income Portfolio
Effective August 1, 2006, Legg Mason Partners Fund Advisor, LLC (“LMPFA”) became the Portfolio’s investment manager and ClearBridge Advisors, LLC (“ClearBridge”), formerly CAM North America, LLC became the Portfolio’s subadviser. The portfolio manager who is responsible for the day-to-day management of the Portfolio remains the same immediately prior to and immediately after the date of these changes. Michael Kagan, investment officer of the manager and co-director of research for ClearBridge, has managed or co-managed the Portfolio since 2000. LMPFA and ClearBridge, are wholly-owned subsidiaries of Legg Mason.
Shareholder approval of a reorganization pursuant to which the Portfolio’s assets will be acquired, and its liabilities assumed by the Legg Mason Partners Variable Appreciation Portfolio (“the Acquiring Portfolio”), in exchange for shares of the Acquiring Portfolio has been obtained. It is expected that the Portfolio will then be liquidated, and shares of the
IV Legg Mason Partners Investment Series
Acquiring Portfolio will be distributed to Portfolio shareholders on or about May 1, 2007.
The Portfolio was formerly known as Smith Barney Growth and Income Portfolio.
Legg Mason Partners Variable Government Portfolio
Effective August 1, 2006, Legg Mason Partners Fund Advisor, LLC (“LMPFA”) became the Portfolio’s investment manager and Western Asset Management Company (“Western Asset”) became the Portfolio’s subadviser. The portfolio managers who are responsible for the day-to-day management of the Portfolio remained the same immediately prior to and immediately after the date of these changes. LMPFA and Western Asset are wholly-owned subsidiaries of Legg Mason.
Additionally, effective November 1, 2006, the Portfolio’s Board approved a change in the Portfolio’s benchmark to the Lehman Brothers U.S. Fixed-Rate Mortgage Backed Securities Indexvii to reflect the Fund’s increased focus on mortgage-related securities issued or guaranteed by the U.S. government, its agencies or instrumentalities.
The Portfolio was formerly known as SB Government Portfolio.
Information About Your Portfolios
As you may be aware, several issues in the mutual fund industry have come under the scrutiny of federal and state regulators. Affiliates of the Portfolios’ manager have, in recent years, received requests for information from various government regulators regarding market timing, late trading, fees, and other mutual fund issues in connection with various investigations. The regulators appear to be examining, among other things, the Portfolios’ response to market timing and shareholder exchange activity, including compliance with prospectus disclosure related to these subjects. The Portfolios are not in a position to predict the outcome of these requests and investigations.
Important information with regard to recent regulatory developments that may affect the Portfolios are contained in the Notes to Financial Statements included in this report.
Legg Mason Partners Investment Series V
As always, thank you for your confidence in our stewardship of your assets. We look forward to helping you to meet your financial goals.
Sincerely,

R. Jay Gerken, CFA
Chairman, President and Chief Executive Officer
December 13, 2006
All index performance reflects no deduction for fees, expenses or taxes. Please note that an investor cannot invest directly in an index.
| i | | Gross domestic product is a market value of goods and services produced by labor and property in a given country. |
| ii | | The federal funds rate is the interest rate that banks with excess reserves at a Federal Reserve district bank charge other banks that need overnight loans. |
| iii | | The Federal Reserve Board is responsible for the formulation of a policy designed to promote economic growth, full employment, stable prices, and a sustainable pattern of international trade and payments. |
| iv | | The S&P 500 Index is an unmanaged index of 500 stocks that is generally representative of the performance of larger companies in the U.S. |
| v | | Source: The Wall Street Journal, 9/29/06 |
| vi | | The Lehman Brothers U.S. Aggregate Index is a broad-based bond index comprised of government, corporate, mortgage and asset-backed issues, rated investment grade or higher, and having at least one year to maturity. |
| vii | | The Lehman Brothers U.S. Fixed-Rate Mortgage Backed Securities Index is an unmanaged index composed of securities backed by 15-year to 30-year fixed-rate mortgage pools of Government National Mortgage Association, Federal National Mortgage Association and Federal Home Loan Mortgage Corporation. |
VI Legg Mason Partners Investment Series
Legg Mason Partners Variable Premier Selections All Cap Growth Portfolio
Portfolio Overview
Q. What were the overall market conditions during the Portfolio’s reporting period?
A. At the start of the fiscal year, the broad stock market experienced a sharp sell-off early in the Fall of 2005 as investors were hit with the uncertainty surrounding Hurricanes Katrina and Rita and the pending challenges of rebuilding the region. Showing considerable resilience, a year-end rally led by strong earnings and weaker oil prices began in late October.
Through the first quarter of 2006, the prevailing theme was one of continued investor agnosticism towards the equity markets. Negative headlines certainly played a part, as the broad media continued to emphasize the plethora of downbeat themes from 2005: low Presidential approval ratings, lack of measurable success in Iraq, steady interest rate increases, continued upward pressure on energy prices, an inverted yield curve, and record budget and trade deficits. The broad market indexes experienced sharp corrections in May and June of this year, led by pullbacks in international markets and commodities, and investor sentiment remained low.
Many of the forces that negatively impacted the Portfolio in the first half of the year reversed themselves in the Fall of 2006. The headwinds of an uncertain Federal Reserve (“Fed”)i and high-energy prices, quickly became tailwinds for quality growth companies. Oil prices, which had risen to above $70 towards the end of the period, peaked near $78, then declined nearly 15%ii, leading to decreased costs for both energy using corporate producers and consumers. After increasing the federal Portfolio’s rate to 5.25% in June—its 17th consecutive rate hike—the Fed paused from raising rates at its August, September and October meetings, signaling the end of the 2 year tightening cycle. These two factors resulted in investors bidding up the stock market and in particular sectors that were perceived to benefit the most, mainly consumer discretionary (retail and restaurants), technology, and transports.
The ongoing economic expansion and solid corporate profits helped the U.S. equity market to generate very strong results during the 12-month period that ended October 31, 2006. Over that time, the S&P 500 Index returned 16.33%.iii
Performance Review
For the 12 months ending October 31, 2006, the Legg Mason Partners Variable Premier Selections All Cap Growth Portfolio excluding sales charges, returned 9.77%. These shares underperformed the Lipper Variable Multi-Cap Growth Funds Category Average,1 which increased 10.51%. The Portfolio’s unmanaged benchmarks, the Russell 1000 Growth Index,iii the Russell 2000 Growth Index,iv and the S&P 400 MidCap Index,v returned 10.84%, 17.07% and 13.43%, respectively, for the same period.
Legg Mason Partners Investment Series 2006 Annual Report 1
Q. What were the most significant factors affecting Portfolio performance?
What were the leading contributors to performance?
A. Stock selection in the health care and in the information technology sectors enhanced results during the reporting period. In terms of sector positioning, the Portfolio’s overweight exposure to consumer discretionary and financial stocks were positive contributors to relative performance. On an individual stock basis, the largest absolute contributors to performance were Merrill Lynch & Co. Inc., MEMC Electronic Materials Inc., FMC Technologies Inc., Cisco Systems, Inc., and Berkshire Hathaway Inc. B Shares.
What were the leading detractors from performance?
A. During the period, overall stock selection and sector positioning detracted from relative performance. In particular, stock selection in consumer discretionary was the largest relative detractor from relative performance. From a sector allocation perspective, the Portfolio’s underweight exposure to industrials and overweight exposure to utilities detracted the most from relative performance. On an individual stock basis, the largest detractors from absolute performance were eBay Inc., Dell Inc., Chico’s FAS Inc., Yahoo! Inc., and Labor Ready Inc.
Q. Were there any significant changes to the Portfolio during the reporting period?
A. As usual, the Portfolio’s sector allocation was the result of its bottom-up stock selection decisions rather than a top-down allocation strategy. Sector allocation changed little during the period, with most changes the result of individual stock transactions and changes in market valuation.
| 1 | | Lipper, Inc. is a major independent mutual-fund tracking organization. Returns are based on the 12-month period ended October 31, 2006, including the reinvestment of all distributions, including returns of capital, if any, calculated among the 157 funds in the Portfolio’s Lipper category. |
2 Legg Mason Partners Investment Series 2006 Annual Report
Thank you for your investment in the Legg Mason Partners Variable Premier Selections All Cap Growth Portfolio. As ever, we appreciate that you have chosen us to manage your assets and we remain focused on seeking to achieve the Portfolio’s investment goals.
Sincerely,
| | |
 | |  |
| Alan J. Blake | | Timothy Woods, CFA |
| Portfolio Manager | | Portfolio Manager |
| |
 | |  |
Brian Angerame Portfolio Manager | | Derek Deutsch, CFA Portfolio Manager |
ClearBridge Advisors, LLC
November 29, 2006
Legg Mason Partners Investment Series 2006 Annual Report 3
The information provided is not intended to be a forecast of future events, a guarantee of future results or investment advice. Views expressed may differ from those of the firm as a whole.
Portfolio holdings and breakdowns are as of October 31, 2006 and are subject to change and may not be representative of the portfolio manager’s current or future investments. The Portfolio’s top ten holdings (as a percentage of net assets) as of this date were: Merrill Lynch & Co. Inc. (2.6%), Amgen Inc. (2.4%), Berkshire Hathaway Inc., Class B Shares (2.2%), Amazon.com Inc. (2.1%), Motorola Inc. (1.9%), Procter & Gamble Inc. (1.9%), American International Group Inc. (1.9%), Genentech Inc. (1.8%), Pfizer Inc. (1.8%) and Microsoft Corp. (1.8%). Please refer to pages 28 through 33 for a list and percentage breakdown of the Portfolio’s holdings.
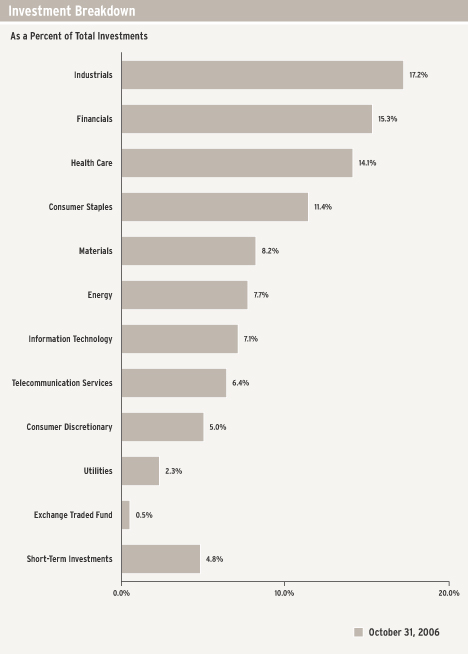
The mention of sector breakdowns is for informational purposes only and should not be construed as a recommendation to purchase or sell any securities. The information provided regarding such sectors is not a sufficient basis upon which to make an investment decision. Investors seeking financial advice regarding the appropriateness of investing in any securities or investment strategies discussed should consult their financial professional. Portfolio holdings are subject to change at any time and may not be representative of the portfolio manager’s current or future investments. The Portfolio’s top five sector holdings (as a percentage of net assets) as of October 31, 2006 were: Information Technology (26.3%), Consumer Discretionary (19.5%), Health Care (17.6%), Financials (15.2%) and Consumer Staples (7.6%). The Portfolio’s composition is subject to change at any time.
RISKS: The Portfolio may invest in small- and mid-cap companies that may involve a higher degree of risk and volatility than investments in large-cap companies. The Portfolio may use derivatives, such as options and futures, which can be illiquid, may disproportionately increase losses, and have a potentially large impact on fund performance. The Portfolio may invest in foreign securities that may be subject to certain risks not associated with domestic investing, such as currency fluctuations, and changes in political and economic conditions. These risks are magnified in emerging or developing markets. Please see the Portfolio’s prospectus for more information on these and other risks.
All index performance reflects no deduction for fees, expenses or taxes. Please note that an investor cannot invest directly in an index.
| i | | The Federal Reserve Board is responsible for the formulation of a policy designed to promote economic growth, full employment, stable prices, and a sustainable pattern of international trade and payments. |
| ii | | Source: The Wall Street Journal, 9/29/06 |
| iii | | The S&P 500 index is an unmanaged index of 500 stocks that is generally representative of the performance of larger companies in the U.S. |
| iv | | The Russell 1000 Growth Index measures the performance of those Russell 1000 companies with higher price-to-book ratios and higher forecasted growth values. |
| v | | The Russell 2000 Growth Index measures the performance of those Russell 2000 companies with higher price-to-book ratios and higher forecasted growth values. |
| vi | | The S&P 400 MidCap Index is a market-value weighted index which consists of 400 domestic stocks chosen for market size, liquidity, and industry group representation. |
4 Legg Mason Partners Investment Series 2006 Annual Report
Fund at a Glance (unaudited)
Legg Mason Partners Variable Premier Selections All Cap Growth Portfolio

Legg Mason Partners Investment Series 2006 Annual Report 5
Fund Performance
Legg Mason Partners Variable Premier Selections All Cap Growth Portfolio
| | | |
| Average Annual Total Returns(1) (unaudited) | |
Twelve Months Ended 10/31/06 | | 9.77 | % |
| | |
Five Years Ended 10/31/06 | | 4.80 | |
| | |
9/15/99* through 10/31/06 | | 4.48 | |
| | |
| | | |
| Cumulative Total Returns(1) (unaudited) | |
9/15/99* through 10/31/06 | | 36.66 | % |
| | |
| (1) | | Assumes reinvestment of all distributions, including returns of capital, if any, at net asset value. All figures represent past performance and are not a guarantee of future results. Investment return and principal value of an investment will fluctuate so that an investor’s shares, when redeemed, may be worth more or less than their original cost. Total returns do not reflect expenses associated with the separate account such as administrative fees, account charges and surrender charges, which, if reflected, would reduce the total returns. Performance figures may reflect fee waivers and/or expense reimbursements. In the absence of fee waivers and/or expense reimbursements, the total return would have been lower. |
| * | | Commencement of operations. |
6 Legg Mason Partners Investment Series 2006 Annual Report
Historical Performance (unaudited)
Value of $10,000 Invested in the Legg Mason Partners Variable Premier Selections All Cap Growth Portfolio* vs. S&P MidCap 400 Index, Russell 1000 Growth Index and Russell 2000 Growth Index† (September 1999 — October 2006)
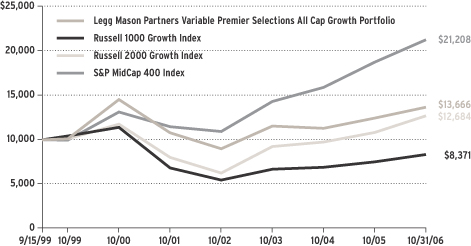
| † | | Hypothetical illustration of $10,000 invested on September 15, 1999 (commencement of operations), assuming the reinvestment of all distributions, including returns of capital, if any, at net asset value through October 31, 2006. The S&P MidCap 400 Index is a widely recognized index of 400 medium-capitalization stocks. Figures for the S&P MidCap 400 Index include reinvestment of dividends. The Russell 1000 Growth Index measures the performance of those Russell 1000 companies with higher price-to-book ratios and higher forecasted growth values. (A price-to-book ratio is the price of a stock compared to the difference between a company’s assets and liabilities. The Russell 2000 Growth Index measures the performance of those Russell 2000 companies with higher price-to-book ratios and higher forecasted growth values. (A price-to-book ratio is the price of a stock compared to the difference between a company’s assets and liabilities.) The Indices are unmanaged and are not subject to the same management and trading expenses of a mutual fund. Please note that an investor cannot invest directly in an index. |
| * | | Before May 1, 2001, the Portfolio was known as Select Mid Cap Portfolio and had a different investment style. |
All figures represent past performance and are not a guarantee of future results. Investment return and principal value of an investment will fluctuate so that an investor’s shares, when redeemed, may be worth more or less than their original cost. Total returns do not reflect expenses associated with the separate account such as administrative fees, account charges and surrender charges, which, if reflected, would reduce the total returns. Performance figures may reflect fee waivers and/or expense reimbursements. In the absence of fee waivers and/or expense reimbursements, the total return would have been lower.
Legg Mason Partners Investment Series 2006 Annual Report 7
Legg Mason Partners Variable Dividend Strategy Portfolio
Portfolio Overview
Q. What were the overall market conditions during the Portfolio’s reporting period?
A. For the 12-month period ending October 31, 2006, the broad stock market generated solid results despite a number of macroeconomic hurdles including the aftermath of Hurricanes Katrina and Rita early in the period and the ensuing rise in energy costs and drop in housing prices that put many consumers on notice and raised concerns about the strength of both continued consumer spending and some corporate earnings. During the period, the Federal Reserve Board (“Fed”)i ended its tightening cycle and transitioned to a data-dependent stance, which the managers considered to be a positive factor for the market overall.
Performance Review
For the 12 months ending October 31, 2006, Legg Mason Partners Variable Dividend Strategy Portfolio, excluding sales charges, returned 16.89%. These shares outperformed the Lipper Variable Large-Cap Core Funds Category Average,1 which increased 14.24%. The Portfolio’s unmanaged benchmark, the S&P 500 Indexii, returned 16.33% for the same period.
Q. What were the most significant factors affecting Portfolio performance?
For the 12-month period, the Portfolio had positive absolute returns in all sectors in which it was invested. Relative to its benchmark, the S&P 500 Index, both stock selection and sector allocation contributed positively to performance, with stock selection accounting for the majority of the difference between the Portfolio’s return and the benchmark return for the same period.
What were the leading contributors to performance?
A. Leading contributors to relative performance included stock selection in financials, health care, telecommunications services (“telecom”), consumer staples, industrials and consumer discretionary. An underweight to the information technology (“IT”) sector and overweights to both the materials and telecom sectors also contributed positively to relative performance. In terms of individual stocks, significant contributors to performance for the period include positions in BellSouth Corp. in telecom, Exxon Mobil Corp. and Chevron Corp. in energy, JPMorgan Chase & Co., Bank of America Corp. and Wells Fargo & Co. in financials, Pfizer Inc. and Wyeth in health care, Honeywell International Inc. and Emerson Electric Co., in industrials.
What were the leading detractors from performance?
A. Significant detractors from relative performance for the period included stock selection in the materials sector, as well as an overweight to the health care sector and an
| 1 | | Lipper, Inc. is a major independent mutual-fund tracking organization. Returns are based on the 12-month period ended October 31, 2006, including the reinvestment of all distributions, including returns of capital, if any, calculated among the 224 funds in the Portfolio’s Lipper category. |
8 Legg Mason Partners Investment Series 2006 Annual Report
underweight to the financials sector. For the period, leading stock detractors from Portfolio performance included positions in Dow Chemical Co. and Olin Corp. in materials, Mills Corp. and Plum Creek Timber Company Inc. in financials, Medtronic Inc. in health care, Home Depot Inc., Gannett Co. Inc. and Target Corp. in consumer discretionary, Intel Corp. in IT, and Masco Corp. in industrials.
Q. Were there any significant changes to the Portfolio during the reporting period?
A. During the course of the period, the Portfolio’s weighting in telecom increased significantly and allocations to industrials and IT also grew, while allocations to materials, financials, utilities and consumer staples were reduced.
Thank you for your investment in the Legg Mason Partners Variable Dividend Strategy Portfolio. As ever, we appreciate that you have chosen us to manage your assets and we remain focused on seeking to achieve the Portfolio’s investment goals.
Sincerely,
| | |

Scott K. Glasser,
Portfolio Manager | | 
Peter J. Hable,
Portfolio Manager |
ClearBridge Advisors, LLC
November 29, 2006
Legg Mason Partners Investment Series 2006 Annual Report 9
The information provided is not intended to be a forecast of future events, a guarantee of future results or investment advice. Views expressed may differ from those of the firm as a whole.
Portfolio holdings and breakdowns are as of October 31, 2006 and are subject to change and may not be representative of the portfolio manager’s current or future investments. The Portfolio’s top ten holdings (as a percentage of net assets) as of this date were: Exxon Mobil Corp (4.0%), General Electric Co. (3.6%), E.I. Du Pont de Nemours & Co. (3.0%), Johnson & Johnson (2.9%), JPMorgan Chase & Co. (2.9%), Microsoft Corp. (2.7%), Bank of America Corp (2.6%), Honeywell International Inc. (2.6%), Wyeth (2.4%) and Kimberly-Clark Corp. (2.4%). Please refer to pages 34 through 38 for a list and percentage breakdown of the Portfolio’s holdings.
The mention of sector breakdowns is for informational purposes only and should not be construed as a recommendation to purchase or sell any securities. The information provided regarding such sectors is not a sufficient basis upon which to make an investment decision. Investors seeking financial advice regarding the appropriateness of investing in any securities or investment strategies discussed should consult their financial professional. Portfolio holdings are subject to change at any time and may not be representative of the portfolio manager’s current or future investments. The Portfolio’s top five sector holdings (as a percentage of net assets) as of October 31, 2006 were: Industrials (16.6%), Financials (14.9%), Health Care (13.7%), Consumer Staples (11.0%) and Materials (8.0%). The Portfolio’s composition is subject to change at any time.
RISKS: The Portfolio may invest in foreign securities that may be subject to certain risks not associated with domestic investing, such as currency fluctuations, and changes in political and economic conditions. The Portfolio may engage in active and frequent trading, resulting in increased transaction costs, which could detract from the Portfolio’s performance. The Portfolio may use derivatives, such as options and futures, which can be illiquid, may disproportionately increase losses and have a potentially large impact on fund performance. Please see the Portfolio’s prospectus for more information on these and other risks.
All index performance reflects no deduction for fees, expenses or taxes. Please note that an investor cannot invest directly in an index.
| i | | The Federal Reserve Board is responsible for the formulation of a policy designed to promote economic growth, full employment, stable prices, and a sustainable pattern of international trade and payments. |
| ii | | The S&P 500 Index is an unmanaged index of 500 stocks that is generally representative of the performance of larger companies in the U.S. |
10 Legg Mason Partners Investment Series 2006 Annual Report
Fund at a Glance (unaudited)
Legg Mason Partners Variable Dividend Strategy Portfolio
Legg Mason Partners Investment Series 2006 Annual Report 11
Fund Performance
Legg Mason Partners Variable Dividend Strategy Portfolio
| | | |
| Average Annual Total Returns(1) (unaudited) | | | |
Twelve Months Ended 10/31/06 | | 16.89 | % |
| | |
Five Years Ended 10/31/06 | | 2.95 | |
| | |
9/15/99* through 10/31/06 | | 0.55 | |
| | |
| | | |
| Cumulative Total Return(1) (unaudited) | | | |
9/15/99* through 10/31/06 | | 3.96 | % |
| | |
| (1) | | Assumes reinvestment of all distributions, including returns of capital, if any, at net asset value. All figures represent past performance and are not a guarantee of future results. Investment return and principal value of an investment will fluctuate so that an investor’s shares, when redeemed, may be worth more or less than their original cost. Total returns do not reflect expenses associated with the separate account such as administrative fees, account charges and surrender charges, which, if reflected, would reduce the total returns. Performance figures may reflect fee waivers and/or expense reimbursements. In the absence of fee waivers and/or expense reimbursements, the total return would have been lower. |
| * | | Commencement of operations. |
12 Legg Mason Partners Investment Series 2006 Annual Report
Historical Performance (unaudited)
Value of $10,000 Invested in the Legg Mason Partners Variable Dividend Strategy Portfolio* vs. S&P 500 Index† (September 1999 — October 2006)
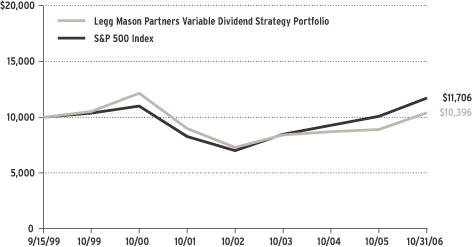
| † | | Hypothetical illustration of $10,000 invested on September 15, 1999 (commencement of operations), assuming the reinvestment of all distributions, including returns of capital, if any, at net asset value through October 31, 2006. The S&P 500 Index is an index of widely held common stocks listed on the New York and American Stock Exchanges and the over-the-counter markets. Figures for the S&P 500 Index include reinvestment of dividends. The Index is unmanaged and is not subject to the same management and trading expenses of a mutual fund. Please note that an investor cannot invest directly in an index. |
| * | | Before November 1, 2004, the Portfolio was known as Smith Barney Large Cap Core Portfolio and had a different investment style. |
All figures represent past performance and are not a guarantee of future results. Investment return and principal value of an investment will fluctuate so that an investor’s shares, when redeemed, may be worth more or less than their original cost. Total returns do not reflect expenses associated with the separate account such as administrative fees, account charges and surrender charges, which, if reflected, would reduce the total returns. Performance figures may reflect fee waivers and/or expense reimbursements. In the absence of fee waivers and/or expense reimbursements, the total return would have been lower.
Legg Mason Partners Investment Series 2006 Annual Report 13
Legg Mason Partners Variable Growth and Income Portfolio
Portfolio Overview
Q. What were the overall market conditions during the Portfolio’s reporting period?
A. The market rose over 16% during the one-year period ending October 31, 2006. The market was led by the telecommunications and materials sectors. Healthcare and technology stocks trailed the market. Rallies in the fourth quarter of 2005 and the third quarter of 2006 were interrupted by a sharp correction in May and June of 2006.
The key factors in the market action were the robust U.S. economy and the Federal Reserve Board’s (“Fed”)i actions to slow it down. The Fed increased rates at 17 consecutive Open Market Committee meetings before pausing in August 2006. The Fed increased rates because it was concerned about the roaring U.S. housing market and because it was afraid of inflationary pressures from low unemployment rates and materials price increases. The easing of these fears helped enable them to pause in August. Gross domestic product (“GDP”)ii growth held above 4% until the third quarter of 2006, when it rose a tepid 2.2% according to Commerce Department’s preliminary estimate.
We believe that the worst of the raw materials pressure is behind us, due to a concerted effort by the world governments. A sharp divergence between commodities traded on exchanges, such as copper and nickel, and non-exchange traded commodities, such as ethylene, began to appear in the first quarter of 2005. Despite similar supply/demand dynamics, exchange traded commodities soared, while non-exchange traded commodities fell. The government intervened with four commodity margin requirement increases in February and May 2006. The Japanese government withdrew over $200 billion of liquidity from the world financial markets in the spring of 2006. The declines in oil and commodity prices that began in May have persisted, as substantial amounts of new capacity have come on line and inventories are beginning to build.
The U.S. housing market began to turn down in September 2005. By the summer of 2006, the decline was beginning to look like a rout. Housing starts and sales and existing home sales, declined at over a 10% rate. Inventories of new and existing houses hit 15-year highs. In August 2006, the housing numbers finally gave signs of stabilizing. Months of inventories of new and existing homes fell in both August and September. Coincident with the pause in interest rate hikes and the possible bottom in housing, the stock market started its summer rally.
The U.S. employment picture and corporate profits were powerful throughout the year. The U.S. unemployment rate hit a low for this business cycle of 4.4% in September. Corporate profits rose 19% in the third quarter of 2006. Despite the slower GDP growth, there is a firm underpinning to the U.S. economy.
Performance Review
For the 12 months ended October 31, 2006, Legg Mason Partners Variable Growth and Income Portfolio, excluding sales charges, returned 13.13%. These shares underperformed
14 Legg Mason Partners Investment Series 2006 Annual Report
the Lipper Variable Large-Cap Core Funds Category Average,1 which increased by 14.24%. The Portfolio’s unmanaged benchmark, the S&P 500 Indexiii, returned 16.33% for the same period.
Q. What were the most significant factors affecting Portfolio performance?
A. The Portfolio had strong performance in the financial and consumer discretionary sectors. It held large positions in Goldman Sachs and Merrill Lynch, who steered through tricky financial market waters to generate excellent returns on equity. The big screen TV market helped Best Buy deliver strong earnings growth. McDonald’s focus on improving the quality and consistency of its menu helped drive sales growth.
The Portfolio was hurt by poor stock pickings in the healthcare and telecommunications sectors. It was hurt by the sharp decline in the Health Maintenance Organizations (“HMOs”), which occurred, despite better than expected earnings. Teva Pharmaceutical, the large generic drug company, was hurt by difficulties in assimilating its acquisition of Ivax Pharmaceuticals. In telecommunications, the Portfolio owned companies that we believed would be takeover candidates, including SprintNextel, Alltel and Echostar Communications. It avoided the regional Bell operating companies and the cable companies, due to concerns that the convergence of cable and broadband telephone service would create pricing pressure. None of the companies that were owned were taken over, and earnings performance was better than expected at the regional Bells and cable companies.
What were the leading contributors to performance?
A. The biggest contributors to performance were Goldman Sachs, JPMorgan Chase and Boeing. The best performing sectors were financials, consumer discretionary and energy. Goldman Sachs benefited from strong performance across its business units, especially in trading and investment banking. JPMorgan Chase had excellent earnings growth, driven by cost savings from the BankOne merger. Boeing was helped by orders for the new 787 and by Airbus’ struggles with the A350 and A380.
What were the leading detractors from performance?
A. The stocks that most hurt performance were Qualcomm, SprintNextel and Yahoo. The worst performing sectors were healthcare, telecommunications and technology. Qualcomm’s strong operating results were overshadowed by ongoing litigation with Nokia. SprintNextel executed poorly on its acquisition of Nextel. Yahoo lost market share in Internet search.
| 1 | | Lipper, Inc. is a major independent mutual-fund tracking organization. Returns are based on the 12-month period ended October 31, 2006, including the reinvestment of all distributions, including returns of capital, if any, calculated among the 224 funds in the Portfolio’s Lipper category. |
Legg Mason Partners Investment Series 2006 Annual Report 15
Q. Were there any significant changes to the Portfolio during the reporting period?
A. The Portfolio is higher in growth and larger in size than it was coming into 2006. We concentrated the Portfolio by reducing the number of names from 78 to 62 and increased the percentage of the Portfolio in the top 20 names from 45% to 50%. We built an aggressive position in housing related names such as Toll Brothers, Masco and Freddie Mac at midyear, after these stocks declined to attractive valuations. The big decline in technology stocks during May and June created an opportunity for us to build large positions in broadband equipment companies Cisco Systems, Juniper Networks and Qualcomm.
Thank you for your investment in the Legg Mason Partners Variable Growth and Income Portfolio. As ever, we appreciate that you have chosen us to manage your assets and we remain focused on seeking to achieve the Portfolio’s investment goals.
Sincerely,

Michael A. Kagan, Portfolio Manager
ClearBridge Advisors, LLC
November 29, 2006
The information provided is not intended to be a forecast of future events, a guarantee of future results or investment advice. Views expressed may differ from those of the firm as a whole.
Portfolio holdings and breakdowns are as of October 31, 2006 and are subject to change and may not be representative of the Portfolio manager’s current or future investments. The Portfolio’s top ten holdings (as a percentage of net assets) as of this date were: General Electric Co. (4.0%), Microsoft Corp. (3.8%), Exxon Mobil Corp. (3.0%), Wells Fargo & Co. (2.9%), Qualcomm Inc. (2.8%), Wal-Mart Stores Inc. (2.7%), JPMorgan Chase & Co. (2.6%), Sempra Energy (2.6%), Total SA (2.4%) and Barrick Gold Corp. (2.3%). Please refer to pages 39 through 42 for a list and percentage breakdown of the Portfolio’s holdings.
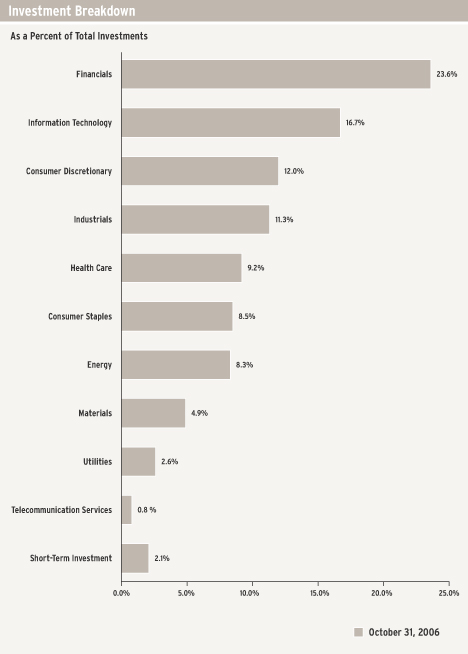
The mention of sector breakdowns is for informational purposes only and should not be construed as a recommendation to purchase or sell any securities. The information provided regarding such sectors is not a sufficient basis upon which to make an investment decision. Investors seeking financial advice regarding the appropriateness of investing in any securities or investment strategies discussed should consult their financial professional. Portfolio holdings are subject to change at any time and may not be representative of the Portfolio manager’s current or future investments. The Portfolio’s top five sector holdings (as a percentage of net assets) as of October 31, 2006 were: Financials (23.6%), Information Technology (16.7%), Consumer Discretionary (12.0%), Industrials (11.3%) and Health Care (9.2%). The Portfolio’s composition is subject to change at any time.
RISKS: The Portfolio may invest in foreign securities, which are subject to certain risks not associated with domestic investing, such as currency fluctuations, and changes in political and economic conditions. The Portfolio may also invest in lower-rated, higher-yielding bonds, known as “junk bonds,” which are subject to greater credit risk, including the risk of default, than higher-rated obligations. The Portfolio may engage in short sales. Losses from short sales may be unlimited. The Portfolio may use derivatives, such as options and futures, which can be illiquid, may disproportionately increase losses, and have a potentially larger impact on Portfolio performance. Please see the Portfolio’s prospectus for more information on these and other risks.
All index performance reflects no deduction for fees, expenses or taxes. Please note an investor cannot invest directly in an index.
| i | | The Federal Reserve Board is responsible for the formulation of a policy designed to promote economic growth, full employment, stable prices, and a sustainable pattern of international trade and payments. |
| ii | | Gross domestic product is a market value of goods and services produced by labor and property in a given country. |
| iii | | The S&P 500 Index is an unmanaged index of 500 stocks that is generally representative of the performance of larger companies in the U.S. |
16 Legg Mason Partners Investment Series 2006 Annual Report
Fund at a Glance (unaudited)
Legg Mason Partners Variable Growth and Income Portfolio
Legg Mason Partners Investment Series 2006 Annual Report 17
Fund Performance
Legg Mason Partners Variable Growth and Income Portfolio
| | | |
| Average Annual Total Returns(1) (unaudited) | |
Twelve Months Ended 10/31/06 | | 13.13 | % |
| | |
Five Years Ended 10/31/06 | | 6.14 | |
| | |
9/15/99* through 10/31/06 | | 1.48 | |
| | |
| | | |
| Cumulative Total Return(1) (unaudited) | |
9/15/99* through 10/31/06 | | 11.01 | % |
| | |
| (1) | | Assumes reinvestment of all distributions, including returns of capital, if any, at net asset value. All figures represent past performance and are not a guarantee of future results. Investment return and principal value of an investment will fluctuate so that an investor’s shares, when redeemed, may be worth more or less than their original cost. Total returns do not reflect expenses associated with the separate account such as administrative fees, account charges and surrender charges, which, if reflected, would reduce the total returns. Performance figures may reflect fee waivers and/or expense reimbursements. In the absence of fee waivers and/or expense reimbursements, the total return would have been lower. |
| * | | Commencement of operations. |
18 Legg Mason Partners Investment Series 2006 Annual Report
Historical Performance (unaudited)
Value of $10,000 Invested in the Legg Mason Partners Variable Growth and Income Portfolio vs. S&P 500 Index† (September 1999 — October 2006)
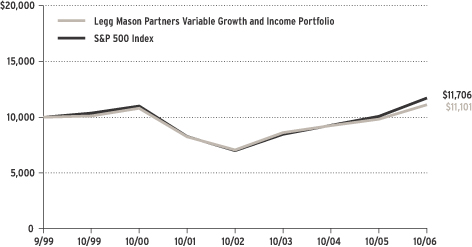
| † | | Hypothetical illustration of $10,000 invested on September 15, 1999 (commencement of operations), assuming the reinvestment of distributions, including returns of capital, if any, at net asset value through October 31, 2006. The S&P 500 Index is an index of widely held common stocks listed on the New York and American Stock Exchanges and the over-the-counter markets. Figures for the S&P 500 Index include reinvestment of dividends. The Index is unmanaged and is not subject to the same management and trading expenses of a mutual fund. Please note that an investor cannot invest directly in an index. |
All figures represent past performance and are not a guarantee of future results. Investment return and principal value of an investment will fluctuate so that an investor’s shares, when redeemed, may be worth more or less than their original cost. Total returns do not reflect expenses associated with the separate account such as administrative fees, account charges and surrender charges, which, if reflected, would reduce the total returns. Performance figures may reflect fee waivers and/or expense reimbursements. In the absence of fee waivers and/or expense reimbursements, the total return would have been lower.
Legg Mason Partners Investment Series 2006 Annual Report 19
Legg Mason Partners Variable Government Portfolio
Portfolio Overview
Q. What were the overall market conditions during the Portfolio’s reporting period?
A. The bond market faced a number of challenges over the period, including six additional short-term interest rate hikes by the Federal Reserve Board (“Fed”)i, inflationary pressures and a continued economic expansion. However, as the period progressed, oil prices fell sharply, a cooling housing market triggered slower economic growth and the Fed paused from raising rates during its meetings in August, September and October 2006. This led to a strong rally in the bond market, with both short- and long-term yields falling sharply. At the end of October, the yield curve was inverted, as two-year Treasury yields were higher than their 10-year counterparts, this has often been a precursor of slower economic growth.
Performance Review
For the 12 months ended October 31, 2006, Legg Mason Partners Variable Government Portfolio returned 4.66%. In comparison, the Portfolio’s unmanaged benchmark, the Lehman Brothers Government Bond Indexii returned 4.58% for the same period. The Lipper Variable General U.S. Government Funds Category Average1, returned 3.90% over the same time frame.
Q. What were the most significant factors affecting Portfolio performance?
What were the leading contributors to performance?
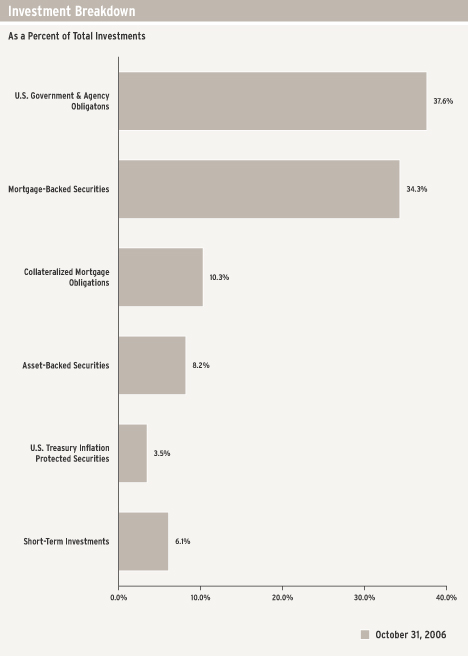
A. In the early stages of the reporting period, the Portfolio’s allocation to mortgage-backed securities enhanced results, as they outperformed both U.S. Treasuries and agencies. Our durationiii posture remained defensive versus that of the benchmark, which helped to manage volatility during the periods when interest rates rose.
As the reporting period progressed, the Portfolio’s allocation to mortgage-backed securities continued to boost returns as they outperformed Treasuries. Within mortgage-backed sector, the Portfolio’s heavier allocation to FNMA (Fannie Mae) bonds versus GNMA (Ginnie Mae) bonds enhanced results. Finally, we moved the Portfolio’s duration to be longer than the benchmark. This positioning was beneficial to performance when interest rates started their descent that began in July (interest rates and bond prices move in the opposite direction).
What were the leading detractors from performance?
A. In the last two months of 2005 and the first two months of 2006, the Portfolio’s exposure to U.S. Treasury securities detracted from absolute performance. Over this same period, the Portfolio’s slightly shorter duration versus the benchmark was a drag on performance during the occasions when 10-year U.S. Treasuries yields declined.
| 1 | | Lipper, Inc. is a major independent mutual-fund tracking organization. Returns are based on the 12-month period ended October 31, 2006, including the reinvestment of all distributions, including returns of capital, if any, calculated among the 64 funds in the Portfolio’s Lipper category. |
20 Legg Mason Partners Investment Series 2006 Annual Report
As mentioned, we moved the Portfolio’s duration to be longer than the benchmark. While this was a positive for performance when interest rates fell toward the end of period, it was a negative during periods when economic data was stronger than expected and interest rates rose.
Q. Were there any significant changes to the Portfolio during the reporting period?
A. There were no significant changes to the Portfolio during the reporting period.
Thank you for your investment in the Legg Mason Partners Variable Government Portfolio. As ever, we appreciate that you have chosen us to manage your assets and we remain focused on seeking to achieve the Portfolio’s investment goals.
Sincerely,
Western Asset Management Company
November 29, 2006
Legg Mason Partners Investment Series 2006 Annual Report 21
The information provided is not intended to be a forecast of future events, a guarantee of future results or investment advice. Views expressed may differ from those of the firm as a whole.
RISKS: Keep in mind, bond and mortgage-related securities are subject to interest rate and market risks. The U.S. government guarantee of principal and interest payment only applies to underlying securities in the Portfolio’s portfolio. Please note that the Portfolio’s shares are not guaranteed by the U.S. government or its agencies. The Portfolio may use derivatives, such as options and futures, which can have a potentially large impact on the fund performance. Please see the Portfolio’s prospectus for more information on these and other risks.
All index performance reflects no deduction for fees, expenses or taxes. Please note that an investor cannot invest directly in an index.
| i | | The Federal Reserve Board is responsible for the formulation of a policy designed to promote economic growth, full employment, stable prices, and a sustainable pattern of international trade and payments. |
| ii | | The Lehman Brothers Government Bond Index is a broad-based index of all public debt obligations of the U.S. government and its agencies that have an average maturity of roughly nine years. |
| iii | | Duration is a common gauge of the price sensitivity of a fixed income asset or portfolio to change in interest rates. |
22 Legg Mason Partners Investment Series 2006 Annual Report
Fund at a Glance (unaudited)
Legg Mason Partners Variable Government Portfolio
Legg Mason Partners Investment Series 2006 Annual Report 23
Fund Performance
Legg Mason Partners Variable Government Portfolio
| | | |
| Average Annual Total Returns(1) (unaudited) | |
Twelve Months Ended 10/31/06 | | 4.66 | % |
| | |
Five Years Ended 10/31/06 | | 2.79 | |
| | |
9/15/99* through 10/31/06 | | 4.91 | |
| | |
| | | |
| Cumulative Total Return(1) (unaudited) | |
9/15/99* through 10/31/06 | | 40.67 | % |
| | |
| (1) | | Assumes reinvestment of all distributions, including returns of capital, if any, at net asset value. All figures represent past performance and are not a guarantee of future results. Investment return and principal value of an investment will fluctuate so that an investor’s shares, when redeemed, may be worth more or less than their original cost. Total returns do not reflect expenses associated with the separate account such as administrative fees, account charges and surrender charges, which, if reflected, would reduce the total returns. Performance figures may reflect fee waivers and/or expense reimbursements. In the absence of fee waivers and/or expense reimbursements, the total return would have been lower. |
| * | | Commencement of operations. |
24 Legg Mason Partners Investment Series 2006 Annual Report
Historic Performance (unaudited)
Value of $10,000 Invested in the Legg Mason Partners Variable Government Portfolio vs. Lehman Brothers Government Bond Index† (September 1999 — October 2006)
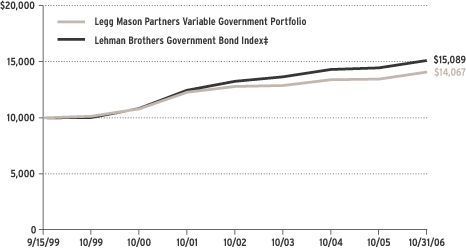
| † | | Hypothetical illustration of $10,000 invested on September 15, 1999 (commencement of operations), assuming the reinvestment of distributions, including returns of capital, if any, at net asset value through October 31, 2006. The Lehman Brothers Government Bond Index includes U.S. Treasury and government agency securities with maturities of one year or more having a minimum outstanding principal of $100 million and are only fixed-coupon securities. The Index is unmanaged and is not subject to the same management and trading expenses as a mutual fund. Please note that an investor cannot invest directly in an index. |
All figures represent past performance and are not a guarantee of future results. Investment return and principal value of an investment will fluctuate so that an investor’s shares, when redeemed, may be worth more or less than their original cost. Total returns do not reflect expenses associated with the separate account such as administrative fees, account charges and surrender charges, which, if reflected, would reduce the total returns. Performance figures may reflect fee waivers and/or expense reimbursements. In the absence of fee waivers and/or expense reimbursements, the total return would have been lower.
| ‡ | | Benchmark return beginning September 30, 1999. |
Legg Mason Partners Investment Series 2006 Annual Report 25
Fund Expenses (unaudited)
Example
As a shareholder of the Fund, you may incur two types of costs: (1) transaction costs and (2) ongoing costs, including management fees and other Fund expenses. This example is intended to help you understand your ongoing costs (in dollars) of investing in the Fund and to compare these costs with the ongoing costs of investing in other mutual funds.
This example is based on an investment of $1,000 invested on May 1, 2006 and held for the six months ended October 31, 2006.
Actual Expenses
The table below titled “Based on Actual Total Return” provides information about actual account values and actual expenses. You may use the information provided in this table, together with the amount you invested, to estimate the expenses that you paid over the period. To estimate the expenses you paid on your account, divide your ending account value by $1,000 (for example, an $8,600 ending account value divided by $1,000 = 8.6), then multiply the result by the number under the heading entitled “Expenses Paid During the Period”.
| | | | | | | | | | | | | | | |
| Based on Actual Total Return(1) |
| | | | | |
| | | Actual
Total Return(2) | | | Beginning
Account
Value | | Ending
Account
Value | | Annualized
Expense
Ratio | | | Expenses
Paid During
the Period(3) |
Legg Mason Partners Variable Premier Selections All Cap Growth Portfolio | | 0.22 | % | | $ | 1,000.00 | | $ | 1,002.20 | | 1.07 | % | | $ | 5.40 |
| |
Legg Mason Partners Variable Dividend Strategy Portfolio | | 7.21 | | | | 1,000.00 | | | 1,072.10 | | 0.93 | | | | 4.86 |
| |
Legg Mason Partners Variable Growth and Income Portfolio | | 2.51 | | | | 1,000.00 | | | 1,025.10 | | 0.91 | | | | 4.64 |
| |
Legg Mason Partners Variable Government Portfolio | | 4.42 | | | | 1,000.00 | | | 1,044.20 | | 0.74 | | | | 3.81 |
| |
| (1) | | For the six months ended October 31, 2006. |
| (2) | | Assumes reinvestment of all distributions, including returns of capital, if any, at net asset value. Total return is not annualized, as it may not be representative of the total return for the year. Total returns do not reflect expenses associated with the separate account such as administrative fees, account charges and surrender charges, which, if reflected, would reduce the total returns. Performance figures may reflect fee waivers and/or expense reimbursements . Past performance is no guarantee of future results. In the absence of fee waivers, the total return would have been lower. |
| (3) | | Expenses (net of voluntary fee waivers and/or expense reimbursements) are equal to each Fund’s respective annualized expense ratio multiplied by the average account value over the period, multiplied by the number of days in the most recent fiscal half-year, then divided by 365. |
26 Legg Mason Partners Investment Series 2006 Annual Report
Fund Expenses (unaudited) (continued)
Hypothetical Example for Comparison Purposes
The table below titled “Based on Hypothetical Total Return” provides information about hypothetical account values and hypothetical expenses based on the actual expense ratio and an assumed rate of return of 5.00% per year before expenses, which is not the Fund’s actual return. The hypothetical account values and expenses may not be used to estimate the actual ending account balance or expenses you paid for the period. You may use the information provided in this table to compare the ongoing costs of investing in the Fund and other funds. To do so, compare the 5.00% hypothetical example relating to the Fund with the 5.00% hypothetical examples that appear in the shareholder reports of the other funds.
Please note that the expenses shown in the table below are meant to highlight your ongoing costs only and do not reflect any transactional costs, such as front-end or back-end sales charges (loads). Therefore, this table is useful in comparing ongoing costs only, and will not help you determine the relative total costs of owning different funds. In addition, if these transaction costs were included, your costs would have been higher.
| | | | | | | | | | | | | | | |
| Based on Hypothetical Total Return(1) |
| | | | | |
| | | Hypothetical
Annualized
Total Return | | | Beginning
Account
Value | | Ending
Account
Value | | Annualized
Expense
Ratio | | | Expenses
Paid During
the Period(2) |
Legg Mason Partners Variable Premier Selections All Cap Growth Portfolio | | 5.00 | % | | $ | 1,000.00 | | $ | 1,019.81 | | 1.07 | % | | $ | 5.45 |
| |
Legg Mason Partners Variable Dividend Strategy Portfolio | | 5.00 | | | | 1,000.00 | | | 1,020.52 | | 0.93 | | | | 4.74 |
| |
Legg Mason Partners Variable Growth and Income Portfolio | | 5.00 | | | | 1,000.00 | | | 1,020.62 | | 0.91 | | | | 4.63 |
| |
Legg Mason Partners Variable Government Portfolio | | 5.00 | | | | 1,000.00 | | | 1,021.48 | | 0.74 | | | | 3.77 |
| |
| (1) | | For the six months ended October 31, 2006. |
| (2) | | Expenses (net of voluntary fee waivers and/or expense reimbursements) are equal to each Fund’s respective annualized expense ratio multiplied by the average account value over the period, multiplied by the number of days in the most recent fiscal half-year, then divided by 365. |
Legg Mason Partners Investment Series 2006 Annual Report 27
Schedules of Investments (October 31, 2006)
LEGG MASON PARTNERS VARIABLE PREMIER SELECTIONS ALL CAP GROWTH PORTFOLIO
| | | | | |
| | |
| Shares | | Security | | Value |
| | | | | |
| COMMON STOCKS — 98.4% | | | |
| CONSUMER DISCRETIONARY — 19.5% | | | |
| Auto Components — 0.3% | | | |
| 2,420 | | BorgWarner Inc. | | $ | 139,150 |
| |
| Diversified Consumer Services — 0.9% | | | |
| 37,500 | | ServiceMaster Co. | | | 424,875 |
| |
| Hotels, Restaurants & Leisure — 4.4% | | | |
| 7,100 | | CBRL Group Inc. | | | 311,761 |
| 3,000 | | Panera Bread Co.* | | | 185,400 |
| 3,800 | | PF Chang’s China Bistro Inc.* | | | 158,916 |
| 20,550 | | Shuffle Master Inc.* | | | 574,989 |
| 7,000 | | Station Casinos Inc. | | | 422,100 |
| 13,600 | | WMS Industries Inc.* | | | 480,488 |
| |
| | Total Hotels, Restaurants & Leisure | | | 2,133,654 |
| |
| Household Durables — 1.5% | | | |
| 2,980 | | Black & Decker Corp. | | | 249,962 |
| 3,170 | | Mohawk Industries Inc.* | | | 230,459 |
| 9,100 | | Toll Brothers Inc.* | | | 263,081 |
| |
| | Total Household Durables | | | 743,502 |
| |
| Internet & Catalog Retail — 3.7% | | | |
| 26,800 | | Amazon.com Inc.* | | | 1,020,812 |
| 16,900 | | IAC/InterActiveCorp.* | | | 523,562 |
| 7,100 | | VistaPrint Ltd.* | | | 222,088 |
| |
| | Total Internet & Catalog Retail | | | 1,766,462 |
| |
| Media — 2.0% | | | |
| 39,500 | | Time Warner Inc. | | | 790,395 |
| 5,800 | | Warner Music Group Corp. | | | 150,394 |
| |
| | Total Media | | | 940,789 |
| |
| Specialty Retail — 6.7% | | | |
| 9,000 | | Bebe Stores Inc. | | | 223,470 |
| 11,930 | | Bed Bath & Beyond Inc.* | | | 480,660 |
| 14,300 | | Charming Shoppes Inc.* | | | 211,640 |
| 11,000 | | Dick’s Sporting Goods Inc.* | | | 547,360 |
| 5,000 | | DSW, Inc., Class A Shares* | | | 173,000 |
| 22,300 | | Home Depot Inc. | | | 832,459 |
| 12,500 | | Pacific Sunwear of California Inc.* | | | 220,250 |
| 5,200 | | Sherwin-Williams Co. | | | 307,996 |
| 12,200 | | Urban Outfitters Inc.* | | | 213,500 |
| |
| | Total Specialty Retail | | | 3,210,335 |
| |
| | TOTAL CONSUMER DISCRETIONARY | | | 9,358,767 |
| |
See Notes to Financial Statements.
28 Legg Mason Partners Investment Series 2006 Annual Report
Schedules of Investments (October 31, 2006) (continued)
| | | | | |
| | |
| Shares | | Security | | Value |
| | | | | |
| CONSUMER STAPLES — 7.6% | | | |
| Beverages — 3.6% | | | |
| 15,700 | | Coca-Cola Co. | | $ | 733,504 |
| 3,900 | | Molson Coors Brewing Co., Class B Shares | | | 277,602 |
| 10,900 | | PepsiCo Inc. | | | 691,496 |
| |
| | Total Beverages | | | 1,702,602 |
| |
| Food & Staples Retailing — 0.5% | | | |
| 12,500 | | Wild Oats Markets Inc.* | | | 224,750 |
| |
| Food Products — 1.6% | | | |
| 14,950 | | Wm. Wrigley Jr. Co. | | | 776,652 |
| |
| Household Products — 1.9% | | | |
| 14,622 | | Procter & Gamble Co. | | | 926,889 |
| |
| | TOTAL CONSUMER STAPLES | | | 3,630,893 |
| |
| ENERGY — 3.1% | | | |
| Energy Equipment & Services — 1.6% | | | |
| 7,200 | | FMC Technologies Inc.* | | | 435,240 |
| 6,400 | | Nabors Industries Ltd.* | | | 197,632 |
| 3,600 | | Smith International Inc. | | | 142,128 |
| |
| | Total Energy Equipment & Services | | | 775,000 |
| |
| Oil, Gas & Consumable Fuels — 1.5% | | | |
| 5,850 | | Murphy Oil Corp. | | | 275,886 |
| 10,150 | | Newfield Exploration Co.* | | | 414,019 |
| |
| | Total Oil, Gas & Consumable Fuels | | | 689,905 |
| |
| | TOTAL ENERGY | | | 1,464,905 |
| |
| EXCHANGE TRADED FUND — 0.5% | | | |
| Exchange Traded — 0.5% | | | |
| 2,900 | | iShares Nasdaq Biotechnology Index Fund | | | 231,130 |
| |
| FINANCIALS — 15.2% | | | |
| Capital Markets — 4.9% | | | |
| 3,750 | | Affiliated Managers Group Inc.* | | | 375,525 |
| 2,600 | | Bear Stearns Cos. Inc. | | | 393,510 |
| 6,900 | | Investment Technology Group Inc.* | | | 322,230 |
| 14,300 | | Merrill Lynch & Co. Inc. | | | 1,250,106 |
| |
| | Total Capital Markets | | | 2,341,371 |
| |
| Commercial Banks — 1.0% | | | |
| 6,700 | | East-West Bancorp Inc. | | | 244,617 |
| 7,500 | | Western Digital Corp* | | | 254,850 |
| |
| | Total Commercial Banks | | | 499,467 |
| |
| Consumer Finance — 0.5% | | | |
| 8,340 | | Nelnet Inc., Class A Shares* | | | 245,530 |
| |
| Diversified Financial Services — 0.6% | | | |
| 8,700 | | optionsXpress Holdings Inc. | | | 270,396 |
| |
See Notes to Financial Statements.
Legg Mason Partners Investment Series 2006 Annual Report 29
Schedules of Investments (October 31, 2006) (continued)
| | | | | |
| | |
| Shares | | Security | | Value |
| | | | | |
| Insurance — 5.1% | | | |
| 13,200 | | American International Group Inc. | | $ | 886,644 |
| 304 | | Berkshire Hathaway Inc., Class B Shares* | | | 1,068,560 |
| 4,800 | | Cincinnati Financial Corp. | | | 219,120 |
| 12,225 | | Old Republic International Corp. | | | 275,429 |
| |
| | Total Insurance | | | 2,449,753 |
| |
| Real Estate Investment Trusts (REITs) — 1.3% | | | |
| 2,500 | | Alexandria Real Estate Equities Inc. | | | 249,250 |
| 6,500 | | FelCor Lodging Trust Inc. | | | 134,940 |
| 19,060 | | Spirit Finance Corp. | | | 227,004 |
| |
| | Total Real Estate Investment Trusts (REITs) | | | 611,194 |
| |
| Thrifts & Mortgage Finance — 1.8% | | | |
| 21,900 | | Hudson City Bancorp Inc. | | | 300,687 |
| 2,800 | | MGIC Investment Corp. | | | 164,528 |
| 10,800 | | New York Community Bancorp Inc. | | | 176,580 |
| 5,700 | | PMI Group Inc. | | | 243,105 |
| |
| | Total Thrifts & Mortgage Finance | | | 884,900 |
| |
| | TOTAL FINANCIALS | | | 7,302,611 |
| |
| HEALTH CARE — 17.6% | | | |
| Biotechnology — 7.5% | | | |
| 15,200 | | Amgen Inc.* | | | 1,153,832 |
| 14,200 | | Biogen Idec Inc.* | | | 675,920 |
| 10,600 | | Genentech Inc.* | | | 882,980 |
| 5,500 | | ImClone Systems Inc.* | | | 172,095 |
| 9,000 | | MedImmune Inc.* | | | 288,360 |
| 10,300 | | Vertex Pharmaceuticals Inc.* | | | 418,180 |
| |
| | Total Biotechnology | | | 3,591,367 |
| |
| Health Care Equipment & Supplies — 3.3% | | | |
| 6,800 | | AngioDynamics Inc.* | | | 147,220 |
| 11,800 | | Boston Scientific Corp.* | | | 187,738 |
| 6,500 | | Fisher Scientific International Inc.* | | | 556,530 |
| 5,600 | | Gen-Probe Inc.* | | | 268,072 |
| 9,400 | | ResMed Inc.* | | | 413,506 |
| |
| | Total Health Care Equipment & Supplies | | | 1,573,066 |
| |
| Health Care Providers & Services — 4.3% | | | |
| 17,300 | | Allscripts Healthcare Solutions Inc.* | | | 408,107 |
| 2,925 | | Coventry Health Care Inc.* | | | 137,329 |
| 8,500 | | Eclipsys Corp.* | | | 180,115 |
| 3,200 | | Health Net Inc.* | | | 132,832 |
| 6,600 | | Pediatrix Medical Group Inc.* | | | 296,538 |
| 10,200 | | Sierra Health Services Inc.* | | | 349,248 |
| 11,200 | | VCA Antech Inc.* | | | 362,544 |
| 3,000 | | WellCare Health Plans Inc.* | | | 176,250 |
| |
| | Total Health Care Providers & Services | | | 2,042,963 |
| |
See Notes to Financial Statements.
30 Legg Mason Partners Investment Series 2006 Annual Report
Schedules of Investments (October 31, 2006) (continued)
| | | | | |
| | |
| Shares | | Security | | Value |
| | | | | |
| Life Sciences Tools & Services — 0.5% | | | |
| 7,700 | | Parexel International Corp.* | | $ | 227,920 |
| |
| Pharmaceuticals — 2.0% | | | |
| 7,000 | | MGI Pharma Inc.* | | | 133,210 |
| 32,100 | | Pfizer Inc. | | | 855,465 |
| |
| | Total Pharmaceuticals | | | 988,675 |
| |
| | TOTAL HEALTH CARE | | | 8,423,991 |
| |
| INDUSTRIALS — 7.2% | | | |
| Aerospace & Defense — 1.4% | | | |
| 6,200 | | Armor Holdings Inc.* | | | 319,052 |
| 4,200 | | L-3 Communications Holdings Inc. | | | 338,184 |
| |
| | Total Aerospace & Defense | | | 657,236 |
| |
| Commercial Services & Supplies — 1.0% | | | |
| 4,000 | | Geo Group, Inc.* | | | 152,000 |
| 9,520 | | R.R. Donnelley & Sons Co. | | | 322,347 |
| |
| | Total Commercial Services & Supplies | | | 474,347 |
| |
| Electrical Equipment — 1.0% | | | |
| 10,380 | | Roper Industries Inc. | | | 496,683 |
| |
| Industrial Conglomerates — 0.7% | | | |
| 9,500 | | General Electric Co. | | | 333,545 |
| |
| Machinery — 2.7% | | | |
| 11,900 | | AGCO Corp.* | | | 318,325 |
| 4,500 | | Eaton Corp. | | | 325,935 |
| 7,400 | | JLG Industries Inc. | | | 204,610 |
| 5,000 | | Mueller Industries Inc. | | | 183,350 |
| 3,400 | | Parker Hannifin Corp. | | | 284,342 |
| |
| | Total Machinery | | | 1,316,562 |
| |
| Trading Companies & Distributors — 0.4% | | | |
| 4,300 | | MSC Industrial Direct Co. Inc., Class A Shares | | | 175,956 |
| |
| | TOTAL INDUSTRIALS | | | 3,454,329 |
| |
| INFORMATION TECHNOLOGY — 26.3% | | | |
| Communications Equipment — 5.0% | | | |
| 34,500 | | Cisco Systems Inc.* | | | 832,485 |
| 20,000 | | Foundry Networks Inc.* | | | 253,200 |
| 21,100 | | Juniper Networks Inc.* | | | 363,342 |
| 40,200 | | Motorola Inc. | | | 927,012 |
| |
| | Total Communications Equipment | | | 2,376,039 |
| |
| Computers & Peripherals — 2.8% | | | |
| 7,800 | | Intergraph Corp.* | | | 340,782 |
| 4,100 | | Lexmark International Inc., Class A Shares* | | | 260,719 |
| 17,000 | | Palm Inc.* | | | 260,950 |
| 8,800 | | Rackable Systems, Inc.* | | | 272,888 |
| 10,500 | | Western Digital Corp.* | | | 191,940 |
| |
| | Total Computers & Peripherals | | | 1,327,279 |
| |
See Notes to Financial Statements.
Legg Mason Partners Investment Series 2006 Annual Report 31
Schedules of Investments (October 31, 2006) (continued)
| | | | | | |
| | |
| Shares | | Security | | Value | |
| | | | | | |
| Electronic Equipment & Instruments — 1.9% | | | | |
| 17,850 | | Benchmark Electronics Inc.* | | $ | 473,918 | |
| 9,800 | | Trimble Navigation Ltd.* | | | 452,956 | |
| | |
| | Total Electronic Equipment & Instruments | | | 926,874 | |
| | |
| Internet Software & Services — 3.1% | | | | |
| 24,400 | | eBay Inc.* | | | 783,972 | |
| 7,900 | | j2 Global Communications Inc.* | | | 216,776 | |
| 19,300 | | Yahoo! Inc.* | | | 508,362 | |
| | |
| | Total Internet Software & Services | | | 1,509,110 | |
| | |
| IT Services — 1.5% | | | | |
| 31,400 | | MPS Group Inc.* | | | 478,850 | |
| 9,700 | | Sabre Holdings Corp., Class A Shares | | | 246,574 | |
| | |
| | Total IT Services | | | 725,424 | |
| | |
| Semiconductors & Semiconductor Equipment — 7.1% | | | | |
| 8,000 | | Agere Systems Inc.* | | | 135,840 | |
| 6,400 | | Diodes Inc.* | | | 281,856 | |
| 16,400 | | Entegris Inc.* | | | 183,844 | |
| 7,500 | | FormFactor Inc.* | | | 286,350 | |
| 7,500 | | Freescale Semiconductor Inc., Class B Shares* | | | 294,975 | |
| 5,800 | | Hittite Microwave Corp.* | | | 198,882 | |
| 24,600 | | Intel Corp. | | | 524,964 | |
| 11,890 | | MEMC Electronic Materials Inc.* | | | 422,095 | |
| 17,220 | | Microsemi Corp.* | | | 337,512 | |
| 23,800 | | Texas Instruments Inc. | | | 718,284 | |
| | |
| | Total Semiconductors & Semiconductor Equipment | | | 3,384,602 | |
| | |
| Software — 4.9% | | | | |
| 12,700 | | Check Point Software Technologies Ltd.* | | | 263,144 | |
| 16,800 | | Concur Technologies Inc.* | | | 267,792 | |
| 13,300 | | Electronic Arts Inc.* | | | 703,437 | |
| 29,500 | | Microsoft Corp. | | | 846,945 | |
| 20,000 | | Quest Software Inc.* | | | 294,600 | |
| | |
| | Total Software | | | 2,375,918 | |
| | |
| | TOTAL INFORMATION TECHNOLOGY | | | 12,625,246 | |
| | |
| MATERIALS — 0.2% | | | | |
| Metals & Mining — 0.2% | | | | |
| 2,600 | | Reliance Steel & Aluminum Co. | | | 89,310 | |
| | |
| UTILITIES — 1.2% | | | | |
| Multi-Utilities — 1.2% | | | | |
| 7,950 | | SCANA Corp. | | | 317,682 | |
| 4,500 | | Sempra Energy | | | 238,680 | |
| | |
| | TOTAL UTILITIES | | | 556,362 | |
| | |
| | TOTAL INVESTMENTS BEFORE SHORT-TERM INVESTMENT (Cost — $38,973,616) | | | 47,137,544 | |
| | |
See Notes to Financial Statements.
32 Legg Mason Partners Investment Series 2006 Annual Report
Schedules of Investments (October 31, 2006) (continued)
| | | | | | | |
| | |
Face
Amount | | Security | | Value | |
| | SHORT-TERM INVESTMENT — 2.8% | | | | |
| | Repurchase Agreement — 2.8% | | | | |
| $ | 1,346,000 | | Interest in $382,313,000 joint tri-party repurchase agreement dated 10/31/06 with Banc of America Securities LLC, 5.290% due 11/1/06; Proceeds at maturity — $1,346,198; (Fully collateralized by various U.S. government agency obligations, 0.000% to 5.375% due 7/23/07 to 5/15/19; Market value — $1,372,930) (Cost — $1,346,000) | | $ | 1,346,000 | |
| | | |
| | | TOTAL INVESTMENTS — 101.2% (Cost — $40,319,616#) | | | 48,483,544 | |
| | | Liabilities in Excess of Other Assets — (1.2)% | | | (565,550 | ) |
| | | |
| | | TOTAL NET ASSETS — 100.0% | | $ | 47,917,994 | |
| | | |
| * | | Non-income producing security. |
| # | | Aggregate cost for federal income tax purposes is $40,608,310. |
See Notes to Financial Statements.
Legg Mason Partners Investment Series 2006 Annual Report 33
Schedules of Investments (October 31, 2006) (continued)
LEGG MASON PARTNERS VARIABLE DIVIDEND STRATEGY PORTFOLIO
| | | | | |
| | |
| Shares | | Security | | Value |
| | | | | |
| COMMON STOCKS — 92.2% | | | |
| CONSUMER DISCRETIONARY — 4.9% | | | |
| Hotels, Restaurants & Leisure — 1.1% | | | |
| 19,721 | | McDonald’s Corp. | | $ | 826,704 |
| |
| Leisure Equipment & Products — 0.2% | | | |
| 5,500 | | Hasbro Inc. | | | 142,560 |
| |
| Media — 2.7% | | | |
| 15,200 | | News Corp., Class B Shares | | | 330,448 |
| 69,300 | | Pearson PLC | | | 1,022,943 |
| 12,870 | | Regal Entertainment Group, Class A Shares | | | 266,795 |
| 22,800 | | Time Warner Inc. | | | 456,228 |
| |
| | Total Media | | | 2,076,414 |
| |
| Specialty Retail — 0.9% | | | |
| 10,100 | | Gap Inc. | | | 212,302 |
| 12,799 | | Home Depot Inc. | | | 477,787 |
| |
| | Total Specialty Retail | | | 690,089 |
| |
| | TOTAL CONSUMER DISCRETIONARY | | | 3,735,767 |
| |
| CONSUMER STAPLES — 11.0% | | | |
| Beverages — 1.6% | | | |
| 11,400 | | Coca-Cola Co. | | | 532,608 |
| 11,397 | | PepsiCo Inc. | | | 723,026 |
| |
| | Total Beverages | | | 1,255,634 |
| |
| Food & Staples Retailing — 2.2% | | | |
| 34,100 | | Wal-Mart Stores Inc. | | | 1,680,448 |
| |
| Food Products — 3.8% | | | |
| 9,900 | | Cadbury Schweppes PLC, ADR | | | 401,841 |
| 11,250 | | Campbell Soup Co. | | | 420,525 |
| 12,800 | | General Mills Inc. | | | 727,296 |
| 8,600 | | H.J. Heinz Co. | | | 362,576 |
| 42,161 | | Unilever PLC, ADR | | | 1,023,669 |
| |
| | Total Food Products | | | 2,935,907 |
| |
| Household Products — 3.4% | | | |
| 27,906 | | Kimberly-Clark Corp. | | | 1,856,307 |
| 11,400 | | Procter & Gamble Co. | | | 722,646 |
| |
| | Total Household Products | | | 2,578,953 |
| |
| | TOTAL CONSUMER STAPLES | | | 8,450,942 |
| |
| ENERGY — 7.4% | | | |
| Oil, Gas & Consumable Fuels — 7.4% | | | |
| 11,500 | | BP PLC, ADR | | | 771,650 |
| 27,946 | | Chevron Corp. | | | 1,877,971 |
| 42,842 | | Exxon Mobil Corp. | | | 3,059,776 |
| |
| | TOTAL ENERGY | | | 5,709,397 |
| |
See Notes to Financial Statements.
34 Legg Mason Partners Investment Series 2006 Annual Report
Schedules of Investments (October 31, 2006) (continued)
| | | | | |
| | |
| Shares | | Security | | Value |
| | | | | |
| EXCHANGE TRADED FUND — 0.5% | | | |
| 11,400 | | Health Care Select Sector SPDR Fund | | $ | 379,620 |
| |
| FINANCIALS — 14.9% | | | |
| Capital Markets — 2.7% | | | |
| 4,300 | | Bank of New York Co. Inc. | | | 147,791 |
| 12,100 | | Merrill Lynch & Co. Inc. | | | 1,057,782 |
| 14,526 | | UBS AG, Registered Shares | | | 869,236 |
| |
| | Total Capital Markets | | | 2,074,809 |
| |
| Commercial Banks — 2.8% | | | |
| 7,200 | | Wachovia Corp. | | | 399,600 |
| 49,146 | | Wells Fargo & Co. | | | 1,783,508 |
| |
| | Total Commercial Banks | | | 2,183,108 |
| |
| Consumer Finance — 0.6% | | | |
| 8,500 | | American Express Co. | | | 491,385 |
| |
| Diversified Financial Services — 5.6% | | | |
| 37,678 | | Bank of America Corp. | | | 2,029,714 |
| 47,141 | | JPMorgan Chase & Co. | | | 2,236,369 |
| |
| | Total Diversified Financial Services | | | 4,266,083 |
| |
| Insurance — 2.5% | | | |
| 25,842 | | Chubb Corp. | | | 1,373,502 |
| 4,300 | | Marsh & McLennan Cos. Inc. | | | 126,592 |
| 8,500 | | St. Paul Travelers Cos. Inc. | | | 434,605 |
| |
| | Total Insurance | | | 1,934,699 |
| |
| Real Estate Investment Trusts (REITs) — 0.4% | | | |
| 20,200 | | Annaly Mortgage Management Inc. | | | 265,024 |
| |
| Thrifts & Mortgage Finance — 0.3% | | | |
| 14,300 | | Hudson City Bancorp Inc. | | | 196,339 |
| |
| | TOTAL FINANCIALS | | | 11,411,447 |
| |
| HEALTH CARE — 13.7% | | | |
| Health Care Equipment & Supplies — 1.3% | | | |
| 16,092 | | Baxter International Inc. | | | 739,749 |
| 4,250 | | Medtronic Inc. | | | 206,890 |
| |
| | Total Health Care Equipment & Supplies | | | 946,639 |
| |
| Pharmaceuticals — 12.4% | | | |
| 36,756 | | Abbott Laboratories | | | 1,746,278 |
| 7,125 | | Bristol-Myers Squibb Co. | | | 176,344 |
| 6,500 | | Eli Lilly & Co. | | | 364,065 |
| 21,494 | | GlaxoSmithKline PLC, ADR | | | 1,144,555 |
| 33,450 | | Johnson & Johnson | | | 2,254,530 |
| 10,000 | | Novartis AG, ADR | | | 607,300 |
| 51,857 | | Pfizer Inc. | | | 1,381,989 |
| 36,605 | | Wyeth | | | 1,867,953 |
| |
| | Total Pharmaceuticals | | | 9,543,014 |
| |
| | TOTAL HEALTH CARE | | | 10,489,653 |
| |
See Notes to Financial Statements.
Legg Mason Partners Investment Series 2006 Annual Report 35
Schedules of Investments (October 31, 2006) (continued)
| | | | | |
| | |
| Shares | | Security | | Value |
| | | | | |
| INDUSTRIALS — 16.6% | | | |
| Aerospace & Defense — 5.0% | | | |
| 47,882 | | Honeywell International Inc. | | $ | 2,016,790 |
| 12,800 | | Raytheon Co. | | | 639,360 |
| 18,600 | | United Technologies Corp. | | | 1,222,392 |
| |
| | Total Aerospace & Defense | | | 3,878,542 |
| |
| Air Freight & Logistics — 0.6% | | | |
| 5,700 | | United Parcel Service Inc., Class B Shares | | | 429,495 |
| |
| Building Products — 0.4% | | | |
| 11,300 | | Masco Corp. | | | 312,445 |
| |
| Commercial Services & Supplies — 2.6% | | | |
| 12,750 | | Pitney Bowes Inc. | | | 595,552 |
| 14,300 | | R.R. Donnelley & Sons Co. | | | 484,198 |
| 24,200 | | Waste Management Inc. | | | 907,016 |
| |
| | Total Commercial Services & Supplies | | | 1,986,766 |
| |
| Electrical Equipment — 2.6% | | | |
| 2,900 | | Cooper Industries Ltd., Class A Shares | | | 259,405 |
| 20,710 | | Emerson Electric Co. | | | 1,747,924 |
| |
| | Total Electrical Equipment | | | 2,007,329 |
| |
| Industrial Conglomerates — 5.4% | | | |
| 11,400 | | 3M Co. | | | 898,776 |
| 78,025 | | General Electric Co. | | | 2,739,458 |
| 17,100 | | Tyco International Ltd. | | | 503,253 |
| |
| | Total Industrial Conglomerates | | | 4,141,487 |
| |
| | TOTAL INDUSTRIALS | | | 12,756,064 |
| |
| INFORMATION TECHNOLOGY — 6.8% | | | |
| Computers & Peripherals — 1.4% | | | |
| 11,430 | | International Business Machines Corp. | | | 1,055,332 |
| |
| IT Services — 1.2% | | | |
| 18,500 | | Automatic Data Processing Inc. | | | 914,640 |
| |
| Semiconductors & Semiconductor Equipment — 1.5% | | | |
| 18,500 | | Intel Corp. | | | 394,790 |
| 81,800 | | Taiwan Semiconductor Manufacturing Co., Ltd., ADR | | | 793,460 |
| |
| | Total Semiconductors & Semiconductor Equipment | | | 1,188,250 |
| |
| Software — 2.7% | | | |
| 72,621 | | Microsoft Corp. | | | 2,084,949 |
| |
| | TOTAL INFORMATION TECHNOLOGY | | | 5,243,171 |
| |
See Notes to Financial Statements.
36 Legg Mason Partners Investment Series 2006 Annual Report
Schedules of Investments (October 31, 2006) (continued)
| | | | | |
| | |
| Shares | | Security | | Value |
| | | | | |
| MATERIALS — 8.0% | | | |
| Chemicals — 5.5% | | | |
| 28,830 | | Dow Chemical Co. | | $ | 1,175,976 |
| 50,800 | | E.I. du Pont de Nemours & Co. | | | 2,326,640 |
| 9,980 | | PPG Industries Inc. | | | 682,632 |
| |
| | Total Chemicals | | | 4,185,248 |
| |
| Metals & Mining — 1.0% | | | |
| 25,644 | | Alcoa Inc. | | | 741,368 |
| |
| Paper & Forest Products — 1.5% | | | |
| 18,688 | | Weyerhaeuser Co. | | | 1,188,370 |
| |
| | TOTAL MATERIALS | | | 6,114,986 |
| |
| TELECOMMUNICATION SERVICES — 6.2% | | | |
| Diversified Telecommunication Services — 4.7% | | | |
| 8,500 | | AT&T Inc. | | | 291,125 |
| 32,511 | | BellSouth Corp. | | | 1,466,246 |
| 10,000 | | Embarq Corp. | | | 483,500 |
| 37,919 | | Verizon Communications Inc. | | | 1,403,003 |
| |
| | Total Diversified Telecommunication Services | | | 3,643,874 |
| |
| Wireless Telecommunication Services — 1.5% | | | |
| 44,187 | | Vodafone Group PLC, ADR | | | 1,142,234 |
| |
| | TOTAL TELECOMMUNICATION SERVICES | | | 4,786,108 |
| |
| UTILITIES — 2.2% | | | |
| Electric Utilities — 1.4% | | | |
| 13,416 | | Duke Energy Corp. | | | 424,482 |
| 12,800 | | FPL Group Inc. | | | 652,800 |
| |
| | Total Electric Utilities | | | 1,077,282 |
| |
| Multi-Utilities — 0.8% | | | |
| 5,700 | | Ameren Corp. | | | 308,370 |
| 14,300 | | NiSource Inc. | | | 332,761 |
| |
| | Total Multi-Utilities | | | 641,131 |
| |
| | TOTAL UTILITIES | | | 1,718,413 |
| |
| | TOTAL INVESTMENTS BEFORE SHORT-TERM INVESTMENTS
(Cost — $59,051,425) | | | 70,795,568 |
| |
See Notes to Financial Statements.
Legg Mason Partners Investment Series 2006 Annual Report 37
Schedules of Investments (October 31, 2006) (continued)
| | | | | | | |
| | |
Face
Amount | | Security | | Value | |
| | SHORT-TERM INVESTMENTS — 4.7% | | | | |
| | Repurchase Agreements — 4.7% | | | | |
| $ | 2,014,000 | | Interest in $382,313,000 joint tri-party repurchase agreement dated 10/31/06 with Banc of America Securities LLC, 5.290% due 11/1/06; Proceeds at maturity — $2,014,296; (Fully collateralized by various U.S. government agency obligations, 0.000% to 5.375% due 7/23/07 to 5/15/19; Market value — $2,054,295) | | $ | 2,014,000 | |
| | 1,577,000 | | Interest in $8,280,000 joint tri-party repurchase agreement dated 10/31/06 with Deutsche Bank Securities Inc., 5.290% due 11/1/06; Proceeds at maturity — $1,577,232; (Fully collateralized by various U.S. government agency obligations, 1.370% to 5.000% due 1/1/18 to 7/15/35; Market value — $1,608,540) | | | 1,577,000 | |
| | | |
| | | TOTAL SHORT-TERM INVESTMENTS
(Cost — $3,591,000) | | | 3,591,000 | |
| | | |
| | | TOTAL INVESTMENTS — 96.9% (Cost — $62,642,425#) | | | 74,386,568 | |
| | | Other Assets in Excess of Liabilities — 3.1% | | | 2,381,695 | |
| | | |
| | | TOTAL NET ASSETS — 100.0% | | $ | 76,768,263 | |
| | | |
| # | | Aggregate cost for federal income tax purposes is $63,074,449. |
| | |
Abbreviations used in this schedule: |
| ADR | | — American Depositary Receipt |
| SPDR | | — Standard & Poor’s Depositary Receipts |
See Notes to Financial Statements.
38 Legg Mason Partners Investment Series 2006 Annual Report
Schedules of Investments (October 31, 2006) (continued)
LEGG MASON PARTNERS VARIABLE GROWTH AND INCOME PORTFOLIO
| | | | | |
| | |
| Shares | | Security | | Value |
| | | | | |
| COMMON STOCKS — 98.0% |
| CONSUMER DISCRETIONARY — 12.0% |
| Hotels, Restaurants & Leisure — 3.1% |
| 39,340 | | McDonald’s Corp. | | $ | 1,649,133 |
| 13,000 | | Station Casinos Inc. | | | 783,900 |
| |
| | Total Hotels, Restaurants & Leisure | | | 2,433,033 |
| |
| Household Durables — 2.0% |
| 53,700 | | Toll Brothers Inc.* | | | 1,552,467 |
| |
| Media — 4.5% |
| 23,000 | | EchoStar Communications Corp., Class A Shares* | | | 816,960 |
| 64,520 | | News Corp., Class B Shares | | | 1,402,664 |
| 62,600 | | Time Warner Inc. | | | 1,252,626 |
| |
| | Total Media | | | 3,472,250 |
| |
| Specialty Retail — 2.4% |
| 24,200 | | Best Buy Co. Inc. | | | 1,337,050 |
| 22,300 | | Staples Inc. | | | 575,117 |
| |
| | Total Specialty Retail | | | 1,912,167 |
| |
| | TOTAL CONSUMER DISCRETIONARY | | | 9,369,917 |
| |
| CONSUMER STAPLES — 8.5% |
| Beverages — 1.7% |
| 21,210 | | PepsiCo Inc. | | | 1,345,562 |
| |
| Food & Staples Retailing — 2.7% |
| 42,800 | | Wal-Mart Stores Inc. | | | 2,109,184 |
| |
| Food Products — 2.4% |
| 19,160 | | Kellogg Co. | | | 963,940 |
| 24,850 | | McCormick & Co. Inc., Non Voting Shares | | | 929,390 |
| |
| | Total Food Products | | | 1,893,330 |
| |
| Household Products — 1.7% |
| 20,240 | | Procter & Gamble Co. | | | 1,283,014 |
| |
| | TOTAL CONSUMER STAPLES | | | 6,631,090 |
| |
| ENERGY — 8.3% |
| Energy Equipment & Services — 1.1% |
| 17,510 | | ENSCO International Inc. | | | 857,465 |
| |
| Oil, Gas & Consumable Fuels — 7.2% |
| 11,836 | | ConocoPhillips | | | 713,001 |
| 32,220 | | Exxon Mobil Corp. | | | 2,301,152 |
| 9,480 | | Suncor Energy Inc. | | | 726,642 |
| 27,300 | | Total SA, ADR | | | 1,860,222 |
| |
| | Total Oil, Gas & Consumable Fuels | | | 5,601,017 |
| |
| | TOTAL ENERGY | | | 6,458,482 |
| |
See Notes to Financial Statements.
Legg Mason Partners Investment Series 2006 Annual Report 39
Schedules of Investments (October 31, 2006) (continued)
| | | | | |
| | |
| Shares | | Security | | Value |
| | | | | |
| FINANCIALS — 23.6% |
| Capital Markets — 4.5% |
| 9,090 | | Goldman Sachs Group Inc. | | $ | 1,725,191 |
| 19,820 | | Merrill Lynch & Co. Inc. | | | 1,732,665 |
| |
| | Total Capital Markets | | | 3,457,856 |
| |
| Commercial Banks — 2.9% |
| 62,480 | | Wells Fargo & Co. | | | 2,267,399 |
| |
| Consumer Finance — 3.4% |
| 24,710 | | American Express Co. | | | 1,428,485 |
| 15,170 | | Capital One Financial Corp. | | | 1,203,436 |
| |
| | Total Consumer Finance | | | 2,631,921 |
| |
| Diversified Financial Services — 4.9% |
| 33,636 | | Bank of America Corp. | | | 1,811,972 |
| 42,848 | | JPMorgan Chase & Co. | | | 2,032,709 |
| |
| | Total Diversified Financial Services | | | 3,844,681 |
| |
| Insurance — 4.7% |
| 21,170 | | AFLAC Inc. | | | 950,956 |
| 8 | | Berkshire Hathaway Inc., Class A Shares* | | | 843,800 |
| 19,920 | | Chubb Corp. | | | 1,058,748 |
| 28,000 | | Marsh & McLennan Cos. Inc. | | | 824,320 |
| |
| | Total Insurance | | | 3,677,824 |
| |
| Thrifts & Mortgage Finance — 3.2% |
| 25,200 | | Freddie Mac | | | 1,738,548 |
| 56,100 | | Hudson City Bancorp Inc. | | | 770,253 |
| |
| | Total Thrifts & Mortgage Finance | | | 2,508,801 |
| |
| | TOTAL FINANCIALS | | | 18,388,482 |
| |
| HEALTH CARE — 9.2% |
| Biotechnology — 1.5% |
| 15,570 | | Amgen Inc.* | | | 1,181,919 |
| |
| Health Care Providers & Services — 2.5% |
| 14,755 | | Coventry Health Care Inc.* | | | 692,747 |
| 7,300 | | Medco Health Solutions Inc.* | | | 390,550 |
| 17,700 | | UnitedHealth Group Inc. | | | 863,406 |
| |
| | Total Health Care Providers & Services | | | 1,946,703 |
| |
| Pharmaceuticals — 5.2% |
| 29,700 | | Sanofi-Aventis, ADR | | | 1,267,893 |
| 44,500 | | Schering-Plough Corp. | | | 985,230 |
| 22,480 | | Teva Pharmaceutical Industries Ltd., ADR | | | 741,165 |
| 20,700 | | Wyeth | | | 1,056,321 |
| |
| | Total Pharmaceuticals | | | 4,050,609 |
| |
| | TOTAL HEALTH CARE | | | 7,179,231 |
| |
See Notes to Financial Statements.
40 Legg Mason Partners Investment Series 2006 Annual Report
Schedules of Investments (October 31, 2006) (continued)
| | | | | |
| | |
| Shares | | Security | | Value |
| | | | | |
| INDUSTRIALS — 11.3% |
| Aerospace & Defense — 2.8% |
| 11,775 | | Boeing Co. | | $ | 940,352 |
| 19,400 | | Honeywell International Inc. | | | 817,128 |
| 24,000 | | Orbital Sciences Corp.* | | | 435,840 |
| |
| | Total Aerospace & Defense | | | 2,193,320 |
| |
| Building Products — 2.0% |
| 55,300 | | Masco Corp. | | | 1,529,045 |
| |
| Industrial Conglomerates — 5.2% |
| 88,200 | | General Electric Co. | | | 3,096,702 |
| 10,780 | | Textron Inc. | | | 980,225 |
| |
| | Total Industrial Conglomerates | | | 4,076,927 |
| |
| Machinery — 1.3% |
| 12,000 | | Parker Hannifin Corp. | | | 1,003,560 |
| |
| | TOTAL INDUSTRIALS | | | 8,802,852 |
| |
| INFORMATION TECHNOLOGY — 16.7% |
| Communications Equipment — 7.1% |
| 69,500 | | Cisco Systems Inc.* | | | 1,677,035 |
| 44,800 | | Juniper Networks Inc.* | | | 771,456 |
| 39,300 | | Motorola Inc. | | | 906,258 |
| 59,300 | | QUALCOMM Inc. | | | 2,157,927 |
| |
| | Total Communications Equipment | | | 5,512,676 |
| |
| Electronic Equipment & Instruments — 0.7% |
| 27,270 | | Dolby Laboratories Inc., Class A Shares* | | | 539,673 |
| |
| IT Services — 1.1% |
| 21,400 | | Paychex Inc. | | | 844,872 |
| |
| Semiconductors & Semiconductor Equipment — 2.0% |
| 43,100 | | ASML Holding NV, NY Registered Shares* | | | 984,404 |
| 18,300 | | Texas Instruments Inc. | | | 552,294 |
| |
| | Total Semiconductors & Semiconductor Equipment | | | 1,536,698 |
| |
| Software — 5.8% |
| 21,900 | | Adobe Systems Inc.* | | | 837,675 |
| 14,560 | | Electronic Arts Inc.* | | | 770,079 |
| 103,120 | | Microsoft Corp. | | | 2,960,575 |
| |
| | Total Software | | | 4,568,329 |
| |
| | TOTAL INFORMATION TECHNOLOGY | | | 13,002,248 |
| |
| MATERIALS — 5.0% |
| Chemicals — 2.6% |
| 27,400 | | E.I. du Pont de Nemours & Co. | | | 1,254,920 |
| 17,300 | | Ecolab Inc. | | | 784,555 |
| |
| | Total Chemicals | | | 2,039,475 |
| |
See Notes to Financial Statements.
Legg Mason Partners Investment Series 2006 Annual Report 41
Schedules of Investments (October 31, 2006) (continued)
| | | | | | | |
| | |
| Shares | | Security | | Value | |
| | Metals & Mining — 2.4% | |
| | 58,523 | | Barrick Gold Corp. | | $ | 1,814,213 | |
| | | |
| | | TOTAL MATERIALS | | | 3,853,688 | |
| | | |
| | TELECOMMUNICATION SERVICES — 0.8% | |
| | Wireless Telecommunication Services — 0.8% | |
| | 11,680 | | ALLTEL Corp. | | | 622,661 | |
| | | |
| | UTILITIES — 2.6% | |
| | Multi-Utilities — 2.6% | |
| | 37,500 | | Sempra Energy | | | 1,989,000 | |
| | | |
| | | TOTAL INVESTMENTS BEFORE SHORT-TERM INVESTMENT
(Cost — $62,284,951) | | | 76,297,651 | |
| | | |
| | |
Face
Amount | | | | | |
| | SHORT-TERM INVESTMENT — 2.1% | |
| | Repurchase Agreement — 2.1% | |
| $ | 1,659,000 | | Interest in $443,028,000 joint tri-party repurchase agreement dated 10/31/06 with Merrill Lynch, Pierce, Fenner & Smith Inc., 5.290% due 11/1/06; Proceeds at maturity — $1,659,244; (Fully collateralized by U.S. Treasury Note,
4.875% due 8/15/16; Market value — $1,692,180)
(Cost — $1,659,000) | | | 1,659,000 | |
| | | |
| | | TOTAL INVESTMENTS — 100.1% (Cost — $63,943,951#) | | | 77,956,651 | |
| | | Liabilities in Excess of Other Assets — (0.1)% | | | (89,733 | ) |
| | | |
| | | TOTAL NET ASSETS — 100.0% | | $ | 77,866,918 | |
| | | |
| * | | Non-income producing security. |
| # | | Aggregate cost for federal income tax purposes is $64,131,109. |
| | |
Abbreviation used in this schedule: |
| ADR | | — American Depositary Receipt |
See Notes to Financial Statements.
42 Legg Mason Partners Investment Series 2006 Annual Report
Schedules of Investments (October 31, 2006) (continued)
LEGG MASON PARTNERS VARIABLE GOVERNMENT PORTFOLIO
| | | | | | | |
| | |
Face
Amount | | Security | | Value | |
| | | | | | | |
| | | | | | | |
| | U.S. GOVERNMENT & AGENCY OBLIGATIONS — 52.7% | | | | |
| | U.S. Government Agency — 0.8% | | | | |
| $ | 1,000,000 | | Federal National Mortgage Association (FNMA),
Notes, 5.290% due 2/17/09 (a) | | $ | 965,930 | |
| | | |
| | U.S. Government Obligations — 51.9% | | | | |
| | | U.S. Treasury Bonds: | | | | |
| | 200,000 | | 9.000% due 11/15/18 (b) | | | 278,172 | |
| | 1,200,000 | | 8.750% due 8/15/20 (c) | | | 1,677,750 | |
| | 8,000,000 | | 4.500% due 2/15/36 (c) | | | 7,723,752 | |
| | | U.S. Treasury Notes: | | | | |
| | 1,500,000 | | 3.625% due 4/30/07 (c) | | | 1,490,040 | |
| | 7,700,000 | | 3.500% due 5/31/07 (c) | | | 7,634,735 | |
| | 8,500,000 | | 5.000% due 7/31/08 (c) | | | 8,538,522 | |
| | 7,500,000 | | 3.375% due 10/15/09 (c) | | | 7,250,392 | |
| | 5,000,000 | | 4.000% due 4/15/10 (c) | | | 4,908,790 | |
| | 5,000,000 | | 4.125% due 8/15/10 (c) | | | 4,923,635 | |
| | 14,860,000 | | 4.000% due 2/15/14 (c) | | | 14,320,166 | |
| | 2,000,000 | | 4.250% due 8/15/15 | | | 1,950,314 | |
| | 4,000,000 | | 4.500% due 11/15/15 (c) | | | 3,970,940 | |
| | | |
| | | Total U.S. Government Obligations | | | 64,667,208 | |
| | | |
| | | TOTAL U.S. GOVERNMENT & AGENCY OBLIGATIONS
(Cost — $65,598,690) | | | 65,633,138 | |
| | | |
| | ASSET-BACKED SECURITIES (a) — 11.4% | | | | |
| | Credit Card — 0.4% | | | | |
| | 500,000 | | Capital One Multi-Asset Execution Trust, Series 2004-A2,
Class A2, 5.410% due 1/17/12 (c) | | | 501,324 | |
| | | |
| | Home Equity — 10.0% | | | | |
| | 1,026,025 | | Ace Securities Corp., Series 2006-GP1, Class A, 5.450% due 2/25/31 | | | 1,026,661 | |
| | | Countrywide Home Equity Loan Trust: | | | | |
| | 1,150,706 | | Series 2004-0, Class 1A, 5.600% due 2/15/34 | | | 1,153,860 | |
| | 905,306 | | Series 2004-I, Class A, 5.610% due 2/15/34 | | | 908,374 | |
| | 1,072,857 | | Series 2006-E, Class 2A, 5.470% due 12/25/31 | | | 1,074,194 | |
| | 1,200,000 | | GMAC Mortgage Corp. Loan Trust, Series 2006-HE1, Class A,
5.530% due 11/25/36 (c) | | | 1,201,292 | |
| | 872,833 | | GSAMP Trust, Series 2006-S4, Class A1, 5.420% due 7/5/36 (c) | | | 873,420 | |
| | 1,022,121 | | Indymac Seconds Asset Backed Trust, Series 2006-A, Class A,
5.450% due 6/25/36 (c) | | | 1,022,756 | |
| | | Morgan Stanley ABS Capital I: | | | | |
| | 660,564 | | Series 2005-WMC2, Class A1MZ, 5.570% due 2/25/35 | | | 661,280 | |
| | 775,147 | | Series 2005-WMC3, Class A1MZ, 5.580% due 3/25/35 (c) | | | 775,849 | |
| | 791,769 | | Series 2005-WMC4, Class A1MZ, 5.580% due 4/25/35 (c) | | | 793,031 | |
| | 1,001,048 | | Morgan Stanley Ixis Real Estate Capital Trust, Series 2006-1, Class 1A,
5.350% due 7/25/36 (c) | | | 1,001,670 | |
See Notes to Financial Statements.
Legg Mason Partners Investment Series 2006 Annual Report 43
Schedules of Investments (October 31, 2006) (continued)
| | | | | | | |
| | |
Face
Amount | | Security | | Value | |
| | | | | | | |
| | Home Equity — 10.0% (continued) | | | | |
| $ | 988,011 | | SACO I Trust, Series 2006-6, Class A, 5.450% due 6/25/36 (c) | | $ | 988,625 | |
| | 1,023,490 | | Structured Asset Securities Corp., Series 2006-ARS1, Class A1,
5.430% due 2/25/36 (c)(d) | | | 1,023,810 | |
| | | |
| | | Total Home Equity | | | 12,504,822 | |
| | | |
| | Student Loan — 1.0% | | | | |
| | 1,200,000 | | SLM Student Loan Trust, Series 2006-5, Class A2, 5.367% due 7/25/17 (c) | | | 1,200,751 | |
| | | |
| | | TOTAL ASSET-BACKED SECURITIES
(Cost — $14,199,753) | | | 14,206,897 | |
| | | |
| | COLLATERALIZED MORTGAGE OBLIGATIONS — 14.4% | | | | |
| | | Countrywide Alternative Loan Trust: | | | | |
| | | Series 2006-OA09: | | | | |
| | 1,175,199 | | Class 1A1, 5.520% due 7/25/36 (a)(c) | | | 1,172,659 | |
| | 1,146,795 | | Class 2A1B, 5.520% due 7/25/36 (a)(c) | | | 1,150,099 | |
| | 1,161,128 | | Series 2006-OA11, Class A4, 5.510% due 7/25/36 (a)(c) | | | 1,160,154 | |
| | | Federal Home Loan Mortgage Corp. (FHLMC): | | | | |
| | 121,832 | | Series 2525, Class AM, 4.500% due 4/15/32 | | | 111,439 | |
| | 1,304,806 | | Series 2686, Class QI, PAC IO, 5.500% due 1/15/23 | | | 32,789 | |
| | 897,421 | | Series 2780, Class SL, PAC, 6.000% due 4/15/34 (a)(c) | | | 879,014 | |
| | 1,000,900 | | IMPAC Secured Assets Corp., Series 2005-2, Class A1,
5.640% due 3/25/36 (a)(c) | | | 1,003,179 | |
| | 1,078,036 | | Luminent Mortgage Trust, Series 2006-4, Class A1A,
5.510% due 5/25/46 (a)(c) | | | 1,077,214 | |
| | 208,396 | | MASTR Adjustable Rate Mortgage Trust, Series 2004-15, Class 1A1,
4.612% due 12/25/34 (a) | | | 209,008 | |
| | 876,875 | | MASTR Adjustable Rate Mortgages Trust, Series 2004-1, Class 3A2,
4.327% due 2/25/34 (a)(c) | | | 866,218 | |
| | | Morgan Stanley Mortgage Loan Trust: | | | | |
| | 904,899 | | Series 2006-4SL, Class A1, 5.470% due 3/25/36 (a)(c) | | | 905,708 | |
| | 988,020 | | Series 2006-8AR, Class 1A2, 5.390% due 6/25/36 (a)(c) | | | 988,015 | |
| | 1,101,280 | | Novastar Mortgage-Backed Notes, Series 2006-MTA1, Class 2A1A,
5.510% due 6/25/36 (a)(c) | | | 1,102,371 | |
| | 1,175,178 | | Structured Asset Mortgage Investments Inc., Series 2006-AR6,
Class 1A1, 5.504% due 12/25/35 (a)(c) | | | 1,177,706 | |
| | | Thornburg Mortgage Securities Trust, Series 2006-3: | | | | |
| | 1,166,091 | | Class A2, 5.435% due 6/25/09 (a)(c) | | | 1,164,394 | |
| | 1,171,739 | | Class A3, 5.440% due 6/25/09 (a)(c) | | | 1,169,747 | |
| | | Washington Mutual Inc.: | | | | |
| | 929,013 | | Series 2005-AR11, Class A1A, 5.640% due 8/25/45 (a)(c) | | | 932,351 | |
| | 963,004 | | Series 2005-AR17, Class A1A1, 5.590% due 12/25/45 (a)(c) | | | 967,146 | |
| | 828,826 | | Series 2005-AR19, Class A1A2, 5.610% due 12/25/45 (a)(c) | | | 831,700 | |
| | 1,067,213 | | Zuni Mortgage Loan Trust, Series 2006-OA1, Class A1,
5.460% due 6/25/36 (a)(c) | | | 1,066,448 | |
| | | |
| | | TOTAL COLLATERALIZED MORTGAGE OBLIGATIONS
(Cost — $17,961,434) | | | 17,967,359 | |
| | | |
See Notes to Financial Statements.
44 Legg Mason Partners Investment Series 2006 Annual Report
Schedules of Investments (October 31, 2006) (continued)
| | | | | | | |
| | |
Face
Amount | | Security | | Value | |
| | | | | | | |
| | MORTGAGE-BACKED SECURITIES — 47.9% | | | | |
| | FHLMC — 2.5% | | | | |
| | | Federal Home Loan Mortgage Corp. (FHLMC), Gold: | | | | |
| $ | 260,119 | | 6.500% due 9/1/31 | | $ | 266,819 | |
| | 112,217 | | 6.000% due 12/1/31 | | | 113,417 | |
| | 290,238 | | 5.000% due 8/1/33 | | | 281,239 | |
| | 2,600,000 | | 5.000% due 11/13/36 (e)(f) | | | 2,512,250 | |
| | | |
| | | TOTAL FHLMC | | | 3,173,725 | |
| | | |
| | FNMA — 39.6% | | | | |
| | | Federal National Mortgage Association (FNMA): | | | | |
| | 1,600,000 | | 4.875% due 4/15/09 | | | 1,601,266 | |
| | 3,970,000 | | 5.000% due 11/16/21-11/13/36 (e)(f) | | | 3,889,719 | |
| | 10,900,000 | | 5.500% due 11/16/21-11/13/36 (e)(f) | | | 10,825,222 | |
| | 9,630,000 | | 6.000% due 11/16/21-11/13/36 (e)(f) | | | 9,699,844 | |
| | 113,603 | | 6.500% due 4/1/29-5/1/32 | | | 116,469 | |
| | 119,131 | | 7.000% due 11/1/31 | | | 123,058 | |
| | 87,405 | | 7.500% due 3/1/32-4/1/32 | | | 90,931 | |
| | 293,263 | | 6.000% due 6/1/32 | | | 296,007 | |
| | 40,300 | | 7.500% due 12/1/32 (a) | | | 41,925 | |
| | 1,263,550 | | 6.000% due 1/1/33 (c) | | | 1,275,374 | |
| | 2,400,000 | | 4.500% due 11/13/36 (e)(f) | | | 2,252,251 | |
| | 3,800,000 | | 6.500% due 11/13/36 (e)(f) | | | 3,873,625 | |
| | 12,000,000 | | 5.000% due 12/12/36 (e) | | | 11,583,744 | |
| | 2,700,000 | | 6.000% due 12/12/36 (e) | | | 2,715,187 | |
| | 1,000,000 | | 6.500% due 12/12/36 (e) | | | 1,018,750 | |
| | | |
| | | TOTAL FNMA | | | 49,403,372 | |
| | | |
| | GNMA — 5.8% | | | | |
| | | Government National Mortgage Association (GNMA): | | | | |
| | 44,419 | | 6.500% due 6/15/31 | | | 45,764 | |
| | 54,697 | | 7.000% due 9/15/31 | | | 56,606 | |
| | 5,149,787 | | 6.000% due 3/15/33 (c) | | | 5,228,582 | |
| | 730,000 | | 5.000% due 11/20/36 (e)(f) | | | 711,978 | |
| | 1,200,000 | | 6.500% due 11/20/36 (e)(f) | | | 1,232,250 | |
| | | |
| | | TOTAL GNMA | | | 7,275,180 | |
| | | |
| | | TOTAL MORTGAGE-BACKED SECURITIES
(Cost — $60,128,620) | | | 59,852,277 | |
| | | |
| | U.S. TREASURY INFLATION PROTECTED SECURITIES — 4.8% | | | | |
| | 2,912,789 | | U.S. Treasury Bonds, Inflation Indexed, 2.000% due 1/15/26 (c) | | | 2,784,787 | |
| | | U.S. Treasury Notes, Inflation Indexed: | | | | |
| | 2,013,332 | | 2.375% due 4/15/11 (c) | | | 2,003,186 | |
| | 1,231,688 | | 2.500% due 7/15/16 (c) | | | 1,249,779 | |
| | | |
| | | TOTAL U.S. TREASURY INFLATION PROTECTED SECURITIES
(Cost — $6,023,996) | | | 6,037,752 | |
| | | |
| | | TOTAL INVESTMENTS BEFORE SHORT-TERM INVESTMENTS
(Cost — $163,912,493) | | | 163,697,423 | |
| | | |
See Notes to Financial Statements.
Legg Mason Partners Investment Series 2006 Annual Report 45
Schedules of Investments (October 31, 2006) (continued)
| | | | | | | |
| | |
Face
Amount | | Security | | Value | |
| | SHORT-TERM INVESTMENTS — 8.5% | | | | |
| | U.S. Government Agency — 4.6% | | | | |
| $ | 5,906,000 | | U.S. Treasury Bill, 5.109% due 4/19/07 (c)(g) (Cost — $5,767,789) | | $ | 5,769,648 | |
| | | |
| | Repurchase Agreements — 3.9% | | | | |
| | 3,000,000 | | Interest in $25,000,000 joint tri-party repurchase agreement dated 10/31/06 with Morgan Stanley, 5.280% due 11/1/06; Proceeds at maturity — $3,000,440; (Fully collateralized by U.S. government agency obligation, 0.000% due 11/24/06; Market value — $3,079,494) (c) | | | 3,000,000 | |
| | 1,791,000 | | Nomura Securities International Inc. repurchase agreement dated 10/31/06, 5.280% due 11/1/06; Proceeds at maturity — $1,791,263; (Fully collateralized by U.S Treasury Note 4.375% due 9/15/12; Market value — $1,827,088) (c) | | | 1,791,000 | |
| | | |
| | | Total Repurchase Agreements | | | 4,791,000 | |
| | | |
| | | TOTAL SHORT-TERM INVESTMENTS (Cost — $10,558,789) | | | 10,560,648 | |
| | | |
| | | TOTAL INVESTMENTS — 139.7% (Cost — $174,471,282#) | | | 174,258,071 | |
| | | Liabilities in Excess of Other Assets — (39.7)% | | | (49,535,450 | ) |
| | | |
| | | TOTAL NET ASSETS — 100.0% | | $ | 124,722,621 | |
| | | |
| (a) | | Variable rate security. Interest rate disclosed is that which is in effect at October 31, 2006. |
| (b) | | All or a portion of this security is held at the broker as collateral for open futures contracts. |
| (c) | | All or a portion of this security is segregated for open futures contracts, TBA’s and/or mortgage dollar rolls. |
| (d) | | Security is exempt from registration under Rule 144A of the Securities Act of 1933. This security may be resold in transactions that are exempt from registration, normally to qualified institutional buyers. This security has been deemed liquid pursuant to guidelines approved by the Board of Trustees, unless otherwise noted. |
| (e) | | This security is traded on a to-be-announced (“TBA”) basis (See Note 1). |
| (f) | | All or a portion of this security was acquired under a mortgage dollar roll agreement (See Notes 1 and 3). |
| (g) | | Rate shown represents yield-to-maturity. |
| # | | Aggregate cost for federal income tax purposes is $174,493,243. |
| | |
Abbreviations used in this schedule: |
| IO | | — Interest Only |
| MASTR | | — Mortgage Asset Securitization Transactions Inc. |
| PAC | | — Planned Amortization Class |
See Notes to Financial Statements.
46 Legg Mason Partners Investment Series 2006 Annual Report
Statements of Assets and Liabilities (October 31, 2006)
| | | | | | | | | | | | | | | | |
| | | | |
| | | Legg Mason
Partners
Variable
Premier Selections
All Cap Growth
Portfolio | | | Legg Mason
Partners
Variable
Dividend
Strategy
Portfolio | | | Legg Mason
Partners
Variable
Growth and
Income
Portfolio | | | Legg Mason
Partners
Variable
Government
Portfolio | |
| ASSETS: | | | | | | | | | | | | | | | | |
Investments, at cost | | $ | 40,319,616 | | | $ | 62,642,425 | | | $ | 63,943,951 | | | $ | 174,471,282 | |
| | |
Investments, at value | | $ | 48,483,544 | | | $ | 74,386,568 | | | $ | 77,956,651 | | | $ | 174,258,071 | |
Cash | | | 602 | | | | 1,122 | | | | 950 | | | | 504 | |
Dividends and interest receivable | | | 13,089 | | | | 65,324 | | | | 38,677 | | | | 746,676 | |
Receivable for securities sold | | | — | | | | 2,496,628 | | | | — | | | | 16,536,988 | |
Receivable for Fund shares sold | | | — | | | | 5,145 | | | | 56,936 | | | | 34,934 | |
Prepaid expenses | | | 912 | | | | 959 | | | | 1,183 | | | | 1,751 | |
| | |
Total Assets | | | 48,498,147 | | | | 76,955,746 | | | | 78,054,397 | | | | 191,578,924 | |
| | |
| LIABILITIES: | | | | | | | | | | | | | | | | |
Payable for securities purchased | | | 339,085 | | | | — | | | | — | | | | 66,700,786 | |
Payable for Fund shares repurchased | | | 174,720 | | | | 73,541 | | | | 89,833 | | | | — | |
Investment management fee payable | | | 6,780 | | | | 42,262 | | | | 43,042 | | | | 58,100 | |
Trustees’ retirement plan | | | 1,394 | | | | 2,204 | | | | 2,215 | | | | 3,703 | |
Trustees’ fees payable | | | 1,045 | | | | 1,524 | | | | — | | | | 496 | |
Payable to broker — variation margin on open futures contracts | | | — | | | | — | | | | — | | | | 19,537 | |
Deferred dollar roll income | | | — | | | | — | | | | — | | | | 6,835 | |
Accrued expenses | | | 57,129 | | | | 67,952 | | | | 52,389 | | | | 66,846 | |
| | |
Total Liabilities | | | 580,153 | | | | 187,483 | | | | 187,479 | | | | 66,856,303 | |
| | |
Total Net Assets | | $ | 47,917,994 | | | $ | 76,768,263 | | | $ | 77,866,918 | | | $ | 124,722,621 | |
| | |
| NET ASSETS: | | | | | | | | | | | | | | | | |
Par value (Note 4) | | $ | 35 | | | $ | 77 | | | $ | 73 | | | $ | 110 | |
Paid-in capital in excess of par value | | | 45,568,219 | | | | 88,001,590 | | | | 66,712,052 | | | | 126,992,435 | |
Undistributed net investment income | | | — | | | | 1,120,391 | | | | 346,101 | | | | 3,738,936 | |
Accumulated net realized loss on investments, futures contracts and foreign currency transactions | | | (5,814,188 | ) | | | (24,097,938 | ) | | | (3,204,008 | ) | | | (5,825,023 | ) |
Net unrealized appreciation (depreciation) on investments and futures contracts | | | 8,163,928 | | | | 11,744,143 | | | | 14,012,700 | | | | (183,837 | ) |
| | |
Total Net Assets | | $ | 47,917,994 | | | $ | 76,768,263 | | | $ | 77,866,918 | | | $ | 124,722,621 | |
| | |
Shares Outstanding | | | 3,539,188 | | | | 7,711,442 | | | | 7,325,527 | | | | 10,999,788 | |
| | |
Net Asset Value | | | $13.54 | | | | $9.96 | | | | $10.63 | | | | $11.34 | |
| | |
See Notes to Financial Statements.
Legg Mason Partners Investment Series 2006 Annual Report 47
Statements of Operations (For the year ended October 31, 2006)
| | | | | | | | | | | | | | | | |
| | | | |
| | | Legg Mason
Partners
Variable
Premier Selections
All Cap Growth
Portfolio | | | Legg Mason
Partners
Variable
Dividend
Strategy
Portfolio | | | Legg Mason
Partners
Variable
Growth and
Income
Portfolio | | | Legg Mason
Partners
Variable
Government
Portfolio | |
INVESTMENT INCOME: | | | | | | | | | | | | | | | | |
Interest | | $ | 25,118 | | | $ | 152,099 | | | $ | 66,552 | | | $ | 6,246,510 | |
Dividends | | | 446,092 | | | | 2,096,246 | | | | 1,155,103 | | | | — | |
Income from securities lending | | | — | | | | — | | | | 454 | | | | — | |
Less: Foreign taxes withheld | | | — | | | | (4,619 | ) | | | (16,459 | ) | | | — | |
| | |
Total Investment Income | | | 471,210 | | | | 2,243,726 | | | | 1,205,650 | | | | 6,246,510 | |
| | |
| EXPENSES: | | | | | | | | | | | | | | | | |
Investment management fee (Note 2) | | | 385,569 | | | | 490,636 | | | | 497,808 | | | | 700,952 | |
Legal fees | | | 67,510 | | | | 78,850 | | | | 67,460 | | | | 69,337 | |
Shareholder reports | | | 25,743 | | | | 32,996 | | | | 21,938 | | | | 61,690 | |
Merger and proxy fees | | | 19,150 | | | | 8,063 | | | | 21,667 | | | | 10,109 | |
Audit and tax | | | 18,300 | | | | 21,383 | | | | 18,899 | | | | 20,176 | |
Custody fees | | | 6,294 | | | | 27,908 | | | | 5,248 | | | | 6,096 | |
Trustees’ fees | | | 4,619 | | | | 7,957 | | | | 9,895 | | | | 5,871 | |
Insurance | | | 1,260 | | | | 1,063 | | | | 1,624 | | | | 2,867 | |
Transfer agent fees (Note 2) | | | 1,024 | | | | 1,213 | | | | 699 | | | | 1,270 | |
Registration fees | | | 59 | | | | 94 | | | | 488 | | | | 423 | |
Miscellaneous expenses | | | 4,860 | | | | 5,798 | | | | 6,901 | | | | 3,499 | |
| | |
Total Expenses | | | 534,388 | | | | 675,961 | | | | 652,627 | | | | 882,290 | |
Less: Fee waivers and/or expense reimbursements (Notes 2 and 6) | | | (26,491 | ) | | | (3,238 | ) | | | (3,247 | ) | | | (4,474 | ) |
| | |
Net Expenses | | | 507,897 | | | | 672,723 | | | | 649,380 | | | | 877,816 | |
| | |
Net Investment Income (Loss) | | | (36,687 | ) | | | 1,571,003 | | | | 556,270 | | | | 5,368,694 | |
| | |
REALIZED AND UNREALIZED GAIN
(LOSS) ON INVESTMENTS, FUTURES CONTRACTS AND FOREIGN CURRENCY TRANSACTIONS (NOTES 1 AND 3): | | | | | | | | | | | | | | | | |
Net Realized Gain (Loss) From: | | | | | | | | | | | | | | | | |
Investment transactions | | | 4,518,544 | | | | 1,933,064 | | | | 4,078,887 | | | | (2,123,967 | ) |
Futures contracts | | | — | | | | — | | | | — | | | | 264,304 | |
Foreign currency transactions | | | — | | | | 57 | | | | (8 | ) | | | — | |
| | |
Net Realized Gain (Loss) | | | 4,518,544 | | | | 1,933,121 | | | | 4,078,879 | | | | (1,859,663 | ) |
| | |
Change in Net Unrealized Appreciation/Depreciation From: | | | | | | | | | | | | | | | | |
Investments | | | 376,074 | | | | 8,271,356 | | | | 4,771,681 | | | | 2,177,449 | |
Futures contracts | | | — | | | | — | | | | — | | | | (50,843 | ) |
| | |
Change in Net Unrealized
Appreciation/Depreciation | | | 376,074 | | | | 8,271,356 | | | | 4,771,681 | | | | 2,126,606 | |
| | |
Increase From Payment by Affiliate (Note 2) | | | — | | | | — | | | | 45,194 | | | | — | |
| | |
Net Gain on Investments, Futures
Contracts and Foreign Currency Transactions | | | 4,894,618 | | | | 10,204,477 | | | | 8,895,754 | | | | 266,943 | |
| | |
Increase in Net Assets From Operations | | $ | 4,857,931 | | | $ | 11,775,480 | | | $ | 9,452,024 | | | $ | 5,635,637 | |
| | |
See Notes to Financial Statements.
48 Legg Mason Partners Investment Series 2006 Annual Report
Statements of Changes in Net Assets (For the years ended October 31,)
| | | | | | | | |
| | |
Legg Mason Partners Variable Premier Selections
All Cap Growth Portfolio | | 2006 | | | 2005 | |
| OPERATIONS: | | | | | | | | |
Net investment income (loss) | | $ | (36,687 | ) | | $ | 65,509 | |
Net realized gain | | | 4,518,544 | | | | 854,169 | |
Change in net unrealized appreciation/depreciation | | | 376,074 | | | | 4,675,349 | |
| | |
Increase in Net Assets From Operations | | | 4,857,931 | | | | 5,595,027 | |
| | |
| DISTRIBUTIONS TO SHAREHOLDERS FROM (NOTE 1): | | | | | | | | |
Net investment income | | | (65,509 | ) | | | — | |
| | |
Decrease in Net Assets From Distributions to Shareholders | | | (65,509 | ) | | | — | |
| | |
| FUND SHARE TRANSACTIONS (NOTE 4): | | | | | | | | |
Net proceeds from sale of shares | | | 1,463,475 | | | | 2,175,320 | |
Reinvestment of distributions | | | 65,509 | | | | — | |
Cost of shares repurchased | | | (11,710,995 | ) | | | (13,543,097 | ) |
| | |
Decrease in Net Assets From Fund Share Transactions | | | (10,182,011 | ) | | | (11,367,777 | ) |
| | |
Decrease in Net Assets | | | (5,389,589 | ) | | | (5,772,750 | ) |
NET ASSETS: | | | | | | | | |
Beginning of year | | | 53,307,583 | | | | 59,080,333 | |
| | |
End of year* | | $ | 47,917,994 | | | $ | 53,307,583 | |
| | |
* Includes undistributed net investment income of: | | | — | | | | $65,509 | |
| | |
See Notes to Financial Statements.
Legg Mason Partners Investment Series 2006 Annual Report 49
Statements of Changes in Net Assets (For the years ended October 31,) (continued)
| | | | | | | | |
| | |
| Legg Mason Partners Variable Dividend Strategy Portfolio | | 2006 | | | 2005 | |
| OPERATIONS: | | | | | | | | |
Net investment income | | $ | 1,571,003 | | | $ | 1,630,551 | |
Net realized gain | | | 1,933,121 | | | | 3,685,032 | |
Change in net unrealized appreciation/depreciation | | | 8,271,356 | | | | (3,626,246 | ) |
| | |
Increase in Net Assets From Operations | | | 11,775,480 | | | | 1,689,337 | |
| | |
| DISTRIBUTIONS TO SHAREHOLDERS FROM (NOTE 1): | | | | | | | | |
Net investment income | | | (1,500,001 | ) | | | (750,395 | ) |
| | |
Decrease in Net Assets From Distributions to Shareholders | | | (1,500,001 | ) | | | (750,395 | ) |
| | |
| FUND SHARE TRANSACTIONS (NOTE 4): | | | | | | | | |
Net proceeds from sale of shares | | | 3,603,419 | | | | 7,025,850 | |
Reinvestment of distributions | | | 1,500,001 | | | | 750,395 | |
Cost of shares repurchased | | | (14,476,987 | ) | | | (10,684,795 | ) |
| | |
Decrease in Net Assets From Fund Share Transactions | | | (9,373,567 | ) | | | (2,908,550 | ) |
| | |
Increase (Decrease) in Net Assets | | | 901,912 | | | | (1,969,608 | ) |
| NET ASSETS: | | | | | | | | |
Beginning of year | | | 75,866,351 | | | | 77,835,959 | |
| | |
End of year* | | $ | 76,768,263 | | | $ | 75,866,351 | |
| | |
* Includes undistributed net investment income of: | | | $1,120,391 | | | | $1,104,524 | |
| | |
See Notes to Financial Statements.
50 Legg Mason Partners Investment Series 2006 Annual Report
Statements of Changes in Net Assets (For the years ended October 31,) (continued)
| | | | | | | | |
| | |
| Legg Mason Partners Variable Growth and Income Portfolio | | 2006 | | | 2005 | |
| OPERATIONS: | | | | | | | | |
Net investment income | | $ | 556,270 | | | $ | 859,322 | |
Net realized gain | | | 4,078,879 | | | | 1,946,100 | |
Change in net unrealized appreciation/depreciation | | | 4,771,681 | | | | 1,704,609 | |
Increase from payment by affiliate | | | 45,194 | | | | — | |
| | |
Increase in Net Assets From Operations | | | 9,452,024 | | | | 4,510,031 | |
| | |
| DISTRIBUTIONS TO SHAREHOLDERS FROM (NOTE 1): | | | | | | | | |
Net investment income | | | (600,002 | ) | | | (825,257 | ) |
| | |
Decrease in Net Assets From Distributions to Shareholders | | | (600,002 | ) | | | (825,257 | ) |
| | |
| FUND SHARE TRANSACTIONS (NOTE 4): | | | | | | | | |
Net proceeds from sale of shares | | | 5,039,750 | | | | 7,667,798 | |
Reinvestment of distributions | | | 600,002 | | | | 825,257 | |
Cost of shares repurchased | | | (10,767,396 | ) | | | (8,199,481 | ) |
| | |
Increase (Decrease) in Net Assets From Fund Share Transactions | | | (5,127,644 | ) | | | 293,574 | |
| | |
Increase in Net Assets | | | 3,724,378 | | | | 3,978,348 | |
| NET ASSETS: | | | | | | | | |
Beginning of year | | | 74,142,540 | | | | 70,164,192 | |
| | |
End of year* | | | $77,866,918 | | | | $74,142,540 | |
| | |
*Includes undistributed net investment income of: | | | $346,101 | | | | $368,174 | |
| | |
See Notes to Financial Statements.
Legg Mason Partners Investment Series 2006 Annual Report 51
Statements of Changes in Net Assets (For the years ended October 31,) (continued)
| | | | | | | | |
| | |
| Legg Mason Partners Variable Government Portfolio | | 2006 | | | 2005 | |
| OPERATIONS: | | | | | | | | |
Net investment income | | $ | 5,368,694 | | | $ | 4,811,829 | |
Net realized gain (loss) | | | (1,859,663 | ) | | | 151,833 | |
Change in net unrealized appreciation/depreciation | | | 2,126,606 | | | | (4,358,724 | ) |
| | |
Increase in Net Assets From Operations | | | 5,635,637 | | | | 604,938 | |
| | |
| DISTRIBUTIONS TO SHAREHOLDERS FROM (NOTE 1): | | | | | | | | |
Net investment income | | | (6,000,004 | ) | | | (4,853,346 | ) |
| | |
Decrease in Net Assets From Distributions to Shareholders | | | (6,000,004 | ) | | | (4,853,346 | ) |
| | |
| FUND SHARE TRANSACTIONS (NOTE 4): | | | | | | | | |
Net proceeds from sale of shares | | | 7,392,439 | | | | 16,268,536 | |
Reinvestment of distributions | | | 6,000,004 | | | | 4,853,346 | |
Cost of shares repurchased | | | (19,318,850 | ) | | | (12,823,407 | ) |
| | |
Increase (Decrease) in Net Assets From Fund Share Transactions | | | (5,926,407 | ) | | | 8,298,475 | |
| | |
Increase (Decrease) in Net Assets | | | (6,290,774 | ) | | | 4,050,067 | |
| NET ASSETS: | | | | | | | | |
Beginning of year | | | 131,013,395 | | | | 126,963,328 | |
| | |
End of year* | | | $124,722,621 | | | | $131,013,395 | |
| | |
*Includes undistributed net investment income of: | | | $3,738,936 | | | | $4,243,941 | |
| | |
See Notes to Financial Statements.
52 Legg Mason Partners Investment Series 2006 Annual Report
Financial Highlights
For a share of beneficial interest outstanding throughout each year ended October 31:
| | | | | | | | | | | | | | | | | | | | |
| | | | | |
Legg Mason Partners Variable Premier
Selections All Cap Growth Portfolio | | 2006 | | | 2005 | | | 2004 | | | 2003 | | | 2002 | |
Net Asset Value, Beginning of Year | | | $12.35 | | | | $11.23 | | | | $11.45 | | | | $8.96 | | | | $10.73 | |
| | |
Income (Loss) From Operations: | | | | | | | | | | | | | | | | | | | | |
Net investment income (loss) | | | 0.00 | (1) | | | 0.02 | | | | (0.02 | ) | | | (0.01 | ) | | | (0.03 | ) |
Net realized and unrealized gain (loss) | | | 1.21 | | | | 1.10 | | | | (0.20 | ) | | | 2.50 | | | | (1.73 | ) |
| | |
Total Income (Loss) From Operations | | | 1.21 | | | | 1.12 | | | | (0.22 | ) | | | 2.49 | | | | (1.76 | ) |
| | |
Less Distributions From: | | | | | | | | | | | | | | | | | | | | |
Net investment income | | | (0.02 | ) | | | — | | | | — | | | | — | | | | (0.01 | ) |
| | |
Total Distributions | | | (0.02 | ) | | | — | | | | — | | | | — | | | | (0.01 | ) |
| | |
Net Asset Value, End of Year | | | $13.54 | | | | $12.35 | | | | $11.23 | | | | $11.45 | | | | $8.96 | |
| | |
Total Return(2) | | | 9.77 | % | | | 9.97 | % | | | (1.92 | )% | | | 27.79 | % | | | (16.44 | )% |
| | |
Net Assets, End of Year (000s) | | $ | 47,918 | | | $ | 53,308 | | | $ | 59,080 | | | $ | 34,884 | | | $ | 28,628 | |
| | |
Ratios to Average Net Assets: | | | | | | | | | | | | | | | | | | | | |
Gross expenses | | | 1.04 | % | | | 0.94 | % | | | 0.95 | % | | | 0.90 | % | | | 1.11 | % |
Net expenses(3) | | | 0.99 | (4)(5) | | | 0.94 | | | | 0.94 | (4) | | | 0.90 | | | | 0.95 | (4) |
Net investment income | | | (0.07 | ) | | | 0.11 | | | | (0.25 | ) | | | (0.08 | ) | | | (0.25 | ) |
| | |
Portfolio Turnover Rate | | | 44 | % | | | 43 | % | | | 46 | % | | | 66 | % | | | 58 | % |
| | |
| (1) | | Amount represents less than $0.01 per share. |
| (2) | | Performance figures may reflect fee waivers and/or expense reimbursements. Past performance is no guarantee of future results. In the absence of fee waivers and/or expense reimbursements, the total return would have been lower. Total returns do not reflect expenses associated with the separate accounts such as administrative fees, account charges and surrender charges which, if reflected, would reduce the total return for all periods shown. |
| (3) | | As a result of a voluntary expense limitation, the ratio of expenses to average net assets, other than interest, brokerage, taxes and extraordinary expenses, will not exceed 0.95%. |
| (4) | | Reflects fee waivers and/or expense reimbursements. |
| (5) | | The ratio of expenses to average net assets of the portfolio exceeds the voluntary expense limitation by 0.04% due to extraordinary expense. |
See Notes to Financial Statements.
Legg Mason Partners Investment Series 2006 Annual Report 53
Financial Highlights (continued)
For a share of beneficial interest outstanding throughout each year ended October 31:
| | | | | | | | | | | | | | | | | | | | |
| | | | | |
Legg Mason Partners Variable Dividend
Strategy Portfolio | | 2006 | | | 2005 | | | 2004 | | | 2003 | | | 2002 | |
Net Asset Value, Beginning of Year | | | $8.69 | | | | $8.58 | | | | $8.33 | | | | $7.24 | | | | $8.96 | |
| | |
Income (Loss) From Operations: | | | | | | | | | | | | | | | | | | | | |
Net investment income | | | 0.19 | | | | 0.18 | | | | 0.03 | | | | 0.03 | | | | 0.02 | |
Net realized and unrealized gain (loss) | | | 1.25 | | | | 0.01 | | | | 0.25 | | | | 1.09 | | | | (1.72 | ) |
| | |
Total Income (Loss) From Operations | | | 1.44 | | | | 0.19 | | | | 0.28 | | | | 1.12 | | | | (1.70 | ) |
| | |
Less Distributions From: | | | | | | | | | | | | | | | | | | | | |
Net investment income | | | (0.17 | ) | | | (0.08 | ) | | | (0.03 | ) | | | (0.03 | ) | | | (0.02 | ) |
| | |
Total Distributions | | | (0.17 | ) | | | (0.08 | ) | | | (0.03 | ) | | | (0.03 | ) | | | (0.02 | ) |
| | |
Net Asset Value, End of Year | | | $9.96 | | | | $8.69 | | | | $8.58 | | | | $8.33 | | | | $7.24 | |
| | |
Total Return(1) | | | 16.89 | % | | | 2.23 | % | | | 3.41 | % | | | 15.47 | % | | | (18.94 | )% |
| | |
Net Assets, End of Year (000s) | | $ | 76,768 | | | $ | 75,866 | | | $ | 77,836 | | | $ | 73,717 | | | $ | 61,139 | |
| | |
Ratios to Average Net Assets: | | | | | | | | | | | | | | | | | | | | |
Gross expenses | | | 0.90 | % | | | 0.86 | % | | | 0.88 | % | | | 0.91 | % | | | 0.93 | % |
Net expenses(2) | | | 0.89 | (3) | | | 0.86 | | | | 0.88 | (3) | | | 0.91 | | | | 0.93 | |
Net investment income | | | 2.08 | | | | 2.07 | | | | 0.37 | | | | 0.47 | | | | 0.24 | |
| | |
Portfolio Turnover Rate | | | 22 | % | | | 99 | % | | | 42 | % | | | 77 | % | | | 45 | % |
| | |
| (1) | | Performance figures may reflect fee waivers and/or expense reimbursements. Past performance is no guarantee of future results. In the absence of fee waivers and/or expense reimbursements, the total return would have been lower. Total returns do not reflect expenses associated with the separate accounts such as administrative fees, account charges and surrender charges which, if reflected, would reduce the total return for all periods shown. |
| (2) | | As a result of a voluntary expense limitation, the ratio of expenses to average net assets, other than interest, brokerage, taxes and extraordinary expenses, will not exceed 0.95%. |
| (3) | | Reflects fee waivers and/or expense reimbursements. |
See Notes to Financial Statements.
54 Legg Mason Partners Investment Series 2006 Annual Report
Financial Highlights (continued)
For a share of beneficial interest outstanding throughout each year ended October 31:
| | | | | | | | | | | | | | | | | | | | |
| | | | | |
Legg Mason Partners Variable Growth and
Income Portfolio | | 2006 | | | 2005 | | | 2004 | | | 2003 | | | 2002 | |
Net Asset Value, Beginning of Year | | | $9.47 | | | | $9.00 | | | | $8.44 | | | | $6.95 | | | | $8.15 | |
| | |
Income (Loss) From Operations: | | | | | | | | | | | | | | | | | | | | |
Net investment income | | | 0.08 | | | | 0.11 | | | | 0.05 | | | | 0.05 | | | | 0.02 | |
Net realized and unrealized gain (loss) | | | 1.16 | | | | 0.46 | | | | 0.55 | | | | 1.48 | | | | (1.20 | ) |
| | |
Total Income (Loss) From Operations | | | 1.24 | | | | 0.57 | | | | 0.60 | | | | 1.53 | | | | (1.18 | ) |
| | |
Less Distributions From: | | | | | | | | | | | | | | | | | | | | |
Net investment income | | | (0.08 | ) | | | (0.10 | ) | | | (0.04 | ) | | | (0.04 | ) | | | (0.02 | ) |
| | |
Total Distributions | | | (0.08 | ) | | | (0.10 | ) | | | (0.04 | ) | | | (0.04 | ) | | | (0.02 | ) |
| | |
Net Asset Value, End of Year | | | $10.63 | | | | $9.47 | | | | $9.00 | | | | $8.44 | | | | $6.95 | |
| | |
Total Return(1) | | | 13.13 | %(2) | | | 6.37 | % | | | 7.18 | % | | | 22.09 | % | | | (14.47 | )% |
| | |
Net Assets, End of Year (000s) | | $ | 77,867 | | | $ | 74,143 | | | $ | 70,164 | | | $ | 54,334 | | | $ | 36,730 | |
| | |
Ratios to Average Net Assets: | | | | | | | | | | | | | | | | | | | | |
Gross expenses | | | 0.85 | % | | | 0.78 | % | | | 0.91 | % | | | 0.87 | % | | | 1.09 | % |
Net expenses(3) | | | 0.85 | (4) | | | 0.78 | | | | 0.91 | (4) | | | 0.87 | | | | 0.95 | (4) |
Net investment income | | | 0.73 | | | | 1.14 | | | | 0.61 | | | | 0.68 | | | | 0.40 | |
| | |
Portfolio Turnover Rate | | | 38 | % | | | 57 | % | | | 43 | % | | | 65 | % | | | 48 | % |
| | |
| (1) | | Performance figures may reflect fee waivers and/or expense reimbursements. Past performance is no guarantee of future results. In the absence of fee waivers and/or expense reimbursements, the total return would have been lower. Total returns do not reflect expenses associated with the separate accounts such as administrative fees, account charges and surrender charges which, if reflected, would reduce the total return for all periods shown. |
| (2) | | The investment manager fully reimbursed the Fund for losses incurred resulting from an investment transaction error. Without this reimbursement, total return would not have changed. |
| (3) | | As a result of a voluntary expense limitation, the ratio of expenses to average net assets, other than interest, brokerage, taxes and extraordinary expenses, will not exceed 0.95%. |
| (4) | | Reflects fee waivers and/or expense reimbursements. |
See Notes to Financial Statements.
Legg Mason Partners Investment Series 2006 Annual Report 55
Financial Highlights (continued)
For a share of beneficial interest outstanding throughout each year ended October 31:
| | | | | | | | | | | | | | | | | | | | |
| | | | | |
Legg Mason Partners Variable
Government Portfolio | | 2006 | | | 2005 | | | 2004 | | | 2003 | | | 2002(1) | |
Net Asset Value, Beginning of Year | | | $11.35 | | | | $11.75 | | | | $11.68 | | | | $11.74 | | | | $11.44 | |
| | |
Income (Loss) From Operations: | | | | | | | | | | | | | | | | | | | | |
Net investment income | | | 0.49 | | | | 0.45 | | | | 0.41 | | | | 0.33 | | | | 0.35 | |
Net realized and unrealized gain (loss) | | | 0.02 | | | | (0.40 | ) | | | 0.03 | | | | (0.23 | ) | | | 0.13 | |
| | |
Total Income From Operations | | | 0.51 | | | | 0.05 | | | | 0.44 | | | | 0.10 | | | | 0.48 | |
| | |
Less Distributions From: | | | | | | | | | | | | | | | | | | | | |
Net investment income | | | (0.52 | ) | | | (0.45 | ) | | | (0.37 | ) | | | (0.16 | ) | | | (0.11 | ) |
Net realized gains | | | — | | | | — | | | | — | | | | — | | | | (0.07 | ) |
| | |
Total Distributions | | | (0.52 | ) | | | (0.45 | ) | | | (0.37 | ) | | | (0.16 | ) | | | (0.18 | ) |
| | |
Net Asset Value, End of Year | | | $11.34 | | | | $11.35 | | | | $11.75 | | | | $11.68 | | | | $11.74 | |
| | |
Total Return(2) | | | 4.66 | % | | | 0.41 | % | | | 3.90 | % | | | 0.87 | % | | | 4.20 | % |
| | |
Net Assets, End of Year (000s) | | $ | 124,723 | | | $ | 131,013 | | | $ | 126,963 | | | $ | 127,378 | | | $ | 84,104 | |
| | |
Ratios to Average Net Assets: | | | | | | | | | | | | | | | | | | | | |
Gross expenses | | | 0.69 | % | | | 0.65 | % | | | 0.70 | % | | | 0.68 | % | | | 1.00 | % |
Net expenses(3) | | | 0.69 | (4) | | | 0.65 | | | | 0.70 | (4) | | | 0.68 | | | | 0.80 | (4) |
Net investment income | | | 4.21 | | | | 3.68 | | | | 3.44 | | | | 2.91 | | | | 3.17 | |
| | |
Portfolio Turnover Rate | | | 136 | %(5) | | | 96 | %(5) | | | 53 | %(5) | | | 83 | %(5) | | | 145 | % |
| | |
| (1) | | Per share amounts have been calculated using the average shares method. |
| (2) | | Performance figures may reflect fee waivers and/or expense reimbursements. Past performance is no guarantee of future results. In the absence of fee waivers and/or expense reimbursements, the total return would have been lower. Total returns do not reflect expenses associated with the separate accounts such as administrative fees, account charges and surrender charges which, if reflected, would reduce the total return for all periods shown. |
| (3) | | As a result of a voluntary expense limitation, the ratio of expenses to average net assets, other than interest, brokerage, taxes and extraordinary expenses, will not exceed 0.80%. |
| (4) | | Reflects fee waivers and/or expense reimbursements. |
| (5) | | Excluding mortgage dollar roll transactions. If mortgage dollar roll transactions had been included, the portfolio turnover rate would have been 557%, 614%, 667% and 429% for the years ended October 31, 2006, 2005, 2004 and 2003, respectively. |
See Notes to Financial Statements.
56 Legg Mason Partners Investment Series 2006 Annual Report
Notes to Financial Statements
| 1. | Organization and Significant Accounting Policies |
Legg Mason Partners Variable Premier Selections All Cap Growth Portfolio, Legg Mason Partners Variable Dividend Strategy Portfolio, Legg Mason Partners Variable Growth and Income Portfolio and Legg Mason Partners Variable Government Portfolio (the “Funds”) (formerly known as Smith Barney Premier Selections All Cap Growth Portfolio, Smith Barney Dividend Strategy Portfolio, Smith Barney Growth and Income Portfolio and SB Government Portfolio, respectively) are separate diversified investment funds of Legg Mason Partners Investment Series (formerly known as Smith Barney Investment Series) (the “Trust”). The Trust, a Massachusetts business trust, is registered under the Investment Company Act of 1940, as amended (“1940 Act”), as an open-end management investment company.
The following are significant accounting policies consistently followed by the Funds and are in conformity with U.S. generally accepted accounting principles (“GAAP”). Estimates and assumptions are required to be made regarding assets, liabilities and changes in net assets resulting from operations when financial statements are prepared. Changes in the economic environment, financial markets and any other parameters used in determining these estimates could cause actual results to differ.
(a) Investment Valuation. Equity securities for which market quotations are available are valued at the last sale price or official closing price on the primary market or exchange on which they trade. Debt securities are valued at the mean between the bid and asked prices provided by an independent pricing service that are based on transactions in debt obligations, quotations from bond dealers, market transactions in comparable securities and various other relationships between securities. When prices are not readily available, or are determined not to reflect fair value, such as when the value of a security has been significantly affected by events after the close of the exchange or market on which the security is principally traded, but before the Funds calculate their net asset value, the Funds may value these investments at fair value as determined in accordance with the procedures approved by the Funds’ Board of Trustees. Short-term obligations with maturities of 60 days or less are valued at amortized cost, which approximates market value.
(b) Repurchase Agreements. When entering into repurchase agreements, it is the Funds’ policy that their custodian or a third party custodian take possession of the underlying collateral securities, the market value of which at least equals the principal amount of the repurchase transaction, including accrued interest. To the extent that any repurchase transaction exceeds one business day, the value of the collateral is marked-to-market to ensure the adequacy of the collateral. If the seller defaults and the market value of the collateral declines or if bankruptcy proceedings are commenced with respect to the seller of the security, realization of the collateral by the Funds may be delayed or limited.
(c) Financial Futures Contracts. The Funds may enter into financial futures contracts typically to hedge a portion of the portfolios. Upon entering into a financial futures contract, the Funds are required to deposit cash or securities as initial margin. Additional securities are also segregated up to the current market value of the financial futures contracts. Subsequent payments, known as variation margin, are made or received by the Funds each day, depending on the daily fluctuation in the value of the underlying financial
Legg Mason Partners Investment Series 2006 Annual Report 57
Notes to Financial Statements (continued)
instruments. The Funds recognize an unrealized gain or loss equal to the daily variation margin. When the financial futures contracts are closed, a realized gain or loss is recognized equal to the difference between the proceeds from (or cost of) the closing transactions and the Funds’ basis in the contracts.
The risks associated with entering into financial futures contracts include the possibility that a change in the value of the contract may not correlate with the changes in the value of the underlying instruments. In addition, investing in financial futures contracts involves the risk that the Funds could lose more than the original margin deposit and subsequent payments required for a futures transaction. Risks may also arise upon entering into these contracts from the potential inability of the counterparties to meet the terms of their contracts.
(d) Lending of Portfolio Securities. The Funds have an agreement with their custodian whereby the custodian may lend securities owned by the Funds to brokers, dealers and other financial organizations. In exchange for lending securities under the terms of the agreement with their custodian, the Funds receive a lender’s fee. Fees earned by the Funds on securities lending are recorded as securities lending income. Loans of securities by the Funds are collateralized by cash, U.S. government securities or high quality money market instruments that are maintained at all times in an amount at least equal to the current market value of the loaned securities, plus a margin which varies depending on the type of securities loaned. The custodian establishes and maintains the collateral in a segregated account. The Funds have the right under the lending agreement to recover the securities from the borrower on demand.
The Funds maintain the risk of any loss on the securities on loan as well as the potential loss on investments purchased with cash collateral received from securities lending.
(e) Securities Traded on a To-Be-Announced Basis. The Legg Mason Partners Variable Government Portfolio may trade securities on a to-be-announced (“TBA”) basis. In a TBA transaction, the Fund commits to purchasing or selling securities which have not yet been issued by the issuer and for which specific information is not known, such as the face amount and maturity date and the underlying pool of investments in U.S. government agency mortgage pass-through transactions. Securities purchased on a TBA basis are not settled until they are delivered to the Fund, normally 15 to 45 days later. Beginning on the date the Fund enters into a TBA transaction, cash, U.S. government securities or other liquid high-grade debt obligations are segregated in an amount equal in value to the purchase price of the TBA security. These transactions are subject to market fluctuations and their current value is determined in the same manner as for other securities.
(f) Mortgage Dollar Rolls. The Legg Mason Partners Variable Government Portfolio enters into dollar rolls in which the Fund sells mortgage-backed securities for delivery in the current month and simultaneously contracts to repurchase substantially similar (same type, coupon and maturity) securities to settle on a specified future date. During the roll period, the Fund forgoes principal and interest paid on the securities. The Fund is compensated by a fee paid by the counterparty, often in the form of a drop in the repurchase price of the securities. Dollar rolls are accounted for as financing arrangements; the fee is accrued into interest income ratably over the term of the dollar roll and any gain or loss on the roll is deferred and realized upon disposition of the rolled security.
58 Legg Mason Partners Investment Series 2006 Annual Report
Notes to Financial Statements (continued)
The risk of entering into a mortgage dollar roll is that the market value of the securities the Fund is obligated to repurchase under the agreement may decline below the repurchase price. In the event the buyer of securities under a mortgage dollar roll files for bankruptcy or becomes insolvent, the Fund’s use of proceeds of the dollar roll may be restricted pending a determination by the other party, or its trustee or receiver, whether to enforce the Fund’s obligation to repurchase the securities.
(g) Stripped Securities. Certain Funds invest in “Stripped Securities,” a term used collectively for stripped fixed income securities. Stripped securities can be principal only securities (“PO”), which are debt obligations that have been stripped of unmatured interest coupons or interest only securities (“IO”), which are unmatured interest coupons that have been stripped from debt obligations. Stripped Securities do not make periodic payments of interest prior to maturity. As is the case with all securities, the market value of Stripped Securities will fluctuate in response to changes in economic conditions, interest rates and the market’s perception of the securities. However, fluctuations in response to interest rates may be greater in Stripped Securities than for debt obligations of comparable maturities that pay interest currently. The amount of fluctuation increases with a longer period of maturity.
The yield to maturity on IO’s is sensitive to the rate of principal repayments (including prepayments) on the related underlying debt obligation and principal payments may have a material effect on yield to maturity. If the underlying debt obligation experiences greater than anticipated prepayments of principal, the Funds may not fully recoup its initial investment in IO’s.
(h) Security Transactions and Investment Income. Security transactions are accounted for on a trade date basis. Interest income, adjusted for amortization of premium and accretion of discount, is recorded on the accrual basis. Dividend income is recorded on the ex-dividend date. Foreign dividend income is recorded on the ex-dividend date or as soon as practical after the Funds determine the existence of a dividend declaration after exercising reasonable due diligence. The cost of investments sold is determined by use of the specific identification method. To the extent any issuer defaults on an expected interest payment, the Funds’ policy is to generally halt any additional interest income accruals and consider the realizability of interest accrued up to the date of default.
(i) Foreign Currency Translation. Investment securities and other assets and liabilities denominated in foreign currencies are translated into U.S. dollar amounts based upon prevailing exchange rates on the date of valuation. Purchases and sales of investment securities and income and expense items denominated in foreign currencies are translated into U.S. dollar amounts based upon prevailing exchange rates on the respective dates of such transactions.
The Funds do not isolate that portion of the results of operations resulting from changes in foreign exchange rates on investments from the fluctuations arising from changes in market prices of securities held. Such fluctuations are included with the net realized and unrealized gain or loss on investments.
Net realized foreign exchange gains or losses arise from sales of foreign currencies, including gains and losses on forward foreign currency contracts, currency gains or losses realized between the trade and settlement dates on securities transactions and the difference
Legg Mason Partners Investment Series 2006 Annual Report 59
Notes to Financial Statements (continued)
between the amounts of dividends, interest and foreign withholding taxes recorded on the Funds’ books and the U.S. dollar equivalent of the amounts actually received or paid. Net unrealized foreign exchange gains and losses arise from changes in the fair values of assets and liabilities, other than investments in securities, at the date of valuation, resulting from changes in exchange rates.
Foreign security and currency transactions may involve certain considerations and risks not typically associated with those of U.S. dollar denominated transactions as a result of, among other factors, the possibility of lower levels of governmental supervision and regulation of foreign securities markets and the possibility of political or economic instability.
(j) Distributions to Shareholders. Distributions from net investment income and distributions of net realized gains, if any, are declared at least annually. Distributions to shareholders of the Funds are recorded on the ex-dividend date and are determined in accordance with income tax regulations, which may differ from GAAP.
(k) Federal and Other Taxes. It is the Funds’ policy to comply with the federal income and excise tax requirements of the Internal Revenue Code of 1986, as amended, applicable to regulated investment companies. Accordingly, the Funds intend to distribute substantially all of their income and net realized gains on investments, if any, to shareholders each year. Therefore, no federal income tax provision is required in the Funds’ financial statements. Under the applicable foreign tax laws, a withholding tax may be imposed on interest, dividends and capital gains at various rates.
(l) Reclassification. GAAP requires that certain components of net assets be adjusted to reflect permanent differences between financial and tax reporting. These reclassifications have no effect on net assets or net asset values per share. During the current year, the following reclassifications have been made:
| | | | | | | | | | | | | | |
| | | |
| Fund | | (Over)/
Undistributed Net
Investment Income | | | Undistributed
Realized Gains/
Accumulated Net
Realized Losses | | | Paid-in Capital | |
Legg Mason Partners Variable | | (a) | | $ | 38,169 | | | | — | | | $ | (38,169 | ) |
Premier Selections All Cap Growth Portfolio | | (b) | | | (1,482 | ) | | $ | 1,482 | | | | — | |
| | |
Legg Mason Partners Variable | | (c) | | | 8,063 | | | | — | | | | (8,063 | ) |
Dividend Strategy Portfolio | | (d) | | | (63,198 | ) | | | 63,198 | | | | — | |
| | |
Legg Mason Partners Variable | | (c) | | | 21,667 | | | | — | | | | (21,667 | ) |
Growth and Income Portfolio | | (e) | | | (8 | ) | | | 8 | | | | — | |
| | |
Legg Mason Partners Variable | | (c) | | | 10,109 | | | | — | | | | (10,109 | ) |
Government Portfolio | | (f) | | | 116,196 | | | | (116,196 | ) | | | — | |
| | |
| (a) | | Reclassifications are primarily due to a tax net operating loss and book/tax differences in the treatment of various items. |
| (b) | | Reclassifications are primarily due to book/tax differences in the treatment of distributions from real estate investment trusts. |
| (c) | | Reclassifications are primarily due to book/tax differences in the treatment of various items. |
| (d) | | Reclassifications are primarily due to foreign currency transactions treated as ordinary income for tax purposes and book/tax differences in the treatment of distributions from real estate investment trusts. |
| (e) | | Reclassifications are primarily due to foreign currency transactions treated as ordinary income for tax purposes. |
| (f) | | Reclassifications are primarily due to differences between book and tax amortization of premium on fixed income securities and income from mortgage backed securities treated as capital gains for tax purposes. |
60 Legg Mason Partners Investment Series 2006 Annual Report
Notes to Financial Statements (continued)
| 2. | Investment Management Agreement and Other Transactions with Affiliates |
On December 1, 2005, Citigroup Inc. (“Citigroup”) completed the sale of substantially all of its asset management business to Legg Mason, Inc. (“Legg Mason”). As a result, the Funds’ then investment manager, Smith Barney Fund Management LLC (“SBFM”), previously an indirect wholly-owned subsidiary of Citigroup, became a wholly-owned subsidiary of Legg Mason. Completion of the sale caused the Funds’ then existing investment management contracts to terminate. The Funds’ shareholders approved new investment management contracts between the Funds and SBFM, which became effective on December 1, 2005.
Prior to the Legg Mason transaction and continuing under the new investment management agreements, which became effective December 1, 2005, the Funds paid SBFM an investment management fee calculated daily and paid monthly, at an annual rate of the Funds’ average daily net assets in accordance with the following breakpoint schedules:
| | | |
| |
| Legg Mason Partners Variable Premier Selections All Cap Growth Portfolio | | Annual Rate | |
Average Daily Net Assets First $1 billion | | 0.750 | % |
Next $1 billion | | 0.725 | |
Next $3 billion | | 0.700 | |
Next $5 billion | | 0.675 | |
Over $10 billion | | 0.650 | |
| | |
| | | |
| |
Legg Mason Partners Variable Dividend Strategy Portfolio and Legg Mason Partners Variable Growth and Income Portfolio | | Annual Rate | |
Average Daily Net Assets First $1 billion | | 0.650 | % |
Next $1 billion | | 0.600 | |
Next $1 billion | | 0.550 | |
Next $1 billion | | 0.500 | |
Over $4 billion | | 0.450 | |
| | |
| | | |
| |
| Legg Mason Partners Variable Government Portfolio | | Annual Rate | |
Average Daily Net Assets | | 0.550 | % |
Next $2 billion | | 0.500 | |
Next $2 billion | | 0.450 | |
Next $2 billion | | 0.400 | |
Over $8 billion | | 0.350 | |
| | |
Effective August 1, 2006, Legg Mason Partners Fund Advisor, LLC (“LMPFA”) became each Portfolio’s investment manager. ClearBridge Advisors, LLC (“ClearBridge”), formerly CAM North America, LLC, became subadviser to the Legg Mason Partners Variable Premier Selections All Cap Growth Portfolio, Legg Mason Partners Variable Dividend Strategy Portfolio and Legg Mason Partners Variable Growth and Income Portfolio. Western Asset Management Company (“Western Asset”) became the subadviser to Legg Mason Partners Variable Government Portfolio. The portfolio managers who are responsible for the day-to day management of the Funds remain the same immediately prior to and immediately after the date of these changes. LMPFA, ClearBridge and Western Asset are wholly-owned subsidiaries of Legg Mason.
Legg Mason Partners Investment Series 2006 Annual Report 61
Notes to Financial Statements (continued)
LMPFA provides administrative and certain oversight services to the Funds. LMPFA has delegated to the subadvisers the day-to day portfolio management of the Funds. The Funds’ investment management fees remain unchanged. For its services, LMPFA pays the subadviser 70% of the net management fee that it receives from the Funds.
During the year ended October 31, 2006, Legg Mason Partners Variable Premier Selections All Cap Growth Portfolio, Legg Mason Partners Variable Dividend Strategy Portfolio and Legg Mason Partners Variable Growth and Income Portfolio, had expense limitations in place of 0.95%. Legg Mason Partners Variable Government Portfolio had an expense limitation in place of 0.80%. These expenses limitations can be terminated at any time.
During the year ended October 31, 2006, SBFM and LMPFA waived a portion of their management fee in the amount of $26,491, $3,238, $3,247 and $4,474 for the Legg Mason Partners Variable Premier Selections All Cap Growth Portfolio, Legg Mason Partners Variable Dividend Strategy Portfolio, Legg Mason Partners Variable Growth and Income Portfolio and Legg Mason Partners Variable Government Portfolio, respectively.
During the year ended October 31, 2006, the Manager reimbursed Legg Mason Partners Variable Growth and Income Portfolio in the amount of $45,194 for losses incurred resulting from an investment transaction error.
The Funds’ Board has approved PFPC Inc. (“PFPC”) to serve as transfer agent for the Funds, effective January 1, 2006. The principal business office of PFPC is located at 4400 Computer Drive, Westborough, MA 01581. Prior to January 1, 2006, Citicorp Trust Bank, fsb. (“CTB”), a subsidiary of Citigroup, acted as the Funds’ transfer agent. Also, prior to January 1, 2006, PFPC acted as the Funds’ sub-transfer agent. CTB received account fees and asset-based fees that varied according to the size and type of account. PFPC was responsible for shareholder recordkeeping and financial processing for all shareholder accounts and was paid by CTB. For the period ended October 31, 2006, the Funds paid transfer agent fees of $8,332 to CTB.
The totals for each Fund were as follows:
| | | |
| |
| | | Transfer Agent Fees |
Legg Mason Partners Variable Premier Selections All Cap Growth Portfolio | | $ | 2,083 |
Legg Mason Partners Variable Dividend Strategy Portfolio | | | 2,083 |
Legg Mason Partners Variable Growth and Income Portfolio | | | 2,083 |
Legg Mason Partners Variable Government Portfolio | | | 2,083 |
| |
The Funds’ Board has appointed Citigroup Global Markets Inc. (“CGM”), a subsidiary of Citigroup, and Legg Mason Investor Services, LLC (“LMIS”), a wholly-owned broker-dealer subsidiary of Legg Mason, as co-distributors of the Funds. CGM and other broker-dealers, financial intermediaries and financial institutions (each called a “Service Agent”) that currently offer Fund shares will continue to make the Funds’ shares available to their clients. Additional Service Agents may offer Fund shares in the future.
Certain officers and one Trustee of the Trust are employees of Legg Mason or its affiliates and do not receive compensation from the Trust.
During a special meeting in June 2006 the Fund’s Board approved a number of initiatives to streamline and restructure the fund complex. In that connection the Board voted to establish a mandatory retirement age of 75 for current Trustees and 72 for all
62 Legg Mason Partners Investment Series 2006 Annual Report
Notes to Financial Statements (continued)
future Trustees and to allow current Trustees to elect to retire as of the date on which Trustees elected in accordance with the Joint Proxy Statement (see Note 9) to commence service as Trustees of the realigned and consolidated Board (the “Effective Date”).
On July 10, 2006, the Board also voted to amend its retirement plans to provide for the payment of certain benefits (in lieu of any other retirement payments under the plans) to Trustees who have not elected to retire as of the Effective Date. Under the amended plan, Trustees electing to receive benefits under the amendments must waive all rights under the plan prior to amendment. Each fund overseen by the Board (including the Fund) will pay a pro rata share (based upon asset size) of such benefits. As of October 31, 2006, the Funds’ allocable share of benefits under this amendment are $1,394, $2,204, $2,215, and $3,703, Legg Mason Partners Variable Premier Selections All Cap Growth Portfolio, Legg Mason Partners Variable Dividend Strategy Portfolio, Legg Mason Partners Variable Growth and Income Portfolio and Legg Mason Partners Variable Government Portfolio, respectively.
Under the previous Retirement Plan (the “Plan”), all Trustees who were not “Interested Persons” of the Fund, within the meaning of the 1940 Act were required to retire from the Board as of the last day of the calendar year in which the applicable Trustee attained age 75. Trustees were able to retire under the Plan before attaining the mandatory retirement age. Trustees who had served as Trustee of the Fund or any of the investment companies associated with Citi Fund Management Inc. and LMPFA for at least ten years when they retired continue to be eligible to receive the maximum retirement benefit under the previous Plan, subject to the terms of the amended Plans. The maximum retirement benefit was an amount equal to five times the amount of retainer and regular meeting fees payable to a Trustee during the entirety of the calendar year of the Trustee’s retirement (assuming no change in relevant facts for the balance of the year following the Trustee’s retirement). Amounts owed under the Plan may be paid in installments or in a lump sum (discounted to present value). Benefits under the Plan are unfunded. Two former Trustees are currently receiving payments under the Plan. In addition, three other Trustees received full payment under the Plan.
3. Investments
During the year ended October 31, 2006, the aggregate cost of purchases and proceeds from sales of investments (excluding short-term investments) and U.S Government & Agency Obligations were as follows:
| | | | | | | | | | | | |
| | |
| | | Investments | | U.S. Government & Agency
Obligations |
| | | Purchases | | Sales | | Purchases | | Sales |
Legg Mason Partners Variable Premier Selections All Cap Growth Portfolio | | $ | 22,459,747 | | $ | 32,629,776 | | | — | | | — |
Legg Mason Partners Variable Dividend Strategy Portfolio | | | 15,632,911 | | | 24,953,297 | | | — | | | — |
Legg Mason Partners Variable Growth and Income Portfolio | | | 28,599,386 | | | 34,364,225 | | | — | | | — |
Legg Mason Partners Variable Government Portfolio | | | 36,012,884 | | | — | | $ | 189,873,320 | | $ | 190,601,017 |
| |
Legg Mason Partners Investment Series 2006 Annual Report 63
Notes to Financial Statements (continued)
At October 31, 2006, the aggregate gross unrealized appreciation and depreciation of investments for federal income tax purposes were as follows:
| | | | | | | | | | | |
| | | |
| | | Gross
unrealized
appreciation | | Gross
unrealized
depreciation | | | Net unrealized
appreciation/
depreciation | |
Legg Mason Partners Variable Premier Selections All Cap Growth Portfolio | | $ | 9,277,648 | | $ | (1,402,414 | ) | | $ | 7,875,234 | |
Legg Mason Partners Variable Dividend Strategy Portfolio | | | 12,295,660 | | | (983,541 | ) | | | 11,312,119 | |
Legg Mason Partners Variable Growth and Income Portfolio | | | 15,020,023 | | | (1,194,481 | ) | | | 13,825,542 | |
Legg Mason Partners Variable Government Portfolio | | | 776,309 | | | (1,011,481 | ) | | | (235,172 | ) |
| | |
At October 31, 2006, Legg Mason Partners Variable Government Portfolio had the following open futures contracts:
| | | | | | | | | | | | | | |
| | | | | |
| Contracts to Buy: | | Number of
Contracts | | Expiration
Date | | Basis
Value | | Market Value | | Unrealized
Gain (Loss) | |
U.S. Treasury 2 Year Notes | | 239 | | 12/06 | | $ | 48,774,695 | | $ | 48,853,094 | | $ | 78,399 | |
U.S. Treasury Bond | | 9 | | 12/06 | | | 994,803 | | | 1,013,906 | | | 19,103 | |
| | |
| | | | | | | | | | | | | 97,502 | |
| | |
| | | | | |
| Contracts to Sell: | | | | | | | | | | | |
U.S. Treasury 5 Year Notes | | 2 | | 12/06 | | | 210,334 | | | 211,125 | | | (791 | ) |
U.S. Treasury 10 Year Notes | | 194 | | 12/06 | | | 20,927,100 | | | 20,994,437 | | | (67,337 | ) |
| | |
| | | | | | | | | | | | | (68,128 | ) |
| | |
Net Unrealized Gain on Open Futures Contracts | | | | | | | | | | | | $ | 29,374 | |
| | |
At October 31, 2006, Legg Mason Partners Variable Government Portfolio had outstanding mortgage dollar rolls with a total cost of $50,419,241. During the year ended October 31, 2006, Legg Mason Partners Variable Government Portfolio entered into mortgage dollar roll transactions in the aggregate amount of $589,349,476. For the year ended October 31, 2006, Legg Mason Partners Variable Government Portfolio recorded interest income of $440,271 related to such mortgage rolls.
| 4. | Shares of Beneficial Interest |
At October 31, 2006, the Trust had an unlimited number of shares of beneficial interest authorized with a par value of $0.00001 per share.
64 Legg Mason Partners Investment Series 2006 Annual Report
Notes to Financial Statements (continued)
Transactions in shares of each Fund were as follows:
| | | | | | |
Legg Mason Partners Variable Premier Selections
All Cap Growth Portfolio | | Year Ended
October 31, 2006 | | | Year Ended
October 31, 2005 | |
Shares sold | | 112,506 | | | 182,244 | |
Shares issued on reinvestment | | 5,043 | | | — | |
Shares repurchased | | (895,394 | ) | | (1,127,132 | ) |
| | |
Net Decrease | | (777,845 | ) | | (944,888 | ) |
| | |
| | |
| Legg Mason Partners Variable Dividend Strategy Portfolio | | | | | | |
Shares sold | | 389,733 | | | 801,488 | |
Shares issued on reinvestment | | 171,428 | | | 84,314 | |
Shares repurchased | | (1,581,717 | ) | | (1,221,275 | ) |
| | |
Net Decrease | | (1,020,556 | ) | | (335,473 | ) |
| | |
| |
| Legg Mason Partners Variable Growth and Income Portfolio | | | | |
Shares sold | | 500,011 | | | 817,377 | |
Shares issued on reinvestment | | 60,668 | | | 86,414 | |
Shares repurchased | | (1,067,547 | ) | | (869,834 | ) |
| | |
Net Increase (Decrease) | | (506,868 | ) | | 33,957 | |
| | |
| | |
| Legg Mason Partners Variable Government Portfolio | | | | | | |
Shares sold | | 665,655 | | | 1,421,226 | |
Shares issued on reinvestment | | 545,951 | | | 429,880 | |
Shares repurchased | | (1,752,212 | ) | | (1,119,908 | ) |
| | |
Net Increase (Decrease) | | (540,606 | ) | | 731,198 | |
| | |
| 5. | Income Tax Information and Distributions to Shareholders |
The tax character of distributions paid during the fiscal year ended October 31, 2006 were as follows:
| | | | | | | | | | | | |
| | | | |
| | | Legg Mason Partners Variable Premier Selections All Cap Growth Portfolio | | Legg Mason Partners Variable Dividend Strategy
Portfolio | | Legg Mason Partners Variable Growth and
Income Portfolio | | Legg Mason Partners Variable Government
Portfolio |
Ordinary Income | | $ | 65,509 | | $ | 1,500,001 | | $ | 600,002 | | $ | 6,000,004 |
| |
Legg Mason Partners Investment Series 2006 Annual Report 65
Notes to Financial Statements (continued)
The tax character of distributions paid during the fiscal year ended October 31, 2005 were as follows:
| | | | | | | | | | | |
| | | | |
| | | Legg Mason Partners Variable Premier Selections All Cap Growth Portfolio | | Legg Mason Partners Variable Dividend Strategy
Portfolio | | Legg Mason Partners Variable Growth and
Income Portfolio | | Legg Mason Partners Variable Government
Portfolio |
Ordinary Income | | — | | $ | 750,395 | | $ | 825,257 | | $ | 4,853,346 |
| |
As of October 31, 2006, the components of accumulated earnings on a tax basis were as follows:
| | | | | | | | | | | | | | | | |
| | | | |
| | | Legg Mason Partners Variable Premier Selections All Cap Growth Portfolio | | | Legg Mason Partners Variable Dividend Strategy
Portfolio | | | Legg Mason Partners Variable Growth and
Income Portfolio | | | Legg Mason Partners Variable Government
Portfolio | |
Undistributed ordinary income — net | | | — | | | $ | 1,120,391 | | | $ | 346,101 | | | $ | 3,738,936 | |
Undistributed long-term capital gains — net | | $ | 1,510,574 | | | | — | | | | 26,077 | | | | — | |
| | |
Total undistributed earnings | | $ | 1,510,574 | | | $ | 1,120,391 | | | $ | 372,178 | | | $ | 3,738,936 | |
| | |
Capital loss carryforward* | | $ | (7,036,068 | ) | | $ | (23,665,914 | ) | | $ | (3,042,927 | ) | | $ | (5,739,955 | ) |
Other book/tax temporary differences | | | — | | | | — | | | | — | | | | (63,107 | )(c) |
Unrealized appreciation/(depreciation) | | | 7,875,234 | (a) | | | 11,312,119 | (b) | | | 13,825,542 | (b) | | | (205,798 | )(d) |
| | |
Total accumulated earnings/(losses) — net | | $ | 2,349,740 | | | $ | (11,233,404 | ) | | $ | 11,154,793 | | | $ | (2,269,924 | ) |
| | |
| * | During the taxable year ended October 31, 2006, Legg Mason Partners Variable Premier Selections All Cap Growth Portfolio utilized $2,970,386, Legg Mason Partners Variable Dividend Strategy Portfolio utilized $1,946,201 and Legg Mason Partners Variable Growth and Income Portfolio utilized $3,771,402 of each of their respective capital loss carryovers available from prior years. As of October 31, 2006, the Funds had the following net capital loss carryforwards remaining: |
66 Legg Mason Partners Investment Series 2006 Annual Report
Notes to Financial Statements (continued)
| | | | | | | | | | | | | | | | |
| | | | |
| Year of Expiration | | Legg Mason Partners Variable Premier Selections All Cap Growth Portfolio | | | Legg Mason Partners Variable Dividend Strategy
Portfolio | | | Legg Mason Partners Variable Growth and
Income Portfolio | | | Legg Mason Partners Variable Government
Portfolio | |
10/31/2009 | | | — | | | $ | (1,360,004 | ) | | | — | | | | — | |
10/31/2010 | | $ | (4,391,142 | ) | | | (15,846,502 | ) | | | — | | | $ | (49,007 | ) |
10/31/2011 | | | (2,644,926 | ) | | | (6,459,408 | ) | | $ | (3,042,927 | ) | | | (2,378,580 | ) |
10/31/2012 | | | — | | | | — | | | | — | | | | (877,195 | ) |
10/31/2013 | | | — | | | | — | | | | — | | | | (266,355 | ) |
10/31/2014 | | | — | | | | — | | | | — | | | | (2,168,818 | ) |
| | |
| | $ | (7,036,068 | ) | | $ | (23,665,914 | ) | | $ | (3,042,927 | ) | | $ | (5,739,955 | ) |
| | |
These amounts will be available to offset any future taxable capital gains. However, Legg Mason Partners Variable Premier Selections All Cap Growth Portfolio is subject to an annual limitation of $2,417,172, Legg Mason Partners Variable Dividend Strategy Portfolio is subject to an annual limitation of $3,423,032, Legg Mason Partners Variable Growth and Income Portfolio is subject to an annual limitation of $3,301,069. The losses are subject to this limitation because they were derived from a Fund ownership change.
| (a) | The difference between book-basis and tax-basis unrealized appreciation / (depreciation) is attributable primarily to the tax deferral of losses on wash sales and the difference between the book and tax cost basis of investments in real estate investment trusts. |
| (b) | The difference between book-basis and tax-basis unrealized appreciation / (depreciation) is attributable primarily to the tax deferral of losses on wash sales. |
| (c) | Other book/tax temporary differences are attributable primarily to the tax deferral of losses on straddles and the realization for tax purposes of unrealized gains on certain futures contracts. |
| (d) | The difference between book-basis and tax-basis unrealized appreciation / (depreciation ) is attributable primarily to the difference between book & tax amortization methods for premiums on fixed income securities. |
Due to the proposed reorganization for Legg Mason Partners Variable Premier Selections All Cap Growth Portfolio and Legg Mason Partners Variable Growth and Income Portfolio described in Note 9, the expiration dates of these loss carryforwards will move up by one year. Additionally, as a result of the reorganization, the loss carryforwards will be subject to various tax limitations, which may result in future taxable capital gain distributions to shareholders due to the fact that some portion of the Fund’s loss carryforwards may be unable to be utilized.
On May 31, 2005, the U.S. Securities and Exchange Commission (“SEC”) issued an order in connection with the settlement of an administrative proceeding against SBFM and CGM relating to the appointment of an affiliated transfer agent for the Smith Barney family of mutual funds (the “Funds”).
The SEC order finds that SBFM and CGM willfully violated Section 206(1) of the Investment Advisers Act of 1940 (“Advisers Act”). Specifically, the order finds that SBFM and CGM knowingly or recklessly failed to disclose to the boards of the Funds in 1999 when proposing a new transfer agent arrangement with an affiliated transfer agent that: First Data Investors Services Group (“First Data”), the Funds’ then-existing transfer agent, had offered to continue as transfer agent and do the same work for substantially less money than before; and that Citigroup Asset Management (“CAM”), the Citigroup business unit that, at the time, included the Fund’s investment manager and other investment advisory companies, had entered into a side letter with First Data under which CAM agreed to recommend the appointment of First Data as sub-transfer agent to the affiliated transfer agent in exchange for, among other things, a guarantee by First Data of specified amounts
Legg Mason Partners Investment Series 2006 Annual Report 67
Notes to Financial Statements (continued)
of asset management and investment banking fees to CAM and CGM. The order also finds that SBFM and CGM willfully violated Section 206(2) of the Advisers Act by virtue of the omissions discussed above and other misrepresentations and omissions in the materials provided to the Funds’ boards, including the failure to make clear that the affiliated transfer agent would earn a high profit for performing limited functions while First Data continued to perform almost all of the transfer agent functions, and the suggestion that the proposed arrangement was in the Funds’ best interests and that no viable alternatives existed. SBFM and CGM do not admit or deny any wrongdoing or liability. The settlement does not establish wrongdoing or liability for purposes of any other proceeding.
The SEC censured SBFM and CGM and ordered them to cease and desist from violations of Sections 206(1) and 206(2) of the Advisers Act. The order requires Citigroup to pay $208.1 million, including $109 million in disgorgement of profits, $19.1 million in interest, and a civil money penalty of $80 million. Approximately $24.4 million has already been paid to the Funds, primarily through fee waivers. The remaining $183.7 million, including the penalty, has been paid to the U.S. Treasury and will be distributed pursuant to a plan submitted for the approval of the SEC. At this time, there is no certainty as to how the above-described proceeds of the settlement will be distributed, to whom such distributions will be made, the methodology by which such distributions will be allocated, and when such distributions will be made.
The order also required that transfer agency fees received from the Funds since December 1, 2004, less certain expenses, be placed in escrow and provided that a portion of such fees might be subsequently distributed in accordance with the terms of the order.
On April 3, 2006, an aggregate amount of approximately $9 million was distributed to the affected Funds.
The order required SBFM to recommend a new transfer agent contract to the Fund boards within 180 days of the entry of the order; if a Citigroup affiliate submitted a proposal to serve as transfer agent or sub-transfer agent, SBFM and CGM would have been required, at their expense, to engage an independent monitor to oversee a competitive bidding process. On November 21, 2005, and within the specified timeframe, the Fund’s Board selected a new transfer agent for the Fund. No Citigroup affiliate submitted a proposal to serve as transfer agent. Under the order, SBFM also must comply with an amended version of a vendor policy that Citigroup instituted in August 2004.
Although there can be no assurance, the Fund’s manager does not believe that this matter will have a material adverse effect on the Funds.
On December 1, 2005, Citigroup completed the sale of substantially all of its global asset management business, including SBFM, to Legg Mason.
Beginning in August 2005, five class action lawsuits alleging violations of federal securities laws and state law were filed against CGM and SBFM, (collectively, the ‘‘Defendants’’) based on the May 31, 2005 settlement order issued against the Defendants by the SEC as described in Note 6. The complaints seek injunctive relief and compensatory and punitive damages, removal of SBFM as the advisor for the Smith Barney family of funds, rescission
68 Legg Mason Partners Investment Series 2006 Annual Report
Notes to Financial Statements (continued)
of the Funds’ management and other contracts with SBFM, recovery of all fees paid to SBFM pursuant to such contracts, and an award of attorneys’ fees and litigation expenses.
On October 5, 2005, a motion to consolidate the five actions and any subsequently filed, related action was filed. That motion contemplates that a consolidated amended complaint alleging substantially similar causes of action will be filed in the future.
As of the date of this report, the Fund’s investment manager believes that resolution of the pending lawsuit will not have a material effect on the financial position or results of operations of the Fund or the ability of the Fund’s investment manager and its affiliates to continue to render services to the Fund under its respective contracts.
* * *
Beginning in June 2004, class action lawsuits alleging violations of the federal securities laws were filed against CGM and a number of its then affiliates, including SBFM and Salomon Brothers Asset Management Inc (‘‘SBAM’’), which were then investment adviser or manager to certain of the Funds (the ‘‘Managers’’), substantially all of the mutual funds then managed by the Managers (the ‘‘Defendant Funds’’), and Board members of the Defendant Funds (collectively, the ‘‘Defendants’’). The complaints alleged, among other things, that CGM created various undisclosed incentives for its brokers to sell Smith Barney and Salomon Brothers funds. In addition, according to the complaints, the Managers caused the Defendant Funds to pay excessive brokerage commissions to CGM for steering clients towards proprietary funds. The complaints also alleged that the Defendants breached their fiduciary duty to the Defendant Funds by improperly charging Rule 12b-1 fees and by drawing on fund assets to make undisclosed payments of soft dollars and excessive brokerage commissions. The complaints also alleged that the Defendant Funds failed to adequately disclose certain of the allegedly wrongful conduct. The complaints sought injunctive relief and compensatory and punitive damages, rescission of the Defendant Funds’ contracts with the Managers, recovery of all fees paid to the Managers pursuant to such contracts and an award of attorneys’ fees and litigation expenses.
On December 15, 2004, a consolidated amended complaint (the ‘‘Complaint’’) was filed alleging substantially similar causes of action. On May 27, 2005, all of the Defendants filed motions to dismiss the Complaint. On July 26, 2006, the court issued a decision and order (1) finding that plaintiffs lacked standing to sue on behalf of the shareholders of the Funds in which none of the plaintiffs had invested and dismissing those Funds from the case (although stating that they could be brought back into the case if standing as to them could be established), and (2) other than one stayed claim, dismissing all of the causes of action against the remaining Defendants, with prejudice, except for the cause of action under Section 36(b) of the Investment Company Act, which the court granted plaintiffs leave to repeal as a derivative claim.
On October 16, 2006, plaintiffs filed their Second Consolidated Amended Complaint (‘‘Second Amended Complaint’’) which alleges derivative claims on behalf of nine funds identified in the Second Amended Complaint, under Section 36(b) of the 1940 Act, against CAM, SBAM, SBFM and CGM as investment advisers to the identified funds, as well as CGM as a distributor for the identified funds (collectively, the ‘‘Second Amended
Legg Mason Partners Investment Series 2006 Annual Report 69
Notes to Financial Statements (continued)
Complaint Defendants’’). The Funds were not identified in the Second Amended Complaint. The Second Amended Complaint alleges no claims against any of the Funds or any of their Board members. Under Section 36(b), the Second Amended Complaint alleges similar facts and seeks similar relief against the Second Amended Complaint Defendants as the Complaint.
Additional lawsuits arising out of these circumstances and presenting similar allegations and requests for relief may be filed in the future.
On September 16, 2005, the staff of the SEC informed SBFM and SBAM that the staff is considering recommending that the SEC institute administrative proceedings against SBFM and SBAM for alleged violations of Section 19(a) and 34(b) of the Investment Company Act (and related Rule 19a-1). The notification is a result of an industry wide inspection by the SEC and is based upon alleged deficiencies in disclosures regarding dividends and distributions paid to shareholders of certain funds. Section 19(a) and related Rule 19a-1 of the Investment Company Act generally require funds that are making dividend and distribution payments to provide shareholders with a written statement disclosing the source of the dividends and distributions, and, in particular, the portion of the payments made from each of net investment income, undistributed net profits and/or paid-in capital. In connection with the contemplated proceedings, the staff may seek a cease and desist order and/or monetary damages from SBFM or SBAM.
Although there can be no assurance, the Fund’s manager believes that this matter is not likely to have a material adverse effect on the Funds.
| 9. | Additional Shareholder Information |
Shareholders approved a reorganization pursuant to which the Legg Mason Partners Variable Growth and Income Portfolio’s assets will be acquired, and its liabilities assumed by the Legg Mason Partners Variable Appreciation Portfolio, (the “Acquiring Fund”), in exchange for shares of the Acquiring Fund. The Fund would then be liquidated and shares of the Acquiring Fund would be distributed to Fund shareholders on or about May 1, 2007.
The Funds’ Board also approved a reorganization pursuant to which the Legg Mason Partners Variable Premier Selections All Cap Growth Portfolio’s assets would be acquired and its liabilities assumed by the Legg Mason Partners Variable Portfolios III — Legg Mason Partners Variable Aggressive Growth Portfolio (the “Acquiring Fund”) in exchange for shares of the Acquiring Fund. The Fund would then be liquidated, and shares of the Acquiring Fund would be distributed to Fund shareholders. If shareholders approve the reorganization, it is expected to be implemented on or about May 1, 2007.
The Funds’ Board also approved a number of initiatives designed to streamline and restructure the fund complex, and authorized seeking shareholder approval for those initiatives where shareholder approval is required. As a result, each Fund’s shareholders have been asked to elect a new Board, approve matters that will result in the Funds being grouped for organizational and governance purposes with other funds in the fund complex, and domicile the Funds as Maryland business trusts, with all funds operating under
70 Legg Mason Partners Investment Series 2006 Annual Report
Notes to Financial Statements (continued)
uniform charter documents. Each Fund’s shareholders also have been asked to approve investment matters, including standardized fundamental investment policies. Shareholder approval was obtained on December 11, 2006. These matters generally are expected to be implemented on or about May 1, 2007.
| 10. | Recent Accounting Pronouncements |
During June 2006, the Financial Accounting Standards Board (“FASB”) issued FASB Interpretation 48 (“FIN 48” or the “Interpretation”), Accounting for Uncertainty in Income Taxes—an interpretation of FASB Statement 109. FIN 48 supplements FASB Statement 109, Accounting for Income Taxes, by defining the confidence level that a tax position must meet in order to be recognized in the financial statements. FIN 48 prescribes a comprehensive model for how a fund should recognize, measure, present, and disclose in its financial statements uncertain tax positions that the fund has taken or expects to take on a tax return. FIN 48 requires that the tax effects of a position be recognized only if it is “more likely than not” to be sustained based solely on its technical merits. Management must be able to conclude that the tax law, regulations, case law, and other objective information regarding the technical merits sufficiently support the position’s sustainability with a likelihood of more than 50 percent. FIN 48 is effective for fiscal periods beginning after December 15, 2006, which for this Fund will be November 1, 2007. At adoption, the financial statements must be adjusted to reflect only those tax positions that are more likely than not to be sustained as of the adoption date. Management of the Fund has determined that adopting FIN 48 will not have a material impact on the Fund’s financial statements.
* * *
On September 20, 2006, FASB released Statement of Financial Accounting Standards No. 157 “Fair Value Measurements” (“FAS 157”). FAS 157 establishes an authoritative definition of fair value, sets out a framework for measuring fair value, and requires additional disclosures about fair value measurements. The application of FAS 157 is required for fiscal years beginning after November 15, 2007 and interim periods within those fiscal years. At this time, management is evaluating the implications of FAS 157 and its impact on the financial statements has not yet been determined.
Should shareholders approve the reorganization proposal for Legg Mason Partners Variable Growth and Income Portfolio and Legg Mason Partners Variable Premier Selections All Cap Growth Portfolio, these new standards will not be applicable for the above mentioned Funds.
Legg Mason Partners Investment Series 2006 Annual Report 71
Report of Independent Registered Public Accounting Firm
The Board of Trustees and Shareholders
Legg Mason Partners Investment Series:
We have audited the accompanying statements of assets and liabilities, including the schedules of investments, of Legg Mason Partners Variable Premier Selections All Cap Growth Portfolio (formerly Smith Barney Premier Selections All Cap Growth Portfolio), Legg Mason Partners Variable Dividend Strategy Portfolio (formerly Smith Barney Dividend Strategy Portfolio), Legg Mason Partners Variable Growth and Income Portfolio (formerly Smith Barney Growth and Income Portfolio) and Legg Mason Partners Variable Government Portfolio (formerly SB Government Portfolio), each a series of Legg Mason Partners Investment Series (formerly Smith Barney Investment Series), as of October 31, 2006, and the related statements of operations for the year then ended, the statements of changes in net assets for each of the years in the two-year period then ended, and the financial highlights for each of the years in the five-year period then ended. These financial statements and financial highlights are the responsibility of the Funds’ management. Our responsibility is to express an opinion on these financial statements and financial highlights based on our audits.
We conducted our audits in accordance with the standards of the Public Company Accounting Oversight Board (United States). Those standards require that we plan and perform the audit to obtain reasonable assurance about whether the financial statements and financial highlights are free of material misstatement. An audit includes examining, on a test basis, evidence supporting the amounts and disclosures in the financial statements. Our procedures included confirmation of securities owned as of October 31, 2006, by correspondence with the custodian and brokers or by other appropriate auditing procedures. An audit also includes assessing the accounting principles used and significant estimates made by management, as well as evaluating the overall financial statement presentation. We believe that our audits provide a reasonable basis for our opinion.
In our opinion, the financial statements and financial highlights referred to above present fairly, in all material respects, the financial position of Legg Mason Partners Variable Premier Selections All Cap Growth Portfolio, Legg Mason Partners Variable Dividend Strategy Portfolio, Legg Mason Partners Variable Growth and Income Portfolio and Legg Mason Partners Variable Government Portfolio, as of October 31, 2006, and the results of their operations for the year then ended, the changes in their net assets for each of the years in the two-year period then ended, and the financial highlights for each of the years in the five-year period then ended, in conformity with U.S. generally accepted accounting principles.

New York, New York
December 27, 2006
72 Legg Mason Partners Investment Series 2006 Annual Report
Board Approval of Management and Subadvisory Agreements (unaudited)
Legg Mason Partners Variable Premier Selections All Cap Growth Portfolio
At a meeting held in person on June 19, 2006, the Fund’s Board, including a majority of the Board Members who are not “interested persons” of the Fund or Legg Mason Partners Fund Advisor, LLC (the “Manager”) or any sub-investment adviser or proposed subinvestment adviser as defined in the Investment Company Act of 1940, as amended (the “1940 Act”) (the “Independent Board Members”), approved a new management agreement (the “New Management Agreement”) between the Fund and the Manager. The Fund’s Board, including a majority of the Independent Board Members, also approved one or more new subadvisory agreements between the Manager and ClearBridge Advisors, LLC the “Subadviser”) (the “New Subadvisory Agreement”). The New Management Agreement and the New Subadvisory Agreement replaced the Fund’s prior management agreement with Smith Barney Fund Management, LLC and were entered into in connection with an internal reorganization of the Manager’s and the prior manager’s parent organization, Legg Mason. In approving the New Management Agreement and New Subadvisory Agreement, the Board, including the Independent Board Members, considered the factors discussed below, among other things.
The Board noted that the Manager will provide administrative and certain oversight services to the Fund, and that the Manager will delegate to the Subadviser the day-to-day portfolio management of the Fund. The Board Members reviewed the qualifications, backgrounds and responsibilities of the senior personnel that will provide oversight and general management services and the portfolio management team that would be primarily responsible for the day-to-day management of the Fund. The Board Members noted that the portfolio management team was expected to be the same as then managing the Fund.
The Board Members received and considered information regarding the nature, extent and quality of services expected to be provided to the Fund by the Manager under the New Management Agreement and by the Subadviser under the New Subadvisory Agreement. The Board Members’ evaluation of the services expected to be provided by the Manager and the Subadviser took into account the Board Members’ knowledge and familiarity gained as Fund Board Members, including as to the scope and quality of Legg Mason’s investment management and other capabilities and the quality of its administrative and other services. The Board Members considered, among other things, information and assurances provided by Legg Mason as to the operations, facilities and organization of the Manager and the Subadviser and the qualifications, backgrounds and responsibilities of their senior personnel. The Board Members further considered the financial resources available to the Manager, the Subadviser and Legg Mason. The Board Members concluded that, overall, the nature, extent and quality of services expected to be provided under the New Management Agreement and the New Subadvisory Agreement were acceptable.
The Board Members also received and considered performance information for the Fund as well as comparative information with respect to a peer group of funds (the “Performance Universe”) selected by Lipper, Inc. (“Lipper”), an independent provider of
Legg Mason Partners Investment Series 73
Board Approval of Management and Subadvisory Agreements (unaudited) (continued)
investment company data. The Board Members were provided with a description of the methodology Lipper used to determine the similarity of the Fund to the funds included in the Performance Universe. The Board Members noted that they had received and discussed with management, at periodic intervals, information comparing the Fund’s performance against, among other things, its benchmark.
The Board Members reviewed and considered the management fee that would be payable by the Fund to the Manager in light of the nature, extent and quality of the management services expected to be provided by the Manager, including the fee waiver and/or expense reimbursement arrangements currently in place. Additionally, the Board Members received and considered information comparing the Fund’s management fee and overall expenses with those of comparable funds in both the relevant expense group and a broader group of funds, each selected and provided by Lipper. The Board Members also reviewed and considered the subadvisory fee that would be payable by the Manager to the Subadviser in light of the nature, extent and quality of the management services expected to be provided by the Subadviser. The Board Members noted that the Manager, and not the Fund, will pay the subadvisory fee to the Subadviser. The Board Members determined that the Fund’s management fee and the Fund’s subadvisory fee were reasonable in light of the nature, extent and quality of the services expected to be provided to the Fund under the New Management Agreement and the New Subadvisory Agreement.
The Board Members received and considered a pro-forma profitability analysis of Legg Mason and its affiliates in providing services to the Fund, including information with respect to the allocation methodologies used in preparing the profitability data. The Board Members recognized that Legg Mason may realize economies of scale based on its internal reorganization and synergies of operations. The Board Members noted that it was not possible to predict with a high degree of confidence how Legg Mason’s and its affiliates’ profitability would be affected by its internal reorganization and by other factors including potential economies of scale, but that based on their review of the pro forma profitability analysis, their most recent prior review of the profitability of the predecessor manager and its affiliates from their relationship with the Fund and other factors considered, they determined that the management fee was reasonable. The Board Members noted that they expect to receive and evaluate profitability information on an annual basis.
In their deliberations, the Board Members also considered the information that had been received, the factors that had been identified and the conclusions that had been reached by the Board in connection with the Board’s most recent approval of the Fund’s prior management agreement, in addition to information provided in connection with the Board’s evaluation of the terms and conditions of the New Management Agreement and the New Subadvisory Agreement.
The Board Members considered Legg Mason’s advice and the advice of its counsel that the New Management Agreement and the New Subadvisory Agreement were being entered into in connection with an internal reorganization within Legg Mason that did not involve an actual change of control or management. The Board Members further noted that the terms and conditions of the New Management Agreement are substantially
74 Legg Mason Partners Investment Series
Board Approval of Management and Subadvisory Agreements (unaudited) (continued)
identical to those of the Fund’s previous management agreement except for the identity of the Manager, and that the initial term of the New Management Agreement (after which it will continue in effect only if such continuance is specifically approved at least annually by the Board, including a majority of the Independent Board Members) was the same as that under the prior management agreement.
In light of all of the foregoing, the Board, including the Independent Board Members, approved the New Management Agreement and the New Subadvisory Agreement. No single factor reviewed by the Board Members was identified as the principal factor in determining whether to approve the New Management Agreement and the New Subadvisory Agreement. The Independent Board Members were advised by separate independent legal counsel throughout the process. The Independent Board Members also discussed the proposed approval of the New Management Agreement and the New Subadvisory Agreement in private sessions with their independent legal counsel at which no representatives of the Manager or Subadviser were present.
Legg Mason Partners Investment Series 75
Board Approval of Management and Subadvisory Agreements (unaudited) (continued)
Legg Mason Partners Variable Dividend Strategy Portfolio
At a meeting held in person on June 19, 2006, the Fund’s Board, including a majority of the Board Members who are not “interested persons” of the Fund or Legg Mason Partners Fund Advisor, LLC (the “Manager”) or any sub-investment adviser or proposed subinvestment adviser as defined in the Investment Company Act of 1940, as amended (the “1940 Act”) (the “Independent Board Members”), approved a new management agreement (the “New Management Agreement”) between the Fund and the Manager. The Fund’s Board, including a majority of the Independent Board Members, also approved one or more new subadvisory agreements between the Manager and ClearBridge Advisors, LLC the “Subadviser”) (the “New Subadvisory Agreement”). The New Management Agreement and the New Subadvisory Agreement replaced the Fund’s prior management agreement with Smith Barney Fund Management, LLC and were entered into in connection with an internal reorganization of the Manager’s and the prior manager’s parent organization, Legg Mason. In approving the New Management Agreement and New Subadvisory Agreement, the Board, including the Independent Board Members, considered the factors discussed below, among other things.
The Board noted that the Manager will provide administrative and certain oversight services to the Fund, and that the Manager will delegate to the Subadviser the day-to-day portfolio management of the Fund. The Board Members reviewed the qualifications, backgrounds and responsibilities of the senior personnel that will provide oversight and general management services and the portfolio management team that would be primarily responsible for the day-to-day management of the Fund. The Board Members noted that the portfolio management team was expected to be the same as then managing the Fund.
The Board Members received and considered information regarding the nature, extent and quality of services expected to be provided to the Fund by the Manager under the New Management Agreement and by the Subadviser under the New Subadvisory Agreement. The Board Members’ evaluation of the services expected to be provided by the Manager and the Subadviser took into account the Board Members’ knowledge and familiarity gained as Fund Board Members, including as to the scope and quality of Legg Mason’s investment management and other capabilities and the quality of its administrative and other services. The Board Members considered, among other things, information and assurances provided by Legg Mason as to the operations, facilities and organization of the Manager and the Subadviser and the qualifications, backgrounds and responsibilities of their senior personnel. The Board Members further considered the financial resources available to the Manager, the Subadviser and Legg Mason. The Board Members concluded that, overall, the nature, extent and quality of services expected to be provided under the New Management Agreement and the New Subadvisory Agreement were acceptable.
The Board Members also received and considered performance information for the Fund as well as comparative information with respect to a peer group of funds (the “Performance Universe”) selected by Lipper, Inc. (“Lipper”), an independent provider of investment company data. The Board Members were provided with a description of the methodology Lipper used to determine the similarity of the Fund to the funds included in
76 Legg Mason Partners Investment Series
Board Approval of Management and Subadvisory Agreements (unaudited) (continued)
the Performance Universe. The Board Members noted that they had received and discussed with management, at periodic intervals, information comparing the Fund’s performance against, among other things, its benchmark.
The Board Members reviewed and considered the management fee that would be payable by the Fund to the Manager in light of the nature, extent and quality of the management services expected to be provided by the Manager, including the fee waiver and/or expense reimbursement arrangements currently in place. Additionally, the Board Members received and considered information comparing the Fund’s management fee and overall expenses with those of comparable funds in both the relevant expense group and a broader group of funds, each selected and provided by Lipper. The Board Members also reviewed and considered the subadvisory fee that would be payable by the Manager to the Subadviser in light of the nature, extent and quality of the management services expected to be provided by the Subadviser. The Board Members noted that the Manager, and not the Fund, will pay the subadvisory fee to the Subadviser. The Board Members determined that the Fund’s management fee and the Fund’s subadvisory fee were reasonable in light of the nature, extent and quality of the services expected to be provided to the Fund under the New Management Agreement and the New Subadvisory Agreement.
The Board Members received and considered a pro-forma profitability analysis of Legg Mason and its affiliates in providing services to the Fund, including information with respect to the allocation methodologies used in preparing the profitability data. The Board Members recognized that Legg Mason may realize economies of scale based on its internal reorganization and synergies of operations. The Board Members noted that it was not possible to predict with a high degree of confidence how Legg Mason’s and its affiliates’ profitability would be affected by its internal reorganization and by other factors including potential economies of scale, but that based on their review of the pro forma profitability analysis, their most recent prior review of the profitability of the predecessor manager and its affiliates from their relationship with the Fund and other factors considered, they determined that the management fee was reasonable. The Board Members noted that they expect to receive and evaluate profitability information on an annual basis.
In their deliberations, the Board Members also considered the information that had been received, the factors that had been identified and the conclusions that had been reached by the Board in connection with the Board’s most recent approval of the Fund’s prior management agreement, in addition to information provided in connection with the Board’s evaluation of the terms and conditions of the New Management Agreement and the New Subadvisory Agreement.
The Board Members considered Legg Mason’s advice and the advice of its counsel that the New Management Agreement and the New Subadvisory Agreement were being entered into in connection with an internal reorganization within Legg Mason that did not involve an actual change of control or management. The Board Members further noted that the terms and conditions of the New Management Agreement are substantially identical to those of the Fund’s previous management agreement except for the identity of the Manager, and that the initial term of the New Management Agreement (after which it
Legg Mason Partners Investment Series 77
Board Approval of Management and Subadvisory Agreements (unaudited) (continued)
will continue in effect only if such continuance is specifically approved at least annually by the Board, including a majority of the Independent Board Members) was the same as that under the prior management agreement.
In light of all of the foregoing, the Board, including the Independent Board Members, approved the New Management Agreement and the New Subadvisory Agreement. No single factor reviewed by the Board Members was identified as the principal factor in determining whether to approve the New Management Agreement and the New Subadvisory Agreement. The Independent Board Members were advised by separate independent legal counsel throughout the process. The Independent Board Members also discussed the proposed approval of the New Management Agreement and the New Subadvisory Agreement in private sessions with their independent legal counsel at which no representatives of the Manager or Subadviser were present.
78 Legg Mason Partners Investment Series
Board Approval of Management and Subadvisory Agreements (unaudited) (continued)
Legg Mason Partners Variable Growth and Income Portfolio
At a meeting held in person on June 19, 2006 the Fund’s Board, including a majority of the Board Members who are not “interested persons” of the Fund or Legg Mason Partners Fund Advisor, LLC (the “Manager”) or any sub-investment adviser or proposed subinvestment adviser as defined in the Investment Company Act of 1940, as amended (the “1940 Act”) (the “Independent Board Members”), approved a new management agreement (the “New Management Agreement”) between the Fund and the Manager. The Fund’s Board, including a majority of the Independent Board Members, also approved one or more new subadvisory agreements between the Manager and ClearBridge Advisors, LLC (the “Subadviser”) (the “New Subadvisory Agreement”). The New Management Agreement and the New Subadvisory Agreement replaced the Fund’s prior management agreement with Smith Barney Fund Management LLC and were entered into in connection with an internal reorganization of the Manager’s and the prior manager’s parent organization, Legg Mason. In approving the New Management Agreement and New Subadvisory Agreement, the Board, including the Independent Board Members, considered the factors discussed below, among other things.
The Board noted that the Manager will provide administrative and certain oversight services to the Fund, and that the Manager will delegate to the Subadviser the day-to-day portfolio management of the Fund. The Board Members reviewed the qualifications, backgrounds and responsibilities of the senior personnel that will provide oversight and general management services and the portfolio management team that would be primarily responsible for the day-to-day management of the Fund. The Board Members noted that the portfolio management team was expected to be the same as then managing the Fund.
The Board Members received and considered information regarding the nature, extent and quality of services expected to be provided to the Fund by the Manager under the New Management Agreement and by the Subadviser under the New Subadvisory Agreement. The Board Members’ evaluation of the services expected to be provided by the Manager and the Subadviser took into account the Board Members’ knowledge and familiarity gained as Fund Board Members, including as to the scope and quality of Legg Mason’s investment management and other capabilities and the quality of its administrative and other services. The Board Members considered, among other things, information and assurances provided by Legg Mason as to the operations, facilities and organization of the Manager and the Subadviser and the qualifications, backgrounds and responsibilities of their senior personnel. The Board Members further considered the financial resources available to the Manager, the Subadviser and Legg Mason. The Board Members concluded that, overall, the nature, extent and quality of services expected to be provided under the New Management Agreement and the New Subadvisory Agreement were acceptable.
The Board Members also received and considered performance information for the Fund as well as comparative information with respect to a peer group of funds (the “Performance Universe”) selected by Lipper, Inc. (“Lipper”), an independent provider of investment company data. The Board Members were provided with a description of the methodology Lipper used to determine the similarity of the Fund to the funds included in
Legg Mason Partners Investment Series 79
Board Approval of Management and Subadvisory Agreements (unaudited) (continued)
the Performance Universe. The Board Members noted that they had received and discussed with management, at periodic intervals, information comparing the Fund’s performance against, among other things, its benchmark.
The Board Members reviewed and considered the management fee that would be payable by the Fund to the Manager in light of the nature, extent and quality of the management services expected to be provided by the Manager, including the fee waiver and/or expense reimbursement arrangements currently in place. Additionally, the Board Members received and considered information comparing the Fund’s management fee and overall expenses with those of comparable funds in both the relevant expense group and a broader group of funds, each selected and provided by Lipper. The Board Members also reviewed and considered the subadvisory fee that would be payable by the Manager to the Subadviser in light of the nature, extent and quality of the management services expected to be provided by the Subadviser. The Board Members noted that the Manager, and not the Fund, will pay the subadvisory fee to the Subadviser. The Board Members determined that the Fund’s management fee and the Fund’s subadvisory fee were reasonable in light of the nature, extent and quality of the services expected to be provided to the Fund under the New Management Agreement and the New Subadvisory Agreement.
The Board Members received and considered a pro-forma profitability analysis of Legg Mason and its affiliates in providing services to the Fund, including information with respect to the allocation methodologies used in preparing the profitability data. The Board Members recognized that Legg Mason may realize economies of scale based on its internal reorganization and synergies of operations. The Board Members noted that it was not possible to predict with a high degree of confidence how Legg Mason’s and its affiliates’ profitability would be affected by its internal reorganization and by other factors including potential economies of scale, but that based on their review of the pro-forma profitability analysis, their most recent prior review of the profitability of the predecessor manager and its affiliates from their relationship with the Fund and other factors considered, they determined that the management fee was reasonable. The Board Members noted that they expect to receive and evaluate profitability information on an annual basis.
In their deliberations, the Board Members also considered the information that had been received, the factors that had been identified and the conclusions that had been reached by the Board in connection with the Board’s most recent approval of the Fund’s prior management agreement, in addition to information provided in connection with the Board’s evaluation of the terms and conditions of the New Management Agreement and the New Subadvisory Agreement.
The Board Members considered Legg Mason’s advice and the advice of its counsel that the New Management Agreement and the New Subadvisory Agreement were being entered into in connection with an internal reorganization within Legg Mason that did not involve an actual change of control or management. The Board Members further noted that the terms and conditions of the New Management Agreement are substantially identical to those of the Fund’s previous management agreement except for the identity of the Manager, and that the initial term of the New Management Agreement (after which it
80 Legg Mason Partners Investment Series
Board Approval of Management and Subadvisory Agreements (unaudited) (continued)
will continue in effect only if such continuance is specifically approved at least annually by the Board, including a majority of the Independent Board Members) was the same as that under the prior management agreement.
In light of all of the foregoing, the Board, including the Independent Board Members, approved the New Management Agreement and the New Subadvisory Agreement. No single factor reviewed by the Board Members was identified as the principal factor in determining whether to approve the New Management Agreement and the New Subadvisory Agreement. The Independent Board Members were advised by separate independent legal counsel throughout the process. The Independent Board Members also discussed the proposed approval of the New Management Agreement and the New Subadvisory Agreement in private sessions with their independent legal counsel at which no representatives of the Manager or Subadviser were present.
Legg Mason Partners Investment Series 81
Board Approval of Management and Subadvisory Agreements (unaudited) (continued)
Legg Mason Partners Variable Government Portfolio
At a meeting held in person on June 19, 2006 the Fund’s Board, including a majority of the Board Members who are not ‘‘interested persons’’ of the Fund or Legg Mason Partners Fund Advisor, LLC (the ‘‘Manager’’) or any sub-investment adviser as defined in the Investment Company Act of 1940, as amended (the ‘‘1940 Act’’) (the ‘‘Independent Board Members’’), approved a new management agreement (the ‘‘New Management Agreement’’) between the Fund and the Manager. The Fund’s Board, including a majority of the Independent Board Members, also approved a new subadvisory agreement between the Manager and Western Asset Management Company (the ‘‘Subadviser’’) (the ‘‘New Subadvisory Agreement’’). The New Management Agreement and the New Subadvisory Agreement replaced the Fund’s prior management agreement with Smith Barney Fund Management LLC and were entered into in connection with an internal reorganization of the Manager’s and the prior manager’s parent organization, Legg Mason. In approving the New Management Agreement and New Subadvisory Agreement, the Board, including the Independent Board Members, considered the factors discussed below, among other things.
The Board noted that the Manager will provide administrative and certain oversight services to the Fund, and that the Manager will delegate to the Subadviser the day-to-day portfolio management of the Fund. The Board Members reviewed the qualifications, backgrounds and responsibilities of the senior personnel that will provide oversight and general management services and the portfolio management team that would be primarily responsible for the day-to-day management of the Fund. The Board Members noted that the portfolio management team was expected to be the same as then managing the Fund.
The Board Members received and considered information regarding the nature, extent and quality of services expected to be provided to the Fund by the Manager under the New Management Agreement and by the Subadviser under the New Subadvisory Agreement. The Board Members’ evaluation of the services expected to be provided by the Manager and the Subadviser took into account the Board Members’ knowledge and familiarity gained as Fund Board Members, including as to the scope and quality of Legg Mason’s investment management and other capabilities and the quality of its administrative and other services. The Board Members considered, among other things, information and assurances provided by Legg Mason as to the operations, facilities and organization of the Manager and the Subadviser and the qualifications, backgrounds and responsibilities of their senior personnel. The Board Members further considered the financial resources available to the Manager, the Subadviser and Legg Mason. The Board Members concluded that, overall, the nature, extent and quality of services expected to be provided under the New Management Agreement and the New Subadvisory Agreement were acceptable.
The Board Members also received and considered performance information for the Fund as well as comparative information with respect to a peer group of funds (the ‘‘Performance Universe’’) selected by Lipper, Inc. (‘‘Lipper’’), an independent provider of investment company data. The Board Members were provided with a description of the methodology Lipper used to determine the similarity of the Fund to the funds included in
82 Legg Mason Partners Investment Series
Board Approval of Management and Subadvisory Agreements (unaudited) (continued)
the Performance Universe. The Board Members noted that they had received and discussed with management, at periodic intervals, information comparing the Fund’s performance against, among other things, its benchmark.
The Board Members reviewed and considered the management fee that would be payable by the Fund to the Manager in light of the nature, extent and quality of the management services expected to be provided by the Manager. Additionally, the Board Members received and considered information comparing the Fund’s management fee and overall expenses with those of comparable funds in both the relevant expense group and a broader group of funds, each selected and provided by Lipper. The Board Members also reviewed and considered the subadvisory fee that would be payable by the Manager to the Subadviser in light of the nature, extent and quality of the management services expected to be provided by the Subadviser. The Board Members noted that the Manager, and not the Fund, will pay the subadvisory fee to the Subadviser. The Board Members determined that the Fund’s management fee and the Fund’s subadvisory fee were reasonable in light of the nature, extent and quality of the services expected to be provided to the Fund under the New Management Agreement and the New Subadvisory Agreement.
The Board Members received and considered a pro-forma profitability analysis of Legg Mason and its affiliates in providing services to the Fund, including information with respect to the allocation methodologies used in preparing the profitability data. The Board Members recognized that Legg Mason may realize economies of scale based on its internal reorganization and synergies of operations. The Board Members noted that it was not possible to predict with a high degree of confidence how Legg Mason’s and its affiliates’ profitability would be affected by its internal reorganization and by other factors including potential economies of scale, but that based on their review of the pro-forma profitability analysis, their most recent prior review of the profitability of the predecessor manager and its affiliates from their relationship with the Fund and other factors considered, they determined that the management fee was reasonable. The Board Members noted that they expect to receive and evaluate profitability information on an annual basis.
In their deliberations, the Board Members also considered the information that had been received, the factors that had been identified, and the conclusions that had been reached by the Board in connection with the Board’s most recent approval of the Fund’s prior management agreement in addition to information provided in connection with the Board’s evaluation of the terms and conditions of the New Management Agreement and the New Subadvisory Agreement.
The Board Members considered Legg Mason’s advice and the advice of its counsel that the New Management Agreement and the New Subadvisory Agreement were being entered into in connection with an internal reorganization within Legg Mason that did not involve an actual change of control or management. The Board Members further noted that the terms and conditions of the New Management Agreement are substantially identical to those of the Fund’s previous management agreement except for the identity of the Manager, and that the initial term of the New Management Agreement (after which it will continue in effect only if such continuance is specifically approved at least annually by
Legg Mason Partners Investment Series 83
Board Approval of Management and Subadvisory Agreements (unaudited) (continued)
the Board, including a majority of the Independent Board Members) was the same as that under the prior management agreement.
In light of all of the foregoing, the Board, including the Independent Board Members, approved the New Management Agreement and the New Subadvisory Agreement. No single factor reviewed by the Board Members was identified as the principal factor in determining whether to approve the New Management Agreement and the New Subadvisory Agreement. The Independent Board Members were advised by separate independent legal counsel throughout the process. The Independent Board Members also discussed the proposed approval of the New Management Agreement and the New Subadvisory Agreement in private sessions with their independent legal counsel at which no representatives of the Manager or Subadviser were present.
84 Legg Mason Partners Investment Series
Additional Information (unaudited)
Information about Trustees and Officers
The business and affairs of Legg Mason Partners Investment Series (formerly known as Smith Barney Investment Series) (the “Trust”) are managed under the direction of the Trust’s Board of Trustees. Information pertaining to the Trustees and officers of the Trust is set forth below. Each Trustee and Officer holds office for his or her lifetime, unless that individual resigns, retires or is otherwise removed. The Statement of Additional Information includes additional information about the Trustees and is available without charge, upon request by calling Legg Mason Partners Shareholder Services at 1-800-451-2010.
| | | | | | | | | | |
| | | | | |
Name, Address and
Birth Year | | Position(s)
Held with
Fund | | Term of
Office* and
Length
of Time
Served | | Principal
Occupation(s) During Past
Five Years | | Number of
Portfolios
in Fund
Complex
Overseen by
Trustee | | Other Board
Memberships Held by
Trustee
During Past
5 Years |
| Non-Interested Trustees: | | | | | | |
Elliott J. Berv c/o R. Jay Gerken Legg Mason & Co., LLC (“Legg Mason”) 399 Park Avenue New York, NY 10022 Birth Year: 1943 | | Trustee | | Since 2001 | | President and Chief Executive Officer, Catalyst (consulting) (since 1984); Chief Executive Officer, Rocket City Enterprises (media) (2000 to 2005); Chief Executive Officer, Landmark City (real estate development) (2001 to 2004); Executive Vice President, DigiGym Systems (personal fitness systems) (2001 to 2004); Chief Executive Officer, Motorcity USA (Motorsport Racing) (2004 to 2005) | | 37 | | Board Member, American Identity Corp. (doing business as Morpheus Technologies) (biometric information management) (since 2001); Director, Lapoint Industries (industrial filter company) (since 2002); Director, Alzheimer’s Association (New England Chapter) (since 1998) |
| | | | | |
Donald M. Carlton c/o R. Jay Gerken Legg Mason 399 Park Avenue New York, NY 10022 Birth Year: 1937 | | Trustee | | Since 2001 | | Consultant, URS Corporation (engineering) (since 1999); Formerly, Chief Executive Officer, Radian International LLC (engineering) (from 1996 to 1998), Member of the Management Committee, Signature Science (research and development) (since 2000) | | 37 | | Director, Temple-Inland (forest products) (since 2003); Director, American Electric Power Co. (electric utility) (since 1999); Director, National Instruments Corp. (technology) (since 1994); formerly, Director, Valero Energy (petroleum refining) (from 1999 to 2003) |
Legg Mason Partners Investment Series 85
Additional Information (unaudited) (continued)
| | | | | | | | | | |
| | | | | |
Name, Address and
Birth Year | | Position(s)
Held with
Fund | | Term of
Office* and
Length
of Time
Served | | Principal
Occupation(s) During Past
Five Years | | Number of
Portfolios
in Fund
Complex
Overseen by
Trustee | | Other Board
Memberships Held by
Trustee
During Past
5 Years |
| Non-Interested Trustees: | | | | | | | | |
A. Benton Cocanougher c/o R. Jay Gerken Legg Mason 399 Park Avenue New York, NY 10022 Birth Year: 1938 | | Trustee | | Since 2001 | | Dean Emeritus and Professor, Texas A&M University (since 2001); Formerly, Interim Chancellor, Texas A&M University System (2003 to 2004); Formerly, Special Advisor to the President, Texas A&M University (2002-2003); Formerly, Dean and Professor of Marketing, College and Graduate School of Business, Texas A&M University (1987 to 2001) | | 37 | | None |
| | | | | |
Mark T. Finn
c/o R. Jay Gerken Legg Mason 399 Park Avenue New York, NY 10022 Birth Year: 1943 | | Trustee | | Since 2001 | | Adjunct Professor, College of William & Mary (since 2002); Principal/Member, Balvan Partners (investment management) (since 2002); Chairman, Chief Executive Officer and Owner, Vantage Consulting Group, Inc. (Investment management) (since 1988); Formerly, Vice Chairman and Chief Operating Officer, Lindner Asset Management Company (mutual fund company) (1999 to 2001); formerly, General Partner and Shareholder, Greenwich Ventures, LLC (investment partnership) (1996 to 2001) | | 37 | | None |
86 Legg Mason Partners Investment Series
Additional Information (unaudited) (continued)
| | | | | | | | | | |
| | | | | |
Name, Address and
Birth Year | | Position(s)
Held with
Fund | | Term of
Office* and
Length
of Time
Served | | Principal
Occupation(s) During Past
Five Years | | Number of
Portfolios
in Fund
Complex
Overseen by
Trustee | | Other Board
Memberships Held by
Trustee
During Past
5 Years |
| Non-Interested Trustees: | | | | | | | | |
Stephen Randolph Gross
c/o R. Jay Gerken Legg Mason 399 Park Avenue New York, NY 10022 Birth Year: 1947 | | Trustee | | Since 2001 | | Chairman, HLB Gross Collins, P.C. (accounting and consulting firm (since 1979); Treasurer, Coventry Limited, Inc. (Senior Living Facilities) (since 1985); formerly, Managing Director, Fountainhead Ventures, LLC (technology accelerator) (1998 to 2003); formerly, Treasurer, Hank Aaron Enterprises (fast food franchise) (1985 to 2001); formerly, Partner, Capital Investment Advisory Partners (leverage buyout consulting) (2000 to 2002); formerly, Secretary, Carint N.A. (manufacturing) (1998 to 2002) | | 37 | | Director, Andersen Calhoun (assisted living) (since 1987); Formerly, Director, United Telesis, Inc. (telecommunications) (1997 to 2002); formerly, Director, ebank Financial Services, Inc. (1997 to 2004) |
| | | | | |
Diana R. Harrington c/o R. Jay Gerken Legg Mason 399 Park Avenue New York, NY 10022 Birth Year: 1940 | | Trustee | | Since 1992 | | Professor, Babson College (since 1992) | | 37 | | None |
| | | | | |
Susan B. Kerley c/o R. Jay Gerken Legg Mason 399 Park Avenue New York, NY 10022 Birth Year: 1951 | | Trustee | | Since 1992 | | Investment Consultant, Partner, Strategic Management Advisors, LLC (investment consulting)
(since 1990) | | 37 | | Chairperson and Independent Board Member of Eclipse Fund, Inc. and Eclipse Funds (which trade as Mainstay Funds) (currently supervises 16 investment companies in the Fund complex) (since 1991) |
Legg Mason Partners Investment Series 87
Additional Information (unaudited) (continued)
| | | | | | | | | | |
| | | | | |
Name, Address and
Birth Year | | Position(s)
Held with
Fund | | Term of
Office* and
Length
of Time
Served | | Principal
Occupation(s) During Past
Five Years | | Number of
Portfolios
in Fund
Complex
Overseen by
Trustee | | Other Board
Memberships Held by
Trustee
During Past
5 Years |
| Non-Interested Trustees: | | | | | | | | |
Alan G. Merten c/o R. Jay Gerken Legg Mason 399 Park Avenue New York, NY 10022 Birth Year: 1941 | | Trustee | | Since 2001 | | President, George Mason University (since 1996) | | 37 | | Trustee, First Potomac Realty Trust (since 2005); Director, Xybernaut Corporation (information technology) (2004-2006); Director, Digital Net Holdings, Inc. (2003-2004); Director, Comshare, Inc. (information technology) (1985 to 2003); Director, BTG, Inc. (information systems) (1997 to 2001) |
| | | | | |
R. Richardson Pettit c/o R. Jay Gerken Legg Mason 399 Park Avenue New York, NY 10022 Birth Year: 1942 | | Trustee | | Since 2001 | | Formerly, Duncan Professor of Finance, University of Houston (1977 to 2006); | | 37 | | None |
| | | | |
| Interested Trustee: | | | | | | | | |
R. Jay Gerken, CFA ** Legg Mason 399 Park Avenue, 4th Floor New York, NY 10022
Birth Year: 1951 | | Director, Chairman, President and Chief Executive Officer, Class II | | Since 2002 | | Managing Director, Legg Mason; Chairman of the Board, Trustee, or Director of 162 funds associated with Legg Mason Partners Fund Advisor, LLC (“LMPFA”) and its affiliates; President, LMPFA (since 2006); Chairman, President and Chief Executive Officer of certain mutual funds associated with Legg Mason or its affiliates; formerly, Chairman, Smith Barney Fund Management LLC (“SBFM”) and Citi Fund Management, Inc. (“CFM”) (2002 to 2005); formerly, Chairman, President and Chief Executive Officer, Travelers Investment Advisers Inc. (2002 to 2005) | | 162 | | Trustee, Consulting Group Capital Markets Fund |
88 Legg Mason Partners Investment Series
Additional Information (unaudited) (continued)
| | | | | | | | | | |
| | | | | |
Name, Address and
Birth Year | | Position(s)
Held with
Fund | | Term of
Office* and
Length
of Time
Served | | Principal
Occupation(s) During Past
Five Years | | Number of
Portfolios
in Fund
Complex
Overseen by
Trustee | | Other Board
Memberships Held by
Trustee
During Past
5 Years |
| Officers: | | | | | | | | | | |
Frances M. Guggino
Legg Mason
125 Broad Street
10th Floor
New York, NY 10004
Birth Year: 1957 | | Chief Financial Officer and Treasurer | | Since
2004 | | Director of Legg Mason; Chief Financial Officer and Treasurer of certain mutual funds associated with Legg Mason; Formerly, Controller of certain mutual funds associated with Legg Mason (from 1999 to 2004) | | N/A | | N/A |
| | | | | |
Alan J. Blake
ClearBridge Advisors, LLC
(“ClearBridge Advisors”)
399 Park Avenue,
4th Floor
New York, NY 10022
Birth Year: 1949 | | Vice President and Investment Officer | | Since 2001 | | Managing Director of Legg Mason | | N/A | | N/A |
| | | | | |
Scott K. Glasser
ClearBridge Advisors
399 Park Avenue
4th Floor
New York, NY 10022
Birth Year: 1966 | | Vice President and Investment Officer | | Since
1996 | | Managing Director of Legg Mason and Investment Officer of ClearBridge Advisors | | N/A | | N/A |
| | | | | |
Peter J. Hable
ClearBridge Advisors
One Sansome Street
San Francisco, CA 94104
Birth Year: 1958 | | Vice President and Investment Officer | | Since
1999 | �� | Managing Director of Legg Mason and Investment Officer of ClearBridge Advisors | | N/A | | N/A |
| | | | | |
Michael A. Kagan
ClearBridge Advisors
399 Park Avenue,
4th Floor
New York, NY 10022 Birth Year: 1960 | | Vice President and Investment Officer | | Since 2000 | | Managing Director of Legg Mason and Investment Officer of ClearBridge Advisors | | N/A | | N/A |
| | | | | |
Timothy Woods, CFA
ClearBridge Advisors
100 First Stamford Place
Stamford, CT 06902
Birth Year: 1960 | | Vice President and Investment Officer | | Since
2001 | | Managing Director of Legg Mason and Investment Officer of ClearBridge Advisors | | N/A | | N/A |
Legg Mason Partners Investment Series 89
Additional Information (unaudited) (continued)
| | | | | | | | | | |
| | | | | |
Name, Address and
Birth Year | | Position(s)
Held with
Fund | | Term of
Office* and
Length
of Time
Served | | Principal
Occupation(s) During Past
Five Years | | Number of
Portfolios
in Fund
Complex
Overseen by
Trustee | | Other Board
Memberships Held by
Trustee
During Past
5 Years |
| Officers: | | | | | | | | | | |
Ted P. Becker
Legg Mason
399 Park Avenue
4th Floor
New York, NY 10022
Birth Year: 1951 | | Chief Compliance Officer | | Since
2006 | | Director of Global Compliance at Legg Mason (since 2006); Chief Compliance Officer of LMPFA (since 2006); Managing Director of Compliance at Legg Mason since 2005; Chief Compliance Officer with certain mutual funds associated with Legg Mason (since 2006); Managing Director of Compliance at Legg Mason or its predecessor (2002-2005); Prior to 2002, Managing Director-Internal Audit & Risk Review at Citigroup Inc. | | N/A | | N/A |
| | | | | |
John Chiota
Legg Mason
300 First Stamford Place
4th Floor
Stamford, CT 06902
Birth Year: 1968 | | Chief Anti-Money Laundering Compliance Officer | | Since
2006 | | Vice President of Legg Mason or its predecessor (since 2004); Chief Anti-Money Laundering Compliance Officer with certain mutual funds associated with Legg Mason (since 2006); Prior to August 2004, Chief AML Compliance Officer with TD Waterhouse | | N/A | | N/A |
| | | | | |
Robert I. Frenkel Legg Mason
300 First Stamford Place
4th Floor
Stamford, CT 06902
Birth Year: 1954 | | Secretary
and Chief Legal Officer | | Since
2003 | | Managing Director and General Counsel of Global Mutual Funds for Legg Mason and its predecessors (since 1994); Secretary and Chief Legal Officer of mutual funds associated with Legg Mason (since 2003); formerly, Secretary of CFM (from 2001 to 2004) | | N/A | | N/A |
| * | | Each Trustee and Officer serves until his or her successor has been duly elected and qualified. |
| ** | | Mr. Gerken is an “interested person” of the Funds as defined in the Investment Company Act of 1940, as amended, because Mr. Gerken is an officer of LMPFA and certain of its affiliates. |
90 Legg Mason Partners Investment Series
Additional Shareholder Information (unaudited)
Results of a Special Meeting of Shareholders
On October 19, 2006, a Special Meeting of Shareholder was held to approve an Agreement and Plan of Reorganization, providing for (i) the acquisition of all of the assets and the assumption of all of the liabilities of the Legg Mason Partners Variable Growth and Income Portfolio (the “Acquired Fund), in exchange for shares of the corresponding Legg Mason Partners Variable Appreciation Portfolio (the “Acquiring Fund”) to be distributed to the shareholders of the Acquired Fund and (ii) the subsequent termination of the Acquired Fund. The following table provides the number of votes cast for, against or withheld, as well the number of abstentions and non-votes for the matter voted on at the Special Meeting of Shareholders:
Approval of Agreement and Plan of Reorganization
| | | | | | |
| Votes For | | Votes Against | | Abstentions | | Broker Non-Votes |
64,144,251.199 | | 1,853,319.564 | | 8,230,704.903 | | 0.000 |
| |
On December 11, 2006, a Special Meeting of Shareholders was held to elect Board Members. The following table provides the number of votes cast for or against, as well as the number of abstentions and broker non-votes as to the matter voted on at the Special Meeting of Shareholders.
Election of Board Members†
| | | | | | | | |
| Item Voted On | | Votes For | | Votes Against | | Abstentions | | Broker Non-Votes |
Nominees: | | | | | | | | |
Paul R. Ades | | 123,276,317.131 | | 3,082,135.672 | | 0.000 | | 0.000 |
Andrew L. Breech | | 123,263,371.782 | | 3,095,081.021 | | 0.000 | | 0.000 |
Dwight B. Crane | | 123,262,454.821 | | 3,095,997.982 | | 0.000 | | 0.000 |
Robert M. Frayn, Jr. | | 123,177,621.132 | | 3,180,831.671 | | 0.000 | | 0.000 |
Frank G. Hubbard | | 123,240,887.733 | | 3,117,565.070 | | 0.000 | | 0.000 |
Howard J. Johnson | | 123,237,577.056 | | 3,120,875.747 | | 0.000 | | 0.000 |
David E. Maryatt | | 123,181,879.401 | | 3,176,573.402 | | 0.000 | | 0.000 |
Jerome H. Miller | | 123,151,423.644 | | 3,207,029.159 | | 0.000 | | 0.000 |
Ken Miller | | 123,225,633.504 | | 3,132,819.299 | | 0.000 | | 0.000 |
John J. Murphy | | 123,258,467.753 | | 3,099,985.050 | | 0.000 | | 0.000 |
Thomas F. Schlafly | | 123,271,369.107 | | 3,087,083.696 | | 0.000 | | 0.000 |
Jerry A. Viscione | | 123,159,026.695 | | 3,199,426.108 | | 0.000 | | 0.000 |
R. Jay Gerken, CFA | | 123,180,648.353 | | 3,177,804.450 | | 0.000 | | 0.000 |
| |
| † | | Board Members are elected by the shareholders of all of the series of the Trust of which the Fund is a series. |
Legg Mason Partners Investment Series 91
Important Tax Information (unaudited)
The following information is provided with respect to the distributions paid during the taxable year ended October 31, 2006:
| | | | | | | | | |
| | | |
| | | Legg Mason
Partners
Variable
Premier Selections
All Cap Growth
Portfolio | | | Legg Mason
Partners
Variable
Dividend
Strategy
Portfolio | | | Legg Mason
Partners
Variable
Growth and
Income
Portfolio | |
Record Date: | | 12/27/2005 | | | 12/27/2005 | | | 12/27/2005 | |
Payable Date: | | 12/28/2005 | | | 12/28/2005 | | | 12/28/2005 | |
| | |
Ordinary Income: | | | | | | | | | |
Dividends Qualifying for the Dividends Received Deduction for Corporations | | 100.00 | % | | 100.00 | % | | 100.00 | % |
| | |
Please retain this information for your records.
92 Legg Mason Partners Investment Series
Legg Mason Partners Investment Series
| | |
TRUSTEES Elliott J. Berv Donald M. Carlton A. Benton Cocanougher Mark T. Finn R. Jay Gerken, CFA
Chairman Stephen Randolph Gross Diana R. Harrington Susan B. Kerley Alan G. Merten R. Richardson Pettit | | INVESTMENT MANAGER Legg Mason Partners Fund
Advisor, LLC SUBADVISERS ClearBridge Advisors, LLC Western Asset Management
Company DISTRIBUTORS Citigroup Global Markets Inc. Legg Mason Investors
Services, LLC CUSTODIAN State Street Bank and Trust Company TRANSFER AGENT PFPC Inc. 4400 Computer Drive Westborough, Massachusetts 01581 INDEPENDENT REGISTERED PUBLIC ACCOUNTING FIRM KPMG LLP 345 Park Avenue New York, New York 10154 |
This report is submitted for general information of the shareholders of the Legg Mason Partners Investment Series — Legg Mason Partners Variable Premier Selections All Cap Growth, Legg Mason Partners Variable Dividend Strategy, Legg Mason Partners Variable Growth and Income and Legg Mason Partners Variable Government Portfolios.
This report must be preceded or accompanied by a free prospectus. Investors should consider the Funds’ investment objectives, risks, charges and expenses carefully before investing. The prospectus contains this and other important information about the Funds. Please read the prospectus carefully before investing.
www.leggmason.com/InvestorServices
©2006 Legg Mason Investor Services, LLC
Member NASD, SIPC
Legg Mason Partners Investment Series
Legg Mason Partners Variable Premier Selections All Cap Growth Portfolio
Legg Mason Partners Variable Dividend Strategy Portfolio
Legg Mason Partners Variable Growth and Income Portfolio
Legg Mason Partners Variable Government Portfolio
The Funds are separate investment funds of the Legg Mason Partners Investment Series, a Massachusetts business trust.
LEGG MASON PARTNERS INVESTMENT SERIES
Legg Mason Partners Funds
125 Broad Street
10th Floor, MF-2
New York, New York 10004
The Funds file their complete schedules of portfolio holdings with the Securities and Exchange Commission for the first and third quarters of each fiscal year on Form N-Q. The Funds’ Forms N-Q are available on the Commission’s website at http://www.sec.gov. The Funds’ Forms N-Q may be reviewed and copied at the Commission’s Public Reference Room in Washington D.C., and how information on the operation of the Public Reference Room may be obtained by calling 800-SEC-0330. To obtain information on Form N-Q from the Funds, shareholders can call Legg Mason Partners Shareholder Services at 1-800-451-2010.
Information on how the Funds voted proxies relating to portfolio securities during the prior 12-month period ended June 30th of each year and a description of the policies and procedures that the Funds use to determine how to vote proxies relating to portfolio transactions is available (1) without charge, upon request, by calling 1-800-451-2010, (2) on the Funds’ website at www.leggmason.com/InvestorServices.com and (3) on the SEC’s website at www.sec.gov.
ITEM 2. CODE OF ETHICS.
The registrant has adopted a code of ethics that applies to the registrant’s principal executive officer, principal financial officer, principal accounting officer or controller.
ITEM 3. AUDIT COMMITTEE FINANCIAL EXPERT.
The Board of Trustees of the registrant has determined that Stephen Randolph Gross, the Chairman of the Board’s Audit Committee, possesses the technical attributes identified in Instruction 2(b) of Item 3 to Form N-CSR to qualify as an “audit committee financial expert,” and has designated Mr. Gross as the Audit Committee’s financial expert. Mr. Gross is an “independent” Trustee pursuant to paragraph (a)(2) of Item 3 to Form N-CSR.
ITEM 4. PRINCIPAL ACCOUNTANT FEES AND SERVICES.
a) Audit Fees. The aggregate fees billed in the last two fiscal years ending October 31, 2005 and October 31, 2006 (the “Reporting Periods”) for professional services rendered by the Registrant’s principal accountant (the “Auditor”) for the audit of the Registrant’s annual financial statements, or services that are normally provided by the Auditor in connection with the statutory and regulatory filings or engagements for the Reporting Periods, were $130,000 in 2005 and $136,000 in 2006.
b) Audit-Related Fees. The aggregate fees billed in the Reporting Periods for assurance and related services by the Auditor that are reasonably related to the performance of the audit of the Registrant’s financial statements and are not reported under paragraph (a) of this Item 4 were $8,000 in 2005 and $0 in 2006. These services consisted of procedures performed in connection with the Review of the Annual Registration Statement filed on Form N-1A of the Legg Mason Partners Investment Series and the Review and Preparation with the Issuance of the 17-F2 Security Count Independent Accountants Reports.
In addition, there were no Audit-Related Fees billed in the Reporting Period for assurance and related services by the Auditor to the Registrant’s investment adviser (not including any sub-adviser whose role is primarily portfolio management and is subcontracted with or overseen by another investment adviser), and any entity controlling, controlled by or under common control with the investment adviser that provides ongoing services to the Legg Mason Partners Investment Series (“service affiliates”), that were reasonably related to the performance of the annual audit of the service affiliates. Accordingly, there were no such fees that required pre-approval by the Audit Committee for the Reporting Periods (prior to May 6, 2003 services provided by the Auditor were not required to be pre-approved).
(c) Tax Fees. The aggregate fees billed in the Reporting Periods for professional services rendered by the Auditor for tax compliance, tax advice and tax planning (“Tax Services”) were $29,600 in 2005 and $0 in 2006. These services consisted of (i) review or preparation of U.S. federal, state, local and excise tax returns; (ii) U.S. federal, state and local tax planning, advice and assistance regarding statutory, regulatory or administrative developments, and (iii) tax advice regarding tax qualification matters and/or treatment of various financial instruments held or proposed to be acquired or held.
There were no fees billed for tax services by the Auditors to service affiliates during the Reporting Periods that required pre-approval by the Audit Committee.
d) All Other Fees. There were no other fees billed in the Reporting Periods for products and services provided by the Auditor, other than the services reported in paragraphs (a) through (c) of this Item 4 on behalf of the Legg Mason Partners Investment Series.
All Other Fees. There were no other non-audit services rendered by the Auditor to Smith Barney Fund Management LLC (“SBFM”), and any entity controlling, controlled by or under common control with SBFM that provided ongoing services to Legg Mason Partners Investment Series requiring pre-approval by the Audit Committee in the Reporting Period.
(e) Audit Committee’s pre–approval policies and procedures described in paragraph (c) (7) of Rule 2-01 of Regulation S-X.
(1) The Charter for the Audit Committee (the “Committee”) of the Board of each registered investment company (the “Fund”) advised by Smith Barney Fund Management LLC or Salomon Brothers Asset Management Inc. or one of their affiliates (each, an “Adviser”) requires that the Committee shall approve (a) all audit and permissible non-audit services to be provided to the Fund and (b) all permissible non-audit services to be provided by the Fund’s independent auditors to the Adviser and any Covered Service Providers if the engagement relates directly to the operations and financial reporting of the Fund. The Committee may implement policies and procedures by which such services are approved other than by the full Committee.
The Committee shall not approve non-audit services that the Committee believes may impair the independence of the auditors. As of the date of the approval of this Audit Committee Charter, permissible non-audit services include any professional services (including tax services), that are not prohibited services as described below, provided to the Fund by the independent auditors, other than those provided to the Fund in connection with an audit or a review of the financial statements of the Fund. Permissible non-audit services may not include: (i) bookkeeping or other services related to the accounting records or financial statements of the Fund; (ii) financial information systems design and implementation; (iii) appraisal or valuation services, fairness opinions or contribution-in-kind reports; (iv) actuarial services; (v) internal audit outsourcing services; (vi) management functions or human resources; (vii) broker or dealer, investment adviser or investment banking services; (viii) legal services and expert services unrelated to the audit; and (ix) any other service the Public Company Accounting Oversight Board determines, by regulation, is impermissible.
Pre-approval by the Committee of any permissible non-audit services is not required so long as: (i) the aggregate amount of all such permissible non-audit services provided to the Fund, the Adviser and any service providers controlling, controlled by or under common control with the Adviser that provide ongoing services to the Fund (“Covered Service Providers”) constitutes not more than 5% of the total amount of revenues paid to the independent auditors during the fiscal year in which the permissible non-audit services are provided to (a) the Fund, (b) the Adviser and (c) any entity controlling, controlled by or under common control with the Adviser that provides ongoing services to the Fund during the fiscal year in which the services are provided that would have to be approved by the Committee; (ii) the permissible non-audit services were not recognized by the Fund at the time of the engagement to be non-audit services; and (iii) such services are promptly brought to the attention of the Committee and approved by the Committee (or its delegate(s)) prior to the completion of the audit.
(2) For the Legg Mason Partners Investment Series, the percentage of fees that were approved by the audit committee, with respect to: Audit-Related Fees were 100% and 0% for 2005 and 2006; Tax Fees were 100% and 0% for 2005 and 2006; and Other Fees were 100% and 0% for 2005 and 2006.
(f) N/A
(g) Non-audit fees billed by the Auditor for services rendered to Legg Mason Partners Investment Series and CAM and any entity controlling, controlled by, or under common control with CAM that provides ongoing services to Legg Mason Partners Investment Series during the reporting period were $0 in 2006 for fees related to the transfer agent matter as fully described in the notes the financial statements titled “additional information” and $75,000 for 2005.
(h) Yes. Legg Mason Partners Investment Series’s Audit Committee has considered whether the provision of non-audit services that were rendered to Service Affiliates which were not pre-approved (not requiring pre-approval) is compatible with maintaining the Accountant’s independence. All services provided by the Auditor to the Legg Mason Partners Investment Series or to Service Affiliates, which were required to be pre-approved, were pre-approved as required.
ITEM 5. AUDIT COMMITTEE OF LISTED REGISTRANTS.
Not applicable.
ITEM 6. SCHEDULE OF INVESTMENTS.
Included herein under Item 1.
ITEM 7. DISCLOSURE OF PROXY VOTING POLICIES AND PROCEDURES FOR CLOSED-END MANAGEMENT INVESTMENT COMPANIES.
Not applicable.
ITEM 8. PORTFOLIO MANAGERS OF CLOSED-END MANAGEMENT INVESTMENT COMPANIES.
Not applicable.
ITEM 9. PURCHASES OF EQUITY SECURITIES BY CLOSED-END MANAGEMENT INVESTMENT COMPANY AND AFFILIATED PURCHASERS.
Not applicable.
ITEM 10. SUBMISSION OF MATTERS TO A VOTE OF SECURITY HOLDERS.
Not applicable.
ITEM 11. CONTROLS AND PROCEDURES.
| | (a) | The registrant’s principal executive officer and principal financial officer have concluded that the registrant’s disclosure controls and procedures (as defined in Rule 30a- 3(c) under the Investment Company Act of 1940, as amended (the “1940 Act”)) are effective as of a date within 90 days of the filing date of this report that includes the disclosure required by this paragraph, based on their evaluation of the disclosure controls and procedures required by Rule 30a-3(b) under the 1940 Act and 15d-15(b) under the Securities Exchange Act of 1934. |
| | (b) | There were no changes in the registrant’s internal control over financial reporting (as defined in Rule 30a-3(d) under the 1940 Act) that occurred during the registrant’s last fiscal half-year (the registrant’s second fiscal half-year in the case of an annual report) that have materially affected, or are likely to materially affect the registrant’s internal control over financial reporting. |
ITEM 12. EXHIBITS.
| | |
| (a)(1) | | Code of Ethics attached hereto. |
| |
| | Exhibit 99.CODE ETH |
| |
| (a)(2) | | Certifications pursuant to section 302 of the Sarbanes-Oxley Act of 2002 attached hereto. |
| |
| | Exhibit 99.CERT |
| |
| (b) | | Certifications pursuant to Section 906 of the Sarbanes-Oxley Act of 2002 attached hereto. |
| |
| | Exhibit 99.906CERT |
SIGNATURES
Pursuant to the requirements of the Securities Exchange Act of 1934 and the Investment Company Act of 1940, the registrant has duly caused this Report to be signed on its behalf by the undersigned, there unto duly authorized.
Legg Mason Partners Investment Series
| | |
By: | | /s/ R. Jay Gerken |
| | R. Jay Gerken |
| | Chief Executive Officer of |
| | Legg Mason Partners Investment Series |
Date: January 8, 2007
Pursuant to the requirements of the Securities Exchange Act of 1934 and the Investment Company Act of 1940, this report has been signed below by the following persons on behalf of the registrant and in the capacities and on the dates indicated.
| | |
By: | | /s/ R. Jay Gerken |
| | R. Jay Gerken |
| | Chief Executive Officer of |
| | Legg Mason Partners Investment Series |
Date: January 8, 2007
| | |
| By: | | /s/ Frances M. Guggino |
| | Frances M. Guggino |
| | Chief Financial Officer of |
| | Legg Mason Partners Investment Series |
Date: January 8, 2007