UNITED STATES
SECURITIES AND EXCHANGE COMMISSION
Washington, D.C. 20549
FORM N-CSR
CERTIFIED SHAREHOLDER REPORT OF REGISTERED MANAGEMENT
INVESTMENT COMPANIES
Investment Company Act file number 811-5018
Smith Barney Investment Series
(Exact name of registrant as specified in charter)
| | |
| 125 Broad Street, New York, NY | | 10004 |
| (Address of principal executive offices) | | (Zip code) |
Robert I. Frenkel, Esq.
Smith Barney Fund Management LLC
300 First Stamford Place
Stamford, CT 06902
(Name and address of agent for service)
Registrant’s telephone number, including area code: (800) 451-2010
Date of fiscal year end: October 31
Date of reporting period: October 31, 2004
| ITEM 1. | REPORT TO STOCKHOLDERS. |
The Annual Report to Stockholders is filed herewith.
SB GROWTH AND INCOME FUND
CLASSIC SERIES | ANNUAL REPORT | OCTOBER 31, 2004

NOT FDIC INSURED • NOT BANK GUARANTEED • MAY LOSE VALUE

MICHAEL KAGAN
PORTFOLIO MANAGER

KEVIN CALIENDO
PORTFOLIO MANAGER
Classic Series

Annual Report • October 31, 2004
SB GROWTH AND INCOME FUND
MICHAEL KAGAN
Michael Kagan has more than 21 years of securities business experience and has been managing the fund since August 14, 2000.
Education: BA in Economics, Harvard University. Attended the Massachusetts Institute of Technology’s Sloan School of Management.
KEVIN CALIENDO
Kevin Caliendo has 10 years of securities business experience.
Education: BA in Journalism from Boston University.
FUND OBJECTIVE
The fund seeks reasonable growth and income. It invests in a portfolio consisting principally of equity securities, including convertible securities, that provide dividend or interest income. However, it may also invest in non-income producing investments for potential appreciation in value.
What’s Inside
LETTER FROM THE CHAIRMAN

R. JAY GERKEN, CFA
Chairman, President and Chief Executive Officer
Dear Shareholder,
Stock prices collectively advanced over the 12 months ending October 31, 2004, although performance varied sharply among sectors and investment styles. The equity market also shifted gears during the period due to investors’ reaction to mixed signals about the economy.
Last fall, stocks continued to rise as many geopolitical concerns began to ease, and a spate of mortgage refinancings freed up investable cash for investors. Despite positive corporate earnings results, stocks traded in a narrow range during the first quarter of this year due to concerns about anemic job growth. During this time, the economy grew at a moderate pace,i albeit at significantly stronger levels than during the first half of 2003.
In the spring, the economic recovery became broader based as labor market growth improved dramatically in March and April, although signs suggested a pickup in inflation in the spring as well. As widely anticipated, the Federal Reserve Board (“Fed”)ii proceeded to push short-term interest rates higher, marking its first hike in four years. The Fed raised its target for the closely watched federal funds rateiii by 0.25% on three occasions during the reporting period, increasing it from a four-decade low of 1.00% in June to 1.75% in September, and then again to 2.00% on November 10th after the fund’s reporting period had ended. Higher rates can help
slow a potential acceleration of economic growth and thereby help maintain a balance between that growth and the inflation that can generally accompany it.
As the period came to a close, inflation figures were benign while labor market growth, which had tapered off during the summer, exceeded consensus estimates for October. Crude oil prices, which had risen to record highs in the third quarter, when coupled with investors’ reaction to terrorism concerns, weakened investor sentiment toward the equity markets. However, reports of a pullback in oil prices and strong third-quarter corporate profits gave stock prices a boost in the final month of the period.
Over the past 12 months, stocks of small- and mid-capitalization companies continued to outperform large-caps in general. Value-oriented stocks handily outpaced growth-oriented stocks. International stock markets beat out the broad domestic U.S. market by a wide margin.
Please read on for a more detailed look at prevailing economic and market conditions during the fund’s fiscal year and to learn how those conditions have affected fund performance.
Information About Your Fund
As you may be aware, several issues in the mutual fund industry have recently come under the scrutiny of federal and state regulators. The fund’s Adviser and some of its affiliates have received requests for information from various government regulators regarding market timing, late trading, fees, and other mutual fund issues in connection with various investigations. The regulators appear to be examining, among other things, the fund’s response to market timing and shareholder exchange activity, including compliance with prospectus disclosure related to these subjects. The fund has been
1 SB Growth and Income Fund | 2004 Annual Report
informed that the Adviser and its affiliates are responding to those information requests, but are not in a position to predict the outcome of these requests and investigations.
In November 2003, Citigroup Asset Management (“CAM”) disclosed an investigation by the Securities and Exchange Commission (“SEC”) and the U.S. Attorney relating to CAM’s entry into the transfer agency business during 1997-1999. Citigroup has disclosed that the Staff of the SEC is considering recommending a civil injunctive action and/or an administrative proceeding against certain advisory and transfer agent entities affiliated with Citigroup, the former CEO of CAM, two former employees and a current employee of CAM, relating to the creation, operation and fees of its internal transfer agent unit that serves various CAM-managed funds. Citigroup is cooperating with the SEC and will seek to resolve this matter in discussion with the SEC Staff. Although there can be no assurance, Citigroup does not believe that this matter will have a material adverse effect on the fund.
As always, thank you for your confidence in our stewardship of your assets. We look forward to helping you continue to meet your financial goals.
Sincerely,
|
|
 |
R. Jay Gerken, CFA Chairman, President and Chief Executive Officer |
November 16, 2004
2 SB Growth and Income Fund | 2004 Annual Report
MANAGER OVERVIEW
Market Overview
U.S. economic growth has settled down to a more sustainable pace of about 3.00%. Job growth and unemployment claims improved steadily during 2004, indicating broad-based strength in the economy. Consumer confidence numbers peaked in July, but the absolute levels remain quite solid. Oil prices spiked to over $55 in late October, before declining to the high $40s in November. Higher heating oil prices could limit retail sales growth in the Northeast this winter, but all in all, the U.S. economy has adjusted well to the significant increase in oil prices this year.
The strongest sectors of the market during the past year were those tied to energy prices, oils and utilities, and those helped by the strong Chinese and solid U.S. economies; the materials and industrials sectors. Defensive stocks such as consumer staples and health care lagged.
The U.S. markets traded in an unusually tight band during 2004. Equity volatility this year was the lowest in 62 years. The positives of strong earnings per share growth and extraordinary free cash flow generation were offset by fears of rising oil prices and interest rates, and uncertainty about the outcome of the U.S. election. The U.S. equity markets are the cheapest that they have ever been on a market value to free cash flow basis. But operating margins are far above normal, and earnings growth is sure to slow in 2005.
Performance Review
For the 12 months ended October 31, 2004, Smith Barney Class A shares of the SB Growth and Income Fund, excluding sales charges, returned 6.82%. These shares underperformed the fund’s unmanaged benchmark, the S&P 500 Index,iv which returned 9.41% for the same period. These shares outperformed the Lipper large-cap core funds category average,1 which was 5.97%.
PERFORMANCE SNAPSHOT
AS OF OCTOBER 31, 2004
(excluding sales charges)
| | | | | | |
| | | 6 Months | | | 12 Months | |
| | | | | | | |
Smith Barney Class A Shares — SB Growth and Income Fund | | 2.10 | % | | 6.82 | % |
| | | | | | | |
S&P 500 Index | | 2.96 | % | | 9.41 | % |
| | | | | | | |
Lipper Large-Cap Core Funds Category Average | | 1.21 | % | | 5.97 | % |
The performance shown represents past performance. Past performance is no guarantee of future results and current performance may be higher or lower than the performance shown above. Principal value and investment returns will fluctuate and investors’ shares, when redeemed, may be worth more or less than their original cost. To obtain performance data current to the most recent month-end, please visit our website at www.smithbarneymutualfunds.com
Performance figures may reflect reimbursements or fee waivers, without which the performance would have been lower.
Smith Barney Class A share returns assume the reinvestment of income dividends and capital gains distributions at net asset value and the deduction of all fund expenses. Returns have not been adjusted to include sales charges that may apply when shares are purchased or the deduction of taxes that a shareholder would pay on fund distributions. Excluding sales charges, Smith Barney Class 1 shares returned 2.24%, Smith Barney Class B shares returned 1.49%, Smith Barney Class C shares returned 1.72%, Smith Barney Class O shares returned 1.93%, Smith Barney Class P shares returned 1.85%, Smith Barney Class Y shares returned 2.38%, Salomon Brothers Class A shares returned 2.11%, Salomon Brothers Class B shares returned 1.71% and Salomon Brothers Class C shares returned 1.73% over the six months ended October 31, 2004. Excluding sales charges, Smith Barney Class 1 shares returned 7.08%, Smith Barney Class B shares returned 5.65%, Smith Barney Class C shares returned 6.23%, Smith Barney Class O shares returned 6.57%, Smith Barney Class P shares returned 6.40%, Smith Barney Class Y shares returned 7.48% and Salomon Brothers Class A shares returned 6.89% over the twelve months ended October 31, 2004. Salomon Brothers Class B shares returned 6.28% and Salomon Brothers Class C shares returned 6.23% since inception on 11/05/03.
Lipper, Inc. is a major independent mutual-fund tracking organization. Returns are based on the period ended October 31, 2004, calculated among the 956 funds for the six-month period and among the 933 funds for the 12-month period in the fund’s Lipper category including the reinvestment of dividends and capital gains, if any, and excluding sales charges.
| 1 | | Lipper, Inc. is a major independent mutual-fund tracking organization. Returns are based on the 12-month period ended October 31, 2004, calculated among the 933 funds in the fund’s Lipper category, including the reinvestment of dividends and capital gains, if any, and excluding sales charges. |
3 SB Growth and Income Fund | 2004 Annual Report
Explanation of Fund Performance
The fund’s underperformance relative to its benchmark can be attributed to weak stock selection in the consumer cyclical, technology and energy sectors. Performance was helped by stock selection in the consumer staples, healthcare and industrial sectors. In particular, performance benefited from holdings in mobile telecommunications service provider AT&T Wireless Services, Inc., manufacturing conglomerate Tyco International Ltd. and aerospace company The Boeing Company. Stocks that detracted from performance included global telecommunications equipment maker Nortel Networks Corporation, a provider of financial and business information IAC/InterActiveCorp. and global communications supplier ADC Telecommunications, Inc.
Thank you for your investment in the SB Growth and Income Fund. As ever, we appreciate that you have chosen us to manage your assets and we remain focused on achieving the fund’s investment goals.
| | |
| Sincerely, | | |

Michael Kagan Portfolio Manager | | 
Kevin Caliendo
Portfolio Manager |
November 16, 2004
The information provided is not intended to be a forecast of future events, a guarantee of future results or investment advice. Views expressed may differ from those of the firm as a whole.
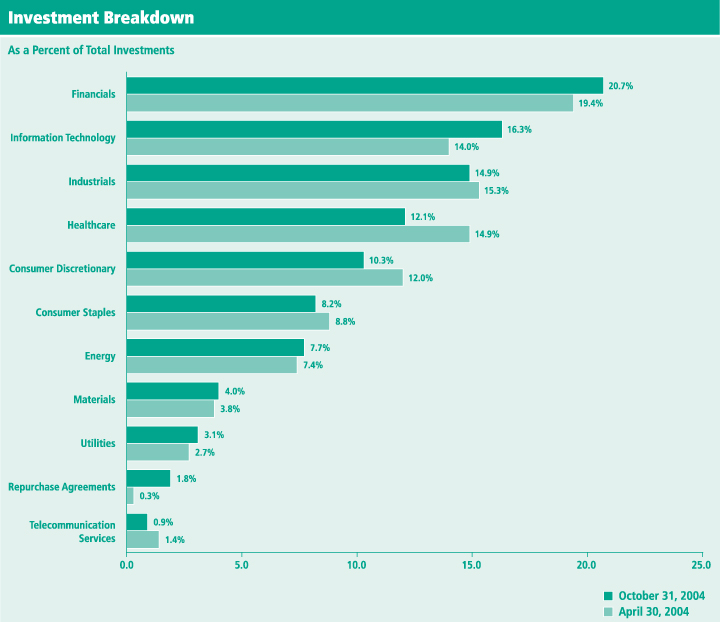
Portfolio holdings and breakdowns are as of October 31, 2004 and are subject to change and may not be representative of the fund’s current or future investments. The fund’s top ten holdings (as a % of net assets) as of this date were: General Electric Co. (4.3%), Microsoft Corp. (3.8%), Bank of America Corp. (3.0%), Pfizer Inc. (2.8%), Exxon Mobil Corp. (2.5%), The Boeing Co. (2.4%), Wells Fargo & Co. (2.3%), JPMorgan Chase & Co. (2.1%), The Procter & Gamble Co. (2.1%), American International Group, Inc. (2.0%). Please refer to pages 10 through 13 for a list and percentage breakdown of the fund’s holdings.
The mention of sector breakdowns is for informational purposes only and should not be construed as a recommendation to purchase or sell any securities. The information provided regarding such sectors is not a sufficient basis upon which to make an investment decision. Investors seeking financial advice regarding the appropriateness of investing in any securities or investment strategies discussed should consult their financial professional. Portfolio holdings are subject to change at any time and may not be representative of the fund’s current or future investments. The fund’s top five sector holdings as of October 31, 2004 (as a % of net assets) were: Financials (20.6%); Information Technology (16.3%); Industrials (14.8%); Healthcare (12.1%); Consumer Discretionary (10.3%). The fund’s portfolio composition is subject to change at any time.
RISKS: The fund is subject to certain risks of overseas investing not typically associated with investing in U.S. securities, including currency fluctuations and changes in political and economic conditions. Lower-rated, higher yielding bonds known as “junk bonds” are subject to greater credit risk, including the risk of default, than higher-rated obligations. The fund may engage in short sales. Losses from short sales may be unlimited. The fund may use derivatives, such as options and futures, which can be illiquid, may disproportionately increase losses, and have a potentially large impact on fund performance.
All index performance reflects no deduction for fees, expenses or taxes. Please note an investor cannot invest directly in an index.
| i | | Source: Commerce Department (Bureau of Economic Analysis). Refers to quarterly growth of Gross Domestic Product (“GDP”). Gross domestic product is a market value of goods and services produced by labor and property in a given country. |
| ii | | Source: U.S. Federal Reserve Board. The Fed is responsible for the formulation of a policy designed to promote economic growth, full employment, stable prices, and a sustainable pattern of international trade and payments. |
| iii | | The federal funds rate is the interest rate that banks with excess reserves at a Federal Reserve district bank charge other banks that need overnight loans. |
| iv | | The S&P 500 Index is a market capitalization-weighted index of 500 widely held common stocks. |
4 SB Growth and Income Fund | 2004 Annual Report
Fund at a Glance (unaudited)
5 SB Growth and Income Fund | 2004 Annual Report
Fund Expenses (unaudited)
Example
As a shareholder of the Fund, you may incur two types of costs: (1) transaction costs, including front-end and back-end sales charges (loads) on purchase payments, reinvested dividends, or other distributions; and (2) ongoing costs, including management fees; distribution and/or service (12b-1) fees; and other Fund expenses. This example is intended to help you understand your ongoing costs (in dollars) of investing in the Fund and to compare these costs with the ongoing costs of investing in other mutual funds.
This example is based on an investment of $1,000 invested on May 1, 2004 and held for the six months ended October 31, 2004.
Actual Expenses
The table below titled “Based on Actual Total Return” provides information about actual account values and actual expenses. You may use the information provided in this table, together with the amount you invested, to estimate the expenses that you paid over the period. To estimate the expenses you paid on your account, divide your ending account value by $1,000 (for example, an $8,600 ending account value divided by $1,000 = 8.6), then multiply the result by the number under the heading entitled “Expenses Paid During the Period”.
Based on Actual Total Return(1)
| | | | | | | | | | | | | | | |
| | | Actual Total
Return Without
Sales Charges(2) | | | Beginning
Account
Value | | Ending
Account
Value | | Annualized
Expense
Ratios | | | Expenses
Paid During
the Period(3) |
Smith Barney Class 1 | | 2.24 | % | | $ | 1,000.00 | | $ | 1,022.40 | | 0.97 | % | | $ | 4.93 |
|
Smith Barney Class A | | 2.10 | | | | 1,000.00 | | | 1,021.00 | | 1.30 | | | | 6.60 |
|
Smith Barney Class B | | 1.49 | | | | 1,000.00 | | | 1,014.90 | | 2.41 | | | | 12.21 |
|
Smith Barney Class C(4) | | 1.72 | | | | 1,000.00 | | | 1,017.20 | | 1.84 | | | | 9.33 |
|
Smith Barney Class O | | 1.93 | | | | 1,000.00 | | | 1,019.30 | | 1.52 | | | | 7.72 |
|
Smith Barney Class P | | 1.85 | | | | 1,000.00 | | | 1,018.50 | | 1.61 | | | | 8.17 |
|
Smith Barney Class Y | | 2.38 | | | | 1,000.00 | | | 1,023.80 | | 0.68 | | | | 3.46 |
|
Salomon Brothers Class A | | 2.11 | | | | 1,000.00 | | | 1,021.10 | | 1.23 | | | | 6.25 |
|
Salomon Brothers Class B | | 1.71 | | | | 1,000.00 | | | 1,017.10 | | 1.95 | | | | 9.89 |
|
Salomon Brothers Class C(5) | | 1.73 | | | | 1,000.00 | | | 1,017.30 | | 1.93 | | | | 9.79 |
|
| (1) | | For the six months ended October 31, 2004. |
| (2) | | Assumes reinvestment of all dividends and capital gain distributions, if any, at net asset value and does not reflect the deduction of the applicable sales charges with respect to Smith Barney Class 1, Smith Barney Class A, Smith Barney Class O and Salomon Brothers Class A shares or the applicable contingent deferred sales charges (“CDSC”) with respect to Smith Barney Class B and Smith Barney Class P shares. Total return is not annualized, as it may not be representative of the total return for the year. Performance figures may reflect fee waivers and/or expense reimbursements. Past performance is no guarantee of future results. In the absence of fee waivers and/or expense reimbursements, the total return would have been lower. |
| (3) | | Expenses (net of voluntary waiver) are equal to the annualized expense ratio multiplied by the average account value over the period, multiplied by the number of days in the most recent fiscal half-year, then divided by 366. |
| (4) | | On April 29, 2004, Class L shares were renamed as Class C shares. |
| (5) | | On April 29, 2004, Salomon Brothers Class 2 shares were renamed as Salomon Brothers Class C shares. |
6 SB Growth and Income Fund | 2004 Annual Report
Fund Expenses (unaudited) (continued)
Hypothetical Example for Comparison Purposes
The table below titled “Based on Hypothetical Total Return” provides information about hypothetical account values and hypothetical expenses based on the actual expense ratio and an assumed rate of return of 5.00% per year before expenses, which is not the Fund’s actual return. The hypothetical account values and expenses may not be used to estimate the actual ending account balance or expenses you paid for the period. You may use the information provided in this table to compare the ongoing costs of investing in the Fund and other funds. To do so, compare the 5.00% hypothetical example relating to the Fund with the 5.00% hypothetical examples that appear in the shareholder reports of the other funds.
Please note that the expenses shown in the table below are meant to highlight your ongoing costs only and do not reflect any transactional costs, such as front-end or back-end sales charges (loads). Therefore, the table is useful in comparing ongoing costs only, and will not help you determine the relative total costs of owning different funds. In addition, if these transaction costs were included, your costs would have been higher.
Based on Hypothetical Total Return(1)
| | | | | | | | | | | | | | | |
| | | Hypothetical
Total Return | | | Beginning
Account
Value | | Ending
Account
Value | | Annualized
Expense
Ratios | | | Expenses
Paid During
the Period(2) |
Smith Barney Class 1 | | 5.00 | % | | $ | 1,000.00 | | $ | 1,020.26 | | 0.97 | % | | $ | 4.93 |
|
Smith Barney Class A | | 5.00 | | | | 1,000.00 | | | 1,018.60 | | 1.30 | | | | 6.60 |
|
Smith Barney Class B | | 5.00 | | | | 1,000.00 | | | 1,013.02 | | 2.41 | | | | 12.19 |
|
Smith Barney Class C(3) | | 5.00 | | | | 1,000.00 | | | 1,015.89 | | 1.84 | | | | 9.32 |
|
Smith Barney Class O | | 5.00 | | | | 1,000.00 | | | 1,017.50 | | 1.52 | | | | 7.71 |
|
Smith Barney Class P | | 5.00 | | | | 1,000.00 | | | 1,017.04 | | 1.61 | | | | 8.16 |
|
Smith Barney Class Y | | 5.00 | | | | 1,000.00 | | | 1,021.72 | | 0.68 | | | | 3.46 |
|
Salomon Brothers Class A | | 5.00 | | | | 1,000.00 | | | 1,018.95 | | 1.23 | | | | 6.24 |
|
Salomon Brothers Class B | | 5.00 | | | | 1,000.00 | | | 1,015.33 | | 1.95 | | | | 9.88 |
|
Salomon Brothers Class C(4) | | 5.00 | | | | 1,000.00 | | | 1,015.43 | | 1.93 | | | | 9.78 |
|
| (1) | | For the six months ended October 31, 2004. |
| (2) | | Expenses (net of voluntary waiver) are equal to each class’ respective annualized expense ratio multiplied by the average account value over the period, multiplied by the number of days in the most recent fiscal half-year, then divided by 366. |
| (3) | | On April 29, 2004, Smith Barney Class L shares were renamed as Smith Barney Class C shares. |
| (4) | | On April 29, 2004, Salomon Brothers Class 2 shares were renamed as Salomon Brothers Class C shares. |
7 SB Growth and Income Fund | 2004 Annual Report
Average Annual Total Returns(1)† (unaudited)
| | | | | | | | | | | | | | | | | | | | | | | | | | | | |
| | | Without Sales Charges(2)
|
| | | Smith
Barney
Class 1 | | | Smith
Barney
Class A | | | Smith
Barney
Class B | | | Smith
Barney
Class C | | | Smith
Barney
Class O | | | Smith
Barney
Class P | | | Smith
Barney
Class Y | | | Salomon
Brothers
Class A | | | Salomon
Brothers
Class B‡ | | Salomon
Brothers
Class C‡ |
Twelve Months Ended 10/31/04 | | 7.08 | % | | 6.82 | % | | 5.65 | % | | 6.23 | % | | 6.57 | % | | 6.40 | % | | 7.48 | % | | 6.89 | % | | N/A | | N/A |
Five Years Ended 10/31/04 | | (2.51 | ) | | (2.81 | ) | | (3.74 | ) | | N/A | | | N/A | | | N/A | | | N/A | | | N/A | | | N/A | | N/A |
Ten Years Ended 10/31/04 | | 8.25 | | | N/A | | | N/A | | | N/A | | | N/A | | | N/A | | | N/A | | | N/A | | | N/A | | N/A |
Inception* through 10/31/04 | | 8.25 | | | 5.75 | | | 4.82 | | | (4.47 | ) | | (3.72 | ) | | (3.68 | ) | | (2.80 | ) | | 9.37 | | | 6.28 | | 6.23 |
| |
| | | With Sales Charges(3)
|
| | | Smith
Barney
Class 1 | | | Smith
Barney
Class A | | | Smith
Barney
Class B | | | Smith
Barney
Class C | | | Smith
Barney
Class O | | | Smith
Barney
Class P | | | Smith
Barney
Class Y | | | Salomon
Brothers
Class A | | | Salomon
Brothers
Class B | | Salomon
Brothers
Class C |
Twelve Months Ended 10/31/04 | | (2.04 | )% | | 1.49 | % | | 0.65 | % | | 5.23 | % | | 5.57 | % | | 1.40 | % | | 7.48 | % | | 0.78 | % | | N/A | | N/A |
Five Years Ended 10/31/04 | | (4.22 | ) | | (3.80 | ) | | (3.89 | ) | | N/A | | | N/A | | | N/A | | | N/A | | | N/A | | | N/A | | N/A |
Ten Years Ended 10/31/04 | | 7.29 | | | N/A | | | N/A | | | N/A | | | N/A | | | N/A | | | N/A | | | N/A | | | N/A | | N/A |
Inception* through 10/31/04 | | 7.71 | | | 5.10 | | | 4.82 | | | (4.47 | ) | | (3.72 | ) | | (4.18 | ) | | (2.80 | ) | | 3.53 | | | 1.28 | | 5.23 |
Cumulative Total Returns† (unaudited)
| | | |
| | | Without Sales Charges(2) | |
Smith Barney Class 1 (10/31/94 through 10/31/04) | | 120.88 | % |
Smith Barney Class A (Inception* through 10/31/04) | | 58.24 | |
Smith Barney Class B (Inception* through 10/31/04) | | 47.17 | |
Smith Barney Class C (Inception* through 10/31/04) | | (16.99 | ) |
Smith Barney Class O (Inception* through 10/31/04) | | (13.72 | ) |
Smith Barney Class P (Inception* through 10/31/04) | | (13.60 | ) |
Smith Barney Class Y (Inception* through 10/31/04) | | (10.48 | ) |
Salomon Brothers Class A (Inception* through 10/31/04) | | 10.15 | |
Salomon Brothers Class B (Inception* through 10/31/04) | | 6.28 | |
Salomon Brothers Class C (Inception* through 10/31/04) | | 6.23 | |
| (1) | | On May 9, 2003 Class 1, A, B, L, O, P and Y shares were renamed as Smith Barney Class 1, Smith Barney Class A, Smith Barney Class B, Smith Barney Class L, Smith Barney Class O, Smith Barney Class P and Smith Barney Class Y shares, respectively. |
| (2) | | Assumes reinvestment of all dividends and capital gain distributions, if any, at net asset value and does not reflect deduction of the applicable sales charges with respect to Smith Barney Class 1, Smith Barney Class A, Smith Barney Class C and Salomon Brothers Class A shares or the applicable contingent deferred sales charges (“CDSC”) with respect to Smith Barney Class B, Smith Barney Class C, Smith Barney Class O and Smith Barney Class P shares. |
| (3) | | Assumes reinvestment of all dividends and capital gain distributions, if any, at net asset value. In addition, Smith Barney Class 1, Smith Barney Class A, Smith Barney Class C, Smith Barney Class O and Salomon Brothers Class A shares reflect the deduction of the maximum sales charges of 8.50%, 5.00%, 1.00%, 1.00%, and 5.75%, respectively. Smith Barney Class B and Smith Barney Class P shares reflect the deduction of a 5.00% CDSC, which applies if shares are redeemed within one year from purchase payment and declines by 1.00% per year until no CDSC is incurred. Smith Barney Class C and Smith Barney Class O shares also reflect the deduction of a 1.00% CDSC, which applies if shares are redeemed within one year from purchase payment. |
| * | | Inception date for Smith Barney Class 1 shares is April 14, 1987. Inception date for Smith Barney Class A and Smith Barney Class B shares is August 18, 1996. Inception date for Smith Barney Class C shares is October 9, 2000. Inception date for Smith Barney Class O, Smith Barney Class P and Smith Barney Class Y shares is December 8, 2000. Inception date for Salomon Brothers Class A shares is October 3, 2003. Inception date for Salomon Brothers Class B and Class C shares is November 5, 2003. |
| † | | All figures represent past performance and are not a guarantee of future results. Investment return and principal value of an investment will fluctuate so that an investor’s shares, when redeemed, may be worth more or less than their original cost. The returns shown do not reflect the deduction of taxes that a shareholder would pay on fund distributions or the redemption of fund shares. Performance figures may reflect fee waivers and/or expense reimbursements. In the absence of fee waivers and/or expense reimbursements, the total return would have been lower. |
| ‡ | | Total return is not annualized, as it may not be representative of the total return for the year. |
8 SB Growth and Income Fund | 2004 Annual Report
Historical Performance (unaudited)
Value of $10,000 Invested in Smith Barney Class 1 Shares of the
SB Growth and Income Fund vs. S&P 500 Index†
October 1994 — October 2004
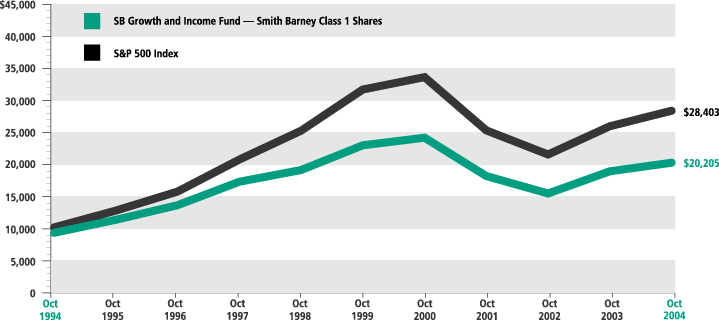
| † | Hypothetical illustration of $10,000 invested in Smith Barney Class 1 shares on October 31, 1994, assuming deduction of the 8.50% maximum sales charge at the time of investment and the reinvestment of dividends and capital gains, if any, at net asset value through October 31, 2004. The S&P 500 Index is an index of widely held common stocks listed on the New York Stock Exchange, American Stock Exchange and over-the-counter markets. Figures for the Index include reinvestment of dividends. The Index is unmanaged and is not subject to the same management and trading expenses of a mutual fund. Please note that an investor cannot invest directly in an index. The performance of the Fund’s other classes may be greater or less than the performance of Smith Barney Class 1 shares’ performance indicated on this chart, depending on whether greater or lesser sales charges and fees were incurred by shareholder investing in other classes. |
| | All figures represent past performance and are not a guarantee of future results. Investment return and principal value of an investment will fluctuate so that an investor’s shares, when redeemed, may be worth more or less than their original cost. The returns shown do not reflect the deduction of taxes that a shareholder would pay on fund distributions or the redemption of fund shares. Performance figures may reflect fee waivers and/or expense reimbursements. In the absence of fee waivers and/or expense reimbursements, the total return would have been lower. |
9 SB Growth and Income Fund | 2004 Annual Report
| | |
| Schedule of Investments | | October 31, 2004 |
| | | | | |
| | |
| SHARES | | SECURITY | | VALUE |
| COMMON STOCK — 97.9% | | | |
| CONSUMER DISCRETIONARY — 10.3% | | | |
| Hotels Restaurants & Leisure — 0.8% | | | |
| 327,000 | | McDonald's Corp. | | $ | 9,532,050 |
|
| Household Durables — 1.0% | | | |
| 510,400 | | Newell Rubbermaid Inc. | | | 11,004,224 |
|
| Leisure Equipment & Products — 1.2% | | | |
| 777,000 | | Mattel, Inc. | | | 13,605,270 |
|
| Media — 4.6% | | | |
| 388,700 | | Comcast Corp., Class A Shares (a) | | | 11,466,650 |
| 131,700 | | Comcast Corp., Special Class A Shares (a) | | | 3,824,568 |
| 955,602 | | Liberty Media Corp., Class A Shares (a) | | | 8,523,970 |
| 57,684 | | Liberty Media International, Inc., Class A Shares (a) | | | 2,079,508 |
| 365,000 | | The News Corp. Ltd., Preferred Shares, ADR (a) | | | 11,475,600 |
| 384,900 | | Viacom Inc., Class B Shares | | | 14,045,001 |
|
| | | | | | 51,415,297 |
|
| Multiline Retail — 0.9% | | | |
| 207,100 | | Costco Wholesale Corp. | | | 9,928,374 |
|
| Specialty Retail — 1.8% | | | |
| 337,000 | | Best Buy Co., Inc. | | | 19,957,140 |
|
| | | TOTAL CONSUMER DISCRETIONARY | | | 115,442,355 |
|
| CONSUMER STAPLES — 8.1% | | | |
| Beverages — 1.9% | | | |
| 433,500 | | PepsiCo, Inc. | | | 21,492,930 |
|
| Food Products — 2.1% | | | |
| 303,100 | | Kellogg Co. | | | 13,033,300 |
| 475,600 | | Sara Lee Corp. | | | 11,071,968 |
|
| | | | | | 24,105,268 |
|
| Household Products — 3.0% | | | |
| 176,800 | | Kimberly-Clark Corp. | | | 10,549,656 |
| 455,100 | | The Procter & Gamble Co. | | | 23,292,018 |
|
| | | | | | 33,841,674 |
|
| Personal Products — 1.1% | | | |
| 279,100 | | The Estee Lauder Cos., Inc., Class A Shares | | | 11,987,345 |
|
| | | TOTAL CONSUMER STAPLES | | | 91,427,217 |
|
| ENERGY — 7.7% | | | |
| Energy Equipment & Services — 1.8% | | | |
| 347,500 | | ENSCO International Inc. | | | 10,616,125 |
| 317,000 | | GlobalSantaFe Corp. | | | 9,351,500 |
|
| | | | | | 19,967,625 |
|
| Oil & Gas — 5.9% | | | |
| 221,400 | | ChevronTexaco Corp. | | | 11,747,484 |
| 569,100 | | Exxon Mobil Corp. | | | 28,011,102 |
See Notes to Financial Statements.
10 SB Growth and Income Fund | 2004 Annual Report
| | |
| Schedule of Investments (continued) | | October 31, 2004 |
| | | | | |
| | |
| SHARES | | SECURITY | | VALUE |
| Oil & Gas — 5.9% (continued) | | | |
| 111,400 | | Nexen Inc. | | $ | 4,741,184 |
| 206,900 | | Total SA, Sponsored ADR (b) | | | 21,575,532 |
|
| | | | | | 66,075,302 |
|
| | | TOTAL ENERGY | | | 86,042,927 |
|
| FINANCIALS — 20.6% | | | |
| Banks — 8.9% | | | |
| 755,154 | | Bank of America Corp. | | | 33,823,348 |
| 287,700 | | The Bank of New York Co., Inc. | | | 9,338,742 |
| 154,600 | | Comerica Inc. | | | 9,509,446 |
| 312,100 | | U.S. Bancorp | | | 8,929,181 |
| 248,800 | | Wachovia Corp. | | | 12,243,448 |
| 440,800 | | Wells Fargo & Co. | | | 26,324,576 |
|
| | | | | | 100,168,741 |
|
| Diversified Financials — 7.8% | | | |
| 284,200 | | American Express Co. | | | 15,082,494 |
| 167,700 | | Freddie Mac | | | 11,168,820 |
| 165,900 | | The Goldman Sachs Group, Inc. | | | 16,321,242 |
| 621,080 | | JPMorgan Chase & Co. | | | 23,973,688 |
| 324,600 | | MBNA Corp. | | | 8,319,498 |
| 238,600 | | Merrill Lynch & Co., Inc. | | | 12,870,084 |
|
| | | | | | 87,735,826 |
|
| Insurance — 3.9% | | | |
| 368,700 | | American International Group, Inc. | | | 22,383,777 |
| 141 | | Berkshire Hathaway Inc., Class A Shares (a) | | | 11,879,250 |
| 129,600 | | The Chubb Corp. | | | 9,348,048 |
|
| | | | | | 43,611,075 |
|
| | | TOTAL FINANCIALS | | | 231,515,642 |
|
| HEALTHCARE — 12.1% | | | |
| Biotechnology — 2.1% | | | |
| 240,704 | | Amgen Inc. (a) | | | 13,671,987 |
| 152,000 | | OSI Pharmaceuticals, Inc. (a)(b) | | | 9,876,960 |
|
| | | | | | 23,548,947 |
|
| Healthcare Equipment & Supplies — 2.4% | | | |
| 195,700 | | Fisher Scientific International (b) | | | 11,225,352 |
| 238,600 | | Guidant Corp. | | | 15,895,532 |
|
| | | | | | 27,120,884 |
|
| Pharmaceuticals — 7.6% | | | |
| 373,500 | | GlaxoSmithKline PLC, Sponsored ADR (b) | | | 15,836,400 |
| 1,067,400 | | Pfizer Inc. | | | 30,901,230 |
| 169,800 | | Sepracor Inc. (a)(b) | | | 7,798,914 |
| 761,700 | | Teva Pharmaceutical Industries Ltd., Sponsored ADR | | | 19,804,200 |
| 263,300 | | Wyeth | | | 10,439,845 |
|
| | | | | | 84,780,589 |
|
| | | TOTAL HEALTHCARE | | | 135,450,420 |
|
See Notes to Financial Statements.
11 SB Growth and Income Fund | 2004 Annual Report
| | |
| Schedule of Investments (continued) | | October 31, 2004 |
| | | | | |
| | |
| SHARES | | SECURITY | | VALUE |
| INDUSTRIALS — 14.8% | | | |
| Aerospace & Defense — 4.3% | | | |
| 532,200 | | The Boeing Co. | | $ | 26,556,780 |
| 151,400 | | Lockheed Martin Corp. | | | 8,340,626 |
| 374,900 | | Raytheon Co. | | | 13,676,352 |
|
| | | | | | 48,573,758 |
|
| Building Products — 1.1% | | | |
| 330,700 | | American Standard Cos. Inc. (a) | | | 12,093,699 |
|
| Commercial Services & Supplies — 2.5% | | | |
| 172,700 | | Avery Dennison Corp. | | | 10,507,068 |
| 361,100 | | Paychex, Inc. | | | 11,841,913 |
| 184,000 | | Waste Management, Inc. | | | 5,240,320 |
|
| | | | | | 27,589,301 |
|
| Industrial Conglomerates — 6.3% | | | |
| 1,411,100 | | General Electric Co. | | | 48,146,732 |
| 306,400 | | Honeywell International Inc. | | | 10,319,552 |
| 403,600 | | Tyco International Ltd. | | | 12,572,140 |
|
| | | | | | 71,038,424 |
|
| Machinery — 0.6% | | | |
| 206,300 | | Navistar International Corp. (a)(b) | | | 7,127,665 |
|
| | | TOTAL INDUSTRIALS | | | 166,422,847 |
|
| INFORMATION TECHNOLOGY — 16.3% | | | |
| Communications Equipment — 4.0% | | | |
| 5,620,700 | | ADC Telecommunications, Inc. (a)(b) | | | 12,421,747 |
| 745,900 | | Cisco Systems, Inc. (a) | | | 14,328,739 |
| 4,295,400 | | Nortel Networks Corp. (a) | | | 14,561,406 |
| 158,800 | | Polycom, Inc. (a) | | | 3,279,220 |
|
| | | | | | 44,591,112 |
|
| Computers & Peripherals — 4.1% | | | |
| 481,600 | | Dell Inc. (a) | | | 16,884,896 |
| 219,800 | | International Business Machines Corp. | | | 19,727,050 |
| 112,900 | | Lexmark International, Inc., Class A Shares (a) | | | 9,383,119 |
|
| | | | | | 45,995,065 |
|
| Semiconductor Equipment & Products — 1.9% | | | |
| 178,300 | | Applied Materials, Inc. (a) | | | 2,870,630 |
| 392,000 | | Intel Corp. | | | 8,725,920 |
| 329,400 | | Xilinx, Inc. | | | 10,079,640 |
|
| | | | | | 21,676,190 |
|
| Software — 6.3% | | | |
| 535,700 | | BMC Software, Inc. (a) | | | 10,135,444 |
| 1,516,600 | | Microsoft Corp. | | | 42,449,634 |
| 630,900 | | Oracle Corp. (a) | | | 7,987,194 |
| 468,600 | | VERITAS Software Corp. (a) | | | 10,252,968 |
|
| | | | | | 70,825,240 |
|
| | | TOTAL INFORMATION TECHNOLOGY | | | 183,087,607 |
|
See Notes to Financial Statements.
12 SB Growth and Income Fund | 2004 Annual Report
| | |
| Schedule of Investments (continued) | | October 31, 2004 |
| | | | | |
| | |
| SHARES | | SECURITY | | VALUE |
| MATERIALS — 4.0% | | | |
| Containers & Packaging — 0.5% | | | |
| 335,500 | | Smurfit-Stone Container Corp. (a) | | $ | 5,824,280 |
|
| Metals & Mining — 2.3% | | | |
| 264,100 | | Alcoa Inc. | | | 8,583,250 |
| 783,700 | | Barrick Gold Corp. | | | 17,641,087 |
|
| | | | | | 26,224,337 |
|
| Paper & Forest Products — 1.2% | | | |
| 342,100 | | International Paper Co. | | | 13,174,271 |
|
| | | TOTAL MATERIALS | | | 45,222,888 |
|
| TELECOMMUNICATION SERVICES — 0.9% | | | |
| Wireless Telecommunication Services — 0.9% | | | |
| 362,900 | | Nextel Communications, Inc., Class A Shares (a) | | | 9,613,221 |
|
| | | TOTAL TELECOMMUNICATION SERVICES | | | 9,613,221 |
|
| UTILITIES — 3.1% | | | |
| Electric Utilities — 0.6% | | | |
| 166,500 | | FirstEnergy Corp. | | | 6,881,445 |
|
| Gas Utilities — 1.2% | | | |
| 1,480,000 | | El Paso Corp. | | | 13,231,200 |
|
| Multi-Utilities — 1.3% | | | |
| 499,200 | | NiSource Inc. | | | 10,707,840 |
| 129,800 | | Sempra Energy | | | 4,353,492 |
|
| | | | | | 15,061,332 |
|
| | | TOTAL UTILITIES | | | 35,173,977 |
|
| | | TOTAL COMMON STOCK
(Cost — $938,603,887) | | | 1,099,399,101 |
|
| REPURCHASE AGREEMENT — 1.8% | | | |
| 20,752,000 | | State Street Bank & Trust Co., 1.700% due 11/1/04; Proceeds at maturity — $20,754,940; (Fully collateralized by U.S. Treasury Bonds, 7.500% due 11/15/16;
Market value — $21,173,581) (Cost — $20,752,000) | | | 20,752,000 |
|
| | | TOTAL INVESTMENTS — 99.7%
(Cost — $959,355,887*) | | | 1,120,151,101 |
| | | Other Assets in Excess of Liabilities — 0.3% | | | 3,294,823 |
|
| | | TOTAL NET ASSETS — 100.0% | | $ | 1,123,445,924 |
|
| LOANED SECURITIES COLLATERAL | | | |
| $32,979,788 | | State Street Navigator Securities Lending Trust Prime Portfolio
(Cost — $32,979,788) | | $ | 32,979,788 |
|
| (a) | | Non-income producing security. |
| (b) | | All or a portion of this security is on loan (See Notes 1 and 3). |
| * | | Aggregate cost for Federal income tax purposes is $964,208,588. |
Abbreviations used in this schedule:
ADR — American Depositary Receipt
See Notes to Financial Statements.
13 SB Growth and Income Fund | 2004 Annual Report
Statement of Assets and LiabilitiesOctober 31, 2004
| | | | |
| ASSETS: | | | | |
Investments, at value (Cost — $959,355,887) | | $ | 1,120,151,101 | |
Loaned securities collateral, at value (Cost — $32,979,788) (Notes 1 and 3) | | | 32,979,788 | |
Cash | | | 585 | |
Dividends and interest receivable | | | 727,154 | |
Receivable for securities sold | | | 12,911,988 | |
Receivable for Fund shares sold | | | 1,503,818 | |
|
|
Total Assets | | | 1,168,274,434 | |
|
|
| LIABILITIES: | | | | |
Payable for loaned securities collateral (Notes 1 and 3) | | | 32,979,788 | |
Payable for securities purchased | | | 9,555,738 | |
Management fee payable | | | 610,542 | |
Payable for Fund shares reacquired | | | 570,363 | |
Trustees’ retirement plan payable (Note 2) | | | 284,970 | |
Service plan fees payable | | | 32,667 | |
Accrued expenses | | | 794,442 | |
|
|
Total Liabilities | | | 44,828,510 | |
|
|
Total Net Assets | | $ | 1,123,445,924 | |
|
|
| NET ASSETS: | | | | |
Par value of shares of beneficial interest ($0.00001 par value, unlimited shares authorized) | | $ | 784 | |
Capital paid in excess of par value | | | 1,139,443,061 | |
Undistributed net investment income | | | 536,107 | |
Accumulated net realized loss from investment transactions and foreign currencies | | | (177,329,242 | ) |
Net unrealized appreciation of investments | | | 160,795,214 | |
|
|
Total Net Assets | | $ | 1,123,445,924 | |
|
|
Shares Outstanding: | | | | |
Smith Barney Class 1 | | | 35,908,662 | |
| |
Smith Barney Class A | | | 19,635,314 | |
| |
Smith Barney Class B | | | 8,305,051 | |
| |
Smith Barney Class C | | | 400,773 | |
| |
Smith Barney Class O | | | 97,943 | |
| |
Smith Barney Class P | | | 945,322 | |
| |
Smith Barney Class Y | | | 13,056,960 | |
| |
Salomon Brothers Class A | | | 3,494 | |
| |
Salomon Brothers Class B | | | 1,114 | |
| |
Salomon Brothers Class C | | | 174 | |
| |
Net Asset Value: | | | | |
Smith Barney Class 1 | | | $14.42 | |
| |
Smith Barney Class A | | | $14.42 | |
| |
Smith Barney Class B | | | $13.64 | |
| |
Smith Barney Class C | | | $14.16 | |
| |
Smith Barney Class O | | | $14.28 | |
| |
Smith Barney Class P | | | $14.30 | |
| |
Smith Barney Class Y | | | $14.45 | |
| |
Salomon Brothers Class A | | | $14.42 | |
| |
Salomon Brothers Class B | | | $13.71 | |
| |
Salomon Brothers Class C | | | $14.15 | |
| |
Maximum Public Offering Price Per Share: | | | | |
Smith Barney Class 1 (based on maximum sales charge of 8.50%) | | | $15.76 | |
| |
Smith Barney Class A (based on maximum sales charge of 5.00%) | | | $15.18 | |
| |
Salomon Brothers Class A (based on maximum sales charge of 5.75%) | | | $15.30 | |
|
|
| * | | Redemption price is NAV of Smith Barney Class B, Smith Barney Class C, Smith Barney Class O, Smith Barney Class P, Salomon Brothers Class B and Salomon Brothers Class C shares reduced by a 5.00%, 1.00%, 1.00%, 5.00%, 5.00% and 1.00% contingent deferred sales charge (“CDSC”), respectively, if shares are redeemed within one year from purchase payment (See Note 2). |
See Notes to Financial Statements.
14 SB Growth and Income Fund | 2004 Annual Report
Statement of Operations For the Year Ended October 31, 2004
| | | | |
| INVESTMENT INCOME: | | | | |
Dividends | | $ | 17,716,199 | |
Interest (Notes 1 and 3) | | | 345,833 | |
Less: Foreign withholding tax | | | (147,315 | ) |
|
|
Total Investment Income | | | 17,914,717 | |
|
|
| EXPENSES: | | | | |
Management fee (Note 2) | | | 7,452,801 | |
Transfer agency services (Notes 2 and 4) | | | 3,305,000 | |
Service plan fees (Notes 2 and 4) | | | 2,112,530 | |
Registration fees | | | 138,510 | |
Audit and legal | | | 119,664 | |
Shareholder communications (Note 4) | | | 112,669 | |
Custody | | | 87,080 | |
Trustees’ fees | | | 40,483 | |
Insurance fees | | | 21,691 | |
Other | | | 14,997 | |
|
|
Total Expenses | | | 13,405,425 | |
Less: Management fee waiver and expense reimbursement (Notes 2 and 8) | | | (88,503 | ) |
|
|
Net Expenses | | | 13,316,922 | |
|
|
Net Investment Income | | | 4,597,795 | |
|
|
REALIZED AND UNREALIZED GAIN (LOSS) ON INVESTMENTS
AND FOREIGN CURRENCIES (NOTES 1 AND 3): | | | | |
Realized Gain From: | | | | |
Investment transactions | | | 52,522,581 | |
Foreign currency transactions | | | 8 | |
|
|
Net Realized Gain | | | 52,522,589 | |
|
|
Net Increase in Unrealized Appreciation | | | 20,430,552 | |
|
|
Net Gain on Investments and Foreign Currencies | | | 72,953,141 | |
|
|
Increase in Net Assets From Operations | | $ | 77,550,936 | |
|
|
See Notes to Financial Statements.
15 SB Growth and Income Fund | 2004 Annual Report
| | |
| Statements of Changes in Net Assets | | For the Years Ended October 31, |
| | | | | | | | |
| | | 2004 | | | 2003 | |
| OPERATIONS: | | | | | | | | |
Net investment income | | $ | 4,597,795 | | | $ | 3,684,397 | |
Net realized gain (loss) | | | 52,522,589 | | | | (109,929,583 | ) |
Net increase in unrealized appreciation | | | 20,430,552 | | | | 318,152,765 | |
|
|
Increase in Net Assets From Operations | | | 77,550,936 | | | | 211,907,579 | |
|
|
| DIVIDENDS TO SHAREHOLDERS FROM (NOTE 5): | | | | | | | | |
Net investment income | | | (4,438,675 | ) | | | (3,166,671 | ) |
|
|
Decrease in Net Assets From Dividends to Shareholders | | | (4,438,675 | ) | | | (3,166,671 | ) |
|
|
| FUND SHARE TRANSACTIONS (NOTE 6): | | | | | | | | |
Net proceeds from sale of shares | | | 126,454,342 | | | | 83,291,446 | |
Net asset value of shares issued for reinvestment of dividends | | | 2,994,814 | | | | 2,102,528 | |
Cost of shares reacquired | | | (214,582,297 | ) | | | (165,271,692 | ) |
|
|
Decrease in Net Assets From Fund Share Transactions | | | (85,133,141 | ) | | | (79,877,718 | ) |
|
|
Increase (Decrease) in Net Assets | | | (12,020,880 | ) | | | 128,863,190 | |
| | |
| NET ASSETS: | | | | | | | | |
Beginning of year | | | 1,135,466,804 | | | | 1,006,603,614 | |
|
|
End of year* | | $ | 1,123,445,924 | | | $ | 1,135,466,804 | |
|
|
* Includes undistributed net investment income of: | | | $536,107 | | | | $459,085 | |
|
|
See Notes to Financial Statements.
16 SB Growth and Income Fund | 2004 Annual Report
Financial Highlights
For a share of each class of beneficial interest outstanding throughout each year ended October 31, unless otherwise noted:
| | | | | | | | | | | | | | | |
| Smith Barney Class 1 Shares(1)(2) | | 2004 | | | 2003 | | | 2002 | | | 2001 | | | 2000 | |
Net Asset Value, Beginning of Year | | $13.53 | | | $11.05 | | | $13.08 | | | $19.03 | | | $21.36 | |
|
|
Income (Loss) From Operations: | | | | | | | | | | | | | | | |
Net investment income | | 0.08 | | | 0.07 | | | 0.05 | | | 0.10 | | | 0.08 | |
Net realized and unrealized gain (loss) | | 0.88 | | | 2.46 | | | (2.02 | ) | | (4.62 | ) | | 1.11 | |
|
|
Total Income (Loss) From Operations | | 0.96 | | | 2.53 | | | (1.97 | ) | | (4.52 | ) | | 1.19 | |
|
|
Less Dividends and Distributions From: | | | | | | | | | | | | | | | |
Net investment income | | (0.07 | ) | | (0.05 | ) | | (0.05 | ) | | (0.06 | ) | | (0.07 | ) |
Net realized gains | | — | | | — | | | — | | | (1.37 | ) | | (3.45 | ) |
Capital | | — | | | — | | | (0.01 | ) | | — | | | — | |
|
|
Total Distributions | | (0.07 | ) | | (0.05 | ) | | (0.06 | ) | | (1.43 | ) | | (3.52 | ) |
|
|
Net Asset Value, End of Year | | $14.42 | | | $13.53 | | | $11.05 | | | $13.08 | | | $19.03 | |
|
|
Total Return(3) | | 7.08 | % | | 22.91 | % | | (15.13 | )% | | (25.18 | )% | | 5.39 | % |
|
|
Net Assets, End of Year (millions) | | $518 | | | $536 | | | $494 | | | $678 | | | $1,017 | |
|
|
Ratios to Average Net Assets: | | | | | | | | | | | | | | | |
Expenses | | 0.96 | %(4) | | 1.00 | % | | 0.99 | % | | 0.73 | % | | 0.85 | % |
Net investment income | | 0.59 | | | 0.56 | | | 0.38 | | | 0.62 | | | 0.43 | |
|
|
Portfolio Turnover Rate | | 42 | % | | 63 | % | | 44 | % | | 69 | % | | 63 | % |
|
|
| | | | | |
| Smith Barney Class A Shares(2)(5) | | 2004 | | | 2003 | | | 2002 | | | 2001 | | | 2000 | |
Net Asset Value, Beginning of Year | | $13.52 | | | $11.06 | | | $13.07 | | | $19.03 | | | $21.35 | |
|
|
Income (Loss) From Operations: | | | | | | | | | | | | | | | |
Net investment income | | 0.04 | | | 0.02 | | | 0.02 | | | 0.03 | | | 0.04 | |
Net realized and unrealized gain (loss) | | 0.88 | | | 2.45 | | | (2.02 | ) | | (4.61 | ) | | 1.11 | |
|
|
Total Income (Loss) From Operations | | 0.92 | | | 2.47 | | | (2.00 | ) | | (4.58 | ) | | 1.15 | |
|
|
Less Dividends and Distributions From: | | | | | | | | | | | | | | | |
Net investment income | | (0.02 | ) | | (0.01 | ) | | (0.00 | )* | | (0.01 | ) | | (0.02 | ) |
Net realized gains | | — | | | — | | | — | | | (1.37 | ) | | (3.45 | ) |
Capital | | — | | | — | | | (0.01 | ) | | — | | | — | |
|
|
Total Dividends and Distributions | | (0.02 | ) | | (0.01 | ) | | (0.01 | ) | | (1.38 | ) | | (3.47 | ) |
|
|
Net Asset Value, End of Year | | $14.42 | | | $13.52 | | | $11.06 | | | $13.07 | | | $19.03 | |
|
|
Total Return(3) | | 6.82 | % | | 22.36 | % | | (15.29 | )% | | (25.51 | )% | | 5.14 | % |
|
|
Net Assets, End of Year (millions) | | $283 | | | $278 | | | $233 | | | $295 | | | $215 | |
|
|
Ratios to Average Net Assets: | | | | | | | | | | | | | | | |
Expenses | | 1.27 | %(4) | | 1.35 | % | | 1.25 | % | | 1.17 | % | | 1.06 | % |
Net investment income | | 0.28 | | | 0.21 | | | 0.12 | | | 0.19 | | | 0.21 | |
|
|
Portfolio Turnover Rate | | 42 | % | | 63 | % | | 44 | % | | 69 | % | | 63 | % |
|
|
| (1) | On May 9, 2003, Class 1 shares were renamed as Smith Barney Class 1 shares. |
| (2) | Per share amounts have been calculated using the monthly average shares method. |
| (3) | Performance figures may reflect fee waivers and/or expense reimbursements. Past performance is no guarantee of future results. In the absence of fee waivers and/or expense reimbursements, the total return would be reduced. |
| (4) | The manager has waived management fees for the Fund’s Smith Barney Class 1 and Smith Barney Class A shares $36,654 and $19,996, respectively, for the period ended October 31, 2004. If such fees were not waived, the actual expense ratios would have been 0.97% and 1.28% for the Fund’s Smith Barney Class 1 and Smith Barney Class A shares, respectively. |
| (5) | On May 9, 2003, Class A shares were renamed as Smith Barney Class A shares. |
| * | Amount represents less than $0.01 per share. |
See Notes to Financial Statements.
17 SB Growth and Income Fund | 2004 Annual Report
Financial Highlights (continued)
For a share of each class of beneficial interest outstanding throughout each year or period ended October 31:
| | | | | | | | | | | | | | | |
| Smith Barney Class B Shares(1)(2) | | 2004 | | | 2003 | | | 2002 | | | 2001 | | | 2000 | |
Net Asset Value, Beginning of Year | | $12.91 | | | $10.66 | | | $12.73 | | | $18.70 | | | $21.16 | |
|
|
Income (Loss) From Operations: | | | | | | | | | | | | | | | |
Net investment loss | | (0.11 | ) | | (0.10 | ) | | (0.11 | ) | | (0.10 | ) | | (0.10 | ) |
Net realized and unrealized gain (loss) | | 0.84 | | | 2.35 | | | (1.96 | ) | | (4.50 | ) | | 1.09 | |
|
|
Total Income (Loss) From Operations | | 0.73 | | | 2.25 | | | (2.07 | ) | | (4.60 | ) | | 0.99 | |
|
|
Less Distributions From: | | | | | | | | | | | | | | | |
Net realized gains | | — | | | — | | | — | | | (1.37 | ) | | (3.45 | ) |
|
|
Total Distributions | | — | | | — | | | — | | | (1.37 | ) | | (3.45 | ) |
|
|
Net Asset Value, End of Year | | $13.64 | | | $12.91 | | | $10.66 | | | $12.73 | | | $18.70 | |
|
|
Total Return(3) | | 5.65 | % | | 21.11 | % | | (16.26 | )% | | (26.10 | )% | | 4.36 | % |
|
|
Net Assets, End of Year (millions) | | $113 | | | $117 | | | $111 | | | $160 | | | $232 | |
|
|
Ratios to Average Net Assets: | | | | | | | | | | | | | | | |
Expenses | | 2.36 | %(4) | | 2.42 | % | | 2.28 | % | | 2.00 | % | | 1.81 | % |
Net investment loss | | (0.81 | ) | | (0.85 | ) | | (0.91 | ) | | (0.65 | ) | | (0.54 | ) |
|
|
Portfolio Turnover Rate | | 42 | % | | 63 | % | | 44 | % | | 69 | % | | 63 | % |
|
|
| | | | | |
| Smith Barney Class C Shares(2)(5) | | 2004 | | | 2003 | | | 2002 | | | 2001 | | | 2000(6) | |
Net Asset Value, Beginning of Period | | $13.33 | | | $10.94 | | | $13.00 | | | $19.04 | | | $18.49 | |
|
|
Income (Loss) From Operations: | | | | | | | | | | | | | | | |
Net investment loss | | (0.04 | ) | | (0.03 | ) | | (0.07 | ) | | (0.08 | ) | | (0.02 | ) |
Net realized and unrealized gain (loss) | | 0.87 | | | 2.42 | | | (1.99 | ) | | (4.59 | ) | | 0.57 | |
|
|
Total Income (Loss) From Operations | | 0.83 | | | 2.39 | | | (2.06 | ) | | (4.67 | ) | | 0.55 | |
|
|
Less Dividends And Distributions From: | | | | | | | | | | | | | | | |
Net investment income | | 0.00 | * | | — | | | — | | | — | | | — | |
Net realized gains | | — | | | — | | | — | | | (1.37 | ) | | — | |
|
|
Total Dividends and Distributions | | 0.00 | | | — | | | — | | | (1.37 | ) | | — | |
|
|
Net Asset Value, End of Period | | $14.16 | | | $13.33 | | | $10.94 | | | $13.00 | | | $19.04 | |
|
|
Total Return(3) | | 6.23 | % | | 21.85 | % | | (15.85 | )% | | (25.99 | )% | | 2.97 | %‡ |
|
|
Net Assets, End of Period (000s) | | $5,675 | | | $5,696 | | | $4,516 | | | $5,774 | | | $205 | |
|
|
Ratios to Average Net Assets: | | | | | | | | | | | | | | | |
Expenses | | 1.82 | %(4) | | 1.80 | % | | 1.89 | % | | 1.85 | % | | 1.71 | %† |
Net investment loss | | (0.27 | ) | | (0.25 | ) | | (0.52 | ) | | (0.49 | ) | | (1.23 | )† |
|
|
Portfolio Turnover Rate | | 42 | % | | 63 | % | | 44 | % | | 69 | % | | 63 | % |
|
|
| (1) | | On May 9, 2003, Class B shares were renamed as Smith Barney Class B shares. |
| (2) | | Per share amounts have been calculated using the monthly average shares method. |
| (3) | | Performance figures may reflect fee waivers and/or expense reimbursements. Past performance is no guarantee of future results. In the absence of fee waivers and/or expense reimbursements, the total return would be lower. |
| (4) | | The manager has waived management fees for the Fund’s Smith Barney Class B and Smith Barney Class C shares $8,065 and $406, respectively, for the period ended October 31, 2004. If such fees were not waived, the actual expense ratios would have been 2.37% and 1.82% for the Fund’s Smith Barney Class B and Smith Barney Class C shares, respectively. |
| (5) | | On May 9, 2003, Class L shares were renamed as Smith Barney Class L shares. On April 29, 2004, Smith Barney Class L shares were renamed as Smith Barney Class C shares. |
| (6) | | For the period October 9, 2000 (inception date) to October 31, 2000. |
| ‡ | | Total return is not annualized, as it may not be representative of the total return for the year. |
| * | | Amount represents less than $0.01 per share. |
See Notes to Financial Statements.
18 SB Growth and Income Fund | 2004 Annual Report
Financial Highlights (continued)
For a share of each class of beneficial interest outstanding throughout each year or period ended October 31:
| | | | | | | | | | | | |
| Smith Barney Class O Shares(1)(2) | | 2004 | | | 2003 | | | 2002 | | | 2001(2)(3) | |
Net Asset Value, Beginning of Period | | $13.40 | | | $10.97 | | | $13.04 | | | $16.55 | |
|
|
Income (Loss) From Operations: | | | | | | | | | | | | |
Net investment income (loss) | | 0.01 | | | 0.01 | | | (0.06 | ) | | (0.03 | ) |
Net realized and unrealized gain (loss) | | 0.87 | | | 2.42 | | | (2.01 | ) | | (3.48 | ) |
|
|
Total Income (Loss) From Operations | | 0.88 | | | 2.43 | | | (2.07 | ) | | (3.51 | ) |
|
|
Net Asset Value, End of Period | | $14.28 | | | $13.40 | | | $10.97 | | | $13.04 | |
|
|
Total Return(4) | | 6.57 | % | | 22.15 | % | | (15.87 | )% | | (21.21 | )%‡ |
|
|
Net Assets, End of Period (000s) | | $1,399 | | | $1,566 | | | $1,595 | | | $2,453 | |
|
|
Ratios to Average Net Assets: | | | | | | | | | | | | |
Expenses | | 1.51 | %(5) | | 1.52 | % | | 1.82 | % | | 1.53 | %† |
Net investment income (loss) | | 0.04 | | | 0.05 | | | (0.45 | ) | | (0.18 | )† |
|
|
Portfolio Turnover Rate | | 42 | % | | 63 | % | | 44 | % | | 69 | % |
|
|
| | | | |
| Smith Barney Class P Shares(2)(6) | | 2004 | | | 2003 | | | 2002 | | | 2001(3) | |
Net Asset Value, Beginning of Period | | $13.44 | | | $11.00 | | | $13.04 | | | $16.55 | |
|
|
Income (Loss) From Operations: | | | | | | | | | | | | |
Net investment income (loss) | | (0.00 | )* | | 0.01 | | | (0.03 | ) | | (0.03 | ) |
Net realized and unrealized gain (loss) | | 0.86 | | | 2.43 | | | (2.01 | ) | | (3.48 | ) |
|
|
Total Income (Loss) From Operations | | 0.86 | | | 2.44 | | | (2.04 | ) | | (3.51 | ) |
|
|
Net Asset Value, End of Period | | $14.30 | | | $13.44 | | | $11.00 | | | $13.04 | |
|
|
Total Return(4) | | 6.40 | % | | 22.18 | % | | (15.64 | )% | | (21.21 | )%‡ |
|
|
Net Assets, End of Period (000s) | | $13,521 | | | $22,993 | | | $26,301 | | | $47,719 | |
|
|
Ratios to Average Net Assets: | | | | | | | | | | | | |
Expenses | | 1.58 | %(5) | | 1.51 | % | | 1.61 | % | | 1.53 | %† |
Net investment income (loss) | | (0.02 | ) | | 0.06 | | | (0.23 | ) | | (0.20 | )† |
|
|
Portfolio Turnover Rate | | 42 | % | | 63 | % | | 44 | % | | 69 | % |
|
|
| (1) | | On May 9, 2003, Class O shares were renamed as Smith Barney Class O shares. |
| (2) | | Per share amounts have been calculated using the monthly average shares method. |
| (3) | | For the period December 8, 2000 (inception date) to October 31, 2001. |
| (4) | | Performance figures may reflect fee waivers and/or expense reimbursements. Past performance is no guarantee of future results. In the absence of fee waivers and/or expense reimbursements, the total return would be lower. |
| (5) | | The manager has waived management fees for the Fund’s Smith Barney Class O and Smith Barney Class P shares $100 and $1,052, respectively, for the period ended October 31, 2004. If such fees were not waived, the actual expense ratios would have been 1.51% and 1.59% for the Fund’s Smith Barney Class O and Smith Barney Class P shares, respectively. |
| (6) | | On May 9, 2003, Class P shares were renamed as Smith Barney Class P shares. |
| * | | Amount represents less than $0.01 per share. |
| ‡ | | Total return is not annualized, as it may not be representative of the total return for the year. |
See Notes to Financial Statements.
19 SB Growth and Income Fund | 2004 Annual Report
Financial Highlights (continued)
For a share of each class of beneficial interest outstanding throughout each year or period ended October 31:
| | | | | | | | | | | | |
| Smith Barney Class Y Shares(1)(2) | | 2004 | | | 2003 | | | 2002 | | | 2001(3) | |
Net Asset Value, Beginning of Period | | $13.55 | | | $11.08 | | | $13.08 | | | $16.55 | |
|
|
Income (Loss) From Operations: | | | | | | | | | | | | |
Net investment income | | 0.12 | | | 0.11 | | | 0.09 | | | 0.10 | |
Net realized and unrealized gain (loss) | | 0.89 | | | 2.44 | | | (2.01 | ) | | (3.51 | ) |
|
|
Total Income (Loss) From Operations | | 1.01 | | | 2.55 | | | (1.92 | ) | | (3.41 | ) |
|
|
Less Dividends and Distributions From: | | | | | | | | | | | | |
Net investment income | | (0.11 | ) | | (0.08 | ) | | (0.07 | ) | | (0.06 | ) |
Capital | | — | | | — | | | (0.01 | ) | | — | |
|
|
Total Dividends and Distributions | | (0.11 | ) | | (0.08 | ) | | (0.08 | ) | | (0.06 | ) |
|
|
Net Asset Value, End of Period | | $14.45 | | | $13.55 | | | $11.08 | | | $13.08 | |
|
|
Total Return(4) | | 7.48 | % | | 23.16 | % | | (14.77 | )% | | (20.65 | )%‡ |
|
|
Net Assets, End of Period (millions) | | $189 | | | $174 | | | $136 | | | $161 | |
|
|
Ratios to Average Net Assets: | | | | | | | | | | | | |
Expenses | | 0.67 | %(5) | | 0.67 | % | | 0.67 | % | | 0.67 | %† |
Net investment income | | 0.87 | | | 0.88 | | | 0.70 | | | 0.68 | † |
|
|
Portfolio Turnover Rate | | 42 | % | | 63 | % | | 44 | % | | 69 | % |
|
|
| (1) | | On May 9, 2003, Class Y shares were renamed as Smith Barney Class Y shares. |
| (2) | | Per share amounts have been calculated using the monthly average shares method. |
| (3) | | For the period December 8, 2000 (inception date) to October 31, 2001. |
| (4) | | Performance figures may reflect fee waivers and/or expense reimbursements. Past performance is no guarantee of future results. In the absence of fee waivers and/or expense reimbursements, the total return would be lower. |
| (5) | | The manager has waived management fees for the Fund’s Smith Barney Class Y shares $12,965 in expenses for the period ended October 31, 2004. If such fees were not waived, the actual expense ratio would have been 0.68% for the Fund’s Smith Barney Class Y shares. |
| ‡ | | Total return is not annualized, as it may not be representative of the total return for the year. |
See Notes to Financial Statements.
20 SB Growth and Income Fund | 2004 Annual Report
Financial Highlights (continued)
For a share of each class of beneficial interest outstanding throughout each year or period ended October 31:
| | | | | | |
| Salomon Brothers Class A Shares(1) | | 2004 | | | 2003(2) | |
Net Asset Value, Beginning of Period | | $13.52 | | | $13.12 | |
|
|
Income (Loss) From Operations: | | | | | | |
Net investment income (loss) | | 0.04 | | | (0.00 | )* |
Net realized and unrealized gain | | 0.89 | | | 0.40 | |
|
|
Total Income From Operations | | 0.93 | | | 0.40 | |
|
|
Less Dividends From: | | | | | | |
Net investment income | | (0.03 | ) | | — | |
|
|
Total Dividends | | (0.03 | ) | | — | |
|
|
Net Asset Value, End of Period | | $14.42 | | | $13.52 | |
|
|
Total Return(4) | | 6.89 | % | | 3.05 | %‡ |
|
|
Net Assets, End of Period (000s) | | $50 | | | $24 | |
|
|
Ratios to Average Net Assets: | | | | | | |
Expenses | | 1.24 | %(3) | | 1.25 | %† |
Net investment income (loss) | | 0.26 | | | (0.21 | )† |
|
|
Portfolio Turnover Rate | | 42 | % | | 63 | % |
|
|
| (1) | | Per share amounts have been calculated using the monthly average shares method. |
| (2) | | For the period October 3, 2003 (inception date) to October 31, 2003. |
| (3) | | The manager has waived management fees and reimbursed the Fund’s Salomon Brothers Class A shares for expenses in the amount of $3,061 for the year ended October 31, 2004. In the absence of such fee waivers and/or expense reimbursements, the actual annualized expense ratio would have been 11.33%. |
| (4) | | Performance figures may reflect fee waivers and/or expense reimbursements. Past performance is no guarantee of future results. In the absence of fee waivers and/or expense reimbursements, the total return would be lower. |
| ‡ | | Total return is not annualized, as it may not be representative of the total return for the year. |
| * | | Amount represents less than $0.01 per share. |
See Notes to Financial Statements.
21 SB Growth and Income Fund | 2004 Annual Report
Financial Highlights (continued)
For a share of each class of beneficial interest outstanding throughout the period ended October 31:
| | | |
| Salomon Brothers Class B Shares(1)(2) | | 2004 | |
Net Asset Value, Beginning of Period | | $12.90 | |
|
|
Income (Loss) From Operations: | | | |
Net investment loss | | (0.05 | ) |
Net realized and unrealized gain | | 0.86 | |
|
|
Total Income From Operations | | 0.81 | |
|
|
Net Asset Value, End of Period | | $13.71 | |
|
|
Total Return(4) | | 6.28 | %‡ |
|
|
Net Assets, End of Period (000s) | | $15 | |
|
|
Ratios to Average Net Assets: | | | |
Expenses(3) | | 1.99 | %† |
Net investment loss | | (0.39 | )† |
|
|
Portfolio Turnover Rate | | 42 | % |
|
|
| |
| Salomon Brothers Class C Shares(1)(2)(5) | | 2004 | |
Net Asset Value, Beginning of Period | | $13.32 | |
|
|
Income (Loss) From Operations: | | | |
Net investment loss | | (0.06 | ) |
Net realized and unrealized gain | | 0.89 | |
|
|
Total Income From Operations | | 0.83 | |
|
|
Net Asset Value, End of Period | | $14.15 | |
|
|
Total Return(4) | | 6.23 | %‡ |
|
|
Net Assets, End of Period (000s) | | $2 | |
|
|
Ratios to Average Net Assets: | | | |
Expenses(3) | | 1.99 | %† |
Net investment loss | | (0.43 | )† |
|
|
Portfolio Turnover Rate | | 42 | % |
|
|
| (1) | | For the period November 5, 2003 (inception date) to October 31, 2004. |
| (2) | | Per share amounts have been calculated using the monthly average shares method. |
| (3) | | The manager has waived management fees and reimbursed the Fund for expenses in the amount of $3,095 and $3,109 for Salomon Brothers Class B and C shares, respectively, for the period ended October 31, 2004. In the absence of such fee waivers and/or expense reimbursements, the actual expense ratios would have been 40.81% and 169.24% for Salomon Brothers Class B shares and Salomon Brothers Class C shares, respectively. |
| (4) | | Performance figures may reflect fee waivers and/or expense reimbursements. Past performance is no guarantee of future results. In the absence of fee waivers and/or expense reimbursements, the total return would be lower. |
| (5) | | On April 29, 2004, Salomon Brothers Class 2 shares were renamed as Salomon Brothers Class C shares. |
| ‡ | | Total return is not annualized, as it may not be representative of the total return for the year. |
See Notes to Financial Statements.
22 SB Growth and Income Fund | 2004 Annual Report
Notes to Financial Statements
| 1. | Organization and Significant Accounting Policies |
SB Growth and Income Fund (“Fund”) is a separate investment fund of Smith Barney Investment Series (“Trust”). The Trust, a Massachusetts business trust, is registered under the Investment Company Act of 1940, as amended (“1940 Act”), as a diversified, open-end management investment company.
The following are significant accounting policies consistently followed by the Fund and are in conformity with U.S. generally accepted accounting principles (“GAAP”). Estimates and assumptions are required to be made regarding assets, liabilities and changes in net assets resulting from operations when financial statements are prepared. Changes in the economic environment, financial markets and any other parameters used in determining these estimates could cause actual results to differ.
(a) Investment Valuation. Securities traded on national securities markets are valued at the closing prices on such markets. Securities primarily traded on foreign exchanges are generally valued at the preceding closing values of such securities on their respective exchanges. Over-the-counter securities are valued on the basis of the mean between the bid and asked price at the close of business on each day. Securities listed on the NASDAQ National Market System for which market quotations are available are valued at the official closing price or, if there is no official closing price on that day, at the last sale price. When market quotations or official closing prices are not readily available, or are determined not to reflect accurately fair value, such as when the value of a security has been significantly affected by events after the close of the exchange or market on which the security is principally traded (for example, a foreign exchange or market), but before the Fund calculates its net asset value, the Fund may value these investments at fair value as determined in accordance with the procedures approved by the Fund’s Board of Trustees. Fair valuing of securities may be determined with the assistance of a pricing service using calculations based on indices of domestic securities and other appropriate indicators, such as prices of relevant ADRs and futures contracts. Short-term securities maturing within 60 days are valued at amortized cost, which approximates value.
(b) Repurchase Agreements. When entering into repurchase agreements, it is the Fund’s policy that a custodian takes possession of the underlying collateral securities, the value of which at least equals the principal amount of the repurchase transaction, including accrued interest. To the extent that any repurchase transaction exceeds one business day, the value of the collateral is marked-to-market to ensure the adequacy of the collateral. If the seller defaults and the value of the collateral declines or if bankruptcy proceedings are commenced with respect to the seller of the security, realization of the collateral by the Fund may be delayed or limited.
(c) Forward Foreign Currency Contracts. A forward foreign currency contract is an agreement between two parties to buy and sell a currency at a set price on a future date. The contract is marked-to-market daily and the change in value is recorded by the Fund as an unrealized gain or loss. When a forward foreign currency contract is extinguished, through either delivery or offset by entering into another forward foreign currency contract, the Fund records a realized gain or loss equal to the difference between the value of the contract at the time it was opened and the value of the contract at the time it was extinguished or offset. The Fund bears the market risk that arises from changes in foreign currency exchange rates and the credit risk should a counterparty fail to meet the terms of such contracts.
(d) Lending of Portfolio Securities. The Fund has an agreement with its custodian whereby the custodian may lend securities owned by the Fund to brokers, dealers and other financial organizations, and receives a lender’s fee. Fees earned by the Fund on securities lending are recorded as interest income. Loans of securities by the Fund are collateralized by cash, U.S. government securities or high quality money market instruments that are maintained at all times in an amount at least equal to the current market value of the loaned securities, plus a margin which may vary depending on the type of securities loaned. The custodian establishes and maintains the collateral in a segregated account. The Fund maintains exposure for the risk of any losses in the investment of amounts received as collateral.
23 SB Growth and Income Fund | 2004 Annual Report
Notes to Financial Statements (continued)
(e) Investment Transactions and Investment Income. Security transactions are accounted for on trade date. Dividend income is recorded on the ex-dividend date and foreign dividend income is recorded on the ex-dividend date or as soon as practical after the Fund determines the existence of a dividend declaration after exercising reasonable due diligence. Gains or losses on the sale of securities are calculated by using the specific identification method.
(f ) Foreign Currency Translation. The books and records of the Fund are maintained in U.S. dollars. Transactions denominated in foreign currencies are recorded at the current prevailing exchange rates. All assets and liabilities denominated in foreign currencies are translated into U.S. dollar amounts at the current exchange rate at the end of the period. Translation gains or losses resulting from changes in the exchange rate during the reporting period and realized gains and losses on the settlement of foreign currency transactions are reported in the results of operations for the current period. The Fund does not isolate that portion of realized gains and losses on investments in securities which are due to changes in the foreign exchange rate from that which is due to changes in market prices of equity securities.
(g) Risks. Investing in securities of foreign companies and foreign governments involves special risks and considerations not typically associated with investing in U.S. companies. These risks include revaluation of currencies and future adverse political and economic developments. Moreover, securities of many foreign companies and foreign governments and their markets may be less liquid and their prices more volatile than those of securities of comparable U.S. companies and the U.S. government.
(h) Dividends and Distributions to Shareholders. Dividends and distributions to shareholders are recorded by the Fund on the ex-dividend date. The Fund distributes dividends, if any, quarterly and capital gains, if any, at least annually. The character of income and gains to be distributed is determined in accordance with income tax regulations which may differ from GAAP.
(i) Class Accounting. Class specific expenses are charged to each class; management fees, general fund expenses, income and gains and/or losses are allocated on the basis of relative net assets of each class or on another reasonable basis.
(j) Federal and Other Taxes. It is the Fund’s policy to comply with the federal income and excise tax requirements of the Internal Revenue Code of 1986, as amended, applicable to regulated investment companies. Accordingly, the Fund intends to distribute substantially all of its taxable income and net realized gains on investments, if any, to shareholders each year. Therefore, no federal income tax provision is required. Under the applicable foreign tax law, a withholding tax may be imposed on interest, dividends, and capital gain at various rates.
(k) Reclassification. U.S. generally accepted accounting principles require that certain components of net assets be adjusted to reflect permanent differences between financial and tax reporting. Accordingly, $82,106 has been reclassified between accumulated net realized loss from investment transactions and undistributed net investment income due to distributions from investments in Real Estate Investment Trusts being reclassified. This reclassification has no effect on net assets or net asset values per share.
24 SB Growth and Income Fund | 2004 Annual Report
Notes to Financial Statements (continued)
| 2. | Management Agreement and Other Transactions |
Smith Barney Fund Management LLC (“SBFM”), an indirect wholly-owned subsidiary of Citigroup Inc. (“Citigroup”) acts as the investment manager to the Fund. The Fund pays SBFM a management fee, which is calculated daily and paid monthly, at an annual rate of the Fund’s average daily net assets as follows:
| | | |
| Average Daily Net Assets | | Annual Rate | |
First $1 billion | | 0.65 | % |
|
|
Next $1 billion | | 0.60 | |
|
|
Next $1 billion | | 0.55 | |
|
|
Next $1 billion | | 0.50 | |
|
|
Over $4 billion | | 0.45 | |
|
|
During the year ended October 31, 2004, SBFM voluntarily waived management fees and reimbursed expenses amounting to $88,503.
Citicorp Trust Bank, fsb. (“CTB”), another subsidiary of Citigroup, acts as the Fund’s transfer agent. PFPC Inc. (“PFPC”) and Primerica Shareholder Services (“PSS”), another subsidiary of Citigroup, act as the Fund’s sub-transfer agents. CTB receives account fees and asset-based fees that vary according to the size and type of account. PFPC and PSS are responsible for shareholder recordkeeping and financial processing for all shareholder accounts and are paid by CTB. For the year ended October 31, 2004, the Fund paid transfer agent fees of $146,381 to CTB.
Citigroup Global Markets Inc. (“CGM”) and PFS Distributors, Inc. (“PFS”), both of which are subsidiaries of Citigroup, act as the Fund’s distributors.
On April 29, 2004, Smith Barney Class L and Salomon Brothers Class 2 shares were renamed as Smith Barney Class C and Salomon Brothers Class C shares, respectively. On February 2, 2004, sales charges on Smith Barney Class C and Salomon Brothers Class C shares were eliminated. On April 29, 2004, sales charges on Smith Barney Class O shares were eliminated.
There are maximum sales charges of 8.50%, 5.00% and 5.75% for Smith Barney Class 1, Smith Barney Class A and Salomon Brothers Class A shares, respectively. There is a contingent deferred sales charge (“CDSC”) of 5.00% on Smith Barney Class B, Smith Barney Class P and Salomon Brothers Class B shares, which applies if redemption occurs within one year from purchase payment and declines thereafter by 1.00% per year until no CDSC is incurred. Smith Barney Class C, Smith Barney Class O and Salomon Brothers Class C shares also have a 1.00% CDSC, which applies if redemption occurs within one year from purchase payment. In certain cases, Smith Barney Class A and Salomon Brothers Class A shares have a 1.00% CDSC, which applies if redemption occurs within one year from purchase payment. This CDSC only applies to those purchases of Smith Barney Class A and Salomon Brothers Class A shares which, when combined with current holdings of Smith Barney Class A and Salomon Brothers Class A shares, respectively, equal or exceed $1,000,000 in the aggregate. These purchases do not incur an initial sales charge.
For the year ended October 31, 2004, CGM and its affiliates received sales charges of approximately $889,000, $949,000 and $5,000 on sales on the Fund’s Smith Barney Class 1, Smith Barney Class A and Smith Barney Class C shares, respectively. In addition, CDSCs paid to CGM and its affiliates for the year ended October 31, 2004 were approximately:
| | | | | | |
| | | Smith Barney Class B | | Smith Barney Class P |
CDSCs | | $ | 234,000 | | $ | 11,000 |
|
25 ��SB Growth and Income Fund | 2004 Annual Report
Notes to Financial Statements (continued)
For the year ended October 31, 2004, CGM and its affiliates received $1,770 in brokerage commissions for the Fund’s portfolio agency transactions.
All officers and one Trustee of the Trust are employees of Citigroup or its affiliates and do not receive compensation from the Trust.
The Trustees of the Funds have adopted a Retirement Plan (“Plan”) for all Trustees who are not “interested persons” of the Fund, within the meaning of the 1940 Act. Under the Plan, all Trustees are required to retire from the Board as of the last day of the calendar year in which the applicable Trustee attains age 75 (certain Trustees who had already attained age 75 when the Plan was adopted were required to retire effective December 31, 2003). Trustees may retire under the Plan before attaining the mandatory retirement age. Trustees who have served as Trustee of the Trust or any of the investment companies associated with Citigroup for at least ten years when they retire are eligible to receive the maximum retirement benefit under the Plan. The maximum retirement benefit is an amount equal to five times the amount of retainer and regular meeting fees payable to a Trustee during the calendar year ending on or immediately prior to the applicable Trustee’s retirement. Amounts under the Plan may be paid in installments or in a lump sum (discounted to present value). Benefits under the Plan are unfunded. Two former Trustees are currently receiving payments under the Plan. In addition, two other Trustees elected to receive a lump sum payment from the Plan during the period.
Certain of the Trustees also are covered by a prior retirement plan. Under the prior plan, retirement benefits are payable for a ten-year period following retirement, with the annual payment to be based upon the Trustee’s compensation from the Trust during calendar year 2000. Trustees with more than five but less than ten years of service at retirement will receive a prorated benefit. In order to receive benefits under the current Plan, a Trustee must waive all rights under the prior plan prior to receiving payment under either plan.
At October 31, 2004, $284,970 is accrued in connection with these plans.
During the year ended October 31, 2004, the aggregate cost of purchases and proceeds from sales of investments (excluding short-term investments) were as follows:
| | | |
|
Purchases | | $ | 482,100,525 |
|
Sales | | | 583,251,554 |
|
At October 31, 2004, the aggregate gross unrealized appreciation and depreciation of investments for Federal income tax purposes were as follows:
| | | | |
|
|
Gross unrealized appreciation | | $ | 183,135,110 | |
Gross unrealized depreciation | | | (27,192,597 | ) |
|
|
Net unrealized appreciation | | $ | 155,942,513 | |
|
|
At October 31, 2004, the Fund loaned securities having a market value of $32,414,896. The Fund received cash collateral amounting to $32,979,788 which was invested in the State Street Navigator Securities Lending Trust Prime Portfolio, a rule 2a-7 money market fund.
Income earned by the Fund from securities lending for the year ended October 31, 2004 was $103,811.
26 SB Growth and Income Fund | 2004 Annual Report
Notes to Financial Statements (continued)
| 4. | Class Specific Expenses |
Pursuant to Rule 12b-1 Service Plans, the Fund pays a distribution/service fee with respect to its Smith Barney Class A, Smith Barney Class B, Smith Barney Class C, Smith Barney Class O, Smith Barney Class P, Salomon Brothers Class A, Salomon Brothers Class B and Salomon Brothers Class C shares calculated at an annual rate not to exceed 0.25%, 1.00%, 1.00%, 0.70%, 0.75%, 0.25%, 1.00% and 1.00% of the average daily net assets of each class, respectively. For the year ended October 31, 2004, total Rule 12b-1 Service Plan fees, which are accrued daily and paid monthly, were as follows:
| | | | | | | | | | | | | | | | |
| | | Smith
Barney
Class A | | Smith
Barney
Class B | | Smith
Barney
Class C | | Smith
Barney
Class O | | Smith
Barney
Class P | | Salomon
Brothers
Class A | | Salomon
Brothers
Class B* | | Salomon
Brothers
Class C* |
Rule 12b-1 Service Plan Fees | | $726,901 | | $1,178,691 | | $60,224 | | $10,658 | | $135,879 | | $76 | | $81 | | $20 |
|
| * | For Salomon Brothers Class B and Salomon Brothers Class C shares, amounts are for the period November 5, 2003 (inception date) to October 31, 2004. |
For the year ended October 31, 2004, total Transfer Agency Service expenses were as follows:
| | | | | | | | | | | | | | | | | | | | |
| | | Smith
Barney
Class 1 | | Smith
Barney
Class A | | Smith
Barney
Class B | | Smith
Barney
Class C | | Smith
Barney
Class O | | Smith
Barney
Class P | | Smith
Barney
Class Y | | Salomon
Brothers
Class A | | Salomon
Brothers
Class B* | | Salomon
Brothers
Class C* |
Transfer Agency
Service Expenses | | $1,503,983 | | $968,417 | | $795,176 | | $8,219 | | $1,922 | | $27,037 | | $196 | | $20 | | $15 | | $15 |
|
| * | For Salomon Brothers Class B and Salomon Brothers Class C shares, amounts are for the period November 5, 2003 (inception date) to October 31, 2004. |
For the year ended October 31, 2004, total Shareholder Communication expenses were as follows:
| | | | | | | | | | | | | | | | | | | | |
| | | Smith
Barney
Class 1 | | Smith
Barney
Class A | | Smith
Barney
Class B | | Smith
Barney
Class C | | Smith
Barney
Class O | | Smith
Barney
Class P | | Smith
Barney
Class Y | | Salomon
Brothers
Class A | | Salomon
Brothers
Class B* | | Salomon
Brothers
Class C* |
Shareholder Communication
Expenses | | $43,302 | | $40,015 | | $17,431 | | $415 | | $122 | | $2,041 | | $9 | | $3,134 | | $3,100 | | $3,100 |
|
| * | For Salomon Brothers Class B and Salomon Brothers Class C shares, amounts are for the period November 5, 2003 (inception date) to October 31, 2004. |
| 5. | Dividends Paid to Shareholders by Class |
| | | | | | |
| | | Year Ended
October 31, 2004 | | Year Ended
October 31, 2003* |
Net Investment Income | | | | | | |
Smith Barney Class 1 | | $ | 2,547,298 | | $ | 1,877,177 |
Smith Barney Class A | | | 450,703 | | | 236,104 |
Smith Barney Class Y | | | 1,440,607 | | | 1,053,390 |
Salomon Brothers Class A | | | 67 | | | — |
|
Total | | $ | 4,438,675 | | $ | 3,166,671 |
|
| * | For Salomon Brothers Class A shares, amount is for the period October 3, 2003 (inception date) to October 31, 2003. |
| 6. | Shares of Beneficial Interest |
The Fund has ten classes of beneficial interest, Smith Barney Class 1, Smith Barney Class A, Smith Barney Class B, Smith Barney Class C, Smith Barney Class O, Smith Barney Class P, Smith Barney Class Y, Salomon Brothers Class A, Salomon Brothers Class B and Salomon Brothers Class C shares, each with a par value of $0.00001 per share. There is an unlimited number of shares authorized. Effective April 29, 2004, the Fund renamed Smith Barney Class L shares as Smith Barney Class C shares and Salomon Brothers Class 2 shares as Salomon Brothers Class C shares.
27 SB Growth and Income Fund | 2004 Annual Report
Notes to Financial Statements (continued)
Transactions in shares of each class were as follows:
| | | | | | | | | | | | | | |
| | | Year Ended October 31, 2004
| | | Year Ended October 31, 2003**
| |
| | | Shares | | | Amount | | | Shares | | | Amount | |
Smith Barney Class 1† | | | | | | | | | | | | | | |
Shares sold | | 1,044,006 | | | $ | 14,924,192 | | | 1,258,123 | | | $ | 14,889,228 | |
Shares issued on reinvestment | | 178,451 | | | | 2,547,297 | | | 158,372 | | | | 1,877,176 | |
Shares reacquired | | (4,938,441 | ) | | | (70,599,270 | ) | | (6,508,330 | ) | | | (75,645,878 | ) |
|
|
Net Decrease | | (3,715,984 | ) | | $ | (53,127,781 | ) | | (5,091,835 | ) | | $ | (58,879,474 | ) |
|
|
Smith Barney Class A† | | | | | | | | | | | | | | |
Shares sold | | 2,940,815 | | | $ | 41,900,698 | | | 3,283,089 | | | $ | 39,175,584 | |
Shares issued on reinvestment | | 30,102 | | | | 430,744 | | | 19,201 | | | | 225,352 | |
Shares reacquired | | (3,921,903 | ) | | | (55,990,984 | ) | | (3,750,095 | ) | | | (43,787,798 | ) |
|
|
Net Decrease | | (950,986 | ) | | $ | (13,659,542 | ) | | (447,805 | ) | | $ | (4,386,862 | ) |
|
|
Smith Barney Class B† | | | | | | | | | | | | | | |
Shares sold | | 967,167 | | | $ | 13,145,626 | | | 1,606,684 | | | $ | 18,270,578 | |
Shares reacquired | | (1,708,716 | ) | | | (23,129,672 | ) | | (2,998,549 | ) | | | (33,804,525 | ) |
|
|
Net Decrease | | (741,549 | ) | | $ | (9,984,046 | ) | | (1,391,865 | ) | | $ | (15,533,947 | ) |
|
|
Smith Barney Class C†‡ | | | | | | | | | | | | | | |
Shares sold | | 49,254 | | | $ | 688,315 | | | 112,187 | | | $ | 1,351,536 | |
Shares reacquired | | (75,689 | ) | | | (1,065,685 | ) | | (97,670 | ) | | | (1,136,849 | ) |
|
|
Net Increase (Decrease) | | (26,435 | ) | | $ | (377,370 | ) | | 14,517 | | | $ | 214,687 | |
|
|
Smith Barney Class O† | | | | | | | | | | | | | | |
Shares sold | | 911 | | | $ | 13,210 | | | 862 | | | $ | 9,949 | |
Shares reacquired | | (19,813 | ) | | | (284,260 | ) | | (29,389 | ) | | | (352,879 | ) |
|
|
Net Decrease | | (18,902 | ) | | $ | (271,050 | ) | | (28,527 | ) | | $ | (342,930 | ) |
|
|
Smith Barney Class P† | | | | | | | | | | | | | | |
Shares sold | | 8,706 | | | $ | 124,408 | | | 16,828 | | | $ | 195,959 | |
Shares reacquired | | (774,610 | ) | | | (10,991,629 | ) | | (697,379 | ) | | | (8,174,198 | ) |
|
|
Net Decrease | | (765,904 | ) | | $ | (10,867,221 | ) | | (680,551 | ) | | $ | (7,978,239 | ) |
|
|
Smith Barney Class Y† | | | | | | | | | | | | | | |
Shares sold | | 3,958,728 | | | $ | 55,615,862 | | | 779,555 | | | $ | 9,375,000 | |
Shares issued on reinvestment | | 1,173 | | | | 16,706 | | | | | | | | |
Shares reacquired | | (3,745,374 | ) | | | (52,520,803 | ) | | (206,647 | ) | | | (2,369,516 | ) |
|
|
Net Increase | | 214,527 | | | $ | 3,111,765 | | | 572,908 | | | $ | 7,005,484 | |
|
|
Salomon Brothers Class A | | | | | | | | | | | | | | |
Shares sold | | 1,694 | | | $ | 24,297 | | | 1,800 | | | $ | 23,612 | |
Shares issued on reinvestment | | 4 | | | | 67 | | | — | | | | — | |
Shares reacquired | | — | | | | — | | | (4 | ) | | | (49 | ) |
|
|
Net Increase | | 1,698 | | | $ | 24,364 | | | 1,796 | | | $ | 23,563 | |
|
|
Salomon Brothers Class B* | | | | | | | | | | | | | | |
Shares sold | | 1,114 | | | $ | 15,250 | | | — | | | | — | |
|
|
Net Increase | | 1,114 | | | $ | 15,250 | | | — | | | | — | |
|
|
Salomon Brothers Class C‡* | | | | | | | | | | | | | | |
Shares sold | | 174 | | | $ | 2,490 | | | — | | | | — | |
|
|
Net Increase | | 174 | | | $ | 2,490 | | | — | | | | — | |
|
|
| * | | For Salomon Brothers Class B and Salomon Brothers Class C shares, transactions are for the period November 5, 2003 (inception date) to October 31, 2004. |
| ** | | For Salomon Brothers Class A shares, transactions are for the period October 3, 2003 (inception date) to October 31, 2003. |
| † | | On May 9, 2003, Class 1, A, B, L, O, P and Y shares were renamed as Smith Barney Class 1, Smith Barney Class A, Smith Barney Class B, Smith Barney Class L, Smith Barney Class O, Smith Barney Class P and Smith Barney Class Y shares, respectively. |
| ‡ | | On April 29, 2004, Smith Barney Class L and Salomon Brothers Class 2 shares were renamed as Smith Barney Class C and Salomon Bothers Class C shares, respectively. |
28 SB Growth and Income Fund | 2004 Annual Report
Notes to Financial Statements (continued)
| 7. | Income Tax Information and Distributions to Shareholders |
The tax character of distributions paid during the fiscal years ended October 31, were as follows:
| | | | | | |
| | | 2004 | | 2003 |
Ordinary income | | $ | 4,438,675 | | $ | 3,166,671 |
|
Net long term capital gains | | | — | | | — |
|
Total distributions paid | | $ | 4,438,675 | | $ | 3,166,671 |
|
As of October 31, 2004, the components of accumulated earnings on a tax basis were as follows:
| | | | |
|
|
Undistributed ordinary income — net | | $ | 536,107 | |
|
|
Capital loss carryforward | | | (172,476,541 | )* |
Unrealized appreciation | | | 155,942,513 | ** |
|
|
Total accumulated losses | | | (15,997,921 | ) |
|
|
| * | | On October 31, 2004, the Fund had a net capital loss carryforward of $172,476,541, of which $61,995,062 expires in 2010 and $110,481,479 expires in 2011. This amount will be available to offset like amounts of any future taxable gains. |
| ** | | The difference between book-basis and tax-basis unrealized appreciation is attributable primarily to the tax deferral of losses on wash sales. |
In connection with an investigation previously disclosed by Citigroup, the Staff of the Securities and Exchange Commission (“SEC”) has notified Citigroup Asset Management (“CAM”), the Citigroup business unit that includes the Fund’s investment manager and other investment advisory companies; Citicorp Trust Bank (“CTB”), an affiliate of CAM; Thomas W. Jones, the former CEO of CAM; and three other individuals, one of whom is an employee and the other two of whom are former employees of CAM, that the SEC Staff is considering recommending a civil injunctive action and/or an administrative proceeding against each of them relating to the creation and operation of an internal transfer agent unit to serve various CAM-managed funds.
In 1999, CTB entered the transfer agent business. CTB hired an unaffiliated subcontractor to perform some of the transfer agent services. The subcontractor, in exchange, had signed a separate agreement with CAM in 1998 that guaranteed investment management revenue to CAM and investment banking revenue to a CAM affiliate. The subcontractor’s business was later taken over by PFPC Inc., and at that time the revenue guarantee was eliminated and a one-time payment was made by the subcontractor to a CAM affiliate.
CAM did not disclose the revenue guarantee when the boards of various CAM managed funds hired CTB as transfer agent. Nor did CAM disclose to the boards of the various CAM-managed funds the one-time payment received by the CAM affiliate when it was made.
In addition, the SEC Staff has indicated that it is considering recommending action based on the adequacy of the disclosures made to the fund boards that approved the transfer agency arrangement, CAM’s initiation and operation of, and compensation for, the transfer agent business and CAM’s retention of, and agreements with, the subcontractor.
Citigroup is cooperating fully in the investigation and will seek to resolve the matter in discussions with the SEC Staff. Although there can be no assurance, Citigroup does not believe that this matter will have a material adverse effect on the Fund. As previously disclosed, CAM has already agreed to pay the applicable funds, primarily through fee waivers, a total of approximately $17 million (plus interest) that is the amount of the revenue received by Citigroup relating to the revenue guarantee.
29 SB Growth and Income Fund | 2004 Annual Report
Notes to Financial Statements (continued)
Beginning in June 2004, class action lawsuits alleging violations of the federal securities laws were filed against Citigroup Global Markets Inc. (the “Distributor”) and a number of its affiliates, including Smith Barney Fund Management LLC and Salomon Brothers Asset Management Inc (the “Advisers”), substantially all of the mutual funds managed by the Advisers, including the Fund (the “Funds”), and directors or trustees of the Funds (collectively, the “Defendants”). The complaints alleged, among other things, that the Distributor created various undisclosed incentives for its brokers to sell Smith Barney and Salomon Brothers funds. In addition, according to the complaints, the Advisers caused the Funds to pay excessive brokerage commissions to the Distributor for steering clients towards proprietary funds. The complaints also alleged that the defendants breached their fiduciary duty to the Funds by improperly charging Rule 12b-1 fees and by drawing on fund assets to make undisclosed payments of soft dollars and excessive brokerage commissions. The complaints also alleged that the Funds failed to adequately disclose certain of the allegedly wrongful conduct. The complaints sought injunctive relief and compensatory and punitive damages, rescission of the Funds’ contracts with the Advisers, recovery of all fees paid to the Advisers pursuant to such contracts and an award of attorneys’ fees and litigation expenses.
On December 15, 2004, a consolidated amended complaint (the “Complaint”) was filed alleging substantially similar causes of action. While the lawsuit is in its earliest stages, to the extent that the Complaint purports to state causes of action against the Funds, Citigroup Asset Management believes the Funds have significant defenses to such allegations, which the Funds intend to vigorously assert in responding to the Complaint.
Additional lawsuits arising out of these circumstances and presenting similar allegations and requests for relief may be filed against the Defendants in the future.
As of the date of this report, Citigroup Asset Management and the Funds believe that the resolution of the pending lawsuit will not have a material effect on the financial position or results of operations of the Funds or the ability of the Advisers and their affiliates to continue to render services to the Funds under their respective contracts.
30 SB Growth and Income Fund | 2004 Annual Report
Report of Independent Registered Public Accounting Firm
The Shareholders and Board of Trustees
of Smith Barney Investment Series:
We have audited the accompanying statement of assets and liabilities, including the schedule of investments, of SB Growth and Income Fund of Smith Barney Investment Series (“Fund”) as of October 31, 2004, and the related statement of operations for the year then ended, the statements of changes in net assets for each of the years in the two-year period then ended and the financial highlights for each of the years in the five-year period then ended. These financial statements and financial highlights are the responsibility of the Fund’s management. Our responsibility is to express an opinion on these financial statements and financial highlights based on our audits.
We conducted our audits in accordance with the standards of the Public Company Accounting Oversight Board (United States). Those standards require that we plan and perform the audit to obtain reasonable assurance about whether the financial statements and financial highlights are free of material misstatement. An audit includes examining, on a test basis, evidence supporting the amounts and disclosures in the financial statements. Our procedures included confirmation of securities owned as of October 31, 2004 by correspondence with the custodian and brokers or by other appropriate auditing procedures where replies from brokers were not received. An audit also includes assessing the accounting principles used and significant estimates made by management, as well as evaluating the overall financial statement presentation. We believe that our audits provide a reasonable basis for our opinion.
In our opinion, the financial statements and financial highlights referred to above present fairly, in all material respects, the financial position of the Fund as of October 31, 2004, and the results of its operations for the year then ended, the changes in its net assets for each of the years in the two-year period then ended and the financial highlights for each of the years in the five-year period then ended, in conformity with U.S. generally accepted accounting principles.

New York, New York
December 17, 2004
31 SB Growth and Income Fund | 2004 Annual Report
Additional Information (unaudited)
Information about Trustees and Officers
The business and affairs of SB Growth and Income Fund, formerly known as Smith Barney Growth and Income Fund (“Fund”) are managed under the direction of the Fund’s Board of Trustees. Information pertaining to the Trustees and Officers of the Fund is set forth below. Each Trustee and officer holds office for his or her lifetime unless that individual resigns, retires or is otherwise removed. The Statement of Additional Information includes additional information about Fund’s Trustees and is available, without charge, upon request by calling Citicorp Trust Bank, fsb. at 1-800-451-2010 or the Fund’s sub-transfer agents (PFPC at 1-800-451-2010 and Primerica Shareholder Services at 1-800-544-5445).
| | | | | | | | | | |
| Name, Address and Age | | Position(s)
Held with
Fund | | Term of Office* and Length
of Time
Served | | Principal Occupation(s) During Past Five Years | | Number of
Portfolios in Fund
Complex
Overseen by
Trustee | | Other Board Memberships Held by Trustees During Past Five Years |
Non-Interested Trustees: | | | | | | | | |
| | | | | |
Elliott J. Berv c/o R. Jay Gerken, CFA Citigroup Asset Management (“CAM”) 399 Park Avenue New York, NY 10022 DOB: 4/30/43 | | Trustee | | Since 2001 | | Executive Vice President and Chief Operations Officer, DigiGym Systems (On-line Personal Training Systems) (since 2001); Chief Executive Officer, Rocket City Enterprises (Internet Service Company) (from 2000 to 2001); President, Catalyst (Consulting) (since 1984) | | 36 | | Board Member, American Identity Corp. (doing business as Morpheus Technologies) (Biometric information management) (since 2001; Consultant since 1999); Director, Lapoint Industries (Industrial Filter Company) (since 2002); Director. Alzheimer’s Association (New England Chapter) (since 1998) |
| | | | | |
Donald M. Carlton c/o R. Jay Gerken, CFA CAM 399 Park Avenue New York, NY 10022 DOB: 7/20/37 | | Trustee | | Since 1997 | | Consultant, URS Corporation (Engineering) (since 1999); former Chief Executive Officer, Radian International L.L.C. (Engineering) (from 1996 to 1998), Member of Management Committee, Signature Science (Research and Development) (since 2000) | | 31 | | Director, American Electric Power Co. (Electric Utility) (since 1999); Director, Valero Energy (Petroleum Refining) (since 1999); Director, National Instruments Corp. (Technology) (since 1994) |
| | | | | |
A. Benton Cocanougher c/o R. Jay Gerken, CFA CAM 399 Park Avenue New York, NY 10022 DOB: 7/6/38 | | Trustee | | Since 1991 | | Dean Emeritus and Wiley Professor, Texas A&M University (since 2001); former Dean and Professor of Marketing, College and Graduate School of Business of Texas A&M University (from 1987 to 2001) | | 31 | | None |
32 SB Growth and Income Fund | 2004 Annual Report
Additional Information (unaudited) (continued)
| | | | | | | | | | |
| Name, Address and Age | | Position(s)
Held with
Fund | | Term of Office* and Length
of Time
Served | | Principal Occupation(s) During Past Five Years | | Number of
Portfolios in Fund
Complex
Overseen by
Trustee | | Other Board Memberships Held by Trustees During Past Five Years |
| | | | | |
Mark T. Finn
c/o R. Jay Gerken, CFA CAM 399 Park Avenue New York, NY 10022 DOB: 5/16/43 | | Trustee | | Since 2001 | | Adjunct Professor, William & Mary College (since September 2002); Principal/Member, Belvan Partners/Balfour Vantage–Manager and General Partner to the Vantage Hedge Fund, LP (since March 2002); Chairman and Owner, Vantage Consulting Group, Inc. (Investment Advisory and Consulting Firm) (since 1988); former Vice Chairman and Chief Operating Officer, Lindner Asset Management Company (Mutual Fund Company) (from March 1999 to 2001); former General Partner and Shareholder, Greenwich Ventures, LLC (Investment Partnership) (from 1996 to 2001); former President, Secretary, and Owner, Phoenix Trading Co. (Commodity Trading Advisory Firm) (from 1997 to 2000) | | 36 | | Former President and Director, Delta Financial, Inc. (Investment Advisory Firm) (from 1983 to 1999) |
| | | | | |
Stephen Randolph Gross
c/o R. Jay Gerken, CFA CAM 399 Park Avenue New York, NY 10022 DOB: 10/8/47 | | Trustee | | Since 1986 | | Chief Executive Officer, HLB Gross Collins, P.C. (accounting firm) (since 1979); Partner, Capital Investment Advisory Partners (Consulting) (2000-2002); former Chief Operating Officer, General Media Communications, Inc. (from March 2003 to August 2003) Managing Director, Fountainhead Ventures, LLC (Consulting) (from 1998 to 2003); Secretary, Carint N.A. (Manufacturing) (since 1988); former Treasurer, Hank Aaron Enterprises (Fast Food Franchise) (from 1985 to 2001); Treasurer, Coventry Limited, Inc. (since 1985) | | 31 | | Director, United Telesis, Inc. (Telecommunications) (since 1997); Director, eBank.com, Inc. (1997-2004); Director, Andersen Calhoun, Inc. (Assisted Living) (since 1987); former Director, Charter Bank, Inc, Inc. (from 1987 to 1997); former Director, Yu Save, Inc. (Internet Company) (from 1998 to 2000); former Director, Hotpalm.com, Inc. (Wireless Applications) (from 1998 to 2000); former Director, Ikon Ventures, Inc. (from 1997 to 1998) |
| | | | | |
Diana R. Harrington c/o R. Jay Gerken, CFA CAM 399 Park Avenue New York, NY 10022 DOB: 3/25/40 | | Trustee | | Since 2001 | | Professor, Babson College (since 1993) | | 36 | | Former Trustee, The Highland Family of Funds (Investment Company) (from 1997 to 1998) |
| | | | | |
Susan B. Kerley c/o R. Jay Gerken, CFA CAM 399 Park Avenue New York, NY 10022 DOB: 8/12/51 | | Trustee | | Since 2001 | | Consultant, Strategic Management Advisors, LLC Global Research Associates, Inc. (Investment Consulting) (since 1990) | | 36 | | Director, Eclipse Funds (currently supervises 17 investment companies in fund complex) (since 1990) |
33 SB Growth and Income Fund | 2004 Annual Report
Additional Information (unaudited) (continued)
| | | | | | | | | | |
| Name, Address and Age | | Position(s)
Held with
Fund | | Term of Office* and Length
of Time
Served | | Principal Occupation(s) During Past Five Years | | Number of
Portfolios in Fund
Complex
Overseen by
Trustee | | Other Board Memberships Held by Trustees During Past Five Years |
| | | | | |
Alan G. Merten c/o R. Jay Gerken, CFA CAM 399 Park Avenue New York, NY 10022 DOB: 12/27/41 | | Trustee | | Since 1990 | | President, George Mason University (since 1996) | | 31 | | Director, DigitalNet Holdings, Inc. (since October 2003); Director, Comshare, Inc. (Information Technology) (since 1985); former Director, Indus (Information Technology) (from 1995 to 1999) |
| | | | | |
R. Richardson Pettit c/o R. Jay Gerken, CFA CAM 399 Park Avenue New York, NY 10022 DOB: 7/6/42 | | Trustee | | Since 1990 | | Professor of Finance, University of Houston (from 1977 to 2002); Independent Consultant (since 1984) | | 31 | | None |
| | | | |
Interested Trustee: | | | | | | | | |
| | | | | |
R. Jay Gerken, CFA ** CAM 399 Park Avenue New York, NY 10022
DOB: 4/5/51 | | Chairman, President and Chief Executive Officer | | Since 2002 | | Managing Director of Citigroup Global Markets Inc. (“CGM”) Chairman, President and Chief Executive Officer of Smith Barney Fund Management, LLC (“SBFM”), Travelers Investment Adviser, Inc. (“TIA”) and Citi Fund Management Inc. (“CFM”); President and Chief Executive Officer of certain mutual funds associated with Citigroup Inc. (“Citigroup”); Formerly Portfolio Manager of Smith Barney Allocation Series Inc. (from 1996-2001) and Smith Barney Growth and Income Fund (from 1996-2000) | | 221 | | N/A |
Officers: | | | | | | | | | | |
| | | | | |
Andrew B. Shoup CAM 125 Broad Street 10th Floor New York, NY 10004 DOB: 8/1/56 | | Senior Vice President and Chief Administrative Officer | | Since
2003 | | Director of CAM; Senior Vice President and Chief Administrative Officer of mutual funds associated with Citigroup; Head of International Funds Administration of CAM (from 2001 to 2003); Director of Global Funds Administration of CAM (from 2000 to 2001); Head of U.S. Citibank Funds Administration of CAM (from 1998 to 2000) | | N/A | | N/A |
| | | | | |
Frances M. Guggino CAM 125 Broad Street, 10th Floor New York, NY 10004 DOB: 9/8/57 | | Chief Financial Officer and Treasurer | | Since
2004 | | Vice President of CAM; Chief Financial Officer and Treasurer of certain mutual funds associated with Citigroup; Formerly Controller of certain mutual Funds associated with Citigroup | | N/A | | N/A |
34 SB Growth and Income Fund | 2004 Annual Report
| | |
| Additional Information (unaudited) (continued) | | |
| | | | | | | | | | |
| Name, Address and Age | | Position(s)
Held with
Fund | | Term of Office* and Length
of Time
Served | | Principal Occupation(s) During Past Five Years | | Number of
Portfolios in Fund
Complex
Overseen by
Trustee | | Other Board Memberships Held by Trustees During Past Five Years |
| | | | | |
Andrew Beagley CAM 399 Park Avenue, 4th Floor New York, NY 10022 DOB: 10/9/62 | | Chief Anti-Money Laundering Compliance Officer Chief Compliance Officer | | Since
2002 Since 2004 | | Director of CGM (since 2000); Director of Compliance, North America, CAM (since 2000); Chief Anti-Money Laundering Compliance Officer, Chief Compliance Officer and Vice President of certain mutual funds associated with Citigroup; Director of Compliance, Europe, the Middle East and Africa, CAM (from 1999 to 2000); Compliance Officer, SBFM, CFM, TIA, Salomon Brothers Asset Management Limited, Smith Barney Global Capital Management Inc., Salomon Brothers Asset Management Asia Pacific Limited (from 1997 to 1999) | | N/A | | N/A |
| | | | | |
Kevin Caliendo CAM 399 Park Avenue, 4th Floor New York, NY 10004 DOB: 3/6/70 | | Vice President and Investment Officer | | Since
2003 | | Director of CGM (since 2002); Investment Officer of SBAM (since 2002); Healthcare Equity Analyst and Convertible Bond Fund Portfolio Manager for SAC Capital Advisors, LLC (from 2001 to 2002); Convertible Bond Analyst of the Healthcare sector for Wachovia Securities (from 1998 to 2001) | | N/A | | N/A |
| | | | | |
Michael Kagan CAM 399 Park Avenue New York, NY 10022 DOB: 7/3/60 | | Vice President and Investment Officer | | Since
2000 | | Managing Director of CGM | | N/A | | N/A |
| | | | | |
Wendy S. Setnicka CAM 125 Broad Street 10th Floor New York, NY 10004 DOB: 10/26/65 | | Controller | | Since
2004 | | Vice President of CGM; Controller of certain funds associated with Citigroup; Assistant Controller of CAM | | N/A | | N/A |
| | | | | |
Robert I. Frenkel CAM 300 First Stamford Place 4th Floor Stamford, CT 06902 DOB: 12/12/54 | | Secretary Chief Legal Officer | | Since
2000 Since
2003 | | Managing Director and General Counsel, Global Mutual Funds for CAM and its predecessor (since 1994); Secretary and Chief Legal Officer of mutual funds associated with Citigroup | | N/A | | N/A |
| | * | | Each Trustee and officer serves until his or her successor has been duly elected and qualified. |
| | ** | | Mr. Gerken is an “interested person” of the Funds as defined in the Investment Company Act of 1940, as amended, because Mr. Gerken is an officer of SBFM and certain of its affiliates. |
35 SB Growth and Income Fund | 2004 Annual Report
| | |
| Important Tax Information (unaudited) | | |
The following information is provided with respect to the distributions paid during the taxable year ended October 31, 2004:
| | | |
Record Date: | | Quarterly | |
Payable Date: | | Quarterly | |
|
|
Qualified Dividend Income for Individuals | | 100.00 | % |
|
|
Dividends Qualifying for the Dividends Received Deduction for Corporations | | 100.00 | % |
|
|
Interest from Federal Obligations | | — | |
|
|
Foreign Source Income | | — | |
|
|
Foreign Taxes Paid Per Share | | — | |
|
|
Please retain this information for your records.
36 SB Growth and Income Fund | 2004 Annual Report
SB
GROWTH AND INCOME FUND
| | |
TRUSTEES Elliott J. Berv Donald M. Carlton A. Benton Cocanougher Mark T. Finn R. Jay Gerken, CFA
Chairman Stephen Randolph Gross Diana R. Harrington Susan B. Kerley Alan G. Merten R. Richardson Pettit OFFICERS R. Jay Gerken, CFA President and Chief
Executive Officer Andrew B. Shoup Senior Vice President and Chief Administrative Officer Frances M. Guggino Chief Financial Officer and Treasurer Kevin Caliendo Vice President and Investment Officer Michael Kagan Vice President and Investment Officer Andrew Beagley Chief Anti-Money Laundering Compliance Officer and Chief Compliance Officer | | OFFICERS (cont’d.) Wendy S. Setnicka Controller Robert I. Frenkel Secretary and Chief Legal Officer INVESTMENT MANAGER Smith Barney Fund Management LLC DISTRIBUTORS Citigroup Global Markets Inc. PFS Distributors, Inc. CUSTODIAN State Street Bank and
Trust Company TRANSFER AGENT Citicorp Trust Bank, fsb. 125 Broad Street, 11th Floor New York, New York 10004 SUB-TRANSFER AGENTS PFPC Inc. P.O. Box 9699 Providence, Rhode Island 02940-9699 Primerica Shareholder Services P.O. Box 9662 Providence, Rhode Island 02940-9662 |
Smith Barney Investment Series
SB Growth and Income Fund
The Fund is a separate investment fund of the Smith Barney Investment Series, a Massachusetts business trust.
The Fund files its complete schedule of portfolio holdings with Securities Exchange Commission for the first and third quarters of each fiscal year on Form N-Q. The Fund’s Forms N-Q are available on the Commission’s website at www.sec.gov. The Fund’s Forms N-Q may be reviewed and copied at the Commission’s Public Reference Room in Washington D.C., and information on the operation of the Public Reference Room may be obtained by calling 1-800-SEC-0330. To obtain information on Form N-Q from the Fund, shareholders can call 1-800-451-2010.
Information on how the fund voted proxies relating to portfolio securities during the 12 month period ended June 30, 2004 and a description of the policies and procedures that the fund uses to determine how to vote proxies relating to portfolio securities is available (1) without charge, upon request, by calling 1-800-451-2010, (2) on the fund’s website at www.citigroupAM.com and (3) on the SEC’s website at www.sec.gov.
This report is submitted for the general information of the shareholders of Smith Barney Investment Series — SB Growth and Income Fund. It is not authorized for distribution to prospective investors unless accompanied or preceded by a current Prospectus.
SB GROWTH AND INCOME FUND
Smith Barney Mutual Funds
3120 Breckinridge Boulevard
Duluth, Georgia 30099-0001
This document must be preceded or accompanied by a free prospectus. Investors should consider the fund’s investment objectives, risks, charges and expenses carefully before investing. The prospectus contains this and other important information about the fund. Please read the prospectus carefully before you invest or send money.
www.smithbarneymutualfunds.com
©2004 Citigroup Global Markets Inc.
Member NASD, SIPC
FD02101 12/04 04-7545
The registrant has adopted a code of ethics that applies to the registrant’s principal executive officer, principal financial officer, principal accounting officer or controller.
| ITEM 3. | AUDIT COMMITTEE FINANCIAL EXPERT. |
The Board of Trustees of the registrant has determined that Stephen Randolph Gross, the Chairman of the Board’s Audit Committee, possesses the technical attributes identified in Instruction 2(b) of Item 3 to Form N-CSR to qualify as an “audit committee financial expert,” and has designated Mr. Gross as the Audit Committee’s financial expert. Mr. Gross is an “independent” Trustee pursuant to paragraph (a)(2) of Item 3 to Form N-CSR.
| ITEM 4. | PRINCIPAL ACCOUNTANT FEES AND SERVICES. |
| | (a) | Audit Fees for the Smith Barney Investment Series were $130,000 and $126,000 for the years ended 10/31/04 and 10/31/03. |
| | (b) | Audit-Related Fees for the Smith Barney Investment Series were $0 and $8,000 for the years ended 10/31/04 and 10/31/03. |
| | (c) | Tax Fees for Smith Barney Investment Series of $17,500 and $16,900 for the years ended 10/31/04 and 10/31/03. These amounts represent aggregate fees paid for tax compliance, tax advice and tax planning services, which include (the filing and amendment of federal, state and local income tax returns, timely RIC qualification review and tax distribution and analysis planning) rendered by the Accountant to Smith Barney Investment Series. |
| | (d) | All Other Fees for Smith Barney Investment Series of $0 and $0 for the years ended 10/31/04 and 10/31/03. |
| | (e) | (1) Audit Committee’s pre–approval policies and procedures described in paragraph (c) (7) of Rule 2-01 of Regulation S-X. |
The Charter for the Audit Committee (the “Committee”) of the Board of each registered investment company (the “Fund”) advised by Smith Barney Fund Management LLC or Salomon Brothers Asset Management Inc. or one of their affiliates (each, an “Adviser”) requires that the Committee shall approve (a) all audit and permissible non-audit services to be provided to the Fund and (b) all permissible non-audit services to be provided by the Fund’s independent auditors to the Adviser and any Covered Service Providers if the engagement relates directly to the operations and financial reporting of the Fund. The Committee may implement policies and procedures by which such services are approved other than by the full Committee.
The Committee shall not approve non-audit services that the Committee believes may impair the independence of the auditors. As of the date of the approval of this Audit Committee Charter, permissible non-audit services include any professional services (including tax services), that are not prohibited services as described below, provided to the Fund by the independent auditors, other than those provided to the Fund in connection with an audit or a review of the financial statements of the Fund. Permissible non-audit services may not include: (i) bookkeeping or other services related to the accounting records or financial statements of the Fund; (ii) financial information systems design and implementation; (iii) appraisal or valuation services, fairness opinions or contribution-in-kind reports; (iv) actuarial services; (v) internal audit outsourcing services; (vi) management functions or human resources; (vii) broker or dealer, investment adviser or investment banking services; (viii) legal services and expert services unrelated to the audit; and (ix) any other service the Public Company Accounting Oversight Board determines, by regulation, is impermissible.
Pre-approval by the Committee of any permissible non-audit services is not required so long as: (i) the aggregate amount of all such permissible non-audit services provided to the Fund, the Adviser and any service providers controlling, controlled by or under common control with the Adviser that provide ongoing services to the Fund (“Covered Service Providers”) constitutes not more than 5% of the total amount of revenues paid to the independent auditors during the fiscal year in which the permissible non-audit services are provided to (a) the Fund, (b) the Adviser and (c) any entity controlling, controlled by or under common control with the Adviser that provides ongoing services to the Fund during the fiscal year in which the services are provided that would have to be approved by the Committee; (ii) the permissible non-audit services were not recognized by the Fund at the time of the engagement to be non-audit services; and (iii) such services are promptly brought to the attention of the Committee and approved by the Committee (or its delegate(s)) prior to the completion of the audit.
(2) For the Smith Barney Investment Series, the percentage of fees that were approved by the audit committee, with respect to: Audit-Related Fees were 100% and 100% for the years ended 10/31/04 and 10/31/03; Tax Fees were 100% and 100% for the years ended 10/31/04 and 10/31/03; and
Other Fees were 100% and 100% for the years ended 10/31/04 and 10/31/03.
| | (g) | Non-audit fees billed by the Accountant for services rendered to Smith Barney Investment Series and CAM and any entity controlling, controlled by, or under common control with CAM that provides ongoing services to Smith Barney Investment Series were $0 and $0 for the years ended 10/31/04 and 10/31/03. |
| | (h) | Yes. The Smith Barney Investment Series’s Audit Committee has considered whether the provision of non-audit services that were rendered to Service Affiliates which were not pre-approved (not requiring pre-approval) is compatible with maintaining the Accountant’s independence. All services provided by the Accountant to the Smith Barney Investment Series or to Service Affiliates which were required to be pre-approved were pre-approved as required. |
| ITEM 5. | AUDIT COMMITTEE OF LISTED REGISTRANTS. |
Not applicable.
| ITEM 7. | DISCLOSURE OF PROXY VOTING POLICIES AND PROCEDURES FOR CLOSED-END MANAGEMENT INVESTMENT COMPANIES. |
Not applicable.
| ITEM 9. | SUBMISSION OF MATTERS TO A VOTE OF SECURITY HOLDERS. |
Not applicable.
| ITEM 10. | CONTROLS AND PROCEDURES. |
| | (a) | The registrant’s principal executive officer and principal financial officer have concluded that the registrant’s disclosure controls and procedures (as defined in Rule 30a- 3(c) under the Investment Company Act of 1940, as amended (the “1940 Act”)) are effective as of a date within 90 days of the filing date of this report that includes the disclosure required by this paragraph, based on their evaluation of the disclosure controls and procedures required by Rule 30a-3(b) under the 1940 Act and 15d-15(b) under the Securities Exchange Act of 1934. |
| | (b) | There were no changes in the registrant’s internal control over financial reporting (as defined in Rule 30a-3(d) under the 1940 Act) that occurred during the registrant’s last fiscal half-year (the registrant’s second fiscal half-year in the case of an annual report) that have materially affected, or are likely to materially affect the registrant’s internal control over financial reporting. |
| | (a) | Code of Ethics attached hereto. |
Exhibit 99.CODE ETH
(b) Attached hereto.
| | |
| Exhibit 99.CERT | | Certifications pursuant to section 302 of the Sarbanes-Oxley Act of 2002 |
| |
| Exhibit 99.906CERT | | Certifications pursuant to Section 906 of the Sarbanes-Oxley Act of 2002 |
SIGNATURES
Pursuant to the requirements of the Securities Exchange Act of 1934 and the Investment Company Act of 1940, the registrant has duly caused this Report to be signed on its behalf by the undersigned, there unto duly authorized.
| | |
| Smith Barney Investment Series |
| |
| By: | | /s/ R. JAY GERKEN |
| | | R. Jay Gerken |
| | | Chief Executive Officer of Smith Barney Investment Series |
Date: January 5, 2005
Pursuant to the requirements of the Securities Exchange Act of 1934 and the Investment Company Act of 1940, this report has been signed below by the following persons on behalf of the registrant and in the capacities and on the dates indicated.
| | |
| |
| By: | | /s/ R. JAY GERKEN |
| | | (R. Jay Gerken) |
| | | Chief Executive Officer of Smith Barney Investment Series |
Date: January 5, 2005
| | |
| |
| By: | | /s/ FRANCES M. GUGGINO |
| | | (Frances M. Guggino) |
| | | Chief Financial Officer of Smith Barney Investment Series |
Date: January 5, 2005