UNITED STATES
SECURITIES AND EXCHANGE COMMISSION
WASHINGTON, D. C. 20549
FORM N-CSRS
Investment Company Act file number: 811-05002
Deutsche DWS Variable Series II
(Exact Name of Registrant as Specified in Charter)
345 Park Avenue
New York, NY 10154-0004
(Address of Principal Executive Offices) (Zip Code)
Registrant’s Telephone Number, including Area Code:(212) 250-2500
Diane Kenneally
One International Place
Boston, MA 02110
(Name and Address of Agent for Service)
| Date of fiscal year end: | 12/31 |
| Date of reporting period: | 6/30/2019 |
| ITEM 1. | REPORT TO STOCKHOLDERS |
Table of Contents
June 30, 2019
Semiannual Report
Deutsche DWS Variable Series II
DWS Alternative Asset Allocation VIP
Beginning on January 1, 2021, as permitted by regulations adopted by the Securities and Exchange Commission, you may not be receiving paper copies of the Fund’s shareholder reports from the insurance company that offers your contract unless you specifically request paper copies from your insurance company or from your financial intermediary. Instead, the shareholder reports will be made available on a Web site, and your insurance company will notify you by mail each time a report is posted and provide you with a Web site link to access the report. Instructions for requesting paper copies will be provided by your insurance company.
If you already elected to receive shareholder reports electronically, you will not be affected by this change and you need not take any action. You may elect to receive shareholder reports and other communications from your insurance company electronically by following the instructions provided by your insurance company.
You may elect to receive all future reports in paper free of charge from your insurance company. If your insurance company informs you that future reports will be delivered via Web access, you can inform your insurance company that you wish to continue receiving paper copies of your shareholder reports by following the instructions provided by your insurance company.

Table of Contents
This report must be preceded or accompanied by a prospectus. To obtain an additional prospectus or summary prospectus, if available, call (800) 728-3337 or your financial representative. We advise you to consider the Fund’s objectives, risks, charges and expenses carefully before investing. The summary prospectus and prospectus contain this and other important information about the Fund. Please read the prospectus carefully before you invest.
Although allocation among different asset categories generally limits risk, portfolio management may favor an asset category that underperforms other assets or markets as a whole. The Fund expects to invest in underlying funds that emphasize alternatives or non-traditional asset categories or investment strategies, and as a result, it is subject to the risk factors of those underlying funds. Some of those risks include: stock market risk; the political, general economic, liquidity and currency risks of foreign investments, which may be particularly significant for emerging markets; credit and interest rate risk; floating rate loan risk; volatility in commodity prices, infrastructure and high-yield debt securities; market direction risk (market advances when short, market declines when long); and short sales risk. Because Exchange Traded Funds (ETFs) trade on a securities exchange, their shares may trade at a premium or discount to their net asset value. ETFs also incur fees and expenses so they may not fully match the performance of the indexes they are designed to track. Because Exchange Traded Notes (ETNs) are senior, unsecured, unsubordinated debt securities of an issuer (typically a bank or bank holding company), ETNs are subject to the credit risk of the issuer and may lose value due to a downgrade in the issuer’s credit rating. The returns of an ETN are linked to the performance of an underlying instrument (typically an index), minus applicable fees. ETNs typically do not make periodic interest payments and principal typically is not protected. The value of an ETN may fluctuate based on factors such as time to maturity, level of supply and demand for the ETN, volatility and lack of liquidity in the underlying assets, changes in the applicable interest rates, and economic, legal, political or geographic events that affect the underlying assets. The Fund bears its proportionate share of any fees and expenses borne by the ETN. Because ETNs trade on a securities exchange, their shares may trade at a premium or discount to their net asset value. The Fund may use derivatives, including as part of its currency and interest-rate strategies. Investing in derivatives entails special risks relating to liquidity, leverage and credit that may reduce returns and/or increase volatility. The success of the Fund’s currency and interest-rate strategies are dependent, in part, on the effectiveness and implementation of portfolio management’s proprietary models. As part of these strategies, the Fund’s exposure to foreign currencies could cause lower returns or even losses because foreign currency rates may fluctuate significantly over short periods of time for a number of reasons. The risk of loss is heightened during periods of rapid rises in interest rates. In addition, the notional amount of the Fund’s aggregate currency and interest-rate exposure resulting from these strategies may significantly exceed the net assets of the Fund. Please read prospectus for additional risks and specific details regarding the Fund’s risk profile.
The brand DWS represents DWS Group GmbH & Co. KGaA and any of its subsidiaries such as DWS Distributors, Inc. which offers investment products or DWS Investment Management Americas, Inc. and RREEF America L.L.C. which offer advisory services.
DWS Distributors, Inc., 222 South Riverside Plaza, Chicago, IL 60606, (800) 621-1148
NOT FDIC/NCUA INSURED NO BANK GUARANTEE MAY LOSE VALUE NOT A DEPOSIT
NOT INSURED BY ANY FEDERAL GOVERNMENT AGENCY
| 2 | | | Deutsche DWS Variable Series II — DWS Alternative Asset Allocation VIP |
Table of Contents
| Performance Summary | June 30, 2019 (Unaudited) |
Fund performance shown is historical, assumes reinvestment of all dividend and capital gain distributions and does not guarantee future results. Investment return and principal value fluctuate with changing market conditions so that, when redeemed, shares may be worth more or less than their original cost. Current performance may be lower or higher than the performance data quoted. Please contact your participating insurance company for the Fund’s most recent month-end performance. Performance does not reflect charges and fees (“contract charges”) associated with the separate account that invests in the Fund or any variable life insurance policy or variable annuity contract for which the Fund is an investment option. These charges and fees will reduce returns. While all share classes have the same underlying portfolio, their performance will differ.
The gross expense ratios of the Fund, as stated in the fee table of the prospectus dated May 1, 2019 are 1.42% and 1.77% for Class A and Class B shares, respectively, and may differ from the expense ratios disclosed in the Financial Highlights tables in this report. These expense ratios include net expenses of the underlying funds in which the Fund invests.
Generally accepted accounting principles require adjustments to be made to the net assets of the Fund at period end for financial reporting purposes only, and as such, the total return based on the unadjusted net asset value per share may differ from the total return reported in the financial highlights.
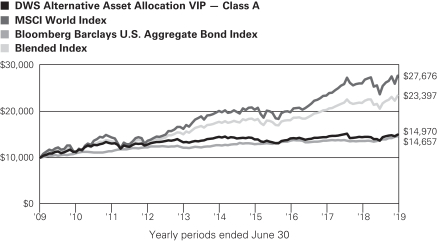
Growth of an Assumed $10,000 Investment in DWS Alternative Asset Allocation VIP
| The Morgan Stanley Capital International (MSCI) World Index is an unmanaged index representing large and mid-cap equity performance across 23 developed markets countries. It covers approximately 85% of the free float-adjusted market capitalization in each country.
The Bloomberg Barclays U.S. Aggregate Bond Index is an unmanaged index representing domestic taxable investment-grade bonds, with index components for government and corporate securities, mortgage pass-through securities, and asset-backed securities with an average maturity of one year or more.
TheBlended Index consists of 70% MSCI World Index and 30% Bloomberg Barclays U.S. Aggregate Bond Index.
Index returns do not reflect any fees or expenses and it is not possible to invest directly into an index. |
| Comparative Results | ||||||||||||
| DWS Alternative Asset Allocation VIP | 6-Month‡ | 1-Year | 3-Year | 5-Year | 10-Year | |||||||
| Class A | Growth of $10,000 | $10,970 | $10,370 | $10,600 | $10,319 | $14,970 | ||||||
| Average annual total return | 9.70% | 3.70% | 1.96% | 0.63% | 4.12% | |||||||
| MSCI World Index | Growth of $10,000 | $11,698 | $10,633 | $13,961 | $13,767 | $27,676 | ||||||
| Average annual total return | 16.98% | 6.33% | 11.77% | 6.60% | 10.72% | |||||||
| Bloomberg Barclays U.S. Aggregate Bond Index | Growth of $10,000 | $10,611 | $10,787 | $10,710 | $11,564 | $14,657 | ||||||
| Average annual total return | 6.11% | 7.87% | 2.31% | 2.95% | 3.90% | |||||||
| Blended Index | Growth of $10,000 | $11,379 | $10,713 | $12,953 | $13,168 | $23,397 | ||||||
| Average annual total return | 13.79% | 7.13% | 9.01% | 5.66% | 8.87% | |||||||
Deutsche DWS Variable Series II — DWS Alternative Asset Allocation VIP | | | 3 |
Table of Contents
| DWS Alternative Asset Allocation VIP | 6-Month‡ | 1-Year | 3-Year | 5-Year | 10-Year | |||||||
| Class B | Growth of $10,000 | $10,955 | $10,339 | $10,505 | $10,171 | $14,575 | ||||||
| Average annual total return | 9.55% | 3.39% | 1.66% | 0.34% | 3.84% | |||||||
| MSCI World Index | Growth of $10,000 | $11,698 | $10,633 | $13,961 | $13,767 | $27,676 | ||||||
| Average annual total return | 16.98% | 6.33% | 11.77% | 6.60% | 10.72% | |||||||
| Bloomberg Barclays U.S. Aggregate Bond Index | Growth of $10,000 | $10,611 | $10,787 | $10,710 | $11,564 | $14,657 | ||||||
| Average annual total return | 6.11% | 7.87% | 2.31% | 2.95% | 3.90% | |||||||
| Blended Index | Growth of $10,000 | $11,379 | $10,713 | $12,953 | $13,168 | $23,397 | ||||||
| Average annual total return | 13.79% | 7.13% | 9.01% | 5.66% | 8.87% | |||||||
The growth of $10,000 is cumulative.
| ‡ | Total returns shown for periods less than one year are not annualized. |
| 4 | | | Deutsche DWS Variable Series II — DWS Alternative Asset Allocation VIP |
Table of Contents
| Portfolio Summary | (Unaudited) |
| Asset Allocation* (As a % of Investment Portfolio) | 6/30/19 | 12/31/18 | ||||||
Real Asset | 42% | 40% | ||||||
DWS Enhanced Commodity Strategy Fund | 13% | 15% | ||||||
DWS RREEF Global Infrastructure Fund | 12% | 5% | ||||||
DWS RREEF Real Estate Securities Fund | 8% | 8% | ||||||
iShares Global Infrastructure ETF | 6% | 6% | ||||||
DWS RREEF Global Real Estate Securities Fund | 3% | 6% | ||||||
Alternative Fixed Income | 21% | 21% | ||||||
DWS Floating Rate Fund | 10% | 12% | ||||||
DWS Emerging Markets Fixed Income Fund | 6% | 7% | ||||||
iShares JP Morgan USD Emerging Markets Bond ETF | 5% | 2% | ||||||
Alternative Equity | 19% | 19% | ||||||
SPDR Bloomberg Barclays Convertible Securities ETF | 12% | 14% | ||||||
iShares U.S. Preferred Stock ETF | 7% | 5% | ||||||
Absolute Return | 5% | 4% | ||||||
DWS Global Macro Fund | 3% | 3% | ||||||
Invesco DB U.S. Dollar Index Bullish Fund | 2% | 1% | ||||||
Cash Equivalents | 13% | 16% | ||||||
DWS ESG Liquidity Fund | 10% | 8% | ||||||
DWS Central Cash Management Government Fund | 3% | 8% | ||||||
| 100% | 100% | |||||||
| * | During the periods indicated, asset categories and investment strategies represented in the Fund’s portfolio fell into the following categories: Real Assets, Alternative Fixed Income, Alternative Equity, and Absolute Return. Real Asset investments have a tangible or physical aspect such as real estate or commodities. Alternative Fixed Income investments seek to offer exposure to categories generally not included in investors’ allocations and to foreign investments, many of which are not denominated in US dollars. Alternative Equity investments are investments primarily in convertible and preferred instruments that offer equity exposure. Absolute Return investments seek positive returns in all market environments or seek to increase the diversification or liquidity of the Fund’s portfolio. |
Portfolio holdings and characteristics are subject to change.
For more complete details about the Fund’s investment portfolio, see page 6.
Following the Fund’s fiscal first and third quarter-end, a complete portfolio holdings listing is filed with the SEC on Form N-Q or Form N-PORT (available for filings after March 31, 2019). The Fund’s Form N-Q or Form N-PORT will be available on the SEC’s Web site at sec.gov. The Fund’s portfolio holdings are also posted on dws.com from time to time. Please read the Fund’s current prospectus for more information.
Pankaj Bhatnagar, PhD, Managing Director
Darwei Kung, Managing Director
Dokyoung Lee, CFA, Director
Portfolio Managers
Deutsche DWS Variable Series II — DWS Alternative Asset Allocation VIP | | | 5 |
Table of Contents
| Investment Portfolio | June 30, 2019 (Unaudited) |
| Shares | Value ($) | |||||||
| Mutual Funds 55.1% | ||||||||
DWS Emerging Markets Fixed Income Fund “Institutional” (a) | 2,021,587 | 18,800,762 | ||||||
DWS Enhanced Commodity Strategy Fund “Institutional” (a) | 4,106,799 | 39,507,408 | ||||||
DWS Floating Rate Fund “Institutional” (a) | 3,856,437 | 31,121,446 | ||||||
DWS Global Macro Fund “Institutional” (a) | 870,215 | 8,414,982 | ||||||
DWS RREEF Global Infrastructure Fund “Institutional” (a) | 2,404,219 | 37,265,391 | ||||||
DWS RREEF Global Real Estate Securities Fund “Institutional” (a) | 1,091,473 | 10,336,247 | ||||||
DWS RREEF Real Estate Securities Fund “Institutional” (a) | 1,158,973 | 25,717,609 | ||||||
Total Mutual Funds (Cost $172,778,383) |
| 171,163,845 | ||||||
| Exchange-Traded Funds 31.7% |
| |||||||
Invesco DB U.S. Dollar Index Bullish Fund | 215,000 | 5,583,550 | ||||||
iShares Global Infrastructure ETF | 400,435 | 18,500,097 | ||||||
| Shares | Value ($) | |||||||
iShares JP Morgan USD Emerging Markets Bond ETF | 141,200 | 15,996,548 | ||||||
iShares U.S. Preferred Stock ETF | 624,950 | 23,029,408 | ||||||
SPDR Bloomberg Barclays Convertible Securities ETF | 670,730 | 35,461,495 | ||||||
Total Exchange-Traded Funds (Cost $94,431,166) |
| 98,571,098 | ||||||
| Cash Equivalents 13.0% | ||||||||
DWS Central Cash Management Government Fund, 2.40% (a) (b) | 10,875,301 | 10,875,301 | ||||||
DWS ESG Liquidity Fund “Institutional Shares”, 2.55% (a) (b) | 29,585,569 | 29,588,527 | ||||||
Total Cash Equivalents (Cost $40,461,695) |
| 40,463,828 | ||||||
| % of Net Assets | Value ($) | |||||||
Total Investment Portfolio (Cost $307,671,244) | 99.8 | 310,198,771 | ||||||
| Other Assets and Liabilities, Net | 0.2 | 481,235 | ||||||
| Net Assets | 100.0 | 310,680,006 | ||||||
The Fund mainly invests in Underlying DWS Funds andNon-affiliated ETFs. The Underlying DWS Funds in which the Fund invests are considered to be affiliated investments.
A summary of the Fund’s transactions with affiliated investments during the period ended June 30, 2019 are as follows:
| Value ($) at 12/31/2018 | Purchases Cost ($) | Sales Proceeds ($) | Net Realized Gain/ (Loss) ($) | Net Change in Unrealized Appreciation (Depreciation) ($) | Income ($) | Capital Gain Distributions ($) | Number of Shares at 6/30/2019 | Value ($) at 6/30/2019 | ||||||||||||||||||||||||
Mutual Funds 55.1% |
| |||||||||||||||||||||||||||||||
DWS Emerging Markets Fixed Income Fund “Institutional” (a) |
| |||||||||||||||||||||||||||||||
| 17,037,469 | 392,321 | — | — | 1,370,972 | 392,321 | — | 2,021,587 | 18,800,762 | ||||||||||||||||||||||||
DWS Enhanced Commodity Strategy Fund “Institutional” (a) |
| |||||||||||||||||||||||||||||||
| 34,471,696 | 4,520,222 | — | — | 515,490 | 260,222 | — | 4,106,799 | 39,507,408 | ||||||||||||||||||||||||
DWS Floating Rate Fund “Institutional” (a) |
| |||||||||||||||||||||||||||||||
| 29,538,196 | 756,537 | — | — | 826,713 | 756,537 | — | 3,856,437 | 31,121,446 | ||||||||||||||||||||||||
DWS Global Macro Fund “Institutional” (a) |
| |||||||||||||||||||||||||||||||
| 6,302,154 | 1,639,000 | — | — | 473,828 | — | — | 870,215 | 8,414,982 | ||||||||||||||||||||||||
DWS RREEF Global Infrastructure Fund “Institutional” (a) |
| |||||||||||||||||||||||||||||||
| 12,746,320 | 21,333,244 | — | — | 3,185,827 | 332,112 | — | 2,404,219 | 37,265,391 | ||||||||||||||||||||||||
DWS RREEF Global Real Estate Securities Fund “Institutional” (a) |
| |||||||||||||||||||||||||||||||
| 13,651,660 | 239,760 | 5,254,000 | 26,045 | 1,672,782 | 239,760 | 99,616 | 1,091,473 | 10,336,247 | ||||||||||||||||||||||||
DWS RREEF Real Estate Securities Fund “Institutional” (a) |
| |||||||||||||||||||||||||||||||
| 17,837,606 | 4,905,245 | — | — | 2,974,758 | 290,245 | 61,324 | 1,158,973 | 25,717,609 | ||||||||||||||||||||||||
Cash Equivalents 13.0% |
| |||||||||||||||||||||||||||||||
DWS Central Cash Management Government Fund, 2.40% (a) (b) |
| |||||||||||||||||||||||||||||||
| 17,736,862 | 57,333,976 | 64,195,537 | — | — | 170,031 | — | 10,875,301 | 10,875,301 | ||||||||||||||||||||||||
DWS ESG Liquidity Fund “Institutional Shares”, 2.55% (a) (b) |
| |||||||||||||||||||||||||||||||
| 18,321,686 | 11,262,878 | — | — | 3,963 | 292,903 | — | 29,585,569 | 29,588,527 | ||||||||||||||||||||||||
| 167,643,649 | 102,383,183 | 69,449,537 | 26,045 | 11,024,333 | 2,734,131 | 160,940 | 55,970,573 | 211,627,673 | ||||||||||||||||||||||||
| (a) | Affiliated fund managed by DWS Investment Management Americas, Inc. |
| (b) | The rate shown is the annualizedseven-day yield at period end. |
SPDR: Standard & Poor’s Depositary Receipt
The accompanying notes are an integral part of the financial statements.
| 6 | | | Deutsche DWS Variable Series II — DWS Alternative Asset Allocation VIP |
Table of Contents
Fair Value Measurements
Various inputs are used in determining the value of the Fund’s investments. These inputs are summarized in three broad levels. Level 1 includes quoted prices in active markets for identical securities. Level 2 includes other significant observable inputs (including quoted prices for similar securities, interest rates, prepayment speeds and credit risk). Level 3 includes significant unobservable inputs (including the Fund’s own assumptions in determining the fair value of investments). The level assigned to the securities valuations may not be an indication of the risk or liquidity associated with investing in those securities.
The following is a summary of the inputs used as of June 30, 2019 in valuing the Fund’s investments. For information on the Fund’s policy regarding the valuation of investments, please refer to the Security Valuation section of Note A in the accompanying Notes to Financial Statements.
| Assets | Level 1 | Level 2 | Level 3 | Total | ||||||||||||
| Mutual Funds | $ | 171,163,845 | $ | — | $ | — | $ | 171,163,845 | ||||||||
| Exchange-Traded Funds | 98,571,098 | — | — | 98,571,098 | ||||||||||||
| Short-Term Investments | 40,463,828 | — | — | 40,463,828 | ||||||||||||
| Total | $ | 310,198,771 | $ | — | $ | — | $ | 310,198,771 | ||||||||
The accompanying notes are an integral part of the financial statements.
Deutsche DWS Variable Series II — DWS Alternative Asset Allocation VIP | | | 7 |
Table of Contents
Statement of Assets and Liabilities
| as of June 30, 2019 (Unaudited) | ||||
| Assets | ||||
| Investments in affiliated Underlying Funds, at value (cost $213,240,078) | $ | 211,627,673 | ||
| Investments innon-affiliated securities, at value (cost $94,431,166) | 98,571,098 | |||
| Cash | 10,000 | |||
| Receivable for Fund shares sold | 615,081 | |||
| Interest receivable | 89,036 | |||
| Other assets | 2,855 | |||
| Total assets | 310,915,743 | |||
| Liabilities | ||||
| Payable for Fund shares redeemed | 48,465 | |||
| Accrued Trustees’ fees | 713 | |||
| Other accrued expenses and payables | 186,559 | |||
| Total liabilities | 235,737 | |||
| Net assets, at value | $ | 310,680,006 | ||
| Net Assets Consist of | ||||
| Distributable earnings (loss) | (7,933,529 | ) | ||
| Paid-in capital | 318,613,535 | |||
| Net assets, at value | $ | 310,680,006 | ||
Class A | ||||
| Net Asset Value, offering and redemption price per share ($30,909,165 ÷ 2,420,245 outstanding shares of beneficial interest, no par value, unlimited number of shares authorized) | $ | 12.77 | ||
Class B | ||||
| Net Asset Value, offering and redemption price per share ($279,770,841 ÷ 21,891,781 outstanding shares of beneficial interest, no par value, unlimited number of shares authorized) | $ | 12.78 | ||
| for the six months ended June 30, 2019 (Unaudited) | ||||
| Investment Income | ||||
| Income: | ||||
| Income distributions from affiliated Underlying Funds | $ | 2,734,131 | ||
| Dividends | 1,200,684 | |||
| Total income | 3,934,815 | |||
| Expenses: | ||||
| Management fee | 714,140 | |||
| Administration fee | 136,929 | |||
| Recordkeeping fees (Class B) | 140,910 | |||
| Services to shareholders | 1,540 | |||
| Distribution and service fees (Class B) | 306,148 | |||
| Custodian fee | 3,400 | |||
| Professional fees | 35,645 | |||
| Reports to shareholders | 24,771 | |||
| Trustees’ fees and expenses | 6,090 | |||
| Other | 3,105 | |||
| Total expenses before expense reductions | 1,372,678 | |||
| Expense reductions | (716,302 | ) | ||
| Total expenses after expense reductions | 656,376 | |||
| Net investment income | 3,278,439 | |||
| Realized and Unrealized Gain (Loss) | ||||
| Net realized gain (loss) from: | ||||
| Sale of affiliated Underlying Funds | 26,045 | |||
| Sale of non-affiliated Underlying Funds | (145,297 | ) | ||
| Capital gain distributions from affiliated Underlying Funds | 160,940 | |||
| 41,688 | ||||
| Change in net unrealized appreciation (depreciation) on: | ||||
| Affiliated Underlying Funds | 11,024,333 | |||
| Non-affiliated Underlying Funds | 9,148,571 | |||
| 20,172,904 | ||||
| Net gain (loss) | 20,214,592 | |||
| Net increase (decrease) in net assets resulting from operations | $ | 23,493,031 | ||
The accompanying notes are an integral part of the financial statements.
| 8 | | | Deutsche DWS Variable Series II — DWS Alternative Asset Allocation VIP |
Table of Contents
Statements of Changes in Net Assets
| Six Months Ended June 30, 2019 | Year Ended December 31, | |||||||
| Increase (Decrease) in Net Assets | (Unaudited) | 2018 | ||||||
| Operations: | ||||||||
| Net investment income (loss) | $ | 3,278,439 | $ | 9,946,992 | ||||
| Net realized gain (loss) | 41,688 | (7,030,042 | ) | |||||
| Change in net unrealized appreciation (depreciation) | 20,172,904 | (23,318,609 | ) | |||||
| Net increase (decrease) in net assets resulting from operations | 23,493,031 | (20,401,659 | ) | |||||
| Distributions to shareholders: | ||||||||
Class A | (1,142,148 | ) | (576,122 | ) | ||||
Class B | (9,062,974 | ) | (3,035,192 | ) | ||||
| Total distributions | (10,205,122 | ) | (3,611,314 | ) | ||||
| Fund share transactions: | ||||||||
Class A | ||||||||
| Proceeds from shares sold | 2,820,486 | 4,125,802 | ||||||
| Reinvestment of distributions | 1,142,148 | 576,122 | ||||||
| Payments for shares redeemed | (898,232 | ) | (2,134,243 | ) | ||||
| Net increase (decrease) in net assets from Class A share transactions | 3,064,402 | 2,567,681 | ||||||
Class B | ||||||||
| Proceeds from shares sold | 56,701,057 | 83,793,280 | ||||||
| Reinvestment of distributions | 9,062,974 | 3,035,192 | ||||||
| Payments for shares redeemed | (5,526,786 | ) | (15,136,874 | ) | ||||
| Net increase (decrease) in net assets from Class B share transactions | 60,237,245 | 71,691,598 | ||||||
| Increase (decrease) in net assets | 76,589,556 | 50,246,306 | ||||||
| Net assets at beginning of period | 234,090,450 | 183,844,144 | ||||||
| Net assets at end of period | $ | 310,680,006 | $ | 234,090,450 | ||||
| Other Information | ||||||||
Class A | ||||||||
| Shares outstanding at beginning of period | 2,180,831 | 1,982,448 | ||||||
| Shares sold | 220,501 | 319,659 | ||||||
| Shares issued to shareholders in reinvestment of distributions | 90,217 | 45,508 | ||||||
| Shares redeemed | (71,304 | ) | (166,784 | ) | ||||
| Net increase (decrease) in Class A shares | 239,414 | 198,383 | ||||||
| Shares outstanding at end of period | 2,420,245 | 2,180,831 | ||||||
Class B | ||||||||
| Shares outstanding at beginning of period | 17,175,164 | 11,540,895 | ||||||
| Shares sold | 4,434,419 | 6,569,707 | ||||||
| Shares issued to shareholders in reinvestment of distributions | 715,310 | 239,557 | ||||||
| Shares redeemed | (433,112 | ) | (1,174,995 | ) | ||||
| Net increase (decrease) in Class B shares | 4,716,617 | 5,634,269 | ||||||
| Shares outstanding at end of period | 21,891,781 | 17,175,164 | ||||||
The accompanying notes are an integral part of the financial statements.
Deutsche DWS Variable Series II — DWS Alternative Asset Allocation VIP | | | 9 |
Table of Contents
Six Months | Years Ended December 31, | |||||||||||||||||||||||
| Class A | (Unaudited) | 2018 | 2017 | 2016 | 2015 | 2014 | ||||||||||||||||||
| Selected Per Share Data | ||||||||||||||||||||||||
| Net asset value, beginning of period | $ | 12.10 | $ | 13.61 | $ | 12.97 | $ | 12.60 | $ | 13.88 | $ | 13.75 | ||||||||||||
| Income (loss) from investment operations: | ||||||||||||||||||||||||
Net investment incomea | .17 | .61 | .33 | .35 | .29 | .36 | ||||||||||||||||||
Net realized and unrealized gain (loss) | 1.00 | (1.84 | ) | .62 | .31 | (1.13 | ) | .13 | ||||||||||||||||
Total from investment operations | 1.17 | (1.23 | ) | .95 | .66 | (.84 | ) | .49 | ||||||||||||||||
| Less distributions from: | ||||||||||||||||||||||||
Net investment income | (.50 | ) | (.28 | ) | (.31 | ) | (.29 | ) | (.41 | ) | (.27 | ) | ||||||||||||
Net realized gains | — | — | — | — | (.03 | ) | (.09 | ) | ||||||||||||||||
Total distributions | (.50 | ) | (.28 | ) | (.31 | ) | (.29 | ) | (.44 | ) | (.36 | ) | ||||||||||||
| Net asset value, end of period | $ | 12.77 | $ | 12.10 | $ | 13.61 | $ | 12.97 | $ | 12.60 | $ | 13.88 | ||||||||||||
| Total Return (%)b,c | 9.70 | ** | (9.14 | ) | 7.41 | 5.30 | (6.29 | ) | 3.50 | |||||||||||||||
| Ratios to Average Net Assets and Supplemental Data | ||||||||||||||||||||||||
| Net assets, end of period ($ millions) | 31 | 26 | 27 | 24 | 21 | 20 | ||||||||||||||||||
| Ratio of expenses before expense reductions (%)d,e | .68 | * | .73 | .64 | .56 | .53 | .56 | |||||||||||||||||
| Ratio of expenses after expense reductions (%)d,e | .22 | * | .16 | .19 | .27 | .33 | .32 | |||||||||||||||||
| Ratio of net investment income (%) | 2.61 | * | 4.78 | 2.50 | 2.70 | 2.19 | 2.54 | |||||||||||||||||
| Portfolio turnover rate (%) | 6 | ** | 32 | 55 | 51 | 21 | 28 | |||||||||||||||||
Six Months | Years Ended December 31, | |||||||||||||||||||||||
| Class B | (Unaudited) | 2018 | 2017 | 2016 | 2015 | 2014 | ||||||||||||||||||
| Selected Per Share Data | ||||||||||||||||||||||||
| Net asset value, beginning of period | $ | 12.09 | $ | 13.59 | $ | 12.96 | $ | 12.59 | $ | 13.87 | $ | 13.74 | ||||||||||||
| Income (loss) from investment operations: | ||||||||||||||||||||||||
Net investment incomea | .15 | .62 | .31 | .31 | .25 | .31 | ||||||||||||||||||
Net realized and unrealized gain (loss) | 1.00 | (1.88 | ) | .59 | .31 | (1.12 | ) | .14 | ||||||||||||||||
Total from investment operations | 1.15 | (1.26 | ) | .90 | .62 | (.87 | ) | .45 | ||||||||||||||||
| Less distributions from: | ||||||||||||||||||||||||
Net investment income | (.46 | ) | (.24 | ) | (.27 | ) | (.25 | ) | (.38 | ) | (.23 | ) | ||||||||||||
Net realized gains | — | — | — | — | (.03 | ) | (.09 | ) | ||||||||||||||||
Total distributions | (.46 | ) | (.24 | ) | (.27 | ) | (.25 | ) | (.41 | ) | (.32 | ) | ||||||||||||
| Net asset value, end of period | $ | 12.78 | $ | 12.09 | $ | 13.59 | $ | 12.96 | $ | 12.59 | $ | 13.87 | ||||||||||||
| Total Return (%)b,c | 9.55 | ** | (9.35 | ) | 7.01 | 4.99 | (6.54 | ) | 3.24 | |||||||||||||||
| Ratios to Average Net Assets and Supplemental Data | ||||||||||||||||||||||||
| Net assets, end of period ($ millions) | 280 | 208 | 157 | 107 | 88 | 94 | ||||||||||||||||||
| Ratio of expenses before expense reductions (%)d,e | 1.04 | * | 1.08 | .93 | .85 | .83 | .86 | |||||||||||||||||
| Ratio of expenses after expense reductions (%)d,e | .51 | * | .45 | .48 | .57 | .62 | .57 | |||||||||||||||||
| Ratio of net investment income (%) | 2.37 | * | 4.85 | 2.31 | 2.45 | 1.84 | 2.22 | |||||||||||||||||
| Portfolio turnover rate (%) | 6 | ** | 32 | 55 | 51 | 21 | 28 | |||||||||||||||||
| a | Based on average shares outstanding during the period. |
| b | Total return would have been lower had certain expenses not been reduced. |
| c | Total return would have been lower if the Advisor had not reduced some Underlying DWS Funds’ expenses. |
| d | The Fund invests in other Funds and indirectly bears its proportionate share of fees and expenses incurred by the Underlying Funds in which the Fund is invested. This ratio does not include these indirect fees and expenses. |
| e | Expense ratio does not reflect charges and fees associated with the separate account that invests in the Fund or any variable life insurance policy or variable annuity contract for which the Fund is an investment option. |
| * | Annualized |
| ** | Not annualized |
The accompanying notes are an integral part of the financial statements.
| 10 | | | Deutsche DWS Variable Series II — DWS Alternative Asset Allocation VIP |
Table of Contents
| Notes to Financial Statements | (Unaudited) |
A. Organization and Significant Accounting Policies
DWS Alternative Asset Allocation VIP (the “Fund”) is a diversified series of Deutsche DWS Variable Series II (the “Trust”), which is registered under the Investment Company Act of 1940, as amended (the “1940 Act”), as an open-end management investment company organized as a Massachusetts business trust. The Fund mainly invests in other affiliated DWS funds (i.e., mutual funds, exchange-traded funds and other pooled investment vehicles managed by DWS Investment Management Americas, Inc. or one of its affiliates, together the “Underlying DWS Funds”), non-affiliated exchange-traded funds (“Non-affiliated ETFs”), non-affiliated exchange-traded notes (“Non-affiliated ETNs”) and derivative investments. Non-affiliated ETFs, Non-affiliated ETNs and Underlying DWS Funds are collectively referred to as “Underlying Funds.” During the six months ended June 30, 2019, the Fund primarily invested in Underlying DWS Funds and non-affiliated ETFs. Each Underlying DWS Fund’s accounting policies and investment holdings are outlined in the Underlying DWS Funds’ financial statements and are available upon request.
Multiple Classes of Shares of Beneficial Interest. The Fund offers two classes of shares (Class A shares and Class B shares). Sales of Class B shares are subject to recordkeeping fees up to 0.15% and Rule 12b-1 fees under the 1940 Act equal to an annual rate of 0.25% of the average daily net assets of the Class B shares of the Fund. Class A shares are not subject to such fees.
Investment income, realized and unrealized gains and losses, and certain fund-level expenses and expense reductions, if any, are borne pro rata on the basis of relative net assets by the holders of all classes of shares except that each class bears certain expenses unique to that class (including the applicable Rule 12b-1 fee). Differences in class-level expenses may result in payment of different per share dividends by class. All shares have equal rights with respect to voting subject to class-specific arrangements.
The Fund’s financial statements are prepared in accordance with accounting principles generally accepted in the United States of America (“U.S. GAAP”) which require the use of management estimates. Actual results could differ from those estimates. The Fund qualifies as an investment company under Topic 946 of Accounting Standards Codification of U.S. GAAP. The policies described below are followed consistently by the Fund in the preparation of its financial statements.
Security Valuation. Investments are stated at value determined as of the close of regular trading on the New York Stock Exchange on each day the exchange is open for trading.
Various inputs are used in determining the value of the Fund’s investments. These inputs are summarized in three broad levels. Level 1 includes quoted prices in active markets for identical securities. Level 2 includes other significant observable inputs (including quoted prices for similar securities, interest rates, prepayment speeds and credit risk). Level 3 includes significant unobservable inputs (including the Fund’s own assumptions in determining the fair value of investments). The level assigned to the securities valuations may not be an indication of the risk or liquidity associated with investing in those securities.
Investments in mutual funds are valued at the net asset value per share of each class of the Underlying DWS Funds and are categorized as Level 1.
ETFs and ETNs are valued at the most recent sale price or official closing price reported on the exchange (U.S. or foreign) or over-the-counter market on which they trade. ETFs and ETNs for which no sales are reported are valued at the calculated mean between the most recent bid and asked quotations on the relevant market or, if a mean cannot be determined, at the most recent bid quotation. ETFs and ETNs securities are generally categorized as Level 1.
Disclosure about the classification of fair value measurements is included in a table following the Fund’s Investment Portfolio.
Federal Income Taxes. The Fund’s policy is to comply with the requirements of the Internal Revenue Code, as amended, which are applicable to regulated investment companies and to distribute all of its taxable income to its shareholders.
At December 31, 2018, the Fund had approximately $10,101,000 of tax basis capital loss carryforwards, which may be applied against realized net taxable capital gains indefinitely, including short-term losses ($6,827,000) and long-term losses ($3,274,000).
Deutsche DWS Variable Series II — DWS Alternative Asset Allocation VIP | | | 11 |
Table of Contents
At June 30, 2019, the aggregate cost of investments for federal income tax purposes was $311,239,639. The net unrealized depreciation for all investments based on tax cost was $1,040,868. This consisted of aggregate gross unrealized appreciation for all investments in which there was an excess of value over tax cost of $12,553,160 and aggregate gross unrealized depreciation for all investments in which there was an excess of tax cost over value of $13,594,028.
The Fund has reviewed the tax positions for the open tax years as of December 31, 2018 and has determined that no provision for income tax and/or uncertain tax positions is required in the Fund’s financial statements. The Fund’s federal tax returns for the prior three fiscal years remain open subject to examination by the Internal Revenue Service.
Distribution of Income and Gains. Distributions from net investment income of the Fund, if any, are declared and distributed to shareholders annually. Net realized gains from investment transactions, in excess of available capital loss carryforwards, would be taxable to the Fund if not distributed and, therefore, will be distributed to shareholders at least annually. The Fund may also make additional distributions for tax purposes if necessary.
The timing and characterization of certain income and capital gain distributions are determined annually in accordance with federal tax regulations which may differ from accounting principles generally accepted in the United States of America. These differences primarily relate to certain securities sold at a loss and capital gain distributions from Underlying Funds. As a result, net investment income (loss) and net realized gain (loss) on investment transactions for a reporting period may differ significantly from distributions during such period. Accordingly, the Fund may periodically make reclassifications among certain of its capital accounts without impacting the net asset value of the Fund.
The tax character of current year distributions will be determined at the end of the current fiscal year.
Expenses. Expenses of the Trust arising in connection with a specific fund are allocated to that fund. Other Trust expenses which cannot be directly attributed to a fund are apportioned among the funds in the Trust based upon the relative net assets or other appropriate measures.
Contingencies.In the normal course of business, the Fund may enter into contracts with service providers that contain general indemnification clauses. The Fund’s maximum exposure under these arrangements is unknown, as this would involve future claims that may be made against the Fund that have not yet been made. However, based on experience, the Fund expects the risk of loss to be remote.
Other.Investment transactions are accounted for on a trade date plus one basis for daily net asset value calculations. However, for financial reporting purposes, investment transactions are reported on trade date. Interest income is recorded on the accrual basis. Dividend Income is recorded on the ex-dividend date. Distributions of income and capital gains from the Underlying Funds are recorded on the ex-dividend date. Realized gains and losses from investment transactions are recorded on an identified cost basis.
B. Purchases and Sales of Securities
During the six months ended June 30, 2019, purchases and sales of affiliated Underlying Funds (excluding short-term investments) aggregated $33,726,197 and $5,254,000, respectively. Purchases and sales of Non-affiliated ETFs aggregated $34,566,724 and $10,914,978, respectively.
C. Related Parties
Management Agreement.Under the Investment Management Agreement with DWS Investment Management Americas, Inc. (“DIMA” or the “Advisor”), an indirect, wholly owned subsidiary of DWS Group GmbH & Co. KGaA (“DWS Group”), the Advisor directs the investments of the Fund in accordance with its investment objectives, policies and restrictions. The Advisor determines the securities, instruments and other contracts relating to investments in Underlying Funds to be purchased, sold or entered into by the Fund or delegates such responsibility to the Fund’s subadvisors.
RREEF America L.L.C. (“RREEF”), an indirect, wholly owned subsidiary of DWS Group, acts as an investment subadvisor to the Fund. As an investment subadvisor to the Fund, RREEF provides investment management services to the portions of the Fund’s portfolio allocated to direct investments in global real estate and global infrastructure securities. RREEF is paid by the Advisor for the services RREEF provides to the Fund. As of the date of this report, the Fund obtained its exposure to global real estate and global infrastructure securities indirectly through investments in other Underlying DWS Funds.
| 12 | | | Deutsche DWS Variable Series II — DWS Alternative Asset Allocation VIP |
Table of Contents
The Fund does not invest in the Underlying DWS Funds for the purpose of exercising management or control; however, investments within the set limits may represent 5% or more of an Underlying DWS Fund’s outstanding shares. At June 30, 2019, the Fund held approximately 26% of DWS Global Macro Fund, 24% of DWS Emerging Markets Fixed Income Fund, 13% of DWS Floating Rate Fund and 7% of DWS ESG Liquidity Fund. Pursuant to the Investment Management Agreement with the Advisor, the Fund pays a monthly management fee based on the Fund’s average daily net assets, computed and accrued daily and payable monthly, at the following annual rates:
| On assets invested in other DWS Funds | .20 | % | ||
| On assets invested in all other assets not considered DWS Funds | 1.20 | % |
Accordingly, for the six months ended June 30, 2019, the fee pursuant to the Investment Management Agreement was equivalent to an annualized rate (exclusive of any applicable waivers/reimbursements) of 0.52% of the Fund’s average daily net assets.
In addition, the Advisor will receive management fees from managing the Underlying DWS Funds in which the Fund invests.
For the period from January 1, 2019 through April 30, 2019, the Advisor had contractually agreed to waive its fees and/or reimburse certain operating expenses to the extent necessary to maintain the total annual operating expenses (excluding certain expenses such as extraordinary expenses, taxes, brokerage, interest expense and Underlying Funds) of each class as follows:
| Class A | .23 | % | ||
| Class B | .53 | % |
In addition, the Advisor has contractually agreed to waive its fees and/or reimburse fund expenses for the period January 1, 2019 through April 30, 2020 to the extent necessary to maintain the fund’s total annual operating expenses (including indirect expenses of Underlying Funds and excluding certain expenses such as extraordinary expenses, taxes, brokerage and interest expenses) of each class as follows:
| Class A | .86 | % | ||
| Class B | 1.15 | % |
For the six months ended June 30, 2019, the Advisor has voluntarily agreed to waive 0.15% of its management fee.
For the six months ended June 30, 2019, fees waived and/or expenses reimbursed for each class are as follows:
| Class A | $ | 65,983 | ||
| Class B | 650,319 | |||
| $ | 716,302 |
The Fund indirectly bears its proportionate share of fees and expenses incurred by the Underlying Funds in which it is invested.
Administration Fee. Pursuant to an Administrative Services Agreement, DIMA provides most administrative services to the Fund. For all services provided under the Administrative Services Agreement, the Fund pays DIMA an annual fee (“Administration Fee”) of 0.10% of the Fund’s average daily net assets, computed and accrued daily and payable monthly. For the six months ended June 30, 2019, the Administration Fee was $136,929, of which $24,952 is unpaid.
Service Provider Fees. DWS Service Company (“DSC”), an affiliate of the Advisor, is the transfer agent, dividend-paying agent and shareholder service agent for the Fund. Pursuant to a sub-transfer agency agreement between DSC and DST Systems, Inc. (“DST”), DSC has delegated certain transfer agent, dividend-paying agent and shareholder service agent functions to DST. DSC compensates DST out of the shareholder servicing fee it receives from the Fund. For the six months ended June 30, 2019, the amounts charged to the Fund by DSC were as follows:
| Services to Shareholders | Total Aggregated | Unpaid at June 30, 2019 | ||||||
| Class A | $ | 58 | $ | 16 | ||||
| Class B | 125 | 40 | ||||||
| $ | 183 | $ | 56 | |||||
Deutsche DWS Variable Series II — DWS Alternative Asset Allocation VIP | | | 13 |
Table of Contents
Distribution Service Agreement. Under the Fund’s Class B 12b-1 plan, DWS Distributors, Inc. (“DDI”) received a fee (“Distribution Service Fee”) of 0.25% of average daily net assets of Class B shares. For the six months ended June 30, 2019, the Distribution Service Fee aggregated $306,148, of which $56,114 is unpaid.
Typesetting and Filing Service Fees. Under an agreement with the Fund, DIMA is compensated for providing certain pre-press and regulatory filing services to the Fund. For the six months ended June 30, 2019, the amount charged to the Fund by DIMA included in the Statement of Operations under “Reports to shareholders” aggregated $5,624, all of which is unpaid.
Trustees’ Fees and Expenses. The Fund paid retainer fees to each Trustee not affiliated with the Advisor, plus specified amounts to the Board Chairperson and to each committee Chairperson.
Affiliated Cash Management Vehicles. The Fund may invest uninvested cash balances in DWS Central Cash Management Government Fund and DWS ESG Liquidity Fund, affiliated money market funds which are managed by the Advisor. Each affiliated money market fund is managed in accordance with Rule 2a-7 under the 1940 Act, which governs the quality, maturity, diversity and liquidity of instruments in which a money market fund may invest. DWS Central Cash Management Government Fund seeks to maintain a stable net asset value, and DWS ESG Liquidity Fund maintains a floating net asset value. The Fund indirectly bears its proportionate share of the expenses of each affiliated money market fund in which it invests. DWS Central Cash Management Government Fund does not pay the Advisor an investment management fee.
D. Ownership of the Fund
At June 30, 2019, two participating insurance companies were owners of record of 10% or more of the total outstanding Class A shares of the Fund, each owning 85% and 13%. Two participating insurance companies were owners of record of 10% or more of the total outstanding Class B shares of the Fund, each owning 74% and 17%, respectively.
| 14 | | | Deutsche DWS Variable Series II — DWS Alternative Asset Allocation VIP |
Table of Contents
| Information About Your Fund’s Expenses | (Unaudited) |
As an investor of the Fund, you incur two types of costs: ongoing expenses and transaction costs. Ongoing expenses include management fees, distribution and service (12b-1) fees and other Fund expenses. Examples of transaction costs include contract charges, which are not shown in this section. The following tables are intended to help you understand your ongoing expenses (in dollars) of investing in the Fund and to help you compare these expenses with the ongoing expenses of investing in other mutual funds. In addition to the ongoing expenses which the Fund bears directly, the Fund’s shareholders indirectly bear the expense of the Underlying Funds in which the Fund invests. These expenses are not included in the Fund’s annualized expense ratios used to calculate the expense estimate in the tables. In the most recent six-month period, the Fund limited the ongoing expenses the Fund bears directly; had it not done so, expenses would have been higher. The examples in the table are based on an investment of $1,000 invested at the beginning of the six-month period and held for the entire period (January 1, 2019 to June 30, 2019).
The tables illustrate your Fund’s expenses in two ways:
| – | Actual Fund Return. This helps you estimate the actual dollar amount of ongoing expenses (but not transaction costs) paid on a $1,000 investment in the Fund using the Fund’s actual return during the period. To estimate the expenses you paid over the period, simply divide your account value by $1,000 (for example, an $8,600 account value divided by $1,000 = 8.6), then multiply the result by the number in the “Expenses Paid per $1,000” line under the share class you hold. |
| – | Hypothetical 5% Fund Return. This helps you to compare your Fund’s ongoing expenses (but not transaction costs) with those of other mutual funds using the Fund’s actual expense ratio and a hypothetical rate of return of 5% per year before expenses. Examples using a 5% hypothetical Fund return may be found in the shareholder reports of other mutual funds. The hypothetical account values and expenses may not be used to estimate the actual ending account balance or expenses you paid for the period. |
Please note that the expenses shown in these tables are meant to highlight your ongoing expenses only and do not reflect any transaction costs. The “Expenses Paid per $1,000” line of the tables is useful in comparing ongoing expenses only and will not help you determine the relative total expense of owning different funds. If these transaction costs had been included, your costs would have been higher.
| Expenses and Value of a $1,000 Investment for the six months ended June 30, 2019 | ||||||||
| Actual Fund Return | Class A | Class B | ||||||
| Beginning Account Value 1/1/19 | $ | 1,000.00 | $ | 1,000.00 | ||||
| Ending Account Value 6/30/19 | $ | 1,097.00 | $ | 1,095.50 | ||||
| Expenses Paid per $1,000* | $ | 1.14 | $ | 2.65 | ||||
| Hypothetical 5% Fund Return | Class A | Class B | ||||||
| Beginning Account Value 1/1/19 | $ | 1,000.00 | $ | 1,000.00 | ||||
| Ending Account Value 6/30/19 | $ | 1,023.70 | $ | 1,022.27 | ||||
| Expenses Paid per $1,000* | $ | 1.10 | $ | 2.56 | ||||
| * | Expenses are equal to the Fund’s annualized expense ratio for each share class, multiplied by the average account value over the period, multiplied by 181 (the number of days in the most recent six-month period), then divided by 365. |
| Annualized Expense Ratios** | Class A | Class B | ||||||
| Deutsche DWS Variable Series II — DWS Alternative Asset Allocation VIP | .22 | % | .51 | % | ||||
| ** | The Fund invests in other funds and indirectly bears its proportionate share of fees and expenses incurred by the Underlying Funds in which the Fund is invested. These ratios do not include these indirect fees and expenses. |
For more information, please refer to the Fund’s prospectus.
These tables do not reflect charges and fees (“contract charges”) associated with the separate account that invests in the Fund or any variable life insurance policy or variable annuity contract for which the Fund is an investment option.
For an analysis of the fees associated with an investment in the Fund or similar funds, please refer to the current and hypothetical expense calculators for Variable Insurance Products which can be found at dws.com/calculators.
Deutsche DWS Variable Series II — DWS Alternative Asset Allocation VIP | | | 15 |
Table of Contents
The Trust’s policies and procedures for voting proxies for portfolio securities and information about how the Trust voted proxies related to its portfolio securities during the most recent 12-month period ended June 30 are available on our Web site — dws.com/en-us/resources/proxy-voting — or on the SEC’s Web site — sec.gov. To obtain a written copy of the Trust’s policies and procedures without charge, upon request, call us toll free at (800) 728-3337.
| 16 | | | Deutsche DWS Variable Series II — DWS Alternative Asset Allocation VIP |
Table of Contents
Advisory Agreement Board Considerations and Fee Evaluation
The Board of Trustees (hereinafter referred to as the “Board” or “Trustees”) approved the renewal of DWS Alternative Asset Allocation VIP’s (the “Fund”) investment management agreement (the “Agreement”) with DWS Investment Management Americas, Inc. (“DIMA”) andsub-advisory agreement (the“Sub-Advisory Agreement” and together with the Agreement, the “Agreements”) between DIMA and RREEF America L.L.C. (“RREEF”), an affiliate of DIMA, in September 2018.
In terms of the process that the Board followed prior to approving the Agreements, shareholders should know that:
| – | During the entire process, all of the Fund’s Trustees were independent of DIMA and its affiliates (the “Independent Trustees”). |
| – | The Board met frequently during the past year to discuss fund matters and dedicated a substantial amount of time to contract review matters. Over the course of several months, the Board’s Contract Committee reviewed extensive materials received from DIMA, independent third parties and independent counsel. These materials included an analysis of the Fund’s performance, fees and expenses, and profitability from a fee consultant retained by the Fund’s Independent Trustees (the “Fee Consultant”). Based on its evaluation of the information provided, the Contract Committee presented its findings and recommendations to the Board. The Board then reviewed the Contract Committee’s findings and recommendations. |
| – | The Board also received extensive information throughout the year regarding performance of the Fund. |
| – | The Independent Trustees regularly met privately with counsel to discuss contract review and other matters. In addition, the Independent Trustees were advised by the Fee Consultant in the course of their review of the Fund’s contractual arrangements and considered a comprehensive report prepared by the Fee Consultant in connection with their deliberations. |
| – | In connection with reviewing the Agreements, the Board also reviewed the terms of the Fund’sRule 12b-1 plan, distribution agreement, administrative services agreement, transfer agency agreement and other material service agreements. |
In connection with the contract review process, the Contract Committee and the Board considered the factors discussed below, among others. The Board also considered that DIMA has managed the Fund since its inception, and the Board believes that a long-term relationship with a capable, conscientious advisor is in the best interests of the Fund. The Board considered, generally, that shareholders chose to invest or remain invested in the Fund knowing that DIMA managed the Fund. DIMA and RREEF are part of DWS Group GmbH & Co. KGaA (“DWS Group”). DWS Group is a global asset management business that offers a wide range of investing expertise and resources, including research capabilities in many countries throughout the world. In 2018, approximately 20% of DWS Group’s shares were sold in an initial public offering, with Deutsche Bank AG owning the remaining shares.
As part of the contract review process, the Board carefully considered the fees and expenses of each DWS fund overseen by the Board in light of the fund’s performance. In many cases, this led to the negotiation and implementation of expense caps. As part of these negotiations, the Board indicated that it would consider relaxing these caps in future years following sustained improvements in performance, among other considerations.
While shareholders may focus primarily on fund performance and fees, the Fund’s Board considers these and many other factors, including the quality and integrity of DIMA’s and RREEF’s personnel and administrative support services provided by DIMA, such as back-office operations, fund valuations, and compliance policies and procedures.
Nature, Quality and Extent of Services.The Board considered the terms of the Agreements, including the scope of advisory services provided under the Agreements. The Board noted that, under the Agreements, DIMA and RREEF provide portfolio management services to the Fund and that, pursuant to a separate administrative services agreement, DIMA provides administrative services to the Fund. The Board considered the experience and skills of senior management and investment personnel and the resources made available to such personnel. Throughout the course of the year, the Board also received information regarding DIMA’s oversight of fundsub-advisers, including RREEF. The Board reviewed the Fund’s performance over short-term and long-term periods and compared those returns to various agreed-upon performance measures, including market index(es) and a peer universe compiled using information supplied by Morningstar Direct (“Morningstar”), an independent fund data service. The Board also noted that it has
Deutsche DWS Variable Series II — DWS Alternative Asset Allocation VIP | | | 17 |
Table of Contents
put into place a process of identifying “Funds in Review” (e.g., funds performing poorly relative to a peer universe), and receives additional reporting from DIMA regarding such funds and, where appropriate, DIMA’s plans to address underperformance. The Board believes this process is an effective manner of identifying and addressing underperforming funds. Based on the information provided, the Board noted that, for theone-, three- and five-year periods ended December 31, 2017, the Fund’s performance (Class A shares) was in the 1st quartile, 1st quartile and 2nd quartile, respectively, of the applicable Morningstar universe (the 1st quartile being the best performers and the 4th quartile being the worst performers). The Board also observed that the Fund has underperformed its benchmark in theone-, three- and five-year periods ended December 31, 2017.
Fees and Expenses. The Board considered the Fund’s investment management fee schedule,sub-advisory fee schedule, operating expenses and total expense ratios, and comparative information provided by Broadridge Financial Solutions, Inc. (“Broadridge”) and the Fee Consultant regarding investment management fee rates paid to other investment advisors by similar funds (1st quartile being the most favorable and 4th quartile being the least favorable). With respect to management fees paid to other investment advisors by similar funds, the Board noted that the contractual fee rates paid by the Fund, which include a 0.10% fee paid to DIMA under the Fund’s administrative services agreement, were higher than the median (3rd quartile) of the applicable Broadridge peer group (based on Broadridge data provided as of December 31, 2017). The Board noted that, since inception, DIMA has waived voluntarily a portion (0.15%) of the Fund’s management fee. With respect to anysub-advisory fee paid to RREEF, the Board noted that the fee is paid by DIMA out of its fee and not directly by the Fund. The Board noted the Fund’s total (net) operating expenses and noted that the expense limitations agreed to by DIMA were expected to help the Fund’s total (net) operating expenses remain competitive. The Board considered the Fund’s management fee rate as compared to fees charged by DIMA to comparable DWS U.S. registered funds (“DWS Funds”) and considered differences between the Fund and the comparable DWS Funds. The information requested by the Board as part of its review of fees and expenses also included information about institutional accounts (including anysub-advised funds and accounts) and funds offered primarily to European investors (“DWS Europe Funds”) managed by DWS Group. The Board noted that DIMA indicated that DWS Group does not manage any institutional accounts or DWS Europe Funds comparable to the Fund.
On the basis of the information provided, the Board concluded that management fees were reasonable and appropriate in light of the nature, quality and extent of services provided by DIMA and RREEF.
Profitability. The Board reviewed detailed information regarding revenues received by DIMA from advising the DWS Funds along with the estimated costs to DIMA, andpre-tax profits realized by DIMA, from advising the DWS Funds. The Board also received information regarding the estimated enterprise-wide profitability of DIMA and its affiliates with respect to all fund services in totality. The Board did not receive profitability information with respect to the Fund, but did receive such information with respect to the funds in which the Fund invests. The Board also reviewed certain publicly available information regarding the profitability of certain similar investment management firms. The Board noted that, while information regarding the profitability of such firms is limited (and in some cases is not necessarily prepared on a comparable basis), DIMA and its affiliates’ overall profitability with respect to the DWS Funds (after taking into account distribution and other services provided to the funds by DIMA and its affiliates) was lower than the overall profitability levels of most comparable firms for which such data was available.
Economies of Scale. The Board considered whether there are economies of scale with respect to the management of the Fund and whether the Fund benefits from any economies of scale. In this regard, the Board observed that while the Fund’s current investment management fee schedule does not include breakpoints, the Fund’s fee schedule represents an appropriate sharing between the Fund and DIMA of such economies of scale as may exist in the management of the Fund at current asset levels.
Other Benefits to DIMA and Its Affiliates. The Board also considered the character and amount of other incidental or“fall-out” benefits received by DIMA and its affiliates, including any fees received by DIMA for administrative services provided to the Fund, any fees received by an affiliate of DIMA for transfer agency services provided to the Fund and any fees received by an affiliate of DIMA for distribution services. The Board also considered benefits to DIMA related to brokerage and soft-dollar allocations, including allocating brokerage to pay for research generated by parties other than the executing broker dealers, which pertain primarily to funds investing in equity securities. In addition, the Board considered the incidental public relations benefits to DIMA related to DWS Funds advertising and cross-selling opportunities among DIMA products and services. The Board considered these benefits in reaching its conclusion that the Fund’s management fees were reasonable.
| 18 | | | Deutsche DWS Variable Series II — DWS Alternative Asset Allocation VIP |
Table of Contents
Compliance. The Board considered the significant attention and resources dedicated by DIMA to its compliance processes in recent years. The Board noted in particular (i) the experience, seniority and time commitment of the individuals serving as DIMA’s and the Fund’s chief compliance officers and (ii) the substantial commitment of resources by DIMA and its affiliates to compliance matters, including the retention of compliance personnel.
Based on all of the information considered and the conclusions reached, the Board unanimously determined that the continuation of the Agreements is in the best interests of the Fund. In making this determination, the Board did not give particular weight to any single factor identified above. The Board considered these factors over the course of numerous meetings, certain of which were in executive session with only the Independent Trustees and counsel present. It is possible that individual Independent Trustees may have weighed these factors differently in reaching their individual decisions to approve the continuation of the Agreements.
Deutsche DWS Variable Series II — DWS Alternative Asset Allocation VIP | | | 19 |
Table of Contents
| ||
VS2AAA-3 (R-028379-8 8/19) |
Table of Contents
June 30, 2019
Semiannual Report
Deutsche DWS Variable Series II
DWS CROCI® U.S. VIP
Beginning on January 1, 2021, as permitted by regulations adopted by the Securities and Exchange Commission, you may not be receiving paper copies of the Fund’s shareholder reports from the insurance company that offers your contract unless you specifically request paper copies from your insurance company or from your financial intermediary. Instead, the shareholder reports will be made available on a Web site, and your insurance company will notify you by mail each time a report is posted and provide you with a Web site link to access the report. Instructions for requesting paper copies will be provided by your insurance company.
If you already elected to receive shareholder reports electronically, you will not be affected by this change and you need not take any action. You may elect to receive shareholder reports and other communications from your insurance company electronically by following the instructions provided by your insurance company.
You may elect to receive all future reports in paper free of charge from your insurance company. If your insurance company informs you that future reports will be delivered via Web access, you can inform your insurance company that you wish to continue receiving paper copies of your shareholder reports by following the instructions provided by your insurance company.

Table of Contents
This report must be preceded or accompanied by a prospectus. To obtain an additional prospectus or summary prospectus, if available, call (800)728-3337 or your financial representative. We advise you to consider the Fund’s objectives, risks, charges and expenses carefully before investing. The summary prospectus and prospectus contain this and other important information about the Fund. Please read the prospectus carefully before you invest.
The Fund will be managed using the CROCI® Investment Process which is based on portfolio management’s belief that, over time, stocks which display more favorable financial metrics (for example, the CROCI® Economic P/E Ratio) as generated by this process may outperform stocks which display less favorable metrics. This premise may not prove to be correct and prospective investors should evaluate this assumption prior to investing in the Fund. Stocks may decline in value. The Fund may lend securities to approved institutions. Please read the prospectus for details.
The brand DWS represents DWS Group GmbH & Co. KGaA and any of its subsidiaries such as DWS Distributors, Inc. which offers investment products or DWS Investment Management Americas, Inc. and RREEF America L.L.C. which offer advisory services.
DWS Distributors, Inc., 222 South Riverside Plaza, Chicago, IL 60606, (800)621-1148
NOT FDIC/NCUA INSURED NO BANK GUARANTEE MAY LOSE VALUE NOT A DEPOSIT NOT INSURED BY ANY FEDERAL GOVERNMENT AGENCY
| 2 | | | Deutsche DWS Variable Series II — DWS CROCI® U.S. VIP |
Table of Contents
| Performance Summary | June 30, 2019 (Unaudited) |
Fund performance shown is historical, assumes reinvestment of all dividend and capital gain distributions and does not guarantee future results. Investment return and principal value fluctuate with changing market conditions so that, when redeemed, shares may be worth more or less than their original cost. Current performance may be lower or higher than the performance data quoted. Please contact your participating insurance company for the Fund’s most recentmonth-end performance. Performance does not reflect charges and fees (“contract charges”) associated with the separate account that invests in the Fund or any variable life insurance policy or variable annuity contract for which the Fund is an investment option. These charges and fees will reduce returns. While all share classes have the same underlying portfolio, their performance will differ.
The gross expense ratios of the Fund, as stated in the fee table of the prospectus dated May 1, 2019 are 0.84% and 1.16% for Class A and Class B shares, respectively, and may differ from the expense ratios disclosed in the Financial Highlights tables in this report.
Generally accepted accounting principles require adjustments to be made to the net assets of the Fund at period end for financial reporting purposes only, and as such, the total return based on the unadjusted net asset value per share may differ from the total return reported in the financial highlights.
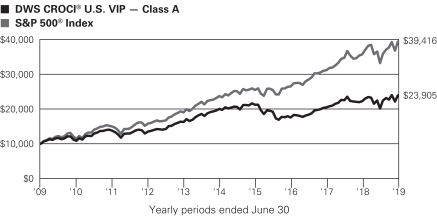
Growth of an Assumed $10,000 Investment in DWS CROCI® U.S. VIP
| The Standard & Poor’s 500 (S&P 500) Index is an unmanaged,capitalization-weighted index of 500 stocks. The index is designed to measure performance of the broad domestic economy through changes in the aggregate market value of 500 stocks representing all major industries.
Index returns do not reflect any fees or expenses and it is not possible to invest directly into an index.
Prior to May 1, 2017, the Fund operated with a different investment strategy. Prior to October 3, 2016, the Fund had a team that operated with a different investment strategy. Performance would have been different if the Fund’s current strategy had been in effect. |
| Comparative Results | ||||||||||||
| DWS CROCI® U.S. VIP | 6-Month‡ | 1-Year | 3-Year | 5-Year | 10-Year | |||||||
| Class A | Growth of $10,000 | $11,844 | $10,757 | $13,610 | $11,942 | $23,905 | ||||||
| Average annual total return | 18.44% | 7.57% | 10.82% | 3.61% | 9.11% | |||||||
| S&P 500® Index | Growth of $10,000 | $11,854 | $11,042 | $14,889 | $16,633 | $39,416 | ||||||
| Average annual total return | 18.54% | 10.42% | 14.19% | 10.71% | 14.70% | |||||||
| DWS CROCI® U.S. VIP | 6-Month‡ | 1-Year | 3-Year | 5-Year | 10-Year | |||||||
| Class B | Growth of $10,000 | $11,823 | $10,726 | $13,495 | $11,771 | $23,207 | ||||||
| Average annual total return | 18.23% | 7.26% | 10.51% | 3.31% | 8.78% | |||||||
| S&P 500® Index | Growth of $10,000 | $11,854 | $11,042 | $14,889 | $16,633 | $39,416 | ||||||
| Average annual total return | 18.54% | 10.42% | 14.19% | 10.71% | 14.70% | |||||||
The growth of $10,000 is cumulative.
| ‡ | Total returns shown for periods less than one year are not annualized. |
Deutsche DWS Variable Series II — DWS CROCI® U.S. VIP | | | 3 |
Table of Contents
| Portfolio Summary | (Unaudited) |
| Asset Allocation (As a % of Investment Portfolio) | 6/30/19 | 12/31/18 | ||||||
| Common Stocks | 99% | 97% | ||||||
| Cash Equivalents | 1% | 3% | ||||||
| 100% | 100% | |||||||
Sector Diversification (As a % of Investment Portfolio excluding Cash Equivalents) | 6/30/19 | 12/31/18 | ||||||
| Financials | 37% | 27% | ||||||
| Health Care | 15% | 16% | ||||||
| Materials | 10% | 10% | ||||||
| Industrials | 10% | 11% | ||||||
| Information Technology | 8% | 21% | ||||||
| Consumer Discretionary | 5% | 8% | ||||||
| Communication Services | 5% | — | ||||||
| Energy | 5% | — | ||||||
| Utilities | 5% | 2% | ||||||
| Consumer Staples | — | 5% | ||||||
| 100% | 100% | |||||||
Portfolio holdings and characteristics are subject to change.
For more complete details about the Fund’s investment portfolio, see page 5.
Following the Fund’s fiscal first and thirdquarter-end, a complete portfolio holdings listing is filed with the SEC on FormN-Q or Form N-PORT (available for filings after March 31, 2019). The Fund’s Form N-Q or Form N-PORT will be available on the SEC’s Web site at sec.gov. The Fund’s portfolio holdings are also posted on dws.com from time to time. Please read the Fund’s current prospectus for more information.
Di Kumble, CFA, Managing Director
John Moody, Vice President
Portfolio Managers
| 4 | | | Deutsche DWS Variable Series II — DWS CROCI® U.S. VIP |
Table of Contents
| Investment Portfolio | June 30, 2019 (Unaudited) |
| Shares | Value ($) | |||||||
| Common Stocks 99.3% |
| |||||||
| Communication Services 5.0% |
| |||||||
Entertainment 2.5% |
| |||||||
Viacom, Inc. “B” | 124,538 | 3,719,950 | ||||||
Media 2.5% |
| |||||||
CBS Corp. “B” | 73,213 | 3,653,329 | ||||||
| Consumer Discretionary 5.3% |
| |||||||
Auto Components 2.8% |
| |||||||
BorgWarner, Inc. | 98,387 | 4,130,286 | ||||||
Distributors 2.5% |
| |||||||
Genuine Parts Co. | 36,020 | 3,730,952 | ||||||
| Energy 4.9% |
| |||||||
Oil, Gas & Consumable Fuels |
| |||||||
Occidental Petroleum Corp. | 66,632 | 3,350,257 | ||||||
Phillips 66 | 41,435 | 3,875,830 | ||||||
|
| |||||||
| 7,226,087 | ||||||||
| Financials 36.3% |
| |||||||
Banks 24.6% |
| |||||||
Bank of America Corp. | 123,969 | 3,595,101 | ||||||
BB&T Corp. | 72,745 | 3,573,962 | ||||||
Citigroup, Inc. | 54,088 | 3,787,782 | ||||||
Citizens Financial Group, Inc. | 101,166 | 3,577,230 | ||||||
Huntington Bancshares, Inc. | 264,380 | 3,653,731 | ||||||
JPMorgan Chase & Co. | 31,640 | 3,537,352 | ||||||
M&T Bank Corp. | 21,267 | 3,616,879 | ||||||
PNC Financial Services Group, Inc. | 26,779 | 3,676,221 | ||||||
U.S. Bancorp. | 67,895 | 3,557,698 | ||||||
Wells Fargo & Co. | 77,059 | 3,646,432 | ||||||
|
| |||||||
| 36,222,388 | ||||||||
Capital Markets 4.5% |
| |||||||
Bank of New York Mellon Corp. | 76,602 | 3,381,978 | ||||||
State Street Corp. | 58,744 | 3,293,189 | ||||||
|
| |||||||
| 6,675,167 | ||||||||
Consumer Finance 7.2% |
| |||||||
Capital One Financial Corp. | 38,546 | 3,497,664 | ||||||
Discover Financial Services | 45,478 | 3,528,638 | ||||||
Synchrony Financial | 100,289 | 3,477,020 | ||||||
|
| |||||||
| 10,503,322 | ||||||||
| Health Care 15.1% |
| |||||||
Biotechnology 7.5% |
| |||||||
Amgen, Inc. | 20,748 | 3,823,441 | ||||||
Gilead Sciences, Inc. | 53,461 | 3,611,825 | ||||||
Regeneron Pharmaceuticals, Inc.* | 11,667 | 3,651,771 | ||||||
|
| |||||||
| 11,087,037 | ||||||||
Health Care Equipment & Supplies 2.7% |
| |||||||
Medtronic PLC | 40,189 | 3,914,007 | ||||||
Pharmaceuticals 4.9% |
| |||||||
Bristol-Myers Squibb Co. | 75,956 | 3,444,605 | ||||||
Merck & Co., Inc. | 44,638 | 3,742,896 | ||||||
|
| |||||||
| 7,187,501 | ||||||||
| Shares | Value ($) | |||||||
| Industrials 10.1% |
| |||||||
Electrical Equipment 2.6% |
| |||||||
Eaton Corp. PLC | 44,887 | 3,738,189 | ||||||
Machinery 5.0% |
| |||||||
Cummins, Inc. | 22,014 | 3,771,879 | ||||||
PACCAR, Inc. | 50,692 | 3,632,588 | ||||||
|
| |||||||
| 7,404,467 | ||||||||
Professional Services 2.5% |
| |||||||
ManpowerGroup, Inc. | 38,281 | 3,697,945 | ||||||
| Information Technology 7.7% |
| |||||||
IT Services 5.0% |
| |||||||
Cognizant Technology Solutions Corp. “A” | 59,197 | 3,752,498 | ||||||
International Business Machines Corp. | 26,185 | 3,610,911 | ||||||
|
| |||||||
| 7,363,409 | ||||||||
Semiconductors & Semiconductor Equipment 2.7% |
| |||||||
Micron Technology, Inc.* | 101,065 | 3,900,099 | ||||||
| Materials 10.2% |
| |||||||
Chemicals 5.2% |
| |||||||
Eastman Chemical Co. | 49,917 | 3,885,040 | ||||||
LyondellBasell Industries NV “A” | 44,135 | 3,801,348 | ||||||
|
| |||||||
| 7,686,388 | ||||||||
Containers & Packaging 2.5% |
| |||||||
WestRock Co. | 100,018 | 3,647,656 | ||||||
Metals & Mining 2.5% |
| |||||||
Nucor Corp. | 66,707 | 3,675,556 | ||||||
| Utilities 4.7% |
| |||||||
Electric Utilities 2.3% |
| |||||||
Exelon Corp. | 71,659 | 3,435,332 | ||||||
Multi-Utilities 2.4% |
| |||||||
DTE Energy Co. | 27,600 | 3,529,488 | ||||||
| Total Common Stocks(Cost $146,121,835) |
| 146,128,555 | ||||||
| Cash Equivalents 0.6% |
| |||||||
DWS Central Cash Management Government Fund, 2.40% (a) (Cost $820,691) | 820,691 | 820,691 | ||||||
| % of Net Assets | Value ($) | |||||||
Total Investment Portfolio (Cost $146,942,526) | 99.9 | 146,949,246 | ||||||
| Other Assets and Liabilities, Net | 0.1 | 132,128 | ||||||
| Net Assets | 100.0 | 147,081,374 | ||||||
The accompanying notes are an integral part of the financial statements.
Deutsche DWS Variable Series II — DWS CROCI® U.S. VIP | | | 5 |
Table of Contents
A summary of the Fund’s transactions with affiliated investments during the period ended June 30, 2019 are as follows:
| Value ($) at 12/31/2018 | Purchases Cost ($) | Sales Proceeds ($) | Net Realized Gain/ (Loss) ($) | Net Change in Unrealized Appreciation (Depreciation) ($) | Income ($) | Capital Gain Distributions ($) | Number of Shares at 6/30/2019 | Value ($) at 6/30/2019 | ||||||||||||||||||||||||
Cash Equivalents 0.6% |
| |||||||||||||||||||||||||||||||
DWS Central Cash Management Government Fund, 2.40% (a) |
| |||||||||||||||||||||||||||||||
| 3,576,006 | 4,470,261 | 7,225,576 | — | — | 21,158 | — | 820,691 | 820,691 | ||||||||||||||||||||||||
| * | Non-income producing security. |
| (a) | Affiliated fund managed by DWS Investment Management Americas, Inc. The rate shown is the annualizedseven-day yield at period end. |
Fair Value Measurements
Various inputs are used in determining the value of the Fund’s investments. These inputs are summarized in three broad levels. Level 1 includes quoted prices in active markets for identical securities. Level 2 includes other significant observable inputs (including quoted prices for similar securities, interest rates, prepayment speeds and credit risk). Level 3 includes significant unobservable inputs (including the Fund’s own assumptions in determining the fair value of investments). The level assigned to the securities valuations may not be an indication of the risk or liquidity associated with investing in those securities.
The following is a summary of the inputs used as of June 30, 2019 in valuing the Fund’s investments. For information on the Fund’s policy regarding the valuation of investments, please refer to the Security Valuation section of Note A in the accompanying Notes to Financial Statements.
| Assets | Level 1 | Level 2 | Level 3 | Total | ||||||||||||
| Common Stocks (b) | $ | 146,128,555 | $ | — | $ | — | $ | 146,128,555 | ||||||||
| Short-Term Investment | 820,691 | — | — | 820,691 | ||||||||||||
| Total | $ | 146,949,246 | $ | — | $ | — | $ | 146,949,246 | ||||||||
| (b) | See Investment Portfolio for additional detailed categorizations. |
The accompanying notes are an integral part of the financial statements.
| 6 | | | Deutsche DWS Variable Series II — DWS CROCI® U.S. VIP |
Table of Contents
Statement of Assets and Liabilities
| as of June 30, 2019 (Unaudited) |
| Assets | ||||
| Investments innon-affiliated securities, at value (cost $146,121,835) | $ | 146,128,555 | ||
| Investment in DWS Central Cash Management Government Fund (cost $820,691) | 820,691 | |||
| Cash | 10,000 | |||
| Receivable for Fund shares sold | 921 | |||
| Dividends receivable | 315,532 | |||
| Interest receivable | 1,995 | |||
| Other assets | 1,543 | |||
| Total assets | 147,279,237 | |||
| Liabilities | ||||
| Payable for Fund shares redeemed | 67,631 | |||
| Accrued management fee | 60,501 | |||
| Accrued Trustees’ fees | 540 | |||
| Other accrued expenses and payables | 69,191 | |||
| Total liabilities | 197,863 | |||
| Net assets, at value | $ | 147,081,374 | ||
| Net Assets Consist of | ||||
| Distributable earnings (loss) | 4,868,986 | |||
| Paid-in capital | 142,212,388 | |||
| Net assets, at value | $ | 147,081,374 | ||
| Net Asset Value | ||||
Class A | ||||
| Net Asset Value, and redemption price per share ($143,628,935 ÷ 9,998,968 outstanding shares of beneficial interest, no par value, unlimited shares authorized) | $ | 14.36 | ||
Class B | ||||
| Net Asset Value, offering and redemption price per share ($3,452,439 ÷ 239,227 outstanding shares of beneficial interest, no par value, unlimited shares authorized) | $ | 14.43 | ||
| for the six months ended June 30, 2019 (Unaudited) | ||
| Investment Income | ||||
| Income: | ||||
| Dividends | $ | 1,840,546 | ||
| Income distributions — DWS Central Cash Management Government Fund | 21,158 | |||
| Total income | 1,861,704 | |||
| Expenses: | ||||
| Management fee | 461,076 | |||
| Administration fee | 70,935 | |||
| Services to Shareholders | 1,337 | |||
| Recordkeeping fee (Class B) | 1,162 | |||
| Distribution service fee (Class B) | 4,164 | |||
| Custodian fee | 2,173 | |||
| Professional fees | 37,737 | |||
| Reports to shareholders | 14,511 | |||
| Trustees’ fees and expenses | 4,525 | |||
| Other | 5,539 | |||
| Total expenses before expense reductions | 603,159 | |||
| Expense reductions | (101,286 | ) | ||
| Total expenses after expense reductions | 501,873 | |||
| Net investment income | 1,359,831 | |||
| Realized and Unrealized gain (loss) | ||||
| Net realized gain (loss) from investments | 4,050,225 | |||
| Change in net unrealized appreciation (depreciation) on investments | 18,079,837 | |||
| Net gain (loss) | 22,130,062 | |||
| Net increase (decrease) in net assets resulting from operations | $ | 23,489,893 | ||
The accompanying notes are an integral part of the financial statements.
Deutsche DWS Variable Series II — DWS CROCI® U.S. VIP | | | 7 |
Table of Contents
Statements of Changes in Net Assets
| Six Months Ended June 30, 2019 | Year Ended December 31, | |||||||
| Increase (Decrease) in Net Assets | (Unaudited) | 2018 | ||||||
| Operations: | ||||||||
| Net investment income (loss) | $ | 1,359,831 | $ | 2,797,835 | ||||
| Net realized gain (loss) | 4,050,225 | 12,382,135 | ||||||
| Change in net unrealized appreciation (depreciation) | 18,079,837 | (30,136,434 | ) | |||||
| Net increase (decrease) in net assets resulting from operations | 23,489,893 | (14,956,464 | ) | |||||
| Distributions to shareholders: | ||||||||
Class A | (14,271,121 | ) | (14,077,923 | ) | ||||
Class B | (332,950 | ) | (318,032 | ) | ||||
| Total distributions | (14,604,071 | ) | (14,395,955 | ) | ||||
Class A | ||||||||
| Proceeds from shares sold | 2,408,017 | 2,162,910 | ||||||
| Reinvestment of distributions | 14,271,121 | 14,077,923 | ||||||
| Payments of shares redeemed | (6,464,218 | ) | (15,569,405 | ) | ||||
| Net increase (decrease) in net assets from Class A share transactions | 10,214,920 | 671,428 | ||||||
Class B | ||||||||
| Proceeds from shares sold | 31,791 | 1,589,334 | ||||||
| Reinvestment of distributions | 332,950 | 318,032 | ||||||
| Payments of shares redeemed | (140,029 | ) | (1,755,739 | ) | ||||
| Net increase (decrease) in net assets from Class B share transactions | 224,712 | 151,627 | ||||||
| Increase (decrease) in net assets | 19,325,454 | (28,529,364 | ) | |||||
| Net assets at beginning of period | 127,755,920 | 156,285,284 | ||||||
| Net assets at end of period | $ | 147,081,374 | $ | 127,755,920 | ||||
| Other Information | ||||||||
Class A | ||||||||
| Shares outstanding at beginning of period | 9,266,278 | 9,181,648 | ||||||
| Shares sold | 166,316 | 140,074 | ||||||
| Shares issued to shareholders in reinvestment of distributions | 1,002,890 | 953,143 | ||||||
| Shares redeemed | (436,516 | ) | (1,008,587 | ) | ||||
| Net increase (decrease) in Class A shares | 732,690 | 84,630 | ||||||
| Shares outstanding at end of period | 9,998,968 | 9,266,278 | ||||||
Class B | ||||||||
| Shares outstanding at beginning of period | 223,302 | 210,410 | ||||||
| Shares sold | 2,176 | 104,157 | ||||||
| Shares issued to shareholders in reinvestment of distributions | 23,283 | 21,431 | ||||||
| Shares redeemed | (9,534 | ) | (112,696 | ) | ||||
| Net increase (decrease) in Class B shares | 15,925 | 12,892 | ||||||
| Shares outstanding at end of period | 239,227 | 223,302 | ||||||
The accompanying notes are an integral part of the financial statements.
| 8 | | | Deutsche DWS Variable Series II — DWS CROCI® U.S. VIP |
Table of Contents
| Six Months Ended 6/30/19 | Years Ended December 31, | |||||||||||||||||||||||
| Class A | (Unaudited) | 2018 | 2017 | 2016 | 2015 | 2014 | ||||||||||||||||||
| Selected Per Share Data | ||||||||||||||||||||||||
| Net asset value, beginning of period | $ | 13.46 | $ | 16.64 | $ | 13.75 | $ | 15.29 | $ | 17.38 | $ | 15.97 | ||||||||||||
| Income (loss) from investment operations: | ||||||||||||||||||||||||
Net investment income (loss)a | .14 | .29 | .24 | .23 | .11 | .24 | ||||||||||||||||||
Net realized and unrealized gain (loss) | 2.33 | (1.89 | ) | 2.88 | (.93 | ) | (1.20 | ) | 1.45 | |||||||||||||||
Total from investment operations | 2.47 | (1.60 | ) | 3.12 | (.70 | ) | (1.09 | ) | 1.69 | |||||||||||||||
| Less distributions from: | ||||||||||||||||||||||||
Net investment income | (.30 | ) | (.41 | ) | (.23 | ) | (.14 | ) | (.25 | ) | (.28 | ) | ||||||||||||
Net realized gains on investment transactions | (1.27 | ) | (1.17 | ) | — | (.70 | ) | (.75 | ) | — | ||||||||||||||
Total distributions | (1.57 | ) | (1.58 | ) | (.23 | ) | (.84 | ) | (1.00 | ) | (.28 | ) | ||||||||||||
| Net asset value, end of period | $ | 14.36 | $ | 13.46 | $ | 16.64 | $ | 13.75 | $ | 15.29 | $ | 17.38 | ||||||||||||
| Total Return (%)b | 18.44 | ** | (10.50 | ) | 22.88 | c | (4.39 | ) | (6.87 | ) | 10.72 | |||||||||||||
| Ratios to Average Net Assets and Supplemental Data | ||||||||||||||||||||||||
| Net assets, end of period ($ millions) | 144 | 125 | 153 | 227 | 293 | 430 | ||||||||||||||||||
| Ratio of expenses before expense reductions (%)d | .84 | * | .84 | .82 | .81 | .78 | .78 | |||||||||||||||||
| Ratio of expenses after expense reductions (%)d | .70 | * | .72 | .72 | .74 | .73 | .73 | |||||||||||||||||
| Ratio of net investment income (loss) (%) | 1.92 | * | 1.89 | 1.59 | 1.66 | .65 | 1.43 | |||||||||||||||||
| Portfolio turnover rate (%) | 53 | ** | 100 | 97 | 293 | 121 | 133 | |||||||||||||||||
| a | Based on average shares outstanding during the period. |
| b | Total return would have been lower had certain expenses not been reduced. |
| c | The Fund’s total return includes a reimbursement by the Adviser for commission costs incurred in connection with purchases and sales of portfolio assets due to the change in investment strategy, which otherwise would have reduced total return by 0.03%. |
| d | Expense ratio does not reflect charges and fees associated with the separate account that invests in the Fund or any variable life insurance policy or variable annuity contract for which the Fund is an investment option. |
| * | Annualized |
| ** | Not annualized |
| Six Months Ended 6/30/19 | Years Ended December 31, | |||||||||||||||||||||||
| Class B | (Unaudited) | 2018 | 2017 | 2016 | 2015 | 2014 | ||||||||||||||||||
| Selected Per Share Data | ||||||||||||||||||||||||
| Net asset value, beginning of period | $ | 13.50 | $ | 16.67 | $ | 13.78 | $ | 15.31 | $ | 17.40 | $ | 15.99 | ||||||||||||
| Income (loss) from investment operations: | ||||||||||||||||||||||||
Net investment income (loss)a | .12 | .24 | .20 | .19 | .06 | .18 | ||||||||||||||||||
Net realized and unrealized gain (loss) | 2.33 | (1.88 | ) | 2.87 | (.92 | ) | (1.21 | ) | 1.46 | |||||||||||||||
Total from investment operations | 2.45 | (1.64 | ) | 3.07 | (.73 | ) | (1.15 | ) | 1.64 | |||||||||||||||
| Less distributions from: | ||||||||||||||||||||||||
Net investment income | (.25 | ) | (.36 | ) | (.18 | ) | (.10 | ) | (.19 | ) | (.23 | ) | ||||||||||||
Net realized gains on investment transactions | (1.27 | ) | (1.17 | ) | — | (.70 | ) | (.75 | ) | — | ||||||||||||||
Total distributions | (1.52 | ) | (1.53 | ) | (.18 | ) | (.80 | ) | (.94 | ) | (.23 | ) | ||||||||||||
| Net asset value, end of period | $ | 14.43 | $ | 13.50 | $ | 16.67 | $ | 13.78 | $ | 15.31 | $ | 17.40 | ||||||||||||
| Total Return (%)b | 18.23 | ** | (10.71 | ) | 22.45 | c | (4.62 | ) | (7.16 | ) | 10.36 | |||||||||||||
| Ratios to Average Net Assets and Supplemental Data | ||||||||||||||||||||||||
| Net assets, end of period ($ millions) | 3 | 3 | 4 | 4 | 4 | 5 | ||||||||||||||||||
| Ratio of expenses before expense reductions (%)d | 1.17 | * | 1.16 | 1.15 | 1.13 | 1.10 | 1.09 | |||||||||||||||||
| Ratio of expenses after expense reductions (%)d | 1.02 | * | 1.04 | 1.03 | 1.05 | 1.04 | 1.04 | |||||||||||||||||
| Ratio of net investment income (loss) (%) | 1.60 | * | 1.55 | 1.31 | 1.37 | .35 | 1.10 | |||||||||||||||||
| Portfolio turnover rate (%) | 53 | ** | 100 | 97 | 293 | 121 | 133 | |||||||||||||||||
| a | Based on average shares outstanding during the period. |
| b | Total return would have been lower had certain expenses not been reduced. |
| c | The Fund’s total return includes a reimbursement by the Adviser for commission costs incurred in connection with purchases and sales of portfolio assets due to the change in investment strategy, which otherwise would have reduced total return by 0.03%. |
| d | Expense ratio does not reflect charges and fees associated with the separate account that invests in the Fund or any variable life insurance policy or variable annuity contract for which the Fund is an investment option. |
| * | Annualized |
| ** | Not annualized |
The accompanying notes are an integral part of the financial statements.
Deutsche DWS Variable Series II — DWS CROCI® U.S. VIP | | | 9 |
Table of Contents
| Notes to Financial Statements | (Unaudited) |
A. Organization and Significant Accounting Policies
DWS CROCI® U.S. VIP (the “Fund”) is a diversified series of Deutsche DWS Variable Series II (the “Trust”), which is registered under the Investment Company Act of 1940, as amended (the “1940 Act”), as anopen-end management investment company organized as a Massachusetts business trust.
Multiple Classes of Shares of Beneficial Interest. The Fund offers two classes of shares (Class A shares and Class B shares). Sales of Class B shares are subject to recordkeeping fees up to 0.15% and Rule12b-1 fees under the 1940 Act equal to an annual rate of 0.25% of the average daily net assets of the Class B shares of the Fund. Class A shares are not subject to such fees.
Investment income, realized and unrealized gains and losses, and certainfund-level expenses and expense reductions, if any, are borne pro rata on the basis of relative net assets by the holders of all classes of shares except that each class bears certain expenses unique to that class (including the applicable Rule12b-1 fee and recordkeeping fees). Differences inclass-level expenses may result in payment of different per share dividends by class. All shares have equal rights with respect to voting subject toclass-specific arrangements.
The Fund’s financial statements are prepared in accordance with accounting principles generally accepted in the United States of America (“U.S. GAAP”) which require the use of management estimates. Actual results could differ from those estimates. The Fund qualifies as an investment company under Topic 946 of Accounting Standards Codification of U.S. GAAP. The policies described below are followed consistently by the Fund in the preparation of its financial statements.
Security Valuation. Investments are stated at value determined as of the close of regular trading on the New York Stock Exchange on each day the exchange is open for trading.
Various inputs are used in determining the value of the Fund’s investments. These inputs are summarized in three broad levels. Level 1 includes quoted prices in active markets for identical securities. Level 2 includes other significant observable inputs (including quoted prices for similar securities, interest rates, prepayment speeds and credit risk). Level 3 includes significant unobservable inputs (including the Fund’s own assumptions in determining the fair value of investments). The level assigned to the securities valuations may not be an indication of the risk or liquidity associated with investing in those securities.
Equity securities are valued at the most recent sale price or official closing price reported on the exchange (U.S. or foreign) orover-the-counter market on which they trade. Securities for which no sales are reported are valued at the calculated mean between the most recent bid and asked quotations on the relevant market or, if a mean cannot be determined, at the most recent bid quotation. Equity securities are generally categorized as Level 1.
Investments inopen-end investment companies are valued at their net asset value each business day and are categorized as Level 1.
Securities and other assets for which market quotations are not readily available or for which the above valuation procedures are deemed not to reflect fair value are valued in a manner that is intended to reflect their fair value as determined in accordance with procedures approved by the Board and are generally categorized as Level 3. In accordance with the Fund’s valuation procedures, factors considered in determining value may include, but are not limited to, the type of the security; the size of the holding; the initial cost of the security; the existence of any contractual restrictions on the security’s disposition; the price and extent of public trading in similar securities of the issuer or of comparable companies; quotations or evaluated prices frombroker-dealers and/or pricing services; information obtained from the issuer, analysts, and/or the appropriate stock exchange (forexchange-traded securities); an analysis of the company’s or issuer’s financial statements; an evaluation of the forces that influence the issuer and the market(s) in which the security is purchased and sold; and with respect to debt securities, the maturity, coupon, creditworthiness, currency denomination and the movement of the market in which the security is normally traded. The value determined under these procedures may differ from published values for the same securities.
Disclosure about the classification of fair value measurements is included in a table following the Fund’s Investment Portfolio.
Foreign Currency Translations. The books and records of the Fund are maintained in U.S. dollars. Investment securities and other assets and liabilities denominated in a foreign currency are translated into
| 10 | | | Deutsche DWS Variable Series II — DWS CROCI® U.S. VIP |
Table of Contents
U.S. dollars at the prevailing exchange rates at period end. Purchases and sales of investment securities, income and expenses are translated into U.S. dollars at the prevailing exchange rates on the respective dates of the transactions.
Net realized and unrealized gains and losses on foreign currency transactions represent net gains and losses between trade and settlement dates on securities transactions, the acquisition and disposition of foreign
currencies, and the difference between the amount of net investment income accrued and the U.S. dollar amount actually received. The portion of both realized and unrealized gains and losses on investments that results from fluctuations in foreign currency exchange rates is not separately disclosed but is included with net realized and unrealized gain/appreciation and loss/depreciation on investments.
Securities Lending. Deutsche Bank AG, as lending agent, lends securities of the Fund to certain financial institutions under the terms of its securities lending agreement. During the term of the loans, the Fund continues to receive interest and dividends generated by the securities and to participate in any changes in their market value. The Fund requires the borrowers of the securities to maintain collateral with the Fund consisting of either cash or liquid, unencumbered assets having a value at least equal to the value of the securities loaned. When the collateral falls below specified amounts, the lending agent will use its best effort to obtain additional collateral on the next business day to meet required amounts under the securities lending agreement. During the six months ended June 30, 2019, the Fund invested the cash collateral into a joint trading account in DWS Government & Agency Securities Portfolio, an affiliated money market fund managed by DWS Investment Management Americas, Inc. DWS Investment Management Americas, Inc. receives a management/administration fee (0.11% annualized effective rate as of June 30, 2019) on the cash collateral invested in DWS Government & Agency Securities Portfolio. The Fund receives compensation for lending its securities either in the form of fees or by earning interest on invested cash collateral net of borrower rebates and fees paid to a lending agent. Either the Fund or the borrower may terminate the loan at any time, and the borrower, after notice, is required to return borrowed securities within a standard time period. There may be risks of delay and costs in recovery of securities or even loss of rights in the collateral should the borrower of the securities fail financially. If the Fund is not able to recover securities lent, the Fund may sell the collateral and purchase a replacement investment in the market, incurring the risk that the value of the replacement security is greater than the value of the collateral. The Fund is also subject to all investment risks associated with the reinvestment of any cash collateral received, including, but not limited to, interest rate, credit and liquidity risk associated with such investments.
During the period ended June 30, 2019, the Fund had no securities on loan.
Federal Income Taxes. The Fund’s policy is to comply with the requirements of the Internal Revenue Code, as amended, which are applicable to regulated investment companies and to distribute all of its taxable income to its shareholders.
At June 30, 2019, the aggregate cost of investments for federal income tax purposes was $147,347,001. The net unrealized depreciation for all investments based on tax cost was $397,755. This consisted of aggregate gross unrealized appreciation for all investments in which there was an excess of value over tax cost of $7,071,937 aggregate gross unrealized depreciation for all investments in which was an excess of tax cost over value of $7,469,692.
The Fund has reviewed the tax positions for the open tax years as of December 31, 2018 and has determined that no provision for income tax and/or uncertain tax positions is required in the Fund’s financial statements. The Fund’s federal tax returns for the prior three fiscal years remain open subject to examination by the Internal Revenue Service.
Distribution of Income and Gains. Distributions from net investment income of the Fund, if any, is declared and distributed to shareholders annually. Net realized gains from investment transactions, in excess of available capital loss carryforwards, would be taxable to the Fund if not distributed and, therefore, will be distributed to shareholders at least annually. The Fund may also make additional distributions for tax purposes if necessary.
The timing and characterization of certain income and capital gain distributions are determined annually in accordance with federal tax regulations which may differ from accounting principles generally accepted in the United States of America. These differences primarily relate to certain securities sold at a loss. As a result, net investment income (loss) and net realized gain (loss) on investment transactions for a reporting period may differ significantly from distributions during such period. Accordingly, the Fund may periodically make reclassifications among certain of its capital accounts without impacting the net asset value of the Fund.
The tax character of current year distributions will be determined at the end of the current fiscal year.
Deutsche DWS Variable Series II — DWS CROCI® U.S. VIP | | | 11 |
Table of Contents
Expenses. Expenses of the Trust arising in connection with a specific fund are allocated to that fund. Other Trust expenses which cannot be directly attributed to a fund are apportioned among the funds in the Trust based upon the relative net assets or other appropriate measures.
Contingencies. In the normal course of business, the Fund may enter into contracts with service providers that contain general indemnification clauses. The Fund’s maximum exposure under these arrangements is unknown, as this would involve future claims that may be made against the Fund that have not yet been made. However, based on experience, the Fund expects the risk of loss to be remote.
Other. Investment transactions are accounted for on a trade date plus one basis for daily net asset value calculations. However, for financial reporting purposes, investment transactions are reported on trade date. Interest income is recorded on the accrual basis. Dividend income is recorded on theex-dividend date net of foreign withholding taxes. Realized gains and losses from investment transactions are recorded on an identified cost basis. Proceeds from litigation payments, if any, are included in net realized gain (loss) from investments.
B. Purchases and Sales of Securities
During the six months ended June 30, 2019, purchases and sales of investment transactions (excludingshort-term investments) aggregated $74,201,205 and $74,213,405, respectively.
C. Related Parties
Management Agreement. Under the Investment Management Agreement with DWS Investment Management Americas, Inc. (“DIMA” or the “Advisor”), an indirect, wholly owned subsidiary of DWS Group GmbH & Co. KGaA (“DWS Group”), the Advisor directs the investments of the Fund in accordance with its investment objectives, policies and restrictions. The Advisor determines the securities, instruments and other contracts relating to investments to be purchased, sold or entered into by the Fund.
Under the Investment Management Agreement with the Advisor, the Fund pays a monthly management fee based on the Fund’s average daily net assets, computed and accrued daily and payable monthly, at the following annual rates:
| First $250 million | .650 | % | ||
| Next $750 million | .625 | % | ||
| Next $1.5 billion | .600 | % | ||
| Next $2.5 billion | .575 | % | ||
| Next $2.5 billion | .550 | % | ||
| Next $2.5 billion | .525 | % | ||
| Next $2.5 billion | .500 | % | ||
| Over $12.5 billion | .475 | % |
Accordingly, for the six months ended June 30, 2019, the fee pursuant to the Investment Management Agreement was equivalent to an annualized rate (exclusive of any applicable waivers/reimbursements) of 0.65% of the Fund’s average daily net assets.
For the period from January 1, 2019 through April 30, 2020, the Advisor has contractually agreed to waive all or a portion of its fee and/or reimburse certain operating expenses of the Fund to the extent necessary to maintain the total annual operating expenses (excluding certain expenses such as extraordinary expenses, taxes, brokerage and interest expense) of each class as follows:
| Class A | .70 | % | ||
| Class B | 1.02 | % |
For the six months ended June 30, 2019, fees waived and/or expenses reimbursed for each class are as follows:
| Class A | $ | 98,808 | ||
| Class B | 2,478 | |||
| $ | 101,286 | |||
Administration Fee. Pursuant to an Administrative Services Agreement, DIMA provides most administrative services to the Fund. For all services provided under the Administrative Services Agreement, the Fund pays
| 12 | | | Deutsche DWS Variable Series II — DWS CROCI® U.S. VIP |
Table of Contents
DIMA an annual fee (“Administration Fee”) of 0.10% of the Fund’s average daily net assets, computed and accrued daily and payable monthly. For the six months ended June 30, 2019, the Administration Fee was $70,935, of which $11,792 is unpaid.
Service Provider Fees. DWS Service Company (“DSC”), an affiliate of the Advisor, is the transfer agent,dividend-paying agent and shareholder service agent for the Fund. Pursuant to asub-transfer agency agreement between DSC and DST Systems, Inc. (“DST”), DSC has delegated certain transfer agent,dividend-paying agent and shareholder service agent functions to DST. DSC compensates DST out of the shareholder servicing fee it receives from the Fund. For the six months ended June 30, 2019, the amounts charged to the Fund by DSC were as follows:
| Services to Shareholders | Total Aggregated | Unpaid at June 30, 2019 | ||||||
| Class A | $ | 190 | $ | 63 | ||||
| Class B | 110 | 36 | ||||||
| $ | 300 | $ | 99 | |||||
Distribution Service Agreement. Under the Fund’s Class B12b-1 plan, DWS Distributors, Inc. (“DDI”) received a fee (“Distribution Service Fee”) of 0.25% of average daily net assets of Class B shares. For the six months ended June 30, 2019, the Distribution Service Fee aggregated $4,164, of which $691 is unpaid.
Typesetting and Filing Service Fees. Under an agreement with the Fund, DIMA is compensated for providing certainpre-press and regulatory filing services to the Fund. For the six months ended June 30, 2019, the amount charged to the Fund by DIMA included in the Statement of Operations under “Reports to shareholders” aggregated $4,647, all of which is unpaid.
Trustees’ Fees and Expenses. The Fund paid retainer fees to each Trustee not affiliated with the Advisor, plus specified amounts to the Board Chairperson and to each committee Chairperson.
Affiliated Cash Management Vehicles. The Fund may invest uninvested cash balances in DWS Central Cash Management Government Fund and DWS ESG Liquidity Fund, affiliated money market funds which are managed by the Advisor. Each affiliated money market fund is managed in accordance withRule 2a-7 under the 1940 Act, which governs the quality, maturity, diversity and liquidity of instruments in which a money market fund may invest. DWS Central Cash Management Government Fund seeks to maintain a stable net asset value, and DWS ESG Liquidity Fund maintains a floating net asset value. The Fund indirectly bears its proportionate share of the expenses of each affiliated money market fund in which it invests. DWS Central Cash Management Government Fund does not pay the Advisor an investment management fee. To the extent that DWS ESG Liquidity Fund pays an investment management fee to the Advisor, the Advisor will waive an amount of the investment management fee payable to the Advisor by the Fund equal to the amount of the investment management fee payable on the Fund’s assets invested in DWS ESG Liquidity Fund.
D. Ownership of the Fund
At June 30, 2019, two participating insurance companies were owners of record of 10% or more of the total outstanding Class A shares of the Fund, each owning 62% and 29%. Two participating insurance companies were the owners of record of 10% or more of the total outstanding Class B shares of the Fund, each owning 62% and 15%.
E. Line of Credit
The Fund and other affiliated funds (the “Participants”) share in a $400 million revolving credit facility provided by a syndication of banks. The Fund may borrow for temporary or emergency purposes, including the meeting of redemption requests that otherwise might require the untimely disposition of securities. The Participants are charged an annual commitment fee which is allocated based on net assets, among each of the Participants. Interest is calculated at a rate per annum equal to the sum of the Federal Funds Rate plus 1.25 percent plus if theone-month LIBOR exceeds the Federal Funds Rate, the amount of such excess. The Fund may borrow up to a maximum of 33 percent of its net assets under the agreement. The Fund had no outstanding loans at June 30, 2019.
Deutsche DWS Variable Series II — DWS CROCI® U.S. VIP | | | 13 |
Table of Contents
| Information About Your Fund’s Expenses | (Unaudited) |
As an investor of the Fund, you incur two types of costs: ongoing expenses and transaction costs. Ongoing expenses include management fees, distribution and service(12b-1) fees and other Fund expenses. Examples of transaction costs include contract charges, which are not shown in this section. The following tables are intended to help you understand your ongoing expenses (in dollars) of investing in the Fund and to help you compare these expenses with the ongoing expenses of investing in other mutual funds. In the most recentsix-month period, the Fund limited these expenses; had it not done so, expenses would have been higher. The example in the table is based on an investment of $1,000 invested at the beginning of thesix-month period and held for the entire period (January 1, 2019 to June 30, 2019).
The tables illustrate your Fund’s expenses in two ways:
| – | Actual Fund Return. This helps you estimate the actual dollar amount of ongoing expenses (but not transaction costs) paid on a $1,000 investment in the Fund using the Fund’s actual return during the period. To estimate the expenses you paid over the period, simply divide your account value by $1,000 (for example, an $8,600 account value divided by $1,000 = 8.6), then multiply the result by the number in the “Expenses Paid per $1,000” line under the share class you hold. |
| – | Hypothetical 5% Fund Return. This helps you to compare your Fund’s ongoing expenses (but not transaction costs) with those of other mutual funds using the Fund’s actual expense ratio and a hypothetical rate of return of 5% per year before expenses. Examples using a 5% hypothetical Fund return may be found in the shareholder reports of other mutual funds. The hypothetical account values and expenses may not be used to estimate the actual ending account balance or expenses you paid for the period. |
Please note that the expenses shown in these tables are meant to highlight your ongoing expenses only and do not reflect any transaction costs. The “Expenses Paid per $1,000” line of the tables is useful in comparing ongoing expenses only and will not help you determine the relative total expense of owning different funds. If these transaction costs had been included, your costs would have been higher.
| Expenses and Value of a $1,000 Investment for the six months ended June 30, 2019 | ||||||||
| Actual Fund Return | Class A | Class B | ||||||
| Beginning Account Value 1/1/19 | $ | 1,000.00 | $ | 1,000.00 | ||||
| Ending Account Value 6/30/19 | $ | 1,184.40 | $ | 1,182.30 | ||||
| Expenses Paid per $1,000* | $ | 3.79 | $ | 5.52 | ||||
| Hypothetical 5% Fund Return | Class A | Class B | ||||||
| Beginning Account Value 1/1/19 | $ | 1,000.00 | $ | 1,000.00 | ||||
| Ending Account Value 6/30/19 | $ | 1,021.32 | $ | 1,019.74 | ||||
| Expenses Paid per $1,000* | $ | 3.51 | $ | 5.11 | ||||
| * | Expenses are equal to the Fund’s annualized expense ratio for each share class, multiplied by the average account value over the period, multiplied by 181 (the number of days in the most recentsix-month period), then divided by 365. |
| Annualized Expense Ratios | Class A | Class B | ||||||
| Deutsche DWS Variable Series II — DWS CROCI®U.S. VIP | .70 | % | 1.02 | % | ||||
For more information, please refer to the Fund’s prospectus.
These tables do not reflect charges and fees (“contract charges”) associated with the separate account that invests in the Fund or any variable life insurance policy or variable annuity contract for which the Fund is an investment option.
For an analysis of the fees associated with an investment in the Fund or similar funds, please refer to the current and hypothetical expense calculators for Variable Insurance Products which can be found at dws.com/calculators.
| 14 | | | Deutsche DWS Variable Series II — DWS CROCI® U.S. VIP |
Table of Contents
The Trust’s policies and procedures for voting proxies for portfolio securities and information about how the Trust voted proxies related to its portfolio securities during the most recent12-month period ended June 30 are available on our Web site — dws.com/en-us/resources/proxy-voting — or on the SEC’s Web site — sec.gov. To obtain a written copy of the Trust’s policies and procedures without charge, upon request, call us toll free at (800)728-3337.
Deutsche DWS Variable Series II — DWS CROCI® U.S. VIP | | | 15 |
Table of Contents
Advisory Agreement Board Considerations and Fee Evaluation
The Board of Trustees (hereinafter referred to as the “Board” or “Trustees”) approved the renewal of DWS CROCI® U.S. VIP’s (the “Fund”) investment management agreement (the “Agreement”) with DWS Investment Management Americas, Inc. (“DIMA”) in September 2018.
In terms of the process that the Board followed prior to approving the Agreement, shareholders should know that:
| – | During the entire process, all of the Fund’s Trustees were independent of DIMA and its affiliates (the “Independent Trustees”). |
| – | The Board met frequently during the past year to discuss fund matters and dedicated a substantial amount of time to contract review matters. Over the course of several months, the Board’s Contract Committee reviewed extensive materials received from DIMA, independent third parties and independent counsel. These materials included an analysis of the Fund’s performance, fees and expenses, and profitability from a fee consultant retained by the Fund’s Independent Trustees (the “Fee Consultant”). Based on its evaluation of the information provided, the Contract Committee presented its findings and recommendations to the Board. The Board then reviewed the Contract Committee’s findings and recommendations. |
| – | The Board also received extensive information throughout the year regarding performance of the Fund. |
| – | The Independent Trustees regularly met privately with counsel to discuss contract review and other matters. In addition, the Independent Trustees were advised by the Fee Consultant in the course of their review of the Fund’s contractual arrangements and considered a comprehensive report prepared by the Fee Consultant in connection with their deliberations. |
| – | In connection with reviewing the Agreement, the Board also reviewed the terms of the Fund’s Rule12b-1 plan, distribution agreement, administrative services agreement, transfer agency agreement and other material service agreements. |
In connection with the contract review process, the Contract Committee and the Board considered the factors discussed below, among others. The Board also considered that DIMA and its predecessors have managed the Fund since its inception, and the Board believes that a long-term relationship with a capable, conscientious advisor is in the best interests of the Fund. The Board considered, generally, that shareholders chose to invest or remain invested in the Fund knowing that DIMA managed the Fund. DIMA is part of DWS Group GmbH & Co. KGaA (“DWS Group”). DWS Group is a global asset management business that offers a wide range of investing expertise and resources, including research capabilities in many countries throughout the world. In 2018, approximately 20% of DWS Group’s shares were sold in an initial public offering, with Deutsche Bank AG owning the remaining shares.
As part of the contract review process, the Board carefully considered the fees and expenses of each DWS fund overseen by the Board in light of the fund’s performance. In many cases, this led to the negotiation and implementation of expense caps. As part of these negotiations, the Board indicated that it would consider relaxing these caps in future years following sustained improvements in performance, among other considerations.
While shareholders may focus primarily on fund performance and fees, the Fund’s Board considers these and many other factors, including the quality and integrity of DIMA’s personnel and administrative support services provided by DIMA, such as back-office operations, fund valuations, and compliance policies and procedures.
Nature, Quality and Extent of Services.The Board considered the terms of the Agreement, including the scope of advisory services provided under the Agreement. The Board noted that, under the Agreement, DIMA provides portfolio management services to the Fund and that, pursuant to a separate administrative services agreement, DIMA provides administrative services to the Fund. The Board considered the experience and skills of senior management and investment personnel and the resources made available to such personnel. The Board reviewed the Fund’s performance over short-term and long-term periods and compared those returns to various agreed-upon performance measures, including market index(es) and a peer universe compiled using information supplied by Morningstar Direct (“Morningstar”), an independent fund data service. The Board also noted that it has put into place a process of identifying “Funds in Review” (e.g., funds performing poorly relative to a peer universe), and receives additional reporting from DIMA regarding such funds and, where appropriate, DIMA’s plans to address underperformance. The Board
| 16 | | | Deutsche DWS Variable Series II — DWS CROCI® U.S. VIP |
Table of Contents
believes this process is an effective manner of identifying and addressing underperforming funds. Based on the information provided, the Board noted that, for theone-, three- and five-year periods ended December 31, 2017, the Fund’s performance (Class A shares) was in the 1st quartile, 4th quartile and 4th quartile, respectively, of the applicable Morningstar universe (the 1st quartile being the best performers and the 4th quartile being the worst performers). The Board also observed that the Fund has outperformed its benchmark in theone-year period and has underperformed its benchmark in the three- and five-year periods ended December 31, 2017. The Board noted the disappointing investment performance of the Fund in some past periods and continued to discuss with senior management of DIMA the factors contributing to such underperformance and actions being taken to improve performance. The Board considered that, effective October 3, 2016, the Fund changed its investment strategy and portfolio managers and noted that the Fund further changed its investment strategy, effective May 1, 2017. The Board observed that the Fund had experienced improved relative performance in 2017. The Board recognized the efforts by DIMA in recent years to enhance its investment platform and improve long-term performance across the DWS fund complex.
Fees and Expenses. The Board considered the Fund’s investment management fee schedule, operating expenses and total expense ratios, and comparative information provided by Broadridge Financial Solutions, Inc. (“Broadridge”) and the Fee Consultant regarding investment management fee rates paid to other investment advisors by similar funds (1st quartile being the most favorable and 4th quartile being the least favorable). With respect to management fees paid to other investment advisors by similar funds, the Board noted that the contractual fee rates paid by the Fund, which include a 0.10% fee paid to DIMA under the Fund’s administrative services agreement, were equal to the median of the applicable Broadridge peer group (based on Broadridge data provided as of December 31, 2017). The Board noted that the Fund’s Class A shares total (net) operating expenses were expected to be lower than the median (2nd quartile) of the applicable Broadridge expense universe (based on Broadridge data provided as of December 31, 2017, and analyzing Broadridge expense universe Class A (net) expenses less any applicable12b-1 fees) (“Broadridge Universe Expenses”). The Board also reviewed data comparing each share class’s total (net) operating expenses to the applicable Broadridge Universe Expenses. The Board noted that the expense limitations agreed to by DIMA were expected to help the Fund’s total (net) operating expenses remain competitive. The Board considered the Fund’s management fee rate as compared to fees charged by DIMA to comparable DWS U.S. registered funds (“DWS Funds”) and considered differences between the Fund and the comparable DWS Funds. The information requested by the Board as part of its review of fees and expenses also included information about institutional accounts (including anysub-advised funds and accounts) and funds offered primarily to European investors (“DWS Europe Funds”) managed by DWS Group. The Board noted that DIMA indicated that DWS Group does not manage any institutional accounts or DWS Europe Funds comparable to the Fund.
On the basis of the information provided, the Board concluded that management fees were reasonable and appropriate in light of the nature, quality and extent of services provided by DIMA.
Profitability. The Board reviewed detailed information regarding revenues received by DIMA under the Agreement. The Board considered the estimated costs to DIMA, andpre-tax profits realized by DIMA, from advising the DWS Funds, as well as estimates of thepre-tax profits attributable to managing the Fund in particular. The Board also received information regarding the estimated enterprise-wide profitability of DIMA and its affiliates with respect to all fund services in totality and by fund. The Board and the Fee Consultant reviewed DIMA’s methodology in allocating its costs to the management of the Fund. Based on the information provided, the Board concluded that thepre-tax profits realized by DIMA in connection with the management of the Fund were not unreasonable. The Board also reviewed certain publicly available information regarding the profitability of certain similar investment management firms. The Board noted that, while information regarding the profitability of such firms is limited (and in some cases is not necessarily prepared on a comparable basis), DIMA and its affiliates’ overall profitability with respect to the DWS Funds (after taking into account distribution and other services provided to the funds by DIMA and its affiliates) was lower than the overall profitability levels of most comparable firms for which such data was available.
Economies of Scale. The Board considered whether there are economies of scale with respect to the management of the Fund and whether the Fund benefits from any economies of scale. The Board noted that the Fund’s investment management fee schedule includes fee breakpoints. The Board concluded that the Fund’s fee schedule represents an appropriate sharing between the Fund and DIMA of such economies of scale as may exist in the management of the Fund at current asset levels.
Deutsche DWS Variable Series II — DWS CROCI® U.S. VIP | | | 17 |
Table of Contents
Other Benefits to DIMA and Its Affiliates. The Board also considered the character and amount of other incidental or“fall-out” benefits received by DIMA and its affiliates, including any fees received by DIMA for administrative services provided to the Fund, any fees received by an affiliate of DIMA for transfer agency services provided to the Fund and any fees received by an affiliate of DIMA for distribution services. The Board noted that DIMA pays a licensing fee to an affiliate related to the Fund’s use of the CROCI® strategy. The Board also considered benefits to DIMA related to brokerage and soft-dollar allocations, including allocating brokerage to pay for research generated by parties other than the executing broker dealers, which pertain primarily to funds investing in equity securities. In addition, the Board considered the incidental public relations benefits to DIMA related to DWS Funds advertising and cross-selling opportunities among DIMA products and services. The Board considered these benefits in reaching its conclusion that the Fund’s management fees were reasonable.
Compliance. The Board considered the significant attention and resources dedicated by DIMA to its compliance processes in recent years. The Board noted in particular (i) the experience, seniority and time commitment of the individuals serving as DIMA’s and the Fund’s chief compliance officers and (ii) the substantial commitment of resources by DIMA and its affiliates to compliance matters, including the retention of compliance personnel.
Based on all of the information considered and the conclusions reached, the Board unanimously determined that the continuation of the Agreement is in the best interests of the Fund. In making this determination, the Board did not give particular weight to any single factor identified above. The Board considered these factors over the course of numerous meetings, certain of which were in executive session with only the Independent Trustees and counsel present. It is possible that individual Independent Trustees may have weighed these factors differently in reaching their individual decisions to approve the continuation of the Agreement.
| 18 | | | Deutsche DWS Variable Series II — DWS CROCI® U.S. VIP |
Table of Contents
Notes
Table of Contents
| ||
VS2CUS-3 (R-028386-8 8/19) |
Table of Contents
June 30, 2019
Semiannual Report
Deutsche DWS Variable Series II
DWS Global Equity VIP
Beginning on January 1, 2021, as permitted by regulations adopted by the Securities and Exchange Commission, you may not be receiving paper copies of the Fund’s shareholder reports from the insurance company that offers your contract unless you specifically request paper copies from your insurance company or from your financial intermediary. Instead, the shareholder reports will be made available on a Web site, and your insurance company will notify you by mail each time a report is posted and provide you with a Web site link to access the report. Instructions for requesting paper copies will be provided by your insurance company.
If you already elected to receive shareholder reports electronically, you will not be affected by this change and you need not take any action. You may elect to receive shareholder reports and other communications from your insurance company electronically by following the instructions provided by your insurance company.
You may elect to receive all future reports in paper free of charge from your insurance company. If your insurance company informs you that future reports will be delivered via Web access, you can inform your insurance company that you wish to continue receiving paper copies of your shareholder reports by following the instructions provided by your insurance company.

Table of Contents
This report must be preceded or accompanied by a prospectus. To obtain an additional prospectus or summary prospectus, if available, call (800)728-3337 or your financial representative. We advise you to consider the Fund’s objectives, risks, charges and expenses carefully before investing. The summary prospectus and prospectus contain this and other important information about the Fund. Please read the prospectus carefully before you invest.
Stocks may decline in value. Investing in foreign securities, particularly those of emerging markets, presents certain risks, such as currency fluctuations, political and economic changes, and market risks. Emerging markets tend to be more volatile and less liquid than the markets of more mature economies, and generally have less diverse and less mature economic structures and less stable political systems than those of developed countries. Investing in derivatives entails special risks relating to liquidity, leverage and credit that may reduce returns and/or increase volatility. The Fund may lend securities to approved institutions. Please read the prospectus for details.
The brand DWS represents DWS Group GmbH & Co. KGaA and any of its subsidiaries such as DWS Distributors, Inc. which offers investment products or DWS Investment Management Americas, Inc. and RREEF America L.L.C. which offer advisory services.
DWS Distributors, Inc., 222 South Riverside Plaza, Chicago, IL 60606, (800)621-1148
NOT FDIC/NCUA INSURED NO BANK GUARANTEE MAY LOSE VALUE NOT A DEPOSIT
NOT INSURED BY ANY FEDERAL GOVERNMENT AGENCY
| 2 | | | Deutsche DWS Variable Series II — DWS Global Equity VIP |
Table of Contents
| Performance Summary | June 30, 2019 (Unaudited) |
Fund performance shown is historical, assumes reinvestment of all dividend and capital gain distributions and does not guarantee future results. Investment return and principal value fluctuate with changing market conditions so that, when redeemed, shares may be worth more or less than their original cost. Current performance may be lower or higher than the performance data quoted. Please contact your participating insurance company for the Fund’s most recentmonth-end performance. Performance does not reflect charges and fees (“contract charges”) associated with the separate account that invests in the Fund or any variable life insurance policy or variable annuity contract for which the Fund is an investment option. These charges and fees will reduce returns.
The gross expense ratio of the Fund, as stated in the fee table of the prospectus dated May 1, 2019 is 1.22% for Class A shares and may differ from the expense ratio disclosed in the Financial Highlights table in this report.
Generally accepted accounting principles require adjustments to be made to the net assets of the Fund at period end for financial reporting purposes only, and as such, the total return based on the unadjusted net asset value per share may differ from the total return reported in the financial highlights.
Growth of an Assumed $10,000 Investment in DWS Global Equity VIP
| The MSCI All Country World Index is an unmanaged equity index which captures large and mid-capitalization representation across 23 developed markets and 24 emerging markets countries. It covers approximately 85% of the global investable equity opportunity set.
Index returns do not reflect any fees or expenses and it is not possible to invest directly into an index. |
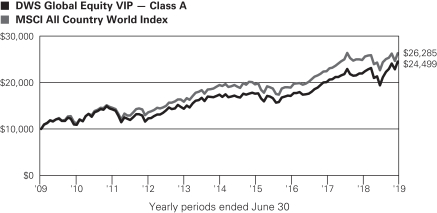
| Comparative Results | ||||||||||||
| DWS Global Equity VIP | 6-Month‡ | 1-Year | 3-Year | 5-Year | 10-Year | |||||||
| Class A | Growth of $10,000 | $12,615 | $11,156 | $14,332 | $14,072 | $24,499 | ||||||
| Average annual total return | 26.15% | 11.56% | 12.75% | 7.07% | 9.37% | |||||||
| MSCI All Country World Index | Growth of $10,000 | $11,623 | $10,574 | $13,908 | $13,485 | $26,285 | ||||||
| Average annual total return | 16.23% | 5.74% | 11.62% | 6.16% | 10.15% | |||||||
The growth of $10,000 is cumulative.
| ‡ | Total returns shown for periods less than one year are not annualized. |
Deutsche DWS Variable Series II — DWS Global Equity VIP | | | 3 |
Table of Contents
| Portfolio Summary | (Unaudited) |
| Asset Allocation (As a % of Investment Portfolio excluding Securities Lending Collateral) | 6/30/19 | 12/31/18 | ||||||
| Common Stocks | 98% | 99% | ||||||
| Cash Equivalent | 2% | 1% | ||||||
| 100% | 100% | |||||||
| Sector Diversification (As a % of Investment Portfolio excluding Cash Equivalent and Securities Lending Collateral) | 6/30/19 | 12/31/18 | ||||||
| Financials | 20% | 20% | ||||||
| Information Technology | 18% | 18% | ||||||
| Health Care | 16% | 15% | ||||||
| Consumer Discretionary | 11% | 11% | ||||||
| Industrials | 11% | 11% | ||||||
| Communication Services | 8% | 9% | ||||||
| Consumer Staples | 8% | 8% | ||||||
| Materials | 4% | 4% | ||||||
| Energy | 3% | 3% | ||||||
| Real Estate | 1% | 1% | ||||||
| 100% | 100% | |||||||
| Geographical Diversification (As a % of Investment Portfolio excluding Cash Equivalent and Securities Lending Collateral) | 6/30/19 | 12/31/18 | ||||||
| United States | 51% | 51% | ||||||
| Germany | 9% | 10% | ||||||
| China | 7% | 7% | ||||||
| Canada | 7% | 7% | ||||||
| United Kingdom | 5% | 5% | ||||||
| Switzerland | 5% | 4% | ||||||
| Japan | 4% | 5% | ||||||
| France | 3% | 3% | ||||||
| Argentina | 2% | 2% | ||||||
| Ireland | 2% | 2% | ||||||
| Sweden | 2% | 2% | ||||||
| Luxembourg | 1% | 1% | ||||||
| Others | 2% | 1% | ||||||
| 100% | 100% | |||||||
Portfolio holdings and characteristics are subject to change.
For more complete details about the Fund’s investment portfolio, see page 5.
Following the Fund’s fiscal first and thirdquarter-end, a complete portfolio holdings listing is filed with the SEC on FormN-Q or Form N-PORT (available for filings after March 31, 2019). The Fund’s FormN-Q or Form N-PORT will be available on the SEC’s Web site at sec.gov. The Fund’s portfolio holdings are also posted on dws.com from time to time. Please read the Fund’s current prospectus for more information.
Sebastian P. Werner, PhD, Director
Mark Schumann, CFA, Director
Portfolio Managers
| 4 | | | Deutsche DWS Variable Series II — DWS Global Equity VIP |
Table of Contents
| Investment Portfolio | as of June 30, 2019 (Unaudited) |
| Shares | Value ($) | |||||||
| Common Stocks 98.1% |
| |||||||
| Argentina 1.8% |
| |||||||
Globant SA * (Cost $274,381) | 5,300 | 535,565 | ||||||
| Canada 6.6% |
| |||||||
Agnico Eagle Mines Ltd. | 4,650 | 238,266 | ||||||
Alimentation Couche-Tard, Inc. “B” | 5,170 | 325,348 | ||||||
Brookfield Asset Management, Inc. “A” | 18,200 | 870,704 | ||||||
Canada Goose Holdings, Inc. * | 4,200 | 162,573 | ||||||
Toronto-Dominion Bank | 6,300 | 368,124 | ||||||
|
| |||||||
(Cost $1,122,368) |
| 1,965,015 | ||||||
| China 6.7% |
| |||||||
Alibaba Group Holding Ltd. (ADR) * | 2,650 | 449,042 | ||||||
China Literature Ltd. 144A * | 14 | 66 | ||||||
Luckin Coffee, Inc. (ADR) * | 5,942 | 115,810 | ||||||
Momo, Inc. (ADR) | 5,500 | 196,900 | ||||||
New Oriental Education & Technology Group, Inc. (ADR) * | 2,180 | 210,544 | ||||||
Ping An Insurance (Group) Co. of China Ltd. “H” | 41,500 | 498,945 | ||||||
Tencent Holdings Ltd. | 11,200 | 505,836 | ||||||
|
| |||||||
(Cost $1,538,358) |
| 1,977,143 | ||||||
| France 3.1% |
| |||||||
LVMH Moet Hennessy Louis Vuitton SE | 275 | 117,091 | ||||||
Total SA | 6,060 | 339,498 | ||||||
VINCI SA | 4,400 | 450,716 | ||||||
|
| |||||||
(Cost $901,371) |
| 907,305 | ||||||
| Germany 8.7% |
| |||||||
adidas AG | 485 | 149,855 | ||||||
Allianz SE (Registered) | 2,300 | 554,707 | ||||||
BASF SE | 3,800 | 276,740 | ||||||
Deutsche Boerse AG | 3,650 | 516,498 | ||||||
Evonik Industries AG | 10,000 | 291,942 | ||||||
Fresenius Medical Care AG & Co. KGaA | 6,107 | 480,290 | ||||||
Siemens AG (Registered) | 2,400 | 285,612 | ||||||
|
| |||||||
(Cost $2,293,155) |
| 2,555,644 | ||||||
| Ireland 1.7% |
| |||||||
Kerry Group PLC “A” (a) | 3,721 | 444,021 | ||||||
Kerry Group PLC “A” (a) | 379 | 45,308 | ||||||
|
| |||||||
(Cost $278,106) | 489,329 | |||||||
| Japan 4.5% |
| |||||||
Kao Corp. | 3,700 | 282,760 | ||||||
Keyence Corp. | 600 | 369,981 | ||||||
Komatsu Ltd. | 7,400 | 178,969 | ||||||
Mitsubishi UFJ Financial Group, Inc. | 31,100 | 147,971 | ||||||
SMC Corp. | 900 | 337,270 | ||||||
|
| |||||||
(Cost $1,432,816) |
| 1,316,951 | ||||||
| Luxembourg 1.1% |
| |||||||
Eurofins Scientific SE (b) (Cost $176,520) | 720 | 318,905 | ||||||
| Shares | Value ($) | |||||||
| Malaysia 0.6% |
| |||||||
IHH Healthcare Bhd. (Cost $177,866) | 136,600 | 191,635 | ||||||
| Norway 0.6% |
| |||||||
Mowi ASA (Cost $82,231)* | 7,200 | 168,416 | ||||||
| Singapore 1.0% |
| |||||||
DBS Group Holdings Ltd. (Cost $279,300) | 15,200 | 291,600 | ||||||
| Sweden 1.6% |
| |||||||
Assa Abloy AB “B” | 9,900 | 223,790 | ||||||
Spotify Technology SA * (c) | 1,695 | 247,843 | ||||||
|
| |||||||
(Cost $449,427) |
| 471,633 | ||||||
| Switzerland 4.8% |
| |||||||
Lonza Group AG (Registered) | 2,500 | 845,366 | ||||||
Nestle SA (Registered) | 5,509 | 570,241 | ||||||
|
| |||||||
(Cost $580,697) |
| 1,415,607 | ||||||
| United Kingdom 5.3% |
| |||||||
Aon PLC (c) | 1,750 | 337,715 | ||||||
Compass Group PLC | 9,600 | 230,181 | ||||||
Experian PLC | 15,300 | 463,612 | ||||||
Halma PLC | 10,000 | 256,955 | ||||||
Spirax-Sarco Engineering PLC | 2,500 | 291,996 | ||||||
|
| |||||||
(Cost $881,161) |
| 1,580,459 | ||||||
| United States 50.0% |
| |||||||
A.O. Smith Corp. | 3,300 | 155,628 | ||||||
Activision Blizzard, Inc. | 7,600 | 358,720 | ||||||
Alphabet, Inc. “A” * | 580 | 628,024 | ||||||
American Express Co. | 3,040 | 375,258 | ||||||
AMETEK, Inc. | 5,250 | 476,910 | ||||||
Amphenol Corp. “A” | 6,000 | 575,640 | ||||||
Apple, Inc. | 1,155 | 228,598 | ||||||
Applied Materials, Inc. | 6,300 | 282,933 | ||||||
Becton, Dickinson & Co. | 2,705 | 681,687 | ||||||
Boeing Co. | 780 | 283,928 | ||||||
CBRE Group, Inc. “A” * | 4,500 | 230,850 | ||||||
Danaher Corp. | 6,300 | 900,396 | ||||||
Ecolab, Inc. | 1,740 | 343,546 | ||||||
EOG Resources., Inc. | 3,800 | 354,008 | ||||||
EPAM Systems, Inc. * | 2,550 | 441,405 | ||||||
Eventbrite, Inc. “A” * | 4,500 | 72,900 | ||||||
Evolent Health, Inc. “A” * | 13,400 | 106,530 | ||||||
Fiserv, Inc. * | 4,200 | 382,872 | ||||||
Intuit, Inc. | 1,600 | 418,128 | ||||||
JPMorgan Chase & Co. | 6,200 | 693,160 | ||||||
Las Vegas Sands Corp. | 2,460 | 145,361 | ||||||
MasterCard, Inc. “A” | 2,950 | 780,363 | ||||||
McDonald’s Corp. | 2,710 | 562,758 | ||||||
Microsoft Corp. | 4,000 | 535,840 | ||||||
Mondelez International, Inc. “A” | 6,590 | 355,201 | ||||||
NVIDIA Corp. | 600 | 98,538 | ||||||
Pinterest, Inc. “A” * | 2,732 | 74,365 | ||||||
Progressive Corp. | 15,200 | 1,214,936 | ||||||
Schlumberger Ltd. | 5,000 | 198,700 | ||||||
ServiceMaster Global Holdings, Inc. * | 6,000 | 312,540 | ||||||
ServiceNow, Inc. * | 1,400 | 384,398 | ||||||
T-Mobile U.S., Inc. * | 4,300 | 318,802 | ||||||
The accompanying notes are an integral part of the financial statements.
Deutsche DWS Variable Series II — DWS Global Equity VIP | | | 5 |
Table of Contents
| Shares | Value ($) | |||||||
TJX Companies, Inc. | 5,491 | 290,364 | ||||||
TransMedics Group, Inc. * | 8,300 | 240,617 | ||||||
YETI Holdings, Inc. * (b) | 16,900 | 489,255 | ||||||
Zoetis, Inc. | 6,900 | 783,081 | ||||||
|
| |||||||
(Cost $9,072,521) |
| 14,776,240 | ||||||
| Total Common Stocks(Cost $19,540,278) |
| 28,961,447 | ||||||
| Securities Lending Collateral 2.4% |
| |||||||
DWS Government & Agency Securities Portfolio “DWS Government Cash Institutional Shares”, 2.28% (d) (e) (Cost $718,950) | 718,950 | 718,950 | ||||||
| Shares | Value ($) | |||||||
| Cash Equivalents 1.6% |
| |||||||
DWS Central Cash Management Government Fund, 2.40% (d) (Cost $468,701) | 468,701 | 468,701 | ||||||
| % of Net Assets | Value ($) | |||||||
Total Investment Portfolio(Cost $20,727,929) | 102.1 | 30,149,098 | ||||||
| Other Assets and Liabilities, Net | (2.1 | ) | (625,886 | ) | ||||
| Net Assets | 100.0 | 29,523,212 | ||||||
A summary of the Fund’s transactions with affiliated investments during the period ended June 30, 2019 are as follows:
| Value ($) at 12/31/2018 | Purchases Cost ($) | Sales Proceeds ($) | Net Realized Gain/ (Loss) ($) | Net Change in Unrealized Appreciation (Depreciation) ($) | Income ($) | Capital Gain Distributions ($) | Number of Shares at 6/30/2019 | Value ($) at 6/30/2019 | ||||||||||||||||||||||||
Securities Lending Collateral 2.4% |
| |||||||||||||||||||||||||||||||
DWS Government & Agency Securities Portfolio “DWS Government Cash Institutional Shares”, 2.28% (d) (e) |
| |||||||||||||||||||||||||||||||
| 111,625 | 607,325 | (f) | — | — | — | 17,036 | — | 718,950 | 718,950 | |||||||||||||||||||||||
Cash Equivalents 1.6% |
| |||||||||||||||||||||||||||||||
DWS Central Cash Management Government Fund, 2.40% (d) |
| |||||||||||||||||||||||||||||||
| 238,530 | 2,618,033 | 2,387,862 | — | — | 2,806 | — | 468,701 | 468,701 | ||||||||||||||||||||||||
| 350,155 | 3,225,358 | 2,387,862 | — | — | 19,842 | — | 1,187,651 | 1,187,651 | ||||||||||||||||||||||||
| * | Non-income producing security. |
| (a) | Securities with the same description are the same corporate entity but trade on different stock exchanges. |
| (b) | All or a portion of these securities were on loan. In addition, “Other Assets and Liabilities, Net” may include pending sales that are also on loan. The value of securities loaned at June 30, 2019 amounted to $707,822, which is 2.4% of net assets. |
| (c) | Listed on the New York Stock Exchange. |
| (d) | Affiliated fund managed by DWS Investment Management Americas, Inc. The rate shown is the annualizedseven-day yield at period end. |
| (e) | Represents cash collateral held in connection with securities lending. Income earned by the Fund is net of borrower rebates. |
| (f) | Represents the net increase (purchase cost) or decrease (sales proceeds) in the amount invested in cash collateral for the period ended June 30, 2019. |
144A: Security exempt from registration under Rule 144A of the Securities Act of 1933. These securities may be resold in transactions exempt from registration, normally to qualified institutional buyers.
ADR: American Depositary Receipt
The accompanying notes are an integral part of the financial statements.
| 6 | | | Deutsche DWS Variable Series II — DWS Global Equity VIP |
Table of Contents
Fair Value Measurements
Various inputs are used in determining the value of the Fund’s investments. These inputs are summarized in three broad levels. Level 1 includes quoted prices in active markets for identical securities. Level 2 includes other significant observable inputs (including quoted prices for similar securities, interest rates, prepayment speeds and credit risk). Level 3 includes significant unobservable inputs (including the Fund’s own assumptions in determining the fair value of investments). The level assigned to the securities valuations may not be an indication of the risk or liquidity associated with investing in those securities.
The following is a summary of the inputs used as of June 30, 2019 in valuing the Fund’s investments. For information on the Fund’s policy regarding the valuation of investments, please refer to the Security Valuation section of Note A in the accompanying Notes to Financial Statements.
| Assets | Level 1 | Level 2 | Level 3 | Total | ||||||||||||
| Common Stocks | ||||||||||||||||
Argentina | $ | 535,565 | $ | — | $ | — | $ | 535,565 | ||||||||
Canada | 1,965,015 | — | — | 1,965,015 | ||||||||||||
China | 972,296 | 1,004,847 | — | 1,977,143 | ||||||||||||
France | — | 907,305 | — | 907,305 | ||||||||||||
Germany | — | 2,555,644 | — | 2,555,644 | ||||||||||||
Ireland | — | 489,329 | — | 489,329 | ||||||||||||
Japan | — | 1,316,951 | — | 1,316,951 | ||||||||||||
Luxembourg | — | 318,905 | — | 318,905 | ||||||||||||
Malaysia | — | 191,635 | — | 191,635 | ||||||||||||
Norway | — | 168,416 | — | 168,416 | ||||||||||||
Singapore | — | 291,600 | — | 291,600 | ||||||||||||
Sweden | 247,843 | 223,790 | — | 471,633 | ||||||||||||
Switzerland | — | 1,415,607 | — | 1,415,607 | ||||||||||||
United Kingdom | 337,715 | 1,242,744 | — | 1,580,459 | ||||||||||||
United States | 14,776,240 | — | — | 14,776,240 | ||||||||||||
| Short-Term Investments (g) | 1,187,651 | — | — | 1,187,651 | ||||||||||||
| Total | $ | 20,022,325 | $ | 10,126,773 | $ | — | $ | 30,149,098 | ||||||||
| (g) | See Investment Portfolio for additional detailed categorizations. |
The accompanying notes are an integral part of the financial statements.
Deutsche DWS Variable Series II — DWS Global Equity VIP | | | 7 |
Table of Contents
| * | Represents collateral on securities loaned. |
| ||||
| for the six months ended June 30, 2019 (Unaudited) |
| |||
| Investment Income | ||||
| Income: | ||||
Dividends (net of foreign taxes withheld of $23,277) | $ | 285,762 | ||
| Income distributions — DWS Central Cash Management Government Fund | 2,806 | |||
| Securities lending income, net of borrower rebates | 17,036 | |||
| Total income | 305,604 | |||
| Expenses: | ||||
| Management fee | 90,092 | |||
| Administration fee | 13,860 | |||
| Services to shareholders | 207 | |||
| Custodian fee | 9,980 | |||
| Professional fees | 36,897 | |||
| Reports to shareholders | 9,670 | |||
| Trustees’ fees and expenses | 1,823 | |||
| Other | 6,993 | |||
| Total expenses before expense reductions | 169,522 | |||
| Expense reductions | (46,165 | ) | ||
| Total expenses after expense reductions | 123,357 | |||
| Net investment income | 182,247 | |||
| Realized and Unrealized Gain (Loss) | ||||
| Net realized gain (loss) from: | ||||
| Investments | 484,251 | |||
| Foreign currency | (3,005 | ) | ||
| 481,246 | ||||
| Change in net unrealized appreciation (depreciation) on: | ||||
| Investments | 5,671,998 | |||
| Foreign currency | 5,132 | |||
| 5,677,130 | ||||
| Net gain (loss) | 6,158,376 | |||
| Net increase (decrease) in net assets resulting from operations | $ | 6,340,623 | ||
The accompanying notes are an integral part of the financial statements.
| 8 | | | Deutsche DWS Variable Series II — DWS Global Equity VIP |
Table of Contents
| Statements of Changes in Net Assets |
| Increase (Decrease) in Net Assets | Six Months Ended June 30, 2019 (Unaudited) | Year Ended 2018 | ||||||
| Operations: | ||||||||
| Net investment income (loss) | 182,247 | $ | 149,728 | |||||
| Net realized gain (loss) | 481,246 | 2,189,088 | ||||||
| Change in net unrealized appreciation (depreciation) | 5,677,130 | (5,431,199 | ) | |||||
| Net increase (decrease) in net assets resulting from operations | 6,340,623 | (3,092,383 | ) | |||||
| Distributions to shareholders: | ||||||||
Class A | (2,329,682 | ) | (219,217 | ) | ||||
| Fund share transactions: | ||||||||
Class A | ||||||||
| Proceeds from shares sold | 217,394 | 730,055 | ||||||
| Reinvestment of distributions | 2,329,682 | 219,217 | ||||||
| Payments for shares redeemed | (1,963,478 | ) | (3,317,394 | ) | ||||
| Net increase (decrease) in net assets from Class A share transactions | 583,598 | (2,368,122 | ) | |||||
| Increase (decrease) in net assets | 4,594,539 | (5,679,722 | ) | |||||
| Net assets at beginning of period | 24,928,673 | 30,608,395 | ||||||
| Net assets at end of period | 29,523,212 | 24,928,673 | ||||||
| Other Information | ||||||||
Class A | ||||||||
| Shares outstanding at beginning of period | 2,415,204 | 2,616,821 | ||||||
| Shares sold | 18,287 | 62,443 | ||||||
| Shares issued to shareholders in reinvestment of distributions | 200,144 | 19,281 | ||||||
| Shares redeemed | (169,134 | ) | (283,341 | ) | ||||
| Net increase (decrease) in Class A shares | 49,297 | (201,617 | ) | |||||
| Shares outstanding at end of period | 2,464,501 | 2,415,204 | ||||||
The accompanying notes are an integral part of the financial statements.
Deutsche DWS Variable Series II — DWS Global Equity VIP | | | 9 |
Table of Contents
| Financial Highlights |
| Six Months Ended 6/30/19 (Unaudited) | Years Ended December 31, | |||||||||||||||||||||||
| Class A | 2018 | 2017 | 2016 | 2015 | 2014 | |||||||||||||||||||
| Selected Per Share Data | ||||||||||||||||||||||||
| Net asset value, beginning of period | $ | 10.32 | $ | 11.70 | $ | 9.48 | $ | 9.00 | $ | 9.21 | $ | 9.27 | ||||||||||||
| Income (loss) from investment operations: | ||||||||||||||||||||||||
Net investment incomea | .08 | .06 | .05 | .04 | .05 | .06 | ||||||||||||||||||
Net realized and unrealized gain (loss) | 2.59 | (1.35 | ) | 2.22 | .51 | (.21 | ) | .04 | ||||||||||||||||
Total from investment operations | 2.67 | (1.29 | ) | 2.27 | .55 | (.16 | ) | .10 | ||||||||||||||||
| Less distributions from: | ||||||||||||||||||||||||
Net investment income | (.06 | ) | (.09 | ) | (.05 | ) | (.07 | ) | (.05 | ) | (.16 | ) | ||||||||||||
Net realized gains | (.95 | ) | — | — | — | — | — | |||||||||||||||||
Total distributions | (1.01 | ) | (.09 | ) | (.05 | ) | (.07 | ) | (.05 | ) | (.16 | ) | ||||||||||||
| Net asset value, end of period | $ | 11.98 | $ | 10.32 | $ | 11.70 | $ | 9.48 | $ | 9.00 | $ | 9.21 | ||||||||||||
| Total Return (%) | 26.15 | b** | (11.12 | )b | 24.04 | b | 6.11 | b,c | (1.75 | )b | 1.14 | |||||||||||||
| Ratios to Average Net Assets and Supplemental Data | ||||||||||||||||||||||||
| Net assets, end of period ($ millions) | 30 | 25 | 31 | 43 | 49 | 68 | ||||||||||||||||||
| Ratio of expenses before expense reductions (%)d | 1.22 | * | 1.22 | 1.06 | 1.03 | 1.00 | .95 | |||||||||||||||||
| Ratio of expenses after expense reductions (%)d | .89 | * | .92 | .95 | .95 | .91 | .95 | |||||||||||||||||
| Ratio of net investment income (%) | 1.31 | * | .51 | .49 | .49 | .58 | .59 | |||||||||||||||||
| Portfolio turnover rate (%) | 6 | ** | 43 | 19 | 46 | 79 | 78 | |||||||||||||||||
| a | Based on average shares outstanding during the period. |
| b | Total return would have been lower had certain expenses not been reimbursed. |
| c | Includes a reimbursement by the Advisor for a realized loss on a trade executed incorrectly, which otherwise would have reduced total return by 0.31%. |
| d | Expense ratio does not reflect charges and fees associated with the separate account that invests in the Fund or any variable life insurance policy or variable annuity contract for which the Fund is an investment option. |
| * | Annualized |
| ** | Not annualized |
The accompanying notes are an integral part of the financial statements.
| 10 | | | Deutsche DWS Variable Series II — DWS Global Equity VIP |
Table of Contents
| Notes to Financial Statements | (Unaudited) |
A. Organization and Significant Accounting Policies
DWS Global Equity VIP (the “Fund”) is a diversified series of Deutsche DWS Variable Series II (the “Trust”), which is registered under the Investment Company Act of 1940, as amended (the “1940 Act”), as anopen-end management investment company organized as a Massachusetts business trust.
The Fund’s financial statements are prepared in accordance with accounting principles generally accepted in the United States of America (“U.S. GAAP”) which require the use of management estimates. Actual results could differ from those estimates. The Fund qualifies as an investment company under Topic 946 of Accounting Standards Codification of U.S. GAAP. The policies described below are followed consistently by the Fund in the preparation of its financial statements.
Security Valuation. Investments are stated at value determined as of the close of regular trading on the New York Stock Exchange on each day the exchange is open for trading.
Various inputs are used in determining the value of the Fund’s investments. These inputs are summarized in three broad levels. Level 1 includes quoted prices in active markets for identical securities. Level 2 includes other significant observable inputs (including quoted prices for similar securities, interest rates, prepayment speeds and credit risk). Level 3 includes significant unobservable inputs (including the Fund’s own assumptions in determining the fair value of investments). The level assigned to the securities valuations may not be an indication of the risk or liquidity associated with investing in those securities.
Equity securities are valued at the most recent sale price or official closing price reported on the exchange (U.S. or foreign) orover-the-counter market on which they trade. Securities for which no sales are reported are valued at the calculated mean between the most recent bid and asked quotations on the relevant market or, if a mean cannot be determined, at the most recent bid quotation. Equity securities are generally categorized as Level 1. For certain international equity securities, in order to adjust for events which may occur between the close of the foreign exchanges and the close of the New York Stock Exchange, a fair valuation model may be used. This fair valuation model takes into account comparisons to the valuation of American Depository Receipts (ADRs), futures contracts and certain indices and these securities are categorized as Level 2.
Investments inopen-end investment companies are valued at their net asset value each business day and are categorized as Level 1.
Securities and other assets for which market quotations are not readily available or for which the above valuation procedures are deemed not to reflect fair value are valued in a manner that is intended to reflect their fair value as determined in accordance with procedures approved by the Board and are generally categorized as Level 3. In accordance with the Fund’s valuation procedures, factors considered in determining value may include, but are not limited to, the type of the security; the size of the holding; the initial cost of the security; the existence of any contractual restrictions on the security’s disposition; the price and extent of public trading in similar securities of the issuer or of comparable companies; quotations or evaluated prices frombroker-dealers and/or pricing services; information obtained from the issuer, analysts, and/or the appropriate stock exchange (forexchange-traded securities); an analysis of the company’s or issuer’s financial statements; an evaluation of the forces that influence the issuer and the market(s) in which the security is purchased and sold; and with respect to debt securities, the maturity, coupon, creditworthiness, currency denomination and the movement of the market in which the security is normally traded. The value determined under these procedures may differ from published values for the same securities.
Disclosure about the classification of fair value measurements is included in a table following the Fund’s Investment Portfolio.
Securities Lending. Deutsche Bank AG, as lending agent, lends securities of the Fund to certain financial institutions under the terms of its securities lending agreement. During the term of the loans, the Fund continues to receive interest and dividends generated by the securities and to participate in any changes in their market value. The Fund requires the borrowers of the securities to maintain collateral with the Fund consisting of either cash or liquid, unencumbered assets having a value at least equal to the value of the securities loaned. When the collateral falls below specified amounts, the lending agent will use its best effort to obtain additional collateral on the next business day to meet required amounts under the securities lending agreement. As of period end, any securities on loan were collateralized by cash. During the six months ended June 30, 2019, the Fund invested the cash collateral into a joint trading account in DWS Government &
Deutsche DWS Variable Series II — DWS Global Equity VIP | | | 11 |
Table of Contents
Agency Securities Portfolio, an affiliated money market fund managed by DWS Investment Management Americas, Inc. DWS Investment Management Americas, Inc. receives a management/administration fee (0.11% annualized effective rate as of June 30, 2019) on the cash collateral invested in DWS Government & Agency Securities Portfolio. The Fund receives compensation for lending its securities either in the form of fees or by earning interest on invested cash collateral net of borrower rebates and fees paid to a lending agent. Either the Fund or the borrower may terminate the loan at any time, and the borrower, after notice, is required to return borrowed securities within a standard time period. There may be risks of delay and costs in recovery of securities or even loss of rights in the collateral should the borrower of the securities fail financially. If the Fund is not able to recover securities lent, the Fund may sell the collateral and purchase a replacement investment in the market, incurring the risk that the value of the replacement security is greater than the value of the collateral. The Fund is also subject to all investment risks associated with the reinvestment of any cash collateral received, including, but not limited to, interest rate, credit and liquidity risk associated with such investments.
As of June 30, 2019, the Fund had securities on loan, which were classified as common stocks in the Investment Portfolio. The value of the related collateral exceeded the value of the securities loaned at period end. As of period end, the remaining contractual maturity of the collateral agreements were overnight and continuous.
Foreign Currency Translations. The books and records of the Fund are maintained in U.S. dollars. Investment securities and other assets and liabilities denominated in a foreign currency are translated into U.S. dollars at the prevailing exchange rates at period end. Purchases and sales of investment securities, income and expenses are translated into U.S. dollars at the prevailing exchange rates on the respective dates of the transactions.
Net realized and unrealized gains and losses on foreign currency transactions represent net gains and losses between trade and settlement dates on securities transactions, the acquisition and disposition of foreign currencies, and the difference between the amount of net investment income accrued and the U.S. dollar amount actually received. The portion of both realized and unrealized gains and losses on investments that results from fluctuations in foreign currency exchange rates is not separately disclosed but is included with net realized and unrealized gain/appreciation and loss/depreciation on investments.
Taxes. The Fund’s policy is to comply with the requirements of the Internal Revenue Code, as amended, which are applicable to regulated investment companies, and to distribute all of its taxable income to its shareholders.
Additionally, the Fund may be subject to taxes imposed by the governments of countries in which it invests and are generally based on income and/or capital gains earned or repatriated, a portion of which may be recoverable. Based upon the current interpretation of the tax rules and regulations, estimated tax liabilities and recoveries on certain foreign securities are recorded on an accrual basis and are reflected as components of interest income or net change in unrealized gain/loss on investments. Tax liabilities realized as a result of security sales are reflected as a component of net realized gain/loss on investments.
At June 30, 2019, the aggregate cost of investments for federal income tax purposes was $20,792,859. The net unrealized appreciation for all investments based on tax cost was $9,356,239. This consisted of aggregate gross unrealized appreciation for all investments in which there was an excess of value over tax cost of $10,174,637 and aggregate gross unrealized depreciation for all investments in which there was an excess of tax cost over value of $818,398.
The Fund has reviewed the tax positions for the open tax years as of December 31, 2018 and has determined that no provision for income tax and/or uncertain tax positions is required in the Fund’s financial statements. The Fund’s federal tax returns for the prior three fiscal years remain open subject to examination by the Internal Revenue Service.
Distribution of Income and Gains. Distributions from net investment income of the Fund, if any, are declared and distributed to shareholders annually. Net realized gains from investment transactions, in excess of available capital loss carryforwards, would be taxable to the Fund if not distributed and, therefore, will be distributed to shareholders at least annually. The Fund may also make additional distributions for tax purposes if necessary.
The timing and characterization of certain income and capital gain distributions are determined annually in accordance with federal tax regulations which may differ from accounting principles generally accepted in the United States of America. These differences primarily relate to investments in foreign denominated investments and certain securities sold at a loss. As a result, net investment income (loss) and net realized gain (loss) on investment transactions for a reporting period may differ significantly from distributions during such period. Accordingly, the Fund may periodically make reclassifications among certain of its capital accounts without impacting the net asset value of the Fund.
| 12 | | | Deutsche DWS Variable Series II — DWS Global Equity VIP |
Table of Contents
The tax character of current year distributions will be determined at the end of the current fiscal year.
Expenses. Expenses of the Trust arising in connection with a specific fund are allocated to that fund. Other Trust expenses which cannot be directly attributed to a fund are apportioned among the funds in the Trust based upon the relative net assets or other appropriate measures.
Contingencies. In the normal course of business, the Fund may enter into contracts with service providers that contain general indemnification clauses. The Fund’s maximum exposure under these arrangements is unknown, as this would involve future claims that may be made against the Fund that have not yet been made. However, based on experience, the Fund expects the risk of loss to be remote.
Other. Investment transactions are accounted for on a trade date plus one basis for daily net asset value calculations. However, for financial reporting purposes, investment transactions are reported on trade date. Interest income is recorded on the accrual basis. Dividend income is recorded on theex-dividend date net of foreign withholding taxes. Certain dividends from foreign securities may be recorded subsequent to theex-dividend date as soon as the Fund is informed of such dividends. Realized gains and losses from investment transactions are recorded on an identified cost basis. Proceeds from litigation payments, if any, are included in net realized gain (loss) from investments.
B. Purchases and Sales of Securities
During the six months ended June 30, 2019, purchases and sales of investment transactions (excludingshort-term investments) aggregated $1,756,946 and $3,544,408, respectively.
C. Related Parties
Management Agreement. Under the Investment Management Agreement with DWS Investment Management Americas, Inc. (“DIMA” or the “Advisor”), an indirect, wholly owned subsidiary of DWS Group GmbH & Co. KGaA (“DWS Group”), the Advisor directs the investments of the Fund in accordance with its investment objectives, policies and restrictions. The Advisor determines the securities, instruments and other contracts relating to investments to be purchased, sold or entered into by the Fund.
Pursuant to the Investment Management Agreement with the Advisor, the Fund pays a monthly management fee based on the Fund’s average daily net assets, computed and accrued daily and payable monthly, at the following annual rates:
| First $1.5 billion | .650 | % | ||
| Next $1.75 billion | .635 | % | ||
| Next $1.75 billion | .620 | % | ||
| Over $5 billion | .605 | % |
Accordingly, for the six months ended June 30, 2019, the fee pursuant to the Investment Management Agreement was equivalent to an annualized rate (exclusive of any applicable waivers/reimbursements) of 0.65% of the Fund’s average daily net assets.
For the period from January 1, 2019 through April 30, 2020, the Advisor has contractually agreed to waive its fee and/or reimburse certain operating expenses to the extent necessary to maintain the total annual operating expenses (excluding certain expenses such as extraordinary expenses, taxes, brokerage and interest expense) of Class A shares at 0.89%.
For the six months ended June 30, 2019, fees waived and/or expenses reimbursed were $46,165.
Administration Fee. Pursuant to an Administrative Services Agreement, DIMA provides most administrative services to the Fund. For all services provided under the Administrative Services Agreement, the Fund pays DIMA an annual fee (“Administration Fee”) of 0.10% of the Fund’s average daily net assets, computed and accrued daily and payable monthly. For the six months ended June 30, 2019, the Administration Fee was $13,860, of which $2,370 is unpaid.
Service Provider Fees. DWS Service Company (“DSC”), an affiliate of the Advisor, is the transfer agent,dividend-paying agent and shareholder service agent for the Fund. Pursuant to asub-transfer agency agreement between DSC and DST Systems, Inc. (“DST”), DSC has delegated certain transfer agent,dividend-paying agent and shareholder service agent functions to DST. DSC compensates DST out of the shareholder servicing fee it receives from the Fund. For the six months ended June 30, 2019, the amounts charged to the Fund by DSC aggregated $40, of which $13 is unpaid.
Deutsche DWS Variable Series II — DWS Global Equity VIP | | | 13 |
Table of Contents
Typesetting and Filing Service Fees. Under an agreement with the Fund, DIMA is compensated for providing certainpre-press and regulatory filing services to the Fund. For the six months ended June 30, 2019, the amount charged to the Fund by DIMA included in the Statement of Operations under “Reports to shareholders” aggregated $4,331, of which $3,756 is unpaid.
Trustees’ Fees and Expenses. The Fund paid retainer fees to each Trustee not affiliated with the Advisor, plus specified amounts to the Board Chairperson and to each committee Chairperson.
Affiliated Cash Management Vehicles. The Fund may invest uninvested cash balances in DWS Central Cash Management Government Fund and DWS ESG Liquidity Fund, affiliated money market funds which are managed by the Advisor. Each affiliated money market fund is managed in accordance withRule 2a-7 under the 1940 Act, which governs the quality, maturity, diversity and liquidity of instruments in which a money market fund may invest. DWS Central Cash Management Government Fund seeks to maintain a stable net asset value, and DWS ESG Liquidity Fund maintains a floating net asset value. The Fund indirectly bears its proportionate share of the expenses of each affiliated money market fund in which it invests. DWS Central Cash Management Government Fund does not pay the Advisor an investment management fee. To the extent that DWS ESG Liquidity Fund pays an investment management fee to the Advisor, the Advisor will waive an amount of the investment management fee payable to the Advisor by the Fund equal to the amount of the investment management fee payable on the Fund’s assets invested in DWS ESG Liquidity Fund.
Securities Lending Fees. Deutsche Bank AG serves as lending agent for the Fund. For the six months ended June 30, 2019, the Fund incurred lending agent fees to Deutsche Bank AG in the amount of $1,303.
D. Ownership of the Fund
At June 30, 2019, one participating insurance company was owner of record of 10% or more of the total outstanding Class A shares of the Fund, owning 99%.
E. Line of Credit
The Fund and other affiliated funds (the “Participants”) share in a $400 million revolving credit facility provided by a syndication of banks. The Fund may borrow for temporary or emergency purposes, including the meeting of redemption requests that otherwise might require the untimely disposition of securities. The Participants are charged an annual commitment fee which is allocated based on net assets, among each of the Participants. Interest is calculated at a rate per annum equal to the sum of the Federal Funds Rate plus 1.25 percent plus if theone-month LIBOR exceeds the Federal Funds Rate, the amount of such excess. The Fund may borrow up to a maximum of 33 percent of its net assets under the agreement. The Fund had no outstanding loans at June 30, 2019.
| 14 | | | Deutsche DWS Variable Series II — DWS Global Equity VIP |
Table of Contents
| Information About Your Fund’s Expenses | (Unaudited) |
As an investor of the Fund, you incur two types of costs: ongoing expenses and transaction costs. Ongoing expenses include management fees and other Fund expenses. Examples of transaction costs include contract charges, which are not shown in this section. The following tables are intended to help you understand your ongoing expenses (in dollars) of investing in the Fund and to help you compare these expenses with the ongoing expenses of investing in other mutual funds. In the most recentsix-month period, the Fund limited these expenses; had it not done so, expenses would have been higher. The example in the table is based on an investment of $1,000 invested at the beginning of thesix-month period and held for the entire period (January 1, 2019 to June 30, 2019).
The tables illustrate your Fund’s expenses in two ways:
| – | Actual Fund Return. This helps you estimate the actual dollar amount of ongoing expenses (but not transaction costs) paid on a $1,000 investment in the Fund using the Fund’s actual return during the period. To estimate the expenses you paid over the period, simply divide your account value by $1,000 (for example, an $8,600 account value divided by $1,000 = 8.6), then multiply the result by the number in the “Expenses Paid per $1,000” line under the share class you hold. |
| – | Hypothetical 5% Fund Return. This helps you to compare your Fund’s ongoing expenses (but not transaction costs) with those of other mutual funds using the Fund’s actual expense ratio and a hypothetical rate of return of 5% per year before expenses. Examples using a 5% hypothetical Fund return may be found in the shareholder reports of other mutual funds. The hypothetical account values and expenses may not be used to estimate the actual ending account balance or expenses you paid for the period. |
Please note that the expenses shown in these tables are meant to highlight your ongoing expenses only and do not reflect any transaction costs. The “Expenses Paid per $1,000” line of the tables is useful in comparing ongoing expenses only and will not help you determine the relative total expense of owning different funds. If these transaction costs had been included, your costs would have been higher.
| Expenses and Value of a $1,000 Investment for the six months ended June 30, 2019 | ||||
| Actual Fund Return | Class A | |||
| Beginning Account Value 1/1/19 | $ | 1,000.00 | ||
| Ending Account Value 6/30/19 | $ | 1,261.50 | ||
| Expenses Paid per $1,000* | $ | 4.99 | ||
| Hypothetical 5% Fund Return | Class A | |||
| Beginning Account Value 1/1/19 | $ | 1,000.00 | ||
| Ending Account Value 6/30/19 | $ | 1,020.38 | ||
| Expenses Paid per $1,000* | $ | 4.46 | ||
| * | Expenses are equal to the Fund’s annualized expense ratio, multiplied by the average account value over the period, multiplied by 181 (the number of days in the most recentsix-month period), then divided by 365. |
| Annualized Expense Ratio | Class A | |||
| Deutsche DWS Variable Series II — DWS Global Equity VIP | .89 | % | ||
For more information, please refer to the Fund’s prospectus.
These tables do not reflect charges and fees (“contract charges”) associated with the separate account that invests in the Fund or any variable life insurance policy or variable annuity contract for which the Fund is an investment option.
For an analysis of the fees associated with an investment in the Fund or similar funds, please refer to the current and hypothetical expense calculators for Variable Insurance Products which can be found at dws.com/calculators.
Deutsche DWS Variable Series II — DWS Global Equity VIP | | | 15 |
Table of Contents
The Trust’s policies and procedures for voting proxies for portfolio securities and information about how the Trust voted proxies related to its portfolio securities during the most recent12-month period ended June 30 are available on our Web site — dws.com/en-us/resources/proxy-voting — or on the SEC’s Web site — sec.gov. To obtain a written copy of the Trust’s policies and procedures without charge, upon request, call us toll free at(800) 728-3337.
| 16 | | | Deutsche DWS Variable Series II — DWS Global Equity VIP |
Table of Contents
Advisory Agreement Board Considerations and Fee Evaluation
The Board of Trustees (hereinafter referred to as the “Board” or “Trustees”) approved the renewal of DWS Global Equity VIP’s (the “Fund”) investment management agreement (the “Agreement”) with DWS Investment Management Americas, Inc. (“DIMA”) in September 2018.
In terms of the process that the Board followed prior to approving the Agreement, shareholders should know that:
| – | During the entire process, all of the Fund’s Trustees were independent of DIMA and its affiliates (the “Independent Trustees”). |
| – | The Board met frequently during the past year to discuss fund matters and dedicated a substantial amount of time to contract review matters. Over the course of several months, the Board’s Contract Committee reviewed extensive materials received from DIMA, independent third parties and independent counsel. These materials included an analysis of the Fund’s performance, fees and expenses, and profitability from a fee consultant retained by the Fund’s Independent Trustees (the “Fee Consultant”). Based on its evaluation of the information provided, the Contract Committee presented its findings and recommendations to the Board. The Board then reviewed the Contract Committee’s findings and recommendations. |
| – | The Board also received extensive information throughout the year regarding performance of the Fund. |
| – | The Independent Trustees regularly met privately with counsel to discuss contract review and other matters. In addition, the Independent Trustees were advised by the Fee Consultant in the course of their review of the Fund’s contractual arrangements and considered a comprehensive report prepared by the Fee Consultant in connection with their deliberations. |
| – | In connection with reviewing the Agreement, the Board also reviewed the terms of the Fund’s distribution agreement, administrative services agreement, transfer agency agreement and other material service agreements. |
In connection with the contract review process, the Contract Committee and the Board considered the factors discussed below, among others. The Board also considered that DIMA and its predecessors have managed the Fund since its inception, and the Board believes that a long-term relationship with a capable, conscientious advisor is in the best interests of the Fund. The Board considered, generally, that shareholders chose to invest or remain invested in the Fund knowing that DIMA managed the Fund. DIMA is part of DWS Group GmbH & Co. KGaA (“DWS Group”). DWS Group is a global asset management business that offers a wide range of investing expertise and resources, including research capabilities in many countries throughout the world. In 2018, approximately 20% of DWS Group’s shares were sold in an initial public offering, with Deutsche Bank AG owning the remaining shares.
As part of the contract review process, the Board carefully considered the fees and expenses of each DWS fund overseen by the Board in light of the fund’s performance. In many cases, this led to the negotiation and implementation of expense caps. As part of these negotiations, the Board indicated that it would consider relaxing these caps in future years following sustained improvements in performance, among other considerations.
While shareholders may focus primarily on fund performance and fees, the Fund’s Board considers these and many other factors, including the quality and integrity of DIMA’s personnel and administrative support services provided by DIMA, such as back-office operations, fund valuations, and compliance policies and procedures.
Nature, Quality and Extent of Services.The Board considered the terms of the Agreement, including the scope of advisory services provided under the Agreement. The Board noted that, under the Agreement, DIMA provides portfolio management services to the Fund and that, pursuant to a separate administrative services agreement, DIMA provides administrative services to the Fund. The Board considered the experience and skills of senior management and investment personnel and the resources made available to such personnel. The Board reviewed the Fund’s performance over short-term and long-term periods and compared those returns to various agreed-upon performance measures, including market index(es) and a peer universe compiled using information supplied by Morningstar Direct (“Morningstar”), an independent fund data service. The Board also noted that it has put into place a process of identifying “Funds in Review” (e.g., funds performing poorly relative to a peer universe), and receives additional reporting from DIMA regarding such funds and, where appropriate, DIMA’s plans to address underperformance. The Board
Deutsche DWS Variable Series II — DWS Global Equity VIP | | | 17 |
Table of Contents
believes this process is an effective manner of identifying and addressing underperforming funds. Based on the information provided, the Board noted that, for the one-, three- and five-year periods ended December 31, 2017, the Fund’s performance (Class A shares) was in the 3rd quartile, 3rd quartile and 4th quartile, respectively, of the applicable Morningstar universe (the 1st quartile being the best performers and the 4th quartile being the worst performers). The Board also observed that the Fund has outperformed its benchmark in the one-year period and has underperformed its benchmark in the three- and five-year periods ended December 31, 2017.
Fees and Expenses. The Board considered the Fund’s investment management fee schedule, operating expenses and total expense ratios, and comparative information provided by Broadridge Financial Solutions, Inc. (“Broadridge”) and the Fee Consultant regarding investment management fee rates paid to other investment advisors by similar funds (1st quartile being the most favorable and 4th quartile being the least favorable). With respect to management fees paid to other investment advisors by similar funds, the Board noted that the contractual fee rates paid by the Fund, which include a 0.10% fee paid to DIMA under the Fund’s administrative services agreement, were equal to the median of the applicable Broadridge peer group (based on Broadridge data provided as of December 31, 2017). The Board noted that the Fund’s Class A shares total (net) operating expenses were expected to be higher than the median (3rd quartile) of the applicable Broadridge expense universe (based on Broadridge data provided as of December 31, 2017, and analyzing Broadridge expense universe Class A (net) expenses less any applicable 12b-1 fees) (“Broadridge Universe Expenses”). The Board noted that the expense limitation agreed to by DIMA was expected to help the Fund’s total (net) operating expenses remain competitive. The Board considered the Fund’s management fee rate as compared to fees charged by DIMA to comparable DWS U.S. registered funds (“DWS Funds”) and considered differences between the Fund and the comparable DWS Funds. The information requested by the Board as part of its review of fees and expenses also included information about institutional accounts (including any sub-advised funds and accounts) and funds offered primarily to European investors (“DWS Europe Funds”) managed by DWS Group. The Board noted that DIMA indicated that DWS Group does not manage any institutional accounts or DWS Europe Funds comparable to the Fund.
On the basis of the information provided, the Board concluded that management fees were reasonable and appropriate in light of the nature, quality and extent of services provided by DIMA.
Profitability. The Board reviewed detailed information regarding revenues received by DIMA under the Agreement. The Board considered the estimated costs to DIMA, and pre-tax profits realized by DIMA, from advising the DWS Funds, as well as estimates of the pre-tax profits attributable to managing the Fund in particular. The Board also received information regarding the estimated enterprise-wide profitability of DIMA and its affiliates with respect to all fund services in totality and by fund. The Board and the Fee Consultant reviewed DIMA’s methodology in allocating its costs to the management of the Fund. Based on the information provided, the Board concluded that the pre-tax profits realized by DIMA in connection with the management of the Fund were not unreasonable. The Board also reviewed certain publicly available information regarding the profitability of certain similar investment management firms. The Board noted that, while information regarding the profitability of such firms is limited (and in some cases is not necessarily prepared on a comparable basis), DIMA and its affiliates’ overall profitability with respect to the DWS Funds (after taking into account distribution and other services provided to the funds by DIMA and its affiliates) was lower than the overall profitability levels of most comparable firms for which such data was available.
Economies of Scale. The Board considered whether there are economies of scale with respect to the management of the Fund and whether the Fund benefits from any economies of scale. The Board noted that the Fund’s investment management fee schedule includes fee breakpoints. The Board concluded that the Fund’s fee schedule represents an appropriate sharing between the Fund and DIMA of such economies of scale as may exist in the management of the Fund at current asset levels.
Other Benefits to DIMA and Its Affiliates. The Board also considered the character and amount of other incidental or “fall-out” benefits received by DIMA and its affiliates, including any fees received by DIMA for administrative services provided to the Fund and any fees received by an affiliate of DIMA for transfer agency services provided to the Fund. The Board also considered benefits to DIMA related to brokerage and soft-dollar allocations, including allocating brokerage to pay for research generated by parties other than the executing broker dealers, which pertain primarily to funds investing in equity securities. In addition, the Board considered the incidental public relations benefits to DIMA related to DWS Funds advertising and cross-selling opportunities among DIMA products and services. The Board considered these benefits in reaching its conclusion that the Fund’s management fees were reasonable.
| 18 | | | Deutsche DWS Variable Series II — DWS Global Equity VIP |
Table of Contents
Compliance. The Board considered the significant attention and resources dedicated by DIMA to its compliance processes in recent years. The Board noted in particular (i) the experience, seniority and time commitment of the individuals serving as DIMA’s and the Fund’s chief compliance officers and (ii) the substantial commitment of resources by DIMA and its affiliates to compliance matters, including the retention of compliance personnel.
Based on all of the information considered and the conclusions reached, the Board unanimously determined that the continuation of the Agreement is in the best interests of the Fund. In making this determination, the Board did not give particular weight to any single factor identified above. The Board considered these factors over the course of numerous meetings, certain of which were in executive session with only the Independent Trustees and counsel present. It is possible that individual Independent Trustees may have weighed these factors differently in reaching their individual decisions to approve the continuation of the Agreement.
Deutsche DWS Variable Series II — DWS Global Equity VIP | | | 19 |
Table of Contents
| ||
VS2GE-3 (R-028380-8 8/19) |
Table of Contents
June 30, 2019
Semiannual Report
Deutsche DWS Variable Series II
DWS Global Income Builder VIP
Beginning on January 1, 2021, as permitted by regulations adopted by the Securities and Exchange Commission, you may not be receiving paper copies of the Fund’s shareholder reports from the insurance company that offers your contract unless you specifically request paper copies from your insurance company or from your financial intermediary. Instead, the shareholder reports will be made available on a Web site, and your insurance company will notify you by mail each time a report is posted and provide you with a Web site link to access the report. Instructions for requesting paper copies will be provided by your insurance company.
If you already elected to receive shareholder reports electronically, you will not be affected by this change and you need not take any action. You may elect to receive shareholder reports and other communications from your insurance company electronically by following the instructions provided by your insurance company.
You may elect to receive all future reports in paper free of charge from your insurance company. If your insurance company informs you that future reports will be delivered via Web access, you can inform your insurance company that you wish to continue receiving paper copies of your shareholder reports by following the instructions provided by your insurance company.

Table of Contents
This report must be preceded or accompanied by a prospectus. To obtain an additional prospectus or summary prospectus, if available, call (800) 728-3337 or your financial representative. We advise you to consider the Fund’s objectives, risks, charges and expenses carefully before investing. The summary prospectus and prospectus contain this and other important information about the Fund. Please read the prospectus carefully before you invest.
Although allocation among different asset categories generally limits risk, fund management may favor an asset category that underperforms other assets or markets as a whole. Stocks may decline in value. Smaller company stocks tend to be more volatile than medium-sized or large company stocks. Dividends are not guaranteed. If the dividend-paying stocks held by the Fund reduce or stop paying dividends, the Fund’s ability to generate income may be adversely affected. Preferred stocks, a type of dividend-paying stock, present certain additional risks. Investing in foreign securities, particularly those of emerging markets, presents certain risks, such as currency fluctuations, political and economic changes, and market risks. Emerging markets tend to be more volatile and less liquid than the markets of more mature economies, and generally have less diverse and less mature economic structures and less stable political systems than those of developed countries. Investing in derivatives entails special risks relating to liquidity, leverage and credit that may reduce returns and/or increase volatility. Bond investments are subject to interest-rate, credit, liquidity and market risks to varying degrees. When interest rates rise, bond prices generally fall. Credit risk refers to the ability of an issuer to make timely payments of principal and interest. Because Exchange Traded Funds (ETFs) trade on a securities exchange, their shares may trade at a premium or discount to their net asset value. ETFs also incur fees and expenses so they may not fully match the performance of the indexes they are designed to track. The Fund may lend securities to approved institutions. Any fund that focuses in a particular segment of the market or region of the world will generally be more volatile than a fund that invests more broadly. See the prospectus for details.
The brand DWS represents DWS Group GmbH & Co. KGaA and any of its subsidiaries such as DWS Distributors, Inc. which offers investment products or DWS Investment Management Americas, Inc. and RREEF America L.L.C. which offer advisory services.
DWS Distributors, Inc., 222 South Riverside Plaza, Chicago, IL 60606, (800) 621-1148
NOT FDIC/NCUA INSURED NO BANK GUARANTEE MAY LOSE VALUE NOT A DEPOSIT
NOT INSURED BY ANY FEDERAL GOVERNMENT AGENCY
| 2 | | | Deutsche DWS Variable Series II — DWS Global Income Builder VIP |
Table of Contents
| Performance Summary | June 30, 2019 (Unaudited) |
Fund performance shown is historical, assumes reinvestment of all dividend and capital gain distributions and does not guarantee future results. Investment return and principal value fluctuate with changing market conditions so that, when redeemed, shares may be worth more or less than their original cost. Current performance may be lower or higher than the performance data quoted. Please contact your participating insurance company for the Fund’s most recent month-end performance. Performance does not reflect charges and fees (“contract charges”) associated with the separate account that invests in the Fund or any variable life insurance policy or variable annuity contract for which the Fund is an investment option. These charges and fees will reduce returns.
The gross expense ratios of the Fund, as stated in the fee table of the prospectus dated May 1, 2019 are 0.69% and 1.15% for Class A and Class B shares, respectively, and may differ from the expense ratios disclosed in the Financial Highlights tables in this report.
Generally accepted accounting principles require adjustments to be made to the net assets of the Fund at period end for financial reporting purposes only, and as such, the total return based on the unadjusted net asset value per share may differ from the total return reported in the financial highlights.
Growth of an Assumed $10,000 Investment in DWS Global Income Builder VIP
| The S&P® Target Risk Moderate Index offers significant exposure to fixed income, while also increasing opportunities for higher returns through equities.
The Blended Index consists of an equally weighted blend (50%/50%) of the MSCI World High Dividend Yield Index and Bloomberg Barclays U.S. Universal Index.
MSCI World High Dividend Yield Index is based on the MSCI World Index, its parent index, and includes large and mid-capitalization stocks across 23 developed markets countries. The index is designed to reflect the performance of equities in the parent index (excluding REITs) with higher dividend income and quality characteristics than average dividend yields that are both sustainable and persistent. The index also applies quality screens and reviews 12-month past performance to omit stocks with potentially deteriorating fundamentals that could force them to cut or reduce dividends.
Bloomberg Barclays U.S. Universal Index measures the performance of U.S. dollar-denominated taxable bonds that are rated either investment grade or high yield. The index includes U.S. Treasury bonds, investment-grade and high yield U.S. corporate bonds, mortgage-backed securities, and Eurodollar bonds.
Index returns do not reflect any fees or expenses and it is not possible to invest directly into an index. |
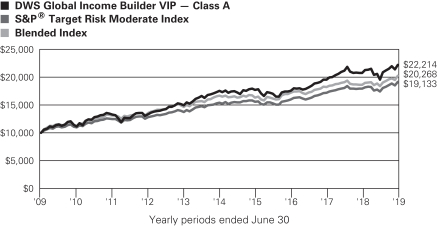
| Comparative Results | ||||||||||||
| DWS Global Income Builder VIP | 6-Month‡ | 1-Year | 3-Year | 5-Year | 10-Year | |||||||
| Class A | Growth of $10,000 | $11,353 | $10,687 | $12,642 | $12,670 | $22,214 | ||||||
| Average annual total return | 13.53% | 6.87% | 8.13% | 4.85% | 8.31% | |||||||
| S&P®Target Risk Moderate Index | Growth of $10,000 | $10,993 | $10,676 | $11,986 | $12,390 | $19,133 | ||||||
| Average annual total return | 9.93% | 6.76% | 6.22% | 4.38% | 6.70% | |||||||
| Blended Index | Growth of $10,000 | $11,021 | $10,871 | $11,798 | $12,153 | $20,268 | ||||||
| Average annual total return | 10.21% | 8.71% | 5.67% | 3.98% | 7.32% | |||||||
The growth of $10,000 is cumulative.
| DWS Global Income Builder VIP | 6-Month‡ | 1-Year | Life of Class* | |||||||||
| Class B | Growth of $10,000 | $11,343 | $10,667 | $10,667 | ||||||||
| Average annual total return | 13.43% | 6.67% | 5.73% | |||||||||
| S&P®Target Risk Moderate Index | Growth of $10,000 | $10,933 | $10,676 | $10,697 | ||||||||
| Average annual total return | 9.93% | 6.76% | 5.95% | |||||||||
| Blended Index | Growth of $10,000 | $11,021 | $10,871 | $10,840 | ||||||||
| Average annual total return | 10.21% | 8.71% | 7.16% | |||||||||
The growth of $10,000 is cumulative.
| * | Class B commenced operations on May 1, 2018. |
| ‡ | Total returns shown for periods less than one year are not annualized. |
Deutsche DWS Variable Series II — DWS Global Income Builder VIP | | | 3 |
Table of Contents
| Portfolio Summary | (Unaudited) |
| Asset Allocation (As a % of Investment Portfolio excluding Securities Lending Collateral) | 6/30/19 | 12/31/18 | ||||||
Equity | 63% | 61% | ||||||
Common Stocks | 55% | 55% | ||||||
Preferred Stocks | 5% | 6% | ||||||
Exchange-Traded Funds | 3% | — | ||||||
Fixed Income | 36% | 37% | ||||||
Corporate Bonds | 13% | 13% | ||||||
Asset-Backed | 9% | 6% | ||||||
Collateralized Mortgage Obligations | 3% | 2% | ||||||
Mortgage-Backed Securities Pass-Throughs | 3% | 0% | ||||||
Commercial Mortgage-Backed Securities | 3% | 1% | ||||||
Short-Term U.S. Treasury Obligations | 3% | 3% | ||||||
Government & Agency Obligations | 2% | 9% | ||||||
Convertible Bonds | 0% | 0% | ||||||
Exchange-Traded Funds | — | 3% | ||||||
| Cash Equivalents | 1% | 2% | ||||||
| 100% | 100% | |||||||
| Sector Diversification (As a % of Equities, Corporate Bonds, Preferred Securities and Convertible Bonds) | 6/30/19 | 12/31/18 | ||||||
| Financials | 18% | 17% | ||||||
| Information Technology | 13% | 12% | ||||||
| Communication Services | 12% | 12% | ||||||
| Energy | 11% | 13% | ||||||
| Consumer Discretionary | 10% | 9% | ||||||
| Health Care | 9% | 9% | ||||||
| Utilities | 7% | 5% | ||||||
| Industrials | 7% | 8% | ||||||
| Consumer Staples | 6% | 6% | ||||||
| Real Estate | 5% | 6% | ||||||
| Materials | 2% | 3% | ||||||
| 100% | 100% | |||||||
Portfolio holdings and characteristics are subject to change.
For more complete details about the Fund’s investment portfolio, see page 5.
Following the Fund’s fiscal first and third quarter-end, a complete portfolio holdings listing is filed with the SEC on Form N-Q or Form N-PORT (available for filings after March 31, 2019). The Fund’s Form N-Q or Form N-PORT will be available on the SEC’s Web site at sec.gov. The Fund’s portfolio holdings are also posted on dws.com from time to time. Please read the Fund’s current prospectus for more information.
Darwei Kung, Managing Director
Di Kumble, CFA, Managing Director
Thomas M. Farina, CFA, Managing Director
Dokyoung Lee, CFA, Director
Scott Agi, CFA, Director
Portfolio Managers
| 4 | | | Deutsche DWS Variable Series II — DWS Global Income Builder VIP |
Table of Contents
| Investment Portfolio | June 30, 2019 (Unaudited) |
| Shares | Value ($) | |||||||
| Common Stocks 56.4% |
| |||||||
| Communication Services 5.5% |
| |||||||
Diversified Telecommunication Services 2.2% |
| |||||||
AT&T, Inc. | 19,448 | 651,703 | ||||||
BCE, Inc. | 3,354 | 152,595 | ||||||
Deutsche Telekom AG (Registered) | 8,895 | 153,912 | ||||||
Nippon Telegraph & Telephone Corp. | 3,694 | 172,223 | ||||||
Orange SA | 11,067 | 174,414 | ||||||
Singapore Telecommunications Ltd. | 63,979 | 165,489 | ||||||
Swisscom AG (Registered) | 317 | 159,237 | ||||||
Telefonica SA | 18,171 | 149,254 | ||||||
Telenor ASA | 7,216 | 153,138 | ||||||
Telia Co. AB | 33,823 | 150,195 | ||||||
TELUS Corp. | 6,071 | 224,426 | ||||||
Verizon Communications, Inc. | 8,609 | 491,832 | ||||||
|
| |||||||
| 2,798,418 | ||||||||
Entertainment 0.5% |
| |||||||
NetEase, Inc. (ADR) | 881 | 225,333 | ||||||
Netflix, Inc.* | 393 | 144,357 | ||||||
Walt Disney Co. | 2,526 | 352,731 | ||||||
|
| |||||||
| 722,421 | ||||||||
Interactive Media & Services 1.6% |
| |||||||
Alphabet, Inc. “A”* | 433 | 468,853 | ||||||
Alphabet, Inc. “C”* | 458 | 495,057 | ||||||
Baidu, Inc. (ADR)* | 1,351 | 158,553 | ||||||
Facebook, Inc. “A”* | 3,594 | 693,642 | ||||||
Tencent Holdings Ltd. (ADR) | 5,200 | 235,352 | ||||||
|
| |||||||
| 2,051,457 | ||||||||
Media 0.8% |
| |||||||
Comcast Corp. “A” | 6,840 | 289,195 | ||||||
Interpublic Group of Companies, Inc. | 6,572 | 148,461 | ||||||
ITV PLC | 107,329 | 147,166 | ||||||
Omnicom Group, Inc. | 1,806 | 148,002 | ||||||
Shaw Communications, Inc. “B” | 7,069 | 144,236 | ||||||
WPP PLC | 12,837 | 161,668 | ||||||
|
| |||||||
| 1,038,728 | ||||||||
Wireless Telecommunication Services 0.4% |
| |||||||
KDDI Corp. | 7,285 | 185,230 | ||||||
NTT DoCoMo, Inc. | 7,730 | 180,294 | ||||||
Vodafone Group PLC | 117,640 | 192,938 | ||||||
|
| |||||||
| 558,462 | ||||||||
| Consumer Discretionary 6.6% |
| |||||||
Auto Components 0.3% |
| |||||||
Bridgestone Corp. (a) | 3,745 | 147,712 | ||||||
Nokian Renkaat Oyj* | 6,259 | 195,527 | ||||||
|
| |||||||
| 343,239 | ||||||||
Automobiles 1.2% |
| |||||||
Bayerische Motoren Werke AG | 2,022 | 149,618 | ||||||
Daimler AG (Registered) | 2,858 | 158,877 | ||||||
Ford Motor Co. | 21,189 | 216,763 | ||||||
General Motors Co. | 4,609 | 177,585 | ||||||
Honda Motor Co., Ltd. | 5,849 | 151,454 | ||||||
| Shares | Value ($) | |||||||
Renault SA | 2,394 | 150,614 | ||||||
Subaru Corp. | 7,354 | 179,051 | ||||||
Toyota Motor Corp. | 5,062 | 314,854 | ||||||
|
| |||||||
| 1,498,816 | ||||||||
Diversified Consumer Services 0.4% |
| |||||||
H&R Block, Inc. | 5,302 | 155,349 | ||||||
New Oriental Education & Technology Group, Inc. (ADR)* | 1,744 | 168,435 | ||||||
Tal Education Group (ADR)* | 5,558 | 211,760 | ||||||
|
| |||||||
| 535,544 | ||||||||
Hotels, Restaurants & Leisure 0.8% |
| |||||||
Carnival Corp. | 2,798 | 130,247 | ||||||
Darden Restaurants, Inc. | 1,187 | 144,494 | ||||||
Las Vegas Sands Corp. | 2,993 | 176,856 | ||||||
McDonald’s Corp. | 1,440 | 299,030 | ||||||
Starbucks Corp. | 2,008 | 168,331 | ||||||
Yum! Brands, Inc. | 1,317 | 145,752 | ||||||
|
| |||||||
| 1,064,710 | ||||||||
Household Durables 0.5% |
| |||||||
Garmin Ltd. | 1,872 | 149,386 | ||||||
Leggett & Platt, Inc. | 3,776 | 144,885 | ||||||
Newell Brands, Inc. | 11,065 | 170,622 | ||||||
Sekisui House Ltd. | 10,808 | 178,515 | ||||||
|
| |||||||
| 643,408 | ||||||||
Internet & Direct Marketing Retail 1.3% |
| |||||||
Alibaba Group Holding Ltd. (ADR)* | 961 | 162,842 | ||||||
Amazon.com, Inc.* | 645 | 1,221,391 | ||||||
Ctrip.com International Ltd. (ADR)* | 4,207 | 155,280 | ||||||
JD.com, Inc. (ADR)* | 5,336 | 161,627 | ||||||
|
| |||||||
| 1,701,140 | ||||||||
Leisure Products 0.1% |
| |||||||
Hasbro, Inc. | 1,416 | 149,643 | ||||||
Multiline Retail 0.6% |
| |||||||
Kohl’s Corp. | 2,959 | 140,701 | ||||||
Macy’s, Inc. | 7,354 | 157,817 | ||||||
Marks & Spencer Group PLC | 54,389 | 145,266 | ||||||
Target Corp. | 1,889 | 163,606 | ||||||
Wesfarmers Ltd. | 6,007 | 152,506 | ||||||
|
| |||||||
| 759,896 | ||||||||
Specialty Retail 0.8% |
| |||||||
Hennes & Mauritz AB “B” | 8,975 | 159,592 | ||||||
Home Depot, Inc. | 2,072 | 430,914 | ||||||
Lowe’s Companies, Inc. | 1,471 | 148,439 | ||||||
The Gap, Inc. | 7,850 | 141,064 | ||||||
TJX Companies, Inc. | 2,771 | 146,530 | ||||||
|
| |||||||
| 1,026,539 | ||||||||
Textiles, Apparel & Luxury Goods 0.6% |
| |||||||
Cie Financiere Richemont SA (Registered) | 1,794 | 152,096 | ||||||
LVMH Moet Hennessy Louis Vuitton SE | 353 | 150,301 | ||||||
NIKE, Inc. “B” | 1,824 | 153,125 | ||||||
Tapestry, Inc. | 4,722 | 149,829 | ||||||
VF Corp. | 1,688 | 147,447 | ||||||
|
| |||||||
| 752,798 | ||||||||
The accompanying notes are an integral part of the financial statements.
Deutsche DWS Variable Series II — DWS Global Income Builder VIP | | | 5 |
Table of Contents
| Shares | Value ($) | |||||||
| Consumer Staples 3.9% |
| |||||||
Beverages 0.8% |
| |||||||
Ambev SA (ADR) | 31,899 | 148,968 | ||||||
Coca-Cola Co. | 7,012 | 357,051 | ||||||
Diageo PLC | 3,397 | 146,290 | ||||||
PepsiCo, Inc. | 2,549 | 334,250 | ||||||
|
| |||||||
| 986,559 | ||||||||
Food & Staples Retailing 0.4% |
| |||||||
Costco Wholesale Corp. | 599 | 158,291 | ||||||
Walgreens Boots Alliance, Inc. | 2,822 | 154,279 | ||||||
Walmart, Inc. | 2,067 | 228,383 | ||||||
|
| |||||||
| 540,953 | ||||||||
Food Products 1.2% |
| |||||||
Archer-Daniels-Midland Co. | 3,682 | 150,226 | ||||||
Bunge Ltd. | 2,582 | 143,843 | ||||||
General Mills, Inc. | 2,786 | 146,321 | ||||||
Kellogg Co. | 2,619 | 140,300 | ||||||
Mondelez International, Inc. “A” | 2,788 | 150,273 | ||||||
Mowi ASA | 6,899 | 161,376 | ||||||
Nestle SA (Registered) | 5,255 | 543,949 | ||||||
The JM Smucker Co. | 1,197 | 137,882 | ||||||
|
| |||||||
| 1,574,170 | ||||||||
Household Products 0.6% |
| |||||||
Colgate-Palmolive Co. | 2,014 | 144,343 | ||||||
Kimberly-Clark Corp. | 1,234 | 164,468 | ||||||
Procter & Gamble Co. | 4,402 | 482,679 | ||||||
|
| |||||||
| 791,490 | ||||||||
Tobacco 0.9% |
| |||||||
Altria Group, Inc. | 6,624 | 313,646 | ||||||
British American Tobacco PLC | 6,632 | 231,874 | ||||||
Japan Tobacco, Inc. | 11,817 | 260,790 | ||||||
Philip Morris International, Inc. | 4,507 | 353,935 | ||||||
|
| |||||||
| 1,160,245 | ||||||||
| Energy 4.5% |
| |||||||
Oil, Gas & Consumable Fuels |
| |||||||
BP PLC | 55,166 | 384,939 | ||||||
Chevron Corp. | 3,414 | 424,838 | ||||||
Enbridge, Inc. | 6,151 | 222,153 | ||||||
Eni SpA | 11,984 | 199,496 | ||||||
Exxon Mobil Corp. | 8,852 | 678,329 | ||||||
Gazprom PJSC (ADR) | 43,031 | 314,987 | ||||||
Kinder Morgan, Inc. | 8,949 | 186,855 | ||||||
LUKOIL PJSC (ADR) | 5,626 | 472,697 | ||||||
Neste Oyj | 5,776 | 196,545 | ||||||
Occidental Petroleum Corp. | 3,619 | 181,963 | ||||||
ONEOK, Inc. | 3,295 | 226,729 | ||||||
Pembina Pipeline Corp. | 4,177 | 155,495 | ||||||
Petroleo Brasileiro SA (ADR) (Preferred) | 10,757 | 152,749 | ||||||
Phillips 66 | 1,728 | 161,637 | ||||||
Plains GP Holdings LP “A”* | 7,270 | 181,532 | ||||||
Repsol SA | 9,138 | 143,444 | ||||||
Royal Dutch Shell PLC “A” | 11,423 | 373,255 | ||||||
Royal Dutch Shell PLC “B” | 10,265 | 336,344 | ||||||
TC Energy Corp. (a) | 3,205 | 158,886 | ||||||
Total SA | 5,013 | 280,842 | ||||||
Valero Energy Corp. | 1,913 | 163,772 | ||||||
Williams Companies, Inc. | 7,839 | 219,806 | ||||||
|
| |||||||
| 5,817,293 | ||||||||
| Shares | Value ($) | |||||||
| Financials 8.7% |
| |||||||
Banks 5.3% |
| |||||||
Aozora Bank Ltd. | 6,123 | 147,090 | ||||||
Australia & New Zealand Banking Group Ltd. | 8,355 | 165,572 | ||||||
Banco Bradesco SA (ADR) (Preferred) | 14,912 | 146,436 | ||||||
Banco Santander SA | 31,787 | 147,167 | ||||||
Bank of America Corp. | 14,406 | 417,774 | ||||||
Bank of Montreal | 1,922 | 145,183 | ||||||
Bank of Nova Scotia | 3,223 | 173,117 | ||||||
BB&T Corp. | 3,016 | 148,176 | ||||||
BNP Paribas SA | 4,159 | 197,586 | ||||||
Canadian Imperial Bank of Commerce (a) | 1,902 | 149,569 | ||||||
Citigroup, Inc. | 3,108 | 217,653 | ||||||
Commonwealth Bank of Australia | 4,021 | 233,751 | ||||||
HSBC Holdings PLC | 44,888 | 374,683 | ||||||
ING Groep NV | 12,787 | 148,212 | ||||||
Itau Unibanco Holding SA (ADR) (Preferred) | 38,240 | 360,221 | ||||||
Japan Post Bank Co., Ltd. | 14,126 | 143,461 | ||||||
JPMorgan Chase & Co. | 5,809 | 649,446 | ||||||
KBC Group NV | 2,180 | 143,092 | ||||||
Lloyds Banking Group PLC | 210,681 | 151,689 | ||||||
Mitsubishi UFJ Financial Group, Inc. | 31,895 | 151,753 | ||||||
Mizuho Financial Group, Inc. | 124,229 | 180,163 | ||||||
National Australia Bank Ltd. | 11,560 | 216,922 | ||||||
People’s United Financial, Inc. | 8,998 | 150,986 | ||||||
Royal Bank of Canada | 2,112 | 167,841 | ||||||
Sberbank of Russia PJSC (ADR) | 32,964 | 503,690 | ||||||
Skandinaviska Enskilda Banken AB “A” | 16,186 | 149,650 | ||||||
Sumitomo Mitsui Financial Group, Inc. | 4,498 | 159,066 | ||||||
Toronto-Dominion Bank | 3,039 | 177,576 | ||||||
U.S. Bancorp. | 2,849 | 149,288 | ||||||
Wells Fargo & Co. | 7,081 | 335,073 | ||||||
Westpac Banking Corp. | 11,460 | 228,322 | ||||||
|
| |||||||
| 6,830,208 | ||||||||
Capital Markets 0.4% |
| |||||||
CME Group, Inc. | 804 | 156,065 | ||||||
Invesco Ltd. | 6,943 | 142,054 | ||||||
UBS Group AG (Registered)* | 12,239 | 145,549 | ||||||
|
| |||||||
| 443,668 | ||||||||
Diversified Financial Services 0.2% |
| |||||||
Berkshire Hathaway, Inc. “B”* | 1,438 | 306,538 | ||||||
Insurance 2.8% |
| |||||||
Admiral Group PLC | 6,979 | 195,909 | ||||||
Ageas | 2,842 | 147,733 | ||||||
Allianz SE (Registered) | 705 | 170,030 | ||||||
American Financial Group, Inc. | 1,514 | 155,139 | ||||||
Assicurazioni Generali SpA | 10,640 | 200,272 | ||||||
Aviva PLC | 34,329 | 181,698 | ||||||
AXA SA | 6,674 | 175,273 | ||||||
Baloise Holding AG (Registered) | 822 | 145,505 | ||||||
Chubb Ltd. | 994 | 146,406 | ||||||
Great-West Lifeco, Inc. | 6,225 | 143,319 | ||||||
Japan Post Holdings Co., Ltd. | 12,758 | 144,516 | ||||||
Legal & General Group PLC | 42,093 | 144,221 | ||||||
MetLife, Inc. | 3,006 | 149,308 | ||||||
The accompanying notes are an integral part of the financial statements.
| 6 | | | Deutsche DWS Variable Series II — DWS Global Income Builder VIP |
Table of Contents
| Shares | Value ($) | |||||||
Muenchener Rueckversicherungs-Gesellschaft AG (Registered) | 626 | 157,158 | ||||||
Poste Italiane SpA 144A | 14,205 | 149,554 | ||||||
Power Corp. of Canada | 6,789 | 146,247 | ||||||
Power Financial Corp. | 7,176 | 165,050 | ||||||
Sampo Oyj “A” | 6,448 | 304,458 | ||||||
Swiss Life Holding AG (Registered) | 334 | 165,706 | ||||||
Swiss Re AG | 2,308 | 234,475 | ||||||
Zurich Insurance Group AG | 705 | 245,051 | ||||||
|
| |||||||
| 3,667,028 | ||||||||
| Health Care 5.3% |
| |||||||
Biotechnology 0.7% |
| |||||||
AbbVie, Inc. | 5,161 | 375,308 | ||||||
Amgen, Inc. | 1,560 | 287,477 | ||||||
Gilead Sciences, Inc. | 4,197 | 283,549 | ||||||
|
| |||||||
| 946,334 | ||||||||
Health Care Equipment & Supplies 0.3% |
| |||||||
Abbott Laboratories | 2,356 | 198,140 | ||||||
Medtronic PLC | 2,128 | 207,246 | ||||||
|
| |||||||
| 405,386 | ||||||||
Health Care Providers & Services 0.5% |
| |||||||
Anthem, Inc. | 530 | 149,571 | ||||||
CVS Health Corp. | 2,731 | 148,812 | ||||||
UnitedHealth Group, Inc. | 1,346 | 328,438 | ||||||
|
| |||||||
| 626,821 | ||||||||
Life Sciences Tools & Services 0.1% |
| |||||||
Thermo Fisher Scientific, Inc. | 547 | 160,643 | ||||||
Pharmaceuticals 3.7% |
| |||||||
Allergan PLC | 1,129 | 189,028 | ||||||
Astellas Pharma, Inc. | 10,586 | 151,036 | ||||||
AstraZeneca PLC | 2,549 | 208,273 | ||||||
Bayer AG (Registered) | 2,383 | 164,794 | ||||||
Bristol-Myers Squibb Co. | 3,683 | 167,024 | ||||||
Eli Lilly & Co. | 1,857 | 205,737 | ||||||
GlaxoSmithKline PLC | 14,735 | 294,996 | ||||||
Johnson & Johnson | 5,507 | 767,015 | ||||||
Merck & Co., Inc. | 4,717 | 395,520 | ||||||
Mitsubishi Tanabe Pharma Corp. | 12,245 | 136,397 | ||||||
Novartis AG (Registered) | 4,596 | 419,490 | ||||||
Novo Nordisk AS “B” | 3,039 | 155,042 | ||||||
Pfizer, Inc. | 12,127 | 525,342 | ||||||
Roche Holding AG (Genusschein) | 1,554 | 437,553 | ||||||
Sanofi | 2,691 | 232,566 | ||||||
Takeda Pharmaceutical Co., Ltd. | 7,097 | 252,185 | ||||||
|
| |||||||
| 4,701,998 | ||||||||
| Industrials 5.1% |
| |||||||
Aerospace & Defense 0.9% |
| |||||||
BAE Systems PLC | 23,529 | 148,090 | ||||||
Boeing Co. | 761 | 277,012 | ||||||
General Dynamics Corp. | 838 | 152,365 | ||||||
Lockheed Martin Corp. | 442 | 160,685 | ||||||
Northrop Grumman Corp. | 442 | 142,815 | ||||||
Raytheon Co. | 761 | 132,323 | ||||||
United Technologies Corp. | 1,141 | 148,558 | ||||||
|
| |||||||
| 1,161,848 | ||||||||
Air Freight & Logistics 0.1% |
| |||||||
United Parcel Service, Inc. “B” | 1,460 | 150,774 | ||||||
| Shares | Value ($) | |||||||
Airlines 0.1% |
| |||||||
easyJet PLC | 12,307 | 148,911 | ||||||
Building Products 0.3% |
| |||||||
Johnson Controls International PLC | 3,652 | 150,864 | ||||||
LIXIL Group Corp. | 10,313 | 163,037 | ||||||
|
| |||||||
| 313,901 | ||||||||
Commercial Services & Supplies 0.3% |
| |||||||
Quad Graphics, Inc. | 2 | 16 | ||||||
Republic Services, Inc. | 1,645 | 142,523 | ||||||
Secom Co., Ltd. | 1,693 | 145,980 | ||||||
Waste Management, Inc. | 1,247 | 143,866 | ||||||
|
| |||||||
| 432,385 | ||||||||
Construction & Engineering 0.2% |
| |||||||
Bouygues SA | 3,982 | 147,645 | ||||||
Kajima Corp. | 10,141 | 139,512 | ||||||
|
| |||||||
| 287,157 | ||||||||
Electrical Equipment 0.4% |
| |||||||
ABB Ltd. (Registered) | 7,388 | 148,466 | ||||||
Eaton Corp. PLC | 1,812 | 150,903 | ||||||
Emerson Electric Co. | 2,358 | 157,326 | ||||||
|
| |||||||
| 456,695 | ||||||||
Industrial Conglomerates 0.4% |
| |||||||
3M Co. | 854 | 148,033 | ||||||
Honeywell International, Inc. | 1,175 | 205,143 | ||||||
Siemens AG (Registered) | 1,209 | 143,877 | ||||||
|
| |||||||
| 497,053 | ||||||||
Machinery 0.9% |
| |||||||
Caterpillar, Inc. | 1,357 | 184,945 | ||||||
Cummins, Inc. | 882 | 151,122 | ||||||
Illinois Tool Works, Inc. | 939 | 141,611 | ||||||
Ingersoll-Rand PLC | 1,170 | 148,204 | ||||||
Kone Oyj “B” | 2,558 | 150,892 | ||||||
Mitsubishi Heavy Industries Ltd. | 3,318 | 144,735 | ||||||
PACCAR, Inc. | 3,352 | 240,204 | ||||||
|
| |||||||
| 1,161,713 | ||||||||
Marine 0.1% |
| |||||||
Kuehne + Nagel International AG (Registered) | 1,102 | 163,728 | ||||||
Professional Services 0.5% |
| |||||||
Adecco Group AG (Registered) | 2,954 | 177,590 | ||||||
Nielsen Holdings PLC | 7,948 | 179,625 | ||||||
RELX PLC | 5,983 | 145,287 | ||||||
SGS SA (Registered) | 55 | 140,073 | ||||||
|
| |||||||
| 642,575 | ||||||||
Road & Rail 0.3% |
| |||||||
Aurizon Holdings Ltd. | 39,101 | 148,346 | ||||||
Union Pacific Corp. | 1,040 | 175,874 | ||||||
|
| |||||||
| 324,220 | ||||||||
Trading Companies & Distributors 0.6% |
| |||||||
ITOCHU Corp. | 8,910 | 170,529 | ||||||
Marubeni Corp. | 23,994 | 159,187 | ||||||
Mitsubishi Corp. | 6,584 | 173,842 | ||||||
Mitsui & Co., Ltd. | 9,235 | 150,624 | ||||||
Sumitomo Corp. | 9,577 | 145,408 | ||||||
|
| |||||||
| 799,590 | ||||||||
The accompanying notes are an integral part of the financial statements.
Deutsche DWS Variable Series II — DWS Global Income Builder VIP | | | 7 |
Table of Contents
| Shares | Value ($) | |||||||
| Information Technology 9.2% |
| |||||||
Communications Equipment 0.8% |
| |||||||
Cisco Systems, Inc. | 9,540 | 522,124 | ||||||
Juniper Networks, Inc. | 5,507 | 146,651 | ||||||
Motorola Solutions, Inc. | 868 | 144,722 | ||||||
Nokia Oyj | 38,662 | 192,429 | ||||||
|
| |||||||
| 1,005,926 | ||||||||
Electronic Equipment, Instruments & Components 0.3% |
| |||||||
Corning, Inc. | 4,817 | 160,069 | ||||||
TE Connectivity Ltd. | 1,637 | 156,792 | ||||||
|
| |||||||
| 316,861 | ||||||||
IT Services 2.4% |
| |||||||
Accenture PLC “A” | 1,304 | 240,940 | ||||||
Automatic Data Processing, Inc. | 1,262 | 208,646 | ||||||
Broadridge Financial Solutions, Inc. | 1,090 | 139,171 | ||||||
Fidelity National Information Services, Inc. | 1,169 | 143,413 | ||||||
Fujitsu Ltd. | 2,069 | 144,405 | ||||||
Infosys Ltd. (ADR) | 19,405 | 207,634 | ||||||
International Business Machines Corp. | 2,798 | 385,844 | ||||||
Leidos Holdings, Inc. | 1,808 | 144,369 | ||||||
MasterCard, Inc. “A” | 1,518 | 401,557 | ||||||
Paychex, Inc. | 2,100 | 172,809 | ||||||
PayPal Holdings, Inc.* | 1,385 | 158,527 | ||||||
Visa, Inc. “A” | 2,951 | 512,146 | ||||||
Western Union Co. | 10,597 | 210,774 | ||||||
|
| |||||||
| 3,070,235 | ||||||||
Semiconductors & Semiconductor Equipment 1.8% |
| |||||||
Analog Devices, Inc. | 1,415 | 159,711 | ||||||
Broadcom, Inc. | 933 | 268,573 | ||||||
Intel Corp. | 9,449 | 452,324 | ||||||
KLA-Tencor Corp. | 1,314 | 155,315 | ||||||
Maxim Integrated Products, Inc. | 2,604 | 155,771 | ||||||
QUALCOMM., Inc. | 2,642 | 200,977 | ||||||
Taiwan Semiconductor Manufacturing Co., Ltd. (ADR) | 12,917 | 505,959 | ||||||
Texas Instruments, Inc. | 2,462 | 282,539 | ||||||
Tokyo Electron Ltd. | 1,180 | 166,010 | ||||||
|
| |||||||
| 2,347,179 | ||||||||
Software 2.2% |
| |||||||
Adobe, Inc.* | 622 | 183,272 | ||||||
Intuit, Inc. | 550 | 143,731 | ||||||
Micro Focus International PLC | 5,776 | 151,518 | ||||||
Microsoft Corp. | 12,796 | 1,714,152 | ||||||
Oracle Corp. | 4,636 | 264,113 | ||||||
salesforce.com, Inc.* | 889 | 134,888 | ||||||
SAP SE | 1,161 | 159,506 | ||||||
Trend Micro, Inc. | 3,130 | 139,485 | ||||||
|
| |||||||
| 2,890,665 | ||||||||
Technology Hardware, Storage & Peripherals 1.7% |
| |||||||
Apple, Inc. | 7,741 | 1,532,099 | ||||||
Canon, Inc. (a) | 8,175 | 238,746 | ||||||
HP, Inc. | 7,555 | 157,068 | ||||||
Samsung Electronics Co., Ltd. (GDR) | 157 | 159,669 | ||||||
Seagate Technology PLC | 3,288 | 154,931 | ||||||
|
| |||||||
| 2,242,513 | ||||||||
| Shares | Value ($) | |||||||
| Materials 1.2% |
| |||||||
Chemicals 0.7% |
| |||||||
Air Products & Chemicals, Inc. | 635 | 143,745 | ||||||
BASF SE | 2,056 | 149,731 | ||||||
Dow, Inc.* | 2,805 | 138,315 | ||||||
DuPont de Nemours, Inc. | 1,477 | 110,878 | ||||||
GEO Specialty Chemicals, Inc.* (b) | 161,069 | 50,576 | ||||||
Linde PLC | 821 | 164,857 | ||||||
LyondellBasell Industries NV “A” | 1,796 | 154,689 | ||||||
|
| |||||||
| 912,791 | ||||||||
Construction Materials 0.1% |
| |||||||
LafargeHolcim Ltd. (Registered)* | 2,910 | 142,256 | ||||||
Metals & Mining 0.3% |
| |||||||
JFE Holdings, Inc. | 10,227 | 150,849 | ||||||
Rio Tinto PLC | 2,492 | 154,388 | ||||||
|
| |||||||
| 305,237 | ||||||||
Paper & Forest Products 0.1% |
| |||||||
UPM-Kymmene Oyj | 5,927 | 157,663 | ||||||
| Real Estate 2.5% |
| |||||||
Equity Real Estate Investment Trusts (REITs) |
| |||||||
AvalonBay Communities, Inc. | 689 | 139,991 | ||||||
Crown Castle International Corp. | 1,156 | 150,685 | ||||||
HCP, Inc. | 4,882 | 156,126 | ||||||
Kimco Realty Corp. | 10,005 | 184,893 | ||||||
Land Securities Group PLC | 14,614 | 154,719 | ||||||
Liberty Property Trust | 3,059 | 153,072 | ||||||
Mid-America Apartment Communities, Inc. | 1,216 | 143,196 | ||||||
National Retail Properties, Inc. | 2,814 | 149,170 | ||||||
Prologis, Inc. | 1,955 | 156,596 | ||||||
Public Storage | 658 | 156,716 | ||||||
Realty Income Corp. | 2,168 | 149,527 | ||||||
RioCan Real Estate Investment Trust | 7,622 | 151,270 | ||||||
Simon Property Group, Inc. | 991 | 158,322 | ||||||
Stockland (a) | 54,185 | 158,703 | ||||||
Ventas, Inc. | 2,691 | 183,930 | ||||||
VEREIT, Inc. | 24,627 | 221,889 | ||||||
Vicinity Centres | 84,544 | 145,545 | ||||||
Welltower, Inc. | 1,983 | 161,674 | ||||||
Weyerhaeuser Co. | 6,003 | 158,119 | ||||||
WP Carey, Inc. | 2,001 | 162,441 | ||||||
|
| |||||||
| 3,196,584 | ||||||||
| Utilities 3.9% |
| |||||||
Electric Utilities 2.3% |
| |||||||
American Electric Power Co., Inc. | 2,004 | 176,372 | ||||||
Duke Energy Corp. | 3,482 | 307,252 | ||||||
EDP — Energias de Portugal SA | 54,758 | 208,053 | ||||||
Endesa SA (a) | 5,674 | 145,884 | ||||||
Enel SpA | 22,718 | 158,656 | ||||||
Entergy Corp. | 1,523 | 156,762 | ||||||
Evergy, Inc. | 2,514 | 151,217 | ||||||
Exelon Corp. | 3,032 | 145,354 | ||||||
FirstEnergy Corp. | 3,386 | 144,955 | ||||||
Fortum Oyj | 7,646 | 169,006 | ||||||
NextEra Energy, Inc. | 888 | 181,916 | ||||||
OGE Energy Corp. | 3,523 | 149,939 | ||||||
Pinnacle West Capital Corp. | 1,556 | 146,404 | ||||||
Power Assets Holdings Ltd. | 21,549 | 155,008 | ||||||
The accompanying notes are an integral part of the financial statements.
| 8 | | | Deutsche DWS Variable Series II — DWS Global Income Builder VIP |
Table of Contents
| Shares | Value ($) | |||||||
PPL Corp. | 5,395 | 167,299 | ||||||
Southern Co. | 3,836 | 212,054 | ||||||
Xcel Energy, Inc. | 2,617 | 155,685 | ||||||
|
| |||||||
| 2,931,816 | ||||||||
Gas Utilities 0.2% |
| |||||||
Enagas SA | 5,198 | 138,767 | ||||||
Snam SpA | 29,114 | 144,668 | ||||||
|
| |||||||
| 283,435 | ||||||||
Multi-Utilities 1.4% |
| |||||||
Ameren Corp. | 1,967 | 147,741 | ||||||
CenterPoint Energy, Inc. | 6,556 | 187,698 | ||||||
Consolidated Edison, Inc. | 1,678 | 147,127 | ||||||
Dominion Energy, Inc | 4,314 | 333,558 | ||||||
DTE Energy Co. | 1,146 | 146,550 | ||||||
Engie SA | 9,871 | 149,597 | ||||||
National Grid PLC | 23,196 | 246,145 | ||||||
Public Service Enterprise Group, Inc. | 2,497 | 146,874 | ||||||
Sempra Energy | 1,163 | 159,843 | ||||||
WEC Energy Group, Inc. | 1,868 | 155,735 | ||||||
|
| |||||||
| 1,820,868 | ||||||||
| Total Common Stocks(Cost $60,217,635) |
| 72,769,132 | ||||||
| Preferred Stocks 4.8% | ||||||||
| Financials 3.2% |
| |||||||
AGNC Investment Corp. Series C, 7.0% | 14,427 | 375,102 | ||||||
AGNC Investment Corp. Series B, 7.75% | 18,000 | 460,440 | ||||||
Bank of America Corp. Series Y, 6.5% | 15,000 | 382,800 | ||||||
BB&T Corp. 5.625% | 10,000 | 257,400 | ||||||
Capital One Financial Corp. Series G, 5.2% | 10,000 | 249,700 | ||||||
Citigroup, Inc. Series S, 6.3% | 15,000 | 392,100 | ||||||
Fifth Third Bancorp. Series I, 6.625% | 10,000 | 275,500 | ||||||
JPMorgan Chase & Co. Series AA, 6.1% | 15,000 | 391,350 | ||||||
KeyCorp Series E, 6.125% | 10,000 | 278,100 | ||||||
Morgan Stanley Series K, 5.85% | 10,000 | 263,200 | ||||||
The Goldman Sachs Group, Inc. Series J, 5.5% | 17,000 | 441,150 | ||||||
Wells Fargo & Co. Series Y, 5.625% | 15,000 | 384,150 | ||||||
|
| |||||||
| 4,150,992 | ||||||||
| Real Estate 1.0% |
| |||||||
Kimco Realty Corp. Series L, 5.125% | 15,000 | 368,100 | ||||||
Prologis, Inc. Series Q, 8.54% | 164 | 10,996 | ||||||
Simon Property Group, Inc. Series J, 8.375% | 8,000 | 551,120 | ||||||
VEREIT, Inc. Series F, 6.7% | 13,600 | 342,856 | ||||||
|
| |||||||
| 1,273,072 | ||||||||
| Utilities 0.6% |
| |||||||
Dominion Energy, Inc. Series A, 5.25% | 30,000 | 774,000 | ||||||
Total Preferred Stocks (Cost $6,389,940) |
| 6,198,064 | ||||||
| Shares | Value ($) | |||||||
| Rights 0.0% |
| |||||||
| Energy |
| |||||||
Repsol SA* (Cost $5,172) | 9,138 | 5,069 | ||||||
| Warrants 0.0% |
| |||||||
| Materials |
| |||||||
Hercules Trust II, Expiration Date 3/31/2029* (b) (Cost $30,284) | 170 | 7,552 | ||||||
| Principal Amount ($)(c) | Value ($) | |||||||
| Corporate Bonds 13.7% |
| |||||||
| Communication Services 3.1% |
| |||||||
Altice Financing SA, 144A, 7.5%, 5/15/2026 | 200,000 | 201,020 | ||||||
Cablevision Systems Corp., 5.875%, 9/15/2022 | 300,000 | 315,000 | ||||||
CCO Holdings LLC, 144A,: | ||||||||
5.375%, 6/1/2029 | 95,000 | 98,088 | ||||||
5.875%, 5/1/2027 | 250,000 | 263,750 | ||||||
Charter Communications Operating LLC, 5.75%, 4/1/2048 | 125,000 | 138,253 | ||||||
CSC Holdings LLC, 144A, 5.5%, 4/15/2027 | 200,000 | 210,000 | ||||||
Expedia Group, Inc., 3.8%, 2/15/2028 | 180,000 | 183,220 | ||||||
GrubHub Holdings, Inc., 144A, 5.5%, 7/1/2027 | 60,000 | 61,582 | ||||||
Netflix, Inc.: |
| |||||||
4.375%, 11/15/2026 | 100,000 | 102,280 | ||||||
5.5%, 2/15/2022 | 365,000 | 383,706 | ||||||
5.875%, 11/15/2028 | 350,000 | 387,492 | ||||||
Nexstar Escrow, Inc., 144A, 5.625%, 7/15/2027 (d) | 25,000 | 25,594 | ||||||
Sirius XM Radio, Inc., 144A, 4.625%, 7/15/2024 (d) | 120,000 | 122,794 | ||||||
Sprint Communications, Inc., 6.0%, 11/15/2022 | 275,000 | 286,687 | ||||||
Sprint Corp., 7.625%, 2/15/2025 | 300,000 | 319,500 | ||||||
Symantec Corp., 3.95%, 6/15/2022 | 275,000 | 278,502 | ||||||
VeriSign, Inc.: |
| |||||||
4.625%, 5/1/2023 | 300,000 | 304,890 | ||||||
5.25%, 4/1/2025 | 300,000 | 320,250 | ||||||
|
| |||||||
| 4,002,608 | ||||||||
| Consumer Discretionary 1.1% |
| |||||||
1011778 B.C. Unlimited Liability Co., 144A, 5.0%, 10/15/2025 | 200,000 | 201,560 | ||||||
American Axle & Manufacturing, Inc., 6.25%, 4/1/2025 (a) | 350,000 | 348,250 | ||||||
General Motors Co., 5.95%, 4/1/2049 | 75,000 | 78,577 | ||||||
Hilton Domestic Operating Co., Inc., 144A, 4.875%, 1/15/2030 | 70,000 | 72,100 | ||||||
Hilton Worldwide Finance LLC, 4.875%, 4/1/2027 | 300,000 | 310,035 | ||||||
IAA, Inc., 144A, 5.5%, 6/15/2027 | 50,000 | 52,000 | ||||||
MGM Resorts International, 5.5%, 4/15/2027 | 345,000 | 361,819 | ||||||
|
| |||||||
| 1,424,341 | ||||||||
The accompanying notes are an integral part of the financial statements.
Deutsche DWS Variable Series II — DWS Global Income Builder VIP | | | 9 |
Table of Contents
| Principal Amount ($)(c) | Value ($) | |||||||
| Consumer Staples 0.2% |
| |||||||
Altria Group, Inc., 5.95%, 2/14/2049 | 70,000 | 79,898 | ||||||
Anheuser-Busch InBev Worldwide, Inc., 5.55%, 1/23/2049 | 121,000 | 148,286 | ||||||
Post Holdings, Inc., 144A, 5.5%, 12/15/2029 (d) | 55,000 | 55,138 | ||||||
|
| |||||||
| 283,322 | ||||||||
| Energy 3.4% |
| |||||||
Antero Midstream Partners LP, 144A, 5.75%, 1/15/2028 | 315,000 | 311,850 | ||||||
Apache Corp., 4.25%, 1/15/2030 | 211,000 | 217,580 | ||||||
Boardwalk Pipelines LP, 4.95%, 12/15/2024 | 125,000 | 133,311 | ||||||
Cheniere Corpus Christi Holdings LLC, 5.875%, 3/31/2025 | 200,000 | 222,750 | ||||||
Cheniere Energy Partners LP, 144A, 5.625%, 10/1/2026 | 350,000 | 369,250 | ||||||
Crestwood Midstream Partners LP, 6.25%, 4/1/2023 | 700,000 | 714,000 | ||||||
CrownRock LP, 144A, 5.625%, 10/15/2025 | 100,000 | 100,250 | ||||||
Devon Energy Corp., 5.0%, 6/15/2045 | 110,000 | 126,197 | ||||||
Empresa Nacional del Petroleo, 144A, 5.25%, 11/6/2029 | 200,000 | 226,588 | ||||||
Energy Transfer Operating LP: |
| |||||||
5.5%, 6/1/2027 | 100,000 | 111,783 | ||||||
6.25%, 4/15/2049 | 70,000 | 82,939 | ||||||
Enterprise Products Operating LP, 4.2%, 1/31/2050 (d) | 332,000 | 331,309 | ||||||
Hess Corp., 5.8%, 4/1/2047 | 70,000 | 77,722 | ||||||
Hilcorp Energy I LP, 144A, 5.75%, 10/1/2025 | 200,000 | 200,500 | ||||||
Kinder Morgan, Inc., 5.2%, 3/1/2048 | 65,000 | 73,427 | ||||||
MEG Energy Corp., 144A, 6.5%, 1/15/2025 | 200,000 | 201,000 | ||||||
MPLX LP, 5.5%, 2/15/2049 | 70,000 | 79,504 | ||||||
Parkland Fuel Corp., | 180,000 | 180,000 | ||||||
Plains All American Pipeline LP, 2.85%, 1/31/2023 | 55,000 | 54,778 | ||||||
Range Resources Corp., 5.0%, 8/15/2022 | 200,000 | 189,750 | ||||||
Targa Resources Partners LP, 5.375%, 2/1/2027 | 200,000 | 207,000 | ||||||
WPX Energy, Inc., 5.25%, 9/15/2024 | 200,000 | 205,250 | ||||||
|
| |||||||
| 4,416,738 | ||||||||
| Financials 1.6% |
| |||||||
Banco Santander SA, 2.706%, 6/27/2024 | 200,000 | 200,380 | ||||||
BPCE SA, 144A, 4.875%, 4/1/2026 | 500,000 | 537,848 | ||||||
Citigroup, Inc., 3.98%, 3/20/2030 | 120,000 | 128,169 | ||||||
FS KKR Capital Corp., 4.75%, 5/15/2022 | 70,000 | 70,726 | ||||||
Morgan Stanley, 4.431%, 1/23/2030 | 94,000 | 103,988 | ||||||
REC Ltd., 144A, 5.25%, 11/13/2023 | 200,000 | 213,266 | ||||||
Royal Bank of Scotland Group PLC, 7.5%, Perpetual (e) | 400,000 | 410,000 | ||||||
Synchrony Financial, 4.375%, 3/19/2024 | 90,000 | 94,243 | ||||||
| Principal Amount ($)(c) | Value ($) | |||||||
The Allstate Corp., 3.85%, 8/10/2049 | 30,000 | 31,378 | ||||||
Wells Fargo & Co., 3.196%, 6/17/2027 | 100,000 | 101,910 | ||||||
Westpac Banking Corp., 5.0%, Perpetual (e) | 200,000 | 192,900 | ||||||
|
| |||||||
| 2,084,808 | ||||||||
| Health Care 1.3% |
| |||||||
AbbVie, Inc., 4.875%, 11/14/2048 | 75,000 | 78,938 | ||||||
Bristol-Myers Squibb Co., 144A, 4.25%, 10/26/2049 | 250,000 | 276,350 | ||||||
CVS Health Corp., 5.05%, 3/25/2048 | 285,000 | 303,559 | ||||||
HCA, Inc.: |
| |||||||
4.125%, 6/15/2029 | 110,000 | 113,078 | ||||||
5.25%, 6/15/2026 | 500,000 | 553,604 | ||||||
7.5%, 2/15/2022 | 350,000 | 385,875 | ||||||
|
| |||||||
| 1,711,404 | ||||||||
| Industrials 0.4% |
| |||||||
Clean Harbors, Inc., 144A, 4.875%, 7/15/2027 (d) | 55,000 | 55,899 | ||||||
Park Aerospace Holdings Ltd., 144A, 5.25%, 8/15/2022 | 175,000 | 184,765 | ||||||
Parker-Hannifin Corp., 3.25%, 6/14/2029 | 40,000 | 41,488 | ||||||
Prime Security Services Borrower LLC, 144A, 5.25%, 4/15/2024 | 255,000 | 259,463 | ||||||
|
| |||||||
| 541,615 | ||||||||
| Information Technology 0.7% |
| |||||||
Broadcom, Inc., 144A, 4.75%, 4/15/2029 | 70,000 | 71,875 | ||||||
Dell International LLC, 144A, 5.3%, 10/1/2029 | 65,000 | 68,497 | ||||||
Fiserv, Inc.: |
| |||||||
3.5%, 7/1/2029 | 140,000 | 143,904 | ||||||
4.4%, 7/1/2049 | 50,000 | 52,604 | ||||||
IQVIA, Inc., 144A, 5.0%, 5/15/2027 | 205,000 | 211,662 | ||||||
NXP BV: |
| |||||||
144A, 3.875%, 6/18/2026 | 150,000 | 154,162 | ||||||
144A, 4.3%, 6/18/2029 | 100,000 | 103,088 | ||||||
Oracle Corp., 4.0%, 11/15/2047 | 60,000 | 64,478 | ||||||
|
| |||||||
| 870,270 | ||||||||
| Materials 0.4% |
| |||||||
Ardagh Packaging Finance PLC, 144A, 7.25%, 5/15/2024 | 200,000 | 210,750 | ||||||
Freeport-McMoRan, Inc., 4.55%, 11/14/2024 | 235,000 | 240,229 | ||||||
|
| |||||||
| 450,979 | ||||||||
| Real Estate 0.5% |
| |||||||
American Tower Corp., 3.8%, 8/15/2029 | 325,000 | 335,011 | ||||||
Hospitality Properties Trust, (REIT), 3.95%, 1/15/2028 | 100,000 | 94,231 | ||||||
Office Properties Income Trust: | ||||||||
(REIT), 4.15%, 2/1/2022 | 60,000 | 60,881 | ||||||
(REIT), 4.25%, 5/15/2024 | 45,000 | 44,847 | ||||||
Omega Healthcare Investors, Inc.: | ||||||||
(REIT), 4.5%, 4/1/2027 | 50,000 | 52,284 | ||||||
(REIT), 4.75%, 1/15/2028 | 60,000 | 63,538 | ||||||
|
| |||||||
| 650,792 | ||||||||
The accompanying notes are an integral part of the financial statements.
| 10 | | | Deutsche DWS Variable Series II — DWS Global Income Builder VIP |
Table of Contents
| Principal Amount ($)(c) | Value ($) | |||||||
| Utilities 1.0% |
| |||||||
Israel Electric Corp. Ltd., REG S, 144A, 5.0%, 11/12/2024 | 200,000 | 216,440 | ||||||
NextEra Energy Operating Partners LP, 144A, 4.25%, 7/15/2024 | 275,000 | 276,724 | ||||||
NRG Energy, Inc., 144A, 5.25%, 6/15/2029 | 148,000 | 157,990 | ||||||
Perusahaan Listrik Negara PT, 144A, 2.875%, 10/25/2025 | EUR 260,000 | 317,857 | ||||||
Southern California Edison Co., Series E, 3.7%, 8/1/2025 | 270,000 | 279,181 | ||||||
Vistra Operations Co. LLC, 144A, 5.0%, 7/31/2027 | 55,000 | 56,994 | ||||||
|
| |||||||
| 1,305,186 | ||||||||
Total Corporate Bonds (Cost $17,465,923) |
| 17,742,063 | ||||||
| Asset-Backed 9.3% |
| |||||||
| Automobile Receivables 1.7% |
| |||||||
AmeriCredit Automobile Receivables Trust, “C”,Series 2019-2, 2.74%, 4/18/2025 | 720,000 | 723,029 | ||||||
Avis Budget Rental Car Funding AESOP LLC, “C”,Series 2019-1A, 144A, 4.53%, 3/20/2023 | 100,000 | 102,827 | ||||||
CPS Auto Receivables Trust, “E”,Series 2015-C, 144A, 6.54%, 8/16/2021 | 500,000 | 515,564 | ||||||
Hertz Vehicle Financing II LP, “A”, Series2018-1A, 144A, 3.29%, 2/25/2024 | 500,000 | 508,705 | ||||||
Santander Drive Auto Receivables Trust, “C”, Series2019-1, 3.42%, 4/15/2025 | 250,000 | 254,563 | ||||||
|
| |||||||
| 2,104,688 | ||||||||
| Credit Card Receivables 2.0% |
| |||||||
Chase Issuance Trust, “A1”,Series 2018-A1, 2.594%**, 4/17/2023 | 1,600,000 | 1,601,600 | ||||||
Citibank Credit Card Issuance Trust, “A7”,Series 2017-A7, 2.782%**, 8/8/2024 | 1,000,000 | 1,002,298 | ||||||
|
| |||||||
| 2,603,898 | ||||||||
| Miscellaneous 5.6% |
| |||||||
Apidos CLO XXIX, “A2”,Series 2018-29A, 144A,3-monthUSD-LIBOR + 1.550%, 4.13%**, 7/25/2030 | 1,500,000 | 1,480,229 | ||||||
DB Master Finance LLC, “A2I”,Series 2019-1A, 144A, 3.787%, 5/20/2049 | 220,000 | 224,690 | ||||||
Dell Equipment Finance Trust, “D”, Series2017-1, 144A, 3.44%, 4/24/2023 | 280,000 | 281,362 | ||||||
Domino’s Pizza Master Issuer LLC, “A23”,Series 2017-1A, 144A, 4.118%, 7/25/2047 | 334,050 | 346,904 | ||||||
Dryden 55 CLO Ltd., “B”,Series 2018-55A, 144A,3-monthUSD-LIBOR + 1.550%, 4.147%**, 4/15/2031 | 1,500,000 | 1,485,550 | ||||||
| Principal Amount ($)(c) | Value ($) | |||||||
GMF Floorplan Owner Revolving Trust, “C”, Series2019-1, 144A, 3.06%, 4/15/2024 | 260,000 | 263,427 | ||||||
GoldenTree Loan Management CLO Ltd., “C1A”, Series 2X, REG S,3-month EURIBOR + 2.450% floor, 2.45%**, 1/20/2032 | EUR 480,000 | 548,073 | ||||||
Hilton Grand Vacations Trust, “B”,Series 2014-AA, 144A, 2.07%, 11/25/2026 | 84,181 | 83,539 | ||||||
Jubilee CLO BV, “C1”,Series 2018-21A, 144A,3-month EURIBOR + 2.500% floor, 2.5%**, 1/15/2032 | EUR 500,000 | 565,415 | ||||||
MVW Owner Trust, “A”,Series 2019-1A, 144A, 2.89%, 11/20/2036 | 530,000 | 536,983 | ||||||
Neuberger Berman CLO Ltd., “B”,Series 2018-28A, 144A,USD-LIBOR + 1.600%, 4.192%**, 4/20/2030 | 750,000 | 740,475 | ||||||
Taco Bell Funding LLC, “A2I”,Series 2018-1A, 144A, 4.318%, 11/25/2048 | 497,500 | 516,052 | ||||||
Wendy’s Funding LLC, “A2I”,Series 2018-1A, 144A, 3.573%, 3/15/2048 | 157,600 | 158,505 | ||||||
|
| |||||||
| 7,231,204 | ||||||||
Total Asset-Backed (Cost $11,916,792) |
| 11,939,790 | ||||||
| Mortgage-Backed SecuritiesPass-Throughs 3.4% | ||||||||
Federal Home Loan Mortgage Corp.: | ||||||||
4.0%, 8/1/2048 | 1,083,747 | 1,122,755 | ||||||
6.0%, 3/1/2038 | 2,798 | 3,098 | ||||||
Federal National Mortgage Association: | ||||||||
4.0%, 7/1/2049 (d) | 3,100,000 | 3,203,959 | ||||||
4.5%, 9/1/2035 | 5,423 | 5,668 | ||||||
6.0%, 1/1/2024 | 7,746 | 8,479 | ||||||
Total Mortgage-Backed SecuritiesPass-Throughs (Cost $4,332,730) |
| 4,343,959 | ||||||
| Commercial Mortgage-Backed Securities 2.7% |
| |||||||
BX Commercial Mortgage Trust, “D”, Series2018-IND, 144A,1-monthUSD-LIBOR + 1.300%, 3.694%**, 11/15/2035 | 203,031 | 202,968 | ||||||
CSAIL Commercial Mortgage Trust, “B”, Series2019-C15, 4.476%, 3/15/2052 | 500,000 | 544,781 | ||||||
DBWF Mortgage Trust, “C”, Series 2018-GLKS, 144A,1-monthUSD-LIBOR + 1.750%, 4.14%**, 11/19/2035 | 250,000 | 250,088 | ||||||
FHLMC Multifamily Structured Pass-Through Certificates, “X1”, Series K043, Interest Only, 0.668%**, 12/25/2024 | 4,898,922 | 127,786 | ||||||
GMAC Commercial Mortgage Securities, Inc., “G”,Series 2004-C1, 144A, 5.455%, 3/10/2038 | 394,448 | 375,293 | ||||||
The accompanying notes are an integral part of the financial statements.
Deutsche DWS Variable Series II — DWS Global Income Builder VIP | | | 11 |
Table of Contents
| Principal Amount ($)(c) | Value ($) | |||||||
GS Mortgage Securities Corp.: | ||||||||
“A4”, Series 2019-GC40, 3.16%, 7/10/2052 (b) (d) | 400,000 | 411,984 | ||||||
“C”, Series 2018-FBLU, 144A,1-monthUSD-LIBOR + 1.600%, 3.994%**, 11/15/2035 | 500,000 | 499,366 | ||||||
MTRO Commercial Mortgage Trust, “C”, Series 2019-TECH, 144A,1-monthUSD-LIBOR + 1.300%, 3.694%**, 12/15/2033 | 250,000 | 250,313 | ||||||
NYT Mortgage Trust, “B”,Series 2019-NYT, 144A,1-monthUSD-LIBOR + 1.400%, 3.794%**, 11/15/2035 | 350,000 | 351,423 | ||||||
Wells Fargo Commercial Mortgage Trust, “A4”, Series 2019-C51, 3.311%, 6/15/2052 (b) (d) | 400,000 | 411,972 | ||||||
Total Commercial Mortgage-Backed Securities (Cost $3,409,912) |
| 3,425,974 | ||||||
| Collateralized Mortgage Obligations 3.4% |
| |||||||
Connecticut Avenue Securities Trust: | ||||||||
“1M2”, Series2019-R03, 144A,1-monthUSD-LIBOR + 2.150%, 4.554%**, 9/25/2031 | 168,000 | 168,926 | ||||||
“1M2”, Series2019-R02, 144A,1-monthUSD-LIBOR + 2.300%, 4.704%**, 8/25/2031 | 256,667 | 258,878 | ||||||
Fannie Mae Connecticut Avenue Securities: | ||||||||
“1M2”, Series2018-C06,1-monthUSD-LIBOR + 2.000%, 4.404%**, 3/25/2031 | 187,500 | 187,735 | ||||||
1-monthUSD-LIBOR + 2.250%, 4.654%**, 7/25/2030 | 172,000 | 173,819 | ||||||
“1M2”, Series2018-C05,1-monthUSD-LIBOR + 2.350%, 4.754%**, 1/25/2031 | 500,000 | 504,442 | ||||||
Federal Home Loan Mortgage Corp.: | ||||||||
“PI”, Series 3843, Interest Only, 4.5%, 5/15/2038 | 122,762 | 4,781 | ||||||
“C31”, Series 303, Interest Only, 4.5%, 12/15/2042 | 974,615 | 183,460 | ||||||
“H”, Series 2278, 6.5%, 1/15/2031 | 110 | 112 | ||||||
Federal National Mortgage Association: | ||||||||
“WO”, Series2013-27, Principal Only, Zero Coupon, 12/25/2042 | 220,000 | 140,013 | ||||||
“AS”, Series 4885, Principal Only, 3.656%, 6/15/2049 | 1,479,316 | 288,619 | ||||||
“4”, Series 406, Interest Only, 4.0%, 9/25/2040 | 87,916 | 15,577 | ||||||
“I”, Series2003-84, Interest Only, 6.0%, 9/25/2033 | 95,911 | 14,380 | ||||||
| Principal Amount ($)(c) | Value ($) | |||||||
Freddie Mac Structured Agency Credit Risk Debt Notes: | ||||||||
“M2”, Series 2019-DNA1, 144A,1-monthUSD-LIBOR + 2.650%, 5.054%**, 1/25/2049 | 60,000 | 61,427 | ||||||
“M2”, Series 2019-DNA2, 144A,1-monthUSD-LIBOR + 2.450%, 4.854%**, 3/25/2049 | 660,000 | 669,228 | ||||||
Government National Mortgage Association: | ||||||||
“PI”, Series2015-40, Interest Only, 4.0%, 4/20/2044 | 188,131 | 17,363 | ||||||
“PI”, Series2014-108, Interest Only, 4.5%, 12/20/2039 | 52,936 | 7,443 | ||||||
“IP”, Series2014-11, Interest Only, 4.5%, 1/20/2043 | 130,825 | 13,365 | ||||||
“IN”, Series2009-69, Interest Only, 5.5%, 8/20/2039 | 157,764 | 26,533 | ||||||
“IV”, Series2009-69, Interest Only, 5.5%, 8/20/2039 | 153,384 | 25,716 | ||||||
“IJ”, Series2009-75, Interest Only, 6.0%, 8/16/2039 | 104,713 | 17,009 | ||||||
New Residential Mortgage Loan: | ||||||||
“A1”, Series 2019-NQM3, 144A, 2.802%, 7/25/2049 | 500,000 | 500,884 | ||||||
“A1”, Series 2019-NQM2, 144A, 3.6%, 4/25/2049 | 191,269 | 194,029 | ||||||
STACR Trust, “M2”,Series 2018-DNA3, 144A,1-monthUSD-LIBOR + 2.100%, 4.504%**, 9/25/2048 | 324,324 | 324,325 | ||||||
Verus Securitization Trust, “A1”, Series 2019-INV1, 144A, 3.402%, 12/25/2059 | 544,018 | 550,000 | ||||||
Total Collateralized Mortgage Obligations |
| 4,348,064 | ||||||
| Government & Agency Obligations 2.1% |
| |||||||
| Sovereign Bonds 0.7% |
| |||||||
Republic of Indonesia, 4.45%, 2/11/2024 | 225,000 | 238,918 | ||||||
Republic of Kazakhstan, 144A, 1.55%, 11/9/2023 | EUR 270,000 | 322,254 | ||||||
Republic of South Africa, 4.875%, 4/14/2026 | 200,000 | 206,820 | ||||||
State of Qatar, 144A, 3.25%, 6/2/2026 | 200,000 | 205,642 | ||||||
|
| |||||||
| 973,634 | ||||||||
| U.S. Treasury Obligations 1.4% |
| |||||||
U.S. Treasury Notes: |
| |||||||
0.5%, 4/15/2024 | 1,620,896 | 1,641,132 | ||||||
2.375%, 5/15/2029 | 153,000 | 158,110 | ||||||
|
| |||||||
| 1,799,242 | ||||||||
Total Government & Agency Obligations (Cost $2,726,345) |
| 2,772,876 | ||||||
| Convertible Bonds 0.2% |
| |||||||
| Materials |
| |||||||
GEO Specialty Chemicals, Inc.,3-monthUSD-LIBOR + 14.0%, 16.503%** PIK, 10/18/2025 (b) (Cost $272,093) | 273,418 | 306,501 | ||||||
The accompanying notes are an integral part of the financial statements.
| 12 | | | Deutsche DWS Variable Series II — DWS Global Income Builder VIP |
Table of Contents
| Principal Amount ($)(c) | Value ($) | |||||||
| Short-Term U.S. Treasury Obligations 2.6% |
| |||||||
U.S. Treasury Bills: |
| |||||||
2.362%***, 8/15/2019 (f) | 1,750,000 | 1,745,423 | ||||||
2.573%***, 10/10/2019 (g) | 1,660,000 | 1,650,243 | ||||||
Total Short-Term U.S. Treasury Obligations (Cost $3,392,850) |
| 3,395,666 | ||||||
| Shares | Value ($) | |||||||
| Exchange-Traded Funds 2.6% |
| |||||||
Vanguard Real Estate ETF (Cost $3,299,515) | 37,670 | 3,292,358 | ||||||
| Commercial Paper 0.4% |
| |||||||
Ford Motor Credit Co. (Cost $496,593) | 500,000 | 496,408 | ||||||
| Shares | Value ($) | |||||||
| Securities Lending Collateral 1.0% |
| |||||||
DWS Government & Agency Securities Portfolio “DWS Government Cash Institutional Shares”, 2.28% (h) (i) (Cost $1,292,302) | 1,292,302 | 1,292,302 | ||||||
| Cash Equivalents 1.4% |
| |||||||
DWS Central Cash Management Government Fund, 2.40% (h) (Cost $1,858,043) | 1,858,043 | 1,858,043 | ||||||
| % of Net Assets | Value ($) | |||||||
Total Investment Portfolio (Cost $121,222,328) | 104,1 | 134,193,821 | ||||||
| Other Assets and Liabilities, Net | (4.1 | ) | (5,223,979 | ) | ||||
| Net Assets | 100.0 | 128,969,842 | ||||||
A summary of the Fund’s transactions with affiliated investments during the period ended June 30, 2019 are as follows:
| Value ($) at 12/31/2018 | Purchases Cost ($) | Sales Proceeds ($) | Net Realized Gain/ (Loss) ($) | Net Change in Unrealized Appreciation (Depreciation) ($) | Income ($) | Capital Gain Distributions ($) | Number of Shares at 6/30/2019 | Value ($) at 6/30/2019 | ||||||||||||||||||||||||
Securities Lending Collateral 1.0% |
| |||||||||||||||||||||||||||||||
DWS Government & Agency Securities Portfolio “DWS Government Cash Institutional Shares”, 2.28% (h) (i) |
| |||||||||||||||||||||||||||||||
| 2,070,696 | — | 778,394 | (j) | — | — | 14,934 | — | 1,292,302 | 1,292,302 | |||||||||||||||||||||||
Cash Equivalents 1.4% |
| |||||||||||||||||||||||||||||||
DWS Central Cash Management Government Fund, 2.40% (h) |
| |||||||||||||||||||||||||||||||
| 2,297,660 | 34,754,860 | 35,194,477 | — | — | 59,454 | — | 1,858,043 | 1,858,043 | ||||||||||||||||||||||||
| 4,368,356 | 34,754,860 | 35,972,871 | — | — | 74,388 | — | 3,150,345 | 3,150,345 | ||||||||||||||||||||||||
| * | Non-income producing security. |
| ** | Variable or floating rate security. These securities are shown at their current rate as of June 30, 2019. For securities based on a published reference rate and spread, the reference rate and spread are indicated within the description above. Certain variable rate securities are not based on a published reference rate and spread but adjust periodically based on current market conditions, prepayment of underlying positions and/or other variables. |
| *** | Annualized yield at time of purchase; not a coupon rate. |
| (a) | All or a portion of these securities were on loan. In addition, “Other Assets and Liabilities, Net” may include pending sales that are also on loan. The value of securities loaned at June 30, 2019 amounted to $1,232,073, which is 1.0% of net assets. |
| (b) | Investment was valued using significant unobservable inputs. |
| (c) | Principal amount stated in U.S. dollars unless otherwise noted. |
| (d) | When-issued, delayed delivery or forward commitment securities included. |
| (e) | Perpetual, callable security with no stated maturity date. |
| (f) | At June 30, 2019, this security has been pledged, in whole or in part, to cover initial margin requirements for open futures contracts. |
| (g) | At June 30, 2019, this security has been pledged, in whole or in part, to cover initial margin requirements for open centrally cleared swap contracts. |
| (h) | Affiliated fund managed by DWS Investment Management Americas, Inc. The rate shown is the annualized seven-day yield at period end. |
| (i) | Represents cash collateral held in connection with securities lending. Income earned by the Fund is net of borrower rebates. |
| (j) | Represents the net increase (purchase cost) or decrease (sales proceeds) in the amount invested in cash collateral for the period ended June 30, 2019. |
144A: Security exempt from registration under Rule 144A of the Securities Act of 1933. These securities may be resold in transactions exempt from registration, normally to qualified institutional buyers.
ADR: American Depositary Receipt
ASX: Australian Securities Exchange
CLO: Collateralized Loan Obligation
EURIBOR: Euro Interbank Offered Rate
GDR: Global Depositary Receipt
Interest Only: Interest Only (IO) bonds represent the “interest only” portion of payments on a pool of underlying mortgages or mortgage-backed securities. IO securities are subject to prepayment risk of the pool of underlying mortgages.
The accompanying notes are an integral part of the financial statements.
Deutsche DWS Variable Series II — DWS Global Income Builder VIP | | | 13 |
Table of Contents
LIBOR: London Interbank Offered Rate
MSCI: Morgan Stanley Capital International
PIK: Denotes that all or a portion of the income is paid in-kind in the form of additional principal.
PJSC: Public Joint Stock Company
Principal Only: Principal Only (PO) bonds represent the “principal only” portion of payments on a pool of underlying mortgages or mortgage-backed securities.
REG S: Securities sold under Regulation S may not be offered, sold or delivered within the United States or to, or for the account or benefit of, U.S. persons, except pursuant to an exemption from, or in a transaction not subject to, the registration requirements of the Securities Act of 1933.
REIT: Real Estate Investment Trust
S&P: Standard & Poor’s
At June 30, 2019, open futures contracts purchased were as follows:
| Futures | Currency | Expiration Date | Contracts | Notional Amount ($) | Notional Value ($) | Unrealized Appreciation (Depreciation) ($) | ||||||||||||||||||
| 10 Year U.S. Treasury Note | USD | 9/19/2019 | 43 | 5,417,438 | 5,502,656 | 85,218 | ||||||||||||||||||
| 3 Month Euro Euribor Interest Rate | EUR | 9/14/2020 | 2 | 570,784 | 571,336 | 552 | ||||||||||||||||||
| 3 Month Euro Swiss Franc (Euroswiss) Interest Rate | CHF | 9/14/2020 | 2 | 516,548 | 516,800 | 252 | ||||||||||||||||||
| 3 Month Euroyen | JPY | 9/14/2020 | 2 | 464,113 | 464,036 | (77 | ) | |||||||||||||||||
| 3 Month Sterling (Short Sterling) Interest Rate | GBP | 9/16/2020 | 3 | 472,674 | 472,683 | 9 | ||||||||||||||||||
| 90 Day Eurodollar Time Deposit | USD | 9/14/2020 | 2 | 492,131 | 492,225 | 94 | ||||||||||||||||||
| ASX 90 Day Bank Accepted Bills | AUD | 9/10/2020 | 3 | 2,100,563 | 2,101,331 | 768 | ||||||||||||||||||
| MSCI Emerging Market Index | USD | 9/20/2019 | 57 | 2,884,720 | 3,002,190 | 117,470 | ||||||||||||||||||
| Ultra 10 Year U.S. Treasury Note | USD | 9/19/2019 | 46 | 6,265,018 | 6,353,750 | 88,732 | ||||||||||||||||||
| Ultra Long U.S. Treasury Bond | USD | 9/19/2019 | 22 | 3,812,490 | 3,906,375 | 93,885 | ||||||||||||||||||
| Total net unrealized appreciation |
| 386,903 | ||||||||||||||||||||||
At June 30, 2019, open futures contracts sold were as follows:
| Futures | Currency | Expiration Date | Contracts | Notional Amount ($) | Notional Value ($) | Unrealized Depreciation ($) | ||||||||||||||||||
| Euro Stoxx 50 Index | EUR | 9/20/2019 | 67 | 2,528,356 | 2,640,597 | (112,241 | ) | |||||||||||||||||
| S&P 500E-Mini Index | USD | 9/20/2019 | 10 | 1,400,095 | 1,472,100 | (72,005 | ) | |||||||||||||||||
| TOPIX Index | JPY | 9/12/2019 | 2 | 280,934 | 287,715 | (6,781 | ) | |||||||||||||||||
| U.S. Treasury Long Bond | USD | 9/19/2019 | 5 | 761,550 | 777,969 | (16,419 | ) | |||||||||||||||||
| Total unrealized depreciation |
| (207,446 | ) | |||||||||||||||||||||
At June 30, 2019, open interest rate swap contracts were as follows:
| Centrally Cleared Swaps | ||||||||||||||||||||||||||
| Cash Flows Paid by the Fund/Frequency | Cash Flows Received by the Fund/Frequency | Effective/ Expiration Date | Notional Amount ($) | Currency | Value ($) | Upfront Payments Paid/ (Received) ($) | Unrealized Depreciation ($) | |||||||||||||||||||
| Fixed — 1.961%Semi-Annually | Floating —3-Month LIBOR Quarterly | 6/28/2019 6/28/2029 | 400,000 | USD | (186) | — | (186) | |||||||||||||||||||
| Fixed — 2.636%Semi-Annually | Floating —3-Month LIBOR Quarterly | 1/21/2020 1/21/2025 | 1,800,000 | USD | (77,939) | — | (77,939) | |||||||||||||||||||
| Fixed — 2.729%Semi-Annually | Floating —3-Month LIBOR Quarterly | 3/4/2019 3/5/2029 | 400,000 | USD | (30,815) | — | (30,815) | |||||||||||||||||||
| Total unrealized depreciation |
| (108,940) | ||||||||||||||||||||||||
LIBOR: London Interbank Offered Rate;3-month LIBOR rate as of March 31, 2019 is 2.600%.
The accompanying notes are an integral part of the financial statements.
| 14 | | | Deutsche DWS Variable Series II — DWS Global Income Builder VIP |
Table of Contents
As of June 30, 2019, the Fund had the following open forward foreign currency contracts:
| Contracts to Deliver | In Exchange For | Settlement Date | Unrealized Appreciation ($) | Counterparty | ||||||||||||||||||||||
| USD | 1,104,663 | CAD | 1,480,000 | 8/7/2019 | 26,407 | State Street Bank and Trust | ||||||||||||||||||||
| EUR | 1,983,000 | JPY | 245,548,074 | 8/8/2019 | 22,216 | Credit Agricole | ||||||||||||||||||||
| EUR | 1,567,000 | USD | 1,798,820 | 9/26/2019 | 5,009 | JPMorgan Chase Securities, Inc. | ||||||||||||||||||||
| Total unrealized appreciation | 53,632 | |||||||||||||||||||||||||
| Contracts to Deliver | In Exchange For | Settlement Date | Unrealized Depreciation ($) | Counterparty | ||||||||||||||||||||||
| CAD | 1,480,000 | USD | 1,100,790 | 8/7/2019 | (30,281 | ) | Bank of America | |||||||||||||||||||
| AUD | 1,580,000 | USD | 1,102,836 | 8/8/2019 | (7,798 | ) | State Street Bank and Trust | |||||||||||||||||||
| AUD | 1,580,000 | USD | 1,096,267 | 8/8/2019 | (14,366 | ) | National Australia Bank Ltd. | |||||||||||||||||||
| EUR | 980,000 | USD | 1,099,156 | 8/30/2019 | (20,412 | ) | Credit Agricole | |||||||||||||||||||
| USD | 6,681,472 | EUR | 5,830,000 | 9/12/2019 | (14,663 | ) | Bank of America | |||||||||||||||||||
| EUR | 5,830,000 | USD | 6,640,247 | 9/12/2019 | (26,561 | ) | Bank of America | |||||||||||||||||||
| Total unrealized depreciation | (114,081 | ) | ||||||||||||||||||||||||
Currency Abbreviations
| AUD | Australian Dollar |
| CHF | Swiss Franc |
| EUR | Euro |
| GBP | British Pound |
| JPY | Japanese Yen |
| USD | United States Dollar |
For information on the Fund’s policy and additional disclosures regarding futures contracts, interest rate swap contracts and forward foreign currency contracts, please refer to the Derivatives section of Note B in the accompanying Notes to Financial Statements.
The accompanying notes are an integral part of the financial statements.
Deutsche DWS Variable Series II — DWS Global Income Builder VIP | | | 15 |
Table of Contents
Fair Value Measurements
Various inputs are used in determining the value of the Fund’s investments. These inputs are summarized in three broad levels. Level 1 includes quoted prices in active markets for identical securities. Level 2 includes other significant observable inputs (including quoted prices for similar securities, interest rates, prepayment speeds and credit risk). Level 3 includes significant unobservable inputs (including the Fund’s own assumptions in determining the fair value of investments). The level assigned to the securities valuations may not be an indication of the risk or liquidity associated with investing in those securities.
The following is a summary of the inputs used as of June 30, 2019 in valuing the Fund’s investments. For information on the Fund’s policy regarding the valuation of investments, please refer to the Security Valuation section of Note A in the accompanying Notes to Financial Statements.
| Assets | Level 1 | Level 2 | Level 3 | Total | ||||||||||||
| Common Stocks (k) | ||||||||||||||||
Communication Services | $ | 5,024,328 | $ | 2,145,158 | $ | — | $ | 7,169,486 | ||||||||
Consumer Discretionary | 6,089,750 | 2,385,983 | — | 8,475,733 | ||||||||||||
Consumer Staples | 3,709,138 | 1,344,279 | — | 5,053,417 | ||||||||||||
Energy | 3,902,428 | 1,914,865 | — | 5,817,293 | ||||||||||||
Financials | 5,402,155 | 5,845,287 | — | 11,247,442 | ||||||||||||
Health Care | 4,388,850 | 2,452,332 | — | 6,841,182 | ||||||||||||
Industrials | 3,484,791 | 3,055,759 | — | 6,540,550 | ||||||||||||
Information Technology | 10,681,280 | 1,192,099 | — | 11,873,379 | ||||||||||||
Materials | 712,484 | 754,887 | 50,576 | 1,517,947 | ||||||||||||
Real Estate | 2,737,617 | 458,967 | — | 3,196,584 | ||||||||||||
Utilities | 3,520,335 | 1,515,784 | — | 5,036,119 | ||||||||||||
| Preferred Stocks (k) | 6,198,064 | — | — | 6,198,064 | ||||||||||||
| Rights | — | 5,069 | — | 5,069 | ||||||||||||
| Warrants | — | — | 7,552 | 7,552 | ||||||||||||
| Fixed Income Investments (k) | ||||||||||||||||
Corporate Bonds | — | 17,742,063 | — | 17,742,063 | ||||||||||||
Asset-Backed | — | 11,939,790 | — | 11,939,790 | ||||||||||||
Mortgage-Backed Securities Pass-Throughs | — | 4,343,959 | — | 4,343,959 | ||||||||||||
Commercial Mortgage-Backed Securities | — | 2,602,018 | 823,956 | 3,425,974 | ||||||||||||
Collateralized Mortgage Obligations | — | 4,348,064 | — | 4,348,064 | ||||||||||||
Government & Agency Obligations | — | 2,772,876 | — | 2,772,876 | ||||||||||||
Convertible Bonds | — | — | 306,501 | 306,501 | ||||||||||||
Short-Term U.S. Treasury Obligations | — | 3,395,666 | — | 3,395,666 | ||||||||||||
Commercial papers | — | 496,408 | — | 496,408 | ||||||||||||
| Exchange-Traded Funds | 3,292,358 | — | — | 3,292,358 | ||||||||||||
| Short-Term Investments (k) | 3,150,345 | — | — | 3,150,345 | ||||||||||||
| Derivatives (l) | ||||||||||||||||
Futures Contracts | 386,980 | — | — | 386,980 | ||||||||||||
Forward Foreign Currency Contracts | — | 53,632 | — | 53,632 | ||||||||||||
| Total | $ | 62,680,903 | $ | 70,764,945 | $ | 1,188,585 | $ | 134,634,433 | ||||||||
| Liabilities | Level 1 | Level 1 | Level 1 | Level 1 | ||||||||||||
| Derivatives (l) | ||||||||||||||||
Futures Contracts | $ | (207,523 | ) | $ | — | $ | — | $ | (207,523 | ) | ||||||
Interest Rate Swap Contracts | — | (108,940 | ) | — | (108,940 | ) | ||||||||||
Forward Foreign Currency Contracts | — | (114,081 | ) | — | (114,081 | ) | ||||||||||
| Total | $ | (207,523 | ) | $ | (223,021 | ) | $ | — | $ | (430,544 | ) | |||||
| (k) | See Investment Portfolio for additional detailed categorizations. |
| (l) | Derivatives include unrealized appreciation (depreciation) on open futures contracts, interest rate swap contracts and forward foreign currency contracts. |
The accompanying notes are an integral part of the financial statements.
| 16 | | | Deutsche DWS Variable Series II — DWS Global Income Builder VIP |
Table of Contents
Statement of Assets and Liabilities
| as of June 30, 2019 (Unaudited) | ||||
| Assets | ||||
| Investments innon-affiliated securities, at value (cost $118,071,983) — including $1,232,073 of securities loaned | $ | 131,043,476 | ||
| Investment in DWS Government & Agency Securities Portfolio (cost $1,292,302)* | 1,292,302 | |||
| Investment in DWS Central Cash Management Government Fund (cost $1,858,043) | 1,858,043 | |||
| Cash | 331,751 | |||
| Foreign currency, at value (cost $193,366) | 194,580 | |||
| Receivable for investments sold | 532,017 | |||
| Receivable for Fund shares sold | 5,446 | |||
| Dividends receivable | 244,347 | |||
| Interest receivable | 310,871 | |||
| Receivable for variation margin on centrally cleared swaps | 9,077 | |||
| Unrealized appreciation on forward foreign currency contracts | 53,632 | |||
| Foreign taxes recoverable | 113,790 | |||
| Other assets | 1,796 | |||
| Total assets | 135,991,128 | |||
| Liabilities | ||||
| Payable upon return of securities loaned | 1,292,302 | |||
| Payable for investments purchased | 472,093 | |||
| Payable for investments purchased — when-issued securities | 4,797,657 | |||
| Payable for Fund shares redeemed | 137,005 | |||
| Payable for variation margin on futures contracts | 40,229 | |||
| Unrealized depreciation on forward foreign currency contracts | 114,081 | |||
| Accrued management fee | 38,887 | |||
| Accrued Trustees’ fees | 2,864 | |||
| Other accrued expenses and payables | 126,168 | |||
| Total liabilities | 7,021,286 | |||
| Net assets, at value | $ | 128,969,842 | ||
| Net Assets Consist of |
| |||
| Distributable earnings (loss) | 15,962,636 | |||
| Paid-in capital | 113,007,206 | |||
| Net assets, at value | $ | 128,969,842 | ||
| Net Asset Value |
| |||
Class A |
| |||
| Net Asset Value,offering and redemption price per share ($128,959,171 ÷ 5,541,918 outstanding shares of beneficial interest, no par value, unlimited number of shares authorized) | $ | 23.27 | ||
Class B |
| |||
| Net Asset Value,offering and redemption price per share ($10,671 ÷ 458.6 outstanding shares of beneficial interest, no par value, unlimited number of shares authorized) | $ | 23.27 | ||
| * | Represents collateral on securities loaned. |
The accompanying notes are an integral part of the financial statements.
Deutsche DWS Variable Series II — DWS Global Income Builder VIP | | | 17 |
Table of Contents
| for the six months ended June 30, 2019 (Unaudited) |
| |||
| Investment Income | ||||
| Income: |
| |||
| Dividends (net of foreign taxes withheld of $90,876) | $ | 1,684,061 | ||
| Interest | 871,671 | |||
| Income distributions — DWS Central Cash Management Government Fund | 59,454 | |||
| Securities lending income, net of borrower rebates | 14,394 | |||
| Total income | 2,629,580 | |||
| Expenses: |
| |||
| Management fee | 232,921 | |||
| Administration fee | 62,952 | |||
| Services to Shareholders | 669 | |||
| Distribution service fees (Class B) | 13 | |||
| Custodian fee | 27,643 | |||
| Professional fees | 53,282 | |||
| Reports to shareholders | 25,730 | |||
| Trustees’ fees and expenses | 4,558 | |||
| Other | 23,681 | |||
| Total expenses before expense reductions | 431,449 | |||
| Expense reductions | (14 | ) | ||
| Total expenses after expense reductions | 431,435 | |||
| Net investment income | 2,198,145 | |||
| Realized and Unrealized Gain (Loss) |
| |||
| Net realized gain (loss) from: |
| |||
| Investments | (454,731 | ) | ||
| Swap contracts | 135,952 | |||
| Futures | 1,124,081 | |||
| Forward foreign currency contracts | (42,591 | ) | ||
| Foreign currency | 16,365 | |||
| 779,076 | ||||
| Change in net unrealized appreciation (depreciation) on: | ||||
| Investments | 12,584,705 | |||
| Swap contracts | (605 | ) | ||
| Futures | 374,421 | |||
| Forward foreign currency contracts | (20,843 | ) | ||
| Foreign currency | 6,191 | |||
| 12,943,869 | ||||
| Net gain (loss) | 13,722,945 | |||
| Net increase (decrease) in net assets resulting from operations | $ | 15,921,090 | ||
The accompanying notes are an integral part of the financial statements.
| 18 | | | Deutsche DWS Variable Series II — DWS Global Income Builder VIP |
Table of Contents
Statements of Changes in Net Assets
| Increase (Decrease) in Net Assets | Six Months | Year Ended 2018 | ||||||
| Operations: | ||||||||
| Net investment income | $ | 2,198,145 | $ | 4,562,853 | ||||
| Net realized gain (loss) | 779,076 | 2,201,335 | ||||||
| Change in net unrealized appreciation (depreciation) | 12,943,869 | (16,929,613 | ) | |||||
| Net increase (decrease) in net assets resulting from operations | 15,921,090 | (10,165,425 | ) | |||||
| Distributions to shareholders: |
| |||||||
Class A | (5,055,619 | ) | (17,909,607 | ) | ||||
Class B | (391 | ) | — | |||||
| Total distributions | (5,056,010 | ) | (17,909,607 | ) | ||||
| Fund share transactions: | ||||||||
Class A |
| |||||||
| Proceeds from shares sold | 1,344,623 | 2,336,008 | ||||||
| Reinvestment of distributions | 5,055,619 | 17,909,607 | ||||||
| Payments for shares redeemed | (7,916,381 | ) | (19,079,316 | ) | ||||
| Net increase (decrease) in net assets from Class A share transactions | (1,516,139 | ) | 1,166,299 | |||||
Class B |
| |||||||
| Reinvestment of distributions | 391 | 10,000 | * | |||||
| Net increase (decrease) in net assets from Class B share transactions | 391 | 10,000 | * | |||||
| Increase (decrease) in net assets | 9,349,332 | (26,898,733 | ) | |||||
| Net assets at beginning of year | 119,620,510 | 146,519,243 | ||||||
| Net assets at end of year | 128,969,842 | 119,620,510 | ||||||
| Other Information |
| |||||||
Class A |
| |||||||
| Shares outstanding at beginning of period | 5,608,755 | 5,517,134 | ||||||
| Shares sold | 57,896 | 97,250 | ||||||
| Shares issued to shareholders in reinvestment of distributions | 220,866 | 796,691 | ||||||
| Shares redeemed | (345,599 | ) | (802,320 | ) | ||||
| Net increase (decrease) in Class A shares | (66,837 | ) | 91,621 | |||||
| Shares outstanding at end of period | 5,541,918 | 5,608,755 | ||||||
Class B |
| |||||||
| Shares outstanding at beginning of period | 441.5 | — | ||||||
| Shares sold | 17.1 | 441.5 | * | |||||
| Net increase (decrease) in Class B shares | 17.1 | 441.5 | * | |||||
| Shares outstanding at end of period | 458.6 | 441.5 | * | |||||
| * | For the period from May 1, 2018 (commencement of operations of Class B) to December 31, 2018. |
The accompanying notes are an integral part of the financial statements.
Deutsche DWS Variable Series II — DWS Global Income Builder VIP | | | 19 |
Table of Contents
| Six Months Ended 6/30/19 (Unaudited) | Years Ended December 31, | |||||||||||||||||||||||
| Class A | 2018 | 2017 | 2016 | 2015 | 2014 | |||||||||||||||||||
| Selected Per Share Data | ||||||||||||||||||||||||
| Net asset value, beginning of period | $ | 21.33 | $ | 26.56 | $ | 23.50 | $ | 22.93 | $ | 24.62 | $ | 27.30 | ||||||||||||
| Income (loss) from investment operations: | ||||||||||||||||||||||||
Net investment incomea | .40 | .80 | .71 | .61 | .68 | .72 | ||||||||||||||||||
Net realized and unrealized gain (loss) | 2.47 | (2.67 | ) | 3.10 | .91 | (.97 | ) | .25 | ||||||||||||||||
Total from investment operations | 2.87 | (1.87 | ) | 3.81 | 1.52 | (.29 | ) | .97 | ||||||||||||||||
| Less distributions from: | ||||||||||||||||||||||||
Net investment income | (.90 | ) | (.98 | ) | (.75 | ) | (.95 | ) | (.76 | ) | (.85 | ) | ||||||||||||
Net realized gains | (.03 | ) | (2.38 | ) | — | — | (.64 | ) | (2.80 | ) | ||||||||||||||
Total distributions | (.93 | ) | (3.36 | ) | (.75 | ) | (.95 | ) | (1.40 | ) | (3.65 | ) | ||||||||||||
| Net asset value, end of period | $ | 23.27 | $ | 21.33 | $ | 26.56 | $ | 23.50 | $ | 22.93 | $ | 24.62 | ||||||||||||
| Total Return (%) | 13.53 | ** | (7.66 | )b | 16.54 | 6.81 | (1.44 | )b | 3.83 | |||||||||||||||
| Ratios to Average Net Assets and Supplemental Data | ||||||||||||||||||||||||
| Net assets, end of period ($ millions) | 129 | 120 | 147 | 185 | 202 | 247 | ||||||||||||||||||
| Ratio of expenses before expense reductions (%)c | .69 | * | .69 | .63 | .62 | .60 | .62 | |||||||||||||||||
| Ratio of expenses after expense reductions (%)c | .69 | * | .68 | .63 | .62 | .58 | .62 | |||||||||||||||||
| Ratio of net investment income (loss) (%) | 3.49 | * | 3.34 | 2.85 | 2.66 | 2.85 | 2.83 | |||||||||||||||||
| Portfolio turnover rate (%) | 108 | ** | 70 | 122 | 135 | 92 | 88 | |||||||||||||||||
| a | Based on average shares outstanding during the period. |
| b | Total return would have been lower had certain expenses not been reduced. |
| c | Expense ratio does not reflect charges and fees associated with the separate account that invests in the Fund or any variable life insurance policy or variable annuity contract for which the Fund is an investment option. |
| * | Annualized |
| ** | Not annualized |
| Class B | Six Months Ended 6/30/19 (Unaudited) | Period Ended 12/31/18a | ||||||
| Selected Per Share Data | ||||||||
| Net asset value, beginning of period | $ | 21.30 | $ | 22.65 | ||||
| Income (loss) from investment operations: | ||||||||
Net investment incomeb | .38 | .50 | ||||||
Net realized and unrealized gain (loss) | 2.48 | (1.85 | ) | |||||
Total from investment operations | 2.86 | (1.35 | ) | |||||
| Less distributions from: | ||||||||
Net investment income | (.86 | ) | — | |||||
Net realized gains | (.03 | ) | — | |||||
Total distributions | (.89 | ) | — | |||||
| Net asset value, end of period | $ | 23.27 | $ | 21.30 | ||||
| Total Return (%)c | 13.43 | ** | (5.96 | )** | ||||
| Ratios to Average Net Assets and Supplemental Data | ||||||||
| Net assets, end of period ($ thousands) | 11 | 9 | ||||||
| Ratio of expenses before expense reductions (%)d | 1.14 | * | 1.15 | * | ||||
| Ratio of expenses after expense reductions (%)d | .86 | * | .86 | * | ||||
| Ratio of net investment income (loss) (%) | 3.32 | * | 3.30 | * | ||||
| Portfolio turnover rate (%) | 108 | ** | 70 | e | ||||
| a | For the period from May 1, 2018 (commencement of operations) to December 31, 2018. |
| b | Based on average shares outstanding during the period. |
| c | Total return would have been lower had certain expenses not been reduced. |
| d | Expense ratio does not reflect charges and fees associated with the separate account that invests in the Fund or any variable life insurance policy or variable annuity contract for which the Fund is an investment option. |
| e | Represents the Fund’s portfolio turnover rate for the year ended December 31, 2018. |
| * | Annualized |
| ** | Not annualized |
The accompanying notes are an integral part of the financial statements.
| 20 | | | Deutsche DWS Variable Series ll — DWS Global Income Builder VIP |
Table of Contents
| Notes to Financial Statements | (Unaudited) |
A. Organization and Significant Accounting Policies
DWS Global Income Builder VIP (the “Fund”) is a diversified series of Deutsche DWS Variable Series II (the “Trust”), which is registered under the Investment Company Act of 1940, as amended (the “1940 Act”), as an open-end management investment company organized as a Massachusetts business trust.
Multiple Classes of Shares of Beneficial Interest.The Fund offers two classes of shares (Class A shares and Class B shares). Sales of Class B shares are subject to recordkeeping fees up to 0.15% and Rule 12b-1 fees under the 1940 Act equal to an annual rate of 0.25% of the average daily net assets of the Class B shares of the Fund. Class A shares are not subject to such fees.
Investment income, realized and unrealized gains and losses, and certain fund-level expenses and expense reductions, if any, are borne pro rata on the basis of relative net assets by the holders of all classes of shares, except that each class bears certain expenses unique to that class (including the applicable Rule12b-1 distribution fees). Differences in class-level expenses may result in payment of different per share dividends by class. All shares have equal rights with respect to voting subject to class-specific arrangements.
The Fund’s financial statements are prepared in accordance with accounting principles generally accepted in the United States of America (“U.S. GAAP”) which require the use of management estimates. Actual results could differ from those estimates. The Fund qualifies as an investment company under Topic 946 of Accounting Standards Codification of U.S. GAAP. The policies described below are followed consistently by the Fund in the preparation of its financial statements.
Security Valuation. Investments are stated at value determined as of the close of regular trading on the New York Stock Exchange on each day the exchange is open for trading.
Various inputs are used in determining the value of the Fund’s investments. These inputs are summarized in three broad levels. Level 1 includes quoted prices in active markets for identical securities. Level 2 includes other significant observable inputs (including quoted prices for similar securities, interest rates, prepayment speeds and credit risk). Level 3 includes significant unobservable inputs (including the Fund’s own assumptions in determining the fair value of investments). The level assigned to the securities valuations may not be an indication of the risk or liquidity associated with investing in those securities.
Equity securities and Exchange-Traded Funds (“ETFs”) are valued at the most recent sale price or official closing price reported on the exchange (U.S. or foreign) or over-the-counter market on which they trade. Equity securities or ETFs for which no sales are reported are valued at the calculated mean between the most recent bid and asked quotations on the relevant market or, if a mean cannot be determined, at the most recent bid quotation. Equity securities and ETFs are generally categorized as Level 1. For certain international equity securities, in order to adjust for events which may occur between the close of the foreign exchanges and the close of the New York Stock Exchange, a fair valuation model may be used. This fair valuation model takes into account comparisons to the valuation of American Depository Receipts (ADRs), exchange-traded funds, futures contracts and certain indices and these securities are categorized as Level 2.
Debt securities are valued at prices supplied by independent pricing services approved by the Fund’s Board. Such services may use various pricing techniques which take into account appropriate factors such as yield, quality, coupon rate, maturity, type of issue, trading characteristics, prepayment speeds and other data, as well as broker quotes. If the pricing services are unable to provide valuations, debt securities are valued at the average of the most recent reliable bid quotations or evaluated prices, as applicable, obtained from broker-dealers. These securities are generally categorized as Level 2.
Investments in open-end investment companies are valued at their net asset value each business day and are categorized as Level 1.
Futures contracts are generally valued at the settlement prices established each day on the exchange on which they are traded and are categorized as Level 1.
Forward currency contracts are valued at the prevailing forward exchange rate of the underlying currencies and are categorized as Level 2.
Swap contracts are valued daily based upon prices supplied by a Board approved pricing vendor, if available, and otherwise are valued at the price provided by the broker-dealer. Swap contracts are generally categorized as Level 2.
Deutsche DWS Variable Series II — DWS Global Income Builder VIP | | | 21 |
Table of Contents
Exchange-traded options are valued at the last sale price or, in the absence of a sale, the mean between the closing bid and asked prices or at the most recent asked price (bid for purchased options) if no bid or asked price are available. Exchange-traded options are categorized as Level 1. Over-the-counter written or purchased options are valued at prices supplied by a Board approved pricing vendor, if available, and otherwise are valued at the price provided by the broker-dealer with which the option was traded. Over-the-counter written or purchased options are generally categorized as Level 2.
Securities and other assets for which market quotations are not readily available or for which the above valuation procedures are deemed not to reflect fair value are valued in a manner that is intended to reflect their fair value as determined in accordance with procedures approved by the Board and are generally categorized as Level 3. In accordance with the Fund’s valuation procedures, factors considered in determining value may include, but are not limited to, the type of the security; the size of the holding; the initial cost of the security; the existence of any contractual restrictions on the security’s disposition; the price and extent of public trading in similar securities of the issuer or of comparable companies; quotations or evaluated prices from broker-dealers and/or pricing services; information obtained from the issuer, analysts, and/or the appropriate stock exchange (for exchange-traded securities); an analysis of the company’s or issuer’s financial statements; an evaluation of the forces that influence the issuer and the market(s) in which the security is purchased and sold; and with respect to debt securities, the maturity, coupon, creditworthiness, currency denomination and the movement of the market in which the security is normally traded. The value determined under these procedures may differ from published values for the same securities.
Disclosure about the classification of fair value measurements is included in a table following the Fund’s Investment Portfolio.
Foreign Currency Translations. The books and records of the Fund are maintained in U.S. dollars. Investment securities and other assets and liabilities denominated in a foreign currency are translated into U.S. dollars at the prevailing exchange rates at period end. Purchases and sales of investment securities, income and expenses are translated into U.S. dollars at the prevailing exchange rates on the respective dates of the transactions.
Net realized and unrealized gains and losses on foreign currency transactions represent net gains and losses between trade and settlement dates on securities transactions, the acquisition and disposition of foreign currencies, and the difference between the amount of net investment income accrued and the U.S. dollar amount actually received. The portion of both realized and unrealized gains and losses on investments that results from fluctuations in foreign currency exchange rates is not separately disclosed but is included with net realized and unrealized gain/appreciation and loss/depreciation on investments.
Securities Lending. Deutsche Bank AG, as lending agent, lends securities of the Fund to certain financial institutions under the terms of its securities lending agreement. During the term of the loans, the Fund continues to receive interest and dividends generated by the securities and to participate in any changes in their market value. The Fund requires the borrowers of the securities to maintain collateral with the Fund consisting of either cash or liquid, unencumbered assets having a value at least equal to the value of the securities loaned. When the collateral falls below specified amounts, the lending agent will use its best effort to obtain additional collateral on the next business day to meet required amounts under the securities lending agreement. As of period end, any securities on loan were collateralized by cash. During the six months ended June 30, 2019, the Fund invested the cash collateral into a joint trading account in DWS Government & Agency Securities Portfolio, an affiliated money market fund managed by DWS Investment Management Americas, Inc. DWS Investment Management Americas, Inc. receives a management/administration fee (0.11% annualized effective rate as of June 30, 2019) on the cash collateral invested in DWS Government & Agency Securities Portfolio. The Fund receives compensation for lending its securities either in the form of fees or by earning interest on invested cash collateral net of borrower rebates and fees paid to a lending agent. Either the Fund or the borrower may terminate the loan at any time, and the borrower, after notice, is required to return borrowed securities within a standard time period. There may be risks of delay and costs in recovery of securities or even loss of rights in the collateral should the borrower of the securities fail financially. If the Fund is not able to recover securities lent, the Fund may sell the collateral and purchase a replacement investment in the market, incurring the risk that the value of the replacement security is greater than the value of the collateral. The Fund is also subject to all investment risks associated with the reinvestment of any cash collateral received, including, but not limited to, interest rate, credit and liquidity risk associated with such investments.
| 22 | | | Deutsche DWS Variable Series II — DWS Global Income Builder VIP |
Table of Contents
As of June 30, 2019, the Fund had securities on loan, which were classified as common stocks and corporate bonds in the Investment Portfolio. The value of the related collateral exceeded the value of the securities loaned at period end.
| Remaining Contractual Maturity of the Agreementsas of June 30, 2019 | ||||||||||||||||||||
| Overnight and Continuous | <30 days | Between 30 & 90 days | >90 days | Total | ||||||||||||||||
Securities Lending Transactions | ||||||||||||||||||||
| Common Stocks | $ | 933,862 | $ | — | $ | — | $ | — | $ | 933,862 | ||||||||||
| Corporate Bonds | 358,440 | — | — | — | 358,440 | |||||||||||||||
| Total Borrowings | $ | 1,292,302 | $ | — | $ | — | $ | — | $ | 1,292,302 | ||||||||||
Gross amount of recognized liabilities for securities lending transactions: |
| $ | 1,292,302 | |||||||||||||||||
When-Issued/Delayed Delivery Securities. The Fund may purchase or sell securities with delivery or payment to occur at a later date beyond the normal settlement period. At the time the Fund enters into a commitment to purchase or sell a security, the transaction is recorded and the value of the transaction is reflected in the net asset value. The price of such security and the date when the security will be delivered and paid for are fixed at the time the transaction is negotiated. The value of the security may vary with market fluctuations. At the time the Fund enters into a purchase transaction it is required to segregate cash or other liquid assets at least equal to the amount of the commitment. Additionally, the Fund may be required to post securities and/or cash collateral in accordance with the terms of the commitment.
Certain risks may arise upon entering into when-issued or delayed delivery transactions from the potential inability of counterparties to meet the terms of their contracts or if the issuer does not issue the securities due to political, economic or other factors. Additionally, losses may arise due to changes in the value of the underlying securities.
Taxes. The Fund’s policy is to comply with the requirements of the Internal Revenue Code, as amended, which are applicable to regulated investment companies and to distribute all of its taxable income to its shareholders.
Additionally, the Fund may be subject to taxes imposed by the governments of countries in which it invests and are generally based on income and/or capital gains earned or repatriated, a portion of which may be recoverable based upon the current interpretation of the tax rules and regulations. Estimated tax liabilities and recoveries on certain foreign securities are recorded on an accrual basis and are reflected as components of interest income or net change in unrealized gain/loss on investments. Tax liabilities realized as a result of security sales are reflected as a component of net realized gain/loss on investments.
At June 30, 2019, the aggregate cost of investments for federal income tax purposes was $121,660,745. The net unrealized appreciation for all investments based on tax cost was $12,518,426. This consisted of aggregate gross unrealized appreciation for all investments in which there was an excess of value over tax cost of $14,767,500 and aggregate gross unrealized depreciation for all investments in which there was an excess of tax cost over value of $2,249,074.
The Fund has reviewed the tax positions for the open tax years as of December 31, 2018 and has determined that no provision for income tax and/or uncertain tax positions is required in the Fund’s financial statements. The Fund’s federal tax returns for the prior three fiscal years remain open subject to examination by the Internal Revenue Service.
Distribution of Income and Gains. Distributions from net investment income of the Fund, if any, are declared and distributed to shareholders annually. Net realized gains from investment transactions, in excess of available capital loss carryforwards, would be taxable to the Fund if not distributed and, therefore, will be distributed to shareholders at least annually. The Fund may also make additional distributions for tax purposes if necessary.
The timing and characterization of certain income and capital gain distributions are determined annually in accordance with federal tax regulations which may differ from accounting principles generally accepted in the United States of America. These differences primarily relate to investments in foreign denominated investments, forward currency contracts, futures contracts, swap contracts and certain securities sold at a loss. As a result, net investment income (loss) and net realized gain (loss) on investment transactions for a reporting period may differ significantly from distributions during such period. Accordingly, the Fund may
Deutsche DWS Variable Series II — DWS Global Income Builder VIP | | | 23 |
Table of Contents
periodically make reclassifications among certain of its capital accounts without impacting the net asset value of the Fund.
The tax character of current year distributions will be determined at the end of the current fiscal year.
Expenses. Expenses of the Trust arising in connection with a specific fund are allocated to that fund. Other Trust expenses which cannot be directly attributed to a fund are apportioned among the funds in the Trust based upon the relative net assets or other appropriate measures.
Contingencies. In the normal course of business, the Fund may enter into contracts with service providers that contain general indemnification clauses. The Fund’s maximum exposure under these arrangements is unknown, as this would involve future claims that may be made against the Fund that have not yet been made. However, based on experience, the Fund expects the risk of loss to be remote.
Other. Investment transactions are accounted for on a trade date plus one basis for daily net asset value calculations. However, for financial reporting purposes, investment transactions are reported on trade date. Interest income is recorded on the accrual basis. Dividend income is recorded on the ex-dividend date net of foreign withholding taxes. Certain dividends from foreign securities may be recorded subsequent to the ex-dividend date as soon as the Fund is informed of such dividends. Realized gains and losses from investment transactions are recorded on an identified cost basis. Proceeds from litigation payments, if any, are included in net realized gain (loss) from investments. All discounts and premiums are accreted/amortized for both tax and financial reporting purposes, with the exception of securities in default of principal.
B. Derivative Instruments
Swaps. A swap is a contract between two parties to exchange future cash flows at periodic intervals based on the notional amount of the swap. A bilateral swap is a transaction between the fund and a counterparty where cash flows are exchanged between the two parties. A centrally cleared swap is a transaction executed between the fund and a counterparty, then cleared by a clearing member through a central clearinghouse. The central clearinghouse serves as the counterparty, with whom the fund exchanges cash flows.
The value of a swap is adjusted daily, and the change in value, if any, is recorded as unrealized appreciation or depreciation in the Statement of Assets and Liabilities. Gains or losses are realized when the swap expires or is closed. Certain risks may arise when entering into swap transactions including counterparty default; liquidity; or unfavorable changes in interest rates or the value of the underlying reference security, commodity or index. In connection with bilateral swaps, securities and/or cash may be identified as collateral in accordance with the terms of the swap agreement to provide assets of value and recourse in the event of default. The maximum counterparty credit risk is the net present value of the cash flows to be received from or paid to the counterparty over the term of the swap, to the extent that this amount is beneficial to the Fund, in addition to any related collateral posted to the counterparty by the Fund. This risk may be partially reduced by a master netting arrangement between the Fund and the counterparty. Upon entering into a centrally cleared swap, the Fund is required to deposit with a financial intermediary cash or securities (“initial margin”) in an amount equal to a certain percentage of the notional amount of the swap. Subsequent payments (“variation margin”) are made or received by the Fund dependent upon the daily fluctuations in the value of the swap. In a cleared swap transaction, counterparty risk is minimized as the central clearinghouse acts as the counterparty.
An upfront payment, if any, made by the Fund is recorded as an asset in the Statement of Assets and Liabilities. An upfront payment, if any, received by the Fund is recorded as a liability in the Statement of Assets and Liabilities. Payments received or made at the end of the measurement period are recorded as realized gain or loss in the Statement of Operations.
Interest Rate Swaps. Interest rate swaps are agreements in which the Fund agrees to pay to the counterparty a fixed rate payment in exchange for the counterparty agreeing to pay to the Fund a variable rate payment, or the Fund agrees to receive from the counterparty a fixed rate payment in exchange for the counterparty agreeing to receive from the Fund a variable rate payment. The payment obligations are based on the notional amount of the swap. For the six months ended June 30, 2019, the Fund entered into interest rate swap agreements to gain exposure to different parts of the yield curve while managing overall duration.
A summary of the open interest rate swap contracts as of December 31, 2018 is included in a table following the Fund’s Investment Portfolio. For the six months ended June 30, 2019, the investment in interest rate swap contracts had a total notional amount generally indicative of a range from $2,200,000 to $26,400,000.
| 24 | | | Deutsche DWS Variable Series II — DWS Global Income Builder VIP |
Table of Contents
Credit Default Swaps. Credit default swaps are agreements between a buyer and a seller of protection against predefined credit events for the reference entity. The Fund may enter into credit default swaps to gain exposure to an underlying issuer’s credit quality characteristics without directly investing in that issuer or to hedge against the risk of a credit event on debt securities. As a seller of a credit default swap, the Fund is required to pay the par (or other agreed-upon) value of the referenced entity to the counterparty with the occurrence of a credit event by a third party, such as a U.S. or foreign corporate issuer, on the reference entity, which would likely result in a loss to the Fund. In return, the Fund receives from the counterparty a periodic stream of payments over the term of the swap provided that no credit event has occurred. If no credit event occurs, the Fund keeps the stream of payments with no payment obligations. The Fund may also buy credit default swaps, in which case the Fund functions as the counterparty referenced above. This involves the risk that the swap may expire worthless. It also involves counterparty risk that the seller may fail to satisfy its payment obligations to the Fund with the occurrence of a credit event. When the Fund sells a credit default swap, it will cover its commitment. This may be achieved by, among other methods, maintaining cash or liquid assets equal to the aggregate notional value of the reference entities for all outstanding credit default swaps sold by the Fund. For the six months ended June 30, 2019, the Fund entered into credit default swap agreements to gain exposure to the underlying issuer’s credit quality characteristics and to hedge the risk of default or other specified credit events on portfolio assets.
Under the terms of a credit default swap, the Fund receives or makes periodic payments based on a specified interest rate on a fixed notional amount. These payments are recorded as a realized gain or loss in the Statement of Operations. Payments received or made as a result of a credit event or termination of the swap are recognized, net of a proportional amount of the upfront payment, as realized gains or losses in the Statement of Operations.
There were no open credit default swap contracts as of June 30, 2019. For the six months ended June 30, 2019, the investment in credit default swap contracts purchased had a total USD equivalent notional value generally indicative of a range from $0 to approximately $6,437,000 and the investment in credit default swap contracts sold had a total USD equivalent notional value generally indicative of a range from $0 to approximately $10,819,000.
Futures Contracts. A futures contract is an agreement between a buyer or seller and an established futures exchange or its clearinghouse in which the buyer or seller agrees to take or make a delivery of a specific amount of a financial instrument at a specified price on a specific date (settlement date). For the six months ended June 30, 2019, the Fund entered into interest rate futures to gain exposure to different parts of the yield curve while managing overall duration. The Fund also entered into interest rate futures contracts for non-hedging purposes to seek to enhance potential gains. In addition, the Fund entered into equity index futures as a means of gaining exposure to the equity asset class without investing directly into such asset class and to manage the risk of stock market volatility.
Upon entering into a futures contract, the Fund is required to deposit with a financial intermediary cash or securities (“initial margin”) in an amount equal to a certain percentage of the face value indicated in the futures contract. Subsequent payments (“variation margin”) are made or received by the Fund dependent upon the daily fluctuations in the value and are recorded for financial reporting purposes as unrealized gains or losses by the Fund. Gains or losses are realized when the contract expires or is closed. Since all futures contracts are exchange-traded, counterparty risk is minimized as the exchange’s clearinghouse acts as the counterparty, and guarantees the futures against default.
Certain risks may arise upon entering into futures contracts, including the risk that an illiquid market will limit the Fund’s ability to close out a futures contract prior to the settlement date and the risk that the futures contract is not well correlated with the security, index or currency to which it relates. Risk of loss may exceed amounts disclosed in the Statement of Assets and Liabilities.
A summary of the open futures contracts as of June 30, 2019 is included in a table following the Fund’s Investment Portfolio. For the six months ended June 30, 2019, the investment in futures contracts purchased had a total notional value generally indicative of a range from approximately $23,383,000 to $30,986,000, and the investment in futures contracts sold had a total notional value generally indicative of a range from approximately $5,178,000 to $31,596,000.
Forward Foreign Currency Contracts. A forward foreign currency contract (“forward currency contract”) is a commitment to purchase or sell a foreign currency at the settlement date at a negotiated rate. For the six months ended June 30, 2019, the Fund entered into forward currency contracts in order to hedge its exposure to changes in foreign currency exchange rates on its foreign currency denominated portfolio
Deutsche DWS Variable Series II — DWS Global Income Builder VIP | | | 25 |
Table of Contents
holdings, to facilitate transactions in foreign currency denominated securities and for non-hedging purposes to seek to enhance potential gains.
Forward currency contracts are valued at the prevailing forward exchange rate of the underlying currencies and unrealized gain (loss) is recorded daily. On the settlement date of the forward currency contract, the Fund records a realized gain or loss equal to the difference between the value of the contract at the time it was opened and the value of the contract at the time it was closed. Certain risks may arise upon entering into forward currency contracts from the potential inability of counterparties to meet the terms of their contracts. The maximum counterparty credit risk to the Fund is measured by the unrealized gain on appreciated contracts. Additionally, when utilizing forward currency contracts to hedge, the Fund gives up the opportunity to profit from favorable exchange rate movements during the term of the contract.
A summary of the open forward currency contracts as of June 30, 2019 is included in a table following the Fund’s Investment Portfolio. For the six months ended June 30, 2019, the investment in forward currency contracts short vs. U.S. dollars had a total contract value generally indicative of a range from approximately $8,597,000 to $19,036,000, and the investment in forward currency contracts long vs. U.S. dollars had a total contract value generally indicative of a range from approximately $1,361,000 to $7,786,000. The investment in forward currency contracts long vs. other foreign currencies sold had a total contract value generally indicative of a range from $0 to approximately $2,222,000.
The following tables summarize the value of the Fund’s derivative instruments held as of June 30, 2019 and the related location in the accompanying Statement of Assets and Liabilities, presented by primary underlying risk exposure:
| Asset Derivatives | Forward Contracts | Futures Contracts | Total | |||||||||
| Equity Contracts (a) | $ | — | $ | 117,470 | $ | 117,470 | ||||||
| Interest Rate Contracts (a) | — | 269,510 | 269,510 | |||||||||
| Foreign Exchange Contracts (b) | 53,632 | — | 53,632 | |||||||||
| $ | 53,632 | $ | 386,980 | $ | 440,612 | |||||||
Each of the above derivatives is located in the following Statement of Assets and Liabilities accounts:
| (a) | Includes cumulative appreciation of futures contracts as disclosed in the Investment Portfolio. Unsettled variation margin is disclosed separately within the Statement of Assets and Liabilities. |
| (b) | Unrealized appreciation on forward foreign currency contracts |
| Liability Derivatives | Forward Contracts | Swap Contracts | Futures Contracts | Total | ||||||||||||
| Equity Contracts (c) | $ | — | $ | — | $ | (191,027 | ) | $ | (191,027 | ) | ||||||
| Interest Rate Contracts (c) | — | (108,940 | ) | (16,496 | ) | (125,436 | ) | |||||||||
| Foreign Exchange Contracts (d) | (114,081 | ) | — | — | (114,081 | ) | ||||||||||
| $ | (114,081 | ) | $ | (108,940 | ) | $ | (207,523 | ) | $ | (430,544 | ) | |||||
Each of the above derivatives is located in the following Statement of Assets and Liabilities accounts:
| (c) | Includes cumulative depreciation of futures and centrally cleared swap contracts as disclosed in the Investment Portfolio. Unsettled variation margin is disclosed separately within the Statement of Assets and Liabilities. |
| (d) | Unrealized depreciation on forward foreign currency contracts |
Additionally, the amount of unrealized and realized gains and losses on derivative instruments recognized in Fund earnings during the six months ended June 30, 2019, and the related location in the accompanying Statement of Operations is summarized in the following tables by primary underlying risk exposure:
| Realized Gain (Loss) | Forward Contracts | Swap Contracts | Futures Contracts | Total | ||||||||||||
| Equity Contracts (e) | $ | — | $ | — | $ | 573,074 | $ | 573,074 | ||||||||
| Credit Contracts (e) | — | (64,515 | ) | — | (64,515 | ) | ||||||||||
| Interest Rate Contracts (e) | — | 200,467 | 551,007 | 751,474 | ||||||||||||
| Foreign Exchange Contracts (f) | (42,591 | ) | — | — | (42,591 | ) | ||||||||||
| $ | (42,591 | ) | $ | 135,952 | $ | 1,124,081 | $ | 1,217,442 | ||||||||
Each of the above derivatives is located in the following Statement of Operations accounts:
| (e) | Net realized gain (loss) from swap contracts and futures, respectively |
| (f) | Net realized gain (loss) from forward foreign currency contracts |
| 26 | | | Deutsche DWS Variable Series II — DWS Global Income Builder VIP |
Table of Contents
Change in Net Unrealized Appreciation (Depreciation) | Forward Contracts | Swap Contracts | Futures Contracts | Total | ||||||||||||
| Equity Contracts (g) | $ | — | $ | — | $ | 358,889 | $ | 358,889 | ||||||||
| Credit Contracts (g) | — | 307,357 | — | 307,357 | ||||||||||||
| Interest Rate Contracts (g) | — | (307,962 | ) | 15,532 | (292,430 | ) | ||||||||||
| Foreign Exchange Contracts (h) | (20,843 | ) | — | — | (20,843 | ) | ||||||||||
| $ | (20,843 | ) | $ | (605 | ) | $ | 374,421 | $ | 352,973 | |||||||
Each of the above derivatives is located in the following Statement of Operations accounts:
| (g) | Change in net unrealized appreciation (depreciation) on swap contracts and futures, respectively |
| (h) | Change in net unrealized appreciation (depreciation) on forward foreign currency contracts |
As of June 30, 2019, the Fund has transactions subject to enforceable master netting agreements which govern the terms of certain transactions, and reduce the counterparty risk associated with such transactions. Master netting agreements allow a Fund to close out and net total exposure to a counterparty in the event of a deterioration in the credit quality or contractual default with respect to all of the transactions with a counterparty. As defined by the master netting agreement, the Fund may have collateral agreements with certain counterparties to mitigate risk. For financial reporting purposes the Statement of Assets and Liabilities generally shows derivatives assets and liabilities on a gross basis, which reflects the full risks and exposures prior to netting. A reconciliation of the gross amounts on the Statement of Assets and Liabilities to the net amounts by a counterparty, including any collateral exposure, is included in the following tables:
| Counterparty | Gross Amounts of Assets Presented in the Statement of Assets and Liabilities | Financial Instruments and Derivatives Available for Offset | Collateral Received | Net Amount of Derivative Assets | ||||||||||||
Credit Agricole | $ | 22,216 | $ | (20,412 | ) | $ | — | $ | 1,804 | |||||||
JPMorgan Chase Securities, Inc. | 5,009 | — | — | 5,009 | ||||||||||||
State Street Bank and Trust | 26,407 | (7,798 | ) | — | 18,609 | |||||||||||
| $ | 53,632 | $ | (28,210 | ) | $ | — | $ | 25,422 | ||||||||
| Counterparty | Gross Amounts of Liabilities Presented in the Statement of Assets and Liabilities | Financial Instruments and Derivatives Available for Offset | Collateral Pledged | Net Amount of Derivative Liabilities | ||||||||||||
Bank of America | $ | 71,505 | $ | — | $ | — | $ | 71,505 | ||||||||
Credit Agricole | 20,412 | (20,412 | ) | — | — | |||||||||||
National Australia Bank Ltd. | 14,366 | — | — | 14,366 | ||||||||||||
State Street Bank and Trust | 7,798 | (7,798 | ) | — | — | |||||||||||
| $ | 114,081 | $ | (28,210 | ) | $ | — | $ | 85,871 | ||||||||
C. Purchases and Sales of Securities
During the six months ended June 30, 2019, purchases and sales of investment transactions, excluding short-term investments, were as follows:
| Purchases | Sales | |||||||
| Non-U.S. Treasury Obligations | $ | 121,566,571 | $ | 118,512,854 | ||||
| U.S. Treasury Obligations | $ | 11,293,517 | $ | 12,276,542 | ||||
D. Related Parties
Management Agreement. Under the Investment Management Agreement with DWS Investment Management Americas, Inc. (“DIMA” or the “Advisor”), an indirect, wholly owned subsidiary of DWS Group GmbH & Co. KGaA (“DWS Group”), the Advisor directs the investments of the Fund in accordance with its investment objectives, policies and restrictions. The Advisor determines the securities, instruments and other contracts relating to investments to be purchased, sold or entered into by the Fund or delegates such responsibility to the Fund’s subadvisor.
Deutsche DWS Variable Series II — DWS Global Income Builder VIP | | | 27 |
Table of Contents
Effective May 16, 2019, DWS Alternatives Global Limited, also an indirect, wholly owned subsidiary of DWS Group, no longer serves as subadvisor for the Fund. DWS Alternatives Global Limited provided portfolio manager services to the Fund and pursuant to a sub-advisory agreement between DIMA and DWS Alternatives Global Limited, DIMA, not the Fund, compensated DWS Alternatives Global Limited for the services it provided to the Fund.
Under the Investment Management Agreement, the Fund pays a monthly management fee based on the Fund’s average daily net assets, computed and accrued daily and payable monthly, at the following annual rates:
| First $250 million | .370 | % | ||
| Next $750 million | .345 | % | ||
| Over $1 billion | .310 | % |
Accordingly, for the six months ended June 30, 2019, the fee pursuant to the Investment Management Agreement was equivalent to an annualized rate (exclusive of any applicable waiver/reimbursements) of 0.37% of the Fund’s average daily net assets.
For the period from January 1, 2019 through September 30, 2019 (and through April 30, 2020 for Class B shares), the Advisor has contractually agreed to waive its fees and/or reimburse certain operating expenses to the extent necessary to maintain the total annual operating expenses (excluding certain expenses such as extraordinary expenses, taxes, brokerage and interest expense) of each class as follows:
| Class A | 0.73 | % | ||
| Class B | 0.86 | % |
For the six months ended June 30, 2019, fees waived and/or expenses reimbursed for Class B are $14.
Administration Fee. Pursuant to an Administrative Services Agreement, DIMA provides most administrative services to the Fund. For all services provided under the Administrative Services Agreement, the Fund pays DIMA an annual fee (“Administration Fee”) of 0.10% of the Fund’s average daily net assets, computed and accrued daily and payable monthly. For the six months ended June 30, 2019, the Administration Fee was $62,952, of which $10,511 is unpaid.
Distribution Service Agreement.DWS Distributors, Inc. (“DDI”), an affiliate of the Advisor, is the Fund’s distributor. In accordance with the Distribution Plan, DDI receives 12b-1 fees of 0.25% of average daily net assets of Class B shares. For the six months ended June 30, 2019, the Distribution Service Fee was as follows:
| Distribution Fee | Total Aggregated | Unpaid at June 30, 2019 | ||||||
| Class B | $ | 13 | $ | 2 | ||||
Service Provider Fees. DWS Service Company (“DSC”), an affiliate of the Advisor, is the transfer agent, dividend-paying agent and shareholder service agent for the Fund. Pursuant to a sub-transfer agency agreement between DSC and DST Systems, Inc. (“DST”), DSC has delegated certain transfer agent, dividend-paying agent and shareholder service agent functions to DST. DSC compensates DST out of the shareholder servicing fee it receives from the Fund. For the six months ended June 30, 2019, the amounts charged to the Fund by DSC were as follows:
| Services to Shareholders | Total Aggregated | Unpaid at June 30, 2019 | ||||||
| Class A | $ | 195 | $ | 162 | ||||
| Class B | 10 | 6 | ||||||
| $ | 205 | $ | 168 | |||||
Typesetting and Filing Service Fees. Under an agreement with the Fund, DIMA is compensated for providing certain pre-press and regulatory filing services to the Fund. For the six months ended June 30, 2019, the amount charged to the Fund by DIMA included in the Statement of Operations under “Reports to shareholders” aggregated $7,478, of which $2,478 unpaid.
Trustees’ Fees and Expenses. The Fund paid retainer fees to each Trustee not affiliated with the Advisor, plus specified amounts to the Board Chairperson and to each committee Chairperson.
| 28 | | | Deutsche DWS Variable Series II — DWS Global Income Builder VIP |
Table of Contents
Affiliated Cash Management Vehicles. The Fund may invest uninvested cash balances in DWS Central Cash Management Government Fund and DWS ESG Liquidity Fund, affiliated money market funds which are managed by the Advisor. Each affiliated money market fund is managed in accordance withRule 2a-7 under the 1940 Act, which governs the quality, maturity, diversity and liquidity of instruments in which a money market fund may invest. DWS Central Cash Management Government Fund seeks to maintain a stable net asset value, and DWS ESG Liquidity Fund maintains a floating net asset value. The Fund indirectly bears its proportionate share of the expenses of each affiliated money market fund in which it invests. DWS Central Cash Management Government Fund does not pay the Advisor an investment management fee. To the extent that DWS ESG Liquidity Fund pays an investment management fee to the Advisor, the Advisor will waive an amount of the investment management fee payable to the Advisor by the Fund equal to the amount of the investment management fee payable on the Fund’s assets invested in DWS ESG Liquidity Fund.
Securities Lending Agent Fees. Deutsche Bank AG serves as securities lending agent for the Fund. For the six months ended June 30, 2019, the Fund incurred securities lending agent fees to Deutsche Bank AG in the amount of $1,102.
E. Ownership of the Fund
At June 30, 2019, one participating insurance company was owner of record of 10% or more of the total outstanding Class A shares of the Fund, owning 70%.
F. Line of Credit
The Fund and other affiliated funds (the “Participants”) share in a $400 million revolving credit facility provided by a syndication of banks. The Fund may borrow for temporary or emergency purposes, including the meeting of redemption requests that otherwise might require the untimely disposition of securities. The Participants are charged an annual commitment fee which is allocated based on net assets, among each of the Participants. Interest is calculated at a rate per annum equal to the sum of the Federal Funds Rate plus 1.25 percent plus if the one-month LIBOR exceeds the Federal Funds Rate, the amount of such excess. The Fund may borrow up to a maximum of 33 percent of its net assets under the agreement. The Fund had no outstanding loans at June 30, 2019.
Deutsche DWS Variable Series II — DWS Global Income Builder VIP | | | 29 |
Table of Contents
| Information About Your Fund’s Expenses | (Unaudited) |
As an investor of the Fund, you incur two types of costs: ongoing expenses and transaction costs. Ongoing expenses include management fees and other Fund expenses. Examples of transaction costs include contract charges, which are not shown in this section. The following tables are intended to help you understand your ongoing expenses (in dollars) of investing in the Fund and to help you compare these expenses with the ongoing expenses of investing in other mutual funds. In the most recent six-month period, Class B limited these expenses; had it not done so, expenses would have been higher. The example in the table is based on an investment of $1,000 invested at the beginning of the six-month period and held for the entire period (January 1, 2019 to June 30, 2019).
The tables illustrate your Fund’s expenses in two ways:
| – | Actual Fund Return. This helps you estimate the actual dollar amount of ongoing expenses (but not transaction costs) paid on a $1,000 investment in the Fund using the Fund’s actual return during the period. To estimate the expenses you paid over the period, simply divide your account value by $1,000 (for example, an $8,600 account value divided by $1,000 = 8.6), then multiply the result by the number in the “Expenses Paid per $1,000” line under the share class you hold. |
| – | Hypothetical 5% Fund Return. This helps you to compare your Fund’s ongoing expenses (but not transaction costs) with those of other mutual funds using the Fund’s actual expense ratio and a hypothetical rate of return of 5% per year before expenses. Examples using a 5% hypothetical Fund return may be found in the shareholder reports of other mutual funds. The hypothetical account values and expenses may not be used to estimate the actual ending account balance or expenses you paid for the period. |
Please note that the expenses shown in these tables are meant to highlight your ongoing expenses only and do not reflect any transaction costs. The “Expenses Paid per $1,000” line of the tables is useful in comparing ongoing expenses only and will not help you determine the relative total expense of owning different funds. If these transaction costs had been included, your costs would have been higher.
| Expenses and Value of a $1,000 Investment for the six months ended June 30, 2019 | ||||||||
| Actual Fund Return | Class A | Class B | ||||||
| Beginning Account Value 1/1/19 | $ | 1,000.00 | $ | 1,000.00 | ||||
| Ending Account Value 6/30/19 | $ | 1,135.30 | $ | 1,134.30 | ||||
| Expenses Paid per $1,000* | $ | 3.65 | $ | 4.55 | ||||
| Hypothetical 5% Fund Return | Class A | Class B | ||||||
| Beginning Account Value 1/1/19 | $ | 1,000.00 | $ | 1,000.00 | ||||
| Ending Account Value 6/30/19 | $ | 1,021.37 | $ | 1,020.53 | ||||
| Expenses Paid per $1,000* | $ | 3.46 | $ | 4.31 | ||||
| * | Expenses are equal to the Fund’s annualized expense ratio for each share class, multiplied by the average account value over the period, multiplied by 181 (the number of days in the most recent six-month period), then divided by 365. |
| Annualized Expense Ratio | Class A | Class B | ||||||
| Deutsche DWS Variable Series II — DWS Global Income Builder VIP | .69 | % | .86 | % | ||||
For more information, please refer to the Fund’s prospectus.
These tables do not reflect charges and fees (“contract charges”) associated with the separate account that invests in the Fund or any variable life insurance policy or variable annuity contract for which the Fund is an investment option.
For an analysis of the fees associated with an investment in the Fund or similar funds, please refer to the current and hypothetical expense calculators for Variable Insurance Products which can be found at dws.com/calculators.
| 30 | | | Deutsche DWS Variable Series II — DWS Global Income Builder VIP |
Table of Contents
The Trust’s policies and procedures for voting proxies for portfolio securities and information about how the Trust voted proxies related to its portfolio securities during the most recent 12-month period ended June 30 are available on our Web site — dws.com/en-us/resources/proxy-voting — or on the SEC’s Web site — sec.gov. To obtain a written copy of the Trust’s policies and procedures without charge, upon request, call us toll free at(800) 728-3337.
Deutsche DWS Variable Series II — DWS Global Income Builder VIP | | | 31 |
Table of Contents
Advisory Agreement Board Considerations and Fee Evaluation
The Board of Trustees (hereinafter referred to as the “Board” or “Trustees”) approved the renewal of DWS Global Income Builder VIP’s (the “Fund”) investment management agreement (the “Agreement”) with DWS Investment Management Americas, Inc. (“DIMA”) andsub-advisory agreement (the“Sub-Advisory Agreement” and together with the Agreement, the “Agreements”) between DIMA and Deutsche Alternative Asset Management (Global) Limited (now known as DWS Alternatives Global Limited) (“DAAM Global”), an affiliate of DIMA, in September 2018 (effective May 16, 2019, DAAM Global no longer serves as sub-advisor to the Fund).
In terms of the process that the Board followed prior to approving the Agreements, shareholders should know that:
| – | During the entire process, all of the Fund’s Trustees were independent of DIMA and its affiliates (the “Independent Trustees”). |
| – | The Board met frequently during the past year to discuss fund matters and dedicated a substantial amount of time to contract review matters. Over the course of several months, the Board’s Contract Committee reviewed extensive materials received from DIMA, independent third parties and independent counsel. These materials included an analysis of the Fund’s performance, fees and expenses, and profitability from a fee consultant retained by the Fund’s Independent Trustees (the “Fee Consultant”). Based on its evaluation of the information provided, the Contract Committee presented its findings and recommendations to the Board. The Board then reviewed the Contract Committee’s findings and recommendations. |
| – | The Board also received extensive information throughout the year regarding performance of the Fund. |
| – | The Independent Trustees regularly met privately with counsel to discuss contract review and other matters. In addition, the Independent Trustees were advised by the Fee Consultant in the course of their review of the Fund’s contractual arrangements and considered a comprehensive report prepared by the Fee Consultant in connection with their deliberations. |
| – | In connection with reviewing the Agreements, the Board also reviewed the terms of the Fund’sRule 12b-1 plan, distribution agreement, administrative services agreement, transfer agency agreement and other material service agreements. |
In connection with the contract review process, the Contract Committee and the Board considered the factors discussed below, among others. The Board also considered that DIMA and its predecessors have managed the Fund since its inception, and the Board believes that a long-term relationship with a capable, conscientious advisor is in the best interests of the Fund. The Board considered, generally, that shareholders chose to invest or remain invested in the Fund knowing that DIMA managed the Fund. DIMA and DAAM Global are part of DWS Group GmbH & Co. KGaA (“DWS Group”). DWS Group is a global asset management business that offers a wide range of investing expertise and resources, including research capabilities in many countries throughout the world. In 2018, approximately 20% of DWS Group’s shares were sold in an initial public offering, with Deutsche Bank AG owning the remaining shares.
As part of the contract review process, the Board carefully considered the fees and expenses of each DWS fund overseen by the Board in light of the fund’s performance. In many cases, this led to the negotiation and implementation of expense caps. As part of these negotiations, the Board indicated that it would consider relaxing these caps in future years following sustained improvements in performance, among other considerations.
While shareholders may focus primarily on fund performance and fees, the Fund’s Board considers these and many other factors, including the quality and integrity of DIMA’s and DAAM Global’s personnel and administrative support services provided by DIMA, such as back-office operations, fund valuations, and compliance policies and procedures.
Nature, Quality and Extent of Services. The Board considered the terms of the Agreements, including the scope of advisory services provided under the Agreements. The Board noted that, under the Agreements, DIMA and DAAM Global provide portfolio management services to the Fund and that, pursuant to a separate administrative services agreement, DIMA provides administrative services to the Fund. The Board considered the experience and skills of senior management and investment personnel and the resources made available to such personnel. Throughout the course of the year, the Board also received information regarding DIMA’s oversight of fundsub-advisers, including DAAM Global. The Board reviewed the Fund’s performance over short-term and long-term periods and compared those returns to various agreed-upon
| 32 | | | Deutsche DWS Variable Series II — DWS Global Income Builder VIP |
Table of Contents
performance measures, including market index(es) and a peer universe compiled using information supplied by Morningstar Direct (“Morningstar”), an independent fund data service. The Board also noted that it has put into place a process of identifying “Funds in Review” (e.g., funds performing poorly relative to a peer universe), and receives additional reporting from DIMA regarding such funds and, where appropriate, DIMA’s plans to address underperformance. The Board believes this process is an effective manner of identifying and addressing underperforming funds. Based on the information provided, the Board noted that, for theone-, three- and five-year periods ended December 31, 2017, the Fund’s performance (Class A shares) was in the 1st quartile of the applicable Morningstar universe (the 1st quartile being the best performers and the 4th quartile being the worst performers). The Board also observed that the Fund has outperformed its benchmark in theone-, three- and five-year periods ended December 31, 2017.
Fees and Expenses. The Board considered the Fund’s investment management fee schedule,sub-advisory fee schedule, operating expenses and total expense ratios, and comparative information provided by Broadridge Financial Solutions, Inc. (“Broadridge”) and the Fee Consultant regarding investment management fee rates paid to other investment advisors by similar funds (1st quartile being the most favorable and 4th quartile being the least favorable). With respect to management fees paid to other investment advisors by similar funds, the Board noted that the contractual fee rates paid by the Fund, which include a 0.10% fee paid to DIMA under the Fund’s administrative services agreement, were lower than the median (1st quartile) of the applicable Broadridge peer group (based on Broadridge data provided as of December 31, 2017). With respect to thesub-advisory fee paid to DAAM Global, the Board noted that the fee is paid by DIMA out of its fee and not directly by the Fund. The Board noted that the Fund’s Class A shares total (net) operating expenses were expected to be lower than the median (2nd quartile) of the applicable Broadridge expense universe (based on Broadridge data provided as of December 31, 2017, and analyzing Broadridge expense universe Class A (net) expenses less any applicable12b-1 fees). The Board noted that the expense limitations agreed to by DIMA were expected to help the Fund’s total (net) operating expenses remain competitive. The Board considered the Fund’s management fee rate as compared to fees charged by DIMA to a comparable DWS U.S. registered fund (“DWS Funds”) and considered differences between the Fund and the comparable DWS Fund. The information requested by the Board as part of its review of fees and expenses also included information about institutional accounts (including anysub-advised funds and accounts) and funds offered primarily to European investors (“DWS Europe Funds”) managed by DWS Group. The Board noted that DIMA indicated that DWS Group does not manage any institutional accounts or DWS Europe Funds comparable to the Fund.
On the basis of the information provided, the Board concluded that management fees were reasonable and appropriate in light of the nature, quality and extent of services provided by DIMA and DAAM Global.
Profitability. The Board reviewed detailed information regarding revenues received by DIMA under the Agreement. The Board considered the estimated costs to DIMA, andpre-tax profits realized by DIMA, from advising the DWS Funds, as well as estimates of thepre-tax profits attributable to managing the Fund in particular. The Board also received information regarding the estimated enterprise-wide profitability of DIMA and its affiliates with respect to all fund services in totality and by fund. The Board and the Fee Consultant reviewed DIMA’s methodology in allocating its costs to the management of the Fund. Based on the information provided, the Board concluded that thepre-tax profits realized by DIMA in connection with the management of the Fund were not unreasonable. The Board also reviewed certain publicly available information regarding the profitability of certain similar investment management firms. The Board noted that, while information regarding the profitability of such firms is limited (and in some cases is not necessarily prepared on a comparable basis), DIMA and its affiliates’ overall profitability with respect to the DWS Funds (after taking into account distribution and other services provided to the funds by DIMA and its affiliates) was lower than the overall profitability levels of most comparable firms for which such data was available.
Economies of Scale. The Board considered whether there are economies of scale with respect to the management of the Fund and whether the Fund benefits from any economies of scale. The Board noted that the Fund’s investment management fee schedule includes fee breakpoints. The Board concluded that the Fund’s fee schedule represents an appropriate sharing between the Fund and DIMA of such economies of scale as may exist in the management of the Fund at current asset levels.
Other Benefits to DIMA and Its Affiliates. The Board also considered the character and amount of other incidental or“fall-out” benefits received by DIMA and its affiliates, including any fees received by DIMA for administrative services provided to the Fund, any fees received by an affiliate of DIMA for transfer agency services provided to the Fund and any fees received by an affiliate of DIMA for distribution services. The Board also considered benefits to DIMA related to brokerage and soft-dollar allocations, including allocating
Deutsche DWS Variable Series II — DWS Global Income Builder VIP | | | 33 |
Table of Contents
brokerage to pay for research generated by parties other than the executing broker dealers, which pertain primarily to funds investing in equity securities. In addition, the Board considered the incidental public relations benefits to DIMA related to DWS Funds advertising and cross-selling opportunities among DIMA products and services. The Board considered these benefits in reaching its conclusion that the Fund’s management fees were reasonable.
Compliance. The Board considered the significant attention and resources dedicated by DIMA to its compliance processes in recent years. The Board noted in particular (i) the experience, seniority and time commitment of the individuals serving as DIMA’s and the Fund’s chief compliance officers and (ii) the substantial commitment of resources by DIMA and its affiliates to compliance matters, including the retention of compliance personnel.
Based on all of the information considered and the conclusions reached, the Board unanimously determined that the continuation of the Agreements is in the best interests of the Fund. In making this determination, the Board did not give particular weight to any single factor identified above. The Board considered these factors over the course of numerous meetings, certain of which were in executive session with only the Independent Trustees and counsel present. It is possible that individual Independent Trustees may have weighed these factors differently in reaching their individual decisions to approve the continuation of the Agreements.
| 34 | | | Deutsche DWS Variable Series II — DWS Global Income Builder VIP |
Table of Contents
Notes
Table of Contents
| ||
VS2GIB-3 (R-028382-8 8/19) |
Table of Contents
June 30, 2019
Semiannual Report
Deutsche DWS Variable Series II
DWS Government & Agency Securities VIP
Beginning on January 1, 2021, as permitted by regulations adopted by the Securities and Exchange Commission, you may not be receiving paper copies of the Fund’s shareholder reports from the insurance company that offers your contract unless you specifically request paper copies from your insurance company or from your financial intermediary. Instead, the shareholder reports will be made available on a Web site, and your insurance company will notify you by mail each time a report is posted and provide you with a Web site link to access the report. Instructions for requesting paper copies will be provided by your insurance company.
If you already elected to receive shareholder reports electronically, you will not be affected by this change and you need not take any action. You may elect to receive shareholder reports and other communications from your insurance company electronically by following the instructions provided by your insurance company.
You may elect to receive all future reports in paper free of charge from your insurance company. If your insurance company informs you that future reports will be delivered via Web access, you can inform your insurance company that you wish to continue receiving paper copies of your shareholder reports by following the instructions provided by your insurance company.

Table of Contents
This report must be preceded or accompanied by a prospectus. To obtain an additional prospectus or summary prospectus, if available, call (800) 728-3337 or your financial representative. We advise you to consider the Fund’s objectives, risks, charges and expenses carefully before investing. The summary prospectus and prospectus contain this and other important information about the Fund. Please read the prospectus carefully before you invest.
Investing in derivatives entails special risks relating to liquidity, leverage and credit that may reduce returns and/or increase volatility. Bond investments are subject to interest-rate, credit, liquidity and market risks to varying degrees. When interest rates rise, bond prices generally fall. Credit risk refers to the ability of an issuer to make timely payments of principal and interest. The “full faith and credit” guarantee of the US government applies to the timely repayment of interest, and does not eliminate market risk. Because of the rising US government debt burden, it is possible that the US government may not be able to meet its financial obligations or that securities issued by the US government may experience credit downgrades. The Fund may lend securities to approved institutions. See the prospectus for details.
The brand DWS represents DWS Group GmbH & Co. KGaA and any of its subsidiaries such as DWS Distributors, Inc. which offers investment products or DWS Investment Management Americas, Inc. and RREEF America L.L.C. which offer advisory services.
DWS Distributors, Inc., 222 South Riverside Plaza, Chicago, IL 60606, (800) 621-1148
NOT FDIC/NCUA INSURED NO BANK GUARANTEE MAY LOSE VALUE NOT A DEPOSIT NOT INSURED BY ANY FEDERAL GOVERNMENT AGENCY
| 2 | | | Deutsche DWS Variable Series II — DWS Government & Agency Securities VIP |
Table of Contents
| Performance Summary | June 30, 2019 (Unaudited) |
Fund performance shown is historical, assumes reinvestment of all dividend and capital gain distributions and does not guarantee future results. Investment return and principal value fluctuate with changing market conditions so that, when redeemed, shares may be worth more or less than their original cost. Current performance may be lower or higher than the performance data quoted. Please contact your participating insurance company for the Fund’s most recent month-end performance. Performance does not reflect charges and fees (“contract charges”) associated with the separate account that invests in the Fund or any variable life insurance policy or variable annuity contract for which the Fund is an investment option. These charges and fees will reduce returns. While all share classes have the same underlying portfolio, their performance will differ.
The gross expense ratios of the Fund, as stated in the fee table of the prospectus dated May 1, 2019 are 0.93% and 1.28% for Class A and Class B shares, respectively, and may differ from the expense ratios disclosed in the Financial Highlights tables in this report.
Generally accepted accounting principles require adjustments to be made to the net assets of the Fund at period end for financial reporting purposes only, and as such, the total return based on the unadjusted net asset value per share may differ from the total return reported in the financial highlights.
Growth of an Assumed $10,000 Investment in DWS Government & Agency Securities VIP
| The Bloomberg Barclays GNMA Index is an unmanaged, market-value-weighted measure of all fixed-rate securities backed by mortgage pools of the Government National Mortgage Association.
Index returns do not reflect any fees or expenses and it is not possible to invest directly into an index. |
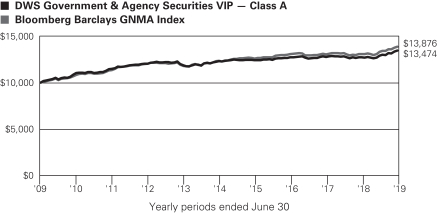
| Comparative Results | ||||||||||||
| DWS Government & Agency Securities VIP | 6-Month‡ | 1-Year | 3-Year | 5-Year | 10-Year | |||||||
| Class A | Growth of $10,000 | $10,445 | $10,581 | $10,574 | $10,937 | $13,474 | ||||||
| Average annual total return | 4.45% | 5.81% | 1.88% | 1.81% | 3.03% | |||||||
| Bloomberg Barclays GNMA Index | Growth of $10,000 | $10,411 | $10,608 | $10,598 | $11,226 | $13,876 | ||||||
| Average annual total return | 4.11% | 6.08% | 1.95% | 2.34% | 3.33% | |||||||
| DWS Government & Agency Securities VIP | 6-Month‡ | 1-Year | 3-Year | 5-Year | 10-Year | |||||||
| Class B | Growth of $10,000 | $10,417 | $10,533 | $10,462 | $10,746 | $13,006 | ||||||
| Average annual total return | 4.17% | 5.33% | 1.52% | 1.45% | 2.66% | |||||||
| Bloomberg Barclays GNMA Index | Growth of $10,000 | $10,411 | $10,608 | $10,598 | $11,226 | $13,876 | ||||||
| Average annual total return | 4.11% | 6.08% | 1.95% | 2.34% | 3.33% | |||||||
The growth of $10,000 is cumulative.
| ‡ | Total returns shown for periods less than one year are not annualized. |
Deutsche DWS Variable Series II — DWS Government & Agency Securities VIP | | | 3 |
Table of Contents
| Portfolio Summary | (Unaudited) |
| Asset Allocation (As a % of Net Assets) | 6/30/19 | 12/31/18 | ||||||
| Mortgage-Backed Securities Pass-Throughs | 79% | 82% | ||||||
| Collateralized Mortgage Obligations | 14% | 10% | ||||||
| Commercial Mortgage-Backed Securities | 7% | 4% | ||||||
| Asset-Backed | 7% | 3% | ||||||
| Government & Agency Obligations | 4% | 4% | ||||||
| Commercial Papers | 3% | — | ||||||
| Cash Equivalents and Other Assets and Liabilities, net | –14% | –3% | ||||||
| 100% | 100% | |||||||
| Coupons* | 6/30/19 | 12/31/18 | ||||||
| Less than 3.5% | 28% | 25% | ||||||
| 3.5%–4.49% | 48% | 52% | ||||||
| 4.5%–5.49% | 19% | 17% | ||||||
| 5.5%–6.49% | 3% | 3% | ||||||
| 6.5%–7.49% | 2% | 3% | ||||||
| 7.5% and Greater | 0% | 0% | ||||||
| 100% | 100% | |||||||
| Interest Rate Sensitivity | 6/30/19 | 12/31/18 | ||||||
| Effective Maturity | 5.2 years | 8.1 years | ||||||
| Effective Duration | 3.4 years | 4.7 years | ||||||
| * | Excludes Cash Equivalents and U.S. Treasury Bills. |
Effective maturity is the weighted average of the maturity date of bonds held by the Fund taking into consideration any available maturity shortening features.
Effective duration is an approximate measure of the Fund’s sensitivity to interest rate changes taking into consideration any maturity shortening features.
Portfolio holdings and characteristics are subject to change.
For more complete details about the Fund’s investment portfolio, see page 5.
Following the Fund’s fiscal first and third quarter-end, a complete portfolio holdings listing is filed with the SEC on Form N-Q or Form N-PORT (available for filings after March 31, 2019). The Fund’s Form N-Q or Form N-PORT will be available on the SEC’s Web site at sec.gov. The Fund’s portfolio holdings are also posted on dws.com from time to time. Please read the Fund’s current prospectus for more information.
Gregory M. Staples, CFA, Managing Director
Scott Agi, CFA, Director
Portfolio Managers
| 4 | | | Deutsche DWS Variable Series II — DWS Government & Agency Securities VIP |
Table of Contents
| Investment Portfolio | as of June 30, 2019 (Unaudited) |
| Principal Amount ($) | Value ($) | |||||||
| Mortgage-Backed Securities Pass-Throughs 78.4% |
| |||||||
Federal Home Loan Mortgage Corp.: |
| |||||||
3.0%, 9/1/2047 | 715,258 | 723,116 | ||||||
3.5%, 9/1/2047 | 649,897 | 668,904 | ||||||
4.0%, with various maturities from 1/1/2045 until 12/1/2045 | 526,941 | 558,001 | ||||||
Federal National Mortgage Association: |
| |||||||
3.0%, with various maturities from 3/1/2047 until 10/1/2047 | 1,240,270 | 1,253,729 | ||||||
3.5%, with various maturities from 8/1/2047 until 7/1/2049 (a) | 3,072,276 | 3,158,258 | ||||||
4.0%, with various maturities from 8/1/2047 until 7/1/2049 (a) | 4,256,809 | 4,409,776 | ||||||
Government National Mortgage Association: |
| |||||||
3.0%, with various maturities from 4/20/2046 until 7/1/2049 (a) | 2,339,703 | 2,388,908 | ||||||
3.5%, with various maturities from 4/15/2042 until 7/1/2049 (a) | 6,531,926 | 6,765,575 | ||||||
4.0%, with various maturities from 6/20/2047 until 4/20/2049 | 1,320,758 | 1,371,867 | ||||||
4.5%, with various maturities from 4/20/2035 until 6/20/2049 | 3,150,726 | 3,326,576 | ||||||
4.55%, 1/15/2041 | 102,909 | 109,793 | ||||||
4.625%, 5/15/2041 | 96,332 | 101,528 | ||||||
5.0%, with various maturities from 12/15/2032 until 2/20/2049 | 2,249,853 | 2,364,886 | ||||||
5.5%, with various maturities from 1/15/2034 until 6/15/2042 | 517,282 | 577,364 | ||||||
6.0%, with various maturities from 5/20/2034 until 1/15/2038 | 257,849 | 294,607 | ||||||
6.5%, with various maturities from 9/15/2036 until 2/15/2039 | 204,894 | 236,325 | ||||||
7.0%, with various maturities from 2/20/2027 until 2/15/2038 | 59,786 | 60,751 | ||||||
7.5%, 10/20/2031 | 3,041 | 3,509 | ||||||
Total Mortgage-Backed Securities |
| 28,373,473 | ||||||
| Asset-Backed 6.9% |
| |||||||
| Automobile Receivables 3.2% |
| |||||||
AmeriCredit Automobile Receivables Trust: |
| |||||||
“A3”, Series2017-1, 1.87%, 8/18/2021 | 73,249 | 73,127 | ||||||
“C”, Series2019-2, 2.74%, 4/18/2025 | 330,000 | 331,388 | ||||||
“D”, Series2017-3, 3.18%, 7/18/2023 | 210,000 | 212,334 | ||||||
Hertz Vehicle Financing II LP, “A”, Series2018-1A, 144A, 3.29%, 2/25/2024 | 350,000 | 356,094 | ||||||
| Principal Amount ($) | Value ($) | |||||||
United Auto Credit Securitization Trust, “A”, Series2019-1, 144A, 2.82%, 7/12/2021 | 167,342 | 167,545 | ||||||
|
| |||||||
| 1,140,488 | ||||||||
| Miscellaneous 3.7% |
| |||||||
Carbone CLO Ltd., “A1”,Series 2017-1A, 144A,3-monthUSD-LIBOR + 1.140%, 3.732%*, 1/20/2031 | 380,000 | 378,108 | ||||||
GMF Floorplan Owner Revolving Trust, “B”, Series2019-2, 144A, 3.1%, 4/15/2026 | 440,000 | 449,424 | ||||||
MVW Owner Trust, “A”,Series 2019-1A, 144A, 2.89%, 11/20/2036 | 330,000 | 334,348 | ||||||
NRZ Excess Spread-Collateralized Notes, “B”, Series 2018-PLS1, 144A, 3.588%, 1/25/2023 | 191,936 | 192,851 | ||||||
|
| |||||||
| 1,354,731 | ||||||||
Total Asset-Backed (Cost $2,475,428) |
| 2,495,219 | ||||||
| Collateralized Mortgage Obligations 14.4% |
| |||||||
Federal Home Loan Mortgage Corp.: |
| |||||||
“OA”, Series 3179, Principal Only, Zero Coupon, 7/15/2036 | 66,137 | 59,370 | ||||||
“CZ”, Series 4113, 3.0%, 9/15/2042 | 329,106 | 330,598 | ||||||
“PI”, Series 3940, Interest Only, 4.0%, 2/15/2041 | 229,574 | 27,604 | ||||||
“C1”, Series 329, Interest Only, 4.0%, 12/15/2041 | 679,249 | 119,410 | ||||||
“UA”, Series 4298, 4.0%, 2/15/2054 | 53,835 | 55,106 | ||||||
“C32”, Series 303, Interest Only, 4.5%, 12/15/2042 | 693,459 | 140,974 | ||||||
“C28”, Series 303, Interest Only, 4.5%, 1/15/2043 | 806,649 | 160,359 | ||||||
“MI”, Series 3871, Interest Only, 6.0%, 4/15/2040 | 22,248 | 932 | ||||||
“IJ”, Series 4472, Interest Only, 6.0%, 11/15/2043 | 258,961 | 61,352 | ||||||
“A”, Series 172, Interest Only, 6.5%, 1/1/2024 | 4,664 | 491 | ||||||
“C22”, Series 324, Interest Only, 6.5%, 4/15/2039 | 375,972 | 94,145 | ||||||
Federal National Mortgage Association: |
| |||||||
“FE”, Series2018-94, 2.804%, 1/25/2049 | 363,774 | 363,541 | ||||||
“Z”, Series2013-44, 3.0%, 5/25/2043 | 100,875 | 103,232 | ||||||
“IO”, Series2012-146, Interest Only, 3.5%, 1/25/2043 | 911,464 | 159,822 | ||||||
“4”, Series 406, Interest Only, 4.0%, 9/25/2040 | 175,832 | 31,154 | ||||||
“IO”, Series2016-26, Interest Only, 5.0%, 5/25/2046 | 736,021 | 138,092 | ||||||
“UI”, Series2010-126, Interest Only, 5.5%, 10/25/2040 | 284,146 | 49,216 | ||||||
“IO”, Series2014-70, Interest Only, 5.5%, 10/25/2044 | 387,070 | 80,569 | ||||||
The accompanying notes are an integral part of the financial statements.
Deutsche DWS Variable Series II — DWS Government & Agency Securities VIP | | | 5 |
Table of Contents
| Principal Amount ($) | Value ($) | |||||||
“BI”, Series2015-97, Interest Only, 5.5%, 1/25/2046 | 321,662 | 65,075 | ||||||
“WI”, Series2011-59, Interest Only, 6.0%, 5/25/2040 | 22,226 | 452 | ||||||
“YT”, Series2013-35, 6.5%, 9/25/2032 | 426,712 | 494,191 | ||||||
Government National Mortgage Association: |
| |||||||
“JI”, Series2013-10, Interest Only, 3.5%, 1/20/2043 | 429,197 | 75,054 | ||||||
“ID”, Series2013-70, Interest Only, 3.5%, 5/20/2043 | 198,987 | 35,768 | ||||||
“IP”, Series2015-50, Interest Only, 4.0%, 9/20/2040 | 606,003 | 38,471 | ||||||
“PI”, Series2015-40, Interest Only, 4.0%, 4/20/2044 | 188,131 | 17,363 | ||||||
“PI”, Series2014-108, Interest Only, 4.5%, 12/20/2039 | 160,703 | 22,597 | ||||||
“IP”, Series2014-115, Interest Only, 4.5%, 2/20/2044 | 109,314 | 15,419 | ||||||
“GZ”, Series2005-24, 5.0%, 3/20/2035 | 682,082 | 797,743 | ||||||
“AZ”, Series2019-31, 5.0%, 3/20/2049 | 291,959 | 327,795 | ||||||
“IA”, Series2012-64, Interest Only, 5.5%, 5/16/2042 | 156,603 | 33,055 | ||||||
“DI”, Series2009-10, Interest Only, 6.0%, 4/16/2038 | 82,715 | 10,025 | ||||||
“IP”, Series2009-118, Interest Only, 6.5%, 12/16/2039 | 27,807 | 6,764 | ||||||
“IC”, Series1997-4, Interest Only, 7.5%, 3/16/2027 | 194,480 | 120 | ||||||
JP Morgan Mortgage Trust: |
| |||||||
“A6”, Series2017-2, 144A, 3.0%, 5/25/2047 | 472,843 | 472,734 | ||||||
“A5”, Series2017-4, 144A, 3.5%, 11/25/2048 | 303,694 | 308,154 | ||||||
New Residential Mortgage Loan: |
| |||||||
“A1”, Series 2019-NQM3, 144A, 2.802%, 7/25/2049 | 300,000 | 300,531 | ||||||
“A1”, Series 2019-NQM2, 144A, 3.6%, 4/25/2049 | 215,177 | 218,283 | ||||||
Total Collateralized Mortgage Obligations (Cost $5,061,401) |
| 5,215,561 | ||||||
| Commercial Mortgage-Backed Securities 7.3% |
| |||||||
Federal National Mortgage Association: |
| |||||||
“A2”, Series2017-M15, 3.058%*, 9/25/2027 | 700,000 | 729,251 | ||||||
“A2”, Series2018-M1, 3.086%*, 12/25/2027 | 500,000 | 518,849 | ||||||
GS Mortgage Securities Trust, “A4”, Series 2019-GC40, 3.16%, 7/10/2052 | 300,000 | 308,988 | ||||||
| Principal Amount ($) | Value ($) | |||||||
Wells Fargo Commercial Mortgage Trust: |
| |||||||
“A4”, Series 2016-NXS6, 2.918%, 11/15/2049 | 750,000 | 762,722 | ||||||
“A4”, Series 2019-C51, 3.311%, 6/15/2052 | 300,000 | 308,979 | ||||||
Total Commercial Mortgage-Backed Securities (Cost $2,597,158) |
| 2,628,789 | ||||||
| Government & Agency Obligations 1.6% |
| |||||||
| U.S. Treasury Obligation |
| |||||||
U.S. Treasury Inflation Indexed Note, 0.5%, 4/15/2024 (Cost $562,966) | 557,183 | 564,139 | ||||||
| Short-Term U.S. Treasury Obligations 2.4% |
| |||||||
U.S. Treasury Bills: |
| |||||||
2.36%**, 8/15/2019 (b) | 380,000 | 379,006 | ||||||
2.582%**, 10/10/2019 (c) | 500,000 | 497,061 | ||||||
Total Short-Term U.S. Treasury Obligations |
| 876,067 | ||||||
| Commercial Papers 2.8% |
| |||||||
ENI Finance U.S.A., Inc., | 300,000 | 299,394 | ||||||
Ford Motor Credit Co., | 400,000 | 397,126 | ||||||
Nissan Motor Acceptance Corp., 2.747%, 7/15/2019 | 300,000 | 299,663 | ||||||
Total Commercial Paper (Cost $996,399) |
| 996,183 | ||||||
| Shares | Value ($) | |||||||
| Cash Equivalents 10.3% |
| |||||||
DWS Central Cash Management Government Fund, 2.40% (d) | 2,621,752 | 2,621,752 | ||||||
DWS ESG Liquidity Fund “Capital Shares”, 2.55% (d) | 1,111,203 | 1,111,315 | ||||||
Total Cash Equivalents (Cost $3,732,848) |
| 3,733,067 | ||||||
| % of Net Assets | Value ($) | |||||||
Total Investment Portfolio (Cost $44,374,364) | 124.1 | 44,882,498 | ||||||
| Other Assets and Liabilities, Net | (24.1 | ) | (8,705,953 | ) | ||||
| Net Assets | 100.0 | 36,176,545 | ||||||
The accompanying notes are an integral part of the financial statements.
| 6 | | | Deutsche DWS Variable Series II — DWS Government & Agency Securities VIP |
Table of Contents
A summary of the Fund’s transactions with affiliated investments during the period ended June 30, 2019 are as follows:
| Value ($) at 12/31/2018 | Purchases Cost ($) | Sales Proceeds ($) | Net Realized Gain/ (Loss) ($) | Net Change in Unrealized Appreciation (Depreciation) ($) | Income ($) | Capital Gain Distributions ($) | Number of Shares at 6/30/2019 | Value ($) at 6/30/2019 | ||||||||||||||||||||||||
Cash Equivalents 10.3% |
| |||||||||||||||||||||||||||||||
DWS Central Cash Management Government Fund, 2.40% (d) |
| |||||||||||||||||||||||||||||||
| 3,485,215 | 16,670,863 | 17,534,326 | — | — | 31,338 | — | 2,621,752 | 2,621,752 | ||||||||||||||||||||||||
DWS ESG Liquidity Fund “Capital Shares”, 2.55% (d) |
| |||||||||||||||||||||||||||||||
| 3,784,362 | 26,843 | 2,700,540 | 810 | (160 | ) | 10,087 | — | 1,111,203 | 1,111,315 | |||||||||||||||||||||||
| 7,269,577 | 16,697,706 | 20,234,866 | 810 | (160 | ) | 41,425 | — | 3,732,955 | 3,733,067 | |||||||||||||||||||||||
| * | Variable or floating rate security. These securities are shown at their current rate as of June 30, 2019. For securities based on a published reference rate and spread, the reference rate and spread are indicated within the description above. Certain variable rate securities are not based on a published reference rate and spread but adjust periodically based on current market conditions, prepayment of underlying positions and/or other variables. |
| ** | Annualized yield at time of purchase; not a coupon rate. |
| (a) | When-issued, delayed delivery or forward commitment securities included. |
| (b) | At June 30, 2019, this security has been pledged, in whole or in part, to cover initial margin requirements for open futures contracts. |
| (c) | At June 30, 2019, this security has been pledged, in whole or in part, to cover initial margin requirements for open centrally cleared swap contracts. |
| (d) | Affiliated fund managed by DWS Investment Management Americas, Inc. The rate shown is the annualizedseven-day yield at period end. |
144A: Security exempt from registration under Rule 144A of the Securities Act of 1933. These securities may be resold in transactions exempt from registration, normally to qualified institutional buyers.
CLO: Collateralized Loan Obligation
Interest Only: Interest Only (IO) bonds represent the “interest only” portion of payments on a pool of underlying mortgages or mortgage-backed securities. IO securities are subject to prepayment risk of the pool of underlying mortgages.
LIBOR: London Interbank Offered Rate
Principal Only: Principal Only (PO) bonds represent the “principal only” portion of payments on a pool of underlying mortgages or mortgage-backed securities.
Included in the portfolio are investments in mortgage or asset-backed securities which are interests in separate pools of mortgages or assets. Effective maturities of these investments may be shorter than stated maturities due to prepayments. Some separate investments in the Federal Home Loan Mortgage Corp., Federal National Mortgage Association and Government National Mortgage Association issues which have similar coupon rates have been aggregated for presentation purposes in this investment portfolio.
At June 30, 2019, open futures contracts purchased were as follows:
| Futures | Currency | Expiration Date | Contracts | Notional Amount ($) | Notional Value ($) | Unrealized Appreciation ($) | ||||||||||||||||||
| U.S. Treasury Long Bond | USD | 9/19/2019 | 2 | 303,318 | 311,188 | 7,870 | ||||||||||||||||||
| Ultra 10 Year U.S. Treasury Note | USD | 9/19/2019 | 35 | 4,780,435 | 4,834,375 | 53,940 | ||||||||||||||||||
| Ultra Long U.S. Treasury Bond | USD | 9/19/2019 | 9 | 1,556,041 | 1,598,063 | 42,022 | ||||||||||||||||||
| Total unrealized appreciation |
| 103,832 | ||||||||||||||||||||||
At June 30, 2019, open futures contracts sold were as follows:
| Futures | Currency | Expiration Date | Contracts | Notional Amount ($) | Notional Value ($) | Unrealized Depreciation ($) | ||||||||||||||||||
| 5 Year U.S. Treasury Note | USD | 9/30/2019 | 42 | 4,946,995 | 4,962,563 | (15,568 | ) | |||||||||||||||||
At June 30, 2019, open interest rate swap contracts were as follows:
| Centrally Cleared Swaps | ||||||||||||||||||||||
| Cash Flows Paid by the Fund/ Frequency | Cash Flows Received by the Fund/ Frequency | Effective/ Expiration Date | Notional Amount ($) | Currency | Upfront Payments Paid/ (Received) ($) | Value ($) | Unrealized Depreciation ($) | |||||||||||||||
| Fixed — 1.961% Semi-Annually | Floating — 3-Month LIBOR Quarterly | | 6/28/2019 6/28/2029 |
| 300,000 | USD | — | (189) | (189) | |||||||||||||
| Fixed — 2.724% Semi-Annually | Floating— 3-Month LIBOR Quarterly | | 3/4/2019 3/5/2029 |
| 700,000 | USD | — | (53,604) | (53,604) | |||||||||||||
| Fixed — 2.085% Semi-Annually | Floating — 3-Month LIBOR Quarterly | | 5/30/2019 5/31/2022 |
| 200,000 | USD | — | (1,843) | (1,843) | |||||||||||||
| Fixed — 2.179% Semi-Annually | Floating — 3-Month LIBOR Quarterly | | 5/21/2019 2/21/2023 |
| 300,000 | USD | — | (4,587) | (4,587) | |||||||||||||
The accompanying notes are an integral part of the financial statements.
Deutsche DWS Variable Series II — DWS Government & Agency Securities VIP | | | 7 |
Table of Contents
| Centrally Cleared Swaps | ||||||||||||||||||||||
| Cash Flows Paid by the Fund/ Frequency | Cash Flows Received by the Fund/ Frequency | Effective/ Expiration Date | Notional Amount ($) | Currency | Upfront Payments Paid/ (Received) ($) | Value ($) | Unrealized Depreciation ($) | |||||||||||||||
| Fixed — 2.45% Semi-Annually | Floating — 3-Month LIBOR Quarterly | | 12/20/2017 12/20/2032 |
| 500,000 | USD | — | (21,583) | (21,583) | |||||||||||||
| Total unrealized depreciation | (81,806) | |||||||||||||||||||||
LIBOR: London Interbank Offered Rate;3-Month LIBOR rate at June 30, 2019 is 2.320%.
At June 30, 2019, open total return swap contracts were as follows:
| Bilateral Swaps | ||||||||||||||||||||||||
| Pay/Receive Return of the Reference Index | Fixed Cash Flows Received Frequency | Counterparty/ Expiration Date | Notional Amount | Currency | Upfront Payments Paid/ (Received) ($) | Value ($) | Unrealized Depreciation ($) | |||||||||||||||||
| Short Positions | ||||||||||||||||||||||||
| Markit IOS INDEX FN30.400.10 | 4.0%/Monthly | Goldman Sachs & Co. 1/12/2041 | 326,684 | USD | — | (1,222) | (1,222) | |||||||||||||||||
As of June 30, 2019, the Fund had the following open forward foreign currency contracts:
| Contracts to Deliver | In Exchange For | Settlement Date | Unrealized Appreciation ($) | Counterparty | ||||||||||||||||||||
| EUR | 643,051 | JPY | 79,299,074 | 8/8/2019 | 4,144 | Citigroup, Inc. | ||||||||||||||||||
Currency Abbreviations
| EUR | Euro |
| JPY | Japanese Yen |
| USD | United States Dollar |
For information on the Fund’s policy and additional disclosures regarding futures contracts, interest rate swap contracts, total return swap contracts and forward foreign currency contracts, please refer to the Derivatives section of Note B in the accompanying Notes to Financial Statements.
Fair Value Measurements
Various inputs are used in determining the value of the Fund’s investments. These inputs are summarized in three broad levels. Level 1 includes quoted prices in active markets for identical securities. Level 2 includes other significant observable inputs (including quoted prices for similar securities, interest rates, prepayment speeds and credit risk). Level 3 includes significant unobservable inputs (including the Fund’s own assumptions in determining the fair value of investments). The level assigned to the securities valuations may not be an indication of the risk or liquidity associated with investing in those securities.
The following is a summary of the inputs used as of June 30, 2019 in valuing the Fund’s investments. For information on the Fund’s policy regarding the valuation of investments, please refer to the Security Valuation section of Note A in the accompanying Notes to Financial Statements.
| Assets | Level 1 | Level 2 | Level 3 | Total | ||||||||||||
| Fixed Income Investments (e) | ||||||||||||||||
Mortgage-Backed Securities Pass-Throughs | $ | — | $ | 28,373,473 | $ | — | $ | 28,373,473 | ||||||||
Asset-Backed | — | 2,495,219 | — | 2,495,219 | ||||||||||||
Collateralized Mortgage Obligations | — | 5,215,561 | — | 5,215,561 | ||||||||||||
Commercial Mortgage-Backed Securities | — | 2,628,789 | — | 2,628,789 | ||||||||||||
Government & Agency Obligations | — | 564,139 | — | 564,139 | ||||||||||||
Short-Term U.S. Treasury Obligations | — | 876,067 | — | 876,067 | ||||||||||||
Commercial Papers | — | 996,183 | — | 996,183 | ||||||||||||
| Short-Term Investments (e) | 3,733,067 | — | — | 3,733,067 | ||||||||||||
| Derivatives (f) | ||||||||||||||||
Futures Contracts | $ | 103,832 | $ | — | $ | — | $ | 103,832 | ||||||||
Forward Foreign Currency Contracts | — | 4,144 | — | 4,144 | ||||||||||||
| Total | $ | 3,836,899 | $ | 41,153,575 | $ | — | $ | 44,990,474 | ||||||||
| Liabilities | Level 1 | Level 2 | Level 3 | Total | ||||||||||||
| Derivatives (f) | ||||||||||||||||
Futures Contracts | $ | (15,568 | ) | $ | — | $ | — | $ | (15,568 | ) | ||||||
Interest Rate Swap Contracts | — | (81,806 | ) | — | (81,806 | ) | ||||||||||
Total Return Swap Contracts | — | (1,222 | ) | — | (1,222 | ) | ||||||||||
| Total | $ | (15,568 | ) | $ | (83,028 | ) | $ | — | $ | (98,596 | ) | |||||
| (e) | See Investment Portfolio for additional detailed categorizations. |
| (f) | Derivatives include unrealized appreciation (depreciation) on open futures contracts, interest rate swap contracts, total return swap contracts and forward foreign currency contracts. |
The accompanying notes are an integral part of the financial statements.
| 8 | | | Deutsche DWS Variable Series II — DWS Government & Agency Securities VIP |
Table of Contents
Statement of Assets and Liabilities
| as of June 30, 2019 (Unaudited) | ||||
| Assets | ||||
| Investments innon-affiliated securities, at value (cost $40,641,516) | $ | 41,149,431 | ||
| Investment in affiliated securities, at value (cost $3,732,848) | 3,733,067 | |||
| Cash | 10,000 | |||
| Foreign currency, at value (cost $63,712) | 63,668 | |||
| Receivable for Fund shares sold | 3,876 | |||
| Interest receivable | 137,191 | |||
| Receivable for variation margin on centrally cleared swaps | 2,027 | |||
| Unrealized appreciation on forward foreign currency contracts | 4,144 | |||
| Other assets | 661 | |||
| Total assets | 45,104,065 | |||
| Liabilities | ||||
| Payable for investments purchased — forward commitments | 7,203,007 | |||
| Payable for investments purchased | 1,618,672 | |||
| Payable for Fund shares redeemed | 25,732 | |||
| Payable for variation margin on futures contracts | 1,288 | |||
| Unrealized depreciation on bilateral swap contracts | 1,222 | |||
| Accrued management fee | 1,294 | |||
| Accrued Trustees’ fees | 236 | |||
| Other accrued expenses and payables | 76,069 | |||
| Total liabilities | 8,927,520 | |||
| Net assets, at value | $ | 36,176,545 | ||
| Net Assets Consist of | ||||
| Distributable earnings (loss) | 981,631 | |||
| Paid-in capital | 35,194,914 | |||
| Net assets, at value | $ | 36,176,545 | ||
| Net Asset Value | ||||
Class A | ||||
| Net Asset Value, offering and redemption price per share ($34,732,416 ÷ 3,132,903 outstanding shares of beneficial interest, no par value, unlimited number of shares authorized) | $ | 11.09 | ||
Class B | ||||
| Net Asset Value, offering and redemption price per share ($1,444,129 ÷ 130,173 outstanding shares of beneficial interest, no par value, unlimited number of shares authorized) | $ | 11.09 | ||
| for the six months ended June 30, 2019 (Unaudited) |
| |||
| Investment Income | ||||
| Income: | ||||
| Interest | $ | 571,969 | ||
| Income distributions from affiliated securities | 41,425 | |||
| Total income | 613,394 | |||
| Expenses: | ||||
| Management fee | 81,078 | |||
| Administration fee | 18,017 | |||
| Services to Shareholders | 333 | |||
| Record keeping fee (Class B) | 719 | |||
| Distribution service fees (Class B) | 1,917 | |||
| Custodian fee | 8,600 | |||
| Professional fees | 42,625 | |||
| Reports to shareholders | 17,587 | |||
| Trustees’ fees and expenses | 1,840 | |||
| Other | 7,643 | |||
| Total expenses before expense reductions | 180,359 | |||
| Expense reductions | (82,202 | ) | ||
| Total expenses after expense reductions | 98,157 | |||
| Net investment income | 515,237 | |||
| Realized and Unrealized Gain/(Loss) | ||||
| Net realized gain (loss) from: | ||||
| Non-Affiliated investments | 178,416 | |||
| Affiliated investments | 810 | |||
| Swap contracts | (49,245 | ) | ||
| Futures | 365,910 | |||
| Forward foreign currency contracts | 5,256 | |||
| Foreign currency | (10 | ) | ||
| 501,137 | ||||
| Change in net unrealized appreciation (depreciation) on: | ||||
| Non-Affiliated investments | 627,753 | |||
| Affiliated investments | (160 | ) | ||
| Swap contracts | (43,774 | ) | ||
| Futures | (28,290 | ) | ||
| Forward foreign currency contracts | (1,160 | ) | ||
| Foreign currency | (409 | ) | ||
| 553,960 | ||||
| Net gain (loss) | 1,055,097 | |||
| Net increase (decrease) in net assets resulting from operations | $ | 1,570,334 | ||
The accompanying notes are an integral part of the financial statements.
Deutsche DWS Variable Series II — DWS Government & Agency Securities VIP | | | 9 |
Table of Contents
Statements of Changes in Net Assets
| Increase (Decrease) in Net Assets | Six Months Ended June 30, 2019 (Unaudited) | Year Ended 2018 | ||||||
| Operations: | ||||||||
| Net investment income | $ | 515,237 | $ | 1,004,300 | ||||
| Net realized gain (loss) | 501,137 | (489,745 | ) | |||||
| Change in net unrealized appreciation (depreciation) | 553,960 | (391,353 | ) | |||||
| Net increase (decrease) in net assets resulting from operations | 1,570,334 | 123,202 | ||||||
| Distributions to shareholders | ||||||||
Class A | (931,223 | ) | (1,045,563 | ) | ||||
Class B | (36,052 | ) | (40,012 | ) | ||||
| Total distributions | (967,275 | ) | (1,085,575 | ) | ||||
| Fund share transactions: | ||||||||
Class A | ||||||||
| Proceeds from shares sold | 2,025,372 | 2,638,856 | ||||||
| Reinvestment of distributions | 931,223 | 1,045,563 | ||||||
| Payments for shares redeemed | (3,708,020 | ) | (8,226,521 | ) | ||||
| Net increase (decrease) in net assets from Class A share transactions | (751,425 | ) | (4,542,102 | ) | ||||
Class B | ||||||||
| Proceeds from shares sold | 53,271 | 54,842 | ||||||
| Reinvestment of distributions | 36,052 | 40,012 | ||||||
| Payments for shares redeemed | (280,819 | ) | (296,226 | ) | ||||
| Net increase (decrease) in net assets from Class B share transactions | (191,496 | ) | (201,372 | ) | ||||
| Increase (decrease) in net assets | (339,862 | ) | (5,705,847 | ) | ||||
| Net assets at beginning of period | 36,516,407 | 42,222,254 | ||||||
| Net assets at end of period | $ | 36,176,545 | $ | 36,516,407 | ||||
| Other Information | ||||||||
Class A | ||||||||
| Shares outstanding at beginning of period | 3,199,776 | 3,619,812 | ||||||
| Shares sold | 185,013 | 242,507 | ||||||
| Shares issued to shareholders in reinvestment of distributions | 85,985 | 97,716 | ||||||
| Shares redeemed | (337,871 | ) | (760,259 | ) | ||||
| Net increase (decrease) in Class A shares | (66,873 | ) | (420,036 | ) | ||||
| Shares outstanding at end of period | 3,132,903 | 3,199,776 | ||||||
Class B | ||||||||
| Shares outstanding at beginning of period | 147,546 | 165,975 | ||||||
| Shares sold | 4,833 | 5,073 | ||||||
| Shares issued to shareholders in reinvestment of distributions | 3,326 | 3,736 | ||||||
| Shares redeemed | (25,532 | ) | (27,238 | ) | ||||
| Net increase (decrease) in Class B shares | (17,373 | ) | (18,429 | ) | ||||
| Shares outstanding at end of period | 130,173 | 147,546 | ||||||
The accompanying notes are an integral part of the financial statements.
| 10 | | | Deutsche DWS Variable Series II — DWS Government & Agency Securities VIP |
Table of Contents
| Six Months Ended 6/30/19 | Years Ended December 31, | |||||||||||||||||||||||
| Class A | (Unaudited) | 2018 | 2017 | 2016 | 2015 | 2014 | ||||||||||||||||||
| Selected Per Share Data | ||||||||||||||||||||||||
| Net asset value, beginning of period | $ | 10.91 | $ | 11.15 | $ | 11.25 | $ | 11.48 | $ | 11.80 | $ | 11.47 | ||||||||||||
| Income (loss) from investment operations: | ||||||||||||||||||||||||
Net investment incomea | .16 | .28 | .23 | .25 | .27 | .29 | ||||||||||||||||||
Net realized and unrealized gain (loss) | .32 | (.22 | ) | (.04 | ) | (.13 | ) | (.26 | ) | .31 | ||||||||||||||
Total from investment operations | .48 | .06 | .19 | .12 | .01 | .60 | ||||||||||||||||||
| Less distributions from: | ||||||||||||||||||||||||
Net investment income | (.30 | ) | (.30 | ) | (.29 | ) | (.35 | ) | (.33 | ) | (.27 | ) | ||||||||||||
| Net asset value, end of period | $ | 11.09 | $ | 10.91 | $ | 11.15 | $ | 11.25 | $ | 11.48 | $ | 11.80 | ||||||||||||
| Total Return (%)b | 4.45 | ** | .55 | 1.67 | 1.06 | .06 | 5.29 | |||||||||||||||||
| Ratios to Average Net Assets and Supplemental Data | ||||||||||||||||||||||||
| Net assets, end of period ($ millions) | 35 | 35 | 40 | 52 | 66 | 87 | ||||||||||||||||||
| Ratio of expenses before expense reductions (%)c | .99 | * | .93 | .87 | .86 | .74 | .72 | |||||||||||||||||
| Ratio of expenses after expense reductions (%)c | .53 | * | .55 | .61 | .58 | .68 | .70 | |||||||||||||||||
| Ratio of net investment income (%) | 2.87 | * | 2.58 | 2.03 | 2.22 | 2.33 | 2.49 | |||||||||||||||||
| Portfolio turnover rate (%) | 185 | ** | 448 | 588 | 521 | 376 | 393 | |||||||||||||||||
| a | Based on average shares outstanding during the period. |
| b | Total return would have been lower had certain expenses not been reduced. |
| c | Expense ratio does not reflect charges and fees associated with the separate account that invests in the Fund or any variable life insurance policy or variable annuity contract for which the Fund is an investment option. |
| * | Annualized |
| ** | Not annualized |
| Six Months Ended 6/30/19 | Years Ended December 31, | |||||||||||||||||||||||
| Class B | (Unaudited) | 2018 | 2017 | 2016 | 2015 | 2014 | ||||||||||||||||||
| Selected Per Share Data | ||||||||||||||||||||||||
| Net asset value, beginning of period | $ | 10.90 | $ | 11.14 | $ | 11.24 | $ | 11.46 | $ | 11.79 | $ | 11.46 | ||||||||||||
| Income (loss) from investment operations: | ||||||||||||||||||||||||
Net investment incomea | .14 | .24 | .19 | .21 | .23 | .25 | ||||||||||||||||||
Net realized and unrealized gain (loss) | .31 | (.22 | ) | (.04 | ) | (.12 | ) | (.27 | ) | .31 | ||||||||||||||
Total from investment operations | .45 | .02 | .15 | .09 | (.04 | ) | .56 | |||||||||||||||||
| Less distributions from: | ||||||||||||||||||||||||
Net investment income | (.26 | ) | (.26 | ) | (.25 | ) | (.31 | ) | (.29 | ) | (.23 | ) | ||||||||||||
| Net asset value, end of period | $ | 11.09 | $ | 10.90 | $ | 11.14 | $ | 11.24 | $ | 11.46 | $ | 11.79 | ||||||||||||
| Total Return (%)b | 4.17 | ** | .19 | 1.31 | .79 | (.36 | ) | 4.95 | ||||||||||||||||
| Ratios to Average Net Assets and Supplemental Data | ||||||||||||||||||||||||
| Net assets, end of period ($ millions) | 1 | 2 | 2 | 2 | 3 | 3 | ||||||||||||||||||
| Ratio of expenses before expense reductions (%)c | 1.33 | * | 1.28 | 1.21 | 1.21 | 1.09 | 1.06 | |||||||||||||||||
| Ratio of expenses after expense reductions (%)c | .88 | * | .90 | .95 | .93 | 1.03 | 1.03 | |||||||||||||||||
| Ratio of net investment income (%) | 2.52 | * | 2.23 | 1.69 | 1.88 | 1.99 | 2.16 | |||||||||||||||||
| Portfolio turnover rate (%) | 185 | ** | 448 | 588 | 521 | 376 | 393 | |||||||||||||||||
| a | Based on average shares outstanding during the period. |
| b | Total return would have been lower had certain expenses not been reduced. |
| c | Expense ratio does not reflect charges and fees associated with the separate account that invests in the Fund or any variable life insurance policy or variable annuity contract for which the Fund is an investment option. |
| * | Annualized |
| ** | Not annualized |
The accompanying notes are an integral part of the financial statements.
Deutsche DWS Variable Series II — DWS Government & Agency Securities VIP | | | 11 |
Table of Contents
| Notes to Financial Statements | (Unaudited) |
A. Organization and Significant Accounting Policies
DWS Government & Agency Securities VIP (the “Fund”) is a diversified series of Deutsche DWS Variable Series II (the “Trust”), which is registered under the Investment Company Act of 1940, as amended (the “1940 Act”), as an open-end management investment company organized as a Massachusetts business trust.
Multiple Classes of Shares of Beneficial Interest. The Fund offers two classes of shares (Class A shares and Class B shares). Sales of Class B shares are subject to recordkeeping fees up to 0.15% and Rule 12b-1 fees under the 1940 Act equal to an annual rate of 0.25% of the average daily net assets of the Class B shares of the Fund. Class A shares are not subject to such fees.
Investment income, realized and unrealized gains and losses, and certain fund-level expenses and expense reductions, if any, are borne pro rata on the basis of relative net assets by the holders of all classes of shares except that each class bears certain expenses unique to that class (including the applicable Rule 12b-1 fee and recordkeeping fees). Differences in class-level expenses may result in payment of different per share dividends by class. All shares have equal rights with respect to voting subject to class-specific arrangements.
The Fund’s financial statements are prepared in accordance with accounting principles generally accepted in the United States of America (“U.S. GAAP”) which require the use of management estimates. Actual results could differ from those estimates. The Fund qualifies as an investment company under Topic 946 of Accounting Standards Codification of U.S. GAAP. The policies described below are followed consistently by the Fund in the preparation of its financial statements.
Security Valuation. Investments are stated at value determined as of the close of regular trading on the New York Stock Exchange on each day the exchange is open for trading.
Various inputs are used in determining the value of the Fund’s investments. These inputs are summarized in three broad levels. Level 1 includes quoted prices in active markets for identical securities. Level 2 includes other significant observable inputs (including quoted prices for similar securities, interest rates, prepayment speeds and credit risk). Level 3 includes significant unobservable inputs (including the Fund’s own assumptions in determining the fair value of investments). The level assigned to the securities valuations may not be an indication of the risk or liquidity associated with investing in those securities.
Debt securities are valued at prices supplied by independent pricing services approved by the Fund’s Board. Such services may use various pricing techniques which take into account appropriate factors such as yield, quality, coupon rate, maturity, type of issue, trading characteristics, prepayment speeds and other data, as well as broker quotes. If the pricing services are unable to provide valuations, debt securities are valued at the average of the most recent reliable bid quotations or evaluated prices, as applicable, obtained from broker-dealers. These securities are generally categorized as Level 2.
Investments in open-end investment companies are valued at their net asset value each business day and are categorized as Level 1.
Futures contracts are generally valued at the settlement prices established each day on the exchange on which they are traded and are categorized as Level 1.
Forward currency contracts are valued at the prevailing forward exchange rate of the underlying currencies and are categorized as Level 2.
Swap contracts are valued daily based upon prices supplied by a Board approved pricing vendor, if available, and otherwise are valued at the price provided by the broker-dealer. Swap contracts are generally categorized as Level 2.
Securities and other assets for which market quotations are not readily available or for which the above valuation procedures are deemed not to reflect fair value are valued in a manner that is intended to reflect their fair value as determined in accordance with procedures approved by the Board and are generally categorized as Level 3. In accordance with the Fund’s valuation procedures, factors considered in determining value may include, but are not limited to, the type of the security; the size of the holding; the initial cost of the security; the existence of any contractual restrictions on the security’s disposition; the price and extent of public trading in similar securities of the issuer or of comparable companies; quotations or evaluated prices from broker-dealers and/or pricing services; information obtained from the issuer, analysts, and/or the appropriate stock exchange (for exchange-traded securities); an analysis of the company’s or
| 12 | | | Deutsche DWS Variable Series II — DWS Government & Agency Securities VIP |
Table of Contents
issuer’s financial statements; an evaluation of the forces that influence the issuer and the market(s) in which the security is purchased and sold; and with respect to debt securities, the maturity, coupon, creditworthiness, currency denomination and the movement of the market in which the security is normally traded. The value determined under these procedures may differ from published values for the same securities.
Disclosure about the classification of fair value measurements is included in a table following the Fund’s Investment Portfolio.
Foreign Currency Translations. The books and records of the Fund are maintained in U.S. dollars. Investment securities and other assets and liabilities denominated in a foreign currency are translated into U.S. dollars at the prevailing exchange rates at period end. Purchases and sales of investment securities, income and expenses are translated into U.S. dollars at the prevailing exchange rates on the respective dates of the transactions.
Net realized and unrealized gains and losses on foreign currency transactions represent net gains and losses between trade and settlement dates on securities transactions, the acquisition and disposition of foreign currencies, and the difference between the amount of net investment income accrued and the U.S. dollar amount actually received. The portion of both realized and unrealized gains and losses on investments that results from fluctuations in foreign currency exchange rates is not separately disclosed but is included with net realized and unrealized gain/appreciation and loss/depreciation on investments.
Securities Lending. Deutsche Bank AG, as lending agent, lends securities of the Fund to certain financial institutions under the terms of its securities lending agreement. During the term of the loans, the Fund continues to receive interest and dividends generated by the securities and to participate in any changes in their market value. The Fund requires the borrowers of the securities to maintain collateral with the Fund consisting of either cash or liquid, unencumbered assets having a value at least equal to the value of the securities loaned. When the collateral falls below specified amounts, the lending agent will use its best effort to obtain additional collateral on the next business day to meet required amounts under the securities lending agreement. During the six months ended June 30, 2019, the Fund invested the cash collateral into a joint trading account in DWS Government & Agency Securities Portfolio, an affiliated money market fund managed by DWS Investment Management Americas, Inc. DWS Investment Management Americas, Inc. receives a management/administration fee (0.11% annualized effective rate as of June 30, 2019) on the cash collateral invested in DWS Government & Agency Securities Portfolio. The Fund receives compensation for lending its securities either in the form of fees or by earning interest on invested cash collateral net of borrower rebates and fees paid to a lending agent. Either the Fund or the borrower may terminate the loan at any time, and the borrower, after notice, is required to return borrowed securities within a standard time period. There may be risks of delay and costs in recovery of securities or even loss of rights in the collateral should the borrower of the securities fail financially. If the Fund is not able to recover securities lent, the Fund may sell the collateral and purchase a replacement investment in the market, incurring the risk that the value of the replacement security is greater than the value of the collateral. The Fund is also subject to all investment risks associated with the reinvestment of any cash collateral received, including, but not limited to, interest rate, credit and liquidity risk associated with such investments.
During the period ended June 30, 2019, the Fund had no securities on loan.
Forward Commitments. The Fund may purchase or sell securities on a when-issued, delayed delivery or forward commitment basis with delivery or payment to occur at a later date beyond the normal settlement period. At the time the Fund enters into a commitment to purchase or sell a security, the transaction is recorded and the value of the transaction is reflected in the net asset value. The price of such security and the date when the security will be delivered and paid for are fixed at the time the transaction is negotiated. The Fund may sell the forward commitment security before the settlement date or enter into a new commitment to extend the delivery date into the future. The value of the security may vary with market fluctuations. At the time the Fund enters into a purchase transaction it is required to segregate cash or other liquid assets at least equal to the amount of the commitment. Additionally, the Fund or the counterparty may be required to post securities and/or cash collateral in accordance with the terms of the commitment.
Certain risks may arise upon entering into when-issued, delayed delivery or forward commitment transactions from the potential inability of counterparties to meet the terms of their contracts or if the issuer does not issue the securities due to political, economic or other factors. Such transactions may also have the effect of leverage on the Fund and may cause the Fund to be more volatile. Additionally, losses may arise due to changes in the value of the underlying securities.
Deutsche DWS Variable Series II — DWS Government & Agency Securities VIP | | | 13 |
Table of Contents
Federal Income Taxes. The Fund’s policy is to comply with the requirements of the Internal Revenue Code, as amended, which are applicable to regulated investment companies and to distribute all of its taxable income to its shareholders.
At December 31, 2018, the Fund had a net tax basis capital loss carryforward of approximately $431,000, which may be applied against realized net taxable capital gains indefinitely, including short-term losses ($329,000) and long-term losses ($102,000).
At June 30, 2019, the aggregate cost of investments for federal income tax purposes was $44,380,582. The net unrealized appreciation for all investments based on tax cost was $501,916. This consisted of aggregate gross unrealized appreciation for all investments in which there was an excess of value over tax cost of $729,632 and aggregate gross unrealized depreciation for all investments in which there was an excess of tax cost over value of $227,716.
The Fund has reviewed the tax positions for the open tax years as of December 31, 2018 and has determined that no provision for income tax and/or uncertain tax positions is required in the Fund’s financial statements. The Fund’s federal tax returns for the prior three fiscal years remain open subject to examination by the Internal Revenue Service.
Distribution of Income and Gains. Distributions from net investment income of the Fund, if any, are declared and distributed to shareholders annually. Net realized gains from investment transactions, in excess of available capital loss carryforwards, would be taxable to the Fund if not distributed and, therefore, will be distributed to shareholders at least annually. The Fund may also make additional distributions for tax purposes if necessary.
The timing and characterization of certain income and capital gain distributions are determined annually in accordance with federal tax regulations which may differ from accounting principles generally accepted in the United States of America. These differences primarily relate to investments in futures contracts, investments in swap contracts, forward currency contracts and certain securities sold at a loss. As a result, net investment income (loss) and net realized gain (loss) on investment transactions for a reporting period may differ significantly from distributions during such period. Accordingly, the Fund may periodically make reclassifications among certain of its capital accounts without impacting the net asset value of the Fund.
The tax character of current year distributions will be determined at the end of the current fiscal year.
Expenses. Expenses of the Trust arising in connection with a specific fund are allocated to that fund. Other Trust expenses which cannot be directly attributed to a fund are apportioned among the funds in the Trust based upon the relative net assets or other appropriate measures.
Contingencies. In the normal course of business, the Fund may enter into contracts with service providers that contain general indemnification clauses. The Fund’s maximum exposure under these arrangements is unknown, as this would involve future claims that may be made against the Fund that have not yet been made. However, based on experience, the Fund expects the risk of loss to be remote.
Other. Investment transactions are accounted for on a trade date plus one basis for daily net asset value calculations. However, for financial reporting purposes, investment transactions are reported on trade date. Interest income is recorded on the accrual basis. Realized gains and losses from investment transactions are recorded on an identified cost basis. All discounts and premiums are accreted/amortized for both tax and financial reporting purposes for the Fund.
B. Derivative Instruments
Swaps. A swap is a contract between two parties to exchange future cash flows at periodic intervals based on the notional amount of the swap. A bilateral swap is a transaction between the Fund and a counterparty where cash flows are exchanged between the two parties. A centrally cleared swap is a transaction executed between the Fund and a counterparty, then cleared by a clearing member through a central clearinghouse. The central clearinghouse serves as the counterparty, with whom the Fund exchanges cash flows.
The value of a swap is adjusted daily, and the change in value, if any, is recorded as unrealized appreciation or depreciation in the Statement of Assets and Liabilities. Gains or losses are realized when the swap expires or is closed. Certain risks may arise when entering into swap transactions including counterparty default; liquidity; or unfavorable changes in interest rates or the value of the underlying reference security, commodity or index. In connection with bilateral swaps, securities and/or cash may be identified as collateral in accordance with the terms of the swap agreement to provide assets of value and recourse in the event of default. The maximum counterparty credit risk is the net present value of the cash flows to be received from
| 14 | | | Deutsche DWS Variable Series II — DWS Government & Agency Securities VIP |
Table of Contents
or paid to the counterparty over the term of the swap, to the extent that this amount is beneficial to the Fund, in addition to any related collateral posted to the counterparty by the Fund. This risk may be partially reduced by a master netting arrangement between the Fund and the counterparty. Upon entering into a centrally cleared swap, the Fund is required to deposit with a financial intermediary cash or securities (“initial margin”) in an amount equal to a certain percentage of the notional amount of the swap. Subsequent payments (“variation margin”) are made or received by the Fund dependent upon the daily fluctuations in the value of the swap. In a cleared swap transaction, counterparty risk is minimized as the central clearinghouse acts as the counterparty.
An upfront payment, if any, made by the Fund is recorded as an asset in the Statement of Assets and Liabilities. An upfront payment, if any, received by the Fund is recorded as a liability in the Statement of Assets and Liabilities. Payments received or made at the end of the measurement period are recorded as realized gain or loss in the Statement of Operations.
Total Return Swap Contracts. Total return swaps involve commitments to pay interest in exchange for a market-linked return based on a notional amount. One counterparty pays out the total return of the reference security or index underlying the total return swap, and in return receives a fixed or variable rate. As a receiver, the Fund would receive payments based on any positive total return and would owe payments in the event of a negative total return. As the payer, the Fund would owe payments on any net positive total return, and would receive payments in the event of a negative total return. For the six months ended June 30, 2019, the Fund entered into total return swap transactions as a means of gaining exposure to a particular asset class without investing directly in such asset class.
A summary of the open total return swap contracts as of June 30, 2019 is included in a table following the Fund’s Investment Portfolio. For the six months ended June 30, 2019, the investment in total return swap contracts had a total notional amount generally indicative of a range from approximately $327,000 to $348,000.
Interest Rate Swaps. Interest rate swaps are agreements in which the Fund agrees to pay to the counterparty a fixed rate payment in exchange for the counterparty agreeing to pay to the Fund a variable rate payment, or the Fund agrees to receive from the counterparty a fixed rate payment in exchange for the counterparty agreeing to receive from the Fund a variable rate payment. The payment obligations are based on the notional amount of the swap. For the six months ended June 30, 2019, the Fund entered into interest rate swap agreements to gain exposure to different parts of the yield curve while managing overall duration and for non-hedging purposes to seek to enhance potential gains.
A summary of the open interest rate swap contracts as of June 30, 2019 is included in a table following the Fund’s Investment Portfolio. For the six months ended June 30, 2019, the investment in interest rate swap contracts had a total USD equivalent notional amount generally indicative of a range from $1,600,000 to $4,700,000.
Futures Contracts. A futures contract is an agreement between a buyer or seller and an established futures exchange or its clearinghouse in which the buyer or seller agrees to take or make a delivery of a specific amount of a financial instrument at a specified price on a specific date (settlement date). For the six months ended June 30, 2019, the Fund entered into interest rate futures to gain exposure to different parts of the yield curve while managing overall duration and for non-hedging purposes to seek to enhance potential gains.
Upon entering into a futures contract, the Fund is required to deposit with a financial intermediary cash or securities (“initial margin”) in an amount equal to a certain percentage of the face value indicated in the futures contract. Subsequent payments (“variation margin”) are made or received by the Fund dependent upon the daily fluctuations in the value and are recorded for financial reporting purposes as unrealized gains or losses by the Fund. Gains or losses are realized when the contract expires or is closed. Since all futures contracts are exchange-traded, counterparty risk is minimized as the exchange’s clearinghouse acts as the counterparty, and guarantees the futures against default.
Certain risks may arise upon entering into futures contracts, including the risk that an illiquid market will limit the Fund’s ability to close out a futures contract prior to the settlement date and the risk that the futures contract is not well correlated with the security, index or currency to which it relates. Risk of loss may exceed amounts disclosed in the Statement of Assets and Liabilities.
A summary of the open futures contracts as of June 30, 2019, is included in a table following the Fund’s Investment Portfolio. For the six months ended June 30, 2019, the investment in futures contracts purchased had a total notional value generally indicative of a range from approximately $6,293,000 to $12,365,000 and the investment in futures contracts sold had a total notional value generally indicative of a range from approximately $579,000 to $4,963,000.
Deutsche DWS Variable Series II — DWS Government & Agency Securities VIP | | | 15 |
Table of Contents
Options.An option contract is a contract in which the writer (seller) of the option grants the buyer of the option, upon payment of a premium, the right to purchase from (call option), or sell to (put option), the writer a designated instrument at a specified price within a specified period of time. The Fund may write or purchase interest rate swaption agreements which are options to enter into a pre-defined swap agreement. The interest rate swaption agreement will specify whether the buyer of the swaption will be a fixed-rate receiver or a fixed-rate payer upon exercise. Certain options, including options on indices and interest rate options, will require cash settlement by the Fund if exercised. For the six months ended June 30, 2019, the Fund entered into options on interest rate swaps in order to hedge against potential adverse interest rate movements of portfolio assets.
If the Fund writes a covered call option, the Fund foregoes, in exchange for the premium, the opportunity to profit during the option period from an increase in the market value of the underlying security above the exercise price. If the Fund writes a put option it accepts the risk of a decline in the value of the underlying security below the exercise price. Over-the-counter options have the risk of the potential inability of counterparties to meet the terms of their contracts. The Fund’s maximum exposure to purchased options is limited to the premium initially paid. In addition, certain risks may arise upon entering into option contracts including the risk that an illiquid secondary market will limit the Fund’s ability to close out an option contract prior to the expiration date and that a change in the value of the option contract may not correlate exactly with changes in the value of the securities hedged.
There were no open option contracts as of June 30, 2019. For the six months ended June 30, 2019, the investment in purchased option contracts had a total value generally indicative of a range from $0 to approximately $3,000.
Forward Foreign Currency Contracts. A forward foreign currency contract (“forward currency contract”) is a commitment to purchase or sell a foreign currency at the settlement date at a negotiated rate. For the six months ended June 30, 2019, the Fund entered into forward currency contracts in order to hedge its exposure to changes in foreign currency exchange rates on its foreign currency denominated portfolio holdings and for non-hedging purposes to seek to enhance potential gains.
Forward currency contracts are valued at the prevailing forward exchange rate of the underlying currencies and unrealized gain (loss) is recorded daily. On the settlement date of the forward currency contract, the Fund records a realized gain or loss equal to the difference between the value of the contract at the time it was opened and the value of the contract at the time it was closed. Certain risks may arise upon entering into forward currency contracts from the potential inability of counterparties to meet the terms of their contracts. The maximum counterparty credit risk to the Fund is measured by the unrealized gain on appreciated contracts. Additionally, when utilizing forward currency contracts to hedge, the Fund gives up the opportunity to profit from favorable exchange rate movements during the term of the contract.
A summary of the open forward currency contracts as of June 30, 2019 is included in a table following the Fund’s Investment Portfolio. For the six months ended June 30, 2019, the investment in forward currency contracts short vs. U.S. dollars had a total contract value generally indicative of a range from approximately $0 to approximately $785,000 and the investment in forward currency contracts long vs. U.S. dollars had a total contract value generally indicative of a range from $0 to approximately $780,000. The investment in forward currency contracts long vs. other foreign currencies sold had a total contract value generally indicative of a range from $0 to approximately $720,000.
The following tables summarize the value of the Fund’s derivative instruments held as of June 30, 2019 and the related location in the accompanying Statement of Assets and Liabilities, presented by primary underlying risk exposure:
| Asset Derivatives | Forward Contracts | Futures Contracts | Total | |||||||||
| Interest Rate Contracts (a) | $ | — | $ | 103,832 | $ | 103,832 | ||||||
| Foreign Exchange Contracts (b) | 4,144 | — | 4,144 | |||||||||
| $ | 4,144 | $ | 103,832 | $ | 107,976 | |||||||
Each of the above derivatives is located in the following Statement of Assets and Liabilities accounts:
| (a) | Includes cumulative appreciation of futures contracts as disclosed in the Investment Portfolio. Unsettled variation margin is disclosed separately within the Statement of Assets and Liabilities. |
| (b) | Unrealized appreciation on forward foreign currency contracts |
| 16 | | | Deutsche DWS Variable Series II — DWS Government & Agency Securities VIP |
Table of Contents
| Liability Derivatives | Swap Contracts | Futures Contracts | Total | |||||||||
| Interest Rate Contracts (c) (d) | $ | (83,028 | ) | $ | (15,568 | ) | $ | (98,596 | ) | |||
Each of the above derivatives is located in the following Statement of Assets and Liabilities accounts:
| (c) | Includes cumulative depreciation of swap contracts and futures contracts as disclosed in the Investment Portfolio. Unsettled variation margin is disclosed separately within the Statement of Assets and Liabilities. |
| (d) | Unrealized depreciation on bilateral swap contracts |
Additionally, the amount of unrealized and realized gains and losses on derivative instruments recognized in Fund earnings during the six months ended June 30, 2019 and the related location in the accompanying Statement of Operations is summarized in the following tables by primary underlying risk exposure:
| Realized Gain (Loss) | Purchased Options | Forward Contracts | Swap Contracts | Futures Contracts | Total | |||||||||||||||
| Interest Rate Contracts (e) | $ | (2,750 | ) | $ | — | $ | (49,245 | ) | $ | 365,910 | $ | 313,915 | ||||||||
| Foreign Exchange Contracts (f) | — | 5,256 | — | — | 5,256 | |||||||||||||||
| $ | (2,750 | ) | $ | 5,256 | $ | (49,245 | ) | $ | 365,910 | $ | 319,171 | |||||||||
Each of the above derivatives is located in the following Statement of Operations accounts:
| (e) | Net realized gain (loss) from investments (includes purchased options), swap contracts and futures, respectively |
| (f) | Net realized gain (loss) from forward foreign currency contracts |
| Change in Net Unrealized Appreciation (Depreciation) | Forward Contracts | Swap Contracts | Futures Contracts | Total | ||||||||||||
| Interest Rate Contracts (g) | $ | — | $ | (43,774 | ) | $ | (28,290 | ) | $ | (72,064 | ) | |||||
| Foreign Exchange Contracts (h) | (1,160 | ) | — | — | (1,160 | ) | ||||||||||
| $ | (1,160 | ) | $ | (43,774 | ) | $ | (28,290 | ) | $ | (73,224 | ) | |||||
Each of the above derivatives is located in the following Statement of Operations accounts:
| (g) | Change in net unrealized appreciation (depreciation) from swap contracts and futures, respectively |
| (h) | Change in net unrealized appreciation (depreciation) on forward foreign currency contracts |
As of June 30, 2019, the Fund has transactions subject to enforceable master netting agreements which govern the terms of certain transactions, and reduce the counterparty risk associated with such transactions. Master netting agreements allow a Fund to close out and net total exposure to a counterparty in the event of a deterioration in the credit quality or contractual default with respect to all of the transactions with a counterparty. As defined by the master netting agreement, the Fund may have collateral agreements with certain counterparties to mitigate risk. For financial reporting purposes the Statement of Assets and Liabilities generally shows derivatives assets and liabilities on a gross basis, which reflects the full risks and exposures prior to netting. A reconciliation of the gross amounts on the Statement of Assets and Liabilities to the net amounts by a counterparty, including any collateral exposure, is included in the following tables:
| Counterparty | Gross Amounts of Assets Presented in the Statement of Assets and Liabilities | Financial Instruments and Derivatives Available for Offset | Collateral Received | Net Amount of Derivative Assets | ||||||||||||
| Citigroup, Inc. | $ | 4,144 | $ | — | $ | — | $ | 4,144 | ||||||||
| Counterparty | Gross Amounts of Liabilities Presented in the Statement of Assets and Liabilities | Financial Instruments and Derivatives Available for Offset | Collateral Pledged | Net Amount of Derivative Liabilities | ||||||||||||
| Goldman Sachs & Co. | $ | 1,222 | $ | — | $ | — | $ | 1,222 | ||||||||
Deutsche DWS Variable Series II — DWS Government & Agency Securities VIP | | | 17 |
Table of Contents
C. Purchases and Sales of Securities
During the six months ended June 30, 2019, purchases and sales of investment securities, excluding short-term investments, were as follows:
| Purchases | Sales | |||||||
| Non-U.S. Treasury Obligations | $ | 72,515,680 | $ | 70,611,263 | ||||
| U.S. Treasury Obligations | $ | 1,099,773 | $ | 1,253,810 | ||||
D. Related Parties
Management Agreement. Under the Investment Management Agreement with DWS Investment Management Americas, Inc. (“DIMA” or the “Advisor”), an indirect, wholly owned subsidiary of DWS Group GmbH & Co. KGaA (“DWS Group”), the Advisor directs the investments of the Fund in accordance with its investment objectives, policies and restrictions. The Advisor determines the securities, instruments and other contracts relating to investments to be purchased, sold or entered into by the Fund.
Pursuant to the Investment Management Agreement with the Advisor, the Fund pays a monthly management fee based on the Fund’s average daily net assets, computed and accrued daily and payable monthly, at the following annual rates:
| First $250 million | .450 | % | ||
| Next $750 million | .430 | % | ||
| Next $1.5 billion | .410 | % | ||
| Next $2.5 billion | .400 | % | ||
| Next $2.5 billion | .380 | % | ||
| Next $2.5 billion | .360 | % | ||
| Next $2.5 billion | .340 | % | ||
| Over $12.5 billion | .320 | % |
Accordingly, for the six months ended June 30, 2019, the fee pursuant to the Investment Management Agreement was equivalent to an annualized rate (exclusive of any applicable waivers/reimbursements) of 0.45% of the Fund’s average daily net assets.
For the period from January 1, 2019 through April 30, 2020, the Advisor has contractually agreed to waive all or a portion of its fees and/or reimburse certain operating expenses of the Fund to the extent necessary to maintain the total annual operating expenses (excluding certain expenses such as extraordinary expenses, taxes, brokerage and interest) of each class as follows:
| Class A | .53 | % | ||
| Class B | .88 | % |
For the six months ended June 30, 2019, fees waived and/or expenses reimbursed for each class are as follows:
| Class A | $ | 78,711 | ||
| Class B | 3,491 | |||
| $ | 82,202 |
Administration Fee. Pursuant to an Administrative Services Agreement, DIMA provides most administrative services to the Fund. For all services provided under the Administrative Services Agreement, the Fund pays DIMA an annual fee (“Administration Fee”) of 0.10% of the Fund’s average daily net assets, computed and accrued daily and payable monthly. For the six months ended June 30, 2019, the Administration Fee was $18,017, of which $2,984 is unpaid.
Service Provider Fees. DWS Service Company (“DSC”), an affiliate of the Advisor, is the transfer agent, dividend-paying agent and shareholder service agent for the Fund. Pursuant to a sub-transfer agency agreement between DSC and DST Systems, Inc. (“DST”), DSC has delegated certain transfer agent, dividend-paying agent and shareholder service agent functions to DST. DSC compensates DST out of the
| 18 | | | Deutsche DWS Variable Series II — DWS Government & Agency Securities VIP |
Table of Contents
shareholder servicing fee it receives from the Fund. For the six months ended June 30, 2019, the amounts charged to the Fund by DSC were as follows:
| Total Aggregated | Unpaid at | |||||||
| Class A | $ | 128 | $ | 33 | ||||
| Class B | 24 | 12 | ||||||
| $ | 152 | $ | 45 | |||||
Distribution Service Agreement. Under the Fund’s Class B 12b-1 plan, DWS Distributors, Inc. (“DDI”) received a fee (“Distribution Service Fee”) of 0.25% of average daily net assets of Class B shares. For the six months ended June 30, 2019, the Distribution Service Fee aggregated $1,917, of which $300 is unpaid.
Typesetting and Filing Service Fees. Under an agreement with the Fund, DIMA is compensated for providing certain pre-press and regulatory filing services to the Fund. For the six months ended June 30, 2019, the amount charged to the Fund by DIMA included in the Statement of Operations under “Reports to shareholders” aggregated $5,401, all of which is unpaid.
Trustees’ Fees and Expenses. The Fund paid retainer fees to each Trustee not affiliated with the Advisor, plus specified amounts to the Board Chairperson and to each committee Chairperson.
Affiliated Cash Management Vehicles. The Fund may invest uninvested cash balances in DWS Central Cash Management Government Fund and DWS ESG Liquidity Fund, affiliated money market funds which are managed by the Advisor. Each affiliated money market fund is managed in accordance with Rule 2a-7 under the 1940 Act, which governs the quality, maturity, diversity and liquidity of instruments in which a money market fund may invest. DWS Central Cash Management Government Fund seeks to maintain a stable net asset value, and DWS ESG Liquidity Fund maintains a floating net asset value. The Fund indirectly bears its proportionate share of the expenses of each affiliated money market fund in which it invests. DWS Central Cash Management Government Fund does not pay the Advisor an investment management fee. To the extent that DWS ESG Liquidity Fund pays an investment management fee to the Advisor, the Advisor will waive an amount of the investment management fee payable to the Advisor by the Fund equal to the amount of the investment management fee payable on the Fund’s assets invested in DWS ESG Liquidity Fund.
Security Lending Fees. Deutsche Bank AG serves as securities lending agent for the Fund. For the six months ended June 30, 2019, the Fund did not incur securities lending agent fees to Deutsche Bank AG.
E. Ownership of the Fund
At June 30, 2019, three participating insurance companies were owners of record of 10% or more of the total outstanding Class A shares of the Fund, each owning 50%, 33% and 14%. One participating insurance company was the owner of record of 10% or more of the total outstanding Class B shares of the Fund, owning 93%.
F. Line of Credit
The Fund and other affiliated funds (the “Participants”) share in a $400 million revolving credit facility provided by a syndication of banks. The Fund may borrow for temporary or emergency purposes, including the meeting of redemption requests that otherwise might require the untimely disposition of securities. The Participants are charged an annual commitment fee which is allocated based on net assets, among each of the Participants. Interest is calculated at a rate per annum equal to the sum of the Federal Funds Rate plus 1.25 percent plus if the one-month LIBOR exceeds the Federal Funds Rate, the amount of such excess. The Fund may borrow up to a maximum of 33 percent of its net assets under the agreement. The Fund had no outstanding loans at June 30, 2019.
Deutsche DWS Variable Series II — DWS Government & Agency Securities VIP | | | 19 |
Table of Contents
| Information About Your Fund’s Expenses | (Unaudited) |
As an investor of the Fund, you incur two types of costs: ongoing expenses and transaction costs. Ongoing expenses include management fees, distribution and service (12b-1) fees and other Fund expenses. Examples of transaction costs include contract charges, which are not shown in this section. The following tables are intended to help you understand your ongoing expenses (in dollars) of investing in the Fund and to help you compare these expenses with the ongoing expenses of investing in other mutual funds. In the most recent six-month period, the Fund limited these expenses; had it not done so, expenses would have been higher. The example in the table is based on an investment of $1,000 invested at the beginning of thesix-month period and held for the entire period (January 1, 2019 to June 30, 2019).
The tables illustrate your Fund’s expenses in two ways:
| – | Actual Fund Return. This helps you estimate the actual dollar amount of ongoing expenses (but not transaction costs) paid on a $1,000 investment in the Fund using the Fund’s actual return during the period. To estimate the expenses you paid over the period, simply divide your account value by $1,000 (for example, an $8,600 account value divided by $1,000 = 8.6), then multiply the result by the number in the “Expenses Paid per $1,000” line under the share class you hold. |
| – | Hypothetical 5% Fund Return. This helps you to compare your Fund’s ongoing expenses (but not transaction costs) with those of other mutual funds using the Fund’s actual expense ratio and a hypothetical rate of return of 5% per year before expenses. Examples using a 5% hypothetical Fund return may be found in the shareholder reports of other mutual funds. The hypothetical account values and expenses may not be used to estimate the actual ending account balance or expenses you paid for the period. |
Please note that the expenses shown in these tables are meant to highlight your ongoing expenses only and do not reflect any transaction costs. The “Expenses Paid per $1,000” line of the tables is useful in comparing ongoing expenses only and will not help you determine the relative total expense of owning different funds. If these transaction costs had been included, your costs would have been higher.
| Expenses and Value of a $1,000 Investment for the six months ended June 30, 2019 | ||||||||
| Actual Fund Return | Class A | Class B | ||||||
| Beginning Account Value 1/1/19 | $ | 1,000.00 | $ | 1,000.00 | ||||
| Ending Account Value 6/30/19 | $ | 1,044.50 | $ | 1,041.70 | ||||
| Expenses Paid per $1,000* | $ | 2.69 | $ | 4.45 | ||||
| Hypothetical 5% Fund Return | Class A | Class B | ||||||
| Beginning Account Value 1/1/19 | $ | 1,000.00 | $ | 1,000.00 | ||||
| Ending Account Value 6/30/19 | $ | 1,022.17 | $ | 1,020.43 | ||||
| Expenses Paid per $1,000* | $ | 2.66 | $ | 4.41 | ||||
| * | Expenses are equal to the Fund’s annualized expense ratio for each share class, multiplied by the average account value over the period, multiplied by 181 (the number of days in the most recent six-month period), then divided by 365. |
| Annualized Expense Ratios | Class A | Class B | ||||||
| Deutsche DWS Variable Series II — DWS Government & Agency Securities VIP | .53 | % | .88 | % | ||||
For more information, please refer to the Fund’s prospectus.
These tables do not reflect charges and fees (“contract charges”) associated with the separate account that invests in the Fund or any variable life insurance policy or variable annuity contract for which the Fund is an investment option.
For an analysis of the fees associated with an investment in the Fund or similar funds, please refer to the current and hypothetical expense calculators for Variable Insurance Products which can be found at dws.com/calculators.
| 20 | | | Deutsche DWS Variable Series II — DWS Government & Agency Securities VIP |
Table of Contents
| Proxy Voting |
The Trust’s policies and procedures for voting proxies for portfolio securities and information about how the Trust voted proxies related to its portfolio securities during the most recent 12-month period ended June 30 are available on our Web site — dws.com/en-us/resources/proxy-voting — or on the SEC’s Web site — sec.gov. To obtain a written copy of the Trust’s policies and procedures without charge, upon request, call us toll free at(800) 728-3337.
Deutsche DWS Variable Series II — DWS Government & Agency Securities VIP | | | 21 |
Table of Contents
Advisory Agreement Board Considerations and Fee Evaluation
The Board of Trustees (hereinafter referred to as the “Board” or “Trustees”) approved the renewal of DWS Government & Agency Securities VIP’s (the “Fund”) investment management agreement (the “Agreement”) with DWS Investment Management Americas, Inc. (“DIMA”) in September 2018.
In terms of the process that the Board followed prior to approving the Agreement, shareholders should know that:
| – | During the entire process, all of the Fund’s Trustees were independent of DIMA and its affiliates (the “Independent Trustees”). |
| – | The Board met frequently during the past year to discuss fund matters and dedicated a substantial amount of time to contract review matters. Over the course of several months, the Board’s Contract Committee reviewed extensive materials received from DIMA, independent third parties and independent counsel. These materials included an analysis of the Fund’s performance, fees and expenses, and profitability from a fee consultant retained by the Fund’s Independent Trustees (the “Fee Consultant”). Based on its evaluation of the information provided, the Contract Committee presented its findings and recommendations to the Board. The Board then reviewed the Contract Committee’s findings and recommendations. |
| – | The Board also received extensive information throughout the year regarding performance of the Fund. |
| – | The Independent Trustees regularly met privately with counsel to discuss contract review and other matters. In addition, the Independent Trustees were advised by the Fee Consultant in the course of their review of the Fund’s contractual arrangements and considered a comprehensive report prepared by the Fee Consultant in connection with their deliberations. |
| – | In connection with reviewing the Agreement, the Board also reviewed the terms of the Fund’s Rule 12b-1 plan, distribution agreement, administrative services agreement, transfer agency agreement and other material service agreements. |
In connection with the contract review process, the Contract Committee and the Board considered the factors discussed below, among others. The Board also considered that DIMA and its predecessors have managed the Fund since its inception, and the Board believes that a long-term relationship with a capable, conscientious advisor is in the best interests of the Fund. The Board considered, generally, that shareholders chose to invest or remain invested in the Fund knowing that DIMA managed the Fund. DIMA is part of DWS Group GmbH & Co. KGaA (“DWS Group”). DWS Group is a global asset management business that offers a wide range of investing expertise and resources, including research capabilities in many countries throughout the world. In 2018, approximately 20% of DWS Group’s shares were sold in an initial public offering, with Deutsche Bank AG owning the remaining shares.
As part of the contract review process, the Board carefully considered the fees and expenses of each DWS fund overseen by the Board in light of the fund’s performance. In many cases, this led to the negotiation and implementation of expense caps. As part of these negotiations, the Board indicated that it would consider relaxing these caps in future years following sustained improvements in performance, among other considerations.
While shareholders may focus primarily on fund performance and fees, the Fund’s Board considers these and many other factors, including the quality and integrity of DIMA’s personnel and administrative support services provided by DIMA, such as back-office operations, fund valuations, and compliance policies and procedures.
Nature, Quality and Extent of Services.The Board considered the terms of the Agreement, including the scope of advisory services provided under the Agreement. The Board noted that, under the Agreement, DIMA provides portfolio management services to the Fund and that, pursuant to a separate administrative services agreement, DIMA provides administrative services to the Fund. The Board considered the experience and skills of senior management and investment personnel and the resources made available to such personnel. The Board reviewed the Fund’s performance over short-term and long-term periods and compared those returns to various agreed-upon performance measures, including market index(es) and a peer universe compiled using information supplied by Morningstar Direct (“Morningstar”), an independent fund data service. The Board also noted that it has put into place a process of identifying “Funds in Review” (e.g., funds performing poorly relative to a peer universe), and receives additional reporting from DIMA regarding such funds and, where appropriate, DIMA’s plans to address underperformance. The Board
| 22 | | | Deutsche DWS Variable Series II — DWS Government & Agency Securities VIP |
Table of Contents
believes this process is an effective manner of identifying and addressing underperforming funds. Based on the information provided, the Board noted that, for the one-, three- and five-year periods ended December 31, 2017, the Fund’s performance (Class A shares) was in the 4th quartile, 4th quartile and 3rd quartile, respectively, of the applicable Morningstar universe (the 1st quartile being the best performers and the 4th quartile being the worst performers). The Board also observed that the Fund has underperformed its benchmark in the one-, three- and five-year periods ended December 31, 2017. The Board noted the disappointing investment performance of the Fund in recent periods and continued to discuss with senior management of DIMA the factors contributing to such underperformance and actions being taken to improve performance. The Board observed that the Fund had experienced improved relative performance during the first eight months of 2018. The Board recognized the efforts by DIMA in recent years to enhance its investment platform and improve long-term performance across the DWS fund complex.
Fees and Expenses. The Board considered the Fund’s investment management fee schedule, operating expenses and total expense ratios, and comparative information provided by Broadridge Financial Solutions, Inc. (“Broadridge”) and the Fee Consultant regarding investment management fee rates paid to other investment advisors by similar funds (1st quartile being the most favorable and 4th quartile being the least favorable). With respect to management fees paid to other investment advisors by similar funds, the Board noted that the contractual fee rates paid by the Fund, which include a 0.10% fee paid to DIMA under the Fund’s administrative services agreement, were higher than the median (3rd quartile) of the applicable Broadridge peer group (based on Broadridge data provided as of December 31, 2017). The Board noted that the Fund’s Class A shares total (net) operating expenses were expected to be lower than the median (2nd quartile) of the applicable Broadridge expense universe (based on Broadridge data provided as of December 31, 2017, and analyzing Broadridge expense universe Class A (net) expenses less any applicable 12b-1 fees) (“Broadridge Universe Expenses”). The Board also reviewed data comparing each share class’s total (net) operating expenses to the applicable Broadridge Universe Expenses. The Board noted that the expense limitations agreed to by DIMA were expected to help the Fund’s total (net) operating expenses remain competitive. The Board considered the Fund’s management fee rate as compared to fees charged by DIMA to comparable DWS U.S. registered funds (“DWS Funds”), noting that DIMA indicated that it does not provide services to any other comparable DWS Funds. The information requested by the Board as part of its review of fees and expenses also included information about institutional accounts (including any sub-advised funds and accounts) and funds offered primarily to European investors (“DWS Europe Funds”) managed by DWS Group. The Board noted that DIMA indicated that DWS Group does not manage any institutional accounts or DWS Europe Funds comparable to the Fund.
On the basis of the information provided, the Board concluded that management fees were reasonable and appropriate in light of the nature, quality and extent of services provided by DIMA.
Profitability. The Board reviewed detailed information regarding revenues received by DIMA under the Agreement. The Board considered the estimated costs to DIMA, and pre-tax profits realized by DIMA, from advising the DWS Funds, as well as estimates of the pre-tax profits attributable to managing the Fund in particular. The Board also received information regarding the estimated enterprise-wide profitability of DIMA and its affiliates with respect to all fund services in totality and by fund. The Board and the Fee Consultant reviewed DIMA’s methodology in allocating its costs to the management of the Fund. Based on the information provided, the Board concluded that the pre-tax profits realized by DIMA in connection with the management of the Fund were not unreasonable. The Board also reviewed certain publicly available information regarding the profitability of certain similar investment management firms. The Board noted that, while information regarding the profitability of such firms is limited (and in some cases is not necessarily prepared on a comparable basis), DIMA and its affiliates’ overall profitability with respect to the DWS Funds (after taking into account distribution and other services provided to the funds by DIMA and its affiliates) was lower than the overall profitability levels of most comparable firms for which such data was available.
Economies of Scale. The Board considered whether there are economies of scale with respect to the management of the Fund and whether the Fund benefits from any economies of scale. The Board noted that the Fund’s investment management fee schedule includes fee breakpoints. The Board concluded that the Fund’s fee schedule represents an appropriate sharing between the Fund and DIMA of such economies of scale as may exist in the management of the Fund at current asset levels.
Other Benefits to DIMA and Its Affiliates. The Board also considered the character and amount of other incidental or “fall-out” benefits received by DIMA and its affiliates, including any fees received by DIMA for administrative services provided to the Fund, any fees received by an affiliate of DIMA for transfer agency services provided to the Fund and any fees received by an affiliate of DIMA for distribution services. The
Deutsche DWS Variable Series II — DWS Government & Agency Securities VIP | | | 23 |
Table of Contents
Board also considered benefits to DIMA related to brokerage and soft-dollar allocations, including allocating brokerage to pay for research generated by parties other than the executing broker dealers, which pertain primarily to funds investing in equity securities. In addition, the Board considered the incidental public relations benefits to DIMA related to DWS Funds advertising and cross-selling opportunities among DIMA products and services. The Board considered these benefits in reaching its conclusion that the Fund’s management fees were reasonable.
Compliance. The Board considered the significant attention and resources dedicated by DIMA to its compliance processes in recent years. The Board noted in particular (i) the experience, seniority and time commitment of the individuals serving as DIMA’s and the Fund’s chief compliance officers and (ii) the substantial commitment of resources by DIMA and its affiliates to compliance matters, including the retention of compliance personnel.
Based on all of the information considered and the conclusions reached, the Board unanimously determined that the continuation of the Agreement is in the best interests of the Fund. In making this determination, the Board did not give particular weight to any single factor identified above. The Board considered these factors over the course of numerous meetings, certain of which were in executive session with only the Independent Trustees and counsel present. It is possible that individual Independent Trustees may have weighed these factors differently in reaching their individual decisions to approve the continuation of the Agreement.
| 24 | | | Deutsche DWS Variable Series II — DWS Government & Agency Securities VIP |
Table of Contents
Notes
Table of Contents
Notes
Table of Contents
Notes
Table of Contents
| ||
VS2GAS-3 (R-028384-8 8/19) |
Table of Contents
June 30, 2019
Semiannual Report
Deutsche DWS Variable Series II
DWS Government Money Market VIP
Beginning on January 1, 2021, as permitted by regulations adopted by the Securities and Exchange Commission, you may not be receiving paper copies of the Fund’s shareholder reports from the insurance company that offers your contract unless you specifically request paper copies from your insurance company or from your financial intermediary. Instead, the shareholder reports will be made available on a Web site, and your insurance company will notify you by mail each time a report is posted and provide you with a Web site link to access the report. Instructions for requesting paper copies will be provided by your insurance company.
If you already elected to receive shareholder reports electronically, you will not be affected by this change and you need not take any action. You may elect to receive shareholder reports and other communications from your insurance company electronically by following the instructions provided by your insurance company.
You may elect to receive all future reports in paper free of charge from your insurance company. If your insurance company informs you that future reports will be delivered via Web access, you can inform your insurance company that you wish to continue receiving paper copies of your shareholder reports by following the instructions provided by your insurance company.

Table of Contents
This report must be preceded or accompanied by a prospectus. To obtain an additional prospectus or summary prospectus, if available, call (800)728-3337 or your financial representative. We advise you to consider the Fund’s objectives, risks, charges and expenses carefully before investing. The summary prospectus and prospectus contain this and other important information about the Fund. Please read the prospectus carefully before you invest.
You could lose money by investing in the Fund. Although the Fund seeks to preserve the value of your investment at $1.00 per share, it cannot guarantee it will do so. An investment in the Fund is not insured or guaranteed by the Federal Deposit Insurance Corporation or any other government agency. The Fund’s sponsor has no legal obligation to provide financial support to the Fund, and you should not expect that the sponsor will provide financial support to the Fund at any time.You should not rely on or expect the Advisor to enter into support agreements or take other actions to maintain the Fund’s $1.00 share price. The credit quality of the Fund’s holdings can change rapidly in certain markets, and the default of a single holding could have an adverse impact on the Fund’s share price. The Fund’s share price can also be negatively affected during periods of high redemption pressures and/or illiquid markets. The actions of a few large investors in the Fund may have a significant adverse effect on the share price of the Fund. Please read the prospectus for specific details regarding the Fund’s risk profile.
The brand DWS represents DWS Group GmbH & Co. KGaA and any of its subsidiaries such as DWS Distributors, Inc. which offers investment products or DWS Investment Management Americas, Inc. and RREEF America L.L.C. which offer advisory services.
DWS Distributors, Inc., 222 South Riverside Plaza, Chicago, IL 60606, (800)621-1148
NOT FDIC/NCUA INSURED NO BANK GUARANTEE MAY LOSE VALUE NOT A DEPOSIT
NOT INSURED BY ANY FEDERAL GOVERNMENT AGENCY
| 2 | | | Deutsche DWS Variable Series II — DWS Government Money Market VIP |
Table of Contents
| Portfolio Summary | (Unaudited) |
| Asset Allocation (As a % of Investment Portfolio) | 6/30/19 | 12/31/18 | ||||||
| Government & Agency Obligations | 59% | 62% | ||||||
| Repurchase Agreement | 41% | 38% | ||||||
| 100% | 100% | |||||||
| Weighted Average Maturity | 6/30/19 | 12/31/18 | ||||||
| Deutsche DWS Variable Series II — DWS Government Money Market VIP | 29 days | 25 days | ||||||
| Government & Agency Retail Money Fund Average* | 27 days | 28 days | ||||||
| * | The Fund is compared to its respective iMoneyNet Category: Government & Agency Retail Money Fund Average — Category includes the most broadly based of the government retail funds. These funds may invest in U.S. Treasury securities, securities issued or guaranteed by the U.S. Government or its agencies or instrumentalities. |
Weighted average maturity, also known as effective maturity, is the weighted average of the maturity date of bonds held by the Fund taking into consideration any available maturity shortening features.
Portfolio holdings and characteristics are subject to change.
For more complete details about the Fund’s investment portfolio, see page 4.
Following the Fund’s fiscal first and thirdquarter-end, a complete portfolio holdings listing was filed with the SEC on FormN-Q. Effective from and after the Fund’s third fiscal quarter-end of 2019, Form N-Q is rescinded and will not be filed with the SEC. In addition, each month, information about the Fund and its portfolio holdings is filed with the SEC on FormN-MFP. The SEC delays the public availability of the information filed on FormN-MFP for 60 days after the end of the reporting period included in the filing. These forms will be available on the SEC’s Web site at sec.gov. The Fund’s portfolio holdings are also posted on dws.com as of each month-end. Please see the Fund’s current prospectus for more information.
A group of investment professionals is responsible for the day-to-day management of the Fund. These investment professionals have a broad range of experience managing money market funds.
Deutsche DWS Variable Series II — DWS Government Money Market VIP | | | 3 |
Table of Contents
| Investment Portfolio | June 30, 2019 (Unaudited) |
| Principal Amount ($) | Value ($) | |||||||
| Government & Agency Obligations 59.8% |
| |||||||
| U.S. Government Sponsored Agencies 56.7% |
| |||||||
Federal Farm Credit Bank: | ||||||||
1-month LIBOR minus 0.123%, 2.288%*, 8/13/2019 | 1,000,000 | 1,000,000 | ||||||
1-month LIBOR minus 0.095%, 2.309%*, 7/25/2019 | 1,000,000 | 999,999 | ||||||
1-month LIBOR minus 0.035%, 2.348%*, 8/20/2020 | 1,500,000 | 1,500,000 | ||||||
1-month LIBOR minus 0.050%, 2.354%*, 2/25/2020 | 500,000 | 499,985 | ||||||
1-month LIBOR minus 0.075%, 2.355%*, 11/5/2019 | 1,000,000 | 999,965 | ||||||
1-month LIBOR minus 0.050%, 2.381%*, 2/4/2020 | 1,180,000 | 1,180,000 | ||||||
3-month LIBOR minus 0.18%, 2.399%*, 11/1/2019 | 500,000 | 500,000 | ||||||
1-month LIBOR minus 0.025%, 2.403%*, 5/29/2020 | 500,000 | 499,977 | ||||||
1-month LIBOR minus 0.020%, 2.409%*, 4/30/2020 | 2,000,000 | 2,000,000 | ||||||
2.626%**, 8/21/2019 | 350,000 | 348,716 | ||||||
Federal Home Loan Bank: | ||||||||
3-month LIBOR minus 0.230%, 2.29%*, 12/3/2019 | 500,000 | 500,000 | ||||||
1-month LIBOR minus 0.085%, 2.326%*, 9/13/2019 | 1,300,000 | 1,300,000 | ||||||
3-month LIBOR minus 0.190%, 2.331%*, 8/28/2019 | 1,000,000 | 1,000,000 | ||||||
3-month LIBOR minus 0.195%, 2.333%*, 2/14/2020 | 1,000,000 | 1,000,000 | ||||||
1-month LIBOR minus 0.065%, 2.337%*, 8/28/2019 | 500,000 | 500,000 | ||||||
1-month LIBOR minus 0.055%, 2.346%*, 1/14/2020 | 500,000 | 500,000 | ||||||
1-month LIBOR minus 0.025%, 2.358%*, 4/20/2020 | 1,250,000 | 1,250,000 | ||||||
1-month LIBOR minus 0.060%, 2.361%*, 12/6/2019 | 500,000 | 500,000 | ||||||
3-month LIBOR minus 0.200%, 2.384%*, 1/10/2020 | 1,000,000 | 1,000,000 | ||||||
1-month LIBOR minus 0.020%, 2.393%*, 5/12/2020 | 750,000 | 750,000 | ||||||
3-month LIBOR minus 0.020%, 2.401%*, 1/16/2020 | 1,000,000 | 1,000,000 | ||||||
2.406%**, 11/15/2019 | 2,500,000 | 2,477,424 | ||||||
2.411%**, 8/14/2019 | 2,000,000 | 1,994,187 | ||||||
1-month LIBOR minus 0.010%, 2.43%*, 9/1/2020 | 650,000 | 650,000 | ||||||
SOFR plus 0.040%, | 1,000,000 | 1,000,000 | ||||||
2.443%**, 8/15/2019 | 2,000,000 | 1,993,975 | ||||||
SOFR plus 0.025%, | 1,500,000 | 1,500,000 | ||||||
SOFR plus 0.030%, | 1,000,000 | 1,000,000 | ||||||
SOFR plus 0.035%, | 1,000,000 | 1,000,000 | ||||||
SOFR plus 0.035%, | 1,000,000 | 1,000,000 | ||||||
SOFR plus 0.035%, | 1,250,000 | 1,250,000 | ||||||
SOFR plus 0.060%, | 500,000 | 500,000 | ||||||
SOFR plus 0.065%, | 750,000 | 750,000 | ||||||
2.486%**, 9/11/2019 | 2,000,000 | 1,990,192 | ||||||
| Principal Amount ($) | Value ($) | |||||||
SOFR plus 0.105%, 2.525%*, 10/1/2020 | 500,000 | 500,000 | ||||||
2.58%, 3/30/2020 | 2,500,000 | 2,500,000 | ||||||
2.596%**, 7/29/2019 | 1,250,000 | 1,247,511 | ||||||
Federal Home Loan Mortgage Corp.: | ||||||||
1-month LIBOR minus 0.100%, 2.312%*, 8/8/2019 | 2,500,000 | 2,499,950 | ||||||
2.4%, 6/12/2020 | 500,000 | 500,000 | ||||||
SOFR minus 0.010%, | 1,500,000 | 1,500,000 | ||||||
SOFR plus 0.010%, | 1,000,000 | 1,000,000 | ||||||
SOFR plus 0.010%, | 1,500,000 | 1,500,000 | ||||||
SOFR plus 0.020%, | 1,000,000 | 1,000,000 | ||||||
SOFR plus 0.030%, | 750,000 | 750,000 | ||||||
SOFR plus 0.030%, | 2,250,000 | 2,250,000 | ||||||
2.5%, 5/22/2020 | 1,000,000 | 1,000,000 | ||||||
Federal National Mortgage Association: | ||||||||
SOFR plus 0.060%, | 400,000 | 400,000 | ||||||
SOFR plus 0.070%, | 250,000 | 250,000 | ||||||
SOFR plus 0.075%, | 750,000 | 750,000 | ||||||
SOFR plus 0.10%, | 250,000 | 250,000 | ||||||
|
| |||||||
| 53,831,881 | ||||||||
| U.S. Treasury Obligation 3.1% |
| |||||||
U.S. Treasury Bill, | 3,000,000 | 2,980,810 | ||||||
Total Government & Agency Obligations (Cost $56,812,691) | 56,812,691 | |||||||
| Repurchase Agreements 42.1% |
| |||||||
BNP Paribas, 2.48%, dated 6/29/2019, to be repurchased at $19,902,742 on 7/1/2019 (a) | 19,900,000 | 19,900,000 | ||||||
Wells Fargo Bank, 2.52%, dated 6/29/2019, to be repurchased at $20,100,814 on 7/1/2019 (b) | 20,098,000 | 20,098,000 | ||||||
Total Repurchase Agreements (Cost $39,998,000) | 39,998,000 | |||||||
| % of Net Assets | Value ($) | |||||||
Total Investment Portfolio | 101.9 | 96,810,691 | ||||||
| Other Assets and Liabilities, Net | (1.9 | ) | (1,794,530 | ) | ||||
| Net Assets | 100.0 | 95,016,161 | ||||||
| * | Floating rate security. These securities are shown at their current rate as of June 30, 2019. |
| ** | Annualized yield at time of purchase; not a coupon rate. |
The accompanying notes are an integral part of the financial statements.
| 4 | | | Deutsche DWS Variable Series II — DWS Government Money Market VIP |
Table of Contents
(a) Collateralized by:
| Principal Amount ($) | Security | Rate (%) | Maturity Date | Collateral Value ($) | ||||||||||
| 600 | U.S. Treasury Bills | Zero Coupon | 07/18/2019 | 599 | ||||||||||
| 19,256,000 | U.S. Treasury Notes | 2.75 | 02/15/2024 | 20,297,434 | ||||||||||
| Total Collateral Value | 20,298,033 | |||||||||||||
(b) Collateralized by:
| Principal Amount ($) | Security | Rate (%) | Maturity Date | Collateral Value ($) | ||||||||||
| 2,508,258 | Federal Home Loan Mortgage Corp. | 3–4.5 | 4/1/2034–5/1/2049 | 2,578,487 | ||||||||||
| 17,400,891 | Federal National Mortgage Association | 2.5–5 | 6/1/2029–6/1/2049 | 17,921,473 | ||||||||||
| Total Collateral Value | 20,499,960 | |||||||||||||
LIBOR: London Interbank Offered Rate
SOFR : Secured Overnight Mortgage Association
Fair Value Measurements
Various inputs are used in determining the value of the Fund’s investments. These inputs are summarized in three broad levels. Level 1 includes quoted prices in active markets for identical securities. Level 2 includes other significant observable inputs (including quoted prices for similar securities, interest rates, prepayment speeds and credit risk). Level 3 includes significant unobservable inputs (including the Fund’s own assumptions in determining the fair value of investments). The level assigned to the securities valuations may not be an indication of the risk or liquidity associated with investing in those securities. Securities held by the Fund are reflected as Level 2 because the securities are valued at amortized cost (which approximates fair value) and, accordingly, the inputs used to determine value are not quoted prices in an active market.
The following is a summary of the inputs used as of June 30, 2019 in valuing the Fund’s investments. For information on the Fund’s policy regarding the valuation of investments, please refer to the Security Valuation section of Note A in the accompanying Notes to Financial Statements.
| Assets | Level 1 | Level 2 | Level 3 | Total | ||||||||||||
| Investments in Securities (c) | $ | — | $ | 56,812,691 | $ | — | $ | 56,812,691 | ||||||||
| Repurchase Agreements | — | 39,998,000 | — | 39,998,000 | ||||||||||||
| Total | $ | — | $ | 96,810,691 | $ | — | $ | 96,810,691 | ||||||||
| (c) | See Investment Portfolio for additional detailed categorizations. |
The accompanying notes are an integral part of the financial statements.
Deutsche DWS Variable Series II — DWS Government Money Market VIP | | | 5 |
Table of Contents
Statement of Assets and Liabilities
| as of June 30, 2019 (Unaudited) |
| |||
| Assets |
| |||
| Investments in securities, valued at amortized cost | $ | 56,812,691 | ||
| Repurchase Agreements, valued at amortized cost | 39,998,000 | |||
| Cash | 6,201 | |||
| Receivable for Fund shares sold | 41,866 | |||
| Interest receivable | 124,816 | |||
| Other assets | 1,426 | |||
| Total assets | 96,985,000 | |||
| Liabilities | ||||
| Payable for Fund shares redeemed | 1,795,121 | |||
| Distributions payable | 67,740 | |||
| Accrued management fee | 18,928 | |||
| Accrued Trustees’ fees | 518 | |||
| Other accrued expenses and payables | 86,532 | |||
| Total liabilities | 1,968,839 | |||
| Net assets, at value | $ | 95,016,161 | ||
| Net Assets Consist of | ||||
| Distributable earnings (loss) | 14,868 | |||
| Paid-in capital | 95,001,293 | |||
| Net assets, at value | $ | 95,016,161 | ||
Class A Net Asset Value | ||||
| Net asset value, offering and redemption price per share ($95,016,161 ÷ 95,085,008 outstanding shares of beneficial interest, no par value, unlimited number of shares authorized) | $ | 1.00 | ||
for the six months ended June 30, 2019 (Unaudited) |
| |||
| Investment Income | ||||
| Income: | ||||
| Interest | $ | 1,202,428 | ||
| Expenses: | ||||
| Management fee | 114,948 | |||
| Administration fee | 48,914 | |||
| Services to Shareholders | 1,105 | |||
| Custodian fee | 3,020 | |||
| Professional fees | 27,611 | |||
| Reports to shareholders | 40,705 | |||
| Trustees’ fees and expenses | 3,285 | |||
| Other | 5,943 | |||
| Total expenses before expense reductions | 245,531 | |||
| Expense reductions | (120 | ) | ||
| Total expenses after expense reductions | 245,411 | |||
| Net investment income | 957,017 | |||
| Net realized gain (loss) from investments | 42 | |||
| Net increase (decrease) in net assets resulting from operations | $ | 957,059 | ||
The accompanying notes are an integral part of the financial statements.
| 6 | | | Deutsche DWS Variable Series II — DWS Government Money Market VIP |
Table of Contents
Statements of Changes in Net Assets
| Increase (Decrease) in Net Assets | Six Months Ended June 30, 2019 (Unaudited) | Year Ended December 31, 2018 | ||||||
| Operations: | ||||||||
| Net investment income (loss) | $ | 957,017 | $ | 1,437,915 | ||||
| Net realized gain (loss) | 42 | (141 | ) | |||||
| Net increase (decrease) in net assets resulting from operations | 957,059 | 1,437,774 | ||||||
| Distributions to shareholders : | ||||||||
Class A | (956,953 | ) | (1,437,977 | ) | ||||
| Fund share transactions: | ||||||||
Class A | ||||||||
| Proceeds from shares sold | 37,490,408 | 122,763,991 | ||||||
| Reinvestment of distributions | 968,351 | 1,393,905 | ||||||
| Payments for shares redeemed | (50,622,480 | ) | (128,197,879 | ) | ||||
| Net increase (decrease) in net assets from Class A share transactions | (12,163,721 | ) | (4,039,983 | ) | ||||
| Increase (decrease) in net assets | (12,163,615 | ) | (4,040,186 | ) | ||||
| Net assets at beginning of period | 107,179,776 | 111,219,962 | ||||||
| Net assets at end of period | $ | 95,016,161 | $ | 107,179,776 | ||||
| Other Information: | ||||||||
Class A | ||||||||
| Shares outstanding at beginning of period | 107,248,730 | 111,288,713 | ||||||
| Shares sold | 37,490,407 | 122,763,991 | ||||||
| Shares issued to shareholders in reinvestment of distributions | 968,351 | 1,393,905 | ||||||
| Shares redeemed | (50,622,480 | ) | (128,197,879 | ) | ||||
| Net increase (decrease) in Fund shares | (12,163,722 | ) | (4,039,983 | ) | ||||
| Shares outstanding at end of period | 95,085,008 | 107,248,730 | ||||||
The accompanying notes are an integral part of the financial statements.
Deutsche DWS Variable Series II — DWS Government Money Market VIP | | | 7 |
Table of Contents
| Six Months Ended 6/30/19 | Years Ended December 31, | |||||||||||||||||||||||
| Class A | (Unaudited) | 2018 | 2017 | 2016 | 2015 | 2014 | ||||||||||||||||||
| Selected Per Share Data | ||||||||||||||||||||||||
| Net asset value, beginning of period | $ | 1.00 | $ | 1.00 | $ | 1.00 | $ | 1.00 | $ | 1.00 | $ | 1.00 | ||||||||||||
| Income from investment operations: | ||||||||||||||||||||||||
Net investment income | .010 | .014 | .005 | .001 | b | .000 | *** | .000 | *** | |||||||||||||||
Net realized gain (loss) | .000 | *** | (.000 | )*** | .000 | *** | .000 | *** | (.000 | )*** | .000 | *** | ||||||||||||
Total from investment operations | .010 | .014 | .005 | .001 | .000 | *** | .000 | *** | ||||||||||||||||
| Less distributions from: | ||||||||||||||||||||||||
Net investment income | (.010 | ) | (.014 | ) | (.005 | ) | (.001 | ) | (.000 | )*** | (.000 | )*** | ||||||||||||
| Net asset value, end of period | $ | 1.00 | $ | 1.00 | $ | 1.00 | $ | 1.00 | $ | 1.00 | $ | 1.00 | ||||||||||||
| Total Return (%) | .97 | a** | 1.39 | a | .45 | .05 | a,b | .01 | a | .01 | a | |||||||||||||
| Ratios to Average Net Assets and Supplemental Data | ||||||||||||||||||||||||
| Net assets, end of period ($ millions) | 95 | 107 | 111 | 122 | 134 | 177 | ||||||||||||||||||
| Ratio of expenses before expense reductions (%)c | .50 | * | .50 | .48 | .51 | .49 | .49 | |||||||||||||||||
| Ratio of expenses after expense reductions (%)c | .50 | * | .50 | .48 | .44 | .25 | .18 | |||||||||||||||||
| Ratio of net investment income (%) | 1.96 | * | 1.37 | .45 | .05 | b | .01 | .01 | ||||||||||||||||
| a | Total return would have been lower had certain expenses not been reduced. |
| b | Includes anon-recurring payment for overbilling of prior years’ custodianout-of-pocket fees. Excluding this payment, net investment income per share, total return, and ratio of net investment income to average net assets would have been reduced by $0.0004, 0.04%, and 0.04%, respectively. |
| c | Expense ratio does not reflect charges and fees associated with the separate account that invests in the Fund or any variable life insurance policy or variable annuity contract for which the Fund is an investment option. |
| * | Annualized |
| ** | Not annualized |
| *** | Amount is less than $.0005. |
The accompanying notes are an integral part of the financial statements.
| 8 | | | Deutsche DWS Variable Series II — DWS Government Money Market VIP |
Table of Contents
| Notes to Financial Statements | (Unaudited) |
A. Organization and Significant Accounting Policies
DWS Government Money Market VIP (the “Fund”) is a diversified series of Deutsche DWS Variable Series II (the “Trust”), which is registered under the Investment Company Act of 1940, as amended (the “1940 Act”), as anopen-end management investment company organized as a Massachusetts business trust.
The Fund’s financial statements are prepared in accordance with accounting principles generally accepted in the United States of America (“U.S. GAAP”) which require the use of management estimates. Actual results could differ from those estimates. The Fund qualifies as an investment company under Topic 946 of Accounting Standards Codification of U.S. GAAP. The policies described below are followed consistently by the Fund in the preparation of its financial statements.
Security Valuation. Various inputs are used in determining the value of the Fund’s investments. These inputs are summarized in three broad levels. Level 1 includes quoted prices in active markets for identical securities. Level 2 includes other significant observable inputs (including quoted prices for similar securities, interest rates, prepayment speeds and credit risk). Level 3 includes significant unobservable inputs (including the Fund’s own assumptions in determining the fair value of investments). The level assigned to the securities valuations may not be an indication of the risk or liquidity associated with investing in those securities.
The Fund values all securities utilizing the amortized cost method permitted in accordance with Rule2a-7 under the 1940 Act and certain conditions therein. Under this method, which does not take into account unrealized capital gains or losses on securities, an instrument is initially valued at its cost and thereafter assumes a constant accretion/amortization rate to maturity of any discount or premium. Securities held by the Fund are reflected as Level 2 because the securities are valued at amortized cost (which approximates fair value) and, accordingly, the inputs used to determine value are not quoted prices in an active market.
Disclosure about the classification of fair value measurements is included in a table following the Fund’s Investment Portfolio.
Repurchase Agreements. The Fund may enter into repurchase agreements, under the terms of a Master Repurchase Agreement, with certain banks and broker/dealers whereby the Fund, through its custodian or asub-custodian bank, receives delivery of the underlying securities, the amount of which at the time of purchase and each subsequent business day is required to be maintained at such a level that the value is equal to at least the principal amount of the repurchase price plus accrued interest. The custodian bank or another designatedsub-custodian holds the collateral in a separate account until the agreement matures. If the value of the securities falls below the principal amount of the repurchase agreement plus accrued interest, the financial institution deposits additional collateral by the following business day. If the financial institution either fails to deposit the required additional collateral or fails to repurchase the securities as agreed, the Fund has the right to sell the securities and recover any resulting loss from the financial institution. If the financial institution enters into bankruptcy, the Fund’s claim on the collateral may be subject to legal proceedings.
As of June 30, 2019, the Fund held repurchase agreements with a gross value of $39,998,000. The value of the related collateral exceeded the value of the repurchase agreements at period end. The detail of the related collateral is included in the footnotes following the Fund’s Investment Portfolio.
Federal Income Taxes. The Fund’s policy is to comply with the requirements of the Internal Revenue Code, as amended, which are applicable to regulated investment companies and to distribute all of its taxable income to its shareholders.
At December 31, 2018, the Fund had $141 of short-term tax basis capital loss carryforwards, which maybe applied against realized net taxable capital gains indefinitely.
At June 30, 2019, the aggregate cost of investments for federal income tax purposes was $96,810,691.
The Fund has reviewed the tax positions for the open tax years as of December 31, 2018 and has determined that no provision for income tax and/or uncertain tax positions is required in the Fund’s financial statements. The Fund’s federal tax returns for the prior three fiscal years remain open subject to examination by the Internal Revenue Service.
Distribution of Income and Gains. Net investment income of the Fund is declared as a daily dividend and is distributed to shareholders monthly. The Fund may take into account capital gains and losses in its daily dividend declarations. The Fund may also make additional distributions for tax purposes if necessary.
Deutsche DWS Variable Series II — DWS Government Money Market VIP | | | 9 |
Table of Contents
Permanent book and tax differences relating to shareholder distributions will result in reclassifications topaid-in capital. Temporary book and tax differences will reverse in a subsequent period. There were no significant book to tax differences for the Fund.
The tax character of current year distributions will be determined at the end of the current fiscal year.
Expenses. Expenses of the Trust arising in connection with a specific fund are allocated to that fund. Other Trust expenses which cannot be directly attributed to a fund are apportioned among the funds in the Trust based upon the relative net assets or other appropriate measures.
Contingencies. In the normal course of business, the Fund may enter into contracts with service providers that contain general indemnification clauses. The Fund’s maximum exposure under these arrangements is unknown, as this would involve future claims that may be made against the Fund that have not yet been made. However, based on experience, the Fund expects the risk of loss to be remote.
Other. Investment transactions are accounted for on a trade date. Interest income is recorded on the accrual basis. Realized gains and losses from investment transactions are recorded on an identified cost basis. All discounts and premiums are accreted/amortized for both tax and financial reporting purposes.
B. Related Parties
Management Agreement. Under the Investment Management Agreement with DWS Investment Management Americas, Inc. (“DIMA” or the “Advisor”), an indirect, wholly owned subsidiary of DWS Group GmbH & Co. KGaA (“DWS Group”), the Advisor directs the investments of the Fund in accordance with its investment objectives, policies and restrictions. The Advisor determines the securities, instruments and other contracts relating to investments to be purchased, sold or entered into by the Fund.
Pursuant to the Investment Management Agreement with the Advisor, the Fund pays the Advisor a monthly management fee based on its average daily net assets, computed and accrued daily and payable monthly, at the following annual rates:
| First $500 million | .235 | % | ||
| Next $500 million | .220 | % | ||
| Next $1.0 billion | .205 | % | ||
| Over $2.0 billion | .190 | % |
Accordingly, for the six months ended June 30, 2019, the fee pursuant to the Investment Management Agreement was equivalent to an annualized rate (exclusive of any applicable waivers/reimbursements) of 0.235% of the Fund’s average daily net assets.
For the period from January 1, 2019 through September 30, 2019, the Advisor has contractually agreed to waive its fee and/or reimburse certain operating expenses to the extent necessary to maintain the total annual operating expenses (excluding certain expenses such as extraordinary expenses, taxes, brokerage and interest expense) at 0.51%.
For the six months ended June 30, 2019, fees waived and/or expenses reimbursed amounted to $120.
Administration Fee. Pursuant to an Administrative Services Agreement, DIMA provides most administrative services to the Fund. For all services provided under the Administrative Services Agreement, the Fund pays DIMA an annual fee (“Administration Fee”) of 0.10% of the Fund’s average daily net assets, computed and accrued daily and payable monthly. For the six months ended June 30, 2019 the Administration Fee was $48,914, of which $8,055 is unpaid.
Service Provider Fees. DWS Service Company (“DSC”), an affiliate of the Advisor, is the transfer agent,dividend-paying agent and shareholder service agent for the Fund. Pursuant to asub-transfer agency agreement between DSC and DST Systems, Inc. (“DST”), DSC has delegated certain transfer agent,dividend-paying agent and shareholder service agent functions to DST. DSC compensates DST out of the shareholder servicing fee it receives from the Fund. For the six months ended June 30, 2019, the amounts charged to the Fund by DSC aggregated $923, of which $182 is unpaid.
Typesetting and Filing Service Fees. Under an agreement with the fund, DIMA is compensated for providing certainpre-press and regulatory filing services to the Fund. For the six months ended June 30, 2019, the amount charged to the Fund by DIMA included in the Statement of Operations under “Reports to shareholders” aggregated $4,288, all of which is unpaid.
| 10 | | | Deutsche DWS Variable Series II — DWS Government Money Market VIP |
Table of Contents
Trustees’ Fees and Expenses. The Fund paid retainer fees to each Trustee not affiliated with the Advisor, plus specified amounts to the Board Chairperson and to each committee Chairperson.
C. Ownership of the Fund
At June 30, 2019, three participating insurance companies were owners of record of 10% or more of the total outstanding Class A shares of the Fund, each owning 43%, 19% and 18%.
D. Line of Credit
The Fund and other affiliated funds (the “Participants”) share in a $400 million revolving credit facility provided by a syndication of banks. The Fund may borrow for temporary or emergency purposes, including the meeting of redemption requests that otherwise might require the untimely disposition of securities. The Participants are charged an annual commitment fee which is allocated based on net assets, among each of the Participants. Interest is calculated at a rate per annum equal to the sum of the Federal Funds Rate, plus 1.25 percent plus if theone-month LIBOR exceeds the Federal Funds Rate, the amount of such excess. The Fund may borrow up to a maximum of 33 percent of its net assets under the agreement. The Fund had no outstanding loans at June 30, 2019.
Deutsche DWS Variable Series II — DWS Government Money Market VIP | | | 11 |
Table of Contents
| Information About Your Fund’s Expenses | (Unaudited) |
As an investor of the Fund, you incur two types of costs: ongoing expenses and transaction costs. Ongoing expenses include management fees and other Fund expenses. Examples of transaction costs include contract charges, which are not shown in this section. The following tables are intended to help you understand your ongoing expenses (in dollars) of investing in the Fund and to help you compare these expenses with the ongoing expenses of investing in other mutual funds. In the most recent six-month period the Fund limited these expenses; had it not done so, expenses would have been higher. The example in the table is based on an investment of $1,000 invested at the beginning of thesix-month period and held for the entire period (January 1, 2019 to June 30, 2019).
The tables illustrate your Fund’s expenses in two ways:
| – | Actual Fund Return. This helps you estimate the actual dollar amount of ongoing expenses (but not transaction costs) paid on a $1,000 investment in the Fund using the Fund’s actual return during the period. To estimate the expenses you paid over the period, simply divide your account value by $1,000 (for example, an $8,600 account value divided by $1,000 = 8.6), then multiply the result by the number in the “Expenses Paid per $1,000” line under the share class you hold. |
| – | Hypothetical 5% Fund Return. This helps you to compare your Fund’s ongoing expenses (but not transaction costs) with those of other mutual funds using the Fund’s actual expense ratio and a hypothetical rate of return of 5% per year before expenses. Examples using a 5% hypothetical Fund return may be found in the shareholder reports of other mutual funds. The hypothetical account values and expenses may not be used to estimate the actual ending account balance or expenses you paid for the period. |
Please note that the expenses shown in these tables are meant to highlight your ongoing expenses only and do not reflect any transaction costs. The “Expenses Paid per $1,000” line of the tables is useful in comparing ongoing expenses only and will not help you determine the relative total expense of owning different funds. If these transaction costs had been included, your costs would have been higher.
| Expenses and Value of a $1,000 Investment for the six months ended June 30, 2019 | ||||
| Actual Fund Return | Class A | |||
| Beginning Account Value 1/1/19 | $ | 1,000.00 | ||
| Ending Account Value 6/30/19 | $ | 1,009.70 | ||
| Expenses Paid per $1,000* | $ | 2.49 | ||
| Hypothetical 5% Fund Return | Class A | |||
| Beginning Account Value 1/1/19 | $ | 1,000.00 | ||
| Ending Account Value 6/30/19 | $ | 1,022.32 | ||
| Expenses Paid per $1,000* | $ | 2.51 | ||
| * | Expenses are equal to the Fund’s annualized expense ratio, multiplied by the average account value over the period, multiplied by 181 (the number of days in the most recentsix-month period), then divided by 365. |
| Annualized Expense Ratio | Class A | |||
| Deutsche DWS Variable Series II — DWS Government Money Market VIP | .50 | % | ||
For more information, please refer to the Fund’s prospectus.
These tables do not reflect charges and fees (“contract charges”) associated with the separate account that invests in the Fund or any variable life insurance policy or variable annuity contract for which the Fund is an investment option.
For an analysis of the fees associated with an investment in the Fund or similar funds, please refer to the current and hypothetical expense calculators for Variable Insurance Products which can be found at dws.com/calculators.
| 12 | | | Deutsche DWS Variable Series II — DWS Government Money Market VIP |
Table of Contents
The Trust’s policies and procedures for voting proxies for portfolio securities and information about how the Trust voted proxies related to its portfolio securities during the most recent12-month period ended June 30 are available on our Web site — dws.com/en-us/resources/proxy-voting — or on the SEC’s Web site — sec.gov. To obtain a written copy of the Trust’s policies and procedures without charge, upon request, call us toll free at (800)728-3337.
Deutsche DWS Variable Series II — DWS Government Money Market VIP | | | 13 |
Table of Contents
Advisory Agreement Board Considerations and Fee Evaluation
The Board of Trustees (hereinafter referred to as the “Board” or “Trustees”) approved the renewal of DWS Government Money Market VIP’s (the “Fund”) investment management agreement (the “Agreement”) with DWS Investment Management Americas, Inc. (“DIMA”) in September 2018.
In terms of the process that the Board followed prior to approving the Agreement, shareholders should know that:
| – | During the entire process, all of the Fund’s Trustees were independent of DIMA and its affiliates (the “Independent Trustees”). |
| – | The Board met frequently during the past year to discuss fund matters and dedicated a substantial amount of time to contract review matters. Over the course of several months, the Board’s Contract Committee reviewed extensive materials received from DIMA, independent third parties and independent counsel. These materials included an analysis of the Fund’s performance, fees and expenses, and profitability from a fee consultant retained by the Fund’s Independent Trustees (the “Fee Consultant”). Based on its evaluation of the information provided, the Contract Committee presented its findings and recommendations to the Board. The Board then reviewed the Contract Committee’s findings and recommendations. |
| – | The Board also received extensive information throughout the year regarding performance of the Fund. |
| – | The Independent Trustees regularly met privately with counsel to discuss contract review and other matters. In addition, the Independent Trustees were advised by the Fee Consultant in the course of their review of the Fund’s contractual arrangements and considered a comprehensive report prepared by the Fee Consultant in connection with their deliberations. |
| – | In connection with reviewing the Agreement, the Board also reviewed the terms of the Fund’s distribution agreement, administrative services agreement, transfer agency agreement and other material service agreements. |
In connection with the contract review process, the Contract Committee and the Board considered the factors discussed below, among others. The Board also considered that DIMA and its predecessors have managed the Fund since its inception, and the Board believes that a long-term relationship with a capable, conscientious advisor is in the best interests of the Fund. The Board considered, generally, that shareholders chose to invest or remain invested in the Fund knowing that DIMA managed the Fund. DIMA is part of DWS Group GmbH & Co. KGaA (“DWS Group”). DWS Group is a global asset management business that offers a wide range of investing expertise and resources, including research capabilities in many countries throughout the world. In 2018, approximately 20% of DWS Group’s shares were sold in an initial public offering, with Deutsche Bank AG owning the remaining shares.
As part of the contract review process, the Board carefully considered the fees and expenses of each DWS fund overseen by the Board in light of the fund’s performance. In many cases, this led to the negotiation and implementation of expense caps. As part of these negotiations, the Board indicated that it would consider relaxing these caps in future years following sustained improvements in performance, among other considerations.
While shareholders may focus primarily on fund performance and fees, the Fund’s Board considers these and many other factors, including the quality and integrity of DIMA’s personnel and administrative support services provided by DIMA, such as back-office operations, fund valuations, and compliance policies and procedures.
Nature, Quality and Extent of Services.The Board considered the terms of the Agreement, including the scope of advisory services provided under the Agreement. The Board noted that, under the Agreement, DIMA provides portfolio management services to the Fund and that, pursuant to a separate administrative services agreement, DIMA provides administrative services to the Fund. The Board considered the experience and skills of senior management and investment personnel and the resources made available to such personnel. The Board reviewed the Fund’s performance over short-term and long-term periods and compared those returns to various agreed-upon performance measures, including a peer universe compiled using information supplied by iMoneyNet, an independent fund data service. The Board also noted that it has put into place a process of identifying “Funds in Review” (e.g., funds performing poorly relative to a peer universe), and receives additional reporting from DIMA regarding such funds and, where appropriate, DIMA’s plans to address underperformance. The Board believes this process is an effective manner of identifying
| 14 | | | Deutsche DWS Variable Series II — DWS Government Money Market VIP |
Table of Contents
and addressing underperforming funds. Based on the information provided, the Board noted that, for theone- and three-year periods ended December 31, 2017, the Fund’s gross performance (Class A shares) was in the 1st quartile of the applicable iMoneyNet universe (the 1st quartile being the best performers and the 4th quartile being the worst performers).
Fees and Expenses. The Board considered the Fund’s investment management fee schedule, operating expenses and total expense ratios, and comparative information provided by Broadridge Financial Solutions, Inc. (“Broadridge”) and the Fee Consultant regarding investment management fee rates paid to other investment advisors by similar funds (1st quartile being the most favorable and 4th quartile being the least favorable). With respect to management fees paid to other investment advisors by similar funds, the Board noted that the contractual fee rates paid by the Fund, which include a 0.10% fee paid to DIMA under the Fund’s administrative services agreement, were lower than the median (2nd quartile) of the applicable Broadridge peer group (based on Broadridge data provided as of December 31, 2017). The Board considered that the Fund’s management fee was reduced by 0.05% at all breakpoint levels in connection with the restructuring of the Fund into a government money market fund in 2016. The Board noted that the Fund’s Class A shares total (net) operating expenses were higher than the median (3rd quartile) of the applicable Broadridge expense universe (based on Broadridge data provided as of December 31, 2017, and analyzing Broadridge expense universe Class A (net) expenses less any applicable12b-1 fees). The Board noted the expense limitation agreed to by DIMA. The Board also noted the voluntary fee waivers implemented by DIMA prior to December 31, 2017 to ensure the Fund maintained a positive yield. The Board considered the Fund’s management fee rate as compared to fees charged by DIMA to comparable DWS U.S. registered funds (“DWS Funds”) and considered differences between the Fund and the comparable DWS Funds. The information requested by the Board as part of its review of fees and expenses also included information about institutional accounts (including anysub-advised funds and accounts) and funds offered primarily to European investors (“DWS Europe Funds”) managed by DWS Group. The Board noted that DIMA indicated that DWS Group does not manage any institutional accounts or DWS Europe Funds comparable to the Fund.
On the basis of the information provided, the Board concluded that management fees were reasonable and appropriate in light of the nature, quality and extent of services provided by DIMA.
Profitability. The Board reviewed detailed information regarding revenues received by DIMA under the Agreement. The Board considered the estimated costs to DIMA, andpre-tax profits realized by DIMA, from advising the DWS Funds, as well as estimates of thepre-tax profits attributable to managing the Fund in particular. The Board also received information regarding the estimated enterprise-wide profitability of DIMA and its affiliates with respect to all fund services in totality and by fund. The Board and the Fee Consultant reviewed DIMA’s methodology in allocating its costs to the management of the Fund. Based on the information provided, the Board concluded that thepre-tax profits realized by DIMA in connection with the management of the Fund were not unreasonable. The Board also reviewed certain publicly available information regarding the profitability of certain similar investment management firms. The Board noted that, while information regarding the profitability of such firms is limited (and in some cases is not necessarily prepared on a comparable basis), DIMA and its affiliates’ overall profitability with respect to the DWS Funds (after taking into account distribution and other services provided to the funds by DIMA and its affiliates) was lower than the overall profitability levels of most comparable firms for which such data was available.
Economies of Scale. The Board considered whether there are economies of scale with respect to the management of the Fund and whether the Fund benefits from any economies of scale. The Board noted that the Fund’s investment management fee schedule includes fee breakpoints. The Board concluded that the Fund’s fee schedule represents an appropriate sharing between the Fund and DIMA of such economies of scale as may exist in the management of the Fund at current asset levels.
Other Benefits to DIMA and Its Affiliates. The Board also considered the character and amount of other incidental or“fall-out” benefits received by DIMA and its affiliates, including any fees received by DIMA for administrative services provided to the Fund and any fees received by an affiliate of DIMA for transfer agency services provided to the Fund. The Board also considered benefits to DIMA related to brokerage and soft-dollar allocations, including allocating brokerage to pay for research generated by parties other than the executing broker dealers, which pertain primarily to funds investing in equity securities. In addition, the Board considered the incidental public relations benefits to DIMA related to DWS Funds advertising and cross-selling opportunities among DIMA products and services. The Board considered these benefits in reaching its conclusion that the Fund’s management fees were reasonable.
Compliance. The Board considered the significant attention and resources dedicated by DIMA to its compliance processes in recent years. The Board noted in particular (i) the experience, seniority and time
Deutsche DWS Variable Series II — DWS Government Money Market VIP | | | 15 |
Table of Contents
commitment of the individuals serving as DIMA’s and the Fund’s chief compliance officers and (ii) the substantial commitment of resources by DIMA and its affiliates to compliance matters, including the retention of compliance personnel.
Based on all of the information considered and the conclusions reached, the Board unanimously determined that the continuation of the Agreement is in the best interests of the Fund. In making this determination, the Board did not give particular weight to any single factor identified above. The Board considered these factors over the course of numerous meetings, certain of which were in executive session with only the Independent Trustees and counsel present. It is possible that individual Independent Trustees may have weighed these factors differently in reaching their individual decisions to approve the continuation of the Agreement.
| 16 | | | Deutsche DWS Variable Series II — DWS Government Money Market VIP |
Table of Contents
Notes
Table of Contents
Notes
Table of Contents
Notes
Table of Contents
| ||
VS2GMM-3 (R-028387-8 8/19) |
Table of Contents
June 30, 2019
Semiannual Report
Deutsche DWS Variable Series II
DWS High Income VIP
Beginning on January 1, 2021, as permitted by regulations adopted by the Securities and Exchange Commission, you may not be receiving paper copies of the Fund’s shareholder reports from the insurance company that offers your contract unless you specifically request paper copies from your insurance company or from your financial intermediary. Instead, the shareholder reports will be made available on a Web site, and your insurance company will notify you by mail each time a report is posted and provide you with a Web site link to access the report. Instructions for requesting paper copies will be provided by your insurance company.
If you already elected to receive shareholder reports electronically, you will not be affected by this change and you need not take any action. You may elect to receive shareholder reports and other communications from your insurance company electronically by following the instructions provided by your insurance company.
You may elect to receive all future reports in paper free of charge from your insurance company. If your insurance company informs you that future reports will be delivered via Web access, you can inform your insurance company that you wish to continue receiving paper copies of your shareholder reports by following the instructions provided by your insurance company.

Table of Contents
This report must be preceded or accompanied by a prospectus. To obtain an additional prospectus or summary prospectus, if available, call (800) 728-3337 or your financial representative. We advise you to consider the Fund’s objectives, risks, charges and expenses carefully before investing. The summary prospectus and prospectus contain this and other important information about the Fund. Please read the prospectus carefully before you invest.
Bond investments are subject to interest-rate, credit, liquidity and market risks to varying degrees. When interest rates rise, bond prices generally fall. Credit risk refers to the ability of an issuer to make timely payments of principal and interest. Investments in lower-quality (“junk bonds”) and non-rated securities present greater risk of loss than investments in higher-quality securities. Investing in derivatives entails special risks relating to liquidity, leverage and credit that may reduce returns and/or increase volatility. The Fund may lend securities to approved institutions. Please read the prospectus for details.
The brand DWS represents DWS Group GmbH & Co. KGaA and any of its subsidiaries such as DWS Distributors, Inc. which offers investment products or DWS Investment Management Americas, Inc. and RREEF America L.L.C. which offer advisory services.
DWS Distributors, Inc., 222 South Riverside Plaza, Chicago, IL 60606, (800) 621-1148
NOT FDIC/NCUA INSURED NO BANK GUARANTEE MAY LOSE VALUE NOT A DEPOSIT NOT INSURED BY ANY FEDERAL GOVERNMENT AGENCY
| 2 | | | Deutsche DWS Variable Series II — DWS High Income VIP |
Table of Contents
| Performance Summary | June 30, 2019 (Unaudited) |
Fund performance shown is historical, assumes reinvestment of all dividend and capital gain distributions and does not guarantee future results. Investment return and principal value fluctuate with changing market conditions so that, when redeemed, shares may be worth more or less than their original cost. Current performance may be lower or higher than the performance data quoted. Please contact your participating insurance company for the Fund’s most recent month-end performance. Performance does not reflect charges and fees (“contract charges”) associated with the separate account that invests in the Fund or any variable life insurance policy or variable annuity contract for which the Fund is an investment option. These charges and fees will reduce returns. While all share classes have the same underlying portfolio, their performance will differ.
The gross expense ratios of the Fund, as stated in the fee table of the prospectus dated May 1, 2019 are 0.94% and 1.34% for Class A and Class B shares, respectively, and may differ from the expense ratios disclosed in the Financial Highlights tables in this report.
Generally accepted accounting principles require adjustments to be made to the net assets of the Fund at period end for financial reporting purposes only, and as such, the total return based on the unadjusted net asset value per share may differ from the total return reported in the financial highlights.
Growth of an Assumed $10,000 Investment in DWS High Income VIP
| ICE BofAML US High Yield Index (formerly BofAML US High Yield Master II Constrained Index) tracks the performance of US dollar denominated below investment grade corporate debt publicly issued in the US domestic market.
Index returns do not reflect any fees or expenses and it is not possible to invest directly into an index. |
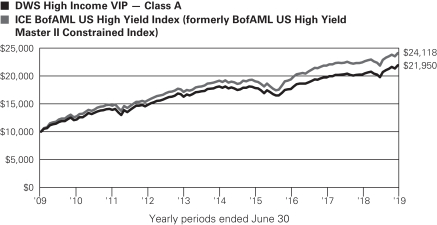
| Comparative Results | ||||||||||||
| DWS High Income VIP | 6-Month‡ | 1-Year | 3-Year | 5-Year | 10-Year | |||||||
| Class A | Growth of $10,000 | $11,086 | $10,839 | $12,409 | $12,109 | $21,950 | ||||||
| Average annual total return | 10.86% | 8.39% | 7.46% | 3.90% | 8.18% | |||||||
ICE BofAML US High Yield Index (formerly BofAML US High Yield Master II Constrained Index) | Growth of $10,000 | $11,016 | $10,758 | $12,436 | $12,584 | $24,118 | ||||||
| Average annual total return | 10.16% | 7.58% | 7.54% | 4.70% | 9.20% | |||||||
| DWS High Income VIP | 6-Month‡ | 1-Year | 3-Year | 5-Year | 10-Year | |||||||
| Class B | Growth of $10,000 | $11,072 | $10,808 | $12,325 | $11,913 | $21,323 | ||||||
| Average annual total return | 10.72% | 8.08% | 7.22% | 3.56% | 7.87% | |||||||
ICE BofAML US High Yield Index (formerly BofAML US High Yield Master II Constrained Index) | Growth of $10,000 | $11,016 | $10,758 | $12,436 | $12,584 | $24,118 | ||||||
| Average annual total return | 10.16% | 7.58% | 7.54% | 4.70% | 9.20% | |||||||
The growth of $10,000 is cumulative.
| ‡ | Total returns shown for periods less than one year are not annualized. |
Deutsche DWS Variable Series II — DWS High Income VIP | | | 3 |
Table of Contents
| Portfolio Summary | (Unaudited) |
| Asset Allocation (As a % of Investment Portfolio excluding Securities Lending Collateral) | 6/30/19 | 12/31/18 | ||||||
| Corporate Bonds | 84% | 83% | ||||||
| Cash Equivalent | 9% | 8% | ||||||
| Convertible Bonds | 3% | 3% | ||||||
| Loan Participations and Assignments | 3% | 6% | ||||||
| Common Stocks | 1% | 0% | ||||||
| Warrants | 0% | 0% | ||||||
| 100% | 100% | |||||||
| Sector Diversification (As a % of Investment Portfolio excluding Cash Equivalent and Securities Lending Collateral) | 6/30/19 | 12/31/18 | ||||||
| Communication Services | 24% | 23% | ||||||
| Energy | 17% | 22% | ||||||
| Materials | 16% | 17% | ||||||
| Consumer Discretionary | 14% | 10% | ||||||
| Health Care | 7% | 10% | ||||||
| Industrials | 6% | 7% | ||||||
| Utilities | 5% | 3% | ||||||
| Real Estate | 3% | 3% | ||||||
| Consumer Staples | 3% | 2% | ||||||
| Information Technology | 3% | 2% | ||||||
| Financials | 2% | 1% | ||||||
| 100% | 100% | |||||||
| Quality (As a % of Investment Portfolio excluding Cash Equivalent and Securities Lending Collateral) | 6/30/19 | 12/31/18 | ||||||
| BBB | 9% | 10% | ||||||
| BB | 58% | 56% | ||||||
| B | 26% | 28% | ||||||
| CCC | 3% | 2% | ||||||
| Not Rated | 4% | 4% | ||||||
| 100% | 100% | |||||||
The quality ratings represent the higher of Moody’s Investors Service, Inc. (“Moody’s”), Fitch Ratings, Inc. (“Fitch”) or Standard & Poor’s Corporation (“S&P”) credit ratings. The ratings of Moody’s, Fitch and S&P represent their opinions as to the quality of the securities they rate. Credit quality measures a bond issuer’s ability to repay interest and principal in a timely manner. Ratings are relative and subjective and are not absolute standards of quality. Credit quality does not remove market risk and is subject to change.
Portfolio holdings and characteristics are subject to change.
For more complete details about the Fund’s investment portfolio, see page 5.
Following the Fund’s fiscal first and third quarter-end, a complete portfolio holdings listing is filed with the SEC on Form N-Q or Form N-PORT (available for filings after March 31, 2019). The Fund’s Form N-Q or Form N-PORT will be available on the SEC’s Web site at sec.gov. The Fund’s portfolio holdings are also posted on dws.com from time to time. Please read the Fund’s current prospectus for more information.
Gary Russell, CFA, Managing Director
Thomas R. Bouchard, Director
Lonnie Fox, Director
Portfolio Managers
| 4 | | | Deutsche DWS Variable Series II — DWS High Income VIP |
Table of Contents
| Investment Portfolio | as of June 30, 2019 (Unaudited) |
| Principal Amount ($)(a) | Value ($) | |||||||
| Corporate Bonds 84.6% |
| |||||||
| Communication Services 20.3% |
| |||||||
Altice France SA: |
| |||||||
144A, 7.375%, 5/1/2026 | 910,000 | 932,750 | ||||||
144A, 8.125%, 2/1/2027 | 200,000 | 210,000 | ||||||
Altice Luxembourg SA: |
| |||||||
144A, 7.75%, 5/15/2022 | 200,000 | 203,250 | ||||||
144A, 10.5%, 5/15/2027 | 200,000 | 205,500 | ||||||
CCO Holdings LLC: |
| |||||||
144A, 5.0%, 2/1/2028 | 150,000 | 153,180 | ||||||
144A, 5.125%, 5/1/2027 | 125,000 | 129,420 | ||||||
144A, 5.375%, 6/1/2029 | 130,000 | 134,225 | ||||||
144A, 5.5%, 5/1/2026 | 210,000 | 219,776 | ||||||
144A, 5.875%, 4/1/2024 | 170,000 | 177,650 | ||||||
144A, 5.875%, 5/1/2027 | 200,000 | 211,000 | ||||||
CenturyLink, Inc.: |
| |||||||
5.625%, 4/1/2025 (b) | 225,000 | 229,500 | ||||||
Series W, 6.75%, 12/1/2023 | 45,000 | 48,544 | ||||||
Clear Channel Worldwide Holdings, Inc.: |
| |||||||
Series A, 6.5%, 11/15/2022 | 180,000 | 184,050 | ||||||
144A, 9.25%, 2/15/2024 | 15,000 | 16,275 | ||||||
CommScope, Inc.: |
| |||||||
144A, 5.5%, 3/1/2024 | 230,000 | 236,037 | ||||||
144A, 8.25%, 3/1/2027 (b) | 130,000 | 132,581 | ||||||
CSC Holdings LLC: |
| |||||||
144A, 5.5%, 4/15/2027 | 345,000 | 362,250 | ||||||
144A, 6.5%, 2/1/2029 | 200,000 | 218,250 | ||||||
144A, 7.5%, 4/1/2028 | 200,000 | 219,560 | ||||||
144A, 10.875%, 10/15/2025 | 230,000 | 263,637 | ||||||
Cumulus Media New Holdings, Inc., 144A, 6.75%, 7/1/2026 | 55,000 | 54,852 | ||||||
DISH DBS Corp.: |
| |||||||
5.875%, 7/15/2022 | 140,000 | 142,100 | ||||||
5.875%, 11/15/2024 | 231,000 | 218,584 | ||||||
7.75%, 7/1/2026 | 130,000 | 126,100 | ||||||
Entercom Media Corp., 144A, 6.5%, 5/1/2027 | 26,000 | 27,040 | ||||||
Frontier Communications Corp.: |
| |||||||
7.125%, 1/15/2023 | 90,000 | 53,775 | ||||||
144A, 8.0%, 4/1/2027 | 240,000 | 249,600 | ||||||
11.0%, 9/15/2025 | 80,000 | 49,600 | ||||||
GrubHub Holdings, Inc., 144A, 5.5%, 7/1/2027 | 65,000 | 66,714 | ||||||
Intelsat Connect Finance SA, 144A, 9.5%, 2/15/2023 | 90,000 | 79,650 | ||||||
Intelsat Jackson Holdings SA: |
| |||||||
144A, 8.5%, 10/15/2024 | 390,000 | 386,100 | ||||||
144A, 9.75%, 7/15/2025 | 380,000 | 387,600 | ||||||
Level 3 Financing, Inc.: |
| |||||||
5.25%, 3/15/2026 | 110,000 | 113,850 | ||||||
5.375%, 5/1/2025 | 100,000 | 103,250 | ||||||
Netflix, Inc.: |
| |||||||
4.375%, 11/15/2026 | 180,000 | 184,104 | ||||||
144A, 4.625%, 5/15/2029 | EUR 130,000 | 167,934 | ||||||
REG S, 4.625%, 5/15/2029 | EUR 100,000 | 129,180 | ||||||
5.875%, 2/15/2025 | 60,000 | 66,150 | ||||||
5.875%, 11/15/2028 | 71,000 | 78,606 | ||||||
Nexstar Escrow, Inc., 144A, 5.625%, 7/15/2027 (c) | 55,000 | 56,306 | ||||||
| Principal Amount ($)(a) | Value ($) | |||||||
Sirius XM Radio, Inc.: |
| |||||||
144A, 3.875%, 8/1/2022 | 300,000 | 300,750 | ||||||
144A, 4.625%, 5/15/2023 | 111,000 | 112,110 | ||||||
144A, 4.625%, 7/15/2024 (c) | 115,000 | 117,677 | ||||||
144A, 5.375%, 7/15/2026 | 100,000 | 103,625 | ||||||
SoftBank Group Corp., REG S, 5.0%, 4/15/2028 | EUR 100,000 | 128,869 | ||||||
Sprint Capital Corp.: |
| |||||||
6.875%, 11/15/2028 | 265,000 | 272,367 | ||||||
8.75%, 3/15/2032 | 115,000 | 133,113 | ||||||
Sprint Corp.: |
| |||||||
7.125%, 6/15/2024 | 335,000 | 355,200 | ||||||
7.625%, 3/1/2026 | 135,000 | 143,910 | ||||||
T-Mobile U.S.A., Inc.: |
| |||||||
4.75%, 2/1/2028 | 215,000 | 221,203 | ||||||
6.5%, 1/15/2026 | 85,000 | 91,890 | ||||||
T-Mobile USA, Inc., 5.125%, 4/15/2025 | 75,000 | 78,059 | ||||||
Telecom Italia Capital SA, 6.375%, 11/15/2033 | 80,000 | 83,000 | ||||||
Telecom Italia SpA, 144A, 5.303%, 5/30/2024 | 200,000 | 207,000 | ||||||
Telefonica Europe BV, REG S, 7.625%, Perpetual (d) | EUR 100,000 | 130,771 | ||||||
Telesat Canada, 144A, 8.875%, 11/15/2024 | 130,000 | 140,725 | ||||||
Unitymedia Hessen GmbH & Co., KG, 144A, 5.0%, 1/15/2025 | 225,000 | 231,750 | ||||||
ViaSat, Inc.: |
| |||||||
144A, 5.625%, 9/15/2025 | 55,000 | 54,038 | ||||||
144A, 5.625%, 4/15/2027 | 120,000 | 124,800 | ||||||
Virgin Media Secured Finance PLC: |
| |||||||
144A, 5.25%, 1/15/2026 | 200,000 | 204,942 | ||||||
144A, 5.5%, 8/15/2026 | 215,000 | 222,794 | ||||||
144A, 5.5%, 5/15/2029 (c) | 345,000 | 350,071 | ||||||
Wind Tre SpA, 144A, 5.0%, 1/20/2026 | 200,000 | 193,600 | ||||||
Zayo Group LLC, 144A, 5.75%, 1/15/2027 | 240,000 | 244,531 | ||||||
|
| |||||||
| 11,475,325 | ||||||||
| Consumer Discretionary 12.0% |
| |||||||
Adient Global Holdings Ltd., REG S, 3.5%, 8/15/2024 | EUR 185,000 | 174,602 | ||||||
Ally Financial, Inc., 5.75%, 11/20/2025 (b) | 485,000 | 536,483 | ||||||
American Axle & Manufacturing, Inc.: |
| |||||||
6.25%, 4/1/2025 | 160,000 | 159,200 | ||||||
6.25%, 3/15/2026 | 145,000 | 143,187 | ||||||
Asbury Automotive Group, Inc., 6.0%, 12/15/2024 | 219,000 | 226,665 | ||||||
Ashtead Capital, Inc., 144A, 5.25%, 8/1/2026 | 240,000 | 250,200 | ||||||
Boyd Gaming Corp.: |
| |||||||
6.0%, 8/15/2026 | 160,000 | 168,200 | ||||||
6.875%, 5/15/2023 | 100,000 | 103,250 | ||||||
Cumberland Farms, Inc., 144A, 6.75%, 5/1/2025 | 48,000 | 50,880 | ||||||
Dana Financing Luxembourg Sarl: |
| |||||||
144A, 5.75%, 4/15/2025 | 155,000 | 159,069 | ||||||
144A, 6.5%, 6/1/2026 | 160,000 | 168,400 | ||||||
Dana, Inc., 5.5%, 12/15/2024 | 65,000 | 66,625 | ||||||
The accompanying notes are an integral part of the financial statements.
Deutsche DWS Variable Series II — DWS High Income VIP | | | 5 |
Table of Contents
| Principal Amount ($)(a) | Value ($) | |||||||
Eldorado Resorts, Inc., 6.0%, 9/15/2026 | 173,000 | 189,002 | ||||||
Fiat Chrysler Automobiles NV, 5.25%, 4/15/2023 | 445,000 | 470,040 | ||||||
HD Supply, Inc., 144A, 5.375%, 10/15/2026 | 190,000 | 200,450 | ||||||
Hilton Domestic Operating Co., Inc.: |
| |||||||
144A, 4.875%, 1/15/2030 | 139,000 | 143,170 | ||||||
5.125%, 5/1/2026 | 260,000 | 271,375 | ||||||
IAA, Inc., 144A, 5.5%, 6/15/2027 | 75,000 | 78,000 | ||||||
Lennar Corp.: |
| |||||||
4.75%, 11/15/2022 | 110,000 | 115,088 | ||||||
4.75%, 11/29/2027 | 120,000 | 126,300 | ||||||
5.0%, 6/15/2027 | 50,000 | 52,563 | ||||||
Mattel, Inc., 144A, 6.75%, 12/31/2025 | 215,000 | 221,181 | ||||||
Meritage Homes Corp., 5.125%, 6/6/2027 | 15,000 | 15,225 | ||||||
Meritor, Inc., 6.25%, 2/15/2024 | 75,000 | 77,156 | ||||||
Merlin Entertainments PLC, 144A, 5.75%, 6/15/2026 | 200,000 | 210,500 | ||||||
MGM Resorts International: |
| |||||||
5.5%, 4/15/2027 | 300,000 | 314,625 | ||||||
5.75%, 6/15/2025 | 190,000 | 206,682 | ||||||
NCL Corp., Ltd., 144A, 4.75%, 12/15/2021 | 93,000 | 94,279 | ||||||
Panther BF Aggregator 2 LP: |
| |||||||
144A, 4.375%, 5/15/2026 | EUR 100,000 | 117,406 | ||||||
144A, 6.25%, 5/15/2026 | 55,000 | 57,131 | ||||||
Penn National Gaming, Inc., 144A, 5.625%, 1/15/2027 | 80,000 | 79,000 | ||||||
Penske Automotive Group, Inc., 5.5%, 5/15/2026 | 165,000 | 172,012 | ||||||
PetSmart, Inc., 144A, 7.125%, 3/15/2023 | 155,000 | 145,312 | ||||||
PulteGroup, Inc.: |
| |||||||
5.5%, 3/1/2026 | 80,000 | 86,400 | ||||||
6.375%, 5/15/2033 | 100,000 | 106,625 | ||||||
Rivers Pittsburgh Borrower LP, 144A, 6.125%, 8/15/2021 | 50,000 | 50,750 | ||||||
Sonic Automotive, Inc., 6.125%, 3/15/2027 | 55,000 | 54,038 | ||||||
Staples, Inc., 144A, 7.5%, 4/15/2026 | 150,000 | 149,116 | ||||||
Stars Group Holdings BV, 144A, 7.0%, 7/15/2026 | 200,000 | 211,500 | ||||||
Suburban Propane Partners LP, 5.75%, 3/1/2025 | 105,000 | 105,788 | ||||||
Toll Brothers Finance Corp., 4.35%, 2/15/2028 | 127,000 | 126,683 | ||||||
TRI Pointe Group, Inc., 5.25%, 6/1/2027 | 55,000 | 52,938 | ||||||
Viking Cruises Ltd., 144A, 5.875%, 9/15/2027 | 205,000 | 207,562 | ||||||
William Carter Co., 144A, 5.625%, 3/15/2027 | 10,000 | 10,475 | ||||||
WMG Acquisition Corp., 144A, 5.0%, 8/1/2023 | 75,000 | 76,500 | ||||||
|
| |||||||
| 6,801,633 | ||||||||
| Consumer Staples 2.8% |
| |||||||
Cott Holdings, Inc., 144A, 5.5%, 4/1/2025 | 325,000 | 331,094 | ||||||
Darling Ingredients, Inc., 144A, 5.25%, 4/15/2027 | 30,000 | 31,350 | ||||||
| Principal Amount ($)(a) | Value ($) | |||||||
JBS U.S.A. LUX SA: |
| |||||||
144A, 5.75%, 6/15/2025 | 210,000 | 218,400 | ||||||
144A, 6.5%, 4/15/2029 | 132,000 | 143,385 | ||||||
144A, 6.75%, 2/15/2028 | 235,000 | 255,269 | ||||||
Pilgrim’s Pride Corp.: |
| |||||||
144A, 5.75%, 3/15/2025 | 50,000 | 50,750 | ||||||
144A, 5.875%, 9/30/2027 | 150,000 | 155,437 | ||||||
Post Holdings, Inc.: |
| |||||||
144A, 5.5%, 3/1/2025 | 250,000 | 258,125 | ||||||
144A, 5.5%, 12/15/2029 (c) | 110,000 | 110,275 | ||||||
Simmons Foods, Inc., 144A, 5.75%, 11/1/2024 | 50,000 | 45,500 | ||||||
|
| |||||||
| 1,599,585 | ||||||||
| Energy 15.8% |
| |||||||
Antero Midstream Partners LP: |
| |||||||
5.375%, 9/15/2024 | 125,000 | 124,219 | ||||||
144A, 5.75%, 3/1/2027 | 155,000 | 155,000 | ||||||
144A, 5.75%, 1/15/2028 | 250,000 | 247,500 | ||||||
Antero Resources Corp.: |
| |||||||
5.125%, 12/1/2022 | 100,000 | 96,000 | ||||||
5.625%, 6/1/2023 | 245,000 | 236,474 | ||||||
Archrock Partners LP, 144A, 6.875%, 4/1/2027 | 110,000 | 114,961 | ||||||
Carrizo Oil & Gas, Inc., 8.25%, 7/15/2025 | 100,000 | 98,500 | ||||||
Cheniere Corpus Christi Holdings LLC: |
| |||||||
5.125%, 6/30/2027 | 230,000 | 249,837 | ||||||
5.875%, 3/31/2025 | 165,000 | 183,769 | ||||||
7.0%, 6/30/2024 | 110,000 | 126,511 | ||||||
Cheniere Energy Partners LP, 144A, 5.625%, 10/1/2026 | 80,000 | 84,400 | ||||||
Chesapeake Energy Corp.: |
| |||||||
8.0%, 1/15/2025 (b) | 165,000 | 153,037 | ||||||
8.0%, 6/15/2027 (b) | 165,000 | 145,406 | ||||||
CNX Midstream Partners LP, 144A, 6.5%, 3/15/2026 | 107,000 | 101,650 | ||||||
Crestwood Midstream Partners LP: |
| |||||||
144A, 5.625%, 5/1/2027 | 150,000 | 149,625 | ||||||
6.25%, 4/1/2023 | 245,000 | 249,900 | ||||||
DCP Midstream Operating LP, 5.375%, 7/15/2025 | 387,000 | 407,801 | ||||||
Endeavor Energy Resources LP: |
| |||||||
144A, 5.5%, 1/30/2026 | 35,000 | 36,269 | ||||||
144A, 5.75%, 1/30/2028 | 35,000 | 36,838 | ||||||
EnLink Midstream LLC, 5.375%, 6/1/2029 | 45,000 | 46,125 | ||||||
EnLink Midstream Partners LP, 4.4%, 4/1/2024 | 280,000 | 283,144 | ||||||
Genesis Energy LP: |
| |||||||
6.25%, 5/15/2026 | 115,000 | 110,975 | ||||||
6.5%, 10/1/2025 | 85,000 | 83,088 | ||||||
Gulfport Energy Corp., 6.0%, 10/15/2024 | 60,000 | 46,350 | ||||||
Hilcorp Energy I LP: |
| |||||||
144A, 5.0%, 12/1/2024 | 105,000 | 104,475 | ||||||
144A, 5.75%, 10/1/2025 | 145,000 | 145,362 | ||||||
144A, 6.25%, 11/1/2028 | 105,000 | 105,525 | ||||||
Holly Energy Partners LP, 144A, 6.0%, 8/1/2024 | 225,000 | 234,000 | ||||||
Jagged Peak Energy LLC, 5.875%, 5/1/2026 | 174,000 | 171,390 | ||||||
Matador Resources Co., 5.875%, 9/15/2026 | 134,000 | 135,340 | ||||||
The accompanying notes are an integral part of the financial statements.
| 6 | | | Deutsche DWS Variable Series II — DWS High Income VIP |
Table of Contents
| Principal Amount ($)(a) | Value ($) | |||||||
MEG Energy Corp., 144A, 6.5%, 1/15/2025 | 234,000 | 235,170 | ||||||
Murphy Oil U.S.A., Inc., 5.625%, 5/1/2027 | 65,000 | 67,600 | ||||||
Nabors Industries, Inc.: |
| |||||||
5.5%, 1/15/2023 | 15,000 | 14,025 | ||||||
5.75%, 2/1/2025 | 80,000 | 70,900 | ||||||
NuStar Logistics LP, 5.625%, 4/28/2027 | 236,000 | 237,770 | ||||||
6.0%, 6/1/2026 | 160,000 | 165,600 | ||||||
Oasis Petroleum, Inc.: |
| |||||||
6.875%, 3/15/2022 | 138,000 | 137,655 | ||||||
6.875%, 1/15/2023 | 60,000 | 60,000 | ||||||
Parkland Fuel Corp., 5.875%, 7/15/2027 | 170,000 | 170,000 | ||||||
Parsley Energy LLC: |
| |||||||
144A, 5.25%, 8/15/2025 | 55,000 | 55,825 | ||||||
144A, 5.375%, 1/15/2025 | 185,000 | 189,625 | ||||||
144A, 5.625%, 10/15/2027 | 120,000 | 125,400 | ||||||
Peabody Energy Corp., 144A, 6.0%, 3/31/2022 | 295,000 | 302,006 | ||||||
Precision Drilling Corp., 144A, 7.125%, 1/15/2026 | 110,000 | 106,425 | ||||||
Range Resources Corp., 5.0%, 8/15/2022 | 185,000 | 175,519 | ||||||
Shelf Drilling Holdings Ltd., 144A, 8.25%, 2/15/2025 | 180,000 | 166,140 | ||||||
Southwestern Energy Co.: |
| |||||||
6.2%, 1/23/2025 | 60,000 | 54,750 | ||||||
7.75%, 10/1/2027 (b) | 115,000 | 110,113 | ||||||
Sunoco LP: |
| |||||||
5.5%, 2/15/2026 | 130,000 | 135,363 | ||||||
5.875%, 3/15/2028 | 35,000 | 36,269 | ||||||
144A, 6.0%, 4/15/2027 | 52,000 | 54,600 | ||||||
Targa Resources Partners LP: |
| |||||||
4.25%, 11/15/2023 | 210,000 | 210,000 | ||||||
5.0%, 1/15/2028 | 235,000 | 235,587 | ||||||
5.375%, 2/1/2027 | 260,000 | 269,100 | ||||||
5.875%, 4/15/2026 | 113,000 | 119,780 | ||||||
144A, 6.5%, 7/15/2027 | 15,000 | 16,369 | ||||||
Transocean Poseidon Ltd., 144A, 6.875%, 2/1/2027 | 95,000 | 100,403 | ||||||
Transocean, Inc.: |
| |||||||
144A, 7.25%, 11/1/2025 | 80,000 | 75,800 | ||||||
144A, 9.0%, 7/15/2023 | 55,000 | 58,575 | ||||||
USA Compression Partners LP, 6.875%, 4/1/2026 | 142,000 | 150,151 | ||||||
Whiting Petroleum Corp.: |
| |||||||
5.75%, 3/15/2021 | 160,000 | 161,200 | ||||||
6.625%, 1/15/2026 (b) | 110,000 | 106,081 | ||||||
WPX Energy, Inc.: |
| |||||||
5.25%, 9/15/2024 | 145,000 | 148,806 | ||||||
6.0%, 1/15/2022 | 43,000 | 44,828 | ||||||
8.25%, 8/1/2023 | 105,000 | 119,700 | ||||||
|
| |||||||
| 8,950,606 | ||||||||
| Financials 1.4% |
| |||||||
CNO Financial Group, Inc., 5.25%, 5/30/2025 | 100,000 | 107,750 | ||||||
5.25%, 5/30/2029 | 65,000 | 70,363 | ||||||
Intesa Sanpaolo Spa, 144A, 5.71%, 1/15/2026 | 200,000 | 202,408 | ||||||
Lions Gate Capital Holdings LLC, 144A, 6.375%, 2/1/2024 | 80,000 | 84,100 | ||||||
Navient Corp., 6.5%, 6/15/2022 | 100,000 | 106,224 | ||||||
| Principal Amount ($)(a) | Value ($) | |||||||
Springleaf Finance Corp.: |
| |||||||
6.125%, 3/15/2024 | 110,000 | 118,250 | ||||||
6.625%, 1/15/2028 | 35,000 | 36,750 | ||||||
Tempo Acquisition LLC, 144A, 6.75%, 6/1/2025 | 75,000 | 77,250 | ||||||
|
| |||||||
| 803,095 | ||||||||
| Health Care 6.7% |
| |||||||
Avantor, Inc., 144A, 6.0%, 10/1/2024 | 70,000 | 74,480 | ||||||
Bausch Health Americas, Inc.: |
| |||||||
144A, 8.5%, 1/31/2027 | 385,000 | 423,315 | ||||||
144A, 9.25%, 4/1/2026 | 85,000 | 95,098 | ||||||
Bausch Health Companies, Inc.: |
| |||||||
144A, 5.75%, 8/15/2027 | 115,000 | 120,863 | ||||||
144A, 5.875%, 5/15/2023 | 71,000 | 71,825 | ||||||
144A, 6.125%, 4/15/2025 | 150,000 | 153,183 | ||||||
144A, 6.5%, 3/15/2022 | 105,000 | 108,806 | ||||||
144A, 7.0%, 3/15/2024 | 255,000 | 270,963 | ||||||
Bausch Health Cos, Inc.: |
| |||||||
144A, 7.0%, 1/15/2028 | 40,000 | 41,450 | ||||||
144A, 7.25%, 5/30/2029 | 20,000 | 20,800 | ||||||
Catalent Pharma Solutions, Inc., 144A, 5.0%, 7/15/2027 | 125,000 | 127,187 | ||||||
Centene Corp., 144A, 5.375%, 6/1/2026 | 95,000 | 99,869 | ||||||
Charles River Laboratories International, Inc., 144A, 5.5%, 4/1/2026 | 20,000 | 21,046 | ||||||
DaVita, Inc.: |
| |||||||
5.0%, 5/1/2025 | 110,000 | 108,598 | ||||||
5.125%, 7/15/2024 | 110,000 | 110,033 | ||||||
HCA, Inc.: |
| |||||||
5.375%, 9/1/2026 | 170,000 | 183,175 | ||||||
5.625%, 9/1/2028 | 270,000 | 292,275 | ||||||
5.875%, 2/15/2026 | 190,000 | 209,950 | ||||||
MEDNAX, Inc., 144A, 6.25%, 1/15/2027 | 170,000 | 167,237 | ||||||
Tenet Healthcare Corp.: |
| |||||||
5.125%, 5/1/2025 | 325,000 | 326,625 | ||||||
144A, 6.25%, 2/1/2027 | 120,000 | 124,200 | ||||||
6.75%, 6/15/2023 (b) | 45,000 | 45,169 | ||||||
7.0%, 8/1/2025 (b) | 85,000 | 84,681 | ||||||
Teva Pharmaceutical Finance Netherlands III BV, 6.0%, 4/15/2024 | 320,000 | 301,800 | ||||||
WellCare Health Plans, Inc., 144A, 5.375%, 8/15/2026 | 210,000 | 222,600 | ||||||
|
| |||||||
| 3,805,228 | ||||||||
| Industrials 5.4% |
| |||||||
Berry Global Escrow Corp., 144A, 5.625%, 7/15/2027 | 15,000 | 15,600 | ||||||
Bombardier, Inc.: |
| |||||||
144A, 5.75%, 3/15/2022 | 115,000 | 116,581 | ||||||
144A, 6.0%, 10/15/2022 | 143,000 | 143,613 | ||||||
144A, 7.875%, 4/15/2027 | 164,000 | 164,205 | ||||||
Builders Firstsource, Inc., 144A, 6.75%, 6/1/2027 | 15,000 | 15,825 | ||||||
BWX Technologies, Inc., 144A, 5.375%, 7/15/2026 | 30,000 | 30,974 | ||||||
Clean Harbors, Inc.: |
| |||||||
144A, 4.875%, 7/15/2027 (c) | 65,000 | 66,063 | ||||||
144A, 5.125%, 7/15/2029 (c) | 30,000 | 30,600 | ||||||
The accompanying notes are an integral part of the financial statements.
Deutsche DWS Variable Series II — DWS High Income VIP | | | 7 |
Table of Contents
| Principal Amount ($)(a) | Value ($) | |||||||
Colfax Corp.: |
| |||||||
144A, 6.0%, 2/15/2024 | 25,000 | 26,438 | ||||||
144A, 6.375%, 2/15/2026 | 95,000 | 101,887 | ||||||
Covanta Holding Corp.: |
| |||||||
5.875%, 3/1/2024 | 160,000 | 164,800 | ||||||
5.875%, 7/1/2025 | 205,000 | 213,200 | ||||||
DAE Funding LLC: |
| |||||||
144A, 4.5%, 8/1/2022 | 8,000 | 8,120 | ||||||
144A, 5.0%, 8/1/2024 | 25,000 | 26,031 | ||||||
144A, 5.75%, 11/15/2023 | 115,000 | 120,750 | ||||||
Energizer Holdings, Inc.: |
| |||||||
144A, 6.375%, 7/15/2026 | 120,000 | 123,300 | ||||||
144A, 7.75%, 1/15/2027 | 30,000 | 32,470 | ||||||
Graphic Packaging International LLC, 144A, 4.75%, 7/15/2027 | 30,000 | 30,788 | ||||||
Harsco Corp., 144A, 5.75%, 7/31/2027 | 35,000 | 36,448 | ||||||
Itron, Inc., 144A, 5.0%, 1/15/2026 | 140,000 | 143,150 | ||||||
Moog, Inc., 144A, 5.25%, 12/1/2022 | 120,000 | 122,100 | ||||||
Novelis Corp., 144A, 5.875%, 9/30/2026 | 230,000 | 232,875 | ||||||
Park Aerospace Holdings Ltd., 144A, 5.5%, 2/15/2024 | 245,000 | 264,105 | ||||||
Prime Security Services Borrower LLC, 144A, 9.25%, 5/15/2023 | 2,000 | 2,100 | ||||||
Summit Materials LLC, 6.125%, 7/15/2023 | 200,000 | 202,500 | ||||||
Tennant Co., 5.625%, 5/1/2025 | 30,000 | 30,975 | ||||||
TransDigm, Inc., 144A, 6.25%, 3/15/2026 | 170,000 | 178,925 | ||||||
United Rentals North America, Inc., 6.5%, 12/15/2026 | 390,000 | 422,175 | ||||||
|
| |||||||
| 3,066,598 | ||||||||
| Information Technology 2.2% |
| |||||||
Cardtronics, Inc., 144A, 5.5%, 5/1/2025 | 95,000 | 94,525 | ||||||
Cdk Global, Inc., 144A, 5.25%, 5/15/2029 | 85,000 | 88,081 | ||||||
Change Healthcare Holdings LLC, 144A, 5.75%, 3/1/2025 | 210,000 | 213,150 | ||||||
Fair Isaac Corp., 144A, 5.25%, 5/15/2026 | 130,000 | 136,500 | ||||||
Go Daddy Operating Co. LLC, 144A, 5.25%, 12/1/2027 | 165,000 | 170,775 | ||||||
IQVIA, Inc., 144A, 5.0%, 5/15/2027 | 220,000 | 227,150 | ||||||
Refinitiv U.S. Holdings, Inc., 144A, 8.25%, 11/15/2026 | 85,000 | 87,423 | ||||||
SS&C Technologies, Inc., 144A, 5.5%, 9/30/2027 | 85,000 | 88,187 | ||||||
TTM Technologies, Inc., 144A, 5.625%, 10/1/2025 | 155,000 | 151,553 | ||||||
|
| |||||||
| 1,257,344 | ||||||||
| Materials 10.3% |
| |||||||
AK Steel Corp., 7.5%, 7/15/2023 | 85,000 | 86,887 | ||||||
Ardagh Packaging Finance PLC, 144A, 6.0%, 2/15/2025 | 220,000 | 227,975 | ||||||
Axalta Coating Systems LLC, 144A, 4.875%, 8/15/2024 | 175,000 | 180,250 | ||||||
Berry Global Escrow Corp., 144A, 4.875%, 7/15/2026 | 105,000 | 107,231 | ||||||
Berry Global, Inc., 5.5%, 5/15/2022 | 315,000 | 318,544 | ||||||
| Principal Amount ($)(a) | Value ($) | |||||||
BWAY Holding Co.: |
| |||||||
144A, 5.5%, 4/15/2024 | 175,000 | 175,087 | ||||||
144A, 7.25%, 4/15/2025 | 90,000 | 86,850 | ||||||
Cascades, Inc., 144A, 5.5%, 7/15/2022 | 26,000 | 26,098 | ||||||
CF Industries, Inc.: |
| |||||||
3.45%, 6/1/2023 | 200,000 | 200,700 | ||||||
5.15%, 3/15/2034 | 105,000 | 102,637 | ||||||
Chemours Co.: |
| |||||||
5.375%, 5/15/2027 | 115,000 | 109,537 | ||||||
6.625%, 5/15/2023 | 99,000 | 102,403 | ||||||
7.0%, 5/15/2025 | 60,000 | 62,700 | ||||||
Clearwater Paper Corp., 144A, 5.375%, 2/1/2025 | 110,000 | 99,825 | ||||||
Constellium NV: |
| |||||||
144A, 4.625%, 5/15/2021 | EUR 150,000 | 171,375 | ||||||
144A, 5.75%, 5/15/2024 | 250,000 | 256,250 | ||||||
144A, 6.625%, 3/1/2025 | 250,000 | 260,000 | ||||||
Element Solutions, Inc., 144A, 5.875%, 12/1/2025 | 85,000 | 88,506 | ||||||
First Quantum Minerals Ltd.: |
| |||||||
144A, 6.5%, 3/1/2024 | 245,000 | 229,075 | ||||||
144A, 6.875%, 3/1/2026 | 200,000 | 185,500 | ||||||
Flex Acquisition Co., Inc, 144A, 7.875%, 7/15/2026 | 85,000 | 78,412 | ||||||
Freeport-McMoRan, Inc.: |
| |||||||
3.55%, 3/1/2022 | 440,000 | 441,650 | ||||||
3.875%, 3/15/2023 | 200,000 | 200,000 | ||||||
4.0%, 11/14/2021 | 180,000 | 183,375 | ||||||
Hexion, Inc., 144A, 7.875%, 7/15/2027 (c) | 35,000 | 35,263 | ||||||
Hudbay Minerals, Inc.: |
| |||||||
144A, 7.25%, 1/15/2023 | 95,000 | 97,850 | ||||||
144A, 7.625%, 1/15/2025 | 75,000 | 77,438 | ||||||
Kaiser Aluminum Corp., 5.875%, 5/15/2024 | 145,000 | 150,800 | ||||||
Kronos International, Inc., REG S, 3.75%, 9/15/2025 | EUR 100,000 | 113,085 | ||||||
LABL Escrow Issuer LLC, 144A, 6.75%, 7/15/2026 (c) | 100,000 | 100,875 | ||||||
Mercer International, Inc., 6.5%, 2/1/2024 | 110,000 | 113,850 | ||||||
NOVA Chemicals Corp.: |
| |||||||
144A, 4.875%, 6/1/2024 | 185,000 | 191,475 | ||||||
144A, 5.25%, 6/1/2027 | 140,000 | 148,925 | ||||||
Novelis Corp., 144A, 6.25%, 8/15/2024 | 200,000 | 209,692 | ||||||
Reynolds Group Issuer, Inc.: |
| |||||||
144A, 5.125%, 7/15/2023 | 290,000 | 295,437 | ||||||
144A, 7.0%, 7/15/2024 | 35,000 | 36,191 | ||||||
Tronox Finance PLC, 144A, 5.75%, 10/1/2025 | 66,000 | 64,020 | ||||||
Tronox, Inc., 144A, 6.5%, 4/15/2026 | 122,000 | 120,932 | ||||||
United States Steel Corp., 6.25%, 3/15/2026 | 34,000 | 30,260 | ||||||
WR Grace &Co-Conn, 144A, 5.125%, 10/1/2021 | 65,000 | 67,438 | ||||||
|
| |||||||
| 5,834,398 | ||||||||
| Real Estate 3.2% |
| |||||||
CyrusOne LP: |
| |||||||
(REIT), 5.0%, 3/15/2024 | 200,000 | 205,500 | ||||||
(REIT), 5.375%, 3/15/2027 | 165,000 | 173,662 | ||||||
The accompanying notes are an integral part of the financial statements.
| 8 | | | Deutsche DWS Variable Series II — DWS High Income VIP |
Table of Contents
| Principal Amount ($)(a) | Value ($) | |||||||
Iron Mountain, Inc.: |
| |||||||
144A, (REIT), 5.25%, 3/15/2028 | 50,000 | 50,063 | ||||||
(REIT), 5.75%, 8/15/2024 | 320,000 | 323,245 | ||||||
(REIT), 6.0%, 8/15/2023 | 300,000 | 308,250 | ||||||
MGM Growth Properties Operating Partnership LP, 144A, (REIT), 5.75%, 2/1/2027 | 310,000 | 334,025 | ||||||
MPT Operating Partnership LP, (REIT), 6.375%, 3/1/2024 | 170,000 | 178,075 | ||||||
SBA Communications Corp., (REIT), 4.0%, 10/1/2022 | 215,000 | 217,956 | ||||||
|
| |||||||
| 1,790,776 | ||||||||
| Utilities 4.3% |
| |||||||
AES Corp., 4.875%, 5/15/2023 | 109,000 | 110,912 | ||||||
AmeriGas Partners LP: |
| |||||||
5.5%, 5/20/2025 | 205,000 | 215,762 | ||||||
5.75%, 5/20/2027 | 110,000 | 115,500 | ||||||
Calpine Corp.: |
| |||||||
144A, 5.25%, 6/1/2026 | 90,000 | 91,575 | ||||||
5.75%, 1/15/2025 | 45,000 | 44,663 | ||||||
NextEra Energy Operating Partners LP, 144A, 4.25%, 7/15/2024 | 210,000 | 211,317 | ||||||
NRG Energy, Inc.: |
| |||||||
144A, 5.25%, 6/15/2029 | 277,000 | 295,697 | ||||||
5.75%, 1/15/2028 | 200,000 | 214,500 | ||||||
Vistra Energy Corp., 5.875%, 6/1/2023 | 70,000 | 71,575 | ||||||
Vistra Operations Co. LLC: |
| |||||||
144A, 5.0%, 7/31/2027 | 220,000 | 227,975 | ||||||
144A, 5.5%, 9/1/2026 | 315,000 | 332,719 | ||||||
144A, 5.625%, 2/15/2027 | 495,000 | 524,081 | ||||||
|
| |||||||
| 2,456,276 | ||||||||
Total Corporate Bonds (Cost $46,591,768) |
| 47,840,864 | ||||||
| Loan Participations and Assignments 2.6% |
| |||||||
| Senior Loans** |
| |||||||
CenturyLink, Inc., Term Loan B,1-month USD LIBOR + 2.750%, 5.189%, 1/31/2025 | 364,040 | 356,255 | ||||||
CSC Holdings LLC, First Lien Term Loan,1-month USD LIBOR + 2.250%, 4.644%, 7/17/2025 | 236,977 | 233,589 | ||||||
First Data Corp., Term Loan,1-month USD LIBOR + 2.000%, 4.404%, 7/8/2022 | 198,388 | 198,383 | ||||||
Mediacom Illinois LLC, Term Loan N,1-week USD LIBOR + 1.750%, 4.11%, 2/15/2024 | 223,304 | 222,243 | ||||||
SBA Senior Finance II LLC, Term Loan B,1-month USD LIBOR + 2.000%, 4.44%, 4/11/2025 | 223,869 | 221,375 | ||||||
TransDigm, Inc., Term Loan F,1-month USD LIBOR + 2.500%, 4.939%, 6/9/2023 | 138,945 | 136,622 | ||||||
Unitymedia Finance LLC, Term Loan D,1-month USD LIBOR + 2.250%, 4.644%, 1/15/2026 | 88,493 | 88,352 | ||||||
Total Loan Participations and Assignments |
| 1,456,819 | ||||||
| Principal Amount ($)(a) | Value ($) | |||||||
| Convertible Bonds 3.4% |
| |||||||
| Communication Services 0.1% |
| |||||||
DISH Network Corp., 2.375%, 3/15/2024 | 35,000 | 32,332 | ||||||
| Materials 3.3% |
| |||||||
GEO Specialty Chemicals, Inc.,3-monthUSD-LIBOR + 14.0%, 16.503%** PIK, 10/18/2025 (e) | 1,695,550 | 1,900,712 | ||||||
Total Convertible Bonds (Cost $1,722,501) |
| 1,933,044 | ||||||
| Shares | Value ($) | |||||||
| Common Stocks 0.6% |
| |||||||
| Industrials 0.0% |
| |||||||
Quad Graphics, Inc. | 287 | 2,270 | ||||||
| Materials 0.6% |
| |||||||
GEO Specialty Chemicals, Inc.* (e) | 1,023,015 | 321,226 | ||||||
GEO Specialty Chemicals, Inc. 144A* (e) | 2,206 | 693 | ||||||
|
| |||||||
| 321,919 | ||||||||
Total Common Stocks (Cost $526,959) |
| 324,189 | ||||||
| Warrants 0.1% |
| |||||||
| Materials |
| |||||||
Hercules Trust II, | 1,100 | 48,864 | ||||||
| Securities Lending Collateral 2.6% |
| |||||||
DWS Government & Agency Securities Portfolio “DWS Government Cash Institutional Shares”, 2.28% (f) (g) (Cost $1,505,350) | 1,505,350 | 1,505,350 | ||||||
| Cash Equivalents 9.1% |
| |||||||
DWS Central Cash Management Government Fund, 2.40% (f) | 5,137,379 | 5,137,379 | ||||||
| % of Net Assets | Value ($) | |||||||
Total Investment Portfolio (Cost $57,181,093) | 103.0 | 58,246,509 | ||||||
| Other Assets and Liabilities, Net | (3.0 | ) | (1,671,003 | ) | ||||
| Net Assets | 100.0 | 56,575,506 | ||||||
The accompanying notes are an integral part of the financial statements.
Deutsche DWS Variable Series II — DWS High Income VIP | | | 9 |
Table of Contents
A summary of the Fund’s transactions with affiliated investments during the period ended June 30, 2019 are as follows:
| Value ($) at 12/31/2018 | Purchases Cost ($) | Sales Proceeds ($) | Net Realized Gain/ (Loss) ($) | Net Change in Unrealized Appreciation (Depreciation) ($) | Income ($) | Capital Gain Distributions ($) | Number of Shares at 6/30/2019 | Value ($) at 6/30/2019 | ||||||||||||||||||||||||
Securities Lending Collateral 2.6% |
| |||||||||||||||||||||||||||||||
DWS Government & Agency Securities Portfolio “DWS Government Cash Institutional Shares”, 2.28% (f) (g) |
| |||||||||||||||||||||||||||||||
| 1,464,490 | 40,860 | (h) | — | — | — | 4,971 | — | 1,505,350 | 1,505,350 | |||||||||||||||||||||||
Cash Equivalents 9.1% |
| |||||||||||||||||||||||||||||||
DWS Central Cash Management Government Fund, 2.40% (f) |
| |||||||||||||||||||||||||||||||
| 4,341,875 | 14,882,978 | 14,087,474 | — | — | 30,797 | — | 5,137,379 | 5,137,379 | ||||||||||||||||||||||||
| 5,806,365 | 14,923,838 | 14,087,474 | — | — | 35,768 | — | 6,642,729 | 6,642,729 | ||||||||||||||||||||||||
| * | Non-income producing security. |
| ** | Variable or floating rate security. These securities are shown at their current rate as of June 30, 2019. For securities based on a published reference rate and spread, the reference rate and spread are indicated within the description above. Certain variable rate securities are not based on a published reference rate and spread but adjust periodically based on current market conditions, prepayment of underlying positions and/or other variables. |
| (a) | Principal amount stated in U.S. dollars unless otherwise noted. |
| (b) | All or a portion of these securities were on loan. In addition, “Other Assets and Liabilities, Net” may include pending sales that are also on loan. The value of securities loaned at June 30, 2019 amounted to $1,448,921, which is 2.6% of net assets. |
| (c) | When-issued, delayed delivery or forward commitment securities included. |
| (d) | Perpetual, callable security with no stated maturity date. |
| (e) | Investment was valued using significant unobservable inputs. |
| (f) | Affiliated fund managed by DWS Investment Management Americas, Inc. The rate shown is the annualizedseven-day yield at period end. |
| (g) | Represents cash collateral held in connection with securities lending. Income earned by the Fund is net of borrower rebates. |
| (h) | Represents the net increase (purchase cost) or decrease (sales proceeds) in the amount invested in cash collateral for the period ended June 30, 2019. |
144A: Security exempt from registration under Rule 144A of the Securities Act of 1933. These securities may be resold in transactions exempt from registration, normally to qualified institutional buyers.
LIBOR: London Interbank Offered Rate
PIK: Denotes that all or a portion of the income is paidin-kind in the form of additional principal.
REG S: Securities sold under Regulation S may not be offered, sold or delivered within the United States or to, or for the account or benefit of, U.S. persons, except pursuant to an exemption from, or in a transaction not subject to, the registration requirements of the Securities Act of 1933.
REIT: Real Estate Investment Trust
As of June 30, 2019, the Fund had the following open forward foreign currency contracts:
| Contracts to Deliver | In Exchange For | Settlement Date | Unrealized Appreciation ($) | Counterparty | ||||||||||||||||||||
| EUR | 1,008,169 | USD | 1,151,048 | 7/31/2019 | 1,715 | State Street Bank and Trust | ||||||||||||||||||
Currency Abbreviations
| EUR | Euro |
| USD | United States Dollar |
For information on the Fund’s policy and additional disclosures regarding forward foreign currency contracts, please refer to the Derivatives section of Note A in the accompanying Notes to Financial Statements.
The accompanying notes are an integral part of the financial statements.
| 10 | | | Deutsche DWS Variable Series II — DWS High Income VIP |
Table of Contents
Fair Value Measurements
Various inputs are used in determining the value of the Fund’s investments. These inputs are summarized in three broad levels. Level 1 includes quoted prices in active markets for identical securities. Level 2 includes other significant observable inputs (including quoted prices for similar securities, interest rates, prepayment speeds and credit risk). Level 3 includes significant unobservable inputs (including the Fund’s own assumptions in determining the fair value of investments). The level assigned to the securities valuations may not be an indication of the risk or liquidity associated with investing in those securities.
The following is a summary of the inputs used as of June 30, 2019 in valuing the Fund’s investments. For information on the Fund’s policy regarding the valuation of investments, please refer to the Security Valuation section of Note A in the accompanying Notes to Financial Statements.
| Assets | Level 1 | Level 2 | Level 3 | Total | ||||||||||||
| Fixed Income Investments (i) | ||||||||||||||||
Corporate Bonds | $ | — | $ | 47,840,864 | $ | — | $ | 47,840,864 | ||||||||
Loan Participations and Assignments | — | 1,456,819 | — | 1,456,819 | ||||||||||||
Convertible Bonds | — | 32,332 | 1,900,712 | 1,933,044 | ||||||||||||
| Common Stocks (i) | 2,270 | — | 321,919 | 324,189 | ||||||||||||
| Warrants | — | — | 48,864 | 48,864 | ||||||||||||
| Short-Term Investments (i) | 6,642,729 | — | — | 6,642,729 | ||||||||||||
| Derivatives (j) | ||||||||||||||||
Forward Foreign Currency Contracts | $ | — | $ | 1,715 | $ | — | $ | 1,715 | ||||||||
| Total | $ | 6,644,999 | $ | 49,331,730 | $ | 2,271,495 | $ | 58,248,224 | ||||||||
| (i) | See Investment Portfolio for additional detailed categorizations. |
| (j)) | Derivatives include unrealized appreciation (depreciation) on open futures contracts. |
Level 3 Reconciliation
The following is a reconciliation of the Fund’s Level 3 investments for which significant unobservable inputs were used in determining value:
| Convertible Bond | Common Stocks | Warrant | Total | |||||||||||||
Balance as of December 31, 2018 | $ | 1,710,710 | $ | 116,277 | $ | 27,119 | $ | 1,854,106 | ||||||||
| Realized gains (loss) | — | — | — | — | ||||||||||||
| Change in unrealized appreciation (depreciation) | 79,780 | 181,656 | 21,745 | 283,181 | ||||||||||||
| Amortization of premium/accretion of discount | 130 | — | — | 130 | ||||||||||||
| Purchases/PIK | 110,092 | 23,986 | — | 134,078 | ||||||||||||
| (Sales) | — | — | — | — | ||||||||||||
| Transfer into Level 3 | — | — | — | — | ||||||||||||
| Transfer (out) of Level 3 | — | — | — | — | ||||||||||||
| Balance as of June 30, 2019 | $ | 1,900,712 | $ | 321,919 | $ | 48,864 | $ | 2,271,495 | ||||||||
| Net change in unrealized appreciation (depreciation) from investments still held as of June 30, 2019 | $ | 79,780 | $ | 181,656 | $ | 21,745 | $ | 283,181 | ||||||||
| Quantitative Disclosure About Significant Unobservable Inputs | ||||||||||||
| Asset Class | Fair Value at 6/30/19 | Valuation Technique(s) | Unobservable Input | Range (Weighted Average) | ||||||||
| Common Stocks | ||||||||||||
| Materials | $321,919 | Market Approach | Terms of merger agreement | N/A | ||||||||
| Illiquidity Discount | 5% | |||||||||||
| Warrant | ||||||||||||
| Materials | $48,864 | Black Scholes Option Pricing Model | Implied Volatility of Option | 26.6% | ||||||||
| Illiquidity Discount | 20% | |||||||||||
| Convertible Bond | ||||||||||||
| Materials | $1,900,712 | Market Approach | Terms of merger agreement | N/A | ||||||||
| Illiquidity Discount | 5% | |||||||||||
The accompanying notes are an integral part of the financial statements.
Deutsche DWS Variable Series II — DWS High Income VIP | | | 11 |
Table of Contents
Qualitative Disclosure About Unobservable Inputs
Significant unobservable inputs developed by the Pricing Committee and used in the fair value measurement of the Fund’s convertible bond investment include the terms of the merger agreement and an illiquidity discount. A significant change in the terms of the merger agreement is unlikely to have a material impact to the fair value measurement, while a significant change in the illiquidity discount is likely to have a material impact to the fair value measurement.
Significant unobservable inputs developed by the Pricing Committee and used in the fair value measurement of the Fund’s common stock investment include the terms of the merger agreement and an illiquidity discount. A significant change in the terms of the merger agreement is unlikely to have a material impact to the fair value measurement, while a significant change in the illiquidity discount is unlikely to have a material impact to the fair value measurement.
Significant unobservable inputs developed by the Pricing Committee and used in the fair value measurement of the Fund’s warrants include volatility and discount for lack of marketability. A change in the volatility of the underlying asset as an input to the Black-Scholes model may have a significant change in the fair value measurement. A significant change in the discount for lack of marketability is unlikely to have a material impact to the fair value measurement.
The accompanying notes are an integral part of the financial statements.
| 12 | | | Deutsche DWS Variable Series II — DWS High Income VIP |
Table of Contents
Statement of Assets and Liabilities
| as of June 30, 2019 (Unaudited) | ||||
| Assets | ||||
| Investments innon-affiliated securities, at value (cost $50,538,364) — including $1,448,921 of securities loaned | $ | 51,603,780 | ||
| Investment in DWS Government & Agency Securities Portfolio (cost $1,505,350)* | 1,505,350 | |||
| Investment in DWS Central Cash Management Government Fund (cost $5,137,379) | 5,137,379 | |||
| Cash | 10,000 | |||
| Foreign currency, at value (cost $1,006) | 1,005 | |||
| Receivable for investments sold | 1,006,019 | |||
| Receivable for investments sold — when-issued securities | 220,900 | |||
| Receivable for Fund shares sold | 3,827 | |||
| Interest receivable | 811,513 | |||
| Unrealized appreciation on forward foreign currency contracts | 1,715 | |||
| Other assets | 619 | |||
| Total assets | 60,302,107 | |||
| Liabilities | ||||
| Payable upon return of securities loaned | 1,505,350 | |||
| Payable for investments purchased | 1,026,749 | |||
| Payable for investments purchased —when-issued securities | 1,083,620 | |||
| Payable for Fund shares redeemed | 12,948 | |||
| Accrued management fee | 10,852 | |||
| Accrued Trustees’ fees | 711 | |||
| Other accrued expenses and payables | 86,371 | |||
| Total liabilities | 3,726,601 | |||
| Net assets, at value | $ | 56,575,506 | ||
| Net Assets Consist of | ||||
| Distributable earnings (loss) | (4,392,327 | ) | ||
| Paid-in capital | 60,967,833 | |||
| Net assets, at value | $ | 56,575,506 | ||
| Net Asset Value | ||||
Class A | ||||
| Net Asset Value, offering and redemption price per share ($56,434,234 ÷ 9,435,585 outstanding shares of beneficial interest, no par value, unlimited number of shares authorized) | $ | 5.98 | ||
Class B | ||||
| Net Asset Value, offering and redemption price per share ($141,272 ÷ 23,500 outstanding shares of beneficial interest, no par value, unlimited number of shares authorized) | $ | 6.01 | ||
| * | Represents collateral on securities loaned. |
| for the six months ended June 30, 2019 (Unaudited) |
| |||
| Investment Income | ||||
| Income: | ||||
| Interest | $ | 1,638,732 | ||
| Income distributions — DWS Central Cash Management Government Fund | 30,797 | |||
| Securities lending income, net of borrower rebates | 4,971 | |||
| Total income | 1,674,500 | |||
| Expenses: | ||||
| Management fee | 136,597 | |||
| Administration fee | 27,319 | |||
| Services to Shareholders | 432 | |||
| Record keeping fee (Class B) | 98 | |||
| Distribution service fees (Class B) | 170 | |||
| Custodian fee | 9,651 | |||
| Professional fees | 46,516 | |||
| Reports to shareholders | 22,363 | |||
| Trustees’ fees and expenses | 2,444 | |||
| Pricing service fee | 15,413 | |||
| Other | 2,054 | |||
| Total expenses before expense reductions | 263,057 | |||
| Expense reductions | (77,026 | ) | ||
| Total expenses after expense reductions | 186,031 | |||
| Net investment income | 1,488,469 | |||
| Realized and Unrealized Gain (Loss) | ||||
| Net realized gain (loss) from: | ||||
| Investments | (374,540 | ) | ||
| Forward foreign currency contracts | 13,763 | |||
| Foreign currency | (1,264 | ) | ||
| (362,041 | ) | |||
| Change in net unrealized appreciation (depreciation) on: | ||||
| Investments | 4,545,180 | |||
| Forward foreign currency contracts | 3,151 | |||
| Foreign currency | 155 | |||
| 4,548,486 | ||||
| Net gain (loss) | 4,186,445 | |||
| Net increase (decrease) in net assets resulting from operations | $ | 5,674,914 | ||
The accompanying notes are an integral part of the financial statements.
Deutsche DWS Variable Series II — DWS High Income VIP | | | 13 |
Table of Contents
Statements of Changes in Net Assets
| Increase (Decrease) in Net Assets | Six Months Ended June 30, 2019 (Unaudited) | Year Ended December 31, 2018 | ||||||
| Operations: | ||||||||
| Net investment income (loss) | $ | 1,488,469 | $ | 3,142,998 | ||||
| Net realized gain (loss) | (362,041 | ) | (176,656 | ) | ||||
| Change in net unrealized appreciation (depreciation) | 4,548,486 | (4,256,326 | ) | |||||
| Net increase (decrease) in net assets resulting from operations | 5,674,914 | (1,289,984 | ) | |||||
| Distributions to shareholders: | ||||||||
Class A | (3,177,995 | ) | (4,670,013 | ) | ||||
Class B | (7,539 | ) | (14,079 | ) | ||||
| Total distributions | (3,185,534 | ) | (4,684,092 | ) | ||||
| Fund share transactions: | ||||||||
Class A | ||||||||
| Proceeds from shares sold | 3,473,426 | 4,796,087 | ||||||
| Reinvestment of distributions | 3,177,995 | 4,670,013 | ||||||
| Payments for shares redeemed | (4,588,888 | ) | (12,180,108 | ) | ||||
| Net increase (decrease) in net assets from Class A share transactions | 2,062,533 | (2,714,008 | ) | |||||
Class B | ||||||||
| Proceeds from shares sold | 429 | 63,056 | ||||||
| Reinvestment of distributions | 7,539 | 14,079 | ||||||
| Payments for shares redeemed | (7,356 | ) | (64,199 | ) | ||||
| Net increase (decrease) in net assets from Class B share transactions | 612 | 12,936 | ||||||
| Increase (decrease) in net assets | 4,552,525 | (8,675,148 | ) | |||||
| Net assets at beginning of period | 52,022,981 | 60,698,129 | ||||||
| Net assets at end of period | $ | 56,575,506 | $ | 52,022,981 | ||||
| Other Information | ||||||||
Class A | ||||||||
| Shares outstanding at beginning of period | 9,081,584 | 9,527,083 | ||||||
| Shares sold | 584,209 | 775,176 | ||||||
| Shares issued to shareholders in reinvestment of distributions | 543,247 | 803,789 | ||||||
| Shares redeemed | (773,455 | ) | (2,024,464 | ) | ||||
| Net increase (decrease) in Class A shares | 354,001 | (445,499 | ) | |||||
| Shares outstanding at end of period | 9,435,585 | 9,081,584 | ||||||
Class B | ||||||||
| Shares outstanding at beginning of period | 23,418 | 21,761 | ||||||
| Shares sold | 70 | 9,962 | ||||||
| Shares issued to shareholders in reinvestment of distributions | 1,282 | 2,411 | ||||||
| Shares redeemed | (1,270 | ) | (10,716 | ) | ||||
| Net increase (decrease) in Class B shares | 82 | 1,657 | ||||||
| Shares outstanding at end of period | 23,500 | 23,418 | ||||||
The accompanying notes are an integral part of the financial statements.
| 14 | | | Deutsche DWS Variable Series II — DWS High Income VIP |
Table of Contents
| Six Months Ended 6/30/19 | Years Ended December 31, | |||||||||||||||||||||||
| Class A | (Unaudited) | 2018 | 2017 | 2016 | 2015 | 2014 | ||||||||||||||||||
| Selected Per Share Data | ||||||||||||||||||||||||
| Net asset value, beginning of period | $ | 5.71 | $ | 6.36 | $ | 6.28 | $ | 5.93 | $ | 6.60 | $ | 6.96 | ||||||||||||
| Income (loss) from investment operations: | ||||||||||||||||||||||||
Net investment incomea | .16 | .33 | .31 | .32 | .32 | .36 | ||||||||||||||||||
Net realized and unrealized gain (loss) | .46 | (.48 | ) | .15 | .41 | (.58 | ) | (.25 | ) | |||||||||||||||
Total from investment operations | .62 | (.15 | ) | .46 | .73 | (.26 | ) | .11 | ||||||||||||||||
| Less distributions from: | ||||||||||||||||||||||||
Net investment income | (.35 | ) | (.50 | ) | (.38 | ) | (.38 | ) | (.41 | ) | (.47 | ) | ||||||||||||
| Net asset value, end of period | $ | 5.98 | $ | 5.71 | $ | 6.36 | $ | 6.28 | $ | 5.93 | $ | 6.60 | ||||||||||||
| Total Return (%)b | 10.86 | ** | (2.52 | ) | 7.51 | 12.87 | (4.44 | ) | 1.47 | |||||||||||||||
| Ratios to Average Net Assets and Supplemental Data | ||||||||||||||||||||||||
| Net assets, end of period ($ millions) | 56 | 52 | 61 | 100 | 101 | 135 | ||||||||||||||||||
| Ratio of expenses before expense reductions (%)c | .96 | * | .94 | .78 | .80 | .75 | .75 | |||||||||||||||||
| Ratio of expenses after expense reductions (%)c | .68 | * | .69 | .72 | .72 | .72 | .73 | |||||||||||||||||
| Ratio of net investment income (%) | 5.45 | * | 5.41 | 4.98 | 5.38 | 5.09 | 5.21 | |||||||||||||||||
| Portfolio turnover rate (%) | 41 | ** | 62 | 71 | 77 | 47 | 52 | |||||||||||||||||
| a | Based on average shares outstanding during the period. |
| b | Total return would have been lower had certain expenses not been reduced. |
| c | Expense ratio does not reflect charges and fees associated with the separate account that invests in the Fund or any variable life insurance policy or variable annuity contract for which the Fund is an investment option. |
| * | Annualized |
| ** | Not annualized |
| Six Months Ended 6/30/19 | Years Ended December 31, | |||||||||||||||||||||||
| Class B | (Unaudited) | 2018 | 2017 | 2016 | 2015 | 2014 | ||||||||||||||||||
| Selected Per Share Data | ||||||||||||||||||||||||
| Net asset value, beginning of period | $ | 5.73 | $ | 6.38 | $ | 6.30 | $ | 5.94 | $ | 6.63 | $ | 6.99 | ||||||||||||
| Income (loss) from investment operations: | ||||||||||||||||||||||||
Net investment incomea | .15 | .31 | .31 | .31 | .32 | .35 | ||||||||||||||||||
Net realized and unrealized gain (loss) | .47 | (.48 | ) | .13 | .41 | (.61 | ) | (.26 | ) | |||||||||||||||
Total from investment operations | .62 | (.17 | ) | .44 | .72 | (.29 | ) | .09 | ||||||||||||||||
| Less distributions from: | ||||||||||||||||||||||||
Net investment income | (.34 | ) | (.48 | ) | (.36 | ) | (.36 | ) | (.40 | ) | (.45 | ) | ||||||||||||
| Net asset value, end of period | $ | 6.01 | $ | 5.73 | $ | 6.38 | $ | 6.30 | $ | 5.94 | $ | 6.63 | ||||||||||||
| Total Return (%)b | 10.72 | ** | (2.76 | ) | 7.21 | 12.67 | (4.95 | ) | 1.22 | |||||||||||||||
| Ratios to Average Net Assets and Supplemental Data | ||||||||||||||||||||||||
| Net assets, end of period ($ millions) | .1 | .1 | .1 | 2 | 3 | .03 | ||||||||||||||||||
| Ratio of expenses before expense reductions (%)c | 1.39 | * | 1.34 | 1.15 | 1.21 | 1.14 | 1.13 | |||||||||||||||||
| Ratio of expenses after expense reductions (%)c | .94 | * | .96 | .98 | .98 | 1.02 | .97 | |||||||||||||||||
| Ratio of net investment income (%) | 5.19 | * | 5.14 | 4.88 | 5.15 | 4.86 | 5.09 | |||||||||||||||||
| Portfolio turnover rate (%) | 41 | ** | 62 | 71 | 77 | 47 | 52 | |||||||||||||||||
| a | Based on average shares outstanding during the period. |
| b | Total return would have been lower had certain expenses not been reduced. |
| c | Expense ratio does not reflect charges and fees associated with the separate account that invests in the Fund or any variable life insurance policy or variable annuity contract for which the Fund is an investment option. |
| * | Annualized |
| ** | Not annualized |
The accompanying notes are an integral part of the financial statements.
Deutsche DWS Variable Series II — DWS High Income VIP | | | 15 |
Table of Contents
| Notes to Financial Statements | (Unaudited) |
A. Organization and Significant Accounting Policies
DWS High Income VIP (the “Fund”) is a diversified series of Deutsche DWS Variable Series II (the “Trust”), which is registered under the Investment Company Act of 1940, as amended (the “1940 Act”), as an open-end management investment company organized as a Massachusetts business trust.
Multiple Classes of Shares of Beneficial Interest. The Fund offers two classes of shares (Class A shares and Class B shares). Sales of Class B shares are subject to recordkeeping fees up to 0.15% and Rule 12b-1 fees under the 1940 Act equal to an annual rate of 0.25% of the average daily net assets of the Class B shares of the Fund. Class A shares are not subject to such fees.
Investment income, realized and unrealized gains and losses, and certain fund-level expenses and expense reductions, if any, are borne pro rata on the basis of relative net assets by the holders of all classes of shares except that each class bears certain expenses unique to that class (including the applicable Rule 12b-1 fee and recordkeeping fees). Differences in class-level expenses may result in payment of different per share dividends by class. All shares have equal rights with respect to voting subject to class-specific arrangements.
The Fund’s financial statements are prepared in accordance with accounting principles generally accepted in the United States of America (“U.S. GAAP”) which require the use of management estimates. Actual results could differ from those estimates. The Fund qualifies as an investment company under Topic 946 of Accounting Standards Codification of U.S. GAAP. The policies described below are followed consistently by the Fund in the preparation of its financial statements.
Security Valuation. Investments are stated at value determined as of the close of regular trading on the New York Stock Exchange on each day the exchange is open for trading.
Various inputs are used in determining the value of the Fund’s investments. These inputs are summarized in three broad levels. Level 1 includes quoted prices in active markets for identical securities. Level 2 includes other significant observable inputs (including quoted prices for similar securities, interest rates, prepayment speeds and credit risk). Level 3 includes significant unobservable inputs (including the Fund’s own assumptions in determining the fair value of investments). The level assigned to the securities valuations may not be an indication of the risk or liquidity associated with investing in those securities.
Debt securities and loan participations and assignments are valued at prices supplied by independent pricing services approved by the Fund’s Board. Such services may use various pricing techniques which take into account appropriate factors such as yield, quality, coupon rate, maturity, type of issue, trading characteristics, prepayment speeds and other data, as well as broker quotes. If the pricing services are unable to provide valuations, debt securities are valued at the average of the most recent reliable bid quotations or evaluated prices, as applicable, obtained from broker-dealers and loan participations and assignments are valued at the mean of the most recent bid and ask quotations or evaluated prices, as applicable, obtained from broker-dealers. Certain securities may be valued on the basis of a price provided by a single source or broker-dealer. No active trading market may exist for some senior loans and they may be subject to restrictions on resale. The inability to dispose of senior loans in a timely fashion could result in losses. These securities are generally categorized as Level 2.
Equity securities are valued at the most recent sale price or official closing price reported on the exchange (U.S. or foreign) or over-the-counter market on which they trade. Securities for which no sales are reported are valued at the calculated mean between the most recent bid and asked quotations on the relevant market or, if a mean cannot be determined, at the most recent bid quotation. Equity securities are generally categorized as Level 1 securities.
Investments in open-end investment companies are valued at their net asset value each business day and are categorized as Level 1.
Forward currency contracts are valued at the prevailing forward exchange rate of the underlying currencies and are categorized as Level 2.
Securities and other assets for which market quotations are not readily available or for which the above valuation procedures are deemed not to reflect fair value are valued in a manner that is intended to reflect their fair value as determined in accordance with procedures approved by the Board and are generally categorized as Level 3. In accordance with the Fund’s valuation procedures, factors considered in determining value may include, but are not limited to, the type of the security; the size of the holding; the initial cost of the security; the existence of any contractual restrictions on the security’s disposition; the price
| 16 | | | Deutsche DWS Variable Series II — DWS High Income VIP |
Table of Contents
and extent of public trading in similar securities of the issuer or of comparable companies; quotations or evaluated prices from broker-dealers and/or pricing services; information obtained from the issuer, analysts and/or the appropriate stock exchange (for exchange-traded securities); an analysis of the company’s or issuer’s financial statements; an evaluation of the forces that influence the issuer and the market(s) in which the security is purchased and sold; and with respect to debt securities, the maturity, coupon, creditworthiness, currency denomination and the movement of the market in which the security is normally traded. The value determined under these procedures may differ from published values for the same securities.
Disclosure about the classification of fair value measurements is included in a table following the Fund’s Investment Portfolio.
Foreign Currency Translations. The books and records of the Fund are maintained in U.S. dollars. Investment securities and other assets and liabilities denominated in a foreign currency are translated into U.S. dollars at the prevailing exchange rates at period end. Purchases and sales of investment securities, income and expenses are translated into U.S. dollars at the prevailing exchange rates on the respective dates of the transactions.
Net realized and unrealized gains and losses on foreign currency transactions represent net gains and losses between trade and settlement dates on securities transactions, the acquisition and disposition of foreign currencies, and the difference between the amount of net investment income accrued and the U.S. dollar amount actually received. That portion of both realized and unrealized gains and losses on investments that results from fluctuations in foreign currency exchange rates is not separately disclosed but is included with net realized and unrealized gain/appreciation and loss/depreciation on investments.
Securities Lending. Deutsche Bank AG, as lending agent, lends securities of the Fund to certain financial institutions under the terms of its securities lending agreement. During the term of the loans, the Fund continues to receive interest and dividends generated by the securities and to participate in any changes in their market value. The Fund requires the borrowers of the securities to maintain collateral with the Fund consisting of either cash or liquid, unencumbered assets having a value at least equal to the value of the securities loaned. When the collateral falls below specified amounts, the lending agent will use its best effort to obtain additional collateral on the next business day to meet required amounts under the securities lending agreement. As of period end, any securities on loan were collateralized by cash. During the six months ended June 30, 2019, the Fund invested the cash collateral into a joint trading account in DWS Government & Agency Securities Portfolio, an affiliated money market fund managed by DWS Investment Management Americas, Inc. DWS Investment Management Americas, Inc. receives a management/administration fee (0.11% annualized effective rate as of June 30, 2019) on the cash collateral invested in DWS Government & Agency Securities Portfolio. The Fund receives compensation for lending its securities either in the form of fees or by earning interest on invested cash collateral net of borrower rebates and fees paid to a lending agent. Either the Fund or the borrower may terminate the loan at any time, and the borrower, after notice, is required to return borrowed securities within a standard time period. There may be risks of delay and costs in recovery of securities or even loss of rights in the collateral should the borrower of the securities fail financially. If the Fund is not able to recover securities lent, the Fund may sell the collateral and purchase a replacement investment in the market, incurring the risk that the value of the replacement security is greater than the value of the collateral. The Fund is also subject to all investment risks associated with the reinvestment of any cash collateral received, including, but not limited to, interest rate, credit and liquidity risk associated with such investments.
As of June 30, 2019, the Fund had securities on loan, which were classified as corporate bonds in the Investment Portfolio. The value of the related collateral exceeded the value of the securities loaned at period end. As of period end, the remaining contractual maturity of the collateral agreements were overnight and continuous.
Taxes. The Fund’s policy is to comply with the requirements of the Internal Revenue Code, as amended, which are applicable to regulated investment companies and to distribute all of its taxable income to its shareholders.
At December 31, 2018, the Fund had a net tax basis capital loss carryforward of approximately $6,549,000, which may be applied against realized net taxable capital gains indefinitely, including short-term losses ($843,000) and long-term losses ($5,706,000).
At June 30, 2019, the aggregate cost of investments for federal income tax purposes was $57,178,132. The net unrealized appreciation for all investments based on tax cost was $1,068,377. This consisted of aggregate gross unrealized appreciation for all investments in which there was an excess of value over tax
Deutsche DWS Variable Series II — DWS High Income VIP | | | 17 |
Table of Contents
cost of $1,817,945 and aggregate gross unrealized depreciation for all investments in which there was an excess of tax cost over value of $749,568.
The Fund has reviewed the tax positions for the open tax years as of December 31, 2018 and has determined that no provision for income tax and/or uncertain tax positions is required in the Fund’s financial statements. The Fund’s federal tax returns for the prior three fiscal years remain open subject to examination by the Internal Revenue Service.
Distribution of Income and Gains. Distributions from net investment income of the Fund, if any, are declared and distributed to shareholders annually. Net realized gains from investment transactions, in excess of available capital loss carryforwards, would be taxable to the Fund if not distributed and, therefore, will be distributed to shareholders at least annually. The Fund may also make additional distributions for tax purposes if necessary.
The timing and characterization of certain income and capital gain distributions are determined annually in accordance with federal tax regulations which may differ from accounting principles generally accepted in the United States of America. These differences primarily relate to investments in swap contracts and certain securities sold at a loss. As a result, net investment income (loss) and net realized gain (loss) on investment transactions for a reporting period may differ significantly from distributions during such period. Accordingly, the Fund may periodically make reclassifications among certain of its capital accounts without impacting the net asset value of the Fund.
The tax character of current year distributions will be determined at the end of the current fiscal year.
Expenses. Expenses of the Trust arising in connection with a specific fund are allocated to that fund. Other Trust expenses which cannot be directly attributed to a fund are apportioned among the funds in the Trust based upon the relative net assets or other appropriate measures.
Contingencies. In the normal course of business, the Fund may enter into contracts with service providers that contain general indemnification clauses. The Fund’s maximum exposure under these arrangements is unknown, as this would involve future claims that may be made against the Fund that have not yet been made. However, based on experience, the Fund expects the risk of loss to be remote.
Other. Investment transactions are accounted for on a trade date plus one basis for daily net asset value calculations. However, for financial reporting purposes, investment transactions are reported on trade date. Interest income is recorded on the accrual basis. Dividend income is recorded on ex-dividend date. Realized gains and losses from investment transactions are recorded on an identified cost basis. Proceeds from litigation payments, if any, are included in net realized gain (loss) from investments. All discounts and premiums are accreted/amortized for both tax and financial reporting purposes for the Fund, with the exception of securities in default of principal.
B. Derivative Instruments
Forward Foreign Currency Exchange Contracts. A forward foreign currency exchange contract (“forward currency contract”) is a commitment to purchase or sell a foreign currency at the settlement date at a negotiated rate. For the six months ended June 30, 2019, the Fund entered into forward currency contracts in order to hedge its exposure to changes in foreign currency exchange rates on its foreign currency denominated portfolio holdings and to facilitate transactions in foreign currency denominated securities.
Forward currency contracts are valued at the prevailing forward exchange rate of the underlying currencies and unrealized gain (loss) is recorded daily. On the settlement date of the forward currency contract, the Fund records a realized gain or loss equal to the difference between the value of the contract at the time it was opened and the value of the contract at the time it was closed. Certain risks may arise upon entering into forward currency contracts from the potential inability of counterparties to meet the terms of their contracts. The maximum counterparty credit risk to the Fund is measured by the unrealized gain on appreciated contracts. Additionally, when utilizing forward currency contracts to hedge, the Fund gives up the opportunity to profit from favorable exchange rate movements during the term of the contract.
A summary of the open forward currency contracts as of June 30, 2019 is included in a table following the Fund’s Investment Portfolio. For the six months ended June 30, 2019, the investment in forward currency contracts short vs. U.S. dollars had a total contract value generally indicative of a range from approximately $719,000 to $1,151,000.
| 18 | | | Deutsche DWS Variable Series II — DWS High Income VIP |
Table of Contents
The following table summarizes the value of the Fund’s derivative instruments held as of June 30, 2019 and the related location in the accompanying Statement of Assets and Liabilities, presented by primary underlying risk exposure:
| Asset Derivative | Forward Contract | |||
| Foreign Exchange Contract (a) | $ | 1,715 | ||
The above derivative is located in the following Statement of Assets and Liabilities account:
| (a) | Unrealized appreciation on forward foreign currency contract. |
Additionally, the amount of unrealized and realized gains and losses on derivative instruments recognized in Fund earnings during the six months ended June 30, 2019 and the related location in the accompanying Statement of Operations is summarized in the following tables by primary underlying risk exposure:
| Realized Gain (Loss) | Forward Contract | |||
| Foreign Exchange Contracts (b) | $ | 13,763 | ||
The above derivatives is located in the following Statement of Operations accounts:
| (b) | Net realized gain (loss) from forward foreign currency contracts |
| Change in Net Unrealized Appreciation (Depreciation) | Forward Contract | |||
| Foreign Exchange Contract (c) | $ | 3,151 | ||
The above derivative is located in the following Statement of Operations accounts:
| (c) | Change in net unrealized appreciation (depreciation) on forward foreign currency contracts |
As of June 30, 2019, the Fund has transactions subject to enforceable master netting agreements which govern the terms of certain transactions, and reduce the counterparty risk associated with such transactions. Master netting agreements allow a Fund to close out and net total exposure to a counterparty in the event of a deterioration in the credit quality or contractual default with respect to all of the transactions with a counterparty. As defined by the master netting agreement, the Fund may have collateral agreements with certain counterparties to mitigate risk. For financial reporting purposes the Statement of Assets and Liabilities generally shows derivatives assets and liabilities on a gross basis, which reflects the full risks and exposures prior to netting. A reconciliation of the gross amounts on the Statement of Assets and Liabilities to the net amounts by a counterparty, including any collateral exposure, is included in the following table:
| Counterparty | Gross Amounts of Assets Presented in the Statement of Assets and Liabilities | Financial Instruments and Derivatives Available for Offset | Collateral Pledged | Net Amount of Derivative Assets | ||||||||||||
| State Street Bank and Trust | $ | 1,715 | $ | — | $ | — | $ | 1,715 | ||||||||
C. Purchases and Sales of Securities
During the six months ended June 30, 2019, purchases and sales of investment transactions (excluding short-term investments and U.S. Treasury securities) aggregated $21,223,244 and $21,949,008, respectively.
D. Related Parties
Management Agreement. Under the Investment Management Agreement with DWS Investment Management Americas, Inc. (“DIMA” or the “Advisor”), an indirect, wholly owned subsidiary of DWS Group GmbH & Co. KGaA (“DWS Group”), the Advisor directs the investments of the Fund in accordance with its investment objectives, policies and restrictions. The Advisor determines the securities, instruments and other contracts relating to investments to be purchased, sold or entered into by the Fund.
Deutsche DWS Variable Series II — DWS High Income VIP | | | 19 |
Table of Contents
Pursuant to the Investment Management Agreement with the Advisor, the Fund pays a monthly management fee based on the Fund’s average daily net assets, computed and accrued daily and payable monthly, at the following annual rates:
| First $250 million | .500 | % | ||
| Next $750 million | .470 | % | ||
| Next $1.5 billion | .450 | % | ||
| Next $2.5 billion | .430 | % | ||
| Next $2.5 billion | .400 | % | ||
| Next $2.5 billion | .380 | % | ||
| Next $2.5 billion | .360 | % | ||
| Over $12.5 billion | .340 | % |
Accordingly, for the six months ended June 30, 2019, the fee pursuant to the Investment Management Agreement was equivalent to an annualized rate (exclusive of any applicable waivers/reimbursements) of 0.50% of the Fund’s average daily net assets.
For the period from January 1, 2019 through April 30, 2020, the Advisor has contractually agreed to waive all or a portion of its fees and/or reimburse certain operating expenses of the Fund to the extent necessary to maintain the total annual operating expenses (excluding certain expenses such as extraordinary expenses, taxes, brokerage and interest expense) of each class as follows:
| Class A | .68 | % | ||
| Class B | .94 | % |
For the six months ended June 30, 2019, fees waived and/or expenses reimbursed for each class were as follows:
| Class A | $ | 76,719 | ||
| Class B | 307 | |||
| $ | 77,026 |
Administration Fee. Pursuant to an Administrative Services Agreement, DIMA provides most administrative services to the Fund. For all services provided under the Administrative Services Agreement, the Fund pays DIMA an annual fee (“Administration Fee”) of 0.10% of the Fund’s average daily net assets, computed and accrued daily and payable monthly. For the six months ended June 30, 2019, the Administration Fee was $27,319, of which $4,549 is unpaid.
Service Provider Fees. DWS Service Company (“DSC”), an affiliate of the Advisor, is the transfer agent, dividend-paying agent and shareholder service agent for the Fund. Pursuant to a sub-transfer agency agreement between DSC and DST Systems, Inc. (“DST”), DSC has delegated certain transfer agent, dividend-paying agent and shareholder service agent functions to DST. DSC compensates DST out of the shareholder servicing fee it receives from the Fund. For the six months ended June 30, 2019, the amounts charged to the Fund by DSC were as follows:
| Services to Shareholders | Total Aggregated | Unpaid at June 30, 2019 | ||||||
| Class A | $ | 133 | $ | 45 | ||||
| Class B | 25 | 8 | ||||||
| $ | 158 | $ | 53 | |||||
Distribution Service Agreement. Under the Fund’s Class B 12b-1 plan, DWS Distributors, Inc. (“DDI”) received a fee (“Distribution Service Fee”) of 0.25% of average daily net assets of Class B shares. For the six months ended June 30, 2019, the Distribution Service Fee was $170, of which $29 is unpaid.
Typesetting and Filing Service Fees. Under an agreement with the Fund, DIMA is compensated for providing certain pre-press and regulatory filing services to the Fund. For the six months ended June 30, 2019, the amount charged to the Fund by DIMA included in the Statement of Operations under “Reports to shareholders” aggregated $5,853, all of which is unpaid.
| 20 | | | Deutsche DWS Variable Series II — DWS High Income VIP |
Table of Contents
Trustees’ Fees and Expenses. The Fund paid retainer fees to each Trustee not affiliated with the Advisor, plus specified amounts to the Board Chairperson and to each committee Chairperson.
Affiliated Cash Management Vehicles. The Fund may invest uninvested cash balances in DWS Central Cash Management Government Fund and DWS ESG Liquidity Fund, affiliated money market funds which are managed by the Advisor. Each affiliated money market fund is managed in accordance with Rule 2a-7 under the 1940 Act, which governs the quality, maturity, diversity and liquidity of instruments in which a money market fund may invest. DWS Central Cash Management Government Fund seeks to maintain a stable net asset value, and DWS ESG Liquidity Fund maintains a floating net asset value. The Fund indirectly bears its proportionate share of the expenses of each affiliated money market fund in which it invests. DWS Central Cash Management Government Fund does not pay the Advisor an investment management fee. To the extent that DWS ESG Liquidity Fund pays an investment management fee to the Advisor, the Advisor will waive an amount of the investment management fee payable to the Advisor by the Fund equal to the amount of the investment management fee payable on the Fund’s assets invested in DWS ESG Liquidity Fund.
Security Lending Fees. Deutsche Bank AG serves as lending agent for the Fund. For the six months ended June 30, 2019, the Fund incurred lending agent fees to Deutsche Bank AG for the amount of $379.
E. Investing in High-Yield Debt Securities
High-yield debt securities or junk bonds are generally regarded as speculative with respect to the issuer’s continuing ability to meet principal and interest payments. The Fund’s performance could be hurt if an issuer of a debt security suffers an adverse change in financial condition that results in the issuer not making timely payments of interest or principal, a security downgrade or an inability to meet a financial obligation. High-yield debt securities’ total return and yield may generally be expected to fluctuate more than the total return and yield of investment-grade debt securities. A real or perceived economic downturn or an increase in market interest rates could cause a decline in the value of high-yield debt securities, result in increased redemptions and/or result in increased portfolio turnover, which could result in a decline in net asset value of the fund, reduce liquidity for certain investments and/or increase costs. High-yield debt securities are often thinly traded and can be more difficult to sell and value accurately than investment-grade debt securities as there may be no established secondary market. Investments in high yield debt securities could increase liquidity risk for the fund. In addition, the market for high-yield debt securities can experience sudden and sharp volatility which is generally associated more with investments in stocks.
F. Ownership of the Fund
At June 30, 2019, two participating insurance companies were owners of record of 10% or more of the total outstanding Class A shares of the Fund, each owning 72% and 19%. One participating insurance company was owner of record of 10% or more of the total outstanding Class B shares of the Fund, owning 94%.
G. Line of Credit
The Fund and other affiliated funds (the “Participants”) share in a $400 million revolving credit facility provided by a syndication of banks. The Fund may borrow for temporary or emergency purposes, including the meeting of redemption requests that otherwise might require the untimely disposition of securities. The Participants are charged an annual commitment fee which is allocated based on net assets, among each of the Participants. Interest is calculated at a rate per annum equal to the sum of the Federal Funds Rate plus 1.25 percent plus if the one-month LIBOR exceeds the Federal Funds Rate, the amount of such excess. The Fund may borrow up to a maximum of 33 percent of its net assets under the agreement. The Fund had no outstanding loans at June 30, 2019.
Deutsche DWS Variable Series II — DWS High Income VIP | | | 21 |
Table of Contents
| Information About Your Fund’s Expenses | (Unaudited) |
As an investor of the Fund, you incur two types of costs: ongoing expenses and transaction costs. Ongoing expenses include management fees, distribution and service (12b-1) fees and other Fund expenses. Examples of transaction costs include contract charges, which are not shown in this section. The following tables are intended to help you understand your ongoing expenses (in dollars) of investing in the Fund and to help you compare these expenses with the ongoing expenses of investing in other mutual funds. In the most recent six-month period, the Fund limited these expenses; had it not done so, expenses would have been higher. The example in the table is based on an investment of $1,000 invested at the beginning of the six-month period and held for the entire period (January 1, 2019 to June 30, 2019).
The tables illustrate your Fund’s expenses in two ways:
| – | Actual Fund Return.This helps you estimate the actual dollar amount of ongoing expenses (but not transaction costs) paid on a $1,000 investment in the Fund using the Fund’s actual return during the period. To estimate the expenses you paid over the period, simply divide your account value by $1,000 (for example, an $8,600 account value divided by $1,000 = 8.6), then multiply the result by the number in the “Expenses Paid per $1,000” line under the share class you hold. |
| – | Hypothetical 5% Fund Return.This helps you to compare your Fund’s ongoing expenses (but not transaction costs) with those of other mutual funds using the Fund’s actual expense ratio and a hypothetical rate of return of 5% per year before expenses. Examples using a 5% hypothetical Fund return may be found in the shareholder reports of other mutual funds. The hypothetical account values and expenses may not be used to estimate the actual ending account balance or expenses you paid for the period. |
Please note that the expenses shown in these tables are meant to highlight your ongoing expenses only and do not reflect any transaction costs. The “Expenses Paid per $1,000” line of the tables is useful in comparing ongoing expenses only and will not help you determine the relative total expense of owning different funds. If these transaction costs had been included, your costs would have been higher.
| Expenses and Value of a $1,000 Investment for the six months ended June 30, 2019 | ||||||||
| Actual Fund Return | Class A | Class B | ||||||
| Beginning Account Value 1/1/19 | $ | 1,000.00 | $ | 1,000.00 | ||||
| Ending Account Value 6/30/19 | $ | 1,108.60 | $ | 1,107.20 | ||||
| Expenses Paid per $1,000* | $ | 3.56 | $ | 4.91 | ||||
| Hypothetical 5% Fund Return | Class A | Class B | ||||||
| Beginning Account Value 1/1/19 | $ | 1,000.00 | $ | 1,000.00 | ||||
| Ending Account Value 6/30/19 | $ | 1,021.42 | $ | 1,020.13 | ||||
| Expenses Paid per $1,000* | $ | 3.41 | $ | 4.71 | ||||
| * | Expenses are equal to the Fund’s annualized expense ratio for each share class, multiplied by the average account value over the period, multiplied by 181 (the number of days in the most recent six-month period), then divided by 365. |
| Annualized Expense Ratios | Class A | Class B | ||||||
| Deutsche DWS Variable Series II — DWS High Income VIP | .68 | % | .94 | % | ||||
For more information, please refer to the Fund’s prospectus.
These tables do not reflect charges and fees (“contract charges”) associated with the separate account that invests in the Fund or any variable life insurance policy or variable annuity contract for which the Fund is an investment option.
For an analysis of the fees associated with an investment in the Fund or similar funds, please refer to the current and hypothetical expense calculators for Variable Insurance Products which can be found at dws.com/calculators.
| 22 | | | Deutsche DWS Variable Series II — DWS High Income VIP |
Table of Contents
| Proxy Voting |
The Trust’s policies and procedures for voting proxies for portfolio securities and information about how the Trust voted proxies related to its portfolio securities during the most recent 12-month period ended June 30 are available on our Web site — dws.com/en-us/resources/proxy-voting — or on the SEC’s Web site — sec.gov. To obtain a written copy of the Trust’s policies and procedures without charge, upon request, call us toll free at (800) 728-3337.
Deutsche DWS Variable Series II — DWS High Income VIP | | | 23 |
Table of Contents
Advisory Agreement Board Considerations and Fee Evaluation
The Board of Trustees (hereinafter referred to as the “Board” or “Trustees”) approved the renewal of DWS High Income VIP’s (the “Fund”) investment management agreement (the “Agreement”) with DWS Investment Management Americas, Inc. (“DIMA”) in September 2018.
In terms of the process that the Board followed prior to approving the Agreement, shareholders should know that:
| – | During the entire process, all of the Fund’s Trustees were independent of DIMA and its affiliates (the “Independent Trustees”). |
| – | The Board met frequently during the past year to discuss fund matters and dedicated a substantial amount of time to contract review matters. Over the course of several months, the Board’s Contract Committee reviewed extensive materials received from DIMA, independent third parties and independent counsel. These materials included an analysis of the Fund’s performance, fees and expenses, and profitability from a fee consultant retained by the Fund’s Independent Trustees (the “Fee Consultant”). Based on its evaluation of the information provided, the Contract Committee presented its findings and recommendations to the Board. The Board then reviewed the Contract Committee’s findings and recommendations. |
| – | The Board also received extensive information throughout the year regarding performance of the Fund. |
| – | The Independent Trustees regularly met privately with counsel to discuss contract review and other matters. In addition, the Independent Trustees were advised by the Fee Consultant in the course of their review of the Fund’s contractual arrangements and considered a comprehensive report prepared by the Fee Consultant in connection with their deliberations. |
| – | In connection with reviewing the Agreement, the Board also reviewed the terms of the Fund’s Rule 12b-1 plan, distribution agreement, administrative services agreement, transfer agency agreement and other material service agreements. |
In connection with the contract review process, the Contract Committee and the Board considered the factors discussed below, among others. The Board also considered that DIMA and its predecessors have managed the Fund since its inception, and the Board believes that a long-term relationship with a capable, conscientious advisor is in the best interests of the Fund. The Board considered, generally, that shareholders chose to invest or remain invested in the Fund knowing that DIMA managed the Fund. DIMA is part of DWS Group GmbH & Co. KGaA (“DWS Group”). DWS Group is a global asset management business that offers a wide range of investing expertise and resources, including research capabilities in many countries throughout the world. In 2018, approximately 20% of DWS Group’s shares were sold in an initial public offering, with Deutsche Bank AG owning the remaining shares.
As part of the contract review process, the Board carefully considered the fees and expenses of each DWS fund overseen by the Board in light of the fund’s performance. In many cases, this led to the negotiation and implementation of expense caps. As part of these negotiations, the Board indicated that it would consider relaxing these caps in future years following sustained improvements in performance, among other considerations.
While shareholders may focus primarily on fund performance and fees, the Fund’s Board considers these and many other factors, including the quality and integrity of DIMA’s personnel and administrative support services provided by DIMA, such as back-office operations, fund valuations, and compliance policies and procedures.
Nature, Quality and Extent of Services.The Board considered the terms of the Agreement, including the scope of advisory services provided under the Agreement. The Board noted that, under the Agreement, DIMA provides portfolio management services to the Fund and that, pursuant to a separate administrative services agreement, DIMA provides administrative services to the Fund. The Board considered the experience and skills of senior management and investment personnel and the resources made available to such personnel. The Board reviewed the Fund’s performance over short-term and long-term periods and compared those returns to various agreed-upon performance measures, including market index(es) and a peer universe compiled using information supplied by Morningstar Direct (“Morningstar”), an independent fund data service. The Board also noted that it has put into place a process of identifying “Funds in Review” (e.g., funds performing poorly relative to a peer universe), and receives additional reporting from DIMA regarding such funds and, where appropriate, DIMA’s plans to address underperformance. The Board
| 24 | | | Deutsche DWS Variable Series II — DWS High Income VIP |
Table of Contents
believes this process is an effective manner of identifying and addressing underperforming funds. Based on the information provided, the Board noted that, for the one-, three- and five-year periods ended December 31, 2017, the Fund’s performance (Class A shares) was in the 2nd quartile, 4th quartile and 3rd quartile, respectively, of the applicable Morningstar universe (the 1st quartile being the best performers and the 4th quartile being the worst performers). The Board also observed that the Fund has outperformed its benchmark in the one-year period and has underperformed its benchmark in the three- and five-year periods ended December 31, 2017. The Board noted the disappointing investment performance of the Fund in some past periods and continued to discuss with senior management of DIMA the factors contributing to such underperformance and actions being taken to improve performance. The Board observed that the Fund had experienced improved relative performance in 2017 and during the first eight months of 2018. The Board recognized the efforts by DIMA in recent years to enhance its investment platform and improve long-term performance across the DWS fund complex.
Fees and Expenses. The Board considered the Fund’s investment management fee schedule, operating expenses and total expense ratios, and comparative information provided by Broadridge Financial Solutions, Inc. (“Broadridge”) and the Fee Consultant regarding investment management fee rates paid to other investment advisors by similar funds (1st quartile being the most favorable and 4th quartile being the least favorable). With respect to management fees paid to other investment advisors by similar funds, the Board noted that the contractual fee rates paid by the Fund, which include a 0.10% fee paid to DIMA under the Fund’s administrative services agreement, were lower than the median (1st quartile) of the applicable Broadridge peer group (based on Broadridge data provided as of December 31, 2017). The Board noted that the Fund’s Class A shares total (net) operating expenses were expected to be lower than the median (2nd quartile) of the applicable Broadridge expense universe (based on Broadridge data provided as of December 31, 2017, and analyzing Broadridge expense universe Class A (net) expenses less any applicable 12b-1 fees) (“Broadridge Universe Expenses”). The Board also reviewed data comparing each share class’s total (net) operating expenses to the applicable Broadridge Universe Expenses. The Board noted that the expense limitations agreed to by DIMA were expected to help the Fund’s total (net) operating expenses remain competitive. The Board considered the Fund’s management fee rate as compared to fees charged by DIMA to comparable DWS U.S. registered funds (“DWS Funds”) and considered differences between the Fund and the comparable DWS Funds. The information requested by the Board as part of its review of fees and expenses also included information about institutional accounts (including any sub-advised funds and accounts) and funds offered primarily to European investors (“DWS Europe Funds”) managed by DWS Group. The Board noted that DIMA indicated that DWS Group does not manage any institutional accounts or DWS Europe Funds comparable to the Fund.
On the basis of the information provided, the Board concluded that management fees were reasonable and appropriate in light of the nature, quality and extent of services provided by DIMA.
Profitability. The Board reviewed detailed information regarding revenues received by DIMA under the Agreement. The Board considered the estimated costs to DIMA, and pre-tax profits realized by DIMA, from advising the DWS Funds, as well as estimates of the pre-tax profits attributable to managing the Fund in particular. The Board also received information regarding the estimated enterprise-wide profitability of DIMA and its affiliates with respect to all fund services in totality and by fund. The Board and the Fee Consultant reviewed DIMA’s methodology in allocating its costs to the management of the Fund. Based on the information provided, the Board concluded that the pre-tax profits realized by DIMA in connection with the management of the Fund were not unreasonable. The Board also reviewed certain publicly available information regarding the profitability of certain similar investment management firms. The Board noted that, while information regarding the profitability of such firms is limited (and in some cases is not necessarily prepared on a comparable basis), DIMA and its affiliates’ overall profitability with respect to the DWS Funds (after taking into account distribution and other services provided to the funds by DIMA and its affiliates) was lower than the overall profitability levels of most comparable firms for which such data was available.
Economies of Scale. The Board considered whether there are economies of scale with respect to the management of the Fund and whether the Fund benefits from any economies of scale. The Board noted that the Fund’s investment management fee schedule includes fee breakpoints. The Board concluded that the Fund’s fee schedule represents an appropriate sharing between the Fund and DIMA of such economies of scale as may exist in the management of the Fund at current asset levels.
Other Benefits to DIMA and Its Affiliates. The Board also considered the character and amount of other incidental or “fall-out” benefits received by DIMA and its affiliates, including any fees received by DIMA for administrative services provided to the Fund, any fees received by an affiliate of DIMA for transfer agency
Deutsche DWS Variable Series II — DWS High Income VIP | | | 25 |
Table of Contents
services provided to the Fund and any fees received by an affiliate of DIMA for distribution services. The Board also considered benefits to DIMA related to brokerage and soft-dollar allocations, including allocating brokerage to pay for research generated by parties other than the executing broker dealers, which pertain primarily to funds investing in equity securities. In addition, the Board considered the incidental public relations benefits to DIMA related to DWS Funds advertising and cross-selling opportunities among DIMA products and services. The Board considered these benefits in reaching its conclusion that the Fund’s management fees were reasonable.
Compliance. The Board considered the significant attention and resources dedicated by DIMA to its compliance processes in recent years. The Board noted in particular (i) the experience, seniority and time commitment of the individuals serving as DIMA’s and the Fund’s chief compliance officers and (ii) the substantial commitment of resources by DIMA and its affiliates to compliance matters, including the retention of compliance personnel.
Based on all of the information considered and the conclusions reached, the Board unanimously determined that the continuation of the Agreement is in the best interests of the Fund. In making this determination, the Board did not give particular weight to any single factor identified above. The Board considered these factors over the course of numerous meetings, certain of which were in executive session with only the Independent Trustees and counsel present. It is possible that individual Independent Trustees may have weighed these factors differently in reaching their individual decisions to approve the continuation of the Agreement.
| 26 | | | Deutsche DWS Variable Series II — DWS High Income VIP |
Table of Contents
Notes
Table of Contents
|
VS2HI-3 (R-028385-8 8/19) |
Table of Contents
June 30, 2019
Semiannual Report
Deutsche DWS Variable Series II
DWS International Growth VIP
Beginning on January 1, 2021, as permitted by regulations adopted by the Securities and Exchange Commission, you may not be receiving paper copies of the Fund’s shareholder reports from the insurance company that offers your contract unless you specifically request paper copies from your insurance company or from your financial intermediary. Instead, the shareholder reports will be made available on a Web site, and your insurance company will notify you by mail each time a report is posted and provide you with a Web site link to access the report. Instructions for requesting paper copies will be provided by your insurance company.
If you already elected to receive shareholder reports electronically, you will not be affected by this change and you need not take any action. You may elect to receive shareholder reports and other communications from your insurance company electronically by following the instructions provided by your insurance company.
You may elect to receive all future reports in paper free of charge from your insurance company. If your insurance company informs you that future reports will be delivered via Web access, you can inform your insurance company that you wish to continue receiving paper copies of your shareholder reports by following the instructions provided by your insurance company.

Table of Contents
This report must be preceded or accompanied by a prospectus. To obtain an additional prospectus or summary prospectus, if available, call (800)728-3337 or your financial representative. We advise you to consider the Fund’s objectives, risks, charges and expenses carefully before investing. The summary prospectus and prospectus contain this and other important information about the Fund. Please read the prospectus carefully before you invest.
Stocks may decline in value. Smaller company stocks tend to be more volatile thanmedium-sized or large company stocks. Investing in foreign securities, particularly those of emerging markets, presents certain risks, such as currency fluctuations, political and economic changes, and market risks. Emerging markets tend to be more volatile and less liquid than the markets of more mature economies, and generally have less diverse and less mature economic structures and less stable political systems than those of developed countries. Investing in derivatives entails special risks relating to liquidity, leverage and credit that may reduce returns and/or increase volatility. The Fund may lend securities to approved institutions. Please read prospectus for details.
The brand DWS represents DWS Group GmbH & Co. KGaA and any of its subsidiaries such as DWS Distributors, Inc. which offers investment products or DWS Investment Management Americas, Inc. and RREEF America L.L.C. which offer advisory services.
DWS Distributors, Inc., 222 South Riverside Plaza, Chicago, IL 60606, (800)621-1148
NOT FDIC/NCUA INSURED NO BANK GUARANTEE MAY LOSE VALUE NOT A DEPOSIT
NOT INSURED BY ANY FEDERAL GOVERNMENT AGENCY
| 2 | | | Deutsche DWS Variable Series II — DWS International Growth VIP |
Table of Contents
| Performance Summary | June 30, 2019 (Unaudited) |
Fund performance shown is historical, assumes reinvestment of all dividend and capital gain distributions and does not guarantee future results. Investment return and principal value fluctuate with changing market conditions so that, when redeemed, shares may be worth more or less than their original cost. Current performance may be lower or higher than the performance data quoted. Please contact your participating insurance company for the Fund’s most recentmonth-end performance. Performance does not reflect charges and fees (“contract charges”) associated with the separate account that invests in the Fund or any variable life insurance policy or variable annuity contract for which the Fund is an investment option. These charges and fees will reduce returns. While all share classes have the same underlying portfolio, their performance will differ.
The gross expense ratios of the Fund, as stated in the fee table of the prospectus dated May 1, 2019 are 1.72% and 2.07% for Class A and Class B shares, respectively, and may differ from the expense ratios disclosed in the Financial Highlights tables in this report.
Generally accepted accounting principles require adjustments to be made to the net assets of the Fund at period end for financial reporting purposes only, and as such, the total return based on the unadjusted net asset value per share may differ from the total return reported in the financial highlights.
Growth of an Assumed $10,000 Investment in DWS International Growth VIP
| TheMSCIAll Country Worldex-USAIndexis designed to provide a broad measure of stock performance throughout the world, with the exception of U.S.-based companies. The MSCI All Country World ex-USA Index includes both developed and emerging markets.
Index returns do not reflect any fees or expenses and it is not possible to invest directly into an index. |
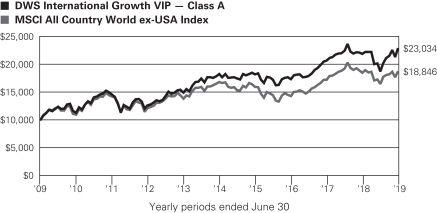
| Comparative Results | ||||||||||||
| DWS International Growth VIP | 6-Month‡ | 1-Year | 3-Year | 5-Year | 10-Year | |||||||
| Class A | Growth of $10,000 | $12,253 | $10,473 | $13,224 | $12,552 | $23,034 | ||||||
| Average annual total return | 22.53% | 4.73% | 9.76% | 4.65% | 8.70% | |||||||
| MSCI All Country World ex-USA Index | Growth of $10,000 | $11,360 | $10,129 | $13,088 | $11,130 | $18,846 | ||||||
| Average annual total return | 13.60% | 1.29% | 9.39% | 2.16% | 6.54% | |||||||
| DWS International Growth VIP | 6-Month‡ | 1-Year | 3-Year | 5-Year | 10-Year | |||||||
| Class B | Growth of $10,000 | $12,236 | $10,437 | $13,135 | $12,366 | $22,307 | ||||||
| Average annual total return | 22.36% | 4.37% | 9.52% | 4.34% | 8.35% | |||||||
| MSCI All Country World ex-USA Index | Growth of $10,000 | $11,360 | $10,129 | $13,088 | $11,130 | $18,846 | ||||||
| Average annual total return | 13.60% | 1.29% | 9.39% | 2.16% | 6.54% | |||||||
The growth of $10,000 is cumulative.
| ‡ | Total returns shown for periods less than one year are not annualized. |
Deutsche DWS Variable Series II — DWS International Growth VIP | | | 3 |
Table of Contents
| Portfolio Summary | (Unaudited) |
| Asset Allocation (As a % of Investment Portfolio excluding Securities Lending Collateral) | 6/30/19 | 12/31/18 | ||||||
| Common Stocks | 98% | 99% | ||||||
| Cash Equivalents | 2% | 1% | ||||||
| Preferred Stocks | 0% | 0% | ||||||
| Warrants | — | 0% | ||||||
| 100% | 100% | |||||||
Sector Diversification (As a % of Investment Portfolio excluding Cash Equivalents and Securities Lending Collateral) | 6/30/19 | 12/31/18 | ||||||
| Financials | 19% | 20% | ||||||
| Information Technology | 19% | 14% | ||||||
| Industrials | 16% | 15% | ||||||
| Health Care | 15% | 14% | ||||||
| Consumer Discretionary | 13% | 15% | ||||||
| Consumer Staples | 8% | 7% | ||||||
| Materials | 5% | 6% | ||||||
| Communication Services | 3% | 7% | ||||||
| Energy | 2% | 2% | ||||||
| 100% | 100% | |||||||
Geographical Diversification (As a % of Investment Portfolio excluding Cash Equivalents and Securities Lending Collateral) | 6/30/19 | 12/31/18 | ||||||
| France | 13% | 11% | ||||||
| Germany | 12% | 13% | ||||||
| Canada | 10% | 10% | ||||||
| Japan | 10% | 12% | ||||||
| Switzerland | 9% | 9% | ||||||
| China | 8% | 8% | ||||||
| United Kingdom | 7% | 7% | ||||||
| United States | 6% | 7% | ||||||
| Netherlands | 4% | 4% | ||||||
| Sweden | 3% | 3% | ||||||
| Singapore | 2% | 2% | ||||||
| Argentina | 2% | 2% | ||||||
| Korea | 2% | 2% | ||||||
| Ireland | 2% | 1% | ||||||
| Other | 10% | 9% | ||||||
| 100% | 100% | |||||||
Portfolio holdings and characteristics are subject to change.
For more complete details about the Fund’s investment portfolio, see page 5.
Following the Fund’s fiscal first and thirdquarter-end, a complete portfolio holdings listing is filed with the SEC on FormN-Q or Form N-PORT (available for filings after March 31, 2019). The Fund’s Form N-Q or Form N-PORT will be available on the SEC’s Web site at sec.gov. The Fund’s portfolio holdings are also posted on dws.com from time to time. Please read the Fund’s current prospectus for more information.
Sebastian P. Werner, PhD, Director
Mark Schumann, CFA, Director
Portfolio Managers
| 4 | | | Deutsche DWS Variable Series II — DWS International Growth VIP |
Table of Contents
| as of June 30, 2019 (Unaudited) |
| Shares | Value ($) | |||||||
| Common Stocks 96.9% | ||||||||
| Argentina 2.1% | ||||||||
Globant SA* (a) | 3,200 | 323,360 | ||||||
Grupo Supervielle SA (ADR) (b) | 3,900 | 30,732 | ||||||
|
| |||||||
(Cost $226,943) | 354,092 | |||||||
| Brazil 1.0% | ||||||||
Pagseguro Digital Ltd. “A”* (a) (Cost $107,563) | 4,050 | 157,829 | ||||||
| Canada 9.9% | ||||||||
Agnico Eagle Mines Ltd. | 4,850 | 248,657 | ||||||
Alimentation Couche-Tard, Inc. “B” | 4,081 | 256,817 | ||||||
Brookfield Asset Management, Inc. “A” | 9,386 | 449,034 | ||||||
Canada Goose Holdings, Inc.* (b) | 3,086 | 119,453 | ||||||
Canadian National Railway Co. | 2,508 | 232,118 | ||||||
Gildan Activewear, Inc. | 2,315 | 89,591 | ||||||
Toronto-Dominion Bank | 4,295 | 250,967 | ||||||
|
| |||||||
(Cost $1,038,892) | 1,646,637 | |||||||
| China 7.9% | ||||||||
Alibaba Group Holding Ltd. (ADR)* | 1,500 | 254,175 | ||||||
Luckin Coffee, Inc. (ADR)* (b) | 3,325 | 64,804 | ||||||
Minth Group Ltd. | 26,870 | 72,563 | ||||||
Momo, Inc. (ADR) | 3,200 | 114,560 | ||||||
New Oriental Education & Technology Group, Inc. (ADR)* | 1,200 | 115,896 | ||||||
Ping An Healthcare and Technology Co., Ltd. 144A* | 2,100 | 8,779 | ||||||
Ping An Insurance (Group) Co. of China Ltd. “H” | 34,000 | 408,774 | ||||||
Tencent Holdings Ltd. | 6,200 | 280,016 | ||||||
|
| |||||||
(Cost $965,169) | 1,319,567 | |||||||
| Denmark 0.7% | ||||||||
Chr Hansen Holding AS | 1,148 | 107,825 | ||||||
| Finland 0.9% | ||||||||
Sampo Oyj “A” (Cost $144,794) | 3,010 | 142,125 | ||||||
| France 12.9% | ||||||||
Airbus SE | 1,186 | 168,287 | ||||||
BNP Paribas SA | 1,785 | 84,802 | ||||||
Capgemini SE | 2,140 | 265,927 | ||||||
EssilorLuxottica SA | 793 | 103,420 | ||||||
LVMH Moet Hennessy Louis Vuitton SE | 855 | 364,045 | ||||||
Orpea | 700 | 84,516 | ||||||
SMCP SA 144A* | 7,900 | 133,673 | ||||||
Teleperformance | 1,174 | 235,300 | ||||||
Total SA | 4,716 | 264,204 | ||||||
VINCI SA | 2,630 | 269,405 | ||||||
Vivendi SA | 5,950 | 163,692 | ||||||
|
| |||||||
(Cost $1,886,969) | 2,137,271 | |||||||
| Germany 11.7% | ||||||||
adidas AG | 310 | 95,783 | ||||||
Allianz SE (Registered) | 1,125 | 271,324 | ||||||
BASF SE | 2,275 | 165,680 | ||||||
| Shares | Value ($) | |||||||
Continental AG | 557 | 81,166 | ||||||
Deutsche Boerse AG | 2,693 | 381,077 | ||||||
Deutsche Post AG (Registered) | 2,588 | 85,090 | ||||||
Evonik Industries AG | 5,610 | 163,779 | ||||||
Fresenius Medical Care AG & Co. KGaA | 3,000 | 235,938 | ||||||
LANXESS AG | 2,149 | 127,985 | ||||||
SAP SE | 1,621 | 222,703 | ||||||
Siemens AG (Registered) | 1,000 | 119,005 | ||||||
|
| |||||||
(Cost $1,923,654) | 1,949,530 | |||||||
| Hong Kong 1.0% | ||||||||
Techtronic Industries Co., Ltd. (Cost $51,080) | 21,597 | 165,782 | ||||||
| Ireland 1.4% | ||||||||
Kerry Group PLC “A” | 1,955 | 233,287 | ||||||
| Japan 9.9% | ||||||||
Daikin Industries Ltd. | 2,400 | 314,627 | ||||||
Fast Retailing Co., Ltd. | 500 | 303,073 | ||||||
Hoya Corp. | 2,700 | 207,552 | ||||||
Kao Corp. | 1,500 | 114,632 | ||||||
Keyence Corp. | 400 | 246,654 | ||||||
Komatsu Ltd. | 3,500 | 84,647 | ||||||
MISUMI Group, Inc. | 4,911 | 123,762 | ||||||
Mitsubishi UFJ Financial Group, Inc. | 20,800 | 98,965 | ||||||
Pigeon Corp. | 3,700 | 149,008 | ||||||
|
| |||||||
(Cost $1,460,035) | 1,642,920 | |||||||
| Korea 1.4% | ||||||||
Samsung Electronics Co., Ltd. (Cost $253,931) | 5,868 | 238,795 | ||||||
| Luxembourg 1.1% | ||||||||
Eurofins Scientific (Cost $98,434) | 400 | 177,170 | ||||||
| Macau 0.9% | ||||||||
Sands China Ltd. (Cost $163,702) | 30,800 | 147,395 | ||||||
| Malaysia 0.9% | ||||||||
IHH Healthcare Bhd. | 111,500 | 156,423 | ||||||
| Netherlands 3.6% | ||||||||
Adyen NV 144A* | 11 | 8,498 | ||||||
ASML Holding NV | 700 | 146,038 | ||||||
Core Laboratories NV (a) (b) | 755 | 39,471 | ||||||
ING Groep NV | 15,743 | 182,475 | ||||||
Koninklijke Philips NV | 5,000 | 217,499 | ||||||
|
| |||||||
(Cost $630,862) | 593,981 | |||||||
| Norway 0.6% | ||||||||
Mowi ASA (Cost $46,840) | 4,065 | 95,085 | ||||||
| Singapore 2.2% | ||||||||
DBS Group Holdings Ltd. | 19,100 | 366,419 | ||||||
| South Africa 1.1% | ||||||||
Naspers Ltd. “N” (Cost $167,905) | 745 | 181,149 | ||||||
The accompanying notes are an integral part of the financial statements.
Deutsche DWS Variable Series II — DWS International Growth VIP | | | 5 |
Table of Contents
| Shares | Value ($) | |||||||
| Sweden 3.1% | ||||||||
Assa Abloy AB “B” | 6,440 | 145,577 | ||||||
Hexagon AB “B” | 1,750 | 97,269 | ||||||
Nobina AB 144A | 21,995 | 136,677 | ||||||
Spotify Technology SA* (a) | 900 | 131,598 | ||||||
|
| |||||||
(Cost $458,430) | 511,121 | |||||||
| Switzerland 8.8% | ||||||||
Alcon, Inc.* | 615 | 38,081 | ||||||
Julius Baer Group Ltd.* | 1,350 | 60,029 | ||||||
Lonza Group AG (Registered)* | 1,538 | 520,069 | ||||||
Nestle SA (Registered) | 3,349 | 346,657 | ||||||
Novartis AG (Registered) | 3,078 | 280,938 | ||||||
Roche Holding AG (Genusschein) | 783 | 220,466 | ||||||
|
| |||||||
(Cost $960,198) | 1,466,240 | |||||||
| Taiwan 1.0% | ||||||||
Taiwan Semiconductor Manufacturing Co., Ltd. (Cost $127,110) | 21,000 | 160,875 | ||||||
| United Kingdom 6.8% | ||||||||
Clinigen Healthcare Ltd.* | 9,300 | 119,141 | ||||||
Compass Group PLC | 6,790 | 162,805 | ||||||
Experian PLC | 12,839 | 389,040 | ||||||
Farfetch Ltd. “A”* (a) | 3,940 | 81,952 | ||||||
Halma PLC | 5,179 | 133,077 | ||||||
Prudential PLC | 11,150 | 243,302 | ||||||
|
| |||||||
(Cost $879,331) | 1,129,317 | |||||||
| United States 6.0% | ||||||||
Activision Blizzard, Inc. | 2,482 | 117,150 | ||||||
EPAM Systems, Inc.* | 1,310 | 226,761 | ||||||
Marsh & McLennan Companies, Inc. | 1,730 | 172,568 | ||||||
MasterCard, Inc. “A” | 780 | 206,333 | ||||||
| Shares | Value ($) | |||||||
NVIDIA Corp. | 320 | 52,554 | ||||||
Schlumberger Ltd. | 2,500 | 99,350 | ||||||
Thermo Fisher Scientific, Inc. | 429 | 125,989 | ||||||
|
| |||||||
(Cost $590,971) | 1,000,705 | |||||||
Total Common Stocks (Cost $12,875,589) |
| 16,081,540 | ||||||
| Convertible Preferred Stocks 0.1% |
| |||||||
| United States | ||||||||
Providence Service Corp. (c) (Cost $13,600) | 136 | 19,554 | ||||||
| Securities Lending Collateral 1.5% |
| |||||||
DWS Government & Agency Securities Portfolio “DWS Government Cash Institutional Shares”, 2.28% (d) (e) (Cost $246,161) | 246,161 | 246,161 | ||||||
| Cash Equivalents 2.2% | ||||||||
DWS Central Cash Management Government Fund, 2.40% (d) (Cost $372,225) | 372,225 | 372,225 | ||||||
| % of Net Assets | Value ($) | |||||||
Total Investment Portfolio | 100.7 | 16,719,480 | ||||||
| Other Assets and Liabilities, Net | (0.7 | ) | (114,160 | ) | ||||
| Net Assets | 100.0 | 16,605,320 | ||||||
A summary of the Fund’s transactions with affiliated investments during the period ended June 30, 2019 are as follows:
| Value ($) at 12/31/2018 | Purchases Cost ($) | Sales Proceeds ($) | Net Realized Gain/ (Loss) ($) | Net Change in Unrealized Appreciation (Depreciation) ($) | Income ($) | Capital Gain Distributions ($) | Number of Shares at 6/30/2019 | Value ($) at 6/30/2019 | ||||||||||||||||||||||||
Securities Lending Collateral 1.5% |
| |||||||||||||||||||||||||||||||
DWS Government & Agency Securities Portfolio “DWS Government Cash Institutional Shares”, 2.28% (d) (e) |
| |||||||||||||||||||||||||||||||
| 156,436 | 89,725 | (f) | — | — | — | 5,733 | — | 246,161 | 246,161 | |||||||||||||||||||||||
Cash Equivalents 2.2% |
| |||||||||||||||||||||||||||||||
DWS Central Cash Management Government Fund, 2.40% (d) |
| |||||||||||||||||||||||||||||||
| 148,953 | 2,010,254 | 1,786,982 | — | — | 2,512 | — | 372,225 | 372,225 | ||||||||||||||||||||||||
| 305,389 | 2,099,979 | 1,786,982 | — | — | 8,245 | — | 618,386 | 618,386 | ||||||||||||||||||||||||
| * | Non-income producing security. |
| (a) | Listed on the New York Stock Exchange. |
| (b) | All or a portion of these securities were on loan. In addition, “Other Assets and Liabilities, Net” may include pending sales that are also on loan. The value of securities loaned at June 30, 2019 amounted to $247,286, which is 1.5% of net assets. |
| (c) | Investment was valued using significant unobservable inputs. |
| (d) | Affiliated fund managed by DWS Investment Management Americas, Inc. The rate shown is the annualizedseven-day yield at period end. |
| (e) | Represents cash collateral held in connection with securities lending. Income earned by the Fund is net of borrower rebates. |
| (f) | Represents the net increase (purchase cost) or decrease (sales proceeds) in the amount invested in cash collateral for the period ended June 30, 2019. |
144A: Security exempt from registration under Rule 144A of the Securities Act of 1933. These securities may be resold in transactions exempt from registration, normally to qualified institutional buyers.
ADR: American Depositary Receipt
The accompanying notes are an integral part of the financial statements.
| 6 | | | Deutsche DWS Variable Series II — DWS International Growth VIP |
Table of Contents
Fair Value Measurements
Various inputs are used in determining the value of the Fund’s investments. These inputs are summarized in three broad levels. Level 1 includes quoted prices in active markets for identical securities. Level 2 includes other significant observable inputs (including quoted prices for similar securities, interest rates, prepayment speeds and credit risk). Level 3 includes significant unobservable inputs (including the Fund’s own assumptions in determining the fair value of investments). The level assigned to the securities valuations may not be an indication of the risk or liquidity associated with investing in those securities.
The following is a summary of the inputs used as of June 30, 2019 in valuing the Fund’s investments. For information on the Fund’s policy regarding the valuation of investments, please refer to the Security Valuation section of Note A in the accompanying Notes to Financial Statements.
Assets | Level 1 | Level 2 | Level 3 | Total | ||||||||||||
Common Stocks | ||||||||||||||||
Argentina | $ | 354,092 | $ | — | $ | — | $ | 354,092 | ||||||||
Brazil | 157,829 | — | — | 157,829 | ||||||||||||
Canada | 1,646,637 | — | — | 1,646,637 | ||||||||||||
China | 549,435 | 770,132 | — | 1,319,567 | ||||||||||||
Denmark | — | 107,825 | — | 107,825 | ||||||||||||
Finland | — | 142,125 | — | 142,125 | ||||||||||||
France | — | 2,137,271 | — | 2,137,271 | ||||||||||||
Germany | — | 1,949,530 | — | 1,949,530 | ||||||||||||
Hong Kong | — | 165,782 | — | 165,782 | ||||||||||||
Ireland | — | 233,287 | — | 233,287 | ||||||||||||
Japan | — | 1,642,920 | — | 1,642,920 | ||||||||||||
Korea | — | 238,795 | — | 238,795 | ||||||||||||
Luxembourg | — | 177,170 | — | 177,170 | ||||||||||||
Macau | — | 147,395 | — | 147,395 | ||||||||||||
Malaysia | — | 156,423 | — | 156,423 | ||||||||||||
Netherlands | 39,471 | 554,510 | — | 593,981 | ||||||||||||
Norway | — | 95,085 | — | 95,085 | ||||||||||||
Singapore | — | 366,419 | — | 366,419 | ||||||||||||
South Africa | — | 181,149 | — | 181,149 | ||||||||||||
Sweden | 131,598 | 379,523 | — | 511,121 | ||||||||||||
Switzerland | — | 1,466,240 | — | 1,466,240 | ||||||||||||
Taiwan | — | 160,875 | — | 160,875 | ||||||||||||
United Kingdom | 81,952 | 1,047,365 | — | 1,129,317 | ||||||||||||
United States | 1,000,705 | — | — | 1,000,705 | ||||||||||||
Convertible Preferred Stocks | — | — | 19,554 | 19,554 | ||||||||||||
Short-Term Investments (g) | 618,386 | — | — | 618,386 | ||||||||||||
Total | $ | 4,580,105 | $ | 12,119,821 | $ | 19,554 | $ | 16,719,480 | ||||||||
| (g) | See Investment Portfolio for additional detailed categorizations. |
The accompanying notes are an integral part of the financial statements.
Deutsche DWS Variable Series II — DWS International Growth VIP | | | 7 |
Table of Contents
Statement of Assets and Liabilities
| as of June 30, 2019 (Unaudited) | ||||
| Assets | ||||
| Investments innon-affiliated securities, at value (cost $12,889,189) — including $247,286 of securities loaned | $ | 16,101,094 | ||
| Investment in DWS Government & Agency Securities Portfolio (cost $246,161)* | 246,161 | |||
| Investment in DWS Central Cash Management Government Fund (cost $372,225) | 372,225 | |||
| Foreign currency, at value (cost $181,214) | 178,694 | |||
| Receivable for Fund shares sold | 192 | |||
| Dividends receivable | 12,482 | |||
| Interest receivable | 1,301 | |||
| Foreign taxes recoverable | 24,349 | |||
| Other assets | 693 | |||
| Total assets | 16,937,191 | |||
| Liabilities | ||||
| Payable upon return of securities loaned | 246,161 | |||
| Payable for Fund shares redeemed | 15,881 | |||
| Accrued Trustees’ fees | 1,140 | |||
| Other accrued expenses and payables | 68,689 | |||
| Total liabilities | 331,871 | |||
| Net assets, at value | $ | 16,605,320 | ||
| Net Assets Consist of | ||||
| Distributable earnings (loss) | 3,254,584 | |||
| Paid-in capital | 13,350,736 | |||
| Net assets, at value | $ | 16,605,320 | ||
| Net Asset Value | ||||
Class A | ||||
| Net Asset Value, offering and redemption price per share ($16,468,098 ÷ 1,204,760 outstanding shares of beneficial interest, no par value, unlimited number of shares authorized) | $ | 13.67 | ||
Class B | ||||
| Net Asset Value, offering and redemption price per share ($137,222 ÷ 10,008 outstanding shares of beneficial interest, no par value, unlimited number of shares authorized) | $ | 13.71 | ||
| * | Represents collateral on securities loaned. |
| for the six months ended June 30, 2019 (Unaudited) |
| |||
| Investment Income | ||||
| Income: | ||||
| Dividends (net of foreign taxes withheld of $29,097) | $ | 227,942 | ||
| Income distributions — DWS Central Cash Management Government Fund | 2,512 | |||
| Securities lending income, net of borrower rebates | 5,733 | |||
| Total income | 236,187 | |||
| Expenses: | ||||
| Management fee | 48,416 | |||
| Administration fee | 7,809 | |||
| Services to Shareholders | 412 | |||
| Record keeping fee (Class B) | 34 | |||
| Distribution service fee (Class B) | 159 | |||
| Custodian fee | 14,058 | |||
| Professional fees | 39,229 | |||
| Reports to shareholders | 11,971 | |||
| Trustees’ fees and expenses | 1,559 | |||
| Other | 9,690 | |||
| Total expenses before expense reductions | 133,337 | |||
| Expense reductions | (67,754 | ) | ||
| Total expenses after expense reductions | 65,583 | |||
| Net investment income (loss) | 170,604 | |||
| Realized and Unrealized Gain (Loss) | ||||
| Net realized gain (loss) from: | ||||
| Investments | (80,429 | ) | ||
| Foreign currency | 1,855 | |||
| (78,574 | ) | |||
| Change in net unrealized appreciation (depreciation) on: | ||||
| Investments | 3,046,267 | |||
| Foreign currency | 843 | |||
| 3,047,110 | ||||
| Net gain (loss) | 2,968,536 | |||
| Net increase (decrease) in net assets resulting from operations | $ | 3,139,140 | ||
The accompanying notes are an integral part of the financial statements.
| 8 | | | Deutsche DWS Variable Series II — DWS International Growth VIP |
Table of Contents
Statements of Changes in Net Assets
| Increase (Decrease) in Net Assets | Six Months Ended June 30, 2019 (Unaudited) | Year Ended December 31, 2018 | ||||||
| Operations: | ||||||||
| Net investment income (loss) | $ | 170,604 | $ | 210,075 | ||||
| Net realized gain (loss) | (78,574 | ) | 228,637 | |||||
| Change in net unrealized appreciation (depreciation) | 3,047,110 | (3,352,382 | ) | |||||
| Net increase (decrease) in net assets resulting from operations | 3,139,140 | (2,913,670 | ) | |||||
| Distributions to shareholders: | ||||||||
Class A | (445,123 | ) | (169,762 | ) | ||||
Class B | (3,307 | ) | (1,806 | ) | ||||
| Total distributions | (448,430 | ) | (171,568 | ) | ||||
| Fund share transactions: | ||||||||
Class A | ||||||||
| Proceeds from shares sold | 638,262 | 1,452,220 | ||||||
| Reinvestment of distributions | 445,123 | 169,762 | ||||||
| Payments for shares redeemed | (1,374,085 | ) | (3,127,727 | ) | ||||
| Net increase (decrease) in net assets from Class A share transactions | (290,700 | ) | (1,505,745 | ) | ||||
Class B | ||||||||
| Proceeds from shares sold | 795 | 82,846 | ||||||
| Reinvestment of distributions | 3,307 | 1,806 | ||||||
| Payments for shares redeemed | (106,627 | ) | (28,351 | ) | ||||
| Net increase (decrease) in net assets from Class B share transactions | (102,525 | ) | 56,301 | |||||
| Increase (decrease) in net assets | 2,297,485 | (4,534,682 | ) | |||||
| Net assets at beginning of period | 14,307,835 | 18,842,517 | ||||||
| Net assets at end of period | $ | 16,605,320 | $ | 14,307,835 | ||||
| Other Information | ||||||||
Class A | ||||||||
| Shares outstanding at beginning of period | 1,228,635 | 1,340,522 | ||||||
| Shares sold | 48,879 | 108,093 | ||||||
| Shares issued to shareholders in reinvestment of distributions | 33,594 | 12,631 | ||||||
| Shares redeemed | (106,348 | ) | (232,611 | ) | ||||
| Net increase (decrease) in Class A shares | (23,875 | ) | (111,887 | ) | ||||
| Shares outstanding at end of period | 1,204,760 | 1,228,635 | ||||||
Class B | ||||||||
| Shares outstanding at beginning of period | 19,045 | 14,862 | ||||||
| Shares sold | 61 | 6,136 | ||||||
| Shares issued to shareholders in reinvestment of distributions | 249 | 134 | ||||||
| Shares redeemed | (9,347 | ) | (2,087 | ) | ||||
| Net increase (decrease) in Class B shares | (9,037 | ) | 4,183 | |||||
| Shares outstanding at end of period | 10,008 | 19,045 | ||||||
The accompanying notes are an integral part of the financial statements.
Deutsche DWS Variable Series II — DWS International Growth VIP | | | 9 |
Table of Contents
Six Months | Years Ended December 31, | |||||||||||||||||||||||
| Class A | 2018 | 2017 | 2016 | 2015 | 2014 | |||||||||||||||||||
| Selected Per Share Data | ||||||||||||||||||||||||
| Net asset value, beginning of period | $ | 11.47 | $ | 13.90 | $ | 11.12 | $ | 10.81 | $ | 11.04 | $ | 11.13 | ||||||||||||
| Income (loss) from investment operations: | ||||||||||||||||||||||||
Net investment incomea | .14 | .16 | .08 | .06 | .07 | .08 | ||||||||||||||||||
Net realized and unrealized gain (loss) | 2.43 | (2.46 | ) | 2.75 | .34 | (.21 | ) | (.06 | ) | |||||||||||||||
Total from investment operations | 2.57 | (2.30 | ) | 2.83 | .40 | (.14 | ) | .02 | ||||||||||||||||
| Less distribution from: | ||||||||||||||||||||||||
Net investment income | (.17 | ) | (.13 | ) | (.05 | ) | (.09 | ) | (.09 | ) | (.11 | ) | ||||||||||||
Net realized gain | (.20 | ) | — | — | — | — | — | |||||||||||||||||
Total distributions | (.37 | ) | (.13 | ) | (.05 | ) | (.09 | ) | (.09 | ) | (.11 | ) | ||||||||||||
| Net asset value, end of period | $ | 13.67 | $ | 11.47 | $ | 13.90 | $ | 11.12 | $ | 10.81 | $ | 11.04 | ||||||||||||
| Total Return (%)b | 22.53 | ** | (16.69 | ) | 25.47 | 3.72 | (1.32 | ) | .21 | |||||||||||||||
| Ratios to Average Net Assets and Supplemental Data |
| |||||||||||||||||||||||
| Net assets, end of period ($ millions) | 16 | 14 | 19 | 27 | 34 | 47 | ||||||||||||||||||
| Ratio of expenses before expense reductions (%)c | 1.70 | * | 1.72 | 1.56 | 1.66 | 1.44 | 1.41 | |||||||||||||||||
| Ratio of expenses after expense reductions (%)c | .84 | * | .81 | .92 | .95 | .90 | .82 | |||||||||||||||||
| Ratio of net investment income (%) | 2.18 | * | 1.21 | .61 | .51 | .65 | .71 | |||||||||||||||||
| Portfolio turnover rate (%) | 3 | ** | 38 | 62 | 70 | 64 | 63 | |||||||||||||||||
| a | Based on average shares outstanding during the period. |
| b | Total return would have been lower had certain expenses not been reduced. |
| c | Expense ratio does not reflect charges and fees associated with the separate account that invests in the Fund or any variable life insurance policy or variable annuity contract for which the Fund is an investment option. |
| * | Annualized |
| ** | Not annualized |
| Six Months Ended 6/30/19 (Unaudited) | Years Ended December 31, | |||||||||||||||||||||||
| Class B | 2018 | 2017 | 2016 | 2015 | 2014 | |||||||||||||||||||
| Selected Per Share Data | ||||||||||||||||||||||||
| Net asset value, beginning of period | $ | 11.49 | $ | 13.93 | $ | 11.13 | $ | 10.82 | $ | 11.05 | $ | 11.14 | ||||||||||||
| Income (loss) from investment operations: | ||||||||||||||||||||||||
Net investment incomea | .12 | .12 | .02 | .02 | .05 | .02 | ||||||||||||||||||
Net realized and unrealized gain (loss) | 2.44 | (2.46 | ) | �� | 2.79 | .35 | (.23 | ) | (.04 | ) | ||||||||||||||
Total from investment operations | 2.56 | (2.34 | ) | 2.81 | .37 | (.18 | ) | (.02 | ) | |||||||||||||||
| Less distribution from: | ||||||||||||||||||||||||
Net investment income | (.14 | ) | (.10 | ) | (.01 | ) | (.06 | ) | (.05 | ) | (.07 | ) | ||||||||||||
Net realized gain | (.20 | ) | — | — | — | — | — | |||||||||||||||||
Total distributions | (.34 | ) | (.10 | ) | (.01 | ) | (.06 | ) | (.05 | ) | (.07 | ) | ||||||||||||
| Net asset value, end of period | $ | 13.71 | $ | 11.49 | $ | 13.93 | $ | 11.13 | $ | 10.82 | $ | 11.05 | ||||||||||||
| Total Return (%)b | 22.36 | ** | (16.92 | ) | 25.26 | 3.38 | (1.64 | ) | (.15 | ) | ||||||||||||||
| Ratios to Average Net Assets and Supplemental Data | ||||||||||||||||||||||||
| Net assets, end of period ($ millions) | .1 | .2 | .2 | .07 | .1 | .1 | ||||||||||||||||||
| Ratio of expenses before expense reductions (%)c | 2.05 | * | 2.07 | 1.90 | 1.98 | 1.76 | 1.76 | |||||||||||||||||
| Ratio of expenses after expense reductions (%)c | 1.11 | * | 1.06 | 1.15 | 1.24 | 1.22 | 1.15 | |||||||||||||||||
| Ratio of net investment income (%) | 1.90 | * | .92 | .12 | .17 | .40 | .14 | |||||||||||||||||
| Portfolio turnover rate (%) | 3 | ** | 38 | 62 | 70 | 64 | 63 | |||||||||||||||||
| a | Based on average shares outstanding during the period. |
| b | Total return would have been lower had certain expenses not been reduced. |
| c | Expense ratio does not reflect charges and fees associated with the separate account that invests in the Fund or any variable life insurance policy or variable annuity contract for which the Fund is an investment option. |
| * | Annualized |
| ** | Not annualized |
The accompanying notes are an integral part of the financial statements.
| 10 | | | Deutsche DWS Variable Series II — DWS International Growth VIP |
Table of Contents
| Notes to Financial Statements | (Unaudited) |
A. Organization and Significant Accounting Policies
DWS International Growth VIP (the “Fund”) is a diversified series of Deutsche DWS Variable Series II (the “Trust”), which is registered under the Investment Company Act of 1940, as amended (the “1940 Act”), as anopen-end management investment company organized as a Massachusetts business trust.
Multiple Classes of Shares of Beneficial Interest. The Fund offers two classes of shares (Class A shares and Class B shares). Sales of Class B shares are subject to recordkeeping fees up to 0.15% and Rule12b-1 fees under the 1940 Act equal to an annual rate of 0.25% of the average daily net assets for Class B shares of the Fund. Class A shares are not subject to such fees.
Investment income, realized and unrealized gains and losses, and certainfund-level expenses and expense reductions, if any, are borne pro rata on the basis of relative net assets by the holders of all classes of shares except that each class bears certain expenses unique to that class (including the applicable Rule12b-1 fee and recordkeeping fees). Differences inclass-level expenses may result in payment of different per share dividends by class. All shares have equal rights with respect to voting subject toclass-specific arrangements.
The Fund’s financial statements are prepared in accordance with accounting principles generally accepted in the United States of America (“U.S. GAAP”) which require the use of management estimates. Actual results could differ from those estimates. The Fund qualifies as an investment company under Topic 946 of Accounting Standards Codification of U.S. GAAP. The policies described below are followed consistently by the Fund in the preparation of its financial statements.
Security Valuation. Investments are stated at value determined as of the close of regular trading on the New York Stock Exchange on each day the exchange is open for trading.
Various inputs are used in determining the value of the Fund’s investments. These inputs are summarized in three broad levels. Level 1 includes quoted prices in active markets for identical securities. Level 2 includes other significant observable inputs (including quoted prices for similar securities, interest rates, prepayment speeds and credit risk). Level 3 includes significant unobservable inputs (including the Fund’s own assumptions in determining the fair value of investments). The level assigned to the securities valuations may not be an indication of the risk or liquidity associated with investing in those securities.
Equity securities are valued at the most recent sale price or official closing price reported on the exchange (U.S. or foreign) orover-the-counter market on which they trade. Securities for which no sales are reported are valued at the calculated mean between the most recent bid and asked quotations on the relevant market or, if a mean cannot be determined, at the most recent bid quotation. Equity securities are generally categorized as Level 1. For certain international equity securities, in order to adjust for events which may occur between the close of the foreign exchanges and the close of the New York Stock Exchange, a fair valuation model may be used. This fair valuation model takes into account comparisons to the valuation of American Depository Receipts (ADRs),exchange-traded funds, futures contracts and certain indices and these securities are categorized as Level 2.
Investments inopen-end investment companies are valued at their net asset value each business day and are categorized as Level 1.
Securities and other assets for which market quotations are not readily available or for which the above valuation procedures are deemed not to reflect fair value are valued in a manner that is intended to reflect their fair value as determined in accordance with procedures approved by the Board and are generally categorized as Level 3. In accordance with the Fund’s valuation procedures, factors considered in determining value may include, but are not limited to, the type of the security; the size of the holding; the initial cost of the security; the existence of any contractual restrictions on the security’s disposition; the price and extent of public trading in similar securities of the issuer or of comparable companies; quotations or evaluated prices frombroker-dealers and/or pricing services; information obtained from the issuer, analysts, and/or the appropriate stock exchange (forexchange-traded securities); an analysis of the company’s or issuer’s financial statements; an evaluation of the forces that influence the issuer and the market(s) in which the security is purchased and sold; and with respect to debt securities, the maturity, coupon, creditworthiness, currency denomination and the movement of the market in which the security is normally traded. The value determined under these procedures may differ from published values for the same securities.
Disclosure about the classification of fair value measurements is included in a table following the Fund’s Investment Portfolio.
Deutsche DWS Variable Series II — DWS International Growth VIP | | | 11 |
Table of Contents
Foreign Currency Translations. The books and records of the Fund are maintained in U.S. dollars. Investment securities and other assets and liabilities denominated in a foreign currency are translated into U.S. dollars at the prevailing exchange rates at period end. Purchases and sales of investment securities, income and expenses are translated into U.S. dollars at the prevailing exchange rates on the respective dates of the transactions.
Net realized and unrealized gains and losses on foreign currency transactions represent net gains and losses between trade and settlement dates on securities transactions, the acquisition and disposition of foreign currencies, and the difference between the amount of net investment income accrued and the U.S. dollar amount actually received. The portion of both realized and unrealized gains and losses on investments that results from fluctuations in foreign currency exchange rates is not separately disclosed but is included with net realized and unrealized gain/appreciation and loss/depreciation on investments.
Securities Lending. Brown Brothers Harriman & Co., as lending agent, lends securities of the Fund to certain financial institutions under the terms of its securities lending agreement. During the term of the loans, the Fund continues to receive interest and dividends generated by the securities and to participate in any changes in their market value. The Fund requires the borrowers of the securities to maintain collateral with the Fund consisting of either cash and/or U.S. Treasury Securities having a value at least equal to the value of the securities loaned. When the collateral falls below specified amounts, the lending agent will use its best effort to obtain additional collateral on the next business day to meet required amounts under the securities lending agreement. During the six months ended June 30, 2019, the Fund invested the cash collateral into a joint trading account in DWS Government & Agency Securities Portfolio, an affiliated money market fund managed by DWS Investment Management Americas, Inc. DWS Investment Management Americas, Inc. receives a management/administration fee (0.11% annualized effective rate as of June 30, 2019) on the cash collateral invested in DWS Government & Agency Securities Portfolio. The Fund receives compensation for lending its securities either in the form of fees or by earning interest on invested cash collateral net of borrower rebates and fees paid to a lending agent. Either the Fund or the borrower may terminate the loan at any time, and the borrower, after notice, is required to return borrowed securities within a standard time period. There may be risks of delay and costs in recovery of securities or even loss of rights in the collateral should the borrower of the securities fail financially. If the Fund is not able to recover securities lent, the Fund may sell the collateral and purchase a replacement investment in the market, incurring the risk that the value of the replacement security is greater than the value of the collateral. The Fund is also subject to all investment risks associated with the reinvestment of any cash collateral received, including, but not limited to, interest rate, credit and liquidity risk associated with such investments.
As of June 30, 2019, the Fund had securities on loan, which were classified as common stocks in the Investment Portfolio. Due to the increased market values of securities on loan on June 30, 2019, the value of the related collateral was less than the value of securities on loan at period end. On the next business day, additional collateral was received, and the value of collateral exceeded the value of the securities on loan. As of period end, the remaining contractual maturity of the collateral agreements was overnight and continuous.
Taxes. The Fund’s policy is to comply with the requirements of the Internal Revenue Code, as amended, which are applicable to regulated investment companies and to distribute all of its taxable income to its shareholders.
Additionally, the Fund may be subject to taxes imposed by the governments of countries in which it invests and are generally based on income and/or capital gains earned or repatriated, a portion of which may be recoverable. Based upon the current interpretation of the tax rules and regulations, estimated tax liabilities and recoveries on certain foreign securities are recorded on an accrual basis and are reflected as components of interest income or net change in unrealized gain/loss on investments. Tax liabilities realized as a result of security sales are reflected as a component of net realized gain/loss on investments.
At June 30, 2019, the aggregate cost of investments for federal income tax purposes was $13,539,972. The net unrealized appreciation for all investments based on tax cost was $3,179,508. This consisted of aggregate gross unrealized appreciation for all investments in which there was an excess of value over tax cost of $3,881,613 aggregate gross unrealized depreciation for all investments in which was an excess of tax cost over value of $702,105.
The Fund has reviewed the tax positions for the open tax years as of December 31, 2018 and has determined that no provision for income tax and/or uncertain tax positions is required in the Fund’s financial statements. The Fund’s federal tax returns for the prior three fiscal years remain open subject to examination by the Internal Revenue Service.
Distribution of Income and Gains. Distributions from net investment income of the Fund, if any, are declared and distributed to shareholders annually. Net realized gains from investment transactions, in excess
| 12 | | | Deutsche DWS Variable Series II — DWS International Growth VIP |
Table of Contents
of available capital loss carryforwards, would be taxable to the Fund if not distributed and, therefore, will be distributed to shareholders at least annually. The Fund may also make additional distributions for tax purposes if necessary.
The timing and characterization of certain income and capital gain distributions are determined annually in accordance with federal tax regulations which may differ from accounting principles generally accepted in the United States of America. These differences primarily relate to investments in foreign denominated investments and certain securities sold at a loss. As a result, net investment income (loss) and net realized gain (loss) on investment transactions for a reporting period may differ significantly from distributions during such period. Accordingly, the Fund may periodically make reclassifications among certain of its capital accounts without impacting the net asset value of the Fund.
The tax character of current year distributions will be determined at the end of the current fiscal year.
Expenses. Expenses of the Trust arising in connection with a specific fund are allocated to that fund. Other Trust expenses which cannot be directly attributed to a fund are apportioned among the funds in the Trust based upon the relative net assets or other appropriate measures.
Contingencies. In the normal course of business, the Fund may enter into contracts with service providers that contain general indemnification clauses. The Fund’s maximum exposure under these arrangements is unknown, as this would involve future claims that may be made against the Fund that have not yet been made. However, based on experience, the Fund expects the risk of loss to be remote.
Other. Investment transactions are accounted for on a trade date plus one basis for daily net asset value calculations. However, for financial reporting purposes, investment transactions are reported on trade date. Interest income is recorded on the accrual basis. Dividend income is recorded on theex-dividend date net of foreign withholding taxes. Realized gains and losses from investment transactions are recorded on an identified cost basis. Proceeds from litigation payments, if any, are included in net realized gain (loss) from investments.
B. Purchases and Sales of Securities
During the six months ended June 30, 2019, purchases and sales of investment transactions (excludingshort-term investments) aggregated $532,033 and $1,384,649, respectively.
C. Related Parties
Management Agreement. Under the Investment Management Agreement with DWS Investment Management Americas, Inc. (“DIMA” or the “Advisor”), an indirect, wholly owned subsidiary of DWS Group GmbH & Co. KGaA (“DWS Group”), the Advisor directs the investments of the Fund in accordance with its investment objectives, policies and restrictions. The Advisor determines the securities, instruments and other contracts relating to investments to be purchased, sold or entered into by the Fund.
Pursuant to the Investment Management Agreement with the Advisor, the Fund pays the Advisor an annual fee based on its average daily net assets, computed and accrued daily and payable monthly at the annual rate (exclusive of any applicable waivers/reimbursements) of 0.62%.
For the period from January 1, 2019 through April 30, 2019, the Advisor had contractually agreed to waive its fees and/or reimburse certain operating expenses to the extent necessary to maintain the total annual operating expenses (excluding certain expenses such as extraordinary expenses, taxes, brokerage and interest expense) of each class as follows:
| Class A | .81 | % | ||
| Class B | 1.06 | % |
Effective May 1, 2019 through April 30, 2020, the Advisor has contractually agreed to waive its fees and/or reimburse certain operating expenses to the extent necessary to maintain the total annual operating expenses (excluding certain expenses such as extraordinary expenses, taxes, brokerage and interest expense) of each class as follows:
| Class A | .89 | % | ||
| Class B | 1.21 | % |
For the six months ended June 30, 2019, fees waived and/or expenses reimbursed for each class are as follows:
| Class A | $ | 67,158 | ||
| Class B | 596 | |||
| $ | 67,754 |
Deutsche DWS Variable Series II — DWS International Growth VIP | | | 13 |
Table of Contents
Administration Fee. Pursuant to an Administrative Services Agreement, DIMA provides most administrative services to the Fund. For all services provided under the Administrative Services Agreement, the Fund pays DIMA an annual fee (“Administration Fee”) of 0.10% of the Fund’s average daily net assets, computed and accrued daily and payable monthly. For the six months ended June 30, 2019, the Administration Fee was $7,809, of which $1,326 is unpaid.
Service Provider Fees. DWS Service Company (“DSC”), an affiliate of the Advisor, is the transfer agent,dividend-paying agent and shareholder service agent for the Fund. Pursuant to asub-transfer agency agreement between DSC and DST Systems, Inc. (“DST”), DSC has delegated certain transfer agent,dividend-paying agent and shareholder service agent functions to DST. DSC compensates DST out of the shareholder servicing fee it receives from the Fund. For the six months ended June 30, 2019, the amounts charged to the Fund by DSC were as follows:
| Services to Shareholders | Total Aggregated | Unpaid at June 30, 2019 | ||||||
| Class A | $ | 116 | $ | 43 | ||||
| Class B | 25 | 9 | ||||||
| $ | 141 | $ | 52 | |||||
Distribution Service Agreement. Under the Fund’s Class B12b-1 plan, DWS Distributors, Inc. (“DDI”) received a fee (“Distribution Service Fee”) of 0.25% of average daily net assets of Class B shares. For the six months ended June 30, 2019, the Distribution Service Fee aggregated $159, of which $27 is unpaid.
Typesetting and Filing Service Fees. Under an agreement with the Fund, DIMA is compensated for providing certainpre-press and regulatory filing services to the Fund. For the six months ended June 30, 2019, the amount charged to the Fund by DIMA included in the Statement of Operations under “Reports to shareholders” aggregated $4,783, all of which is unpaid.
Trustees’ Fees and Expenses. The Fund paid retainer fees to each Trustee not affiliated with the Advisor, plus specified amounts to the Board Chairperson and to each committee Chairperson.
Affiliated Cash Management Vehicles. The Fund may invest uninvested cash balances in DWS Central Cash Management Government Fund and DWS ESG Liquidity Fund, affiliated money market funds which are managed by the Advisor. Each affiliated money market fund is managed in accordance with Rule2a-7 under the 1940 Act, which governs the quality, maturity, diversity and liquidity of instruments in which a money market fund may invest. DWS Central Cash Management Government Fund seeks to maintain a stable net asset value, and DWS ESG Liquidity Fund maintains a floating net asset value. The Fund indirectly bears its proportionate share of the expenses of each affiliated money market fund in which it invests. DWS Central Cash Management Government Fund does not pay the Advisor an investment management fee. To the extent that DWS ESG Liquidity Fund pays an investment management fee to the Advisor, the Advisor will waive an amount of the investment management fee payable to the Advisor by the Fund equal to the amount of the investment management fee payable on the Fund’s assets invested in DWS ESG Liquidity Fund.
D. Ownership of the Fund
At June 30, 2019, one participating insurance company was owner of record of 10% or more of the total outstanding Class A shares of the Fund, owning 86%. Two participating insurance companies were owners of record of 10% or more of the total outstanding Class B shares of the Fund, owning 54%, and 46%.
E. Line of Credit
The Fund and other affiliated funds (the “Participants”) share in a $400 million revolving credit facility provided by a syndication of banks. The Fund may borrow for temporary or emergency purposes, including the meeting of redemption requests that otherwise might require the untimely disposition of securities. The Participants are charged an annual commitment fee which is allocated based on net assets, among each of the Participants. Interest is calculated at a rate per annum equal to the sum of the Federal Funds Rate plus 1.25 percent plus if theone-month LIBOR exceeds the Federal Funds Rate, the amount of such excess. The Fund may borrow up to a maximum of 33 percent of its net assets under the agreement. The Fund had no outstanding loans at June 30, 2019.
| 14 | | | Deutsche DWS Variable Series II — DWS International Growth VIP |
Table of Contents
| Information About Your Fund’s Expenses | (Unaudited) |
As an investor of the Fund, you incur two types of costs: ongoing expenses and transaction costs. Ongoing expenses include management fees, distribution and service(12b-1) fees and other Fund expenses. Examples of transaction costs include contract charges, which are not shown in this section. The following tables are intended to help you understand your ongoing expenses (in dollars) of investing in the Fund and to help you compare these expenses with the ongoing expenses of investing in other mutual funds. In the most recentsix-month period, the Fund limited these expenses; had it not done so, expenses would have been higher. The example in the table is based on an investment of $1,000 invested at the beginning of thesix-month period and held for the entire period (January 1, 2019 to June 30, 2019).
The tables illustrate your Fund’s expenses in two ways:
| – | Actual Fund Return. This helps you estimate the actual dollar amount of ongoing expenses (but not transaction costs) paid on a $1,000 investment in the Fund using the Fund’s actual return during the period. To estimate the expenses you paid over the period, simply divide your account value by $1,000 (for example, an $8,600 account value divided by $1,000 = 8.6), then multiply the result by the number in the “Expenses Paid per $1,000” line under the share class you hold. |
| – | Hypothetical 5% Fund Return. This helps you to compare your Fund’s ongoing expenses (but not transaction costs) with those of other mutual funds using the Fund’s actual expense ratio and a hypothetical rate of return of 5% per year before expenses. Examples using a 5% hypothetical Fund return may be found in the shareholder reports of other mutual funds. The hypothetical account values and expenses may not be used to estimate the actual ending account balance or expenses you paid for the period. |
Please note that the expenses shown in these tables are meant to highlight your ongoing expenses only and do not reflect any transaction costs. The “Expenses Paid per $1,000” line of the tables is useful in comparing ongoing expenses only and will not help you determine the relative total expense of owning different funds. If these transaction costs had been included, your costs would have been higher.
| Expenses and Value of a $1,000 Investment for the six months ended June 30, 2019 | ||||||||
| Actual Fund Return | Class A | Class B | ||||||
| Beginning Account Value 1/1/19 | $ | 1,000.00 | $ | 1,000.00 | ||||
| Ending Account Value 6/30/19 | $ | 1,225.30 | $ | 1,223.60 | ||||
| Expenses Paid per $1,000* | $ | 4.63 | $ | 6.12 | ||||
| Hypothetical 5% Fund Return | ||||||||
| Beginning Account Value 1/1/19 | $ | 1,000.00 | $ | 1,000.00 | ||||
| Ending Account Value 6/30/19 | $ | 1,020.63 | $ | 1,019.29 | ||||
| Expenses Paid per $1,000* | $ | 4.21 | $ | 5.56 | ||||
| * | Expenses are equal to the Fund’s annualized expense ratio for each share class, multiplied by the average account value over the period, multiplied by 181 (the number of days in the most recentsix-month period), then divided by 365. |
| Annualized Expense Ratios | Class A | Class B | ||||||
| Deutsche DWS Variable Series II — DWS International Growth VIP | .84 | % | 1.11 | % | ||||
For more information, please refer to the Fund’s prospectus.
These tables do not reflect charges and fees (“contract charges”) associated with the separate account that invests in the Fund or any variable life insurance policy or variable annuity contract for which the Fund is an investment option.
For an analysis of the fees associated with an investment in the Fund or similar funds, please refer to the current and hypothetical expense calculators for Variable Insurance Products which can be found at dws.com/calculators.
Deutsche DWS Variable Series II — DWS International Growth VIP | | | 15 |
Table of Contents
The Trust’s policies and procedures for voting proxies for portfolio securities and information about how the Trust voted proxies related to its portfolio securities during the most recent12-month period ended June 30 are available on our Web site — dws.com/en-us/resources/proxy-voting — or on the SEC’s Web site — sec.gov. To obtain a written copy of the Trust’s policies and procedures without charge, upon request, call us toll free at(800) 728-3337.
| 16 | | | Deutsche DWS Variable Series II — DWS International Growth VIP |
Table of Contents
Advisory Agreement Board Considerations and Fee Evaluation
The Board of Trustees (hereinafter referred to as the “Board” or “Trustees”) approved the renewal of DWS International Growth VIP’s (the “Fund��) investment management agreement (the “Agreement”) with DWS Investment Management Americas, Inc. (“DIMA”) in September 2018.
In terms of the process that the Board followed prior to approving the Agreement, shareholders should know that:
| – | During the entire process, all of the Fund’s Trustees were independent of DIMA and its affiliates (the “Independent Trustees”). |
| – | The Board met frequently during the past year to discuss fund matters and dedicated a substantial amount of time to contract review matters. Over the course of several months, the Board’s Contract Committee reviewed extensive materials received from DIMA, independent third parties and independent counsel. These materials included an analysis of the Fund’s performance, fees and expenses, and profitability from a fee consultant retained by the Fund’s Independent Trustees (the “Fee Consultant”). Based on its evaluation of the information provided, the Contract Committee presented its findings and recommendations to the Board. The Board then reviewed the Contract Committee’s findings and recommendations. |
| – | The Board also received extensive information throughout the year regarding performance of the Fund. |
| – | The Independent Trustees regularly met privately with counsel to discuss contract review and other matters. In addition, the Independent Trustees were advised by the Fee Consultant in the course of their review of the Fund’s contractual arrangements and considered a comprehensive report prepared by the Fee Consultant in connection with their deliberations. |
| – | In connection with reviewing the Agreement, the Board also reviewed the terms of the Fund’s Rule12b-1 plan, distribution agreement, administrative services agreement, transfer agency agreement and other material service agreements. |
In connection with the contract review process, the Contract Committee and the Board considered the factors discussed below, among others. The Board also considered that DIMA and its predecessors have managed the Fund since its inception, and the Board believes that a long-term relationship with a capable, conscientious advisor is in the best interests of the Fund. The Board considered, generally, that shareholders chose to invest or remain invested in the Fund knowing that DIMA managed the Fund. DIMA is part of DWS Group GmbH & Co. KGaA (“DWS Group”). DWS Group is a global asset management business that offers a wide range of investing expertise and resources, including research capabilities in many countries throughout the world. In 2018, approximately 20% of DWS Group’s shares were sold in an initial public offering, with Deutsche Bank AG owning the remaining shares.
As part of the contract review process, the Board carefully considered the fees and expenses of each DWS fund overseen by the Board in light of the fund’s performance. In many cases, this led to the negotiation and implementation of expense caps. As part of these negotiations, the Board indicated that it would consider relaxing these caps in future years following sustained improvements in performance, among other considerations.
While shareholders may focus primarily on fund performance and fees, the Fund’s Board considers these and many other factors, including the quality and integrity of DIMA’s personnel and administrative support services provided by DIMA, such as back-office operations, fund valuations, and compliance policies and procedures.
Nature, Quality and Extent of Services.The Board considered the terms of the Agreement, including the scope of advisory services provided under the Agreement. The Board noted that, under the Agreement, DIMA provides portfolio management services to the Fund and that, pursuant to a separate administrative services agreement, DIMA provides administrative services to the Fund. The Board considered the experience and skills of senior management and investment personnel and the resources made available to such personnel. The Board reviewed the Fund’s performance over short-term and long-term periods and compared those returns to various agreed-upon performance measures, including market index(es) and a peer universe compiled using information supplied by Morningstar Direct (“Morningstar”), an independent fund data service. The Board also noted that it has put into place a process of identifying “Funds in Review” (e.g., funds performing poorly relative to a peer universe), and receives additional reporting from DIMA regarding such funds and, where appropriate, DIMA’s plans to address underperformance. The Board
Deutsche DWS Variable Series II — DWS International Growth VIP | | | 17 |
Table of Contents
believes this process is an effective manner of identifying and addressing underperforming funds. Based on the information provided, the Board noted that, for theone-, three- and five-year periods ended December 31, 2017, the Fund’s performance (Class A shares) was in the 2nd quartile, 3rd quartile and 3rd quartile, respectively, of the applicable Morningstar universe (the 1st quartile being the best performers and the 4th quartile being the worst performers). The Board also observed that the Fund has outperformed its benchmark in the three- and five-year periods and has underperformed its benchmark in theone-year period ended December 31, 2017. The Board considered that, effective October 3, 2016, the Fund’s investment strategy and certain members of the portfolio management team were changed, and that, effective October 1, 2017, the Fund further changed its investment strategy.
Fees and Expenses. The Board considered the Fund’s investment management fee schedule, operating expenses and total expense ratios, and comparative information provided by Broadridge Financial Solutions, Inc. (“Broadridge”) and the Fee Consultant regarding investment management fee rates paid to other investment advisors by similar funds (1st quartile being the most favorable and 4th quartile being the least favorable). With respect to management fees paid to other investment advisors by similar funds, the Board noted that the contractual fee rates paid by the Fund, which include a 0.10% fee paid to DIMA under the Fund’s administrative services agreement, were lower than the median (1st quartile) of the applicable Broadridge peer group (based on Broadridge data provided as of December 31, 2017). The Board noted that, effective October 1, 2017, DIMA agreed to reduce the Fund’s contractual management fee rate to an annual rate of 0.62% in connection with changes to the Fund’s investment strategy. The Board noted that the Fund’s Class A shares total (net) operating expenses were expected to be higher than the median (3rd quartile) of the applicable Broadridge expense universe (based on Broadridge data provided as of December 31, 2017, and analyzing Broadridge expense universe Class A (net) expenses less any applicable12b-1 fees) (“Broadridge Universe Expenses”). The Board also reviewed data comparing each share class’s total (net) operating expenses to the applicable Broadridge Universe Expenses. The Board noted that the expense limitations agreed to by DIMA were expected to help the Fund’s total (net) operating expenses remain competitive. The Board considered the Fund’s management fee rate as compared to fees charged by DIMA to a comparable DWS U.S. registered fund (“DWS Funds”) and considered differences between the Fund and the comparable DWS Fund. The information requested by the Board as part of its review of fees and expenses also included information about institutional accounts (including anysub-advised funds and accounts) and funds offered primarily to European investors (“DWS Europe Funds”) managed by DWS Group. The Board noted that DIMA indicated that DWS Group does not manage any institutional accounts or DWS Europe Funds comparable to the Fund.
On the basis of the information provided, the Board concluded that management fees were reasonable and appropriate in light of the nature, quality and extent of services provided by DIMA.
Profitability. The Board reviewed detailed information regarding revenues received by DIMA under the Agreement. The Board considered the estimated costs to DIMA, andpre-tax profits realized by DIMA, from advising the DWS Funds, as well as estimates of thepre-tax profits attributable to managing the Fund in particular. The Board also received information regarding the estimated enterprise-wide profitability of DIMA and its affiliates with respect to all fund services in totality and by fund. The Board and the Fee Consultant reviewed DIMA’s methodology in allocating its costs to the management of the Fund. Based on the information provided, the Board concluded that thepre-tax profits realized by DIMA in connection with the management of the Fund were not unreasonable. The Board also reviewed certain publicly available information regarding the profitability of certain similar investment management firms. The Board noted that, while information regarding the profitability of such firms is limited (and in some cases is not necessarily prepared on a comparable basis), DIMA and its affiliates’ overall profitability with respect to the DWS Funds (after taking into account distribution and other services provided to the funds by DIMA and its affiliates) was lower than the overall profitability levels of most comparable firms for which such data was available.
Economies of Scale. The Board considered whether there are economies of scale with respect to the management of the Fund and whether the Fund benefits from any economies of scale. In this regard, the Board observed that while the Fund’s current investment management fee schedule does not include breakpoints, the Fund’s fee schedule represents an appropriate sharing between the Fund and DIMA of such economies of scale as may exist in the management of the Fund at current asset levels.
Other Benefits to DIMA and Its Affiliates. The Board also considered the character and amount of other incidental or“fall-out” benefits received by DIMA and its affiliates, including any fees received by DIMA for administrative services provided to the Fund, any fees received by an affiliate of DIMA for transfer agency services provided to the Fund and any fees received by an affiliate of DIMA for distribution services. The
| 18 | | | Deutsche DWS Variable Series II — DWS International Growth VIP |
Table of Contents
Board also considered benefits to DIMA related to brokerage and soft-dollar allocations, including allocating brokerage to pay for research generated by parties other than the executing broker dealers, which pertain primarily to funds investing in equity securities. In addition, the Board considered the incidental public relations benefits to DIMA related to DWS Funds advertising and cross-selling opportunities among DIMA products and services. The Board considered these benefits in reaching its conclusion that the Fund’s management fees were reasonable.
Compliance. The Board considered the significant attention and resources dedicated by DIMA to its compliance processes in recent years. The Board noted in particular (i) the experience, seniority and time commitment of the individuals serving as DIMA’s and the Fund’s chief compliance officers and (ii) the substantial commitment of resources by DIMA and its affiliates to compliance matters, including the retention of compliance personnel.
Based on all of the information considered and the conclusions reached, the Board unanimously determined that the continuation of the Agreement is in the best interests of the Fund. In making this determination, the Board did not give particular weight to any single factor identified above. The Board considered these factors over the course of numerous meetings, certain of which were in executive session with only the Independent Trustees and counsel present. It is possible that individual Independent Trustees may have weighed these factors differently in reaching their individual decisions to approve the continuation of the Agreement.
Deutsche DWS Variable Series II — DWS International Growth VIP | | | 19 |
Table of Contents
| ||
VS2IG-3 (R-028383-8 8/19) |
Table of Contents
June 30, 2019
Semiannual Report
Deutsche DWS Variable Series II
��
DWS Multisector Income VIP
Beginning on January 1, 2021, as permitted by regulations adopted by the Securities and Exchange Commission, you may not be receiving paper copies of the Fund’s shareholder reports from the insurance company that offers your contract unless you specifically request paper copies from your insurance company or from your financial intermediary. Instead, the shareholder reports will be made available on a Web site, and your insurance company will notify you by mail each time a report is posted and provide you with a Web site link to access the report. Instructions for requesting paper copies will be provided by your insurance company.
If you already elected to receive shareholder reports electronically, you will not be affected by this change and you need not take any action. You may elect to receive shareholder reports and other communications from your insurance company electronically by following the instructions provided by your insurance company.
You may elect to receive all future reports in paper free of charge from your insurance company. If your insurance company informs you that future reports will be delivered via Web access, you can inform your insurance company that you wish to continue receiving paper copies of your shareholder reports by following the instructions provided by your insurance company.

Table of Contents
This report must be preceded or accompanied by a prospectus. To obtain an additional prospectus or summary prospectus, if available, call (800)728-3337 or your financial representative. We advise you to consider the Fund’s objectives, risks, charges and expenses carefully before investing. The summary prospectus and prospectus contain this and other important information about the Fund. Please read the prospectus carefully before you invest.
Bond investments are subject tointerest-rate, credit, liquidity and market risks to varying degrees. When interest rates rise, bond prices generally fall. Credit risk refers to the ability of an issuer to make timely payments of principal and interest. Investments inlower-quality (“junk bonds”) andnon-rated securities present greater risk of loss than investments inhigher-quality securities. Investing in foreign securities, particularly those of emerging markets, presents certain risks, such as currency fluctuations, political and economic changes, and market risks. Emerging markets tend to be more volatile and less liquid than the markets of more mature economies, and generally have less diverse and less mature economic structures and less stable political systems than those of developed countries. Investing in derivatives entails special risks relating to liquidity, leverage and credit that may reduce returns and/or increase volatility. The Fund may lend securities to approved institutions. See the prospectus for details.
The brand DWS represents DWS Group GmbH & Co. KGaA and any of its subsidiaries such as DWS Distributors, Inc. which offers investment products or DWS Investment Management Americas, Inc. and RREEF America L.L.C. which offer advisory services.
DWS Distributors, Inc., 222 South Riverside Plaza, Chicago, IL 60606, (800)621-1148
NOT FDIC/NCUA INSURED NO BANK GUARANTEE MAY LOSE VALUE NOT A DEPOSIT NOT INSURED BY ANY FEDERAL GOVERNMENT AGENCY
| 2 | | | Deutsche DWS Variable Series II — DWS Multisector Income VIP |
Table of Contents
| Performance Summary | June 30, 2019 (Unaudited) |
Fund performance shown is historical, assumes reinvestment of all dividend and capital gain distributions and does not guarantee future results. Investment return and principal value fluctuate with changing market conditions so that, when redeemed, shares may be worth more or less than their original cost. Current performance may be lower or higher than the performance data quoted. Please contact your participating insurance company for the Fund’s most recentmonth-end performance. Performance does not reflect charges and fees (“contract charges”) associated with the separate account that invests in the Fund or any variable life insurance policy or variable annuity contract for which the Fund is an investment option. These charges and fees will reduce returns.
The gross expense ratio of the Fund, as stated in the fee table of the prospectus dated May 1, 2019 is 2.19% for Class A shares and may differ from the expense ratio disclosed in the Financial Highlights table in this report.
Generally accepted accounting principles require adjustments to be made to the net assets of the Fund at period end for financial reporting purposes only, and as such, the total return based on the unadjusted net asset value per share may differ from the total return reported in the financial highlights.
Growth of an Assumed $10,000 Investment in DWS Multisector Income VIP
| The unmanaged Bloomberg Barclays U.S. Universal Index represents the union of the U.S. Aggregate Index, the U.S.High-Yield Corporate Index, the 144A Index, the Eurodollar Index, the Emerging Markets Index and thenon-ERISA portion of the CMBS Index.
Index returns do not reflect any fees or expenses and it is not possible to invest directly into an index. |
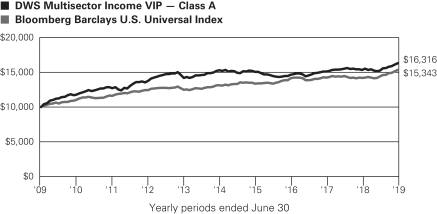
| Comparative Results | ||||||||||||
| DWS Multisector Income VIP | 6-Month‡ | 1-Year | 3-Year | 5-Year | 10-Year | |||||||
| Class A | Growth of $10,000 | $10,710 | $10,630 | $11,155 | $10,674 | $16,316 | ||||||
| Average annual total return | 7.10% | 6.30% | 3.71% | 1.31% | 5.02% | |||||||
| Bloomberg Barclays U.S. Universal Index | Growth of $10,000 | $10,654 | $10,807 | $10,876 | $11,694 | $15,343 | ||||||
| Average annual total return | 6.54% | 8.07% | 2.84% | 3.18% | 4.37% | |||||||
The growth of $10,000 is cumulative.
| ‡ | Total returns shown for periods less than one year are not annualized. |
Deutsche DWS Variable Series II — DWS Multisector Income VIP | | | 3 |
Table of Contents
| Portfolio Summary | (Unaudited) |
| Asset Allocation (As a % of Investment Portfolio) | 6/30/19 | 12/31/18 | ||||||
| Corporate Bonds | 30% | 11% | ||||||
| Government & Agency Obligations | 30% | 44% | ||||||
| Collateralized Mortgage Obligations | 13% | 17% | ||||||
| Mortgage-Backed Securities Pass-Throughs | 8% | 6% | ||||||
| Cash Equivalents | 5% | 5% | ||||||
| Commercial Mortgage-Backed Securities | 5% | 5% | ||||||
| Loan Participations and Assignments | 3% | 5% | ||||||
| Short-Term U.S. Treasury Obligations | 3% | 3% | ||||||
| Convertible Bonds | 2% | 2% | ||||||
| Asset-Backed | 1% | 2% | ||||||
| Common Stocks | 0% | 0% | ||||||
| Warrants | 0% | 0% | ||||||
| 100% | 100% | |||||||
| Quality (Excludes Cash Equivalents) | 6/30/19 | 12/31/18 | ||||||
| AAA | 43% | 38% | ||||||
| AA | 2% | 0% | ||||||
| A | 9% | 8% | ||||||
| BBB | 18% | 12% | ||||||
| BB | 11% | 22% | ||||||
| B | 10% | 11% | ||||||
| CCC or Below | 1% | 2% | ||||||
| Non Rated | 6% | 7% | ||||||
| 100% | 100% | |||||||
| Interest Rate Sensitivity | 6/30/19 | 12/31/18 | ||||||
| Effective Maturity | 6.7 years | 4.8 years | ||||||
| Effective Duration | 6.0 years | 3.6 years | ||||||
The quality ratings represent the higher of Moody’s Investors Service, Inc. (“Moody’s”), Fitch Ratings, Inc. (“Fitch”) or Standard & Poor’s Corporation (“S&P”) credit ratings. The ratings of Moody’s, Fitch and S&P represent their opinions as to the quality of the securities they rate. Credit quality measures a bond issuer’s ability to repay interest and principal in a timely manner. Ratings are relative and subjective and are not absolute standards of quality. Credit quality does not remove market risk and is subject to change.
Effective maturity is the weighted average of the maturity date of bonds held by the Fund taking into consideration any available maturity shortening features.
Effective duration is an approximate measure of the Fund’s sensitivity to interest rate changes taking into consideration any maturity shortening features.
Portfolio holdings and characteristics are subject to change.
For more complete details about the Fund’s investment portfolio, see page 5.
Following the Fund’s fiscal first and thirdquarter-end, a complete portfolio holdings listing is filed with the SEC on FormN-Q or Form N-PORT (available for filings after March 31, 2019). The Fund’s Form N-Q or Form N-PORT will be available on the SEC’s Web site at sec.gov. The Fund’s portfolio holdings are also posted on dws.com from time to time. Please read the Fund’s current prospectus for more information.
Thomas M. Farina, CFA, Managing Director
Kelly L. Beam, CFA, Director
Portfolio Managers
| 4 | | | Deutsche DWS Variable Series II — DWS Multisector Income VIP |
Table of Contents
| Investment Portfolio | as of June 30, 2019 (Unaudited) |
| Principal Amount ($)(a) | Value ($) | |||||||
| Corporate Bonds 31.6% |
| |||||||
| Communication Services 5.3% |
| |||||||
CCO Holdings LLC, 144A, 5.375%, 6/1/2029 | 15,000 | 15,488 | ||||||
Charter Communications Operating LLC, 5.75%, 4/1/2048 | 30,000 | 33,180 | ||||||
Comcast Corp.: | ||||||||
4.6%, 10/15/2038 | 20,000 | 22,901 | ||||||
4.95%, 10/15/2058 | 12,000 | 14,648 | ||||||
GrubHub Holdings, Inc., 144A, 5.5%, 7/1/2027 | 10,000 | 10,264 | ||||||
Netflix, Inc.: | ||||||||
5.5%, 2/15/2022 | 60,000 | 63,075 | ||||||
5.875%, 11/15/2028 | 70,000 | 77,498 | ||||||
Nexstar Escrow, Inc., 144A, 5.625%, 7/15/2027 (b) | 5,000 | 5,119 | ||||||
Sirius XM Radio, Inc., 144A, 4.625%, 7/15/2024 (b) | 20,000 | 20,465 | ||||||
Sprint Communications, Inc., 6.0%, 11/15/2022 | 50,000 | 52,125 | ||||||
Symantec Corp., 3.95%, 6/15/2022 | 50,000 | 50,637 | ||||||
VeriSign, Inc.: | ||||||||
4.625%, 5/1/2023 | 50,000 | 50,815 | ||||||
5.25%, 4/1/2025 | 50,000 | 53,375 | ||||||
|
| |||||||
| 469,590 | ||||||||
| Consumer Discretionary 5.8% |
| |||||||
American Axle & Manufacturing, Inc., 6.25%, 4/1/2025 | 60,000 | 59,700 | ||||||
Ford Motor Credit Co. LLC, 5.584%, 3/18/2024 | 200,000 | 214,676 | ||||||
General Motors Co., 5.95%, 4/1/2049 | 12,000 | 12,572 | ||||||
Hilton Domestic Operating Co., Inc., 144A, 4.875%, 1/15/2030 | 13,000 | 13,390 | ||||||
Hilton Worldwide Finance LLC, 4.875%, 4/1/2027 | 50,000 | 51,673 | ||||||
IAA, Inc., 144A, 5.5%, 6/15/2027 | 10,000 | 10,400 | ||||||
Lowe’s Companies, Inc., 2.5%, 4/15/2026 | 75,000 | 73,625 | ||||||
MGM Resorts International, 5.5%, 4/15/2027 | 55,000 | 57,681 | ||||||
Starbucks Corp., 4.5%, 11/15/2048 | 18,000 | 19,763 | ||||||
|
| |||||||
| 513,480 | ||||||||
| Consumer Staples 1.4% |
| |||||||
Altria Group, Inc., 5.95%, 2/14/2049 | 20,000 | 22,828 | ||||||
Anheuser-Busch Companies LLC, 4.9%, 2/1/2046 | 11,000 | 12,248 | ||||||
Anheuser-Busch InBev Worldwide, Inc.: | ||||||||
4.75%, 4/15/2058 | 10,000 | 10,575 | ||||||
5.45%, 1/23/2039 | 12,000 | 14,281 | ||||||
5.55%, 1/23/2049 | 20,000 | 24,510 | ||||||
Keurig Dr Pepper, Inc.: |
| |||||||
4.597%, 5/25/2028 | 11,000 | 12,043 | ||||||
5.085%, 5/25/2048 | 16,000 | 17,815 | ||||||
Post Holdings, Inc., 144A, 5.5%, 12/15/2029 (b) | 10,000 | 10,025 | ||||||
|
| |||||||
| 124,325 | ||||||||
| Principal Amount ($)(a) | Value ($) | |||||||
| Energy 4.1% |
| |||||||
Antero Midstream Partners LP, 144A, 5.75%, 1/15/2028 | 55,000 | 54,450 | ||||||
Apache Corp., 4.25%, 1/15/2030 | 34,000 | 35,060 | ||||||
Cheniere Energy Partners LP, 144A, 5.625%, 10/1/2026 | 100,000 | 105,500 | ||||||
Devon Energy Corp., 5.0%, 6/15/2045 | 15,000 | 17,209 | ||||||
Energy Transfer Operating LP, 6.25%, 4/15/2049 | 20,000 | 23,697 | ||||||
Enterprise Products Operating LP, 4.2%, 1/31/2050 | 52,000 | 51,892 | ||||||
Hess Corp., 5.8%, 4/1/2047 | 15,000 | 16,655 | ||||||
Kinder Morgan, Inc., 5.2%, 3/1/2048 | 11,000 | 12,426 | ||||||
MPLX LP, 5.5%, 2/15/2049 | 20,000 | 22,715 | ||||||
Parkland Fuel Corp., 5.875%, 7/15/2027 | 30,000 | 30,000 | ||||||
|
| |||||||
| 369,604 | ||||||||
| Financials 4.4% |
| |||||||
Bank of America Corp., 3.974%, 2/7/2030 | 80,000 | 85,752 | ||||||
Citigroup, Inc., 3.98%, 3/20/2030 | 58,000 | 61,948 | ||||||
JPMorgan Chase & Co., 3.782%, 2/1/2028 | 35,000 | 37,104 | ||||||
Morgan Stanley, 4.431%, 1/23/2030 | 60,000 | 66,376 | ||||||
Synchrony Financial, 4.375%, 3/19/2024 | 20,000 | 20,943 | ||||||
The Allstate Corp., 3.85%, 8/10/2049 | 10,000 | 10,459 | ||||||
The Goldman Sachs Group, Inc., 4.223%, 5/1/2029 | 80,000 | 85,801 | ||||||
Wells Fargo & Co., 3.196%, 6/17/2027 | 20,000 | 20,382 | ||||||
|
| |||||||
| 388,765 | ||||||||
| Health Care 2.4% |
| |||||||
AbbVie, Inc., 4.875%, 11/14/2048 | 15,000 | 15,788 | ||||||
Bristol-Myers Squibb Co., 144A, 4.25%, 10/26/2049 | 40,000 | 44,216 | ||||||
CVS Health Corp., 5.05%, 3/25/2048 | 45,000 | 47,930 | ||||||
Eli Lilly & Co.: | ||||||||
3.95%, 3/15/2049 | 10,000 | 10,825 | ||||||
4.15%, 3/15/2059 | 9,000 | 9,879 | ||||||
HCA, Inc.: | ||||||||
4.125%, 6/15/2029 | 20,000 | 20,560 | ||||||
7.5%, 2/15/2022 | 60,000 | 66,150 | ||||||
|
| |||||||
| 215,348 | ||||||||
| Industrials 2.2% |
| |||||||
Clean Harbors, Inc., 144A, 4.875%, 7/15/2027 (b) | 10,000 | 10,163 | ||||||
General Electric Co., 4.5%, 3/11/2044 | 30,000 | 29,107 | ||||||
Park Aerospace Holdings Ltd., 144A, 5.25%, 8/15/2022 | 60,000 | 63,348 | ||||||
Parker-Hannifin Corp., 3.25%, 6/14/2029 | 10,000 | 10,372 | ||||||
Prime Security Services Borrower LLC, 144A, 5.25%, 4/15/2024 | 50,000 | 50,875 | ||||||
The accompanying notes are an integral part of the financial statements.
Deutsche DWS Variable Series II — DWS Multisector Income VIP | | | 5 |
Table of Contents
| Principal Amount ($)(a) | Value ($) | |||||||
United Technologies Corp., 4.625%, 11/16/2048 | 25,000 | 29,154 | ||||||
|
| |||||||
| 193,019 | ||||||||
| Information Technology 1.4% |
| |||||||
Broadcom, Inc., 144A, 4.75%, 4/15/2029 | 11,000 | 11,295 | ||||||
Dell International LLC, 144A, 5.3%, 10/1/2029 | 11,000 | 11,592 | ||||||
Fiserv, Inc.: | ||||||||
3.5%, 7/1/2029 | 30,000 | 30,836 | ||||||
4.4%, 7/1/2049 | 10,000 | 10,521 | ||||||
NXP BV: | ||||||||
144A, 3.875%, 6/18/2026 | 30,000 | 30,832 | ||||||
144A, 4.3%, 6/18/2029 | 20,000 | 20,618 | ||||||
Oracle Corp., 4.0%, 11/15/2047 | 10,000 | 10,746 | ||||||
|
| |||||||
| 126,440 | ||||||||
| Materials 0.5% |
| |||||||
Freeport-McMoRan, Inc., 4.55%, 11/14/2024 | 40,000 | 40,890 | ||||||
| Real Estate 1.7% |
| |||||||
American Tower Corp., (REIT), 3.8%, 8/15/2029 | 50,000 | 51,540 | ||||||
Office Properties Income Trust: | ||||||||
(REIT), 4.0%, 7/15/2022 | 25,000 | 25,274 | ||||||
(REIT), 4.15%, 2/1/2022 | 30,000 | 30,441 | ||||||
(REIT), 4.25%, 5/15/2024 | 10,000 | 9,966 | ||||||
Omega Healthcare Investors, Inc.: | ||||||||
(REIT), 4.5%, 4/1/2027 | 15,000 | 15,685 | ||||||
(REIT), 4.75%, 1/15/2028 | 20,000 | 21,179 | ||||||
|
| |||||||
| 154,085 | ||||||||
| Utilities 2.4% |
| |||||||
NextEra Energy Operating Partners LP, 144A, 4.25%, 7/15/2024 | 45,000 | 45,282 | ||||||
NRG Energy, Inc., 144A, 5.25%, 6/15/2029 | 25,000 | 26,687 | ||||||
Southern California Edison Co., Series E, 3.7%, 8/1/2025 | 130,000 | 134,421 | ||||||
Vistra Operations Co. LLC, 144A, 5.0%, 7/31/2027 | 10,000 | 10,363 | ||||||
|
| |||||||
| 216,753 | ||||||||
Total Corporate Bonds (Cost $2,753,622) |
| 2,812,299 | ||||||
| Mortgage-Backed SecuritiesPass-Throughs 7.9% |
| |||||||
Federal National Mortgage Association, 4.0%, 7/1/2049 (b) (Cost $677,157) | 670,366 | 699,219 | ||||||
| Asset-Backed 0.7% |
| |||||||
| Home Equity Loans 0.1% |
| |||||||
CIT Group Home Equity Loan Trust, “AF6”, Series2002-1, 6.2%, 2/25/2030 | 11,614 | 11,873 | ||||||
| Principal Amount ($)(a) | Value ($) | |||||||
| Miscellaneous 0.6% |
| |||||||
Hilton Grand Vacations Trust, “B”,Series 2014-AA, 144A, 2.07%, 11/25/2026 | 50,509 | 50,124 | ||||||
Total Asset-Backed (Cost $61,843) |
| 61,997 | ||||||
| Commercial Mortgage-Backed Securities 5.4% |
| |||||||
GMAC Commercial Mortgage Securities, Inc., “G”,Series 2004-C1, 144A, 5.455%, 3/10/2038 | 394,448 | 375,292 | ||||||
GS Mortgage Securities Corp.,”A4”, Series 2019-GC40, 1-month USD-LIBOR + 1.600%, 3.16%**, 7/10/2052 | 100,000 | 102,996 | ||||||
Total Commercial Mortgage-Backed Securities(Cost $499,909) |
| 478,288 | ||||||
| Collateralized Mortgage Obligations 13.5% |
| |||||||
Banc of America Mortgage Securities, “2A2”,Series 2004-A, 4.817%**, 2/25/2034 | 28,156 | 28,520 | ||||||
Bear Stearns Adjustable Rate Mortgage Trust, “2A1”,Series 2005-11, 5.233%**, 12/25/2035 | 28,181 | 29,088 | ||||||
Countrywide Home Loans, “2A5”,Series 2004-13, 5.75%, 8/25/2034 | 26,024 | 26,301 | ||||||
Fannie Mae Connecticut Avenue Securities: | ||||||||
“1M2”, Series2018-C06,1-monthUSD-LIBOR + 2.000%, 4.404%**, 3/25/2031 | 62,500 | 62,578 | ||||||
“1M2”, Series2018-C01“1M2”,Series 2018-C06“1M2”,Series 2018-C01,1-monthUSD-LIBOR + 2.250%, 4.654%**, 7/25/2030 | 250,000 | 252,643 | ||||||
“1M2”, Series2019-R02, 144A,1-monthUSD-LIBOR + 2.300%, 4.704%**, 8/25/2031 | 70,000 | 70,603 | ||||||
“1M2”, Series2018-C05,1-monthUSD-LIBOR + 2.350%, 4.754%**, 1/25/2031 | 100,000 | 100,889 | ||||||
Federal Home Loan Mortgage Corp.: | ||||||||
“PI”, Series 3843, Interest Only, 4.5%, 5/15/2038 | 77,805 | 3,030 | ||||||
“C31”, Series 303, Interest Only, 4.5%, 12/15/2042 | 369,682 | 69,588 | ||||||
Federal National Mortgage Association, “4”, Series 406, Interest Only, 4.0%, 9/25/2040 | 87,916 | 15,577 | ||||||
Freddie Mac Structured Agency Credit Risk Debt Notes, “M2”, Series 2019-DNA2, 144A,1-monthUSD-LIBOR + 2.450%, 4.854%**, 3/25/2049 | 110,000 | 111,538 | ||||||
The accompanying notes are an integral part of the financial statements.
| 6 | | | Deutsche DWS Variable Series II — DWS Multisector Income VIP |
Table of Contents
| Principal Amount ($)(a) | Value ($) | |||||||
Government National Mortgage Association: | ||||||||
“GI”, Series2014-146, Interest Only, 3.5%, 9/20/2029 | 743,905 | 80,768 | ||||||
“PI”, Series2015-40, Interest Only, 4.0%, 4/20/2044 | 94,065 | 8,682 | ||||||
“HI”, Series2015-77, Interest Only, 4.0%, 5/20/2045 | 204,425 | 29,787 | ||||||
“IP”, Series2014-115, Interest Only, 4.5%, 2/20/2044 | 31,233 | 4,405 | ||||||
“IN”, Series2009-69, Interest Only, 5.5%, 8/20/2039 | 105,176 | 17,689 | ||||||
“IV”, Series2009-69, Interest Only, 5.5%, 8/20/2039 | 102,256 | 17,144 | ||||||
“IJ”, Series2009-75, Interest Only, 6.0%, 8/16/2039 | 87,697 | 14,245 | ||||||
JPMorgan Mortgage Trust, “2A1”,Series 2006-A2, 4.281%**, 4/25/2036 | 102,636 | 99,540 | ||||||
Merrill Lynch Mortgage Investors Trust, “2A”, Series2003-A6, 4.577%**, 10/25/2033 | 22,783 | 23,069 | ||||||
STACR Trust, “M2”, Series 2018-DNA3, 144A,1-monthUSD-LIBOR + 2.100%, 4.504%**, 9/25/2048 | 108,108 | 108,108 | ||||||
Wells Fargo Mortgage-Backed Securities Trust, “2A3”,Series 2004-EE, 4.959%**, 12/25/2034 | 25,613 | 26,023 | ||||||
Total Collateralized Mortgage Obligations (Cost $958,947) |
| 1,199,815 | ||||||
| Government & Agency Obligations 31.5% |
| |||||||
| Sovereign Bonds 2.5% |
| |||||||
Republic of Argentina-Inflation Linked Bond, 5.83%, 12/31/2033 | ARS | 476 | 97 | |||||
Republic of Kazakhstan, 144A, 1.55%, 11/9/2023 | EUR | 100,000 | 119,353 | |||||
Republic of Slovenia, 144A, 5.5%, 10/26/2022 | 100,000 | 109,366 | ||||||
|
| |||||||
| 228,816 | ||||||||
| U.S. Treasury Obligations 29.0% |
| |||||||
U.S. Treasury Bond, 3.0%, 2/15/2049 | 102,000 | 112,025 | ||||||
U.S. Treasury Inflation Indexed Note, 0.625%, 4/15/2023 | 282,874 | 286,205 | ||||||
U.S. Treasury Notes: |
| |||||||
1.625%, 12/31/2019 | 109,000 | 108,740 | ||||||
2.125%, 5/31/2026 | 272,000 | 276,547 | ||||||
2.375%, 5/15/2029 | 861,000 | 889,756 | ||||||
2.625%, 8/31/2020 | 900,000 | 907,383 | ||||||
|
| |||||||
| 2,580,656 | ||||||||
Total Government & Agency Obligations |
| 2,809,472 | ||||||
| Short-Term U.S. Treasury Obligations 2.7% |
| |||||||
U.S. Treasury Bills: |
| |||||||
2.362%***, 8/15/2019 (c) | 200,000 | 199,477 | ||||||
2.573%***, 10/10/2019 | 40,000 | 39,765 | ||||||
Total Short-Term U.S. Treasury Obligations (Cost $239,121) |
| 239,242 | ||||||
| Principal Amount ($)(a) | Value ($) | |||||||
| Loan Participations and Assignments 3.2% |
| |||||||
| Senior Loans ** |
| |||||||
DaVita, Inc., Term Loan B,1-week USD LIBOR + 2.750%, 5.135%, 6/24/2021 | 66,500 | 66,556 | ||||||
Level 3 Financing, Inc., Term Loan B,1-month USD LIBOR + 2.250%, 4.652%, 2/22/2024 | 60,000 | 59,603 | ||||||
MEG Energy Corp., Term Loan B,1-month USD LIBOR + 3.500%, 5.902%, 12/31/2023 | 5,254 | 5,258 | ||||||
Quebecor Media, Inc., Term Loan B1,1-month USD LIBOR + 2.250%, 4.651%, 8/17/2020 | 84,825 | 85,019 | ||||||
Valeant Pharmaceuticals International, Inc., Term Loan B,1-month USD LIBOR + 3.000%, 5.412%, 6/2/2025 | 68,498 | 68,548 | ||||||
Total Loan Participations and Assignments (Cost $285,004) |
| 284,984 | ||||||
| Convertible Bonds 1.9% |
| |||||||
| Materials | ||||||||
GEO Specialty Chemicals, Inc.,3-monthUSD-LIBOR + 14.0%, 16.503%** PIK 10/18/2025 (d) (Cost $156,151) | 156,998 | 175,995 | ||||||
| Shares | Value ($) | |||||||
| Common Stocks 0.3% |
| |||||||
| Industrials 0.0% |
| |||||||
Quad Graphics, Inc. | 4 | 32 | ||||||
| Materials 0.3% |
| |||||||
GEO Specialty Chemicals, Inc.* (d) | 94,587 | 29,700 | ||||||
Total Common Stocks (Cost $41,676) |
| 29,732 | ||||||
| Warrants 0.0% |
| |||||||
| Materials | ||||||||
Hercules Trust II, Expiration Date 29/03/2031* (d) (Cost $17,432) | 85 | 3,776 | ||||||
| Cash Equivalents 5.6% | ||||||||
DWS Central Cash Management Government Fund, 2.40% (e) (Cost $498,533) | 498,533 | 498,533 | ||||||
| % of Net Assets | Value ($) | |||||||
Total Investment Portfolio | 104.3 | 9,293,352 | ||||||
| Other Assets and Liabilities, Net | (4.3 | ) | (385,189 | ) | ||||
| Net Assets | 100.0 | 8,908,163 | ||||||
The accompanying notes are an integral part of the financial statements.
Deutsche DWS Variable Series II — DWS Multisector Income VIP | | | 7 |
Table of Contents
A summary of the Fund’s transactions with affiliated investments during the period ended June 30, 2019 are as follows:
| Value ($) at 12/31/2018 | Purchases Cost ($) | Sales Proceeds ($) | Net Realized Gain/ (Loss) ($) | Net Change in Unrealized Appreciation (Depreciation) ($) | Income ($) | Capital Gain Distributions ($) | Number of Shares at 6/30/2019 | Value ($) at 6/30/2019 | ||||||||||||||||||||||||
Securities Lending Collateral 0.0% |
| |||||||||||||||||||||||||||||||
DWS Government & Agency Securities Portfolio “DWS Government Cash Institutional Shares”, 2.28% (e) (f) |
| |||||||||||||||||||||||||||||||
| 302,310 | — | 302,310 | (g) | — | — | 2,307 | — | — | — | |||||||||||||||||||||||
Cash Equivalents 5.6% |
| |||||||||||||||||||||||||||||||
DWS Central Cash Management Government Fund, 2.40% (e) |
| |||||||||||||||||||||||||||||||
| 395,710 | 4,357,110 | 4,254,287 | — | — | 9,692 | — | 498,533 | 498,533 | ||||||||||||||||||||||||
| 698,020 | 4,357,110 | 4,556,597 | — | — | 11,999 | — | 498,533 | 498,533 | ||||||||||||||||||||||||
| * | Non-income producing security. |
| ** | Variable or floating rate security. These securities are shown at their current rate as of June 30, 2019. For securities based on a published reference rate and spread, the reference rate and spread are indicated within the description above. Certain variable rate securities are not based on a published reference rate and spread but adjust periodically based on current market conditions, prepayment of underlying positions and/or other variables. |
| *** | Annualized yield at time of purchase; not a coupon rate. |
| (a) | Principal amount stated in U.S. dollars unless otherwise noted. |
| (b) | When-issued, delayed delivery or forward commitment securities included. |
| (c) | At June 30, 2019, this security has been pledged, in whole or in part, to cover initial margin requirements for open futures contracts. |
| (d) | Investment was valued using significant unobservable inputs. |
| (e) | Affiliated fund managed by DWS Investment Management Americas, Inc. The rate shown is the annualizedseven-day yield at period end. |
| (f) | Represents cash collateral held in connection with securities lending. Income earned by the Fund is net of borrower rebates. |
| (g) | Represents the net increase (purchase cost) or decrease (sales proceeds) in the amount invested in cash collateral for the period ended June 30, 2019. |
144A: Security exempt from registration under Rule 144A of the Securities Act of 1933. These securities may be resold in transactions exempt from registration, normally to qualified institutional buyers.
Interest Only: Interest Only (IO) bonds represent the “interest only” portion of payments on a pool of underlying mortgages or mortgage-backed securities. IO securities are subject to prepayment risk of the pool of underlying mortgages.
LIBOR: London Interbank Offered Rate
PIK: Denotes that all or a portion of the income is paidin-kind in the form of additional principal.
REIT: Real Estate Investment Trust
Included in the portfolio are investments in mortgage or asset-backed securities which are interests in separate pools of mortgages or assets. Effective maturities of these investments may be shorter than stated maturities due to prepayments.
At June 30, 2019, open futures contracts purchased were as follows:
| Futures | Currency | Expiration Date | Contracts | Notional Amount ($) | Notional Value ($) | Unrealized Appreciation ($) | ||||||||||||||||||
| 2 Year U.S. Treasury Note | USD | 9/30/2019 | 9 | 1,927,498 | 1,936,617 | 9,119 | ||||||||||||||||||
| U.S. Treasury Long Bond | USD | 9/19/2019 | 2 | 305,606 | 311,188 | 5,582 | ||||||||||||||||||
| Ultra 10 Year U.S. Treasury Note | USD | 9/19/2019 | 10 | 1,359,586 | 1,381,250 | 21,664 | ||||||||||||||||||
| Total unrealized appreciation |
| 36,365 | ||||||||||||||||||||||
As of June 30, 2019, the Fund had the following open forward foreign currency contracts:
| Contracts to Deliver | In Exchange For | Settlement Date | Unrealized Appreciation ($) | Counterparty | ||||||||||||||||||||
| USD | 171,671 | CAD | 230,000 | 8/7/2019 | 4,104 | State Street Bank and Trust | ||||||||||||||||||
| EUR | 150,000 | JPY | 18,479,056 | 8/7/2019 | 799 | National Australia Bank Ltd. | ||||||||||||||||||
| EUR | 105,000 | USD | 120,534 | 9/26/2019 | 335 | JPMorgan Chase Securities, Inc. | ||||||||||||||||||
| Total unrealized appreciation | 5,238 | |||||||||||||||||||||||
| Contracts to Deliver | In Exchange For | Settlement Date | Unrealized Depreciation ($) | Counterparty | ||||||||||||||||||||
| CAD | 230,000 | USD | 171,069 | 8/7/2019 | (4,706) | Bank of America | ||||||||||||||||||
| EUR | 157,000 | JPY | 19,149,462 | 8/7/2019 | (949) | Credit Agricole | ||||||||||||||||||
| AUD | 245,000 | USD | 171,009 | 8/8/2019 | (1,209) | State Street Bank and Trust | ||||||||||||||||||
| AUD | 245,000 | USD | 169,991 | 8/8/2019 | (2,228 | ) | National Australia Bank Ltd. | |||||||||||||||||
| Total unrealized depreciation | (9,092 | ) | ||||||||||||||||||||||
The accompanying notes are an integral part of the financial statements.
| 8 | | | Deutsche DWS Variable Series II — DWS Multisector Income VIP |
Table of Contents
Currency Abbreviations
| ARS | Argentine Peso |
| AUD | Australian Dollar |
| CAD | Canadian Dollar |
| EUR | Euro |
| JPY | Japanese Yen |
| USD | United States Dollar |
For information on the Fund’s policy and additional disclosures regarding futures contracts and forward foreign currency contracts, please refer to the Derivatives section of Note A in the accompanying Notes to Financial Statements.
Fair Value Measurements
Various inputs are used in determining the value of the Fund’s investments. These inputs are summarized in three broad levels. Level 1 includes quoted prices in active markets for identical securities. Level 2 includes other significant observable inputs (including quoted prices for similar securities, interest rates, prepayment speeds and credit risk). Level 3 includes significant unobservable inputs (including the Fund’s own assumptions in determining the fair value of investments). The level assigned to the securities valuations may not be an indication of the risk or liquidity associated with investing in those securities.
The following is a summary of the inputs used as of June 30, 2019 in valuing the Fund’s investments. For information on the Fund’s policy regarding the valuation of investments, please refer to the Security Valuation section of Note A in the accompanying Notes to Financial Statements.
| Assets | Level 1 | Level 2 | Level 3 | Total | ||||||||||||
| Fixed Income Investments (h) | ||||||||||||||||
Corporate Bonds | $ | — | $ | 2,812,299 | $ | — | $ | 2,812,299 | ||||||||
Mortgage-Backed Securities Pass-Throughs | — | 699,219 | — | 699,219 | ||||||||||||
Asset-Backed | — | 61,997 | — | 61,997 | ||||||||||||
Commercial Mortgage-Backed Securities | — | 478,288 | — | 478,288 | ||||||||||||
Collateralized Mortgage Obligations | — | 1,199,815 | — | 1,199,815 | ||||||||||||
Government & Agency Obligations | — | 2,809,472 | — | 2,809,472 | ||||||||||||
Short-Term U.S. Treasury Obligations | — | 239,242 | — | 239,242 | ||||||||||||
Loan Participations and Assignments | — | 284,984 | — | 284,984 | ||||||||||||
Convertible Bonds | — | — | 175,995 | 175,995 | ||||||||||||
| Common Stocks(h) | 32 | — | 29,700 | 29,732 | ||||||||||||
| Warrants | — | — | 3,776 | 3,776 | ||||||||||||
| Short-Term Investments | 498,533 | — | — | 498,533 | ||||||||||||
| Derivatives (i) | ||||||||||||||||
Futures Contracts | $ | 36,365 | $ | — | $ | — | $ | 36,365 | ||||||||
Forward Foreign Currency Contracts | — | 5,238 | — | 5,238 | ||||||||||||
| Total | $ | 534,930 | $ | 8,590,554 | $ | 209,471 | $ | 9,334,955 | ||||||||
| Liabilities | Level 1 | Level 2 | Level 3 | Total | ||||||||||||
| Derivatives (i) | ||||||||||||||||
Forward Foreign Currency Contracts | $ | — | $ | (9,092 | ) | $ | — | $ | (9,092 | ) | ||||||
| Total | $ | — | $ | (9,092 | ) | $ | — | $ | (9,092 | ) | ||||||
| (h) | See Investment Portfolio for additional detailed categorizations. |
| (i) | Derivatives include unrealized appreciation (depreciation) on open futures contracts and forward foreign currency contracts. |
Level 3 Reconciliation
The following is a reconciliation of the Fund’s Level 3 investments for which significant unobservable inputs were used in determining value:
| Bank Loans | Convertible Bonds | Common Stocks | Warrants | Total | ||||||||||||||||
Balance as of December 31, 2018 | $ | 56,865 | $ | 158,403 | $ | 10,724 | $ | 2,096 | $ | 228,088 | ||||||||||
| Realized gains (loss) | (6 | ) | — | — | — | (6 | ) | |||||||||||||
| Change in unrealized appreciation (depreciation) | 328 | 7,388 | 16,755 | 1,680 | 26,151 | |||||||||||||||
| Amortization premium/discount | 0 | 10 | — | — | 10 | |||||||||||||||
| Purchases/PIK | — | 10,194 | 2,221 | — | 12,415 | |||||||||||||||
| (Sales) | (57,187 | ) | — | — | — | (57,187 | ) | |||||||||||||
| Transfers into Level 3 | — | — | — | — | — | |||||||||||||||
| Transfers (out) of Level 3 | — | — | — | — | — | |||||||||||||||
| Balance as of June 30, 2019 | $ | — | $ | 175,995 | $ | 29,700 | $ | 3,776 | $ | 209,471 | ||||||||||
| Net change in unrealized appreciation (depreciation) from investments still held as of June 30, 2019 | $ | — | $ | 7,388 | $ | 16,755 | $ | 1,680 | $ | 25,823 | ||||||||||
The accompanying notes are an integral part of the financial statements.
Deutsche DWS Variable Series II — DWS Multisector Income VIP | | | 9 |
Table of Contents
| Quantitative Disclosure About Significant Unobservable Inputs | ||||||||||
| Asset Class | Fair Value at 6/30/19 | Valuation Technique(s) | Unobservable Input | Range (Weighted Average) | ||||||
| Convertible Bond: | ||||||||||
| Materials | $175,995 | Market Approach | Terms of merger agreement | N/A | ||||||
Illiquidity discount | 5% | |||||||||
| Common Stock: | ||||||||||
| Materials | $29,700 | Market Approach | Terms of merger agreement | N/A | ||||||
Illiquidity discount | 5% | |||||||||
| Warrants: | ||||||||||
| Materials | $3,776 | Black Scholes Option Pricing Model | Implied Volatility of Option | 26.06% | ||||||
Illiquidity discount | 20% | |||||||||
Qualitative Disclosure About Unobservable Inputs
Significant unobservable inputs developed by the Pricing Committee and used in the fair value measurement of the Fund’s convertible bond investment include the terms of the merger agreement and an illiquidity discount. A significant change in the terms of the merger agreement is unlikely to have a material impact to the fair value measurement, while a significant change in the illiquidity discount is likely to have a material impact to the fair value measurement.
Significant unobservable inputs developed by the Pricing Committee and used in the fair value measurement of the Fund’s common stock investment include the terms of the merger agreement and an illiquidity discount. A significant change in the terms of the merger agreement is unlikely to have a material impact to the fair value measurement, while a significant change in the illiquidity discount is unlikely to have a material impact to the fair value measurement.
Significant unobservable inputs developed by the Pricing Committee and used in the fair value measurement of the Fund’s warrants include volatility and discount for lack of marketability. A change in the volatility of the underlying asset as an input to the Black-Scholes model may have a significant change in the fair value measurement. A significant change in the discount for lack of marketability is unlikely to have a material impact to the fair value measurement.
The accompanying notes are an integral part of the financial statements.
| 10 | | | Deutsche DWS Variable Series II — DWS Multisector Income VIP |
Table of Contents
Statement of Assets and Liabilities
| as of June 30, 2019 (Unaudited) | ||||
| Assets | ||||
| Investments innon-affiliated securities, at value (cost $8,443,373) | $ | 8,794,819 | ||
| Investment in DWS Central Cash Management Government Fund (cost $498,533) | 498,533 | |||
| Cash | 12,129 | |||
| Foreign currency, at value (cost $45,935) | 46,300 | |||
| Deposit with broker for future contracts | 485 | |||
| Receivable for investments sold | 70,873 | |||
| Interest receivable | 63,098 | |||
| Unrealized appreciation on forward foreign currency contracts | 5,238 | |||
| Foreign taxes recoverable | 627 | |||
Due from Advisor | 7,423 | |||
| Other assets | 75 | |||
| Total assets | 9,499,600 | |||
| Liabilities | ||||
| Payable for investments purchased | 265,738 | |||
| Payable for investments purchased — when issued securities | 251,881 | |||
| Payable for Fund shares redeemed | 4,877 | |||
| Payable for variation margin on futures contracts | 558 | |||
| Unrealized depreciation on forward foreign currency contracts | 9,092 | |||
| Accrued Trustees’ fees | 67 | |||
| Other accrued expenses and payables | 59,224 | |||
| Total liabilities | 591,437 | |||
| Net assets, at value | $ | 8,908,163 | ||
| Net Assets Consist of | ||||
| Distributable earnings (loss) | (4,167,584 | ) | ||
| Paid-in capital | 13,075,747 | |||
| Net assets, at value | $ | 8,908,163 | ||
| Net Asset Value |
| |||
Class A | ||||
| Net asset value, offering and redemption price per share (8,908,163 ÷ 929,067 outstanding shares of beneficial interest, no par value, unlimited number of shares authorized) | $ | 9.59 | ||
| for the six months ended June 30, 2019 (Unaudited) |
| |||
| Investment Income | ||||
| Income: | ||||
| Interest | $ | 163,541 | ||
| Income distributions — DWS Central Cash Management Government Fund | 9,692 | |||
| Securities lending income, net of borrower rebates | 2,307 | |||
| Total income | 175,540 | |||
| Expenses: | ||||
| Management fee | 23,098 | |||
| Administration fee | 4,200 | |||
| Services to Shareholders | 113 | |||
| Custodian fee | 9,655 | |||
| Professional fees | 42,926 | |||
| Reports to shareholders | 15,083 | |||
| Trustees’ fees and expenses | 1,116 | |||
| Pricing service fee | 5,250 | |||
| Other | 1,324 | |||
| Total expenses before expense reductions | 102,765 | |||
| Expense reductions | (75,322 | ) | ||
| Total expenses after expense reductions | 27,443 | |||
| Net investment income | 148,097 | |||
| Realized and Unrealized Gain (Loss) | ||||
| Net realized gain (loss) from: | ||||
| Investments | (109,392 | ) | ||
| Futures | 105,087 | |||
| Forward foreign currency contracts | (144 | ) | ||
| Foreign currency | 2,039 | |||
| (2,410 | ) | |||
| Change in net unrealized appreciation (depreciation) on: | ||||
| Investments | 453,443 | |||
| Futures | (3,879 | ) | ||
| Forward foreign currency contracts | (13,628 | ) | ||
| Foreign currency | 549 | |||
| 436,485 | ||||
| Net gain (loss) | 434,075 | |||
| Net increase (decrease) in net assets resulting from operations | $ | 582,172 | ||
The accompanying notes are an integral part of the financial statements.
Deutsche DWS Variable Series II — DWS Multisector Income VIP | | | 11 |
Table of Contents
Statements of Changes in Net Assets
| Increase (Decrease) in Net Assets | Six Months Ended June 30, 2019 (Unaudited) | Year Ended 2018 | ||||||
| Operations: | ||||||||
| Net investment income | $ | 148,097 | $ | 309,384 | ||||
| Net realized gain (loss) | (2,410 | ) | (106,781 | ) | ||||
| Change in net unrealized appreciation (depreciation) | 436,485 | (345,745 | ) | |||||
| Net increase (decrease) in net assets resulting from operations | 582,172 | (143,142 | ) | |||||
| Distributions to shareholders: | ||||||||
Class A | (339,978 | ) | (641,992 | ) | ||||
| Fund share transactions: | ||||||||
Class A | ||||||||
| Proceeds from shares sold | 711,739 | 612,918 | ||||||
| Reinvestment of distributions | 339,978 | 641,992 | ||||||
| Payments for shares redeemed | (677,583 | ) | (1,895,400 | ) | ||||
| Net increase (decrease) in net assets from Class A share transactions | 374,134 | (640,490 | ) | |||||
| Increase (decrease) in net assets | 616,328 | (1,425,624 | ) | |||||
| Net assets at beginning of period | 8,291,835 | 9,717,459 | ||||||
| Net assets at end of period | $ | 8,908,163 | $ | 8,291,835 | ||||
| Other Information | ||||||||
Class A | ||||||||
| Shares outstanding at beginning of period | 888,694 | 951,249 | ||||||
| Shares sold | 75,208 | 64,660 | ||||||
| Shares issued to shareholders in reinvestment of distributions | 36,596 | 68,080 | ||||||
| Shares redeemed | (71,431 | ) | (195,295 | ) | ||||
| Net increase (decrease) in Class A shares | 40,373 | (62,555 | ) | |||||
| Shares outstanding at end of period | 929,067 | 888,694 | ||||||
The accompanying notes are an integral part of the financial statements.
| 12 | | | Deutsche DWS Variable Series II — DWS Multisector Income VIP |
Table of Contents
| Six Months Ended 6/30/19 | Years Ended December 31, | |||||||||||||||||||||||
| Class A | (Unaudited) | 2018 | 2017 | 2016 | 2015 | 2014 | ||||||||||||||||||
| Selected Per Share Data | ||||||||||||||||||||||||
| Net asset value, beginning of period | $ | 9.33 | $ | 10.22 | $ | 9.65 | $ | 10.43 | $ | 11.20 | $ | 11.53 | ||||||||||||
| Income (loss) from investment operations: | ||||||||||||||||||||||||
Net investment incomea | .17 | .34 | .28 | .22 | .40 | .49 | ||||||||||||||||||
Net realized and unrealized gain (loss) | .48 | (.50 | ) | .37 | (.17 | ) | (.72 | ) | (.23 | ) | ||||||||||||||
Total from investment operations | .65 | (.16 | ) | .65 | .05 | (.32 | ) | .26 | ||||||||||||||||
| Less distributions from: | ||||||||||||||||||||||||
Net investment income | (.39 | ) | (.73 | ) | (.08 | ) | (.83 | ) | (.45 | ) | (.59 | ) | ||||||||||||
| Net asset value, end of period | $ | 9.59 | $ | 9.33 | $ | 10.22 | $ | 9.65 | $ | 10.43 | $ | 11.20 | ||||||||||||
| Total Return (%)b | 7.10 | ** | (1.65 | ) | 6.78 | .50 | (3.02 | ) | 2.23 | |||||||||||||||
| Ratios to Average Net Assets and Supplemental Data | ||||||||||||||||||||||||
| Net assets, end of period ($ millions) | 9 | 8 | 10 | 25 | 33 | 54 | ||||||||||||||||||
| Ratio of expenses before expense reductions (%)c | 2.45 | * | 2.19 | 1.37 | 1.31 | 1.15 | 1.08 | |||||||||||||||||
| Ratio of expenses after expense reductions (%)c | .65 | * | .65 | .67 | .68 | .70 | .77 | |||||||||||||||||
| Ratio of net investment income (%) | 3.53 | * | 3.50 | 2.81 | 2.19 | 3.67 | 4.23 | |||||||||||||||||
| Portfolio turnover rate (%) | 114 | ** | 85 | 96 | 159 | 185 | 185 | |||||||||||||||||
| a | Based on average shares outstanding during the period. |
| b | Total return would have been lower had certain expenses not been reduced. |
| c | Expense ratio does not reflect charges and fees associated with the separate account that invests in the Fund or any variable life insurance policy or variable annuity contract for which the Fund is an investment option. |
| * | Annualized |
| ** | Not annualized |
The accompanying notes are an integral part of the financial statements.
Deutsche DWS Variable Series II — DWS Multisector Income VIP | | | 13 |
Table of Contents
| Notes to Financial Statements | (Unaudited) |
A. Organization and Significant Accounting Policies
DWS Multisector Income VIP (the “Fund”) is a diversified series of Deutsche DWS Variable Series II (the “Trust”), which is registered under the Investment Company Act of 1940, as amended (the “1940 Act”), as anopen-end management investment company organized as a Massachusetts business trust.
The Fund’s financial statements are prepared in accordance with accounting principles generally accepted in the United States of America (“U.S. GAAP”) which require the use of management estimates. Actual results could differ from those estimates. The Fund qualifies as an investment company under Topic 946 of Accounting Standards Codification of U.S. GAAP. The policies described below are followed consistently by the Fund in the preparation of its financial statements.
Security Valuation. Investments are stated at value determined as of the close of regular trading on the New York Stock Exchange on each day the exchange is open for trading.
Various inputs are used in determining the value of the Fund’s investments. These inputs are summarized in three broad levels. Level 1 includes quoted prices in active markets for identical securities. Level 2 includes other significant observable inputs (including quoted prices for similar securities, interest rates, prepayment speeds and credit risk). Level 3 includes significant unobservable inputs (including the Fund’s own assumptions in determining the fair value of investments). The level assigned to the securities valuations may not be an indication of the risk or liquidity associated with investing in those securities.
Debt securities and loan participations and assignments are valued at prices supplied by independent pricing services approved by the Fund’s Board. Such services may use various pricing techniques which take into account appropriate factors such as yield, quality, coupon rate, maturity, type of issue, trading characteristics, prepayment speeds and other data, as well as broker quotes. If the pricing services are unable to provide valuations, debt securities are valued at the average of the most recent reliable bid quotations or evaluated prices, as applicable, obtained frombroker-dealers and loan participations and assignments are valued at the mean of the most recent bid and ask quotations or evaluated prices, as applicable, obtained from one or morebroker-dealers. Certain securities may be valued on the basis of a price provided by a single source orbroker-dealer. No active trading market may exist for some senior loans and they may be subject to restrictions on resale. The inability to dispose of senior loans in a timely fashion could result in losses. These securities are generally categorized as Level 2. Certain securities may be valued on the basis of a price provided by a single source or broker-dealer. No active trading market may exist for some senior loans and they may be subject to restrictions on resale. The inability to dispose of senior loans in a timely fashion could result in losses. These securities are generally categorized as Level 3.
Equity securities are valued at the most recent sale price or official closing price reported on the exchange (U.S. or foreign) or over-the-counter market on which they trade. Securities for which no sales are reported are valued at the calculated mean between the most recent bid and asked quotations on the relevant market or, if a mean cannot be determined, at the most recent bid quotation. Equity securities are generally categorized as Level 1.
Futures contracts are generally valued at the settlement prices established each day on the exchange on which they are traded and are categorized as Level 1.
Forward currency contracts are valued at the prevailing forward exchange rate of the underlying currencies and are categorized as Level 2.
Securities and other assets for which market quotations are not readily available or for which the above valuation procedures are deemed not to reflect fair value are valued in a manner that is intended to reflect their fair value as determined in accordance with procedures approved by the Board and are generally categorized as Level 3. In accordance with the Fund’s valuation procedures, factors considered in determining value may include, but are not limited to, the type of the security; the size of the holding; the initial cost of the security; the existence of any contractual restrictions on the security’s disposition; the price and extent of public trading in similar securities of the issuer or of comparable companies; quotations or evaluated prices frombroker-dealers and/or pricing services; information obtained from the issuer, analysts, and/or the appropriate stock exchange (forexchange-traded securities); an analysis of the company’s or issuer’s financial statements; an evaluation of the forces that influence the issuer and the market(s) in which the security is purchased and sold; and with respect to debt securities, the maturity, coupon, creditworthiness, currency denomination and the movement of the market in which the security is normally
| 14 | | | Deutsche DWS Variable Series II — DWS Multisector Income VIP |
Table of Contents
traded. The value determined under these procedures may differ from published values for the same securities.
Disclosure about the classification of fair value measurements is included in a table following the Fund’s Investment Portfolio.
Foreign Currency Translations. The books and records of the Fund are maintained in U.S. dollars. Investment securities and other assets and liabilities denominated in a foreign currency are translated into U.S. dollars at the prevailing exchange rates at period end. Purchases and sales of investment securities, income and expenses are translated into U.S. dollars at the prevailing exchange rates on the respective dates of the transactions.
Net realized and unrealized gains and losses on foreign currency transactions represent net gains and losses between trade and settlement dates on securities transactions, the acquisition and disposition of foreign currencies, and the difference between the amount of net investment income accrued and the U.S. dollar amount actually received. The portion of both realized and unrealized gains and losses on investments that results from fluctuations in foreign currency exchange rates is not separately disclosed but is included with net realized and unrealized gain/appreciation and loss/depreciation on investments.
Securities Lending. Deutsche Bank AG, as lending agent, lends securities of the Fund to certain financial institutions under the terms of its securities lending agreement. During the term of the loans, the Fund continues to receive interest and dividends generated by the securities and to participate in any changes in their market value. The Fund requires the borrowers of the securities to maintain collateral with the Fund consisting of either cash or liquid, unencumbered assets having a value at least equal to the value of the securities loaned. When the collateral falls below specified amounts, the lending agent will use its best effort to obtain additional collateral on the next business day to meet required amounts under the securities lending agreement. As of period end, any securities on loan were collateralized by cash. During the six months ended June 30, 2019, the Fund invested the cash collateral into a joint trading account in DWS Government & Agency Securities Portfolio, an affiliated money market fund managed by DWS Investment Management Americas, Inc. DWS Investment Management Americas, Inc. receives a management/administration fee (0.11% annualized effective rate as of June 30, 2019) on the cash collateral invested in DWS Government & Agency Securities Portfolio. The Fund receives compensation for lending its securities either in the form of fees or by earning interest on invested cash collateral net of borrower rebates and fees paid to a lending agent. Either the Fund or the borrower may terminate the loan at any time, and the borrower, after notice, is required to return borrowed securities within a standard time period. There may be risks of delay and costs in recovery of securities or even loss of rights in the collateral should the borrower of the securities fail financially. If the Fund is not able to recover securities lent, the Fund may sell the collateral and purchase a replacement investment in the market, incurring the risk that the value of the replacement security is greater than the value of the collateral. The Fund is also subject to all investment risks associated with the reinvestment of any cash collateral received, including, but not limited to, interest rate, credit and liquidity risk associated with such investments.
As of June 30, 2019, the Fund had no securities on loan.
Loan Participations and Assignments. Loan Participations and Assignments are portions of loans originated by banks and sold in pieces to investors. Thesefloating-rate loans (“Loans”) in which the Fund invests are arranged between the borrower and one or more financial institutions (“Lenders”). These Loans may take the form of Senior Loans, which are corporate obligations often issued in connection with recapitalizations, acquisitions, leveraged buy outs and refinancing. The Fund invests in such Loans in the form of participations in Loans (“Participations”) or assignments of all or a portion of Loans from third parties (“Assignments”). Participations typically result in the Fund having a contractual relationship with only the Lender, not with the borrower. The Fund has the right to receive payments of principal, interest and any fees to which it is entitled from the Lender selling the Participation and only upon receipt by the Lender of the payments from the borrower. In connection with purchasing Participations, the Fund generally has no right to enforce compliance by the borrower with the terms of the loan agreement relating to the Loan, or any rights of set off against the borrower, and the Fund will not benefit directly from any collateral supporting the Loan in which it has purchased the Participation. As a result, the Fund assumes the credit risk of both the borrower and the Lender that is selling the Participation. Assignments typically result in the Fund having a direct contractual relationship with the borrower, and the Fund may enforce compliance by the borrower with the terms of the loan agreement. Loans held by the Fund are generally in the form of Assignments, but the Fund may also invest in Participations. If affiliates of the Advisor participate in the primary and secondary market for senior loans, legal limitations may restrict the Fund’s ability to participate in restructuring or
Deutsche DWS Variable Series II — DWS Multisector Income VIP | | | 15 |
Table of Contents
acquiring some senior loans. All Loans involve interest rate risk, liquidity risk and credit risk, including the potential default or insolvency of the borrower.
Taxes. The Fund’s policy is to comply with the requirements of the Internal Revenue Code, as amended, which are applicable to regulated investment companies and to distribute all of its taxable income to its shareholders.
Additionally, the Fund may be subject to taxes imposed by the governments of countries in which it invests and are generally based on income and/or capital gains earned or repatriated, a portion of which may be recoverable. Based upon the current interpretation of the tax rules and regulations, estimated tax liabilities and recoveries on certain foreign securities are recorded on an accrual basis and are reflected as components of interest income or net change in unrealized gain/loss on investments. Tax liabilities realized as a result of security sales are reflected as a component of net realized gain/loss on investments.
At December 31, 2018, the Fund had net tax basis capital loss carryforwards of approximately $4,643,000, which may be applied against realized net taxable capital gains indefinitely, includingshort-term losses ($1,959,000) andlong-term losses ($2,684,000).
At June 30, 2019, the aggregate cost of investments for federal income tax purposes was $8,942,869. The net unrealized appreciation for all investments based on tax cost was $350,483. This consisted of aggregate gross unrealized appreciation for all investments in which there was an excess of value over tax cost of $400,935 and aggregate gross unrealized depreciation for all investments in which there was an excess of tax cost over value of $50,452.
The Fund has reviewed the tax positions for the open tax years as of December 31, 2018 and has determined that no provision for income tax and/or uncertain tax provisions is required in the Fund’s financial statements. The Fund’s federal tax returns for the prior three fiscal years remain open subject to examination by the Internal Revenue Service.
Distribution of Income and Gains. Distributions from net investment income of the Fund, if any, are declared and distributed to shareholders annually. Net realized gains from investment transactions, in excess of available capital loss carryforwards, would be taxable to the Fund if not distributed and, therefore, will be distributed to shareholders at least annually. The Fund may also make additional distributions for tax purposes if necessary.
The timing and characterization of certain income and capital gain distributions are determined annually in accordance with federal tax regulations which may differ from accounting principles generally accepted in the United States of America. These differences primarily relate to investments in foreign denominated investments, futures contracts and certain securities sold at a loss. As a result, net investment income (loss) and net realized gain (loss) on investment transactions for a reporting period may differ significantly from distributions during such period. Accordingly, the Fund may periodically make reclassifications among certain of its capital accounts without impacting the net asset value of the Fund.
The tax character of current year distributions will be determined at the end of the current fiscal year.
Expenses. Expenses of the Trust arising in connection with a specific fund are allocated to that fund. Other Trust expenses which cannot be directly attributed to a fund are apportioned among the funds in the Trust based upon the relative net assets or other appropriate measures.
Contingencies. In the normal course of business, the Fund may enter into contracts with service providers that contain general indemnification clauses. The Fund’s maximum exposure under these arrangements is unknown, as this would involve future claims that may be made against the Fund that have not yet been made. However, based on experience, the Fund expects the risk of loss to be remote.
Other. Investment transactions are accounted for on a trade date plus one basis for daily net asset value calculations. However, for financial reporting purposes, investment transactions are reported on trade date. Interest income is recorded on the accrual basis. Dividend income is recorded on theex-dividend date net of foreign withholding taxes. Realized gains and losses from investment transactions are recorded on an identified cost basis. Proceeds from litigation payments, if any, are included in net realized gain (loss) from investments. All discounts and premiums are accreted/amortized for both tax and financial reporting purposes for the Fund, with the exception of securities in default of principal.
B. Derivative Instruments
Futures Contracts. A futures contract is an agreement between a buyer or seller and an established futures exchange or its clearinghouse in which the buyer or seller agrees to take or make a delivery of a specific
| 16 | | | Deutsche DWS Variable Series II — DWS Multisector Income VIP |
Table of Contents
amount of a financial instrument at a specified price on a specific date (settlement date). For the six months ended June 30, 2019, the Fund entered into interest rate futures to gain exposure to different parts of the yield curve while managing overall duration and fornon-hedging purposes to seek to enhance potential gains.
Upon entering into a futures contract, the Fund is required to deposit with a financial intermediary cash or securities (“initial margin”) in an amount equal to a certain percentage of the face value indicated in the futures contract. Subsequent payments (“variation margin”) are made or received by the Fund dependent upon the daily fluctuations in the value and are recorded for financial reporting purposes as unrealized gains or losses by the Fund. Gains or losses are realized when the contract expires or is closed. Since all futures contracts areexchange-traded, counterparty risk is minimized as the exchange’s clearinghouse acts as the counterparty, and guarantees the futures against default.
Certain risks may arise upon entering into futures contracts, including the risk that an illiquid market will limit the Fund’s ability to close out a futures contract prior to the settlement date and the risk that the futures contract is not well correlated with the security, index or currency to which it relates. Risk of loss may exceed amounts disclosed in the Statement of Assets and Liabilities.
A summary of the open futures contracts as of June 30, 2019 is included in a table following the Fund’s Investment Portfolio. For the six months ended June 30, 2019, the investment in futures contracts purchased had a total notional value generally indicative of a range from approximately $2,182,000 to $3,769,000, and the investment in futures contracts sold had a total notional value generally indicative of a range from $0 to approximately $1,301,000.
Forward Foreign Currency Contracts. A forward foreign currency contract (“forward currency contract”) is a commitment to purchase or sell a foreign currency at the settlement date at a negotiated rate. For the six months ended June 30, 2019, the Fund entered into forward currency contracts in order to hedge against anticipated currency market changes and fornon-hedging purposes to seek to enhance potential gains.
Forward currency contracts are valued at the prevailing forward exchange rate of the underlying currencies and unrealized gain (loss) is recorded daily. On the settlement date of the forward currency contract, the Fund records a realized gain or loss equal to the difference between the value of the contract at the time it was opened and the value of the contract at the time it was closed. Certain risks may arise upon entering into forward currency contracts from the potential inability of counterparties to meet the terms of their contracts. The maximum counterparty credit risk to the Fund is measured by the unrealized gain on appreciated contracts. Additionally, when utilizing forward currency contracts to hedge, the Fund gives up the opportunity to profit from favorable exchange rate movements during the term of the contract.
A summary of the open forward currency contracts as of June 30, 2019, is included in a table following the Fund’s Investment Portfolio. For the six months ended June 30, 2019, the investment in forward currency contracts short vs. U.S. dollars had a total contract value generally indicative of a range from approximately $380,000 to $785,000, and the investment in forward currency contracts long vs. U.S. dollars had a total contract value generally indicative of a range from approximately $87,000 to $212,000. The investment in forward currency contracts long vs. other foreign currencies sold had a total contract value generally indicative of a range from $0 to approximately $342,000.
The following tables summarize the value of the Fund’s derivative instruments held as of June 30, 2019 and the related location in the accompanying Statement of Assets and Liabilities, presented by primary underlying risk exposure:
| Asset Derivatives | Forward Contracts | Futures Contracts | Total | |||||||||
| Interest Rate Contracts (a) | $ | — | $ | 36,365 | $ | 36,365 | ||||||
| Foreign Exchange Contracts (b) | 5,238 | — | 5,238 | |||||||||
| $ | 5,238 | $ | 36,365 | $ | 41,603 | |||||||
Each of the above derivatives is located in the following Statement of Assets and Liabilities accounts:
| (a) | Includes cumulative appreciation of futures contracts as disclosed in the Investment Portfolio. Unsettled variation margin is disclosed separately within the statement of Assets and Liabilities. |
| (b) | Unrealized appreciation on forward foreign currency contracts |
Deutsche DWS Variable Series II — DWS Multisector Income VIP | | | 17 |
Table of Contents
| Liability Derivatives | Forward Contracts | Total | ||||||
| Foreign Exchange Contracts (c) | $ | (9,092 | ) | $ | (9,092 | ) | ||
| $ | (9,092 | ) | $ | (9,092 | ) | |||
The above derivative is located in the following Statement of Assets and Liabilities accounts:
| (c) | Unrealized depreciation on forward foreign currency contracts |
Additionally, the amount of unrealized and realized gains and losses on derivative instruments recognized in Fund earnings during the six months ended June 30, 2019 and the related location in the accompanying Statement of Operations is summarized in the following tables by primary underlying risk exposure:
| Realized Gain (Loss) | Forward Contracts | Futures Contracts | Total | |||||||||
| Interest Rate Contracts (d) | $ | — | $ | 105,087 | $ | 105,087 | ||||||
| Foreign Exchange Contracts (e) | (144 | ) | — | (144 | ) | |||||||
| $ | (144 | ) | $ | 105,087 | $ | 104,943 | ||||||
Each of the above derivatives is located in the following Statement of Operations accounts:
| (d) | Net realized gain (loss) from futures contracts |
| (e) | Net realized gain (loss) from forward foreign currency contracts |
| Change in Net Unrealized Appreciation (Depreciation) | Forward Contracts | Futures Contracts | Total | |||||||||
| Interest Rate Contracts (f) | $ | — | $ | (3,879 | ) | $ | (3,879 | ) | ||||
| Foreign Exchange Contracts (g) | (13,628 | ) | — | (13,628 | ) | |||||||
| $ | (13,628 | ) | $ | (3,879 | ) | $ | (17,507 | ) | ||||
Each of the above derivatives is located in the following Statement of Operations accounts:
| (f) | Change in net unrealized appreciation (depreciation) on futures |
| (g) | Change in net unrealized appreciation (depreciation) on forward foreign currency contracts |
As of June 30, 2019, the Fund has transactions subject to enforceable master netting agreements which govern the terms of certain transactions, and reduce the counterparty risk associated with such transactions. Master netting agreements allow a Fund to close out and net total exposure to a counterparty in the event of a deterioration in the credit quality or contractual default with respect to all of the transactions with a counterparty. As defined by the master netting agreement, the Fund may have collateral agreements with certain counterparties to mitigate risk. For financial reporting purposes the Statement of Assets and Liabilities generally shows derivatives assets and liabilities on a gross basis, which reflects the full risks and exposures prior to netting. A reconciliation of the gross amounts on the Statement of Assets and Liabilities to the net amounts by a counterparty, including any collateral exposure, is included in the following tables:
| Counterparty | Gross Amounts of Assets Presented in the Statement of Assets and Liabilities | Financial Instruments and Derivatives Available for Offset | Collateral Received | Net Amount of Derivative Assets | ||||||||||||
JPMorgan Chase Securities, Inc. | $ | 335 | $ | — | $ | — | $ | 335 | ||||||||
National Australia Bank Ltd. | 799 | (799 | ) | — | — | |||||||||||
| State Street Bank and Trust | 4,104 | (1,209 | ) | — | 2,895 | |||||||||||
| $ | 5,238 | $ | (2,008 | ) | $ | — | $ | 3,230 | ||||||||
| Counterparty | Gross Amounts of Liabilities Presented in the Statement of Assets and Liabilities | Financial Instruments and Derivatives Available for Offset | Collateral Pledged | Net Amount of Derivative Liabilities | ||||||||||||
| Bank of America | $ | 4,706 | $ | — | $ | — | $ | 4,706 | ||||||||
| Credit Agricole | 949 | — | — | 949 | ||||||||||||
| National Australia Bank Ltd. | 2,228 | (799 | ) | — | 1,429 | |||||||||||
| State Street Bank and Trust | 1,209 | (1,209 | ) | — | — | |||||||||||
| $ | 9,092 | $ | (2,008 | ) | $ | — | $ | 7,084 | ||||||||
| 18 | | | Deutsche DWS Variable Series II — DWS Multisector Income VIP |
Table of Contents
C. Purchases and Sales of Securities
During the six months ended June 30, 2019, purchases and sales of investment securities, excluding short-term investments, were as follows:
| Purchases | Sales | |||||||
| Non-U.S. Treasury Obligations | $ | 5,332,606 | $ | 5,454,907 | ||||
| U.S. Treasury Obligations | $ | 3,965,434 | $ | 3,267,834 | ||||
D. Related Parties
Management Agreement. Under the Investment Management Agreement with DWS Investment Management Americas, Inc. (“DIMA” or the “Advisor”), an indirect, wholly owned subsidiary of DWS Group GmbH & Co. KGaA (“DWS Group”), the Advisor directs the investments of the Fund in accordance with its investment objectives, policies and restrictions. The Advisor determines the securities, instruments and other contracts relating to investments to be purchased, sold or entered into by the Fund or delegates such responsibility to the Fund’s subadvisor.
Effective May 16, 2019, DWS Alternatives Global Limited, also an indirect, wholly owned subsidiary of DWS Group, no longer serves as subadvisor for the Fund. DWS Alternatives Global Limited provided portfolio manager services to the Fund and pursuant to a sub-advisory agreement between DIMA and DWS Alternatives Global Limited, DIMA, not the Fund, compensated DWS Alternatives Global Limited for the services it provided to the Fund.
Pursuant to the Investment Management Agreement with the Advisor, the Fund pays a monthly management fee based on the Fund’s average daily net assets, computed and accrued daily and payable monthly, at the following annual rates:
| First $250 million | .550 | % | ||
| Next $750 million | .520 | % | ||
| Next $1.5 billion | .500 | % | ||
| Next $2.5 billion | .480 | % | ||
| Next $2.5 billion | .450 | % | ||
| Next $2.5 billion | .430 | % | ||
| Next $2.5 billion | .410 | % | ||
| Over $12.5 billion | .390 | % |
Accordingly, for the six months ended June 30, 2019, the fee pursuant to the Investment Management Agreement was equivalent to an annualized rate (exclusive of any applicable waivers/reimbursements) of 0.55% of the Fund’s average daily net assets.
For the period from January 1, 2019 through April 30, 2019, the Advisor had contractually agreed to waive its fee and/or reimburse certain operating expenses to the extent necessary to maintain the total annual operating expenses (excluding certain expenses such as extraordinary expenses, taxes, brokerage and interest expense) at 0.65%.
Effective May 1, 2019 through April 30, 2020, the Advisor has contractually agreed to waive its fee and/or reimburse certain operating expenses to the extent necessary to maintain the total annual operating expenses (excluding certain expenses such as extraordinary expenses, taxes, brokerage and interest expense) at 0.66%.
For the six months ended June 30, 2019, fees waived and/or expenses reimbursed amounted to $75,322.
Administration Fee. Pursuant to an Administrative Services Agreement, DIMA provides most administrative services to the Fund. For all services provided under the Administrative Services Agreement, the Fund pays DIMA an annual fee (“Administration Fee”) of 0.10% of the Fund’s average daily net assets, computed and accrued daily and payable monthly. For the six months ended June 30, 2019, the Administration Fee was $4,200, of which $727 is unpaid.
Service Provider Fees. DWS Service Company (“DSC”), an affiliate of the Advisor, is the transfer agent,dividend-paying agent and shareholder service agent for the Fund. Pursuant to asub-transfer agency agreement between DSC and DST Systems, Inc. (“DST”), DSC has delegated certain transfer agent,dividend-paying agent and shareholder service agent functions to DST. DSC compensates DST out of the
Deutsche DWS Variable Series II — DWS Multisector Income VIP | | | 19 |
Table of Contents
shareholder servicing fee it receives from the Fund. For the six months ended June 30, 2019, the amounts charged to the Fund by DSC aggregated $56, of which $19 is unpaid.
Typesetting and Filing Service Fees. Under an agreement with the Fund, DIMA is compensated for providing typesetting and certain regulatory filing services to the Fund. For the six months ended June 30, 2019, the amount charged to the Fund by DIMA included in the Statement of Operations under “Reports to shareholders” aggregated $5,945, all of which is unpaid.
Trustees’ Fees and Expenses. The Fund paid retainer fees to each Trustee not affiliated with the Advisor, plus specified amounts to the Board Chairperson and to each committee Chairperson.
Affiliated Cash Management Vehicles. The Fund may invest uninvested cash balances in DWS Central Cash Management Government Fund and DWS ESG Liquidity Fund, affiliated money market funds which are managed by the Advisor. Each affiliated money market fund is managed in accordance withRule 2a-7 under the 1940 Act, which governs the quality, maturity, diversity and liquidity of instruments in which a money market fund may invest. DWS Central Cash Management Government Fund seeks to maintain a stable net asset value, and DWS ESG Liquidity Fund maintains a floating net asset value. The Fund indirectly bears its proportionate share of the expenses of each affiliated money market fund in which it invests. DWS Central Cash Management Government Fund does not pay the Advisor an investment management fee. To the extent that DWS ESG Liquidity Fund pays an investment management fee to the Advisor, the Advisor will waive an amount of the investment management fee payable to the Advisor by the Fund equal to the amount of the investment management fee payable on the Fund’s assets invested in DWS ESG Liquidity Fund.
Security Lending Fees. Deutsche Bank AG serves as securities lending agent for the Fund. For the six months ended June 30, 2019, the Fund incurred securities lending agent fees to Deutsche Bank AG in the amount of $174.
E. Line of Credit
The Fund and other affiliated funds (the “Participants”) share in a $400 million revolving credit facility provided by a syndication of banks. The Fund may borrow for temporary or emergency purposes, including the meeting of redemption requests that otherwise might require the untimely disposition of securities. The Participants are charged an annual commitment fee which is allocated based on net assets, among each of the Participants. Interest is calculated at a rate per annum equal to the sum of the Federal Funds Rate plus 1.25 percent plus if theone-month LIBOR exceeds the Federal Funds Rate, the amount of such excess. The Fund may borrow up to a maximum of 33 percent of its net assets under the agreement. The Fund had no outstanding loans at June 30, 2019.
F. Investing inHigh-Yield Securities
High-yield debt securities or junk bonds are generally regarded as speculative with respect to the issuer’s continuing ability to meet principal and interest payments. The Fund’s performance could be hurt if an issuer of a debt security suffers an adverse change in financial condition that results in the issuer not making timely payments of interest or principal, a security downgrade or an inability to meet a financial obligation.High-yield debt securities’ total return and yield may generally be expected to fluctuate more than the total return and yield ofinvestment-grade debt securities. A real or perceived economic downturn or an increase in market interest rates could cause a decline in the value ofhigh-yield debt securities, result in increased redemptions and/or result in increased portfolio turnover, which could result in a decline in net asset value of the Fund, reduce liquidity for certain investments and/or increase costs.High-yield debt securities are often thinly traded and can be more difficult to sell and value accurately thaninvestment-grade debt securities as there may be no established secondary market. Investments in high yield debt securities could increase liquidity risk for the Fund. In addition, the market forhigh-yield debt securities can experience sudden and sharp volatility which is generally associated more with investments in stocks.
G. Investing in Emerging Markets
Investing in emerging markets may involve special risks and considerations not typically associated with investing in developed markets. These risks include revaluation of currencies, high rates of inflation or deflation, repatriation restrictions on income and capital, and future adverse political, social and economic developments. Moreover, securities issued in these markets may be less liquid, subject to government
| 20 | | | Deutsche DWS Variable Series II — DWS Multisector Income VIP |
Table of Contents
ownership controls or delayed settlements, and may have prices that are more volatile or less easily assessed than those of comparable securities of issuers in developed markets.
H. Ownership of the Fund
At June 30, 2019, one participating insurance company was the owner of record of 10% or more of the total outstanding Class A shares of the Fund, owning 97%.
Deutsche DWS Variable Series II — DWS Multisector Income VIP | | | 21 |
Table of Contents
| Information About Your Fund’s Expenses | (Unaudited) |
As an investor of the Fund, you incur two types of costs: ongoing expenses and transaction costs. Ongoing expenses include management fees and other Fund expenses. Examples of transaction costs include contract charges, which are not shown in this section. The following tables are intended to help you understand your ongoing expenses (in dollars) of investing in the Fund and to help you compare these expenses with the ongoing expenses of investing in other mutual funds. In the most recentsix-month period, the Fund limited these expenses; had it not done so, expenses would have been higher. The example in the table is based on an investment of $1,000 invested at the beginning of thesix-month period and held for the entire period (January 1, 2019 to June 30, 2019).
The tables illustrate your Fund’s expenses in two ways:
| – | Actual Fund Return. This helps you estimate the actual dollar amount of ongoing expenses (but not transaction costs) paid on a $1,000 investment in the Fund using the Fund’s actual return during the period. To estimate the expenses you paid over the period, simply divide your account value by $1,000 (for example, an $8,600 account value divided by $1,000 = 8.6), then multiply the result by the number in the “Expenses Paid per $1,000” line under the share class you hold. |
| – | Hypothetical 5% Fund Return. This helps you to compare your Fund’s ongoing expenses (but not transaction costs) with those of other mutual funds using the Fund’s actual expense ratio and a hypothetical rate of return of 5% per year before expenses. Examples using a 5% hypothetical Fund return may be found in the shareholder reports of other mutual funds. The hypothetical account values and expenses may not be used to estimate the actual ending account balance or expenses you paid for the period. |
Please note that the expenses shown in these tables are meant to highlight your ongoing expenses only and do not reflect any transaction costs. The “Expenses Paid per $1,000” line of the tables is useful in comparing ongoing expenses only and will not help you determine the relative total expense of owning different funds. If these transaction costs had been included, your costs would have been higher.
| Expenses and Value of a $1,000 Investmentfor the six months ended June 30, 2019 | ||||
| Actual Fund Return | Class A | |||
| Beginning Account Value 1/1/19 | $ | 1,000.00 | ||
| Ending Account Value 6/30/19 | $ | 1,071.00 | ||
| Expenses Paid per $1,000* | $ | 3.34 | ||
| Hypothetical 5% Fund Return | Class A | |||
| Beginning Account Value 1/1/19 | $ | 1,000.00 | ||
| Ending Account Value 6/30/19 | $ | 1,021.57 | ||
| Expenses Paid per $1,000* | $ | 3.26 | ||
| * | Expenses are equal to the Fund’s annualized expense ratio, multiplied by the average account value over the period, multiplied by 181 (the number of days in the most recentsix-month period), then divided by 365. |
| Annualized Expense Ratio | Class A | |||
| Deutsche DWS Variable Series II — DWS Multisector Income VIP | .65 | % | ||
For more information, please refer to the Fund’s prospectus.
These tables do not reflect charges and fees (“contract charges”) associated with the separate account that invests in the Fund or any variable life insurance policy or variable annuity contract for which the Fund is an investment option.
For an analysis of the fees associated with an investment in the Fund or similar funds, please refer to the current and hypothetical expense calculators for Variable Insurance Products which can be found at dws.com/calculators.
| 22 | | | Deutsche DWS Variable Series II — DWS Multisector Income VIP |
Table of Contents
The Trust’s policies and procedures for voting proxies for portfolio securities and information about how the Trust voted proxies related to its portfolio securities during the most recent12-month period ended June 30 are available on our Web site — dws.com/en-us/resources/proxy-voting — or on the SEC’s Web site — sec.gov. To obtain a written copy of the Trust’s policies and procedures without charge, upon request, call us toll free at (800)728-3337.
Deutsche DWS Variable Series II — DWS Multisector Income VIP | | | 23 |
Table of Contents
Advisory Agreement Board Considerations and Fee Evaluation
The Board of Trustees (hereinafter referred to as the “Board” or “Trustees”) approved the renewal of DWS Multisector Income VIP’s (the “Fund”) investment management agreement (the “Agreement”) with DWS Investment Management Americas, Inc. (“DIMA”) andsub-advisory agreement (the“Sub-Advisory Agreement” and together with the Agreement, the “Agreements”) between DIMA and Deutsche Alternative Asset Management (Global) Limited (now known as DWS Alternatives Global Limited) (“DAAM Global”), an affiliate of DIMA, in September 2018 (effective May 16, 2019, DAAM Global no longer serves as sub-advisor to the Fund).
In terms of the process that the Board followed prior to approving the Agreements, shareholders should know that:
| – | During the entire process, all of the Fund’s Trustees were independent of DIMA and its affiliates (the “Independent Trustees”). |
| – | The Board met frequently during the past year to discuss fund matters and dedicated a substantial amount of time to contract review matters. Over the course of several months, the Board’s Contract Committee reviewed extensive materials received from DIMA, independent third parties and independent counsel. These materials included an analysis of the Fund’s performance, fees and expenses, and profitability from a fee consultant retained by the Fund’s Independent Trustees (the “Fee Consultant”). Based on its evaluation of the information provided, the Contract Committee presented its findings and recommendations to the Board. The Board then reviewed the Contract Committee’s findings and recommendations. |
| – | The Board also received extensive information throughout the year regarding performance of the Fund. |
| – | The Independent Trustees regularly met privately with counsel to discuss contract review and other matters. In addition, the Independent Trustees were advised by the Fee Consultant in the course of their review of the Fund’s contractual arrangements and considered a comprehensive report prepared by the Fee Consultant in connection with their deliberations. |
| – | In connection with reviewing the Agreements, the Board also reviewed the terms of the Fund’s distribution agreement, administrative services agreement, transfer agency agreement and other material service agreements. |
In connection with the contract review process, the Contract Committee and the Board considered the factors discussed below, among others. The Board also considered that DIMA and its predecessors have managed the Fund since its inception, and the Board believes that a long-term relationship with a capable, conscientious advisor is in the best interests of the Fund. The Board considered, generally, that shareholders chose to invest or remain invested in the Fund knowing that DIMA managed the Fund. DIMA and DAAM Global are part of DWS Group GmbH & Co. KGaA (“DWS Group”). DWS Group is a global asset management business that offers a wide range of investing expertise and resources, including research capabilities in many countries throughout the world. In 2018, approximately 20% of DWS Group’s shares were sold in an initial public offering, with Deutsche Bank AG owning the remaining shares.
As part of the contract review process, the Board carefully considered the fees and expenses of each DWS fund overseen by the Board in light of the fund’s performance. In many cases, this led to the negotiation and implementation of expense caps. As part of these negotiations, the Board indicated that it would consider relaxing these caps in future years following sustained improvements in performance, among other considerations.
While shareholders may focus primarily on fund performance and fees, the Fund’s Board considers these and many other factors, including the quality and integrity of DIMA’s and DAAM Global’s personnel and administrative support services provided by DIMA, such as back-office operations, fund valuations, and compliance policies and procedures.
Nature, Quality and Extent of Services.The Board considered the terms of the Agreements, including the scope of advisory services provided under the Agreements. The Board noted that, under the Agreements, DIMA and DAAM Global provide portfolio management services to the Fund and that, pursuant to a separate administrative services agreement, DIMA provides administrative services to the Fund. The Board considered the experience and skills of senior management and investment personnel and the resources made available to such personnel. Throughout the course of the year, the Board also received information regarding DIMA’s oversight of fundsub-advisers, including DAAM Global. The Board reviewed the Fund’s performance over short-term and long-term periods and compared those returns to various agreed-upon
| 24 | | | Deutsche DWS Variable Series II — DWS Multisector Income VIP |
Table of Contents
performance measures, including market index(es) and a peer universe compiled using information supplied by Morningstar Direct (“Morningstar”), an independent fund data service. The Board also noted that it has put into place a process of identifying “Funds in Review” (e.g., funds performing poorly relative to a peer universe), and receives additional reporting from DIMA regarding such funds and, where appropriate, DIMA’s plans to address underperformance. The Board believes this process is an effective manner of identifying and addressing underperforming funds. Based on the information provided, the Board noted that, for theone-, three- and five-year periods ended December 31, 2017, the Fund’s performance (Class A shares) was in the 1st quartile, 4th quartile and 4th quartile, respectively, of the applicable Morningstar universe (the 1st quartile being the best performers and the 4th quartile being the worst performers). The Board also observed that the Fund has outperformed its benchmark in theone-year period and has underperformed its benchmark in the three- and five-year periods ended December 31, 2017. The Board noted the disappointing investment performance of the Fund in some past periods and continued to discuss with senior management of DIMA and DAAM Global the factors contributing to such underperformance and actions being taken to improve performance. The Board noted certain changes in the Fund’s portfolio management team that were made effective August 1, 2017. The Board observed that the Fund had experienced improved relative performance in 2017. The Board recognized the efforts by DIMA in recent years to enhance its investment platform and improve long-term performance across the DWS fund complex.
Fees and Expenses. The Board considered the Fund’s investment management fee schedule,sub-advisory fee schedule, operating expenses and total expense ratios, and comparative information provided by Broadridge Financial Solutions, Inc. (“Broadridge”) and the Fee Consultant regarding investment management fee rates paid to other investment advisors by similar funds (1st quartile being the most favorable and 4th quartile being the least favorable). With respect to management fees paid to other investment advisors by similar funds, the Board noted that the contractual fee rates paid by the Fund, which include a 0.10% fee paid to DIMA under the Fund’s administrative services agreement, were higher than the median (3rd quartile) of the applicable Broadridge peer group (based on Broadridge data provided as of December 31, 2017). With respect to thesub-advisory fee paid to DAAM Global, the Board noted that the fee is paid by DIMA out of its fee and not directly by the Fund. The Board noted that the Fund’s Class A shares total (net) operating expenses were expected to be lower than the median (2nd quartile) of the applicable Broadridge expense universe (based on Broadridge data provided as of December 31, 2017, and analyzing Broadridge expense universe Class A (net) expenses less any applicable12b-1 fees) (“Broadridge Universe Expenses”). The Board noted that the expense limitation agreed to by DIMA was expected to help the Fund’s total (net) operating expenses remain competitive. The Board considered the Fund’s management fee rate as compared to fees charged by DIMA to comparable DWS U.S. registered funds (“DWS Funds”) and considered differences between the Fund and the comparable DWS Funds. The information requested by the Board as part of its review of fees and expenses also included information about institutional accounts (including anysub-advised funds and accounts) and funds offered primarily to European investors (“DWS Europe Funds”) managed by DWS Group. The Board noted that DIMA indicated that DWS Group does not manage any institutional accounts or DWS Europe Funds comparable to the Fund.
On the basis of the information provided, the Board concluded that management fees were reasonable and appropriate in light of the nature, quality and extent of services provided by DIMA and DAAM Global.
Profitability. The Board reviewed detailed information regarding revenues received by DIMA under the Agreement. The Board considered the estimated costs to DIMA, andpre-tax profits realized by DIMA, from advising the DWS Funds, as well as estimates of thepre-tax profits attributable to managing the Fund in particular. The Board also received information regarding the estimated enterprise-wide profitability of DIMA and its affiliates with respect to all fund services in totality and by fund. The Board and the Fee Consultant reviewed DIMA’s methodology in allocating its costs to the management of the Fund. Based on the information provided, the Board concluded that thepre-tax profits realized by DIMA in connection with the management of the Fund were not unreasonable. The Board also reviewed certain publicly available information regarding the profitability of certain similar investment management firms. The Board noted that, while information regarding the profitability of such firms is limited (and in some cases is not necessarily prepared on a comparable basis), DIMA and its affiliates’ overall profitability with respect to the DWS Funds (after taking into account distribution and other services provided to the funds by DIMA and its affiliates) was lower than the overall profitability levels of most comparable firms for which such data was available.
Economies of Scale. The Board considered whether there are economies of scale with respect to the management of the Fund and whether the Fund benefits from any economies of scale. The Board noted that the Fund’s investment management fee schedule includes fee breakpoints. The Board concluded that the
Deutsche DWS Variable Series II — DWS Multisector Income VIP | | | 25 |
Table of Contents
Fund’s fee schedule represents an appropriate sharing between the Fund and DIMA of such economies of scale as may exist in the management of the Fund at current asset levels.
Other Benefits to DIMA and Its Affiliates. The Board also considered the character and amount of other incidental or“fall-out” benefits received by DIMA and its affiliates, including any fees received by DIMA for administrative services provided to the Fund and any fees received by an affiliate of DIMA for transfer agency services provided to the Fund. The Board also considered benefits to DIMA related to brokerage and soft-dollar allocations, including allocating brokerage to pay for research generated by parties other than the executing broker dealers, which pertain primarily to funds investing in equity securities. In addition, the Board considered the incidental public relations benefits to DIMA related to DWS Funds advertising and cross-selling opportunities among DIMA products and services. The Board considered these benefits in reaching its conclusion that the Fund’s management fees were reasonable.
Compliance. The Board considered the significant attention and resources dedicated by DIMA to its compliance processes in recent years. The Board noted in particular (i) the experience, seniority and time commitment of the individuals serving as DIMA’s and the Fund’s chief compliance officers and (ii) the substantial commitment of resources by DIMA and its affiliates to compliance matters, including the retention of compliance personnel.
Based on all of the information considered and the conclusions reached, the Board unanimously determined that the continuation of the Agreements is in the best interests of the Fund. In making this determination, the Board did not give particular weight to any single factor identified above. The Board considered these factors over the course of numerous meetings, certain of which were in executive session with only the Independent Trustees and counsel present. It is possible that individual Independent Trustees may have weighed these factors differently in reaching their individual decisions to approve the continuation of the Agreements.
| 26 | | | Deutsche DWS Variable Series II — DWS Multisector Income VIP |
Table of Contents
Notes
Table of Contents
| ||
VS2MSI-3 (R-028389-8 8/19) |
Table of Contents
June 30, 2019
Semiannual Report
Deutsche DWS Variable Series II
DWS Small Mid Cap Growth VIP
Beginning on January 1, 2021, as permitted by regulations adopted by the Securities and Exchange Commission, you may not be receiving paper copies of the Fund’s shareholder reports from the insurance company that offers your contract unless you specifically request paper copies from your insurance company or from your financial intermediary. Instead, the shareholder reports will be made available on a Web site, and your insurance company will notify you by mail each time a report is posted and provide you with a Web site link to access the report. Instructions for requesting paper copies will be provided by your insurance company.
If you already elected to receive shareholder reports electronically, you will not be affected by this change and you need not take any action. You may elect to receive shareholder reports and other communications from your insurance company electronically by following the instructions provided by your insurance company.
You may elect to receive all future reports in paper free of charge from your insurance company. If your insurance company informs you that future reports will be delivered via Web access, you can inform your insurance company that you wish to continue receiving paper copies of your shareholder reports by following the instructions provided by your insurance company.

Table of Contents
This report must be preceded or accompanied by a prospectus. To obtain an additional prospectus or summary prospectus, if available, call (800)728-3337 or your financial representative. We advise you to consider the Fund’s objectives, risks, charges and expenses carefully before investing. The summary prospectus and prospectus contain this and other important information about the Fund. Please read the prospectus carefully before you invest.
Stocks may decline in value. Smaller and medium company stocks tend to be more volatile than large company stocks. Investing in derivatives entails special risks relating to liquidity, leverage and credit that may reduce returns and/or increase volatility. The Fund may lend securities to approved institutions. Please read the prospectus for details.
The brand DWS represents DWS Group GmbH & Co. KGaA and any of its subsidiaries such as DWS Distributors, Inc. which offers investment products or DWS Investment Management Americas, Inc. and RREEF America L.L.C. which offer advisory services.
DWS Distributors, Inc., 222 South Riverside Plaza, Chicago, IL 60606, (800)621-1148
NOT FDIC/NCUA INSURED NO BANK GUARANTEE MAY LOSE VALUE NOT A DEPOSIT
NOT INSURED BY ANY FEDERAL GOVERNMENT AGENCY
| 2 | | | Deutsche DWS Variable Series II — DWS Small Mid Cap Growth VIP |
Table of Contents
| Performance Summary | June 30, 2019 (Unaudited) |
Fund performance shown is historical, assumes reinvestment of all dividend and capital gain distributions and does not guarantee future results. Investment return and principal value fluctuate with changing market conditions so that, when redeemed, shares may be worth more or less than their original cost. Current performance may be lower or higher than the performance data quoted. Please contact your participating insurance company for the Fund’s most recentmonth-end performance. Performance does not reflect charges and fees (“contract charges”) associated with the separate account that invests in the Fund or any variable life insurance policy or variable annuity contract for which the Fund is an investment option. These charges and fees will reduce returns.
The gross expense ratio of the Fund, as stated in the fee table of the prospectus dated May 1, 2019 is 0.81% for Class A shares and may differ from the expense ratio disclosed in the Financial Highlights table in this report.
Generally accepted accounting principles require adjustments to be made to the net assets of the Fund at period end for financial reporting purposes only, and as such, the total return based on the unadjusted net asset value per share may differ from the total return reported in the financial highlights.
Growth of an Assumed $10,000 Investment in DWS Small Mid Cap Growth VIP
| The Russell 2500TM Growth Index is an unmanaged index that measures the performance of the small- to mid-cap growth segment of the U.S. equity universe. It includes those Russell 2500 companies with higher price-to-book ratios and higher forecasted growth values.
Index returns do not reflect any fees or expenses and it is not possible to invest directly into an index. |
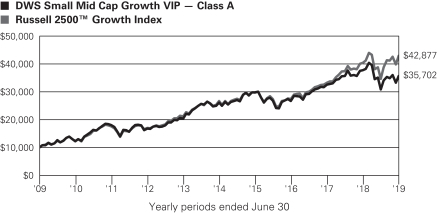
| Comparative Results | ||||||||||||
| DWS Small Mid Cap Growth VIP | 6-Month‡ | 1-Year | 3-Year | 5-Year | 10-Year | |||||||
| Class A | Growth of $10,000 | 11,569 | 9,446 | 13,357 | 13,701 | 35,702 | ||||||
| Average annual total return | 15.69% | -5.54% | 10.13% | 6.50% | 13.57% | |||||||
| Russell 2500 Growth Index | Growth of $10,000 | 12,392 | 10,613 | 15,664 | 16,093 | 42,877 | ||||||
| Average annual total return | 23.92% | 6.13% | 16.14% | 9.98% | 15.67% | |||||||
The growth of $10,000 is cumulative.
| ‡ | Total returns shown for periods less than one year are not annualized. |
Deutsche DWS Variable Series II — DWS Small Mid Cap Growth VIP | | | 3 |
Table of Contents
| Portfolio Summary | (Unaudited) |
| Asset Allocation (As a % of Investment Portfolio excluding Securities Lending Collateral) | 6/30/19 | 12/31/18 | ||||||
| Common Stocks | 98% | 93% | ||||||
| Cash Equivalents | 1% | 6% | ||||||
| Convertible Preferred Stock | 1% | 1% | ||||||
| 100% | 100% | |||||||
| Sector Diversification (As a % of Investment Portfolio excluding Cash Equivalents and Securities Lending Collateral) | 6/30/19 | 12/31/18 | ||||||
Health Care | 24% | 25% | ||||||
Information Technology | 24% | 22% | ||||||
Industrials | 19% | 18% | ||||||
Consumer Discretionary | 15% | 16% | ||||||
Financials | 6% | 7% | ||||||
Materials | 4% | 4% | ||||||
Real Estate | 3% | 3% | ||||||
Energy | 2% | 2% | ||||||
Consumer Staples | 2% | 2% | ||||||
Communication Services | 1% | 1% | ||||||
| 100% | 100% | |||||||
Portfolio holdings and characteristics are subject to change.
For more complete details about the Fund’s investment portfolio, see page 5.
Following the Fund’s fiscal first and thirdquarter-end, a complete portfolio holdings listing is filed with the SEC on FormN-Q or Form N-PORT (available for filings after March 31, 2019). The Fund’s Form N-Q or Form N-PORT will be available on the SEC’s Web site at sec.gov. The Fund’s portfolio holdings are also posted on dws.com from time to time. Please read the Fund’s current prospectus for more information.
Peter Barsa, Director
Michael A. Sesser, CFA, Director
Portfolio Managers
| 4 | | | Deutsche DWS Variable Series II — DWS Small Mid Cap Growth VIP |
Table of Contents
| Investment Portfolio | as of June 30, 2019 (Unaudited) |
| Shares | Value ($) | |||||||
| Common Stocks 98.3% | ||||||||
| Communication Services 1.1% |
| |||||||
Entertainment |
| |||||||
Cinemark Holdings, Inc. | 13,014 | 469,805 | ||||||
Take-Two Interactive Software, Inc.* | 2,302 | 261,346 | ||||||
|
| |||||||
| 731,151 | ||||||||
| Consumer Discretionary 14.9% |
| |||||||
Auto Components 0.8% |
| |||||||
Gentherm, Inc.* | 7,798 | 326,191 | ||||||
Tenneco, Inc. “A” | 16,869 | 187,077 | ||||||
|
| |||||||
| 513,268 | ||||||||
Diversified Consumer Services 2.8% |
| |||||||
Bright Horizons Family Solutions, Inc.* | 8,528 | 1,286,620 | ||||||
ServiceMaster Global Holdings, Inc.* | 11,300 | 588,617 | ||||||
|
| |||||||
| 1,875,237 | ||||||||
Hotels, Restaurants & Leisure 1.7% |
| |||||||
Hilton Grand Vacations, Inc.* | 15,442 | 491,365 | ||||||
Jack in the Box, Inc. | 8,357 | 680,176 | ||||||
|
| |||||||
| 1,171,541 | ||||||||
Household Durables 4.0% |
| |||||||
Helen of Troy Ltd.* | 6,902 | 901,332 | ||||||
iRobot Corp.* (a) | 12,850 | 1,177,574 | ||||||
TopBuild Corp.* | 7,521 | 622,438 | ||||||
|
| |||||||
| 2,701,344 | ||||||||
Internet & Direct Marketing Retail 0.5% |
| |||||||
GrubHub, Inc.* (a) | 3,879 | 302,523 | ||||||
Leisure Products 0.8% |
| |||||||
YETI Holdings, Inc.* (a) | 17,273 | 500,053 | ||||||
Specialty Retail 3.4% |
| |||||||
Burlington Stores, Inc.* | 7,180 | 1,221,677 | ||||||
Camping World Holdings, Inc. “A” (a) | 30,031 | 372,985 | ||||||
The Children’s Place, Inc. (a) | 7,548 | 719,928 | ||||||
|
| |||||||
| 2,314,590 | ||||||||
Textiles, Apparel & Luxury Goods 0.9% |
| |||||||
Carter’s, Inc. | 6,302 | 614,697 | ||||||
| Consumer Staples 1.8% |
| |||||||
Food & Staples Retailing 1.2% |
| |||||||
Casey’s General Stores, Inc. | 5,389 | 840,630 | ||||||
Household Products 0.6% |
| |||||||
Spectrum Brands Holdings, Inc. | 7,393 | 397,522 | ||||||
| Energy 1.9% |
| |||||||
Energy Equipment & Services 1.2% |
| |||||||
Dril-Quip, Inc.* | 16,509 | 792,432 | ||||||
Oil, Gas & Consumable Fuels 0.7% |
| |||||||
California Resources Corp.* | 22,013 | 433,216 | ||||||
Contango Oil & Gas Co.* | 41,553 | 72,302 | ||||||
|
| |||||||
| 505,518 | ||||||||
| Shares | Value ($) | |||||||
| Financials 6.2% |
| |||||||
Banks 4.5% |
| |||||||
Eagle Bancorp., Inc. | 9,086 | 491,825 | ||||||
Pinnacle Financial Partners, Inc. | 7,734 | 444,551 | ||||||
South State Corp. | 8,497 | 625,974 | ||||||
SVB Financial Group* | 3,490 | 783,819 | ||||||
Synovus Financial Corp. | 18,737 | 655,795 | ||||||
|
| |||||||
| 3,001,964 | ||||||||
Capital Markets 1.2% |
| |||||||
Lazard Ltd. “A” | 14,525 | 499,515 | ||||||
Moelis & Co. “A” | 9,674 | 338,106 | ||||||
|
| |||||||
| 837,621 | ||||||||
Consumer Finance 0.5% |
| |||||||
Green Dot Corp. “A”* | 6,525 | 319,072 | ||||||
| Health Care 23.0% |
| |||||||
Biotechnology 8.2% |
| |||||||
Acceleron Pharma, Inc.* | 4,129 | 169,619 | ||||||
Alkermes PLC* | 11,391 | 256,753 | ||||||
Amicus Therapeutics, Inc.* | 18,313 | 228,546 | ||||||
Arena Pharmaceuticals, Inc.* | 7,580 | 444,415 | ||||||
Biohaven Pharmaceutical Holding Co., Ltd.* | 5,813 | 254,551 | ||||||
Bluebird Bio, Inc.* | 2,454 | 312,149 | ||||||
Blueprint Medicines Corp.* | 4,246 | 400,525 | ||||||
Emergent BioSolutions, Inc.* | 12,303 | 594,358 | ||||||
Genomic Health, Inc.* | 3,471 | 201,908 | ||||||
Heron Therapeutics, Inc.* | 24,057 | 447,220 | ||||||
Ligand Pharmaceuticals, Inc.* | 2,597 | 296,448 | ||||||
Neurocrine Biosciences, Inc.* | 10,796 | 911,506 | ||||||
Retrophin, Inc.* | 44,541 | 894,829 | ||||||
Tocagen, Inc.* | 10,717 | 71,590 | ||||||
|
| |||||||
| 5,484,417 | ||||||||
Health Care Equipment & Supplies 4.9% |
| |||||||
Cardiovascular Systems, Inc.* | 14,101 | 605,356 | ||||||
Globus Medical, Inc. “A”* | 6,531 | 276,261 | ||||||
iRhythm Technologies, Inc.* | 3,521 | 278,441 | ||||||
Masimo Corp.* | 5,350 | 796,187 | ||||||
Merit Medical Systems, Inc.* | 9,468 | 563,914 | ||||||
Natus Medical, Inc.* | 13,683 | 351,516 | ||||||
Tandem Diabetes Care, Inc.* | 6,409 | 413,509 | ||||||
|
| |||||||
| 3,285,184 | ||||||||
Health Care Providers & Services 7.0% |
| |||||||
AMN Healthcare Services, Inc.* | 16,063 | 871,418 | ||||||
BioScrip, Inc.* | 296,424 | 770,702 | ||||||
Molina Healthcare, Inc.* | 8,313 | 1,189,923 | ||||||
Providence Service Corp.* | 14,969 | 858,322 | ||||||
RadNet, Inc.* | 58,745 | 810,094 | ||||||
Tivity Health, Inc.* | 14,185 | 233,201 | ||||||
|
| |||||||
| 4,733,660 | ||||||||
Health Care Technology 1.1% |
| |||||||
HMS Holdings Corp.* | 22,425 | 726,346 | ||||||
Pharmaceuticals 1.8% |
| |||||||
ANI Pharmaceuticals, Inc.* | 7,455 | 612,801 | ||||||
Avadel Pharmaceuticals PLC (ADR)* (a) | 24,612 | 71,129 | ||||||
Pacira BioSciences, Inc.* | 12,502 | 543,712 | ||||||
|
| |||||||
| 1,227,642 | ||||||||
The accompanying notes are an integral part of the financial statements.
Deutsche DWS Variable Series II — DWS Small Mid Cap Growth VIP | | | 5 |
Table of Contents
| Shares | Value ($) | |||||||
| Industrials 18.8% |
| |||||||
Aerospace & Defense 1.5% |
| |||||||
HEICO Corp. | 7,424 | 993,405 | ||||||
Building Products 4.5% |
| |||||||
A.O. Smith Corp. | 14,715 | 693,959 | ||||||
Allegion PLC | 11,168 | 1,234,622 | ||||||
Fortune Brands Home & Security, Inc. | 12,443 | 710,869 | ||||||
Masonite International Corp.* | 7,100 | 374,028 | ||||||
|
| |||||||
| 3,013,478 | ||||||||
Commercial Services & Supplies 2.2% |
| |||||||
MSA Safety, Inc. | 3,811 | 401,641 | ||||||
The Brink’s Co. | 13,160 | 1,068,329 | ||||||
|
| |||||||
| 1,469,970 | ||||||||
Construction & Engineering 0.8% |
| |||||||
MasTec, Inc.* | 10,594 | 545,909 | ||||||
Electrical Equipment 1.6% |
| |||||||
Thermon Group Holdings, Inc.* | 41,624 | 1,067,656 | ||||||
Machinery 2.4% |
| |||||||
Chart Industries, Inc.* | 9,241 | 710,448 | ||||||
Hillenbrand, Inc. | 11,100 | 439,227 | ||||||
IDEX Corp. | 2,649 | 455,999 | ||||||
|
| |||||||
| 1,605,674 | ||||||||
Professional Services 1.5% |
| |||||||
Kforce, Inc. | 23,789 | 834,756 | ||||||
Mistras Group, Inc.* | 15,322 | 220,177 | ||||||
|
| |||||||
| 1,054,933 | ||||||||
Trading Companies & Distributors 4.3% |
| |||||||
H&E Equipment Services, Inc. | 28,818 | 838,316 | ||||||
Rush Enterprises, Inc. “A” | 35,301 | 1,289,192 | ||||||
Titan Machinery, Inc.* | 38,636 | 795,129 | ||||||
|
| |||||||
| 2,922,637 | ||||||||
| Information Technology 23.3% |
| |||||||
Communications Equipment 0.8% |
| |||||||
Lumentum Holdings, Inc.* | 10,532 | 562,514 | ||||||
Electronic Equipment, Instruments & Components 1.2% |
| |||||||
Anixter International, Inc.* | 1,446 | 86,341 | ||||||
Cognex Corp. | 8,337 | 400,009 | ||||||
IPG Photonics Corp.* | 1,994 | 307,574 | ||||||
|
| |||||||
| 793,924 | ||||||||
IT Services 5.0% |
| |||||||
Broadridge Financial Solutions, Inc. | 7,482 | 955,302 | ||||||
MAXIMUS, Inc. | 9,060 | 657,212 | ||||||
WEX, Inc.* | 4,517 | 939,988 | ||||||
WNS Holdings Ltd. (ADR)* | 13,885 | 821,992 | ||||||
|
| |||||||
| 3,374,494 | ||||||||
Semiconductors & Semiconductor Equipment 3.2% |
| |||||||
Advanced Energy Industries, Inc.* | 13,373 | 752,499 | ||||||
Advanced Micro Devices, Inc.* | 11,848 | 359,824 | ||||||
Cabot Microelectronics Corp. | 3,315 | 364,915 | ||||||
Cypress Semiconductor Corp. | 16,165 | 359,510 | ||||||
Entegris, Inc. | 8,714 | 325,206 | ||||||
|
| |||||||
| 2,161,954 | ||||||||
Software 13.1% |
| |||||||
2U, Inc.* (a) | 4,424 | 166,519 | ||||||
| Shares | Value ($) | |||||||
Aspen Technology, Inc.* | 10,978 | 1,364,346 | ||||||
Cision Ltd.* | 52,770 | 618,992 | ||||||
Cornerstone OnDemand, Inc.* | 10,573 | 612,494 | ||||||
Envestnet, Inc.* | 10,432 | 713,236 | ||||||
Five9, Inc.* | 19,805 | 1,015,798 | ||||||
New Relic, Inc.* | 3,459 | 299,238 | ||||||
Proofpoint, Inc.* | 7,418 | 892,015 | ||||||
QAD, Inc. “A” | 16,918 | 680,273 | ||||||
Tyler Technologies, Inc.* | 6,090 | 1,315,562 | ||||||
Varonis Systems, Inc.* | 17,800 | 1,102,532 | ||||||
|
| |||||||
| 8,781,005 | ||||||||
| Materials 4.3% |
| |||||||
Chemicals 0.8% |
| |||||||
Trinseo SA | 12,784 | 541,275 | ||||||
Construction Materials 1.4% |
| |||||||
Eagle Materials, Inc. | 10,034 | 930,152 | ||||||
Containers & Packaging 0.6% |
| |||||||
Berry Global Group, Inc.* | 8,183 | 430,344 | ||||||
Metals & Mining 1.5% |
| |||||||
Cleveland-Cliffs, Inc. (a) | 71,240 | 760,131 | ||||||
First Quantum Minerals Ltd. | 26,721 | 253,834 | ||||||
|
| |||||||
| 1,013,965 | ||||||||
| Real Estate 3.0% |
| |||||||
Equity Real Estate Investment Trusts (REITs) |
| |||||||
Americold Realty Trust | 13,210 | 428,268 | ||||||
Four Corners Property Trust, Inc. | 14,776 | 403,828 | ||||||
National Storage Affiliates Trust | 24,731 | 715,715 | ||||||
Urban Edge Properties | 27,384 | 474,565 | ||||||
|
| |||||||
| 2,022,376 | ||||||||
| Total Common Stocks(Cost $48,303,433) |
| 66,162,077 | ||||||
| Convertible Preferred Stocks 0.6% |
| |||||||
| Health Care |
| |||||||
Providence Service Corp., 5.5% (b) (Cost $283,300) | 2,833 | 407,333 | ||||||
| Securities Lending Collateral 3.9% |
| |||||||
DWS Government & Agency Securities Portfolio “DWS Government Cash Institutional Shares”, 2.28% (c) (d) | 2,644,025 | 2,644,025 | ||||||
| Cash Equivalents 1.2% | ||||||||
DWS Central Cash Management Government Fund, 2.40% (c) (Cost $834,095) | 834,095 | 834,095 | ||||||
| % of Net Assets | Value ($) | |||||||
Total Investment Portfolio | 104.0 | 70,047,530 | ||||||
| Other Assets and Liabilities, Net | (4.0 | ) | (2,710,091 | ) | ||||
| Net Assets | 100.0 | 67,337,439 | ||||||
The accompanying notes are an integral part of the financial statements.
| 6 | | | Deutsche DWS Variable Series II — DWS Small Mid Cap Growth VIP |
Table of Contents
A summary of the Fund’s transactions with affiliated investments during the period ended June 30, 2019 are as follows:
| Value ($) at 12/31/2018 | Purchases Cost ($) | Sales Proceeds ($) | Net Realized Gain/ (Loss) ($) | Net Change in Unrealized Appreciation (Depreciation) ($) | Income ($) | Capital Gain Distributions ($) | Number of Shares at 6/30/2019 | Value ($) at 6/30/2019 | ||||||||||||||||||||||||
Securities Lending Collateral 3.9% |
| |||||||||||||||||||||||||||||||
DWS Government & Agency Securities Portfolio “DWS Government Cash Institutional Shares”, 2.28% (c) (d) |
| |||||||||||||||||||||||||||||||
| 2,032,950 | 611,075 | (e) | — | — | — | 28,329 | — | 2,644,025 | 2,644,025 | |||||||||||||||||||||||
Cash Equivalents 1.2% |
| |||||||||||||||||||||||||||||||
DWS Central Cash Management Government Fund, 2.40% (c) |
| |||||||||||||||||||||||||||||||
| 3,874,651 | 4,369,961 | 7,410,517 | — | — | 46,819 | — | 834,095 | 834,095 | ||||||||||||||||||||||||
| 5,907,601 | 4,981,036 | 7,410,517 | — | — | 75,148 | — | 3,478,120 | 3,478,120 | ||||||||||||||||||||||||
| * | Non-income producing security. |
| (a) | All or a portion of these securities were on loan. In addition, “Other Assets and Liabilities, Net” may include pending sales that are also on loan. The value of securities loaned at June 30, 2019 amounted to $2,617,404, which is 3.9% of net assets. |
| (b) | Investment was valued using significant unobservable inputs. |
| (c) | Affiliated fund managed by DWS Investment Management Americas, Inc. The rate shown is the annualizedseven-day yield at period end. |
| (d) | Represents cash collateral held in connection with securities lending. Income earned by the Fund is net of borrower rebates. |
| (e) | Represents the net increase (purchase cost) or decrease (sales proceeds) in the amount invested in cash collateral for the period ended June 30, 2019. |
ADR: American Depositary Receipt
Fair Value Measurements
Various inputs are used in determining the value of the Fund’s investments. These inputs are summarized in three broad levels. Level 1 includes quoted prices in active markets for identical securities. Level 2 includes other significant observable inputs (including quoted prices for similar securities, interest rates, prepayment speeds and credit risk). Level 3 includes significant unobservable inputs (including the Fund’s own assumptions in determining the fair value of investments). The level assigned to the securities valuations may not be an indication of the risk or liquidity associated with investing in those securities.
The following is a summary of the inputs used as of June 30, 2019 in valuing the Fund’s investments. For information on the Fund’s policy regarding the valuation of investments, please refer to the Security Valuation section of Note A in the accompanying Notes to Financial Statements.
| Assets | Level 1 | Level 2 | Level 3 | Total | ||||||||||||
| Common Stocks (f) | $ | 66,162,077 | $ | — | $ | — | $ | 66,162,077 | ||||||||
| Convertible Preferred Stocks | — | — | 407,333 | 407,333 | ||||||||||||
| Short-Term Investments (f) | 3,478,120 | — | — | 3,478,120 | ||||||||||||
| Total | $ | 69,640,197 | $ | — | $ | 407,333 | $ | 70,047,530 | ||||||||
| (f) | See Investment Portfolio for additional detailed categorizations. |
The accompanying notes are an integral part of the financial statements.
Deutsche DWS Variable Series II — DWS Small Mid Cap Growth VIP | | | 7 |
Table of Contents
Statement of Assets and Liabilities
| as of June 30, 2019 (Unaudited) | ||||
| Assets | ||||
Investments in non-affiliated securities, at value (cost $48,586,733) — including $2,617,404 of securities loaned | $ | 66,569,410 | ||
Investment in DWS Government & Agency Securities Portfolio (cost $2,644,025)* | 2,644,025 | |||
Investment in DWS Central Cash Management Government Fund (cost $834,095) | 834,095 | |||
Cash | 10,065 | |||
Foreign currency, at value (cost $167) | 168 | |||
Dividends receivable | 20,833 | |||
Interest receivable | 6,388 | |||
Other assets | 818 | |||
Total assets | 70,085,802 | |||
| Liabilities | ||||
Payable upon return of securities loaned | 2,644,025 | |||
Payable for Fund shares redeemed | 20,193 | |||
Accrued management fee | 31,255 | |||
Accrued Trustees’ fees | 378 | |||
Other accrued expenses and payables | 52,512 | |||
Total liabilities | 2,748,363 | |||
Net assets, at value | $ | 67,337,439 | ||
| Net Assets Consist of | ||||
Distributable earnings (loss) | 18,445,052 | |||
Paid-in capital | 48,892,387 | |||
Net assets, at value | $ | 67,337,439 | ||
| Net Asset Value | ||||
Net Asset Value, offering and redemption price per share ($67,337,439 ÷ 5,215,591 outstanding shares of beneficial interest, no par value, unlimited number of shares authorized) | $ | 12.91 | ||
| * | Represents collateral on securities loaned. |
| for the six months ended June 30, 2019 |
| |||
| Investment Income | ||||
| Income: | ||||
| Dividends (net of foreign taxes withheld of $15) | $ | 278,164 | ||
| Income distributions — DWS Central Cash Management Government Fund | 46,819 | |||
| Securities lending income, net of borrower rebates | 28,329 | |||
| Total income | 353,312 | |||
| Expenses: | ||||
| Management fee | 193,000 | |||
| Administration fee | 35,091 | |||
| Services to Shareholders | 445 | |||
| Custodian fee | 1,603 | |||
| Professional fees | 36,865 | |||
| Reports to shareholders | 13,459 | |||
| Trustees’ fees and expenses | 2,922 | |||
| Other | 3,862 | |||
| Total expenses before expense reductions | 287,247 | |||
| Expense reductions | (3,010 | ) | ||
| Total expenses after expense reductions | 284,237 | |||
| Net investment income (loss) | 69,075 | |||
| Realized and Unrealized Gain (Loss) | ||||
| Net realized gain (loss) from investments | 760,672 | |||
| Change in net unrealized appreciation (depreciation) on: | ||||
| Investments | 9,165,450 | |||
| Foreign currency | 5 | |||
| 9,165,455 | ||||
| Net gain (loss) | 9,926,127 | |||
| Net increase (decrease) in net assets resulting from operations | $ | 9,995,202 | ||
The accompanying notes are an integral part of the financial statements.
| 8 | | | Deutsche DWS Variable Series II — DWS Small Mid Cap Growth VIP |
Table of Contents
Statements of Changes in Net Assets
| Increase (Decrease) in Net Assets | Six Months Ended June 30, 2019 (Unaudited) | Years Ended December 31, 2018 | ||||||
Operations: | ||||||||
Net investment income (loss) | $ | 69,075 | $ | (48,368 | ) | |||
Net realized gain (loss) | 760,672 | 8,989,403 | ||||||
Change in net unrealized appreciation (depreciation) | 9,165,455 | (19,054,040 | ) | |||||
Net increase (decrease) in net assets resulting from operations | 9,995,202 | (10,113,005 | ) | |||||
Distributions to shareholders: | ||||||||
Class A | (8,788,523 | ) | (25,334,744 | ) | ||||
Fund share transactions: | ||||||||
Class A | ||||||||
Proceeds from shares sold | 1,756,896 | 6,446,792 | ||||||
Reinvestment of distributions | 8,788,523 | 25,334,744 | ||||||
Payments for shares redeemed | (8,788,776 | ) | (9,303,196 | ) | ||||
Net increase (decrease) in net assets from Class A share transactions | 1,756,643 | 22,478,340 | ||||||
Increase (decrease) in net assets | 2,963,322 | (12,969,409 | ) | |||||
Net assets at beginning of period | 64,374,117 | 77,343,526 | ||||||
Net assets at end of period | 67,337,439 | $ | 64,374,117 | |||||
Other Information | ||||||||
Class A | ||||||||
Shares outstanding at beginning of period | 5,077,014 | 3,525,232 | ||||||
Shares sold | 131,433 | 381,309 | ||||||
Shares issued to shareholders in reinvestment of distributions | 680,753 | 1,711,807 | ||||||
Shares redeemed | (673,609 | ) | (541,334 | ) | ||||
Net increase (decrease) in Class A shares | 138,577 | 1,551,782 | ||||||
Shares outstanding at end of period | 5,215,591 | 5,077,014 | ||||||
The accompanying notes are an integral part of the financial statements.
Deutsche DWS Variable Series II — DWS Small Mid Cap Growth VIP | | | 9 |
Table of Contents
Six Months | Years Ended December 31, | |||||||||||||||||||||||
| Class A | (Unaudited) | 2018 | 2017 | 2016 | 2015 | 2014 | ||||||||||||||||||
| Selected Per Share Data | ||||||||||||||||||||||||
| Net asset value, beginning of period | $ | 12.68 | $ | 21.94 | $ | 18.96 | $ | 20.90 | $ | 22.83 | $ | 21.59 | ||||||||||||
| Income (loss) from investment operations: | ||||||||||||||||||||||||
Net investment income (loss)a | .01 | (.01 | ) | (.02 | ) | .02 | (.04 | ) | (.02 | ) | ||||||||||||||
Net realized and unrealized gain (loss) | 1.98 | (1.92 | ) | 4.08 | 1.64 | (.00 | ) | 1.26 | ||||||||||||||||
Total from investment operations | 1.99 | (1.93 | ) | 4.06 | 1.66 | (.04 | ) | 1.24 | ||||||||||||||||
| Less distributions from: | ||||||||||||||||||||||||
Net investment income | — | — | (.02 | ) | — | — | — | |||||||||||||||||
Net realized gains | (1.76 | ) | (7.33 | ) | (1.06 | ) | (3.60 | ) | (1.89 | ) | — | |||||||||||||
Total distributions | (1.76 | ) | (7.33 | ) | (1.08 | ) | (3.60 | ) | (1.89 | ) | — | |||||||||||||
| Net asset value, end of period | $ | 12.91 | $ | 12.68 | $ | 21.94 | $ | 18.96 | $ | 20.90 | $ | 22.83 | ||||||||||||
| Total Return (%) | 15.69 | b** | (13.59 | )b | 22.12 | 9.08 | (.90 | ) | 5.74 | |||||||||||||||
| Ratios to Average Net Assets and Supplemental Data | ||||||||||||||||||||||||
| Net assets, end of period ($ millions) | 67 | 64 | 77 | 118 | 135 | 172 | ||||||||||||||||||
| Ratio of expenses before expense reductions (%)c | .82 | * | .81 | .75 | .75 | .72 | .73 | |||||||||||||||||
| Ratio of expenses after expense reductions (%)c | .81 | * | .80 | .75 | .75 | .72 | .73 | |||||||||||||||||
| Ratio of net investment income (loss) (%) | .20 | * | (.06 | ) | (.08 | ) | .11 | (.19 | ) | (.11 | ) | |||||||||||||
| Portfolio turnover rate (%) | 6 | ** | 32 | 32 | 28 | 42 | 44 | |||||||||||||||||
| a | Based on average shares outstanding during the period. |
| b | Total return would have been lower had certain expenses not been reduced. |
| c | Expense ratio does not reflect charges and fees associated with the separate account that invests in the Fund or any variable life insurance policy or variable annuity contract for which the Fund is an investment option. |
| * | Annualized |
| ** | Not annualized |
The accompanying notes are an integral part of the financial statements.
| 10 | | | Deutsche DWS Variable Series II — DWS Small Mid Cap Growth VIP |
Table of Contents
| Notes to Financial Statements | (Unaudited) |
A. Organization and Significant Accounting Policies
DWS Small Mid Cap Growth VIP (the “Fund”) is a diversified series of Deutsche DWS Variable Series II (the “Trust”), which is registered under the Investment Company Act of 1940, as amended (the “1940 Act”), as anopen-end management investment company organized as a Massachusetts business trust.
The Fund’s financial statements are prepared in accordance with accounting principles generally accepted in the United States of America (“U.S. GAAP”) which require the use of management estimates. Actual results could differ from those estimates. The Fund qualifies as an investment company under Topic 946 of Accounting Standards Codification of U.S. GAAP. The policies described below are followed consistently by the Fund in the preparation of its financial statements.
Security Valuation. Investments are stated at value determined as of the close of regular trading on the New York Stock Exchange on each day the exchange is open for trading.
Various inputs are used in determining the value of the Fund’s investments. These inputs are summarized in three broad levels. Level 1 includes quoted prices in active markets for identical securities. Level 2 includes other significant observable inputs (including quoted prices for similar securities, interest rates, prepayment speeds and credit risk). Level 3 includes significant unobservable inputs (including the Fund’s own assumptions in determining the fair value of investments). The level assigned to the securities valuations may not be an indication of the risk or liquidity associated with investing in those securities.
Equity securities are valued at the most recent sale price or official closing price reported on the exchange (U.S. or foreign) orover-the-counter market on which they trade. Securities for which no sales are reported are valued at the calculated mean between the most recent bid and asked quotations on the relevant market or, if a mean cannot be determined, at the most recent bid quotation. Equity securities are generally categorized as Level 1.
Investments inopen-end investment companies are valued at their net asset value each business day and are categorized as Level 1.
Securities and other assets for which market quotations are not readily available or for which the above valuation procedures are deemed not to reflect fair value are valued in a manner that is intended to reflect their fair value as determined in accordance with procedures approved by the Board and are generally categorized as Level 3. In accordance with the Fund’s valuation procedures, factors considered in determining value may include, but are not limited to, the type of the security; the size of the holding; the initial cost of the security; the existence of any contractual restrictions on the security’s disposition; the price and extent of public trading in similar securities of the issuer or of comparable companies; quotations or evaluated prices frombroker-dealers and/or pricing services; information obtained from the issuer, analysts, and/or the appropriate stock exchange (forexchange-traded securities); an analysis of the company’s or issuer’s financial statements; an evaluation of the forces that influence the issuer and the market(s) in which the security is purchased and sold; and with respect to debt securities, the maturity, coupon, creditworthiness, currency denomination and the movement of the market in which the security is normally traded. The value determined under these procedures may differ from published values for the same securities.
Disclosure about the classification of fair value measurements is included in a table following the Fund’s Investment Portfolio.
Foreign Currency Translations. The books and records of the Fund are maintained in U.S. dollars. Investment securities and other assets and liabilities denominated in a foreign currency are translated into U.S. dollars at the prevailing exchange rates at period end. Purchases and sales of investment securities, income and expenses are translated into U.S. dollars at the prevailing exchange rates on the respective dates of the transactions.
Net realized and unrealized gains and losses on foreign currency transactions represent net gains and losses between trade and settlement dates on securities transactions, the acquisition and disposition of foreign currencies, and the difference between the amount of net investment income accrued and the U.S. dollar amount actually received. The portion of both realized and unrealized gains and losses on investments that results from fluctuations in foreign currency exchange rates is not separately disclosed but is included with net realized and unrealized gain/appreciation and loss/depreciation on investments.
Securities Lending. Deutsche Bank AG, as lending agent, lends securities of the Fund to certain financial institutions under the terms of its securities lending agreement. During the term of the loans, the Fund
Deutsche DWS Variable Series II — DWS Small Mid Cap Growth VIP | | | 11 |
Table of Contents
continues to receive interest and dividends generated by the securities and to participate in any changes in their market value. The Fund requires the borrowers of the securities to maintain collateral with the Fund consisting of either cash or liquid, unencumbered assets having a value at least equal to the value of the securities loaned. When the collateral falls below specified amounts, the lending agent will use its best effort to obtain additional collateral on the next business day to meet required amounts under the securities lending agreement. As of period end, any securities on loan were collateralized by cash. During the six months ended June 30, 2019, the Fund invested the cash collateral into a joint trading account in DWS Government & Agency Securities Portfolio, an affiliated money market fund managed by DWS Investment Management Americas, Inc. DWS Investment Management Americas, Inc. receives a management/administration fee (0.11% annualized effective rate as of June 30, 2019) on the cash collateral invested in DWS Government & Agency Securities Portfolio. The Fund receives compensation for lending its securities either in the form of fees or by earning interest on invested cash collateral net of borrower rebates and fees paid to a lending agent. Either the Fund or the borrower may terminate the loan at any time, and the borrower, after notice, is required to return borrowed securities within a standard time period. There may be risks of delay and costs in recovery of securities or even loss of rights in the collateral should the borrower of the securities fail financially. If the Fund is not able to recover securities lent, the Fund may sell the collateral and purchase a replacement investment in the market, incurring the risk that the value of the replacement security is greater than the value of the collateral. The Fund is also subject to all investment risks associated with the reinvestment of any cash collateral received, including, but not limited to, interest rate, credit and liquidity risk associated with such investments.
As of June 30, 2019, the Fund had securities on loan, which were classified as common stock in the Investment Portfolio. The value of the related collateral exceeded the value of the securities loaned at period end. As of period end, the remaining contractual maturity of the collateral agreements were overnight and continuous.
Federal Income Taxes. The Fund’s policy is to comply with the requirements of the Internal Revenue Code, as amended, which are applicable to regulated investment companies, and to distribute all of its taxable income to its shareholders.
At June 30, 2019, the aggregate cost of investments for federal income tax purposes was $52,385,935. The net unrealized appreciation for all investments based on tax cost was $17,661,595. This consisted of aggregate gross unrealized appreciation for all investments in which there was an excess of value over tax cost of $21,795,433 aggregate gross unrealized depreciation for all investments in which was an excess of tax cost over value of $4,133,838.
The Fund has reviewed the tax positions for the open tax years as of December 31, 2018 and has determined that no provision for income tax and/or uncertain tax positions is required in the Fund’s financial statements. The Fund’s federal tax returns for the prior three fiscal years remain open subject to examination by the Internal Revenue Service.
Distribution of Income and Gains. Distributions from net investment income of the Fund, if any, are declared and distributed to shareholders annually. Net realized gains from investment transactions, in excess of available capital loss carryforwards, would be taxable to the Fund if not distributed and, therefore, will be distributed to shareholders at least annually. The Fund may also make additional distributions for tax purposes if necessary.
The timing and characterization of certain income and capital gain distributions are determined annually in accordance with federal tax regulations which may differ from accounting principles generally accepted in the United States of America. These differences primarily relate to certain securities sold at a loss. As a result, net investment income (loss) and net realized gain (loss) on investment transactions for a reporting period may differ significantly from distributions during such period. Accordingly, the Fund may periodically make reclassifications among certain of its capital accounts without impacting the net asset value of the Fund.
The tax character of current year distributions will be determined at the end of the current fiscal year.
Expenses. Expenses of the Trust arising in connection with a specific fund are allocated to that fund. Other Trust expenses which cannot be directly attributed to a fund are apportioned among the funds in the Trust based upon the relative net assets or other appropriate measures.
Contingencies. In the normal course of business, the Fund may enter into contracts with service providers that contain general indemnification clauses. The Fund’s maximum exposure under these arrangements is unknown, as this would involve future claims that may be made against the Fund that have not yet been made. However, based on experience, the Fund expects the risk of loss to be remote.
| 12 | | | Deutsche DWS Variable Series II — DWS Small Mid Cap Growth VIP |
Table of Contents
Other. Investment transactions are accounted for on a trade date plus one basis for daily net asset value calculations. However, for financial reporting purposes, investment transactions are reported on trade date. Interest income is recorded on the accrual basis. Dividend income is recorded on theex-dividend date net of foreign withholding taxes. Realized gains and losses from investment transactions are recorded on an identified cost basis. Proceeds from litigation payments, if any, are included in net realized gain (loss) from investments.
B. Purchases and Sales of Securities
During the six months ended June 30, 2019, purchases and sales of investment transactions (excludingshort-term investments) aggregated $4,205,815 and $8,076,695, respectively.
C. Related Parties
Management Agreement. Under the Investment Management Agreement with DWS Investment Management Americas, Inc. (“DIMA” or the “Advisor”), an indirect, wholly owned subsidiary of DWS Group GmbH & Co. KGaA (“DWS Group”), the Advisor directs the investments of the Fund in accordance with its investment objectives, policies and restrictions. The Advisor determines the securities, instruments and other contracts relating to investments to be purchased, sold or entered into by the Fund.
Pursuant to the Investment Management Agreement with the Advisor, the Fund pays a monthly management fee based on the Fund’s average daily net assets, computed and accrued daily and payable monthly, at the following annual rates:
| First $250 million | .550 | % | ||
| Next $750 million | .525 | % | ||
| Over $1 billion | .500 | % |
Accordingly, for the six months ended June 30, 2019, the fee pursuant to the Investment Management Agreement was equivalent to an annualized rate (exclusive of any applicable waivers/reimbursements) of 0.55% of the Fund’s average daily net assets.
For the period from January 1, 2019 through September 30, 2019, the Advisor has contractually agreed to waive its fees and/or reimburse certain operating expenses to the extent necessary to maintain the total annual operating expenses (excluding certain expenses such as extraordinary expenses, taxes, brokerage and interest expense) of Class A at 0.81%.
For the six months ended June 30, 2019, fees waived and/or expenses reimbursed were $3,010.
Administration Fee. Pursuant to an Administrative Services Agreement, DIMA provides most administrative services to the Fund. For all services provided under the Administrative Services Agreement, the Fund pays DIMA an annual fee (“Administration Fee”) of 0.10% of the Fund’s average daily net assets, computed and accrued daily and payable monthly. For the six months ended June 30, 2019, the Administration Fee was $35,091, of which $5,626 is unpaid.
Service Provider Fees. DWS Service Company (“DSC”), an affiliate of the Advisor, is the transfer agent,dividend-paying agent and shareholder service agent for the Fund. Pursuant to asub-transfer agency agreement between DSC and DST Systems, Inc. (“DST”), DSC has delegated certain transfer agent,dividend-paying agent and shareholder service agent functions to DST. DSC compensates DST out of the shareholder servicing fee it receives from the Fund. For the six months ended June 30, 2019, the amounts charged to the Fund by DSC aggregated $196, of which $62 is unpaid.
Typesetting and Filing Service Fees. Under an agreement with the Fund, DIMA is compensated for providing certainpre-press and regulatory filing services to the Fund. For the six months ended June 30, 2019, the amount charged to the Fund by DIMA included in the Statement of Operations under “Reports to shareholders” aggregated $4,706, all of which is unpaid.
Trustees’ Fees and Expenses. The Fund paid retainer fees to each Trustee not affiliated with the Advisor, plus specified amounts to the Board Chairperson and to each committee Chairperson.
Affiliated Cash Management Vehicles. The Fund may invest uninvested cash balances in DWS Central Cash Management Government Fund and DWS ESG Liquidity Fund, affiliated money market funds which are managed by the Advisor. Each affiliated money market fund is managed in accordance withRule 2a-7 under the 1940 Act, which governs the quality, maturity, diversity and liquidity of instruments in which a money market fund may invest. DWS Central Cash Management Government Fund seeks to maintain a stable net
Deutsche DWS Variable Series II — DWS Small Mid Cap Growth VIP | | | 13 |
Table of Contents
asset value, and DWS ESG Liquidity Fund maintains a floating net asset value. The Fund indirectly bears its proportionate share of the expenses of each affiliated money market fund in which it invests. DWS Central Cash Management Government Fund does not pay the Advisor an investment management fee. To the extent that DWS ESG Liquidity Fund pays an investment management fee to the Advisor, the Advisor will waive an amount of the investment management fee payable to the Advisor by the Fund equal to the amount of the investment management fee payable on the Fund’s assets invested in DWS ESG Liquidity Fund.
Securities Lending Agent Fees. Deutsche Bank AG serves as securities lending agent for the Fund. For the six months ended June 30, 2019, the Fund incurred securities lending agent fees to Deutsche Bank AG in the amount of $2,157.
D. Ownership of the Fund
At June 30, 2019, one participating insurance company was owner of record of 10% or more of the total outstanding Class A shares of the Fund, owning 91%.
E. Line of Credit
The Fund and other affiliated funds (the “Participants”) share in a $400 million revolving credit facility provided by a syndication of banks. The Fund may borrow for temporary or emergency purposes, including the meeting of redemption requests that otherwise might require the untimely disposition of securities. The Participants are charged an annual commitment fee which is allocated based on net assets, among each of the Participants. Interest is calculated at a rate per annum equal to the sum of the Federal Funds Rate plus 1.25 percent plus if theone-month LIBOR exceeds the Federal Funds Rate the amount of such excess. The Fund may borrow up to a maximum of 33 percent of its net assets under the agreement. The Fund had no outstanding loans at June 30, 2019.
| 14 | | | Deutsche DWS Variable Series II — DWS Small Mid Cap Growth VIP |
Table of Contents
| Information About Your Fund’s Expenses | (Unaudited) |
As an investor of the Fund, you incur two types of costs: ongoing expenses and transaction costs. Ongoing expenses include management fees and other Fund expenses. Examples of transaction costs include contract charges, which are not shown in this section. The following tables are intended to help you understand your ongoing expenses (in dollars) of investing in the Fund and to help you compare these expenses with the ongoing expenses of investing in other mutual funds. In the most recent six-month period, the Fund limited these expenses; had it not done so, expenses would have been higher. The example in the table is based on an investment of $1,000 invested at the beginning of thesix-month period and held for the entire period (January 1, 2019 to June 30, 2019).
The tables illustrate your Fund’s expenses in two ways:
| – | Actual Fund Return. This helps you estimate the actual dollar amount of ongoing expenses (but not transaction costs) paid on a $1,000 investment in the Fund using the Fund’s actual return during the period. To estimate the expenses you paid over the period, simply divide your account value by $1,000 (for example, an $8,600 account value divided by $1,000 = 8.6), then multiply the result by the number in the “Expenses Paid per $1,000” line under the share class you hold. |
| – | Hypothetical 5% Fund Return. This helps you to compare your Fund’s ongoing expenses (but not transaction costs) with those of other mutual funds using the Fund’s actual expense ratio and a hypothetical rate of return of 5% per year before expenses. Examples using a 5% hypothetical Fund return may be found in the shareholder reports of other mutual funds. The hypothetical account values and expenses may not be used to estimate the actual ending account balance or expenses you paid for the period. |
Please note that the expenses shown in these tables are meant to highlight your ongoing expenses only and do not reflect any transaction costs. The “Expenses Paid per $1,000” line of the tables is useful in comparing ongoing expenses only and will not help you determine the relative total expense of owning different funds. If these transaction costs had been included, your costs would have been higher.
| Expenses and Value of a $1,000 Investment for the six months ended June 30, 2019 | ||||
| Actual Fund Return | Class A | |||
| Beginning Account Value 1/1/19 | $ | 1,000.00 | ||
| Ending Account Value 6/30/19 | $ | 1,156.90 | ||
| Expenses Paid per $1,000* | $ | 4.33 | ||
| Hypothetical 5% Fund Return | Class A | |||
| Beginning Account Value 1/1/19 | $ | 1,000.00 | ||
| Ending Account Value 6/30/19 | $ | 1,020.78 | ||
| Expenses Paid per $1,000* | $ | 4.06 | ||
| * | Expenses are equal to the Fund’s annualized expense ratio, multiplied by the average account value over the period, multiplied by 181 (the number of days in the most recentsix-month period), then divided by 365. |
| Annualized Expense Ratio | Class A | |||
| Deutsche DWS Variable Series II — DWS Small Mid Cap Growth VIP | .81 | % | ||
For more information, please refer to the Fund’s prospectus.
These tables do not reflect charges and fees (“contract charges”) associated with the separate account that invests in the Fund or any variable life insurance policy or variable annuity contract for which the Fund is an investment option.
For an analysis of the fees associated with an investment in the Fund or similar funds, please refer to the current and hypothetical expense calculators for Variable Insurance Products which can be found at dws.com/calculators.
Deutsche DWS Variable Series II — DWS Small Mid Cap Growth VIP | | | 15 |
Table of Contents
| Proxy Voting |
The Trust’s policies and procedures for voting proxies for portfolio securities and information about how the Trust voted proxies related to its portfolio securities during the most recent12-month period ended June 30 are available on our Web site — dws.com/en-us/resources/proxy-voting — or on the SEC’s Web site — sec.gov. To obtain a written copy of the Trust’s policies and procedures without charge, upon request, call us toll free at (800)728-3337.
| 16 | | | Deutsche DWS Variable Series II — DWS Small Mid Cap Growth VIP |
Table of Contents
Advisory Agreement Board Considerations and Fee Evaluation
The Board of Trustees (hereinafter referred to as the “Board” or “Trustees”) approved the renewal of DWS Small Mid Cap Growth VIP’s (the “Fund”) investment management agreement (the “Agreement”) with DWS Investment Management Americas, Inc. (“DIMA”) in September 2018.
In terms of the process that the Board followed prior to approving the Agreement, shareholders should know that:
| – | During the entire process, all of the Fund’s Trustees were independent of DIMA and its affiliates (the “Independent Trustees”). |
| – | The Board met frequently during the past year to discuss fund matters and dedicated a substantial amount of time to contract review matters. Over the course of several months, the Board’s Contract Committee reviewed extensive materials received from DIMA, independent third parties and independent counsel. These materials included an analysis of the Fund’s performance, fees and expenses, and profitability from a fee consultant retained by the Fund’s Independent Trustees (the “Fee Consultant”). Based on its evaluation of the information provided, the Contract Committee presented its findings and recommendations to the Board. The Board then reviewed the Contract Committee’s findings and recommendations. |
| – | The Board also received extensive information throughout the year regarding performance of the Fund. |
| – | The Independent Trustees regularly met privately with counsel to discuss contract review and other matters. In addition, the Independent Trustees were advised by the Fee Consultant in the course of their review of the Fund’s contractual arrangements and considered a comprehensive report prepared by the Fee Consultant in connection with their deliberations. |
| – | In connection with reviewing the Agreement, the Board also reviewed the terms of the Fund’s distribution agreement, administrative services agreement, transfer agency agreement and other material service agreements. |
In connection with the contract review process, the Contract Committee and the Board considered the factors discussed below, among others. The Board also considered that DIMA and its predecessors have managed the Fund since its inception, and the Board believes that a long-term relationship with a capable, conscientious advisor is in the best interests of the Fund. The Board considered, generally, that shareholders chose to invest or remain invested in the Fund knowing that DIMA managed the Fund. DIMA is part of DWS Group GmbH & Co. KGaA (“DWS Group”). DWS Group is a global asset management business that offers a wide range of investing expertise and resources, including research capabilities in many countries throughout the world. In 2018, approximately 20% of DWS Group’s shares were sold in an initial public offering, with Deutsche Bank AG owning the remaining shares.
As part of the contract review process, the Board carefully considered the fees and expenses of each DWS fund overseen by the Board in light of the fund’s performance. In many cases, this led to the negotiation and implementation of expense caps. As part of these negotiations, the Board indicated that it would consider relaxing these caps in future years following sustained improvements in performance, among other considerations.
While shareholders may focus primarily on fund performance and fees, the Fund’s Board considers these and many other factors, including the quality and integrity of DIMA’s personnel and administrative support services provided by DIMA, such as back-office operations, fund valuations, and compliance policies and procedures.
Nature, Quality and Extent of Services. The Board considered the terms of the Agreement, including the scope of advisory services provided under the Agreement. The Board noted that, under the Agreement, DIMA provides portfolio management services to the Fund and that, pursuant to a separate administrative services agreement, DIMA provides administrative services to the Fund. The Board considered the experience and skills of senior management and investment personnel and the resources made available to such personnel. The Board reviewed the Fund’s performance over short-term and long-term periods and compared those returns to various agreed-upon performance measures, including market index(es) and a peer universe compiled using information supplied by Morningstar Direct (“Morningstar”), an independent fund data service. The Board also noted that it has put into place a process of identifying “Funds in Review” (e.g., funds performing poorly relative to a peer universe), and receives additional reporting from DIMA regarding such funds and, where appropriate, DIMA’s plans to address underperformance. The Board
Deutsche DWS Variable Series II — DWS Small Mid Cap Growth VIP | | | 17 |
Table of Contents
believes this process is an effective manner of identifying and addressing underperforming funds. Based on the information provided, the Board noted that, for theone-, three- and five-year periods ended December 31, 2017, the Fund’s performance (Class A shares) was in the 3rd quartile, 3rd quartile and 2nd quartile, respectively, of the applicable Morningstar universe (the 1st quartile being the best performers and the 4th quartile being the worst performers). The Board also observed that the Fund has underperformed its benchmark in theone-, three- and five-year periods ended December 31, 2017. The Board noted the disappointing investment performance of the Fund in recent periods and continued to discuss with senior management of DIMA the factors contributing to such underperformance and actions being taken to improve performance. The Board noted changes in the portfolio management team, effective April 19, 2018. The Board recognized the efforts by DIMA in recent years to enhance its investment platform and improve long-term performance across the DWS fund complex.
Fees and Expenses. The Board considered the Fund’s investment management fee schedule, operating expenses and total expense ratios, and comparative information provided by Broadridge Financial Solutions, Inc. (“Broadridge”) and the Fee Consultant regarding investment management fee rates paid to other investment advisors by similar funds (1st quartile being the most favorable and 4th quartile being the least favorable). With respect to management fees paid to other investment advisors by similar funds, the Board noted that the contractual fee rates paid by the Fund, which include a 0.10% fee paid to DIMA under the Fund’s administrative services agreement, were lower than the median (1st quartile) of the applicable Broadridge peer group (based on Broadridge data provided as of December 31, 2017). The Board noted that the Fund’s Class A shares total (net) operating expenses were expected to be lower than the median (2nd quartile) of the applicable Broadridge expense universe (based on Broadridge data provided as of December 31, 2017, and analyzing Broadridge expense universe Class A (net) expenses less any applicable12b-1 fees) (“Broadridge Universe Expenses”). The Board noted that the expense limitation agreed to by DIMA was expected to help the Fund’s total (net) operating expenses remain competitive. The Board considered the Fund’s management fee rate as compared to fees charged by DIMA to comparable DWS U.S. registered funds (“DWS Funds”), noting that DIMA indicated that it does not provide services to any comparable DWS Funds. The information requested by the Board as part of its review of fees and expenses also included information about institutional accounts (including anysub-advised funds and accounts) and funds offered primarily to European investors (“DWS Europe Funds”) managed by DWS Group. The Board noted that DIMA indicated that DWS Group does not manage any institutional accounts or DWS Europe Funds comparable to the Fund.
On the basis of the information provided, the Board concluded that management fees were reasonable and appropriate in light of the nature, quality and extent of services provided by DIMA.
Profitability. The Board reviewed detailed information regarding revenues received by DIMA under the Agreement. The Board considered the estimated costs to DIMA, andpre-tax profits realized by DIMA, from advising the DWS Funds, as well as estimates of thepre-tax profits attributable to managing the Fund in particular. The Board also received information regarding the estimated enterprise-wide profitability of DIMA and its affiliates with respect to all fund services in totality and by fund. The Board and the Fee Consultant reviewed DIMA’s methodology in allocating its costs to the management of the Fund. Based on the information provided, the Board concluded that thepre-tax profits realized by DIMA in connection with the management of the Fund were not unreasonable. The Board also reviewed certain publicly available information regarding the profitability of certain similar investment management firms. The Board noted that, while information regarding the profitability of such firms is limited (and in some cases is not necessarily prepared on a comparable basis), DIMA and its affiliates’ overall profitability with respect to the DWS Funds (after taking into account distribution and other services provided to the funds by DIMA and its affiliates) was lower than the overall profitability levels of most comparable firms for which such data was available.
Economies of Scale. The Board considered whether there are economies of scale with respect to the management of the Fund and whether the Fund benefits from any economies of scale. The Board noted that the Fund’s investment management fee schedule includes fee breakpoints. The Board concluded that the Fund’s fee schedule represents an appropriate sharing between the Fund and DIMA of such economies of scale as may exist in the management of the Fund at current asset levels.
Other Benefits to DIMA and Its Affiliates. The Board also considered the character and amount of other incidental or“fall-out” benefits received by DIMA and its affiliates, including any fees received by DIMA for administrative services provided to the Fund and any fees received by an affiliate of DIMA for transfer agency services provided to the Fund. The Board also considered benefits to DIMA related to brokerage and soft-dollar allocations, including allocating brokerage to pay for research generated by parties other than the
| 18 | | | Deutsche DWS Variable Series II — DWS Small Mid Cap Growth VIP |
Table of Contents
executing broker dealers, which pertain primarily to funds investing in equity securities. In addition, the Board considered the incidental public relations benefits to DIMA related to DWS Funds advertising and cross-selling opportunities among DIMA products and services. The Board considered these benefits in reaching its conclusion that the Fund’s management fees were reasonable.
Compliance. The Board considered the significant attention and resources dedicated by DIMA to its compliance processes in recent years. The Board noted in particular (i) the experience, seniority and time commitment of the individuals serving as DIMA’s and the Fund’s chief compliance officers and (ii) the substantial commitment of resources by DIMA and its affiliates to compliance matters, including the retention of compliance personnel.
Based on all of the information considered and the conclusions reached, the Board unanimously determined that the continuation of the Agreement is in the best interests of the Fund. In making this determination, the Board did not give particular weight to any single factor identified above. The Board considered these factors over the course of numerous meetings, certain of which were in executive session with only the Independent Trustees and counsel present. It is possible that individual Independent Trustees may have weighed these factors differently in reaching their individual decisions to approve the continuation of the Agreement.
Deutsche DWS Variable Series II — DWS Small Mid Cap Growth VIP | | | 19 |
Table of Contents
| ||
VS2SMCG-3 (R-028388-8 8/19) |
Table of Contents
June 30, 2019
Semiannual Report
Deutsche DWS Variable Series II
DWS Small Mid Cap Value VIP
Beginning on January 1, 2021, as permitted by regulations adopted by the Securities and Exchange Commission, you may not be receiving paper copies of the Fund’s shareholder reports from the insurance company that offers your contract unless you specifically request paper copies from your insurance company or from your financial intermediary. Instead, the shareholder reports will be made available on a Web site, and your insurance company will notify you by mail each time a report is posted and provide you with a Web site link to access the report. Instructions for requesting paper copies will be provided by your insurance company.
If you already elected to receive shareholder reports electronically, you will not be affected by this change and you need not take any action. You may elect to receive shareholder reports and other communications from your insurance company electronically by following the instructions provided by your insurance company.
You may elect to receive all future reports in paper free of charge from your insurance company. If your insurance company informs you that future reports will be delivered via Web access, you can inform your insurance company that you wish to continue receiving paper copies of your shareholder reports by following the instructions provided by your insurance company.

Table of Contents
This report must be preceded or accompanied by a prospectus. To obtain an additional prospectus or summary prospectus, if available, call (800)728-3337 or your financial representative. We advise you to consider the Fund’s objectives, risks, charges and expenses carefully before investing. The summary prospectus and prospectus contain this and other important information about the Fund. Please read the prospectus carefully before you invest.
Stocks may decline in value. Smaller and medium company stocks tend to be more volatile than large company stocks. Any fund that focuses in a particular segment of the market or region of the world will generally be more volatile than a fund that invests more broadly. The Fund may lend securities to approved institutions. Please read the prospectus for details.
The brand DWS represents DWS Group GmbH & Co. KGaA and any of its subsidiaries such as DWS Distributors, Inc. which offers investment products or DWS Investment Management Americas, Inc. and RREEF America L.L.C. which offer advisory services.
DWS Distributors, Inc., 222 South Riverside Plaza, Chicago, IL 60606, (800)621-1148
NOT FDIC/NCUA INSURED NO BANK GUARANTEE MAY LOSE VALUE NOT A DEPOSIT
NOT INSURED BY ANY FEDERAL GOVERNMENT AGENCY
| 2 | | | Deutsche DWS Variable Series II — DWS Small Mid Cap Value VIP |
Table of Contents
| Performance Summary | June 30, 2019 (Unaudited) |
Fund performance shown is historical, assumes reinvestment of all dividend and capital gain distributions and does not guarantee future results. Investment return and principal value fluctuate with changing market conditions so that, when redeemed, shares may be worth more or less than their original cost. Current performance may be lower or higher than the performance data quoted. Please contact your participating insurance company for the Fund’s most recentmonth-end performance. Performance does not reflect charges and fees (“contract charges”) associated with the separate account that invests in the Fund or any variable life insurance policy or variable annuity contract for which the Fund is an investment option. These charges and fees will reduce returns. While all share classes have the same underlying portfolio, their performance will differ.
The gross expense ratios of the Fund, as stated in the fee table of the prospectus dated May 1, 2019 are 0.87% and 1.24% for Class A and Class B shares, respectively, and may differ from the expense ratios disclosed in the Financial Highlights tables in this report.
Generally accepted accounting principles require adjustments to be made to the net assets of the Fund at period end for financial reporting purposes only, and as such, the total return based on the unadjusted net asset value per share may differ from the total return reported in the financial highlights.
Growth of an Assumed $10,000 Investment in DWS Small Mid Cap Value VIP
| The Russell 2500 Value Index is an unmanaged Index of those securities in the Russell 3000® Index with lower price-to-book ratios and lower forecasted growth values.
Index returns do not reflect any fees or expenses and it is not possible to invest directly into an index. |
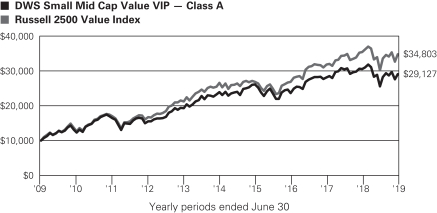
| Comparative Results | ||||||||||||
| DWS Small Mid Cap Value VIP | 6-Month‡ | 1-Year | 3-Year | 5-Year | 10-Year | |||||||
| Class A | Growth of $10,000 | $11,388 | $9,530 | $12,299 | $12,154 | $29,127 | ||||||
| Average annual total return | 13.88% | –4.70% | 7.14% | 3.98% | 11.28% | |||||||
| Russell 2500 Value Index | Growth of $10,000 | $11,526 | $9,808 | $12,942 | $13,099 | $34,803 | ||||||
| Average annual total return | 15.26% | –1.92% | 8.98% | 5.55% | 13.28% | |||||||
| DWS Small Mid Cap Value VIP | 6-Month‡ | 1-Year | 3-Year | 5-Year | 10-Year | |||||||
| Class B | Growth of $10,000 | $11,364 | $9,490 | $12,162 | $11,941 | $28,104 | ||||||
| Average annual total return | 13.64% | –5.10% | 6.74% | 3.61% | 10.89% | |||||||
| Russell 2500 Value Index | Growth of $10,000 | $11,526 | $9,808 | $12,942 | $13,099 | $34,803 | ||||||
| Average annual total return | 15.26% | –1.92% | 8.98% | 5.55% | 13.28% | |||||||
The growth of $10,000 is cumulative.
| ‡ | Total returns shown for periods less than one year are not annualized. |
Deutsche DWS Variable Series II — DWS Small Mid Cap Value VIP | | | 3 |
Table of Contents
| Portfolio Summary | (Unaudited) |
| Asset Allocation (As a % of Investment Portfolio excluding Securities Lending) | 6/30/19 | 12/31/18 | ||||||
| Common Stocks | 98% | 97% | ||||||
| Cash Equivalent | 2% | 3% | ||||||
| Rights | 0% | — | ||||||
| 100% | 100% | |||||||
| Sector Diversification (As a % of Investment Portfolio excluding Cash Equivalent and Securities Lending) | 6/30/19 | 12/31/18 | ||||||
Financials | 23% | 22% | ||||||
Real Estate | 17% | 13% | ||||||
Industrials | 13% | 16% | ||||||
Information Technology | 10% | 11% | ||||||
Consumer Discretionary | 8% | 12% | ||||||
Utilities | 7% | 6% | ||||||
Health Care | 6% | 6% | ||||||
Materials | 5% | 5% | ||||||
Energy | 4% | 4% | ||||||
Communication Services | 4% | 2% | ||||||
Consumer Staples | 3% | 3% | ||||||
| 100% | 100% | |||||||
Portfolio holdings and characteristics are subject to change.
For more complete details about the Fund’s investment portfolio, see page 5.
Following the Fund’s fiscal first and thirdquarter-end, a complete portfolio holdings listing is filed with the SEC on FormN-Q or Form N-PORT (available for filings after March 31, 2019). The Fund’s Form N-Q or Form N-PORT will be available on the SEC’s Web site at sec.gov. The Fund’s portfolio holdings are also posted on dws.com from time to time. Please read the Fund’s current prospectus for more information.
Pankaj Bhatnagar, PhD, Managing Director
Arno V. Puskar, Director
| 4 | | | Deutsche DWS Variable Series II — DWS Small Mid Cap Value VIP |
Table of Contents
| Investment Portfolio | as of June 30, 2019 (Unaudited) |
| Shares | Value ($) | |||||||
| Common Stocks 98.0% |
| |||||||
| Communication Services 3.4% |
| |||||||
Entertainment 1.4% |
| |||||||
AMC Entertainment Holdings, Inc. “A” (a) | 55,055 | 513,663 | ||||||
Eros International PLC* (a) | 49,271 | 66,516 | ||||||
Walt Disney Co. | 5,032 | 702,669 | ||||||
|
| |||||||
| 1,282,848 | ||||||||
Media 2.0% |
| |||||||
Interpublic Group of Companies, Inc. | 70,784 | 1,599,010 | ||||||
Meredith Corp. | 5,811 | 319,954 | ||||||
|
| |||||||
| 1,918,964 | ||||||||
| Consumer Discretionary 7.5% |
| |||||||
Automobiles 1.5% |
| |||||||
Winnebago Industries, Inc. | 36,298 | 1,402,918 | ||||||
Diversified Consumer Services 1.4% |
| |||||||
Regis Corp.* | 79,032 | 1,311,931 | ||||||
Hotels, Restaurants & Leisure 1.6% |
| |||||||
Aramark | 42,196 | 1,521,588 | ||||||
Leisure Products 0.7% |
| |||||||
Brunswick Corp. | 14,307 | 656,548 | ||||||
Multiline Retail 0.4% |
| |||||||
Kohl’s Corp. | 8,100 | 385,155 | ||||||
Textiles, Apparel & Luxury Goods 1.9% |
| |||||||
Columbia Sportswear Co. | 17,354 | 1,738,177 | ||||||
| Consumer Staples 3.1% |
| |||||||
Food Products 1.5% |
| |||||||
Conagra Brands, Inc. | 17,736 | 470,359 | ||||||
Lamb Weston Holdings, Inc. | 15,023 | 951,857 | ||||||
|
| |||||||
| 1,422,216 | ||||||||
Household Products 1.6% |
| |||||||
Central Garden & Pet Co.* | 54,615 | 1,471,874 | ||||||
| Energy 4.4% |
| |||||||
Energy Equipment & Services 1.0% |
| |||||||
Apergy Corp.* | 8,300 | 278,382 | ||||||
Patterson-UTI Energy, Inc. | 54,471 | 626,961 | ||||||
|
| |||||||
| 905,343 | ||||||||
Oil, Gas & Consumable Fuels 3.4% |
| |||||||
Gulfport Energy Corp.* | 60,623 | 297,659 | ||||||
HollyFrontier Corp. | 12,696 | 587,571 | ||||||
Murphy Oil Corp. | 26,957 | 664,490 | ||||||
Peabody Energy Corp. | 25,354 | 611,032 | ||||||
SandRidge Energy, Inc.* | 61,148 | 423,144 | ||||||
WPX Energy, Inc.* | 52,173 | 600,511 | ||||||
|
| |||||||
| 3,184,407 | ||||||||
| Financials 22.5% |
| |||||||
Banks 12.9% |
| |||||||
Bank of America Corp. | 26,170 | 758,930 | ||||||
Eagle Bancorp., Inc. | 28,517 | 1,543,625 | ||||||
East West Bancorp., Inc. | 24,968 | 1,167,753 | ||||||
Great Western Bancorp., Inc. | 58,045 | 2,073,368 | ||||||
Hancock Whitney Corp. | 46,301 | 1,854,818 | ||||||
JPMorgan Chase & Co. | 8,444 | 944,039 | ||||||
| Shares | Value ($) | |||||||
Pacific Premier Bancorp., Inc. | 33,715 | 1,041,119 | ||||||
Sterling Bancorp. | 66,324 | 1,411,375 | ||||||
UMB Financial Corp. | 18,452 | 1,214,511 | ||||||
|
| |||||||
| 12,009,538 | ||||||||
Capital Markets 0.8% |
| |||||||
E*TRADE Financial Corp. | 16,234 | 724,036 | ||||||
Consumer Finance 0.4% |
| |||||||
EZCORP, Inc. “A”* | 38,163 | 361,404 | ||||||
Insurance 5.8% |
| |||||||
American Financial Group, Inc. | 5,290 | 542,066 | ||||||
Assurant, Inc. | 13,300 | 1,414,854 | ||||||
Brown & Brown, Inc. | 51,769 | 1,734,262 | ||||||
MBIA, Inc.* | 99,772 | 928,877 | ||||||
Torchmark Corp. | 9,200 | 823,032 | ||||||
|
| |||||||
| 5,443,091 | ||||||||
Mortgage Real Estate Investment Trusts (REITs) 0.9% |
| |||||||
Blackstone Mortgage Trust, Inc., “A” | 24,538 | 873,062 | ||||||
Thrifts & Mortgage Finance 1.7% |
| |||||||
Walker & Dunlop, Inc. | 29,822 | 1,586,829 | ||||||
| Health Care 5.8% |
| |||||||
Health Care Equipment & Supplies 0.7% |
| |||||||
Invacare Corp. | 117,624 | 610,468 | ||||||
Health Care Providers & Services 1.1% |
| |||||||
Premier, Inc. “A”* | 26,798 | 1,048,070 | ||||||
Life Sciences Tools & Services 3.6% |
| |||||||
Bruker Corp. | 42,574 | 2,126,571 | ||||||
PerkinElmer, Inc. | 12,605 | 1,214,366 | ||||||
|
| |||||||
| 3,340,937 | ||||||||
Pharmaceuticals 0.4% |
| |||||||
Mallinckrodt PLC* (a) | 45,695 | 419,480 | ||||||
| Industrials 12.7% |
| |||||||
Building Products 1.4% |
| |||||||
Simpson Manufacturing Co., Inc. | 19,715 | 1,310,259 | ||||||
Commercial Services & Supplies 2.3% |
| |||||||
Interface, Inc. | 47,907 | 734,414 | ||||||
The Brink’s Co. | 17,413 | 1,413,588 | ||||||
|
| |||||||
| 2,148,002 | ||||||||
Electrical Equipment 2.3% |
| |||||||
EnerSys | 31,967 | 2,189,739 | ||||||
Machinery 4.4% |
| |||||||
Douglas Dynamics, Inc. | 20,212 | 804,236 | ||||||
Federal Signal Corp. | 70,555 | 1,887,346 | ||||||
Hillenbrand, Inc. | 34,641 | 1,370,744 | ||||||
|
| |||||||
| 4,062,326 | ||||||||
Professional Services 1.9% |
| |||||||
ICF International, Inc. | 13,149 | 957,247 | ||||||
Nielsen Holdings PLC | 36,986 | 835,884 | ||||||
|
| |||||||
| 1,793,131 | ||||||||
Road & Rail 0.4% |
| |||||||
Hertz Global Holdings, Inc.* (a) | 25,421 | 405,719 | ||||||
The accompanying notes are an integral part of the financial statements.
Deutsche DWS Variable Series II — DWS Small Mid Cap Value VIP | | | 5 |
Table of Contents
| Shares | Value ($) | |||||||
| Information Technology 10.2% |
| |||||||
Electronic Equipment, Instruments & Components 4.3% |
| |||||||
Insight Enterprises, Inc.* | 37,400 | 2,176,680 | ||||||
Rogers Corp.* | 10,470 | 1,806,913 | ||||||
|
| |||||||
| 3,983,593 | ||||||||
IT Services 2.8% |
| |||||||
Euronet Worldwide, Inc.* | 7,789 | 1,310,421 | ||||||
Leidos Holdings, Inc. | 15,800 | 1,261,630 | ||||||
|
| |||||||
| 2,572,051 | ||||||||
Semiconductors & Semiconductor Equipment 0.9% |
| |||||||
Marvell Technology Group Ltd. | 36,100 | 861,707 | ||||||
Software 2.2% |
| |||||||
Verint Systems, Inc.* | 39,135 | 2,104,680 | ||||||
| Materials 5.2% |
| |||||||
Chemicals 0.4% |
| |||||||
Kraton Corp.* | 11,230 | 348,916 | ||||||
Metals & Mining 4.8% |
| |||||||
Cleveland-Cliffs, Inc. (a) | 142,611 | 1,521,659 | ||||||
Coeur Mining, Inc.* | 134,562 | 583,999 | ||||||
Steel Dynamics, Inc. | 43,769 | 1,321,824 | ||||||
SunCoke Energy, Inc.* | 51,848 | 460,410 | ||||||
Warrior Met Coal, Inc. | 24,621 | 643,101 | ||||||
|
| |||||||
| 4,530,993 | ||||||||
| Real Estate 16.6% |
| |||||||
Equity Real Estate Investment Trusts (REITs) |
| |||||||
Agree Realty Corp. | 32,916 | 2,108,270 | ||||||
Alexander & Baldwin, Inc.* | 19,251 | 444,698 | ||||||
Colony Capital, Inc. | 82,585 | 412,925 | ||||||
Community Healthcare Trust, Inc. | 53,193 | 2,096,336 | ||||||
Duke Realty Corp. | 35,999 | 1,137,928 | ||||||
Easterly Government Properties, Inc. | 71,737 | 1,299,157 | ||||||
Gaming and Leisure Properties, Inc. | 28,066 | 1,094,013 | ||||||
Highwoods Properties, Inc. | 28,870 | 1,192,331 | ||||||
Pebblebrook Hotel Trust | 54,793 | 1,544,067 | ||||||
SITE Centers Corp. | 71,120 | 941,629 | ||||||
STAG Industrial, Inc. | 56,593 | 1,711,372 | ||||||
| Shares | Value ($) | |||||||
WP Carey, Inc. | 19,000 | 1,542,420 | ||||||
|
| |||||||
| 15,525,146 | ||||||||
| Utilities 6.6% |
| |||||||
Electric Utilities 4.8% |
| |||||||
Alliant Energy Corp. | 38,308 | 1,880,157 | ||||||
IDACORP, Inc. | 18,329 | 1,840,781 | ||||||
Pinnacle West Capital Corp. | 7,533 | 708,780 | ||||||
|
| |||||||
| 4,429,718 | ||||||||
Gas Utilities 1.8% |
| |||||||
ONE Gas, Inc. | 18,958 | 1,711,907 | ||||||
| Total Common Stocks(Cost $83,388,775) |
| 91,596,771 | ||||||
| Rights 0.1% |
| |||||||
| Industrials | ||||||||
Hertz Global Holdings, Inc.* (a) (Cost $68,353) | 25,421 | 49,571 | ||||||
| Securities Lending Collateral 2.7% |
| |||||||
DWS Government & Agency Securities Portfolio “DWS Government Cash Institutional Shares”, 2.28% (b) (c) (Cost $2,531,242) | 2,531,242 | 2,531,242 | ||||||
| Cash Equivalents 1.9% |
| |||||||
DWS Central Cash Management Government Fund, 2.40% (b) (Cost $1,764,543) | 1,764,543 | 1,764,543 | ||||||
| % of Net Assets | Value ($) | |||||||
Total Investment Portfolio (Cost $87,752,913) | 102.7 | 95,942,127 | ||||||
| Other Assets and Liabilities, Net | (2.7 | ) | (2,503,026 | ) | ||||
| Net Assets | 100.0 | 93,439,101 | ||||||
A summary of the Fund’s transactions with affiliated investments during the period ended June 30, 2019 are as follows:
| Value ($) at 12/31/2018 | Purchases Cost ($) | Sales Proceeds ($) | Net Realized Gain/ (Loss) ($) | Net Change in Unrealized Appreciation (Depreciation) ($) | Income ($) | Capital Gain Distributions ($) | Number of Shares at 6/30/2019 | Value ($) at 6/30/2019 | ||||||||||||||||||||||||
Securities Lending Collateral 2.7% |
| |||||||||||||||||||||||||||||||
DWS Government & Agency Securities Portfolio “DWS Government Cash Institutional Shares”, 2.28% (b) (c) |
| |||||||||||||||||||||||||||||||
| — | 2,531,242 | (d) | — | — | — | 1,903 | — | 2,531,242 | 2,531,242 | |||||||||||||||||||||||
Cash Equivalents 1.9% |
| |||||||||||||||||||||||||||||||
DWS Central Cash Management Government Fund, 2.40% (b) |
| |||||||||||||||||||||||||||||||
| 2,497,809 | 6,996,439 | 7,729,705 | — | — | 22,231 | — | 1,764,543 | 1,764,543 | ||||||||||||||||||||||||
| 2,497,809 | 9,527,681 | 7,729,705 | — | — | 24,134 | — | 4,295,785 | 4,295,785 | ||||||||||||||||||||||||
| * | Non-income producing security. |
| (a) | All or a portion of these securities were on loan. In addition, “Other Assets and Liabilities, Net” may include pending sales that are also on loan. The value of securities loaned at June 30, 2019 amounted to $2,454,280, which is 2.6% of net assets. |
| (b) | Affiliated fund managed by DWS Investment Management Americas, Inc. The rate shown is the annualizedseven-day yield at period end. |
| (c) | Represents cash collateral held in connection with securities lending. Income earned by the Fund is net of borrower rebates. |
| (d) | Represents the net increase (purchase cost) or decrease (sales proceeds) in the amount invested in cash collateral for the period ended June 30, 2019. |
The accompanying notes are an integral part of the financial statements.
| 6 | | | Deutsche DWS Variable Series II — DWS Small Mid Cap Value VIP |
Table of Contents
Fair Value Measurements
Various inputs are used in determining the value of the Fund’s investments. These inputs are summarized in three broad levels. Level 1 includes quoted prices in active markets for identical securities. Level 2 includes other significant observable inputs (including quoted prices for similar securities, interest rates, prepayment speeds and credit risk). Level 3 includes significant unobservable inputs (including the Fund’s own assumptions in determining the fair value of investments). The level assigned to the securities valuations may not be an indication of the risk or liquidity associated with investing in those securities.
The following is a summary of the inputs used as of June 30, 2019 in valuing the Fund’s investments. For information on the Fund’s policy regarding the valuation of investments, please refer to the Security Valuation section of Note A in the accompanying Notes to Financial Statements.
| Assets | Level 1 | Level 2 | Level 3 | Total | ||||||||||||
| Common Stocks (e) | $ | 91,596,771 | $ | — | $ | — | $ | 91,596,771 | ||||||||
| Rights | 49,571 | — | — | 49,571 | ||||||||||||
| Short-Term Investments (e) | 4,295,785 | — | — | 4,295,785 | ||||||||||||
| Total | $ | 95,942,127 | $ | — | $ | — | $ | 95,942,127 | ||||||||
| (e) | See Investment Portfolio for additional detailed categorizations. |
The accompanying notes are an integral part of the financial statements.
Deutsche DWS Variable Series II — DWS Small Mid Cap Value VIP | | | 7 |
Table of Contents
Statement of Assets and Liabilities
| as of June 30, 2019 (Unaudited) | ||||
| Assets | ||||
| Investments innon-affiliated securities, at value (cost $83,457,128) — including $2,454,280 of securities loaned | $ | 91,646,342 | ||
| Investment in DWS Government & Agency Securities Portfolio (cost $2,531,242)* | 2,531,242 | |||
| Investment in DWS Central Cash Management Government Fund (cost $1,764,543) | 1,764,543 | |||
| Cash | 10,000 | |||
| Receivable for Fund shares sold | 74,100 | |||
| Dividends receivable | 126,369 | |||
| Interest receivable | 3,392 | |||
| Other assets | 1,063 | |||
| Total assets | 96,157,051 | |||
| Liabilities | ||||
| Payable upon return of securities loaned | 2,531,242 | |||
| Payable for Fund shares redeemed | 78,064 | |||
| Accrued management fee | 44,737 | |||
| Accrued Trustees’ fees | 942 | |||
| Other accrued expenses and payables | 62,965 | |||
| Total liabilities | 2,717,950 | |||
| Net assets, at value | $ | 93,439,101 | ||
| Net Assets Consist of | ||||
| Distributable earnings (loss) | 9,996,127 | |||
| Paid-in capital | 83,442,974 | |||
| Net assets, at value | $ | 93,439,101 | ||
| Net Asset Value | ||||
Class A | ||||
| Net Asset Value, offering and redemption price per share ($77,046,485 ÷ 6,005,555 outstanding shares of beneficial interest, no par value, unlimited number of shares authorized) | $ | 12.83 | ||
Class B | ||||
| Net Asset Value, offering and redemption price per share ($16,392,616 ÷ 1,276,409 outstanding shares of beneficial interest, no par value, unlimited number of shares authorized) | $ | 12.84 | ||
| * | Represents collateral on securities loaned. |
| for the six months ended June 30, 2019 |
| |||
| Investment Income | ||||
| Income: | ||||
| Dividends | $ | 1,085,956 | ||
| Income distributions — DWS Cash Management Government Fund | 22,231 | |||
| Securities lending income, net of borrower rebates | 1,903 | |||
| Total income | 1,110,090 | |||
| Expenses: | ||||
| Management fee | 301,367 | |||
| Administration fee | 46,364 | |||
| Services to Shareholders | 1,269 | |||
| Record keeping fee (Class B) | 10,011 | |||
| Distribution service fees (Class B) | 20,528 | |||
| Custodian fee | 3,077 | |||
| Professional fees | 35,476 | |||
| Reports to shareholders | 16,614 | |||
| Trustees’ fees and expenses | 3,620 | |||
| Other | 4,054 | |||
| Total expenses before expense reductions | 442,380 | |||
| Expense reductions | (31,627 | ) | ||
| Total expenses after expense reductions | 410,753 | |||
| Net investment income | 699,337 | |||
| Realized and Unrealized gain (loss) | ||||
| Net realized gain (loss) from investments | 1,240,183 | |||
| Change in net unrealized appreciation (depreciation) on investments | 9,824,602 | |||
| Net gain (loss) | 11,064,785 | |||
| Net increase (decrease) in net assets resulting from operations | $ | 11,764,122 | ||
The accompanying notes are an integral part of the financial statements.
| 8 | | | Deutsche DWS Variable Series II — DWS Small Mid Cap Value VIP |
Table of Contents
Statements of Changes in Net Assets
| Increase (Decrease) in Net Assets | Six Months Ended June 30, 2019 (Unaudited) | Year Ended December 31, 2018 | ||||||
| Operations: | ||||||||
| Net investment income (loss) | $ | 699,337 | $ | 620,637 | ||||
| Net realized gain (loss) | 1,240,183 | 6,571,650 | ||||||
| Change in net unrealized appreciation (depreciation) | 9,824,602 | (23,519,638 | ) | |||||
| Net increase (decrease) in net assets resulting from operations | 11,764,122 | (16,327,351 | ) | |||||
| Distributions to shareholders: | ||||||||
Class A | (6,073,443 | ) | (17,037,935 | ) | ||||
Class B | (1,252,920 | ) | (3,363,724 | ) | ||||
| Total distributions | (7,326,363 | ) | (20,401,659 | ) | ||||
| Fund share transactions: | ||||||||
Class A | ||||||||
| Proceeds from shares sold | 1,949,385 | 4,320,688 | ||||||
| Reinvestment of distributions | 6,073,443 | 17,037,935 | ||||||
| Payments for shares redeemed | (4,720,826 | ) | (16,960,024 | ) | ||||
| Net increase (decrease) in net assets from Class A share transactions | 3,302,002 | 4,398,599 | ||||||
Class B | ||||||||
| Proceeds from shares sold | 908,338 | 2,796,123 | ||||||
| Reinvestment of distributions | 1,252,920 | 3,363,724 | ||||||
| Payments for shares redeemed | (1,755,660 | ) | (3,194,564 | ) | ||||
| Net increase (decrease) in net assets from Class B share transactions | 405,598 | 2,965,283 | ||||||
| Increase (decrease) in net assets | 8,145,359 | (29,365,128 | ) | |||||
| Net assets at beginning of period | 85,293,742 | 114,658,870 | ||||||
| Net assets at end of period | $ | 93,439,101 | $ | 85,293,742 | ||||
| Other Information | ||||||||
Class A | ||||||||
| Shares outstanding at beginning of period | 5,742,711 | 5,375,574 | ||||||
| Shares sold | 148,875 | 286,538 | ||||||
| Shares issued to shareholders in reinvestment of distributions | 468,268 | 1,188,970 | ||||||
| Shares redeemed | (354,299 | ) | (1,108,371 | ) | ||||
| Net increase (decrease) in Class A shares | 262,844 | 367,137 | ||||||
| Shares outstanding at end of period | 6,005,555 | 5,742,711 | ||||||
Class B | ||||||||
| Shares outstanding at beginning of period | 1,243,269 | 1,037,183 | ||||||
| Shares sold | 68,800 | 183,198 | ||||||
| Shares issued to shareholders in reinvestment of distributions | 96,453 | 234,243 | ||||||
| Shares redeemed | (132,113 | ) | (211,355 | ) | ||||
| Net increase (decrease) in Class B shares | 33,140 | 206,086 | ||||||
| Shares outstanding at end of period | 1,276,409 | 1,243,269 | ||||||
The accompanying notes are an integral part of the financial statements.
Deutsche DWS Variable Series II — DWS Small Mid Cap Value VIP | | | 9 |
Table of Contents
| Six Months Ended 6/30/19 | Years Ended December 31, | |||||||||||||||||||||||
| Class A | (Unaudited) | 2018 | 2017 | 2016 | 2015 | 2014 | ||||||||||||||||||
| Selected Per Share Data | ||||||||||||||||||||||||
| Net asset value, beginning of period | $12.21 | $17.88 | $16.65 | $15.97 | $17.79 | $17.08 | ||||||||||||||||||
| Income (loss) from investment operations: | ||||||||||||||||||||||||
Net investment incomea | .10 | .10 | .17 | .15 | .09 | .05 | ||||||||||||||||||
Net realized and unrealized gain (loss) | 1.61 | (2.47 | ) | 1.55 | 2.34 | (.31 | ) | .88 | ||||||||||||||||
Total from investment operations | 1.71 | (2.37 | ) | 1.72 | 2.49 | (.22 | ) | .93 | ||||||||||||||||
| Less distributions from: | ||||||||||||||||||||||||
Net investment income | (.10 | ) | (.24 | ) | (.12 | ) | (.10 | ) | (.05 | ) | (.14 | ) | ||||||||||||
Net realized gains | (.99 | ) | (3.06 | ) | (.37 | ) | (1.71 | ) | (1.55 | ) | (.08 | ) | ||||||||||||
Total distributions | (1.09 | ) | (3.30 | ) | (.49 | ) | (1.81 | ) | (1.60 | ) | (.22 | ) | ||||||||||||
| Net asset value, end of period | $12.83 | $12.21 | $17.88 | $16.65 | $15.97 | $17.79 | ||||||||||||||||||
| Total Return (%) | 13.88 | b** | (16.01 | )b | 10.52 | b | 16.89 | b | (1.91 | ) | 5.53 | |||||||||||||
| Ratios to Average Net Assets and Supplemental Data | ||||||||||||||||||||||||
| Net assets, end of period ($ millions) | 77 | 70 | 96 | 153 | 161 | 205 | ||||||||||||||||||
| Ratio of expenses before expense reductions (%)c | .89 | * | .87 | .83 | .83 | .80 | .82 | |||||||||||||||||
| Ratio of expenses after expense reductions (%)c | .82 | * | .81 | .83 | .82 | .80 | .82 | |||||||||||||||||
| Ratio of net investment income (%) | 1.58 | * | .65 | .98 | .99 | .51 | .32 | |||||||||||||||||
| Portfolio turnover rate (%) | 27 | ** | 64 | 35 | 53 | 25 | 34 | |||||||||||||||||
| a | Based on average shares outstanding during the period. |
| b | Total return would have been lower had certain expenses not been reduced. |
| c | Expense ratio does not reflect charges and fees associated with the separate account that invests in the Fund or any variable life insurance policy or variable annuity contract for which the Fund is an investment option. |
| * | Annualized |
| ** | Not annualized |
| Six Months Ended 6/30/19 | Years Ended December 31, | |||||||||||||||||||||||
| Class B | (Unaudited) | 2018 | 2017 | 2016 | 2015 | 2014 | ||||||||||||||||||
| Selected Per Share Data | ||||||||||||||||||||||||
| Net asset value, beginning of period | $12.20 | $17.86 | $16.63 | $15.95 | $17.77 | $17.07 | ||||||||||||||||||
| Income (loss) from investment operations: | ||||||||||||||||||||||||
Net investment incomea | .08 | .05 | .11 | .09 | .02 | (.01 | ) | |||||||||||||||||
Net realized and unrealized gain (loss) | 1.60 | (2.48 | ) | 1.55 | 2.34 | (.29 | ) | .87 | ||||||||||||||||
Total from investment operations | 1.68 | (2.43 | ) | 1.66 | 2.43 | (.27 | ) | .86 | ||||||||||||||||
| Less distributions from: | ||||||||||||||||||||||||
Net investment income | (.05 | ) | (.17 | ) | (.06 | ) | (.04 | ) | — | (.08 | ) | |||||||||||||
Net realized gains | (.99 | ) | (3.06 | ) | (.37 | ) | (1.71 | ) | (1.55 | ) | (.08 | ) | ||||||||||||
Total distributions | (1.04 | ) | (3.23 | ) | (.43 | ) | (1.75 | ) | (1.55 | ) | (.16 | ) | ||||||||||||
| Net asset value, end of period | $12.84 | $12.20 | $17.86 | $16.63 | $15.95 | $17.77 | ||||||||||||||||||
| Total Return (%) | 13.64 | b** | (16.32 | )b | 10.13 | b | 16.47 | b | (2.21 | ) | 5.09 | |||||||||||||
| Ratios to Average Net Assets and Supplemental Data | ||||||||||||||||||||||||
| Net assets, end of period ($ millions) | 16 | 15 | 19 | 15 | 14 | 17 | ||||||||||||||||||
| Ratio of expenses before expense reductions (%)c | 1.26 | * | 1.24 | 1.19 | 1.19 | 1.16 | 1.17 | |||||||||||||||||
| Ratio of expenses after expense reductions (%)c | 1.18 | * | 1.16 | 1.19 | 1.18 | 1.16 | 1.17 | |||||||||||||||||
| Ratio of net investment income (loss) (%) | 1.21 | * | .30 | .65 | .57 | .14 | (.04 | ) | ||||||||||||||||
| Portfolio turnover rate (%) | 27 | ** | 64 | 35 | 53 | 25 | 34 | |||||||||||||||||
| a | Based on average shares outstanding during the period. |
| b | Total return would have been lower had certain expenses not been reduced. |
| c | Expense ratio does not reflect charges and fees associated with the separate account that invests in the Fund or any variable life insurance policy or variable annuity contract for which the Fund is an investment option. |
| * | Annualized |
| ** | Not annualized |
The accompanying notes are an integral part of the financial statements.
| 10 | | | Deutsche DWS Variable Series II — DWS Small Mid Cap Value VIP |
Table of Contents
| Notes to Financial Statements | (Unaudited) |
A. Organization and Significant Accounting Policies
DWS Small Mid Cap Value VIP (the “Fund”) is a diversified series of Deutsche DWS Variable Series II (the “Trust”), which is registered under the Investment Company Act of 1940, as amended (the “1940 Act”), as anopen-end management investment company organized as a Massachusetts business trust.
Multiple Classes of Shares of Beneficial Interest. The Fund offers two classes of shares (Class A shares and Class B shares). Sales of Class B shares are subject to recordkeeping fees up to 0.15% and Rule12b-1 fees under the 1940 Act equal to an annual rate of 0.25% of the average daily net assets of the Class B shares of the Fund. Class A shares are not subject to such fees.
Investment income, realized and unrealized gains and losses, and certainfund-level expenses and expense reductions, if any, are borne pro rata on the basis of relative net assets by the holders of all classes of shares except that each class bears certain expenses unique to that class (including the applicable Rule12b-1 fee and recordkeeping fees). Differences inclass-level expenses may result in payment of different per share dividends by class. All shares have equal rights with respect to voting subject toclass-specific arrangements.
The Fund’s financial statements are prepared in accordance with accounting principles generally accepted in the United States of America (“U.S. GAAP”) which require the use of management estimates. Actual results could differ from those estimates. The Fund qualifies as an investment company under Topic 946 of Accounting Standards Codification of U.S. GAAP. The policies described below are followed consistently by the Fund in the preparation of its financial statements.
Security Valuation. Investments are stated at value determined as of the close of regular trading on the New York Stock Exchange on each day the exchange is open for trading.
Various inputs are used in determining the value of the Fund’s investments. These inputs are summarized in three broad levels. Level 1 includes quoted prices in active markets for identical securities. Level 2 includes other significant observable inputs (including quoted prices for similar securities, interest rates, prepayment speeds and credit risk). Level 3 includes significant unobservable inputs (including the Fund’s own assumptions in determining the fair value of investments). The level assigned to the securities valuations may not be an indication of the risk or liquidity associated with investing in those securities.
Equity securities are valued at the most recent sale price or official closing price reported on the exchange (U.S. or foreign) orover-the-counter market on which they trade. Securities for which no sales are reported are valued at the calculated mean between the most recent bid and asked quotations on the relevant market or, if a mean cannot be determined, at the most recent bid quotation. Equity securities are generally categorized as Level 1.
Investments inopen-end investment companies are valued at their net asset value each business day and are categorized as Level 1.
Securities and other assets for which market quotations are not readily available or for which the above valuation procedures are deemed not to reflect fair value are valued in a manner that is intended to reflect their fair value as determined in accordance with procedures approved by the Board and are generally categorized as Level 3. In accordance with the Fund’s valuation procedures, factors considered in determining value may include, but are not limited to, the type of the security; the size of the holding; the initial cost of the security; the existence of any contractual restrictions on the security’s disposition; the price and extent of public trading in similar securities of the issuer or of comparable companies; quotations or evaluated prices frombroker-dealers and/or pricing services; information obtained from the issuer, analysts, and/or the appropriate stock exchange (forexchange-traded securities); an analysis of the company’s or issuer’s financial statements; an evaluation of the forces that influence the issuer and the market(s) in which the security is purchased and sold; and with respect to debt securities, the maturity, coupon, creditworthiness, currency denomination and the movement of the market in which the security is normally traded. The value determined under these procedures may differ from published values for the same securities.
Disclosure about the classification of fair value measurements is included in a table following the Fund’s Investment Portfolio.
Foreign Currency Translations. The books and records of the Fund are maintained in U.S. dollars. Investment securities and other assets and liabilities denominated in a foreign currency are translated into U.S. dollars at the prevailing exchange rates at period end. Purchases and sales of investment securities, income and expenses are translated into U.S. dollars at the prevailing exchange rates on the respective dates of the transactions.
Deutsche DWS Variable Series II — DWS Small Mid Cap Value VIP | | | 11 |
Table of Contents
Net realized and unrealized gains and losses on foreign currency transactions represent net gains and losses between trade and settlement dates on securities transactions, the acquisition and disposition of foreign currencies, and the difference between the amount of net investment income accrued and the U.S. dollar amount actually received. The portion of both realized and unrealized gains and losses on investments that results from fluctuations in foreign currency exchange rates is not separately disclosed but is included with net realized and unrealized gain/appreciation and loss/depreciation on investments.
Securities Lending. Brown Brothers Harriman & Co., as lending agent, lends securities of the Fund to certain financial institutions under the terms of its securities lending agreement. During the term of the loans, the Fund continues to receive interest and dividends generated by the securities and to participate in any changes in their market value. The Fund requires the borrowers of the securities to maintain collateral with the Fund consisting of either cash and/or U.S. Treasury Securities having a value at least equal to the value of the securities loaned. When the collateral falls below specified amounts, the lending agent will use its best effort to obtain additional collateral on the next business day to meet required amounts under the securities lending agreement. During the six months ended June 30, 2019, the Fund invested the cash collateral into a joint trading account in DWS Government & Agency Securities Portfolio, an affiliated money market fund managed by DWS Investment Management Americas, Inc. DWS Investment Management Americas Inc. receives a management/administration fee (0.11% annualized effective rate as of June 30, 2019) on the cash collateral invested in DWS Government & Agency Securities Portfolio. The Fund receives compensation for lending its securities either in the form of fees or by earning interest on invested cash collateral net of borrower rebates and fees paid to a lending agent. Either the Fund or the borrower may terminate the loan at any time, and the borrower, after notice, is required to return borrowed securities within a standard time period There may be risks of delay and costs in recovery of securities or even loss of rights in the collateral should the borrower of the securities fail financially. If the Fund is not able to recover securities lent, the Fund may sell the collateral and purchase a replacement investment in the market, incurring the risk that the value of the replacement security is greater than the value of the collateral. The Fund is also subject to all investment risks associated with the reinvestment of any cash collateral received, including, but not limited to, interest rate, credit and liquidity risk associated with such investments.
As of June 30, 2019, the Fund had securities on loan, which were classified as common stock and rights in the Investment Portfolio. The value of the related collateral exceeded the value of the securities loaned at period end.
| Remaining Contractual Maturity of the Agreementsas of June 30, 2019 | ||||||||||||||||||||
| Overnight and Continuous | <30 days | Between 30 & 90 days | >90 days | Total | ||||||||||||||||
| Common Stocks | $ | 2,481,671 | $ | — | $ | — | $ | — | $ | 2,481,671 | ||||||||||
| Rights | 49,571 | — | — | — | 49,571 | |||||||||||||||
| Total Borrowings | $ | 2,531,242 | $ | — | $ | — | $ | — | $ | 2,531,242 | ||||||||||
Gross amount of recognized liabilities for securities lending transactions: |
| $ | 2,531,242 | |||||||||||||||||
Taxes. The Fund’s policy is to comply with the requirements of the Internal Revenue Code, as amended, which are applicable to regulated investment companies and to distribute all of its taxable income to its shareholders.
At June 30, 2019, the aggregate cost of investments for federal income tax purposes was $87,843,109. The net unrealized appreciation for all investments based on tax cost was $8,099,018. This consisted of aggregate gross unrealized appreciation for all investments in which there was an excess of value over tax cost of $14,884,826 aggregate gross unrealized depreciation for all investments in which was an excess of tax cost over value of $6,785,808.
The Fund has reviewed the tax positions for the open tax years as of December 31, 2018 and has determined that no provision for income tax and/or uncertain tax positions is required in the Fund’s financial statements. The Fund’s federal tax returns for the prior three fiscal years remain open subject to examination by the Internal Revenue Service.
Distribution of Income and Gains. Distributions from net investment income of the Fund, if any, are declared and distributed to shareholders annually. Net realized gains from investment transactions, in excess of available capital loss carryforwards, would be taxable to the Fund if not distributed and, therefore, will be distributed to shareholders at least annually. The Fund may also make additional distributions for tax purposes if necessary.
| 12 | | | Deutsche DWS Variable Series II — DWS Small Mid Cap Value VIP |
Table of Contents
The timing and characterization of certain income and capital gain distributions are determined annually in accordance with federal tax regulations which may differ from accounting principles generally accepted in the United States of America. These differences primarily relate to income received from Real Estate Investment Trusts and certain securities sold at a loss. As a result, net investment income (loss) and net realized gain (loss) on investment transactions for a reporting period may differ significantly from distributions during such period. Accordingly, the Fund may periodically make reclassifications among certain of its capital accounts without impacting the net asset value of the Fund.
The tax character of current year distributions will be determined at the end of the current fiscal year.
Expenses. Expenses of the Trust arising in connection with a specific fund are allocated to that fund. Other Trust expenses which cannot be directly attributed to a fund are apportioned among the funds in the Trust based upon the relative net assets or other appropriate measures.
Contingencies. In the normal course of business, the Fund may enter into contracts with service providers that contain general indemnification clauses. The Fund’s maximum exposure under these arrangements is unknown, as this would involve future claims that may be made against the Fund that have not yet been made. However, based on experience, the Fund expects the risk of loss to be remote.
Real Estate Investment Trusts.The Fund at its fiscal year end recharacterizes distributions received from a Real Estate Investment Trust (“REIT”) investment based on information provided by the REIT into the following categories: ordinary income,long-term andshort-term capital gains, and return of capital. If information is not available timely from a REIT, the recharacterization will be estimated for financial reporting purposes and a recharacterization will be made to the accounting records in the following year when such information becomes available. Distributions received from REITs in excess of income are recorded as either a reduction of cost of investments or realized gains.
Other. Investment transactions are accounted for on a trade date plus one basis for daily net asset value calculations. However, for financial reporting purposes, investment transactions are reported on trade date. Interest income is recorded on the accrual basis. Dividend income is recorded on theex-dividend date net of foreign withholding taxes. Realized gains and losses from investment transactions are recorded on an identified cost basis. Proceeds from litigation payments, if any, are included in net realized gain (loss) from investments.
B. Purchases and Sales of Securities
During the six months ended June 30, 2019, purchases and sales of investment transactions (excludingshort-term investments) aggregated $24,577,049 and $26,752,476, respectively.
C. Related Parties
Management Agreement. Under the Investment Management Agreement with DWS Investment Management Americas, Inc. (“DIMA” or the “Advisor”), an indirect, wholly owned subsidiary of DWS Group GmbH & Co. KGaA (“DWS Group”), the Advisor directs the investments of the Fund in accordance with its investment objectives, policies and restrictions. The Advisor determines the securities, instruments and other contracts relating to investments to be purchased, sold or entered into by the Fund.
Pursuant to the Investment Management Agreement with the Advisor, the Fund pays a monthly management fee based on the Fund’s average daily net assets, computed and accrued daily and payable monthly, at the following annual rates:
| First $250 million | .650 | % | ||
| Next $750 million | .620 | % | ||
| Next $1.5 billion | .600 | % | ||
| Next $2.5 billion | .580 | % | ||
| Next $2.5 billion | .550 | % | ||
| Next $2.5 billion | .540 | % | ||
| Next $2.5 billion | .530 | % | ||
| Over $12.5 billion | .520 | % |
Accordingly, for the six months ended June 30 2019, the fee pursuant to the Investment Management Agreement was equivalent to an annualized rate (exclusive of any applicable waivers/reimbursements) of 0.65% of the Fund’s average daily net assets.
Deutsche DWS Variable Series II — DWS Small Mid Cap Value VIP | | | 13 |
Table of Contents
For the period from January 1, 2019 through April 30, 2019, the Advisor had contractually agreed to waive its fees and/or reimburse certain operating expenses to the extent necessary to maintain the total annual operating expenses (excluding certain expenses such as extraordinary expenses, taxes, brokerage and interest expense) of each class as follows:
| Class A | .81 | % | ||
| Class B | 1.16 | % |
Effective May 1, 2019 through April 30, 2020, the Advisor has contractually agreed to waive all or a portion of its fees and/or reimburse certain operating expenses of the Fund to the extent necessary to maintain the total annual operating expenses (excluding certain expenses such as extraordinary expenses, taxes, brokerage and interest) of certain classes as follows:
| Class A | .85 | % | ||
| Class B | 1.21 | % |
For the six months ended June 30, 2019, fees waived and/or expenses reimbursed for each class were as follows:
| Class A | $ | 24,630 | ||
| Class B | 6,997 | |||
| $ | 31,627 |
Administration Fee. Pursuant to an Administrative Services Agreement, DIMA provides most administrative services to the Fund. For all services provided under the Administrative Services Agreement, the Fund pays DIMA an annual fee (“Administration Fee”) of 0.10% of the Fund’s average daily net assets, computed and accrued daily and payable monthly. For the six months ended June 30 2019, the Administration Fee was $46,364, of which $7,541 is unpaid.
Service Provider Fees. DWS Service Company (“DSC”), an affiliate of the Advisor, is the transfer agent,dividend-paying agent and shareholder service agent for the Fund. Pursuant to asub-transfer agency agreement between DSC and DST Systems, Inc. (“DST”), DSC has delegated certain transfer agent,dividend-paying agent and shareholder service agent functions to DST. DSC compensates DST out of the shareholder servicing fee it receives from the Fund. For the six months ended June 30 2019, the amounts charged to the Fund by DSC were as follows:
| Service to Shareholders | Total Aggregated | Unpaid at June 30, 2019 | ||||||
| Class A | $ | 315 | $ | 93 | ||||
| Class B | 230 | 75 | ||||||
| $ | 545 | $ | 168 | |||||
Distribution Service Agreement. Under the Fund’s Class B12b-1 plan, DWS Distributors, Inc. (“DDI”) received a fee (“Distribution Service Fee”) of 0.25% of average daily net assets of Class B shares. For the six months ended June 30 2019, the Distribution Service Fee aggregated $20,528, of which $3,308 is unpaid.
Typesetting and Filing Service Fees. Under an agreement with the Fund, DIMA is compensated for providing certainpre-press and regulatory filing services to the Fund. For the six months ended June 30 2019, the amount charged to the Fund by DIMA included in the Statement of Operations under “Reports to shareholders” aggregated $4,767, of which $4,388 is unpaid.
Trustees’ Fees and Expenses. The Fund paid retainer fees to each Trustee not affiliated with the Advisor, plus specified amounts to the Board Chairperson and to each committee Chairperson.
Affiliated Cash Management Vehicles. The Fund may invest uninvested cash balances in DWS Central Cash Management Government Fund and DWS ESG Liquidity Fund, affiliated money market funds which are managed by the Advisor. Each affiliated money market fund is managed in accordance withRule 2a-7 under the 1940 Act, which governs the quality, maturity, diversity and liquidity of instruments in which a money market fund may invest. DWS Central Cash Management Government Fund seeks to maintain a stable net asset value, and DWS ESG Liquidity Fund maintains a floating net asset value. The Fund indirectly bears its proportionate share of the expenses of each affiliated money market fund in which it invests. DWS Central Cash Management Government Fund does not pay the Advisor an investment management fee. To the extent that DWS ESG Liquidity Fund pays an investment management fee to the Advisor, the Advisor will
| 14 | | | Deutsche DWS Variable Series II — DWS Small Mid Cap Value VIP |
Table of Contents
waive an amount of the investment management fee payable to the Advisor by the Fund equal to the amount of the investment management fee payable on the Fund’s assets invested in DWS ESG Liquidity Fund.
D. Ownership of the Fund
At June 30, 2019, one participating insurance company was owner of record of 10% or more of the total outstanding Class A shares of the Fund, owning 70%. Four participating insurance companies were owners of record of 10% or more of the total outstanding Class B shares of the Fund, each owning 32%, 20%, 18% and 13%.
E. Line of Credit
The Fund and other affiliated funds (the “Participants”) share in a $400 million revolving credit facility provided by a syndication of banks. The Fund may borrow for temporary or emergency purposes, including the meeting of redemption requests that otherwise might require the untimely disposition of securities. The Participants are charged an annual commitment fee which is allocated based on net assets, among each of the Participants. Interest is calculated at a rate per annum equal to the sum of the Federal Funds Rate plus 1.25 percent plus if theone-month LIBOR exceeds the Federal Funds Rate, the amount of such excess. The Fund may borrow up to a maximum of 33 percent of its net assets under the agreement. The Fund had no outstanding loans at June 30, 2019.
Deutsche DWS Variable Series II — DWS Small Mid Cap Value VIP | | | 15 |
Table of Contents
| Information About Your Fund’s Expenses | (Unaudited) |
As an investor of the Fund, you incur two types of costs: ongoing expenses and transaction costs. Ongoing expenses include management fees, distribution and service(12b-1) fees and other Fund expenses. Examples of transaction costs include contract charges, which are not shown in this section. The following tables are intended to help you understand your ongoing expenses (in dollars) of investing in the Fund and to help you compare these expenses with the ongoing expenses of investing in other mutual funds. In the most recent six-month period, the Fund limited these expenses; had it not done so, expenses would have been higher. The example in the table is based on an investment of $1,000 invested at the beginning of thesix-month period and held for the entire period (January 1, 2019 to June 30, 2019).
The tables illustrate your Fund’s expenses in two ways:
| – | Actual Fund Return. This helps you estimate the actual dollar amount of ongoing expenses (but not transaction costs) paid on a $1,000 investment in the Fund using the Fund’s actual return during the period. To estimate the expenses you paid over the period, simply divide your account value by $1,000 (for example, an $8,600 account value divided by $1,000 = 8.6), then multiply the result by the number in the “Expenses Paid per $1,000” line under the share class you hold. |
| – | Hypothetical 5% Fund Return.This helps you to compare your Fund’s ongoing expenses (but not transaction costs) with those of other mutual funds using the Fund’s actual expense ratio and a hypothetical rate of return of 5% per year before expenses. Examples using a 5% hypothetical Fund return may be found in the shareholder reports of other mutual funds. The hypothetical account values and expenses may not be used to estimate the actual ending account balance or expenses you paid for the period. |
Please note that the expenses shown in these tables are meant to highlight your ongoing expenses only and do not reflect any transaction costs. The “Expenses Paid per $1,000” line of the tables is useful in comparing ongoing expenses only and will not help you determine the relative total expense of owning different funds. If these transaction costs had been included, your costs would have been higher.
| Expenses and Value of a $1,000 Investment for the six months ended June 30, 2019 | ||||||||
| Actual Fund Return | Class A | Class B | ||||||
| Beginning Account Value 1/1/19 | $ | 1,000.00 | $ | 1,000.00 | ||||
| Ending Account Value 6/30/19 | $ | 1,138.80 | $ | 1,136.40 | ||||
| Expenses Paid per $1,000* | $ | 4.35 | $ | 6.25 | ||||
| Hypothetical 5% Fund Return | Class A | Class B | ||||||
| Beginning Account Value 1/1/19 | $ | 1,000.00 | $ | 1,000.00 | ||||
| Ending Account Value 6/30/19 | $ | 1,020.73 | $ | 1,018.94 | ||||
| Expenses Paid per $1,000* | $ | 4.11 | $ | 5.91 | ||||
| * | Expenses are equal to the Fund’s annualized expense ratio for each share class, multiplied by the average account value over the period, multiplied by 181 (the number of days in the most recentsix-month period), then divided by 365. |
| Annualized Expense Ratios | Class A | Class B | ||||||
| Deutsche DWS Variable Series II — DWS Small Mid Cap Value VIP | .82 | % | 1.18 | % | ||||
For more information, please refer to the Fund’s prospectus.
These tables do not reflect charges and fees (“contract charges”) associated with the separate account that invests in the Fund or any variable life insurance policy or variable annuity contract for which the Fund is an investment option.
For an analysis of the fees associated with an investment in the Fund or similar funds, please refer to the current and hypothetical expense calculators for Variable Insurance Products which can be found at dws.com/calculators.
| 16 | | | Deutsche DWS Variable Series II — DWS Small Mid Cap Value VIP |
Table of Contents
| (Unaudited) |
The Trust’s policies and procedures for voting proxies for portfolio securities and information about how the Trust voted proxies related to its portfolio securities during the most recent12-month period ended June 30 are available on our Web site — dws.com/en-us/resources/proxy-voting — or on the SEC’s Web site — sec.gov. To obtain a written copy of the Trust’s policies and procedures without charge, upon request, call us toll free at (800)728-3337.
Deutsche DWS Variable Series II — DWS Small Mid Cap Value VIP | | | 17 |
Table of Contents
Advisory Agreement Board Considerations and Fee Evaluation
The Board of Trustees (hereinafter referred to as the “Board” or “Trustees”) approved the renewal of DWS Small Mid Cap Value VIP’s (the “Fund”) investment management agreement (the “Agreement”) with DWS Investment Management Americas, Inc. (“DIMA”) in September 2018.
In terms of the process that the Board followed prior to approving the Agreement, shareholders should know that:
| – | During the entire process, all of the Fund’s Trustees were independent of DIMA and its affiliates (the “Independent Trustees”). |
| – | The Board met frequently during the past year to discuss fund matters and dedicated a substantial amount of time to contract review matters. Over the course of several months, the Board’s Contract Committee reviewed extensive materials received from DIMA, independent third parties and independent counsel. These materials included an analysis of the Fund’s performance, fees and expenses, and profitability from a fee consultant retained by the Fund’s Independent Trustees (the “Fee Consultant”). Based on its evaluation of the information provided, the Contract Committee presented its findings and recommendations to the Board. The Board then reviewed the Contract Committee’s findings and recommendations. |
| – | The Board also received extensive information throughout the year regarding performance of the Fund. |
| – | The Independent Trustees regularly met privately with counsel to discuss contract review and other matters. In addition, the Independent Trustees were advised by the Fee Consultant in the course of their review of the Fund’s contractual arrangements and considered a comprehensive report prepared by the Fee Consultant in connection with their deliberations. |
| – | In connection with reviewing the Agreement, the Board also reviewed the terms of the Fund’s Rule12b-1 plan, distribution agreement, administrative services agreement, transfer agency agreement and other material service agreements. |
In connection with the contract review process, the Contract Committee and the Board considered the factors discussed below, among others. The Board also considered that DIMA and its predecessors have managed the Fund since its inception, and the Board believes that a long-term relationship with a capable, conscientious advisor is in the best interests of the Fund. The Board considered, generally, that shareholders chose to invest or remain invested in the Fund knowing that DIMA managed the Fund. DIMA is part of DWS Group GmbH & Co. KGaA (“DWS Group”). DWS Group is a global asset management business that offers a wide range of investing expertise and resources, including research capabilities in many countries throughout the world. In 2018, approximately 20% of DWS Group’s shares were sold in an initial public offering, with Deutsche Bank AG owning the remaining shares.
As part of the contract review process, the Board carefully considered the fees and expenses of each DWS fund overseen by the Board in light of the fund’s performance. In many cases, this led to the negotiation and implementation of expense caps. As part of these negotiations, the Board indicated that it would consider relaxing these caps in future years following sustained improvements in performance, among other considerations.
While shareholders may focus primarily on fund performance and fees, the Fund’s Board considers these and many other factors, including the quality and integrity of DIMA’s personnel and administrative support services provided by DIMA, such as back-office operations, fund valuations, and compliance policies and procedures.
Nature, Quality and Extent of Services.The Board considered the terms of the Agreement, including the scope of advisory services provided under the Agreement. The Board noted that, under the Agreement, DIMA provides portfolio management services to the Fund and that, pursuant to a separate administrative services agreement, DIMA provides administrative services to the Fund. The Board considered the experience and skills of senior management and investment personnel and the resources made available to such personnel. The Board reviewed the Fund’s performance over short-term and long-term periods and compared those returns to various agreed-upon performance measures, including market index(es) and a peer universe compiled using information supplied by Morningstar Direct (“Morningstar”), an independent fund data service. The Board also noted that it has put into place a process of identifying “Funds in Review” (e.g., funds performing poorly relative to a peer universe), and receives additional reporting from DIMA regarding such funds and, where appropriate, DIMA’s plans to address underperformance. The Board
| 18 | | | Deutsche DWS Variable Series II — DWS Small Mid Cap Value VIP |
Table of Contents
believes this process is an effective manner of identifying and addressing underperforming funds. Based on the information provided, the Board noted that, for theone-, three- and five-year periods ended December 31, 2017, the Fund’s performance (Class A shares) was in the 4th quartile, 3rd quartile and 3rd quartile, respectively, of the applicable Morningstar universe (the 1st quartile being the best performers and the 4th quartile being the worst performers). The Board also observed that the Fund has outperformed its benchmark in theone-year period and has underperformed its benchmark in the three- and five-year periods ended December 31, 2017. The Board noted the disappointing investment performance of the Fund in recent periods and continued to discuss with senior management of DIMA the factors contributing to such underperformance and actions being taken to improve performance. The Board observed that the Fund had experienced improved relative performance during the first eight months of 2018. The Board recognized the efforts by DIMA in recent years to enhance its investment platform and improve long-term performance across the DWS fund complex.
Fees and Expenses. The Board considered the Fund’s investment management fee schedule, operating expenses and total expense ratios, and comparative information provided by Broadridge Financial Solutions, Inc. (“Broadridge”) and the Fee Consultant regarding investment management fee rates paid to other investment advisors by similar funds (1st quartile being the most favorable and 4th quartile being the least favorable). With respect to management fees paid to other investment advisors by similar funds, the Board noted that the contractual fee rates paid by the Fund, which include a 0.10% fee paid to DIMA under the Fund’s administrative services agreement, were lower than the median (1st quartile) of the applicable Broadridge peer group (based on Broadridge data provided as of December 31, 2017). The Board noted that the Fund’s Class A shares total (net) operating expenses were expected to be higher than the median (3rd quartile) of the applicable Broadridge expense universe (based on Broadridge data provided as of December 31, 2017, and analyzing Broadridge expense universe Class A (net) expenses less any applicable12b-1 fees) (“Broadridge Universe Expenses”). The Board also reviewed data comparing each share class’s total (net) operating expenses to the applicable Broadridge Universe Expenses. The Board noted that the expense limitations agreed to by DIMA were expected to help the Fund’s total (net) operating expenses remain competitive. The Board considered the Fund’s management fee rate as compared to fees charged by DIMA to a comparable DWS U.S. registered fund (“DWS Funds”) and considered differences between the Fund and the comparable DWS Fund. The information requested by the Board as part of its review of fees and expenses also included information about institutional accounts (including anysub-advised funds and accounts) and funds offered primarily to European investors (“DWS Europe Funds”) managed by DWS Group. The Board noted that DIMA indicated that DWS Group does not manage any institutional accounts or DWS Europe Funds comparable to the Fund.
On the basis of the information provided, the Board concluded that management fees were reasonable and appropriate in light of the nature, quality and extent of services provided by DIMA.
Profitability. The Board reviewed detailed information regarding revenues received by DIMA under the Agreement. The Board considered the estimated costs to DIMA, andpre-tax profits realized by DIMA, from advising the DWS Funds, as well as estimates of thepre-tax profits attributable to managing the Fund in particular. The Board also received information regarding the estimated enterprise-wide profitability of DIMA and its affiliates with respect to all fund services in totality and by fund. The Board and the Fee Consultant reviewed DIMA’s methodology in allocating its costs to the management of the Fund. Based on the information provided, the Board concluded that thepre-tax profits realized by DIMA in connection with the management of the Fund were not unreasonable. The Board also reviewed certain publicly available information regarding the profitability of certain similar investment management firms. The Board noted that, while information regarding the profitability of such firms is limited (and in some cases is not necessarily prepared on a comparable basis), DIMA and its affiliates’ overall profitability with respect to the DWS Funds (after taking into account distribution and other services provided to the funds by DIMA and its affiliates) was lower than the overall profitability levels of most comparable firms for which such data was available.
Economies of Scale. The Board considered whether there are economies of scale with respect to the management of the Fund and whether the Fund benefits from any economies of scale. The Board noted that the Fund’s investment management fee schedule includes fee breakpoints. The Board concluded that the Fund’s fee schedule represents an appropriate sharing between the Fund and DIMA of such economies of scale as may exist in the management of the Fund at current asset levels.
Other Benefits to DIMA and Its Affiliates. The Board also considered the character and amount of other incidental or“fall-out” benefits received by DIMA and its affiliates, including any fees received by DIMA for administrative services provided to the Fund, any fees received by an affiliate of DIMA for transfer agency
Deutsche DWS Variable Series II — DWS Small Mid Cap Value VIP | | | 19 |
Table of Contents
services provided to the Fund and any fees received by an affiliate of DIMA for distribution services. The Board also considered benefits to DIMA related to brokerage and soft-dollar allocations, including allocating brokerage to pay for research generated by parties other than the executing broker dealers, which pertain primarily to funds investing in equity securities. In addition, the Board considered the incidental public relations benefits to DIMA related to DWS Funds advertising and cross-selling opportunities among DIMA products and services. The Board considered these benefits in reaching its conclusion that the Fund’s management fees were reasonable.
Compliance. The Board considered the significant attention and resources dedicated by DIMA to its compliance processes in recent years. The Board noted in particular (i) the experience, seniority and time commitment of the individuals serving as DIMA’s and the Fund’s chief compliance officers and (ii) the substantial commitment of resources by DIMA and its affiliates to compliance matters, including the retention of compliance personnel.
Based on all of the information considered and the conclusions reached, the Board unanimously determined that the continuation of the Agreement is in the best interests of the Fund. In making this determination, the Board did not give particular weight to any single factor identified above. The Board considered these factors over the course of numerous meetings, certain of which were in executive session with only the Independent Trustees and counsel present. It is possible that individual Independent Trustees may have weighed these factors differently in reaching their individual decisions to approve the continuation of the Agreement.
| 20 | | | Deutsche DWS Variable Series II — DWS Small Mid Cap Value VIP |
Table of Contents
Notes
Table of Contents
Notes
Table of Contents
Notes
Table of Contents
| ||
VS2SMCV-3 (R-028381-8 8/19) |
| ||
ITEM 2. | CODE OF ETHICS | |
| Not applicable. | ||
| ITEM 3. | AUDIT COMMITTEE FINANCIAL EXPERT | |
| Not applicable | ||
| ITEM 4. | PRINCIPAL ACCOUNTANT FEES AND SERVICES | |
| Not applicable | ||
| ITEM 5. | AUDIT COMMITTEE OF LISTED REGISTRANTS | |
| Not applicable | ||
| ITEM 6. | SCHEDULE OF INVESTMENTS | |
| Not applicable | ||
| ITEM 7. | DISCLOSURE OF PROXY VOTING POLICIES AND PROCEDURES FOR CLOSED-END MANAGEMENT INVESTMENT COMPANIES | |
| Not applicable | ||
| ITEM 8. | PORTFOLIO MANAGERS OF CLOSED-END MANAGEMENT INVESTMENT COMPANIES | |
| Not applicable | ||
| ITEM 9. | PURCHASES OF EQUITY SECURITIES BY CLOSED-END MANAGEMENT INVESTMENT COMPANY AND AFFILIATED PURCHASERS | |
| Not applicable | ||
| ITEM 10. | SUBMISSION OF MATTERS TO A VOTE OF SECURITY HOLDERS | |
| There were no material changes to the procedures by which shareholders may recommend nominees to the Fund’s Board. The primary function of the Nominating and Governance Committee is to identify and recommend individuals for membership on the Board and oversee the administration of the Board Governance Guidelines. Shareholders may recommend candidates for Board positions by forwarding their correspondence by U.S. mail or courier service to Keith R. Fox, DWS Funds Board Chair, c/o Thomas R. Hiller, Ropes & Gray LLP, Prudential Tower, 800 Boylston Street, Boston, MA 02199-3600. | ||
| ITEM 11. | CONTROLS AND PROCEDURES | |
| (a) | The Chief Executive and Financial Officers concluded that the Registrant’s Disclosure Controls and Procedures are effective based on the evaluation of the Disclosure Controls and Procedures as of a date within six months of the filing date of this report. | |
| (b) | There have been no changes in the registrant’s internal control over financial reporting that occurred during the six-month period covered by this report that has materially affected, or is reasonably likely to materially affect, the registrant’s internal controls over financial reporting. | |
| ITEM 12. | Disclosure of Securities Lending Activities for Closed-End Management Investment Companies. | |
| Not applicable | ||
| ITEM 13. | EXHIBITS | |
| (a)(1) | Not applicable | |
| (a)(2) | Certification pursuant to Rule 30a-2(a) under the Investment Company Act of 1940 (17 CFR 270.30a-2(a)) is filed and attached hereto as Exhibit 99.CERT. | |
| (b) | Certification pursuant to Rule 30a-2(b) under the Investment Company Act of 1940 (17 CFR 270.30a-2(b)) is furnished and attached hereto as Exhibit 99.906CERT. | |
SIGNATURES
Pursuant to the requirements of the Securities Exchange Act of 1934 and the Investment Company Act of 1940, the registrant has duly caused this report to be signed on its behalf by the undersigned, thereunto duly authorized.
| Registrant: | Deutsche DWS Variable Series II |
| By: | /s/Hepsen Uzcan Hepsen Uzcan President |
| Date: | 8/21/2019 |
Pursuant to the requirements of the Securities Exchange Act of 1934 and the Investment Company Act of 1940, this report has been signed below by the following persons on behalf of the registrant and in the capacities and on the dates indicated.
| By: | /s/Hepsen Uzcan Hepsen Uzcan President |
| Date: | 8/21/2019 |
| By: | /s/Diane Kenneally Diane Kenneally Chief Financial Officer and Treasurer |
| Date: | 8/21/2019 |