UNITED STATES
SECURITIES AND EXCHANGE COMMISSION
WASHINGTON, D. C. 20549
FORM N-CSRS
Investment Company Act file number: 811-05002
Deutsche Variable Series II
(Exact Name of Registrant as Specified in Charter)
345 Park Avenue
New York, NY 10154-0004
(Address of Principal Executive Offices) (Zip Code)
Registrant’s Telephone Number, including Area Code: (212) 250-3220
Paul Schubert
345 Park Avenue
New York, NY 10154-0004
(Name and Address of Agent for Service)
| Date of fiscal year end: | 12/31 |
| Date of reporting period: | 6/30/2017 |
| ITEM 1. | REPORT TO STOCKHOLDERS |

June 30, 2017
Semiannual Report
Deutsche Variable Series II
Deutsche Alternative Asset Allocation VIP

Contents
3 Performance Summary 5 Portfolio Summary 5 Portfolio Management Team 6 Investment Portfolio 7 Statement of Assets and Liabilities 8 Statement of Operations 8 Statements of Changes in Net Assets 10 Financial Highlights 12 Notes to Financial Statements 16 Information About Your Fund's Expenses 17 Proxy Voting 18 Advisory Agreement Board Considerations and Fee Evaluation |
This report must be preceded or accompanied by a prospectus. To obtain an additional prospectus or summary prospectus, if available, call (800) 728-3337 or your financial representative. We advise you to consider the Fund's objectives, risks, charges and expenses carefully before investing. The summary prospectus and prospectus contain this and other important information about the Fund. Please read the prospectus carefully before you invest.
Although allocation among different asset categories generally limits risk, portfolio management may favor an asset category that underperforms other assets or markets as a whole. The Fund expects to invest in underlying funds that emphasize alternatives or non-traditional asset categories or investment strategies, and as a result, it is subject to the risk factors of those underlying funds. Some of those risks include: stock market risk; the political, general economic, liquidity and currency risks of foreign investments, which may be particularly significant for emerging markets; credit and interest rate risk; floating rate loan risk; volatility in commodity prices, infrastructure and high-yield debt securities; market direction risk (market advances when short, market declines when long); and short sales risk. Because Exchange Traded Funds (ETFs) trade on a securities exchange, their shares may trade at a premium or discount to their net asset value. ETFs also incur fees and expenses so they may not fully match the performance of the indexes they are designed to track. The Fund may use derivatives, including as part of its currency and interest-rate strategies. Investing in derivatives entails special risks relating to liquidity, leverage and credit that may reduce returns and/or increase volatility. The success of the Fund’s currency and interest-rate strategies are dependent, in part, on the effectiveness and implementation of portfolio management’s proprietary models. As part of these strategies, the Fund’s exposure to foreign currencies could cause lower returns or even losses because foreign currency rates may fluctuate significantly over short periods of time for a number of reasons. The risk of loss is heightened during periods of rapid rises in interest rates. In addition, the notional amount of the Fund’s aggregate currency and interest-rate exposure resulting from these strategies may significantly exceed the net assets of the Fund. See the prospectus for additional risks and specific details regarding the Fund's risk profile.
Deutsche Asset Management represents the asset management activities conducted by Deutsche Bank AG or any of its subsidiaries.
Deutsche AM Distributors, Inc., 222 South Riverside Plaza, Chicago, IL 60606, (800) 621-1148
NOT FDIC/NCUA INSURED NO BANK GUARANTEE MAY LOSE VALUE NOT A DEPOSIT
NOT INSURED BY ANY FEDERAL GOVERNMENT AGENCY
Performance Summary June 30, 2017 (Unaudited)
Fund performance shown is historical, assumes reinvestment of all dividend and capital gain distributions and does not guarantee future results. Investment return and principal value fluctuate with changing market conditions so that, when redeemed, shares may be worth more or less than their original cost. Current performance may be lower or higher than the performance data quoted. Please contact your participating insurance company for the Fund's most recent month-end performance. Performance doesn't reflect charges and fees ("contract charges") associated with the separate account that invests in the Fund or any variable life insurance policy or variable annuity contract for which the Fund is an investment option. These charges and fees will reduce returns. While all share classes have the same underlying portfolio, their performance will differ.
The gross expense ratios of the Fund, as stated in the fee table of the prospectus dated May 1, 2017 are 1.64% and 1.93% for Class A and Class B shares, respectively, and may differ from the expense ratios disclosed in the Financial Highlights tables in this report. These expense ratios include net expenses of the underlying funds in which the Fund invests.
Generally accepted accounting principles require adjustments to be made to the net assets of the Fund at period end for financial reporting purposes only, and as such, the total return based on the unadjusted net asset value per share may differ from the total return reported in the financial highlights.
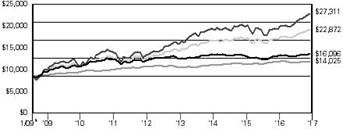
| Growth of an Assumed $10,000 Investment in Deutsche Alternative Asset Allocation VIP from 2/2/09 to 6/30/17 | ||
■ Deutsche Alternative Asset Allocation VIP — Class A ■ MSCI World Index ■ Bloomberg Barclays U.S. Aggregate Bond Index ■ Blended Index |
| The Morgan Stanley Capital International (MSCI) World Index captures large and mid cap representation across 23 Developed Market countries. The Bloomberg Barclays U.S. Aggregate Bond Index is an unmanaged index representing domestic taxable investment-grade bonds, with index components for government and corporate securities, mortgage pass-through securities, and asset-backed securities with an average maturity of one year or more. The Blended Index is calculated using the performance of two unmanaged indices, representative of stocks (the MSCI World Index (70%)) and bonds (the Bloomberg Barclays U.S. Aggregate Bond Index (30%)). These results are summed to produce the aggregate benchmark. Index returns do not reflect any fees or expenses and it is not possible to invest directly into an index. |
 | ||
| Yearly periods ended June 30 | ||
| Comparative Results | ||||||
| Deutsche Alternative Asset Allocation VIP | 6-Month‡ | 1-Year | 3-Year | 5-Year | Life of Fund* | |
| Class A | Growth of $10,000 | $10,315 | $10,213 | $9,942 | $11,222 | $16,096 |
| Average annual total return | 3.15% | 2.13% | –0.20% | 2.33% | 5.82% | |
| MSCI World Index | Growth of $10,000 | $1,166 | $11,820 | $11,655 | $17,144 | $27,311 |
| Average annual total return | 10.66% | 18.20% | 5.24% | 11.38% | 12.68% | |
| Bloomberg Barclays U.S. Aggregate Bond Index | Growth of $10,000 | $10,227 | $9,969 | $10,763 | $11,157 | $14,025 |
| Average annual total return | 2.27% | –0.31% | 2.48% | 2.21% | 4.10% | |
| Blended Index | Growth of $10,000 | $10,809 | $11,236 | $11,423 | $15,167 | $22,872 |
| Average annual total return | 8.09% | 12.36% | 4.53% | 8.69% | 10.33% | |
The growth of $10,000 is cumulative.
* The Fund commenced offering Class A shares on February 2, 2009. The performance shown for each index is for the time period of January 31, 2009 through June 30, 2017, which is based on the performance period of the life of the Fund.
‡ Total returns shown for periods less than one year are not annualized.
| Deutsche Alternative Asset Allocation VIP | 6-Month‡ | 1-Year | 3-Year | 5-Year | Life of Class** | |
| Class B | Growth of $10,000 | $10,299 | $10,181 | $9,857 | $11,070 | $14,489 |
| Average annual total return | 2.99% | 1.81% | –0.48% | 2.05% | 4.67% | |
| MSCI World Index | Growth of $10,000 | $11,066 | $11,820 | $11,655 | $17,144 | $23,325 |
| Average annual total return | 10.66% | 18.20% | 5.24% | 11.38% | 11.04% | |
| Bloomberg Barclays U.S. Aggregate Bond Index | Growth of $10,000 | $10,227 | $9,969 | $10,763 | $11,157 | $13,719 |
| Average annual total return | 2.27% | –0.31% | 2.48% | 2.21% | 3.99% | |
| Blended Index | Growth of $10,000 | $10,809 | $11,236 | $11,423 | $15,167 | $20,277 |
| Average annual total return | 8.09% | 12.36% | 4.53% | 8.69% | 9.14% | |
The growth of $10,000 is cumulative.
** The Fund commenced offering Class B shares on May 18, 2009. The performance shown for each index is for the time period of May 31, 2009 through June 30, 2017, which is based on the performance period of the life of Class B.
‡ Total returns shown for periods less than one year are not annualized.
Portfolio Summary (Unaudited)
| Asset Allocation* (As a % of Investment Portfolio excluding Cash Equivalents) | 6/30/17 | 12/31/16 |
| Real Asset | 36% | 34% |
| Deutsche Enhanced Commodity Strategy Fund | 15% | 17% |
| Deutsche Global Infrastructure Fund | 14% | 11% |
| Deutsche Real Estate Securities Fund | 6% | 6% |
| Deutsche Global Real Estate Securities Fund | 1% | 0% |
| Fixed Income — Nontraditional | 36% | 39% |
| Deutsche Enhanced Emerging Markets Fixed Income Fund | 15% | 18% |
| SPDR Bloomberg Barclays Convertible Securities ETF | 11% | 12% |
| VanEck Vectors JPMorgan EM Local Currency Bond ETF | 8% | 7% |
| WisdomTree Emerging Markets Local Debt ETF | 2% | 2% |
| Fixed Income — Real-Return | 28% | 27% |
| Deutsche Global Inflation Fund | 17% | 16% |
| Deutsche Floating Rate Fund | 11% | 11% |
| 100% | 100% | |
* During the periods indicated, asset categories and investment strategies represented in the fund's portfolio fell into the following general themes; Real Asset, Fixed Income – Nontraditional and Fixed Income – Real Return. Real asset investments have a tangible or physical aspect such as real estate or commodities. Fixed income – nontraditional investments seek to provide diversification but may not be held in traditional portfolios. Fixed income – real return investments seek to provide a measure of inflation protection.
Portfolio holdings and characteristics are subject to change.
For more complete details about the Fund's investment portfolio, see page 6.
Following the Fund's fiscal first and third quarter-end, a complete portfolio holdings listing is filed with the SEC on Form N-Q. The form will be available on the SEC's Web site at sec.gov, and it also may be reviewed and copied at the SEC's Public Reference Room in Washington, D.C. Information on the operation of the SEC's Public Reference Room may be obtained by calling (800) SEC-0330. The Fund's portfolio holdings are also posted on deutschefunds.com from time to time. Please see the Fund's current prospectus for more information.
Portfolio Management Team
Pankaj Bhatnagar, PhD, Managing Director
Darwei Kung, Managing Director
Portfolio Managers
Investment Portfolio June 30, 2017 (Unaudited)
Shares | Value ($) | |
| Mutual Funds 70.1% | ||
| Deutsche Enhanced Commodity Strategy Fund "Institutional" (a) | 1,928,114 | 21,305,660 |
| Deutsche Enhanced Emerging Markets Fixed Income Fund "Institutional" (a) | 2,198,381 | 20,884,621 |
| Deutsche Floating Rate Fund "Institutional" (a) | 1,828,581 | 15,232,082 |
| Deutsche Global Inflation Fund "Institutional"* (a) | 2,350,900 | 23,814,613 |
| Deutsche Global Infrastructure Fund "Institutional" (a) | 1,374,922 | 20,142,602 |
| Deutsche Global Real Estate Securities Fund "Institutional" (a) | 163,411 | 1,470,698 |
| Deutsche Real Estate Securities Fund "Institutional" (a) | 450,557 | 9,249,939 |
| Total Mutual Funds (Cost $115,172,647) | 112,100,215 | |
Shares | Value ($) | |
| Fixed Income — Exchange-Traded Funds 18.7% | ||
| SPDR Bloomberg Barclays Convertible Securities | 317,392 | 15,748,991 |
| VanEck Vectors JPMorgan EM Local Currency Bond | 581,098 | 10,976,941 |
| WisdomTree Emerging Markets Local Debt | 85,632 | 3,248,022 |
| Total Fixed Income — Exchange-Traded Funds (Cost $28,108,876) | 29,973,954 | |
| Cash Equivalents 11.3% | ||
| Deutsche Central Cash Management Government Fund, 1.03% (a) (b) (Cost $18,141,511) | 18,141,511 | 18,141,511 |
| % of Net Assets | Value ($) | |
| Total Investment Portfolio (Cost $161,423,034)† | 100.1 | 160,215,680 |
| Other Assets and Liabilities, Net | (0.1) | (183,213) |
| Net Assets | 100.0 | 160,032,467 |
* Non-income producing security.
† The cost for federal income tax purposes was $163,222,458. At June 30, 2017, net unrealized depreciation for all securities based on tax cost was $3,006,778. This consisted of aggregate gross unrealized appreciation for all securities in which there was an excess of value over tax cost of $6,278,736 and aggregate gross unrealized depreciation for all securities in which there was an excess of tax cost over value of $9,285,514.
(a) Affiliated fund managed by Deutsche Investment Management Americas Inc.
(b) The rate shown is the annualized seven-day yield at period end.
EM: Emerging Markets
SPDR: Standard & Poor's Depositary Receipt
Fair Value Measurements
Various inputs are used in determining the value of the Fund's investments. These inputs are summarized in three broad levels. Level 1 includes quoted prices in active markets for identical securities. Level 2 includes other significant observable inputs (including quoted prices for similar securities, interest rates, prepayment speeds and credit risk). Level 3 includes significant unobservable inputs (including the Fund's own assumptions in determining the fair value of investments). The level assigned to the securities valuations may not be an indication of the risk or liquidity associated with investing in those securities.
The following is a summary of the inputs used as of June 30, 2017 in valuing the Fund's investments. For information on the Fund's policy regarding the valuation of investments, please refer to the Security Valuation section of Note A in the accompanying Notes to Financial Statements.
| Assets | Level 1 | Level 2 | Level 3 | Total |
| Mutual Funds | $ 112,100,215 | $ — | $ — | $ 112,100,215 |
| Exchange-Traded Fund | 29,973,954 | — | — | 29,973,954 |
| Short-Term Investment | 18,141,511 | — | — | 18,141,511 |
| Total | $ 160,215,680 | $ — | $ — | $ 160,215,680 |
There have been no transfers between fair value measurement levels during the period ended June 30, 2017.
The accompanying notes are an integral part of the financial statements.
Statement of Assets and Liabilities
| as of June 30, 2017 (Unaudited) | |
| Assets | |
Investments: Investments in affiliated Underlying Funds, at value (cost $133,314,158) | $ 130,241,726 |
| Investments in non-affiliated Underlying Funds, at value (cost $28,108,876) | 29,973,954 |
| Total investments in securities, at value (cost $161,423,034) | 160,215,680 |
| Receivable for Fund shares sold | 259,445 |
| Interest receivable | 12,721 |
| Other assets | 679 |
| Total assets | 160,488,525 |
| Liabilities | |
| Payable for Fund shares redeemed | 335,683 |
| Accrued management fee | 294 |
| Accrued Trustees' fees | 2,275 |
| Other accrued expenses and payables | 117,806 |
| Total liabilities | 456,058 |
| Net assets, at value | $ 160,032,467 |
| Net Assets Consist of | |
| Undistributed net investment income | 1,157,962 |
| Net unrealized appreciation (depreciation) on investments | (1,207,354) |
| Accumulated net realized gain (loss) | (3,758,519) |
| Paid-in capital | 163,840,378 |
| Net assets, at value | $ 160,032,467 |
Class A Net Asset Value, offering and redemption price per share ($25,227,812 ÷ 1,929,582 outstanding shares of beneficial interest, no par value, unlimited number of shares authorized) | $ 13.07 |
Class B Net Asset Value, offering and redemption price per share ($134,804,655 ÷ 10,305,359 outstanding shares of beneficial interest, no par value, unlimited number of shares authorized) | $ 13.08 |
The accompanying notes are an integral part of the financial statements.
Statement of Operations
| for the six months ended June 30, 2017 (Unaudited) | |
| Investment Income | |
Income: Income distributions from affiliated Underlying Funds | $ 1,038,925 |
| Dividends | 519,272 |
| Total income | 1,558,197 |
Expenses: Management fee | 294,828 |
| Administration fee | 72,874 |
| Record keeping fees (Class B) | 24,565 |
| Services to shareholders | 1,614 |
| Distribution service fee (Class B) | 150,901 |
| Custodian fee | 3,036 |
| Professional fees | 33,405 |
| Reports to shareholders | 22,041 |
| Registration fees | 5 |
| Trustees' fees and expenses | 6,282 |
| Other | 2,260 |
| Total expenses before expense reductions | 611,811 |
| Expense reductions | (267,115) |
| Total expenses after expense reductions | 344,696 |
| Net investment income (loss) | 1,213,501 |
| Realized and Unrealized Gain (Loss) | |
Net realized gain (loss) from: Sale of affiliated Underlying Funds | (246,135) |
| Sale of non-affiliated Underlying Funds | 151,452 |
| (94,683) | |
| Change in net unrealized appreciation (depreciation) on investments | 3,209,567 |
| Net gain (loss) | 3,114,884 |
| Net increase (decrease) in net assets resulting from operations | $ 4,328,385 |
The accompanying notes are an integral part of the financial statements.
Statements of Changes in Net Assets
| Increase (Decrease) in Net Assets | Six Months Ended June 30, 2017 (Unaudited) | Year Ended December 31, 2016 | |
Operations: Net investment income | $ 1,213,501 | $ 2,874,142 | |
| Net realized gain (loss) | (94,683) | (1,444,719) | |
| Change in net unrealized appreciation (depreciation) | 3,209,567 | 3,861,095 | |
| Net increase (decrease) in net assets resulting from operations | 4,328,385 | 5,290,518 | |
Distributions to shareholders from: Net investment income: Class A | (586,944) | (500,963) | |
| Class B | (2,539,240) | (1,722,118) | |
| Total distributions | (3,126,184) | (2,223,081) | |
Fund share transactions: Class A Proceeds from shares sold | 2,143,341 | 4,188,144 | |
| Reinvestment of distributions | 586,944 | 500,963 | |
| Payments for shares redeemed | (1,917,418) | (2,114,144) | |
| Net increase (decrease) in net assets from Class A share transactions | 812,867 | 2,574,963 | |
Class B Proceeds from shares sold | 30,317,930 | 27,389,957 | |
| Reinvestment of distributions | 2,539,240 | 1,722,118 | |
| Payments for shares redeemed | (6,031,516) | (12,422,361) | |
| Net increase (decrease) in net assets from Class B share transactions | 26,825,654 | 16,689,714 | |
| Increase (decrease) in net assets | 28,840,722 | 22,332,114 | |
| Net assets at beginning of period | 131,191,745 | 108,859,631 | |
| Net assets at end of period (including undistributed net investment income of $1,157,962 and $3,070,645, respectively) | $ 160,032,467 | $ 131,191,745 | |
| Other Information | |||
Class A Shares outstanding at beginning of period | 1,866,984 | 1,666,853 | |
| Shares sold | 163,561 | 325,638 | |
| Shares issued to shareholders in reinvestment of distributions | 45,046 | 39,415 | |
| Shares redeemed | (146,009) | (164,922) | |
| Net increase (decrease) in Class A shares | 62,598 | 200,131 | |
| Shares outstanding at end of period | 1,929,582 | 1,866,984 | |
Class B Shares outstanding at beginning of period | 8,257,413 | 6,979,222 | |
| Shares sold | 2,313,447 | 2,113,626 | |
| Shares issued to shareholders in reinvestment of distributions | 194,727 | 135,280 | |
| Shares redeemed | (460,228) | (970,715) | |
| Net increase (decrease) in Class B shares | 2,047,946 | 1,278,191 | |
| Shares outstanding at end of period | 10,305,359 | 8,257,413 | |
The accompanying notes are an integral part of the financial statements.
Financial Highlights
| Class A | Six Months Ended 6/30/17 (Unaudited) | Years Ended December 31, | |||||
| 2016 | 2015 | 2014 | 2013 | 2012 | |||
| Selected Per Share Data | |||||||
| Net asset value, beginning of period | $ 12.97 | $ 12.60 | $ 13.88 | $ 13.75 | $ 13.90 | $ 13.24 | |
Income (loss) from investment operations: Net investment incomea | .12 | .35 | .29 | .36 | .26 | .33 | |
| Net realized and unrealized gain (loss) | .29 | .31 | (1.13) | .13 | (.13) | .93 | |
| Total from investment operations | .41 | .66 | (.84) | .49 | .13 | 1.26 | |
Less distributions from: Net investment income | (.31) | (.29) | (.41) | (.27) | (.28) | (.49) | |
| Net realized gains | — | — | (.03) | (.09) | — | (.11) | |
| Total distributions | (.31) | (.29) | (.44) | (.36) | (.28) | (.60) | |
| Net asset value, end of period | $ 13.07 | $ 12.97 | $ 12.60 | $ 13.88 | $ 13.75 | $ 13.90 | |
| Total Return (%)b,c | 3.15** | 5.30 | (6.29) | 3.50 | .93 | 9.72 | |
| Ratios to Average Net Assets and Supplemental Data | |||||||
| Net assets, end of period ($ millions) | 25 | 24 | 21 | 20 | 15 | 10 | |
| Ratio of expenses before expense reductions (%)d,e | .60* | .56 | .53 | .56 | .64 | .63 | |
| Ratio of expenses after expense reductions (%)d,e | .23* | .27 | .33 | .32 | .27 | .30 | |
| Ratio of net investment income (%) | 1.87* | 2.70 | 2.19 | 2.54 | 1.86 | 2.46 | |
| Portfolio turnover rate (%) | 4** | 51 | 21 | 28 | 40 | 22 | |
a Based on average shares outstanding during the period. b Total return would have been lower had certain expenses not been reduced. c Total return would have been lower if the Advisor had not reduced some Underlying Deutsche Funds' expenses. d The Fund invests in other Funds and indirectly bears its proportionate share of fees and expenses incurred by the Underlying Funds in which the Fund is invested. This ratio does not include these indirect fees and expenses. e Expense ratio does not reflect charges and fees associated with the separate account that invests in the Fund or any variable life insurance policy or variable annuity contract for which the Fund is an investment option. * Annualized ** Not annualized | |||||||
| Class B | Six Months Ended 6/30/17 (Unaudited) | Years Ended December 31, | |||||
| 2016 | 2015 | 2014 | 2013 | 2012 | |||
| Selected Per Share Data | |||||||
| Net asset value, beginning of period | $ 12.96 | $ 12.59 | $ 13.87 | $ 13.74 | $ 13.88 | $ 13.23 | |
Income (loss) from investment operations: Net investment incomea | .11 | .31 | .25 | .31 | .22 | .30 | |
| Net realized and unrealized gain (loss) | .28 | .31 | (1.12) | .14 | (.11) | .91 | |
| Total from investment operations | .39 | .62 | (.87) | .45 | .11 | 1.21 | |
Less distributions from: Net investment income | (.27) | (.25) | (.38) | (.23) | (.25) | (.45) | |
| Net realized gains | — | — | (.03) | (.09) | — | (.11) | |
| Total distributions | (.27) | (.25) | (.41) | (.32) | (.25) | (.56) | |
| Net asset value, end of period | $ 13.08 | $ 12.96 | $ 12.59 | $ 13.87 | $ 13.74 | $ 13.88 | |
| Total Return (%)b,c | 2.99** | 4.99 | (6.54) | 3.24 | .75 | 9.36 | |
| Ratios to Average Net Assets and Supplemental Data | |||||||
| Net assets, end of period ($ millions) | 135 | 107 | 88 | 94 | 84 | 62 | |
| Ratio of expenses before expense reductions (%)d,e | 89* | .85 | .83 | .86 | .93 | .88 | |
| Ratio of expenses after expense reductions (%)d,e | .52* | .57 | .62 | .57 | .52 | .55 | |
| Ratio of net investment income (%) | 1.62* | 2.45 | 1.84 | 2.22 | 1.57 | 2.25 | |
| Portfolio turnover rate (%) | 4** | 51 | 21 | 28 | 40 | 22 | |
a Based on average shares outstanding during the period. b Total return would have been lower had certain expenses not been reduced. c Total return would have been lower if the Advisor had not reduced some Underlying Deutsche Funds' expenses. d The Fund invests in other Funds and indirectly bears its proportionate share of fees and expenses incurred by the Underlying Funds in which the Fund is invested. This ratio does not include these indirect fees and expenses. e Expense ratio does not reflect charges and fees associated with the separate account that invests in the Fund or any variable life insurance policy or variable annuity contract for which the Fund is an investment option. * Annualized ** Not annualized | |||||||
Notes to Financial Statements (Unaudited)
A. Organization and Significant Accounting Policies
Deutsche Alternative Asset Allocation VIP (the "Fund") is a diversified series of Deutsche Variable Series II (the "Trust"), which is registered under the Investment Company Act of 1940, as amended (the "1940 Act"), as an open-end management investment company organized as a Massachusetts business trust. The Fund mainly invests in other affiliated Deutsche funds (i.e., mutual funds, exchange-traded funds and other pooled investment vehicles managed by Deutsche Investment Management Americas Inc. or one of its affiliates, together the "Underlying Deutsche Funds"), non-affiliated exchange-traded funds ("Non-affiliated ETFs") and derivative investments. Non-affiliated ETFs and Underlying Deutsche Funds are collectively referred to as "Underlying Funds." During the six months ended June 30, 2017, the Fund primarily invested in underlying Deutsche Funds and non-affiliated ETFs. Each Underlying Deutsche Fund's accounting policies and investment holdings are outlined in the Underlying Deutsche Funds' financial statements and are available upon request.
Multiple Classes of Shares of Beneficial Interest. The Fund offers two classes of shares (Class A shares and Class B shares). Sales of Class B shares are subject to recordkeeping fees up to 0.15% and Rule 12b-1 fees under the 1940 Act equal to an annual rate of 0.25% of the average daily net assets of the Class B shares of the Fund. Class A shares are not subject to such fees.
Investment income, realized and unrealized gains and losses, and certain fund-level expenses and expense reductions, if any, are borne pro rata on the basis of relative net assets by the holders of all classes of shares except that each class bears certain expenses unique to that class (including the applicable Rule 12b-1 fee). Differences in class-level expenses may result in payment of different per share dividends by class. All shares have equal rights with respect to voting subject to class-specific arrangements.
The Fund's financial statements are prepared in accordance with accounting principles generally accepted in the United States of America ("U.S. GAAP") which require the use of management estimates. Actual results could differ from those estimates. The Fund qualifies as an investment company under Topic 946 of Accounting Standards Codification of U.S. GAAP. The policies described below are followed consistently by the Fund in the preparation of its financial statements.
Security Valuation. Investments are stated at value determined as of the close of regular trading on the New York Stock Exchange on each day the exchange is open for trading.
Various inputs are used in determining the value of the Fund's investments. These inputs are summarized in three broad levels. Level 1 includes quoted prices in active markets for identical securities. Level 2 includes other significant observable inputs (including quoted prices for similar securities, interest rates, prepayment speeds and credit risk). Level 3 includes significant unobservable inputs (including the Fund's own assumptions in determining the fair value of investments). The level assigned to the securities valuations may not be an indication of the risk or liquidity associated with investing in those securities.
Investments in mutual funds are valued at the net asset value per share of each class of the Underlying Deutsche Funds and are categorized as Level 1.
ETFs are valued at the most recent sale price or official closing price reported on the exchange (U.S. or foreign) or over-the-counter market on which they trade. ETFs for which no sales are reported are valued at the calculated mean between the most recent bid and asked quotations on the relevant market or, if a mean cannot be determined, at the most recent bid quotation. ETF securities are generally categorized as Level 1.
Disclosure about the classification of fair value measurements is included in a table following the Fund's Investment Portfolio.
Federal Income Taxes. The Fund's policy is to comply with the requirements of the Internal Revenue Code, as amended, which are applicable to regulated investment companies and to distribute all of its taxable income to its shareholders.
At December 31, 2016, the Fund had approximately $1,864,000 of long-term tax basis capital loss carryforwards, which may be applied against realized net taxable capital gains indefinitely.
The Fund has reviewed the tax positions for the open tax years as of December 31, 2016 and has determined that no provision for income tax and/or uncertain tax provisions is required in the Fund's financial statements. The Fund's federal tax returns for the prior three fiscal years remain open subject to examination by the Internal Revenue Service.
Distribution of Income and Gains. Distributions from net investment income of the Fund, if any, are declared and distributed to shareholders annually. Net realized gains from investment transactions, in excess of available capital loss carryforwards, would be taxable to the Fund if not distributed and, therefore, will be distributed to shareholders at least annually. The Fund may also make additional distributions for tax purposes if necessary.
The timing and characterization of certain income and capital gain distributions are determined annually in accordance with federal tax regulations which may differ from accounting principles generally accepted in the United States of America. These differences primarily relate to certain securities sold at a loss and capital gain distributions from Underlying Funds. As a result, net investment income (loss) and net realized gain (loss) on investment transactions for a reporting period may differ significantly from distributions during such period. Accordingly, the Fund may periodically make reclassifications among certain of its capital accounts without impacting the net asset value of the Fund.
The tax character of current year distributions will be determined at the end of the current fiscal year.
Expenses. Expenses of the Trust arising in connection with a specific fund are allocated to that fund. Other Trust expenses which cannot be directly attributed to a fund are apportioned among the funds in the Trust based upon the relative net assets or other appropriate measures.
Contingencies. In the normal course of business, the Fund may enter into contracts with service providers that contain general indemnification clauses. The Fund's maximum exposure under these arrangements is unknown, as this would involve future claims that may be made against the Fund that have not yet been made. However, based on experience, the Fund expects the risk of loss to be remote.
Other. Investment transactions are accounted for on a trade date plus one basis for daily net asset value calculations. However, for financial reporting purposes, investment transactions are reported on trade date. Interest income is recorded on the accrual basis. Dividend Income is recorded on the ex-dividend date. Distributions of income and capital gains from the Underlying Funds are recorded on the ex-dividend date. Realized gains and losses from investment transactions are recorded on an identified cost basis.
B. Purchases and Sales of Securities
During the six months ended June 30, 2017, purchases and sales of affiliated Underlying Funds (excluding money market funds) aggregated $23,277,223 and $1,939,000, respectively. Purchases and sales of Non-affiliated ETFs aggregated $8,240,528 and $3,464,522, respectively.
C. Related Parties
Management Agreement. Under the Investment Management Agreement with Deutsche Investment Management Americas Inc. ("DIMA" or the "Advisor"), an indirect, wholly owned subsidiary of Deutsche Bank AG, the Advisor directs the investments of the Fund in accordance with its investment objectives, policies and restrictions. The Advisor determines the securities, instruments and other contracts relating to investments in Underlying Funds to be purchased, sold or entered into by the Fund or delegates such responsibility to the Fund's subadvisors.
RREEF America L.L.C. ("RREEF"), an indirect, wholly owned subsidiary of Deutsche Bank AG, acts as an investment subadvisor to the Fund. As an investment subadvisor to the Fund, RREEF provides investment management services to the portions of the Fund's portfolio allocated to direct investments in global real estate and global infrastructure securities. RREEF is paid by the Advisor for the services RREEF provides to the Fund. As of the date of this report, the Fund obtained its exposure to global real estate and global infrastructure securities indirectly through investments in other Underlying Deutsche Funds.
The Fund does not invest in the Underlying Deutsche Funds for the purpose of exercising management or control; however, investments within the set limits may represent 5% or more of an Underlying Deutsche Fund's outstanding shares. At June 30, 2017, the Fund held approximately 23% of Deutsche Global Inflation Fund, and 18% of Deutsche Enhanced Emerging Markets Fixed Income Fund.
Pursuant to the Investment Management Agreement with the Advisor, the Fund pays a monthly management fee based on the Fund's average daily net assets, computed and accrued daily and payable monthly, at the following annual rates:
| On assets invested in other Deutsche Funds | .20% |
| On assets invested in all other assets not considered Deutsche Funds | 1.20% |
Accordingly, for the six months ended June 30, 2017, the fee pursuant to the Investment Management Agreement was equivalent to an annualized rate (exclusive of any applicable waivers/reimbursements) of 0.40% of the Fund's average daily net assets.
In addition, the Advisor will receive management fees from managing the Underlying Deutsche Funds in which the Fund invests.
For the period from January 1, 2017 through September 30, 2017, the Advisor has contractually agreed to waive its fee and/or reimburse certain operating expenses to the extent necessary to maintain the total annual operating expenses (excluding certain expenses such as extraordinary expenses, taxes, brokerage, interest expense and Underlying Funds) of each class as follows:
| Class A | .23% |
| Class B | .53% |
In addition, the Advisor has contractually agreed to waive its fees and/or reimburse fund expenses for the period July 17, 2017 through September 30, 2018 to the extent necessary to maintain the fund’s total annual operating expenses (including indirect expenses of Underlying Funds and excluding certain expenses such as extraordinary expenses, taxes, brokerage and interest expenses) of each class as follows:
| Class A | .86% |
| Class B | 1.15% |
For the six months ended June 30, 2017, the Advisor has voluntarily agreed to waive 0.15% of its management fee.
For the six months ended June 30, 2017, fees waived and/or expenses reimbursed for each class are as follows:
| Class A | $ 46,095 |
| Class B | 221,020 |
| $ 267,115 |
The Fund indirectly bears its proportionate share of fees and expenses incurred by the Underlying Funds in which it is invested.
Administration Fee. Pursuant to an Administrative Services Agreement, DIMA provides most administrative services to the Fund. For all services provided under the Administrative Services Agreement, the Fund pays DIMA an annual fee ("Administration Fee") of 0.10% of the Fund's average daily net assets, computed and accrued daily and payable monthly. For the six months ended June 30, 2017, the Administration Fee was $72,874, of which $13,061 is unpaid.
Service Provider Fees. Deutsche AM Service Company ("DSC"), an affiliate of the Advisor, is the transfer agent, dividend-paying agent and shareholder service agent for the Fund. Pursuant to a sub-transfer agency agreement between DSC and DST Systems, Inc. ("DST"), DSC has delegated certain transfer agent, dividend-paying agent and shareholder service agent functions to DST. DSC compensates DST out of the shareholder servicing fee it receives from the Fund. For the six months ended June 30, 2017, the amounts charged to the Fund by DSC were as follows:
| Services to Shareholders | Total Aggregated | Unpaid at June 30, 2017 |
| Class A | $ 65 | $ 32 |
| Class B | 116 | 52 |
| $ 181 | $ 84 |
Distribution Service Agreement. Under the Fund's Class B 12b-1 plan, Deutsche AM Distributors, Inc. ("DDI") received a fee ("Distribution Service Fee") of 0.25% of average daily net assets of Class B shares. For the six months ended June 30, 2017, the Distribution Service Fee aggregated $150,901, of which $27,353 is unpaid.
Typesetting and Filing Service Fees. Under an agreement with DIMA, DIMA is compensated for providing typesetting and certain regulatory filing services to the Fund. For the six months ended June 30, 2017, the amount charged to the Fund by DIMA included in the Statement of Operations under "Reports to shareholders" aggregated $5,258, of which $4,414 is unpaid.
Trustees' Fees and Expenses. The Fund paid retainer fees to each Trustee not affiliated with the Advisor, plus specified amounts to the Board Chairperson and Vice Chairperson and to each committee Chairperson.
Affiliated Cash Management Vehicles. The Fund may invest uninvested cash balances in Deutsche Central Cash Management Government Fund and Deutsche Variable NAV Money Fund, affiliated money market funds which are managed by the Advisor. Each affiliated money market fund is managed in accordance with Rule 2a-7 under the 1940 Act, which governs the quality, maturity, diversity and liquidity of instruments in which a money market fund may invest. Deutsche Central Cash Management Government Fund seeks to maintain a stable net asset value, and Deutsche Variable NAV Money Fund maintains a floating net asset value. The Fund indirectly bears its proportionate share of the expenses of each affiliated money market fund in which it invests. Deutsche Central Cash Management Government Fund does not pay the Advisor an investment management fee.
D. Ownership of the Fund
At June 30, 2017, one participating insurance company was the owner of record of 10% or more of the total outstanding Class A shares of the Fund, owning 92%. Three participating insurance companies were the owner of record of 10% or more of the total outstanding Class B shares of the Fund, each owning 42%, 36% and 16%, respectively.
E. Transactions with Affiliates
The Fund mainly invests in Underlying Deutsche Funds and Non-affiliated ETFs. The Underlying Deutsche Funds in which the Fund invests are considered to be affiliated investments. A summary of the Fund's transactions with affiliated Underlying Deutsche Funds during the six months ended June 30, 2017 is as follows:
| Affiliate | Value ($) at 12/31/2016 | Purchases Cost ($) | Sales Cost ($) | Realized Gain/ (Loss) ($) | Income Distributions ($) | Value ($) at 6/30/2017 |
| Deutsche Enhanced Commodity Strategy Fund | 18,836,483 | 3,933,201 | — | — | 41,201 | 21,305,660 |
| Deutsche Enhanced Emerging Markets Fixed Income Fund | 20,632,739 | 1,349,040 | 1,939,000 | (246,135) | 355,041 | 20,884,621 |
| Deutsche Floating Rate Fund | 12,592,284 | 2,849,380 | — | — | 341,380 | 15,232,082 |
| Deutsche Global Inflation Fund | 18,478,680 | 4,990,000 | — | — | — | 23,814,613 |
| Deutsche Global Infrastructure Fund | 12,207,777 | 6,712,935 | — | — | 156,935 | 20,142,602 |
| Deutsche Global Real Estate Securities Fund | 422,249 | 1,000,789 | — | — | 4,789 | 1,470,698 |
| Deutsche Real Estate Securities Fund | 6,637,281 | 2,441,878 | — | — | 90,878 | 9,249,939 |
| Deutsche Central Cash Management Government Fund | 18,239,998 | 28,397,129 | 28,495,616 | — | 48,701 | 18,141,511 |
| Total | 108,047,491 | 51,674,352 | 30,434,616 | (246,135) | 1,038,925 | 130,241,726 |
Information About Your Fund's Expenses (Unaudited)
As an investor of the Fund, you incur two types of costs: ongoing expenses and transaction costs. Ongoing expenses include management fees, distribution and service (12b-1) fees and other Fund expenses. Examples of transaction costs include contract charges, which are not shown in this section. The following tables are intended to help you understand your ongoing expenses (in dollars) of investing in the Fund and to help you compare these expenses with the ongoing expenses of investing in other mutual funds. In addition to the ongoing expenses which the Fund bears directly, the Fund's shareholders indirectly bear the expense of the Underlying Funds in which the Fund invests. These expenses are not included in the Fund's annualized expense ratios used to calculate the expense estimate in the tables. In the most recent six-month period, the Fund limited the ongoing expenses the Fund bears directly; had it not done so, expenses would have been higher. The examples in the table are based on an investment of $1,000 invested at the beginning of the six-month period and held for the entire period (January 1, 2017 to June 30, 2017).
The tables illustrate your Fund's expenses in two ways:
— Actual Fund Return. This helps you estimate the actual dollar amount of ongoing expenses (but not transaction costs) paid on a $1,000 investment in the Fund using the Fund's actual return during the period. To estimate the expenses you paid over the period, simply divide your account value by $1,000 (for example, an $8,600 account value divided by $1,000 = 8.6), then multiply the result by the number in the "Expenses Paid per $1,000" line under the share class you hold.
— Hypothetical 5% Fund Return. This helps you to compare your Fund's ongoing expenses (but not transaction costs) with those of other mutual funds using the Fund's actual expense ratio and a hypothetical rate of return of 5% per year before expenses. Examples using a 5% hypothetical Fund return may be found in the shareholder reports of other mutual funds. The hypothetical account values and expenses may not be used to estimate the actual ending account balance or expenses you paid for the period.
Please note that the expenses shown in these tables are meant to highlight your ongoing expenses only and do not reflect any transaction costs. The "Expenses Paid per $1,000" line of the tables is useful in comparing ongoing expenses only and will not help you determine the relative total expense of owning different funds. If these transaction costs had been included, your costs would have been higher.
| Expenses and Value of a $1,000 Investment for the six months ended June 30, 2017 | ||||
| Actual Fund Return | Class A | Class B | ||
| Beginning Account Value 1/1/17 | $ 1,000.00 | $ 1,000.00 | ||
| Ending Account Value 6/30/17 | $ 1,031.50 | $ 1,029.90 | ||
| Expenses Paid per $1,000* | $ 1.16 | $ 2.62 | ||
| Hypothetical 5% Fund Return | Class A | Class B | ||
| Beginning Account Value 1/1/17 | $ 1,000.00 | $ 1,000.00 | ||
| Ending Account Value 6/3/17 | $ 1,023.65 | $ 1,022.22 | ||
| Expenses Paid per $1,000* | $ 1.15 | $ 2.61 | ||
* Expenses are equal to the Fund's annualized expense ratio for each share class, multiplied by the average account value over the period, multiplied by 181 (the number of days in the most recent six-month period), then divided by 365.
| Annualized Expense Ratios** | Class A | Class B | |||
| Deutsche Variable Series II — Deutsche Alternative Asset Allocation VIP | .23% | .52% |
** The Fund invests in other funds and indirectly bears its proportionate share of fees and expenses incurred by the Underlying Funds in which the Fund is invested. These ratios do not include these indirect fees and expenses.
For more information, please refer to the Fund's prospectus.
These tables do not reflect charges and fees ("contract charges") associated with the separate account that invests in the Fund or any variable life insurance policy or variable annuity contract for which the Fund is an investment option.
For an analysis of the fees associated with an investment in the fund or similar funds, please refer to the current and hypothetical expense calculators for Variable Insurance Products which can be found at deutschefunds.com/EN/resources/calculators.jsp.
Proxy Voting
The Trust's policies and procedures for voting proxies for portfolio securities and information about how the Trust voted proxies related to its portfolio securities during the most recent 12-month period ended June 30 are available on our Web site — deutschefunds.com (click on "proxy voting" at the bottom of the page) — or on the SEC's Web site — sec.gov. To obtain a written copy of the Trust's policies and procedures without charge, upon request, call us toll free at (800) 728-3337.
Advisory Agreement Board Considerations and Fee Evaluation
The Board of Trustees (hereinafter referred to as the "Board" or "Trustees") approved the renewal of Deutsche Alternative Asset Allocation VIP’s (the "Fund") investment management agreement (the "Agreement") with Deutsche Investment Management Americas Inc. ("DIMA") and sub-advisory agreement (the "Sub-Advisory Agreement" and together with the Agreement, the "Agreements") between DIMA and RREEF America L.L.C. ("RREEF"), an affiliate of DIMA, in September 2016.
In terms of the process that the Board followed prior to approving the Agreements, shareholders should know that:
— During the entire process, all of the Fund’s Trustees were independent of DIMA and its affiliates (the "Independent Trustees").
— The Board met frequently during the past year to discuss fund matters and dedicated a substantial amount of time to contract review matters. Over the course of several months, the Board’s Contract Committee reviewed extensive materials received from DIMA, independent third parties and independent counsel. These materials included an analysis of the Fund’s performance, fees and expenses, and profitability from a fee consultant retained by the Fund’s Independent Trustees (the "Fee Consultant"). The Board also received extensive information throughout the year regarding performance of the Fund.
— The Independent Trustees regularly meet privately with counsel to discuss contract review and other matters. In addition, the Independent Trustees were advised by the Fee Consultant in the course of their review of the Fund’s contractual arrangements and considered a comprehensive report prepared by the Fee Consultant in connection with their deliberations.
— In connection with reviewing the Agreements, the Board also reviewed the terms of the Fund’s Rule 12b-1 plan, distribution agreement, administrative services agreement, transfer agency agreement and other material service agreements.
— Based on its evaluation of the information provided, the Contract Committee presented its findings and recommendations to the Board. The Board then reviewed the Contract Committee’s findings and recommendations.
In connection with the contract review process, the Contract Committee and the Board considered the factors discussed below, among others. The Board also considered that DIMA has managed the Fund since its inception, and the Board believes that a long-term relationship with a capable, conscientious advisor is in the best interests of the Fund. The Board considered, generally, that shareholders chose to invest or remain invested in the Fund knowing that DIMA managed the Fund. DIMA and RREEF are part of Deutsche Bank AG’s ("Deutsche Bank") Asset Management ("Deutsche AM") division. Deutsche AM is a global asset management business that offers a wide range of investing expertise and resources, including research capabilities in many countries throughout the world. Deutsche Bank has advised the Board that the U.S. asset management business continues to be a critical and integral part of Deutsche Bank, and that Deutsche Bank will continue to invest in Deutsche AM and seek to enhance Deutsche AM’s investment platform. Deutsche Bank also has confirmed its commitment to maintaining strong legal and compliance groups within the Deutsche AM division.
As part of the contract review process, the Board carefully considered the fees and expenses of each Deutsche fund overseen by the Board in light of the fund’s performance. In many cases, this led to the negotiation and implementation of expense caps. As part of these negotiations, the Board indicated that it would consider relaxing these caps in future years following sustained improvements in performance, among other considerations.
While shareholders may focus primarily on fund performance and fees, the Fund’s Board considers these and many other factors, including the quality and integrity of DIMA’s and RREEF’s personnel and such other issues as back-office operations, fund valuations, and compliance policies and procedures.
Nature, Quality and Extent of Services. The Board considered the terms of the Agreements, including the scope of advisory services provided under the Agreements. The Board noted that, under the Agreements, DIMA and RREEF provide portfolio management services to the Fund and that, pursuant to a separate administrative services agreement, DIMA provides administrative services to the Fund. The Board considered the experience and skills of senior management and investment personnel and the resources made available to such personnel. The Board also requested and received information regarding DIMA’s oversight of sub-advisers, including RREEF. The Board reviewed the Fund’s performance over short-term and long-term periods and compared those returns to various agreed-upon performance measures, including market index(es) and a peer universe compiled using information supplied by Morningstar Direct ("Morningstar"), an independent fund data service. The Board also noted that it has put into place a process of identifying "Focus Funds" (e.g., funds performing poorly relative to a peer universe), and receives additional reporting from DIMA regarding such funds and, where appropriate, DIMA’s plans to address underperformance. The Board believes this process is an effective manner of identifying and addressing underperforming funds. Based on the information provided, the Board noted that for the one-, three- and five-year periods ended December 31, 2015, the Fund’s performance (Class A shares) was in the 4th quartile, 3rd quartile and 4th quartile, respectively, of the applicable Morningstar universe (the 1st quartile being the best performers and the 4th quartile being the worst performers). The Board also observed that the Fund has underperformed its benchmark in the one-, three- and five-year periods ended December 31, 2015. The Board noted the disappointing investment performance of the Fund in recent periods and continued to discuss with senior management of DIMA the factors contributing to such underperformance and actions being taken to improve performance. The Board observed that the Fund had experienced improved relative performance during the first seven months of 2016. The Board recognized the efforts by DIMA in recent years to enhance its investment platform and improve long-term performance across the Deutsche fund complex.
Fees and Expenses. The Board considered the Fund’s investment management fee schedule, sub-advisory fee schedule, operating expenses and total expense ratios, and comparative information provided by Broadridge Financial Solutions, Inc. ("Broadridge") and the Fee Consultant regarding investment management fee rates paid to other investment advisors by similar funds (1st quartile being the most favorable and 4th quartile being the least favorable). With respect to management fees paid to other investment advisors by similar funds, the Board noted that the contractual fee rates paid by the Fund, which include a 0.10% fee paid to DIMA under the Fund’s administrative services agreement, were higher than the median (4th quartile) of the applicable Broadridge peer group (based on Broadridge data provided as of December 31, 2015). The Board noted that DIMA agreed to voluntarily waive a portion (0.15%) of the Fund’s management fee. With respect to the sub-advisory fee paid to RREEF, the Board noted that the fee is paid by DIMA out of its fee and not directly by the Fund. The Board noted that the Fund’s Class A shares total (net) operating expenses were expected to be lower than the median (2nd quartile) of the applicable Broadridge expense universe (based on Broadridge data provided as of December 31, 2015, and analyzing Broadridge expense universe Class A (net) expenses less any applicable 12b-1 fees) ("Broadridge Universe Expenses"). The Board also reviewed data comparing each share class’s total (net) operating expenses to the applicable Broadridge Universe Expenses. The Board noted that the expense limitations agreed to by DIMA were expected to help the Fund’s total (net) operating expenses remain competitive. The Board considered the Fund’s management fee rate as compared to fees charged by DIMA to comparable Deutsche U.S. registered funds ("Deutsche Funds") and considered differences between the Fund and the comparable Deutsche Funds. The information requested by the Board as part of its review of fees and expenses also included information about institutional accounts (including any sub-advised funds and accounts) and funds offered primarily to European investors ("Deutsche Europe funds") managed by Deutsche AM. The Board noted that DIMA indicated that Deutsche AM does not manage any institutional accounts or Deutsche Europe funds comparable to the Fund.
On the basis of the information provided, the Board concluded that management fees were reasonable and appropriate in light of the nature, quality and extent of services provided by DIMA and RREEF.
Profitability. The Board reviewed detailed information regarding revenues received by DIMA from advising the Deutsche Funds along with the estimated costs and pre-tax profits realized by DIMA from advising the Deutsche Funds. The Board also received information regarding the estimated enterprise-wide profitability of DIMA and its affiliates with respect to all fund services in totality. The Board did not receive profitability information with respect to the Fund, but did receive such information with respect to the funds in which the Fund invests. The Board also reviewed certain publicly available information regarding the profitability of certain similar investment management firms. The Board noted that while information regarding the profitability of such firms is limited (and in some cases is not necessarily prepared on a comparable basis), DIMA and its affiliates’ overall profitability with respect to the Deutsche Funds (after taking into account distribution and other services provided to the funds by DIMA and its affiliates) was lower than the overall profitability levels of most comparable firms for which such data was available.
Economies of Scale. The Board considered whether there are economies of scale with respect to the management of the Fund and whether the Fund benefits from any economies of scale. In this regard, the Board observed that while the Fund’s current investment management fee schedule does not include breakpoints, the Fund’s fee schedule represents an appropriate sharing between the Fund and DIMA of such economies of scale as may exist in the management of the Fund at current asset levels.
Other Benefits to DIMA and Its Affiliates. The Board also considered the character and amount of other incidental benefits received by DIMA and its affiliates, including any fees received by DIMA for administrative services provided to the Fund and any fees received by an affiliate of DIMA for distribution services. The Board also considered benefits to DIMA related to brokerage and soft-dollar allocations, including allocating brokerage to pay for research generated by parties other than the executing broker dealers, which pertain primarily to funds investing in equity securities, along with the incidental public relations benefits to DIMA related to Deutsche Funds advertising and cross-selling opportunities among DIMA products and services. The Board considered these benefits in reaching its conclusion that the Fund’s management fees were reasonable.
Compliance. The Board considered the significant attention and resources dedicated by DIMA to documenting and enhancing its compliance processes in recent years. The Board noted in particular (i) the experience, seniority and time commitment of the individuals serving as DIMA’s and the Fund’s chief compliance officers; (ii) the large number of DIMA compliance personnel; and (iii) the substantial commitment of resources by DIMA and its affiliates to compliance matters.
Based on all of the information considered and the conclusions reached, the Board unanimously determined that the continuation of the Agreements is in the best interests of the Fund. In making this determination, the Board did not give particular weight to any single factor identified above. The Board considered these factors over the course of numerous meetings, certain of which were in executive session with only the Independent Trustees and counsel present. It is possible that individual Independent Trustees may have weighed these factors differently in reaching their individual decisions to approve the continuation of the Agreements.

VS2AAA-3 (R-028379-6 8/17)

June 30, 2017
Semiannual Report
Deutsche Variable Series II
Deutsche CROCI® U.S. VIP
(formerly Deutsche Large Cap Value VIP)

Contents
3 Performance Summary 4 Portfolio Summary 4 Portfolio Management Team 5 Investment Portfolio 8 Statement of Assets and Liabilities 8 Statement of Operations 9 Statements of Changes in Net Assets 11 Financial Highlights 12 Notes to Financial Statements 16 Information About Your Fund's Expenses 17 Proxy Voting 18 Advisory Agreement Board Considerations and Fee Evaluation |
This report must be preceded or accompanied by a prospectus. To obtain an additional prospectus or summary prospectus, if available, call (800) 728-3337 or your financial representative. We advise you to consider the Fund's objectives, risks, charges and expenses carefully before investing. The summary prospectus and prospectus contain this and other important information about the Fund. Please read the prospectus carefully before you invest.
The fund will be managed using the CROCI® Investment Process which is based on portfolio management's belief that, over time, stocks which display more favorable financial metrics (for example, the CROCI® Economic P/E Ratio) as generated by this process may outperform stocks which display less favorable metrics. This premise may not prove to be correct and prospective investors should evaluate this assumption prior to investing in the fund. Stocks may decline in value. The fund may lend securities to approved institutions. See the prospectus for details.
Deutsche Asset Management represents the asset management activities conducted by Deutsche Bank AG or any of its subsidiaries.
Deutsche AM Distributors, Inc., 222 South Riverside Plaza, Chicago, IL 60606, (800) 621-1148
NOT FDIC/NCUA INSURED NO BANK GUARANTEE MAY LOSE VALUE NOT A DEPOSIT
NOT INSURED BY ANY FEDERAL GOVERNMENT AGENCY
Performance Summary June 30, 2017 (Unaudited)
Fund performance shown is historical, assumes reinvestment of all dividend and capital gain distributions and does not guarantee future results. Investment return and principal value fluctuate with changing market conditions so that, when redeemed, shares may be worth more or less than their original cost. Current performance may be lower or higher than the performance data quoted. Please contact your participating insurance company for the Fund's most recent month-end performance. Performance doesn't reflect charges and fees ("contract charges") associated with the separate account that invests in the Fund or any variable life insurance policy or variable annuity contract for which the Fund is an investment option. These charges and fees will reduce returns. While all share classes have the same underlying portfolio, their performance will differ.
The gross expense ratios of the Fund, as stated in the fee table of the prospectus dated May 1, 2017 are 0.81% and 1.13% for Class A and Class B shares, respectively, and may differ from the expense ratios disclosed in the Financial Highlights tables in this report.
Generally accepted accounting principles require adjustments to be made to the net assets of the Fund at period end for financial reporting purposes only, and as such, the total return based on the unadjusted net asset value per share may differ from the total return reported in the financial highlights.
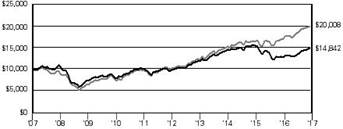
| Growth of an Assumed $10,000 Investment in Deutsche CROCI® U.S. VIP | ||
■ Deutsche CROCI® U.S. VIP — Class A ■ S&P 500 Index | The Standard & Poor’s 500 Index (S&P 500) is an unmanaged, capitalization-weighted index of 500 stocks. The index is designed to measure performance of the broad domestic economy through changes in the aggregate market value of 500 stocks representing all major industries. Index returns do not reflect any fees or expenses and it is not possible to invest directly into an index. Prior to October 3, 2016, the Fund had a different investment management team that operated with a different investment strategy. Performance would have been different if the Fund’s current strategy had been in effect. | |
 | ||
| Yearly periods ended June 30 | ||
| Comparative Results | ||||||
| Deutsche CROCI® U.S. VIP | 6-Month‡ | 1-Year | 3-Year | 5-Year | 10-Year | |
| Class A | Growth of $10,000 | $11,195 | $11,697 | $10,264 | $15,178 | $14,842 |
| Average annual total return | 11.95% | 16.97% | 0.87% | 8.70% | 4.03% | |
| S&P 500® Index | Growth of $10,000 | $10,934 | $11,790 | $13,170 | $19,792 | $20,008 |
| Average annual total return | 9.34% | 17.90% | 9.61% | 14.63% | 7.18% | |
| Deutsche CROCI® U.S. VIP | 6-Month‡ | 1-Year | 3-Year | 5-Year | 10-Year | |
| Class B | Growth of $10,000 | $11,180 | $11,671 | $10,180 | $14,957 | $14,391 |
| Average annual total return | 11.80% | 16.71% | 0.60% | 8.38% | 3.71% | |
| S&P 500® Index | Growth of $10,000 | $10,934 | $11,790 | $13,170 | $19,792 | $20,008 |
| Average annual total return | 9.34% | 17.90% | 9.61% | 14.63% | 7.18% | |
The growth of $10,000 is cumulative.
‡ Total returns shown for periods less than one year are not annualized.
Portfolio Summary (Unaudited)
| Asset Allocation (As a % of Investment Portfolio excluding Securities Lending Collateral) | 6/30/17 | 12/31/16 |
| Common Stocks | 99% | 99% |
| Cash Equivalents | 1% | 1% |
| 100% | 100% |
| Sector Diversification (As a % of Investment Portfolio excluding Cash Equivalents and Securities Lending Collateral) | 6/30/17 | 12/31/16 |
| Consumer Discretionary | 25% | 15% |
| Information Technology | 20% | 12% |
| Industrials | 15% | 12% |
| Health Care | 13% | 17% |
| Consumer Staples | 12% | 17% |
| Financials | 8% | — |
| Utilities | 5% | 21% |
| Materials | 2% | 3% |
| Telecommunication Services | — | 3% |
| 100% | 100% |
Portfolio holdings and characteristics are subject to change.
For more complete details about the Fund's investment portfolio, see page 5.
Following the Fund's fiscal first and third quarter-end, a complete portfolio holdings listing is filed with the SEC on Form N-Q. The form will be available on the SEC's Web site at sec.gov, and it also may be reviewed and copied at the SEC's Public Reference Room in Washington, D.C. Information on the operation of the SEC's Public Reference Room may be obtained by calling (800) SEC-0330. The Fund's portfolio holdings are also posted on deutschefunds.com from time to time. Please see the Fund's current prospectus for more information.
Portfolio Management Team
Di Kumble, CFA, Managing Director
John Moody, Vice President
Portfolio Managers
Investment Portfolio June 30, 2017 (Unaudited)
| Shares | Value ($) | |
| Common Stocks 99.6% | ||
| Consumer Discretionary 24.5% | ||
| Distributors 2.4% | ||
| Genuine Parts Co. | 64,277 | 5,962,335 |
| Household Durables 2.5% | ||
| D.R. Horton, Inc. | 175,516 | 6,067,588 |
| Media 14.9% | ||
| CBS Corp. "B" | 96,126 | 6,130,916 |
| Comcast Corp. "A" | 151,974 | 5,914,828 |
| Discovery Communications, Inc. "A"* (a) | 228,296 | 5,896,886 |
| Time Warner, Inc. | 60,798 | 6,104,727 |
| Twenty-First Century Fox, Inc. "A" | 219,492 | 6,220,404 |
| Walt Disney Co. | 55,137 | 5,858,306 |
| 36,126,067 | ||
| Multiline Retail 2.3% | ||
| Target Corp. | 106,724 | 5,580,598 |
| Textiles, Apparel & Luxury Goods 2.4% | ||
| Michael Kors Holdings Ltd.* | 162,033 | 5,873,696 |
| Consumer Staples 12.3% | ||
| Beverages 7.4% | ||
| Coca-Cola Co. | 135,449 | 6,074,888 |
| Dr. Pepper Snapple Group, Inc. | 65,343 | 5,953,401 |
| PepsiCo, Inc. | 52,182 | 6,026,499 |
| 18,054,788 | ||
| Food & Staples Retailing 2.4% | ||
| Wal-Mart Stores, Inc. | 75,629 | 5,723,603 |
| Household Products 2.5% | ||
| Procter & Gamble Co. | 69,037 | 6,016,574 |
| Financials 7.7% | ||
| Banks 5.2% | ||
| JPMorgan Chase & Co. | 70,544 | 6,447,722 |
| U.S. Bancorp. | 116,816 | 6,065,087 |
| 12,512,809 | ||
| Consumer Finance 2.5% | ||
| Capital One Financial Corp. | 74,886 | 6,187,081 |
| Health Care 13.0% | ||
| Biotechnology 5.5% | ||
| Amgen, Inc. | 38,768 | 6,677,013 |
| Gilead Sciences, Inc. | 92,558 | 6,551,255 |
| 13,228,268 | ||
| Pharmaceuticals 7.5% | ||
| Johnson & Johnson | 46,644 | 6,170,535 |
| Merck & Co., Inc. | 92,695 | 5,940,822 |
| Pfizer, Inc. | 184,843 | 6,208,876 |
| 18,320,233 | ||
| Industrials 14.9% | ||
| Aerospace & Defense 4.9% | ||
| Raytheon Co. | 36,936 | 5,964,425 |
| United Technologies Corp. | 48,945 | 5,976,674 |
| 11,941,099 | ||
| Shares | Value ($) | |
| Industrial Conglomerates 7.4% | ||
| 3M Co. | 29,987 | 6,242,993 |
| General Electric Co. | 211,569 | 5,714,479 |
| Honeywell International, Inc. | 45,206 | 6,025,508 |
| 17,982,980 | ||
| Machinery 2.6% | ||
| Illinois Tool Works, Inc. | 43,351 | 6,210,031 |
| Information Technology 19.7% | ||
| Communications Equipment 2.4% | ||
| Cisco Systems, Inc. | 188,534 | 5,901,114 |
| IT Services 4.9% | ||
| Amdocs Ltd. | 92,608 | 5,969,512 |
| International Business Machines Corp. | 38,961 | 5,993,370 |
| 11,962,882 | ||
| Semiconductors & Semiconductor Equipment 4.6% | ||
| Intel Corp. | 167,132 | 5,639,034 |
| Lam Research Corp. | 39,005 | 5,516,477 |
| 11,155,511 | ||
| Software 5.5% | ||
| CA, Inc. | 188,265 | 6,489,495 |
| Oracle Corp. | 133,729 | 6,705,172 |
| 13,194,667 | ||
| Technology Hardware, Storage & Peripherals 2.3% | ||
| Apple, Inc. | 38,787 | 5,586,104 |
| Materials 2.6% | ||
| Chemicals | ||
| LyondellBasell Industries NV "A" | 74,214 | 6,262,919 |
| Utilities 4.9% | ||
| Electric Utilities 2.5% | ||
| Edison International | 75,755 | 5,923,283 |
| Multi-Utilities 2.4% | ||
| DTE Energy Co. | 55,963 | 5,920,326 |
| Total Common Stocks (Cost $228,757,957) | 241,694,556 | |
| Securities Lending Collateral 2.5% | ||
| Deutsche Government & Agency Securities Portfolio "Deutsche Government Cash Institutional Shares", 0.87% (b) (c) (Cost $6,104,350) | 6,104,350 | 6,104,350 |
| Cash Equivalents 0.5% | ||
| Deutsche Central Cash Management Government Fund, 1.03% (b) (Cost $1,251,015) | 1,251,015 | 1,251,015 |
| % of Net Assets | Value ($) | |
| Total Investment Portfolio (Cost $236,113,322)† | 102.6 | 249,049,921 |
| Other Assets and Liabilities, Net | (2.6) | (6,367,535) |
| Net Assets | 100.0 | 242,682,386 |
* Non-income producing security.
† The cost for federal income tax purposes was $236,202,223. At June 30, 2017, net unrealized appreciation for all securities based on tax cost was $12,847,698. This consisted of aggregate gross unrealized appreciation for all securities in which there was an excess of value over tax cost of $17,283,613 and aggregate gross unrealized depreciation for all securities in which there was an excess of tax cost over value of $4,435,915.
(a) All or a portion of these securities were on loan. In addition, "Other Assets and Liabilities, Net" may include pending sales that are also on loan. The value of securities loaned at June 30, 2017 amounted to $5,894,406, which is 2.4% of net assets.
(b) Affiliated fund managed by Deutsche Investment Management Americas Inc. The rate shown is the annualized seven-day yield at period end.
(c) Represents collateral held in connection with securities lending. Income earned by the Fund is net of borrower rebates.
Fair Value Measurements
Various inputs are used in determining the value of the Fund's investments. These inputs are summarized in three broad levels. Level 1 includes quoted prices in active markets for identical securities. Level 2 includes other significant observable inputs (including quoted prices for similar securities, interest rates, prepayment speeds and credit risk). Level 3 includes significant unobservable inputs (including the Fund's own assumptions in determining the fair value of investments). The level assigned to the securities valuations may not be an indication of the risk or liquidity associated with investing in those securities.
The following is a summary of the inputs used as of June 30, 2017 in valuing the Fund's investments. For information on the Fund's policy regarding the valuation of investments, please refer to the Security Valuation section of Note A in the accompanying Notes to Financial Statements.
| Assets | Level 1 | Level 2 | Level 3 | Total |
| Common Stocks (d) | $ 241,694,556 | $ — | $ — | $ 241,694,556 |
| Short-Term Investment (d) | 7,355,365 | — | — | 7,355,365 |
| Total | $ 249,049,921 | $ — | $ — | $ 249,049,921 |
There have been no transfers between fair value measurement levels during the period ended June 30, 2017.
(d) See Investment Portfolio for additional detailed categorizations.
The accompanying notes are an integral part of the financial statements.
Statement of Assets and Liabilities
| as of June 30, 2017 (Unaudited) | |
| Assets | |
Investments: Investments in non-affiliated securities, at value (cost $228,757,957) — including $5,894,406 of securities loaned | $ 241,694,556 |
| Investment in Deutsche Government & Agency Securities Portfolio (cost $6,104,350)* | 6,104,350 |
| Investment in Deutsche Central Cash Management Government Fund (cost $1,251,015) | 1,251,015 |
| Total investments in securities, at value (cost $236,113,322) | 249,049,921 |
| Receivable for Fund shares sold | 1,377 |
| Dividends receivable | 466,488 |
| Interest receivable | 1,490 |
| Due from Advisor | 62,466 |
| Other assets | 1,263 |
| Total assets | 249,583,005 |
| Liabilities | |
| Payable upon return of securities loaned | 6,104,350 |
| Payable for Fund shares redeemed | 606,293 |
| Accrued management fee | 107,968 |
| Accrued Trustees' fees | 1,327 |
| Other accrued expenses and payables | 80,681 |
| Total liabilities | 6,900,619 |
| Net assets, at value | $ 242,682,386 |
| Net Assets Consist of | |
| Undistributed net investment income | 2,207,861 |
| Net unrealized appreciation (depreciation) on investments | 12,936,599 |
| Accumulated net realized gain (loss) | (9,261,837) |
| Paid-in capital | 236,799,763 |
| Net assets, at value | $ 242,682,386 |
Class A Net Asset Value, offering and redemption price per share ($239,035,903 ÷ 15,762,742 outstanding shares of beneficial interest, no par value, unlimited number of shares authorized) | $ 15.16 |
Class B Net Asset Value, offering and redemption price per share ($3,646,483 ÷ 239,608 outstanding shares of beneficial interest, no par value, unlimited number of shares authorized) | $ 15.22 |
* Represents collateral on securities loaned.
The accompanying notes are an integral part of the financial statements.
Statement of Operations
| for the six months ended June 30, 2017 (Unaudited) | |
| Investment Income | |
Income: Dividends | $ 2,885,281 |
| Income distributions — Deutsche Central Cash Management Government Fund | 4,969 |
| Securities lending income, net of borrower rebates | 661 |
| Total income | 2,890,911 |
Expenses: Management fee | 772,419 |
| Administration fee | 118,834 |
| Services to shareholders | 2,433 |
| Record keeping fees (Class B) | 1,286 |
| Distribution service fees (Class B) | 4,398 |
| Custodian fee | 4,533 |
| Professional fees | 39,214 |
| Reports to shareholders | 16,744 |
| Trustees' fees and expenses | 7,421 |
| Other | 7,973 |
| Total expenses before expense reductions | 975,255 |
| Expense reductions | (114,199) |
| Total expenses after expense reductions | 861,056 |
| Net investment income | $ 2,029,855 |
| Realized and Unrealized Gain (Loss) | |
Net realized gain (loss) from: Investments | 13,625,898 |
| Payments by affiliates (see Note F) | 62,466 |
| 13,688,364 | |
| Change in net unrealized appreciation (depreciation) on investments | 11,220,435 |
| Net gain (loss) | 24,908,799 |
| Net increase (decrease) in net assets resulting from operations | 26,938,654 |
The accompanying notes are an integral part of the financial statements.
Statements of Changes in Net Assets
| Increase (Decrease) in Net Assets | Six Months Ended June 30, 2017 (Unaudited) | Year Ended December 31, 2016 | |
Operations: Net investment income | $ 2,029,855 | $ 4,001,244 | |
| Net realized gain (loss) | 13,688,364 | (20,531,633) | |
| Change in net unrealized appreciation (depreciation) | 11,220,435 | 1,399,099 | |
| Net increase (decrease) in net assets resulting from operations | 26,938,654 | (15,131,290) | |
Distributions to shareholders from: Net investment income: Class A | (3,625,439) | (2,434,486) | |
| Class B | (42,548) | (25,893) | |
Net realized gains: Class A | — | (12,035,759) | |
| Class B | — | (185,570) | |
| Total distributions | (3,667,987) | (14,681,708) | |
Fund share transactions: Class A Proceeds from shares sold | 2,218,573 | 5,510,987 | |
| Reinvestment of distributions | 3,625,439 | 14,470,245 | |
| Payments for shares redeemed | (17,052,008) | (56,264,127) | |
| Net increase (decrease) in net assets from Class A share transactions | (11,207,996) | (36,282,895) | |
Class B Proceeds from shares sold | 84,526 | 525,700 | |
| Reinvestment of distributions | 42,548 | 211,463 | |
| Payments for shares redeemed | (344,183) | (1,258,566) | |
| Net increase (decrease) in net assets from Class B share transactions | (217,109) | (521,403) | |
| Increase (decrease) in net assets | 11,845,562 | (66,617,296) | |
| Net assets at beginning of period | 230,836,824 | 297,454,120 | |
| Net assets at end of period (including undistributed net investment income of $2,207,861 and $3,845,993, respectively) | $ 242,682,386 | $ 230,836,824 | |
| Other Information | |||
Class A Shares outstanding at beginning of period | 16,529,732 | 19,157,658 | |
| Shares sold | 152,519 | 405,203 | |
| Shares issued to shareholders in reinvestment of distributions | 245,460 | 1,079,869 | |
| Shares redeemed | (1,164,969) | (4,112,998) | |
| Net increase (decrease) in Class A shares | (766,990) | (2,627,926) | |
| Shares outstanding at end of period | 15,762,742 | 16,529,732 | |
Class B Shares outstanding at beginning of period | 254,820 | 291,996 | |
| Shares sold | 5,693 | 38,734 | |
| Shares issued to shareholders in reinvestment of distributions | 2,869 | 15,722 | |
| Shares redeemed | (23,774) | (91,632) | |
| Net increase (decrease) in Class B shares | (15,212) | (37,176) | |
| Shares outstanding at end of period | 239,608 | 254,820 | |
The accompanying notes are an integral part of the financial statements.
Financial Highlights
| Class A | Six Months Ended 6/30/17 (Unaudited) | Years Ended December 31, | |||||
| 2016 | 2015 | 2014 | 2013 | 2012 | |||
| Selected Per Share Data | |||||||
| Net asset value, beginning of period | $ 13.75 | $ 15.29 | $ 17.38 | $ 15.97 | $ 12.45 | $ 11.56 | |
Income (loss) from investment operations: Net investment income (loss)a | .12 | .23 | .11 | .24 | .26 | .25 | |
| Net realized and unrealized gain (loss) | 1.52 | (.93) | (1.20) | 1.45 | 3.54 | .87 | |
| Total from investment operations | 1.64 | (.70) | (1.09) | 1.69 | 3.80 | 1.12 | |
Less distributions from: Net investment income | (.23) | (.14) | (.25) | (.28) | (.28) | (.23) | |
| Net realized gains on investment transactions | — | (.70) | (.75) | — | — | — | |
| Total distributions | (.23) | (.84) | (1.00) | (.28) | (.28) | (.23) | |
| Net asset value, end of period | $ 15.16 | $ 13.75 | $ 15.29 | $ 17.38 | $ 15.97 | $ 12.45 | |
| Total Return (%)b | 11.95c** | (4.39) | (6.87) | 10.72 | 30.89 | 9.79 | |
| Ratios to Average Net Assets and Supplemental Data | |||||||
| Net assets, end of period ($ millions) | 239 | 227 | 293 | 430 | 432 | 377 | |
| Ratio of expenses before expense reductions (%)d | .82* | .81 | .78 | .78 | .78 | .78 | |
| Ratio of expenses after expense reductions (%)d | .72* | .74 | .73 | .73 | .74 | .77 | |
| Ratio of net investment income (loss) (%) | 1.71* | 1.66 | .65 | 1.43 | 1.82 | 2.04 | |
| Portfolio turnover rate (%) | 53** | 293 | 121 | 133 | 54 | 63 | |
a Based on average shares outstanding during the period. b Total return would have been lower had certain expenses not been reduced. c The Fund’s total return includes a reimbursement by the Adviser for commission costs incurred in connection with purchases and sales of portfolio assets due to the change in investment strategy, which otherwise would have reduced total return by 0.03%. d Expense ratio does not reflect charges and fees associated with the separate account that invests in the Fund or any variable life insurance policy or variable annuity contract for which the Fund is an investment option. * Annualized ** Not annualized | |||||||
| Class B | Six Months Ended 6/30/17 (Unaudited) | Years Ended December 31, | |||||
| 2016 | 2015 | 2014 | 2013 | 2012 | |||
| Selected Per Share Data | |||||||
| Net asset value, beginning of period | $ 13.78 | $ 15.31 | $ 17.40 | $ 15.99 | $ 12.46 | $ 11.57 | |
Income (loss) from investment operations: Net investment income (loss)a | .10 | .19 | .06 | .18 | .22 | .21 | |
| Net realized and unrealized gain (loss) | 1.52 | (.92) | (1.21) | 1.46 | 3.55 | .88 | |
| Total from investment operations | 1.62 | (.73) | (1.15) | 1.64 | 3.77 | 1.09 | |
Less distributions from: Net investment income | (.18) | (.10) | (.19) | (.23) | (.24) | (.20) | |
| Net realized gains on investment transactions | — | (.70) | (.75) | — | — | — | |
| Total distributions | (.18) | (.80) | (.94) | (.23) | (.24) | (.20) | |
| Net asset value, end of period | $ 15.22 | $ 13.78 | $ 15.31 | $ 17.40 | $ 15.99 | $ 12.46 | |
| Total Return (%)b | 11.80c** | (4.62) | (7.16) | 10.36 | 30.54 | 9.44 | |
| Ratios to Average Net Assets and Supplemental Data | |||||||
| Net assets, end of period ($ millions) | 4 | 4 | 4 | 5 | 5 | 4 | |
| Ratio of expenses before expense reductions (%)d | 1.15* | 1.13 | 1.10 | 1.09 | 1.09 | 1.09 | |
| Ratio of expenses after expense reductions (%)d | 1.03* | 1.05 | 1.04 | 1.04 | 1.05 | 1.08 | |
| Ratio of net investment income (loss) (%) | 1.40* | 1.37 | .35 | 1.10 | 1.52 | 1.73 | |
| Portfolio turnover rate (%) | 53** | 293 | 121 | 133 | 54 | 63 | |
a Based on average shares outstanding during the period. b Total return would have been lower had certain expenses not been reduced. c The Fund’s total return includes a reimbursement by the Adviser for commission costs incurred in connection with purchases and sales of portfolio assets due to the change in investment strategy, which otherwise would have reduced total return by 0.03%. d Expense ratio does not reflect charges and fees associated with the separate account that invests in the Fund or any variable life insurance policy or variable annuity contract for which the Fund is an investment option. * Annualized ** Not annualized | |||||||
Notes to Financial Statements (Unaudited)
A. Organization and Significant Accounting Policies
Deutsche CROCI® U.S. VIP (formerly Deutsche Large Cap Value VIP) (the "Fund") is a diversified series of Deutsche Variable Series II (the "Trust"), which is registered under the Investment Company Act of 1940, as amended (the "1940 Act"), as an open-end management investment company organized as a Massachusetts business trust.
Multiple Classes of Shares of Beneficial Interest. The Fund offers two classes of shares (Class A shares and Class B shares). Sales of Class B shares are subject to recordkeeping fees up to 0.15% and Rule 12b-1 fees under the 1940 Act equal to an annual rate of 0.25% of the average daily net assets of the Class B shares of the Fund. Class A shares are not subject to such fees.
Investment income, realized and unrealized gains and losses, and certain fund-level expenses and expense reductions, if any, are borne pro rata on the basis of relative net assets by the holders of all classes of shares except that each class bears certain expenses unique to that class (including the applicable Rule 12b-1 fee and recordkeeping fees). Differences in class-level expenses may result in payment of different per share dividends by class. All shares have equal rights with respect to voting subject to class-specific arrangements.
The Fund's financial statements are prepared in accordance with accounting principles generally accepted in the United States of America ("U.S. GAAP") which require the use of management estimates. Actual results could differ from those estimates. The Fund qualifies as an investment company under Topic 946 of Accounting Standards Codification of U.S. GAAP. The policies described below are followed consistently by the Fund in the preparation of its financial statements.
Security Valuation. Investments are stated at value determined as of the close of regular trading on the New York Stock Exchange on each day the exchange is open for trading.
Various inputs are used in determining the value of the Fund's investments. These inputs are summarized in three broad levels. Level 1 includes quoted prices in active markets for identical securities. Level 2 includes other significant observable inputs (including quoted prices for similar securities, interest rates, prepayment speeds and credit risk). Level 3 includes significant unobservable inputs (including the Fund's own assumptions in determining the fair value of investments). The level assigned to the securities valuations may not be an indication of the risk or liquidity associated with investing in those securities.
Equity securities are valued at the most recent sale price or official closing price reported on the exchange (U.S. or foreign) or over-the-counter market on which they trade. Securities for which no sales are reported are valued at the calculated mean between the most recent bid and asked quotations on the relevant market or, if a mean cannot be determined, at the most recent bid quotation. Equity securities are generally categorized as Level 1.
Investments in open-end investment companies are valued at their net asset value each business day and are categorized as Level 1.
Securities and other assets for which market quotations are not readily available or for which the above valuation procedures are deemed not to reflect fair value are valued in a manner that is intended to reflect their fair value as determined in accordance with procedures approved by the Board and are generally categorized as Level 3. In accordance with the Fund's valuation procedures, factors considered in determining value may include, but are not limited to, the type of the security; the size of the holding; the initial cost of the security; the existence of any contractual restrictions on the security's disposition; the price and extent of public trading in similar securities of the issuer or of comparable companies; quotations or evaluated prices from broker-dealers and/or pricing services; information obtained from the issuer, analysts, and/or the appropriate stock exchange (for exchange-traded securities); an analysis of the company's or issuer's financial statements; an evaluation of the forces that influence the issuer and the market(s) in which the security is purchased and sold; and with respect to debt securities, the maturity, coupon, creditworthiness, currency denomination and the movement of the market in which the security is normally traded. The value determined under these procedures may differ from published values for the same securities.
Disclosure about the classification of fair value measurements is included in a table following the Fund's Investment Portfolio.
Foreign Currency Translations. The books and records of the Fund are maintained in U.S. dollars. Investment securities and other assets and liabilities denominated in a foreign currency are translated into U.S. dollars at the prevailing exchange rates at period end. Purchases and sales of investment securities, income and expenses are translated into U.S. dollars at the prevailing exchange rates on the respective dates of the transactions.
Net realized and unrealized gains and losses on foreign currency transactions represent net gains and losses between trade and settlement dates on securities transactions, the acquisition and disposition of foreign currencies, and the difference between the amount of net investment income accrued and the U.S. dollar amount actually received. The portion of both realized and unrealized gains and losses on investments that results from fluctuations in foreign currency exchange rates is not separately disclosed but is included with net realized and unrealized gain/appreciation and loss/depreciation on investments.
Securities Lending. Deutsche Bank AG, as lending agent, lends securities of the Fund to certain financial institutions under the terms of its securities lending agreement. During the term of the loans, the Fund continues to receive interest and dividends generated by the securities and to participate in any changes in their market value. The Fund requires the borrowers of the securities to maintain collateral with the Fund consisting of either cash or liquid, unencumbered assets having a value at least equal to the value of the securities loaned. When the collateral falls below specified amounts, the lending agent will use its best effort to obtain additional collateral on the next business day to meet required amounts under the securities lending agreement. As of period end, any securities on loan were collateralized by cash. During the six months ended June 30, 2017, the Fund invested the cash collateral into a joint trading account in affiliated money market funds managed by Deutsche Investment Management Americas Inc. As of June 30, 2017, the Fund invested the cash collateral in Deutsche Government & Agency Securities Portfolio. Deutsche Investment Management Americas Inc. receives a management/administration fee (0.13% annualized effective rate as of June 30, 2017) on the cash collateral invested in Deutsche Government & Agency Securities Portfolio. The Fund receives compensation for lending its securities either in the form of fees or by earning interest on invested cash collateral net of borrower rebates and fees paid to a lending agent. Either the Fund or the borrower may terminate the loan at any time, and the borrower, after notice, is required to return borrowed securities within a standard time period. There may be risks of delay and costs in recovery of securities or even loss of rights in the collateral should the borrower of the securities fail financially. If the Fund is not able to recover securities lent, the Fund may sell the collateral and purchase a replacement investment in the market, incurring the risk that the value of the replacement security is greater than the value of the collateral. The Fund is also subject to all investment risks associated with the reinvestment of any cash collateral received, including, but not limited to, interest rate, credit and liquidity risk associated with such investments.
As of June 30, 2017, the Fund had securities on loan, which were classified as common stock in the Investment Portfolio. The value of the related collateral exceeded the value of the securities loaned at period end. As of period end, the remaining contractual maturity of the collateral agreements were overnight and continuous.
Federal Income Taxes. The Fund's policy is to comply with the requirements of the Internal Revenue Code, as amended, which are applicable to regulated investment companies and to distribute all of its taxable income to its shareholders.
At December 31, 2016, the Fund had a net tax basis capital loss carryforward of approximately $22,862,000, which may be applied against realized net taxable capital gains indefinitely, including short-term losses ($20,822,000) and long-term losses ($2,040,000).
The Fund has reviewed the tax positions for the open tax years as of December 31, 2016 and has determined that no provision for income tax and/or uncertain tax provisions is required in the Fund's financial statements. The Fund's federal tax returns for the prior three fiscal years remain open subject to examination by the Internal Revenue Service.
Distribution of Income and Gains. Distributions from net investment income of the Fund, if any, is declared and distributed to shareholders annually. Net realized gains from investment transactions, in excess of available capital loss carryforwards, would be taxable to the Fund if not distributed and, therefore, will be distributed to shareholders at least annually. The Fund may also make additional distributions for tax purposes if necessary.
The timing and characterization of certain income and capital gain distributions are determined annually in accordance with federal tax regulations which may differ from accounting principles generally accepted in the United States of America. These differences primarily relate to certain securities sold at a loss. As a result, net investment income (loss) and net realized gain (loss) on investment transactions for a reporting period may differ significantly from distributions during such period. Accordingly, the Fund may periodically make reclassifications among certain of its capital accounts without impacting the net asset value of the Fund.
The tax character of current year distributions will be determined at the end of the current fiscal year.
Expenses. Expenses of the Trust arising in connection with a specific fund are allocated to that fund. Other Trust expenses which cannot be directly attributed to a fund are apportioned among the funds in the Trust based upon the relative net assets or other appropriate measures.
Contingencies. In the normal course of business, the Fund may enter into contracts with service providers that contain general indemnification clauses. The Fund's maximum exposure under these arrangements is unknown, as this would involve future claims that may be made against the Fund that have not yet been made. However, based on experience, the Fund expects the risk of loss to be remote.
Other. Investment transactions are accounted for on a trade date plus one basis for daily net asset value calculations. However, for financial reporting purposes, investment transactions are reported on trade date. Interest income is recorded on the accrual basis. Dividend income is recorded on the ex-dividend date net of foreign withholding taxes. Realized gains and losses from investment transactions are recorded on an identified cost basis. Proceeds from litigation payments, if any, are included in net realized gain (loss) from investments.
B. Purchases and Sales of Securities
During the six months ended June 30, 2017, purchases and sales of investment transactions (excluding short-term investments) aggregated $126,574,448 and $136,836,183, respectively.
C. Related Parties
Management Agreement. Under the Investment Management Agreement with Deutsche Investment Management Americas Inc. ("DIMA" or the "Advisor"), an indirect, wholly owned subsidiary of Deutsche Bank AG, the Advisor directs the investments of the Fund in accordance with its investment objectives, policies and restrictions. The Advisor determines the securities, instruments and other contracts relating to investments to be purchased, sold or entered into by the Fund.
Under the Investment Management Agreement with the Advisor, the Fund pays a monthly management fee based on the Fund's average daily net assets, computed and accrued daily and payable monthly, at the following annual rates:
| First $250 million | .650% |
| Next $750 million | .625% |
| Next $1.5 billion | .600% |
| Next $2.5 billion | .575% |
| Next $2.5 billion | .550% |
| Next $2.5 billion | .525% |
| Next $2.5 billion | .500% |
| Over $12.5 billion | .475% |
Accordingly, for the six months ended June 30, 2017, the fee pursuant to the Investment Management Agreement was equivalent to an annualized rate (exclusive of any applicable waivers/reimbursements) of 0.65% of the Fund's average daily net assets.
For the period from January 1, 2017 through April 30, 2018, the Advisor has contractually agreed to waive all or a portion of its fee and/or reimburse certain operating expenses of the Fund to the extent necessary to maintain the total annual operating expenses (excluding certain expenses such as extraordinary expenses, taxes, brokerage and interest expense) of each class as follows:
| Class A | .72% |
| Class B | 1.03% |
For the six months ended June 30, 2017, fees waived and/or expenses reimbursed for each class are as follows:
| Class A | $ 112,176 |
| Class B | 2,023 |
| $ 114,199 |
Administration Fee. Pursuant to an Administrative Services Agreement, DIMA provides most administrative services to the Fund. For all services provided under the Administrative Services Agreement, the Fund pays DIMA an annual fee ("Administration Fee") of 0.10% of the Fund's average daily net assets, computed and accrued daily and payable monthly. For the six months ended June 30, 2017, the Administration Fee was $118,834, of which $20,014 is unpaid.
Service Provider Fees. Deutsche AM Service Company ("DSC"), an affiliate of the Advisor, is the transfer agent, dividend-paying agent and shareholder service agent for the Fund. Pursuant to a sub-transfer agency agreement between DSC and DST Systems, Inc. ("DST"), DSC has delegated certain transfer agent, dividend-paying agent and shareholder service agent functions to DST. DSC compensates DST out of the shareholder servicing fee it receives from the Fund. For the six months ended June 30, 2017, the amounts charged to the Fund by DSC were as follows:
| Services to Shareholders | Total Aggregated | Unpaid at June 30, 2017 |
| Class A | $ 195 | $ 97 |
| Class B | 111 | 50 |
| $ 306 | $ 147 |
Distribution Service Agreement. Under the Fund's Class B 12b-1 plan, Deutsche AM Distributors, Inc. ("DDI") received a fee ("Distribution Service Fee") of 0.25% of average daily net assets of Class B shares. For the six months ended June 30, 2017, the Distribution Service Fee aggregated $4,398, of which $744 is unpaid.
Typesetting and Filing Service Fees. Under an agreement with DIMA, DIMA is compensated for providing typesetting and certain regulatory filing services to the Fund. For the six months ended June 30, 2017, the amount charged to the Fund by DIMA included in the Statement of Operations under "Reports to shareholders" aggregated $5,973, of which $4,412 is unpaid.
Trustees' Fees and Expenses. The Fund paid retainer fees to each Trustee not affiliated with the Advisor, plus specified amounts to the Board Chairperson and Vice Chairperson and to each committee Chairperson.
Affiliated Cash Management Vehicles. The Fund may invest uninvested cash balances in Deutsche Central Cash Management Government Fund and Deutsche Variable NAV Money Fund, affiliated money market funds which are managed by the Advisor. Each affiliated money market fund is managed in accordance with Rule 2a-7 under the 1940 Act, which governs the quality, maturity, diversity and liquidity of instruments in which a money market fund may invest. Deutsche Central Cash Management Government Fund seeks to maintain a stable net asset value, and Deutsche Variable NAV Money Fund maintains a floating net asset value. The Fund indirectly bears its proportionate share of the expenses of each affiliated money market fund in which it invests. Deutsche Central Cash Management Government Fund does not pay the Advisor an investment management fee. To the extent that Deutsche Variable NAV Money Fund pays an investment management fee to the Advisor, the Advisor will waive an amount of the investment management fee payable to the Advisor by the Fund equal to the amount of the investment management fee payable on the Fund's assets invested in Deutsche Variable NAV Money Fund.
Securities Lending Agent Fees. Deutsche Bank AG serves as securities lending agent for the Fund. For the six months ended June 30, 2017, the Fund incurred securities lending agent fees to Deutsche Bank AG in the amount of $50.
D. Ownership of the Fund
At June 30, 2017, three participating insurance companies were owners of record of 10% or more of the total outstanding Class A shares of the Fund, each owning 51%, 27% and 16%. Two participating insurance companies were owners of record of 10% or more of the total outstanding Class B shares of the Fund, each owning 63% and 14%.
E. Line of Credit
The Fund and other affiliated funds (the "Participants") share in a $400 million revolving credit facility provided by a syndication of banks. The Fund may borrow for temporary or emergency purposes, including the meeting of redemption requests that otherwise might require the untimely disposition of securities. The Participants are charged an annual commitment fee which is allocated based on net assets, among each of the Participants. Interest is calculated at a rate per annum equal to the sum of the Federal Funds Rate plus 1.25 percent plus if the one-month LIBOR exceeds the Federal Funds Rate, the amount of such excess. The Fund may borrow up to a maximum of 33 percent of its net assets under the agreement. The Fund had no outstanding loans at June 30, 2017.
F. Payment by Affiliate
During the six months ended June 30, 2017, the Advisor agreed to reimburse the Fund $62,466 for commission costs incurred in connection with purchases and sales of portfolio assets due to the change in investment strategy. The amount reimbursed was 0.03% of the Fund's average net assets.
Information About Your Fund's Expenses (Unaudited)
As an investor of the Fund, you incur two types of costs: ongoing expenses and transaction costs. Ongoing expenses include management fees, distribution and service (12b-1) fees and other Fund expenses. Examples of transaction costs include contract charges, which are not shown in this section. The following tables are intended to help you understand your ongoing expenses (in dollars) of investing in the Fund and to help you compare these expenses with the ongoing expenses of investing in other mutual funds. In the most recent six-month period, the Fund limited these expenses; had it not done so, expenses would have been higher. The example in the table is based on an investment of $1,000 invested at the beginning of the six-month period and held for the entire period (January 1, 2017 to June 30, 2017).
The tables illustrate your Fund's expenses in two ways:
— Actual Fund Return. This helps you estimate the actual dollar amount of ongoing expenses (but not transaction costs) paid on a $1,000 investment in the Fund using the Fund's actual return during the period. To estimate the expenses you paid over the period, simply divide your account value by $1,000 (for example, an $8,600 account value divided by $1,000 = 8.6), then multiply the result by the number in the "Expenses Paid per $1,000" line under the share class you hold.
— Hypothetical 5% Fund Return. This helps you to compare your Fund's ongoing expenses (but not transaction costs) with those of other mutual funds using the Fund's actual expense ratio and a hypothetical rate of return of 5% per year before expenses. Examples using a 5% hypothetical Fund return may be found in the shareholder reports of other mutual funds. The hypothetical account values and expenses may not be used to estimate the actual ending account balance or expenses you paid for the period.
Please note that the expenses shown in these tables are meant to highlight your ongoing expenses only and do not reflect any transaction costs. The "Expenses Paid per $1,000" line of the tables is useful in comparing ongoing expenses only and will not help you determine the relative total expense of owning different funds. If these transaction costs had been included, your costs would have been higher.
| Expenses and Value of a $1,000 Investment for the six months ended June 30, 2017 | ||||
| Actual Fund Return | Class A | Class B | ||
| Beginning Account Value 1/1/17 | $ 1,000.00 | $ 1,000.00 | ||
| Ending Account Value 6/30/17 | $ 1,119.50 | $ 1,118.00 | ||
| Expenses Paid per $1,000* | $ 3.78 | $ 5.41 | ||
| Hypothetical 5% Fund Return | Class A | Class B | ||
| Beginning Account Value 1/1/17 | $ 1,000.00 | $ 1,000.00 | ||
| Ending Account Value 6/30/17 | $ 1,021.22 | $ 1,019.69 | ||
| Expenses Paid per $1,000* | $ 3.61 | $ 5.16 | ||
* Expenses are equal to the Fund's annualized expense ratio for each share class, multiplied by the average account value over the period, multiplied by 181 (the number of days in the most recent six-month period), then divided by 365.
| Annualized Expense Ratios | Class A | Class B | ||
| Deutsche Variable Series II — Deutsche CROCI® U.S. VIP | .72% | 1.03% |
For more information, please refer to the Fund's prospectus.
These tables do not reflect charges and fees ("contract charges") associated with the separate account that invests in the Fund or any variable life insurance policy or variable annuity contract for which the Fund is an investment option.
For an analysis of the fees associated with an investment in the fund or similar funds, please refer to the current and hypothetical expense calculators for Variable Insurance Products which can be found at deutschefunds.com/EN/resources/calculators.jsp.
Proxy Voting
The Trust's policies and procedures for voting proxies for portfolio securities and information about how the Trust voted proxies related to its portfolio securities during the most recent 12-month period ended June 30 are available on our Web site — deutschefunds.com (click on "proxy voting" at the bottom of the page) — or on the SEC's Web site — sec.gov. To obtain a written copy of the Trust's policies and procedures without charge, upon request, call us toll free at (800) 728-3337.
Advisory Agreement Board Considerations and Fee Evaluation
The Board of Trustees (hereinafter referred to as the "Board" or "Trustees") approved the renewal of Deutsche Large Cap Value VIP’s (now known as the Deutsche CROCI® U.S. VIP) (the "Fund") investment management agreement (the "Agreement") with Deutsche Investment Management Americas Inc. ("DIMA") in September 2016.
In terms of the process that the Board followed prior to approving the Agreement, shareholders should know that:
— During the entire process, all of the Fund’s Trustees were independent of DIMA and its affiliates (the "Independent Trustees").
— The Board met frequently during the past year to discuss fund matters and dedicated a substantial amount of time to contract review matters. Over the course of several months, the Board’s Contract Committee reviewed extensive materials received from DIMA, independent third parties and independent counsel. These materials included an analysis of the Fund’s performance, fees and expenses, and profitability from a fee consultant retained by the Fund’s Independent Trustees (the "Fee Consultant"). The Board also received extensive information throughout the year regarding performance of the Fund.
— The Independent Trustees regularly meet privately with counsel to discuss contract review and other matters. In addition, the Independent Trustees were advised by the Fee Consultant in the course of their review of the Fund’s contractual arrangements and considered a comprehensive report prepared by the Fee Consultant in connection with their deliberations.
— In connection with reviewing the Agreement, the Board also reviewed the terms of the Fund’s Rule 12b-1 plan, distribution agreement, administrative services agreement, transfer agency agreement and other material service agreements.
— Based on its evaluation of the information provided, the Contract Committee presented its findings and recommendations to the Board. The Board then reviewed the Contract Committee’s findings and recommendations.
In connection with the contract review process, the Contract Committee and the Board considered the factors discussed below, among others. The Board also considered that DIMA and its predecessors have managed the Fund since its inception, and the Board believes that a long-term relationship with a capable, conscientious advisor is in the best interests of the Fund. The Board considered, generally, that shareholders chose to invest or remain invested in the Fund knowing that DIMA managed the Fund, and that the Agreement was approved by the Fund’s shareholders. DIMA is part of Deutsche Bank AG’s ("Deutsche Bank") Asset Management ("Deutsche AM") division. Deutsche AM is a global asset management business that offers a wide range of investing expertise and resources, including research capabilities in many countries throughout the world. Deutsche Bank has advised the Board that the U.S. asset management business continues to be a critical and integral part of Deutsche Bank, and that Deutsche Bank will continue to invest in Deutsche AM and seek to enhance Deutsche AM’s investment platform. Deutsche Bank also has confirmed its commitment to maintaining strong legal and compliance groups within the Deutsche AM division.
As part of the contract review process, the Board carefully considered the fees and expenses of each Deutsche fund overseen by the Board in light of the fund’s performance. In many cases, this led to the negotiation and implementation of expense caps. As part of these negotiations, the Board indicated that it would consider relaxing these caps in future years following sustained improvements in performance, among other considerations.
While shareholders may focus primarily on fund performance and fees, the Fund’s Board considers these and many other factors, including the quality and integrity of DIMA’s personnel and such other issues as back-office operations, fund valuations, and compliance policies and procedures.
Nature, Quality and Extent of Services. The Board considered the terms of the Agreement, including the scope of advisory services provided under the Agreement. The Board noted that, under the Agreement, DIMA provides portfolio management services to the Fund and that, pursuant to a separate administrative services agreement, DIMA provides administrative services to the Fund. The Board considered the experience and skills of senior management and investment personnel and the resources made available to such personnel. The Board reviewed the Fund’s performance over short-term and long-term periods and compared those returns to various agreed-upon performance measures, including market index(es) and a peer universe compiled using information supplied by Morningstar Direct ("Morningstar"), an independent fund data service. The Board also noted that it has put into place a process of identifying "Focus Funds" (e.g., funds performing poorly relative to a peer universe), and receives additional reporting from DIMA regarding such funds and, where appropriate, DIMA’s plans to address underperformance. The Board believes this process is an effective manner of identifying and addressing underperforming funds. Based on the information provided, the Board noted that for the one-, three- and five-year periods ended December 31, 2015, the Fund’s performance (Class A shares) was in the 4th quartile of the applicable Morningstar universe (the 1st quartile being the best performers and the 4th quartile being the worst performers). The Board also observed that the Fund has underperformed its benchmark in the one-, three- and five-year periods ended December 31, 2015. The Board noted the disappointing investment performance of the Fund in recent periods and continued to discuss with senior management of DIMA the factors contributing to such underperformance and actions being taken to improve performance. The Board considered that on or about October 3, 2016, the Fund would change its investment strategy and portfolio managers. The Board recognized the efforts by DIMA in recent years to enhance its investment platform and improve long-term performance across the Deutsche fund complex.
Fees and Expenses. The Board considered the Fund’s investment management fee schedule, operating expenses and total expense ratios, and comparative information provided by Broadridge Financial Solutions, Inc. ("Broadridge") and the Fee Consultant regarding investment management fee rates paid to other investment advisors by similar funds (1st quartile being the most favorable and 4th quartile being the least favorable). With respect to management fees paid to other investment advisors by similar funds, the Board noted that the contractual fee rates paid by the Fund, which include a 0.10% fee paid to DIMA under the Fund’s administrative services agreement, were equal to the median of the applicable Broadridge peer group (based on Broadridge data provided as of December 31, 2015). The Board noted that the Fund’s Class A shares total (net) operating expenses were expected to be lower than the median (2nd quartile) of the applicable Broadridge expense universe (based on Broadridge data provided as of December 31, 2015, and analyzing Broadridge expense universe Class A (net) expenses less any applicable 12b-1 fees) ("Broadridge Universe Expenses"). The Board also reviewed data comparing each share class’s total (net) operating expenses to the applicable Broadridge Universe Expenses. The Board noted that the expense limitations agreed to by DIMA were expected to help the Fund’s total (net) operating expenses remain competitive. The Board considered the Fund’s management fee rate as compared to fees charged by DIMA to comparable Deutsche U.S. registered funds ("Deutsche Funds") and considered differences between the Fund and the comparable Deutsche Funds. The information requested by the Board as part of its review of fees and expenses also included information about institutional accounts (including any sub-advised funds and accounts) and funds offered primarily to European investors ("Deutsche Europe funds") managed by Deutsche AM. The Board noted that DIMA indicated that Deutsche AM does not manage any institutional accounts or Deutsche Europe funds comparable to the Fund.
On the basis of the information provided, the Board concluded that management fees were reasonable and appropriate in light of the nature, quality and extent of services provided by DIMA.
Profitability. The Board reviewed detailed information regarding revenues received by DIMA under the Agreement. The Board considered the estimated costs and pre-tax profits realized by DIMA from advising the Deutsche Funds, as well as estimates of the pre-tax profits attributable to managing the Fund in particular. The Board also received information regarding the estimated enterprise-wide profitability of DIMA and its affiliates with respect to all fund services in totality and by fund. The Board and the Fee Consultant reviewed DIMA’s methodology in allocating its costs to the management of the Fund. Based on the information provided, the Board concluded that the pre-tax profits realized by DIMA in connection with the management of the Fund were not unreasonable. The Board also reviewed certain publicly available information regarding the profitability of certain similar investment management firms. The Board noted that while information regarding the profitability of such firms is limited (and in some cases is not necessarily prepared on a comparable basis), DIMA and its affiliates’ overall profitability with respect to the Deutsche Funds (after taking into account distribution and other services provided to the funds by DIMA and its affiliates) was lower than the overall profitability levels of most comparable firms for which such data was available.
Economies of Scale. The Board considered whether there are economies of scale with respect to the management of the Fund and whether the Fund benefits from any economies of scale. The Board noted that the Fund’s investment management fee schedule includes fee breakpoints. The Board concluded that the Fund’s fee schedule represents an appropriate sharing between the Fund and DIMA of such economies of scale as may exist in the management of the Fund at current asset levels.
Other Benefits to DIMA and Its Affiliates. The Board also considered the character and amount of other incidental benefits received by DIMA and its affiliates, including any fees received by DIMA for administrative services provided to the Fund and any fees received by an affiliate of DIMA for distribution services. The Board also considered benefits to DIMA related to brokerage and soft-dollar allocations, including allocating brokerage to pay for research generated by parties other than the executing broker dealers, which pertain primarily to funds investing in equity securities, along with the incidental public relations benefits to DIMA related to Deutsche Funds advertising and cross-selling opportunities among DIMA products and services. The Board considered these benefits in reaching its conclusion that the Fund’s management fees were reasonable.
Compliance. The Board considered the significant attention and resources dedicated by DIMA to documenting and enhancing its compliance processes in recent years. The Board noted in particular (i) the experience, seniority and time commitment of the individuals serving as DIMA’s and the Fund’s chief compliance officers; (ii) the large number of DIMA compliance personnel; and (iii) the substantial commitment of resources by DIMA and its affiliates to compliance matters.
Based on all of the information considered and the conclusions reached, the Board unanimously determined that the continuation of the Agreement is in the best interests of the Fund. In making this determination, the Board did not give particular weight to any single factor identified above. The Board considered these factors over the course of numerous meetings, certain of which were in executive session with only the Independent Trustees and counsel present. It is possible that individual Independent Trustees may have weighed these factors differently in reaching their individual decisions to approve the continuation of the Agreement.
Notes

VS2CUS-3 (R-028386-6 8/17)

June 30, 2017
Semiannual Report
Deutsche Variable Series II
Deutsche Global Equity VIP

Contents
3 Performance Summary 4 Portfolio Summary 4 Portfolio Management Team 5 Investment Portfolio 8 Statement of Assets and Liabilities 8 Statement of Operations 9 Statements of Changes in Net Assets 11 Financial Highlights 12 Notes to Financial Statements 16 Information About Your Fund's Expenses 17 Proxy Voting 18 Advisory Agreement Board Considerations and Fee Evaluation |
This report must be preceded or accompanied by a prospectus. To obtain an additional prospectus or summary prospectus, if available, call (800) 728-3337 or your financial representative. We advise you to consider the Fund's objectives, risks, charges and expenses carefully before investing. The summary prospectus and prospectus contain this and other important information about the Fund. Please read the prospectus carefully before you invest.
Stocks may decline in value. Investing in foreign securities, particularly those of emerging markets, presents certain risks, such as currency fluctuations, political and economic changes, and market risks. Emerging markets tend to be more volatile and less liquid than the markets of more mature economies, and generally have less diverse and less mature economic structures and less stable political systems than those of developed countries. Investing in derivatives entails special risks relating to liquidity, leverage and credit that may reduce returns and/or increase volatility. The Fund may lend securities to approved institutions. See the prospectus for details.
Deutsche Asset Management represents the asset management activities conducted by Deutsche Bank AG or any of its subsidiaries.
Deutsche AM Distributors, Inc., 222 South Riverside Plaza, Chicago, IL 60606, (800) 621-1148
NOT FDIC/NCUA INSURED NO BANK GUARANTEE MAY LOSE VALUE NOT A DEPOSIT
NOT INSURED BY ANY FEDERAL GOVERNMENT AGENCY
Performance Summary June 30, 2017 (Unaudited)
Fund performance shown is historical, assumes reinvestment of all dividend and capital gain distributions and does not guarantee future results. Investment return and principal value fluctuate with changing market conditions so that, when redeemed, shares may be worth more or less than their original cost. Current performance may be lower or higher than the performance data quoted. Please contact your participating insurance company for the Fund's most recent month-end performance. Performance doesn't reflect charges and fees ("contract charges") associated with the separate account that invests in the Fund or any variable life insurance policy or variable annuity contract for which the Fund is an investment option. These charges and fees will reduce returns.
The gross expense ratio of the Fund, as stated in the fee table of the prospectus dated May 1, 2017 is 1.03% for Class A shares and may differ from the expense ratio disclosed in the Financial Highlights table in this report.
Generally accepted accounting principles require adjustments to be made to the net assets of the Fund at period end for financial reporting purposes only, and as such, the total return based on the unadjusted net asset value per share may differ from the total return reported in the financial highlights.
| Growth of an Assumed $10,000 Investment in Deutsche Global Equity VIP | ||
■ Deutsche Global Equity VIP — Class A ■ MSCI All Country World Index | The MSCI All Country World Index captures large and mid cap representation across 23 Developed Markets and 23 Emerging Markets countries. Index returns do not reflect any fees or expenses and it is not possible to invest directly into an index. | |
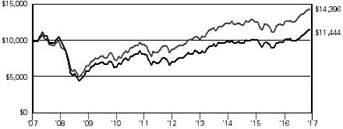 | ||
| Yearly periods ended June 30 | ||
| Comparative Results | ||||||
| Deutsche Global Equity VIP | 6-Month‡ | 1-Year | 3-Year | 5-Year | 10-Year | |
| Class A | Growth of $10,000 | $11,408 | $11,755 | $11,542 | $16,367 | $11,444 |
| Average annual total return | 14.08% | 17.55% | 4.90% | 10.36% | 1.36% | |
| MSCI All Country World Index | Growth of $10,000 | $11,148 | $11,878 | $11,517 | $16,506 | $14,396 |
| Average annual total return | 11.48% | 18.78% | 4.82% | 10.54% | 3.71% | |
The growth of $10,000 is cumulative.
‡ Total returns shown for periods less than one year are not annualized.
Portfolio Summary (Unaudited)
| Asset Allocation (As a % of Investment Portfolio excluding Securities Lending Collateral) | 6/30/17 | 12/31/16 |
| Common Stocks | 96% | 98% |
| Cash Equivalents | 3% | 1% |
| Preferred Stock | 1% | 1% |
| 100% | 100% |
| Sector Diversification (As a % of Investment Portfolio excluding Cash Equivalents and Securities Lending Collateral) | 6/30/17 | 12/31/16 |
| Information Technology | 23% | 21% |
| Health Care | 21% | 20% |
| Financials | 17% | 13% |
| Consumer Staples | 12% | 12% |
| Industrials | 8% | 8% |
| Consumer Discretionary | 6% | 9% |
| Materials | 6% | 7% |
| Energy | 4% | 6% |
| Telecommunication Services | 2% | 2% |
| Real Estate | 1% | 2% |
| 100% | 100% |
| Geographical Diversification (As a % of Investment Portfolio excluding Cash Equivalents and Securities Lending Collateral) | 6/30/17 | 12/31/16 |
| United States | 55% | 55% |
| Canada | 8% | 7% |
| Switzerland | 8% | 7% |
| United Kingdom | 6% | 6% |
| Germany | 6% | 6% |
| Sweden | 3% | 3% |
| China | 2% | 1% |
| Finland | 2% | 2% |
| Luxembourg | 2% | 2% |
| Ireland | 2% | 2% |
| Japan | 1% | 3% |
| Other | 5% | 6% |
| 100% | 100% |
Portfolio holdings and characteristics are subject to change.
For more complete details about the Fund's investment portfolio, see page 5.
Following the Fund's fiscal first and third quarter-end, a complete portfolio holdings listing is filed with the SEC on Form N-Q. The form will be available on the SEC's Web site at sec.gov, and it also may be reviewed and copied at the SEC's Public Reference Room in Washington, D.C. Information on the operation of the SEC's Public Reference Room may be obtained by calling (800) SEC-0330. The Fund's portfolio holdings are also posted on deutschefunds.com from time to time. Please see the Fund's current prospectus for more information.
Portfolio Management Team
Sebastian P. Werner, PhD, Director
Mark Schumann, CFA, Director
Portfolio Managers
Investment Portfolio June 30, 2017 (Unaudited)
| Shares | Value ($) | |
| Common Stocks 95.8% | ||
| Australia 0.9% | ||
| Australia & New Zealand Banking Group Ltd. (Cost $434,670) | 19,800 | 437,069 |
| Austria 0.0% | ||
| Immofinanz AG* (Cost $0) | 887 | 2,027 |
| Canada 8.1% | ||
| Agnico Eagle Mines Ltd. | 25,500 | 1,150,560 |
| Alimentation Couche-Tard, Inc. "B" | 16,600 | 795,694 |
| Brookfield Asset Management, Inc. "A" | 33,000 | 1,295,011 |
| Toronto-Dominion Bank | 11,100 | 559,365 |
| Trisura Group Ltd.* (a) | 193 | 3,230 |
| (Cost $2,623,154) | 3,803,860 | |
| China 2.0% | ||
| Alibaba Group Holding Ltd. (ADR)* | 2,100 | 295,890 |
| Tencent Holdings Ltd. | 18,400 | 657,997 |
| (Cost $655,132) | 953,887 | |
| Finland 1.9% | ||
| Sampo Oyj "A" (Cost $824,246) | 17,500 | 896,844 |
| Germany 5.2% | ||
| Allianz SE (Registered) | 4,400 | 866,389 |
| BASF SE | 3,000 | 277,851 |
| Fresenius Medical Care AG & Co. KGaA | 13,700 | 1,317,046 |
| (Cost $1,763,257) | 2,461,286 | |
| Hong Kong 0.6% | ||
| AIA Group Ltd. (Cost $246,513) | 41,400 | 302,515 |
| Ireland 1.7% | ||
| Kerry Group PLC "A" (b) | 1,579 | 135,963 |
| Kerry Group PLC "A" (b) | 7,921 | 681,508 |
| (Cost $660,575) | 817,471 | |
| Japan 1.5% | ||
| Japan Tobacco, Inc. (Cost $671,352) | 20,000 | 701,845 |
| Luxembourg 1.8% | ||
| Eurofins Scientific (Cost $331,302) | 1,500 | 844,877 |
| Malaysia 0.6% | ||
| IHH Healthcare Bhd. (Cost $277,346) | 213,000 | 285,313 |
| Mexico 0.9% | ||
| Fomento Economico Mexicano SAB de CV (ADR) (Cost $398,597) | 4,400 | 432,696 |
| Norway 0.5% | ||
| Marine Harvest ASA* (Cost $143,938) | 12,600 | 215,666 |
| Philippines 0.7% | ||
| Universal Robina Corp. (Cost $459,003) | 100,000 | 322,830 |
| Sweden 2.8% | ||
| Assa Abloy AB "B" | 30,000 | 659,133 |
| Essity AB "B"* | 18,400 | 503,425 |
| Shares | Value ($) | |
| Svenska Cellulosa AB "B" | 18,400 | 139,233 |
| (Cost $1,005,008) | 1,301,791 | |
| Switzerland 7.3% | ||
| Comet Holding AG (Registered)* | 2,600 | 324,560 |
| Lonza Group AG (Registered)* | 3,100 | 670,174 |
| Nestle SA (Registered) | 12,015 | 1,045,627 |
| Roche Holding AG (Genusschein) | 3,700 | 942,267 |
| u-blox Holding AG* | 2,500 | 468,766 |
| (Cost $2,419,277) | 3,451,394 | |
| United Kingdom 6.4% | ||
| Aon PLC | 8,000 | 1,063,600 |
| Compass Group PLC | 34,615 | 730,374 |
| Halma PLC | 43,000 | 616,058 |
| Spirax-Sarco Engineering PLC | 8,300 | 578,353 |
| (Cost $2,165,098) | 2,988,385 | |
| United States 52.9% | ||
| A.O. Smith Corp. | 7,000 | 394,310 |
| Acadia Healthcare Co., Inc.* (a) | 12,000 | 592,560 |
| Activision Blizzard, Inc. | 16,943 | 975,409 |
| Allergan PLC | 2,700 | 656,343 |
| Alliance Data Systems Corp. | 2,000 | 513,380 |
| Alphabet, Inc. "A"* | 880 | 818,118 |
| American Express Co. | 5,900 | 497,016 |
| AMETEK, Inc. | 13,000 | 787,410 |
| Amphenol Corp. "A" | 17,400 | 1,284,468 |
| Apple, Inc. | 6,500 | 936,130 |
| Applied Materials, Inc. | 22,000 | 908,820 |
| Biogen, Inc.* | 1,400 | 379,904 |
| Bristol-Myers Squibb Co. | 9,000 | 501,480 |
| CBRE Group, Inc. "A"* | 7,100 | 258,440 |
| Celgene Corp.* | 8,500 | 1,103,895 |
| CVS Health Corp. | 5,600 | 450,576 |
| Danaher Corp. | 9,500 | 801,705 |
| Ecolab, Inc. | 5,000 | 663,750 |
| EOG Resources, Inc. | 6,100 | 552,172 |
| EPAM Systems, Inc.* | 4,900 | 412,041 |
| Evolent Health, Inc. "A"* | 10,300 | 261,105 |
| Exxon Mobil Corp. | 6,200 | 500,526 |
| Facebook, Inc. "A"* | 4,230 | 638,645 |
| Fidelity National Information Services, Inc. | 4,500 | 384,300 |
| General Electric Co. | 16,500 | 445,665 |
| JPMorgan Chase & Co. | 10,300 | 941,420 |
| L Brands, Inc. | 3,000 | 161,670 |
| LKQ Corp.* | 14,000 | 461,300 |
| Marcus & Millichap, Inc.* | 7,000 | 184,520 |
| Mastercard, Inc. "A" | 10,500 | 1,275,225 |
| Noble Energy, Inc. | 13,200 | 373,560 |
| Progressive Corp. | 21,500 | 947,935 |
| Schlumberger Ltd. | 5,700 | 375,288 |
| Scotts Miracle-Gro Co. | 5,000 | 447,300 |
| T-Mobile U.S., Inc.* | 13,000 | 788,060 |
| Time Warner, Inc. | 8,500 | 853,485 |
| TJX Companies, Inc. | 9,600 | 692,832 |
| Union Pacific Corp. | 3,500 | 381,185 |
| United Technologies Corp. | 4,000 | 488,440 |
| Zoetis, Inc. | 13,200 | 823,416 |
| (Cost $19,745,391) | 24,913,804 | |
| Total Common Stocks (Cost $34,823,859) | 45,133,560 | |
| Shares | Value ($) | |
| Preferred Stock 0.7% | ||
| Germany | ||
| Draegerwerk AG & Co. KGaA (Cost $214,962) | 3,000 | 315,610 |
| Securities Lending Collateral 1.3% | ||
| Deutsche Government & Agency Securities Portfolio "Deutsche Government Cash Institutional Shares", 0.87% (c) (d) (Cost $603,925) | 603,925 | 603,925 |
| Shares | Value ($) | |
| Cash Equivalents 3.1% | ||
| Deutsche Central Cash Management Government Fund, 1.03% (c) (Cost $1,440,239) | 1,440,239 | 1,440,239 |
| % of Net Assets | Value ($) | |
| Total Investment Portfolio (Cost $37,082,985)† | 100.9 | 47,493,334 |
| Other Assets and Liabilities, Net | (0.9) | (406,338) |
| Net Assets | 100.0 | 47,086,996 |
* Non-income producing security.
† The Cost for federal income tax purposes was $37,184,681. At June 30, 2017, net unrealized appreciation for all securities based on tax Cost was $10,308,653. This consisted of aggregate gross unrealized appreciation for all securities in which there was an excess of value over tax Cost of $11,429,557 and aggregate gross unrealized depreciation for all securities in which there was an excess of tax Cost over value of $1,120,904.
(a) All or a portion of these securities were on loan. In addition, "Other Assets and Liabilities, Net" may include pending sales that are also on loan. The value of securities loaned at June 30, 2017 amounted to $590,852, which is 1.3% of net assets.
(b) Securities with the same description are the same corporate entity but trade on different stock exchanges.
(c) Affiliated fund managed by Deutsche Investment Management Americas Inc. The rate shown is the annualized seven-day yield at period end.
(d) Represents collateral held in connection with securities lending. Income earned by the Fund is net of borrower rebates.
ADR: American Depositary Receipt
Fair Value Measurements
Various inputs are used in determining the value of the Fund's investments. These inputs are summarized in three broad levels. Level 1 includes quoted prices in active markets for identical securities. Level 2 includes other significant observable inputs (including quoted prices for similar securities, interest rates, prepayment speeds and credit risk). Level 3 includes significant unobservable inputs (including the Fund's own assumptions in determining the fair value of investments). The level assigned to the securities valuations may not be an indication of the risk or liquidity associated with investing in those securities.
The following is a summary of the inputs used as of June 30, 2017 in valuing the Fund's investments. For information on the Fund's policy regarding the valuation of investments, please refer to the Security Valuation section of Note A in the accompanying Notes to Financial Statements.
| Assets | Level 1 | Level 2 | Level 3 | Total | |
| Common Stocks | |||||
| Australia | $ 437,069 | $ — | $ — | $ 437,069 | |
| Austria | 2,027 | — | — | 2,027 | |
| Canada | 3,803,860 | — | — | 3,803,860 | |
| China | 953,887 | — | — | 953,887 | |
| Finland | 896,844 | — | — | 896,844 | |
| Germany | 2,461,286 | — | — | 2,461,286 | |
| Hong Kong | 302,515 | — | — | 302,515 | |
| Ireland | 817,471 | — | — | 817,471 | |
| Japan | 701,845 | — | — | 701,845 | |
| Luxembourg | 844,877 | — | — | 844,877 | |
| Malaysia | 285,313 | — | — | 285,313 | |
| Mexico | 432,696 | — | — | 432,696 | |
| Norway | 215,666 | — | — | 215,666 | |
| Philippines | 322,830 | — | — | 322,830 | |
| Sweden | 1,301,791 | — | — | 1,301,791 | |
| Switzerland | 3,451,394 | — | — | 3,451,394 | |
| United Kingdom | 2,988,385 | — | — | 2,988,385 | |
| United States | 24,913,804 | — | — | 24,913,804 | |
| Preferred Stock | 315,610 | — | — | 315,610 | |
| Short-Term Investments (e) | 2,044,164 | — | — | 2,044,164 | |
| Total | $ 47,493,334 | $ — | $ — | $ 47,493,334 | |
As a result of the fair valuation model utilized by the Fund, certain international securities transferred from Level 2 to Level 1. During the
period ended June 30, 2017, the amount of the transfers between Level 2 and Level 1 was $13,501,521.
Transfers between price levels are recognized at the beginning of the reporting year.
(e) See Investment Portfolio for additional detailed categorizations.
The accompanying notes are an integral part of the financial statements.
Statement of Assets and Liabilities
| as of June 30, 2017 (Unaudited) | |
| Assets | |
Investments: Investments in non-affiliated securities, at value (Cost $35,038,821) — including $590,852 of securities loaned | $ 45,449,170 |
| Investment in Deutsche Government & Agency Securities Portfolio (Cost $603,925)* | 603,925 |
| Investment in Deutsche Central Cash Management Government Fund (Cost $1,440,239) | 1,440,239 |
| Total investments in securities, at value (Cost $37,082,985) | 47,493,334 |
| Foreign currency, at value (Cost $207,903) | 210,982 |
| Dividends receivable | 74,177 |
| Interest receivable | 1,336 |
| Foreign taxes recoverable | 40,671 |
| Other assets | 286 |
| Total assets | 47,820,786 |
| Liabilities | |
| Payable upon return of securities loaned | 603,925 |
| Payable for Fund shares redeemed | 52,714 |
| Accrued management fee | 17,299 |
| Accrued Trustees' fees | 414 |
| Other accrued expenses and payables | 59,438 |
| Total liabilities | 733,790 |
| Net assets, at value | $ 47,086,996 |
| Net Assets Consist of | |
| Undistributed net investment income | 227,603 |
Net unrealized appreciation (depreciation) on: Investments | 10,410,349 |
| Foreign currency | 4,228 |
| Accumulated net realized gain (loss) | (38,678,337) |
| Paid-in capital | 75,123,153 |
| Net assets, at value | $ 47,086,996 |
Class A Net Asset Value, offering and redemption price per share ($47,086,996 ÷ 4,374,924 outstanding shares of beneficial interest, no par value, unlimited number of shares authorized) | $ 10.76 |
* Represents collateral on securities loaned.
The accompanying notes are an integral part of the financial statements.
Statement of Operations
| for the six months ended June 30, 2017 (Unaudited) | |
| Investment Income | |
Income: Dividends (net of foreign taxes withheld of $34,612) | $ 452,883 |
| Income distributions — Deutsche Central Cash Management Government Fund | 2,217 |
| Securities lending income, including income from Government & Agency Securities Portfolio, net of borrower rebates | 5,546 |
| Total income | 460,646 |
Expenses: Management fee | 147,138 |
| Administration fee | 22,637 |
| Services to shareholders | 221 |
| Custodian fee | 11,310 |
| Professional fees | 37,272 |
| Reports to shareholders | 10,860 |
| Trustees' fees and expenses | 2,499 |
| Other | 7,611 |
| Total expenses before expense reductions | 239,548 |
| Expense reductions | (24,500) |
| Total expenses after expense reductions | 215,048 |
| Net investment income | 245,598 |
| Realized and Unrealized Gain (Loss) | |
Net realized gain (loss) from: Investments | 587,863 |
| Foreign currency | (217) |
| 587,646 | |
Change in net unrealized appreciation (depreciation) on: Investments | 5,146,541 |
| Foreign currency | 10,957 |
| 5,157,498 | |
| Net gain (loss) | 5,745,144 |
| Net increase (decrease) in net assets resulting from operations | $ 5,990,742 |
The accompanying notes are an integral part of the financial statements.
Statements of Changes in Net Assets
| Increase (Decrease) in Net Assets | Six Months Ended June 30, 2017 (Unaudited) | Year Ended December 31, 2016 | |
Operations: Net investment income | $ 245,598 | $ 218,495 | |
| Net realized gain (loss) | 587,646 | 1,040,800 | |
| Change in net unrealized appreciation (depreciation) | 5,157,498 | 1,213,259 | |
| Net increase (decrease) in net assets resulting from operations | 5,990,742 | 2,472,554 | |
Distributions to shareholders from: Net investment income: Class A | (233,988) | (336,718) | |
Fund share transactions: Class A Proceeds from shares sold | 756,579 | 1,414,193 | |
| Reinvestment of distributions | 233,988 | 336,718 | |
| Payments for shares redeemed | (3,152,187) | (9,403,270) | |
| Net increase (decrease) in net assets from Class A share transactions | (2,161,620) | (7,652,359) | |
| Increase (decrease) in net assets | 3,595,134 | (5,516,523) | |
| Net assets at beginning of period | 43,491,862 | 49,008,385 | |
| Net assets at end of period (including undistributed net investment income of $227,603 and $215,993, respectively) | $ 47,086,996 | $ 43,491,862 | |
| Other Information | |||
Class A Shares outstanding at beginning of period | 4,587,493 | 5,446,357 | |
| Shares sold | 73,220 | 152,025 | |
| Shares issued to shareholders in reinvestment of distributions | 22,499 | 36,640 | |
| Shares redeemed | (308,288) | (1,047,529) | |
| Net increase (decrease) in Class A shares | (212,569) | (858,864) | |
| Shares outstanding at end of period | 4,374,924 | 4,587,493 | |
The accompanying notes are an integral part of the financial statements.
Financial Highlights
| Class A | Six Months Ended 6/30/17 (Unaudited) | Years Ended December 31, | |||||
| 2016 | 2015 | 2014 | 2013 | 2012 | |||
| Selected Per Share Data | |||||||
| Net asset value, beginning of period | $ 9.48 | $ 9.00 | $ 9.21 | $ 9.27 | $ 7.96 | $ 6.98 | |
Income (loss) from investment operations: Net investment incomea | .05 | .04 | .05 | .06 | .14 | .18 | |
| Net realized and unrealized gain (loss) | 1.28 | .51 | (.21) | .04 | 1.37 | 1.01 | |
| Total from investment operations | 1.33 | .55 | (.16) | .10 | 1.51 | 1.19 | |
Less distributions from: Net investment income | (.05) | (.07) | (.05) | (.16) | (.20) | (.21) | |
| Net asset value, end of period | $ 10.76 | $ 9.48 | $ 9.00 | $ 9.21 | $ 9.27 | $ 7.96 | |
| Total Return (%) | 14.08b** | 6.11b,c | (1.75)b | 1.14 | 19.31b | 17.34 | |
| Ratios to Average Net Assets and Supplemental Data | |||||||
| Net assets, end of period ($ millions) | 47 | 43 | 49 | 68 | 73 | 67 | |
| Ratio of expenses before expense reductions (%)d | 1.06* | 1.03 | 1.00 | .95 | 1.06 | 1.02 | |
| Ratio of expenses after expense reductions (%)d | .95* | .95 | .91 | .95 | .99 | 1.02 | |
| Ratio of net investment income (%) | 1.09* | .49 | .58 | .59 | 1.69 | 2.46 | |
| Portfolio turnover rate (%) | 6** | 46 | 79 | 78 | 139 | 18 | |
a Based on average shares outstanding during the period. b Total return would have been lower had certain expenses not been reimbursed. c Includes a reimbursement by the Advisor for a realized loss on a trade executed incorrectly, which otherwise would have reduced total return by 0.31%. d Expense ratio does not reflect charges and fees associated with the separate account that invests in the Fund or any variable life insurance policy or variable annuity contract for which the Fund is an investment option. * Annualized ** Not annualized | |||||||
Notes to Financial Statements (Unaudited)
A. Organization and Significant Accounting Policies
Deutsche Global Equity VIP (the "Fund") is a diversified series of Deutsche Variable Series II (the "Trust"), which is registered under the Investment Company Act of 1940, as amended (the "1940 Act"), as an open-end management investment company organized as a Massachusetts business trust.
The Fund's financial statements are prepared in accordance with accounting principles generally accepted in the United States of America ("U.S. GAAP") which require the use of management estimates. Actual results could differ from those estimates. The Fund qualifies as an investment company under Topic 946 of Accounting Standards Codification of U.S. GAAP. The policies described below are followed consistently by the Fund in the preparation of its financial statements.
Security Valuation. Investments are stated at value determined as of the close of regular trading on the New York Stock Exchange on each day the exchange is open for trading.
Various inputs are used in determining the value of the Fund's investments. These inputs are summarized in three broad levels. Level 1 includes quoted prices in active markets for identical securities. Level 2 includes other significant observable inputs (including quoted prices for similar securities, interest rates, prepayment speeds and credit risk). Level 3 includes significant unobservable inputs (including the Fund's own assumptions in determining the fair value of investments). The level assigned to the securities valuations may not be an indication of the risk or liquidity associated with investing in those securities.
Equity securities are valued at the most recent sale price or official closing price reported on the exchange (U.S. or foreign) or over-the-counter market on which they trade. Securities for which no sales are reported are valued at the calculated mean between the most recent bid and asked quotations on the relevant market or, if a mean cannot be determined, at the most recent bid quotation. Equity securities are generally categorized as Level 1. For certain international equity securities, in order to adjust for events which may occur between the close of the foreign exchanges and the close of the New York Stock Exchange, a fair valuation model may be used. This fair valuation model takes into account comparisons to the valuation of American Depository Receipts (ADRs), futures contracts and certain indices and these securities are categorized as Level 2.
Investments in open-end investment companies are valued at their net asset value each business day and are categorized as Level 1.
Securities and other assets for which market quotations are not readily available or for which the above valuation procedures are deemed not to reflect fair value are valued in a manner that is intended to reflect their fair value as determined in accordance with procedures approved by the Board and are generally categorized as Level 3. In accordance with the Fund's valuation procedures, factors considered in determining value may include, but are not limited to, the type of the security; the size of the holding; the initial cost of the security; the existence of any contractual restrictions on the security's disposition; the price and extent of public trading in similar securities of the issuer or of comparable companies; quotations or evaluated prices from broker-dealers and/or pricing services; information obtained from the issuer, analysts, and/or the appropriate stock exchange (for exchange-traded securities); an analysis of the company's or issuer's financial statements; an evaluation of the forces that influence the issuer and the market(s) in which the security is purchased and sold; and with respect to debt securities, the maturity, coupon, creditworthiness, currency denomination and the movement of the market in which the security is normally traded. The value determined under these procedures may differ from published values for the same securities.
Disclosure about the classification of fair value measurements is included in a table following the Fund's Investment Portfolio.
Securities Lending. Deutsche Bank AG, as lending agent, lends securities of the Fund to certain financial institutions under the terms of its securities lending agreement. During the term of the loans, the Fund continues to receive interest and dividends generated by the securities and to participate in any changes in their market value. The Fund requires the borrowers of the securities to maintain collateral with the Fund consisting of either cash or liquid, unencumbered assets having a value at least equal to the value of the securities loaned. When the collateral falls below specified amounts, the lending agent will use its best effort to obtain additional collateral on the next business day to meet required amounts under the securities lending agreement. As of period end, any securities on loan were collateralized by cash. During the six months ended June 30, 2017, the Fund invested the cash collateral into a joint trading account in affiliated money market funds managed by Deutsche Investment Management Americas Inc. As of June 30, 2017, the Fund invested the cash collateral in Deutsche Government & Agency Securities Portfolio. Deutsche Investment Management Americas Inc. receives a management/administration fee (0.13% annualized effective rate as of June 30, 2017) on the cash collateral invested in Deutsche Government & Agency Securities Portfolio. The Fund receives compensation for lending its securities either in the form of fees or by earning interest on invested cash collateral net of borrower rebates and fees paid to a lending agent. Either the Fund or the borrower may terminate the loan at any time, and the borrower, after notice, is required to return borrowed securities within a standard time period. There may be risks of delay and costs in recovery of securities or even loss of rights in the collateral should the borrower of the securities fail financially. If the Fund is not able to recover securities lent, the Fund may sell the collateral and purchase a replacement investment in the market, incurring the risk that the value of the replacement security is greater than the value of the collateral. The Fund is also subject to all investment risks associated with the reinvestment of any cash collateral received, including, but not limited to, interest rate, credit and liquidity risk associated with such investments.
As of June 30, 2017, the Fund had securities on loan, which were classified as common stocks in the Investment Portfolio. The value of the related collateral exceeded the value of the securities loaned at period end. As of period end, the remaining contractual maturity of the collateral agreements were overnight and continuous.
Foreign Currency Translations. The books and records of the Fund are maintained in U.S. dollars. Investment securities and other assets and liabilities denominated in a foreign currency are translated into U.S. dollars at the prevailing exchange rates at period end. Purchases and sales of investment securities, income and expenses are translated into U.S. dollars at the prevailing exchange rates on the respective dates of the transactions.
Net realized and unrealized gains and losses on foreign currency transactions represent net gains and losses between trade and settlement dates on securities transactions, the acquisition and disposition of foreign currencies, and the difference between the amount of net investment income accrued and the U.S. dollar amount actually received. The portion of both realized and unrealized gains and losses on investments that results from fluctuations in foreign currency exchange rates is not separately disclosed but is included with net realized and unrealized gain/appreciation and loss/depreciation on investments.
Taxes. The Fund's policy is to comply with the requirements of the Internal Revenue Code, as amended, which are applicable to regulated investment companies, and to distribute all of its taxable income to its shareholders.
Additionally, the Fund may be subject to taxes imposed by the governments of countries in which it invests and are generally based on income and/or capital gains earned or repatriated, a portion of which may be recoverable. Based upon the current interpretation of the tax rules and regulations, estimated tax liabilities and recoveries on certain foreign securities are recorded on an accrual basis and are reflected as components of interest income or net change in unrealized gain/loss on investments. Tax liabilities realized as a result of security sales are reflected as a component of net realized gain/loss on investments.
Under the Regulated Investment Company Modernization Act of 2010, net capital losses incurred post-enactment may be carried forward indefinitely, and their character is retained as short-term and/or long-term. Previously, net capital losses were carried forward for eight years and treated as short-term losses. As a transition rule, the Act requires that post-enactment net capital losses be used before pre-enactment net capital losses.
At December 31, 2016, the Fund had a net tax basis capital loss carryforward of approximately $39,164,000 of pre-enactment losses, which may be applied against any realized net taxable capital gains of each succeeding year until fully utilized or until December 31, 2017 ($39,164,000), the expiration date, whichever occurs first.
The Fund has reviewed the tax positions for the open tax years as of December 31, 2016 and has determined that no provision for income tax and/or uncertain tax provisions is required in the Fund's financial statements. The Fund's federal tax returns for the prior three fiscal years remain open subject to examination by the Internal Revenue Service.
Distribution of Income and Gains. Distributions from net investment income of the Fund, if any, are declared and distributed to shareholders annually. Net realized gains from investment transactions, in excess of available capital loss carryforwards, would be taxable to the Fund if not distributed and, therefore, will be distributed to shareholders at least annually. The Fund may also make additional distributions for tax purposes if necessary.
The timing and characterization of certain income and capital gain distributions are determined annually in accordance with federal tax regulations which may differ from accounting principles generally accepted in the United States of America. These differences primarily relate to investments in foreign denominated investments, expiration of capital loss carryforward and certain securities sold at a loss. As a result, net investment income (loss) and net realized gain (loss) on investment transactions for a reporting period may differ significantly from distributions during such period. Accordingly, the Fund may periodically make reclassifications among certain of its capital accounts without impacting the net asset value of the Fund.
The tax character of current year distributions will be determined at the end of the current fiscal year.
Expenses. Expenses of the Trust arising in connection with a specific fund are allocated to that fund. Other Trust expenses which cannot be directly attributed to a fund are apportioned among the funds in the Trust based upon the relative net assets or other appropriate measures.
Contingencies. In the normal course of business, the Fund may enter into contracts with service providers that contain general indemnification clauses. The Fund's maximum exposure under these arrangements is unknown, as this would involve future claims that may be made against the Fund that have not yet been made. However, based on experience, the Fund expects the risk of loss to be remote.
Other. Investment transactions are accounted for on a trade date plus one basis for daily net asset value calculations. However, for financial reporting purposes, investment transactions are reported on trade date. Interest income is recorded on the accrual basis. Dividend income is recorded on the ex-dividend date net of foreign withholding taxes. Certain dividends from foreign securities may be recorded subsequent to the ex-dividend date as soon as the Fund is informed of such dividends. Realized gains and losses from investment transactions are recorded on an identified cost basis. Proceeds from litigation payments, if any, are included in net realized gain (loss) from investments.
B. Purchases and Sales of Securities
During the six months ended June 30, 2017, purchases and sales of investment transactions (excluding short-term investments) aggregated $2,645,538 and $5,650,894, respectively.
C. Related Parties
Management Agreement. Under the Investment Management Agreement with Deutsche Investment Management Americas Inc. ("DIMA" or the "Advisor"), an indirect, wholly owned subsidiary of Deutsche Bank AG, the Advisor directs the investments of the Fund in accordance with its investment objectives, policies and restrictions. The Advisor determines the securities, instruments and other contracts relating to investments to be purchased, sold or entered into by the Fund.
Pursuant to the Investment Management Agreement with the Advisor, the Fund pays a monthly management fee based on the Fund's average daily net assets, computed and accrued daily and payable monthly, at the following annual rates:
| First $1.5 billion | .650% |
| Next $1.75 billion | .635% |
| Next $1.75 billion | .620% |
| Over $5 billion | .605% |
Accordingly, for the six months ended June 30, 2017, the fee pursuant to the Investment Management Agreement was equivalent to an annualized rate (exclusive of any applicable waivers/reimbursements) of 0.65% of the Fund's average daily net assets.
For the period from January 1, 2017 through April 30, 2018, the Advisor has contractually agreed to waive its fee and/or reimburse certain operating expenses to the extent necessary to maintain the total annual operating expenses (excluding certain expenses such as extraordinary expenses, taxes, brokerage and interest expense) of Class A shares at 0.95%.
For the six months ended June 30, 2017, fees waived and/or expenses reimbursed were $24,500.
Administration Fee. Pursuant to an Administrative Services Agreement, DIMA provides most administrative services to the Fund. For all services provided under the Administrative Services Agreement, the Fund pays DIMA an annual fee ("Administration Fee") of 0.10% of the Fund's average daily net assets, computed and accrued daily and payable monthly. For the six months ended June 30, 2017, the Administration Fee was $22,637, of which $3,898 is unpaid.
Service Provider Fees. Deutsche AM Service Company ("DSC"), an affiliate of the Advisor, is the transfer agent, dividend-paying agent and shareholder service agent for the Fund. Pursuant to a sub-transfer agency agreement between DSC and DST Systems, Inc. ("DST"), DSC has delegated certain transfer agent, dividend-paying agent and shareholder service agent functions to DST. DSC compensates DST out of the shareholder servicing fee it receives from the Fund. For the six months ended June 30, 2017, the amounts charged to the Fund by DSC aggregated $40, of which $20 is unpaid.
Typesetting and Filing Service Fees. Under an agreement with DIMA, DIMA is compensated for providing typesetting and certain regulatory filing services to the Fund. For the six months ended June 30, 2017, the amount charged to the Fund by DIMA included in the Statement of Operations under "Reports to shareholders" aggregated $5,619, of which $5,349 is unpaid.
Trustees' Fees and Expenses. The Fund paid retainer fees to each Trustee not affiliated with the Advisor, plus specified amounts to the Board Chairperson and Vice Chairperson and to each committee Chairperson.
Affiliated Cash Management Vehicles. The Fund may invest uninvested cash balances in Deutsche Central Cash Management Government Fund and Deutsche Variable NAV Money Fund, affiliated money market funds which are managed by the Advisor. Each affiliated money market fund is managed in accordance with Rule 2a-7 under the 1940 Act, which governs the quality, maturity, diversity and liquidity of instruments in which a money market fund may invest. Deutsche Central Cash Management Government Fund seeks to maintain a stable net asset value, and Deutsche Variable NAV Money Fund maintains a floating net asset value. The Fund indirectly bears its proportionate share of the expenses of each affiliated money market fund in which it invests. Deutsche Central Cash Management Government Fund does not pay the Advisor an investment management fee. To the extent that Deutsche Variable NAV Money Fund pays an investment management fee to the Advisor, the Advisor will waive an amount of the investment management fee payable to the Advisor by the Fund equal to the amount of the investment management fee payable on the Fund's assets invested in Deutsche Variable NAV Money Fund.
Securities Lending Fees. Deutsche Bank AG serves as lending agent for the Fund. For the six months ended June 30, 2017, the Fund incurred lending agent fees to Deutsche Bank AG in the amount of $393.
D. Ownership of the Fund
At June 30, 2017, two participating insurance companies were owners of record of 10% or more of the total outstanding Class A shares of the Fund, each owning 74% and 25%.
E. Line of Credit
The Fund and other affiliated funds (the "Participants") share in a $400 million revolving credit facility provided by a syndication of banks. The Fund may borrow for temporary or emergency purposes, including the meeting of redemption requests that otherwise might require the untimely disposition of securities. The Participants are charged an annual commitment fee which is allocated based on net assets, among each of the Participants. Interest is calculated at a rate per annum equal to the sum of the Federal Funds Rate plus 1.25 percent plus if the one-month LIBOR exceeds the Federal Funds Rate, the amount of such excess. The Fund may borrow up to a maximum of 33 percent of its net assets under the agreement. The Fund had no outstanding loans at June 30, 2017.
Information About Your Fund's Expenses (Unaudited)
As an investor of the Fund, you incur two types of costs: ongoing expenses and transaction costs. Ongoing expenses include management fees and other Fund expenses. Examples of transaction costs include contract charges, which are not shown in this section. The following tables are intended to help you understand your ongoing expenses (in dollars) of investing in the Fund and to help you compare these expenses with the ongoing expenses of investing in other mutual funds. In the most recent six-month period, the Fund limited these expenses; had it not done so, expenses would have been higher. The example in the table is based on an investment of $1,000 invested at the beginning of the six-month period and held for the entire period (January 1, 2017 to June 30, 2017).
The tables illustrate your Fund's expenses in two ways:
— Actual Fund Return. This helps you estimate the actual dollar amount of ongoing expenses (but not transaction costs) paid on a $1,000 investment in the Fund using the Fund's actual return during the period. To estimate the expenses you paid over the period, simply divide your account value by $1,000 (for example, an $8,600 account value divided by $1,000 = 8.6), then multiply the result by the number in the "Expenses Paid per $1,000" line under the share class you hold.
— Hypothetical 5% Fund Return. This helps you to compare your Fund's ongoing expenses (but not transaction costs) with those of other mutual funds using the Fund's actual expense ratio and a hypothetical rate of return of 5% per year before expenses. Examples using a 5% hypothetical Fund return may be found in the shareholder reports of other mutual funds. The hypothetical account values and expenses may not be used to estimate the actual ending account balance or expenses you paid for the period.
Please note that the expenses shown in these tables are meant to highlight your ongoing expenses only and do not reflect any transaction costs. The "Expenses Paid per $1,000" line of the tables is useful in comparing ongoing expenses only and will not help you determine the relative total expense of owning different funds. If these transaction costs had been included, your costs would have been higher.
| Expenses and Value of a $1,000 Investment for the six months ended June 30, 2017 | ||
| Actual Fund Return | Class A | |
| Beginning Account Value 1/1/17 | $ 1,000.00 | |
| Ending Account Value 6/30/17 | $ 1,140.80 | |
| Expenses Paid per $1,000* | $ 5.04 | |
| Hypothetical 5% Fund Return | Class A | |
| Beginning Account Value 1/1/17 | $ 1,000.00 | |
| Ending Account Value 6/30/17 | $ 1,020.08 | |
| Expenses Paid per $1,000* | $ 4.76 | |
* Expenses are equal to the Fund's annualized expense ratio, multiplied by the average account value over the period, multiplied by 181 (the number of days in the most recent six-month period), then divided by 365.
| Annualized Expense Ratio | Class A | |
| Deutsche Variable Series II — Deutsche Global Equity VIP | .95% |
For more information, please refer to the Fund's prospectus.
These tables do not reflect charges and fees ("contract charges") associated with the separate account that invests in the Fund or any variable life insurance policy or variable annuity contract for which the Fund is an investment option.
For an analysis of the fees associated with an investment in the fund or similar funds, please refer to the current and hypothetical expense calculators for Variable Insurance Products which can be found at deutschefunds.com/EN/resources/calculators.jsp.
Proxy Voting
The Trust's policies and procedures for voting proxies for portfolio securities and information about how the Trust voted proxies related to its portfolio securities during the most recent 12-month period ended June 30 are available on our Web site — deutschefunds.com (click on "proxy voting" at the bottom of the page) — or on the SEC's Web site — sec.gov. To obtain a written copy of the Trust's policies and procedures without charge, upon request, call us toll free at (800) 728-3337.
Advisory Agreement Board Considerations and Fee Evaluation
The Board of Trustees (hereinafter referred to as the "Board" or "Trustees") approved the renewal of Deutsche Global Equity VIP’s (the "Fund") investment management agreement (the "Agreement") with Deutsche Investment Management Americas Inc. ("DIMA") in September 2016.
In terms of the process that the Board followed prior to approving the Agreement, shareholders should know that:
— During the entire process, all of the Fund’s Trustees were independent of DIMA and its affiliates (the "Independent Trustees").
— The Board met frequently during the past year to discuss fund matters and dedicated a substantial amount of time to contract review matters. Over the course of several months, the Board’s Contract Committee reviewed extensive materials received from DIMA, independent third parties and independent counsel. These materials included an analysis of the Fund’s performance, fees and expenses, and profitability from a fee consultant retained by the Fund’s Independent Trustees (the "Fee Consultant"). The Board also received extensive information throughout the year regarding performance of the Fund.
— The Independent Trustees regularly meet privately with counsel to discuss contract review and other matters. In addition, the Independent Trustees were advised by the Fee Consultant in the course of their review of the Fund’s contractual arrangements and considered a comprehensive report prepared by the Fee Consultant in connection with their deliberations.
— In connection with reviewing the Agreement, the Board also reviewed the terms of the Fund’s distribution agreement, administrative services agreement, transfer agency agreement and other material service agreements.
— Based on its evaluation of the information provided, the Contract Committee presented its findings and recommendations to the Board. The Board then reviewed the Contract Committee’s findings and recommendations.
In connection with the contract review process, the Contract Committee and the Board considered the factors discussed below, among others. The Board also considered that DIMA and its predecessors have managed the Fund since its inception, and the Board believes that a long-term relationship with a capable, conscientious advisor is in the best interests of the Fund. The Board considered, generally, that shareholders chose to invest or remain invested in the Fund knowing that DIMA managed the Fund, and that the Agreement was approved by the Fund’s shareholders. DIMA is part of Deutsche Bank AG’s ("Deutsche Bank") Asset Management ("Deutsche AM") division. Deutsche AM is a global asset management business that offers a wide range of investing expertise and resources, including research capabilities in many countries throughout the world. Deutsche Bank has advised the Board that the U.S. asset management business continues to be a critical and integral part of Deutsche Bank, and that Deutsche Bank will continue to invest in Deutsche AM and seek to enhance Deutsche AM’s investment platform. Deutsche Bank also has confirmed its commitment to maintaining strong legal and compliance groups within the Deutsche AM division.
As part of the contract review process, the Board carefully considered the fees and expenses of each Deutsche fund overseen by the Board in light of the fund’s performance. In many cases, this led to the negotiation and implementation of expense caps. As part of these negotiations, the Board indicated that it would consider relaxing these caps in future years following sustained improvements in performance, among other considerations.
While shareholders may focus primarily on fund performance and fees, the Fund’s Board considers these and many other factors, including the quality and integrity of DIMA’s personnel and such other issues as back-office operations, fund valuations, and compliance policies and procedures.
Nature, Quality and Extent of Services. The Board considered the terms of the Agreement, including the scope of advisory services provided under the Agreement. The Board noted that, under the Agreement, DIMA provides portfolio management services to the Fund and that, pursuant to a separate administrative services agreement, DIMA provides administrative services to the Fund. The Board considered the experience and skills of senior management and investment personnel and the resources made available to such personnel. The Board reviewed the Fund’s performance over short-term and long-term periods and compared those returns to various agreed-upon performance measures, including market index(es) and a peer universe compiled using information supplied by Morningstar Direct ("Morningstar"), an independent fund data service. The Board also noted that it has put into place a process of identifying "Focus Funds" (e.g., funds performing poorly relative to a peer universe), and receives additional reporting from DIMA regarding such funds and, where appropriate, DIMA’s plans to address underperformance. The Board believes this process is an effective manner of identifying and addressing underperforming funds. Based on the information provided, the Board noted that for the one-, three- and five-year periods ended December 31, 2015, the Fund’s performance (Class A shares) was in the 3rd quartile, 4th quartile and 4th quartile, respectively, of the applicable Morningstar universe (the 1st quartile being the best performers and the 4th quartile being the worst performers). The Board also observed that the Fund has outperformed its benchmark in the three- and five-year periods and has underperformed its benchmark in the one-year period ended December 31, 2015. The Board noted the disappointing investment performance of the Fund in recent periods and continued to discuss with senior management of DIMA the factors contributing to such underperformance and actions being taken to improve performance. The Board observed that the Fund had experienced improved relative performance during the first seven months of 2016. The Board recognized the efforts by DIMA in recent years to enhance its investment platform and improve long-term performance across the Deutsche fund complex.
Fees and Expenses. The Board considered the Fund’s investment management fee schedule, operating expenses and total expense ratios, and comparative information provided by Broadridge Financial Solutions, Inc. ("Broadridge") and the Fee Consultant regarding investment management fee rates paid to other investment advisors by similar funds (1st quartile being the most favorable and 4th quartile being the least favorable). With respect to management fees paid to other investment advisors by similar funds, the Board noted that the contractual fee rates paid by the Fund, which include a 0.10% fee paid to DIMA under the Fund’s administrative services agreement, were equal to the median (2nd quartile) of the applicable Broadridge peer group (based on Broadridge data provided as of December 31, 2015). The Board noted that the Fund’s Class A shares total (net) operating expenses were expected to be lower than the median (2nd quartile) of the applicable Broadridge expense universe (based on Broadridge data provided as of December 31, 2015, and analyzing Broadridge expense universe Class A (net) expenses less any applicable 12b-1 fees) ("Broadridge Universe Expenses"). The Board noted that the expense limitation agreed to by DIMA was expected to help the Fund’s total (net) operating expenses remain competitive. The Board considered the Fund’s management fee rate as compared to fees charged by DIMA to comparable Deutsche U.S. registered funds ("Deutsche Funds") and considered differences between the Fund and the comparable Deutsche Funds. The information requested by the Board as part of its review of fees and expenses also included information about institutional accounts (including any sub-advised funds and accounts) and funds offered primarily to European investors ("Deutsche Europe funds") managed by Deutsche AM. The Board noted that DIMA indicated that Deutsche AM does not manage any institutional accounts or Deutsche Europe funds comparable to the Fund.
On the basis of the information provided, the Board concluded that management fees were reasonable and appropriate in light of the nature, quality and extent of services provided by DIMA.
Profitability. The Board reviewed detailed information regarding revenues received by DIMA under the Agreement. The Board considered the estimated costs and pre-tax profits realized by DIMA from advising the Deutsche Funds, as well as estimates of the pre-tax profits attributable to managing the Fund in particular. The Board also received information regarding the estimated enterprise-wide profitability of DIMA and its affiliates with respect to all fund services in totality and by fund. The Board and the Fee Consultant reviewed DIMA’s methodology in allocating its costs to the management of the Fund. Based on the information provided, the Board concluded that the pre-tax profits realized by DIMA in connection with the management of the Fund were not unreasonable. The Board also reviewed certain publicly available information regarding the profitability of certain similar investment management firms. The Board noted that while information regarding the profitability of such firms is limited (and in some cases is not necessarily prepared on a comparable basis), DIMA and its affiliates’ overall profitability with respect to the Deutsche Funds (after taking into account distribution and other services provided to the funds by DIMA and its affiliates) was lower than the overall profitability levels of most comparable firms for which such data was available.
Economies of Scale. The Board considered whether there are economies of scale with respect to the management of the Fund and whether the Fund benefits from any economies of scale. The Board noted that the Fund’s investment management fee schedule includes fee breakpoints. The Board concluded that the Fund’s fee schedule represents an appropriate sharing between the Fund and DIMA of such economies of scale as may exist in the management of the Fund at current asset levels.
Other Benefits to DIMA and Its Affiliates. The Board also considered the character and amount of other incidental benefits received by DIMA and its affiliates, including any fees received by DIMA for administrative services provided to the Fund. The Board also considered benefits to DIMA related to brokerage and soft-dollar allocations, including allocating brokerage to pay for research generated by parties other than the executing broker dealers, which pertain primarily to funds investing in equity securities, along with the incidental public relations benefits to DIMA related to Deutsche Funds advertising and cross-selling opportunities among DIMA products and services. The Board considered these benefits in reaching its conclusion that the Fund’s management fees were reasonable.
Compliance. The Board considered the significant attention and resources dedicated by DIMA to documenting and enhancing its compliance processes in recent years. The Board noted in particular (i) the experience,seniority and time commitment of the individuals serving as DIMA’s and the Fund’s chief compliance officers; (ii) the large number of DIMA compliance personnel; and (iii) the substantial commitment of resources by DIMA and its affiliates to compliance matters.
Based on all of the information considered and the conclusions reached, the Board unanimously determined that the continuation of the Agreement is in the best interests of the Fund. In making this determination, the Board did not give particular weight to any single factor identified above. The Board considered these factors over the course of numerous meetings, certain of which were in executive session with only the Independent Trustees and counsel present. It is possible that individual Independent Trustees may have weighed these factors differently in reaching their individual decisions to approve the continuation of the Agreement.
Notes

VS2GE-3 (R-028380-6 8/17)

June 30, 2017
Semiannual Report
Deutsche Variable Series II
Deutsche Global Growth VIP
(Effective on or about October 1, 2017, Deutsche Global Growth VIP will be renamed Deutsche International Growth VIP.)

Contents
3 Performance Summary 4 Portfolio Summary 4 Portfolio Management Team 5 Investment Portfolio 10 Statement of Assets and Liabilities 10 Statement of Operations 11 Statements of Changes in Net Assets 13 Financial Highlights 14 Notes to Financial Statements 19 Information About Your Fund's Expenses 20 Proxy Voting 21 Advisory Agreement Board Considerations and Fee Evaluation |
This report must be preceded or accompanied by a prospectus. To obtain an additional prospectus or summary prospectus, if available, call (800) 728-3337 or your financial representative. We advise you to consider the Fund's objectives, risks, charges and expenses carefully before investing. The summary prospectus and prospectus contain this and other important information about the Fund. Please read the prospectus carefully before you invest.
Stocks may decline in value. Smaller company stocks tend to be more volatile than medium-sized or large company stocks. Investing in foreign securities, particularly those of emerging markets, presents certain risks, such as currency fluctuations, political and economic changes, and market risks. Emerging markets tend to be more volatile and less liquid than the markets of more mature economies, and generally have less diverse and less mature economic structures and less stable political systems than those of developed countries. Investing in derivatives entails special risks relating to liquidity, leverage and credit that may reduce returns and/or increase volatility. The Fund may lend securities to approved institutions. See the prospectus for details.
Deutsche Asset Management represents the asset management activities conducted by Deutsche Bank AG or any of its subsidiaries.
Deutsche AM Distributors, Inc., 222 South Riverside Plaza, Chicago, IL 60606, (800) 621-1148
NOT FDIC/NCUA INSURED NO BANK GUARANTEE MAY LOSE VALUE NOT A DEPOSIT
NOT INSURED BY ANY FEDERAL GOVERNMENT AGENCY
Performance Summary June 30, 2017 (Unaudited)
Fund performance shown is historical, assumes reinvestment of all dividend and capital gain distributions and does not guarantee future results. Investment return and principal value fluctuate with changing market conditions so that, when redeemed, shares may be worth more or less than their original cost. Current performance may be lower or higher than the performance data quoted. Please contact your participating insurance company for the Fund's most recent month-end performance. Performance doesn't reflect charges and fees ("contract charges") associated with the separate account that invests in the Fund or any variable life insurance policy or variable annuity contract for which the Fund is an investment option. These charges and fees will reduce returns. While all share classes have the same underlying portfolio, their performance will differ.
The gross expense ratios of the Fund, as stated in the fee table of the prospectus dated May 1, 2017 are 1.66% and 1.98% for Class A and Class B shares, respectively, and may differ from the expense ratios disclosed in the Financial Highlights tables in this report.
Generally accepted accounting principles require adjustments to be made to the net assets of the Fund at period end for financial reporting purposes only, and as such, the total return based on the unadjusted net asset value per share may differ from the total return reported in the financial highlights.
| Growth of an Assumed $10,000 Investment in Deutsche Global Growth VIP | ||
■ Deutsche Global Growth VIP — Class A ■ MSCI World Index | The Morgan Stanley Capital International (MSCI) World Index captures large and mid cap representation across 23 Developed Markets countries. Index returns do not reflect any fees or expenses and it is not possible to invest directly into an index. | |
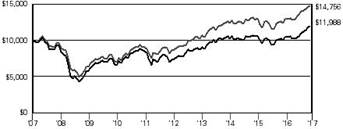 | ||
| Yearly periods ended June 30 | ||
The growth of $10,000 is cumulative.
| Comparative Results | ||||||
| Deutsche Global Growth VIP | 6-Month‡ | 1-Year | 3-Year | 5-Year | 10-Year | |
| Class A | Growth of $10,000 | $11,563 | $11,939 | $11,331 | $16,333 | $11,988 |
| Average annual total return | 15.63% | 19.39% | 4.25% | 10.31% | 1.83% | |
| MSCI World Index | Growth of $10,000 | $11,066 | $11,820 | $11,655 | $17,144 | $14,756 |
| Average annual total return | 10.66% | 18.20% | 5.24% | 11.38% | 3.97% | |
| Deutsche Global Growth VIP | 6-Month‡ | 1-Year | 3-Year | 5-Year | 10-Year | |
| Class B | Growth of $10,000 | $11,564 | $11,928 | $11,230 | $16,088 | $11,596 |
| Average annual total return | 15.64% | 19.28% | 3.94% | 9.98% | 1.49% | |
| MSCI World Index | Growth of $10,000 | $11,066 | $11,820 | $11,655 | $17,144 | $14,756 |
| Average annual total return | 10.66% | 18.20% | 5.24% | 11.38% | 3.97% | |
‡ Total returns shown for periods less than one year are not annualized.
Portfolio Summary (Unaudited)
| Asset Allocation (As a % of Investment Portfolio excluding Securities Lending Collateral) | 6/30/17 | 12/31/16 |
| Common Stocks | 97% | 97% |
| Cash Equivalents | 2% | 2% |
| Preferred Stock | 1% | 1% |
| Warrants | 0% | 0% |
| 100% | 100% |
| Sector Diversification (As a % of Investment Portfolio excluding Cash Equivalents and Securities Lending Collateral) | 6/30/17 | 12/31/16 |
| Information Technology | 23% | 20% |
| Health Care | 21% | 20% |
| Financials | 20% | 18% |
| Consumer Discretionary | 11% | 13% |
| Industrials | 9% | 10% |
| Consumer Staples | 9% | 9% |
| Materials | 4% | 5% |
| Energy | 2% | 3% |
| Telecommunication Services | 1% | 2% |
| 100% | 100% |
| Geographical Diversification (As a % of Investment Portfolio excluding Cash Equivalents and Securities Lending Collateral) | 6/30/17 | 12/31/16 |
| United States | 54% | 56% |
| Canada | 6% | 5% |
| Switzerland | 6% | 5% |
| Germany | 6% | 6% |
| United Kingdom | 5% | 5% |
| Japan | 3% | 6% |
| China | 3% | 1% |
| Sweden | 3% | 3% |
| Singapore | 2% | 2% |
| Netherlands | 2% | 1% |
| Hong Kong | 1% | 2% |
| Other | 9% | 8% |
| 100% | 100% |
Portfolio holdings and characteristics are subject to change.
For more complete details about the Fund's investment portfolio, see page 5.
Following the Fund's fiscal first and third quarter-end, a complete portfolio holdings listing is filed with the SEC on Form N-Q. The form will be available on the SEC's Web site at sec.gov, and it also may be reviewed and copied at the SEC's Public Reference Room in Washington, D.C. Information on the operation of the SEC's Public Reference Room may be obtained by calling (800) SEC-0330. The Fund's portfolio holdings are also posted on deutschefunds.com from time to time. Please see the Fund's current prospectus for more information.
Portfolio Management Team
Sebastian P. Werner, PhD, Director
Mark Schumann, CFA, Director
Portfolio Managers
Investment Portfolio June 30, 2017 (Unaudited)
Shares | Value ($) | |
| Common Stocks 96.7% | ||
| Australia 1.1% | ||
| Australia & New Zealand Banking Group Ltd. (Cost $326,112) | 14,500 | 320,076 |
| Canada 6.1% | ||
| Agnico Eagle Mines Ltd. | 11,000 | 496,052 |
| Alimentation Couche-Tard, Inc. "B" | 7,500 | 359,500 |
| Brookfield Asset Management, Inc. "A" | 15,734 | 617,445 |
| Toronto-Dominion Bank | 6,700 | 337,635 |
| Trisura Group Ltd.* | 92 | 1,540 |
| (Cost $1,285,510) | 1,812,172 | |
| China 2.8% | ||
| Alibaba Group Holding Ltd. (ADR)* | 2,500 | 352,250 |
| Minth Group Ltd. | 38,870 | 164,791 |
| Tencent Holdings Ltd. | 9,000 | 321,846 |
| (Cost $591,008) | 838,887 | |
| Finland 1.0% | ||
| Cramo Oyj | 2,641 | 79,030 |
| Sampo Oyj "A" | 4,500 | 230,617 |
| (Cost $272,658) | 309,647 | |
| France 0.6% | ||
| LVMH Moet Hennessy Louis Vuitton SE (Cost $137,668) | 750 | 186,998 |
| Germany 5.1% | ||
| Allianz SE (Registered) | 1,700 | 334,741 |
| BASF SE | 1,500 | 138,926 |
| Continental AG | 1,060 | 228,758 |
| Fresenius Medical Care AG & Co. KGaA | 4,730 | 454,717 |
| Siemens AG (Registered) | 2,600 | 357,390 |
| (Cost $1,241,815) | 1,514,532 | |
| Hong Kong 1.2% | ||
| AIA Group Ltd. | 25,000 | 182,678 |
| Techtronic Industries Co., Ltd. | 38,097 | 175,177 |
| (Cost $267,206) | 357,855 | |
| Indonesia 0.7% | ||
| PT Arwana Citramulia Tbk | 621,918 | 22,416 |
| PT Bank Rakyat Indonesia Persero Tbk | 150,000 | 171,764 |
| (Cost $187,898) | 194,180 | |
| Ireland 1.3% | ||
| Avadel Pharmaceuticals PLC (ADR)* | 9,500 | 104,785 |
| Kerry Group PLC "A" | 3,300 | 283,926 |
| (Cost $354,661) | 388,711 | |
| Italy 0.5% | ||
| Luxottica Group SpA (Cost $152,470) | 2,600 | 150,410 |
| Japan 3.3% | ||
| Bandai Namco Holdings, Inc. | 4,700 | 160,044 |
| FANUC Corp. | 800 | 154,025 |
| Hoya Corp. | 6,200 | 321,535 |
| MISUMI Group, Inc. | 7,511 | 171,356 |
Shares | Value ($) | |
| Murata Manufacturing Co., Ltd. | 1,200 | 182,120 |
| (Cost $814,446) | 989,080 | |
| Korea 0.4% | ||
| Vieworks Co., Ltd. (Cost $132,359) | 2,500 | 125,639 |
| Luxembourg 1.1% | ||
| Eurofins Scientific (Cost $130,977) | 600 | 337,951 |
| Malaysia 0.4% | ||
| IHH Healthcare Bhd. (Cost $125,729) | 92,000 | 123,234 |
| Netherlands 1.5% | ||
| Core Laboratories NV | 1,268 | 128,410 |
| ING Groep NV | 18,600 | 320,784 |
| (Cost $376,498) | 449,194 | |
| Norway 0.4% | ||
| Marine Harvest ASA* (Cost $82,965) | 7,200 | 123,237 |
| Philippines 0.3% | ||
| Universal Robina Corp. (Cost $126,279) | 27,000 | 87,164 |
| Singapore 1.7% | ||
| Broadcom Ltd. (Cost $363,221) | 2,100 | 489,405 |
| Sweden 2.5% | ||
| Assa Abloy AB "B" | 15,000 | 329,567 |
| Essity AB "B"* | 9,300 | 254,448 |
| Nobina AB 144A | 18,000 | 97,642 |
| Svenska Cellulosa AB "B" | 9,300 | 70,373 |
| (Cost $595,913) | 752,030 | |
| Switzerland 5.8% | ||
| Lonza Group AG (Registered)* | 1,928 | 416,805 |
| Nestle SA (Registered) | 6,180 | 537,826 |
| Novartis AG (Registered) | 4,100 | 341,203 |
| Roche Holding AG (Genusschein) | 1,700 | 432,934 |
| (Cost $1,425,458) | 1,728,768 | |
| Taiwan 1.1% | ||
| Taiwan Semiconductor Manufacturing Co., Ltd. (Cost $285,923) | 47,000 | 322,140 |
| United Kingdom 5.1% | ||
| Aon PLC | 4,300 | 571,685 |
| Clinigen Healthcare Ltd. | 5,959 | 66,825 |
| Compass Group PLC | 11,923 | 251,573 |
| Halma PLC | 11,000 | 157,597 |
| Reckitt Benckiser Group PLC | 4,600 | 466,360 |
| (Cost $1,177,032) | 1,514,040 | |
| United States 52.7% | ||
| A.O. Smith Corp. | 4,000 | 225,320 |
| Acadia Healthcare Co., Inc.* (a) | 4,500 | 222,210 |
| Activision Blizzard, Inc. | 7,000 | 402,990 |
| Allergan PLC | 1,610 | 391,375 |
| Alliance Data Systems Corp. | 1,200 | 308,028 |
| Alphabet, Inc. "A"* | 860 | 799,525 |
| Ameriprise Financial, Inc. | 1,700 | 216,393 |
| AMETEK, Inc. | 6,700 | 405,819 |
Shares | Value ($) | |
| Amgen, Inc. | 900 | 155,007 |
| Amphenol Corp. "A" | 7,000 | 516,740 |
| Apple, Inc. | 4,200 | 604,884 |
| Becton, Dickinson & Co. | 1,600 | 312,176 |
| Biogen, Inc.* | 950 | 257,792 |
| Celgene Corp.* | 4,200 | 545,454 |
| Citigroup, Inc. | 5,600 | 374,528 |
| Colgate-Palmolive Co. | 1,900 | 140,847 |
| Costco Wholesale Corp. | 1,680 | 268,682 |
| Danaher Corp. | 3,700 | 312,243 |
| Ecolab, Inc. | 2,400 | 318,600 |
| EOG Resources, Inc. | 2,150 | 194,618 |
| EPAM Systems, Inc.* | 2,800 | 235,452 |
| Facebook, Inc. "A"* | 3,000 | 452,940 |
| Fiserv, Inc.* | 2,600 | 318,084 |
| General Electric Co. | 9,700 | 261,997 |
| Home Depot, Inc. | 2,100 | 322,140 |
| Jack in the Box, Inc. | 2,200 | 216,700 |
| JPMorgan Chase & Co. | 5,300 | 484,420 |
| L Brands, Inc. | 2,900 | 156,281 |
| Marsh & McLennan Companies, Inc. | 4,300 | 335,228 |
| Mastercard, Inc. "A" | 3,700 | 449,365 |
| Microsoft Corp. | 3,600 | 248,148 |
| NIKE, Inc. "B" | 3,500 | 206,500 |
| NVIDIA Corp. | 1,400 | 202,384 |
| Praxair, Inc. | 1,200 | 159,060 |
| Progressive Corp. | 11,500 | 507,035 |
| QUALCOMM, Inc. | 2,600 | 143,572 |
| Retrophin, Inc.* | 5,000 | 96,950 |
| S&P Global, Inc. | 3,500 | 510,965 |
| Schlumberger Ltd. | 1,900 | 125,096 |
| T-Mobile U.S., Inc.* | 6,000 | 363,720 |
| The Priceline Group, Inc.* | 230 | 430,220 |
| Thermo Fisher Scientific, Inc. | 2,600 | 453,622 |
| Time Warner, Inc. | 2,800 | 281,148 |
| TJX Companies, Inc. | 4,000 | 288,680 |
| TriState Capital Holdings, Inc.* | 4,035 | 101,682 |
| Union Pacific Corp. | 1,400 | 152,474 |
| United Technologies Corp. | 2,600 | 317,486 |
| Wabtec Corp. | 1,800 | 164,700 |
| Wells Fargo & Co. | 4,200 | 232,722 |
| Zoetis, Inc. | 8,000 | 499,040 |
| (Cost $12,558,181) | 15,691,042 | |
| Total Common Stocks (Cost $23,011,987) | 28,806,392 | |
Shares | Value ($) | |
| Warrants 0.0% | ||
| France | ||
| Parrot SA Expiration Date 12/15/2022* | 924 | 137 |
| Parrot SA Expiration Date 12/22/2022* | 924 | 139 |
| Total Warrants (Cost $0) | 276 | |
| Preferred Stocks 0.6% | ||
| Germany 0.5% | ||
| Draegerwerk AG & Co. KGaA (Cost $116,360) | 1,600 | 168,326 |
| United States 0.1% | ||
| Providence Service Corp. (Cost $13,600) | 136 | 17,259 |
| Total Preferred Stocks (Cost $129,960) | 185,585 | |
| Securities Lending Collateral 0.8% | ||
| Deutsche Government & Agency Securities Portfolio "Deutsche Government Cash Institutional Shares", 0.87% (b) (c) (Cost $226,091) | 226,091 | 226,091 |
| Cash Equivalents 2.3% | ||
| Deutsche Central Cash Management Government Fund, 1.03% (b) (Cost $677,445) | 677,445 | 677,445 |
| % of Net Assets | Value ($) | |
| Total Investment Portfolio (Cost $24,045,483)† | 100.4 | 29,895,789 |
| Other Assets and Liabilities, Net | (0.4) | (112,887) |
| Net Assets | 100.0 | 29,782,902 |
* Non-income producing security.
† The Cost for federal income tax purposes was $24,084,634. At June 30, 2017, net unrealized appreciation for all securities based on tax cost was $5,811,155. This consisted of aggregate gross unrealized appreciation for all securities in which there was an excess of value over tax Cost of $6,218,841 and aggregate gross unrealized depreciation for all securities in which there was an excess of tax Cost over value of $407,686.
(a) All or a portion of these securities were on loan. In addition, "Other Assets and Liabilities, Net" may include pending sales that are also on loan. The value of securities loaned at June 30, 2017 amounted to $219,988, which is 0.7% of net assets.
(b) Affiliated fund managed by Deutsche Investment Management Americas Inc. The rate shown is the annualized seven-day yield at period end.
(c) Represents collateral held in connection with securities lending. Income earned by the Fund is net of borrower rebates.
144A: Security exempt from registration under Rule 144A of the Securities Act of 1933. These securities may be resold in transactions exempt from registration, normally to qualified institutional buyers.
ADR: American Depositary Receipt
S&P: Standard & Poor's
Fair Value Measurements
Various inputs are used in determining the value of the Fund's investments. These inputs are summarized in three broad levels. Level 1 includes quoted prices in active markets for identical securities. Level 2 includes other significant observable inputs (including quoted prices for similar securities, interest rates, prepayment speeds and credit risk). Level 3 includes significant unobservable inputs (including the Fund's own assumptions in determining the fair value of investments). The level assigned to the securities valuations may not be an indication of the risk or liquidity associated with investing in those securities.
The following is a summary of the inputs used as of June 30, 2017 in valuing the Fund's investments. For information on the Fund's policy regarding the valuation of investments, please refer to the Security Valuation section of Note A in the accompanying Notes to Financial Statements.
| Assets | Level 1 | Level 2 | Level 3 | Total | |
| Common Stocks | |||||
| Australia | $ 320,076 | $ — | $ — | $ 320,076 | |
| Canada | 1,812,172 | — | — | 1,812,172 | |
| China | 838,887 | — | — | 838,887 | |
| Finland | 309,647 | — | — | 309,647 | |
| France | 186,998 | — | — | 186,998 | |
| Germany | 1,514,532 | — | — | 1,514,532 | |
| Hong Kong | 357,855 | — | — | 357,855 | |
| Indonesia | 194,180 | — | — | 194,180 | |
| Ireland | 388,711 | — | — | 388,711 | |
| Italy | 150,410 | — | — | 150,410 | |
| Japan | 989,080 | — | — | 989,080 | |
| Korea | 125,639 | — | — | 125,639 | |
| Luxembourg | 337,951 | — | — | 337,951 | |
| Malaysia | 123,234 | — | — | 123,234 | |
| Netherlands | 449,194 | — | — | 449,194 | |
| Norway | 123,237 | — | — | 123,237 | |
| Philippines | 87,164 | — | — | 87,164 | |
| Singapore | 489,405 | — | — | 489,405 | |
| Sweden | 752,030 | — | — | 752,030 | |
| Switzerland | 1,728,768 | — | — | 1,728,768 | |
| Taiwan | 322,140 | — | — | 322,140 | |
| United Kingdom | 1,514,040 | — | — | 1,514,040 | |
| United States | 15,691,042 | — | — | 15,691,042 | |
| Warrants (d) | — | — | 276 | 276 | |
| Preferred Stocks (d) | 168,326 | — | 17,259 | 185,585 | |
| Short-Term Investments (d) | 903,536 | — | — | 903,536 | |
| Total | $ 29,878,254 | $ | $ 17,535 | $ 29,895,789 | |
As a result of the fair valuation model utilized by the Fund, certain international securities transferred from Level 2 to Level 1. During the period ended June 30, 2017, the amount of the transfers between Level 2 and Level 1 was $9,085,570.
Transfers between price levels are recognized at the beginning of the reporting year.
(d) See Investment Portfolio for additional detailed categorizations.
The accompanying notes are an integral part of the financial statements.
Statement of Assets and Liabilities
| as of June 30, 2017 (Unaudited) | |
| Assets | |
Investments: Investments in non-affiliated securities, at value (Cost $23,141,947) — including $219,988 of securities loaned | $ 28,992,253 |
| Investment in Deutsche Government & Agency Securities Portfolio (cost $226,091)* | 226,091 |
| Investment in Deutsche Central Cash Management Government Fund (Cost $677,445) | 677,445 |
| Total investments in securities, at value (Cost $24,045,483) | 29,895,789 |
| Foreign currency, at value (Cost $206,219) | 207,088 |
| Receivable for investments sold | 156,592 |
| Receivable for Fund shares sold | 6,822 |
| Dividends receivable | 37,078 |
| Interest receivable | 607 |
| Foreign taxes recoverable | 20,576 |
| Other assets | 700 |
| Total assets | 30,325,252 |
| Liabilities | |
| Payable upon return of securities loaned | 226,091 |
| Payable for investments purchased | 152,363 |
| Payable for Fund shares redeemed | 77,769 |
| Accrued management fee | 17,614 |
| Accrued Directors' fees | 332 |
| Other accrued expenses and payables | 68,181 |
| Total liabilities | 542,350 |
| Net assets, at value | 29,782,902 |
| Net Assets Consist of | |
| Undistributed net investment income | 161,954 |
Net unrealized appreciation (depreciation) on: Investments | 5,850,306 |
| Foreign currency | 1,623 |
| Accumulated net realized gain (loss) | (17,631,235) |
| Paid-in capital | 41,400,254 |
| Net assets, at value | 29,782,902 |
Class A Net Asset Value, offering and redemption price per share ($29,627,835 ÷ 2,312,514 outstanding shares of beneficial interest, no par value, unlimited number of shares authorized) | $ 12.81 |
Class B Net Asset Value, offering and redemption price per share ($155,067 ÷ 12,061 outstanding shares of beneficial interest, no par value, unlimited number of shares authorized) | $ 12.86 |
* Represents collateral on securities loaned.
The accompanying notes are an integral part of the financial statements.
Statement of Operations
| for the six months ended June 30, 2017 (Unaudited) | |
| Investment Income | |
Income: Dividends (net of foreign taxes withheld of $26,533) | $ 307,106 |
| Income distributions — Deutsche Central Cash Management Government Fund | 1,855 |
| Securities lending income, net of borrower rebates | 1,054 |
| Total income | 310,015 |
Expenses: Management fee | 129,166 |
| Administration fee | 14,117 |
| Services to shareholders | 474 |
| Distribution service fee (Class B) | 120 |
| Custodian fee | 16,783 |
| Professional fees | 38,807 |
| Reports to shareholders | 10,989 |
| Directors' fees and expenses | 1,623 |
| Other | 8,476 |
| Total expenses before expense reductions | 220,555 |
| Expense reductions | (86,328) |
| Total expenses after expense reductions | 134,227 |
| Net investment income (loss) | 175,788 |
| Realized and Unrealized Gain (Loss) | |
Net realized gain (loss) from: Investments | 189,300 |
| Foreign currency | 3,286 |
| 192,586 | |
Change in net unrealized appreciation (depreciation) on: Investments | 3,744,781 |
| Foreign currency | 7,048 |
| 3,751,829 | |
| Net gain (loss) | 3,944,415 |
| Net increase (decrease) in net assets resulting from operations | $ 4,120,203 |
The accompanying notes are an integral part of the financial statements.
Statements of Changes in Net Assets
| Increase (Decrease) in Net Assets | Six Months Ended June 30, 2017 (Unaudited) | Year Ended December 31, 2016 | |
Operations: Net investment income (loss) | $ 175,788 | $ 146,983 | |
| Net realized gain (loss) | 192,586 | 1,336,318 | |
| Change in net unrealized appreciation (depreciation) | 3,751,829 | (701,827) | |
| Net increase (decrease) in net assets resulting from operations | 4,120,203 | 781,474 | |
Distributions to shareholders from: Net investment income: Class A | (106,825) | (243,128) | |
| Class B | (65) | (285) | |
| Total distributions | (106,890) | (243,413) | |
Fund share transactions: Class A Proceeds from shares sold | 794,044 | 1,028,197 | |
| Reinvestment of distributions | 106,825 | 243,128 | |
| Payments for shares redeemed | (2,143,526) | (8,614,441) | |
| Net increase (decrease) in net assets from Class A share transactions | (1,242,657) | (7,343,116) | |
Class B Proceeds from shares sold | 73,359 | 14,771 | |
| Reinvestment of distributions | 65 | 285 | |
| Payments for shares redeemed | (903) | (11,122) | |
| Net increase (decrease) in net assets from Class B share transactions | 72,521 | 3,934 | |
| Increase (decrease) in net assets | 2,843,177 | (6,801,121) | |
| Net assets at beginning of period | 26,939,725 | 33,740,846 | |
| Net assets at end of period (including undistributed net investment income of $161,954 and $93,056, respectively) | $ 29,782,902 | $ 26,939,725 | |
| Other Information | |||
Class A Shares outstanding at beginning of period | 2,417,159 | 3,116,107 | |
| Shares sold | 64,042 | 95,060 | |
| Shares issued to shareholders in reinvestment of distributions | 8,713 | 22,163 | |
| Shares redeemed | (177,400) | (816,171) | |
| Net increase (decrease) in Class A shares | (104,645) | (698,948) | |
| Shares outstanding at end of period | 2,312,514 | 2,417,159 | |
Class B Shares outstanding at beginning of period | 6,272 | 6,040 | |
| Shares sold | 5,858 | 1,328 | |
| Shares issued to shareholders in reinvestment of distributions | 5 | 26 | |
| Shares redeemed | (74) | (1,122) | |
| Net increase (decrease) in Class B shares | 5,789 | 232 | |
| Shares outstanding at end of period | 12,061 | 6,272 | |
The accompanying notes are an integral part of the financial statements.
Financial Highlights
| Class A | Six Months Ended 6/30/17 (Unaudited) | Years Ended December 31, | |||||
| 2016 | 2015 | 2014 | 2013 | 2012 | |||
| Selected Per Share Data | |||||||
| Net asset value, beginning of period | $ 11.12 | $ 10.81 | $ 11.04 | $ 11.13 | $ 9.24 | $ 7.90 | |
Income (loss) from investment operations: Net investment incomea | .07 | .06 | .07 | .08 | .10 | .12 | |
| Net realized and unrealized gain (loss) | 1.67 | .34 | (.21) | (.06) | 1.92 | 1.34 | |
| Total from investment operations | 1.74 | .40 | (.14) | .02 | 2.02 | 1.46 | |
Less distributions from: Net investment income | (.05) | (.09) | (.09) | (.11) | (.13) | (.12) | |
| Net asset value, end of period | $ 12.81 | $ 11.12 | $ 10.81 | $ 11.04 | $ 11.13 | $ 9.24 | |
| Total Return (%)b | 15.63** | 3.72 | (1.32) | .21 | 22.08 | 18.60 | |
| Ratios to Average Net Assets and Supplemental Data | |||||||
| Net assets, end of period ($ millions) | 30 | 27 | 34 | 47 | 51 | 54 | |
| Ratio of expenses before expense reductions (%)c | 1.56* | 1.66 | 1.44 | 1.41 | 1.45 | 1.42 | |
| Ratio of expenses after expense reductions (%)c | .95* | .95 | .90 | .82 | .88 | .99 | |
| Ratio of net investment income (%) | 1.25* | .51 | .65 | .71 | 1.00 | 1.40 | |
| Portfolio turnover rate (%) | 11** | 70 | 64 | 63 | 171 | 107 | |
a Based on average shares outstanding during the period. b Total return would have been lower had certain expenses not been reduced. c Expense ratio does not reflect charges and fees associated with the separate account that invests in the Fund or any variable life insurance policy or variable annuity contract for which the Fund is an investment option. * Annualized ** Not annualized | |||||||
| Class B | Six Months Ended 6/30/17 (Unaudited) | Years Ended December 31, | |||||
| 2016 | 2015 | 2014 | 2013 | 2012 | |||
| Selected Per Share Data | |||||||
| Net asset value, beginning of period | $ 11.13 | $ 10.82 | $ 11.05 | $ 11.14 | $ 9.25 | $ 7.91 | |
Income (loss) from investment operations: Net investment incomea | .06 | .02 | .05 | .02 | .07 | .09 | |
| Net realized and unrealized gain (loss) | 1.68 | .35 | (.23) | (.04) | 1.92 | 1.34 | |
| Total from investment operations | 1.74 | .37 | (.18) | (.02) | 1.99 | 1.43 | |
Less distributions from: Net investment income | (.01) | (.06) | (.05) | (.07) | (.10) | (.09) | |
| Net asset value, end of period | $ 12.86 | $ 11.13 | $ 10.82 | $ 11.05 | $ 11.14 | $ 9.25 | |
| Total Return (%)b | 15.64** | 3.38 | (1.64) | (.15) | 21.62 | 18.16 | |
| Ratios to Average Net Assets and Supplemental Data | |||||||
| Net assets, end of period ($ millions) | .16 | .07 | .1 | .1 | 3 | 3 | |
| Ratio of expenses before expense reductions (%)c | 1.85* | 1.98 | 1.76 | 1.76 | 1.81 | 1.76 | |
| Ratio of expenses after expense reductions (%)c | 1.20* | 1.24 | 1.22 | 1.15 | 1.23 | 1.34 | |
| Ratio of net investment income (%) | .94* | .17 | .40 | .14 | .66 | 1.04 | |
| Portfolio turnover rate (%) | 11** | 70 | 64 | 63 | 171 | 107 | |
a Based on average shares outstanding during the period. b Total return would have been lower had certain expenses not been reduced. c Expense ratio does not reflect charges and fees associated with the separate account that invests in the Fund or any variable life insurance policy or variable annuity contract for which the Fund is an investment option. * Annualized ** Not annualized | |||||||
Notes to Financial Statements (Unaudited)
A. Organization and Significant Accounting Policies
Deutsche Global Growth VIP (the "Fund") is a diversified series of Deutsche Variable Series II (the "Trust"), which is registered under the Investment Company Act of 1940, as amended (the "1940 Act"), as an open-end management investment company organized as a Massachusetts business trust.
Multiple Classes of Shares of Beneficial Interest. The Fund offers two classes of shares (Class A shares and Class B shares). Sales of Class B shares are subject to recordkeeping fees up to 0.15% and Rule 12b-1 fees under the 1940 Act equal to an annual rate of 0.25% of the average daily net assets for Class B shares of the Fund. Class A shares are not subject to such fees.
Investment income, realized and unrealized gains and losses, and certain fund-level expenses and expense reductions, if any, are borne pro rata on the basis of relative net assets by the holders of all classes of shares except that each class bears certain expenses unique to that class (including the applicable Rule 12b-1 fee and recordkeeping fees). Differences in class-level expenses may result in payment of different per share dividends by class. All shares have equal rights with respect to voting subject to class-specific arrangements.
The Fund's financial statements are prepared in accordance with accounting principles generally accepted in the United States of America ("U.S. GAAP") which require the use of management estimates. Actual results could differ from those estimates. The Fund qualifies as an investment company under Topic 946 of Accounting Standards Codification of U.S. GAAP. The policies described below are followed consistently by the Fund in the preparation of its financial statements.
Security Valuation. Investments are stated at value determined as of the close of regular trading on the New York Stock Exchange on each day the exchange is open for trading.
Various inputs are used in determining the value of the Fund's investments. These inputs are summarized in three broad levels. Level 1 includes quoted prices in active markets for identical securities. Level 2 includes other significant observable inputs (including quoted prices for similar securities, interest rates, prepayment speeds and credit risk). Level 3 includes significant unobservable inputs (including the Fund's own assumptions in determining the fair value of investments). The level assigned to the securities valuations may not be an indication of the risk or liquidity associated with investing in those securities.
Equity securities are valued at the most recent sale price or official closing price reported on the exchange (U.S. or foreign) or over-the-counter market on which they trade. Securities for which no sales are reported are valued at the calculated mean between the most recent bid and asked quotations on the relevant market or, if a mean cannot be determined, at the most recent bid quotation. Equity securities are generally categorized as Level 1. For certain international equity securities, in order to adjust for events which may occur between the close of the foreign exchanges and the close of the New York Stock Exchange, a fair valuation model may be used. This fair valuation model takes into account comparisons to the valuation of American Depository Receipts (ADRs), exchange-traded funds, futures contracts and certain indices and these securities are categorized as Level 2.
Investments in open-end investment companies are valued at their net asset value each business day and are categorized as Level 1.
Securities and other assets for which market quotations are not readily available or for which the above valuation procedures are deemed not to reflect fair value are valued in a manner that is intended to reflect their fair value as determined in accordance with procedures approved by the Board and are generally categorized as Level 3. In accordance with the Fund's valuation procedures, factors considered in determining value may include, but are not limited to, the type of the security; the size of the holding; the initial cost of the security; the existence of any contractual restrictions on the security's disposition; the price and extent of public trading in similar securities of the issuer or of comparable companies; quotations or evaluated prices from broker-dealers and/or pricing services; information obtained from the issuer, analysts, and/or the appropriate stock exchange (for exchange-traded securities); an analysis of the company's or issuer's financial statements; an evaluation of the forces that influence the issuer and the market(s) in which the security is purchased and sold; and with respect to debt securities, the maturity, coupon, creditworthiness, currency denomination and the movement of the market in which the security is normally traded. The value determined under these procedures may differ from published values for the same securities.
Disclosure about the classification of fair value measurements is included in a table following the Fund's Investment Portfolio.
Foreign Currency Translations. The books and records of the Fund are maintained in U.S. dollars. Investment securities and other assets and liabilities denominated in a foreign currency are translated into U.S. dollars at the prevailing exchange rates at period end. Purchases and sales of investment securities, income and expenses are translated into U.S. dollars at the prevailing exchange rates on the respective dates of the transactions.
Net realized and unrealized gains and losses on foreign currency transactions represent net gains and losses between trade and settlement dates on securities transactions, the acquisition and disposition of foreign currencies, and the difference between the amount of net investment income accrued and the U.S. dollar amount actually received. The portion of both realized and unrealized gains and losses on investments that results from fluctuations in foreign currency exchange rates is not separately disclosed but is included with net realized and unrealized gain/appreciation and loss/depreciation on investments.
Securities Lending. Brown Brothers Harriman & Co., as lending agent, lends securities of the Fund to certain financial institutions under the terms of its securities lending agreement. During the term of the loans, the Fund continues to receive interest and dividends generated by the securities and to participate in any changes in their market value. The Fund requires the borrowers of the securities to maintain collateral with the Fund consisting of either cash or liquid, unencumbered assets having a value at least equal to the value of the securities loaned. When the collateral falls below specified amounts, the lending agent will use its best effort to obtain additional collateral on the next business day to meet required amounts under the securities lending agreement. As of period end, any securities on loan were collateralized by cash. During the six months ended June 30, 2017, the Fund invested the cash collateral into a joint trading account in affiliated money market funds managed by Deutsche Investment Management Americas Inc. As of June 30, 2017, the Fund invested the cash collateral in Deutsche Government & Agency Securities Portfolio. Deutsche Investment Management Americas Inc. receives a management/administration fee (0.13% annualized effective rate as of June 30, 2017) on the cash collateral invested in Deutsche Government & Agency Securities Portfolio. The Fund receives compensation for lending its securities either in the form of fees or by earning interest on invested cash collateral net of borrower rebates and fees paid to a lending agent. Either the Fund or the borrower may terminate the loan at any time, and the borrower, after notice, is required to return borrowed securities within a standard time period. There may be risks of delay and costs in recovery of securities or even loss of rights in the collateral should the borrower of the securities fail financially. If the Fund is not able to recover securities lent, the Fund may sell the collateral and purchase a replacement investment in the market, incurring the risk that the value of the replacement security is greater than the value of the collateral. The Fund is also subject to all investment risks associated with the reinvestment of any cash collateral received, including, but not limited to, interest rate, credit and liquidity risk associated with such investments.
As of June 30, 2017, the Fund had securities on loan, which were classified as common stock in the Investment Portfolio. The value of the related collateral exceeded the value of the securities loaned at period end. As of period end, the remaining contractual maturity of the collateral agreements were overnight and continuous.
Taxes. The Fund's policy is to comply with the requirements of the Internal Revenue Code, as amended, which are applicable to regulated investment companies and to distribute all of its taxable income to its shareholders.
Additionally, the Fund may be subject to taxes imposed by the governments of countries in which it invests and are generally based on income and/or capital gains earned or repatriated, a portion of which may be recoverable. Based upon the current interpretation of the tax rules and regulations, estimated tax liabilities and recoveries on certain foreign securities are recorded on an accrual basis and are reflected as components of interest income or net change in unrealized gain/loss on investments. Tax liabilities realized as a result of security sales are reflected as a component of net realized gain/loss on investments.
Under the Regulated Investment Company Modernization Act of 2010, net capital losses incurred post-enactment may be carried forward indefinitely, and their character is retained as short-term and/or long-term. Previously, net capital losses were carried forward for eight years and treated as short-term. As a transition rule, the Act requires that post-enactment net capital losses be used before pre-enactment net capital losses.
At December 31, 2016, the Fund had a net tax basis capital loss carryforward of approximately $17,790,000 of pre-enactment losses, which may be applied against any realized net taxable capital gains of each succeeding year until fully utilized or until December 31, 2017, the expiration date, whichever occurs first.
From November 1, 2016 through December 31, 2016, the Fund elects to defer qualified late year losses of approximately $360 of net short-term realized capital losses and treat them as arising in the fiscal year ending December 31, 2017.
The Fund has reviewed the tax positions for the open tax years as of December 31, 2016 and has determined that no provision for income tax and/or uncertain tax provisions is required in the Fund's financial statements. The Fund's federal tax returns for the prior three fiscal years remain open subject to examination by the Internal Revenue Service.
Distribution of Income and Gains. Distributions from net investment income of the Fund, if any, are declared and distributed to shareholders annually. Net realized gains from investment transactions, in excess of available capital loss carryforwards, would be taxable to the Fund if not distributed and, therefore, will be distributed to shareholders at least annually. The Fund may also make additional distributions for tax purposes if necessary.
The timing and characterization of certain income and capital gain distributions are determined annually in accordance with federal tax regulations which may differ from accounting principles generally accepted in the United States of America. These differences primarily relate to investments in foreign denominated investments, income received from Passive Foreign Investment Companies and certain securities sold at a loss. As a result, net investment income (loss) and net realized gain (loss) on investment transactions for a reporting period may differ significantly from distributions during such period. Accordingly, the Fund may periodically make reclassifications among certain of its capital accounts without impacting the net asset value of the Fund.
The tax character of current year distributions will be determined at the end of the current fiscal year.
Expenses. Expenses of the Trust arising in connection with a specific fund are allocated to that fund. Other Trust expenses which cannot be directly attributed to a fund are apportioned among the funds in the Trust based upon the relative net assets or other appropriate measures.
Contingencies. In the normal course of business, the Fund may enter into contracts with service providers that contain general indemnification clauses. The Fund's maximum exposure under these arrangements is unknown, as this would involve future claims that may be made against the Fund that have not yet been made. However, based on experience, the Fund expects the risk of loss to be remote.
Other. Investment transactions are accounted for on a trade date plus one basis for daily net asset value calculations. However, for financial reporting purposes, investment transactions are reported on trade date. Interest income is recorded on the accrual basis. Dividend income is recorded on the ex-dividend date net of foreign withholding taxes. Realized gains and losses from investment transactions are recorded on an identified cost basis. Proceeds from litigation payments, if any, are included in net realized gain (loss) from investments.
B. Purchases and Sales of Securities
During the six months ended June 30, 2017, purchases and sales of investment transactions (excluding short-term investments) aggregated $2,945,313 and $4,182,035, respectively.
C. Related Parties
Management Agreement. Under the Investment Management Agreement with Deutsche Investment Management Americas Inc. ("DIMA" or the "Advisor"), an indirect, wholly owned subsidiary of Deutsche Bank AG, the Advisor directs the investments of the Fund in accordance with its investment objectives, policies and restrictions. The Advisor determines the securities, instruments and other contracts relating to investments to be purchased, sold or entered into by the Fund.
Pursuant to the Investment Management Agreement with the Advisor, the Fund pays a monthly management fee based on the Fund's average daily net assets, computed and accrued daily and payable monthly, at the following annual rates:
| First $250 million | .915% |
| Next $500 million | .865% |
| Next $750 million | .815% |
| Next $1.5 billion | .765% |
| Over $3 billion | .715% |
Accordingly, for the six months ended June 30, 2017, the fee pursuant to the Investment Management Agreement was equivalent to an annualized rate (exclusive of any applicable waivers/reimbursements) of 0.915% of the Fund's average daily net assets.
For the period from January 1, 2017 through April 30, 2018, the Advisor has contractually agreed to waive all or a portion of its fee and/or reimburse certain operating expenses of the Fund to the extent necessary to maintain the total annual operating expenses (excluding certain expenses such as extraordinary expenses, taxes, brokerage and interest expense) of each class as follows:
| Class A | .95% |
| Class B | 1.20% |
For the six months ended June 30, 2017, fees waived and/or expenses reimbursed for each class are as follows:
| Class A | $ 86,016 |
| Class B | 312 |
| $ 86,328 |
Effective on or about October 1, 2017, the Fund will pay the Advisor a monthly management fee computed and accrued daily and payable monthly, at the a rate of 0.62% of the Fund's average daily net assets.
In addition, effective on or about October 1, 2017 through September 30, 2018, the Advisor has contractually agreed to waive its fees and/or reimburse Fund expenses to the extent necessary to maintain the Fund’s total annual operating expenses (excluding certain expenses such as extraordinary expenses, taxes, brokerage and interest expenses) of each class as follows:
| Class A | .81% |
| Class B | 1.06% |
Administration Fee. Pursuant to an Administrative Services Agreement, DIMA provides most administrative services to the Fund. For all services provided under the Administrative Services Agreement, the Fund pays DIMA an annual fee ("Administration Fee") of 0.10% of the Fund's average daily net assets, computed and accrued daily and payable monthly. For the six months ended June 30, 2017, the Administration Fee was $14,117, of which $2,467 is unpaid.
Service Provider Fees. Deutsche AM Service Company ("DSC"), an affiliate of the Advisor, is the transfer agent, dividend-paying agent and shareholder service agent for the Fund. Pursuant to a sub-transfer agency agreement between DSC and DST Systems, Inc. ("DST"), DSC has delegated certain transfer agent, dividend-paying agent and shareholder service agent functions to DST. DSC compensates DST out of the shareholder servicing fee it receives from the Fund. For the six months ended June 30, 2017, the amounts charged to the Fund by DSC were as follows:
| Services to Shareholders | Total Aggregated | Unpaid at June 30, 2017 |
| Class A | $ 116 | $ 57 |
| Class B | 20 | 10 |
| $ 136 | $ 67 |
Distribution Service Agreement. Under the Fund's Class B 12b-1 plan, Deutsche AM Distributors, Inc. ("DDI") received a fee ("Distribution Service Fee") of 0.25% of average daily net assets of Class B shares. For the six months ended June 30, 2017, the Distribution Service Fee aggregated $120, of which $32 is unpaid.
Typesetting and Filing Service Fees. Under an agreement with DIMA, DIMA is compensated for providing typesetting and certain regulatory filing services to the Fund. For the six months ended June 30, 2017, the amount charged to the Fund by DIMA included in the Statement of Operations under "Reports to shareholders" aggregated $6,558, of which $6,289 is unpaid.
Trustees' Fees and Expenses. The Fund paid retainer fees to each Trustee not affiliated with the Advisor, plus specified amounts to the Board Chairperson and Vice Chairperson and to each committee Chairperson.
Affiliated Cash Management Vehicles. The Fund may invest uninvested cash balances in Deutsche Central Cash Management Government Fund and Deutsche Variable NAV Money Fund, affiliated money market funds which are managed by the Advisor. Each affiliated money market fund is managed in accordance with Rule 2a-7 under the 1940 Act, which governs the quality, maturity, diversity and liquidity of instruments in which a money market fund may invest. Deutsche Central Cash Management Government Fund seeks to maintain a stable net asset value, and Deutsche Variable NAV Money Fund maintains a floating net asset value. The Fund indirectly bears its proportionate share of the expenses of each affiliated money market fund in which it invests. Deutsche Central Cash Management Government Fund does not pay the Advisor an investment management fee. To the extent that Deutsche Variable NAV Money Fund pays an investment management fee to the Advisor, the Advisor will waive an amount of the investment management fee payable to the Advisor by the Fund equal to the amount of the investment management fee payable on the Fund's assets invested in Deutsche Variable NAV Money Fund.
D. Ownership of the Fund
At June 30, 2017, two participating insurance companies were owners of record of 10% or more of the total outstanding Class A shares of the Fund, each owning 66% and 25%. Three participating insurance companies were owners of record of 10% or more of the total outstanding Class B shares of the Fund, owning 47%, 36%, and 17%.
E. Line of Credit
The Fund and other affiliated funds (the "Participants") share in a $400 million revolving credit facility provided by a syndication of banks. The Fund may borrow for temporary or emergency purposes, including the meeting of redemption requests that otherwise might require the untimely disposition of securities. The Participants are charged an annual commitment fee which is allocated based on net assets, among each of the Participants. Interest is calculated at a rate per annum equal to the sum of the Federal Funds Rate plus 1.25 percent plus if the one-month LIBOR exceeds the Federal Funds Rate, the amount of such excess. The Fund may borrow up to a maximum of 33 percent of its net assets under the agreement. The Fund had no outstanding loans at June 30, 2017.
F. Fund Name and Strategy Change
Effective on or about October 1, 2017, Deutsche Global Growth VIP will be renamed Deutsche International Growth VIP. At that time, the Fund's principal investment strategy will also change to reflect a foreign growth strategy and the Fund's non-fundamental policy will change to reflect the shift from a global to international focus. The Fund will generally invest less than 20% of its assets in U.S. equities. The Fund's benchmark will also change from the MSCI World Index to the MSCI ACWI ex US Index.
Information About Your Fund's Expenses (Unaudited)
As an investor of the Fund, you incur two types of costs: ongoing expenses and transaction costs. Ongoing expenses include management fees, distribution and service (12b-1) fees and other Fund expenses. Examples of transaction costs include contract charges, which are not shown in this section. The following tables are intended to help you understand your ongoing expenses (in dollars) of investing in the Fund and to help you compare these expenses with the ongoing expenses of investing in other mutual funds. In the most recent six-month period, the Fund limited these expenses; had it not done so, expenses would have been higher. The example in the table is based on an investment of $1,000 invested at the beginning of the six-month period and held for the entire period (January 1, 2017 to June 30, 2017).
The tables illustrate your Fund's expenses in two ways:
— Actual Fund Return. This helps you estimate the actual dollar amount of ongoing expenses (but not transaction costs) paid on a $1,000 investment in the Fund using the Fund's actual return during the period. To estimate the expenses you paid over the period, simply divide your account value by $1,000 (for example, an $8,600 account value divided by $1,000 = 8.6), then multiply the result by the number in the "Expenses Paid per $1,000" line under the share class you hold.
— Hypothetical 5% Fund Return. This helps you to compare your Fund's ongoing expenses (but not transaction costs) with those of other mutual funds using the Fund's actual expense ratio and a hypothetical rate of return of 5% per year before expenses. Examples using a 5% hypothetical Fund return may be found in the shareholder reports of other mutual funds. The hypothetical account values and expenses may not be used to estimate the actual ending account balance or expenses you paid for the period.
Please note that the expenses shown in these tables are meant to highlight your ongoing expenses only and do not reflect any transaction costs. The "Expenses Paid per $1,000" line of the tables is useful in comparing ongoing expenses only and will not help you determine the relative total expense of owning different funds. If these transaction costs had been included, your costs would have been higher.
| Expenses and Value of a $1,000 Investment for the six months ended June 30, 2017 | ||||
| Actual Fund Return | Class A | Class B | ||
| Beginning Account Value 1/1/17 | $ 1,000.00 | $ 1,000.00 | ||
| Ending Account Value 6/30/17 | $ 1,156.30 | $ 1,156.40 | ||
| Expenses Paid per $1,000* | $ 5.08 | $ 6.42 | ||
| Hypothetical 5% Fund Return | Class A | Class B | ||
| Beginning Account Value 1/1/17 | $ 1,000.00 | $ 1,000.00 | ||
| Ending Account Value 6/30/17 | $ 1,020.08 | $ 1,018.84 | ||
| Expenses Paid per $1,000* | $ 4.76 | $ 6.01 | ||
* Expenses are equal to the Fund's annualized expense ratio for each share class, multiplied by the average account value over the period, multiplied by 181 (the number of days in the most recent six-month period), then divided by 365.
| Annualized Expense Ratios | Class A | Class B | ||
| Deutsche Variable Series II — Deutsche Global Growth VIP | .95% | 1.20% |
For more information, please refer to the Fund's prospectus.
These tables do not reflect charges and fees ("contract charges") associated with the separate account that invests in the Fund or any variable life insurance policy or variable annuity contract for which the Fund is an investment option.
For an analysis of the fees associated with an investment in the fund or similar funds, please refer to the current and hypothetical expense calculators for Variable Insurance Products which can be found at deutschefunds.com/EN/resources/calculators.jsp.
Proxy Voting
The Trust's policies and procedures for voting proxies for portfolio securities and information about how the Trust voted proxies related to its portfolio securities during the most recent 12-month period ended June 30 are available on our Web site — deutschefunds.com (click on "proxy voting" at the bottom of the page) — or on the SEC's Web site — sec.gov. To obtain a written copy of the Trust's policies and procedures without charge, upon request, call us toll free at (800) 728-3337.
Advisory Agreement Board Considerations and Fee Evaluation
The Board of Trustees (hereinafter referred to as the "Board" or "Trustees") approved the renewal of Deutsche Global Growth VIP’s (the "Fund") investment management agreement (the "Agreement") with Deutsche Investment Management Americas Inc. ("DIMA") in September 2016.
In terms of the process that the Board followed prior to approving the Agreement, shareholders should know that:
— During the entire process, all of the Fund’s Trustees were independent of DIMA and its affiliates (the "Independent Trustees").
— The Board met frequently during the past year to discuss fund matters and dedicated a substantial amount of time to contract review matters. Over the course of several months, the Board’s Contract Committee reviewed extensive materials received from DIMA, independent third parties and independent counsel. These materials included an analysis of the Fund’s performance, fees and expenses, and profitability from a fee consultant retained by the Fund’s Independent Trustees (the "Fee Consultant"). The Board also received extensive information throughout the year regarding performance of the Fund.
— The Independent Trustees regularly meet privately with counsel to discuss contract review and other matters. In addition, the Independent Trustees were advised by the Fee Consultant in the course of their review of the Fund’s contractual arrangements and considered a comprehensive report prepared by the Fee Consultant in connection with their deliberations.
— In connection with reviewing the Agreement, the Board also reviewed the terms of the Fund’s Rule 12b-1 plan, distribution agreement, administrative services agreement, transfer agency agreement and other material service agreements.
— Based on its evaluation of the information provided, the Contract Committee presented its findings and recommendations to the Board. The Board then reviewed the Contract Committee’s findings and recommendations.
In connection with the contract review process, the Contract Committee and the Board considered the factors discussed below, among others. The Board also considered that DIMA and its predecessors have managed the Fund since its inception, and the Board believes that a long-term relationship with a capable, conscientious advisor is in the best interests of the Fund. The Board considered, generally, that shareholders chose to invest or remain invested in the Fund knowing that DIMA managed the Fund, and that the Agreement was approved by the Fund’s shareholders. DIMA is part of Deutsche Bank AG’s ("Deutsche Bank") Asset Management ("Deutsche AM") division. Deutsche AM is a global asset management business that offers a wide range of investing expertise and resources, including research capabilities in many countries throughout the world. Deutsche Bank has advised the Board that the U.S. asset management business continues to be a critical and integral part of Deutsche Bank, and that Deutsche Bank will continue to invest in Deutsche AM and seek to enhance Deutsche AM’s investment platform. Deutsche Bank also has confirmed its commitment to maintaining strong legal and compliance groups within the Deutsche AM division.
As part of the contract review process, the Board carefully considered the fees and expenses of each Deutsche fund overseen by the Board in light of the fund’s performance. In many cases, this led to the negotiation and implementation of expense caps. As part of these negotiations, the Board indicated that it would consider relaxing these caps in future years following sustained improvements in performance, among other considerations.
While shareholders may focus primarily on fund performance and fees, the Fund’s Board considers these and many other factors, including the quality and integrity of DIMA’s personnel and such other issues as back-office operations, fund valuations, and compliance policies and procedures.
Nature, Quality and Extent of Services. The Board considered the terms of the Agreement, including the scope of advisory services provided under the Agreement. The Board noted that, under the Agreement, DIMA provides portfolio management services to the Fund and that, pursuant to a separate administrative services agreement, DIMA provides administrative services to the Fund. The Board considered the experience and skills of senior management and investment personnel and the resources made available to such personnel. The Board reviewed the Fund’s performance over short-term and long-term periods and compared those returns to various agreed-upon performance measures, including market index(es) and a peer universe compiled using information supplied by Morningstar Direct ("Morningstar"), an independent fund data service. The Board also noted that it has put into place a process of identifying "Focus Funds" (e.g., funds performing poorly relative to a peer universe), and receives additional reporting from DIMA regarding such funds and, where appropriate, DIMA’s plans to address underperformance. The Board believes this process is an effective manner of identifying and addressing underperforming funds. Based on the information provided, the Board noted that for the one-, three- and five-year periods ended December 31, 2015, the Fund’s performance (Class A shares) was in the 3rd quartile, 4th quartile and 4th quartile, respectively, of the applicable Morningstar universe (the 1st quartile being the best performers and the 4th quartile being the worst performers). The Board also observed that the Fund has underperformed its benchmark in the one-, three- and five-year periods ended December 31, 2015. The Board noted the disappointing investment performance of the Fund in recent periods and continued to discuss with senior management of DIMA the factors contributing to such underperformance and actions being taken to improve performance. The Board considered that effective on or about October 3, 2016, the Fund would change its investment strategy and portfolio managers. The Board observed that the Fund had experienced improved relative performance during the first seven months of 2016. The Board recognized the efforts by DIMA in recent years to enhance its investment platform and improve long-term performance across the Deutsche fund complex.
Fees and Expenses. The Board considered the Fund’s investment management fee schedule, operating expenses and total expense ratios, and comparative information provided by Broadridge Financial Solutions, Inc. ("Broadridge") and the Fee Consultant regarding investment management fee rates paid to other investment advisors by similar funds (1st quartile being the most favorable and 4th quartile being the least favorable). With respect to management fees paid to other investment advisors by similar funds, the Board noted that the contractual fee rates paid by the Fund, which include a 0.10% fee paid to DIMA under the Fund’s administrative services agreement, were higher than the median (4th quartile) of the applicable Broadridge peer group (based on Broadridge data provided as of December 31, 2015). The Board noted that the Fund’s Class A shares total (net) operating expenses were expected to be lower than the median (2nd quartile) of the applicable Broadridge expense universe (based on Broadridge data provided as of December 31, 2015, and analyzing Broadridge expense universe Class A (net) expenses less any applicable 12b-1 fees) ("Broadridge Universe Expenses"). The Board also reviewed data comparing each share class’s total (net) operating expenses to the applicable Broadridge Universe Expenses. The Board noted that the expense limitations agreed to by DIMA were expected to help the Fund’s total (net) operating expenses remain competitive. The Board considered the Fund’s management fee rate as compared to fees charged by DIMA to comparable Deutsche U.S. registered funds ("Deutsche Funds") and considered differences between the Fund and the comparable Deutsche Funds. The information requested by the Board as part of its review of fees and expenses also included information about institutional accounts (including any sub-advised funds and accounts) and funds offered primarily to European investors ("Deutsche Europe funds") managed by Deutsche AM. The Board noted that DIMA indicated that Deutsche AM does not manage any institutional accounts or Deutsche Europe funds comparable to the Fund.
On the basis of the information provided, the Board concluded that management fees were reasonable and appropriate in light of the nature, quality and extent of services provided by DIMA.
Profitability. The Board reviewed detailed information regarding revenues received by DIMA under the Agreement. The Board considered the estimated costs and pre-tax profits realized by DIMA from advising the Deutsche Funds, as well as estimates of the pre-tax profits attributable to managing the Fund in particular. The Board also received information regarding the estimated enterprise-wide profitability of DIMA and its affiliates with respect to all fund services in totality and by fund. The Board and the Fee Consultant reviewed DIMA’s methodology in allocating its costs to the management of the Fund. Based on the information provided, the Board concluded that the pre-tax profits realized by DIMA in connection with the management of the Fund were not unreasonable. The Board also reviewed certain publicly available information regarding the profitability of certain similar investment management firms. The Board noted that while information regarding the profitability of such firms is limited (and in some cases is not necessarily prepared on a comparable basis), DIMA and its affiliates’ overall profitability with respect to the Deutsche Funds (after taking into account distribution and other services provided to the funds by DIMA and its affiliates) was lower than the overall profitability levels of most comparable firms for which such data was available.
Economies of Scale. The Board considered whether there are economies of scale with respect to the management of the Fund and whether the Fund benefits from any economies of scale. The Board noted that the Fund’s investment management fee schedule includes fee breakpoints. The Board concluded that the Fund’s fee schedule represents an appropriate sharing between the Fund and DIMA of such economies of scale as may exist in the management of the Fund at current asset levels.
Other Benefits to DIMA and Its Affiliates. The Board also considered the character and amount of other incidental benefits received by DIMA and its affiliates, including any fees received by DIMA for administrative services provided to the Fund and any fees received by an affiliate of DIMA for distribution services. The Board also considered benefits to DIMA related to brokerage and soft-dollar allocations, including allocating brokerage to pay for research generated by parties other than the executing broker dealers, which pertain primarily to funds investing in equity securities, along with the incidental public relations benefits to DIMA related to Deutsche Funds advertising and cross-selling opportunities among DIMA products and services. The Board considered these benefits in reaching its conclusion that the Fund’s management fees were reasonable.
Compliance. The Board considered the significant attention and resources dedicated by DIMA to documenting and enhancing its compliance processes in recent years. The Board noted in particular (i) the experience, seniority and time commitment of the individuals serving as DIMA’s and the Fund’s chief compliance officers; (ii) the large number of DIMA compliance personnel; and (iii) the substantial commitment of resources by DIMA and its affiliates to compliance matters.
Based on all of the information considered and the conclusions reached, the Board unanimously determined that the continuation of the Agreement is in the best interests of the Fund. In making this determination, the Board did not give particular weight to any single factor identified above. The Board considered these factors over the course of numerous meetings, certain of which were in executive session with only the Independent Trustees and counsel present. It is possible that individual Independent Trustees may have weighed these factors differently in reaching their individual decisions to approve the continuation of the Agreement.
Notes

VS2GG-3 (R-028383-6 8/17)

June 30, 2017
Semiannual Report
Deutsche Variable Series II
Deutsche Global Income Builder VIP

Contents
3 Performance Summary 4 Portfolio Summary 4 Portfolio Management Team 5 Investment Portfolio 23 Statement of Assets and Liabilities 24 Statement of Operations 25 Statements of Changes in Net Assets 26 Financial Highlights 27 Notes to Financial Statements 35 Information About Your Fund's Expenses 36 Proxy Voting 37 Advisory Agreement Board Considerations and Fee Evaluation |
This report must be preceded or accompanied by a prospectus. To obtain an additional prospectus or summary prospectus, if available, call (800) 728-3337 or your financial representative. We advise you to consider the Fund's objectives, risks, charges and expenses carefully before investing. The summary prospectus and prospectus contain this and other important information about the Fund. Please read the prospectus carefully before you invest.
Although allocation among different asset categories generally limits risk, fund management may favor an asset category that underperforms other assets or markets as a whole. Stocks may decline in value. Smaller company stocks tend to be more volatile than medium-sized or large company stocks. Dividends are not guaranteed. If the dividend-paying stocks held by the Fund reduce or stop paying dividends, the Fund’s ability to generate income may be adversely affected. Preferred stocks, a type of dividend-paying stock, present certain additional risks. Investing in foreign securities, particularly those of emerging markets, presents certain risks, such as currency fluctuations, political and economic changes, and market risks. Emerging markets tend to be more volatile and less liquid than the markets of more mature economies, and generally have less diverse and less mature economic structures and less stable political systems than those of developed countries. Investing in derivatives entails special risks relating to liquidity, leverage and credit that may reduce returns and/or increase volatility. Bond investments are subject to interest-rate, credit, liquidity and market risks to varying degrees. When interest rates rise, bond prices generally fall. Credit risk refers to the ability of an issuer to make timely payments of principal and interest. Because Exchange Traded Funds (ETFs) trade on a securities exchange, their shares may trade at a premium or discount to their net asset value. ETFs also incur fees and expenses so they may not fully match the performance of the indexes they are designed to track. The Fund may lend securities to approved institutions. Any fund that focuses in a particular segment of the market or region of the world will generally be more volatile than a fund that invests more broadly. See the prospectus for details.
Deutsche Asset Management represents the asset management activities conducted by Deutsche Bank AG or any of its subsidiaries.
Deutsche AM Distributors, Inc., 222 South Riverside Plaza, Chicago, IL 60606, (800) 621-1148
NOT FDIC/NCUA INSURED NO BANK GUARANTEE MAY LOSE VALUE NOT A DEPOSIT
NOT INSURED BY ANY FEDERAL GOVERNMENT AGENCY
Performance Summary June 30, 2017 (Unaudited)
Fund performance shown is historical, assumes reinvestment of all dividend and capital gain distributions and does not guarantee future results. Investment return and principal value fluctuate with changing market conditions so that, when redeemed, shares may be worth more or less than their original cost. Current performance may be lower or higher than the performance data quoted. Please contact your participating insurance company for the Fund's most recent month-end performance. Performance doesn't reflect charges and fees ("contract charges") associated with the separate account that invests in the Fund or any variable life insurance policy or variable annuity contract for which the Fund is an investment option. These charges and fees will reduce returns.
The gross expense ratio of the Fund, as stated in the fee table of the prospectus dated May 1, 2017 is 0.66% for Class A shares and may differ from the expense ratio disclosed in the Financial Highlights table in this report.
Generally accepted accounting principles require adjustments to be made to the net assets of the Fund at period end for financial reporting purposes only, and as such, the total return based on the unadjusted net asset value per share may differ from the total return reported in the financial highlights.
| Growth of an Assumed $10,000 Investment in Deutsche Global Income Builder VIP | ||
■ Deutsche Global Income Builder VIP — Class A ■ S&P® Target Risk Moderate Index ■ Blended Index | ||
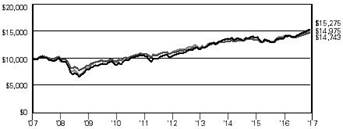 | ||
| Yearly periods ended June 30 | ||
The S&P Target Risk Moderate Index is designed to measure the performance of S&P's proprietary moderate target risk allocation model. The S&P Target Risk Moderate Index seeks to provide significant exposure to fixed income, while also allocating a smaller portion of exposure to equities in order to seek current income, some capital preservation, and an opportunity for moderate to low capital appreciation.
The Blended Index consists of an equally weighted blend (50%/50%) of the MSCI World High Dividend Yield Index and Bloomberg Barclays U.S. Universal Index
MSCI World High Dividend Yield Index includes securities that offer a meaningfully higher-than-average dividend yield relative to the MSCI World Index and pass dividend sustainability and persistence screens. The index offers broad market coverage, and is free-float market capitalization-weighted to ensure that its performance can be replicated in institutional and retail portfolios. The index is calculated using closing local market prices and translates into US dollars using the London close foreign exchange rates.
Bloomberg Barclays U.S. Universal Index represents the union of the U.S. Aggregate Index, the U.S. High-Yield Corporate Index, the 144A Index, the Eurodollar Index, the Emerging Markets Index, and the non-ERISA portion of the CMBS Index.
Index returns do not reflect any fees or expenses and it is not possible to invest directly into an index.
| Comparative Results | ||||||
| Deutsche Global Income Builder VIP | 6-Month‡ | 1-Year | 3-Year | 5-Year | 10-Year | |
| Class A | Growth of $10,000 | $10,746 | $11,119 | $11,145 | $14,616 | $15,275 |
| Average annual total return | 7.46% | 11.19% | 3.68% | 7.89% | 4.33% | |
| S&P® Target Risk Moderate Index | Growth of $10,000 | $10,618 | $10,745 | $11,104 | $13,394 | $14,743 |
| Average annual total return | 6.18% | 7.45% | 3.55% | 6.02% | 3.96% | |
| Blended Index | Growth of $10,000 | $10,593 | $10,625 | $10,945 | $13,472 | $14,975 |
| Average annual total return | 5.93% | 6.25% | 3.06% | 6.14% | 4.12% | |
The growth of $10,000 is cumulative.
‡ Total returns shown for periods less than one year are not annualized.
Portfolio Summary (Unaudited)
| Asset Allocation (As a % of Investment Portfolio excluding Securities Lending Collateral) | 6/30/17 | 12/31/16 |
| Equity | 62% | 58% |
| Common Stocks | 62% | 58% |
| Fixed Income | 36% | 41% |
| Government & Agency Obligations | 12% | 13% |
| Corporate Bonds | 11% | 14% |
| Exchange-Traded Funds | 9% | 10% |
| Collateralized Mortgage Obligations | 2% | 1% |
| Commercial Mortgage-Backed Securities | 1% | 1% |
| Asset-Backed | 1% | 1% |
| Municipal Bonds and Notes | 0% | 0% |
| Mortgage-Backed Securities Pass-Throughs | 0% | 1% |
| Cash Equivalents | 2% | 1% |
| 100% | 100% |
| Sector Diversification (As a % of Equities, Corporate Bonds, Preferred Securities and Convertible Bonds) | 6/30/17 | 12/31/16 |
| Financials | 18% | 29% |
| Information Technology | 16% | 19% |
| Consumer Discretionary | 13% | 9% |
| Industrials | 10% | 8% |
| Energy | 9% | 4% |
| Health Care | 9% | 7% |
| Telecommunication Services | 7% | 6% |
| Utilities | 7% | 7% |
| Consumer Staples | 5% | 7% |
| Materials | 4% | 3% |
| Real Estate | 2% | 1% |
| 100% | 100% |
Portfolio holdings and characteristics are subject to change.
For more complete details about the Fund's investment portfolio, see page 5.
Following the Fund's fiscal first and third quarter-end, a complete portfolio holdings listing is filed with the SEC on Form N-Q. The form will be available on the SEC's Web site at sec.gov, and it also may be reviewed and copied at the SEC's Public Reference Room in Washington, D.C. Information on the operation of the SEC's Public Reference Room may be obtained by calling (800) SEC-0330. The Fund's portfolio holdings are also posted on deutschefunds.com from time to time. Please see the Fund's current prospectus for more information.
Portfolio Management Team
Di Kumble, CFA, Managing Director
Gary Russell, CFA, Managing Director
John D. Ryan, Managing Director
Darwei Kung, Managing Director
Portfolio Managers
Investment Portfolio June 30, 2017 (Unaudited)
Shares | Value ($) | |||
| Common Stocks 62.6% | ||||
| Consumer Discretionary 7.7% | ||||
| Auto Components 0.4% | ||||
| Bridgestone Corp. | 6,705 | 288,528 | ||
| Nokian Renkaat Oyj | 5,565 | 230,344 | ||
| Stanley Electric Co., Ltd. | 10,100 | 304,414 | ||
| 823,286 | ||||
| Automobiles 1.2% | ||||
| Bayerische Motoren Werke (BMW) AG | 2,907 | 269,868 | ||
| Daimler AG (Registered) | 3,916 | 283,432 | ||
| Ford Motor Co. | 29,415 | 329,154 | ||
| General Motors Co. | 9,123 | 318,666 | ||
| Honda Motor Co., Ltd. | 9,850 | 268,330 | ||
| Nissan Motor Co., Ltd. | 23,585 | 234,435 | ||
| Subaru Corp. | 7,600 | 255,822 | ||
| Toyota Motor Corp. | 5,200 | 272,448 | ||
| 2,232,155 | ||||
| Hotels, Restaurants & Leisure 1.5% | ||||
| Carnival Corp. | 4,688 | 307,392 | ||
| Compass Group PLC | 13,435 | 283,466 | ||
| Darden Restaurants, Inc. | 3,300 | 298,452 | ||
| Las Vegas Sands Corp. | 5,000 | 319,450 | ||
| McDonald's Corp. | 2,223 | 340,475 | ||
| Royal Caribbean Cruises Ltd. | 2,638 | 288,149 | ||
| Starbucks Corp. | 4,733 | 275,981 | ||
| TUI AG | 18,677 | 272,206 | ||
| Yum! Brands, Inc. | 4,110 | 303,154 | ||
| 2,688,725 | ||||
| Household Durables 0.9% | ||||
| Berkeley Group Holdings PLC | 7,337 | 308,375 | ||
| Garmin Ltd. | 5,900 | 301,077 | ||
| Leggett & Platt, Inc. | 5,300 | 278,409 | ||
| Persimmon PLC | 10,545 | 307,924 | ||
| Sekisui House Ltd. | 17,054 | 300,141 | ||
| Taylor Wimpey PLC | 98,161 | 225,271 | ||
| 1,721,197 | ||||
| Internet & Direct Marketing Retail 0.2% | ||||
| Amazon.com, Inc.* | 300 | 290,400 | ||
| Leisure Products 0.2% | ||||
| Mattel, Inc. | 14,800 | 318,644 | ||
| Media 1.8% | ||||
| CBS Corp. "B" | 4,486 | 286,117 | ||
| Charter Communications, Inc. "A"* | 917 | 308,892 | ||
| Comcast Corp. "A" | 9,788 | 380,949 | ||
| Interpublic Group of Companies, Inc. | 11,800 | 290,280 | ||
| ITV PLC | 109,919 | 259,699 | ||
| Omnicom Group, Inc. | 3,379 | 280,119 | ||
| SES SA | 12,412 | 290,970 | ||
| Shaw Communications, Inc. "B" | 13,377 | 291,823 | ||
| Time Warner, Inc. | 3,327 | 334,064 | ||
| Twenty-First Century Fox, Inc. "B" | 10,143 | 282,685 | ||
| Walt Disney Co. | 3,209 | 340,956 | ||
| 3,346,554 | ||||
| Multiline Retail 0.3% | ||||
| Marks & Spencer Group PLC | 58,006 | 251,808 | ||
| Target Corp. | 5,002 | 261,554 | ||
| 513,362 | ||||
Shares | Value ($) | |||
| Specialty Retail 0.6% | ||||
| Hennes & Mauritz AB "B" | 11,514 | 286,869 | ||
| Home Depot, Inc. | 1,883 | 288,852 | ||
| Lowe's Companies, Inc. | 3,331 | 258,253 | ||
| TJX Companies, Inc. | 3,100 | 223,727 | ||
| 1,057,701 | ||||
| Textiles, Apparel & Luxury Goods 0.6% | ||||
| Cie Financiere Richemont SA (Registered) | 2,805 | 231,093 | ||
| Coach, Inc. | 6,700 | 317,178 | ||
| NIKE, Inc. "B" | 4,342 | 256,178 | ||
| VF Corp. | 5,841 | 336,442 | ||
| 1,140,891 | ||||
| Consumer Staples 3.3% | ||||
| Beverages 0.3% | ||||
| Anheuser-Busch InBev SA | 2,397 | 264,766 | ||
| PepsiCo, Inc. | 3,295 | 380,540 | ||
| 645,306 | ||||
| Food & Staples Retailing 0.9% | ||||
| Costco Wholesale Corp. | 1,400 | 223,902 | ||
| CVS Health Corp. | 3,511 | 282,495 | ||
| Sysco Corp. | 5,174 | 260,408 | ||
| Wal-Mart Stores, Inc. | 4,146 | 313,769 | ||
| Walgreens Boots Alliance, Inc. | 3,274 | 256,387 | ||
| Wesfarmers Ltd. | 8,909 | 274,720 | ||
| 1,611,681 | ||||
| Food Products 0.8% | ||||
| General Mills, Inc. | 5,016 | 277,886 | ||
| Kellogg Co. | 3,956 | 274,784 | ||
| Kraft Heinz Co. | 3,164 | 270,965 | ||
| Nestle SA (Registered) | 3,655 | 318,083 | ||
| The Hershey Co. | 2,653 | 284,853 | ||
| 1,426,571 | ||||
| Household Products 0.5% | ||||
| Colgate-Palmolive Co. | 3,944 | 292,369 | ||
| Kimberly-Clark Corp. | 2,183 | 281,847 | ||
| Procter & Gamble Co. | 3,318 | 289,163 | ||
| 863,379 | ||||
| Tobacco 0.8% | ||||
| British American Tobacco PLC | 4,150 | 282,906 | ||
| Imperial Brands PLC | 6,037 | 271,152 | ||
| Japan Tobacco, Inc. | 8,477 | 297,477 | ||
| Philip Morris International, Inc. | 2,719 | 319,346 | ||
| Reynolds American, Inc. | 4,592 | 298,664 | ||
| 1,469,545 | ||||
| Energy 3.6% | ||||
| Energy Equipment & Services 0.2% | ||||
| Schlumberger Ltd. | 4,000 | 263,360 | ||
| Oil, Gas & Consumable Fuels 3.4% | ||||
| BP PLC | 49,147 | 283,443 | ||
| China Petroleum & Chemical Corp. (ADR) (a) | 3,800 | 298,680 | ||
| CNOOC Ltd. (ADR) | 2,500 | 273,525 | ||
| Enbridge, Inc. | 6,879 | 274,020 | ||
| Eni SpA | 14,891 | 223,822 | ||
| HollyFrontier Corp. | 10,332 | 283,820 | ||
| JXTG Holdings, Inc. | 62,585 | 273,043 | ||
| Kinder Morgan, Inc. | 14,200 | 272,072 | ||
| Marathon Petroleum Corp. | 5,600 | 293,048 | ||
Shares | Value ($) | |||
| Neste Oyj | 6,867 | 270,510 | ||
| Occidental Petroleum Corp. | 4,749 | 284,323 | ||
| Pembina Pipeline Corp. | 8,900 | 294,768 | ||
| PetroChina Co., Ltd. (ADR) | 4,200 | 257,376 | ||
| Phillips 66 | 3,565 | 294,790 | ||
| Royal Dutch Shell PLC "A" | 14,336 | 379,973 | ||
| Royal Dutch Shell PLC "B" | 12,417 | 333,558 | ||
| Snam SpA | 61,516 | 268,114 | ||
| Statoil ASA | 13,115 | 217,412 | ||
| Suncor Energy, Inc. | 9,100 | 265,884 | ||
| TOTAL SA | 6,421 | 317,441 | ||
| TransCanada Corp. (a) | 6,100 | 290,794 | ||
| Valero Energy Corp. | 4,617 | 311,463 | ||
| 6,261,879 | ||||
| Financials 10.9% | ||||
| Banks 6.9% | ||||
| Australia & New Zealand Banking Group Ltd. | 12,913 | 285,044 | ||
| Banco Bilbao Vizcaya Argentaria SA | 33,669 | 279,376 | ||
| Banco Bradesco SA (ADR) | 29,400 | 249,900 | ||
| Bank of America Corp. | 12,900 | 312,954 | ||
| Bank of Montreal | 4,082 | 299,729 | ||
| Bank of Nova Scotia | 5,098 | 306,674 | ||
| BB&T Corp. | 6,518 | 295,982 | ||
| BNP Paribas SA | 3,910 | 281,614 | ||
| Canadian Imperial Bank of Commerce | 3,594 | 292,082 | ||
| Citigroup, Inc. | 4,800 | 321,024 | ||
| Commonwealth Bank of Australia | 4,534 | 288,579 | ||
| Credit Agricole SA | 18,166 | 292,240 | ||
| Danske Bank AS | 7,569 | 291,118 | ||
| DBS Group Holdings Ltd. | 19,771 | 297,839 | ||
| Hang Seng Bank Ltd. | 13,700 | 286,548 | ||
| HSBC Holdings PLC | 33,417 | 309,760 | ||
| ING Groep NV | 16,656 | 287,257 | ||
| Intesa Sanpaolo SpA | 80,716 | 255,919 | ||
| Intesa Sanpaolo SpA (RSP) | 85,487 | 253,471 | ||
| Itau Unibanco Holding SA (ADR) (Preferred) | 23,500 | 259,675 | ||
| Japan Post Bank Co., Ltd. | 22,600 | 288,942 | ||
| KB Financial Group, Inc. (ADR) | 6,300 | 318,087 | ||
| KBC Group NV | 3,028 | 229,674 | ||
| Lloyds Banking Group PLC | 317,775 | 273,785 | ||
| M&T Bank Corp. | 1,810 | 293,129 | ||
| Mitsubishi UFJ Financial Group, Inc. | 43,900 | 294,605 | ||
| Mizuho Financial Group, Inc. | 153,473 | 280,270 | ||
| National Australia Bank Ltd. | 11,685 | 265,750 | ||
| Nordea Bank AB | 22,555 | 287,001 | ||
| Oversea-Chinese Banking Corp., Ltd. | 38,955 | 305,302 | ||
| People's United Financial, Inc. | 16,356 | 288,847 | ||
| PNC Financial Services Group, Inc. | 2,267 | 283,080 | ||
| Royal Bank of Canada | 4,188 | 304,089 | ||
| Skandinaviska Enskilda Banken AB "A" | 23,993 | 290,205 | ||
| Societe Generale SA | 5,168 | 278,073 | ||
| Sumitomo Mitsui Financial Group, Inc. | 7,600 | 295,891 | ||
| SunTrust Banks, Inc. | 4,905 | 278,212 | ||
| Svenska Handelsbanken AB "A" | 20,000 | 286,301 | ||
| Swedbank AB "A" | 11,922 | 290,525 | ||
| Toronto-Dominion Bank | 6,131 | 308,961 | ||
| U.S. Bancorp. | 5,555 | 288,416 | ||
Shares | Value ($) | |||
| United Overseas Bank Ltd. | 17,102 | 287,197 | ||
| Wells Fargo & Co. | 5,916 | 327,805 | ||
| Westpac Banking Corp. | 11,349 | 266,134 | ||
| 12,657,066 | ||||
| Capital Markets 0.3% | ||||
| CME Group, Inc. | 2,483 | 310,971 | ||
| UBS Group AG (Registered)* | 16,791 | 284,374 | ||
| 595,345 | ||||
| Diversified Financial Services 0.2% | ||||
| Berkshire Hathaway, Inc. "B"* | 1,717 | 290,808 | ||
| Insurance 3.4% | ||||
| Aflac, Inc. | 3,829 | 297,437 | ||
| Ageas | 6,710 | 270,226 | ||
| Allianz SE (Registered) | 1,511 | 297,526 | ||
| Allstate Corp. | 3,348 | 296,097 | ||
| American International Group, Inc. | 4,575 | 286,029 | ||
| AXA SA | 10,603 | 290,040 | ||
| Baloise Holding AG (Registered) | 1,944 | 300,449 | ||
| Chubb Ltd. | 2,031 | 295,267 | ||
| Direct Line Insurance Group PLC | 61,889 | 286,478 | ||
| Japan Post Holdings Co., Ltd. | 22,900 | 283,820 | ||
| Legal & General Group PLC | 87,820 | 295,447 | ||
| MetLife, Inc. | 5,400 | 296,676 | ||
| Muenchener Rueckversicherungs- Gesellschaft AG (Registered) | 1,451 | 292,589 | ||
| Power Financial Corp. | 11,400 | 292,472 | ||
| Progressive Corp. | 7,060 | 311,275 | ||
| Prudential Financial, Inc. | 2,663 | 287,977 | ||
| Sampo Oyj "A" | 5,731 | 293,704 | ||
| Swiss Life Holding AG (Registered)* | 877 | 295,961 | ||
| Swiss Re AG | 4,728 | 432,172 | ||
| The Travelers Companies, Inc. | 2,395 | 303,039 | ||
| Zurich Insurance Group AG | 788 | 229,357 | ||
| 6,234,038 | ||||
| Thrifts & Mortgage Finance 0.1% | ||||
| New York Community Bancorp., Inc. | 21,536 | 282,768 | ||
| Health Care 6.6% | ||||
| Biotechnology 1.5% | ||||
| AbbVie, Inc. | 6,826 | 494,953 | ||
| Actelion Ltd. (Registered)* | 819 | 228,686 | ||
| Amgen, Inc. | 2,109 | 363,233 | ||
| Biogen, Inc.* | 1,141 | 309,622 | ||
| Celgene Corp.* | 2,400 | 311,688 | ||
| CSL Ltd. | 2,332 | 247,402 | ||
| Gilead Sciences, Inc. | 6,640 | 469,979 | ||
| Idorsia Ltd.* | 819 | 15,459 | ||
| Shire PLC | 4,815 | 265,778 | ||
| 2,706,800 | ||||
| Health Care Equipment & Supplies 0.8% | ||||
| Abbott Laboratories | 6,412 | 311,687 | ||
| Baxter International, Inc. | 5,161 | 312,447 | ||
| Becton, Dickinson & Co. | 1,576 | 307,493 | ||
| Medtronic PLC | 3,502 | 310,803 | ||
| Stryker Corp. | 2,099 | 291,299 | ||
| 1,533,729 | ||||
| Health Care Providers & Services 0.5% | ||||
| Aetna, Inc. | 2,011 | 305,330 | ||
| Anthem, Inc. | 1,558 | 293,107 | ||
| UnitedHealth Group, Inc. | 1,657 | 307,241 | ||
| 905,678 | ||||
Shares | Value ($) | |||
| Life Sciences Tools & Services 0.3% | ||||
| Lonza Group AG (Registered)* | 1,499 | 324,062 | ||
| Thermo Fisher Scientific, Inc. | 1,683 | 293,633 | ||
| 617,695 | ||||
| Pharmaceuticals 3.5% | ||||
| Allergan PLC | 1,181 | 287,089 | ||
| Astellas Pharma, Inc. | 22,300 | 272,517 | ||
| AstraZeneca PLC | 4,793 | 320,560 | ||
| Bayer AG (Registered) | 2,267 | 293,103 | ||
| Bristol-Myers Squibb Co. | 5,212 | 290,413 | ||
| Daiichi Sankyo Co., Ltd. | 12,600 | 296,530 | ||
| Eli Lilly & Co. | 3,568 | 293,646 | ||
| GlaxoSmithKline PLC | 16,150 | 344,020 | ||
| Johnson & Johnson | 4,230 | 559,587 | ||
| Merck & Co., Inc. | 6,339 | 406,266 | ||
| Mitsubishi Tanabe Pharma Corp. | 12,800 | 295,433 | ||
| Novartis AG (Registered) | 5,132 | 427,087 | ||
| Novo Nordisk AS ''B" | 7,007 | 300,068 | ||
| Orion Oyj "B" | 4,662 | 297,651 | ||
| Otsuka Holdings Co., Ltd. | 6,300 | 268,300 | ||
| Pfizer, Inc. | 13,222 | 444,127 | ||
| Roche Holding AG (Genusschein) | 1,491 | 379,708 | ||
| Sanofi | 2,924 | 279,729 | ||
| Takeda Pharmaceutical Co., Ltd. | 5,900 | 299,472 | ||
| 6,355,306 | ||||
| Industrials 7.4% | ||||
| Aerospace & Defense 1.1% | ||||
| BAE Systems PLC | 34,519 | 284,817 | ||
| Boeing Co. | 1,176 | 232,554 | ||
| General Dynamics Corp. | 1,486 | 294,377 | ||
| Lockheed Martin Corp. | 1,109 | 307,869 | ||
| Northrop Grumman Corp. | 1,167 | 299,580 | ||
| Raytheon Co. | 1,752 | 282,913 | ||
| United Technologies Corp. | 2,389 | 291,721 | ||
| 1,993,831 | ||||
| Air Freight & Logistics 0.2% | ||||
| United Parcel Service, Inc. "B" | 2,686 | 297,045 | ||
| Building Products 0.2% | ||||
| Johnson Controls International PLC | 6,786 | 294,241 | ||
| Commercial Services & Supplies 0.5% | ||||
| Republic Services, Inc. | 4,677 | 298,065 | ||
| Waste Connections, Inc. | 4,650 | 299,553 | ||
| Waste Management, Inc. | 4,427 | 324,721 | ||
| 922,339 | ||||
| Construction & Engineering 0.7% | ||||
| Kajima Corp. | 41,000 | 345,570 | ||
| Obayashi Corp. | 28,600 | 335,902 | ||
| Skanska AB "B" | 11,900 | 282,362 | ||
| Taisei Corp. | 37,000 | 337,515 | ||
| 1,301,349 | ||||
| Electrical Equipment 0.5% | ||||
| ABB Ltd. (Registered) | 12,385 | 305,847 | ||
| Eaton Corp. PLC | 3,689 | 287,115 | ||
| Emerson Electric Co. | 4,900 | 292,138 | ||
| 885,100 | ||||
| Industrial Conglomerates 0.7% | ||||
| 3M Co. | 1,961 | 408,261 | ||
| General Electric Co. | 12,449 | 336,247 | ||
| Honeywell International, Inc. | 2,606 | 347,354 | ||
| Siemens AG (Registered) | 2,003 | 275,328 | ||
| 1,367,190 | ||||
Shares | Value ($) | |||
| Machinery 1.5% | ||||
| Caterpillar, Inc. | 2,896 | 311,204 | ||
| Cummins, Inc. | 1,800 | 291,996 | ||
| Deere & Co. | 2,500 | 308,975 | ||
| Fortive Corp. | 4,500 | 285,075 | ||
| Illinois Tool Works, Inc. | 2,007 | 287,503 | ||
| Ingersoll-Rand PLC | 3,200 | 292,448 | ||
| Kone Oyj "B" | 6,216 | 316,216 | ||
| Schindler Holding AG (Registered) | 1,107 | 229,504 | ||
| Stanley Black & Decker, Inc. | 2,031 | 285,823 | ||
| Wartsila Oyj | 3,849 | 227,500 | ||
| 2,836,244 | ||||
| Marine 0.2% | ||||
| Kuehne + Nagel International AG (Registered) | 1,828 | 305,016 | ||
| Professional Services 0.5% | ||||
| Adecco Group AG (Registered) | 3,881 | 295,051 | ||
| Nielsen Holdings PLC | 7,029 | 271,741 | ||
| SGS SA (Registered) | 129 | 312,377 | ||
| 879,169 | ||||
| Road & Rail 0.2% | ||||
| Union Pacific Corp. | 2,627 | 286,106 | ||
| Trading Companies & Distributors 1.0% | ||||
| Fastenal Co. | 6,200 | 269,886 | ||
| ITOCHU Corp. | 15,939 | 236,517 | ||
| Marubeni Corp. | 45,949 | 296,508 | ||
| Mitsubishi Corp. | 11,100 | 232,510 | ||
| Mitsui & Co., Ltd. | 19,951 | 284,786 | ||
| Sumitomo Corp. | 20,866 | 271,226 | ||
| W.W. Grainger, Inc. | 1,479 | 267,004 | ||
| 1,858,437 | ||||
| Transportation Infrastructure 0.1% | ||||
| Macquarie Infrastructure Corp. | 3,600 | 282,240 | ||
| Information Technology 11.1% | ||||
| Communications Equipment 0.9% | ||||
| Cisco Systems, Inc. | 9,535 | 298,446 | ||
| Harris Corp. | 2,649 | 288,953 | ||
| Juniper Networks, Inc. | 9,372 | 261,291 | ||
| Motorola Solutions, Inc. | 3,430 | 297,518 | ||
| Nokia Oyj | 83,621 | 511,444 | ||
| 1,657,652 | ||||
| Electronic Equipment, Instruments & Components 0.8% | ||||
| Avnet, Inc. | 7,553 | 293,661 | ||
| Corning, Inc. | 9,821 | 295,121 | ||
| FLIR Systems, Inc. | 7,700 | 266,882 | ||
| Kyocera Corp. | 4,900 | 283,435 | ||
| TE Connectivity Ltd. | 3,754 | 295,365 | ||
| 1,434,464 | ||||
| Internet Software & Services 2.0% | ||||
| Alibaba Group Holding Ltd. (ADR)* | 2,900 | 408,610 | ||
| Alphabet, Inc. "A"* | 400 | 371,872 | ||
| Alphabet, Inc. "C"* | 500 | 454,365 | ||
| Baidu, Inc. (ADR)* | 1,600 | 286,176 | ||
| eBay, Inc.* | 10,460 | 365,263 | ||
| Facebook, Inc. "A"* | 2,900 | 437,842 | ||
| NetEase, Inc. (ADR) | 1,000 | 300,630 | ||
| Tencent Holdings Ltd. (ADR) | 14,300 | 514,228 | ||
| VeriSign, Inc.* | 3,200 | 297,472 | ||
| Yahoo Japan Corp. | 67,100 | 291,726 | ||
| 3,728,184 | ||||
Shares | Value ($) | |||
| IT Services 2.2% | ||||
| Accenture PLC "A" | 2,486 | 307,468 | ||
| Automatic Data Processing, Inc. | 2,986 | 305,946 | ||
| Broadridge Financial Solutions, Inc. | 4,200 | 317,352 | ||
| DXC Technology Co. | 3,627 | 278,263 | ||
| Fidelity National Information Services, Inc. | 3,401 | 290,445 | ||
| Fiserv, Inc.* | 2,396 | 293,127 | ||
| Infosys Ltd. (ADR) | 31,400 | 471,628 | ||
| International Business Machines Corp. | 2,623 | 403,496 | ||
| Mastercard, Inc. "A" | 2,500 | 303,625 | ||
| Paychex, Inc. | 4,923 | 280,316 | ||
| PayPal Holdings, Inc.* | 5,800 | 311,286 | ||
| Visa, Inc. "A" | 2,365 | 221,790 | ||
| Western Union Co. | 14,609 | 278,301 | ||
| 4,063,043 | ||||
| Semiconductors & Semiconductor Equipment 2.1% | ||||
| Analog Devices, Inc. | 3,769 | 293,228 | ||
| Applied Materials, Inc. | 6,900 | 285,039 | ||
| Broadcom Ltd. | 1,251 | 291,546 | ||
| Intel Corp. | 11,960 | 403,530 | ||
| KLA-Tencor Corp. | 2,821 | 258,150 | ||
| Lam Research Corp. | 1,959 | 277,061 | ||
| Maxim Integrated Products, Inc. | 6,254 | 280,805 | ||
| Microchip Technology, Inc. | 3,738 | 288,499 | ||
| NVIDIA Corp. | 1,500 | 216,840 | ||
| QUALCOMM, Inc. | 5,415 | 299,016 | ||
| Texas Instruments, Inc. | 3,621 | 278,563 | ||
| Tokyo Electron Ltd. | 2,100 | 283,050 | ||
| Xilinx, Inc. | 4,400 | 283,008 | ||
| 3,738,335 | ||||
| Software 1.8% | ||||
| Activision Blizzard, Inc. | 5,283 | 304,142 | ||
| Adobe Systems, Inc.* | 2,100 | 297,024 | ||
| CA, Inc. | 8,785 | 302,819 | ||
| Dell Technologies, Inc. "V"* | 4,229 | 258,434 | ||
| Electronic Arts, Inc.* | 2,026 | 214,189 | ||
| Intuit, Inc. | 2,300 | 305,463 | ||
| Microsoft Corp. | 6,174 | 425,574 | ||
| Oracle Corp. | 7,701 | 386,128 | ||
| salesforce.com, Inc.* | 2,500 | 216,500 | ||
| SAP SE | 2,774 | 289,743 | ||
| VMware, Inc. "A"* (a) | 3,024 | 264,389 | ||
| 3,264,405 | ||||
| Technology Hardware, Storage & Peripherals 1.3% | ||||
| Apple, Inc. | 2,883 | 415,210 | ||
| Canon, Inc. | 8,474 | 287,502 | ||
| FUJIFILM Holdings Corp. | 7,500 | 269,393 | ||
| Hewlett Packard Enterprise Co. | 15,100 | 250,509 | ||
| HP, Inc. | 14,754 | 257,900 | ||
| Samsung Electronics Co., Ltd. (GDR) | 358 | 370,530 | ||
| Seagate Technology PLC | 6,700 | 259,625 | ||
| Xerox Corp. | 10,043 | 288,535 | ||
| 2,399,204 | ||||
| Materials 1.9% | ||||
| Chemicals 1.4% | ||||
| Air Products & Chemicals, Inc. | 2,000 | 286,120 | ||
| BASF SE | 2,928 | 271,182 | ||
| Dow Chemical Co. | 4,596 | 289,870 | ||
| E.I. du Pont de Nemours & Co. | 3,576 | 288,619 | ||
| GEO Specialty Chemicals, Inc.* | 19,324 | 7,322 | ||
Shares | Value ($) | |||
| Givaudan SA (Registered) | 145 | 290,030 | ||
| LyondellBasell Industries NV "A" | 3,554 | 299,922 | ||
| Monsanto Co. | 2,000 | 236,720 | ||
| Praxair, Inc. | 2,207 | 292,538 | ||
| Syngenta AG (Registered) | 611 | 282,912 | ||
| 2,545,235 | ||||
| Containers & Packaging 0.1% | ||||
| International Paper Co. | 5,355 | 303,146 | ||
| Metals & Mining 0.2% | ||||
| POSCO (ADR) | 4,900 | 306,691 | ||
| Paper & Forest Products 0.2% | ||||
| UPM-Kymmene Oyj | 10,701 | 305,065 | ||
| Real Estate 1.2% | ||||
| Equity Real Estate Investment Trusts (REITs) 1.1% | ||||
| AvalonBay Communities, Inc. | 1,439 | 276,533 | ||
| Crown Castle International Corp. | 2,978 | 298,336 | ||
| Prologis, Inc. | 5,200 | 304,928 | ||
| Public Storage | 1,400 | 291,942 | ||
| Realty Income Corp. | 5,125 | 282,797 | ||
| Ventas, Inc. | 4,500 | 312,660 | ||
| Welltower, Inc. | 3,200 | 239,520 | ||
| 2,006,716 | ||||
| Real Estate Management & Development 0.1% | ||||
| Immofinanz AG* | 404 | 923 | ||
| Swiss Prime Site AG (Registered)* | 3,242 | 294,481 | ||
| 295,404 | ||||
| Telecommunication Services 4.9% | ||||
| Diversified Telecommunication Services 3.5% | ||||
| AT&T, Inc. | 12,573 | 474,379 | ||
| BCE, Inc. | 6,804 | 306,411 | ||
| Bezeq Israeli Telecommunication Corp., Ltd. | 134,131 | 222,854 | ||
| BT Group PLC | 71,996 | 276,391 | ||
| Deutsche Telekom AG (Registered) | 15,545 | 279,104 | ||
| Elisa Oyj | 7,900 | 306,150 | ||
| HKT Trust & HKT Ltd. "SS", (Units) | 232,683 | 305,776 | ||
| Nippon Telegraph & Telephone Corp. | 6,500 | 306,868 | ||
| Orange SA | 17,370 | 275,566 | ||
| Proximus SA | 8,747 | 306,005 | ||
| PT Telekomunikasi Indonesia Tbk (ADR) | 9,200 | 309,764 | ||
| Singapore Telecommunications Ltd. | 111,045 | 313,757 | ||
| Spark New Zealand Ltd. | 111,289 | 308,269 | ||
| Swisscom AG (Registered) | 684 | 330,052 | ||
| Telefonica Deutschland Holding AG | 46,957 | 234,532 | ||
| Telefonica SA (a) | 24,959 | 257,645 | ||
| Telenor ASA | 17,919 | 297,264 | ||
| Telia Co. AB | 67,061 | 308,770 | ||
| Telstra Corp., Ltd. | 89,735 | 296,572 | ||
| TELUS Corp. | 8,532 | 294,554 | ||
| Verizon Communications, Inc. | 10,071 | 449,771 | ||
| 6,460,454 | ||||
| Wireless Telecommunication Services 1.4% | ||||
| America Movil SAB de CV "L", (ADR) | 18,600 | 296,112 | ||
| China Mobile Ltd. (ADR) | 8,300 | 440,647 | ||
| KDDI Corp. | 11,000 | 290,954 | ||
| NTT DoCoMo, Inc. | 11,869 | 279,854 | ||
| Rogers Communications, Inc. "B" | 6,207 | 293,167 | ||
| T-Mobile U.S., Inc.* | 4,300 | 260,666 | ||
Shares | Value ($) | |||
| Tele2 AB "B" | 26,979 | 282,449 | ||
| Vodafone Group PLC | 127,480 | 361,544 | ||
| 2,505,393 | ||||
| Utilities 4.0% | ||||
| Electric Utilities 2.5% | ||||
| American Electric Power Co., Inc. | 4,254 | 295,526 | ||
| Duke Energy Corp. | 3,395 | 283,788 | ||
| Edison International | 3,579 | 279,842 | ||
| Endesa SA | 11,482 | 264,513 | ||
| Entergy Corp. | 3,691 | 283,358 | ||
| Eversource Energy | 4,823 | 292,804 | ||
| Exelon Corp. | 8,300 | 299,381 | ||
| FirstEnergy Corp. | 9,800 | 285,768 | ||
| Fortum Oyj | 14,113 | 221,316 | ||
| Korea Electric Power Corp. (ADR) | 21,900 | 393,543 | ||
| NextEra Energy, Inc. | 2,100 | 294,273 | ||
| PG&E Corp. | 4,225 | 280,413 | ||
| PPL Corp. | 7,346 | 283,996 | ||
| Southern Co. | 5,679 | 271,911 | ||
| SSE PLC | 15,235 | 288,316 | ||
| Xcel Energy, Inc. | 6,325 | 290,191 | ||
| 4,608,939 | ||||
| Multi-Utilities 1.5% | ||||
| Ameren Corp. | 5,201 | 284,339 | ||
| CenterPoint Energy, Inc. | 10,289 | 281,713 | ||
| Consolidated Edison, Inc. | 3,582 | 289,497 | ||
| Dominion Energy, Inc. | 3,640 | 278,933 | ||
| DTE Energy Co. | 2,727 | 288,489 | ||
| National Grid PLC | 19,674 | 243,893 | ||
| Public Service Enterprise Group, Inc. | 6,584 | 283,178 | ||
| SCANA Corp. | 4,330 | 290,153 | ||
| Sempra Energy | 2,500 | 281,875 | ||
| WEC Energy Group, Inc. | 4,671 | 286,706 | ||
| 2,808,776 | ||||
| Total Common Stocks (Cost $100,310,538) | 114,793,282 | |||
| Preferred Stock 0.1% | ||||
| Consumer Discretionary | ||||
| Bayerische Motoren Werke (BMW) AG (Cost $231,614) | 2,813 | 231,905 | ||
| Right 0.0% | ||||
| Consumer Staples | ||||
| Safeway Casa Ley, Expiration Date 1/30/2018* (Cost $7,611) | 7,499 | 7,611 | ||
| Warrant 0.0% | ||||
| Materials | ||||
| Hercules Trust II, Expiration Date 3/31/2029* (Cost $30,283) | 170 | 5,636 | ||
| Principal Amount ($)(b) | Value ($) | |||
| Corporate Bonds 10.6% | ||||
| Consumer Discretionary 1.6% | ||||
| Adient Global Holdings Ltd., 144A, 4.875%, 8/15/2026 | 350,000 | 350,875 | ||
| Altice Financing SA, 144A, 7.5%, 5/15/2026 | 400,000 | 444,000 | ||
| Principal Amount ($)(b) | Value ($) | |||
| American Axle & Manufacturing, Inc., 144A, 6.25%, 4/1/2025 (a) | 350,000 | 341,250 | ||
| CCO Holdings LLC, 144A, 5.875%, 5/1/2027 | 500,000 | 534,375 | ||
| Charter Communications Operating LLC: | ||||
| 3.579%, 7/23/2020 | 40,000 | 41,335 | ||
| 4.908%, 7/23/2025 | 30,000 | 32,409 | ||
| Churchill Downs, Inc., 5.375%, 12/15/2021 | 28,000 | 29,050 | ||
| CSC Holdings LLC: | ||||
| 144A, 5.5%, 4/15/2027 | 400,000 | 423,000 | ||
| 144A, 10.125%, 1/15/2023 | 200,000 | 232,000 | ||
| CVS Health Corp., 5.125%, 7/20/2045 | 50,000 | 57,320 | ||
| General Motors Co., 6.6%, 4/1/2036 | 30,000 | 34,759 | ||
| Nordstrom, Inc.: | ||||
| 4.0%, 3/15/2027 | 65,000 | 63,606 | ||
| 5.0%, 1/15/2044 | 100,000 | 95,277 | ||
| Viacom, Inc.: | ||||
| 5.875%, 2/28/2057 | 60,000 | 62,400 | ||
| 6.25%, 2/28/2057 | 65,000 | 67,600 | ||
| Walgreens Boots Alliance, Inc., 4.8%, 11/18/2044 | 40,000 | 42,566 | ||
| 2,851,822 | ||||
| Consumer Staples 0.2% | ||||
| Kraft Heinz Foods Co., 4.375%, 6/1/2046 | 210,000 | 205,660 | ||
| Molson Coors Brewing Co., 4.2%, 7/15/2046 | 40,000 | 39,447 | ||
| Reckitt Benckiser Treasury Services PLC, 144A, 3.0%, 6/26/2027 | 200,000 | 197,355 | ||
| 442,462 | ||||
| Energy 3.5% | ||||
| Canadian Natural Resources Ltd.: | ||||
| 3.85%, 6/1/2027 | 70,000 | 69,433 | ||
| 4.95%, 6/1/2047 | 60,000 | 60,894 | ||
| Continental Resources, Inc., 5.0%, 9/15/2022 | 200,000 | 196,250 | ||
| Empresa Nacional del Petroleo, 144A, 3.75%, 8/5/2026 | 400,000 | 397,880 | ||
| Enbridge, Inc., 5.5%, 12/1/2046 | 60,000 | 67,111 | ||
| Energy Transfer LP, 5.95%, 10/1/2043 | 30,000 | 31,781 | ||
| EnLink Midstream Partners LP, 5.45%, 6/1/2047 | 90,000 | 89,738 | ||
| Halliburton Co., 4.85%, 11/15/2035 | 45,000 | 48,110 | ||
| Hess Corp.: | ||||
| 5.6%, 2/15/2041 | 135,000 | 132,714 | ||
| 5.8%, 4/1/2047 | 75,000 | 75,624 | ||
| Hilcorp Energy I LP, 144A, 5.75%, 10/1/2025 | 200,000 | 188,500 | ||
| KazMunayGas National Co. JSC, 144A, 3.875%, 4/19/2022 | 700,000 | 692,720 | ||
| Kinder Morgan Energy Partners LP, 4.7%, 11/1/2042 | 110,000 | 103,849 | ||
| Lukoil International Finance BV, 144A, 6.656%, 6/7/2022 | 500,000 | 561,150 | ||
| Marathon Oil Corp., 5.2%, 6/1/2045 | 90,000 | 86,289 | ||
| MEG Energy Corp., 144A, 6.5%, 1/15/2025 (a) | 200,000 | 182,000 | ||
| Noble Holding International Ltd.: | ||||
| 5.75%, 3/16/2018 | 10,000 | 10,061 | ||
| 7.75%, 1/15/2024 (a) | 100,000 | 79,125 | ||
| Principal Amount ($)(b) | Value ($) | |||
| Oasis Petroleum, Inc., 6.875%, 3/15/2022 (a) | 100,000 | 97,000 | ||
| Pertamina Persero PT, 144A, 5.25%, 5/23/2021 | 800,000 | 866,166 | ||
| Petroleos Mexicanos, REG S, 3.75%, 2/21/2024 | EUR | 600,000 | 709,407 | |
| Plains All American Pipeline LP: | ||||
| 2.85%, 1/31/2023 | 55,000 | 53,356 | ||
| 4.3%, 1/31/2043 | 95,000 | 81,286 | ||
| 4.5%, 12/15/2026 | 150,000 | 151,702 | ||
| Regency Energy Partners LP, 4.5%, 11/1/2023 | 40,000 | 41,505 | ||
| State Oil Co. of The Azerbaijan Republic, REG S, 4.75%, 3/13/2023 | 700,000 | 672,868 | ||
| Sunoco Logistics Partners Operations LP, 5.3%, 4/1/2044 | 40,000 | 38,995 | ||
| Transcanada Trust, 5.3%, 3/15/2077 | 280,000 | 287,840 | ||
| Weatherford International Ltd., 144A, 9.875%, 2/15/2024 | 100,000 | 104,500 | ||
| WPX Energy, Inc., 6.0%, 1/15/2022 | 200,000 | 198,000 | ||
| 6,375,854 | ||||
| Financials 2.2% | ||||
| Akbank TAS, 144A, 5.0%, 10/24/2022 | 750,000 | 747,660 | ||
| Ares Capital Corp., 3.625%, 1/19/2022 | 60,000 | 60,694 | ||
| Blackstone Holdings Finance Co., LLC, 144A, 5.0%, 6/15/2044 | 20,000 | 21,758 | ||
| BNP Paribas SA, 144A, 4.625%, 3/13/2027 | 310,000 | 326,899 | ||
| Everest Reinsurance Holdings, Inc., 4.868%, 6/1/2044 | 50,000 | 51,468 | ||
| FS Investment Corp., 4.75%, 5/15/2022 | 70,000 | 71,876 | ||
| HSBC Holdings PLC, 4.375%, 11/23/2026 | 200,000 | 207,524 | ||
| KKR Group Finance Co. III LLC, 144A, 5.125%, 6/1/2044 | 30,000 | 31,739 | ||
| Legg Mason, Inc., 5.625%, 1/15/2044 | 50,000 | 53,106 | ||
| Massachusetts Mutual Life Insurance Co., 144A, 4.5%, 4/15/2065 | 10,000 | 10,115 | ||
| Morgan Stanley, 6.25%, 8/9/2026 | 600,000 | 718,279 | ||
| Nationwide Financial Services, Inc., 144A, 5.3%, 11/18/2044 | 40,000 | 45,488 | ||
| Royal Bank of Scotland Group PLC, 3.498%, 5/15/2023 | 200,000 | 201,297 | ||
| Santander Holdings U.S.A., Inc., 144A, 3.7%, 3/28/2022 | 215,000 | 217,779 | ||
| Standard Chartered PLC, 144A, 4.05%, 4/12/2026 | 200,000 | 203,355 | ||
| Swiss Re Treasury U.S. Corp., 144A, 4.25%, 12/6/2042 | 30,000 | 30,846 | ||
| TC Ziraat Bankasi AS, 144A, 5.125%, 5/3/2022 | 200,000 | 200,654 | ||
| The Goldman Sachs Group, Inc., 2.922%**, 10/28/2027 | 750,000 | 779,645 | ||
| Voya Financial, Inc., 4.8%, 6/15/2046 | 45,000 | 46,872 | ||
| 4,027,054 | ||||
| Health Care 0.2% | ||||
| Allergan Funding SCS, 4.75%, 3/15/2045 | 9,000 | 9,715 | ||
| Celgene Corp., 5.0%, 8/15/2045 | 30,000 | 33,780 | ||
| Principal Amount ($)(b) | Value ($) | |||
| Express Scripts Holding Co.: | ||||
| 3.4%, 3/1/2027 | 65,000 | 62,733 | ||
| 4.8%, 7/15/2046 | 50,000 | 50,859 | ||
| Gilead Sciences, Inc., 4.15%, 3/1/2047 | 40,000 | 40,186 | ||
| Mylan NV, 5.25%, 6/15/2046 | 55,000 | 60,164 | ||
| Stryker Corp., 4.625%, 3/15/2046 | 40,000 | 43,700 | ||
| 301,137 | ||||
| Industrials 0.1% | ||||
| FedEx Corp., 4.55%, 4/1/2046 | 30,000 | 31,513 | ||
| Park Aerospace Holdings Ltd., 144A, 5.25%, 8/15/2022 | 175,000 | 182,931 | ||
| 214,444 | ||||
| Information Technology 0.4% | ||||
| Dell International LLC: | ||||
| 144A, 4.42%, 6/15/2021 | 200,000 | 210,844 | ||
| 144A, 8.1%, 7/15/2036 | 30,000 | 37,707 | ||
| DXC Technology Co., 144A, 4.75%, 4/15/2027 | 315,000 | 328,445 | ||
| Seagate HDD Cayman: | ||||
| 144A, 4.25%, 3/1/2022 | 90,000 | 91,483 | ||
| 5.75%, 12/1/2034 | 50,000 | 50,020 | ||
| Xilinx, Inc., 2.95%, 6/1/2024 | 95,000 | 95,256 | ||
| 813,755 | ||||
| Materials 0.8% | ||||
| AK Steel Corp., 7.0%, 3/15/2027 (a) | 200,000 | 206,500 | ||
| CF Industries, Inc.: | ||||
| 144A, 3.4%, 12/1/2021 | 180,000 | 181,987 | ||
| 144A, 4.5%, 12/1/2026 | 20,000 | 20,563 | ||
| Chemours Co., 6.625%, 5/15/2023 | 350,000 | 370,125 | ||
| Constellium NV, 144A, 6.625%, 3/1/2025 | 250,000 | 239,375 | ||
| Evraz Group SA, 144A, 5.375%, 3/20/2023 | 300,000 | 300,900 | ||
| Glencore Funding LLC, 144A, 4.625%, 4/29/2024 | 20,000 | 20,908 | ||
| Potash Corp. of Saskatchewan, Inc., 4.0%, 12/15/2026 | 85,000 | 87,645 | ||
| 1,428,003 | ||||
| Real Estate 0.4% | ||||
| CBL & Associates LP: | ||||
| (REIT), 5.25%, 12/1/2023 (a) | 70,000 | 68,283 | ||
| (REIT), 5.95%, 12/15/2026 (a) | 120,000 | 118,827 | ||
| Hospitality Properties Trust, (REIT), 5.0%, 8/15/2022 | 220,000 | 235,820 | ||
| Host Hotels & Resorts LP, (REIT), 3.875%, 4/1/2024 | 100,000 | 101,721 | ||
| Omega Healthcare Investors, Inc.: | ||||
| (REIT), 4.75%, 1/15/2028 | 110,000 | 109,813 | ||
| (REIT), 4.95%, 4/1/2024 | 60,000 | 62,843 | ||
| Select Income REIT: | ||||
| (REIT), 4.15%, 2/1/2022 | 60,000 | 60,487 | ||
| (REIT), 4.25%, 5/15/2024 | 45,000 | 44,598 | ||
| 802,392 | ||||
| Telecommunication Services 0.4% | ||||
| AT&T, Inc.: | ||||
| 3.4%, 5/15/2025 | 150,000 | 147,463 | ||
| 4.5%, 5/15/2035 | 105,000 | 103,298 | ||
| Sprint Spectrum Co., LLC, 144A, 3.36%, 3/20/2023 | 200,000 | 201,750 | ||
| Telefonica Emisiones SAU, 5.213%, 3/8/2047 | 150,000 | 161,960 | ||
| Principal Amount ($)(b) | Value ($) | |||
| Verizon Communications, Inc., 4.272%, 1/15/2036 | 75,000 | 72,387 | ||
| 686,858 | ||||
| Utilities 0.8% | ||||
| Electricite de France SA, 144A, 4.75%, 10/13/2035 | 95,000 | 101,471 | ||
| Eskom Holdings SOC Ltd., 144A, 6.75%, 8/6/2023 | 700,000 | 713,790 | ||
| Great Plains Energy, Inc., 4.85%, 4/1/2047 | 65,000 | 66,884 | ||
| NRG Energy, Inc., 6.25%, 7/15/2022 | 500,000 | 513,125 | ||
| Southern Power Co., Series F, 4.95%, 12/15/2046 | 29,000 | 29,947 | ||
| 1,425,217 | ||||
| Total Corporate Bonds (Cost $19,154,214) | 19,368,998 | |||
| Asset-Backed 0.6% | ||||
| Miscellaneous | ||||
| Dell Equipment Finance Trust: | ||||
| "C", Series 2017-1, 144A, 2.95%, 4/22/2022 | 130,000 | 130,107 | ||
| "D", Series 2017-1, 144A, 3.44%, 4/24/2023 | 280,000 | 280,200 | ||
| Domino's Pizza Master Issuer LLC, "A23", Series 2017-1A, 144A, 4.118%, 7/25/2047 (c) | 340,000 | 339,787 | ||
| Hilton Grand Vacations Trust, "B", Series 2014-AA, 144A, 2.07%, 11/25/2026 | 192,947 | 190,694 | ||
| PennyMac LLC, "A1", Series 2015-NPL1, 144A, 4.0%, 3/25/2055 | 149,597 | 150,289 | ||
| Total Asset-Backed (Cost $1,092,344) | 1,091,077 | |||
| Mortgage-Backed Securities Pass-Throughs 0.0% | ||||
| Federal Home Loan Mortgage Corp., 6.0%, 3/1/2038 | 4,119 | 4,628 | ||
| Federal National Mortgage Association: | ||||
| 4.5%, 9/1/2035 | 13,927 | 14,992 | ||
| 6.0%, 1/1/2024 | 15,119 | 16,998 | ||
| Total Mortgage-Backed Securities Pass-Throughs (Cost $32,855) | 36,618 | |||
| Commercial Mortgage-Backed Securities 1.0% | ||||
| Credit Suisse First Boston Mortgage Securities Corp., "G", Series 2005-C6, 144A, 5.115%**, 12/15/2040 | 157,444 | 158,010 | ||
| CSAIL Commercial Mortgage Trust, "A4", Series 2015-C4, 3.808%, 11/15/2048 | 300,000 | 313,532 | ||
| FHLMC Multifamily Structured Pass-Through Certificates, "X1", Series K043, Interest Only, 0.675%***, 12/25/2024 | 4,966,172 | 172,933 | ||
| GMAC Commercial Mortgage Securities, Inc., "G", Series 2004-C1, 144A, 5.455%, 3/10/2038 | 502,641 | 494,055 | ||
| Principal Amount ($)(b) | Value ($) | |||
| JPMBB Commercial Mortgage Securities Trust: | ||||
| "A4", Series 2015-C28, 3.227%, 10/15/2048 | 450,000 | 454,867 | ||
| "A3", Series 2014-C19, 3.669%, 4/15/2047 | 125,000 | 129,912 | ||
| Total Commercial Mortgage-Backed Securities (Cost $1,726,690) | 1,723,309 | |||
| Collateralized Mortgage Obligations 1.6% | ||||
| Fannie Mae Connecticut Avenue Securities, "1M1", Series 2016-C02, 3.174%**, 9/25/2028 | 436,871 | 443,119 | ||
| Federal Home Loan Mortgage Corp.: | ||||
| "HI", Series 3979, Interest Only, 3.0%, 12/15/2026 | 303,995 | 24,849 | ||
| "IK", Series 4048, Interest Only, 3.0%, 5/15/2027 | 423,325 | 40,604 | ||
| "H", Series 4865, 4.0%, 8/15/2044 | 990,889 | 1,051,272 | ||
| "LI", Series 3720, Interest Only, 4.5%, 9/15/2025 | 592,306 | 65,089 | ||
| "PI", Series 3843, Interest Only, 4.5%, 5/15/2038 | 277,663 | 23,298 | ||
| "C31", Series 303, Interest Only, 4.5%, 12/15/2042 | 1,344,558 | 264,761 | ||
| "H", Series 2278, 6.5%, 1/15/2031 | 124 | 128 | ||
| Federal National Mortgage Association: | ||||
| "WO", Series 2013-27, Principal Only, Zero Coupon, 12/25/2042 | 220,000 | 142,545 | ||
| "4", Series 406, Interest Only, 4.0%, 9/25/2040 | 116,348 | 22,619 | ||
| "I", Series 2003-84, Interest Only, 6.0%, 9/25/2033 | 126,660 | 22,309 | ||
| Government National Mortgage Association: | ||||
| "QI", Series 2011-112, Interest Only, 4.0%, 5/16/2026 | 222,236 | 22,275 | ||
| "PI", Series 2015-40, Interest Only, 4.0%, 4/20/2044 | 313,544 | 41,262 | ||
| "NI", Series 2011-80, Interest Only, 4.5%, 5/16/2038 | 68,680 | 332 | ||
| "BI", Series 2010-30, Interest Only, 4.5%, 7/20/2039 | 45,908 | 5,112 | ||
| "ND", Series 2010-130, 4.5%, 8/16/2039 | 600,000 | 632,441 | ||
| "PI", Series 2014-108, Interest Only, 4.5%, 12/20/2039 | 80,345 | 13,531 | ||
| "IP", Series 2014-11, Interest Only, 4.5%, 1/20/2043 | 217,750 | 33,633 | ||
| "IQ", Series 2011-18, Interest Only, 5.5%, 1/16/2039 | 97,719 | 9,633 | ||
| "IN", Series 2009-69, Interest Only, 5.5%, 8/20/2039 | 237,399 | 43,063 | ||
| "IV", Series 2009-69, Interest Only, 5.5%, 8/20/2039 | 229,700 | 38,734 | ||
| "IJ", Series 2009-75, Interest Only, 6.0%, 8/16/2039 | 177,741 | 30,606 | ||
| Total Collateralized Mortgage Obligations (Cost $2,771,705) | 2,971,215 | |||
| Principal Amount ($)(b) | Value ($) | |||
| Government & Agency Obligations 11.6% | ||||
| Other Government Related (d) 0.8% | ||||
| Sberbank of Russia, 144A, 5.125%, 10/29/2022 | 700,000 | 721,000 | ||
| Vnesheconombank, 144A, 6.025%, 7/5/2022 | 700,000 | 749,987 | ||
| 1,470,987 | ||||
| Sovereign Bonds 3.8% | ||||
| Export Credit Bank of Turkey, 144A, 5.375%, 10/24/2023 | 700,000 | 707,000 | ||
| Export-Import Bank of India, 144A, 3.375%, 8/5/2026 | 1,000,000 | 978,968 | ||
| Government of Indonesia, Series FR56, 8.375%, 9/15/2026 | IDR | 21,340,000,000 | 1,766,124 | |
| Mexican Udibonos Inflation-Linked Bond, Series S, 2.0%, 6/9/2022 | MXN | 8,648,976 | 452,713 | |
| Republic of Angola, 144A, 9.5%, 11/12/2025 | 450,000 | 473,805 | ||
| Republic of Hungary, Series 19/A, 6.5%, 6/24/2019 | HUF | 16,900,000 | 70,203 | |
| Republic of Namibia: | ||||
| 144A, 5.25%, 10/29/2025 | 250,000 | 257,238 | ||
| 144A, 5.5%, 11/3/2021 | 600,000 | 645,702 | ||
| Republic of Portugal, 144A, 5.125%, 10/15/2024 | 400,000 | 408,000 | ||
| Republic of Senegal, 144A, 6.25%, 7/30/2024 | 500,000 | 526,620 | ||
| United Mexican States, Series M, 5.75%, 3/5/2026 | MXN | 13,525,200 | 695,713 | |
| 6,982,086 | ||||
| U.S. Treasury Obligations 7.0% | ||||
| U.S. Treasury Bill: | ||||
| 0.59%****, 8/10/2017 (e) | 1,620,000 | 1,618,510 | ||
| 0.87%****, 8/10/2017 (e) | 87,000 | 86,920 | ||
| U.S. Treasury Bonds: | ||||
| 3.0%, 5/15/2047 | 200,000 | 206,406 | ||
| 3.625%, 2/15/2044 | 85,000 | 97,946 | ||
| 5.375%, 2/15/2031 | 571,000 | 767,415 | ||
| U.S. Treasury Notes: | ||||
| 0.75%, 10/31/2017 (f) | 3,056,000 | 3,052,516 | ||
| 0.75%, 4/30/2018 | 6,000,000 | 5,973,750 | ||
| 2.375%, 5/15/2027 | 900,000 | 905,694 | ||
| 12,709,157 | ||||
| Total Government & Agency Obligations (Cost $20,870,980) | 21,162,230 | |||
| Principal Amount ($)(b) | Value ($) | |||
| Municipal Bonds and Notes 0.0% | ||||
| Kentucky, Asset/Liability Commission, General Fund Revenue, 3.165%, 4/1/2018 (Cost $64,810) | 64,810 | 65,344 | ||
| Convertible Bond 0.1% | ||||
| Materials | ||||
| GEO Specialty Chemicals, Inc., 144A, 7.5%, 10/30/2018 (PIK) (Cost $232,575) | 234,338 | 231,288 | ||
Shares | Value ($) | ||
| Exchange-Traded Funds 9.3% | |||
| iShares iBoxx $ High Yield Corporate Bond ETF (a) | 40,000 | 3,535,600 | |
| SPDR Bloomberg Barclays High Yield Bond ETF (a) | 235,800 | 8,771,760 | |
| VanEck Vectors JPMorgan EM Local Currency Bond ETF | 253,324 | 4,785,290 | |
| Total Exchange-Traded Funds (Cost $15,975,873) | 17,092,650 | ||
| Closed-End Investment Company 0.2% | |||
| Altaba, Inc.* (Cost $254,810) | 5,800 | 315,984 | |
| Securities Lending Collateral 8.0% | |||
| Deutsche Government & Agency Securities Portfolio "Deutsche Government Cash Institutional Shares", 0.87% (g) (h) (Cost $14,709,220) | 14,709,220 | 14,709,220 | |
| Cash Equivalents 2.5% | |||
| Deutsche Central Cash Management Government Fund, 1.03% (g) (Cost $4,512,312) | 4,512,312 | 4,512,312 | |
| % of Net Assets | Value ($) | |
| Total Investment Portfolio (Cost $181,978,434)† | 108.2 | 198,318,679 |
| Other Assets and Liabilities, Net | (8.2) | (14,945,364) |
| Net Assets | 100.0 | 183,373,315 |
* Non-income producing security.
** Floating rate securities' yields vary with a designated market index or market rate, such as the coupon-equivalent of the U.S. Treasury Bill rate. These securities are shown at their current rate as of June 30, 2017.
*** These securities are shown at their current rate as of June 30, 2017.
**** Annualized yield at time of purchase; not a coupon rate.
† The cost for federal income tax purposes was $182,462,229. At June 30, 2017, net unrealized appreciation for all securities based on tax cost was $15,856,450. This consisted of aggregate gross unrealized appreciation for all securities in which there was an excess of value over tax cost of $18,796,817 and aggregate gross unrealized depreciation for all securities in which there was an excess of tax cost over value of $2,940,367.
(a) All or a portion of these securities were on loan. In addition, "Other Assets and Liabilities, Net" may include pending sales that are also on loan. The value of securities loaned at June 30, 2017 amounted to $14,365,471, which is 7.8% of net assets.
(b) Principal amount stated in U.S. dollars unless otherwise noted.
(c) When-issued security
(d) Government-backed debt issued by financial companies or government sponsored enterprises.
(e) At June 30, 2017, this security has been pledged, in whole or in part, to cover initial margin requirements for open futures contracts.
(f) At June 30, 2017, this security has been pledged, in whole or in part, to cover initial margin requirements for open centrally cleared swap contracts.
(g) Affiliated fund managed by Deutsche Investment Management Americas Inc. The rate shown is the annualized seven-day yield at period end.
(h) Represents collateral held in connection with securities lending. Income earned by the Fund is net of borrower rebates.
144A: Security exempt from registration under Rule 144A of the Securities Act of 1933. These securities may be resold in transactions exempt from registration, normally to qualified institutional buyers.
ADR: American Depositary Receipt
EM: Emerging Markets
GDR: Global Depositary Receipt
Interest Only: Interest Only (IO) bonds represent the "interest only" portion of payments on a pool of underlying mortgages or mortgage-backed securities. IO securities are subject to prepayment risk of the pool of underlying mortgages.
JSC: Joint Stock Company
PIK: Denotes that all or a portion of the income is paid in-kind in the form of additional principal.
Principal Only: Principal Only (PO) bonds represent the "principal only" portion of payments on a pool of underlying mortgages or mortgage-backed securities.
REG S: Securities sold under Regulation S may not be offered, sold or delivered within the United States or to, or for the account or benefit of, U.S. persons, except pursuant to an exemption from, or in a transaction not subject to, the registration requirements of the Securities Act of 1933.
REIT: Real Estate Investment Trust
RSP: Risparmio (Convertible Savings Shares)
SPDR: Standard & Poor's Depositary Receipt
At June 30, 2017, open futures contracts purchased were as follows:
| Futures | Currency | Expiration Date | Contracts | Notional Value ($) | Unrealized Appreciation/ (Depreciation) ($) |
| 10 Year Australian Treasury Bond | AUD | 9/15/2017 | 26 | 2,583,075 | (34,943) |
| 10 Year U.S. Treasury Note | USD | 9/20/2017 | 37 | 4,644,656 | (11,138) |
| 3 Month Euro Euribor Interest Rate Futures | EUR | 3/19/2018 | 10 | 2,862,513 | 412 |
| 3 Month Euro Swiss Franc (Euroswiss) Interest Rate Futures | CHF | 3/19/2018 | 11 | 2,886,797 | (4,606) |
| 3 Month Euroyen Futures | JPY | 3/19/2018 | 12 | 2,666,326 | 898 |
| 90 Day Eurodollar | USD | 3/19/2018 | 11 | 2,707,100 | 5,047 |
| 90 Day Sterling Interest Rate Futures | GBP | 3/21/2018 | 17 | 2,751,653 | (3,346) |
| ASX 90 Day Bank Accepted Bills | AUD | 3/8/2018 | 15 | 11,476,928 | 3,368 |
| Euro Stoxx 50 Index | EUR | 9/15/2017 | 136 | 5,329,453 | (220,461) |
| Euro Stoxx Mid Index | EUR | 9/15/2017 | 170 | 4,118,249 | (138,964) |
| Mini MSCI Emerging Market Index | USD | 9/15/2017 | 115 | 5,797,725 | (53,183) |
| U.S. Treasury Long Bond | USD | 9/20/2017 | 19 | 2,920,063 | 4,078 |
| Ultra 10 Year U.S. Treasury Note | USD | 9/20/2017 | 30 | 4,044,375 | (25,571) |
| Ultra Long U.S. Treasury Bond | USD | 9/20/2017 | 14 | 2,322,250 | 20,689 |
| Total net unrealized depreciation | (457,720) | ||||
At June 30, 2017, open futures contracts sold were as follows:
| Futures | Currency | Expiration Date | Contracts | Notional Value ($) | Unrealized Appreciation ($) |
| 2 Year U.S. Treasury Note | USD | 9/29/2017 | 75 | 16,208,203 | 5,712 |
| 5 Year U.S. Treasury Note | USD | 9/29/2017 | 76 | 8,955,531 | 11,734 |
| S&P 500 E-Mini Index | USD | 9/15/2017 | 79 | 9,562,555 | 35,339 |
| Total unrealized appreciation | 52,785 | ||||
At June 30, 2017, open credit default swap contracts sold were as follows:
| Centrally Cleared Swaps | |||||
| Expiration Date | Notional Amount ($) (i) | Fixed Cash Flows Received | Underlying Reference Obligation | Value ($) | Unrealized Appreciation ($) |
| 6/20/2022 | 5,430,000 | 5.0% | Markit CDX North America High Yield Index | 384,595 | 0 |
(i) The maximum potential amount of future undiscounted payments that the Fund could be required to make under a credit default swap contract would be the notional amount of the contract. These potential amounts would be partially offset by any recovery values of the referenced debt obligation or net amounts received from the settlement of buy protection credit default swap contracts entered into by the Fund for the same referenced debt obligation, if any.
At June 30, 2017, open interest rate swap contracts were as follows:
| Centrally Cleared Swaps | |||||
| Effective/ Expiration Dates | Notional Amount ($) | Cash Flows Paid by the Fund | Cash Flows Received by the Fund | Value ($) | Unrealized Appreciation/ (Depreciation) ($) |
| 9/20/2017 9/20/2047 | 2,800,000 | Fixed — 2.5% | Floating — 3-Month LIBOR | 45,067 | (29,041) |
| 9/20/2017 9/20/2027 | 12,600,000 | Fixed — 2.5% | Floating — 3-Month LIBOR | (231,250) | (106,088) |
| 9/20/2017 9/20/2022 | 11,800,000 | Floating — 3-Month LIBOR | Fixed — 2.0% | 3,672 | 45,836 |
| 9/20/2017 9/20/2018 | 1,900,000 | Fixed — 1.5% | Floating — 3-Month LIBOR | 489 | (805) |
| 9/20/2017 9/20/2037 | 200,000 | Fixed — 2.5% | Floating — 3-Month LIBOR | 1,343 | (1,821) |
| Total net unrealized depreciation | (91,919) | ||||
LIBOR: London Interbank Offered Rate; 3-Month LIBOR rate at June 30, 2017 is 1.30%.
As of June 30, 2017, the Fund had the following open forward foreign currency exchange contracts:
| Contracts to Deliver | In Exchange For | Settlement Date | Unrealized Appreciation ($) | Counterparty | |||||
| USD | 4,931,844 | EUR | 4,600,000 | 7/3/2017 | 322,044 | Goldman Sachs & Co. | |||
| USD | 3,569,281 | EUR | 3,269,000 | 7/26/2017 | 168,421 | Toronto-Dominion Bank | |||
| USD | 3,547,698 | GBP | 2,741,000 | 7/26/2017 | 24,702 | Citigroup, Inc. | |||
| USD | 3,716,551 | MXN | 70,190,000 | 7/27/2017 | 137,439 | Citigroup, Inc. | |||
| USD | 4,884,062 | EUR | 4,450,000 | 8/10/2017 | 207,879 | Bank of America | |||
| USD | 4,968,759 | EUR | 4,450,000 | 8/10/2017 | 123,182 | Citigroup, Inc. | |||
| USD | 3,802,925 | AUD | 5,000,000 | 8/21/2017 | 37,794 | Australia & New Zealand Banking Group Ltd. | |||
| JPY | 413,600,000 | USD | 3,730,428 | 8/21/2017 | 45,937 | Credit Agricole | |||
| USD | 9,734,176 | EUR | 8,600,000 | 8/23/2017 | 113,018 | BNP Paribas | |||
| USD | 7,210,703 | GBP | 5,680,000 | 9/6/2017 | 201,308 | Goldman Sachs & Co. | |||
| USD | 1,741,339 | MXN | 32,147,191 | 9/12/2017 | 10,904 | Citigroup, Inc. | |||
| USD | 3,504,124 | GBP | 2,750,000 | 9/21/2017 | 86,169 | Toronto-Dominion Bank | |||
| Total unrealized appreciation | 1,478,797 | ||||||||
| Contracts to Deliver | In Exchange For | Settlement Date | Unrealized Depreciation ($) | Counterparty | |||||
| EUR | 4,600,000 | USD | 4,957,512 | 7/3/2017 | (296,376) | Goldman Sachs & Co. | |||
| MXN | 45,000,000 | USD | 2,398,018 | 7/20/2017 | (75,585) | Toronto-Dominion Bank | |||
| EUR | 600,000 | USD | 654,059 | 7/26/2017 | (31,967) | Citigroup, Inc. | |||
| GBP | 2,741,000 | USD | 3,514,566 | 7/26/2017 | (57,835) | BNP Paribas | |||
| EUR | 3,269,000 | USD | 3,582,517 | 7/26/2017 | (155,185) | JPMorgan Chase Securities, Inc. | |||
| MXN | 70,190,000 | USD | 3,664,499 | 7/27/2017 | (189,490) | Citigroup, Inc. | |||
| USD | 4,907,101 | JPY | 548,000,000 | 8/9/2017 | (27,781) | Citigroup, Inc. | |||
| JPY | 548,000,000 | USD | 4,879,091 | 8/9/2017 | (228) | Toronto-Dominion Bank | |||
| EUR | 8,900,000 | USD | 9,762,188 | 8/10/2017 | (421,694) | Toronto-Dominion Bank | |||
| USD | 4,469,926 | JPY | 496,865,075 | 8/21/2017 | (43,682) | JPMorgan Chase Securities, Inc. | |||
| AUD | 5,000,000 | USD | 3,693,270 | 8/21/2017 | (147,449) | JPMorgan Chase Securities, Inc. | |||
| EUR | 4,300,000 | USD | 4,827,966 | 8/23/2017 | (95,631) | BNP Paribas | |||
| EUR | 4,300,000 | USD | 4,842,931 | 8/23/2017 | (80,666) | Citigroup, Inc. | |||
| GBP | 5,680,000 | USD | 7,337,679 | 9/6/2017 | (74,332) | Citigroup, Inc. | |||
| GBP | 2,750,000 | USD | 3,519,662 | 9/21/2017 | (70,632) | Citigroup, Inc. | |||
| Total unrealized depreciation | (1,768,533) | ||||||||
| Currency Abbreviations |
AUD Australian Dollar CHF Swiss Franc EUR Euro GBP British Pound HUF Hungarian Forint IDR Indonesian Rupiah JPY Japanese Yen MXN Mexican Peso USD United States Dollar |
For information on the Fund's policy and additional disclosures regarding futures contracts, credit default swaps, interest rate swap contracts and forward foreign currency exchange contracts, please refer to Note B in the accompanying Notes to Financial Statements.
Fair Value Measurements
Various inputs are used in determining the value of the Fund's investments. These inputs are summarized in three broad levels. Level 1 includes quoted prices in active markets for identical securities. Level 2 includes other significant observable inputs (including quoted prices for similar securities, interest rates, prepayment speeds and credit risk). Level 3 includes significant unobservable inputs (including the Fund's own assumptions in determining the fair value of investments). The level assigned to the securities valuations may not be an indication of the risk or liquidity associated with investing in those securities.
The following is a summary of the inputs used as of June 30, 2017 in valuing the Fund's investments. For information on the Fund's policy regarding the valuation of investments, please refer to the Security Valuation section of Note A in the accompanying Notes to Financial Statements.
| Assets | Level 1 | Level 2 | Level 3 | Total | |
| Common Stocks | |||||
| Consumer Discretionary | $ 14,132,915 | $ — | $ — | $ 14,132,915 | |
| Consumer Staples | 6,016,482 | — | — | 6,016,482 | |
| Energy | 6,525,239 | — | — | 6,525,239 | |
| Financials | 20,060,025 | — | — | 20,060,025 | |
| Health Care | 12,119,208 | — | — | 12,119,208 | |
| Industrials | 13,508,307 | — | — | 13,508,307 | |
| Information Technology | 20,285,287 | — | — | 20,285,287 | |
| Materials | 3,452,815 | — | 7,322 | 3,460,137 | |
| Real Estate | 2,302,120 | — | — | 2,302,120 | |
| Telecommunication Services | 8,742,993 | 222,854 | — | 8,965,847 | |
| Utilities | 7,417,715 | — | — | 7,417,715 | |
| Preferred Stock | — | 231,905 | — | 231,905 | |
| Right | — | — | 7,611 | 7,611 | |
| Warrant | — | — | 5,636 | 5,636 | |
| Fixed Income Investments (j) | |||||
| Corporate Bonds | — | 19,368,998 | — | 19,368,998 | |
| Asset-Backed | — | 1,091,077 | — | 1,091,077 | |
| Mortgage-Backed Securities Pass-Throughs | — | 36,618 | — | 36,618 | |
| Commercial Mortgage-Backed Securities | — | 1,723,309 | — | 1,723,309 | |
| Collateralized Mortgage Obligations | — | 2,971,215 | — | 2,971,215 | |
| Government & Agency Obligations | — | 21,162,230 | — | 21,162,230 | |
| Municipal Bonds and Notes | — | 65,344 | — | 65,344 | |
| Convertible Bond | — | — | 231,288 | 231,288 | |
| Exchange-Traded Funds | 17,092,650 | — | — | 17,092,650 | |
| Closed-End Investment Company | 315,984 | — | — | 315,984 | |
| Short-Term Investments (j) | 19,221,532 | — | — | 19,221,532 | |
| Derivatives (k) | |||||
| Futures Contracts | 87,277 | — | — | 87,277 | |
| Interest Rate Swap Contracts | — | 45,836 | — | 45,836 | |
| Forward Foreign Currency Exchange Contracts | — | 1,478,797 | — | 1,478,797 | |
| Total | $ 151,280,549 | $ 48,398,183 | $ 251,857 | $ 199,930,589 | |
| Liabilities | Level 1 | Level 2 | Level 3 | Total | |
| Derivatives (k) | |||||
| Futures Contracts | $ (492,212) | $ — | $ — | $ (492,212) | |
| Interest Rate Swap Contracts | — | (137,755) | — | (137,755) | |
| Forward Foreign Currency Exchange Contracts | — | (1,768,533) | — | (1,768,533) | |
| Total | $ (492,212) | $ (1,906,288) | $ — | $ (2,398,500) | |
As a result of the fair valuation model utilized by the Fund, certain international securities transferred from Level 2 to Level 1. During the period ended June 30, 2017, the amount of the transfers between Level 2 and Level 1 was $40,012,612. Transfers between price levels are recognized at the beginning of the reporting year.
(j) See Investment Portfolio for additional detailed categorizations.
(k) Derivatives include unrealized appreciation (depreciation) on open futures contracts, centrally cleared swap contracts and forward foreign currency exchange contracts.
The accompanying notes are an integral part of the financial statements.
Statement of Assets and Liabilities
| as of June 30, 2017 (Unaudited) | |
| Assets | |
Investments: Investments in non-affiliated securities, at value (cost $162,756,902) — including $14,365,471 of securities loaned | $ 179,097,147 |
| Investment in Deutsche Government & Agency Securities Portfolio (cost $14,709,220)* | 14,709,220 |
| Investments in Deutsche Central Cash Management Government Fund (cost $4,512,312) | 4,512,312 |
| Total investments in securities, at value (cost $181,978,434) | 198,318,679 |
| Cash | 52,900 |
| Foreign currency, at value (cost $294,352) | 299,890 |
| Cash held as collateral for forward foreign currency exchange contracts | 123,525 |
| Receivable for investments sold | 272,303 |
| Receivable for Fund shares sold | 182,896 |
| Dividends receivable | 246,521 |
| Interest receivable | 472,761 |
| Net receivable for pending swap contracts | 220,883 |
| Unrealized appreciation on forward foreign currency exchange contracts | 1,478,797 |
| Foreign taxes recoverable | 124,332 |
| Other assets | 1,702 |
| Total assets | 201,795,189 |
| Liabilities | |
| Payable upon return of securities loaned | 14,709,220 |
| Payable for investments purchased | 302,298 |
| Payable for investments purchased — when-issued security | 340,000 |
| Payable for Fund shares redeemed | 518,149 |
| Payable for variation margin on futures contracts | 237,808 |
| Payable for variation margin on centrally cleared swaps | 206,974 |
| Payable upon return of deposit for forward foreign currency contracts | 123,525 |
| Unrealized depreciation on forward foreign currency exchange contracts | 1,768,533 |
| Accrued management fee | 56,369 |
| Accrued Trustees' fees | 2,613 |
| Other accrued expenses and payables | 156,385 |
| Total liabilities | 18,421,874 |
| Net assets, at value | $ 183,373,315 |
| Net Assets Consist of | |
| Undistributed net investment income | 1,222,441 |
Net unrealized appreciation (depreciation) on: Investments | 16,340,245 |
| Swap contracts | (91,919) |
| Futures | (404,935) |
| Foreign currency | (280,952) |
| Accumulated net realized gain (loss) | 2,410,909 |
| Paid-in capital | 164,177,526 |
| Net assets, at value | $ 183,373,315 |
Class A Net Asset Value, offering and redemption price per share ($183,373,315 ÷ 7,486,792 outstanding shares of beneficial interest, no par value, unlimited number of shares authorized) | $ 24.49 |
* Represents collateral on securities loaned.
The accompanying notes are an integral part of the financial statements.
Statement of Operations
| for the six months ended June 30, 2017 (Unaudited) | |
| Investment Income | |
Income: Dividends (net of foreign taxes withheld of $124,922) | $ 2,354,270 |
| Interest (net of foreign taxes withheld of $5,030) | 980,024 |
| Income distributions — Deutsche Central Cash Management Government Fund | 10,189 |
| Securities lending income, net of borrower rebates | 46,077 |
| Total income | 3,390,560 |
Expenses: Management fee | 341,376 |
| Administration fee | 92,264 |
| Services to shareholders | 728 |
| Custodian fee | 28,138 |
| Professional fees | 50,042 |
| Reports to shareholders | 28,231 |
| Trustees' fees and expenses | 8,052 |
| Other | 30,016 |
| Total expenses | 578,847 |
| Net investment income | 2,811,713 |
| Realized and Unrealized Gain (Loss) | |
Net realized gain (loss) from: Investments | 5,822,993 |
| Swap contracts | 1,577,379 |
| Futures | 649,748 |
| Written options | 6,800 |
| Foreign currency | 600,452 |
| 8,657,372 | |
Change in net unrealized appreciation (depreciation) on: Investments | 5,158,972 |
| Swap contracts | (1,537,727) |
| Futures | (189,664) |
| Foreign currency | (1,462,010) |
| 1,969,571 | |
| Net gain (loss) | 10,626,943 |
| Net increase (decrease) in net assets resulting from operations | $ 13,438,656 |
The accompanying notes are an integral part of the financial statements.
Statements of Changes in Net Assets
| Increase (Decrease) in Net Assets | Six Months Ended June 30, 2017 (Unaudited) | Year Ended December 31, 2016 | |
Operations: Net investment income | $ 2,811,713 | $ 5,058,747 | |
| Net realized gain (loss) | 8,657,372 | (200,045) | |
| Change in net unrealized appreciation (depreciation) | 1,969,571 | 7,339,499 | |
| Net increase (decrease) in net assets resulting from operations | 13,438,656 | 12,198,201 | |
Distributions to shareholders from: Net investment income: Class A | (5,628,068) | (7,851,269) | |
Fund share transactions: Class A Proceeds from shares sold | 1,712,866 | 3,626,943 | |
| Shares issued to shareholders in reinvestment of distributions | 5,628,068 | 7,851,269 | |
| Payments for shares redeemed | (16,798,252) | (32,401,979) | |
| Net increase (decrease) in net assets from Class A share transactions | (9,457,318) | (20,923,767) | |
| Increase (decrease) in net assets | (1,646,730) | (16,576,835) | |
| Net assets at beginning of period | 185,020,045 | 201,596,880 | |
| Net assets at end of period (including undistributed net investment income of $1,222,441 and $4,038,796, respectively) | $ 183,373,315 | $ 185,020,045 | |
| Other Information | |||
Class A Shares outstanding at beginning of period | 7,873,905 | 8,792,358 | |
| Shares sold | 70,403 | 157,470 | |
| Shares issued to shareholders in reinvestment of distributions | 233,530 | 348,017 | |
| Shares redeemed | (691,046) | (1,423,940) | |
| Net increase (decrease) in Class A shares | (387,113) | (918,453) | |
| Shares outstanding at end of period | 7,486,792 | 7,873,905 | |
The accompanying notes are an integral part of the financial statements.
Financial Highlights
| Class A | Six Months Ended 6/30/17 (Unaudited) | Years Ended December 31, | |||||
| 2016 | 2015 | 2014 | 2013 | 2012 | |||
| Selected Per Share Data | |||||||
| Net asset value, beginning of period | $ 23.50 | $ 22.93 | $ 24.62 | $ 27.30 | $ 23.90 | $ 21.49 | |
Income (loss) from investment operations: Net investment incomea | .37 | .61 | .68 | .72 | .78 | .57 | |
| Net realized and unrealized gain (loss) | 1.37 | .91 | (.97) | .25 | 3.14 | 2.20 | |
| Total from investment operations | 1.74 | 1.52 | (.29) | .97 | 3.92 | 2.77 | |
Less distributions from: Net investment income | (.75) | (.95) | (.76) | (.85) | (.52) | (.36) | |
| Net realized gains | — | — | (.64) | (2.80) | — | — | |
| Total distributions | (.75) | (.95) | (1.40) | (3.65) | (.52) | (.36) | |
| Net asset value, end of period | $ 24.49 | $ 23.50 | $ 22.93 | $ 24.62 | $ 27.30 | $ 23.90 | |
| Total Return (%) | 7.46** | 6.81 | (1.44)b | 3.83 | 16.63 | 12.98 | |
| Ratios to Average Net Assets and Supplemental Data | |||||||
| Net assets, end of period ($ millions) | 183 | 185 | 202 | 247 | 269 | 260 | |
| Ratio of expenses before expense reductions (%)c | .63* | .62 | .60 | .62 | .60 | .59 | |
| Ratio of expenses after expense reductions (%)c | .63* | .62 | .58 | .62 | .60 | .59 | |
| Ratio of net investment income (loss) (%) | 3.05* | 2.66 | 2.85 | 2.83 | 3.07 | 2.48 | |
| Portfolio turnover rate (%) | 60** | 135 | 92 | 88 | 182 | 188 | |
a Based on average shares outstanding during the period. b Total return would have been lower had certain expenses not been reduced. c Expense ratio does not reflect charges and fees associated with the separate account that invests in the Fund or any variable life insurance policy or variable annuity contract for which the Fund is an investment option. * Annualized ** Not annualized | |||||||
Notes to Financial Statements (Unaudited)
A. Organization and Significant Accounting Policies
Deutsche Global Income Builder VIP (the "Fund") is a diversified series of Deutsche Variable Series II (the "Trust"), which is registered under the Investment Company Act of 1940, as amended (the "1940 Act"), as an open-end management investment company organized as a Massachusetts business trust.
The Fund's financial statements are prepared in accordance with accounting principles generally accepted in the United States of America ("U.S. GAAP") which require the use of management estimates. Actual results could differ from those estimates. The Fund qualifies as an investment company under Topic 946 of Accounting Standards Codification of U.S. GAAP. The policies described below are followed consistently by the Fund in the preparation of its financial statements.
Security Valuation. Investments are stated at value determined as of the close of regular trading on the New York Stock Exchange on each day the exchange is open for trading.
Various inputs are used in determining the value of the Fund's investments. These inputs are summarized in three broad levels. Level 1 includes quoted prices in active markets for identical securities. Level 2 includes other significant observable inputs (including quoted prices for similar securities, interest rates, prepayment speeds and credit risk). Level 3 includes significant unobservable inputs (including the Fund's own assumptions in determining the fair value of investments). The level assigned to the securities valuations may not be an indication of the risk or liquidity associated with investing in those securities.
Equity securities and Exchange-Traded Funds ("ETFs") are valued at the most recent sale price or official closing price reported on the exchange (U.S. or foreign) or over-the-counter market on which they trade. Equity securities or ETFs for which no sales are reported are valued at the calculated mean between the most recent bid and asked quotations on the relevant market or, if a mean cannot be determined, at the most recent bid quotation. Equity securities and ETFs are generally categorized as Level 1. For certain international equity securities, in order to adjust for events which may occur between the close of the foreign exchanges and the close of the New York Stock Exchange, a fair valuation model may be used. This fair valuation model takes into account comparisons to the valuation of American Depository Receipts (ADRs), exchange-traded funds, futures contracts and certain indices and these securities are categorized as Level 2.
Debt securities are valued at prices supplied by independent pricing services approved by the Fund's Board. Such services may use various pricing techniques which take into account appropriate factors such as yield, quality, coupon rate, maturity, type of issue, trading characteristics, prepayment speeds and other data, as well as broker quotes. If the pricing services are unable to provide valuations, debt securities are valued at the average of the most recent reliable bid quotations or evaluated prices, as applicable, obtained from broker-dealers. These securities are generally categorized as Level 2.
Investments in open-end investment companies are valued at their net asset value each business day and are categorized as Level 1.
Futures contracts are generally valued at the settlement prices established each day on the exchange on which they are traded and are categorized as Level 1.
Forward currency contracts are valued at the prevailing forward exchange rate of the underlying currencies and are categorized as Level 2.
Swap contracts are valued daily based upon prices supplied by a Board approved pricing vendor, if available, and otherwise are valued at the price provided by the broker-dealer. Swap contracts are generally categorized as Level 2.
Exchange-traded options are valued at the last sale price or, in the absence of a sale, the mean between the closing bid and asked prices or at the most recent asked price (bid for purchased options) if no bid or asked price are available. Exchange-traded options are categorized as Level 1. Over-the-counter written or purchased options are valued at prices supplied by a Board approved pricing vendor, if available, and otherwise are valued at the price provided by the broker-dealer with which the option was traded. Over-the-counter written or purchased options are generally categorized as Level 2.
Securities and other assets for which market quotations are not readily available or for which the above valuation procedures are deemed not to reflect fair value are valued in a manner that is intended to reflect their fair value as determined in accordance with procedures approved by the Board and are generally categorized as Level 3. In accordance with the Fund's valuation procedures, factors considered in determining value may include, but are not limited to, the type of the security; the size of the holding; the initial cost of the security; the existence of any contractual restrictions on the security's disposition; the price and extent of public trading in similar securities of the issuer or of comparable companies; quotations or evaluated prices from broker-dealers and/or pricing services; information obtained from the issuer, analysts, and/or the appropriate stock exchange (for exchange-traded securities); an analysis of the company's or issuer's financial statements; an evaluation of the forces that influence the issuer and the market(s) in which the security is purchased and sold; and with respect to debt securities, the maturity, coupon, creditworthiness, currency denomination and the movement of the market in which the security is normally traded. The value determined under these procedures may differ from published values for the same securities.
Disclosure about the classification of fair value measurements is included in a table following the Fund's Investment Portfolio.
Foreign Currency Translations. The books and records of the Fund are maintained in U.S. dollars. Investment securities and other assets and liabilities denominated in a foreign currency are translated into U.S. dollars at the prevailing exchange rates at period end. Purchases and sales of investment securities, income and expenses are translated into U.S. dollars at the prevailing exchange rates on the respective dates of the transactions.
Net realized and unrealized gains and losses on foreign currency transactions represent net gains and losses between trade and settlement dates on securities transactions, the acquisition and disposition of foreign currencies, and the difference between the amount of net investment income accrued and the U.S. dollar amount actually received. The portion of both realized and unrealized gains and losses on investments that results from fluctuations in foreign currency exchange rates is not separately disclosed but is included with net realized and unrealized gain/appreciation and loss/depreciation on investments.
Securities Lending. Deutsche Bank AG, as lending agent, lends securities of the Fund to certain financial institutions under the terms of its securities lending agreement. During the term of the loans, the Fund continues to receive interest and dividends generated by the securities and to participate in any changes in their market value. The Fund requires the borrowers of the securities to maintain collateral with the Fund consisting of either cash or liquid, unencumbered assets having a value at least equal to the value of the securities loaned. When the collateral falls below specified amounts, the lending agent will use its best effort to obtain additional collateral on the next business day to meet required amounts under the securities lending agreement. As of period end, any securities on loan were collateralized by cash. During the six months ended June 30, 2017, the Fund invested the cash collateral into a joint trading account in affiliated money market funds managed by Deutsche Investment Management Americas Inc. As of June 30, 2017, the Fund invested the cash collateral in Deutsche Government & Agency Securities Portfolio. Deutsche Investment Management Americas Inc. receives a management/administration fee (0.13% annualized effective rate as of June 30, 2017) on the cash collateral invested in Deutsche Government & Agency Securities Portfolio. The Fund receives compensation for lending its securities either in the form of fees or by earning interest on invested cash collateral net of borrower rebates and fees paid to a lending agent. Either the Fund or the borrower may terminate the loan at any time, and the borrower, after notice, is required to return borrowed securities within a standard time period. There may be risks of delay and costs in recovery of securities or even loss of rights in the collateral should the borrower of the securities fail financially. If the Fund is not able to recover securities lent, the Fund may sell the collateral and purchase a replacement investment in the market, incurring the risk that the value of the replacement security is greater than the value of the collateral. The Fund is also subject to all investment risks associated with the reinvestment of any cash collateral received, including, but not limited to, interest rate, credit and liquidity risk associated with such investments.
As of June 30, 2017, the Fund had securities on loan, which were classified as common stocks, corporate bonds and exchange-traded funds in the Investment Portfolio. The value of the related collateral exceeded the value of the securities loaned at period end.
| Remaining Contractual Maturity of the Agreements as of June 30, 2017 | |||||
| Overnight and Continuous | <30 days | Between 30 & 90 days | >90 days | Total | |
| Securities Lending Transactions | |||||
| Common Stocks | $ 1,145,815 | $ — | $ — | $ — | $ 1,145,815 |
| Corporate Bonds | 1,006,895 | — | — | — | 1,006,895 |
| Exchange-Traded Fund | 12,556,510 | — | — | — | 12,556,510 |
| Total Borrowings | $ 14,709,220 | $ — | $ — | $ — | $ 14,709,220 |
| Gross amount of recognized liabilities for securities lending transactions | $14,709,220 | ||||
When-Issued/Delayed Delivery Securities. The Fund may purchase or sell securities with delivery or payment to occur at a later date beyond the normal settlement period. At the time the Fund enters into a commitment to purchase or sell a security, the transaction is recorded and the value of the transaction is reflected in the net asset value. The price of such security and the date when the security will be delivered and paid for are fixed at the time the transaction is negotiated. The value of the security may vary with market fluctuations. At the time the Fund enters into a purchase transaction it is required to segregate cash or other liquid assets at least equal to the amount of the commitment. Additionally, the Fund may be required to post securities and/or cash collateral in accordance with the terms of the commitment.
Certain risks may arise upon entering into when-issued or delayed delivery transactions from the potential inability of counterparties to meet the terms of their contracts or if the issuer does not issue the securities due to political, economic or other factors. Additionally, losses may arise due to changes in the value of the underlying securities.
Taxes. The Fund's policy is to comply with the requirements of the Internal Revenue Code, as amended, which are applicable to regulated investment companies and to distribute all of its taxable income to its shareholders.
Additionally, the Fund may be subject to taxes imposed by the governments of countries in which it invests and are generally based on income and/or capital gains earned or repatriated, a portion of which may be recoverable based upon the current interpretation of the tax rules and regulations. Estimated tax liabilities and recoveries on certain foreign securities are recorded on an accrual basis and are reflected as components of interest income or net change in unrealized gain/loss on investments. Tax liabilities realized as a result of security sales are reflected as a component of net realized gain/loss on investments.
At December 31, 2016, the Fund had $6,015,000 of tax basis capital loss carryforwards, which may be applied against realized net taxable capital gains indefinitely, including short-term losses ($3,135,000) and long-term losses ($2,880,000).
The Fund has reviewed the tax positions for the open tax years as of December 31, 2016 and has determined that no provision for income tax and/or uncertain tax provisions is required in the Fund's financial statements. The Fund's federal tax returns for the prior three fiscal years remain open subject to examination by the Internal Revenue Service.
Distribution of Income and Gains. Distributions from net investment income of the Fund, if any, are declared and distributed to shareholders annually. Net realized gains from investment transactions, in excess of available capital loss carryforwards, would be taxable to the Fund if not distributed and, therefore, will be distributed to shareholders at least annually. The Fund may also make additional distributions for tax purposes if necessary.
The timing and characterization of certain income and capital gain distributions are determined annually in accordance with federal tax regulations which may differ from accounting principles generally accepted in the United States of America. These differences primarily relate to investments in foreign denominated investments, forward currency contracts, futures contracts, swap contracts and certain securities sold at a loss. As a result, net investment income (loss) and net realized gain (loss) on investment transactions for a reporting period may differ significantly from distributions during such period. Accordingly, the Fund may periodically make reclassifications among certain of its capital accounts without impacting the net asset value of the Fund.
The tax character of current year distributions will be determined at the end of the current fiscal year.
Expenses. Expenses of the Trust arising in connection with a specific fund are allocated to that fund. Other Trust expenses which cannot be directly attributed to a fund are apportioned among the funds in the Trust based upon the relative net assets or other appropriate measures.
Contingencies. In the normal course of business, the Fund may enter into contracts with service providers that contain general indemnification clauses. The Fund's maximum exposure under these arrangements is unknown, as this would involve future claims that may be made against the Fund that have not yet been made. However, based on experience, the Fund expects the risk of loss to be remote.
Other. Investment transactions are accounted for on a trade date plus one basis for daily net asset value calculations. However, for financial reporting purposes, investment transactions are reported on trade date. Interest income is recorded on the accrual basis. Dividend income is recorded on the ex-dividend date net of foreign withholding taxes. Certain dividends from foreign securities may be recorded subsequent to the ex-dividend date as soon as the Fund is informed of such dividends. Realized gains and losses from investment transactions are recorded on an identified cost basis. Proceeds from litigation payments, if any, are included in net realized gain (loss) from investments. All discounts and premiums are accreted/amortized for both tax and financial reporting purposes, with the exception of securities in default of principal.
B. Derivative Instruments
Swaps. A swap is a contract between two parties to exchange future cash flows at periodic intervals based on the notional amount of the swap. A bilateral swap is a transaction between the fund and a counterparty where cash flows are exchanged between the two parties. A centrally cleared swap is a transaction executed between the fund and a counterparty, then cleared by a clearing member through a central clearinghouse. The central clearinghouse serves as the counterparty, with whom the fund exchanges cash flows.
The value of a swap is adjusted daily, and the change in value, if any, is recorded as unrealized appreciation or depreciation in the Statement of Assets and Liabilities. Gains or losses are realized when the swap expires or is closed. Certain risks may arise when entering into swap transactions including counterparty default; liquidity; or unfavorable changes in interest rates or the value of the underlying reference security, commodity or index. In connection with bilateral swaps, securities and/or cash may be identified as collateral in accordance with the terms of the swap agreement to provide assets of value and recourse in the event of default. The maximum counterparty credit risk is the net present value of the cash flows to be received from or paid to the counterparty over the term of the swap, to the extent that this amount is beneficial to the Fund, in addition to any related collateral posted to the counterparty by the Fund. This risk may be partially reduced by a master netting arrangement between the Fund and the counterparty. Upon entering into a centrally cleared swap, the Fund is required to deposit with a financial intermediary cash or securities ("initial margin") in an amount equal to a certain percentage of the notional amount of the swap. Subsequent payments ("variation margin") are made or received by the Fund dependent upon the daily fluctuations in the value of the swap. In a cleared swap transaction, counterparty risk is minimized as the central clearinghouse acts as the counterparty.
An upfront payment, if any, made by the Fund is recorded as an asset in the Statement of Assets and Liabilities. An upfront payment, if any, received by the Fund is recorded as a liability in the Statement of Assets and Liabilities. Payments received or made at the end of the measurement period are recorded as realized gain or loss in the Statement of Operations.
Interest Rate Swaps. Interest rate swaps are agreements in which the Fund agrees to pay to the counterparty a fixed rate payment in exchange for the counterparty agreeing to pay to the Fund a variable rate payment, or the Fund agrees to receive from the counterparty a fixed rate payment in exchange for the counterparty agreeing to receive from the Fund a variable rate payment. The payment obligations are based on the notional amount of the swap. For the six months ended June 30, 2017, the Fund entered into interest rate swap agreements to gain exposure to different parts of the yield curve while managing overall duration.
A summary of the open interest rate swap contracts as of June 30, 2017 is included in a table following the Fund's Investment Portfolio. For the six months ended June 30, 2017, the investment in interest rate swap contracts had a total notional amount generally indicative of a range from $29,300,000 to $31,640,000.
Credit Default Swaps. Credit default swaps are agreements between a buyer and a seller of protection against predefined credit events for the reference entity. The Fund may enter into credit default swaps to gain exposure to an underlying issuer's credit quality characteristics without directly investing in that issuer or to hedge against the risk of a credit event on debt securities. As a seller of a credit default swap, the Fund is required to pay the par (or other agreed-upon) value of the referenced entity to the counterparty with the occurrence of a credit event by a third party, such as a U.S. or foreign corporate issuer, on the reference entity, which would likely result in a loss to the Fund. In return, the Fund receives from the counterparty a periodic stream of payments over the term of the swap provided that no credit event has occurred. If no credit event occurs, the Fund keeps the stream of payments with no payment obligations. The Fund may also buy credit default swaps, in which case the Fund functions as the counterparty referenced above. This involves the risk that the swap may expire worthless. It also involves counterparty risk that the seller may fail to satisfy its payment obligations to the Fund with the occurrence of a credit event. When the Fund sells a credit default swap, it will cover its commitment. This may be achieved by, among other methods, maintaining cash or liquid assets equal to the aggregate notional value of the reference entities for all outstanding credit default swaps sold by the Fund. For the six months ended June 30, 2017, the Fund entered into credit default swap agreements to gain exposure to the underlying issuer's credit quality characteristics or to hedge the risk of default or other specified credit events on portfolio assets.
Under the terms of a credit default swap, the Fund receives or makes periodic payments based on a specified interest rate on a fixed notional amount. These payments are recorded as a realized gain or loss in the Statement of Operations. Payments received or made as a result of a credit event or termination of the swap are recognized, net of a proportional amount of the upfront payment, as realized gains or losses in the Statement of Operations.
A summary of the open credit default swap contracts as of June 30, 2017 is included in a table following the Fund's Investment Portfolio. For the six months ended June 30, 2017, the investment on the credit default swap contracts sold had a total notional value of generally indicative of a range from approximately $376,000 to $7,700,000.
Futures Contracts. A futures contract is an agreement between a buyer or seller and an established futures exchange or its clearinghouse in which the buyer or seller agrees to take or make a delivery of a specific amount of a financial instrument at a specified price on a specific date (settlement date). For the six months ended June 30, 2017, the Fund entered into interest rate futures to gain exposure to different parts of the yield curve while managing overall duration. The Fund also entered into interest rate futures contracts for non-hedging purposes to seek to enhance potential gains and entered into equity index futures as a means of gaining exposure to the equity asset class without investing directly into such asset class.
Upon entering into a futures contract, the Fund is required to deposit with a financial intermediary cash or securities ("initial margin") in an amount equal to a certain percentage of the face value indicated in the futures contract. Subsequent payments ("variation margin") are made or received by the Fund dependent upon the daily fluctuations in the value and are recorded for financial reporting purposes as unrealized gains or losses by the Fund. Gains or losses are realized when the contract expires or is closed. Since all futures contracts are exchange-traded, counterparty risk is minimized as the exchange's clearinghouse acts as the counterparty, and guarantees the futures against default.
Certain risks may arise upon entering into futures contracts, including the risk that an illiquid market will limit the Fund's ability to close out a futures contract prior to the settlement date and the risk that the futures contract is not well correlated with the security, index or currency to which it relates. Risk of loss may exceed amounts disclosed in the Statement of Assets and Liabilities.
A summary of the open futures contracts as of June 30, 2017 is included in a table following the Fund's Investment Portfolio. For the six months ended June 30, 2017, the investment in futures contracts purchased had a total notional value generally indicative of a range from approximately $39,622,000 to $57,111,000, and the investment in futures contracts sold had a total notional value generally indicative of a range from approximately $5,939,000 to $34,726,000.
Options. An option contract is a contract in which the writer (seller) of the option grants the buyer of the option, upon payment of a premium, the right to purchase from (call option), or sell to (put option), the writer a designated instrument at a specified price within a specified period of time. The Fund may write or purchase interest rate swaption agreements which are options to enter into a pre-defined swap agreement. The interest rate swaption agreement will specify whether the buyer of the swaption will be a fixed-rate receiver or a fixed-rate payer upon exercise. Certain options, including options on indices and interest rate options, will require cash settlement by the Fund if exercised. For the six months ended June 30, 2017, the Fund entered into options on equity index futures for non-hedging purposes to seek to enhance potential gains.
If the Fund writes a covered call option, the Fund foregoes, in exchange for the premium, the opportunity to profit during the option period from an increase in the market value of the underlying security above the exercise price. If the Fund writes a put option it accepts the risk of a decline in the value of the underlying security below the exercise price. Over-the-counter options have the risk of the potential inability of counterparties to meet the terms of their contracts. For exchange traded contracts, the counterparty risk is minimized as the exchange's clearinghouse acts as the counterparty, and guarantees the futures against default. The Fund's maximum exposure to purchased options is limited to the premium initially paid. In addition, certain risks may arise upon entering into option contracts including the risk that an illiquid secondary market will limit the Fund's ability to close out an option contract prior to the expiration date and that a change in the value of the option contract may not correlate exactly with changes in the value of the securities or currencies hedged.
There were no open written or purchased option contracts as of June 30, 2017. For the six months ended June 30, 2017, the investment in written option contracts had a total value generally indicative of a range from $0 to $96,000 and purchased option contracts with total values ranging from $0 to $122,000.
Forward Foreign Currency Exchange Contracts. A forward foreign currency exchange contract ("forward currency contract") is a commitment to purchase or sell a foreign currency at the settlement date at a negotiated rate. For the six months ended June 30, 2017, the Fund entered into forward currency contracts in order to hedge its exposure to changes in foreign currency exchange rates on its foreign currency denominated portfolio holdings, to facilitate transactions in foreign currency denominated securities and for non-hedging purposes to seek to enhance potential gains.
Forward currency contracts are valued at the prevailing forward exchange rate of the underlying currencies and unrealized gain (loss) is recorded daily. On the settlement date of the forward currency contract, the Fund records a realized gain or loss equal to the difference between the value of the contract at the time it was opened and the value of the contract at the time it was closed. Certain risks may arise upon entering into forward currency contracts from the potential inability of counterparties to meet the terms of their contracts. The maximum counterparty credit risk to the Fund is measured by the unrealized gain on appreciated contracts. Additionally, when utilizing forward currency contracts to hedge, the Fund gives up the opportunity to profit from favorable exchange rate movements during the term of the contract.
A summary of the open forward currency contracts as of June 30, 2017 is included in a table following the Fund's Investment Portfolio. For the six months ended June 30, 2017, the investment in forward currency contracts short vs. U.S. dollars had a total contract value generally indicative of a range from approximately $53,789,000 to $74,338,000, and the investment in forward currency contracts long vs. U.S. dollars had a total contract value generally indicative of a range from approximately $52,767,000 to $60,988,000.
The following tables summarize the value of the Fund's derivative instruments held as of June 30, 2017 and the related location in the accompanying Statement of Assets and Liabilities, presented by primary underlying risk exposure:
| Asset Derivatives | Forward Contracts | Swap Contracts | Futures Contracts | Total |
| Equity Contracts (a) | $ — | $ — | $ 35,339 | $ 35,339 |
| Interest Rate Contracts (a) | — | 45,836 | 51,938 | 97,774 |
| Credit Contracts (a) | — | 0 | — | 0 |
| Foreign Exchange Contracts (b) | 1,478,797 | — | — | 1,478,797 |
| $ 1,478,797 | $ 45,836 | $ 87,277 | $ 1,611,910 | |
Each of the above derivatives is located in the following Statement of Assets and Liabilities accounts: (a) Includes cumulative appreciation of futures and centrally cleared swap contracts as disclosed in the Investment Portfolio. Unsettled variation margin is disclosed separately within the Statement of Assets and Liabilities. (b) Unrealized appreciation on forward foreign currency exchange contracts | ||||
| Liability Derivatives | Forward Contracts | Swap Contracts | Futures Contracts | Total |
| Equity Contracts (c) | $ — | $ — | $ (412,608) | $ (412,608) |
| Interest Rate Contracts (c) | — | (137,755) | (79,604) | (217,359) |
| Foreign Exchange Contracts (d) | (1,768,533) | — | — | (1,768,533) |
| $ (1,768,533) | $ (137,755) | $ (492,212) | $ (2,398,500) | |
Each of the above derivatives is located in the following Statement of Assets and Liabilities accounts: (c) Includes cumulative depreciation of futures and centrally cleared swap contracts as disclosed in the Investment Portfolio. Unsettled variation margin is disclosed separately within the Statement of Assets and Liabilities. (d) Unrealized depreciation on forward foreign currency exchange contracts | ||||
Additionally, the amount of unrealized and realized gains and losses on derivative instruments recognized in Fund earnings during the six months ended June 30, 2017 and the related location in the accompanying Statement of Operations is summarized in the following tables by primary underlying risk exposure:
| Realized Gain (Loss) | Purchased Options | Written Options | Forward Contracts | Swap Contracts | Futures Contracts | Total |
| Equity Contracts (e) | $ (15,900) | $ 6,800 | $ — | $ — | $ 605,989 | $ 596,889 |
| Interest Rate Contracts (e) | — | — | — | 1,113,685 | 43,759 | 1,157,444 |
| Credit Contracts (e) | — | — | — | 463,694 | — | 463,694 |
| Foreign Exchange Contracts (f) | — | — | 567,281 | — | — | 567,281 |
| $ (15,900) | $ 6,800 | $ 567,281 | $ 1,577,379 | $ 649,748 | $ 2,785,308 | |
Each of the above derivatives is located in the following Statement of Operations accounts: (e) Net realized gain (loss) from investments (includes purchased options), written options, swap contracts and futures, respectively (f) Net realized gain (loss) from foreign currency (Statement of Operations includes both forward currency contracts and foreign currency transactions) | ||||||
| Change in Net Unrealized Appreciation (Depreciation) | Forward Contracts | Swap Contracts | Futures Contracts | Total |
| Equity Contracts (g) | $ — | $ — | $ (357,066) | $ (357,066) |
| Interest Rate Contracts (g) | — | (1,291,361) | 167,402 | (1,123,959) |
| Credit Contracts (g) | — | (246,366) | — | (246,366) |
| Foreign Exchange Contracts (h) | (1,480,244) | — | — | (1,480,244) |
| $ (1,480,244) | $ (1,537,727) | $ (189,664) | $ (3,207,635) | |
Each of the above derivatives is located in the following Statement of Operations accounts: (g) Change in net unrealized appreciation (depreciation) on swap contracts and futures, respectively (h) Change in net unrealized appreciation (depreciation) on foreign currency (Statement of Operations includes both forward currency contracts and foreign currency transactions) | ||||
As of June 30, 2017, the Fund has transactions subject to enforceable master netting agreements which govern the terms of certain transactions, and reduce the counterparty risk associated with such transactions. Master netting agreements allow a Fund to close out and net total exposure to a counterparty in the event of a deterioration in the credit quality or contractual default with respect to all of the transactions with a counterparty. As defined by the master netting agreement, the Fund may have collateral agreements with certain counterparties to mitigate risk. For financial reporting purposes the Statement of Assets and Liabilities generally shows derivatives assets and liabilities on a gross basis, which reflects the full risks and exposures prior to netting. A reconciliation of the gross amounts on the Statement of Assets and Liabilities to the net amounts by a counterparty, including any collateral exposure, is included in the following tables:
| Counterparty | Gross Amounts of Assets Presented in the Statement of Assets and Liabilities | Financial Instruments and Derivatives Available for Offset | Cash Collateral Received (i) | Non-Cash Collateral Received | Net Amount of Derivative Assets |
| Australia & New Zealand Banking Group Ltd. | $ 37,794 | $ — | $ — | $ — | $ 37,794 |
| Bank of America | 207,879 | — | — | — | 207,879 |
| BNP Paribas | 113,018 | (113,018) | — | — | — |
| Citigroup, Inc. | 296,227 | (296,227) | 0 | — | — |
| Credit Agricole | 45,937 | — | — | — | 45,937 |
| Goldman Sachs & Co. | 523,352 | (296,376) | — | — | 226,976 |
| Toronto-Dominion Bank | 254,590 | (254,590) | — | — | — |
| $ 1,478,797 | $ (960,211) | $ — | $ — | $ 518,586 | |
| Counterparty | Gross Amounts of Liabilities Presented in the Statement of Assets and Liabilities | Financial Instruments and Derivatives Available for Offset | Cash Collateral Pledged | Non-Cash Collateral Pledged | Net Amount of Derivative Liabilities |
| BNP Paribas | $ 153,466 | $ (113,018) | $ — | $ — | $ 40,448 |
| Citigroup, Inc | 474,868 | (296,227) | — | — | 178,641 |
| Goldman Sachs & Co. | 296,376 | (296,376) | — | — | — |
| JPMorgan Chase Securities, Inc. | 346,316 | — | — | — | 346,316 |
| Toronto-Dominion Bank | 497,507 | (254,590) | — | — | 242,917 |
| $ 1,768,533 | $ (960,211) | $ — | $ — | $ 808,322 |
(i) The actual collateral received and/or pledged may be more than the amounts shown.
C. Purchases and Sales of Securities
During the six months ended June 30, 2017, purchases and sales of investment transactions (excluding short-term investments and U.S. Treasury obligations) aggregated $99,707,441 and $108,962,259, respectively. Purchases and sales of U.S. Treasury obligations aggregated $8,282,048 and $12,433,480, respectively.
For the six months ended June 30, 2017, transactions for written options on equity index contracts were as follows:
| Contacts | Premium | |
| Outstanding, beginning of period | — | $ — |
| Options written | 1,800 | 102,300 |
| Options closed | (1,800) | (102,300) |
| Outstanding, end of period | — | $ — |
D. Related Parties
Management Agreement. Under the Investment Management Agreement with Deutsche Investment Management Americas Inc. ("DIMA" or the "Advisor"), an indirect, wholly owned subsidiary of Deutsche Bank AG, the Advisor directs the investments of the Fund in accordance with its investment objectives, policies and restrictions. The Advisor determines the securities, instruments and other contracts relating to investments to be purchased, sold or entered into by the Fund or delegates such responsibility to the Fund's subadvisor.
Effective March 1, 2017, Deutsche Alternative Asset Management (Global) Limited (DAAM Global), also an indirect, wholly owned subsidiary of Deutsche Bank AG, serves as subadvisor for the Fund and, as such, provides portfolio manager services to the Fund. Pursuant to a sub-advisory agreement between DIMA and DAAM Global, DIMA, not the Fund, compensates DAAM Global for the services it provides to the Fund.
Under the Investment Management Agreement, the Fund pays a monthly management fee based on the Fund's average daily net assets, computed and accrued daily and payable monthly, at the following annual rates:
| First $250 million | .370% |
| Next $750 million | .345% |
| Over $1 billion | .310% |
Accordingly, for the six months ended June 30, 2017, the fee pursuant to the Investment Management Agreement was equivalent to an annualized rate (exclusive of any applicable waiver/reimbursements) of 0.37% of the Fund's average daily net assets.
For the period from January 1, 2017 through September 30, 2017, the Advisor has contractually agreed to waive its fees and/or reimburse certain operating expenses to the extent necessary to maintain the total annual operating expenses (excluding certain expenses such as extraordinary expenses, taxes, brokerage and interest expense) of Class A shares at 0.73%.
Administration Fee. Pursuant to an Administrative Services Agreement, DIMA provides most administrative services to the Fund. For all services provided under the Administrative Services Agreement, the Fund pays DIMA an annual fee ("Administration Fee") of 0.10% of the Fund's average daily net assets, computed and accrued daily and payable monthly. For the six months ended June 30, 2017, the Administration Fee was $92,264, of which $15,235 is unpaid.
Service Provider Fees. Deutsche AM Service Company ("DSC"), an affiliate of the Advisor, is the transfer agent, dividend-paying agent and shareholder service agent for the Fund. Pursuant to a sub-transfer agency agreement between DSC and DST Systems, Inc. ("DST"), DSC has delegated certain transfer agent, dividend-paying agent and shareholder service agent functions to DST. DSC compensates DST out of the shareholder servicing fee it receives from the Fund. For the six months ended June 30, 2017, the amounts charged to the Fund by DSC aggregated $207, of which $98 is unpaid.
Typesetting and Filing Service Fees. Under an agreement with DIMA, DIMA is compensated for providing typesetting and certain regulatory filing services to the Fund. For the six months ended June 30, 2017, the amount charged to the Fund by DIMA included in the Statement of Operations under "Reports to shareholders" aggregated $8,528, all of which is unpaid.
Trustees' Fees and Expenses. The Fund paid retainer fees to each Trustee not affiliated with the Advisor, plus specified amounts to the Board Chairperson and Vice Chairperson and to each committee Chairperson.
Affiliated Cash Management Vehicles. The Fund may invest uninvested cash balances in Deutsche Central Cash Management Government Fund and Deutsche Variable NAV Money Fund, affiliated money market funds which are managed by the Advisor. Each affiliated money market fund is managed in accordance with Rule 2a-7 under the 1940 Act, which governs the quality, maturity, diversity and liquidity of instruments in which a money market fund may invest. Deutsche Central Cash Management Government Fund seeks to maintain a stable net asset value, and Deutsche Variable NAV Money Fund maintains a floating net asset value. The Fund indirectly bears its proportionate share of the expenses of each affiliated money market fund in which it invests. Deutsche Central Cash Management Government Fund does not pay the Advisor an investment management fee. To the extent that Deutsche Variable NAV Money Fund pays an investment management fee to the Advisor, the Advisor will waive an amount of the investment management fee payable to the Advisor by the Fund equal to the amount of the investment management fee payable on the Fund's assets invested in Deutsche Variable NAV Money Fund.
Securities Lending Agent Fees. Deutsche Bank AG serves as securities lending agent for the Fund. For the six months ended June 30, 2017, the Fund incurred securities lending agent fees to Deutsche Bank AG in the amount of $3,469.
E. Ownership of the Fund
At June 30, 2017, two participating insurance companies were owners of record of 10% or more of the total outstanding shares of the Fund, each owning 58% and 20%.
F. Line of Credit
The Fund and other affiliated funds (the "Participants") share in a $400 million revolving credit facility provided by a syndication of banks. The Fund may borrow for temporary or emergency purposes, including the meeting of redemption requests that otherwise might require the untimely disposition of securities. The Participants are charged an annual commitment fee which is allocated based on net assets, among each of the Participants. Interest is calculated at a rate per annum equal to the sum of the Federal Funds Rate plus 1.25 percent plus if the one-month LIBOR exceeds the Federal Funds Rate, the amount of such excess. The Fund may borrow up to a maximum of 33 percent of its net assets under the agreement. The Fund had no outstanding loans at June 30, 2017.
Information About Your Fund's Expenses (Unaudited)
As an investor of the Fund, you incur two types of costs: ongoing expenses and transaction costs. Ongoing expenses include management fees and other Fund expenses. Examples of transaction costs include contract charges, which are not shown in this section. The following tables are intended to help you understand your ongoing expenses (in dollars) of investing in the Fund and to help you compare these expenses with the ongoing expenses of investing in other mutual funds. The example in the table is based on an investment of $1,000 invested at the beginning of the six-month period and held for the entire period (January 1, 2017 to June 30, 2017).
The tables illustrate your Fund's expenses in two ways:
— Actual Fund Return. This helps you estimate the actual dollar amount of ongoing expenses (but not transaction costs) paid on a $1,000 investment in the Fund using the Fund's actual return during the period. To estimate the expenses you paid over the period, simply divide your account value by $1,000 (for example, an $8,600 account value divided by $1,000 = 8.6), then multiply the result by the number in the "Expenses Paid per $1,000" line under the share class you hold.
— Hypothetical 5% Fund Return. This helps you to compare your Fund's ongoing expenses (but not transaction costs) with those of other mutual funds using the Fund's actual expense ratio and a hypothetical rate of return of 5% per year before expenses. Examples using a 5% hypothetical Fund return may be found in the shareholder reports of other mutual funds. The hypothetical account values and expenses may not be used to estimate the actual ending account balance or expenses you paid for the period.
Please note that the expenses shown in these tables are meant to highlight your ongoing expenses only and do not reflect any transaction costs. The "Expenses Paid per $1,000" line of the tables is useful in comparing ongoing expenses only and will not help you determine the relative total expense of owning different funds. If these transaction costs had been included, your costs would have been higher.
| Expenses and Value of a $1,000 Investment for the six months ended June 30, 2017 | ||
| Actual Fund Return | Class A | |
| Beginning Account Value 1/1/17 | $ 1,000.00 | |
| Ending Account Value 6/30/17 | $ 1,074.60 | |
| Expenses Paid per $1,000* | $ 3.24 | |
| Hypothetical 5% Fund Return | Class A | |
| Beginning Account Value 1/1/17 | $ 1,000.00 | |
| Ending Account Value 6/30/17 | $ 1,021.67 | |
| Expenses Paid per $1,000* | $ 3.16 | |
* Expenses are equal to the Fund's annualized expense ratio, multiplied by the average account value over the period, multiplied by 181 (the number of days in the most recent six-month period), then divided by 365.
| Annualized Expense Ratio | Class A | |
| Deutsche Variable Series II — Deutsche Global Income Builder VIP | .63% |
For more information, please refer to the Fund's prospectus.
These tables do not reflect charges and fees ("contract charges") associated with the separate account that invests in the Fund or any variable life insurance policy or variable annuity contract for which the Fund is an investment option.
For an analysis of the fees associated with an investment in the fund or similar funds, please refer to the current and hypothetical expense calculators for Variable Insurance Products which can be found at deutschefunds.com/EN/resources/calculators.jsp.
Proxy Voting
The Trust's policies and procedures for voting proxies for portfolio securities and information about how the Trust voted proxies related to its portfolio securities during the most recent 12-month period ended June 30 are available on our Web site — deutschefunds.com (click on "proxy voting" at the bottom of the page) — or on the SEC's Web site — sec.gov. To obtain a written copy of the Trust's policies and procedures without charge, upon request, call us toll free at (800) 728-3337.
Advisory Agreement Board Considerations and Fee Evaluation
The Board of Trustees (hereinafter referred to as the "Board" or "Trustees") approved the renewal of Deutsche Global Income Builder VIP’s (the "Fund") investment management agreement (the "Agreement") with Deutsche Investment Management Americas Inc. ("DIMA") in September 2016.
In terms of the process that the Board followed prior to approving the Agreement, shareholders should know that:
— During the entire process, all of the Fund’s Trustees were independent of DIMA and its affiliates (the "Independent Trustees").
— The Board met frequently during the past year to discuss fund matters and dedicated a substantial amount of time to contract review matters. Over the course of several months, the Board’s Contract Committee reviewed extensive materials received from DIMA, independent third parties and independent counsel. These materials included an analysis of the Fund’s performance, fees and expenses, and profitability from a fee consultant retained by the Fund’s Independent Trustees (the "Fee Consultant"). The Board also received extensive information throughout the year regarding performance of the Fund.
— The Independent Trustees regularly meet privately with counsel to discuss contract review and other matters. In addition, the Independent Trustees were advised by the Fee Consultant in the course of their review of the Fund’s contractual arrangements and considered a comprehensive report prepared by the Fee Consultant in connection with their deliberations.
— In connection with reviewing the Agreement, the Board also reviewed the terms of the Fund’s distribution agreement, administrative services agreement, transfer agency agreement and other material service agreements.
— Based on its evaluation of the information provided, the Contract Committee presented its findings and recommendations to the Board. The Board then reviewed the Contract Committee’s findings and recommendations.
In connection with the contract review process, the Contract Committee and the Board considered the factors discussed below, among others. The Board also considered that DIMA and its predecessors have managed the Fund since its inception, and the Board believes that a long-term relationship with a capable, conscientious advisor is in the best interests of the Fund. The Board considered, generally, that shareholders chose to invest or remain invested in the Fund knowing that DIMA managed the Fund, and that the Agreement was approved by the Fund’s shareholders. DIMA is part of Deutsche Bank AG’s ("Deutsche Bank") Asset Management ("Deutsche AM") division. Deutsche AM is a global asset management business that offers a wide range of investing expertise and resources, including research capabilities in many countries throughout the world. Deutsche Bank has advised the Board that the U.S. asset management business continues to be a critical and integral part of Deutsche Bank, and that Deutsche Bank will continue to invest in Deutsche AM and seek to enhance Deutsche AM’s investment platform. Deutsche Bank also has confirmed its commitment to maintaining strong legal and compliance groups within the Deutsche AM division.
As part of the contract review process, the Board carefully considered the fees and expenses of each Deutsche fund overseen by the Board in light of the fund’s performance. In many cases, this led to the negotiation and implementation of expense caps. As part of these negotiations, the Board indicated that it would consider relaxing these caps in future years following sustained improvements in performance, among other considerations.
While shareholders may focus primarily on fund performance and fees, the Fund’s Board considers these and many other factors, including the quality and integrity of DIMA’s personnel and such other issues as back-office operations, fund valuations, and compliance policies and procedures.
Nature, Quality and Extent of Services. The Board considered the terms of the Agreement, including the scope of advisory services provided under the Agreement. The Board noted that, under the Agreement, DIMA provides portfolio management services to the Fund and that, pursuant to a separate administrative services agreement, DIMA provides administrative services to the Fund. The Board considered the experience and skills of senior management and investment personnel and the resources made available to such personnel. The Board reviewed the Fund’s performance over short-term and long-term periods and compared those returns to various agreed-upon performance measures, including market index(es) and a peer universe compiled using information supplied by Morningstar Direct ("Morningstar"), an independent fund data service. The Board also noted that it has put into place a process of identifying "Focus Funds" (e.g., funds performing poorly relative to a peer universe), and receives additional reporting from DIMA regarding such funds and, where appropriate, DIMA’s plans to address underperformance. The Board believes this process is an effective manner of identifying and addressing underperforming funds. Based on the information provided, the Board noted that for the one-, three- and five-year periods ended December 31, 2015, the Fund’s performance (Class A shares) was in the 1st quartile of the applicable Morningstar universe (the 1st quartile being the best performers and the 4th quartile being the worst performers). The Board also observed that the Fund has outperformed its benchmark in the three- and five-year periods and has underperformed its benchmark in the one-year period ended December 31, 2015.
Fees and Expenses. The Board considered the Fund’s investment management fee schedule, operating expenses and total expense ratios, and comparative information provided by Broadridge Financial Solutions, Inc. ("Broadridge") and the Fee Consultant regarding investment management fee rates paid to other investment advisors by similar funds (1st quartile being the most favorable and 4th quartile being the least favorable). With respect to management fees paid to other investment advisors by similar funds, the Board noted that the contractual fee rates paid by the Fund, which include a 0.10% fee paid to DIMA under the Fund’s administrative services agreement, were lower than the median (1st quartile) of the applicable Broadridge peer group (based on Broadridge data provided as of December 31, 2015). The Board noted that the Fund’s Class A shares total (net) operating expenses were expected to be lower than the median (2nd quartile) of the applicable Broadridge expense universe (based on Broadridge data provided as of December 31, 2015, and analyzing Broadridge expense universe Class A (net) expenses less any applicable 12b-1 fees) ("Broadridge Universe Expenses"). The Board noted that the expense limitation agreed to by DIMA was expected to help the Fund’s total (net) operating expenses remain competitive. The Board considered the Fund’s management fee rate as compared to fees charged by DIMA to a comparable Deutsche U.S. registered fund ("Deutsche Funds") and considered differences between the Fund and the comparable Deutsche Fund. The information requested by the Board as part of its review of fees and expenses also included information about institutional accounts (including any sub-advised funds and accounts) and funds offered primarily to European investors ("Deutsche Europe funds") managed by Deutsche AM. The Board noted that DIMA indicated that Deutsche AM does not manage any institutional accounts or Deutsche Europe funds comparable to the Fund.
On the basis of the information provided, the Board concluded that management fees were reasonable and appropriate in light of the nature, quality and extent of services provided by DIMA.
Profitability. The Board reviewed detailed information regarding revenues received by DIMA under the Agreement. The Board considered the estimated costs and pre-tax profits realized by DIMA from advising the Deutsche Funds, as well as estimates of the pre-tax profits attributable to managing the Fund in particular. The Board also received information regarding the estimated enterprise-wide profitability of DIMA and its affiliates with respect to all fund services in totality and by fund. The Board and the Fee Consultant reviewed DIMA’s methodology in allocating its costs to the management of the Fund. Based on the information provided, the Board concluded that the pre-tax profits realized by DIMA in connection with the management of the Fund were not unreasonable. The Board also reviewed certain publicly available information regarding the profitability of certain similar investment management firms. The Board noted that while information regarding the profitability of such firms is limited (and in some cases is not necessarily prepared on a comparable basis), DIMA and its affiliates’ overall profitability with respect to the Deutsche Funds (after taking into account distribution and other services provided to the funds by DIMA and its affiliates) was lower than the overall profitability levels of most comparable firms for which such data was available.
Economies of Scale. The Board considered whether there are economies of scale with respect to the management of the Fund and whether the Fund benefits from any economies of scale. The Board noted that the Fund’s investment management fee schedule includes fee breakpoints. The Board concluded that the Fund’s fee schedule represents an appropriate sharing between the Fund and DIMA of such economies of scale as may exist in the management of the Fund at current asset levels.
Other Benefits to DIMA and Its Affiliates. The Board also considered the character and amount of other incidental benefits received by DIMA and its affiliates, including any fees received by DIMA for administrative services provided to the Fund. The Board also considered benefits to DIMA related to brokerage and soft-dollar allocations, including allocating brokerage to pay for research generated by parties other than the executing broker dealers, which pertain primarily to funds investing in equity securities, along with the incidental public relations benefits to DIMA related to Deutsche Funds advertising and cross-selling opportunities among DIMA products and services. The Board considered these benefits in reaching its conclusion that the Fund’s management fees were reasonable.
Compliance. The Board considered the significant attention and resources dedicated by DIMA to documenting and enhancing its compliance processes in recent years. The Board noted in particular (i) the experience, seniority and time commitment of the individuals serving as DIMA’s and the Fund’s chief compliance officers; (ii) the large number of DIMA compliance personnel; and (iii) the substantial commitment of resources by DIMA and its affiliates to compliance matters.
Based on all of the information considered and the conclusions reached, the Board unanimously determined that the continuation of the Agreement is in the best interests of the Fund. In making this determination, the Board did not give particular weight to any single factor identified above. The Board considered these factors over the course of numerous meetings, certain of which were in executive session with only the Independent Trustees and counsel present. It is possible that individual Independent Trustees may have weighed these factors differently in reaching their individual decisions to approve the continuation of the Agreement.
Sub-Advisory Agreement Board Considerations and Fee Evaluation
The Board of Trustees of Deutsche Variable Series II (hereinafter referred to as the "Board" or "Trustees") approved a sub-advisory agreement (the "Sub-Advisory Agreement") between Deutsche Investment Management Americas Inc. ("DIMA") and Deutsche Alternative Asset Management (Global) Limited ("DAAM Global"), a U.K.-based affiliate of DIMA and an indirect, wholly owned subsidiary of Deutsche Bank AG, on behalf of Deutsche Global Income Builder VIP (the "Fund") at an in-person meeting in February 2017. In February 2017, all of the Fund’s Trustees were independent of DIMA and its affiliates. DIMA relied on a manager of managers exemptive order granted to DIMA and the Fund by the SEC that permits DIMA, subject to the approval of the Board, to select sub-advisors that are affiliated with DIMA to manage all or a portion of the Fund’s assets without obtaining shareholder approval. The Sub-Advisory Agreement became effective on March 1, 2017.
In determining to approve the Sub-Advisory Agreement, the Board considered the capabilities of DAAM Global and the terms of the Sub-Advisory Agreement, including the sub-advisory fee schedule. The Board considered that the Sub-Advisory Agreement was proposed by DIMA to allow for the relocation of one of the Fund’s portfolio managers from New York to London. The Board considered that the appointment of DAAM Global was not expected to impact the Fund’s expenses, and that pursuant to the Sub-Advisory Agreement, DAAM Global would be paid for its services by DIMA from its fees as investment advisor to the Fund. The Board noted DIMA’s representation that its profitability in connection with the management of the Fund would likely decline under the new sub-advisory arrangement.
Given that DAAM Global is an affiliate of DIMA, the Board additionally took into account the factors that it considered as part of the process that it followed in approving the annual renewal of the Fund’s investment management agreement with DIMA in September 2016.
Based on all of the information considered and the conclusions reached, the Board unanimously determined that the approval of the Sub-Advisory Agreement was in the best interests of the Fund. In making this determination the Board did not give particular weight to any single factor. It is possible that individual Trustees may have weighed these factors differently in reaching their individual decisions to approve the Sub-Advisory Agreement.
Notes

VS2GIB-3 (R-028382-6 8/17)

June 30, 2017
Semiannual Report
Deutsche Variable Series II
Deutsche Government & Agency Securities VIP

Contents
3 Performance Summary 4 Portfolio Summary 4 Portfolio Management Team 5 Investment Portfolio 10 Statement of Assets and Liabilities 11 Statement of Operations 12 Statements of Changes in Net Assets 13 Financial Highlights 14 Notes to Financial Statements 22 Information About Your Fund's Expenses 23 Proxy Voting 24 Advisory Agreement Board Considerations and Fee Evaluation |
This report must be preceded or accompanied by a prospectus. To obtain an additional prospectus or summary prospectus, if available, call (800) 728-3337 or your financial representative. We advise you to consider the Fund's objectives, risks, charges and expenses carefully before investing. The summary prospectus and prospectus contain this and other important information about the Fund. Please read the prospectus carefully before you invest.
Investing in derivatives entails special risks relating to liquidity, leverage and credit that may reduce returns and/or increase volatility. Bond investments are subject to interest-rate, credit, liquidity and market risks to varying degrees. When interest rates rise, bond prices generally fall. Credit risk refers to the ability of an issuer to make timely payments of principal and interest. The "full faith and credit" guarantee of the US government applies to the timely repayment of interest, and does not eliminate market risk. Because of the rising US government debt burden, it is possible that the US government may not be able to meet its financial obligations or that securities issued by the US government may experience credit downgrades. The Fund may lend securities to approved institutions. See the prospectus for details.
Deutsche Asset Management represents the asset management activities conducted by Deutsche Bank AG or any of its subsidiaries.
Deutsche AM Distributors, Inc., 222 South Riverside Plaza, Chicago, IL 60606, (800) 621-1148
NOT FDIC/NCUA INSURED NO BANK GUARANTEE MAY LOSE VALUE NOT A DEPOSIT
NOT INSURED BY ANY FEDERAL GOVERNMENT AGENCY
Performance Summary June 30, 2017 (Unaudited)
Fund performance shown is historical, assumes reinvestment of all dividend and capital gain distributions and does not guarantee future results. Investment return and principal value fluctuate with changing market conditions so that, when redeemed, shares may be worth more or less than their original cost. Current performance may be lower or higher than the performance data quoted. Please contact your participating insurance company for the Fund's most recent month-end performance. Performance doesn't reflect charges and fees ("contract charges") associated with the separate account that invests in the Fund or any variable life insurance policy or variable annuity contract for which the Fund is an investment option. These charges and fees will reduce returns. While all share classes have the same underlying portfolio, their performance will differ.
The gross expense ratios of the Fund, as stated in the fee table of the prospectus dated May 1, 2017 are 0.86% and 1.21% for Class A and Class B shares, respectively, and may differ from the expense ratios disclosed in the Financial Highlights tables in this report.
Generally accepted accounting principles require adjustments to be made to the net assets of the Fund at period end for financial reporting purposes only, and as such, the total return based on the unadjusted net asset value per share may differ from the total return reported in the financial highlights.
| Growth of an Assumed $10,000 Investment in Deutsche Government & Agency Securities VIP | ||
■ Deutsche Government & Agency Securities VIP — Class A ■ Bloomberg Barclays GNMA Index | The Bloomberg Barclays GNMA Index is an unmanaged, market-value-weighted measure of all fixed-rate securities backed by mortgage pools of the Government National Mortgage Association. Index returns do not reflect any fees or expenses and it is not possible to invest directly into an index. | |
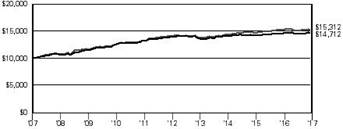 | ||
| Yearly periods ended June 30 | ||
| Comparative Results | ||||||
| Deutsche Government & Agency Securities VIP | 6-Month‡ | 1-Year | 3-Year | 5-Year | 10-Year | |
| Class A | Growth of $10,000 | $10,122 | $10,024 | $10,367 | $10,591 | $14,712 |
| Average annual total return | 1.22% | 0.24% | 1.21% | 1.16% | 3.94% | |
| Bloomberg Barclays GNMA Index | Growth of $10,000 | $10,089 | $9,980 | $10,572 | $10,859 | $15,312 |
| Average annual total return | 0.89% | –0.20% | 1.87% | 1.66% | 4.35% | |
| Deutsche Government & Agency Securities VIP | 6-Month‡ | 1-Year | 3-Year | 5-Year | 10-Year | |
| Class B | Growth of $10,000 | $10,103 | $9,997 | $10,268 | $10,417 | $14,207 |
| Average annual total return | 1.03% | –0.03% | 0.88% | 0.82% | 3.57% | |
| Bloomberg Barclays GNMA Index | Growth of $10,000 | $10,089 | $9,980 | $10,572 | $10,859 | $15,312 |
| Average annual total return | 0.89% | –0.20% | 1.87% | 1.66% | 4.35% | |
The growth of $10,000 is cumulative.
‡ Total returns shown for periods less than one year are not annualized.
Portfolio Summary (Unaudited)
| Asset Allocation (As a % of Net Assets) | 6/30/17 | 12/31/16 |
| Mortgage-Backed Securities Pass-Throughs | 97% | 94% |
| Government & Agency Obligations | 19% | 7% |
| Collateralized Mortgage Obligations | 15% | 16% |
| Corporate Bonds | 3% | 2% |
| Asset-Backed | 2% | — |
| Commercial Mortgage-Backed Securities | 1% | 1% |
| Cash Equivalents and Other Assets and Liabilities, net | –37% | –20% |
| 100% | 100% |
| Coupons* | 6/30/17 | 12/31/16 |
| Less than 3.5% | 41% | 27% |
| 3.5%–4.49% | 31% | 35% |
| 4.5%–5.49% | 17% | 20% |
| 5.5%–6.49% | 10% | 17% |
| 6.5%–7.49% | 1% | 1% |
| 7.5% and Greater | 0% | 0% |
| 100% | 100% |
| Interest Rate Sensitivity | 6/30/17 | 12/31/16 |
| Effective Maturity | 10.5 years | 9.9 years |
| Effective Duration | 4.7 years | 4.2 years |
* Excludes Cash Equivalents and U.S. Treasury Bills.
Effective maturity is the weighted average of the maturity date of bonds held by the Fund taking into consideration any available maturity shortening features.
Effective duration is an approximate measure of the Fund's sensitivity to interest rate changes taking into consideration any maturity shortening features.
Portfolio holdings and characteristics are subject to change.
For more complete details about the Fund's investment portfolio, see page 5.
Following the Fund's fiscal first and third quarter-end, a complete portfolio holdings listing is filed with the SEC on Form N-Q. The form will be available on the SEC's Web site at sec.gov, and it also may be reviewed and copied at the SEC's Public Reference Room in Washington, D.C. Information on the operation of the SEC's Public Reference Room may be obtained by calling (800) SEC-0330. The Fund's portfolio holdings are also posted on deutschefunds.com from time to time. Please see the Fund's current prospectus for more information.
Portfolio Management Team
Gregory M. Staples, CFA, Managing Director
Scott Agi, CFA, Director
Portfolio Managers
Investment Portfolio June 30, 2017 (Unaudited)
| Principal Amount ($)(a) | Value ($) | |||
| Mortgage-Backed Securities Pass-Throughs 96.6% | ||||
| Federal Home Loan Mortgage Corp., 3.0%, 7/1/2047 (b) | 7,500,000 | 7,483,594 | ||
| Federal National Mortgage Association: | ||||
| 3.0%, 7/1/2047 (b) | 3,100,000 | 3,095,821 | ||
| 3.5%, 3/1/2045 | 1,612,397 | 1,665,085 | ||
| 4.0%, with various maturities from 3/1/2042 until 4/1/2046 | 981,200 | 1,038,056 | ||
| Government National Mortgage Association: | ||||
| 3.0%, 7/1/2047 (b) | 4,500,000 | 4,545,351 | ||
| 3.5%, with various maturities from 4/15/2042 until 7/1/2047 (b) | 9,911,267 | 10,290,248 | ||
| 4.0%, with various maturities from 9/20/2040 until 7/1/2047 (b) | 6,412,038 | 6,782,064 | ||
| 4.5%, with various maturities from 6/20/2033 until 4/20/2047 | 3,599,508 | 3,897,630 | ||
| 4.55%, 1/15/2041 | 186,729 | 201,221 | ||
| 4.625%, 5/15/2041 | 100,862 | 108,552 | ||
| 5.0%, with various maturities from 12/15/2032 until 8/15/2040 | 2,387,290 | 2,624,898 | ||
| 5.5%, with various maturities from 1/15/2034 until 6/15/2042 | 1,857,551 | 2,086,460 | ||
| 6.0%, with various maturities from 5/20/2034 until 2/15/2039 | 3,215,271 | 3,705,308 | ||
| 6.5%, with various maturities from 9/15/2036 until 2/15/2039 | 377,806 | 428,690 | ||
| 7.0%, with various maturities from 2/20/2027 until 11/15/2038 | 98,999 | 101,772 | ||
| 7.5%, 10/20/2031 | 3,524 | 4,012 | ||
| Total Mortgage-Backed Securities Pass-Throughs (Cost $48,286,852) | 48,058,762 | |||
| Asset-Backed 1.8% | ||||
| Automobile Receivables 0.3% | ||||
| AmeriCredit Automobile Receivables Trust, "A3", Series 2017-1, 1.87%, 8/18/2021 | 170,000 | 169,944 | ||
| Credit Card Receivables 0.6% | ||||
| Chase Issuance Trust, "A", Series 2017-A2, 1.559%*, 3/15/2024 | 300,000 | 300,908 | ||
| Miscellaneous 0.9% | ||||
| Domino's Pizza Master Issuer LLC, "A23", Series 2017-1A, 144A, 4.118%, 7/25/2047 (b) | 450,000 | 449,719 | ||
| Total Asset-Backed (Cost $919,994) | 920,571 | |||
| Principal Amount ($)(a) | Value ($) | |||
| Collateralized Mortgage Obligations 15.4% | ||||
| Federal Home Loan Mortgage Corp.: | ||||
| "OA", Series 3179, Principal Only, Zero Coupon, 7/15/2036 | 87,549 | 78,363 | ||
| "YI", Series 3936, Interest Only, 3.0%, 6/15/2025 | 28,091 | 617 | ||
| "AI", Series 4016, Interest Only, 3.0%, 9/15/2025 | 493,883 | 23,166 | ||
| "WI", Series 3939, Interest Only, 3.0%, 10/15/2025 | 159,486 | 5,274 | ||
| "EI", Series 3953, Interest Only, 3.0%, 11/15/2025 | 240,724 | 9,076 | ||
| "IO", Series 3974, Interest Only, 3.0%, 12/15/2025 | 91,578 | 5,741 | ||
| "DI", Series 4010, Interest Only, 3.0%, 2/15/2027 | 77,813 | 6,248 | ||
| "IK", Series 4048, Interest Only, 3.0%, 5/15/2027 | 846,649 | 81,209 | ||
| "CZ", Series 4113, 3.0%, 9/15/2042 | 309,963 | 292,483 | ||
| "PL", Series 4627, 3.0%, 10/15/2046 | 500,000 | 488,797 | ||
| "22", Series 243, Interest Only, 3.422%**, 6/15/2021 | 33,392 | 546 | ||
| "IK", Series 3754, Interest Only, 3.5%, 6/15/2025 | 378,174 | 20,901 | ||
| "PI", Series 3940, Interest Only, 4.0%, 2/15/2041 | 320,701 | 45,948 | ||
| "C1", Series 329, Interest Only, 4.0%, 12/15/2041 | 948,149 | 181,335 | ||
| "UA", Series 4298, 4.0%, 2/15/2054 | 126,405 | 129,713 | ||
| "C32", Series 303, Interest Only, 4.5%, 12/15/2042 | 979,525 | 206,344 | ||
| "C28", Series 303, Interest Only, 4.5%, 1/15/2043 | 1,163,794 | 247,760 | ||
| "MI", Series 3871, Interest Only, 6.0%, 4/15/2040 | 52,236 | 4,667 | ||
| "IJ", Series 4472, Interest Only, 6.0%, 11/15/2043 | 401,282 | 92,603 | ||
| "A", Series 172, Interest Only, 6.5%, 1/1/2024 | 8,816 | 1,289 | ||
| "C22", Series 324, Interest Only, 6.5%, 4/15/2039 | 540,241 | 132,817 | ||
| Federal National Mortgage Association: | ||||
| "DI", Series 2011-136, Interest Only, 3.0%, 1/25/2026 | 80,409 | 4,552 | ||
| "IB", Series 2013-35, Interest Only, 3.0%, 4/25/2033 | 569,174 | 83,046 | ||
| "Z", Series 2013-44, 3.0%, 5/25/2043 | 95,007 | 90,890 | ||
| "HI", Series 2010-123, Interest Only, 3.5%, 3/25/2024 | 57,472 | 883 | ||
| "KI", Series 2011-72, Interest Only, 3.5%, 3/25/2025 | 136,400 | 1,470 | ||
| ''IO", Series 2012-146, Interest Only, 3.5%, 1/25/2043 | 1,225,265 | 230,902 | ||
| "4", Series 406, Interest Only, 4.0%, 9/25/2040 | 232,696 | 45,237 | ||
| "25", Series 351, Interest Only, 4.5%, 5/25/2019 | 27,300 | 703 | ||
| "21", Series 334, Interest Only, 5.0%, 3/25/2018 | 3,488 | 29 | ||
| "20", Series 334, Interest Only, 5.0%, 3/25/2018 | 5,313 | 43 | ||
| Principal Amount ($)(a) | Value ($) | |||
| "23", Series 339, Interest Only, 5.0%, 6/25/2018 | 7,941 | 85 | ||
| "26", Series 381, Interest Only, 5.0%, 12/25/2020 | 13,399 | 668 | ||
| "IO", Series 2016-26, Interest Only, 5.0%, 5/25/2046 | 1,057,281 | 204,061 | ||
| "30", Series 381, Interest Only, 5.5%, 11/25/2019 | 66,694 | 2,737 | ||
| "PI", Series 2009-14, Interest Only, 5.5%, 3/25/2024 | 1,632,115 | 111,531 | ||
| "UI", Series 2010-126, Interest Only, 5.5%, 10/25/2040 | 429,584 | 88,535 | ||
| "IO", Series 2014-70, Interest Only, 5.5%, 10/25/2044 | 563,981 | 138,867 | ||
| "BI", Series 2015-97, Interest Only, 5.5%, 1/25/2046 | 473,527 | 105,712 | ||
| "WI", Series 2011-59, Interest Only, 6.0%, 5/25/2040 | 88,593 | 5,035 | ||
| "101", Series 383, Interest Only, 6.5%, 9/25/2022 | 386,521 | 40,367 | ||
| Government National Mortgage Association: | ||||
| "PB", Series 2012-90, 2.5%, 7/20/2042 | 515,988 | 463,200 | ||
| "ZB", Series 2016-161, 3.0%, 11/20/2046 | 981,157 | 922,862 | ||
| "JI", Series 2013-10, Interest only, 3.5%, 1/20/2043 | 552,337 | 108,933 | ||
| "ID", Series 2013-70, Interest only, 3.5%, 5/20/2043 | 263,565 | 47,325 | ||
| "BI", Series 2014-22, Interest Only, 4.0%, 2/20/2029 | 498,075 | 49,882 | ||
| "IP", Series 2015-50, Interest Only, 4.0%, 9/20/2040 | 1,082,285 | 100,707 | ||
| "PI", Series 2015-40, Interest Only, 4.0%, 4/20/2044 | 313,544 | 41,262 | ||
| "LI", Series 2009-104, Interest Only, 4.5%, 12/16/2018 | 28,157 | 575 | ||
| "NI", Series 2010-44, Interest Only, 4.5%, 10/20/2037 | 52,365 | 610 | ||
| "CI", Series 2010-87, Interest Only, 4.5%, 11/20/2038 | 1,251,588 | 102,174 | ||
| "PI", Series 2014-108, Interest Only, 4.5%, 12/20/2039 | 248,363 | 41,826 | ||
| "MI", Series 2010-169, Interest Only, 4.5%, 8/20/2040 | 311,956 | 38,209 | ||
| "IP", Series 2014-115, Interest Only, 4.5%, 2/20/2044 | 170,521 | 30,304 | ||
| "GZ", Series 2005-24, 5.0%, 3/20/2035 | 617,302 | 736,173 | ||
| "MZ", Series 2009-98, 5.0%, 10/16/2039 | 1,246,099 | 1,530,133 | ||
| "AI", Series 2008-46, Interest Only, 5.5%, 5/16/2023 | 28,716 | 859 | ||
| "GI", Series 2003-19, Interest Only, 5.5%, 3/16/2033 | 368,228 | 71,226 | ||
| "IB", Series 2010-130, Interest Only, 5.5%, 2/20/2038 | 93,211 | 16,783 | ||
| "IA", Series 2012-64, Interest Only, 5.5%, 5/16/2042 | 224,174 | 54,044 | ||
| "DI", Series 2009-10, Interest Only, 6.0%, 4/16/2038 | 147,803 | 24,966 | ||
| "IP", Series 2009-118, Interest Only, 6.5%, 12/16/2039 | 38,030 | 9,597 | ||
| "IC", Series 1997-4, Interest Only, 7.5%, 3/16/2027 | 302,650 | 66,310 | ||
| Total Collateralized Mortgage Obligations (Cost $7,006,540) | 7,668,210 | |||
| Principal Amount ($)(a) | Value ($) | |||
| Commercial Mortgage-Backed Securities 1.5% | ||||
| Fannie Mae Grantor Trust, "A", Series 2017-T1, 2.898%, 6/25/2027 | 500,000 | 496,514 | ||
| FHLMC Multifamily Structured Pass-Through Securities, "X1", Series K055, Interest Only, 1.502%**, 3/25/2026 | 2,489,191 | 241,526 | ||
| Total Commercial Mortgage-Backed Securities (Cost $742,696) | 738,040 | |||
| Corporate Bonds 3.0% | ||||
| Financials | ||||
| Bank of Montreal, 144A, 2.5%, 1/11/2022 | 500,000 | 503,158 | ||
| National Australia Bank Ltd., 144A, 2.4%, 12/7/2021 | 1,000,000 | 1,000,681 | ||
| Total Corporate Bonds (Cost $1,496,265) | 1,503,839 | |||
| Government & Agency Obligations 18.1% | ||||
| Other Government Related (c) 2.1% | ||||
| European Financial Stability Facility, REG S, 1.25%, 5/24/2033 | EUR | 891,000 | 998,058 | |
| Sovereign Bonds 5.7% | ||||
| Government of Australia, Series 150, REG S, 3.0%, 3/21/2047 | AUD | 748,000 | 523,061 | |
| Government of New Zealand, Series 0427, REG S, 4.5%, 4/15/2027 | NZD | 1,600,000 | 1,321,093 | |
| Kingdom of Norway, Series 479, 144A, REG S, 1.75%, 2/17/2027 | NOK | 8,400,000 | 1,015,657 | |
| 2,859,811 | ||||
| U.S. Treasury Obligations 10.3% | ||||
| U.S. Treasury Notes: | ||||
| 0.75%, 10/31/2017 (d) | 3,000,000 | 2,996,580 | ||
| 1.75%, 5/31/2022 | 2,150,000 | 2,137,403 | ||
| 5,133,983 | ||||
| Total Government & Agency Obligations (Cost $8,991,566) | 8,991,852 | |||
| Short-Term U.S. Treasury Obligation 1.8% | ||||
| U.S. Treasury Bill, 0.59%***, 8/10/2017 (e) (Cost $877,375) | 880,000 | 879,190 | ||
Shares | Value ($) | |||
| Cash Equivalents 10.2% | ||||
| Deutsche Central Cash Management Government Fund, 1.03% (f) (Cost $5,080,240) | 5,080,240 | 5,080,240 | ||
| % of Net Assets | Value ($) | |
| Total Investment Portfolio (Cost $73,401,528)† | 148.4 | 73,840,704 |
| Other Assets and Liabilities, Net | (48.4) | (24,067,273) |
| Net Assets | 100.0 | 49,773,431 |
* Floating rate securities’ yields vary with a designated market index or market rate, such as the coupon-equivalent of the U.S. Treasury Bill rate. These securities are shown at their current rate as of June 30, 2017.
** These securities are shown at their current rate as of June 30, 2017.
*** Annualized yield at time of purchase; not a coupon rate.
† The cost for federal income tax purposes was $73,401,528. At June 30, 2017, net unrealized appreciation for all securities based on tax cost was $439,176. This consisted of aggregate gross unrealized appreciation for all securities in which there was an excess of value over tax cost of $1,195,630 and aggregate gross unrealized depreciation for all securities in which there was an excess of tax cost over value of $756,454.
(a) Principal amount stated in U.S. dollars unless otherwise noted.
(b) When-issued, delayed delivery or forward commitment securities included.
(c) Government-backed debt issued by financial companies or government sponsored enterprises.
(d) At June 30, 2017, this security has been pledged, in whole or in part, to cover initial margin requirements for open centrally cleared swap contracts.
(e) At June 30, 2017, this security has been pledged, in whole or in part, to cover initial margin requirements for open futures contracts.
(f) Affiliated fund managed by Deutsche Investment Management Americas Inc. The rate shown is the annualized seven-day yield at period end.
144A: Security exempt from registration under Rule 144A of the Securities Act of 1933. These securities may be resold in transactions exempt from registration, normally to qualified institutional buyers.
Interest Only: Interest Only (IO) bonds represent the "interest only" portion of payments on a pool of underlying mortgages or mortgage-backed securities. IO securities are subject to prepayment risk of the pool of underlying mortgages.
Principal Only: Principal Only (PO) bonds represent the "principal only" portion of payments on a pool of underlying mortgages or mortgage-backed securities.
REG S: Securities sold under Regulation S may not be offered, sold or delivered within the United States or to, or for the account or benefit of, U.S. persons, except pursuant to an exemption from, or in a transaction not subject to, the registration requirements of the Securities Act of 1933.
Included in the portfolio are investments in mortgage- or asset-backed securities which are interests in separate pools of mortgages or assets. Effective maturities of these investments may be shorter than stated maturities due to prepayments. Some separate investments in the Federal National Mortgage Association and Government National Mortgage Association issues which have similar coupon rates have been aggregated for presentation purposes in this investment portfolio.
At June 30, 2017, open futures contracts purchased were as follows:
| Futures | Currency | Expiration Date | Contracts | Notional Value ($) | Unrealized Depreciation ($) |
| 10 Year U.S. Treasury Note | USD | 9/20/2017 | 13 | 1,631,906 | (13,417) |
At June 30, 2017, open futures contracts sold were as follows:
| Futures | Currency | Expiration Date | Contracts | Notional Value ($) | Unrealized Appreciation/ (Depreciation) ($) |
| 5 Year U.S. Treasury Note | USD | 9/29/2017 | 16 | 1,885,375 | 4,214 |
| Euro-BTP Italian Government Bond | EUR | 9/7/2017 | 7 | 1,080,451 | 15,587 |
| Euro-OAT French Government Bond | EUR | 9/7/2017 | 11 | 1,865,450 | 2,364 |
| Federal Republic of Germany Euro-Bund | EUR | 9/7/2017 | 6 | 1,109,279 | 20,179 |
| U.S. Treasury Long Bond | USD | 9/20/2017 | 3 | 461,063 | (4,319) |
| Ultra 10 Year U.S. Treasury Note | USD | 9/20/2017 | 7 | 943,688 | 7,257 |
| Ultra Long U.S. Treasury Bond | USD | 9/20/2017 | 11 | 1,824,625 | (34,399) |
| United Kingdom Long Gilt Bond | GBP | 9/27/2017 | 15 | 2,453,229 | 42,955 |
| Total net unrealized appreciation | 53,838 | ||||
At June 30, 2017, open interest rate swap contracts were as follows:
| Centrally Cleared Swaps | ||||||
| Effective/ Expiration Dates | Notional Amount | Currency | Cash Flows Paid by the Fund | Cash Flows Received by the Fund | Value ($) | Unrealized Appreciation ($) |
| 6/15/2017 6/15/2047 | 40,600,000 | JPY | Fixed — 0.811% | Floating — 6-Month JPY LIBOR | 2,643 | 2,643 |
| 6/15/2017 6/15/2022 | 222,900,000 | JPY | Floating — 6-Month JPY LIBOR | Fixed — 0.105% | 482 | 482 |
| Total unrealized appreciation | 3,125 | |||||
LIBOR: London Interbank Offered Rate; JPY 6-Month LIBOR rate at June 30, 2017 is 0.02%.
At June 30, 2017, open total return swap contracts were as follows:
| Bilateral Swaps | ||||||
| Expiration Date | Notional Amount ($) | Fixed Cash Flows Received | Pay/Receive Return of the Reference Index | Value ($) | Upfront Payments Paid/(Received) ($) | Unrealized Appreciation ($) |
| 1/12/2041 | 439,5641 | 4.0% | Markit IOS INDEX FN30.400.10 | 2,179 | — | 2,179 |
Counterparties:
1 Goldman Sachs & Co.
As of June 30, 2017, the Fund had the following open forward foreign currency exchange contracts:
| Contracts to Deliver | In Exchange For | Settlement Date | Unrealized Appreciation ($) | Counterparty | |||||
| USD | 1,338,100 | NZD | 1,889,520 | 8/1/2017 | 45,720 | Australia & New Zealand Banking Group Ltd. | |||
| USD | 560,752 | AUD | 750,000 | 8/30/2017 | 15,256 | Australia & New Zealand Banking Group Ltd. | |||
| NZD | 1,400,000 | CAD | 1,340,605 | 9/14/2017 | 10,529 | Citigroup, Inc. | |||
| USD | 984,917 | CAD | 1,300,000 | 9/25/2017 | 18,913 | Canadian Imperial Bank of Commerce | |||
| Total unrealized appreciation | 90,418 | ||||||||
| Contracts to Deliver | In Exchange For | Settlement Date | Unrealized Depreciation ($) | Counterparty | |||||
| NZD | 987,657 | USD | 711,079 | 8/1/2017 | (12,248) | BNP Paribas | |||
| NZD | 944,760 | USD | 645,786 | 8/1/2017 | (46,125) | Australia & New Zealand Banking Group Ltd. | |||
| NZD | 1,803,135 | USD | 1,296,535 | 8/16/2017 | (23,660) | Australia & New Zealand Banking Group Ltd. | |||
| AUD | 750,000 | USD | 557,374 | 8/30/2017 | (18,634) | Citigroup, Inc. | |||
| NOK | 8,688,305 | USD | 1,028,866 | 9/8/2017 | (13,230) | Citigroup, Inc. | |||
| CAD | 1,342,181 | NZD | 1,400,000 | 9/14/2017 | (11,746) | BNP Paribas | |||
| CAD | 1,300,000 | USD | 1,000,244 | 9/25/2017 | (3,586) | Canadian Imperial Bank of Commerce | |||
| NOK | 8,600,000 | EUR | 891,994 | 9/26/2017 | (8,334) | Goldman Sachs & Co. | |||
| EUR | 905,644 | NOK | 8,600,000 | 9/26/2017 | (7,329) | Danske Bank AS | |||
| AUD | 709,000 | USD | 540,676 | 9/29/2017 | (3,637) | Australia & New Zealand Banking Group Ltd. | |||
| EUR | 879,000 | USD | 1,008,859 | 10/5/2017 | (266) | Citigroup, Inc. | |||
| Total unrealized depreciation | (148,795) | ||||||||
| Currency Abbreviations |
AUD Australian Dollar CAD Canadian Dollar EUR Euro GBP British pound JPY Japanese Yen NOK Norwegian Krone NZD New Zealand Dollar USD United States Dollar |
For information on the Fund's policy and additional disclosures regarding futures contracts, interest rate swap contracts, total return swap contracts and forward foreign currency exchange contracts, please refer to the Derivatives section of Note B in the accompanying Notes to Financial Statements.
Fair Value Measurements
Various inputs are used in determining the value of the Fund's investments. These inputs are summarized in three broad levels. Level 1 includes quoted prices in active markets for identical securities. Level 2 includes other significant observable inputs (including quoted prices for similar securities, interest rates, prepayment speeds and credit risk). Level 3 includes significant unobservable inputs (including the Fund's own assumptions in determining the fair value of investments). The level assigned to the securities valuations may not be an indication of the risk or liquidity associated with investing in those securities.
The following is a summary of the inputs used as of June 30, 2017 in valuing the Fund's investments. For information on the Fund's policy regarding the valuation of investments, please refer to the Security Valuation section of Note A in the accompanying Notes to Financial Statements.
| Assets | Level 1 | Level 2 | Level 3 | Total | |
| Fixed-Income Investments (g) | |||||
| Mortgage-Backed Securities Pass-Throughs | $ — | $ 48,058,762 | $ — | $ 48,058,762 | |
| Asset-Backed | — | 920,571 | — | 920,571 | |
| Collateralized Mortgage Obligations | — | 7,668,210 | — | 7,668,210 | |
| Commercial Mortgage-Backed Securities | — | 738,040 | — | 738,040 | |
| Corporate Bonds | — | 1,503,839 | — | 1,503,839 | |
| Government & Agency Obligations | — | 8,991,852 | — | 8,991,852 | |
| Short-Term U.S. Treasury Obligations | — | 879,190 | — | 879,190 | |
| Short-Term Investments | 5,080,240 | — | — | 5,080,240 | |
| Derivatives (h) | |||||
| Futures Contracts | 92,556 | — | — | 92,556 | |
| Interest Rate Swap Contracts | — | 3,125 | — | 3,125 | |
| Total Return Swap Contracts | — | 2,179 | — | 2,179 | |
| Forward Foreign Currency Exchange Contracts | — | 90,418 | — | 90,418 | |
| Total | $ 5,172,796 | $ 68,856,186 | $ — | $ 74,028,982 | |
| Liabilities | Level 1 | Level 2 | Level 3 | Total | |
| Derivatives (h) | |||||
| Futures Contracts | $ (52,135) | $ — | $ — | $ (52,135) | |
| Forward Foreign Currency Exchange Contracts | — | (148,795) | — | (148,795) | |
| Total | $ (52,135) | $ (148,795) | $ — | $ (200,930) | |
There have been no transfers between fair value measurement levels during the period ended June 30, 2017.
(g) See Investment Portfolio for additional detailed categorizations.
(h) Derivatives include unrealized appreciation (depreciation) on open futures contracts, interest rate swap contracts, total return swap contracts and forward foreign currency exchange contracts.
The accompanying notes are an integral part of the financial statements.
Statement of Assets and Liabilities
| as of June 30, 2017 (Unaudited) | |
| Assets | |
Investments Investments in non-affiliated securities, at value (cost $68,321,288) | $ 68,760,464 |
| Investment in Deutsche Central Cash Management Government Fund (cost $5,080,240) | 5,080,240 |
| Total investments in securities, at value (cost $73,401,528) | 73,840,704 |
| Cash | 100 |
| Foreign currency, at value (cost $21,669) | 21,845 |
| Receivable for investments sold | 734,335 |
| Receivable for investments sold — forward commitments | 13,884,743 |
| Receivable for Fund shares sold | 15,078 |
| Interest receivable | 255,971 |
| Receivable for variation margin on futures contracts | 60,044 |
| Unrealized appreciation on bilateral swap contracts | 2,179 |
| Unrealized appreciation on forward foreign currency exchange contracts | 90,418 |
| Other assets | 724 |
| Total assets | 88,906,141 |
| Liabilities | |
| Payable for investments purchased | 2,049,722 |
| Payable for investments purchased — forward commitments | 36,628,794 |
| Payable for Fund shares redeemed | 205,506 |
| Payable for variation margin on centrally cleared swaps | 3,511 |
| Unrealized depreciation on forward foreign currency exchange contracts | 148,795 |
| Accrued management fee | 10,761 |
| Accrued Trustees' fees | 398 |
| Other accrued expenses and payables | 85,223 |
| Total liabilities | 39,132,710 |
| Net assets, at value | $ 49,773,431 |
| Net Assets Consist of | |
| Undistributed net investment income | 502,962 |
Unrealized appreciation (depreciation) on: Investments | 439,176 |
| Swap contracts | 5,304 |
| Futures | 40,421 |
| Foreign currency | (57,431) |
| Accumulated net realized gain (loss) | 177,857 |
| Paid-in capital | 48,665,142 |
| Net assets, at value | $ 49,773,431 |
Class A Net Asset Value, offering and redemption price per share ($47,616,099 ÷ 4,289,314 outstanding shares of beneficial interest, no par value, unlimited number of shares authorized) | $ 11.10 |
Class B Net Asset Value, offering and redemption price per share ($2,157,332 ÷ 194,244 outstanding shares of beneficial interest, no par value, unlimited number of shares authorized) | $ 11.11 |
The accompanying notes are an integral part of the financial statements.
Statement of Operations
| for the six months ended June 30, 2017 (Unaudited) | |
| Investment Income | |
Income: Interest | $ 645,277 |
| Income distributions — Deutsche Central Cash Management Government Fund | 20,422 |
| Securities lending income, net of borrower rebates | 78 |
| Total income | 665,777 |
Expenses: Management fee | 116,251 |
| Administration fee | 25,834 |
| Services to shareholders | 641 |
| Record keeping fees (Class B) | 1,077 |
| Distribution service fees (Class B) | 2,795 |
| Custodian fee | 14,164 |
| Professional fees | 41,118 |
| Reports to shareholders | 12,461 |
| Trustees' fees and expenses | 2,384 |
| Other | 11,637 |
| Total expenses before expense reductions | 228,362 |
| Expense reductions | (68,586) |
| Total expenses after expense reductions | 159,776 |
| Net investment income | 506,001 |
| Realized and Unrealized Gain (Loss) | |
Net realized gain (loss) from: Investments | 1,148,829 |
| Swap contracts | (82,268) |
| Futures | (203,480) |
| Foreign currency | 165,541 |
| 1,028,622 | |
Change in net unrealized appreciation (depreciation) on: Investments | (987,240) |
| Swap contracts | 110,916 |
| Futures | 32,226 |
| Foreign currency | (62,316) |
| (906,414) | |
| Net gain (loss) | 122,208 |
| Net increase (decrease) in net assets resulting from operations | $ 628,209 |
The accompanying notes are an integral part of the financial statements.
Statements of Changes in Net Assets
| Increase (Decrease) in Net Assets | Six Months Ended June 30, 2017 (Unaudited) | Year Ended December 31, 2016 | |
Operations: Net investment income | $ 506,001 | $ 1,359,001 | |
| Net realized gain (loss) | 1,028,622 | (370,572) | |
| Change in net unrealized appreciation (depreciation) | (906,414) | (170,481) | |
| Net increase (decrease) in net assets resulting from operations | 628,209 | 817,948 | |
Distributions to shareholders from: Net investment income: Class A | (1,241,081) | (1,846,498) | |
| Class B | (46,826) | (72,152) | |
| Total distributions | (1,287,907) | (1,918,650) | |
Fund share transactions: Class A Proceeds from shares sold | 1,031,690 | 2,898,041 | |
| Reinvestment of distributions | 1,241,081 | 1,846,498 | |
| Payments for shares redeemed | (5,761,155) | (18,364,955) | |
| Net increase (decrease) in net assets from Class A share transactions | (3,488,384) | (13,620,416) | |
Class B Proceeds from shares sold | 34,498 | 226,087 | |
| Reinvestment of distributions | 46,826 | 72,152 | |
| Payments for shares redeemed | (295,178) | (503,123) | |
| Net increase (decrease) in net assets from Class B share transactions | (213,854) | (204,884) | |
| Increase (decrease) in net assets | (4,361,936) | (14,926,002) | |
| Net assets at beginning of period | 54,135,367 | 69,061,369 | |
| Net assets at end of period (including undistributed net investment income of $502,962 and $1,284,868, respectively) | $ 49,773,431 | $ 54,135,367 | |
| Other Information | |||
Class A Shares outstanding at beginning of period | 4,598,638 | 5,786,470 | |
| Shares sold | 91,795 | 253,037 | |
| Shares issued to shareholders in reinvestment of distributions | 112,315 | 163,697 | |
| Shares redeemed | (513,434) | (1,604,566) | |
| Net increase (decrease) in Class A shares | (309,324) | (1,187,832) | |
| Shares outstanding at end of period | 4,289,314 | 4,598,638 | |
Class B Shares outstanding at beginning of period | 213,112 | 231,100 | |
| Shares sold | 3,092 | 19,740 | |
| Shares issued to shareholders in reinvestment of distributions | 4,234 | 6,391 | |
| Shares redeemed | (26,194) | (44,119) | |
| Net increase (decrease) in Class B shares | (18,868) | (17,988) | |
| Shares outstanding at end of period | 194,244 | 213,112 | |
The accompanying notes are an integral part of the financial statements.
Financial Highlights
| Class A | Six Months Ended 6/30/17 (Unaudited) | Years Ended December 31, | |||||
| 2016 | 2015 | 2014 | 2013 | 2012 | |||
| Selected Per Share Data | |||||||
| Net asset value, beginning of period | $ 11.25 | $ 11.48 | $ 11.80 | $ 11.47 | $ 12.69 | $ 13.12 | |
Income (loss) from investment operations: Net investment incomea | .11 | .25 | .27 | .29 | .24 | .34 | |
| Net realized and unrealized gain (loss) | .03 | (.13) | (.26) | .31 | (.59) | .03 | |
| Total from investment operations | .14 | .12 | .01 | .60 | (.35) | .37 | |
Less distributions from: Net investment income | (.29) | (.35) | (.33) | (.27) | (.37) | (.52) | |
| Net realized gains | — | — | — | — | (.50) | (.28) | |
| Total distributions | (.29) | (.35) | (.33) | (.27) | (.87) | (.80) | |
| Net asset value, end of period | $ 11.10 | $ 11.25 | $ 11.48 | $ 11.80 | $ 11.47 | $ 12.69 | |
| Total Return (%)b | 1.22** | 1.06 | .06 | 5.29 | (3.04) | 2.93 | |
| Ratios to Average Net Assets and Supplemental Data | |||||||
| Net assets, end of period ($ millions) | 48 | 52 | 66 | 87 | 96 | 121 | |
| Ratio of expenses before expense reductions (%)c | .87* | .86 | .74 | .72 | .71 | .68 | |
| Ratio of expenses after expense reductions (%)c | .60* | .58 | .68 | .70 | .67 | .66 | |
| Ratio of net investment income (%) | 1.97* | 2.22 | 2.33 | 2.49 | 2.05 | 2.65 | |
| Portfolio turnover rate (%) | 292** | 521 | 376 | 393 | 794 | 796 | |
a Based on average shares outstanding during the period. b Total return would have been lower had certain expenses not been reduced. c Expense ratio does not reflect charges and fees associated with the separate account that invests in the Fund or any variable life insurance policy or variable annuity contract for which the Fund is an investment option. * Annualized ** Not annualized | |||||||
| Class B | Six Months Ended 6/30/17 (Unaudited) | Years Ended December 31, | |||||
| 2016 | 2015 | 2014 | 2013 | 2012 | |||
| Selected Per Share Data | |||||||
| Net asset value, beginning of period | $ 11.24 | $ 11.46 | $ 11.79 | $ 11.46 | $ 12.67 | $ 13.10 | |
Income (loss) from investment operations: Net investment incomea | .09 | .21 | .23 | .25 | .20 | .29 | |
| Net realized and unrealized gain (loss) | .03 | (.12) | (.27) | .31 | (.59) | .03 | |
| Total from investment operations | .12 | .09 | (.04) | .56 | (.39) | .32 | |
Less distributions from: Net investment income | (.25) | (.31) | (.29) | (.23) | (.32) | (.47) | |
| Net realized gains | — | — | — | — | (.50) | (.28) | |
| Total distributions | (.25) | (.31) | (.29) | (.23) | (.82) | (.75) | |
| Net asset value, end of period | $ 11.11 | $ 11.24 | $ 11.46 | $ 11.79 | $ 11.46 | $ 12.67 | |
| Total Return (%)b | 1.03** | .79 | (.36) | 4.95 | (3.25) | 2.48 | |
| Ratios to Average Net Assets and Supplemental Data | |||||||
| Net assets, end of period ($ millions) | 2 | 2 | 3 | 3 | 4 | 5 | |
| Ratio of expenses before expense reductions (%)c | 1.22* | 1.21 | 1.09 | 1.06 | 1.06 | 1.03 | |
| Ratio of expenses after expense reductions (%)c | .95* | .93 | 1.03 | 1.03 | .99 | 1.01 | |
| Ratio of net investment income (%) | 1.63* | 1.88 | 1.99 | 2.16 | 1.71 | 2.29 | |
| Portfolio turnover rate (%) | 292** | 521 | 376 | 393 | 794 | 796 | |
a Based on average shares outstanding during the period. b Total return would have been lower had certain expenses not been reduced. c Expense ratio does not reflect charges and fees associated with the separate account that invests in the Fund or any variable life insurance policy or variable annuity contract for which the Fund is an investment option. * Annualized ** Not annualized | |||||||
Notes to Financial Statements (Unaudited)
A. Organization and Significant Accounting Policies
Deutsche Government & Agency Securities VIP (the "Fund") is a diversified series of Deutsche Variable Series II (the "Trust"), which is registered under the Investment Company Act of 1940, as amended (the "1940 Act"), as an open-end management investment company organized as a Massachusetts business trust.
Multiple Classes of Shares of Beneficial Interest. The Fund offers two classes of shares (Class A shares and Class B shares). Sales of Class B shares are subject to recordkeeping fees up to 0.15% and Rule 12b-1 fees under the 1940 Act equal to an annual rate of 0.25% of the average daily net assets of the Class B shares of the Fund. Class A shares are not subject to such fees.
Investment income, realized and unrealized gains and losses, and certain fund-level expenses and expense reductions, if any, are borne pro rata on the basis of relative net assets by the holders of all classes of shares except that each class bears certain expenses unique to that class (including the applicable Rule 12b-1 fee and recordkeeping fees). Differences in class-level expenses may result in payment of different per share dividends by class. All shares have equal rights with respect to voting subject to class-specific arrangements.
The Fund's financial statements are prepared in accordance with accounting principles generally accepted in the United States of America ("U.S. GAAP") which require the use of management estimates. Actual results could differ from those estimates. The Fund qualifies as an investment company under Topic 946 of Accounting Standards Codification of U.S. GAAP. The policies described below are followed consistently by the Fund in the preparation of its financial statements.
Security Valuation. Investments are stated at value determined as of the close of regular trading on the New York Stock Exchange on each day the exchange is open for trading.
Various inputs are used in determining the value of the Fund's investments. These inputs are summarized in three broad levels. Level 1 includes quoted prices in active markets for identical securities. Level 2 includes other significant observable inputs (including quoted prices for similar securities, interest rates, prepayment speeds and credit risk). Level 3 includes significant unobservable inputs (including the Fund's own assumptions in determining the fair value of investments). The level assigned to the securities valuations may not be an indication of the risk or liquidity associated with investing in those securities.
Debt securities are valued at prices supplied by independent pricing services approved by the Fund's Board. Such services may use various pricing techniques which take into account appropriate factors such as yield, quality, coupon rate, maturity, type of issue, trading characteristics, prepayment speeds and other data, as well as broker quotes. If the pricing services are unable to provide valuations, debt securities are valued at the average of the most recent reliable bid quotations or evaluated prices, as applicable, obtained from broker-dealers. These securities are generally categorized as Level 2.
Investments in open-end investment companies are valued at their net asset value each business day and are categorized as Level 1.
Futures contracts are generally valued at the settlement prices established each day on the exchange on which they are traded and are categorized as Level 1.
Forward currency contracts are valued at the prevailing forward exchange rate of the underlying currencies and are categorized as Level 2.
Swap contracts are valued daily based upon prices supplied by a Board approved pricing vendor, if available, and otherwise are valued at the price provided by the broker-dealer. Swap contracts are generally categorized as Level 2.
Securities and other assets for which market quotations are not readily available or for which the above valuation procedures are deemed not to reflect fair value are valued in a manner that is intended to reflect their fair value as determined in accordance with procedures approved by the Board and are generally categorized as Level 3. In accordance with the Fund's valuation procedures, factors considered in determining value may include, but are not limited to, the type of the security; the size of the holding; the initial cost of the security; the existence of any contractual restrictions on the security's disposition; the price and extent of public trading in similar securities of the issuer or of comparable companies; quotations or evaluated prices from broker-dealers and/or pricing services; information obtained from the issuer, analysts, and/or the appropriate stock exchange (for exchange-traded securities); an analysis of the company's or issuer's financial statements; an evaluation of the forces that influence the issuer and the market(s) in which the security is purchased and sold; and with respect to debt securities, the maturity, coupon, creditworthiness, currency denomination and the movement of the market in which the security is normally traded. The value determined under these procedures may differ from published values for the same securities.
Disclosure about the classification of fair value measurements is included in a table following the Fund's Investment Portfolio.
Foreign Currency Translations. The books and records of the Fund are maintained in U.S. dollars. Investment securities and other assets and liabilities denominated in a foreign currency are translated into U.S. dollars at the prevailing exchange rates at period end. Purchases and sales of investment securities, income and expenses are translated into U.S. dollars at the prevailing exchange rates on the respective dates of the transactions.
Net realized and unrealized gains and losses on foreign currency transactions represent net gains and losses between trade and settlement dates on securities transactions, the acquisition and disposition of foreign currencies, and the difference between the amount of net investment income accrued and the U.S. dollar amount actually received. The portion of both realized and unrealized gains and losses on investments that results from fluctuations in foreign currency exchange rates is not separately disclosed but is included with net realized and unrealized gain/appreciation and loss/depreciation on investments.
Securities Lending. Deutsche Bank AG, as lending agent, lends securities of the Fund to certain financial institutions under the terms of its securities lending agreement. During the term of the loans, the Fund continues to receive interest and dividends generated by the securities and to participate in any changes in their market value. The Fund requires the borrowers of the securities to maintain collateral with the Fund consisting of either cash or liquid, unencumbered assets having a value at least equal to the value of the securities loaned. When the collateral falls below specified amounts, the lending agent will use its best effort to obtain additional collateral on the next business day to meet required amounts under the securities lending agreement. During the six months ended June 30, 2017, the Fund invested the cash collateral into a joint trading account in affiliated money market funds, including Deutsche Government & Agency Securities Portfolio, managed by Deutsche Investment Management Americas Inc. Deutsche Investment Management Americas Inc. receives a management/administration fee (0.13% annualized effective rate as of June 30, 2017) on the cash collateral invested in Deutsche Government & Agency Securities Portfolio. The Fund receives compensation for lending its securities either in the form of fees or by earning interest on invested cash collateral net of borrower rebates and fees paid to a lending agent. Either the Fund or the borrower may terminate the loan at any time, and the borrower, after notice, is required to return borrowed securities within a standard time period. There may be risks of delay and costs in recovery of securities or even loss of rights in the collateral should the borrower of the securities fail financially. If the Fund is not able to recover securities lent, the Fund may sell the collateral and purchase a replacement investment in the market, incurring the risk that the value of the replacement security is greater than the value of the collateral. The Fund is also subject to all investment risks associated with the reinvestment of any cash collateral received, including, but not limited to, interest rate, credit and liquidity risk associated with such investments.
As of June 30, 2017, the Fund had no securities on loan.
Forward Commitments. The Fund may purchase or sell securities on a when-issued, delayed delivery or forward commitment basis with delivery or payment to occur at a later date beyond the normal settlement period. At the time the Fund enters into a commitment to purchase or sell a security, the transaction is recorded and the value of the transaction is reflected in the net asset value. The price of such security and the date when the security will be delivered and paid for are fixed at the time the transaction is negotiated. The Fund may sell the forward commitment security before the settlement date or enter into a new commitment to extend the delivery date into the future. The value of the security may vary with market fluctuations. At the time the Fund enters into a purchase transaction it is required to segregate cash or other liquid assets at least equal to the amount of the commitment. Additionally, the Fund or the counterparty may be required to post securities and/or cash collateral in accordance with the terms of the commitment.
Certain risks may arise upon entering into when-issued, delayed delivery or forward commitment transactions from the potential inability of counterparties to meet the terms of their contracts or if the issuer does not issue the securities due to political, economic or other factors. Such transactions may also have the effect of leverage on the Fund and may cause the Fund to be more volatile. Additionally, losses may arise due to changes in the value of the underlying securities.
Federal Income Taxes. The Fund's policy is to comply with the requirements of the Internal Revenue Code, as amended, which are applicable to regulated investment companies and to distribute all of its taxable income to its shareholders.
At December 31, 2016, the Fund had net tax basis capital loss carryforwards of approximately $843,000 of short-term losses, which may be applied against realized net taxable capital gains indefinitely.
The Fund has reviewed the tax positions for the open tax years as of December 31, 2016 and has determined that no provision for income tax and/or uncertain tax provisions is required in the Fund's financial statements. The Fund's federal tax returns for the prior three fiscal years remain open subject to examination by the Internal Revenue Service.
Distribution of Income and Gains. Distributions from net investment income of the Fund, if any, are declared and distributed to shareholders annually. Net realized gains from investment transactions, in excess of available capital loss carryforwards, would be taxable to the Fund if not distributed and, therefore, will be distributed to shareholders at least annually. The Fund may also make additional distributions for tax purposes if necessary.
The timing and characterization of certain income and capital gain distributions are determined annually in accordance with federal tax regulations which may differ from accounting principles generally accepted in the United States of America. These differences primarily relate to investments in futures contracts, investments in swap contracts and certain securities sold at a loss. As a result, net investment income (loss) and net realized gain (loss) on investment transactions for a reporting period may differ significantly from distributions during such period. Accordingly, the Fund may periodically make reclassifications among certain of its capital accounts without impacting the net asset value of the Fund.
The tax character of current year distributions will be determined at the end of the current fiscal year.
Expenses. Expenses of the Trust arising in connection with a specific fund are allocated to that fund. Other Trust expenses which cannot be directly attributed to a fund are apportioned among the funds in the Trust based upon the relative net assets or other appropriate measures.
Contingencies. In the normal course of business, the Fund may enter into contracts with service providers that contain general indemnification clauses. The Fund's maximum exposure under these arrangements is unknown, as this would involve future claims that may be made against the Fund that have not yet been made. However, based on experience, the Fund expects the risk of loss to be remote.
Other. Investment transactions are accounted for on a trade date plus one basis for daily net asset value calculations. However, for financial reporting purposes, investment transactions are reported on trade date. Interest income is recorded on the accrual basis. Realized gains and losses from investment transactions are recorded on an identified cost basis. All discounts and premiums are accreted/amortized for both tax and financial reporting purposes for the Fund.
B. Derivative Instruments
Swaps. A swap is a contract between two parties to exchange future cash flows at periodic intervals based on the notional amount of the swap. A bilateral swap is a transaction between the Fund and a counterparty where cash flows are exchanged between the two parties. A centrally cleared swap is a transaction executed between the Fund and a counterparty, then cleared by a clearing member through a central clearinghouse. The central clearinghouse serves as the counterparty, with whom the Fund exchanges cash flows.
The value of a swap is adjusted daily, and the change in value, if any, is recorded as unrealized appreciation or depreciation in the Statement of Assets and Liabilities. Gains or losses are realized when the swap expires or is closed. Certain risks may arise when entering into swap transactions including counterparty default; liquidity; or unfavorable changes in interest rates or the value of the underlying reference security, commodity or index. In connection with bilateral swaps, securities and/or cash may be identified as collateral in accordance with the terms of the swap agreement to provide assets of value and recourse in the event of default. The maximum counterparty credit risk is the net present value of the cash flows to be received from or paid to the counterparty over the term of the swap, to the extent that this amount is beneficial to the Fund, in addition to any related collateral posted to the counterparty by the Fund. This risk may be partially reduced by a master netting arrangement between the Fund and the counterparty. Upon entering into a centrally cleared swap, the Fund is required to deposit with a financial intermediary cash or securities ("initial margin") in an amount equal to a certain percentage of the notional amount of the swap. Subsequent payments ("variation margin") are made or received by the Fund dependent upon the daily fluctuations in the value of the swap. In a cleared swap transaction, counterparty risk is minimized as the central clearinghouse acts as the counterparty.
An upfront payment, if any, made by the Fund is recorded as an asset in the Statement of Assets and Liabilities. An upfront payment, if any, received by the Fund is recorded as a liability in the Statement of Assets and Liabilities. Payments received or made at the end of the measurement period are recorded as realized gain or loss in the Statement of Operations.
Total Return Swap Contracts. Total return swaps involve commitments to pay interest in exchange for a market-linked return based on a notional amount. One counterparty pays out the total return of the reference security or index underlying the total return swap, and in return receives a fixed or variable rate. As a receiver, the Fund would receive payments based on any positive total return and would owe payments in the event of a negative total return. As the payer, the Fund would owe payments on any net positive total return, and would receive payments in the event of a negative total return. For the six months ended June 30, 2017, the Fund entered into total return swap transactions as a means of gaining exposure to a particular asset class without investing directly in such asset class.
A summary of the open total return swap contracts as of June 30, 2017 is included in a table following the Fund’s Investment Portfolio. For the six months ended June 30, 2017, the investment in total return swap contracts had a total notional amount generally indicative of a range from approximately $440,000 to $963,000.
Interest Rate Swaps. Interest rate swaps are agreements in which the Fund agrees to pay to the counterparty a fixed rate payment in exchange for the counterparty agreeing to pay to the Fund a variable rate payment, or the Fund agrees to receive from the counterparty a fixed rate payment in exchange for the counterparty agreeing to receive from the Fund a variable rate payment. The payment obligations are based on the notional amount of the swap. For the six months ended June 30, 2017, the Fund entered into interest rate swap agreements to gain exposure to different parts of the yield curve while managing overall duration and for non-hedging purposes to seek to enhance potential gains.
A summary of the open interest rate swap contracts as of June 30, 2017 is included in a table following the Fund's Investment Portfolio. For the six months ended June 30, 2017, the investment in interest rate swap contracts had a total USD equivalent notional amount generally indicative of a range from $2,396,000 to $11,953,000.
Futures Contracts. A futures contract is an agreement between a buyer or seller and an established futures exchange or its clearinghouse in which the buyer or seller agrees to take or make a delivery of a specific amount of a financial instrument at a specified price on a specific date (settlement date). For the six months ended June 30, 2017, the Fund entered into interest rate futures to gain exposure to different parts of the yield curve while managing overall duration and for non-hedging purposes to seek to enhance potential gains.
Upon entering into a futures contract, the Fund is required to deposit with a financial intermediary cash or securities ("initial margin") in an amount equal to a certain percentage of the face value indicated in the futures contract. Subsequent payments ("variation margin") are made or received by the Fund dependent upon the daily fluctuations in the value and are recorded for financial reporting purposes as unrealized gains or losses by the Fund. Gains or losses are realized when the contract expires or is closed. Since all futures contracts are exchange-traded, counterparty risk is minimized as the exchange's clearinghouse acts as the counterparty, and guarantees the futures against default.
Certain risks may arise upon entering into futures contracts, including the risk that an illiquid market will limit the Fund's ability to close out a futures contract prior to the settlement date and the risk that the futures contract is not well correlated with the security, index or currency to which it relates. Risk of loss may exceed amounts disclosed in the Statement of Assets and Liabilities.
A summary of the open futures contracts as of June 30, 2017, is included in a table following the Fund's Investment Portfolio. For the six months ended June 30, 2017, the investment in futures contracts purchased had a total notional value generally indicative of a range from approximately $1,632,000 to $7,595,000 and the investment in futures contracts sold had a total notional value generally indicative of a range from approximately $8,787,000 to $11,623,000.
Forward Foreign Currency Exchange Contracts. A forward foreign currency exchange contract ("forward currency contract") is a commitment to purchase or sell a foreign currency at the settlement date at a negotiated rate. For the six months ended June 30, 2017, the Fund entered into forward currency contracts in order to hedge its exposure to changes in foreign currency exchange rates on its foreign currency denominated portfolio holdings.
Forward currency contracts are valued at the prevailing forward exchange rate of the underlying currencies and unrealized gain (loss) is recorded daily. On the settlement date of the forward currency contract, the Fund records a realized gain or loss equal to the difference between the value of the contract at the time it was opened and the value of the contract at the time it was closed. Certain risks may arise upon entering into forward currency contracts from the potential inability of counterparties to meet the terms of their contracts. The maximum counterparty credit risk to the Fund is measured by the unrealized gain on appreciated contracts. Additionally, when utilizing forward currency contracts to hedge, the Fund gives up the opportunity to profit from favorable exchange rate movements during the term of the contract.
A summary of the open forward currency contracts as of June 30, 2017 is included in a table following the Fund's Investment Portfolio. For the six months ended June 30, 2017, the investment in forward currency contracts short vs. U.S. dollars had a total contract value generally indicative of a range from approximately $1,646,000 to $6,789,000 and the investment in forward currency contracts long vs. U.S. dollars had a total contract value generally indicative of a range from approximately $962,000 to $2,884,000. The investment in forward currency contracts long vs. other foreign currencies sold had a total contract value generally indicative of a range from $0 to approximately $4,050,000.
The following tables summarize the value of the Fund's derivative instruments held as of June 30, 2017 and the related location in the accompanying Statement of Assets and Liabilities, presented by primary underlying risk exposure:
| Asset Derivatives | Forward Contracts | Swap Contracts | Futures Contracts | Total |
| Interest Rate Contracts (a) (b) | $ — | $ 5,304 | $ 92,556 | $ 97,860 |
| Foreign Exchange Contracts (c) | 90,418 | — | — | 90,418 |
| $ 90,418 | $ 5,304 | $ 92,556 | $ 188,278 | |
Each of the above derivatives is located in the following Statement of Assets and Liabilities accounts: (a) Includes cumulative appreciation of futures and swap contracts as disclosed in the Investment Portfolio. Unsettled variation margin is disclosed separately within the Statement of Assets and Liabilities. (b) Unrealized appreciation on bilateral swap contracts (c) Unrealized appreciation on forward foreign currency exchange contracts | ||||
| Liability Derivatives | Forward Contracts | Futures Contracts | Total |
| Interest Rate Contracts (d) | $ — | $ (52,135) | $ (52,135) |
| Foreign Exchange Contracts (e) | (148,795) | — | (148,795) |
| $ (148,795) | $ (52,135) | $ (200,930) | |
Each of the above derivatives is located in the following Statement of Assets and Liabilities accounts: (d) Includes cumulative depreciation of futures contracts as disclosed in the Investment Portfolio. Unsettled variation margin is disclosed separately within the Statement of Assets and Liabilities. (e) Unrealized depreciation on forward foreign currency exchange contracts | |||
Additionally, the amount of unrealized and realized gains and losses on derivative instruments recognized in Fund earnings during the six months ended June 30, 2017 and the related location in the accompanying Statement of Operations is summarized in the following tables by primary underlying risk exposure:
| Realized Gain (Loss) | Forward Contracts | Swap Contracts | Futures Contracts | Total |
| Interest Rate Contracts (f) | $ — | $ (82,268) | $ (203,480) | $ (285,748) |
| Foreign Exchange Contracts (g) | 160,348 | — | — | 160,348 |
| $ 160,348 | $ (82,268) | $ (203,480) | $ (125,400) | |
Each of the above derivatives is located in the following Statement of Operations accounts: (f) Net realized gain (loss) on swap contracts and futures, respectively (g) Net realized gain (loss) from foreign currency (Statement of Operations includes both forward currency contracts and foreign currency transactions) | ||||
| Change in Net Unrealized Appreciation (Depreciation) | Forward Contracts | Swap Contracts | Futures Contracts | Total |
| Interest Rate Contracts (h) | $ — | $ 110,916 | $ 32,226 | $ 143,142 |
| Foreign Exchange Contracts (i) | (63,132) | — | — | (63,132) |
| $ (63,132) | $ 110,916 | $ 32,226 | $ 80,010 | |
Each of the above derivatives is located in the following Statement of Operations accounts: (h) Change in net unrealized appreciation (depreciation) from swap contracts and futures, respectively (i) Change in net unrealized appreciation (depreciation) on foreign currency (Statement of Operations includes both forward currency contracts and foreign currency transactions) | ||||
As of June 30, 2017, the Fund has transactions subject to enforceable master netting agreements which govern the terms of certain transactions, and reduce the counterparty risk associated with such transactions. Master netting agreements allow a Fund to close out and net total exposure to a counterparty in the event of a deterioration in the credit quality or contractual default with respect to all of the transactions with a counterparty. As defined by the master netting agreement, the Fund may have collateral agreements with certain counterparties to mitigate risk. For financial reporting purposes the Statement of Assets and Liabilities generally shows derivatives assets and liabilities on a gross basis, which reflects the full risks and exposures prior to netting. A reconciliation of the gross amounts on the Statement of Assets and Liabilities to the net amounts by a counterparty, including any collateral exposure, is included in the following tables:
| Counterparty | Gross Amounts of Assets Presented in the Statement of Assets and Liabilities | Financial Instruments and Derivatives Available for Offset | Collateral Received | Net Amount of Derivative Assets |
| Australia & New Zealand Banking Group Ltd. | $ 60,976 | $ (60,976) | $ — | $ — |
| Canadian Imperial Bank of Commerce | 18,913 | (3,586) | — | 15,327 |
| Citigroup, Inc. | 10,529 | (10,529) | — | — |
| Goldman Sachs & Co. | 2,179 | (2,179) | — | — |
| $ 92,597 | $ (77,270) | $ — | $ 15,327 | |
| Counterparty | Gross Amounts of Liabilities Presented in the Statement of Assets and Liabilities | Financial Instruments and Derivatives Available for Offset | Collateral Pledged | Net Amount of Derivative Liabilities |
| Australia & New Zealand Banking Group Ltd. | $ 73,422 | $ (60,976) | $ — | $ 12,446 |
| BNP Paribas | 23,994 | — | — | 23,994 |
| Canadian Imperial Bank of Commerce | 3,586 | (3,586) | — | — |
| Citigroup, Inc. | 32,130 | (10,529) | — | 21,601 |
| Danske Bank AS | 7,329 | — | — | 7,329 |
| Goldman Sachs & Co. | 8,334 | (2,179) | — | 6,155 |
| $ 148,795 | $ (77,270) | $ — | $ 71,525 |
C. Purchases and Sales of Securities
During the six months ended June 30, 2017, purchases and sales of investment securities (excluding short-term investments and U.S. Treasury securities) aggregated $184,355,165 and $183,347,177, respectively. Purchases and sales of U.S. Treasury securities aggregated $3,793,709 and $1,639,037, respectively.
D. Related Parties
Management Agreement. Under the Investment Management Agreement with Deutsche Investment Management Americas Inc. ("DIMA" or the "Advisor"), an indirect, wholly owned subsidiary of Deutsche Bank AG, the Advisor directs the investments of the Fund in accordance with its investment objectives, policies and restrictions. The Advisor determines the securities, instruments and other contracts relating to investments to be purchased, sold or entered into by the Fund.
Pursuant to the Investment Management Agreement with the Advisor, the Fund pays a monthly management fee based on the Fund's average daily net assets, computed and accrued daily and payable monthly, at the following annual rates:
| First $250 million | .450% |
| Next $750 million | .430% |
| Next $1.5 billion | .410% |
| Next $2.5 billion | .400% |
| Next $2.5 billion | .380% |
| Next $2.5 billion | .360% |
| Next $2.5 billion | .340% |
| Over $12.5 billion | .320% |
Accordingly, for the six months ended June 30, 2017, the fee pursuant to the Investment Management Agreement was equivalent to an annualized rate (exclusive of any applicable waivers/reimbursements) of 0.45% of the Fund's average daily net assets.
For the period from January 1, 2017 through April 30, 2017, the Advisor had contractually agreed to waive all or a portion of its fees and/or reimburse certain operating expenses of the Fund to the extent necessary to maintain the total annual operating expenses (excluding certain expenses such as extraordinary expenses, taxes, brokerage and interest) of each class as follows:
| Class A | .58% |
| Class B | .93% |
Effective May 1, 2017 through April 30, 2018, the Advisor has contractually agreed to waive all or a portion of its fees and/or reimburse certain operating expenses of the Fund to the extent necessary to maintain the total annual operating expenses (excluding certain expenses such as extraordinary expenses, taxes,
brokerage and interest) of each class as follows:
| Class A | .65% |
| Class B | 1.00% |
For the six months ended June 30, 2017, fees waived and/or expenses reimbursed for each class are as follows:
| Class A | $ 65,625 |
| Class B | 2,961 |
| $ 68,586 |
Administration Fee. Pursuant to an Administrative Services Agreement, DIMA provides most administrative services to the Fund. For all services provided under the Administrative Services Agreement, the Fund pays DIMA an annual fee ("Administration Fee") of 0.10% of the Fund's average daily net assets, computed and accrued daily and payable monthly. For the six months ended June 30, 2017, the Administration Fee was $25,834, of which $4,162 is unpaid.
Service Provider Fees. Deutsche AM Service Company ("DSC"), an affiliate of the Advisor, is the transfer agent, dividend-paying agent and shareholder service agent for the Fund. Pursuant to a sub-transfer agency agreement between DSC and DST Systems, Inc. ("DST"), DSC has delegated certain transfer agent, dividend-paying agent and shareholder service agent functions to DST. DSC compensates DST out of the shareholder servicing fee it receives from the Fund. For the six months ended June 30, 2017, the amounts charged to the Fund by DSC were as follows:
| Total Aggregated | Unpaid at June 30, 2017 | |
| Class A | $ 133 | $ 71 |
| Class B | 25 | 13 |
| $ 158 | $ 84 |
Distribution Service Agreement. Under the Fund's Class B 12b-1 plan, Deutsche AM Distributors, Inc. ("DDI") received a fee ("Distribution Service Fee") of 0.25% of average daily net assets of Class B shares. For the six months ended June 30, 2017, the Distribution Service Fee aggregated $2,795, of which $446 is unpaid.
Typesetting and Filing Service Fees. Under an agreement with DIMA, DIMA is compensated for providing typesetting and certain regulatory filing services to the Fund. For the six months ended June 30, 2017, the amount charged to the Fund by DIMA included in the Statement of Operations under "Reports to shareholders" aggregated $6,727, of which $6,140 is unpaid.
Trustees' Fees and Expenses. The Fund paid retainer fees to each Trustee not affiliated with the Advisor, plus specified amounts to the Board Chairperson and Vice Chairperson and to each committee Chairperson.
Affiliated Cash Management Vehicles. The Fund may invest uninvested cash balances in Deutsche Central Cash Management Government Fund and Deutsche Variable NAV Money Fund, affiliated money market funds which are managed by the Advisor. Each affiliated money market fund is managed in accordance with Rule 2a-7 under the 1940 Act, which governs the quality, maturity, diversity and liquidity of instruments in which a money market fund may invest. Deutsche Central Cash Management Government Fund seeks to maintain a stable net asset value, and Deutsche Variable NAV Money Fund maintains a floating net asset value. The Fund indirectly bears its proportionate share of the expenses of each affiliated money market fund in which it invests. Deutsche Central Cash Management Government Fund does not pay the Advisor an investment management fee. To the extent that Deutsche Variable NAV Money Fund pays an investment management fee to the Advisor, the Advisor will waive an amount of the investment management fee payable to the Advisor by the Fund equal to the amount of the investment management fee payable on the Fund's assets invested in Deutsche Variable NAV Money Fund.
Security Lending Fees. Deutsche Bank AG serves as securities lending agent for the Fund. For the six months ended June 30, 2017, the Fund incurred securities lending agent fees to Deutsche Bank AG in the amount of $6.
E. Ownership of the Fund
At June 30, 2017, two participating insurance companies were owners of record of 10% or more of the total outstanding Class A shares of the Fund, each owning 33% and 54%. One participating insurance company was the owner of record of 10% or more of the total outstanding Class B shares of the Fund, owning 94%.
F. Line of Credit
The Fund and other affiliated funds (the "Participants") share in a $400 million revolving credit facility provided by a syndication of banks. The Fund may borrow for temporary or emergency purposes, including the meeting of redemption requests that otherwise might require the untimely disposition of securities. The Participants are charged an annual commitment fee which is allocated based on net assets, among each of the Participants. Interest is calculated at a rate per annum equal to the sum of the Federal Funds Rate plus 1.25 percent plus if the one-month LIBOR exceeds the Federal Funds Rate, the amount of such excess. The Fund may borrow up to a maximum of 33 percent of its net assets under the agreement. The Fund had no outstanding loans at June 30, 2017.
Information About Your Fund's Expenses (Unaudited)
As an investor of the Fund, you incur two types of costs: ongoing expenses and transaction costs. Ongoing expenses include management fees, distribution and service (12b-1) fees and other Fund expenses. Examples of transaction costs include contract charges, which are not shown in this section. The following tables are intended to help you understand your ongoing expenses (in dollars) of investing in the Fund and to help you compare these expenses with the ongoing expenses of investing in other mutual funds. In the most recent six-month period, the Fund limited these expenses; had it not done so, expenses would have been higher. The example in the table is based on an investment of $1,000 invested at the beginning of the six-month period and held for the entire period (January 1, 2017 to June 30, 2017).
The tables illustrate your Fund's expenses in two ways:
— Actual Fund Return. This helps you estimate the actual dollar amount of ongoing expenses (but not transaction costs) paid on a $1,000 investment in the Fund using the Fund's actual return during the period. To estimate the expenses you paid over the period, simply divide your account value by $1,000 (for example, an $8,600 account value divided by $1,000 = 8.6), then multiply the result by the number in the "Expenses Paid per $1,000" line under the share class you hold.
— Hypothetical 5% Fund Return. This helps you to compare your Fund's ongoing expenses (but not transaction costs) with those of other mutual funds using the Fund's actual expense ratio and a hypothetical rate of return of 5% per year before expenses. Examples using a 5% hypothetical Fund return may be found in the shareholder reports of other mutual funds. The hypothetical account values and expenses may not be used to estimate the actual ending account balance or expenses you paid for the period.
Please note that the expenses shown in these tables are meant to highlight your ongoing expenses only and do not reflect any transaction costs. The "Expenses Paid per $1,000" line of the tables is useful in comparing ongoing expenses only and will not help you determine the relative total expense of owning different funds. If these transaction costs had been included, your costs would have been higher.
| Expenses and Value of a $1,000 Investment for the six months ended June 30, 2017 | ||||
| Actual Fund Return | Class A | Class B | ||
| Beginning Account Value 1/1/17 | $ 1,000.00 | $ 1,000.00 | ||
| Ending Account Value 6/30/17 | $ 1,012.20 | $ 1,010.30 | ||
| Expenses Paid per $1,000* | $ 2.99 | $ 4.74 | ||
| Hypothetical 5% Fund Return | Class A | Class B | ||
| Beginning Account Value 1/1/17 | $ 1,000.00 | $ 1,000.00 | ||
| Ending Account Value 6/30/17 | $ 1,021.82 | $ 1,020.08 | ||
| Expenses Paid per $1,000* | $ 3.01 | $ 4.76 | ||
* Expenses are equal to the Fund's annualized expense ratio for each share class, multiplied by the average account value over the period, multiplied by 181 (the number of days in the most recent six-month period), then divided by 365.
| Annualized Expense Ratios | Class A | Class B | ||
| Deutsche Variable Series II — Deutsche Government & Agency Securities VIP | .60% | .95% |
For more information, please refer to the Fund's prospectus.
These tables do not reflect charges and fees ("contract charges") associated with the separate account that invests in the Fund or any variable life insurance policy or variable annuity contract for which the Fund is an investment option.
For an analysis of the fees associated with an investment in the fund or similar funds, please refer to the current and hypothetical expense calculators for Variable Insurance Products which can be found at deutschefunds.com/EN/resources/calculators.jsp.
Proxy Voting
The Trust's policies and procedures for voting proxies for portfolio securities and information about how the Trust voted proxies related to its portfolio securities during the most recent 12-month period ended June 30 are available on our Web site — deutschefunds.com (click on "proxy voting" at the bottom of the page) — or on the SEC's Web site — sec.gov. To obtain a written copy of the Trust's policies and procedures without charge, upon request, call us toll free at (800) 728-3337.
Advisory Agreement Board Considerations and Fee Evaluation
The Board of Trustees (hereinafter referred to as the "Board" or "Trustees") approved the renewal of Deutsche Government & Agency Securities VIP’s (the "Fund") investment management agreement (the "Agreement") with Deutsche Investment Management Americas Inc. ("DIMA") in September 2016.
In terms of the process that the Board followed prior to approving the Agreement, shareholders should know that:
— During the entire process, all of the Fund’s Trustees were independent of DIMA and its affiliates (the "Independent Trustees").
— The Board met frequently during the past year to discuss fund matters and dedicated a substantial amount of time to contract review matters. Over the course of several months, the Board’s Contract Committee reviewed extensive materials received from DIMA, independent third parties and independent counsel. These materials included an analysis of the Fund’s performance, fees and expenses, and profitability from a fee consultant retained by the Fund’s Independent Trustees (the "Fee Consultant"). The Board also received extensive information throughout the year regarding performance of the Fund.
— The Independent Trustees regularly meet privately with counsel to discuss contract review and other matters. In addition, the Independent Trustees were advised by the Fee Consultant in the course of their review of the Fund’s contractual arrangements and considered a comprehensive report prepared by the Fee Consultant in connection with their deliberations.
— In connection with reviewing the Agreement, the Board also reviewed the terms of the Fund’s Rule 12b-1 plan, distribution agreement, administrative services agreement, transfer agency agreement and other material service agreements.
— Based on its evaluation of the information provided, the Contract Committee presented its findings and recommendations to the Board. The Board then reviewed the Contract Committee’s findings and recommendations.
In connection with the contract review process, the Contract Committee and the Board considered the factors discussed below, among others. The Board also considered that DIMA and its predecessors have managed the Fund since its inception, and the Board believes that a long-term relationship with a capable, conscientious advisor is in the best interests of the Fund. The Board considered, generally, that shareholders chose to invest or remain invested in the Fund knowing that DIMA managed the Fund, and that the Agreement was approved by the Fund’s shareholders. DIMA is part of Deutsche Bank AG’s ("Deutsche Bank") Asset Management ("Deutsche AM") division. Deutsche AM is a global asset management business that offers a wide range of investing expertise and resources, including research capabilities in many countries throughout the world. Deutsche Bank has advised the Board that the U.S. asset management business continues to be a critical and integral part of Deutsche Bank, and that Deutsche Bank will continue to invest in Deutsche AM and seek to enhance Deutsche AM’s investment platform. Deutsche Bank also has confirmed its commitment to maintaining strong legal and compliance groups within the Deutsche AM division.
As part of the contract review process, the Board carefully considered the fees and expenses of each Deutsche fund overseen by the Board in light of the fund’s performance. In many cases, this led to the negotiation and implementation of expense caps. As part of these negotiations, the Board indicated that it would consider relaxing these caps in future years following sustained improvements in performance, among other considerations.
While shareholders may focus primarily on fund performance and fees, the Fund’s Board considers these and many other factors, including the quality and integrity of DIMA’s personnel and such other issues as back-office operations, fund valuations, and compliance policies and procedures.
Nature, Quality and Extent of Services. The Board considered the terms of the Agreement, including the scope of advisory services provided under the Agreement. The Board noted that, under the Agreement, DIMA provides portfolio management services to the Fund and that, pursuant to a separate administrative services agreement, DIMA provides administrative services to the Fund. The Board considered the experience and skills of senior management and investment personnel and the resources made available to such personnel. The Board reviewed the Fund’s performance over short-term and long-term periods and compared those returns to various agreed-upon performance measures, including market index(es) and a peer universe compiled using information supplied by Morningstar Direct ("Morningstar"), an independent fund data service. The Board also noted that it has put into place a process of identifying "Focus Funds" (e.g., funds performing poorly relative to a peer universe), and receives additional reporting from DIMA regarding such funds and, where appropriate, DIMA’s plans to address underperformance. The Board believes this process is an effective manner of identifying and addressing underperforming funds. Based on the information provided, the Board noted that for the one-, three- and five-year periods ended December 31, 2015, the Fund’s performance (Class A shares) was in the 4th quartile, 3rd quartile and 2nd quartile, respectively, of the applicable Morningstar universe (the 1st quartile being the best performers and the 4th quartile being the worst performers). The Board also observed that the Fund has underperformed its benchmark in the one-, three- and five-year periods ended December 31, 2015. The Board noted the disappointing investment performance of the Fund in recent periods and continued to discuss with senior management of DIMA the factors contributing to such underperformance and actions being taken to improve performance. The Board recognized the efforts by DIMA in recent years to enhance its investment platform and improve long-term performance across the Deutsche fund complex.
Fees and Expenses. The Board considered the Fund’s investment management fee schedule, operating expenses and total expense ratios, and comparative information provided by Broadridge Financial Solutions, Inc. ("Broadridge") and the Fee Consultant regarding investment management fee rates paid to other investment advisors by similar funds (1st quartile being the most favorable and 4th quartile being the least favorable). With respect to management fees paid to other investment advisors by similar funds, the Board noted that the contractual fee rates paid by the Fund, which include a 0.10% fee paid to DIMA under the Fund’s administrative services agreement, were higher than the median (4th quartile) of the applicable Broadridge peer group (based on Broadridge data provided as of December 31, 2015). The Board noted that the Fund’s Class A shares total (net) operating expenses were expected to be higher than the median (3rd quartile) of the applicable Broadridge expense universe (based on Broadridge data provided as of December 31, 2015, and analyzing Broadridge expense universe Class A (net) expenses less any applicable 12b-1 fees) ("Broadridge Universe Expenses"). The Board also reviewed data comparing each share class’s total (net) operating expenses to the applicable Broadridge Universe Expenses. The Board noted that the expense limitations agreed to by DIMA were expected to help the Fund’s total (net) operating expenses remain competitive. The Board considered the Fund’s management fee rate as compared to fees charged by DIMA to a comparable Deutsche U.S. registered fund ("Deutsche Funds") and considered differences between the Fund and the comparable Deutsche Fund. The information requested by the Board as part of its review of fees and expenses also included information about institutional accounts (including any sub-advised funds and accounts) and funds offered primarily to European investors ("Deutsche Europe funds") managed by Deutsche AM. The Board noted that DIMA indicated that Deutsche AM does not manage any institutional accounts or Deutsche Europe funds comparable to the Fund.
On the basis of the information provided, the Board concluded that management fees were reasonable and appropriate in light of the nature, quality and extent of services provided by DIMA.
Profitability. The Board reviewed detailed information regarding revenues received by DIMA under the Agreement. The Board considered the estimated costs and pre-tax profits realized by DIMA from advising the Deutsche Funds, as well as estimates of the pre-tax profits attributable to managing the Fund in particular. The Board also received information regarding the estimated enterprise-wide profitability of DIMA and its affiliates with respect to all fund services in totality and by fund. The Board and the Fee Consultant reviewed DIMA’s methodology in allocating its costs to the management of the Fund. Based on the information provided, the Board concluded that the pre-tax profits realized by DIMA in connection with the management of the Fund were not unreasonable. The Board also reviewed certain publicly available information regarding the profitability of certain similar investment management firms. The Board noted that while information regarding the profitability of such firms is limited (and in some cases is not necessarily prepared on a comparable basis), DIMA and its affiliates’ overall profitability with respect to the Deutsche Funds (after taking into account distribution and other services provided to the funds by DIMA and its affiliates) was lower than the overall profitability levels of most comparable firms for which such data was available.
Economies of Scale. The Board considered whether there are economies of scale with respect to the management of the Fund and whether the Fund benefits from any economies of scale. The Board noted that the Fund’s investment management fee schedule includes fee breakpoints. The Board concluded that the Fund’s fee schedule represents an appropriate sharing between the Fund and DIMA of such economies of scale as may exist in the management of the Fund at current asset levels.
Other Benefits to DIMA and Its Affiliates. The Board also considered the character and amount of other incidental benefits received by DIMA and its affiliates, including any fees received by DIMA for administrative services provided to the Fund and any fees received by an affiliate of DIMA for distribution services. The Board also considered benefits to DIMA related to brokerage and soft-dollar allocations, including allocating brokerage to pay for research generated by parties other than the executing broker dealers, which pertain primarily to funds investing in equity securities, along with the incidental public relations benefits to DIMA related to Deutsche Funds advertising and cross-selling opportunities among DIMA products and services. The Board considered these benefits in reaching its conclusion that the Fund’s management fees were reasonable.
Compliance. The Board considered the significant attention and resources dedicated by DIMA to documenting and enhancing its compliance processes in recent years. The Board noted in particular (i) the experience, seniority and time commitment of the individuals serving as DIMA’s and the Fund’s chief compliance officers; (ii) the large number of DIMA compliance personnel; and (iii) the substantial commitment of resources by DIMA and its affiliates to compliance matters.
Based on all of the information considered and the conclusions reached, the Board unanimously determined that the continuation of the Agreement is in the best interests of the Fund. In making this determination, the Board did not give particular weight to any single factor identified above. The Board considered these factors over the course of numerous meetings, certain of which were in executive session with only the Independent Trustees and counsel present. It is possible that individual Independent Trustees may have weighed these factors differently in reaching their individual decisions to approve the continuation of the Agreement.
Notes

VS2GAS-3 (R-028384-6 8/17)

June 30, 2017
Semiannual Report
Deutsche Variable Series II
Deutsche Government Money Market VIP

Contents
3 Performance Summary 4 Portfolio Summary 5 Investment Portfolio 7 Statement of Assets and Liabilities 8 Statement of Operations 8 Statements of Changes in Net Assets 9 Financial Highlights 10 Notes to Financial Statements 13 Information About Your Fund's Expenses 14 Other Information 15 Advisory Agreement Board Considerations and Fee Evaluation |
This report must be preceded or accompanied by a prospectus. To obtain an additional prospectus or summary prospectus, if available, call (800) 728-3337 or your financial representative. We advise you to consider the Fund's objectives, risks, charges and expenses carefully before investing. The summary prospectus and prospectus contain this and other important information about the Fund. Please read the prospectus carefully before you invest.
You could lose money by investing in the Fund. Although the Fund seeks to preserve the value of your investment at $1.00 per share, it cannot guarantee it will do so. An investment in the Fund is not insured or guaranteed by the Federal Deposit Insurance Corporation or any other government agency. The Fund's sponsor has no legal obligation to provide financial support to the Fund, and you should not expect that the sponsor will provide financial support to the Fund at any time. You should not rely on or expect the Advisor to enter into support agreements or take other actions to maintain the Fund’s $1.00 share price. The credit quality of the Fund’s holdings can change rapidly in certain markets, and the default of a single holding could have an adverse impact on the Fund’s share price. The Fund’s share price can also be negatively affected during periods of high redemption pressures and/or illiquid markets. The actions of a few large investors in the Fund may have a significant adverse effect on the share price of the Fund. See the prospectus for specific details regarding the Fund’s risk profile.
Deutsche Asset Management represents the asset management activities conducted by Deutsche Bank AG or any of its subsidiaries.
Deutsche AM Distributors, Inc., 222 South Riverside Plaza, Chicago, IL 60606, (800) 621-1148
NOT FDIC/NCUA INSURED NO BANK GUARANTEE MAY LOSE VALUE NOT A DEPOSIT
NOT INSURED BY ANY FEDERAL GOVERNMENT AGENCY
Performance Summary June 30, 2017 (Unaudited)
All performance shown is historical, assumes reinvestment of all dividend and capital gain distributions and does not guarantee future results. Investment return and principal value fluctuate with changing market conditions so that, when redeemed, shares may be worth more or less than their original cost. Current performance may be lower or higher than the performance data quoted. Please contact your participating insurance company for the Fund's most recent month-end performance. Performance doesn't reflect charges and fees ("contract charges") associated with the separate account that invests in the Fund or any variable life insurance policy or variable annuity contract for which the Fund is an investment option. These charges and fees will reduce returns. The yield quotation more closely reflects the current earnings of the Fund than the total return quotation.
You could lose money by investing in the Fund. Although the Fund seeks to preserve the value of your investment at $1.00 per share, it cannot guarantee it will do so. An investment in the Fund is not insured or guaranteed by the Federal Deposit Insurance Corporation or any other government agency. The Fund's sponsor has no legal obligation to provide financial support to the Fund, and you should not expect that the sponsor will provide financial support to the Fund at any time.
| 7-Day Current Yield | |
| June 30, 2017 | .54%* |
| December 31, 2016 | .04%* |
* The investment advisor has agreed to waive fees/reimburse expenses. Without such fee waivers/expense reimbursements, the 7-day current yield would have been lower.
Yields are historical, will fluctuate and do not guarantee future performance. The 7-day current yield refers to the income paid by the Fund over a 7-day period expressed as an annual percentage rate of the Fund's shares outstanding.
Portfolio Summary (Unaudited)
| Asset Allocation (As a % of Investment Portfolio) | 6/30/17 | 12/31/16 |
| Government & Agency Obligations | 79% | 58% |
| Repurchase Agreements | 21% | 42% |
| 100% | 100% |
| Weighted Average Maturity | 6/30/17 | 12/31/16 |
| Deutsche Variable Series II — Deutsche Government Money Market VIP | 26 days | 29 days |
| Government & Agency Retail Money Fund Average* | 31 days | 36 days |
* The Fund is compared to its respective iMoneyNet Category: Government & Agency Retail Money Fund Average — Category includes the most broadly based of the government retail funds. These funds may invest in U.S. Treasury securities, securities issued or guaranteed by the U.S. Government or its agencies or instrumentalities.
Weighted average maturity, also known as effective maturity, is the weighted average of the maturity date of bonds held by the Fund taking into consideration any available maturity shortening features.
Portfolio holdings and characteristics are subject to change.
For more complete details about the Fund's investment portfolio, see page 5.
Following the Fund's fiscal first and third quarter-end, a complete portfolio holdings listing is filed with the SEC on Form N-Q. In addition, each month, information about the Fund and its portfolio holdings is filed with the SEC on Form N-MFP. The SEC delays the public availability of the information filed on Form N-MFP for 60 days after the end of the reporting period included in the filing. These forms will be available on the SEC's Web site at sec.gov, and they may also be reviewed and copied at the SEC's Public Reference Room in Washington, D.C. Information on the operation of the SEC's Public Reference Room may be obtained by calling (800) SEC-0330. The Fund's portfolio holdings are also posted on deutschefunds.com from time to time. Please see the Fund's current prospectus for more information.
Portfolio Management Team
A group of investment professionals is responsible for the day-to-day management of the fund. These investment professionals have a broad range of experience managing money market funds.
Investment Portfolio June 30, 2017 (Unaudited)
| Principal Amount ($) | Value ($) | ||
| Government & Agency Obligations 78.3% | |||
| U.S. Government Sponsored Agencies 39.5% | |||
| Federal Farm Credit Bank: | |||
| 0.75%**, 10/5/2017 | 1,500,000 | 1,497,040 | |
| 0.88%*, 3/2/2018 | 1,000,000 | 1,000,000 | |
| 1.101%*, 7/23/2018 | 1,500,000 | 1,499,933 | |
| 1.147%*, 7/20/2018 | 1,200,000 | 1,200,000 | |
| 1.157%*, 1/10/2019 | 500,000 | 500,540 | |
| 1.264%*, 8/29/2017 | 2,000,000 | 2,000,252 | |
| 1.283%*, 11/13/2018 | 1,500,000 | 1,500,000 | |
| 1.324%*, 9/21/2017 | 500,000 | 500,000 | |
| Federal Home Loan Bank: | |||
| 0.76%**, 11/2/2017 | 500,000 | 498,708 | |
| 0.8%*, 2/9/2018 | 2,000,000 | 2,000,000 | |
| 0.88%*, 2/2/2018 | 1,500,000 | 1,500,000 | |
| 0.881%*, 2/1/2018 | 3,000,000 | 3,000,000 | |
| 0.881%*, 2/1/2018 | 1,500,000 | 1,500,000 | |
| 0.909%*, 8/14/2017 | 1,250,000 | 1,250,000 | |
| 0.929%*, 2/8/2018 | 1,000,000 | 999,968 | |
| 0.953%**, 10/31/2017 | 800,000 | 797,451 | |
| 0.968%**, 10/13/2017 | 1,200,000 | 1,196,689 | |
| 0.968%**, 10/20/2017 | 2,000,000 | 1,994,111 | |
| 0.986%*, 8/22/2017 | 1,000,000 | 999,987 | |
| 0.994%*, 7/18/2017 | 1,000,000 | 1,000,000 | |
| 1.004%**, 10/20/2017 | 650,000 | 648,016 | |
| 1.042%*, 5/30/2018 | 1,000,000 | 1,000,000 | |
| 1.049%**, 9/15/2017 | 1,000,000 | 997,815 | |
| 1.051%*, 1/23/2018 | 1,000,000 | 999,999 | |
| 1.053%**, 11/17/2017 | 1,000,000 | 995,988 | |
| 1.064%*, 3/8/2018 | 750,000 | 750,000 | |
| 1.095%**, 10/27/2017 | 1,000,000 | 996,460 | |
| Federal Home Loan Mortgage Corp.: | |||
| 0.7%**, 10/2/2017 | 1,500,000 | 1,497,326 | |
| 0.862%**, 8/24/2017 | 1,250,000 | 1,248,406 | |
| 0.862%**, 8/24/2017 | 1,750,000 | 1,747,769 | |
| 0.905%*, 8/10/2018 | 500,000 | 500,000 | |
| 0.905%*, 10/10/2018 | 1,000,000 | 1,000,000 | |
| 0.937%*, 12/22/2017 | 750,000 | 750,000 | |
| 0.972%*, 2/22/2018 | 1,000,000 | 1,000,000 | |
| 1.014%**, 10/23/2017 | 1,500,000 | 1,495,250 | |
| 1.2%*, 12/21/2017 | 4,500,000 | 4,500,000 | |
| Principal Amount ($) | Value ($) | ||
| Federal National Mortgage Association, 1.128%*, 1/11/2018 | 1,500,000 | 1,502,543 | |
| Financing Corp., 0.794%**, 10/6/2017 | 1,816,000 | 1,812,166 | |
| 49,876,417 | |||
| U.S. Treasury Obligations 38.8% | |||
| U.S. Treasury Bills: | |||
| 0.671%**, 8/24/2017 | 1,000,000 | 999,007 | |
| 1.029%**, 11/9/2017 | 500,000 | 498,153 | |
| U.S. Treasury Floating Rate Notes: | |||
| 1.073%*, 4/30/2019 | 1,000,000 | 1,000,344 | |
| 1.08%*, 7/31/2017 | 35,000,000 | 35,003,787 | |
| 1.173%*, 10/31/2018 | 1,500,000 | 1,503,523 | |
| 1.193%*, 4/30/2018 | 2,500,000 | 2,500,052 | |
| 1.275%*, 1/31/2018 | 5,000,000 | 5,004,937 | |
| U.S. Treasury Notes: | |||
| 0.875%, 8/15/2017 | 1,250,000 | 1,250,372 | |
| 0.875%, 10/15/2017 | 1,200,000 | 1,199,852 | |
| 48,960,027 | |||
| Total Government & Agency Obligations (Cost $98,836,444) | 98,836,444 | ||
| Repurchase Agreements 20.8% | |||
| Nomura Securities International, 1.13%, dated 6/30/2017, to be repurchased at $20,001,883 on 7/3/2017 (a) | 20,000,000 | 20,000,000 | |
| Wells Fargo Bank, 1.1%, dated 6/30/2017, to be repurchased at $6,300,578 on 7/3/2017 (b) | 6,300,000 | 6,300,000 | |
| Total Repurchase Agreements (Cost $26,300,000) | 26,300,000 | ||
| % of Net Assets | Value ($) | |
| Total Investment Portfolio (Cost $125,136,444)† | 99.1 | 125,136,444 |
| Other Assets and Liabilities, Net | 0.9 | 1,159,968 |
| Net Assets | 100.0 | 126,296,412 |
* Floating rate securities' yields vary with a designated market index or market rate, such as the coupon-equivalent of the U.S. Treasury Bill rate. These securities are shown at their current rate as of June 30, 2017.
** Annualized yield at time of purchase; not a coupon rate.
† The cost for federal income tax purposes was $125,136,444.
(a) Collateralized by:
| Principal Amount ($) | Security | Rate (%) | Maturity Date | Collateral Value ($) |
| 29,321 | Federal Home Loan Mortgage Corp. | 5.0–7.5 | 12/1/2017–1/1/2025 | 29,861 |
| 19,733,053 | Federal National Mortgage Association | 2.5–4.0 | 7/1/2027–5/1/2047 | 20,370,139 |
| Total Collateral Value | 20,400,000 | |||
(b) Collateralized by $6,225,301 Federal National Mortgage Association, 3.5%, maturing on 5/1/2047 with a value of $6,426,001.
Fair Value Measurements
Various inputs are used in determining the value of the Fund's investments. These inputs are summarized in three broad levels. Level 1 includes quoted prices in active markets for identical securities. Level 2 includes other significant observable inputs (including quoted prices for similar securities, interest rates, prepayment speeds and credit risk). Level 3 includes significant unobservable inputs (including the Fund's own assumptions in determining the fair value of investments). The level assigned to the securities valuations may not be an indication of the risk or liquidity associated with investing in those securities. Securities held by the Fund are reflected as Level 2 because the securities are valued at amortized cost (which approximates fair value) and, accordingly, the inputs used to determine value are not quoted prices in an active market.
The following is a summary of the inputs used as of June 30, 2017 in valuing the Fund's investments. For information on the Fund's policy regarding the valuation of investments, please refer to the Security Valuation section of Note A in the accompanying Notes to Financial Statements.
| Assets | Level 1 | Level 2 | Level 3 | Total |
| Investments in Securities (c) | $ — | $ 98,836,444 | $ — | $ 98,836,444 |
| Repurchase Agreements | — | 26,300,000 | — | 26,300,000 |
| Total | $ — | $ 125,136,444 | $ — | $ 125,136,444 |
There have been no transfers between fair value measurement levels during the period ended June 30, 2017.
(c) See Investment Portfolio for additional detailed categorizations.
The accompanying notes are an integral part of the financial statements.
Statement of Assets and Liabilities
| as of June 30, 2017 (Unaudited) | |
| Assets | |
Investments: Investments in securities, valued at amortized cost | $ 98,836,444 |
| Repurchase agreements, valued at amortized cost | 26,300,000 |
| Total investments in securities, valued at amortized cost | 125,136,444 |
| Cash | 28,007 |
| Receivable for Fund shares sold | 1,235,305 |
| Interest receivable | 112,400 |
| Other assets | 1,098 |
| Total assets | 126,513,254 |
| Liabilities | |
| Payable for Fund shares redeemed | 18,837 |
| Distributions payable | 29,085 |
| Accrued management fee | 25,688 |
| Accrued Trustees' fees | 382 |
| Other accrued expenses and payables | 142,850 |
| Total liabilities | 216,842 |
| Net assets, at value | $ 126,296,412 |
| Net Assets Consist of | |
| Undistributed net investment income | 14,910 |
| Paid-in capital | 126,281,502 |
| Net assets, at value | $ 126,296,412 |
Class A Net Asset Value, offering and redemption price per share ($126,296,412 ÷ 126,365,218 outstanding shares of beneficial interest, no par value, unlimited number of shares authorized) | $ 1.00 |
The accompanying notes are an integral part of the financial statements.
Statement of Operations
| for the six months ended June 30, 2017 (Unaudited) | |
| Investment Income | |
Income: Interest | $ 466,496 |
Expenses: Management fee | 143,806 |
| Administration fee | 61,194 |
| Services to shareholders | 1,600 |
| Custodian fee | 5,779 |
| Professional fees | 26,902 |
| Reports to shareholders | 48,425 |
| Trustees' fee and expenses | 3,830 |
| Other | 5,556 |
| Total expenses | 297,092 |
| Net investment income | 169,404 |
| Net increase (decrease) in net assets resulting from operations | $ 169,404 |
The accompanying notes are an integral part of the financial statements.
Statements of Changes in Net Assets
| Increase (Decrease) in Net Assets | Six Months Ended June 30, 2017 (Unaudited) | Year Ended December 31, 2016 | |
Operations: Net investment income | $ 169,404 | $ 63,700 | |
| Net realized gain (loss) | — | 14,243 | |
| Net increase (decrease) in net assets resulting from operations | 169,404 | 77,943 | |
Distributions to shareholders from: Net investment income Class A | (169,409) | (63,706) | |
Fund share transactions: Class A Proceeds from shares sold | 49,908,664 | 122,352,015 | |
| Reinvestment of distributions | 142,353 | 62,278 | |
| Cost of shares redeemed | (46,160,284) | (134,243,063) | |
| Net increase (decrease) in net assets from Class A share transactions | 3,890,733 | (11,828,770) | |
| Increase (decrease) in net assets | 3,890,728 | (11,814,533) | |
| Net assets at beginning of period | 122,405,684 | 134,220,217 | |
| Net assets at end of period (including undistributed net investment income of $14,910 and $14,915, respectively) | $ 126,296,412 | $ 122,405,684 | |
| Other Information | |||
Class A Shares outstanding at beginning of period | 122,474,485 | 134,303,255 | |
| Shares sold | 49,908,664 | 122,352,015 | |
| Shares issued to shareholders in reinvestment of distributions | 142,353 | 62,278 | |
| Shares redeemed | (46,160,284) | (134,243,063) | |
| Net increase (decrease) in Class A shares | 3,890,733 | (11,828,770) | |
| Shares outstanding at end of period | 126,365,218 | 122,474,485 | |
The accompanying notes are an integral part of the financial statements.
Financial Highlights
| Class A | Six Months Ended 6/30/17 (Unaudited) | Years Ended December 31, | |||||
| 2016 | 2015 | 2014 | 2013 | 2012 | |||
| Selected Per Share Data | |||||||
| Net asset value, beginning of period | $ 1.00 | $ 1.00 | $ 1.00 | $ 1.00 | $ 1.00 | $ 1.00 | |
Income from investment operations: Net investment income | .001 | .001b | .000*** | .000*** | .000*** | .000*** | |
| Net realized gain (loss) | — | .000*** | (.000)*** | .000*** | .000*** | .000*** | |
| Total from investment operations | .001 | .001 | .000*** | .000*** | .000*** | .000*** | |
Less distributions from: Net investment income | (.001) | (.001) | (.000)*** | (.000)*** | (.000)*** | (.000)*** | |
| Net asset value, end of period | $ 1.00 | $ 1.00 | $ 1.00 | $ 1.00 | $ 1.00 | $ 1.00 | |
| Total Return (%) | .13** | .05a,b | .01a | .01a | .01a | .01a | |
| Ratios to Average Net Assets and Supplemental Data | |||||||
| Net assets, end of period ($ millions) | 126 | 122 | 134 | 177 | 174 | 196 | |
| Ratio of expenses before expense reductions (%)c | .49* | .51 | .49 | .49 | .49 | .45 | |
| Ratio of expenses after expense reductions (%)c | .49* | .44 | .25 | .18 | .20 | .31 | |
| Ratio of net investment income (%) | .28* | .05b | .01 | .01 | .01 | .01 | |
a Total return would have been lower had certain expenses not been reduced. b Includes a non-recurring payment for overbilling of prior years' custodian out-of-pocket fees. Excluding this payment, net investment income per share, total return, and ratio of net investment income to average net assets would have been reduced by $0.0004, 0.04%, and 0.04%, respectively. c Expense ratio does not reflect charges and fees associated with the separate account that invests in the Fund or any variable life insurance policy or variable annuity contract for which the Fund is an investment option. * Annualized ** Not annualized *** Amount is less than $.0005. | |||||||
Notes to Financial Statements (Unaudited)
A. Organization and Significant Accounting Policies
Deutsche Government Money Market VIP (the "Fund") is a diversified series of Deutsche Variable Series II (the "Trust"), which is registered under the Investment Company Act of 1940, as amended (the "1940 Act"), as an open-end management investment company organized as a Massachusetts business trust.
The Fund's financial statements are prepared in accordance with accounting principles generally accepted in the United States of America ("U.S. GAAP") which require the use of management estimates. Actual results could differ from those estimates. The Fund qualifies as an investment company under Topic 946 of Accounting Standards Codification of U.S. GAAP. The policies described below are followed consistently by the Fund in the preparation of its financial statements.
Security Valuation. Various inputs are used in determining the value of the Fund's investments. These inputs are summarized in three broad levels. Level 1 includes quoted prices in active markets for identical securities. Level 2 includes other significant observable inputs (including quoted prices for similar securities, interest rates, prepayment speeds and credit risk). Level 3 includes significant unobservable inputs (including the Fund's own assumptions in determining the fair value of investments). The level assigned to the securities valuations may not be an indication of the risk or liquidity associated with investing in those securities.
The Fund values all securities utilizing the amortized cost method permitted in accordance with Rule 2a-7 under the 1940 Act and certain conditions therein. Under this method, which does not take into account unrealized capital gains or losses on securities, an instrument is initially valued at its cost and thereafter assumes a constant accretion/amortization rate to maturity of any discount or premium. Securities held by the Fund are reflected as Level 2 because the securities are valued at amortized cost (which approximates fair value) and, accordingly, the inputs used to determine value are not quoted prices in an active market.
Disclosure about the classification of fair value measurements is included in a table following the Fund's Investment Portfolio.
Repurchase Agreements. The Fund may enter into repurchase agreements, under the terms of a Master Repurchase Agreement, with certain banks and broker/dealers whereby the Fund, through its custodian or a sub-custodian bank, receives delivery of the underlying securities, the amount of which at the time of purchase and each subsequent business day is required to be maintained at such a level that the value is equal to at least the principal amount of the repurchase price plus accrued interest. The custodian bank or another designated sub-custodian holds the collateral in a separate account until the agreement matures. If the value of the securities falls below the principal amount of the repurchase agreement plus accrued interest, the financial institution deposits additional collateral by the following business day. If the financial institution either fails to deposit the required additional collateral or fails to repurchase the securities as agreed, the Fund has the right to sell the securities and recover any resulting loss from the financial institution. If the financial institution enters into bankruptcy, the Fund's claim on the collateral may be subject to legal proceedings.
As of June 30, 2017, the Fund held repurchase agreements with a gross value of $26,300,000. The value of the related collateral exceeded the value of the repurchase agreements at period end. The detail of the related collateral is included in the footnotes following the Fund's Investment Portfolio.
Federal Income Taxes. The Fund's policy is to comply with the requirements of the Internal Revenue Code, as amended, which are applicable to regulated investment companies and to distribute all of its taxable income to its shareholders.
The Fund has reviewed the tax positions for the open tax years as of December 31, 2016 and has determined that no provision for income tax and/or uncertain tax provisions is required in the Fund's financial statements. The Fund's federal tax returns for the prior three fiscal years remain open subject to examination by the Internal Revenue Service.
Distribution of Income and Gains. Net investment income of the Fund is declared as a daily dividend and is distributed to shareholders monthly. The Fund may take into account capital gains and losses in its daily dividend declarations. The Fund may also make additional distributions for tax purposes if necessary.
Permanent book and tax differences relating to shareholder distributions will result in reclassifications to paid-in capital. Temporary book and tax differences will reverse in a subsequent period. There were no significant book to tax differences for the Fund.
The tax character of current year distributions will be determined at the end of the current fiscal year.
Expenses. Expenses of the Trust arising in connection with a specific fund are allocated to that fund. Other Trust expenses which cannot be directly attributed to a fund are apportioned among the funds in the Trust based upon the relative net assets or other appropriate measures.
Contingencies. In the normal course of business, the Fund may enter into contracts with service providers that contain general indemnification clauses. The Fund's maximum exposure under these arrangements is unknown, as this would involve future claims that may be made against the Fund that have not yet been made. However, based on experience, the Fund expects the risk of loss to be remote.
Other. Investment transactions are accounted for on a trade date. Interest income is recorded on the accrual basis. Realized gains and losses from investment transactions are recorded on an identified cost basis. All discounts and premiums are accreted/amortized for both tax and financial reporting purposes.
B. Related Parties
Management Agreement. Under the Investment Management Agreement with Deutsche Investment Management Americas Inc. ("DIMA" or the "Advisor"), an indirect, wholly owned subsidiary of Deutsche Bank AG, the Advisor directs the investments of the Fund in accordance with its investment objectives, policies and restrictions. The Advisor determines the securities, instruments and other contracts relating to investments to be purchased, sold or entered into by the Fund.
Pursuant to the Investment Management Agreement with the Advisor, the Fund pays the Advisor a monthly management fee based on its average daily net assets, computed and accrued daily and payable monthly, at the following annual rates:
| First $500 million | .235% |
| Next $500 million | .220% |
| Next $1.0 billion | .205% |
| Over $2.0 billion | .190% |
For the period from January 1, 2017 through September 30, 2017, the Advisor has contractually agreed to waive its fee and/or reimburse certain operating expenses to the extent necessary to maintain the total annual operating expenses (excluding certain expenses such as extraordinary expenses, taxes, brokerage and interest expense) at 0.51%.
Accordingly, for the six months ended June 30, 2017, the fee pursuant to the Investment Management Agreement aggregated $143,806, of which $25,688 is unpaid, resulting in an annualized effective rate of 0.235% of the Fund's average daily net assets.
Administration Fee. Pursuant to an Administrative Services Agreement, DIMA provides most administrative services to the Fund. For all services provided under the Administrative Services Agreement, the Fund pays DIMA an annual fee ("Administration Fee") of 0.10% of the Fund's average daily net assets, computed and accrued daily and payable monthly. For the six months ended June 30, 2017, the Administration Fee was $61,194, of which $10,931 is unpaid.
Service Provider Fees. Deutsche AM Service Company ("DSC"), an affiliate of the Advisor, is the transfer agent, dividend-paying agent and shareholder service agent for the Fund. Pursuant to a sub-transfer agency agreement between DSC and DST Systems, Inc. ("DST"), DSC has delegated certain transfer agent, dividend-paying agent and shareholder service agent functions to DST. DSC compensates DST out of the shareholder servicing fee it receives from the Fund. For the six months ended June 30, 2017, the amounts charged to the Fund by DSC aggregated $1,316, of which $723 is unpaid.
Typesetting and Filing Service Fees. Under an agreement with DIMA, DIMA is compensated for providing typesetting and certain regulatory filing services to the Fund. For the six months ended June 30, 2017, the amount charged to the Fund by DIMA included in the Statement of Operations under "Reports to shareholders" aggregated $5,286, all of which is unpaid.
Trustees' Fees and Expenses. The Fund paid retainer fees to each Trustee not affiliated with the Advisor, plus specified amounts to the Board Chairperson and Vice Chairperson and to each committee Chairperson.
C. Ownership of the Fund
At June 30, 2017, three participating insurance companies were owners of record of 10% or more of the total outstanding Class A shares of the Fund, each owning 53%, 18% and 14%.
D. Line of Credit
The Fund and other affiliated funds (the "Participants") share in a $400 million revolving credit facility provided by a syndication of banks. The Fund may borrow for temporary or emergency purposes, including the meeting of redemption requests that otherwise might require the untimely disposition of securities. The Participants are charged an annual commitment fee which is allocated based on net assets, among each of the Participants. Interest is calculated at a rate per annum equal to the sum of the Federal Funds Rate, plus 1.25 percent plus if the one-month LIBOR exceeds the Federal Funds Rate, the amount of such excess. The Fund may borrow up to a maximum of 33 percent of its net assets under the agreement. The Fund had no outstanding loans at June 30, 2017.
Information About Your Fund's Expenses (Unaudited)
As an investor of the Fund, you incur two types of costs: ongoing expenses and transaction costs. Ongoing expenses include management fees and other Fund expenses. Examples of transaction costs include contract charges, which are not shown in this section. The following tables are intended to help you understand your ongoing expenses (in dollars) of investing in the Fund and to help you compare these expenses with the ongoing expenses of investing in other mutual funds. In the most recent six-month period the Fund limited these expenses; had it not done so, expenses would have been higher. The example in the table is based on an investment of $1,000 invested at the beginning of the six-month period and held for the entire period (January 1, 2017 to June 30, 2017).
The tables illustrate your Fund's expenses in two ways:
— Actual Fund Return. This helps you estimate the actual dollar amount of ongoing expenses (but not transaction costs) paid on a $1,000 investment in the Fund using the Fund's actual return during the period. To estimate the expenses you paid over the period, simply divide your account value by $1,000 (for example, an $8,600 account value divided by $1,000 = 8.6), then multiply the result by the number in the "Expenses Paid per $1,000" line under the share class you hold.
— Hypothetical 5% Fund Return. This helps you to compare your Fund's ongoing expenses (but not transaction costs) with those of other mutual funds using the Fund's actual expense ratio and a hypothetical rate of return of 5% per year before expenses. Examples using a 5% hypothetical Fund return may be found in the shareholder reports of other mutual funds. The hypothetical account values and expenses may not be used to estimate the actual ending account balance or expenses you paid for the period.
Please note that the expenses shown in these tables are meant to highlight your ongoing expenses only and do not reflect any transaction costs. The "Expenses Paid per $1,000" line of the tables is useful in comparing ongoing expenses only and will not help you determine the relative total expense of owning different funds. If these transaction costs had been included, your costs would have been higher.
| Expenses and Value of a $1,000 Investment for the six months ended June 30, 2017 | ||
| Actual Fund Return | Class A | |
| Beginning Account Value 1/1/17 | $ 1,000.00 | |
| Ending Account Value 6/30/17 | $ 1,001.30 | |
| Expenses Paid per $1,000* | $ 2.43 | |
| Hypothetical 5% Fund Return | Class A | |
| Beginning Account Value 1/1/17 | $ 1,000.00 | |
| Ending Account Value 6/30/17 | $ 1,022.36 | |
| Expenses Paid per $1,000* | $ 2.46 | |
* Expenses are equal to the Fund's annualized expense ratio, multiplied by the average account value over the period, multiplied by 181 (the number of days in the most recent six-month period), then divided by 365.
| Annualized Expense Ratio | Class A | |
| Deutsche Variable Series II — Deutsche Government Money Market VIP | .49% |
For more information, please refer to the Fund's prospectus.
These tables do not reflect charges and fees ("contract charges") associated with the separate account that invests in the Fund or any variable life insurance policy or variable annuity contract for which the Fund is an investment option.
For an analysis of the fees associated with an investment in the fund or similar funds, please refer to the current and hypothetical expense calculators for Variable Insurance Products which can be found at deutschefunds.com/EN/resources/calculators.jsp.
Other Information
Proxy Voting
The Trust's policies and procedures for voting proxies for portfolio securities and information about how the Trust voted proxies related to its portfolio securities during the most recent 12-month period ended June 30 are available on our Web site — deutschefunds.com (click on "proxy voting" at the bottom of the page) — or on the SEC's Web site — sec.gov. To obtain a written copy of the Trust's policies and procedures without charge, upon request, call us toll free at (800) 728-3337.
Advisory Agreement Board Considerations and Fee Evaluation
The Board of Trustees (hereinafter referred to as the "Board" or "Trustees") approved the renewal of Deutsche Government Money Market VIP’s (the "Fund") investment management agreement (the "Agreement") with Deutsche Investment Management Americas Inc. ("DIMA") in September 2016.
In terms of the process that the Board followed prior to approving the Agreement, shareholders should know that:
— During the entire process, all of the Fund’s Trustees were independent of DIMA and its affiliates (the "Independent Trustees").
— The Board met frequently during the past year to discuss fund matters and dedicated a substantial amount of time to contract review matters. Over the course of several months, the Board’s Contract Committee reviewed extensive materials received from DIMA, independent third parties and independent counsel. These materials included an analysis of the Fund’s performance, fees and expenses, and profitability from a fee consultant retained by the Fund’s Independent Trustees (the "Fee Consultant"). The Board also received extensive information throughout the year regarding performance of the Fund.
— The Independent Trustees regularly meet privately with counsel to discuss contract review and other matters. In addition, the Independent Trustees were advised by the Fee Consultant in the course of their review of the Fund’s contractual arrangements and considered a comprehensive report prepared by the Fee Consultant in connection with their deliberations.
— In connection with reviewing the Agreement, the Board also reviewed the terms of the Fund’s distribution agreement, administrative services agreement, transfer agency agreement and other material service agreements.
— Based on its evaluation of the information provided, the Contract Committee presented its findings and recommendations to the Board. The Board then reviewed the Contract Committee’s findings and recommendations.
In connection with the contract review process, the Contract Committee and the Board considered the factors discussed below, among others. The Board also considered that DIMA and its predecessors have managed the Fund since its inception, and the Board believes that a long-term relationship with a capable, conscientious advisor is in the best interests of the Fund. The Board considered, generally, that shareholders chose to invest or remain invested in the Fund knowing that DIMA managed the Fund, and that the Agreement was approved by the Fund’s shareholders. DIMA is part of Deutsche Bank AG’s ("Deutsche Bank") Asset Management ("Deutsche AM") division. Deutsche AM is a global asset management business that offers a wide range of investing expertise and resources, including research capabilities in many countries throughout the world. Deutsche Bank has advised the Board that the U.S. asset management business continues to be a critical and integral part of Deutsche Bank, and that Deutsche Bank will continue to invest in Deutsche AM and seek to enhance Deutsche AM’s investment platform. Deutsche Bank also has confirmed its commitment to maintaining strong legal and compliance groups within the Deutsche AM division.
As part of the contract review process, the Board carefully considered the fees and expenses of each Deutsche fund overseen by the Board in light of the fund’s performance. In many cases, this led to the negotiation and implementation of expense caps. As part of these negotiations, the Board indicated that it would consider relaxing these caps in future years following sustained improvements in performance, among other considerations.
While shareholders may focus primarily on fund performance and fees, the Fund’s Board considers these and many other factors, including the quality and integrity of DIMA’s personnel and such other issues as back-office operations, fund valuations, and compliance policies and procedures.
Nature, Quality and Extent of Services. The Board considered the terms of the Agreement, including the scope of advisory services provided under the Agreement. The Board noted that, under the Agreement, DIMA provides portfolio management services to the Fund and that, pursuant to a separate administrative services agreement, DIMA provides administrative services to the Fund. The Board considered the experience and skills of senior management and investment personnel and the resources made available to such personnel. The Board reviewed the Fund’s performance over short-term and long-term periods and compared those returns to various agreed-upon performance measures, including a peer universe compiled using information supplied by iMoneyNet, an independent fund data service. The Board also noted that it has put into place a process of identifying "Focus Funds" (e.g., funds performing poorly relative to a peer universe), and receives additional reporting from DIMA regarding such funds and, where appropriate, DIMA’s plans to address underperformance. The Board believes this process is an effective manner of identifying and addressing underperforming funds. Based on the information provided, the Board noted that for the one- and three-year periods ended December 31, 2015, the Fund’s gross performance (Class A shares) was in the 1st quartile and 2nd quartile, respectively, of the applicable iMoneyNet universe (the 1st quartile being the best performers and the 4th quartile being the worst performers). The Board noted that the Fund’s strategy was changed during the year in order to permit the Fund to operate as a "government money market fund" under applicable Securities and Exchange Commission rules.
Fees and Expenses. The Board considered the Fund’s investment management fee schedule, operating expenses and total expense ratios, and comparative information provided by Broadridge Financial Solutions, Inc. ("Broadridge") and the Fee Consultant regarding investment management fee rates paid to other investment advisors by similar funds (1st quartile being the most favorable and 4th quartile being the least favorable). With respect to management fees paid to other investment advisors by similar funds, the Board noted that the contractual fee rates paid by the Fund, which include a 0.10% fee paid to DIMA under the Fund’s administrative services agreement, were lower than the median (2nd quartile) of the applicable Broadridge peer group (based on Broadridge data provided as of December 31, 2015). The Board considered that the Fund’s management fee was reduced by 0.05% at all breakpoint levels in connection with the restructuring of the Fund into a government money market fund. The Board noted that the Fund’s Class A shares total (net) operating expenses were higher than the median (4th quartile) of the applicable Broadridge expense universe (based on Broadridge data provided as of December 31, 2015, and analyzing Broadridge expense universe Class A (net) expenses less any applicable 12b-1 fees) ("Broadridge Universe Expenses"). The Board noted the expense limitation agreed to by DIMA. The Board also noted the significant voluntary fee waivers implemented by DIMA to ensure the Fund maintained a positive yield. The Board considered the Fund’s management fee rate as compared to fees charged by DIMA to comparable Deutsche U.S. registered funds ("Deutsche Funds") and considered differences between the Fund and the comparable Deutsche Funds. The information requested by the Board as part of its review of fees and expenses also included information about institutional accounts (including any sub-advised funds and accounts) and funds offered primarily to European investors ("Deutsche Europe funds") managed by Deutsche AM. The Board noted that DIMA indicated that Deutsche AM does not manage any institutional accounts or Deutsche Europe funds comparable to the Fund.
On the basis of the information provided, the Board concluded that management fees were reasonable and appropriate in light of the nature, quality and extent of services provided by DIMA.
Profitability. The Board reviewed detailed information regarding revenues received by DIMA under the Agreement. The Board considered the estimated costs and pre-tax profits realized by DIMA from advising the Deutsche Funds, as well as estimates of the pre-tax profits attributable to managing the Fund in particular. The Board also received information regarding the estimated enterprise-wide profitability of DIMA and its affiliates with respect to all fund services in totality and by fund. The Board and the Fee Consultant reviewed DIMA’s methodology in allocating its costs to the management of the Fund. Based on the information provided, the Board concluded that the pre-tax profits realized by DIMA in connection with the management of the Fund were not unreasonable. The Board also reviewed certain publicly available information regarding the profitability of certain similar investment management firms. The Board noted that while information regarding the profitability of such firms is limited (and in some cases is not necessarily prepared on a comparable basis), DIMA and its affiliates’ overall profitability with respect to the Deutsche Funds (after taking into account distribution and other services provided to the funds by DIMA and its affiliates) was lower than the overall profitability levels of most comparable firms for which such data was available.
Economies of Scale. The Board considered whether there are economies of scale with respect to the management of the Fund and whether the Fund benefits from any economies of scale. The Board noted that the Fund’s investment management fee schedule includes fee breakpoints. The Board concluded that the Fund’s fee schedule represents an appropriate sharing between the Fund and DIMA of such economies of scale as may exist in the management of the Fund at current asset levels.
Other Benefits to DIMA and Its Affiliates. The Board also considered the character and amount of other incidental benefits received by DIMA and its affiliates, including any fees received by DIMA for administrative services provided to the Fund. The Board also considered benefits to DIMA related to brokerage and soft-dollar allocations, including allocating brokerage to pay for research generated by parties other than the executing broker dealers, which pertain primarily to funds investing in equity securities, along with the incidental public relations benefits to DIMA related to Deutsche Funds advertising and cross-selling opportunities among DIMA products and services. The Board considered these benefits in reaching its conclusion that the Fund’s management fees were reasonable.
Compliance. The Board considered the significant attention and resources dedicated by DIMA to documenting and enhancing its compliance processes in recent years. The Board noted in particular (i) the experience, seniority and time commitment of the individuals serving as DIMA’s and the Fund’s chief compliance officers; (ii) the large number of DIMA compliance personnel; and (iii) the substantial commitment of resources by DIMA and its affiliates to compliance matters.
Based on all of the information considered and the conclusions reached, the Board unanimously determined that the continuation of the Agreement is in the best interests of the Fund. In making this determination, the Board did not give particular weight to any single factor identified above. The Board considered these factors over the course of numerous meetings, certain of which were in executive session with only the Independent Trustees and counsel present. It is possible that individual Independent Trustees may have weighed these factors differently in reaching their individual decisions to approve the continuation of the Agreement.
Notes

VS2GMM-3 (R-028387-6 8/17)

June 30, 2017
Semiannual Report
Deutsche Variable Series II
Deutsche High Income VIP

Contents
3 Performance Summary 4 Portfolio Summary 4 Portfolio Management Team 5 Investment Portfolio 15 Statement of Assets and Liabilities 16 Statement of Operations 17 Statements of Changes in Net Assets 18 Financial Highlights 19 Notes to Financial Statements 26 Information About Your Fund's Expenses 27 Proxy Voting 28 Advisory Agreement Board Considerations and Fee Evaluation |
This report must be preceded or accompanied by a prospectus. To obtain an additional prospectus or summary prospectus, if available, call (800) 728-3337 or your financial representative. We advise you to consider the Fund's objectives, risks, charges and expenses carefully before investing. The summary prospectus and prospectus contain this and other important information about the Fund. Please read the prospectus carefully before you invest.
Bond investments are subject to interest-rate, credit, liquidity and market risks to varying degrees. When interest rates rise, bond prices generally fall. Credit risk refers to the ability of an issuer to make timely payments of principal and interest. Investments in lower-quality ("junk bonds") and non-rated securities present greater risk of loss than investments in higher-quality securities. Investing in derivatives entails special risks relating to liquidity, leverage and credit that may reduce returns and/or increase volatility. The Fund may lend securities to approved institutions. See the prospectus for details.
Deutsche Asset Management represents the asset management activities conducted by Deutsche Bank AG or any of its subsidiaries.
Deutsche AM Distributors, Inc., 222 South Riverside Plaza, Chicago, IL 60606, (800) 621-1148
NOT FDIC/NCUA INSURED NO BANK GUARANTEE MAY LOSE VALUE NOT A DEPOSIT
NOT INSURED BY ANY FEDERAL GOVERNMENT AGENCY
Performance Summary June 30, 2017 (Unaudited)
Fund performance shown is historical, assumes reinvestment of all dividend and capital gain distributions and does not guarantee future results. Investment return and principal value fluctuate with changing market conditions so that, when redeemed, shares may be worth more or less than their original cost. Current performance may be lower or higher than the performance data quoted. Please contact your participating insurance company for the Fund's most recent month-end performance. Performance doesn't reflect charges and fees ("contract charges") associated with the separate account that invests in the Fund or any variable life insurance policy or variable annuity contract for which the Fund is an investment option. These charges and fees will reduce returns. While all share classes have the same underlying portfolio, their performance will differ.
The gross expense ratios of the Fund, as stated in the fee table of the prospectus dated May 1, 2017 are 0.80% and 1.21% for Class A and Class B shares, respectively, and may differ from the expense ratios disclosed in the Financial Highlights tables in this report.
Generally accepted accounting principles require adjustments to be made to the net assets of the Fund at period end for financial reporting purposes only, and as such, the total return based on the unadjusted net asset value per share may differ from the total return reported in the financial highlights.
| Growth of an Assumed $10,000 Investment in Deutsche High Income VIP | ||
■ Deutsche High Income VIP — Class A ■ BofA Merrill Lynch US High Yield Master II Constrained Index | BofA Merrill Lynch US High Yield Master II Constrained Index tracks the performance of US dollar denominated below investment grade corporate debt publicly issued in the US domestic market. Index returns do not reflect any fees or expenses and it is not possible to invest directly into an index. | |
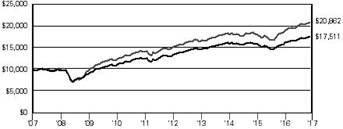 | ||
| Yearly periods ended June 30 | ||
| Comparative Results | ||||||
| Deutsche High Income VIP | 6-Month‡ | 1-Year | 3-Year | 5-Year | 10-Year | |
| Class A | Growth of $10,000 | $10,446 | $11,157 | $10,888 | $13,277 | $17,511 |
| Average annual total return | 4.46% | 11.57% | 2.88% | 5.83% | 5.76% | |
| BofA Merrill Lynch US High Yield Master II Constrained Index | Growth of $10,000 | $10,490 | $11,274 | $11,409 | $13,973 | $20,862 |
| Average annual total return | 4.90% | 12.74% | 4.49% | 6.92% | 7.63% | |
| Deutsche High Income VIP | 6-Month‡ | 1-Year | 3-Year | 5-Year | 10-Year | |
| Class B | Growth of $10,000 | $10,419 | $11,125 | $10,753 | $13,053 | $16,986 |
| Average annual total return | 4.19% | 11.25% | 2.45% | 5.47% | 5.44% | |
| BofA Merrill Lynch US High Yield Master II Constrained Index | Growth of $10,000 | $10,490 | $11,274 | $11,409 | $13,973 | $20,862 |
| Average annual total return | 4.90% | 12.74% | 4.49% | 6.92% | 7.63% | |
The growth of $10,000 is cumulative.
‡ Total returns shown for periods less than one year are not annualized.
Portfolio Summary (Unaudited)
| Asset Allocation (As a % of Investment Portfolio excluding Securities Lending Collateral) | 6/30/17 | 12/31/16 |
| Corporate Bonds | 91% | 93% |
| Cash Equivalents | 6% | 5% |
| Convertible Bond | 2% | 1% |
| Government & Agency Obligations | 1% | 1% |
| Common Stocks | 0% | 0% |
| Warrant | 0% | 0% |
| 100% | 100% |
| Sector Diversification (As a % of Investment Portfolio excluding Government & Agency Obligations, Cash Equivalents and Securities Lending Collateral) | 6/30/17 | 12/31/16 |
| Consumer Discretionary | 27% | 27% |
| Materials | 18% | 16% |
| Energy | 16% | 18% |
| Telecommunication Services | 11% | 13% |
| Industrials | 7% | 7% |
| Health Care | 6% | 6% |
| Information Technology | 5% | 3% |
| Utilities | 4% | 4% |
| Consumer Staples | 3% | 2% |
| Real Estate | 2% | 2% |
| Financials | 1% | 2% |
| 100% | 100% |
| Quality (As a % of Investment Portfolio excluding Cash Equivalents and Securities Lending Collateral) | 6/30/17 | 12/31/16 |
| AAA | 1% | 1% |
| BBB | 7% | 9% |
| BB | 53% | 57% |
| B | 34% | 30% |
| CCC | 5% | 3% |
| Not Rated | — | 0% |
| 100% | 100% |
The quality ratings represent the higher of Moody's Investors Service, Inc. ("Moody's"), Fitch Ratings, Inc. ("Fitch") or Standard & Poor's Corporation ("S&P") credit ratings. The ratings of Moody's, Fitch and S&P represent their opinions as to the quality of the securities they rate. Credit quality measures a bond issuer's ability to repay interest and principal in a timely manner. Ratings are relative and subjective and are not absolute standards of quality. Credit quality does not remove market risk and is subject to change.
Portfolio holdings and characteristics are subject to change.
For more complete details about the Fund's investment portfolio, see page 5.
Following the Fund's fiscal first and third quarter-end, a complete portfolio holdings listing is filed with the SEC on Form N-Q. The form will be available on the SEC's Web site at sec.gov, and it also may be reviewed and copied at the SEC's Public Reference Room in Washington, D.C. Information on the operation of the SEC's Public Reference Room may be obtained by calling (800) SEC-0330. The Fund's portfolio holdings are also posted on deutschefunds.com from time to time. Please see the Fund's current prospectus for more information.
Portfolio Management Team
Gary Russell, CFA, Managing Director
Thomas R. Bouchard, Director
Portfolio Managers
Investment Portfolio June 30, 2017 (Unaudited)
| Principal Amount ($)(a) | Value ($) | |||
| Corporate Bonds 90.4% | ||||
| Consumer Discretionary 24.9% | ||||
| 1011778 B.C. Unlimited Liability Co., 144A, 4.25%, 5/15/2024 | 280,000 | 278,233 | ||
| Adient Global Holdings Ltd.: | ||||
| REG S, 3.5%, 8/15/2024 | EUR | 390,000 | 451,741 | |
| 144A, 4.875%, 8/15/2026 | 340,000 | 340,850 | ||
| Ally Financial, Inc., 5.75%, 11/20/2025 (b) | 150,000 | 157,875 | ||
| Altice Financing SA: | ||||
| 144A, 6.5%, 1/15/2022 | 200,000 | 209,000 | ||
| 144A, 7.5%, 5/15/2026 | 785,000 | 871,350 | ||
| Altice U.S. Finance I Corp., 144A, 5.5%, 5/15/2026 | 480,000 | 504,000 | ||
| American Axle & Manufacturing, Inc.: | ||||
| 144A, 6.25%, 4/1/2025 (b) | 300,000 | 292,500 | ||
| 144A, 6.5%, 4/1/2027 (b) | 380,000 | 369,550 | ||
| Asbury Automotive Group, Inc., 6.0%, 12/15/2024 | 885,000 | 900,487 | ||
| Ashton Woods U.S.A. LLC, 144A, 6.875%, 2/15/2021 | 360,000 | 367,200 | ||
| Beacon Roofing Supply, Inc., 6.375%, 10/1/2023 | 160,000 | 172,000 | ||
| Boyd Gaming Corp., 6.875%, 5/15/2023 | 140,000 | 149,800 | ||
| CalAtlantic Group, Inc., 5.0%, 6/15/2027 | 70,000 | 70,175 | ||
| Caleres, Inc., 6.25%, 8/15/2023 | 110,000 | 114,675 | ||
| Carlson Travel, Inc.: | ||||
| 144A, 6.75%, 12/15/2023 | 200,000 | 203,500 | ||
| 144A, 9.5%, 12/15/2024 | 400,000 | 409,500 | ||
| CCO Holdings LLC: | ||||
| 144A, 5.125%, 5/1/2027 | 345,000 | 352,762 | ||
| 144A, 5.5%, 5/1/2026 | 660,000 | 700,425 | ||
| 144A, 5.875%, 4/1/2024 | 235,000 | 250,863 | ||
| 144A, 5.875%, 5/1/2027 | 480,000 | 513,000 | ||
| Cequel Communications Holdings I LLC, 144A, 5.125%, 12/15/2021 | 602,000 | 612,535 | ||
| Clear Channel Worldwide Holdings, Inc.: | ||||
| Series A, 6.5%, 11/15/2022 | 250,000 | 255,000 | ||
| Series B, 6.5%, 11/15/2022 | 365,000 | 375,110 | ||
| Series A, 7.625%, 3/15/2020 | 110,000 | 108,350 | ||
| CSC Holdings LLC: | ||||
| 5.25%, 6/1/2024 | 585,000 | 596,758 | ||
| 144A, 5.5%, 4/15/2027 | 755,000 | 798,412 | ||
| 144A, 10.125%, 1/15/2023 | 400,000 | 464,000 | ||
| 144A, 10.875%, 10/15/2025 | 275,000 | 331,031 | ||
| Cumberland Farms, Inc., 144A, 6.75%, 5/1/2025 | 68,000 | 71,570 | ||
| Dana Financing Luxembourg Sarl: | ||||
| 144A, 5.75%, 4/15/2025 | 435,000 | 450,225 | ||
| 144A, 6.5%, 6/1/2026 | 385,000 | 409,784 | ||
| Dana, Inc., 5.5%, 12/15/2024 | 180,000 | 186,750 | ||
| DISH DBS Corp.: | ||||
| 5.875%, 7/15/2022 | 600,000 | 645,000 | ||
| 5.875%, 11/15/2024 | 200,000 | 213,394 | ||
| 6.75%, 6/1/2021 | 450,000 | 499,500 | ||
| Dollar Tree, Inc., 5.25%, 3/1/2020 | 420,000 | 431,550 | ||
| Principal Amount ($)(a) | Value ($) | |||
| Eldorado Resorts, Inc., 144A, 6.0%, 4/1/2025 | 145,000 | 153,700 | ||
| Fiat Chrysler Automobiles NV, 5.25%, 4/15/2023 (b) | 245,000 | 249,288 | ||
| Goodyear Tire & Rubber Co.: | ||||
| 5.0%, 5/31/2026 | 165,000 | 170,775 | ||
| 5.125%, 11/15/2023 | 165,000 | 172,838 | ||
| Group 1 Automotive, Inc.: | ||||
| 5.0%, 6/1/2022 | 455,000 | 461,825 | ||
| 144A, 5.25%, 12/15/2023 | 545,000 | 550,450 | ||
| HD Supply, Inc., 144A, 5.75%, 4/15/2024 | 120,000 | 127,500 | ||
| Hot Topic, Inc., 144A, 9.25%, 6/15/2021 (b) | 140,000 | 134,400 | ||
| KFC Holding Co., 144A, 4.75%, 6/1/2027 | 145,000 | 148,081 | ||
| Lennar Corp.: | ||||
| 4.125%, 1/15/2022 | 275,000 | 284,281 | ||
| 4.75%, 11/15/2022 | 400,000 | 425,000 | ||
| MDC Partners, Inc., 144A, 6.5%, 5/1/2024 (b) | 195,000 | 194,513 | ||
| Mediacom Broadband LLC, 6.375%, 4/1/2023 | 225,000 | 235,100 | ||
| NCL Corp., Ltd., 144A, 4.75%, 12/15/2021 | 160,000 | 166,078 | ||
| Nielsen Finance LLC, 144A, 5.0%, 4/15/2022 | 155,000 | 160,813 | ||
| Penn National Gaming, Inc., 144A, 5.625%, 1/15/2027 | 110,000 | 112,063 | ||
| Penske Automotive Group, Inc., 5.5%, 5/15/2026 | 225,000 | 223,875 | ||
| PetSmart, Inc., 144A, 5.875%, 6/1/2025 | 90,000 | 86,738 | ||
| Quebecor Media, Inc., 5.75%, 1/15/2023 | 205,000 | 216,275 | ||
| Rivers Pittsburgh Borrower LP, 144A, 6.125%, 8/15/2021 | 70,000 | 71,050 | ||
| Sally Holdings LLC, 5.625%, 12/1/2025 | 195,000 | 199,631 | ||
| Scientific Games International, Inc., 144A, 7.0%, 1/1/2022 | 705,000 | 750,825 | ||
| Seminole Hard Rock Entertainment, Inc., 144A, 5.875%, 5/15/2021 | 125,000 | 125,625 | ||
| SFR Group SA, 144A, 7.375%, 5/1/2026 | 840,000 | 911,400 | ||
| Sonic Automotive, Inc., 144A, 6.125%, 3/15/2027 | 130,000 | 129,350 | ||
| Suburban Propane Partners LP, 5.75%, 3/1/2025 | 145,000 | 143,550 | ||
| Toll Brothers Finance Corp.: | ||||
| 4.875%, 11/15/2025 | 520,000 | 539,500 | ||
| 4.875%, 3/15/2027 | 450,000 | 463,500 | ||
| TRI Pointe Group, Inc., 5.25%, 6/1/2027 | 185,000 | 185,463 | ||
| Unitymedia Hessen GmbH & Co., KG, 144A, 5.5%, 1/15/2023 | 400,500 | 415,519 | ||
| UPCB Finance IV Ltd., 144A, 5.375%, 1/15/2025 | 955,000 | 999,169 | ||
| Viacom, Inc.: | ||||
| 5.875%, 2/28/2057 | 85,000 | 88,400 | ||
| 6.25%, 2/28/2057 | 10,000 | 10,400 | ||
| Viking Cruises Ltd.: | ||||
| 144A, 6.25%, 5/15/2025 | 240,000 | 241,800 | ||
| 144A, 8.5%, 10/15/2022 | 205,000 | 215,250 | ||
| Principal Amount ($)(a) | Value ($) | |||
| Virgin Media Secured Finance PLC: | ||||
| 144A, 5.25%, 1/15/2026 | 200,000 | 208,162 | ||
| 144A, 5.5%, 8/15/2026 | 215,000 | 225,213 | ||
| WMG Acquisition Corp., 144A, 5.0%, 8/1/2023 | 105,000 | 107,625 | ||
| 24,433,480 | ||||
| Consumer Staples 2.5% | ||||
| B&G Foods, Inc., 5.25%, 4/1/2025 | 445,000 | 453,900 | ||
| Chobani LLC, 144A, 7.5%, 4/15/2025 | 50,000 | 52,813 | ||
| Cott Beverages, Inc., 5.375%, 7/1/2022 | 445,000 | 461,131 | ||
| FAGE International SA, 144A, 5.625%, 8/15/2026 | 420,000 | 432,516 | ||
| First Quality Finance Co., Inc., 144A, 5.0%, 7/1/2025 | 175,000 | 178,500 | ||
| JBS Investments GmbH, 144A, 7.25%, 4/3/2024 | 496,000 | 442,680 | ||
| JBS U.S.A. LUX SA, 144A, 5.75%, 6/15/2025 | 290,000 | 272,600 | ||
| Post Holdings, Inc., 144A, 5.5%, 3/1/2025 | 130,000 | 134,062 | ||
| 2,428,202 | ||||
| Energy 15.0% | ||||
| Antero Midstream Partners LP, 144A, 5.375%, 9/15/2024 | 170,000 | 173,825 | ||
| Antero Resources Corp.: | ||||
| 5.125%, 12/1/2022 | 330,000 | 330,719 | ||
| 5.375%, 11/1/2021 | 250,000 | 252,500 | ||
| 5.625%, 6/1/2023 | 60,000 | 60,750 | ||
| Blue Racer Midstream LLC, 144A, 6.125%, 11/15/2022 | 405,000 | 408,037 | ||
| Carrizo Oil & Gas, Inc.: | ||||
| 6.25%, 4/15/2023 (b) | 115,000 | 110,688 | ||
| 8.25%, 7/15/2025 (c) | 140,000 | 143,150 | ||
| Cheniere Corpus Christi Holdings LLC: | ||||
| 144A, 5.125%, 6/30/2027 | 315,000 | 322,875 | ||
| 5.875%, 3/31/2025 | 225,000 | 239,906 | ||
| 7.0%, 6/30/2024 | 650,000 | 723,125 | ||
| Chesapeake Energy Corp., 144A, 8.0%, 6/15/2027 (b) | 80,000 | 78,600 | ||
| Continental Resources, Inc.: | ||||
| 3.8%, 6/1/2024 | 400,000 | 366,248 | ||
| 4.5%, 4/15/2023 (b) | 350,000 | 334,250 | ||
| 5.0%, 9/15/2022 | 568,000 | 557,350 | ||
| Crestwood Midstream Partners LP: | ||||
| 144A, 5.75%, 4/1/2025 | 170,000 | 169,575 | ||
| 6.25%, 4/1/2023 | 400,000 | 406,000 | ||
| Diamondback Energy, Inc., 144A, 4.75%, 11/1/2024 | 340,000 | 338,300 | ||
| Gulfport Energy Corp.: | ||||
| 144A, 6.0%, 10/15/2024 | 85,000 | 82,663 | ||
| 144A, 6.375%, 5/15/2025 | 140,000 | 137,900 | ||
| Hilcorp Energy I LP: | ||||
| 144A, 5.0%, 12/1/2024 | 295,000 | 271,400 | ||
| 144A, 5.75%, 10/1/2025 | 335,000 | 315,737 | ||
| Holly Energy Partners LP, 144A, 6.0%, 8/1/2024 | 215,000 | 223,600 | ||
| Laredo Petroleum, Inc.: | ||||
| 5.625%, 1/15/2022 | 100,000 | 97,000 | ||
| 6.25%, 3/15/2023 (b) | 295,000 | 292,788 | ||
| MEG Energy Corp.: | ||||
| 144A, 6.375%, 1/30/2023 | 755,000 | 583,237 | ||
| 144A, 6.5%, 1/15/2025 (b) | 324,000 | 294,840 | ||
| Principal Amount ($)(a) | Value ($) | |||
| Murphy Oil U.S.A., Inc., 5.625%, 5/1/2027 | 90,000 | 93,600 | ||
| Newfield Exploration Co., 5.375%, 1/1/2026 | 335,000 | 346,725 | ||
| NuStar Logistics LP, 5.625%, 4/28/2027 | 326,000 | 342,300 | ||
| Oasis Petroleum, Inc.: | ||||
| 6.5%, 11/1/2021 | 55,000 | 53,350 | ||
| 6.875%, 3/15/2022 (b) | 225,000 | 218,250 | ||
| 6.875%, 1/15/2023 | 80,000 | 77,400 | ||
| Parsley Energy LLC: | ||||
| 144A, 5.25%, 8/15/2025 | 75,000 | 74,813 | ||
| 144A, 5.375%, 1/15/2025 | 120,000 | 120,900 | ||
| PDC Energy, Inc., 144A, 6.125%, 9/15/2024 | 210,000 | 213,150 | ||
| Peabody Energy Corp.: | ||||
| 144A, 6.0%, 3/31/2022 | 30,000 | 29,775 | ||
| 144A, 6.375%, 3/31/2025 | 245,000 | 241,325 | ||
| Range Resources Corp.: | ||||
| 4.875%, 5/15/2025 | 175,000 | 166,250 | ||
| 144A, 5.0%, 8/15/2022 | 350,000 | 343,875 | ||
| 144A, 5.875%, 7/1/2022 | 195,000 | 197,925 | ||
| Rice Energy, Inc., 7.25%, 5/1/2023 | 250,000 | 269,375 | ||
| Summit Midstream Holdings LLC, 5.75%, 4/15/2025 | 85,000 | 85,425 | ||
| Sunoco LP: | ||||
| 5.5%, 8/1/2020 | 130,000 | 133,250 | ||
| 6.375%, 4/1/2023 | 590,000 | 619,972 | ||
| Targa Resources Partners LP, 144A, 5.375%, 2/1/2027 | 460,000 | 476,100 | ||
| Tesoro Corp.: | ||||
| 144A, 4.75%, 12/15/2023 | 105,000 | 113,138 | ||
| 144A, 5.125%, 12/15/2026 | 245,000 | 266,614 | ||
| Tesoro Logistics LP: | ||||
| 5.25%, 1/15/2025 | 365,000 | 383,250 | ||
| 6.375%, 5/1/2024 | 180,000 | 194,850 | ||
| Trinidad Drilling Ltd., 144A, 6.625%, 2/15/2025 | 70,000 | 66,500 | ||
| Weatherford International Ltd.: | ||||
| 4.5%, 4/15/2022 (b) | 430,000 | 379,475 | ||
| 8.25%, 6/15/2023 (b) | 100,000 | 100,000 | ||
| 144A, 9.875%, 2/15/2024 | 305,000 | 318,725 | ||
| Whiting Petroleum Corp., 5.75%, 3/15/2021 (b) | 395,000 | 371,300 | ||
| WildHorse Resource Development Corp., 144A, 6.875%, 2/1/2025 | 70,000 | 65,800 | ||
| WPX Energy, Inc.: | ||||
| 5.25%, 9/15/2024 | 200,000 | 190,000 | ||
| 6.0%, 1/15/2022 | 300,000 | 297,000 | ||
| 7.5%, 8/1/2020 | 150,000 | 157,500 | ||
| 8.25%, 8/1/2023 | 295,000 | 320,075 | ||
| 14,643,050 | ||||
| Financials 0.4% | ||||
| Lincoln Finance Ltd., 144A, 7.375%, 4/15/2021 | 105,000 | 111,300 | ||
| Seminole Tribe of Florida, Inc., 144A, 7.804%, 10/1/2020 | 220,000 | 222,200 | ||
| Tempo Acquisition LLC, 144A, 6.75%, 6/1/2025 | 105,000 | 107,363 | ||
| 440,863 | ||||
| Health Care 5.9% | ||||
| Alere, Inc., 144A, 6.375%, 7/1/2023 | 185,000 | 198,644 | ||
| Endo Dac, 144A, 6.0%, 7/15/2023 | 195,000 | 163,898 | ||
| Principal Amount ($)(a) | Value ($) | |||
| HCA, Inc.: | ||||
| 4.5%, 2/15/2027 | 503,000 | 517,461 | ||
| 4.75%, 5/1/2023 | 500,000 | 528,750 | ||
| 5.25%, 6/15/2026 | 385,000 | 415,222 | ||
| 5.5%, 6/15/2047 | 115,000 | 119,025 | ||
| 5.875%, 2/15/2026 | 530,000 | 572,400 | ||
| Hill-Rom Holdings, Inc., 144A, 5.0%, 2/15/2025 | 105,000 | 107,100 | ||
| Hologic, Inc., 144A, 5.25%, 7/15/2022 | 90,000 | 94,500 | ||
| LifePoint Health, Inc., 5.5%, 12/1/2021 | 125,000 | 129,375 | ||
| Mallinckrodt International Finance SA, 144A, 5.625%, 10/15/2023 (b) | 135,000 | 123,188 | ||
| Tenet Healthcare Corp.: | ||||
| 144A, 4.625%, 7/15/2024 | 160,000 | 160,200 | ||
| 4.746%**, 6/15/2020 | 180,000 | 181,800 | ||
| 144A, 7.5%, 1/1/2022 | 135,000 | 146,448 | ||
| THC Escrow Corp. III: | ||||
| 144A, 4.625%, 7/15/2024 | 200,000 | 200,540 | ||
| 144A, 5.125%, 5/1/2025 | 140,000 | 140,525 | ||
| Valeant Pharmaceuticals International, Inc.: | ||||
| 144A, 5.375%, 3/15/2020 (b) | 365,000 | 352,681 | ||
| 144A, 5.875%, 5/15/2023 | 235,000 | 201,513 | ||
| 144A, 6.125%, 4/15/2025 | 205,000 | 173,481 | ||
| 144A, 6.5%, 3/15/2022 | 145,000 | 152,069 | ||
| 144A, 7.0%, 3/15/2024 | 350,000 | 367,937 | ||
| 144A, 7.5%, 7/15/2021 | 750,000 | 726,562 | ||
| 5,773,319 | ||||
| Industrials 6.7% | ||||
| Allegion PLC, 5.875%, 9/15/2023 | 85,000 | 91,163 | ||
| Belden, Inc., 144A, 5.5%, 9/1/2022 | 355,000 | 365,650 | ||
| Bombardier, Inc.: | ||||
| 144A, 5.75%, 3/15/2022 | 315,000 | 313,425 | ||
| 144A, 6.0%, 10/15/2022 | 265,000 | 265,000 | ||
| 144A, 8.75%, 12/1/2021 | 63,000 | 69,930 | ||
| Booz Allen Hamilton, Inc., 144A, 5.125%, 5/1/2025 | 35,000 | 34,388 | ||
| Covanta Holding Corp.: | ||||
| 5.875%, 3/1/2024 | 220,000 | 214,500 | ||
| 5.875%, 7/1/2025 | 120,000 | 116,400 | ||
| EnerSys, 144A, 5.0%, 4/30/2023 | 45,000 | 46,294 | ||
| FTI Consulting, Inc., 6.0%, 11/15/2022 | 205,000 | 212,687 | ||
| GFL Environmental, Inc., 144A, 5.625%, 5/1/2022 | 115,000 | 117,588 | ||
| Kenan Advantage Group, Inc., 144A, 7.875%, 7/31/2023 | 220,000 | 231,000 | ||
| Koppers, Inc., 144A, 6.0%, 2/15/2025 | 295,000 | 313,437 | ||
| Masonite International Corp., 144A, 5.625%, 3/15/2023 | 220,000 | 229,900 | ||
| Moog, Inc., 144A, 5.25%, 12/1/2022 | 165,000 | 171,600 | ||
| Novelis Corp.: | ||||
| 144A, 5.875%, 9/30/2026 | 615,000 | 633,450 | ||
| 144A, 6.25%, 8/15/2024 | 195,000 | 204,750 | ||
| Oshkosh Corp., 5.375%, 3/1/2025 | 25,000 | 26,250 | ||
| Park Aerospace Holdings Ltd.: | ||||
| 144A, 5.25%, 8/15/2022 | 250,000 | 261,330 | ||
| 144A, 5.5%, 2/15/2024 | 335,000 | 349,907 | ||
| Ply Gem Industries, Inc., 6.5%, 2/1/2022 | 506,000 | 528,955 | ||
| Principal Amount ($)(a) | Value ($) | |||
| Prime Security Services Borrower LLC, 144A, 9.25%, 5/15/2023 | 25,000 | 27,167 | ||
| Ritchie Bros Auctioneers, Inc., 144A, 5.375%, 1/15/2025 | 130,000 | 135,525 | ||
| Summit Materials LLC: | ||||
| 144A, 5.125%, 6/1/2025 | 40,000 | 41,000 | ||
| 6.125%, 7/15/2023 | 275,000 | 288,062 | ||
| 8.5%, 4/15/2022 | 95,000 | 107,350 | ||
| Tennant Co., 144A, 5.625%, 5/1/2025 | 40,000 | 42,000 | ||
| United Rentals North America, Inc.: | ||||
| 5.5%, 5/15/2027 | 170,000 | 175,100 | ||
| 5.875%, 9/15/2026 | 233,000 | 248,145 | ||
| 6.125%, 6/15/2023 | 25,000 | 26,031 | ||
| USG Corp., 144A, 4.875%, 6/1/2027 | 230,000 | 236,612 | ||
| Welbilt, Inc., 9.5%, 2/15/2024 | 93,000 | 107,880 | ||
| WESCO Distribution, Inc., 5.375%, 6/15/2024 | 190,000 | 198,313 | ||
| XPO Logistics, Inc., 144A, 6.125%, 9/1/2023 | 85,000 | 88,506 | ||
| 6,519,295 | ||||
| Information Technology 3.8% | ||||
| Cardtronics, Inc.: | ||||
| 5.125%, 8/1/2022 | 145,000 | 147,175 | ||
| 144A, 5.5%, 5/1/2025 | 255,000 | 262,650 | ||
| CDK Global, Inc., 144A, 4.875%, 6/1/2027 | 60,000 | 61,650 | ||
| CDW LLC, 5.0%, 9/1/2025 | 130,000 | 134,875 | ||
| Change Healthcare Holdings LLC, 144A, 5.75%, 3/1/2025 | 290,000 | 295,800 | ||
| Dell International LLC: | ||||
| 144A, 5.875%, 6/15/2021 | 150,000 | 157,125 | ||
| 144A, 7.125%, 6/15/2024 (b) | 300,000 | 329,777 | ||
| First Data Corp., 144A, 7.0%, 12/1/2023 | 525,000 | 560,437 | ||
| Gartner, Inc., 144A, 5.125%, 4/1/2025 | 85,000 | 89,285 | ||
| j2 Cloud Services LLC, 144A, 6.0%, 7/15/2025 | 170,000 | 175,100 | ||
| Match Group, Inc., 6.375%, 6/1/2024 | 120,000 | 130,500 | ||
| Netflix, Inc.: | ||||
| 144A, 4.375%, 11/15/2026 | 250,000 | 249,375 | ||
| 5.875%, 2/15/2025 | 165,000 | 182,738 | ||
| Riverbed Technology, Inc., 144A, 8.875%, 3/1/2023 | 155,000 | 157,519 | ||
| Symantec Corp., 144A, 5.0%, 4/15/2025 | 220,000 | 230,243 | ||
| Western Digital Corp.: | ||||
| 144A, 7.375%, 4/1/2023 | 350,000 | 384,562 | ||
| 10.5%, 4/1/2024 | 168,000 | 198,186 | ||
| 3,746,997 | ||||
| Materials 15.0% | ||||
| AK Steel Corp.: | ||||
| 7.0%, 3/15/2027 (b) | 865,000 | 893,112 | ||
| 7.5%, 7/15/2023 | 200,000 | 216,000 | ||
| Alpha 3 BV, 144A, 6.25%, 2/1/2025 | 200,000 | 205,750 | ||
| Anglo American Capital PLC: | ||||
| 144A, 3.75%, 4/10/2022 | 400,000 | 402,000 | ||
| 144A, 4.75%, 4/10/2027 | 200,000 | 205,460 | ||
| 144A, 4.875%, 5/14/2025 | 600,000 | 624,000 | ||
| Ardagh Packaging Finance PLC: | ||||
| 144A, 6.0%, 2/15/2025 | 640,000 | 672,000 | ||
| 144A, 7.25%, 5/15/2024 | 290,000 | 317,187 | ||
| Principal Amount ($)(a) | Value ($) | |||
| Axalta Coating Systems LLC, 144A, 4.875%, 8/15/2024 | 150,000 | 154,875 | ||
| Ball Corp., 4.375%, 12/15/2020 | 110,000 | 115,500 | ||
| Berry Plastics Corp., 5.5%, 5/15/2022 | 435,000 | 452,944 | ||
| BWAY Holding Co., 144A, 5.5%, 4/15/2024 | 490,000 | 500,412 | ||
| Cascades, Inc., 144A, 5.5%, 7/15/2022 | 145,000 | 147,900 | ||
| Chemours Co.: | ||||
| 5.375%, 5/15/2027 | 295,000 | 304,555 | ||
| 6.625%, 5/15/2023 | 265,000 | 280,238 | ||
| 7.0%, 5/15/2025 | 80,000 | 87,200 | ||
| Clearwater Paper Corp., 144A, 5.375%, 2/1/2025 | 175,000 | 173,688 | ||
| Constellium NV: | ||||
| 144A, 4.625%, 5/15/2021 | EUR | 150,000 | 170,507 | |
| 144A, 5.75%, 5/15/2024 | 250,000 | 231,250 | ||
| 144A, 6.625%, 3/1/2025 (b) | 250,000 | 239,375 | ||
| 144A, 7.875%, 4/1/2021 | 500,000 | 535,000 | ||
| FMG Resources (August 2006) Pty Ltd., 144A, 5.125%, 5/15/2024 | 140,000 | 140,000 | ||
| Freeport-McMoRan, Inc.: | ||||
| 3.55%, 3/1/2022 | 330,000 | 309,269 | ||
| 3.875%, 3/15/2023 (b) | 300,000 | 279,000 | ||
| 4.0%, 11/14/2021 (b) | 250,000 | 244,375 | ||
| 5.45%, 3/15/2043 | 170,000 | 146,591 | ||
| 6.875%, 2/15/2023 | 200,000 | 211,124 | ||
| Hexion, Inc.: | ||||
| 6.625%, 4/15/2020 | 320,000 | 292,000 | ||
| 144A, 10.375%, 2/1/2022 | 55,000 | 54,450 | ||
| Hudbay Minerals, Inc.: | ||||
| 144A, 7.25%, 1/15/2023 | 245,000 | 252,656 | ||
| 144A, 7.625%, 1/15/2025 | 70,000 | 73,325 | ||
| Huntsman International LLC, 4.25%, 4/1/2025 | EUR | 150,000 | 196,477 | |
| Kaiser Aluminum Corp., 5.875%, 5/15/2024 | 200,000 | 210,500 | ||
| Mercer International, Inc., 144A, 6.5%, 2/1/2024 | 150,000 | 156,629 | ||
| NOVA Chemicals Corp.: | ||||
| 144A, 4.875%, 6/1/2024 (b) | 505,000 | 503,106 | ||
| 144A, 5.25%, 6/1/2027 | 330,000 | 328,350 | ||
| Plastipak Holdings, Inc., 144A, 6.5%, 10/1/2021 | 250,000 | 258,125 | ||
| Reynolds Group Issuer, Inc.: | ||||
| 144A, 5.125%, 7/15/2023 | 400,000 | 415,500 | ||
| 144A, 7.0%, 7/15/2024 | 45,000 | 48,272 | ||
| Sealed Air Corp.: | ||||
| 144A, 4.875%, 12/1/2022 | 115,000 | 122,475 | ||
| 144A, 5.125%, 12/1/2024 | 55,000 | 58,988 | ||
| Teck Resources Ltd.: | ||||
| 3.75%, 2/1/2023 | 400,000 | 389,500 | ||
| 4.75%, 1/15/2022 | 759,000 | 785,565 | ||
| 6.125%, 10/1/2035 | 450,000 | 469,125 | ||
| 6.25%, 7/15/2041 | 450,000 | 466,875 | ||
| Tronox Finance LLC, 6.375%, 8/15/2020 | 500,000 | 501,250 | ||
| United States Steel Corp., 144A, 8.375%, 7/1/2021 | 510,000 | 561,000 | ||
| WR Grace & Co-Conn: | ||||
| 144A, 5.125%, 10/1/2021 | 90,000 | 96,525 | ||
| 144A, 5.625%, 10/1/2024 | 170,000 | 181,688 | ||
| 14,681,693 | ||||
| Principal Amount ($)(a) | Value ($) | |||
| Real Estate 2.0% | ||||
| CyrusOne LP: | ||||
| 144A, (REIT), 5.0%, 3/15/2024 | 125,000 | 128,750 | ||
| 144A, (REIT), 5.375%, 3/15/2027 | 155,000 | 161,394 | ||
| Equinix, Inc.: | ||||
| (REIT), 5.375%, 5/15/2027 | 440,000 | 469,150 | ||
| (REIT), 5.75%, 1/1/2025 | 170,000 | 182,963 | ||
| (REIT), 5.875%, 1/15/2026 | 135,000 | 147,192 | ||
| Howard Hughes Corp., 144A, 5.375%, 3/15/2025 | 505,000 | 516,362 | ||
| MPT Operating Partnership LP: | ||||
| (REIT), 5.25%, 8/1/2026 | 50,000 | 51,980 | ||
| (REIT), 6.375%, 3/1/2024 | 235,000 | 255,593 | ||
| VEREIT Operating Partnership LP, (REIT), 4.875%, 6/1/2026 | 85,000 | 89,859 | ||
| 2,003,243 | ||||
| Telecommunication Services 10.4% | ||||
| CenturyLink, Inc.: | ||||
| Series W, 6.75%, 12/1/2023 | 250,000 | 269,220 | ||
| Series Y, 7.5%, 4/1/2024 | 235,000 | 257,325 | ||
| CommScope Technologies LLC, 144A, 5.0%, 3/15/2027 | 140,000 | 139,650 | ||
| Digicel Ltd., 144A, 6.75%, 3/1/2023 | 390,000 | 366,729 | ||
| Frontier Communications Corp.: | ||||
| 6.25%, 9/15/2021 (b) | 640,000 | 571,200 | ||
| 7.125%, 1/15/2023 | 605,000 | 503,662 | ||
| 10.5%, 9/15/2022 | 340,000 | 325,125 | ||
| Hughes Satellite Systems Corp., 7.625%, 6/15/2021 | 230,000 | 261,338 | ||
| Intelsat Jackson Holdings SA: | ||||
| 7.25%, 10/15/2020 | 300,000 | 283,500 | ||
| 144A, 8.0%, 2/15/2024 (b) | 452,000 | 487,030 | ||
| 144A, 9.75%, 7/15/2025 (c) | 260,000 | 259,675 | ||
| Sprint Capital Corp., 8.75%, 3/15/2032 | 325,000 | 409,500 | ||
| Sprint Communications, Inc., 7.0%, 8/15/2020 | 175,000 | 192,500 | ||
| Sprint Corp.: | ||||
| 7.125%, 6/15/2024 | 1,745,000 | 1,941,312 | ||
| 7.625%, 2/15/2025 (b) | 375,000 | 431,719 | ||
| T-Mobile U.S.A., Inc.: | ||||
| 6.0%, 4/15/2024 | 899,000 | 961,930 | ||
| 6.375%, 3/1/2025 | 497,000 | 537,381 | ||
| 6.5%, 1/15/2026 | 15,000 | 16,556 | ||
| Telecom Italia Capital SA, 7.2%, 7/18/2036 | 225,000 | 260,859 | ||
| Telesat Canada, 144A, 8.875%, 11/15/2024 | 180,000 | 202,050 | ||
| Wind Acquisition Finance SA, 144A, 6.5%, 4/30/2020 | 195,000 | 201,825 | ||
| Zayo Group LLC: | ||||
| 144A, 5.75%, 1/15/2027 | 275,000 | 287,719 | ||
| 6.0%, 4/1/2023 | 530,000 | 557,825 | ||
| 6.375%, 5/15/2025 | 386,000 | 416,637 | ||
| 10,142,267 | ||||
| Utilities 3.8% | ||||
| AmeriGas Partners LP: | ||||
| 5.5%, 5/20/2025 | 325,000 | 331,500 | ||
| 5.75%, 5/20/2027 | 305,000 | 308,812 | ||
| Calpine Corp., 5.75%, 1/15/2025 | 120,000 | 112,500 | ||
| Principal Amount ($)(a) | Value ($) | |||
| Dynegy, Inc.: | ||||
| 5.875%, 6/1/2023 | 125,000 | 116,875 | ||
| 7.375%, 11/1/2022 (b) | 830,000 | 819,625 | ||
| 7.625%, 11/1/2024 (b) | 105,000 | 101,850 | ||
| NGL Energy Partners LP, 5.125%, 7/15/2019 | 190,000 | 188,575 | ||
| NRG Energy, Inc.: | ||||
| 6.25%, 7/15/2022 | 1,000,000 | 1,026,250 | ||
| 6.625%, 1/15/2027 | 260,000 | 260,325 | ||
| 7.25%, 5/15/2026 | 385,000 | 398,475 | ||
| 7.875%, 5/15/2021 | 20,000 | 20,650 | ||
| 3,685,437 | ||||
| Total Corporate Bonds (Cost $85,828,130) | 88,497,846 | |||
| Government & Agency Obligation 1.1% | ||||
| U.S. Treasury Obligation | ||||
| U.S. Treasury Note, 0.75%, 10/31/2017 (Cost $1,100,172) | 1,100,000 | 1,098,746 | ||
| Convertible Bond 1.5% | ||||
| Materials | ||||
| GEO Specialty Chemicals, Inc., 144A, 7.5%, 10/30/2018 (PIK) (Cost $1,439,816) | 1,453,183 | 1,434,270 | ||
Shares | Value ($) | |||
| Common Stocks 0.1% | ||||
| Industrials 0.0% | ||||
| Quad Graphics, Inc. | 249 | 5,707 | ||
Shares | Value ($) | |||
| Materials 0.1% | ||||
| GEO Specialty Chemicals, Inc.* | 144,027 | 54,572 | ||
| GEO Specialty Chemicals, Inc., 144A* | 2,206 | 836 | ||
| 55,408 | ||||
| Total Common Stocks (Cost $292,150) | 61,115 | |||
| Warrant 0.0% | ||||
| Materials | ||||
| Hercules Trust II, Expiration Date 3/31/2029* (Cost $244,286) | 1,100 | 36,471 | ||
| Securities Lending Collateral 8.4% | ||||
| Deutsche Government & Agency Securities Portfolio "Deutsche Government Cash Institutional Shares", 0.87% (d) (e) (Cost $8,222,973) | 8,222,973 | 8,222,973 | ||
| Cash Equivalents 6.1% | ||||
| Deutsche Central Cash Management Government Fund, 1.03% (d) (Cost $5,998,425) | 5,998,425 | 5,998,425 | ||
| % of Net Assets | Value ($) | |
| Total Investment Portfolio (Cost $103,125,952)† | 107.6 | 105,349,846 |
| Other Assets and Liabilities, Net | (7.6) | (7,429,515) |
| Net Assets | 100.0 | 97,920,331 |
* Non-income producing security.
** Floating rate securities' yields vary with a designated market index or market rate, such as the coupon-equivalent of the U.S. Treasury Bill rate. These securities are shown at their current rate as of June 30, 2017.
† The cost for federal income tax purposes was $103,125,952. At June 30, 2017, net unrealized appreciation for all securities based on tax cost was $2,223,894. This consisted of aggregate gross unrealized appreciation for all securities in which there was an excess of value over tax cost of $3,377,269 and aggregate gross unrealized depreciation for all securities in which there was an excess of tax cost over value of $1,153,375.
(a) Principal amount stated in U.S. dollars unless otherwise noted.
(b) All or a portion of these securities were on loan. In addition, "Other Assets and Liabilities, Net" may include pending sales that are also on loan. The value of securities loaned at June 30, 2017 amounted to $7,923,185, which is 8.1% of net assets.
(c) When-issued security.
(d) Affiliated fund managed by Deutsche Investment Management Americas Inc. The rate shown is the annualized seven-day yield at period end.
(e) Represents collateral held in connection with securities lending. Income earned by the Fund is net of borrower rebates.
144A: Security exempt from registration under Rule 144A of the Securities Act of 1933. These securities may be resold in transactions exempt from registration, normally to qualified institutional buyers.
PIK: Denotes that all or a portion of the income is paid in-kind in the form of additional principal.
REG S: Securities sold under Regulation S may not be offered, sold or delivered within the United States or to, or for the account or benefit of, U.S. persons, except pursuant to an exemption from, or in a transaction not subject to, the registration requirements of the Securities Act of 1933.
REIT: Real Estate Investment Trust
At June 30, 2017, open credit default swap contracts sold were as follows:
| Bilateral Swaps | ||||||
| Expiration Dates | Notional Amount ($) (f) | Fixed Cash Flows Received | Underlying Debt Obligation/ Quality Rating (g) | Value ($) | Upfront Payments Paid ($) | Unrealized Appreciation ($) |
3/20/2019 | 1,500,0001 | 5.0% | Sprint Communications, Inc., 7.0%, 8/15/2020, B | 111,818 | 53,465 | 58,353 |
(f) The maximum potential amount of future undiscounted payments that the Fund could be required to make under a credit default swap contract would be the notional amount of the contract. These potential amounts would be partially offset by any recovery values of the referenced debt obligation or net amounts received from the settlement of buy protection credit default swap contracts entered into by the Fund for the same referenced debt obligation, if any.
(g) The quality ratings represent the higher of Moody's Investors Service, Inc. ("Moody's") or Standard & Poor's Corporation ("S&P") credit ratings and are unaudited.
Counterparty:
1 Goldman Sachs & Co.
As of June 30, 2017, the Fund had the following open forward foreign currency exchange contracts:
| Contracts to Deliver | In Exchange For | Settlement Date | Unrealized Appreciation ($) | Counterparty | |||||
| USD | 10,028 | EUR | 8,780 | 7/31/2017 | 17 | Citigroup, Inc. | |||
| Contracts to Deliver | In Exchange For | Settlement Date | Unrealized Depreciation ($) | Counterparty | |||||
| EUR | 742,891 | USD | 839,976 | 7/31/2017 | (9,951) | Citigroup, Inc. | |||
| Currency Abbreviations |
EUR Euro USD United States Dollar |
For information on the Fund's policy and additional disclosures regarding credit default swap contracts and forward foreign currency exchange contracts, please refer to Note B in the accompanying Notes to Financial Statements.
Fair Value Measurements
Various inputs are used in determining the value of the Fund's investments. These inputs are summarized in three broad levels. Level 1 includes quoted prices in active markets for identical securities. Level 2 includes other significant observable inputs (including quoted prices for similar securities, interest rates, prepayment speeds and credit risk). Level 3 includes significant unobservable inputs (including the Fund's own assumptions in determining the fair value of investments). The level assigned to the securities valuations may not be an indication of the risk or liquidity associated with investing in those securities.
The following is a summary of the inputs used as of June 30, 2017 in valuing the Fund's investments. For information on the Fund's policy regarding the valuation of investments, please refer to the Security Valuation section of Note A in the accompanying Notes to Financial Statements.
| Assets | Level 1 | Level 2 | Level 3 | Total | |
| Fixed Income Investments (h) | |||||
| Corporate Bonds | $ — | $ 88,497,846 | $ — | $ 88,497,846 | |
| Government & Agency Obligation | — | 1,098,746 | — | 1,098,746 | |
| Convertible Bond | — | — | 1,434,270 | 1,434,270 | |
| Common Stocks (h) | 5,707 | — | 55,408 | 61,115 | |
| Warrant | — | — | 36,471 | 36,471 | |
| Short-Term Investments (h) | 14,221,398 | — | — | 14,221,398 | |
| Derivatives (i) | |||||
| Credit Default Swap Contracts | — | 58,353 | — | 58,353 | |
| Forward Foreign Currency Exchange Contracts | — | 17 | — | 17 | |
| Total | $ 14,227,105 | $ 89,654,962 | $ 1,526,149 | $ 105,408,216 | |
| Liabilities | Level 1 | Level 2 | Level 3 | Total | |
| Derivatives (i) | |||||
| Forward Foreign Currency Exchange Contracts | $ — | $ (9,951) | $ — | $ (9,951) | |
| Total | $ — | $ (9,951) | $ — | $ (9,951) | |
There have been no transfers between fair value measurement levels during the period ended June 30, 2017.
(h) See Investment Portfolio for additional detailed categorizations.
(i) Derivatives include unrealized appreciation (depreciation) on credit default swap contracts and forward foreign currency exchange contracts.
Level 3 Reconciliation
The following is a reconciliation of the Fund's Level 3 investments for which significant unobservable inputs were used in determining value:
| Convertible Bonds | Common Stocks | Warrant | Total | |
| Balance as of December 31, 2016 | $ 1,459,104 | $ 57,426 | $ 4,994 | $ 1,521,524 |
| Realized gains (loss) | — | — | — | — |
| Change in unrealized appreciation (depreciation) | (56,163) | (2,018) | 31,477 | (26,704) |
| Amortization of premium/accretion of discount | 4,583 | — | — | 4,583 |
| Purchases | 26,746 | — | — | 26,746 |
| (Sales) | — | — | — | — |
| Transfer into Level 3 | — | — | — | — |
| Transfer (out) of Level 3 | — | — | — | — |
| Balance as of June 30, 2017 | $ 1,434,270 | $ 55,408 | $ 36,471 | $ 1,526,149 |
| Net change in unrealized appreciation (depreciation) from investments still held as of June 30, 2017 | $ (56,163) | $ (2,018) | $ 31,477 | $ (26,704) |
| Quantitative Disclosure About Significant Unobservable Inputs | ||||
| Asset Class | Fair Value at 6/30/17 | Valuation Technique(s) | Unobservable Input | Range (Weighted Average) |
| Common Stocks | ||||
| Materials | $ 55,408 | Market Approach | EV/EBITDA Multiple | 6.13% |
| Discount to public comparables | 20% | |||
| Discount for lack of marketability | 15% | |||
| Warrant | ||||
| Materials | $ 36,471 | Black Scholes Option Pricing Model | Implied Volatility | 27.59% |
| Illiquidity Discount | 20% | |||
| Convertible Bonds | ||||
| Materials | $ 1,434,270 | Market Approach | EV/EBITDA Multiple | 6.13% |
| Discount to public comparables | 20% | |||
| Discount for lack of marketability | 15% | |||
Qualitative Disclosure About Unobservable Inputs
Significant unobservable inputs developed by the Pricing Committee and used in the fair value measurement of the Fund’s equity and convertible bond investments include enterprise value (EV) to earnings before interest, taxes, depreciation and amortization (EBITDA) ratio with a discount for lack of marketability. A significant change in the EV to EBITDA ratio may result in a significant change in the fair value measurement, while a significant change in the discount for lack of marketability is unlikely to result in a materially higher or lower fair value measurement.
Significant unobservable inputs developed by the Pricing Committee and used in the fair value measurement of the Fund’s warrants include volatility and discount for lack of marketability. A change in the volatility of the underlying asset as an input to the Black-Scholes model may have a significant change in the fair value measurement. A significant change in the discount for lack of marketability is unlikely to have a material impact to the fair value measurement.
The accompanying notes are an integral part of the financial statements.
Statement of Assets and Liabilities
| as of June 30, 2017 (Unaudited) | |
| Assets | |
Investments: Investments in non-affiliated securities, at value (cost $88,904,554) — including $7,923,185 of securities loaned | $ 91,128,448 |
| Investment in Deutsche Government & Agency Securities Portfolio (cost $8,222,973)* | 8,222,973 |
| Investment in Deutsche Central Cash Management Government Fund (cost $5,998,425) | 5,998,425 |
| Total investments in securities, at value (cost $103,125,952) | 105,349,846 |
| Foreign currency, at value (cost $10,258) | 10,266 |
| Receivable for investments sold — when-issued/delayed delivery securities | 724,050 |
| Receivable for Fund shares sold | 5,084 |
| Interest receivable | 1,423,730 |
| Unrealized appreciation on bilateral swap contracts | 58,353 |
| Unrealized appreciation on forward foreign currency exchange contracts | 17 |
| Upfront payments paid on bilateral swap contracts | 53,465 |
| Other assets | 672 |
| Total assets | 107,625,483 |
| Liabilities | |
| Payable upon return of securities loaned | 8,222,973 |
| Payable for investments purchased | 48,048 |
| Payable for investments purchased — when-issued/delayed delivery securities | 1,120,000 |
| Payable for Fund shares redeemed | 168,912 |
| Unrealized depreciation on forward foreign currency exchange contracts | 9,951 |
| Accrued management fee | 36,160 |
| Accrued Trustees' fees | 30 |
| Other accrued expenses and payables | 99,078 |
| Total liabilities | 9,705,152 |
| Net assets, at value | $ 97,920,331 |
| Net Assets Consist of | |
| Undistributed net investment income | 2,441,723 |
Net unrealized appreciation (depreciation) on: Investments | 2,223,894 |
| Swap contracts | 58,353 |
| Foreign currency | (9,571) |
| Accumulated net realized gain (loss) | (25,635,556) |
| Paid-in capital | 118,841,488 |
| Net assets, at value | $ 97,920,331 |
Class A Net Asset Value, offering and redemption price per share ($97,745,979 ÷ 15,822,862 outstanding shares of beneficial interest, no par value, unlimited number of shares authorized) | $ 6.18 |
Class B Net Asset Value, offering and redemption price per share ($174,352 ÷ 28,106 outstanding shares of beneficial interest, no par value, unlimited number of shares authorized) | $ 6.20 |
* Represents collateral on securities loaned.
The accompanying notes are an integral part of the financial statements.
Statement of Operations
| for the six months ended June 30, 2017 (Unaudited) | |
| Investment Income | |
| Interest | $ 2,854,137 |
| Dividends | 149 |
| Income distributions — Deutsche Central Cash Management Government Fund | 18,865 |
| Securities lending income, net of borrower rebates | 26,505 |
| Total income | 2,899,656 |
Expenses: Management fee | 250,571 |
| Administration fee | 50,114 |
| Services to shareholders | 875 |
| Recordkeeping fees (Class B) | 845 |
| Distribution service fee (Class B) | 1,474 |
| Custodian fee | 3,169 |
| Professional fees | 46,183 |
| Reports to shareholders | 17,728 |
| Trustees' fees and expenses | 3,251 |
| Other | 20,117 |
| Total expenses before expense reductions | 394,327 |
| Expense reductions | (30,279) |
| Total expenses after expense reductions | 364,048 |
| Net investment income (loss) | 2,535,608 |
| Realized and Unrealized Gain (Loss) | |
Net realized gain (loss) from: Investments | 1,252,429 |
| Swap contracts | 128,655 |
| Foreign currency | (51,207) |
| 1,329,877 | |
Change in net unrealized appreciation (depreciation) on: Investments | 505,842 |
| Swap contracts | 21,837 |
| Foreign currency | (5,585) |
| 522,094 | |
| Net gain (loss) | 1,851,971 |
| Net increase (decrease) in net assets resulting from operations | $ 4,387,579 |
The accompanying notes are an integral part of the financial statements.
Statements of Changes in Net Assets
| Increase (Decrease) in Net Assets | Six Months Ended June 30, 2017 (Unaudited) | Year Ended December 31, 2016 | |
Operations: Net investment income | $ 2,535,608 | $ 5,440,363 | |
| Net realized gain (loss) | 1,329,877 | (3,163,765) | |
| Change in net unrealized appreciation (depreciation) | 522,094 | 9,890,493 | |
| Net increase (decrease) in net assets resulting from operations | 4,387,579 | 12,167,091 | |
Distributions to shareholders from: Net investment income: Class A | (5,780,980) | (6,259,405) | |
| Class B | (94,574) | (122,558) | |
| Total distributions | (5,875,554) | (6,381,963) | |
Fund share transactions: Class A Proceeds from shares sold | 10,608,255 | 15,011,086 | |
| Reinvestment of distributions | 5,780,980 | 6,259,405 | |
| Payments for shares redeemed | (16,708,036) | (28,525,830) | |
| Net increase (decrease) in net assets from Class A share transactions | (318,801) | (7,255,339) | |
Class B Proceeds from shares sold | 84,102 | 5,848,785 | |
| Reinvestment of distributions | 94,574 | 122,558 | |
| Payments for shares redeemed | (1,563,567) | (7,539,910) | |
| Net increase (decrease) in net assets from Class B share transactions | (1,384,891) | (1,568,567) | |
| Increase (decrease) in net assets | (3,191,667) | (3,038,778) | |
| Net assets at beginning of period | 101,111,998 | 104,150,776 | |
| Net assets at end of period (including undistributed net investment income of $2,441,723 and $5,781,669, respectively) | $ 97,920,331 | $ 101,111,998 | |
| Other Information | |||
Class A Shares outstanding at beginning of period | 15,845,238 | 17,025,372 | |
| Shares sold | 1,675,969 | 2,525,843 | |
| Shares issued to shareholders in reinvestment of distributions | 946,151 | 1,081,072 | |
| Shares redeemed | (2,644,496) | (4,787,049) | |
| Net increase (decrease) in Class A shares | (22,376) | (1,180,134) | |
| Shares outstanding at end of period | 15,822,862 | 15,845,238 | |
Class B Shares outstanding at beginning of period | 254,095 | 530,185 | |
| Shares sold | 13,076 | 990,197 | |
| Shares issued to shareholders in reinvestment of distributions | 15,403 | 21,094 | |
| Shares redeemed | (254,468) | (1,287,381) | |
| Net increase (decrease) in Class B shares | (225,989) | (276,090) | |
| Shares outstanding at end of period | 28,106 | 254,095 | |
The accompanying notes are an integral part of the financial statements.
Financial Highlights
| Class A | Six Months Ended 6/30/17 (Unaudited) | Years Ended December 31, | |||||
| 2016 | 2015 | 2014 | 2013 | 2012 | |||
| Selected Per Share Data | |||||||
| Net asset value, beginning of period | $ 6.28 | $ 5.93 | $ 6.60 | $ 6.96 | $ 6.93 | $ 6.56 | |
Income (loss) from investment operations: Net investment incomea | .16 | .32 | .32 | .36 | .39 | .45 | |
| Net realized and unrealized gain (loss) | .12 | .41 | (.58) | (.25) | .14 | .48 | |
| Total from investment operations | .28 | .73 | (.26) | .11 | .53 | .93 | |
Less distributions from: Net investment income | (.38) | (.38) | (.41) | (.47) | (.50) | (.56) | |
| Net asset value, end of period | $ 6.18 | $ 6.28 | $ 5.93 | $ 6.60 | $ 6.96 | $ 6.93 | |
| Total Return (%) | 4.46b** | 12.87b | (4.44)b | 1.47b | 7.91b | 14.91 | |
| Ratios to Average Net Assets and Supplemental Data | |||||||
| Net assets, end of period ($ millions) | 98 | 100 | 101 | 135 | 165 | 178 | |
| Ratio of expenses before expense reductions (%)c | .78* | .80 | .75 | .75 | .73 | .72 | |
| Ratio of expenses after expense reductions (%)c | .72* | .72 | .72 | .73 | .72 | .72 | |
| Ratio of net investment income (%) | 5.06* | 5.38 | 5.09 | 5.21 | 5.69 | 6.68 | |
| Portfolio turnover rate (%) | 39** | 77 | 47 | 52 | 58 | 58 | |
a Based on average shares outstanding during the period. b Total return would have been lower had certain expenses not been reduced. c Expense ratio does not reflect charges and fees associated with the separate account that invests in the Fund or any variable life insurance policy or variable annuity contract for which the Fund is an investment option. * Annualized ** Not annualized | |||||||
| Class B | Six Months Ended 6/30/17 (Unaudited) | Years Ended December 31, | |||||
| 2016 | 2015 | 2014 | 2013 | 2012 | |||
| Selected Per Share Data | |||||||
| Net asset value, beginning of period | $ 6.30 | $ 5.94 | $ 6.63 | $ 6.99 | $ 6.97 | $ 6.59 | |
Income (loss) from investment operations: Net investment incomea | .15 | .31 | .32 | .35 | .36 | .43 | |
| Net realized and unrealized gain (loss) | .11 | .41 | (.61) | (.26) | .15 | .49 | |
| Total from investment operations | .26 | .72 | (.29) | .09 | .51 | .92 | |
Less distributions from: Net investment income | (.36) | (.36) | (.40) | (.45) | (.49) | (.54) | |
| Net asset value, end of period | $ 6.20 | $ 6.30 | $ 5.94 | $ 6.63 | $ 6.99 | $ 6.97 | |
| Total Return (%)b | 4.19** | 12.67 | (4.95) | 1.22 | 7.44 | 14.70 | |
| Ratios to Average Net Assets and Supplemental Data | |||||||
| Net assets, end of period ($ millions) | .2 | 2 | 3 | .03 | .32 | .09 | |
| Ratio of expenses before expense reductions (%)c | 1.18* | 1.21 | 1.14 | 1.13 | 1.10 | .99 | |
| Ratio of expenses after expense reductions (%)c | .99* | .98 | 1.02 | .97 | .97 | .99 | |
| Ratio of net investment income (%) | 4.84* | 5.15 | 4.86 | 5.09 | 5.29 | 6.42 | |
| Portfolio turnover rate (%) | 39** | 77 | 47 | 52 | 58 | 58 | |
a Based on average shares outstanding during the period. b Total return would have been lower had certain expenses not been reduced. c Expense ratio does not reflect charges and fees associated with the separate account that invests in the Fund or any variable life insurance policy or variable annuity contract for which the Fund is an investment option. * Annualized ** Not annualized | |||||||
Notes to Financial Statements (Unaudited)
A. Organization and Significant Accounting Policies
Deutsche High Income VIP (the "Fund") is a diversified series of Deutsche Variable Series II (the "Trust"), which is registered under the Investment Company Act of 1940, as amended (the "1940 Act"), as an open-end management investment company organized as a Massachusetts business trust.
Multiple Classes of Shares of Beneficial Interest. The Fund offers two classes of shares (Class A shares and Class B shares). Sales of Class B shares are subject to recordkeeping fees up to 0.15% and Rule 12b-1 fees under the 1940 Act equal to an annual rate of 0.25% of the average daily net assets of the Class B shares of the Fund. Class A shares are not subject to such fees.
Investment income, realized and unrealized gains and losses, and certain fund-level expenses and expense reductions, if any, are borne pro rata on the basis of relative net assets by the holders of all classes of shares except that each class bears certain expenses unique to that class (including the applicable Rule 12b-1 fee and recordkeeping fees). Differences in class-level expenses may result in payment of different per share dividends by class. All shares have equal rights with respect to voting subject to class-specific arrangements.
The Fund's financial statements are prepared in accordance with accounting principles generally accepted in the United States of America ("U.S. GAAP") which require the use of management estimates. Actual results could differ from those estimates. The Fund qualifies as an investment company under Topic 946 of Accounting Standards Codification of U.S. GAAP. The policies described below are followed consistently by the Fund in the preparation of its financial statements.
Security Valuation. Investments are stated at value determined as of the close of regular trading on the New York Stock Exchange on each day the exchange is open for trading.
Various inputs are used in determining the value of the Fund's investments. These inputs are summarized in three broad levels. Level 1 includes quoted prices in active markets for identical securities. Level 2 includes other significant observable inputs (including quoted prices for similar securities, interest rates, prepayment speeds and credit risk). Level 3 includes significant unobservable inputs (including the Fund's own assumptions in determining the fair value of investments). The level assigned to the securities valuations may not be an indication of the risk or liquidity associated with investing in those securities.
Debt securities are valued at prices supplied by independent pricing services approved by the Fund's Board. Such services may use various pricing techniques which take into account appropriate factors such as yield, quality, coupon rate, maturity, type of issue, trading characteristics, prepayment speeds and other data, as well as broker quotes. If the pricing services are unable to provide valuations, debt securities are valued at the average of the most recent reliable bid quotations or evaluated prices, as applicable, obtained from broker-dealers. These securities are generally categorized as Level 2.
Equity securities are valued at the most recent sale price or official closing price reported on the exchange (U.S. or foreign) or over-the-counter market on which they trade. Securities for which no sales are reported are valued at the calculated mean between the most recent bid and asked quotations on the relevant market or, if a mean cannot be determined, at the most recent bid quotation. Equity securities are generally categorized as Level 1 securities.
Investments in open-end investment companies are valued at their net asset value each business day and are categorized as Level 1.
Forward currency contracts are valued at the prevailing forward exchange rate of the underlying currencies and are categorized as Level 2.
Swap contracts are valued daily based upon prices supplied by a Board approved pricing vendor, if available, and otherwise are valued at the price provided by the broker-dealer. Swap contracts are generally categorized as Level 2.
Securities and other assets for which market quotations are not readily available or for which the above valuation procedures are deemed not to reflect fair value are valued in a manner that is intended to reflect their fair value as determined in accordance with procedures approved by the Board and are generally categorized as Level 3. In accordance with the Fund's valuation procedures, factors considered in determining value may include, but are not limited to, the type of the security; the size of the holding; the initial cost of the security; the existence of any contractual restrictions on the security's disposition; the price and extent of public trading in similar securities of the issuer or of comparable companies; quotations or evaluated prices from broker-dealers and/or pricing services; information obtained from the issuer, analysts and/or the appropriate stock exchange (for exchange-traded securities); an analysis of the company's or issuer's financial statements; an evaluation of the forces that influence the issuer and the market(s) in which the security is purchased and sold; and with respect to debt securities, the maturity, coupon, creditworthiness, currency denomination and the movement of the market in which the security is normally traded. The value determined under these procedures may differ from published values for the same securities.
Disclosure about the classification of fair value measurements is included in a table following the Fund's Investment Portfolio.
Foreign Currency Translations. The books and records of the Fund are maintained in U.S. dollars. Investment securities and other assets and liabilities denominated in a foreign currency are translated into U.S. dollars at the prevailing exchange rates at period end. Purchases and sales of investment securities, income and expenses are translated into U.S. dollars at the prevailing exchange rates on the respective dates of the transactions.
Net realized and unrealized gains and losses on foreign currency transactions represent net gains and losses between trade and settlement dates on securities transactions, the acquisition and disposition of foreign currencies, and the difference between the amount of net investment income accrued and the U.S. dollar amount actually received. That portion of both realized and unrealized gains and losses on investments that results from fluctuations in foreign currency exchange rates is not separately disclosed but is included with net realized and unrealized gain/appreciation and loss/depreciation on investments.
Securities Lending. Deutsche Bank AG, as lending agent, lends securities of the Fund to certain financial institutions under the terms of its securities lending agreement. During the term of the loans, the Fund continues to receive interest and dividends generated by the securities and to participate in any changes in their market value. The Fund requires the borrowers of the securities to maintain collateral with the Fund consisting of either cash or liquid, unencumbered assets having a value at least equal to the value of the securities loaned. When the collateral falls below specified amounts, the lending agent will use its best effort to obtain additional collateral on the next business day to meet required amounts under the securities lending agreement. As of period end, any securities on loan were collateralized by cash. During the six months ended June 30, 2017, the Fund invested the cash collateral into a joint trading account in affiliated money market funds managed by Deutsche Investment Management Americas Inc. As of June 30, 2017, the Fund invested the cash collateral in Deutsche Government & Agency Securities Portfolio. Deutsche Investment Management Americas Inc. receives a management/administration fee (0.13% annualized effective rate as of June 30, 2017) on the cash collateral invested in Deutsche Government & Agency Securities Portfolio. The Fund receives compensation for lending its securities either in the form of fees or by earning interest on invested cash collateral net of borrower rebates and fees paid to a lending agent. Either the Fund or the borrower may terminate the loan at any time, and the borrower, after notice, is required to return borrowed securities within a standard time period. There may be risks of delay and costs in recovery of securities or even loss of rights in the collateral should the borrower of the securities fail financially. If the Fund is not able to recover securities lent, the Fund may sell the collateral and purchase a replacement investment in the market, incurring the risk that the value of the replacement security is greater than the value of the collateral. The Fund is also subject to all investment risks associated with the reinvestment of any cash collateral received, including, but not limited to, interest rate, credit and liquidity risk associated with such investments.
As of June 30, 2017, the Fund had securities on loan, which were classified as corporate bonds in the Investment Portfolio. The value of the related collateral exceeded the value of the securities loaned at period end. As of period end, the remaining contractual maturity of the collateral agreements were overnight and continuous.
When-Issued/Delayed Delivery Securities. The Fund may purchase or sell securities with delivery or payment to occur at a later date beyond the normal settlement period. At the time the Fund enters into a commitment to purchase or sell a security, the transaction is recorded and the value of the transaction is reflected in the net asset value. The price of such security and the date when the security will be delivered and paid for are fixed at the time the transaction is negotiated. The value of the security may vary with market fluctuations. At the time the Fund enters into a purchase transaction it is required to segregate cash or other liquid assets at least equal to the amount of the commitment. Additionally, the Fund or the counterparty may be required to post securities and/or cash collateral in accordance with the terms of the commitment.
Certain risks may arise upon entering into when-issued or delayed delivery transaction from the potential inability of counterparties to meet the terms of their contracts or if the issuer does not issue the securities due to political, economic, or other factors. Additionally, losses may arise due to changes in the value of the underlying securities.
Taxes. The Fund's policy is to comply with the requirements of the Internal Revenue Code, as amended, which are applicable to regulated investment companies and to distribute all of its taxable income to its shareholders.
Under the Regulated Investment Company Modernization Act of 2010, net capital losses incurred post-enactment may be carried forward indefinitely, and their character is retained as short-term and/or long-term. Previously, net capital losses were carried forward for eight years and treated as short-term losses. As a transition rule, the Act requires that post-enactment net capital losses be used before pre-enactment net capital losses.
At December 31, 2016, the Fund had a net tax basis capital loss carryforward of approximately $26,966,000, including $17,232,000 of pre-enactment losses, which may be applied against any realized net taxable capital gains until December 31, 2017, the expiration date; and approximately $9,734,000 of post-enactment long-term losses, which may be applied against realized net taxable capital gains indefinitely, including short-term losses ($1,843,000) and long-term losses ($7,891,000).
The Fund has reviewed the tax positions for the open tax years as of December 31, 2016 and has determined that no provision for income tax and/or uncertain tax provisions is required in the Fund's financial statements. The Fund's federal tax returns for the prior three fiscal years remain open subject to examination by the Internal Revenue Service.
Distribution of Income and Gains. Distributions from net investment income of the Fund, if any, are declared and distributed to shareholders annually. Net realized gains from investment transactions, in excess of available capital loss carryforwards, would be taxable to the Fund if not distributed and, therefore, will be distributed to shareholders at least annually. The Fund may also make additional distributions for tax purposes if necessary.
The timing and characterization of certain income and capital gain distributions are determined annually in accordance with federal tax regulations which may differ from accounting principles generally accepted in the United States of America. These differences primarily relate to investments in swap contracts, expiration of capital loss carryforward and certain securities sold at a loss. As a result, net investment income (loss) and net realized gain (loss) on investment transactions for a reporting period may differ significantly from distributions during such period. Accordingly, the Fund may periodically make reclassifications among certain of its capital accounts without impacting the net asset value of the Fund.
The tax character of current year distributions will be determined at the end of the current fiscal year.
Expenses. Expenses of the Trust arising in connection with a specific fund are allocated to that fund. Other Trust expenses which cannot be directly attributed to a fund are apportioned among the funds in the Trust based upon the relative net assets or other appropriate measures.
Contingencies. In the normal course of business, the Fund may enter into contracts with service providers that contain general indemnification clauses. The Fund's maximum exposure under these arrangements is unknown, as this would involve future claims that may be made against the Fund that have not yet been made. However, based on experience, the Fund expects the risk of loss to be remote.
Other. Investment transactions are accounted for on a trade date plus one basis for daily net asset value calculations. However, for financial reporting purposes, investment transactions are reported on trade date. Interest income is recorded on the accrual basis. Dividend income is recorded on ex-dividend date. Realized gains and losses from investment transactions are recorded on an identified cost basis. Proceeds from litigation payments, if any, are included in net realized gain (loss) from investments. All discounts and premiums are accreted/amortized for both tax and financial reporting purposes for the Fund, with the exception of securities in default of principal.
B. Derivative Instruments
Swaps. A swap is a contract between two parties to exchange future cash flows at periodic intervals based on the notional amount of the swap. A bilateral swap is a transaction between the fund and a counterparty where cash flows are exchanged between the two parties. A centrally cleared swap is a transaction executed between the fund and a counterparty, then cleared by a clearing member through a central clearinghouse. The central clearinghouse serves as the counterparty, with whom the fund exchanges cash flows.
The value of a swap is adjusted daily, and the change in value, if any, is recorded as unrealized appreciation or depreciation in the Statement of Assets and Liabilities. Gains or losses are realized when the swap expires or is closed. Certain risks may arise when entering into swap transactions including counterparty default; liquidity; or unfavorable changes in interest rates or the value of the underlying reference security, commodity or index. In connection with bilateral swaps, securities and/or cash may be identified as collateral in accordance with the terms of the swap agreement to provide assets of value and recourse in the event of default. The maximum counterparty credit risk is the net present value of the cash flows to be received from or paid to the counterparty over the term of the swap, to the extent that this amount is beneficial to the Fund, in addition to any related collateral posted to the counterparty by the Fund. This risk may be partially reduced by a master netting arrangement between the Fund and the counterparty. Upon entering into a centrally cleared swap, the Fund is required to deposit with a financial intermediary cash or securities ("initial margin") in an amount equal to a certain percentage of the notional amount of the swap. Subsequent payments ("variation margin") are made or received by the Fund dependent upon the daily fluctuations in the value of the swap. In a cleared swap transaction, counterparty risk is minimized as the central clearinghouse acts as the counterparty.
An upfront payment, if any, made by the Fund is recorded as an asset in the Statement of Assets and Liabilities. An upfront payment, if any, received by the Fund is recorded as a liability in the Statement of Assets and Liabilities. Payments received or made at the end of the measurement period are recorded as realized gain or loss in the Statement of Operations.
Credit default swaps are agreements between a buyer and a seller of protection against predefined credit events for the reference entity. The Fund may enter into credit default swaps to gain exposure to an underlying issuer's credit quality characteristics without directly investing in that issuer or to hedge against the risk of a credit event on debt securities. As a seller of a credit default swap, the Fund is required to pay the par (or other agreed-upon) value of the referenced entity to the counterparty with the occurrence of a credit event by a third party, such as a U.S. or foreign corporate issuer, on the reference entity, which would likely result in a loss to the Fund. In return, the Fund receives from the counterparty a periodic stream of payments over the term of the swap provided that no credit event has occurred. If no credit event occurs, the Fund keeps the stream of payments with no payment obligations. The Fund may also buy credit default swaps, in which case the Fund functions as the counterparty referenced above. This involves the risk that the swap may expire worthless. It also involves counterparty risk that the seller may fail to satisfy its payment obligations to the Fund with the occurrence of a credit event. When the Fund sells a credit default swap, it will cover its commitment. This may be achieved by, among other methods, maintaining cash or liquid assets equal to the aggregate notional value of the reference entities for all outstanding credit default swaps sold by the Fund. For the six months ended June 30, 2017, the Fund entered into credit default swap agreements to gain exposure to the underlying issuer's credit quality characteristics.
Under the terms of a credit default swap, the Fund receives or makes periodic payments based on a specified interest rate on a fixed notional amount. These payments are recorded as a realized gain or loss in the Statement of Operations. Payments received or made as a result of a credit event or termination of the swap are recognized, net of a proportional amount of the upfront payment, as realized gains or losses in the Statement of Operations.
A summary of the open credit default swap contracts as of June 30, 2017 is included in a table following the Fund's Investment Portfolio. For the six months ended June 30, 2017, the Fund's investment in credit default swap contracts sold had a total notional value generally indicative of a range from $1,500,000 to $6,450,000.
Forward Foreign Currency Exchange Contracts. A forward foreign currency exchange contract ("forward currency contract") is a commitment to purchase or sell a foreign currency at the settlement date at a negotiated rate. For the six months ended June 30, 2017, the Fund entered into forward currency contracts in order to hedge its exposure to changes in foreign currency exchange rates on its foreign currency denominated portfolio holdings and to facilitate transactions in foreign currency denominated securities. Forward currency contracts are valued at the prevailing forward exchange rate of the underlying currencies and unrealized gain (loss) is recorded daily. On the settlement date of the forward currency contract, the Fund records a realized gain or loss equal to the difference between the value of the contract at the time it was opened and the value of the contract at the time it was closed. Certain risks may arise upon entering into forward currency contracts from the potential inability of counterparties to meet the terms of their contracts. The maximum counterparty credit risk to the Fund is measured by the unrealized gain on appreciated contracts. Additionally, when utilizing forward currency contracts to hedge, the Fund gives up the opportunity to profit from favorable exchange rate movements during the term of the contract.
A summary of the open forward currency contracts as of June 30, 2017 is included in a table following the Fund's Investment Portfolio. For the six months ended June 30, 2017, the investment in forward currency contracts short vs. U.S. dollars had a total contract value generally indicative of a range from approximately $498,000 to $840,000, and the investment in forward currency contracts long vs. U.S. dollars had a total contract value generally indicative of a range from $0 to approximately $217,000.
The following tables summarize the value of the Fund's derivative instruments held as of June 30, 2017 and the related location in the accompanying Statement of Assets and Liabilities, presented by primary underlying risk exposure:
| Asset Derivatives | Forward Contracts | Swap Contracts | Total |
| Credit Contracts (a) | $ — | $ 58,353 | $ 58,353 |
| Foreign Exchange Contracts (b) | 17 | — | 17 |
| $ 17 | $ 58,353 | $ 58,370 | |
Each of the above derivatives are located in the following Statement of Assets and Liabilities accounts: (a) Unrealized appreciation on bilateral swap contracts (b) Unrealized appreciation on foreign forward currency exchange contracts | |||
| Liability Derivative | Forward Contracts |
| Foreign Exchange Contracts (c) | $ (9,951) |
The above derivative is located in the following Statement of Assets and Liabilities account: (c) Unrealized depreciation on foreign forward currency exchange contracts | |
Additionally, the amount of unrealized and realized gains and losses on derivative instruments recognized in Fund earnings during the six months ended June 30, 2017 and the related location in the accompanying Statement of Operations is summarized in the following tables by primary underlying risk exposure:
| Realized Gain (Loss) | Forward Contracts | Swap Contracts | Total |
| Credit Contracts (d) | $ — | $ 128,655 | $ 128,655 |
| Foreign Exchange Contracts (e) | (54,313) | — | (54,313) |
| $ (54,313) | $ 128,655 | $ 74,342 | |
Each of the above derivatives is located in the following Statement of Operations accounts: (d) Net realized gain (loss) from swap contracts (e) Net realized gain (loss) from foreign currency (Statement of Operations includes both forward currency contracts and foreign currency transactions) | |||
| Change in Net Unrealized Appreciation (Depreciation) | Forward Contracts | Swap Contracts | Total |
| Credit Contracts (f) | $ — | $ 21,837 | $ 21,837 |
| Foreign Exchange Contracts (g) | (5,377) | — | (5,377) |
| $ (5,377) | $ 21,837 | $ 16,460 | |
Each of the above derivatives is located in the following Statement of Operations accounts: (f) Change in net unrealized appreciation (depreciation) on swap contracts (g) Change in net unrealized appreciation (depreciation) on foreign currency (Statement of Operations includes both forward currency contracts and foreign currency transactions) | |||
As of June 30, 2017, the Fund has transactions subject to enforceable master netting agreements which govern the terms of certain transactions, and reduce the counterparty risk associated with such transactions. Master netting agreements allow a Fund to close out and net total exposure to a counterparty in the event of a deterioration in the credit quality or contractual default with respect to all of the transactions with a counterparty. As defined by the master netting agreement, the Fund may have collateral agreements with certain counterparties to mitigate risk. For financial reporting purposes the Statement of Assets and Liabilities generally shows derivatives assets and liabilities on a gross basis, which reflects the full risks and exposures prior to netting. A reconciliation of the gross amounts on the Statement of Assets and Liabilities to the net amounts by a counterparty, including any collateral exposure, is included in the following tables:
| Counterparty | Gross Amounts of Assets Presented in the Statement of Assets and Liabilities | Financial Instruments and Derivatives Available for Offset | Collateral Received | Net Amount of Derivative Assets |
| Citigroup, Inc. | $ 17 | $ (17) | $ — | $ — |
| Goldman Sachs & Co. | 58,353 | — | — | 58,353 |
| $ 58,370 | $ (17) | $ — | $ 58,353 | |
| Counterparty | Gross Amounts of Liabilities Presented in the Statement of Assets and Liabilities | Financial Instruments and Derivatives Available for Offset | Collateral Pledged | Net Amount of Derivative Liabilities |
| Citigroup, Inc. | $ 9,951 | $ (17) | $ — | $ 9,934 |
C. Purchases and Sales of Securities
During the six months ended June 30, 2017, purchases and sales of investment transactions (excluding short-term investments and U.S. Treasury securities) aggregated $36,900,594 and $42,506,850, respectively. There were no purchases and sales of U.S. Treasury securities during the period.
D. Related Parties
Management Agreement. Under the Investment Management Agreement with Deutsche Investment Management Americas Inc. ("DIMA" or the "Advisor"), an indirect, wholly owned subsidiary of Deutsche Bank AG, the Advisor directs the investments of the Fund in accordance with its investment objectives, policies and restrictions. The Advisor determines the securities, instruments and other contracts relating to investments to be purchased, sold or entered into by the Fund.
Pursuant to the Investment Management Agreement with the Advisor, the Fund pays a monthly management fee based on the Fund's average daily net assets, computed and accrued daily and payable monthly, at the following annual rates:
| First $250 million | .500% |
| Next $750 million | .470% |
| Next $1.5 billion | .450% |
| Next $2.5 billion | .430% |
| Next $2.5 billion | .400% |
| Next $2.5 billion | .380% |
| Next $2.5 billion | .360% |
| Over $12.5 billion | .340% |
Accordingly, for the six months ended June 30, 2017, the fee pursuant to the Investment Management Agreement was equivalent to an annualized rate (exclusive of any applicable waivers/reimbursements) of 0.50% of the Fund's average daily net assets.
For the period from January 1, 2017 through April 30, 2017, the Advisor had contractually agreed to waive all or a portion of its fees and/or reimburse certain operating expenses of the Fund to the extent necessary to maintain the total annual operating expenses (excluding certain expenses such as extraordinary expenses, taxes, brokerage and interest expense) of each class as follows:
| Class A | .72% |
| Class B | .98% |
Effective May 1, 2017 through April 30, 2018, the Advisor has contractually agreed to waive all or a portion of its fees and/or reimburse certain operating expenses of the Fund to the extent necessary to maintain the total annual operating expenses (excluding certain expenses such as extraordinary expenses, taxes, brokerage and interest expense) of each class as follows:
| Class A | .73% |
| Class B | 1.06% |
For the six months ended June 30, 2017, fees waived and/or expenses reimbursed for each class are as follows:
| Class A | $ 29,140 |
| Class B | 1,139 |
| $ 30,279 |
Administration Fee. Pursuant to an Administrative Services Agreement, DIMA provides most administrative services to the Fund. For all services provided under the Administrative Services Agreement, the Fund pays DIMA an annual fee ("Administration Fee") of 0.10% of the Fund's average daily net assets, computed and accrued daily and payable monthly. For the six months ended June 30, 2017, the Administration Fee was $50,114, of which $8,121 is unpaid.
Service Provider Fees. Deutsche AM Service Company ("DSC"), an affiliate of the Advisor, is the transfer agent, dividend-paying agent and shareholder service agent for the Fund. Pursuant to a sub-transfer agency agreement between DSC and DST Systems, Inc. ("DST"), DSC has delegated certain transfer agent, dividend-paying agent and shareholder service agent functions to DST. DSC compensates DST out of the shareholder servicing fee it receives from the Fund. For the six months ended June 30, 2017, the amounts charged to the Fund by DSC were as follows:
| Services to Shareholders | Total Aggregated | Unpaid at June 30, 2017 |
| Class A | $ 140 | $ 69 |
| Class B | 22 | 12 |
| $ 162 | $ 81 |
Distribution Service Agreement. Under the Fund's Class B 12b-1 plan, Deutsche AM Distributors, Inc. ("DDI") received a fee ("Distribution Service Fee") of 0.25% of average daily net assets of Class B shares. For the six months ended June 30, 2017, the Distribution Service Fee was $1,474, of which $35 is unpaid.
Typesetting and Filing Service Fees. Under an agreement with DIMA, DIMA is compensated for providing typesetting and certain regulatory filing services to the Fund. For the six months ended June 30, 2017, the amount charged to the Fund by DIMA included in the Statement of Operations under "Reports to shareholders" aggregated $7,707, of which $7,112 is unpaid.
Trustees' Fees and Expenses. The Fund paid retainer fees to each Trustee not affiliated with the Advisor, plus specified amounts to the Board Chairperson and Vice Chairperson and to each committee Chairperson.
Affiliated Cash Management Vehicles. The Fund may invest uninvested cash balances in Deutsche Central Cash Management Government Fund and Deutsche Variable NAV Money Fund, affiliated money market funds which are managed by the Advisor. Each affiliated money market fund is managed in accordance with Rule 2a-7 under the 1940 Act, which governs the quality, maturity, diversity and liquidity of instruments in which a money market fund may invest. Deutsche Central Cash Management Government Fund seeks to maintain a stable net asset value, and Deutsche Variable NAV Money Fund maintains a floating net asset value. The Fund indirectly bears its proportionate share of the expenses of each affiliated money market fund in which it invests. Deutsche Central Cash Management Government Fund does not pay the Advisor an investment management fee. To the extent that Deutsche Variable NAV Money Fund pays an investment management fee to the Advisor, the Advisor will waive an amount of the investment management fee payable to the Advisor by the Fund equal to the amount of the investment management fee payable on the Fund's assets invested in Deutsche Variable NAV Money Fund.
Security Lending Fees. Deutsche Bank AG serves as lending agent for the Fund. For the six months ended June 30, 2017, the Fund incurred lending agent fees to Deutsche Bank AG for the amount of $1,996.
E. Investing in High-Yield Debt Securities
High-yield debt securities or junk bonds are generally regarded as speculative with respect to the issuer’s continuing ability to meet principal and interest payments. The Fund’s performance could be hurt if an issuer of a debt security suffers an adverse change in financial condition that results in the issuer not making timely payments of interest or principal, a security downgrade or an inability to meet a financial obligation. High-yield debt securities’ total return and yield may generally be expected to fluctuate more than the total return and yield of investment-grade debt securities. A real or perceived economic downturn or an increase in market interest rates could cause a decline in the value of high-yield debt securities, result in increased redemptions and/or result in increased portfolio turnover, which could result in a decline in net asset value of the fund, reduce liquidity for certain investments and/or increase costs. High-yield debt securities are often thinly traded and can be more difficult to sell and value accurately than investment-grade debt securities as there may be no established secondary market. Investments in high yield debt securities could increase liquidity risk for the fund. In addition, the market for high-yield debt securities can experience sudden and sharp volatility which is generally associated more with investments in stocks.
F. Ownership of the Fund
At June 30, 2017, two participating insurance companies were owners of record of 10% or more of the total outstanding Class A shares of the Fund, each owning 55% and 30%. One participating insurance company was the owner of record of 10% or more of the total outstanding Class B shares of the Fund, owning 87%.
G. Line of Credit
The Fund and other affiliated funds (the "Participants") share in a $400 million revolving credit facility provided by a syndication of banks. The Fund may borrow for temporary or emergency purposes, including the meeting of redemption requests that otherwise might require the untimely disposition of securities. The Participants are charged an annual commitment fee which is allocated based on net assets, among each of the Participants. Interest is calculated at a rate per annum equal to the sum of the Federal Funds Rate plus 1.25 percent plus if the one-month LIBOR exceeds the Federal Funds Rate, the amount of such excess. The Fund may borrow up to a maximum of 33 percent of its net assets under the agreement. The Fund had no outstanding loans at June 30, 2017.
Information About Your Fund's Expenses (Unaudited)
As an investor of the Fund, you incur two types of costs: ongoing expenses and transaction costs. Ongoing expenses include management fees, distribution and service (12b-1) fees and other Fund expenses. Examples of transaction costs include contract charges, which are not shown in this section. The following tables are intended to help you understand your ongoing expenses (in dollars) of investing in the Fund and to help you compare these expenses with the ongoing expenses of investing in other mutual funds. In the most recent six-month period, the Fund limited these expenses; had it not done so, expenses would have been higher. The example in the table is based on an investment of $1,000 invested at the beginning of the six-month period and held for the entire period (January 1, 2017 to June 30, 2017).
The tables illustrate your Fund's expenses in two ways:
— Actual Fund Return. This helps you estimate the actual dollar amount of ongoing expenses (but not transaction costs) paid on a $1,000 investment in the Fund using the Fund's actual return during the period. To estimate the expenses you paid over the period, simply divide your account value by $1,000 (for example, an $8,600 account value divided by $1,000 = 8.6), then multiply the result by the number in the "Expenses Paid per $1,000" line under the share class you hold.
— Hypothetical 5% Fund Return. This helps you to compare your Fund's ongoing expenses (but not transaction costs) with those of other mutual funds using the Fund's actual expense ratio and a hypothetical rate of return of 5% per year before expenses. Examples using a 5% hypothetical Fund return may be found in the shareholder reports of other mutual funds. The hypothetical account values and expenses may not be used to estimate the actual ending account balance or expenses you paid for the period.
Please note that the expenses shown in these tables are meant to highlight your ongoing expenses only and do not reflect any transaction costs. The "Expenses Paid per $1,000" line of the tables is useful in comparing ongoing expenses only and will not help you determine the relative total expense of owning different funds. If these transaction costs had been included, your costs would have been higher.
| Expenses and Value of a $1,000 Investment for the six months ended June 30, 2017 | ||||
| Actual Fund Return | Class A | Class B | ||
| Beginning Account Value 1/1/17 | $ 1,000.00 | $ 1,000.00 | ||
| Ending Account Value 6/30/17 | $ 1,044.60 | $ 1,041.90 | ||
| Expenses Paid per $1,000* | $ 3.65 | $ 5.01 | ||
| Hypothetical 5% Fund Return | Class A | Class B | ||
| Beginning Account Value 1/1/17 | $ 1,000.00 | $ 1,000.00 | ||
| Ending Account Value 6/30/17 | $ 1,021.22 | $ 1,019.89 | ||
| Expenses Paid per $1,000* | $ 3.61 | $ 4.96 | ||
* Expenses are equal to the Fund's annualized expense ratio for each share class, multiplied by the average account value over the period, multiplied by 181 (the number of days in the most recent six-month period), then divided by 365.
| Annualized Expense Ratios | Class A | Class B | ||
| Deutsche Variable Series II — Deutsche High Income VIP | .72% | .99% |
For more information, please refer to the Fund's prospectus.
These tables do not reflect charges and fees ("contract charges") associated with the separate account that invests in the Fund or any variable life insurance policy or variable annuity contract for which the Fund is an investment option.
For an analysis of the fees associated with an investment in the fund or similar funds, please refer to the current and hypothetical expense calculators for Variable Insurance Products which can be found at deutschefunds.com/EN/resources/calculators.jsp.
Proxy Voting
The Trust's policies and procedures for voting proxies for portfolio securities and information about how the Trust voted proxies related to its portfolio securities during the most recent 12-month period ended June 30 are available on our Web site — deutschefunds.com (click on "proxy voting" at the bottom of the page) — or on the SEC's Web site — sec.gov. To obtain a written copy of the Trust's policies and procedures without charge, upon request, call us toll free at (800) 728-3337.
Advisory Agreement Board Considerations and Fee Evaluation
The Board of Trustees (hereinafter referred to as the "Board" or "Trustees") approved the renewal of Deutsche High Income VIP’s (the "Fund") investment management agreement (the "Agreement") with Deutsche Investment Management Americas Inc. ("DIMA") in September 2016.
In terms of the process that the Board followed prior to approving the Agreement, shareholders should know that:
— During the entire process, all of the Fund’s Trustees were independent of DIMA and its affiliates (the "Independent Trustees").
— The Board met frequently during the past year to discuss fund matters and dedicated a substantial amount of time to contract review matters. Over the course of several months, the Board’s Contract Committee reviewed extensive materials received from DIMA, independent third parties and independent counsel. These materials included an analysis of the Fund’s performance, fees and expenses, and profitability from a fee consultant retained by the Fund’s Independent Trustees (the "Fee Consultant"). The Board also received extensive information throughout the year regarding performance of the Fund.
— The Independent Trustees regularly meet privately with counsel to discuss contract review and other matters. In addition, the Independent Trustees were advised by the Fee Consultant in the course of their review of the Fund’s contractual arrangements and considered a comprehensive report prepared by the Fee Consultant in connection with their deliberations.
— In connection with reviewing the Agreement, the Board also reviewed the terms of the Fund’s Rule 12b-1 plan, distribution agreement, administrative services agreement, transfer agency agreement and other material service agreements.
— Based on its evaluation of the information provided, the Contract Committee presented its findings and recommendations to the Board. The Board then reviewed the Contract Committee’s findings and recommendations.
In connection with the contract review process, the Contract Committee and the Board considered the factors discussed below, among others. The Board also considered that DIMA and its predecessors have managed the Fund since its inception, and the Board believes that a long-term relationship with a capable, conscientious advisor is in the best interests of the Fund. The Board considered, generally, that shareholders chose to invest or remain invested in the Fund knowing that DIMA managed the Fund, and that the Agreement was approved by the Fund’s shareholders. DIMA is part of Deutsche Bank AG’s ("Deutsche Bank") Asset Management ("Deutsche AM") division. Deutsche AM is a global asset management business that offers a wide range of investing expertise and resources, including research capabilities in many countries throughout the world. Deutsche Bank has advised the Board that the U.S. asset management business continues to be a critical and integral part of Deutsche Bank, and that Deutsche Bank will continue to invest in Deutsche AM and seek to enhance Deutsche AM’s investment platform. Deutsche Bank also has confirmed its commitment to maintaining strong legal and compliance groups within the Deutsche AM division.
As part of the contract review process, the Board carefully considered the fees and expenses of each Deutsche fund overseen by the Board in light of the fund’s performance. In many cases, this led to the negotiation and implementation of expense caps. As part of these negotiations, the Board indicated that it would consider relaxing these caps in future years following sustained improvements in performance, among other considerations.
While shareholders may focus primarily on fund performance and fees, the Fund’s Board considers these and many other factors, including the quality and integrity of DIMA’s personnel and such other issues as back-office operations, fund valuations, and compliance policies and procedures.
Nature, Quality and Extent of Services. The Board considered the terms of the Agreement, including the scope of advisory services provided under the Agreement. The Board noted that, under the Agreement, DIMA provides portfolio management services to the Fund and that, pursuant to a separate administrative services agreement, DIMA provides administrative services to the Fund. The Board considered the experience and skills of senior management and investment personnel and the resources made available to such personnel. The Board reviewed the Fund’s performance over short-term and long-term periods and compared those returns to various agreed-upon performance measures, including market index(es) and a peer universe compiled using information supplied by Morningstar Direct ("Morningstar"), an independent fund data service. The Board also noted that it has put into place a process of identifying "Focus Funds" (e.g., funds performing poorly relative to a peer universe), and receives additional reporting from DIMA regarding such funds and, where appropriate, DIMA’s plans to address underperformance. The Board believes this process is an effective manner of identifying and addressing underperforming funds. Based on the information provided, the Board noted that for the one-, three- and five-year periods ended December 31, 2015, the Fund’s performance (Class A shares) was in the 3rd quartile of the applicable Morningstar universe (the 1st quartile being the best performers and the 4th quartile being the worst performers). The Board also observed that the Fund has outperformed its benchmark in the one- and three-year periods and has underperformed its benchmark in the five-year period ended December 31, 2015. The Board noted the disappointing investment performance of the Fund in recent periods and continued to discuss with senior management of DIMA the factors contributing to such underperformance and actions being taken to improve performance. The Board recognized the efforts by DIMA in recent years to enhance its investment platform and improve long-term performance across the Deutsche fund complex.
Fees and Expenses. The Board considered the Fund’s investment management fee schedule, operating expenses and total expense ratios, and comparative information provided by Broadridge Financial Solutions, Inc. ("Broadridge") and the Fee Consultant regarding investment management fee rates paid to other investment advisors by similar funds (1st quartile being the most favorable and 4th quartile being the least favorable). With respect to management fees paid to other investment advisors by similar funds, the Board noted that the contractual fee rates paid by the Fund, which include a 0.10% fee paid to DIMA under the Fund’s administrative services agreement, were lower than the median (1st quartile) of the applicable Broadridge peer group (based on Broadridge data provided as of December 31, 2015). The Board noted that the Fund’s Class A shares total (net) operating expenses were expected to be higher than the median (3rd quartile) of the applicable Broadridge expense universe (based on Broadridge data provided as of December 31, 2015, and analyzing Broadridge expense universe Class A (net) expenses less any applicable 12b-1 fees) ("Broadridge Universe Expenses"). The Board also reviewed data comparing each share class’s total (net) operating expenses to the applicable Broadridge Universe Expenses. The Board noted that the expense limitations agreed to by DIMA were expected to help the Fund’s total (net) operating expenses remain competitive. The Board considered the Fund’s management fee rate as compared to fees charged by DIMA to comparable Deutsche U.S. registered funds ("Deutsche Funds") and considered differences between the Fund and the comparable Deutsche Funds. The information requested by the Board as part of its review of fees and expenses also included information about institutional accounts (including any sub-advised funds and accounts) and funds offered primarily to European investors ("Deutsche Europe funds") managed by Deutsche AM. The Board noted that DIMA indicated that Deutsche AM does not manage any institutional accounts or Deutsche Europe funds comparable to the Fund.
On the basis of the information provided, the Board concluded that management fees were reasonable and appropriate in light of the nature, quality and extent of services provided by DIMA.
Profitability. The Board reviewed detailed information regarding revenues received by DIMA under the Agreement. The Board considered the estimated costs and pre-tax profits realized by DIMA from advising the Deutsche Funds, as well as estimates of the pre-tax profits attributable to managing the Fund in particular. The Board also received information regarding the estimated enterprise-wide profitability of DIMA and its affiliates with respect to all fund services in totality and by fund. The Board and the Fee Consultant reviewed DIMA’s methodology in allocating its costs to the management of the Fund. Based on the information provided, the Board concluded that the pre-tax profits realized by DIMA in connection with the management of the Fund were not unreasonable. The Board also reviewed certain publicly available information regarding the profitability of certain similar investment management firms. The Board noted that while information regarding the profitability of such firms is limited (and in some cases is not necessarily prepared on a comparable basis), DIMA and its affiliates’ overall profitability with respect to the Deutsche Funds (after taking into account distribution and other services provided to the funds by DIMA and its affiliates) was lower than the overall profitability levels of most comparable firms for which such data was available.
Economies of Scale. The Board considered whether there are economies of scale with respect to the management of the Fund and whether the Fund benefits from any economies of scale. The Board noted that the Fund’s investment management fee schedule includes fee breakpoints. The Board concluded that the Fund’s fee schedule represents an appropriate sharing between the Fund and DIMA of such economies of scale as may exist in the management of the Fund at current asset levels.
Other Benefits to DIMA and Its Affiliates. The Board also considered the character and amount of other incidental benefits received by DIMA and its affiliates, including any fees received by DIMA for administrative services provided to the Fund and any fees received by an affiliate of DIMA for distribution services. The Board also considered benefits to DIMA related to brokerage and soft-dollar allocations, including allocating brokerage to pay for research generated by parties other than the executing broker dealers, which pertain primarily to funds investing in equity securities, along with the incidental public relations benefits to DIMA related to Deutsche Funds advertising and cross-selling opportunities among DIMA products and services. The Board considered these benefits in reaching its conclusion that the Fund’s management fees were reasonable.
Compliance. The Board considered the significant attention and resources dedicated by DIMA to documenting and enhancing its compliance processes in recent years. The Board noted in particular (i) the experience, seniority and time commitment of the individuals serving as DIMA’s and the Fund’s chief compliance officers; (ii) the large number of DIMA compliance personnel; and (iii) the substantial commitment of resources by DIMA and its affiliates to compliance matters.
Based on all of the information considered and the conclusions reached, the Board unanimously determined that the continuation of the Agreement is in the best interests of the Fund. In making this determination, the Board did not give particular weight to any single factor identified above. The Board considered these factors over the course of numerous meetings, certain of which were in executive session with only the Independent Trustees and counsel present. It is possible that individual Independent Trustees may have weighed these factors differently in reaching their individual decisions to approve the continuation of the Agreement.

VS2HI-3 (R-028385-6 8/17)

June 30, 2017
Semiannual Report
Deutsche Variable Series II
Deutsche Small Mid Cap Growth VIP

Contents
3 Performance Summary 4 Portfolio Summary 4 Portfolio Management Team 5 Investment Portfolio 9 Statement of Assets and Liabilities 9 Statement of Operations 10 Statements of Changes in Net Assets 12 Financial Highlights 13 Notes to Financial Statements 16 Information About Your Fund's Expenses 17 Proxy Voting 18 Advisory Agreement Board Considerations and Fee Evaluation |
This report must be preceded or accompanied by a prospectus. To obtain an additional prospectus or summary prospectus, if available, call (800) 728-3337 or your financial representative. We advise you to consider the Fund's objectives, risks, charges and expenses carefully before investing. The summary prospectus and prospectus contain this and other important information about the Fund. Please read the prospectus carefully before you invest.
Stocks may decline in value. Smaller and medium company stocks tend to be more volatile than large company stocks. Investing in derivatives entails special risks relating to liquidity, leverage and credit that may reduce returns and/or increase volatility. The Fund may lend securities to approved institutions. See the prospectus for details.
Deutsche Asset Management represents the asset management activities conducted by Deutsche Bank AG or any of its subsidiaries.
Deutsche AM Distributors, Inc., 222 South Riverside Plaza, Chicago, IL 60606, (800) 621-1148
NOT FDIC/NCUA INSURED NO BANK GUARANTEE MAY LOSE VALUE NOT A DEPOSIT
NOT INSURED BY ANY FEDERAL GOVERNMENT AGENCY
Performance Summary June 30, 2017 (Unaudited)
Fund performance shown is historical, assumes reinvestment of all dividend and capital gain distributions and does not guarantee future results. Investment return and principal value fluctuate with changing market conditions so that, when redeemed, shares may be worth more or less than their original cost. Current performance may be lower or higher than the performance data quoted. Please contact your participating insurance company for the Fund's most recent month-end performance. Performance doesn't reflect charges and fees ("contract charges") associated with the separate account that invests in the Fund or any variable life insurance policy or variable annuity contract for which the Fund is an investment option. These charges and fees will reduce returns.
The gross expense ratio of the Fund, as stated in the fee table of the prospectus dated May 1, 2017 is 0.75% for Class A shares and may differ from the expense ratio disclosed in the Financial Highlights table in this report.
Generally accepted accounting principles require adjustments to be made to the net assets of the Fund at period end for financial reporting purposes only, and as such, the total return based on the unadjusted net asset value per share may differ from the total return reported in the financial highlights.
| Growth of an Assumed $10,000 Investment in Deutsche Small Mid Cap Growth VIP | ||
■ Deutsche Small Mid Cap Growth VIP — Class A ■ Russell 2500™ Growth Index | The Russell 2500™ Growth Index is an unmanaged index that measures the performance of the small- to mid-cap growth segment of the U.S. equity universe. It includes those Russell 2500 companies with higher price-to-book ratios and higher forecasted growth values. Index returns do not reflect any fees or expenses and it is not possible to invest directly into an index. | |
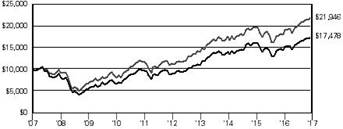 | ||
| Yearly periods ended June 30 | ||
| Comparative Results | ||||||
| Deutsche Small Mid Cap Growth VIP | 6-Month‡ | 1-Year | 3-Year | 5-Year | 10-Year | |
| Class A | Growth of $10,000 | $11,115 | $12,161 | $12,475 | $19,443 | $17,478 |
| Average annual total return | 11.15% | 21.61% | 7.65% | 14.22% | 5.74% | |
| Russell 2500 Growth Index | Growth of $10,000 | $11,063 | $12,144 | $12,477 | $19,538 | $21,946 |
| Average annual total return | 10.63% | 21.44% | 7.65% | 14.33% | 8.18% | |
The growth of $10,000 is cumulative.
‡ Total returns shown for periods less than one year are not annualized.
Portfolio Summary (Unaudited)
| Asset Allocation (As a % of Investment Portfolio excluding Securities Lending Collateral) | 6/30/17 | 12/31/16 |
| Common Stocks | 96% | 97% |
| Cash Equivalents | 4% | 3% |
| Convertible Preferred Stock | 0% | 0% |
| 100% | 100% |
| Sector Diversification (As a % of Investment Portfolio excluding Cash Equivalents and Securities Lending Collateral) | 6/30/17 | 12/31/16 |
| Information Technology | 22% | 20% |
| Health Care | 21% | 18% |
| Industrials | 18% | 20% |
| Consumer Discretionary | 17% | 20% |
| Materials | 8% | 7% |
| Financials | 5% | 7% |
| Consumer Staples | 4% | 4% |
| Energy | 3% | 3% |
| Real Estate | 2% | 1% |
| 100% | 100% |
Portfolio holdings and characteristics are subject to change.
For more complete details about the Fund's investment portfolio, see page 5.
Following the Fund's fiscal first and third quarter-end, a complete portfolio holdings listing is filed with the SEC on Form N-Q. The form will be available on the SEC's Web site at sec.gov, and it also may be reviewed and copied at the SEC's Public Reference Room in Washington, D.C. Information on the operation of the SEC's Public Reference Room may be obtained by calling (800) SEC-0330. The Fund's portfolio holdings are also posted on deutschefunds.com from time to time. Please see the Fund's current prospectus for more information.
Portfolio Management Team
Joseph Axtell, CFA, Managing Director
Peter Barsa, Director
Michael A. Sesser, CFA, Vice President
Portfolio Managers
Investment Portfolio June 30, 2017 (Unaudited)
Shares | Value ($) | |
| Common Stocks 96.2% | ||
| Consumer Discretionary 16.8% | ||
| Auto Components 2.3% | ||
| Gentherm, Inc.* | 38,010 | 1,474,788 |
| Tenneco, Inc. | 24,482 | 1,415,794 |
| 2,890,582 | ||
| Diversified Consumer Services 1.7% | ||
| Bright Horizons Family Solutions, Inc.* | 14,800 | 1,142,708 |
| ServiceMaster Global Holdings, Inc.* | 26,100 | 1,022,859 |
| 2,165,567 | ||
| Hotels, Restaurants & Leisure 1.9% | ||
| Hilton Grand Vacations, Inc.* | 26,500 | 955,590 |
| Jack in the Box, Inc. | 14,752 | 1,453,072 |
| 2,408,662 | ||
| Household Durables 3.0% | ||
| Helen of Troy Ltd.* | 11,200 | 1,053,920 |
| iRobot Corp.* | 21,355 | 1,796,810 |
| Newell Brands, Inc. | 16,958 | 909,288 |
| 3,760,018 | ||
| Leisure Products 1.1% | ||
| Polaris Industries, Inc. (a) | 14,619 | 1,348,310 |
| Media 1.2% | ||
| Cinemark Holdings, Inc. | 39,218 | 1,523,619 |
| Specialty Retail 3.9% | ||
| Burlington Stores, Inc.* | 18,900 | 1,738,611 |
| The Children's Place, Inc. | 15,941 | 1,627,576 |
| Ulta Salon, Cosmetics & Fragrance, Inc.* | 5,069 | 1,456,527 |
| 4,822,714 | ||
| Textiles, Apparel & Luxury Goods 1.7% | ||
| Carter's, Inc. | 12,586 | 1,119,525 |
| Hanesbrands, Inc. (a) | 42,994 | 995,741 |
| 2,115,266 | ||
| Consumer Staples 3.6% | ||
| Food & Staples Retailing 1.0% | ||
| Casey's General Stores, Inc. | 11,282 | 1,208,415 |
| Food Products 1.5% | ||
| Hain Celestial Group, Inc.* | 32,043 | 1,243,909 |
| SunOpta, Inc.* | 65,026 | 663,265 |
| 1,907,174 | ||
| Household Products 1.1% | ||
| Spectrum Brands Holdings, Inc. (a) | 10,800 | 1,350,432 |
| Energy 3.0% | ||
| Energy Equipment & Services 2.1% | ||
| Core Laboratories NV | 9,143 | 925,912 |
| Dril-Quip, Inc.* | 6,084 | 296,899 |
| Patterson-UTI Energy, Inc. | 37,400 | 755,106 |
| Solaris Oilfield Infrastructure, Inc. "A"* (a) | 54,920 | 633,227 |
| 2,611,144 | ||
| Oil, Gas & Consumable Fuels 0.9% | ||
| Diamondback Energy, Inc.* | 10,820 | 960,924 |
| Gulfport Energy Corp.* | 13,830 | 203,993 |
| 1,164,917 | ||
Shares | Value ($) | |
| Financials 4.7% | ||
| Banks 3.1% | ||
| FCB Financial Holdings, Inc. "A"* | 22,121 | 1,056,278 |
| Pinnacle Financial Partners, Inc. | 14,761 | 926,991 |
| South State Corp. | 10,513 | 900,964 |
| SVB Financial Group* | 5,741 | 1,009,210 |
| 3,893,443 | ||
| Capital Markets 1.6% | ||
| Lazard Ltd. "A" | 23,866 | 1,105,712 |
| Moelis & Co. "A" | 22,802 | 885,858 |
| 1,991,570 | ||
| Health Care 19.5% | ||
| Biotechnology 7.1% | ||
| Acceleron Pharma, Inc.* | 25,000 | 759,750 |
| Alkermes PLC* | 21,168 | 1,227,109 |
| Bluebird Bio, Inc.* | 8,876 | 932,424 |
| Clovis Oncology, Inc.* | 6,700 | 627,321 |
| Heron Therapeutics, Inc.* (a) | 65,100 | 901,635 |
| Ligand Pharmaceuticals, Inc.* (a) | 14,109 | 1,712,832 |
| Neurocrine Biosciences, Inc.* | 17,815 | 819,490 |
| Retrophin, Inc.* | 87,925 | 1,704,866 |
| TESARO, Inc.* | 1,900 | 265,734 |
| 8,951,161 | ||
| Health Care Equipment & Supplies 0.7% | ||
| Cardiovascular Systems, Inc.* | 29,003 | 934,767 |
| Health Care Providers & Services 7.9% | ||
| BioScrip, Inc.* | 590,100 | 1,602,121 |
| Centene Corp.* | 20,843 | 1,664,939 |
| Kindred Healthcare, Inc. | 80,458 | 937,336 |
| Molina Healthcare, Inc.* | 30,466 | 2,107,638 |
| Providence Service Corp.* | 33,322 | 1,686,426 |
| RadNet, Inc.* | 107,600 | 833,900 |
| Tivity Health, Inc.* | 26,800 | 1,067,980 |
| 9,900,340 | ||
| Life Sciences Tools & Services 0.9% | ||
| PAREXEL International Corp.* | 12,653 | 1,099,672 |
| Pharmaceuticals 2.9% | ||
| Avadel Pharmaceuticals PLC (ADR)* | 140,644 | 1,551,304 |
| Medicines Co.* (a) | 25,600 | 973,056 |
| Pacira Pharmaceuticals, Inc.* | 22,636 | 1,079,737 |
| 3,604,097 | ||
| Industrials 17.5% | ||
| Aerospace & Defense 1.1% | ||
| HEICO Corp. | 19,652 | 1,411,800 |
| Airlines 1.0% | ||
| JetBlue Airways Corp.* | 55,194 | 1,260,079 |
| Building Products 4.1% | ||
| A.O. Smith Corp. | 28,752 | 1,619,600 |
| Allegion PLC | 14,600 | 1,184,352 |
| Fortune Brands Home & Security, Inc. | 21,743 | 1,418,513 |
| Gibraltar Industries, Inc.* | 26,800 | 955,420 |
| 5,177,885 | ||
| Commercial Services & Supplies 1.0% | ||
| Advanced Disposal Services, Inc.* | 56,424 | 1,282,518 |
Shares | Value ($) | |
| Construction & Engineering 1.0% | ||
| Primoris Services Corp. | 48,342 | 1,205,649 |
| Electrical Equipment 1.7% | ||
| Atkore International Group, Inc.* | 42,738 | 963,742 |
| AZZ, Inc. | 19,600 | 1,093,680 |
| 2,057,422 | ||
| Machinery 5.6% | ||
| IDEX Corp. | 12,700 | 1,435,227 |
| John Bean Technologies Corp. | 20,100 | 1,969,800 |
| WABCO Holdings, Inc.* | 15,722 | 2,004,712 |
| Welbilt, Inc.* | 87,100 | 1,641,835 |
| 7,051,574 | ||
| Marine 0.6% | ||
| Kirby Corp.* | 10,100 | 675,185 |
| Trading Companies & Distributors 1.4% | ||
| Rush Enterprises, Inc. "A"* | 48,165 | 1,790,775 |
| Information Technology 21.4% | ||
| Electronic Equipment, Instruments & Components 5.2% | ||
| Belden, Inc. | 16,800 | 1,267,224 |
| Cognex Corp. | 31,716 | 2,692,688 |
| IPG Photonics Corp.* | 13,356 | 1,937,956 |
| Knowles Corp.* | 38,500 | 651,420 |
| 6,549,288 | ||
| Internet Software & Services 3.1% | ||
| CoStar Group, Inc.* | 7,227 | 1,905,037 |
| Five9, Inc.* | 30,600 | 658,512 |
| WebMD Health Corp.* | 23,433 | 1,374,346 |
| 3,937,895 | ||
| IT Services 5.2% | ||
| Broadridge Financial Solutions, Inc. | 23,570 | 1,780,949 |
| Cardtronics PLC "A"* | 18,277 | 600,582 |
| Euronet Worldwide, Inc.* | 13,000 | 1,135,810 |
| MAXIMUS, Inc. | 13,234 | 828,845 |
| WEX, Inc.* | 9,098 | 948,649 |
| WNS Holdings Ltd. (ADR)* | 34,828 | 1,196,690 |
| 6,491,525 | ||
| Semiconductors & Semiconductor Equipment 3.4% | ||
| Advanced Energy Industries, Inc.* | 28,893 | 1,869,088 |
| Advanced Micro Devices, Inc.* | 16,100 | 200,928 |
| Ambarella, Inc.* (a) | 12,700 | 616,585 |
| Cypress Semiconductor Corp. | 73,172 | 998,798 |
| Mellanox Technologies Ltd.* (a) | 13,000 | 562,900 |
| 4,248,299 | ||
| Software 3.9% | ||
| Aspen Technology, Inc.* | 27,883 | 1,540,814 |
| Proofpoint, Inc.* | 11,700 | 1,015,911 |
| Tyler Technologies, Inc.* | 12,931 | 2,271,589 |
| 4,828,314 | ||
Shares | Value ($) | |
| Technology Hardware, Storage & Peripherals 0.6% | ||
| Super Micro Computer, Inc.* | 30,100 | 741,965 |
| Materials 7.3% | ||
| Chemicals 3.4% | ||
| Huntsman Corp. | 52,512 | 1,356,910 |
| Minerals Technologies, Inc. | 19,378 | 1,418,470 |
| Trinseo SA | 22,115 | 1,519,300 |
| 4,294,680 | ||
| Construction Materials 1.2% | ||
| Eagle Materials, Inc. | 15,756 | 1,456,170 |
| Containers & Packaging 0.9% | ||
| Berry Global Group, Inc.* | 20,095 | 1,145,616 |
| Metals & Mining 1.8% | ||
| Commercial Metals Co. | 60,632 | 1,178,080 |
| Pan American Silver Corp. | 60,244 | 1,013,304 |
| 2,191,384 | ||
| Real Estate 2.4% | ||
| Equity Real Estate Investment Trusts (REITs) | ||
| National Storage Affiliates Trust | 53,170 | 1,228,759 |
| SBA Communications Corp.* | 6,155 | 830,309 |
| Urban Edge Properties | 40,000 | 949,200 |
| 3,008,268 | ||
| Total Common Stocks (Cost $85,641,209) | 120,458,161 | |
| Convertible Preferred Stock 0.3% | ||
| Health Care | ||
| Providence Service Corp., 5.5% (Cost $283,300) | 2,833 | 359,524 |
| Securities Lending Collateral 7.4% | ||
| Deutsche Government & Agency Securities Portfolio "Deutsche Government Cash Institutional Shares", 0.87% (b) (c) (Cost $9,294,586) | 9,294,586 | 9,294,586 |
| Cash Equivalents 3.8% | ||
| Deutsche Central Cash Management Government Fund, 1.03% (b) (Cost $4,749,140) | 4,749,140 | 4,749,140 |
| % of Net Assets | Value ($) | |
| Total Investment Portfolio (Cost $99,968,235)† | 107.7 | 134,861,411 |
| Other Assets and Liabilities, Net | (7.7) | (9,585,149) |
| Net Assets | 100.0 | 125,276,262 |
* Non-income producing security.
† The cost for federal income tax purposes was $100,581,567. At June 30, 2017, net unrealized appreciation for all securities based on tax cost was $34,279,844. This consisted of aggregate gross unrealized appreciation for all securities in which there was an excess of value over tax cost of $37,363,355 and aggregate gross unrealized depreciation for all securities in which there was an excess of tax cost over value of $3,083,511.
(a) All or a portion of these securities were on loan. In addition, "Other Assets and Liabilities, Net" may include pending sales that are also on loan. The value of securities loaned at June 30, 2017 amounted to $9,066,783, which is 7.2% of net assets.
(b) Affiliated fund managed by Deutsche Investment Management Americas Inc. The rate shown is the annualized seven-day yield at period end.
(c) Represents collateral held in connection with securities lending. Income earned by the Fund is net of borrower rebates.
ADR: American Depositary Receipt
Fair Value Measurements
Various inputs are used in determining the value of the Fund's investments. These inputs are summarized in three broad levels. Level 1 includes quoted prices in active markets for identical securities. Level 2 includes other significant observable inputs (including quoted prices for similar securities, interest rates, prepayment speeds and credit risk). Level 3 includes significant unobservable inputs (including the Fund's own assumptions in determining the fair value of investments). The level assigned to the securities valuations may not be an indication of the risk or liquidity associated with investing in those securities.
The following is a summary of the inputs used as of June 30, 2017 in valuing the Fund's investments. For information on the Fund's policy regarding the valuation of investments, please refer to the Security Valuation section of Note A in the accompanying Notes to Financial Statements.
| Assets | Level 1 | Level 2 | Level 3 | Total |
| Common Stocks (d) | $ 120,458,161 | $ — | $ — | $ 120,458,161 |
| Convertible Preferred Stock | — | — | 359,524 | 359,524 |
| Short-Term Investments (d) | 14,043,726 | — | — | 14,043,726 |
| Total | $ 134,501,887 | $ — | $ 359,524 | $ 134,861,411 |
There have been no transfers between fair value measurement levels during the period ended June 30, 2017.
(d) See Investment Portfolio for additional detailed categorizations.
The accompanying notes are an integral part of the financial statements.
Statement of Assets and Liabilities
| as of June 30, 2017 (Unaudited) | |
| Assets | |
Investments: Investments in non-affiliated securities, at value (cost $85,924,509) — including $9,066,783 of securities loaned | $ 120,817,685 |
| Investment in Deutsche Government & Agency Securities Portfolio (cost $9,294,586)* | 9,294,586 |
| Investment in Deutsche Central Cash Management Government Fund (cost $4,749,140) | 4,749,140 |
| Total investments in securities, at value (cost $99,968,235) | 134,861,411 |
| Cash | 78,008 |
| Receivable for investments sold | 277,055 |
| Dividends receivable | 51,652 |
| Interest receivable | 8,662 |
| Other assets | 779 |
| Total assets | 135,277,567 |
| Liabilities | |
| Payable upon return of securities loaned | 9,294,586 |
| Payable for investments purchased | 373,592 |
| Payable for Fund shares redeemed | 206,839 |
| Accrued management fee | 56,721 |
| Accrued Trustees' fees | 303 |
| Other accrued expenses and payables | 69,264 |
| Total liabilities | 10,001,305 |
| Net assets, at value | $ 125,276,262 |
| Net Assets Consist of | |
| Distribution in excess of net investment income | (7,913) |
| Net unrealized appreciation (depreciation) on investments | 34,893,176 |
| Accumulated net realized gain (loss) | 8,079,752 |
| Paid-in capital | 82,311,247 |
| Net assets, at value | $ 125,276,262 |
Class A Net Asset Value, offering and redemption price per share ($125,276,262 ÷ 6,273,734 outstanding shares of beneficial interest, no par value, unlimited number of shares authorized) | $ 19.97 |
* Represents collateral on securities loaned.
The accompanying notes are an integral part of the financial statements.
Statement of Operations
| for the six months ended June 30, 2017 (Unaudited) | |
| Investment Income | |
Income: Dividends (net of foreign taxes withheld of $1,768) | $ 417,179 |
| Income distributions — Deutsche Central Cash Management Government Fund | 13,173 |
| Securities lending income, net of borrower rebates | 30,090 |
| Total income | 460,442 |
Expenses: Management fee | 336,924 |
| Administration fee | 61,259 |
| Services to shareholders | 896 |
| Custodian fee | 1,479 |
| Professional fees | 37,494 |
| Reports to shareholders | 14,067 |
| Trustees' fees and expenses | 4,009 |
| Other | 3,804 |
| Total expenses | 459,932 |
| Net investment income (loss) | 510 |
| Realized and Unrealized Gain (Loss) | |
| Net realized gain (loss) from investments | 8,764,955 |
| Change in net unrealized appreciation (depreciation) on investments | 4,237,960 |
| Net gain (loss) | 13,002,915 |
| Net increase (decrease) in net assets resulting from operations | $ 13,003,425 |
The accompanying notes are an integral part of the financial statements.
Statements of Changes in Net Assets
| Increase (Decrease) in Net Assets | Six Months Ended June 30, 2017 (Unaudited) | Year Ended December 31, 2016 | |
Operations: Net investment income (loss) | $ 510 | $ 124,275 | |
| Net realized gain (loss) | 8,764,955 | 6,541,357 | |
| Change in net unrealized appreciation (depreciation) | 4,237,960 | 1,718,283 | |
| Net increase (decrease) in net assets resulting from operations | 13,003,425 | 8,383,915 | |
Distributions to shareholders from: Net investment income Class A | (124,128) | — | |
Net realized gains Class A | (6,452,819) | (20,264,895) | |
| Total distributions | (6,576,947) | (20,264,895) | |
Fund share transactions: Class A Proceeds from shares sold | 2,344,191 | 2,382,262 | |
| Reinvestment of distributions | 6,576,947 | 20,264,895 | |
| Payments for shares redeemed | (8,448,447) | (27,583,809) | |
| Net increase (decrease) in net assets from Class A share transactions | 472,691 | (4,936,652) | |
| Increase (decrease) in net assets | 6,899,169 | (16,817,632) | |
| Net assets at beginning of period | 118,377,093 | 135,194,725 | |
| Net assets at end of period (including distribution in excess of and undistributed net investment income $7,913 and $115,705, respectively) | $ 125,276,262 | $ 118,377,093 | |
| Other Information | |||
Class A Shares outstanding at beginning of period | 6,244,931 | 6,467,679 | |
| Shares sold | 119,626 | 129,160 | |
| Shares issued to shareholders in reinvestment of distributions | 336,589 | 1,137,838 | |
| Shares redeemed | (427,412) | (1,489,746) | |
| Net increase (decrease) in Class A shares | 28,803 | (222,748) | |
| Shares outstanding at end of period | 6,273,734 | 6,244,931 | |
The accompanying notes are an integral part of the financial statements.
Financial Highlights
| Class A | Six Months Ended 6/30/17 (Unaudited) | Years Ended December 31, | |||||
| 2016 | 2015 | 2014 | 2013 | 2012 | |||
| Selected Per Share Data | |||||||
| Net asset value, beginning of period | $ 18.96 | $ 20.90 | $ 22.83 | $ 21.59 | $ 15.14 | $ 13.24 | |
Income (loss) from investment operations: Net investment income (loss)a | .00*** | .02 | (.04) | (.02) | (.04) | .02 | |
| Net realized and unrealized gain (loss) | 2.09 | 1.64 | (.00) | 1.26 | 6.51 | 1.88 | |
| Total from investment operations | 2.09 | 1.66 | (.04) | 1.24 | 6.47 | 1.90 | |
Less distributions from: Net investment income | (.02) | — | — | — | (.02) | — | |
| Net realized gains | (1.06) | (3.60) | (1.89) | — | — | — | |
| Total distributions | (1.08) | (3.60) | (1.89) | — | (.02) | — | |
| Net asset value, end of period | $ 19.97 | $ 18.96 | $ 20.90 | $ 22.83 | $ 21.59 | $ 15.14 | |
| Total Return (%) | 11.15** | 9.08 | (.90) | 5.74 | 42.78 | 14.35 | |
| Ratios to Average Net Assets and Supplemental Data | |||||||
| Net assets, end of period ($ millions) | 125 | 118 | 135 | 172 | 187 | 145 | |
| Ratio of expenses (%)c | .75* | .75 | .72 | .73 | .72 | .74 | |
| Ratio of net investment income (loss) (%) | .00b* | .11 | (.19) | (.11) | (.22) | .11 | |
| Portfolio turnover rate (%) | 21** | 28 | 42 | 44 | 56 | 57 | |
a Based on average shares outstanding during the period. b Amount is less than .005%. c Expense ratio does not reflect charges and fees associated with the separate account that invests in the Fund or any variable life insurance policy or variable annuity contract for which the Fund is an investment option. * Annualized ** Not annualized *** Amount is less than $.005. | |||||||
Notes to Financial Statements (Unaudited)
A. Organization and Significant Accounting Policies
Deutsche Small Mid Cap Growth VIP (the "Fund") is a diversified series of Deutsche Variable Series II (the "Trust"), which is registered under the Investment Company Act of 1940, as amended (the "1940 Act"), as an open-end management investment company organized as a Massachusetts business trust.
The Fund's financial statements are prepared in accordance with accounting principles generally accepted in the United States of America ("U.S. GAAP") which require the use of management estimates. Actual results could differ from those estimates. The Fund qualifies as an investment company under Topic 946 of Accounting Standards Codification of U.S. GAAP. The policies described below are followed consistently by the Fund in the preparation of its financial statements.
Security Valuation. Investments are stated at value determined as of the close of regular trading on the New York Stock Exchange on each day the exchange is open for trading.
Various inputs are used in determining the value of the Fund's investments. These inputs are summarized in three broad levels. Level 1 includes quoted prices in active markets for identical securities. Level 2 includes other significant observable inputs (including quoted prices for similar securities, interest rates, prepayment speeds and credit risk). Level 3 includes significant unobservable inputs (including the Fund's own assumptions in determining the fair value of investments). The level assigned to the securities valuations may not be an indication of the risk or liquidity associated with investing in those securities.
Equity securities and exchange-trade funds ("ETFs") are valued at the most recent sale price or official closing price reported on the exchange (U.S. or foreign) or over-the-counter market on which they trade. Securities for which no sales are reported are valued at the calculated mean between the most recent bid and asked quotations on the relevant market or, if a mean cannot be determined, at the most recent bid quotation. Equity securities and ETFs are generally categorized as Level 1.
Investments in open-end investment companies are valued at their net asset value each business day and are categorized as Level 1.
Securities and other assets for which market quotations are not readily available or for which the above valuation procedures are deemed not to reflect fair value are valued in a manner that is intended to reflect their fair value as determined in accordance with procedures approved by the Board and are generally categorized as Level 3. In accordance with the Fund's valuation procedures, factors considered in determining value may include, but are not limited to, the type of the security; the size of the holding; the initial cost of the security; the existence of any contractual restrictions on the security's disposition; the price and extent of public trading in similar securities of the issuer or of comparable companies; quotations or evaluated prices from broker-dealers and/or pricing services; information obtained from the issuer, analysts, and/or the appropriate stock exchange (for exchange-traded securities); an analysis of the company's or issuer's financial statements; an evaluation of the forces that influence the issuer and the market(s) in which the security is purchased and sold; and with respect to debt securities, the maturity, coupon, creditworthiness, currency denomination and the movement of the market in which the security is normally traded. The value determined under these procedures may differ from published values for the same securities.
Disclosure about the classification of fair value measurements is included in a table following the Fund's Investment Portfolio.
Securities Lending. Deutsche Bank AG, as lending agent, lends securities of the Fund to certain financial institutions under the terms of its securities lending agreement. During the term of the loans, the Fund continues to receive interest and dividends generated by the securities and to participate in any changes in their market value. The Fund requires the borrowers of the securities to maintain collateral with the Fund consisting of either cash or liquid, unencumbered assets having a value at least equal to the value of the securities loaned. When the collateral falls below specified amounts, the lending agent will use its best effort to obtain additional collateral on the next business day to meet required amounts under the securities lending agreement. As of period end, any securities on loan were collateralized by cash. During the six months ended June 30, 2017, the Fund invested the cash collateral into a joint trading account in affiliated money market funds managed by Deutsche Investment Management Americas Inc. As of June 30, 2017, the Fund invested the cash collateral in Deutsche Government & Agency Securities Portfolio. Deutsche Investment Management Americas Inc. receives a management/administration fee (0.13% annualized effective rate as of June 30, 2017) on the cash collateral invested in Deutsche Government & Agency Securities Portfolio. The Fund receives compensation for lending its securities either in the form of fees or by earning interest on invested cash collateral net of borrower rebates and fees paid to a lending agent. Either the Fund or the borrower may terminate the loan at any time, and the borrower, after notice, is required to return borrowed securities within a standard time period. There may be risks of delay and costs in recovery of securities or even loss of rights in the collateral should the borrower of the securities fail financially. If the Fund is not able to recover securities lent, the Fund may sell the collateral and purchase a replacement investment in the market, incurring the risk that the value of the replacement security is greater than the value of the collateral. The Fund is also subject to all investment risks associated with the reinvestment of any cash collateral received, including, but not limited to, interest rate, credit and liquidity risk associated with such investments.
As of June 30, 2017, the Fund had securities on loan, which were classified as common stock in the Investment Portfolio. The value of the related collateral exceeded the value of the securities loaned at period end. As of period end, the remaining contractual maturity of the collateral agreements were overnight and continuous.
Federal Income Taxes. The Fund's policy is to comply with the requirements of the Internal Revenue Code, as amended, which are applicable to regulated investment companies, and to distribute all of its taxable income to its shareholders.
The Fund has reviewed the tax positions for the open tax years as of December 31, 2016 and has determined that no provision for income tax and/or uncertain tax provisions is required in the Fund's financial statements. The Fund's federal tax returns for the prior three fiscal years remain open subject to examination by the Internal Revenue Service.
Distribution of Income and Gains. Distributions from net investment income of the Fund, if any, are declared and distributed to shareholders annually. Net realized gains from investment transactions, in excess of available capital loss carryforwards, would be taxable to the Fund if not distributed and, therefore, will be distributed to shareholders at least annually. The Fund may also make additional distributions for tax purposes if necessary.
The timing and characterization of certain income and capital gain distributions are determined annually in accordance with federal tax regulations which may differ from accounting principles generally accepted in the United States of America. These differences primarily relate to certain securities sold at a loss. As a result, net investment income (loss) and net realized gain (loss) on investment transactions for a reporting period may differ significantly from distributions during such period. Accordingly, the Fund may periodically make reclassifications among certain of its capital accounts without impacting the net asset value of the Fund.
The tax character of current year distributions will be determined at the end of the current fiscal year.
Expenses. Expenses of the Trust arising in connection with a specific fund are allocated to that fund. Other Trust expenses which cannot be directly attributed to a fund are apportioned among the funds in the Trust based upon the relative net assets or other appropriate measures.
Contingencies. In the normal course of business, the Fund may enter into contracts with service providers that contain general indemnification clauses. The Fund's maximum exposure under these arrangements is unknown, as this would involve future claims that may be made against the Fund that have not yet been made. However, based on experience, the Fund expects the risk of loss to be remote.
Other. Investment transactions are accounted for on a trade date plus one basis for daily net asset value calculations. However, for financial reporting purposes, investment transactions are reported on trade date. Interest income is recorded on the accrual basis. Dividend income is recorded on the ex-dividend date net of foreign withholding taxes. Realized gains and losses from investment transactions are recorded on an identified cost basis. Proceeds from litigation payments, if any, are included in net realized gain (loss) from investments.
B. Purchases and Sales of Securities
During the six months ended June 30, 2017, purchases and sales of investment transactions (excluding short-term investments) aggregated $24,750,943 and $32,556,576, respectively.
C. Related Parties
Management Agreement. Under the Investment Management Agreement with Deutsche Investment Management Americas Inc. ("DIMA" or the "Advisor"), an indirect, wholly owned subsidiary of Deutsche Bank AG, the Advisor directs the investments of the Fund in accordance with its investment objectives, policies and restrictions. The Advisor determines the securities, instruments and other contracts relating to investments to be purchased, sold or entered into by the Fund.
Pursuant to the Investment Management Agreement with the Advisor, the Fund pays a monthly management fee based on the Fund's average daily net assets, computed and accrued daily and payable monthly, at the following annual rates:
| First $250 million | .550% |
| Next $750 million | .525% |
| Over $1 billion | .500% |
Accordingly, for the six months ended June 30, 2017, the fee pursuant to the Investment Management Agreement was equivalent to an annualized rate (exclusive of any applicable waivers/reimbursements) of 0.55% of the Fund's average daily net assets.
For the period from January 1, 2017 through September 30, 2017, the Advisor has contractually agreed to waive its fees and/or reimburse certain operating expenses to the extent necessary to maintain the total annual operating expenses (excluding certain expenses such as extraordinary expenses, taxes, brokerage and interest expense) of Class A at 0.88%.
Administration Fee. Pursuant to an Administrative Services Agreement, DIMA provides most administrative services to the Fund. For all services provided under the Administrative Services Agreement, the Fund pays DIMA an annual fee ("Administration Fee") of 0.10% of the Fund's average daily net assets, computed and accrued daily and payable monthly. For the six months ended June 30, 2017, the Administration Fee was $61,259, of which $10,313 is unpaid.
Service Provider Fees. Deutsche AM Service Company ("DSC"), an affiliate of the Advisor, is the transfer agent, dividend-paying agent and shareholder service agent for the Fund. Pursuant to a sub-transfer agency agreement between DSC and DST Systems, Inc. ("DST"), DSC has delegated certain transfer agent, dividend-paying agent and shareholder service agent functions to DST. DSC compensates DST out of the shareholder servicing fee it receives from the Fund. For the six months ended June 30, 2017, the amounts charged to the Fund by DSC aggregated $181, of which $98 is unpaid.
Typesetting and Filing Service Fees. Under an agreement with DIMA, DIMA is compensated for providing typesetting and certain regulatory filing services to the Fund. For the six months ended June 30, 2017, the amount charged to the Fund by DIMA included in the Statement of Operations under "Reports to shareholders" aggregated $5,255, of which $4,918 is unpaid.
Trustees' Fees and Expenses. The Fund paid retainer fees to each Trustee not affiliated with the Advisor, plus specified amounts to the Board Chairperson and Vice Chairperson and to each committee Chairperson.
Affiliated Cash Management Vehicles. The Fund may invest uninvested cash balances in Deutsche Central Cash Management Government Fund and Deutsche Variable NAV Money Fund, affiliated money market funds which are managed by the Advisor. Each affiliated money market fund is managed in accordance with Rule 2a-7 under the 1940 Act, which governs the quality, maturity, diversity and liquidity of instruments in which a money market fund may invest. Deutsche Central Cash Management Government Fund seeks to maintain a stable net asset value, and Deutsche Variable NAV Money Fund maintains a floating net asset value. The Fund indirectly bears its proportionate share of the expenses of each affiliated money market fund in which it invests. Deutsche Central Cash Management Government Fund does not pay the Advisor an investment management fee. To the extent that Deutsche Variable NAV Money Fund pays an investment management fee to the Advisor, the Advisor will waive an amount of the investment management fee payable to the Advisor by the Fund equal to the amount of the investment management fee payable on the Fund's assets invested in Deutsche Variable NAV Money Fund.
Securities Lending Agent Fees. Deutsche Bank AG serves as securities lending agent for the Fund. For the six months ended June 30, 2017, the Fund incurred securities lending agent fees to Deutsche Bank AG in the amount of $2,265.
D. Ownership of the Fund
At June 30, 2017, two participating insurance companies were owners of record of 10% or more of the total outstanding Class A shares of the Fund, each owning 72% and 23%.
E. Line of Credit
The Fund and other affiliated funds (the "Participants") share in a $400 million revolving credit facility provided by a syndication of banks. The Fund may borrow for temporary or emergency purposes, including the meeting of redemption requests that otherwise might require the untimely disposition of securities. The Participants are charged an annual commitment fee which is allocated based on net assets, among each of the Participants. Interest is calculated at a rate per annum equal to the sum of the Federal Funds Rate plus 1.25 percent plus if the one-month LIBOR exceeds the Federal Funds Rate the amount of such excess. The Fund may borrow up to a maximum of 33 percent of its net assets under the agreement. The Fund had no outstanding loans at June 30, 2017.
Information About Your Fund's Expenses (Unaudited)
As an investor of the Fund, you incur two types of costs: ongoing expenses and transaction costs. Ongoing expenses include management fees and other Fund expenses. Examples of transaction costs include contract charges, which are not shown in this section. The following tables are intended to help you understand your ongoing expenses (in dollars) of investing in the Fund and to help you compare these expenses with the ongoing expenses of investing in other mutual funds. The example in the table is based on an investment of $1,000 invested at the beginning of the six-month period and held for the entire period (January 1, 2017 to June 30, 2017).
The tables illustrate your Fund's expenses in two ways:
— Actual Fund Return. This helps you estimate the actual dollar amount of ongoing expenses (but not transaction costs) paid on a $1,000 investment in the Fund using the Fund's actual return during the period. To estimate the expenses you paid over the period, simply divide your account value by $1,000 (for example, an $8,600 account value divided by $1,000 = 8.6), then multiply the result by the number in the "Expenses Paid per $1,000" line under the share class you hold.
— Hypothetical 5% Fund Return. This helps you to compare your Fund's ongoing expenses (but not transaction costs) with those of other mutual funds using the Fund's actual expense ratio and a hypothetical rate of return of 5% per year before expenses. Examples using a 5% hypothetical Fund return may be found in the shareholder reports of other mutual funds. The hypothetical account values and expenses may not be used to estimate the actual ending account balance or expenses you paid for the period.
Please note that the expenses shown in these tables are meant to highlight your ongoing expenses only and do not reflect any transaction costs. The "Expenses Paid per $1,000" line of the tables is useful in comparing ongoing expenses only and will not help you determine the relative total expense of owning different funds. If these transaction costs had been included, your costs would have been higher.
| Expenses and Value of a $1,000 Investment for the six months ended June 30, 2017 | ||
| Actual Fund Return | Class A | |
| Beginning Account Value 1/1/17 | $ 1,000.00 | |
| Ending Account Value 6/30/17 | $ 1,111.50 | |
| Expenses Paid per $1,000* | $ 3.93 | |
| Hypothetical 5% Fund Return | Class A | |
| Beginning Account Value 1/1/17 | $ 1,000.00 | |
| Ending Account Value 6/30/17 | $ 1,021.08 | |
| Expenses Paid per $1,000* | $ 3.76 | |
* Expenses are equal to the Fund's annualized expense ratio, multiplied by the average account value over the period, multiplied by 181 (the number of days in the most recent six-month period), then divided by 365.
| Annualized Expense Ratio | Class A | |
| Deutsche Variable Series II — Deutsche Small Mid Cap Growth VIP | .75% |
For more information, please refer to the Fund's prospectus.
These tables do not reflect charges and fees ("contract charges") associated with the separate account that invests in the Fund or any variable life insurance policy or variable annuity contract for which the Fund is an investment option.
For an analysis of the fees associated with an investment in the fund or similar funds, please refer to the current and hypothetical expense calculators for Variable Insurance Products which can be found at deutschefunds.com/EN/resources/calculators.jsp.
Proxy Voting
The Trust's policies and procedures for voting proxies for portfolio securities and information about how the Trust voted proxies related to its portfolio securities during the most recent 12-month period ended June 30 are available on our Web site — deutschefunds.com (click on "proxy voting" at the bottom of the page) — or on the SEC's Web site — sec.gov. To obtain a written copy of the Trust's policies and procedures without charge, upon request, call us toll free at (800) 728-3337.
Advisory Agreement Board Considerations and Fee Evaluation
The Board of Trustees (hereinafter referred to as the "Board" or "Trustees") approved the renewal of Deutsche Small Mid Cap Growth VIP’s (the "Fund") investment management agreement (the "Agreement") with Deutsche Investment Management Americas Inc. ("DIMA") in September 2016.
In terms of the process that the Board followed prior to approving the Agreement, shareholders should know that:
— During the entire process, all of the Fund’s Trustees were independent of DIMA and its affiliates (the "Independent Trustees").
— The Board met frequently during the past year to discuss fund matters and dedicated a substantial amount of time to contract review matters. Over the course of several months, the Board’s Contract Committee reviewed extensive materials received from DIMA, independent third parties and independent counsel. These materials included an analysis of the Fund’s performance, fees and expenses, and profitability from a fee consultant retained by the Fund’s Independent Trustees (the "Fee Consultant"). The Board also received extensive information throughout the year regarding performance of the Fund.
— The Independent Trustees regularly meet privately with counsel to discuss contract review and other matters. In addition, the Independent Trustees were advised by the Fee Consultant in the course of their review of the Fund’s contractual arrangements and considered a comprehensive report prepared by the Fee Consultant in connection with their deliberations.
— In connection with reviewing the Agreement, the Board also reviewed the terms of the Fund’s distribution agreement, administrative services agreement, transfer agency agreement and other material service agreements.
— Based on its evaluation of the information provided, the Contract Committee presented its findings and recommendations to the Board. The Board then reviewed the Contract Committee’s findings and recommendations.
In connection with the contract review process, the Contract Committee and the Board considered the factors discussed below, among others. The Board also considered that DIMA and its predecessors have managed the Fund since its inception, and the Board believes that a long-term relationship with a capable, conscientious advisor is in the best interests of the Fund. The Board considered, generally, that shareholders chose to invest or remain invested in the Fund knowing that DIMA managed the Fund, and that the Agreement was approved by the Fund’s shareholders. DIMA is part of Deutsche Bank AG’s ("Deutsche Bank") Asset Management ("Deutsche AM") division. Deutsche AM is a global asset management business that offers a wide range of investing expertise and resources, including research capabilities in many countries throughout the world. Deutsche Bank has advised the Board that the U.S. asset management business continues to be a critical and integral part of Deutsche Bank, and that Deutsche Bank will continue to invest in Deutsche AM and seek to enhance Deutsche AM’s investment platform. Deutsche Bank also has confirmed its commitment to maintaining strong legal and compliance groups within the Deutsche AM division.
As part of the contract review process, the Board carefully considered the fees and expenses of each Deutsche fund overseen by the Board in light of the fund’s performance. In many cases, this led to the negotiation and implementation of expense caps. As part of these negotiations, the Board indicated that it would consider relaxing these caps in future years following sustained improvements in performance, among other considerations.
While shareholders may focus primarily on fund performance and fees, the Fund’s Board considers these and many other factors, including the quality and integrity of DIMA’s personnel and such other issues as back-office operations, fund valuations, and compliance policies and procedures.
Nature, Quality and Extent of Services. The Board considered the terms of the Agreement, including the scope of advisory services provided under the Agreement. The Board noted that, under the Agreement, DIMA provides portfolio management services to the Fund and that, pursuant to a separate administrative services agreement, DIMA provides administrative services to the Fund. The Board considered the experience and skills of senior management and investment personnel and the resources made available to such personnel. The Board reviewed the Fund’s performance over short-term and long-term periods and compared those returns to various agreed-upon performance measures, including market index(es) and a peer universe compiled using information supplied by Morningstar Direct ("Morningstar"), an independent fund data service. The Board also noted that it has put into place a process of identifying "Focus Funds" (e.g., funds performing poorly relative to a peer universe), and receives additional reporting from DIMA regarding such funds and, where appropriate, DIMA’s plans to address underperformance. The Board believes this process is an effective manner of identifying and addressing underperforming funds. Based on the information provided, the Board noted that for the one-, three- and five-year periods ended December 31, 2015, the Fund’s performance (Class A shares) was in the 3rd quartile, 2nd quartile and 2nd quartile, respectively, of the applicable Morningstar universe (the 1st quartile being the best performers and the 4th quartile being the worst performers). The Board also observed that the Fund has underperformed its benchmark in the one-, three- and five-year periods ended December 31, 2015.
Fees and Expenses. The Board considered the Fund’s investment management fee schedule, operating expenses and total expense ratios, and comparative information provided by Broadridge Financial Solutions, Inc. ("Broadridge") and the Fee Consultant regarding investment management fee rates paid to other investment advisors by similar funds (1st quartile being the most favorable and 4th quartile being the least favorable). With respect to management fees paid to other investment advisors by similar funds, the Board noted that the contractual fee rates paid by the Fund, which include a 0.10% fee paid to DIMA under the Fund’s administrative services agreement, were lower than the median (1st quartile) of the applicable Broadridge peer group (based on Broadridge data provided as of December 31, 2015). The Board noted that the Fund’s Class A shares total (net) operating expenses were expected to be lower than the median (1st quartile) of the applicable Broadridge expense universe (based on Broadridge data provided as of December 31, 2015, and analyzing Broadridge expense universe Class A (net) expenses less any applicable 12b-1 fees) ("Broadridge Universe Expenses"). The Board noted that the expense limitation agreed to by DIMA was expected to help the Fund’s total (net) operating expenses remain competitive. The Board considered the Fund’s management fee rate as compared to fees charged by DIMA to a comparable Deutsche U.S. registered fund ("Deutsche Funds") and considered differences between the Fund and the comparable Deutsche Fund. The information requested by the Board as part of its review of fees and expenses also included information about institutional accounts (including any sub-advised funds and accounts) and funds offered primarily to European investors ("Deutsche Europe funds") managed by Deutsche AM. The Board noted that DIMA indicated that Deutsche AM does not manage any institutional accounts or Deutsche Europe funds comparable to the Fund.
On the basis of the information provided, the Board concluded that management fees were reasonable and appropriate in light of the nature, quality and extent of services provided by DIMA.
Profitability. The Board reviewed detailed information regarding revenues received by DIMA under the Agreement. The Board considered the estimated costs and pre-tax profits realized by DIMA from advising the Deutsche Funds, as well as estimates of the pre-tax profits attributable to managing the Fund in particular. The Board also received information regarding the estimated enterprise-wide profitability of DIMA and its affiliates with respect to all fund services in totality and by fund. The Board and the Fee Consultant reviewed DIMA’s methodology in allocating its costs to the management of the Fund. Based on the information provided, the Board concluded that the pre-tax profits realized by DIMA in connection with the management of the Fund were not unreasonable. The Board also reviewed certain publicly available information regarding the profitability of certain similar investment management firms. The Board noted that while information regarding the profitability of such firms is limited (and in some cases is not necessarily prepared on a comparable basis), DIMA and its affiliates’ overall profitability with respect to the Deutsche Funds (after taking into account distribution and other services provided to the funds by DIMA and its affiliates) was lower than the overall profitability levels of most comparable firms for which such data was available.
Economies of Scale. The Board considered whether there are economies of scale with respect to the management of the Fund and whether the Fund benefits from any economies of scale. The Board noted that the Fund’s investment management fee schedule includes fee breakpoints. The Board concluded that the Fund’s fee schedule represents an appropriate sharing between the Fund and DIMA of such economies of scale as may exist in the management of the Fund at current asset levels.
Other Benefits to DIMA and Its Affiliates. The Board also considered the character and amount of other incidental benefits received by DIMA and its affiliates, including any fees received by DIMA for administrative services provided to the Fund. The Board also considered benefits to DIMA related to brokerage and soft-dollar allocations, including allocating brokerage to pay for research generated by parties other than the executing broker dealers, which pertain primarily to funds investing in equity securities, along with the incidental public relations benefits to DIMA related to Deutsche Funds advertising and cross-selling opportunities among DIMA products and services. The Board considered these benefits in reaching its conclusion that the Fund’s management fees were reasonable.
Compliance. The Board considered the significant attention and resources dedicated by DIMA to documenting and enhancing its compliance processes in recent years. The Board noted in particular (i) the experience, seniority and time commitment of the individuals serving as DIMA’s and the Fund’s chief compliance officers; (ii) the large number of DIMA compliance personnel; and (iii) the substantial commitment of resources by DIMA and its affiliates to compliance matters.
Based on all of the information considered and the conclusions reached, the Board unanimously determined that the continuation of the Agreement is in the best interests of the Fund. In making this determination, the Board did not give particular weight to any single factor identified above. The Board considered these factors over the course of numerous meetings, certain of which were in executive session with only the Independent Trustees and counsel present. It is possible that individual Independent Trustees may have weighed these factors differently in reaching their individual decisions to approve the continuation of the Agreement.

VS2SMCG-3 (R-028388-6 8/17)

June 30, 2017
Semiannual Report
Deutsche Variable Series II
Deutsche Small Mid Cap Value VIP

Contents
3 Performance Summary 4 Portfolio Summary 4 Portfolio Management Team 5 Investment Portfolio 9 Statement of Assets and Liabilities 9 Statement of Operations 10 Statements of Changes in Net Assets 12 Financial Highlights 13 Notes to Financial Statements 17 Information About Your Fund's Expenses 18 Proxy Voting 19 Advisory Agreement Board Considerations and Fee Evaluation |
This report must be preceded or accompanied by a prospectus. To obtain an additional prospectus or summary prospectus, if available, call (800) 728-3337 or your financial representative. We advise you to consider the Fund's objectives, risks, charges and expenses carefully before investing. The summary prospectus and prospectus contain this and other important information about the Fund. Please read the prospectus carefully before you invest.
Stocks may decline in value. Smaller and medium company stocks tend to be more volatile than large company stocks. Any fund that focuses in a particular segment of the market or region of the world will generally be more volatile than a fund that invests more broadly. The Fund may lend securities to approved institutions. See the prospectus for details.
Deutsche Asset Management represents the asset management activities conducted by Deutsche Bank AG or any of its subsidiaries.
Deutsche AM Distributors, Inc., 222 South Riverside Plaza, Chicago, IL 60606, (800) 621-1148
NOT FDIC/NCUA INSURED NO BANK GUARANTEE MAY LOSE VALUE NOT A DEPOSIT
NOT INSURED BY ANY FEDERAL GOVERNMENT AGENCY
Performance Summary June 30, 2017 (Unaudited)
Fund performance shown is historical, assumes reinvestment of all dividend and capital gain distributions and does not guarantee future results. Investment return and principal value fluctuate with changing market conditions so that, when redeemed, shares may be worth more or less than their original cost. Current performance may be lower or higher than the performance data quoted. Please contact your participating insurance company for the Fund's most recent month-end performance. Performance doesn't reflect charges and fees ("contract charges") associated with the separate account that invests in the Fund or any variable life insurance policy or variable annuity contract for which the Fund is an investment option. These charges and fees will reduce returns. While all share classes have the same underlying portfolio, their performance will differ.
The gross expense ratios of the Fund, as stated in the fee table of the prospectus dated May 1, 2017 are 0.83% and 1.19% for Class A and Class B shares, respectively, and may differ from the expense ratios disclosed in the Financial Highlights tables in this report.
Generally accepted accounting principles require adjustments to be made to the net assets of the Fund at period end for financial reporting purposes only, and as such, the total return based on the unadjusted net asset value per share may differ from the total return reported in the financial highlights.
| Growth of an Assumed $10,000 Investment in Deutsche Small Mid Cap Value VIP | ||
■ Deutsche Small Mid Cap Value VIP — Class A ■ Russell 2500™ Value Index | The Russell 2500™ Value Index is an unmanaged Index of those securities in the Russell 3000® Index with lower price-to-book ratios and lower forecasted growth values. Index returns do not reflect any fees or expenses and it is not possible to invest directly into an index. | |
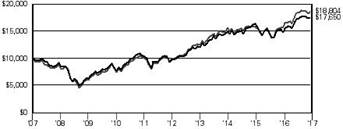 | ||
| Yearly periods ended June 30 | ||
| Comparative Results | ||||||
| Deutsche Small Mid Cap Value VIP | 6-Month‡ | 1-Year | 3-Year | 5-Year | 10-Year | |
| Class A | Growth of $10,000 | $10,212 | $11,881 | $11,741 | $18,143 | $17,650 |
| Average annual total return | 2.12% | 18.81% | 5.50% | 12.65% | 5.85% | |
| Russell 2500 Value Index | Growth of $10,000 | $10,195 | $11,836 | $11,979 | $18,991 | $18,804 |
| Average annual total return | 1.95% | 18.36% | 6.21% | 13.69% | 6.52% | |
| Deutsche Small Mid Cap Value VIP | 6-Month‡ | 1-Year | 3-Year | 5-Year | 10-Year | |
| Class B | Growth of $10,000 | $10,193 | $11,837 | $11,622 | $17,813 | $17,034 |
| Average annual total return | 1.93% | 18.37% | 5.14% | 12.24% | 5.47% | |
| Russell 2500 Value Index | Growth of $10,000 | $10,195 | $11,836 | $11,979 | $18,991 | $18,804 |
| Average annual total return | 1.95% | 18.36% | 6.21% | 13.69% | 6.52% | |
The growth of $10,000 is cumulative.
‡ Total returns shown for periods less than one year are not annualized.
Portfolio Summary (Unaudited)
| Asset Allocation (As a % of Investment Portfolio excluding Securities Lending Collateral) | 6/30/17 | 12/31/16 |
| Common Stocks | 96% | 95% |
| Cash Equivalents | 4% | 5% |
| 100% | 100% |
| Sector Diversification (As a % of Investment Portfolio excluding Cash Equivalents and Securities Lending Collateral) | 6/30/17 | 12/31/16 |
| Financials | 20% | 24% |
| Industrials | 20% | 15% |
| Information Technology | 14% | 15% |
| Real Estate | 12% | 7% |
| Consumer Discretionary | 10% | 14% |
| Materials | 6% | 3% |
| Utilities | 6% | 5% |
| Energy | 5% | 7% |
| Consumer Staples | 4% | 6% |
| Health Care | 3% | 4% |
| 100% | 100% |
Portfolio holdings and characteristics are subject to change.
For more complete details about the Fund's investment portfolio, see page 5.
Following the Fund's fiscal first and third quarter-end, a complete portfolio holdings listing is filed with the SEC on Form N-Q. The form will be available on the SEC's Web site at sec.gov, and it also may be reviewed and copied at the SEC's Public Reference Room in Washington, D.C. Information on the operation of the SEC's Public Reference Room may be obtained by calling (800) SEC-0330. The Fund's portfolio holdings are also posted on deutschefunds.com from time to time. Please see the Fund's current prospectus for more information.
Portfolio Management Team
Richard Hanlon, CFA, Director
Mary Schafer Mahrer, Director
Portfolio Managers
Investment Portfolio June 30, 2017 (Unaudited)
Shares | Value ($) | |
| Common Stocks 96.0% | ||
| Consumer Discretionary 9.5% | ||
| Auto Components 4.2% | ||
| Cooper Tire & Rubber Co. | 29,100 | 1,050,510 |
| Standard Motor Products, Inc. | 50,604 | 2,642,541 |
| Visteon Corp.* | 31,037 | 3,167,636 |
| 6,860,687 | ||
| Automobiles 0.1% | ||
| Winnebago Industries, Inc. | 4,800 | 168,000 |
| Diversified Consumer Services 0.1% | ||
| Regis Corp.* | 15,700 | 161,239 |
| Hotels, Restaurants & Leisure 0.5% | ||
| Caesars Entertainment Corp.* (a) | 59,200 | 710,400 |
| Denny's Corp.* | 14,000 | 164,780 |
| 875,180 | ||
| Leisure Products 0.2% | ||
| Mattel, Inc. | 15,600 | 335,868 |
| Media 2.9% | ||
| AMC Entertainment Holdings, Inc. "A" | 44,500 | 1,012,375 |
| Scripps Networks Interactive, Inc. "A" | 31,200 | 2,131,272 |
| TEGNA, Inc. | 108,567 | 1,564,451 |
| 4,708,098 | ||
| Specialty Retail 1.5% | ||
| Hibbett Sports, Inc.* (a) | 56,884 | 1,180,343 |
| Staples, Inc. | 128,700 | 1,296,009 |
| 2,476,352 | ||
| Consumer Staples 4.1% | ||
| Food Products 1.8% | ||
| Lamb Weston Holdings, Inc. | 39,076 | 1,720,907 |
| Pinnacle Foods, Inc. | 21,000 | 1,247,400 |
| 2,968,307 | ||
| Household Products 2.3% | ||
| Central Garden & Pet Co.* | 61,800 | 1,964,622 |
| Energizer Holdings, Inc. | 37,318 | 1,792,010 |
| 3,756,632 | ||
| Energy 5.1% | ||
| Energy Equipment & Services 1.4% | ||
| Oil States International, Inc.* | 40,700 | 1,105,005 |
| U.S. Silica Holdings, Inc. | 31,839 | 1,129,966 |
| 2,234,971 | ||
| Oil, Gas & Consumable Fuels 3.7% | ||
| Cimarex Energy Co. | 25,176 | 2,366,796 |
| Golar LNG Ltd. | 7,400 | 164,650 |
| Matador Resources Co.* | 69,315 | 1,481,261 |
| Noble Energy, Inc. | 71,700 | 2,029,110 |
| 6,041,817 | ||
| Financials 18.8% | ||
| Banks 8.5% | ||
| Capital Bank Financial Corp. "A" | 49,349 | 1,880,197 |
| Great Western Bancorp., Inc. | 62,102 | 2,534,383 |
| Hancock Holding Co. | 35,416 | 1,735,384 |
| KeyCorp | 204,654 | 3,835,216 |
| OFG Bancorp. (a) | 172,382 | 1,723,820 |
| Sterling Bancorp. | 95,454 | 2,219,305 |
| 13,928,305 | ||
Shares | Value ($) | |
| Capital Markets 2.3% | ||
| Lazard Ltd. "A" | 78,446 | 3,634,403 |
| Consumer Finance 2.0% | ||
| Synchrony Financial | 109,865 | 3,276,174 |
| Insurance 4.3% | ||
| CNO Financial Group, Inc. | 155,178 | 3,240,117 |
| Reinsurance Group of America, Inc. | 29,749 | 3,819,474 |
| 7,059,591 | ||
| Thrifts & Mortgage Finance 1.7% | ||
| Walker & Dunlop, Inc.* | 57,331 | 2,799,473 |
| Health Care 3.2% | ||
| Health Care Providers & Services 2.5% | ||
| Aceto Corp. | 92,204 | 1,424,552 |
| HealthSouth Corp. | 54,935 | 2,658,854 |
| 4,083,406 | ||
| Life Sciences Tools & Services 0.7% | ||
| PerkinElmer, Inc. | 16,843 | 1,147,682 |
| Industrials 18.6% | ||
| Aerospace & Defense 0.5% | ||
| Triumph Group, Inc. | 28,400 | 897,440 |
| Commercial Services & Supplies 5.4% | ||
| Interface, Inc. | 74,475 | 1,463,434 |
| Pitney Bowes, Inc. | 156,263 | 2,359,571 |
| Steelcase, Inc. "A" | 120,420 | 1,685,880 |
| The Brink's Co. | 50,133 | 3,358,911 |
| 8,867,796 | ||
| Construction & Engineering 1.2% | ||
| Aegion Corp.* | 86,800 | 1,899,184 |
| Electrical Equipment 0.8% | ||
| EnerSys | 18,800 | 1,362,060 |
| Industrial Conglomerates 0.8% | ||
| Carlisle Companies, Inc. | 13,310 | 1,269,774 |
| Machinery 7.5% | ||
| Douglas Dynamics, Inc. | 42,200 | 1,388,380 |
| Federal Signal Corp. | 61,200 | 1,062,432 |
| Global Brass & Copper Holdings, Inc. | 49,100 | 1,500,005 |
| Hillenbrand, Inc. | 79,967 | 2,886,809 |
| Snap-on, Inc. | 13,885 | 2,193,830 |
| Stanley Black & Decker, Inc. | 23,659 | 3,329,531 |
| 12,360,987 | ||
| Professional Services 0.4% | ||
| FTI Consulting, Inc.* | 16,705 | 584,007 |
| Trading Companies & Distributors 2.0% | ||
| AerCap Holdings NV* | 69,933 | 3,246,989 |
| Information Technology 13.3% | ||
| Communications Equipment 2.3% | ||
| Harris Corp. | 34,135 | 3,723,446 |
| Electronic Equipment, Instruments & Components 6.3% | ||
| Dolby Laboratories, Inc. "A" | 40,858 | 2,000,408 |
| Insight Enterprises, Inc.* | 49,400 | 1,975,506 |
| Keysight Technologies, Inc.* | 78,652 | 3,061,922 |
| Rogers Corp.* | 22,735 | 2,469,476 |
| Sanmina Corp.* | 22,300 | 849,630 |
| 10,356,942 | ||
Shares | Value ($) | |
| Internet Software & Services 0.4% | ||
| Cars.com, Inc.* (a) | 23,389 | 622,849 |
| IT Services 1.8% | ||
| Convergys Corp. | 77,760 | 1,849,133 |
| NeuStar, Inc. "A"* | 33,407 | 1,114,123 |
| 2,963,256 | ||
| Software 1.3% | ||
| Verint Systems, Inc.* | 52,794 | 2,148,716 |
| Technology Hardware, Storage & Peripherals 1.2% | ||
| NetApp, Inc. | 48,401 | 1,938,460 |
| Materials 6.0% | ||
| Chemicals 4.8% | ||
| Celanese Corp. "A" | 32,629 | 3,097,797 |
| CF Industries Holdings, Inc. | 63,600 | 1,778,256 |
| GCP Applied Technologies, Inc.* | 35,438 | 1,080,859 |
| Minerals Technologies, Inc. | 25,800 | 1,888,560 |
| 7,845,472 | ||
| Containers & Packaging 1.2% | ||
| Owens-Illinois, Inc.* | 83,800 | 2,004,496 |
| Real Estate 11.6% | ||
| Equity Real Estate Investment Trusts (REITs) | ||
| Agree Realty Corp. | 61,102 | 2,802,749 |
| Brixmor Property Group, Inc. | 87,400 | 1,562,712 |
| Easterly Government Properties, Inc. | 70,091 | 1,468,407 |
| Gaming and Leisure Properties, Inc. | 103,621 | 3,903,403 |
| Highwoods Properties, Inc. | 28,800 | 1,460,448 |
| Pebblebrook Hotel Trust (a) | 90,739 | 2,925,425 |
| Physicians Realty Trust | 138,108 | 2,781,495 |
| STAG Industrial, Inc. | 76,900 | 2,122,440 |
| 19,027,079 | ||
Shares | Value ($) | |
| Utilities 5.8% | ||
| Electric Utilities 2.1% | ||
| IDACORP, Inc. | 39,783 | 3,395,479 |
| Gas Utilities 1.4% | ||
| ONE Gas, Inc. | 33,200 | 2,317,692 |
| Multi-Utilities 2.3% | ||
| DTE Energy Co. | 34,800 | 3,681,492 |
| Total Common Stocks (Cost $134,994,335) | 157,029,801 | |
| Securities Lending Collateral 2.7% | ||
| Deutsche Government & Agency Securities Portfolio "Deutsche Government Cash Institutional Shares", 0.87% (b) (c) (Cost $4,399,800) | 4,399,800 | 4,399,800 |
| Cash Equivalents 3.6% | ||
| Deutsche Central Cash Management Government Fund, 1.03% (b) (Cost $5,985,190) | 5,985,190 | 5,985,190 |
| % of Net Assets | Value ($) | |
| Total Investment Portfolio (Cost $145,379,325)† | 102.3 | 167,414,791 |
| Other Assets and Liabilities, Net | (2.3) | (3,833,686) |
| Net Assets | 100.0 | 163,581,105 |
* Non-income producing security.
† The cost for federal income tax purposes was $145,566,584. At June 30, 2017, net unrealized appreciation for all securities based on tax cost was $21,848,207. This consisted of aggregate gross unrealized appreciation for all securities in which there was an excess of value over tax cost of $28,414,967 and aggregate gross unrealized depreciation for all securities in which there was an excess of tax cost over value of $6,566,760.
(a) All or a portion of these securities were on loan. In addition, "Other Assets and Liabilities, Net" may include pending sales that are also on loan. The value of securities loaned at June 30, 2017 amounted to $4,245,124, which is 2.6% of net assets.
(b) Affiliated fund managed by Deutsche Investment Management Americas Inc. The rate shown is the annualized seven-day yield at period end.
(c) Represents collateral held in connection with securities lending. Income earned by the Fund is net of borrower rebates.
Fair Value Measurements
Various inputs are used in determining the value of the Fund's investments. These inputs are summarized in three broad levels. Level 1 includes quoted prices in active markets for identical securities. Level 2 includes other significant observable inputs (including quoted prices for similar securities, interest rates, prepayment speeds and credit risk). Level 3 includes significant unobservable inputs (including the Fund's own assumptions in determining the fair value of investments). The level assigned to the securities valuations may not be an indication of the risk or liquidity associated with investing in those securities.
The following is a summary of the inputs used as of June 30, 2017 in valuing the Fund's investments. For information on the Fund's policy regarding the valuation of investments, please refer to the Security Valuation section of Note A in the accompanying Notes to Financial Statements.
| Assets | Level 1 | Level 2 | Level 3 | Total |
| Common Stocks (d) | $ 157,029,801 | $ — | $ — | $ 157,029,801 |
| Short-Term Investments (d) | 10,384,990 | — | — | 10,384,990 |
| Total | $ 167,414,791 | $ — | $ — | $ 167,414,791 |
There have been no transfers between fair value measurement levels during the period ended June 30, 2017.
(d) See Investment Portfolio for additional detailed categorizations.
The accompanying notes are an integral part of the financial statements.
Statement of Assets and Liabilities
| as of June 30, 2017 (Unaudited) | |
| Assets | |
Investments: Investments in non-affiliated securities, at value (cost $134,994,335) — including $4,245,124 of securities loaned | $ 157,029,801 |
| Investment in Deutsche Government & Agency Securities Portfolio (cost $4,399,800)* | 4,399,800 |
| Investment in Deutsche Central Cash Management Government Fund (cost $5,985,190) | 5,985,190 |
| Total investments in securities, at value (cost $145,379,325) | 167,414,791 |
| Cash | 10,000 |
| Receivable for investments sold | 1,667,086 |
| Receivable for Fund shares sold | 26,620 |
| Dividends receivable | 227,633 |
| Interest receivable | 4,766 |
| Other assets | 894 |
| Total assets | 169,351,790 |
| Liabilities | |
| Payable upon return of securities loaned | 4,399,800 |
| Payable for investments purchased | 996,677 |
| Payable for Fund shares redeemed | 205,363 |
| Accrued management fee | 87,635 |
| Accrued Trustees' fees | 868 |
| Other accrued expenses and payables | 80,342 |
| Total liabilities | 5,770,685 |
| Net assets, at value | $ 163,581,105 |
| Net Assets Consist of | |
| Undistributed net investment income | 1,264,341 |
| Net unrealized appreciation (depreciation) on investments | 22,035,466 |
| Accumulated net realized gain (loss) | 7,697,157 |
| Paid-in capital | 132,584,141 |
| Net assets, at value | $ 163,581,105 |
Class A Net Asset Value, offering and redemption price per share ($146,694,044 ÷ 8,880,906 outstanding shares of beneficial interest, no par value, unlimited number of shares authorized) | $ 16.52 |
Class B Net Asset Value, offering and redemption price per share ($16,887,061 ÷ 1,021,905 outstanding shares of beneficial interest, no par value, unlimited number of shares authorized) | $ 16.53 |
* Represents collateral on securities loaned.
The accompanying notes are an integral part of the financial statements.
Statement of Operations
| for the six months ended June 30, 2017 (Unaudited) | |
| Investment Income | |
Income: Dividends (net of foreign taxes withheld of $2,393) | $ 1,644,517 |
| Income distributions — Deutsche Central Cash Management Government Fund | 22,171 |
| Securities lending income, net of borrower rebates | 9,581 |
| Total income | 1,676,269 |
Expenses: Management fee | 540,453 |
| Administration fee | 83,147 |
| Services to shareholders | 1,165 |
| Record keeping fees (Class B) | 8,792 |
| Distribution service fee (Class B) | 19,974 |
| Custodian fee | 1,878 |
| Professional fees | 34,595 |
| Reports to shareholders | 18,079 |
| Trustees' fees and expenses | 5,886 |
| Other | 3,994 |
| Total expenses | 717,963 |
| Net investment income (loss) | 958,306 |
| Realized and Unrealized Gain (Loss) | |
| Net realized gain (loss) from investments | 8,038,990 |
| Change in net unrealized appreciation (depreciation) on investments | (5,503,227) |
| Net gain (loss) | 2,535,763 |
| Net increase (decrease) in net assets resulting from operations | $ 3,494,069 |
The accompanying notes are an integral part of the financial statements.
Statements of Changes in Net Assets
| Increase (Decrease) in Net Assets | Six Months Ended June 30, 2017 (Unaudited) | Year Ended December 31, 2016 | |
Operations: Net investment income (loss) | $ 958,306 | $ 1,525,205 | |
| Net realized gain (loss) | 8,038,990 | 3,137,095 | |
| Change in net unrealized appreciation (depreciation) | (5,503,227) | 19,608,211 | |
| Net increase (decrease) in net assets resulting from operations | 3,494,069 | 24,270,511 | |
Distributions to shareholders from: Net investment income: Class A | (1,100,828) | (888,084) | |
| Class B | (59,126) | (31,217) | |
Net realized gains: Class A | (3,269,636) | (15,665,658) | |
| Class B | (353,505) | (1,422,898) | |
| Total distributions | (4,783,095) | (18,007,857) | |
Fund share transactions: Class A Proceeds from shares sold | 3,572,749 | 8,157,267 | |
| Reinvestment of distributions | 4,370,464 | 16,553,742 | |
| Payments for shares redeemed | (13,410,180) | (37,741,593) | |
| Net increase (decrease) in net assets from Class A share transactions | (5,466,967) | (13,030,584) | |
Class B Proceeds from shares sold | 2,580,488 | 2,712,137 | |
| Reinvestment of distributions | 412,631 | 1,454,115 | |
| Payments for shares redeemed | (1,349,730) | (3,082,291) | |
| Net increase (decrease) in net assets from Class B share transactions | 1,643,389 | 1,083,961 | |
| Increase (decrease) in net assets | (5,112,604) | (5,683,969) | |
| Net assets at beginning of period | 168,693,709 | 174,377,678 | |
| Net assets at end of period (including undistributed net investment income of $1,264,341 and $1,465,989, respectively) | $ 163,581,105 | $ 168,693,709 | |
| Other Information | |||
Class A Shares outstanding at beginning of period | 9,208,579 | 10,068,570 | |
| Shares sold | 212,972 | 525,679 | |
| Shares issued to shareholders in reinvestment of distributions | 259,221 | 1,110,244 | |
| Shares redeemed | (799,866) | (2,495,914) | |
| Net increase (decrease) in Class A shares | (327,673) | (859,991) | |
| Shares outstanding at end of period | 8,880,906 | 9,208,579 | |
Class B Shares outstanding at beginning of period | 923,852 | 852,173 | |
| Shares sold | 154,001 | 176,025 | |
| Shares issued to shareholders in reinvestment of distributions | 24,445 | 97,461 | |
| Shares redeemed | (80,393) | (201,807) | |
| Net increase (decrease) in Class B shares | 98,053 | 71,679 | |
| Shares outstanding at end of period | 1,021,905 | 923,852 | |
The accompanying notes are an integral part of the financial statements.
Financial Highlights
| Class A | Six Months Ended 6/30/17 (Unaudited) | Years Ended December 31, | |||||
| 2016 | 2015 | 2014 | 2013 | 2012 | |||
| Selected Per Share Data | |||||||
| Net asset value, beginning of period | $ 16.65 | $ 15.97 | $ 17.79 | $ 17.08 | $ 12.78 | $ 11.36 | |
Income (loss) from investment operations: Net investment incomea | .10 | .15 | .09 | .05 | .12 | .14 | |
| Net realized and unrealized gain (loss) | .26 | 2.34 | (.31) | .88 | 4.35 | 1.42 | |
| Total from investment operations | .36 | 2.49 | (.22) | .93 | 4.47 | 1.56 | |
Less distributions from: Net investment income | (.12) | (.10) | (.05) | (.14) | (.17) | (.14) | |
| Net realized gains | (.37) | (1.71) | (1.55) | (.08) | — | — | |
| Total distributions | (.49) | (1.81) | (1.60) | (.22) | (.17) | (.14) | |
| Net asset value, end of period | $ 16.52 | $ 16.65 | $ 15.97 | $ 17.79 | $ 17.08 | $ 12.78 | |
| Total Return (%) | 2.12** | 16.89b | (1.91) | 5.53 | 35.24 | 13.77 | |
| Ratios to Average Net Assets and Supplemental Data | |||||||
| Net assets, end of period ($ millions) | 147 | 153 | 161 | 205 | 240 | 219 | |
| Ratio of expenses before expense reductions (%)c | .83* | .83 | .80 | .82 | .82 | .82 | |
| Ratio of expenses after expense reductions (%)c | .83* | .82 | .80 | .82 | .82 | .82 | |
| Ratio of net investment income (%) | 1.18* | .99 | .51 | .32 | .81 | 1.18 | |
| Portfolio turnover rate (%) | 26** | 53 | 25 | 34 | 115 | 11 | |
a Based on average shares outstanding during the period. b Total return would have been lower had certain expenses not been reduced. c Expense ratio does not reflect charges and fees associated with the separate account that invests in the Fund or any variable life insurance policy or variable annuity contract for which the Fund is an investment option. * Annualized ** Not annualized | |||||||
| Class B | Six Months Ended 6/30/17 (Unaudited) | Years Ended December 31, | |||||
| 2016 | 2015 | 2014 | 2013 | 2012 | |||
| Selected Per Share Data | |||||||
| Net asset value, beginning of period | $ 16.63 | $ 15.95 | $ 17.77 | $ 17.07 | $ 12.78 | $ 11.36 | |
Income (loss) from investment operations: Net investment incomea | .07 | .09 | .02 | (.01) | .07 | .10 | |
| Net realized and unrealized gain (loss) | .26 | 2.34 | (.29) | .87 | 4.34 | 1.42 | |
| Total from investment operations | .33 | 2.43 | (.27) | .86 | 4.41 | 1.52 | |
Less distributions from: Net investment income | (.06) | (.04) | — | (.08) | (.12) | (.10) | |
| Net realized gains | (.37) | (1.71) | (1.55) | (.08) | — | — | |
| Total distributions | (.43) | (1.75) | (1.55) | (.16) | (.12) | (.10) | |
| Net asset value, end of period | $ 16.53 | $ 16.63 | $ 15.95 | $ 17.77 | $ 17.07 | $ 12.78 | |
| Total Return (%) | 1.93** | 16.47b | (2.21) | 5.09 | 34.70 | 13.38 | |
| Ratios to Average Net Assets and Supplemental Data | |||||||
| Net assets, end of period ($ millions) | 17 | 15 | 14 | 17 | 20 | 17 | |
| Ratio of expenses before expense reductions (%)c | 1.19* | 1.19 | 1.16 | 1.17 | 1.17 | 1.16 | |
| Ratio of expenses after expense reductions (%)c | 1.19* | 1.18 | 1.16 | 1.17 | 1.17 | 1.16 | |
| Ratio of net investment income (loss) (%) | .84* | .57 | .14 | (.04) | .45 | .81 | |
| Portfolio turnover rate (%) | 26** | 53 | 25 | 34 | 115 | 11 | |
a Based on average shares outstanding during the period. b Total return would have been lower had certain expenses not been reduced. c Expense ratio does not reflect charges and fees associated with the separate account that invests in the Fund or any variable life insurance policy or variable annuity contract for which the Fund is an investment option. * Annualized ** Not annualized | |||||||
Notes to Financial Statements (Unaudited)
A. Organization and Significant Accounting Policies
Deutsche Small Mid Cap Value VIP (the "Fund") is a diversified series of Deutsche Variable Series II (the "Trust"), which is registered under the Investment Company Act of 1940, as amended (the "1940 Act"), as an open-end management investment company organized as a Massachusetts business trust.
Multiple Classes of Shares of Beneficial Interest. The Fund offers two classes of shares (Class A shares and Class B shares). Sales of Class B shares are subject to recordkeeping fees up to 0.15% and Rule 12b-1 fees under the 1940 Act equal to an annual rate of 0.25% of the average daily net assets of the Class B shares of the Fund. Class A shares are not subject to such fees.
Investment income, realized and unrealized gains and losses, and certain fund-level expenses and expense reductions, if any, are borne pro rata on the basis of relative net assets by the holders of all classes of shares except that each class bears certain expenses unique to that class (including the applicable Rule 12b-1 fee and recordkeeping fees). Differences in class-level expenses may result in payment of different per share dividends by class. All shares have equal rights with respect to voting subject to class-specific arrangements.
The Fund's financial statements are prepared in accordance with accounting principles generally accepted in the United States of America ("U.S. GAAP") which require the use of management estimates. Actual results could differ from those estimates. The Fund qualifies as an investment company under Topic 946 of Accounting Standards Codification of U.S. GAAP. The policies described below are followed consistently by the Fund in the preparation of its financial statements.
Security Valuation. Investments are stated at value determined as of the close of regular trading on the New York Stock Exchange on each day the exchange is open for trading.
Various inputs are used in determining the value of the Fund's investments. These inputs are summarized in three broad levels. Level 1 includes quoted prices in active markets for identical securities. Level 2 includes other significant observable inputs (including quoted prices for similar securities, interest rates, prepayment speeds and credit risk). Level 3 includes significant unobservable inputs (including the Fund's own assumptions in determining the fair value of investments). The level assigned to the securities valuations may not be an indication of the risk or liquidity associated with investing in those securities.
Equity securities are valued at the most recent sale price or official closing price reported on the exchange (U.S. or foreign) or over-the-counter market on which they trade. Securities for which no sales are reported are valued at the calculated mean between the most recent bid and asked quotations on the relevant market or, if a mean cannot be determined, at the most recent bid quotation. Equity securities are generally categorized as Level 1.
Investments in open-end investment companies are valued at their net asset value each business day and are categorized as Level 1.
Securities and other assets for which market quotations are not readily available or for which the above valuation procedures are deemed not to reflect fair value are valued in a manner that is intended to reflect their fair value as determined in accordance with procedures approved by the Board and are generally categorized as Level 3. In accordance with the Fund's valuation procedures, factors considered in determining value may include, but are not limited to, the type of the security; the size of the holding; the initial cost of the security; the existence of any contractual restrictions on the security's disposition; the price and extent of public trading in similar securities of the issuer or of comparable companies; quotations or evaluated prices from broker-dealers and/or pricing services; information obtained from the issuer, analysts, and/or the appropriate stock exchange (for exchange-traded securities); an analysis of the company's or issuer's financial statements; an evaluation of the forces that influence the issuer and the market(s) in which the security is purchased and sold; and with respect to debt securities, the maturity, coupon, creditworthiness, currency denomination and the movement of the market in which the security is normally traded. The value determined under these procedures may differ from published values for the same securities.
Disclosure about the classification of fair value measurements is included in a table following the Fund's Investment Portfolio.
Foreign Currency Translations. The books and records of the Fund are maintained in U.S. dollars. Investment securities and other assets and liabilities denominated in a foreign currency are translated into U.S. dollars at the prevailing exchange rates at period end. Purchases and sales of investment securities, income and expenses are translated into U.S. dollars at the prevailing exchange rates on the respective dates of the transactions.
Net realized and unrealized gains and losses on foreign currency transactions represent net gains and losses between trade and settlement dates on securities transactions, the acquisition and disposition of foreign currencies, and the difference between the amount of net investment income accrued and the U.S. dollar amount actually received. The portion of both realized and unrealized gains and losses on investments that results from fluctuations in foreign currency exchange rates is not separately disclosed but is included with net realized and unrealized gain/appreciation and loss/depreciation on investments.
Securities Lending. Brown Brothers Harriman & Co., as lending agent, lends securities of the Fund to certain financial institutions under the terms of its securities lending agreement. During the term of the loans, the Fund continues to receive interest and dividends generated by the securities and to participate in any changes in their market value. The Fund requires the borrowers of the securities to maintain collateral with the Fund consisting of either cash or liquid, unencumbered assets having a value at least equal to the value of the securities loaned. When the collateral falls below specified amounts, the lending agent will use its best effort to obtain additional collateral on the next business day to meet required amounts under the securities lending agreement. As of period end, any securities on loan were collateralized by cash. During the six months ended June 30, 2017, the Fund invested the cash collateral into a joint trading account in affiliated money market funds managed by Deutsche Investment Management Americas Inc. As of June 30, 2017, the Fund invested the cash collateral in Deutsche Government & Agency Securities Portfolio. Deutsche Investment Management Americas Inc. receives a management/administration fee (0.13% annualized effective rate as of June 30, 2017) on the cash collateral invested in Deutsche Government & Agency Securities Portfolio. The Fund receives compensation for lending its securities either in the form of fees or by earning interest on invested cash collateral net of borrower rebates and fees paid to a lending agent. Either the Fund or the borrower may terminate the loan at any time, and the borrower, after notice, is required to return borrowed securities within a standard time period.. There may be risks of delay and costs in recovery of securities or even loss of rights in the collateral should the borrower of the securities fail financially. If the Fund is not able to recover securities lent, the Fund may sell the collateral and purchase a replacement investment in the market, incurring the risk that the value of the replacement security is greater than the value of the collateral. The Fund is also subject to all investment risks associated with the reinvestment of any cash collateral received, including, but not limited to, interest rate, credit and liquidity risk associated with such investments.
As of June 30, 2017, the Fund had securities on loan, which were classified as common stocks in the Investment Portfolio. The value of the related collateral exceeded the value of the securities loaned at period end. As of period end, the remaining contractual maturity of the collateral agreements were overnight and continuous.
Taxes. The Fund's policy is to comply with the requirements of the Internal Revenue Code, as amended, which are applicable to regulated investment companies and to distribute all of its taxable income to its shareholders.
The Fund has reviewed the tax positions for the open tax years as of December 31, 2016 and has determined that no provision for income tax and/or uncertain tax provisions is required in the Fund's financial statements. The Fund's federal tax returns for the prior three fiscal years remain open subject to examination by the Internal Revenue Service.
Distribution of Income and Gains. Distributions from net investment income of the Fund, if any, are declared and distributed to shareholders annually. Net realized gains from investment transactions, in excess of available capital loss carryforwards, would be taxable to the Fund if not distributed and, therefore, will be distributed to shareholders at least annually. The Fund may also make additional distributions for tax purposes if necessary.
The timing and characterization of certain income and capital gain distributions are determined annually in accordance with federal tax regulations which may differ from accounting principles generally accepted in the United States of America. These differences primarily relate to income received from Real Estate Investment Trusts and certain securities sold at a loss. As a result, net investment income (loss) and net realized gain (loss) on investment transactions for a reporting period may differ significantly from distributions during such period. Accordingly, the Fund may periodically make reclassifications among certain of its capital accounts without impacting the net asset value of the Fund.
The tax character of current year distributions will be determined at the end of the current fiscal year.
Expenses. Expenses of the Trust arising in connection with a specific fund are allocated to that fund. Other Trust expenses which cannot be directly attributed to a fund are apportioned among the funds in the Trust based upon the relative net assets or other appropriate measures.
Contingencies. In the normal course of business, the Fund may enter into contracts with service providers that contain general indemnification clauses. The Fund's maximum exposure under these arrangements is unknown, as this would involve future claims that may be made against the Fund that have not yet been made. However, based on experience, the Fund expects the risk of loss to be remote.
Real Estate Investment Trusts. The Fund at its fiscal year end recharacterizes distributions received from a Real Estate Investment Trust ("REIT") investment based on information provided by the REIT into the following categories: ordinary income, long-term and short-term capital gains, and return of capital. If information is not available timely from a REIT, the recharacterization will be estimated for financial reporting purposes and a recharacterization will be made to the accounting records in the following year when such information becomes available. Distributions received from REITs in excess of income are recorded as either a reduction of cost of investments or realized gains.
Other. Investment transactions are accounted for on a trade date plus one basis for daily net asset value calculations. However, for financial reporting purposes, investment transactions are reported on trade date. Interest income is recorded on the accrual basis. Dividend income is recorded on the ex-dividend date net of foreign withholding taxes. Realized gains and losses from investment transactions are recorded on an identified cost basis. Proceeds from litigation payments, if any, are included in net realized gain (loss) from investments.
B. Purchases and Sales of Securities
During the six months ended June 30, 2017, purchases and sales of investment transactions (excluding short-term investments) aggregated $41,803,675 and $47,557,183, respectively.
C. Related Parties
Management Agreement. Under the Investment Management Agreement with Deutsche Investment Management Americas Inc. ("DIMA" or the "Advisor"), an indirect, wholly owned subsidiary of Deutsche Bank AG, the Advisor directs the investments of the Fund in accordance with its investment objectives, policies and restrictions. The Advisor determines the securities, instruments and other contracts relating to investments to be purchased, sold or entered into by the Fund.
Pursuant to the Investment Management Agreement with the Advisor, the Fund pays a monthly management fee based on the Fund's average daily net assets, computed and accrued daily and payable monthly, at the following annual rates:
| First $250 million | .650% |
| Next $750 million | .620% |
| Next $1.5 billion | .600% |
| Next $2.5 billion | .580% |
| Next $2.5 billion | .550% |
| Next $2.5 billion | .540% |
| Next $2.5 billion | .530% |
| Over $12.5 billion | .520% |
Accordingly, for the six months ended June 30, 2017, the fee pursuant to the Investment Management Agreement was equivalent to an annualized rate (exclusive of any applicable waivers/reimbursements) of 0.65% of the Fund's average daily net assets.
For the period from January 1, 2017 through September 30, 2017, the Advisor has contractually agreed to waive its fees and/or reimburse certain operating expenses to the extent necessary to maintain the total annual operating expenses (excluding certain expenses such as extraordinary expenses, taxes, brokerage and interest expense) of each class as follows:
| Class A | .84% |
| Class B | 1.20% |
Administration Fee. Pursuant to an Administrative Services Agreement, DIMA provides most administrative services to the Fund. For all services provided under the Administrative Services Agreement, the Fund pays DIMA an annual fee ("Administration Fee") of 0.10% of the Fund's average daily net assets, computed and accrued daily and payable monthly. For the six months ended June 30, 2017, the Administration Fee was $83,147, of which $13,482 is unpaid.
Service Provider Fees. Deutsche AM Service Company ("DSC"), an affiliate of the Advisor, is the transfer agent, dividend-paying agent and shareholder service agent for the Fund. Pursuant to a sub-transfer agency agreement between DSC and DST Systems, Inc. ("DST"), DSC has delegated certain transfer agent, dividend-paying agent and shareholder service agent functions to DST. DSC compensates DST out of the shareholder servicing fee it receives from the Fund. For the six months ended June 30, 2017, the amounts charged to the Fund by DSC were as follows:
| Service to Shareholders | Total Aggregated | Unpaid at June 30, 2017 |
| Class A | $ 302 | $ 142 |
| Class B | 227 | 112 |
| $ 529 | $ 254 |
Distribution Service Agreement. Under the Fund's Class B 12b-1 plan, Deutsche AM Distributors, Inc. ("DDI") received a fee ("Distribution Service Fee") of 0.25% of average daily net assets of Class B shares. For the six months ended June 30, 2017, the Distribution Service Fee aggregated $19,974, of which $3,434 is unpaid.
Typesetting and Filing Service Fees. Under an agreement with DIMA, DIMA is compensated for providing typesetting and certain regulatory filing services to the Fund. For the six months ended June 30, 2017, the amount charged to the Fund by DIMA included in the Statement of Operations under "Reports to shareholders" aggregated $5,970, of which $5,506 is unpaid.
Trustees' Fees and Expenses. The Fund paid retainer fees to each Trustee not affiliated with the Advisor, plus specified amounts to the Board Chairperson and Vice Chairperson and to each committee Chairperson.
Affiliated Cash Management Vehicles. The Fund may invest uninvested cash balances in Deutsche Central Cash Management Government Fund and Deutsche Variable NAV Money Fund, affiliated money market funds which are managed by the Advisor. Each affiliated money market fund is managed in accordance with Rule 2a-7 under the 1940 Act, which governs the quality, maturity, diversity and liquidity of instruments in which a money market fund may invest. Deutsche Central Cash Management Government Fund seeks to maintain a stable net asset value, and Deutsche Variable NAV Money Fund maintains a floating net asset value. The Fund indirectly bears its proportionate share of the expenses of each affiliated money market fund in which it invests. Deutsche Central Cash Management Government Fund does not pay the Advisor an investment management fee. To the extent that Deutsche Variable NAV Money Fund pays an investment management fee to the Advisor, the Advisor will waive an amount of the investment management fee payable to the Advisor by the Fund equal to the amount of the investment management fee payable on the Fund's assets invested in Deutsche Variable NAV Money Fund.
D. Ownership of the Fund
At June 30, 2017, two participating insurance companies were owners of record of 10% or more of the total outstanding Class A shares of the Fund, each owning 55% and 21%. Three participating insurance companies were owners of record of 10% or more of the total outstanding Class B shares of the Fund, each owning 25%, 21% and 19%.
E. Line of Credit
The Fund and other affiliated funds (the "Participants") share in a $400 million revolving credit facility provided by a syndication of banks. The Fund may borrow for temporary or emergency purposes, including the meeting of redemption requests that otherwise might require the untimely disposition of securities. The Participants are charged an annual commitment fee which is allocated based on net assets, among each of the Participants. Interest is calculated at a rate per annum equal to the sum of the Federal Funds Rate plus 1.25 percent plus if the one-month LIBOR exceeds the Federal Funds Rate, the amount of such excess. The Fund may borrow up to a maximum of 33 percent of its net assets under the agreement. The Fund had no outstanding loans at June 30, 2017.
Information About Your Fund's Expenses (Unaudited)
As an investor of the Fund, you incur two types of costs: ongoing expenses and transaction costs. Ongoing expenses include management fees, distribution and service (12b-1) fees and other Fund expenses. Examples of transaction costs include contract charges, which are not shown in this section. The following tables are intended to help you understand your ongoing expenses (in dollars) of investing in the Fund and to help you compare these expenses with the ongoing expenses of investing in other mutual funds. The example in the table is based on an investment of $1,000 invested at the beginning of the six-month period and held for the entire period (January 1, 2017 to June 30, 2017).
The tables illustrate your Fund's expenses in two ways:
— Actual Fund Return. This helps you estimate the actual dollar amount of ongoing expenses (but not transaction costs) paid on a $1,000 investment in the Fund using the Fund's actual return during the period. To estimate the expenses you paid over the period, simply divide your account value by $1,000 (for example, an $8,600 account value divided by $1,000 = 8.6), then multiply the result by the number in the "Expenses Paid per $1,000" line under the share class you hold.
— Hypothetical 5% Fund Return. This helps you to compare your Fund's ongoing expenses (but not transaction costs) with those of other mutual funds using the Fund's actual expense ratio and a hypothetical rate of return of 5% per year before expenses. Examples using a 5% hypothetical Fund return may be found in the shareholder reports of other mutual funds. The hypothetical account values and expenses may not be used to estimate the actual ending account balance or expenses you paid for the period.
Please note that the expenses shown in these tables are meant to highlight your ongoing expenses only and do not reflect any transaction costs. The "Expenses Paid per $1,000" line of the tables is useful in comparing ongoing expenses only and will not help you determine the relative total expense of owning different funds. If these transaction costs had been included, your costs would have been higher.
| Expenses and Value of a $1,000 Investment for the six months ended June 30, 2017 | ||||
| Actual Fund Return | Class A | Class B | ||
| Beginning Account Value 1/1/17 | $ 1,000.00 | $ 1,000.00 | ||
| Ending Account Value 6/30/17 | $ 1,021.20 | $ 1,019.30 | ||
| Expenses Paid per $1,000* | $ 4.16 | $ 5.96 | ||
| Hypothetical 5% Fund Return | Class A | Class B | ||
| Beginning Account Value 1/1/17 | $ 1,000.00 | $ 1,000.00 | ||
| Ending Account Value 6/30/17 | $ 1,020.68 | $ 1,018.89 | ||
| Expenses Paid per $1,000* | $ 4.16 | $ 5.96 | ||
* Expenses are equal to the Fund's annualized expense ratio for each share class, multiplied by the average account value over the period, multiplied by 181 (the number of days in the most recent six-month period), then divided by 365.
| Annualized Expense Ratios | Class A | Class B | ||
| Deutsche Variable Series II — Deutsche Small Mid Cap Value VIP | .83% | 1.19% |
For more information, please refer to the Fund's prospectus.
These tables do not reflect charges and fees ("contract charges") associated with the separate account that invests in the Fund or any variable life insurance policy or variable annuity contract for which the Fund is an investment option.
For an analysis of the fees associated with an investment in the fund or similar funds, please refer to the current and hypothetical expense calculators for Variable Insurance Products which can be found at deutschefunds.com/EN/resources/calculators.jsp.
Proxy Voting
The Trust's policies and procedures for voting proxies for portfolio securities and information about how the Trust voted proxies related to its portfolio securities during the most recent 12-month period ended June 30 are available on our Web site — deutschefunds.com (click on "proxy voting" at the bottom of the page) — or on the SEC's Web site — sec.gov. To obtain a written copy of the Trust's policies and procedures without charge, upon request, call us toll free at (800) 728-3337.
Advisory Agreement Board Considerations and Fee Evaluation
The Board of Trustees (hereinafter referred to as the "Board" or "Trustees") approved the renewal of Deutsche Small Mid Cap Value VIP’s (the "Fund") investment management agreement (the "Agreement") with Deutsche Investment Management Americas Inc. ("DIMA") in September 2016.
In terms of the process that the Board followed prior to approving the Agreement, shareholders should know that:
— During the entire process, all of the Fund’s Trustees were independent of DIMA and its affiliates (the "Independent Trustees").
— The Board met frequently during the past year to discuss fund matters and dedicated a substantial amount of time to contract review matters. Over the course of several months, the Board’s Contract Committee reviewed extensive materials received from DIMA, independent third parties and independent counsel. These materials included an analysis of the Fund’s performance, fees and expenses, and profitability from a fee consultant retained by the Fund’s Independent Trustees (the "Fee Consultant"). The Board also received extensive information throughout the year regarding performance of the Fund.
— The Independent Trustees regularly meet privately with counsel to discuss contract review and other matters. In addition, the Independent Trustees were advised by the Fee Consultant in the course of their review of the Fund’s contractual arrangements and considered a comprehensive report prepared by the Fee Consultant in connection with their deliberations.
— In connection with reviewing the Agreement, the Board also reviewed the terms of the Fund’s Rule 12b-1 plan, distribution agreement, administrative services agreement, transfer agency agreement and other material service agreements.
— Based on its evaluation of the information provided, the Contract Committee presented its findings and recommendations to the Board. The Board then reviewed the Contract Committee’s findings and recommendations.
In connection with the contract review process, the Contract Committee and the Board considered the factors discussed below, among others. The Board also considered that DIMA and its predecessors have managed the Fund since its inception, and the Board believes that a long-term relationship with a capable, conscientious advisor is in the best interests of the Fund. The Board considered, generally, that shareholders chose to invest or remain invested in the Fund knowing that DIMA managed the Fund, and that the Agreement was approved by the Fund’s shareholders. DIMA is part of Deutsche Bank AG’s ("Deutsche Bank") Asset Management ("Deutsche AM") division. Deutsche AM is a global asset management business that offers a wide range of investing expertise and resources, including research capabilities in many countries throughout the world. Deutsche Bank has advised the Board that the U.S. asset management business continues to be a critical and integral part of Deutsche Bank, and that Deutsche Bank will continue to invest in Deutsche AM and seek to enhance Deutsche AM’s investment platform. Deutsche Bank also has confirmed its commitment to maintaining strong legal and compliance groups within the Deutsche AM division.
As part of the contract review process, the Board carefully considered the fees and expenses of each Deutsche fund overseen by the Board in light of the fund’s performance. In many cases, this led to the negotiation and implementation of expense caps. As part of these negotiations, the Board indicated that it would consider relaxing these caps in future years following sustained improvements in performance, among other considerations.
While shareholders may focus primarily on fund performance and fees, the Fund’s Board considers these and many other factors, including the quality and integrity of DIMA’s personnel and such other issues as back-office operations, fund valuations, and compliance policies and procedures.
Nature, Quality and Extent of Services. The Board considered the terms of the Agreement, including the scope of advisory services provided under the Agreement. The Board noted that, under the Agreement, DIMA provides portfolio management services to the Fund and that, pursuant to a separate administrative services agreement, DIMA provides administrative services to the Fund. The Board considered the experience and skills of senior management and investment personnel and the resources made available to such personnel. The Board reviewed the Fund’s performance over short-term and long-term periods and compared those returns to various agreed-upon performance measures, including market index(es) and a peer universe compiled using information supplied by Morningstar Direct ("Morningstar"), an independent fund data service. The Board also noted that it has put into place a process of identifying "Focus Funds" (e.g., funds performing poorly relative to a peer universe), and receives additional reporting from DIMA regarding such funds and, where appropriate, DIMA’s plans to address underperformance. The Board believes this process is an effective manner of identifying and addressing underperforming funds. Based on the information provided, the Board noted that for the one-, three- and five-year periods ended December 31, 2015, the Fund’s performance (Class A shares) was in the 2nd quartile, 4th quartile and 4th quartile, respectively, of the applicable Morningstar universe (the 1st quartile being the best performers and the 4th quartile being the worst performers). The Board also observed that the Fund has outperformed its benchmark in the one- and three-year periods and has underperformed its benchmark in the five-year period ended December 31, 2015. The Board noted the disappointing investment performance of the Fund in some past periods and continued to discuss with senior management of DIMA the factors contributing to such underperformance and actions being taken to improve performance. The Board recognized the efforts by DIMA in recent years to enhance its investment platform and improve long-term performance across the Deutsche fund complex.
Fees and Expenses. The Board considered the Fund’s investment management fee schedule, operating expenses and total expense ratios, and comparative information provided by Broadridge Financial Solutions, Inc. ("Broadridge") and the Fee Consultant regarding investment management fee rates paid to other investment advisors by similar funds (1st quartile being the most favorable and 4th quartile being the least favorable). With respect to management fees paid to other investment advisors by similar funds, the Board noted that the contractual fee rates paid by the Fund, which include a 0.10% fee paid to DIMA under the Fund’s administrative services agreement, were lower than the median (1st quartile) of the applicable Broadridge peer group (based on Broadridge data provided as of December 31, 2015). The Board noted that the Fund’s Class A shares total (net) operating expenses were expected to be lower than the median (2nd quartile) of the applicable Broadridge expense universe (based on Broadridge data provided as of December 31, 2015, and analyzing Broadridge expense universe Class A (net) expenses less any applicable 12b-1 fees) ("Broadridge Universe Expenses"). The Board also reviewed data comparing each share class’s total (net) operating expenses to the applicable Broadridge Universe Expenses. The Board noted that the expense limitations agreed to by DIMA were expected to help the Fund’s total (net) operating expenses remain competitive. The Board considered the Fund’s management fee rate as compared to fees charged by DIMA to a comparable Deutsche U.S. registered fund ("Deutsche Funds") and considered differences between the Fund and the comparable Deutsche Fund. The information requested by the Board as part of its review of fees and expenses also included information about institutional accounts (including any sub-advised funds and accounts) and funds offered primarily to European investors ("Deutsche Europe funds") managed by Deutsche AM. The Board noted that DIMA indicated that Deutsche AM does not manage any institutional accounts or Deutsche Europe funds comparable to the Fund.
On the basis of the information provided, the Board concluded that management fees were reasonable and appropriate in light of the nature, quality and extent of services provided by DIMA.
Profitability. The Board reviewed detailed information regarding revenues received by DIMA under the Agreement. The Board considered the estimated costs and pre-tax profits realized by DIMA from advising the Deutsche Funds, as well as estimates of the pre-tax profits attributable to managing the Fund in particular. The Board also received information regarding the estimated enterprise-wide profitability of DIMA and its affiliates with respect to all fund services in totality and by fund. The Board and the Fee Consultant reviewed DIMA’s methodology in allocating its costs to the management of the Fund. Based on the information provided, the Board concluded that the pre-tax profits realized by DIMA in connection with the management of the Fund were not unreasonable. The Board also reviewed certain publicly available information regarding the profitability of certain similar investment management firms. The Board noted that while information regarding the profitability of such firms is limited (and in some cases is not necessarily prepared on a comparable basis), DIMA and its affiliates’ overall profitability with respect to the Deutsche Funds (after taking into account distribution and other services provided to the funds by DIMA and its affiliates) was lower than the overall profitability levels of most comparable firms for which such data was available.
Economies of Scale. The Board considered whether there are economies of scale with respect to the management of the Fund and whether the Fund benefits from any economies of scale. The Board noted that the Fund’s investment management fee schedule includes fee breakpoints. The Board concluded that the Fund’s fee schedule represents an appropriate sharing between the Fund and DIMA of such economies of scale as may exist in the management of the Fund at current asset levels.
Other Benefits to DIMA and Its Affiliates. The Board also considered the character and amount of other incidental benefits received by DIMA and its affiliates, including any fees received by DIMA for administrative services provided to the Fund and any fees received by an affiliate of DIMA for distribution services. The Board also considered benefits to DIMA related to brokerage and soft-dollar allocations, including allocating brokerage to pay for research generated by parties other than the executing broker dealers, which pertain primarily to funds investing in equity securities, along with the incidental public relations benefits to DIMA related to Deutsche Funds advertising and cross-selling opportunities among DIMA products and services. The Board considered these benefits in reaching its conclusion that the Fund’s management fees were reasonable.
Compliance. The Board considered the significant attention and resources dedicated by DIMA to documenting and enhancing its compliance processes in recent years. The Board noted in particular (i) the experience, seniority and time commitment of the individuals serving as DIMA’s and the Fund’s chief compliance officers; (ii) the large number of DIMA compliance personnel; and (iii) the substantial commitment of resources by DIMA and its affiliates to compliance matters.
Based on all of the information considered and the conclusions reached, the Board unanimously determined that the continuation of the Agreement is in the best interests of the Fund. In making this determination, the Board did not give particular weight to any single factor identified above. The Board considered these factors over the course of numerous meetings, certain of which were in executive session with only the Independent Trustees and counsel present. It is possible that individual Independent Trustees may have weighed these factors differently in reaching their individual decisions to approve the continuation of the Agreement.
Notes

VS2SMCV-3 (R-028381-6 8/17)

June 30, 2017
Semiannual Report
Deutsche Variable Series II
Deutsche Unconstrained Income VIP
(Effective on or about October 2, 2017, Deutsche Unconstrained Income VIP will be renamed Deutsche Multisector Income VIP.)

Contents
3 Performance Summary 4 Portfolio Summary 4 Portfolio Management Team 5 Investment Portfolio 13 Statement of Assets and Liabilities 14 Statement of Operations 15 Statements of Changes in Net Assets 16 Financial Highlights 17 Notes to Financial Statements 26 Information About Your Fund's Expenses 27 Proxy Voting 28 Advisory Agreement Board Considerations and Fee Evaluation |
This report must be preceded or accompanied by a prospectus. To obtain an additional prospectus or summary prospectus, if available, call (800) 728-3337 or your financial representative. We advise you to consider the Fund's objectives, risks, charges and expenses carefully before investing. The summary prospectus and prospectus contain this and other important information about the Fund. Please read the prospectus carefully before you invest.
Bond investments are subject to interest-rate, credit, liquidity and market risks to varying degrees. When interest rates rise, bond prices generally fall. Credit risk refers to the ability of an issuer to make timely payments of principal and interest. Investments in lower-quality ("junk bonds") and non-rated securities present greater risk of loss than investments in higher-quality securities. Investing in foreign securities, particularly those of emerging markets, presents certain risks, such as currency fluctuations, political and economic changes, and market risks. Emerging markets tend to be more volatile and less liquid than the markets of more mature economies, and generally have less diverse and less mature economic structures and less stable political systems than those of developed countries. Investing in derivatives entails special risks relating to liquidity, leverage and credit that may reduce returns and/or increase volatility. The Fund may lend securities to approved institutions. See the prospectus for details.
Deutsche Asset Management represents the asset management activities conducted by Deutsche Bank AG or any of its subsidiaries.
Deutsche AM Distributors, Inc., 222 South Riverside Plaza, Chicago, IL 60606, (800) 621-1148
NOT FDIC/NCUA INSURED NO BANK GUARANTEE MAY LOSE VALUE NOT A DEPOSIT
NOT INSURED BY ANY FEDERAL GOVERNMENT AGENCY
Performance Summary June 30, 2017 (Unaudited)
Fund performance shown is historical, assumes reinvestment of all dividend and capital gain distributions and does not guarantee future results. Investment return and principal value fluctuate with changing market conditions so that, when redeemed, shares may be worth more or less than their original cost. Current performance may be lower or higher than the performance data quoted. Please contact your participating insurance company for the Fund's most recent month-end performance. Performance doesn't reflect charges and fees ("contract charges") associated with the separate account that invests in the Fund or any variable life insurance policy or variable annuity contract for which the Fund is an investment option. These charges and fees will reduce returns.
The gross expense ratio of the Fund, as stated in the fee table of the prospectus dated May 1, 2017 is 1.34% for Class A shares and may differ from the expense ratio disclosed in the Financial Highlights table in this report.
Generally accepted accounting principles require adjustments to be made to the net assets of the Fund at period end for financial reporting purposes only, and as such, the total return based on the unadjusted net asset value per share may differ from the total return reported in the financial highlights.
| Growth of an Assumed $10,000 Investment in Deutsche Unconstrained Income VIP | ||
■ Deutsche Unconstrained Income VIP — Class A ■ Bloomberg Barclays U.S. Universal Index | The unmanaged Bloomberg Barclays U.S. Universal Index represents the union of the U.S. Aggregate Index, the U.S. High-Yield Corporate Index, the 144A Index, the Eurodollar Index, the Emerging Markets Index and the non-ERISA portion of the CMBS Index. Index returns do not reflect any fees or expenses and it is not possible to invest directly into an index. | |
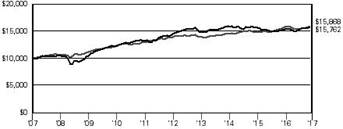 | ||
| Yearly periods ended June 30 | ||
| Comparative Results | ||||||
| Deutsche Unconstrained Income VIP | 6-Month‡ | 1-Year | 3-Year | 5-Year | 10-Year | |
| Class A | Growth of $10,000 | $10,396 | $10,321 | $9,877 | $10,973 | $15,762 |
| Average annual total return | 3.96% | 3.21% | –0.41% | 1.87% | 4.66% | |
| Bloomberg Barclays U.S. Universal Index | Growth of $10,000 | $10,263 | $10,091 | $10,851 | $11,442 | $15,868 |
| Average annual total return | 2.63% | 0.91% | 2.76% | 2.73% | 4.73% | |
The growth of $10,000 is cumulative.
‡ Total returns shown for periods less than one year are not annualized.
Portfolio Summary (Unaudited)
| Asset Allocation (As a % of Investment Portfolio excluding Securities Lending Collateral) | 6/30/17 | 12/31/16 |
| Government & Agency Obligations | 42% | 41% |
| Corporate Bonds | 25% | 20% |
| Exchange-Traded Funds | 8% | 11% |
| Collateralized Mortgage Obligations | 5% | 10% |
| Commercial Mortgage-Backed Securities | 5% | 5% |
| Mortgage-Backed Security Pass-Throughs | 4% | — |
| Loan Participations and Assignments | 4% | 5% |
| Cash Equivalents | 3% | 5% |
| Short-Term U.S. Treasury Obligations | 2% | 2% |
| Asset-Backed | 1% | 1% |
| Convertible Bond | 1% | 0% |
| Common Stocks | 0% | 0% |
| Warrant | 0% | 0% |
| Put Options Purchased | — | 0% |
| 100% | 100% |
| Quality (Excludes Cash Equivalents, Securities Lending Collateral and Exchange-Traded Funds) | 6/30/17 | 12/31/16 |
| AAA | 40% | 41% |
| AA | 0% | 1% |
| A | 5% | 9% |
| BBB | 28% | 31% |
| BB | 16% | 9% |
| B | 6% | 3% |
| CCC or Below | 5% | 6% |
| 100% | 100% |
| Interest Rate Sensitivity | 6/30/17 | 12/31/16 |
| Effective Maturity | 6.6 years | 7.2 years |
| Effective Duration | 4.1 years | 4.6 years |
The quality ratings represent the higher of Moody's Investors Service, Inc. ("Moody's"), Fitch Ratings, Inc. ("Fitch") or Standard & Poor's Corporation ("S&P") credit ratings. The ratings of Moody's, Fitch and S&P represent their opinions as to the quality of the securities they rate. Credit quality measures a bond issuer's ability to repay interest and principal in a timely manner. Ratings are relative and subjective and are not absolute standards of quality. Credit quality does not remove market risk and is subject to change.
Effective maturity is the weighted average of the maturity date of bonds held by the Fund taking into consideration any available maturity shortening features.
Effective duration is an approximate measure of the Fund's sensitivity to interest rate changes taking into consideration any maturity shortening features.
Portfolio holdings and characteristics are subject to change.
For more complete details about the Fund's investment portfolio, see page 5.
Following the Fund's fiscal first and third quarter-end, a complete portfolio holdings listing is filed with the SEC on Form N-Q. The form will be available on the SEC's Web site at sec.gov, and it also may be reviewed and copied at the SEC's Public Reference Room in Washington, D.C. Information on the operation of the SEC's Public Reference Room may be obtained by calling (800) SEC-0330. The Fund's portfolio holdings are also posted on deutschefunds.com from time to time. Please see the Fund's current prospectus for more information.
Portfolio Management Team
Prior to August 1, 2017, the portfolio management team is as follows:
Gary Russell, CFA, Managing Director
John D. Ryan, Managing Director
Darwei Kung, Managing Director
Portfolio Managers
Effective August 1, 2017, the portfolio management team is as follows:
John D. Ryan, Managing Director
Kevin Bliss, Director
Portfolio Managers
Investment Portfolio June 30, 2017 (Unaudited)
| Principal Amount ($)(a) | Value ($) | |||
| Corporate Bonds 23.9% | ||||
| Consumer Discretionary 1.9% | ||||
| Adient Global Holdings Ltd., 144A, 4.875%, 8/15/2026 | 200,000 | 200,500 | ||
| American Axle & Manufacturing, Inc., 144A, 6.25%, 4/1/2025 (b) | 60,000 | 58,500 | ||
| Charter Communications Operating LLC: | ||||
| 3.579%, 7/23/2020 | 20,000 | 20,668 | ||
| 4.908%, 7/23/2025 | 10,000 | 10,803 | ||
| CVS Health Corp., 5.125%, 7/20/2045 | 30,000 | 34,392 | ||
| General Motors Co., 6.6%, 4/1/2036 | 15,000 | 17,379 | ||
| Nordstrom, Inc.: | ||||
| 4.0%, 3/15/2027 | 20,000 | 19,571 | ||
| 5.0%, 1/15/2044 | 35,000 | 33,347 | ||
| Viacom, Inc.: | ||||
| 5.875%, 2/28/2057 | 20,000 | 20,800 | ||
| 6.25%, 2/28/2057 | 20,000 | 20,800 | ||
| Walgreens Boots Alliance, Inc., 4.8%, 11/18/2044 | 20,000 | 21,283 | ||
| 458,043 | ||||
| Consumer Staples 0.9% | ||||
| Kraft Heinz Foods Co., 4.375%, 6/1/2046 | 200,000 | 195,867 | ||
| Molson Coors Brewing Co., 4.2%, 7/15/2046 | 15,000 | 14,793 | ||
| 210,660 | ||||
| Energy 9.3% | ||||
| Canadian Natural Resources Ltd.: | ||||
| 3.85%, 6/1/2027 | 25,000 | 24,797 | ||
| 4.95%, 6/1/2047 | 20,000 | 20,298 | ||
| Continental Resources, Inc., 5.0%, 9/15/2022 | 100,000 | 98,125 | ||
| Ecopetrol SA, 5.875%, 9/18/2023 | 100,000 | 109,350 | ||
| Enbridge, Inc., 5.5%, 12/1/2046 | 20,000 | 22,370 | ||
| Energy Transfer LP, 5.95%, 10/1/2043 | 10,000 | 10,594 | ||
| EnLink Midstream Partners LP, 5.45%, 6/1/2047 | 35,000 | 34,898 | ||
| Halliburton Co., 4.85%, 11/15/2035 | 10,000 | 10,691 | ||
| Hess Corp.: | ||||
| 5.6%, 2/15/2041 | 50,000 | 49,153 | ||
| 5.8%, 4/1/2047 | 25,000 | 25,208 | ||
| Hilcorp Energy I LP, 144A, 5.75%, 10/1/2025 | 100,000 | 94,250 | ||
| KazMunayGas National Co. JSC: | ||||
| 144A, 3.875%, 4/19/2022 | 200,000 | 197,920 | ||
| 144A, 4.75%, 4/19/2027 | 200,000 | 196,020 | ||
| Kinder Morgan Energy Partners LP, 4.7%, 11/1/2042 | 40,000 | 37,763 | ||
| Lukoil International Finance BV, 144A, 6.656%, 6/7/2022 | 150,000 | 168,345 | ||
| Marathon Oil Corp., 5.2%, 6/1/2045 | 35,000 | 33,557 | ||
| MEG Energy Corp., 144A, 6.5%, 1/15/2025 (b) | 100,000 | 91,000 | ||
| Noble Holding International Ltd.: | ||||
| 5.75%, 3/16/2018 | 10,000 | 10,061 | ||
| 7.75%, 1/15/2024 (b) | 100,000 | 79,125 | ||
| Oasis Petroleum, Inc., 6.875%, 3/15/2022 (b) | 50,000 | 48,500 | ||
| Principal Amount ($)(a) | Value ($) | |||
| Pertamina Persero PT, 144A, 5.25%, 5/23/2021 | 200,000 | 216,542 | ||
| Petroleos Mexicanos, REG S, 3.75%, 2/21/2024 | EUR | 200,000 | 236,469 | |
| Plains All American Pipeline LP: | ||||
| 2.85%, 1/31/2023 | 25,000 | 24,253 | ||
| 4.3%, 1/31/2043 | 35,000 | 29,947 | ||
| 4.5%, 12/15/2026 | 50,000 | 50,568 | ||
| Regency Energy Partners LP, 4.5%, 11/1/2023 | 20,000 | 20,752 | ||
| Sunoco Logistics Partners Operations LP, 5.3%, 4/1/2044 | 20,000 | 19,498 | ||
| Transcanada Trust, 5.3%, 3/15/2077 | 90,000 | 92,520 | ||
| Weatherford International Ltd., 144A, 9.875%, 2/15/2024 | 100,000 | 104,500 | ||
| WPX Energy, Inc., 6.0%, 1/15/2022 | 100,000 | 99,000 | ||
| 2,256,074 | ||||
| Financials 3.7% | ||||
| Akbank TAS, 144A, 5.0%, 10/24/2022 | 400,000 | 398,752 | ||
| Ares Capital Corp., 3.625%, 1/19/2022 | 20,000 | 20,231 | ||
| Blackstone Holdings Finance Co., LLC, 144A, 5.0%, 6/15/2044 | 10,000 | 10,879 | ||
| Everest Reinsurance Holdings, Inc., 4.868%, 6/1/2044 | 30,000 | 30,881 | ||
| FS Investment Corp., 4.75%, 5/15/2022 | 40,000 | 41,072 | ||
| KKR Group Finance Co. III LLC, 144A, 5.125%, 6/1/2044 | 20,000 | 21,160 | ||
| Legg Mason, Inc., 5.625%, 1/15/2044 | 20,000 | 21,243 | ||
| Massachusetts Mutual Life Insurance Co., 144A, 4.5%, 4/15/2065 | 10,000 | 10,115 | ||
| Nationwide Financial Services, Inc., 144A, 5.3%, 11/18/2044 | 20,000 | 22,744 | ||
| Santander Holdings U.S.A., Inc., 144A, 3.7%, 3/28/2022 | 75,000 | 75,969 | ||
| Swiss Re Treasury U.S. Corp., 144A, 4.25%, 12/6/2042 | 20,000 | 20,564 | ||
| TC Ziraat Bankasi AS, 144A, 5.125%, 5/3/2022 | 200,000 | 200,654 | ||
| Voya Financial, Inc., 4.8%, 6/15/2046 | 15,000 | 15,624 | ||
| 889,888 | ||||
| Health Care 0.7% | ||||
| Abbott Laboratories, 2.9%, 11/30/2021 | 60,000 | 60,670 | ||
| Allergan Funding SCS, 4.75%, 3/15/2045 | 4,000 | 4,318 | ||
| Celgene Corp., 5.0%, 8/15/2045 | 10,000 | 11,260 | ||
| Express Scripts Holding Co.: | ||||
| 3.4%, 3/1/2027 | 25,000 | 24,128 | ||
| 4.8%, 7/15/2046 | 20,000 | 20,343 | ||
| Gilead Sciences, Inc., 4.15%, 3/1/2047 | 15,000 | 15,070 | ||
| Mylan NV, 5.25%, 6/15/2046 | 25,000 | 27,348 | ||
| Stryker Corp., 4.625%, 3/15/2046 | 10,000 | 10,925 | ||
| 174,062 | ||||
| Principal Amount ($)(a) | Value ($) | |||
| Industrials 0.3% | ||||
| FedEx Corp., 4.55%, 4/1/2046 | 15,000 | 15,757 | ||
| Park Aerospace Holdings Ltd., 144A, 5.25%, 8/15/2022 | 60,000 | 62,719 | ||
| 78,476 | ||||
| Information Technology 1.3% | ||||
| Dell International LLC: | ||||
| 144A, 4.42%, 6/15/2021 | 100,000 | 105,422 | ||
| 144A, 8.1%, 7/15/2036 | 20,000 | 25,138 | ||
| DXC Technology Co., 144A, 4.75%, 4/15/2027 | 90,000 | 93,842 | ||
| Seagate HDD Cayman: | ||||
| 144A, 4.25%, 3/1/2022 | 30,000 | 30,494 | ||
| 5.75%, 12/1/2034 | 30,000 | 30,012 | ||
| Xilinx, Inc., 2.95%, 6/1/2024 | 35,000 | 35,094 | ||
| 320,002 | ||||
| Materials 0.9% | ||||
| AK Steel Corp., 7.0%, 3/15/2027 (b) | 100,000 | 103,250 | ||
| CF Industries, Inc., 144A, 4.5%, 12/1/2026 | 5,000 | 5,141 | ||
| Chemours Co., 6.625%, 5/15/2023 | 60,000 | 63,450 | ||
| Glencore Funding LLC, 144A, 4.625%, 4/29/2024 | 10,000 | 10,454 | ||
| Potash Corp. of Saskatchewan, Inc., 4.0%, 12/15/2026 | 30,000 | 30,933 | ||
| 213,228 | ||||
| Real Estate 1.2% | ||||
| CBL & Associates LP: | ||||
| (REIT), 5.25%, 12/1/2023 | 40,000 | 39,019 | ||
| (REIT), 5.95%, 12/15/2026 | 40,000 | 39,609 | ||
| Crown Castle International Corp., (REIT), 5.25%, 1/15/2023 | 15,000 | 16,662 | ||
| Hospitality Properties Trust, (REIT), 5.0%, 8/15/2022 | 60,000 | 64,315 | ||
| Host Hotels & Resorts LP, (REIT), 3.875%, 4/1/2024 | 35,000 | 35,602 | ||
| Omega Healthcare Investors, Inc.: | ||||
| (REIT), 4.75%, 1/15/2028 | 35,000 | 34,940 | ||
| (REIT), 4.95%, 4/1/2024 | 30,000 | 31,421 | ||
| Select Income REIT: | ||||
| (REIT), 4.15%, 2/1/2022 | 30,000 | 30,244 | ||
| (REIT), 4.25%, 5/15/2024 | 10,000 | 9,911 | ||
| 301,723 | ||||
| Telecommunication Services 1.4% | ||||
| AT&T, Inc.: | ||||
| 3.4%, 5/15/2025 | 50,000 | 49,154 | ||
| 4.5%, 5/15/2035 | 35,000 | 34,433 | ||
| Frontier Communications Corp., 6.25%, 9/15/2021 | 100,000 | 89,250 | ||
| Telefonica Emisiones SAU, 5.213%, 3/8/2047 | 150,000 | 161,960 | ||
| Verizon Communications, Inc., 4.272%, 1/15/2036 | 15,000 | 14,477 | ||
| 349,274 | ||||
| Utilities 2.3% | ||||
| Electricite de France SA, 144A, 4.75%, 10/13/2035 | 25,000 | 26,703 | ||
| Eskom Holdings SOC Ltd., 144A, 6.75%, 8/6/2023 | 400,000 | 407,880 | ||
| Great Plains Energy, Inc., 4.85%, 4/1/2047 | 20,000 | 20,580 | ||
| NRG Energy, Inc., 6.25%, 7/15/2022 | 100,000 | 102,625 | ||
| Principal Amount ($)(a) | Value ($) | |||
| Southern Power Co., Series F, 4.95%, 12/15/2046 | 7,000 | 7,228 | ||
| 565,016 | ||||
| Total Corporate Bonds (Cost $5,778,010) | 5,816,446 | |||
| Mortgage-Backed Securities Pass-Throughs 3.8% | ||||
| Federal Home Loan Mortgage Corp., 4.5%, 4/1/2047 | 394,891 | 423,314 | ||
| Federal National Mortgage Association, 4.0%, 12/1/2040 | 482,763 | 509,928 | ||
| Total Mortgage-Backed Securities Pass-Throughs (Cost $937,059) | 933,242 | |||
| Asset-Backed 1.4% | ||||
| Home Equity Loans 0.1% | ||||
| CIT Group Home Equity Loan Trust, "AF6", Series 2002-1, 6.2%, 2/25/2030 | 22,690 | 23,046 | ||
| Miscellaneous 1.3% | ||||
| Domino's Pizza Master Issuer LLC: | ||||
| "A23", Series 2017-1A, 144A, 4.118%, 7/25/2047 (c) | 110,000 | 109,931 | ||
| "A2", Series 2012-1A, 144A, 5.216%, 1/25/2042 | 86,691 | 86,732 | ||
| Hilton Grand Vacations Trust, "B", Series 2014-AA, 144A, 2.07%, 11/25/2026 | 115,768 | 114,417 | ||
| 311,080 | ||||
| Total Asset-Backed (Cost $340,080) | 334,126 | |||
| Commercial Mortgage-Backed Securities 4.4% | ||||
| Credit Suisse First Boston Mortgage Securities Corp., "G", Series 2005-C6, 144A, 5.23%**, 12/15/2040 | 157,444 | 158,010 | ||
| CSAIL Commercial Mortgage Trust, "A4", Series 2015-C4, 3.808%, 11/15/2048 | 110,000 | 114,962 | ||
| GMAC Commercial Mortgage Securities, Inc., "G", Series 2004-C1, 144A, 5.455%, 3/10/2038 | 502,641 | 494,054 | ||
| JPMBB Commercial Mortgage Securities Trust: | ||||
| "A4", Series 2015-C28, 3.227%, 10/15/2048 | 170,000 | 171,839 | ||
| "A3", Series 2014-C19, 3.669%, 4/15/2047 | 125,000 | 129,912 | ||
| Total Commercial Mortgage-Backed Securities (Cost $1,074,756) | 1,068,777 | |||
| Collateralized Mortgage Obligations 5.3% | ||||
| Banc of America Mortgage Securities, "2A2", Series 2004-A, 3.59%**, 2/25/2034 | 45,292 | 44,843 | ||
| Bear Stearns Adjustable Rate Mortgage Trust, "2A1", Series 2005-11, 3.882%**, 12/25/2035 | 64,704 | 65,666 | ||
| Principal Amount ($)(a) | Value ($) | |||
| Countrywide Home Loans, "2A5", Series 2004-13, 5.75%, 8/25/2034 | 41,404 | 41,181 | ||
| Fannie Mae Connecticut Avenue Securities, "1M1", Series 2016-C02, 3.174%**, 9/25/2028 | 131,061 | 132,936 | ||
| Federal Home Loan Mortgage Corp.: | ||||
| "AI", Series 4016, Interest Only, 3.0%, 9/15/2025 | 493,883 | 23,166 | ||
| "H", Series 4865, 4.0%, 8/15/2044 | 247,722 | 262,818 | ||
| "PI", Series 3843, Interest Only, 4.5%, 5/15/2038 | 175,979 | 14,766 | ||
| "C31", Series 303, Interest Only, 4.5%, 12/15/2042 | 510,005 | 100,427 | ||
| "HI", Series 2934, Interest Only, 5.0%, 2/15/2020 | 29,403 | 1,373 | ||
| "WI", Series 3010, Interest Only, 5.0%, 7/15/2020 | 47,198 | 2,119 | ||
| Federal National Mortgage Association: | ||||
| "4", Series 406, Interest Only, 4.0%, 9/25/2040 | 116,348 | 22,619 | ||
| "BI", Series 2010-13, Interest Only, 5.0%, 12/25/2038 | 1,099 | 0 | ||
| Government National Mortgage Association: | ||||
| "GI", Series 2014-146, Interest Only, 3.5%, 9/20/2029 | 1,237,328 | 162,409 | ||
| "PI", Series 2015-40, Interest Only, 4.0%, 4/20/2044 | 156,772 | 20,631 | ||
| "HI", Series 2015-77, Interest Only, 4.0%, 5/20/2045 | 304,119 | 57,988 | ||
| "IP", Series 2014-115, Interest Only, 4.5%, 2/20/2044 | 48,720 | 8,658 | ||
| "IV", Series 2009-69, Interest Only, 5.5%, 8/20/2039 | 153,133 | 25,823 | ||
| "IN", Series 2009-69, Interest Only, 5.5%, 8/20/2039 | 158,266 | 28,708 | ||
| "IJ", Series 2009-75, Interest Only, 6.0%, 8/16/2039 | 148,858 | 25,632 | ||
| JPMorgan Mortgage Trust, "2A1",��Series 2006-A2, 3.324%**, 4/25/2036 | 166,682 | 161,782 | ||
| Merrill Lynch Mortgage Investors Trust, "2A", Series 2003-A6, 3.266%**, 10/25/2033 | 34,958 | 34,980 | ||
| Wells Fargo Mortgage-Backed Securities Trust, "2A3",Series 2004-EE, 3.237%**, 12/25/2034 | 50,289 | 49,978 | ||
| Total Collateralized Mortgage Obligations (Cost $1,039,885) | 1,288,503 | |||
| Government & Agency Obligations 40.5% | ||||
| Other Government Related (d) 3.8% | ||||
| Perusahaan Penerbit SBSN, 144A, 4.325%, 5/28/2025 | 200,000 | 206,260 | ||
| Sberbank of Russia, 144A, 5.125%, 10/29/2022 | 200,000 | 206,000 | ||
| Southern Gas Corridor CJSC, 144A, 6.875%, 3/24/2026 | 290,000 | 313,925 | ||
| Vnesheconombank, 144A, 6.025%, 7/5/2022 | 200,000 | 214,282 | ||
| 940,467 | ||||
| Principal Amount ($)(a) | Value ($) | |||
| Sovereign Bonds 11.8% | ||||
| Export Credit Bank of Turkey, 144A, 5.375%, 10/24/2023 | 200,000 | 202,000 | ||
| Government of Indonesia, Series FR56, 8.375%, 9/15/2026 | IDR | 1,340,000,000 | 110,900 | |
| KazAgro National Management Holding JSC, 144A, 4.625%, 5/24/2023 | 700,000 | 696,780 | ||
| Mexican Udibonos Inflation-Linked Bond, Series S, 2.0%, 6/9/2022 | MXN | 2,775,632 | 145,285 | |
| Republic of Argentina-Inflation Linked Bond, 5.83%, 12/31/2033 | ARS | 375 | 170 | |
| Republic of Hungary, Series 19/A, 6.5%, 6/24/2019 | HUF | 11,600,000 | 48,187 | |
| Republic of Namibia: | ||||
| 144A, 5.25%, 10/29/2025 | 200,000 | 205,790 | ||
| 144A, 5.5%, 11/3/2021 | 200,000 | 215,234 | ||
| Republic of Portugal, 144A, 5.125%, 10/15/2024 | 400,000 | 408,000 | ||
| Republic of Slovenia, 144A, 5.5%, 10/26/2022 | 100,000 | 114,090 | ||
| Republic of Sri Lanka, 144A, 5.75%, 1/18/2022 | 500,000 | 517,623 | ||
| United Mexican States, Series M, 5.75%, 3/5/2026 | MXN | 3,845,600 | 197,811 | |
| 2,861,870 | ||||
| U.S. Treasury Obligations 24.9% | ||||
| U.S. Treasury Bond, 3.0%, 5/15/2047 | 35,000 | 36,121 | ||
| U.S. Treasury Notes: | ||||
| 0.75%, 10/31/2017 (e) | 730,000 | 729,168 | ||
| 1.5%, 5/31/2019 | 232,600 | 233,118 | ||
| 1.625%, 12/31/2019 | 109,000 | 109,409 | ||
| 1.625%, 2/15/2026 | 5,000,000 | 4,751,955 | ||
| 1.625%, 5/15/2026 | 50,000 | 47,402 | ||
| 2.375%, 5/15/2027 | 150,000 | 150,949 | ||
| 6,058,122 | ||||
| Total Government & Agency Obligations (Cost $9,905,047) | 9,860,459 | |||
| Short-Term U.S. Treasury Obligation 1.6% | ||||
| U.S. Treasury Bill, 0.59%***, 8/10/2017 (f) (Cost $379,638) | 380,000 | 379,650 | ||
| Loan Participations and Assignments 3.6% | ||||
| Senior Loans** | ||||
| American Rock Salt Holdings LLC, First Lien Term Loan, 4.976%, 5/20/2021 | 101,750 | 102,005 | ||
| Calpine Corp., Term Loan B5, 4.046%, 1/15/2024 | 191,100 | 191,046 | ||
| DaVita HealthCare Partners, Inc., Term Loan B, 3.976%, 6/24/2021 | 67,900 | 68,070 | ||
| Level 3 Financing, Inc., Term Loan B, 3.466%, 2/22/2024 | 60,000 | 60,206 | ||
| MacDermid, Inc., Term Loan B6, 4.226%, 6/7/2023 | 61,853 | 62,038 | ||
| MEG Energy Corp., Term Loan B, 4.696%, 12/31/2023 | 29,526 | 28,871 | ||
| NRG Energy, Inc., Term Loan B, 3.546%, 6/30/2023 | 114,581 | 114,567 | ||
| Principal Amount ($)(a) | Value ($) | |||
| Quebecor Media, Inc., Term Loan B1, 3.432%, 8/17/2020 | 86,625 | 86,986 | ||
| Valeant Pharmaceuticals International, Inc., Term Loan B, 5.83%, 4/1/2022 | 150,556 | 152,775 | ||
| Total Loan Participations and Assignments (Cost $863,327) | 866,564 | |||
| Convertible Bond 0.5% | ||||
| Materials | ||||
| GEO Specialty Chemicals, Inc., 144A, 7.5%, 10/30/2018 (PIK) (Cost $133,424) | 134,561 | 132,810 | ||
Shares | Value ($) | |||
| Common Stocks 0.0% | ||||
| Materials | ||||
| GEO Specialty Chemicals, Inc.* (Cost $19,933) | 13,196 | 5,000 | ||
| Warrant 0.0% | ||||
| Materials | ||||
| Hercules Trust II, Expiration Date 3/31/2029* (Cost $17,432) | 85 | 2,818 | ||
Shares | Value ($) | |||
| Exchange-Traded Funds 8.1% | ||||
| iShares iBoxx $ High Yield Corporate Bond ETF (b) | 9,000 | 795,510 | ||
| SPDR Bloomberg Barclays High Yield Bond ETF | 25,000 | 930,000 | ||
| VanEck Vectors JPMorgan EM Local Currency Bond ETF | 12,500 | 236,125 | ||
| Total Exchange-Traded Funds (Cost $1,965,475) | 1,961,635 | |||
| Securities Lending Collateral 4.5% | ||||
| Deutsche Government & Agency Securities Portfolio "Deutsche Government Cash Institutional Shares", 0.87% (g) (h) (Cost $1,094,375) | 1,094,375 | 1,094,375 | ||
| Cash Equivalents 3.2% | ||||
| Deutsche Central Cash Management Government Fund, 1.03% (g) (Cost $778,005) | 778,005 | 778,005 | ||
| % of Net Assets | Value ($) | |
| Total Investment Portfolio (Cost $24,326,446)† | 100.8 | 24,522,410 |
| Other Assets and Liabilities, Net | (0.8) | (201,648) |
| Net Assets | 100.0 | 24,320,762 |
* Non-income producing security.
** Floating rate securities' yields vary with a designated market index or market rate, such as the coupon-equivalent of the U.S. Treasury Bill rate. These securities are shown at their current rate as of June 30, 2017.
*** Annualized yield at time of purchase; not a coupon rate.
† The cost for federal income tax purposes was $24,327,830. At June 30, 2017, net unrealized appreciation for all securities based on tax cost was $194,580. This consisted of aggregate gross unrealized appreciation for all securities in which there was an excess of value over tax cost of $530,249 and aggregate gross unrealized depreciation for all securities in which there was an excess of tax cost over value of $335,669.
(a) Principal amount stated in U.S. dollars unless otherwise noted.
(b) All or a portion of these securities were on loan. In addition, "Other Assets and Liabilities, Net" may include pending sales that are also on loan. The value of securities loaned at June 30, 2017 amounted to $1,065,391, which is 4.4% of net assets.
(c) When-issued security.
(d) Government-backed debt issued by financial companies or government-sponsored enterprises.
(e) At June 30, 2017, this security has been pledged, in whole or in part, to cover initial margin requirements for open centrally cleared swap contracts.
(f) At June 30, 2017, this security has been pledged, in whole or in part, to cover initial margin requirements for open futures contracts.
(g) Affiliated fund managed by Deutsche Investment Management Americas Inc. The rate shown is the annualized seven-day yield at period end.
(h) Represents collateral held in connection with securities lending. Income earned by the Fund is net of borrower rebates.
144A: Security exempt from registration under Rule 144A of the Securities Act of 1933. These securities may be resold in transactions exempt from registration, normally to qualified institutional buyers.
CJSC: Closed Joint Stock Company
EM: Emerging Markets
Interest Only: Interest Only (IO) bonds represent the "interest only" portion of payments on a pool of underlying mortgages or mortgage-backed securities. IO securities are subject to prepayment risk of the pool of underlying mortgages.
JSC: Joint Stock Company
PIK: Denotes that all or a portion of the income is paid in-kind in the form of additional principal.
REG S: Securities sold under Regulation S may not be offered, sold or delivered within the United States or to, or for the account or benefit of, U.S. persons, except pursuant to an exemption from, or in a transaction not subject to, the registration requirements of the Securities Act of 1933.
REIT: Real Estate Investment Trust
SBSN: Surat Berharga Syariah Negara (Islamic Based Government Securities)
SPDR: Standard & Poor's Depositary Receipt
At June 30, 2017, open futures contracts purchased were as follows:
| Futures | Currency | Expiration Date | Contracts | Notional Value ($) | Unrealized Appreciation (Depreciation) ($) |
| 10 Year Australian Treasury Bond | AUD | 9/15/2017 | 8 | 794,792 | (10,593) |
| 5 Year U.S. Treasury Note | USD | 9/29/2017 | 12 | 1,414,031 | (8,836) |
| Ultra Long U.S. Treasury Bond | USD | 9/20/2017 | 1 | 165,875 | 3,076 |
| Total net unrealized depreciation | (16,353) | ||||
At June 30, 2017, open futures contracts sold were as follows:
| Futures | Currency | Expiration Date | Contracts | Notional Value ($) | Unrealized Appreciation ($) |
| 2 Year U.S. Treasury Note | USD | 9/29/2017 | 15 | 3,241,641 | 1,143 |
| Ultra 10 Year U.S. Treasury Note | USD | 9/20/2017 | 20 | 2,696,250 | 33,211 |
| Total unrealized appreciation | 34,354 | ||||
At June 30, 2017, open credit default swap contracts sold were as follows:
| Centrally Cleared Swap | |||||
| Expiration Date | Notional Amount ($) (i) | Fixed Cash Flows Received | Underlying Reference Obligation | Value ($) | Unrealized (Depreciation) ($) |
6/20/2022 | 3,070,000 | 5.0% | Markit CDX North America High Yield Index | 217,441 | (336) |
(i) The maximum potential amount of future undiscounted payments that the Fund could be required to make under a credit default swap contract would be the notional amount of the contract. These potential amounts would be partially offset by any recovery values of the referenced debt obligation or net amounts received from the settlement of buy protection credit default swap contracts entered into by the Fund for the same referenced debt obligation, if any.
As of June 30, 2017, the Fund had the following open forward foreign currency exchange contracts:
| Contracts to Deliver | In Exchange For | Settlement Date | Unrealized Appreciation ($) | Counterparty | |||||
| JPY | 27,755,025 | USD | 249,257 | 8/21/2017 | 1,941 | BNP Paribas | |||
| USD | 591,836 | MXN | 10,926,000 | 9/12/2017 | 3,247 | Citigroup, Inc. | |||
| Total unrealized appreciation | 5,188 | ||||||||
| Contracts to Deliver | In Exchange For | Settlement Date | Unrealized Depreciation ($) | Counterparty | |||||
| MXN | 14,500,000 | USD | 772,695 | 7/20/2017 | (23,509) | Toronto Dominion Bank | |||
| EUR | 200,000 | USD | 218,020 | 7/26/2017 | (10,743) | Citigroup, Inc. | |||
| USD | 250,000 | JPY | 27,755,025 | 8/21/2017 | (2,684) | JPMorgan Chase Securities, Inc. | |||
| Total unrealized depreciation | (36,936) | ||||||||
| Currency Abbreviations |
ARS Argentine Peso AUD Australian Dollar EUR Euro HUF Hungarian Forint IDR Indonesian Rupiah JPY Japanese Yen MXN Mexican Peso USD United States Dollar |
For information on the Fund's policy and additional disclosures regarding futures contracts, credit default swap contracts and forward foreign currency exchange contracts, please refer to Note B in the accompanying Notes to Financial Statements.
Fair Value Measurements
Various inputs are used in determining the value of the Fund's investments. These inputs are summarized in three broad levels. Level 1 includes quoted prices in active markets for identical securities. Level 2 includes other significant observable inputs (including quoted prices for similar securities, interest rates, prepayment speeds and credit risk). Level 3 includes significant unobservable inputs (including the Fund's own assumptions in determining the fair value of investments). The level assigned to the securities valuations may not be an indication of the risk or liquidity associated with investing in those securities.
The following is a summary of the inputs used as of June 30, 2017 in valuing the Fund's investments. For information on the Fund's policy regarding the valuation of investments, please refer to the Security Valuation section of Note A in the accompanying Notes to Financial Statements.
| Assets | Level 1 | Level 2 | Level 3 | Total | |
| Fixed Income Investments (j) | |||||
| Corporate Bonds | $ — | $ 5,816,446 | $ — | $ 5,816,446 | |
| Mortgage-Backed Securities Pass-Throughs | — | 933,242 | — | 933,242 | |
| Asset-Backed | — | 334,126 | — | 334,126 | |
| Commercial Mortgage-Backed Securities | — | 1,068,777 | — | 1,068,777 | |
| Collateralized Mortgage Obligations | — | 1,288,503 | — | 1,288,503 | |
| Government & Agency Obligations | — | 9,860,459 | — | 9,860,459 | |
| Short-Term U.S. Treasury Obligation | — | 379,650 | — | 379,650 | |
| Loan Participations and Assignments | — | 866,564 | — | 866,564 | |
| Convertible Bond | — | — | 132,810 | 132,810 | |
| Common Stocks | — | — | 5,000 | 5,000 | |
| Warrant | — | — | 2,818 | 2,818 | |
| Exchange-Traded Funds | 1,961,635 | — | — | 1,961,635 | |
| Short-Term Investments (j) | 1,872,380 | — | — | 1,872,380 | |
| Derivatives (k) | |||||
| Futures Contracts | 37,430 | — | — | 37,430 | |
| Forward Foreign Currency Exchange Contracts | — | 5,188 | — | 5,188 | |
| Total | $ 3,871,445 | $ 20,552,955 | $ 140,628 | $ 24,565,028 | |
| Liabilities | Level 1 | Level 2 | Level 3 | Total | |
| Derivatives (k) | |||||
| Futures Contracts | $ (19,429) | $ — | $ — | $ (19,429) | |
| Credit Default Swap Contracts | — | (336) | — | (336) | |
| Forward Foreign Currency Exchange Contracts | — | (36,936) | — | (36,936) | |
| Total | $ (19,429) | $ (37,272) | $ — | $ (56,701) | |
There have been no transfers between fair value measurement levels during the period ended June 30, 2017.
(j) See Investment Portfolio for additional detailed categorizations.
(k) Derivatives include unrealized appreciation (depreciation) on futures contracts, credit default swap contracts and forward foreign currency exchange contracts.
The accompanying notes are an integral part of the financial statements.
Statement of Assets and Liabilities
| as of June 30, 2017 (Unaudited) | |
| Assets | |
Investments: Investments in non-affiliated securities, at value (cost $22,454,066) — including $1,065,391 of securities loaned | $ 22,650,030 |
| Investments in Deutsche Government & Agency Securities Portfolio (cost $1,094,375)* | 1,094,375 |
| Investment in Deutsche Central Cash Management Government Fund (cost $778,005) | 778,005 |
| Total investments in securities, at value (cost $24,326,446) | 24,522,410 |
| Cash | 224,052 |
| Foreign currency, at value (cost $451,952) | 438,134 |
| Receivable for investments sold | 481,695 |
| Receivable for Fund shares sold | 99 |
| Interest receivable | 194,871 |
| Receivable for variation margin on centrally cleared swap contracts | 160 |
| Net receivable for pending swap contracts | 2,733 |
| Unrealized appreciation on forward foreign currency exchange contracts | 5,188 |
| Foreign taxes recoverable | 632 |
| Other assets | 345 |
| Total assets | $ 25,870,319 |
| Liabilities | |
| Payable upon return of securities loaned | 1,094,375 |
| Payable for investments purchased | 214,052 |
| Payable for investments purchased — when-issued security | 110,000 |
| Payable for Fund shares redeemed | 7,475 |
| Payable for variation margin on futures contracts | 4,403 |
| Unrealized depreciation on forward foreign currency exchange contracts | 36,936 |
| Accrued Trustees' fees | 398 |
| Other accrued expenses and payables | 81,918 |
| Total liabilities | 1,549,557 |
| Net assets, at value | $ 24,320,762 |
| Net Assets Consist of | |
| Undistributed net investment income | 263,141 |
Net unrealized appreciation (depreciation) on: Investments | 195,964 |
| Swap contracts | (336) |
| Futures | 18,001 |
| Foreign currency | (45,360) |
| Accumulated net realized gain (loss) | (4,592,084) |
| Paid-in capital | 28,481,436 |
| Net assets, at value | $ 24,320,762 |
Class A Net Asset Value, offering and redemption price per share ($24,320,762 ÷ 2,444,052 outstanding shares of beneficial interest, no par value, unlimited number of shares authorized) | $ 9.95 |
* Represents collateral on securities loaned.
The accompanying notes are an integral part of the financial statements.
Statement of Operations
| for the six months ended June 30, 2017 (Unaudited) | |
| Investment Income | |
Income: Interest (net of foreign taxes withheld of $417) | $ 333,897 |
| Dividends | 53,356 |
| Income distributions — Deutsche Central Cash Management Government Fund | 4,878 |
| Securities lending income, net of borrower rebates | 5,766 |
| Total income | 397,897 |
Expenses: Management fee | 66,787 |
| Administration fee | 12,143 |
| Services to shareholders | 353 |
| Custodian fee | 14,743 |
| Professional fees | 43,695 |
| Reports to shareholders | 11,133 |
| Trustees' fees and expenses | 1,690 |
| Pricing service fee | 11,015 |
| Other | 1,115 |
| Total expenses before expense reductions | 162,674 |
| Expense reductions | (81,255) |
| Total expenses after expense reductions | 81,419 |
| Net investment income | 316,478 |
| Realized and Unrealized Gain (Loss) | |
Net realized gain (loss) from: Investments | (49,997) |
| Swap contracts | 178,849 |
| Futures | 184,019 |
| Written options | 93,862 |
| Foreign currency | (23,480) |
| 383,253 | |
Change in net unrealized appreciation (depreciation) on: Investments | 610,696 |
| Swap contracts | (380,606) |
| Futures | 118,956 |
| Written options | (86,505) |
| Foreign currency | (14,811) |
| 247,730 | |
| Net gain (loss) | 630,983 |
| Net increase (decrease) in net assets resulting from operations | $ 947,461 |
The accompanying notes are an integral part of the financial statements.
Statements of Changes in Net Assets
| Increase (Decrease) in Net Assets | Six Months Ended June 30, 2017 (Unaudited) | Year Ended December 31, 2016 | |
Operations: Net investment income | $ 316,478 | $ 620,959 | |
| Net realized gain (loss) | 383,253 | (1,726,036) | |
| Change in net unrealized appreciation (depreciation) | 247,730 | 1,292,328 | |
| Net increase (decrease) in net assets resulting from operations | 947,461 | 187,251 | |
Distributions to shareholders from: Net investment income: Class A | (201,605) | (2,341,380) | |
| Total distributions | (201,605) | (2,341,380) | |
Fund share transactions: Class A Proceeds from shares sold | 500,027 | 1,180,584 | |
| Reinvestment of distributions | 201,605 | 2,341,380 | |
| Payments for shares redeemed | (1,850,201) | (9,433,108) | |
| Net increase (decrease) in net assets from Class A share transactions | (1,148,569) | (5,911,144) | |
| Increase (decrease) in net assets | (402,713) | (8,065,273) | |
| Net assets at beginning of period | 24,723,475 | 32,788,748 | |
| Net assets at end of period (including undistributed net investment income of $263,141 and $148,268, respectively) | $ 24,320,762 | $ 24,723,475 | |
| Other Information | |||
Class A Shares outstanding at beginning of period | 2,560,974 | 3,142,272 | |
| Shares sold | 50,544 | 115,644 | |
| Shares issued to shareholders in reinvestment of distributions | 20,405 | 245,171 | |
| Shares redeemed | (187,871) | (942,113) | |
| Net increase (decrease) in Class A shares | (116,922) | (581,298) | |
| Shares outstanding at end of period | 2,444,052 | 2,560,974 | |
The accompanying notes are an integral part of the financial statements.
Financial Highlights
| Class A | Six Months Ended 6/30/17 (Unaudited) | Years Ended December 31, | |||||
| 2016 | 2015 | 2014 | 2013 | 2012 | |||
| Selected Per Share Data | |||||||
| Net asset value, beginning of period | $ 9.65 | $ 10.43 | $ 11.20 | $ 11.53 | $ 12.60 | $ 11.90 | |
Income (loss) from investment operations: Net investment incomea | .13 | .22 | .40 | .49 | .49 | .57 | |
| Net realized and unrealized gain (loss) | .25 | (.17) | (.72) | (.23) | (.59) | .92 | |
| Total from investment operations | .38 | .05 | (.32) | .26 | (.10) | 1.49 | |
Less distributions from: Net investment income | (.08) | (.83) | (.45) | (.59) | (.62) | (.76) | |
| Net realized gains | — | — | — | — | (.35) | (.03) | |
| Total distributions | (.08) | (.83) | (.45) | (.59) | (.97) | (.79) | |
| Net asset value, end of period | $ 9.95 | $ 9.65 | $ 10.43 | $ 11.20 | $ 11.53 | $ 12.60 | |
| Total Return (%)b | 3.96** | .50 | (3.02) | 2.23 | (1.04) | 13.08 | |
| Ratios to Average Net Assets and Supplemental Data | |||||||
| Net assets, end of period ($ millions) | 24 | 25 | 33 | 54 | 61 | 73 | |
| Ratio of expenses before expense reductions (%)c | 1.34* | 1.31 | 1.15 | 1.08 | 1.02 | .99 | |
| Ratio of expenses after expense reductions (%)c | .67* | .68 | .70 | .77 | .74 | .77 | |
| Ratio of net investment income (%) | 2.61* | 2.19 | 3.67 | 4.23 | 4.16 | 4.72 | |
| Portfolio turnover rate (%) | 59** | 159 | 185 | 185 | 183 | 164 | |
a Based on average shares outstanding during the period. b Total return would have been lower had certain expenses not been reduced. c Expense ratio does not reflect charges and fees associated with the separate account that invests in the Fund or any variable life insurance policy or variable annuity contract for which the Fund is an investment option. * Annualized ** Not annualized | |||||||
Notes to Financial Statements (Unaudited)
A. Organization and Significant Accounting Policies
Deutsche Unconstrained Income VIP (the "Fund") is a diversified series of Deutsche Variable Series II (the "Trust"), which is registered under the Investment Company Act of 1940, as amended (the "1940 Act"), as an open-end management investment company organized as a Massachusetts business trust.
The Fund's financial statements are prepared in accordance with accounting principles generally accepted in the United States of America ("U.S. GAAP") which require the use of management estimates. Actual results could differ from those estimates. The Fund qualifies as an investment company under Topic 946 of Accounting Standards Codification of U.S. GAAP. The policies described below are followed consistently by the Fund in the preparation of its financial statements.
Security Valuation. Investments are stated at value determined as of the close of regular trading on the New York Stock Exchange on each day the exchange is open for trading.
Various inputs are used in determining the value of the Fund's investments. These inputs are summarized in three broad levels. Level 1 includes quoted prices in active markets for identical securities. Level 2 includes other significant observable inputs (including quoted prices for similar securities, interest rates, prepayment speeds and credit risk). Level 3 includes significant unobservable inputs (including the Fund's own assumptions in determining the fair value of investments). The level assigned to the securities valuations may not be an indication of the risk or liquidity associated with investing in those securities.
Debt securities and loan participations and assignments are valued at prices supplied by independent pricing services approved by the Fund's Board. Such services may use various pricing techniques which take into account appropriate factors such as yield, quality, coupon rate, maturity, type of issue, trading characteristics, prepayment speeds and other data, as well as broker quotes. If the pricing services are unable to provide valuations, debt securities are valued at the average of the most recent reliable bid quotations or evaluated prices, as applicable, obtained from broker-dealers and loan participations and assignments are valued at the mean of the most recent bid and ask quotations or evaluated prices, as applicable, obtained from one or more broker-dealers. Certain securities may be valued on the basis of a price provided by a single source or broker-dealer. No active trading market may exist for some senior loans and they may be subject to restrictions on resale. The inability to dispose of senior loans in a timely fashion could result in losses. These securities are generally categorized as Level 2.
Equity securities and exchange-traded funds ("ETFs") are valued at the most recent sale price or official closing price reported on the exchange (U.S. or foreign) or over-the-counter market on which they trade. Equity securities or ETFs for which no sales are reported are valued at the calculated mean between the most recent bid and asked quotations on the relevant market or, if a mean cannot be determined, at the most recent bid quotation. Equity securities and ETFs are generally categorized as Level 1.
Investments in open-end investment companies are valued at their net asset value each business day and are categorized as Level 1.
Futures contracts are generally valued at the settlement prices established each day on the exchange on which they are traded and are categorized as Level 1.
Forward currency contracts are valued at the prevailing forward exchange rate of the underlying currencies and are categorized as Level 2.
Swap contracts are valued daily based upon prices supplied by a Board approved pricing vendor, if available, and otherwise are valued at the price provided by the broker-dealer. Swap contracts are generally categorized as Level 2.
Exchange-traded options are valued at the last sale price or, in the absence of a sale, the mean between the closing bid and asked prices or at the most recent asked price (bid for purchased options) if no bid or asked price are available. Exchange-traded options are categorized as Level 1. Over-the-counter written or purchased options are valued at prices supplied by a Board approved pricing vendor, if available, and otherwise are valued at the price provided by the broker-dealer with which the option was traded. Over-the-counter written or purchased options are generally categorized as Level 2.
Securities and other assets for which market quotations are not readily available or for which the above valuation procedures are deemed not to reflect fair value are valued in a manner that is intended to reflect their fair value as determined in accordance with procedures approved by the Board and are generally categorized as Level 3. In accordance with the Fund's valuation procedures, factors considered in determining value may include, but are not limited to, the type of the security; the size of the holding; the initial cost of the security; the existence of any contractual restrictions on the security's disposition; the price and extent of public trading in similar securities of the issuer or of comparable companies; quotations or evaluated prices from broker-dealers and/or pricing services; information obtained from the issuer, analysts, and/or the appropriate stock exchange (for exchange-traded securities); an analysis of the company's or issuer's financial statements; an evaluation of the forces that influence the issuer and the market(s) in which the security is purchased and sold; and with respect to debt securities, the maturity, coupon, creditworthiness, currency denomination and the movement of the market in which the security is normally traded. The value determined under these procedures may differ from published values for the same securities.
Disclosure about the classification of fair value measurements is included in a table following the Fund's Investment Portfolio.
Foreign Currency Translations. The books and records of the Fund are maintained in U.S. dollars. Investment securities and other assets and liabilities denominated in a foreign currency are translated into U.S. dollars at the prevailing exchange rates at period end. Purchases and sales of investment securities, income and expenses are translated into U.S. dollars at the prevailing exchange rates on the respective dates of the transactions.
Net realized and unrealized gains and losses on foreign currency transactions represent net gains and losses between trade and settlement dates on securities transactions, the acquisition and disposition of foreign currencies, and the difference between the amount of net investment income accrued and the U.S. dollar amount actually received. The portion of both realized and unrealized gains and losses on investments that results from fluctuations in foreign currency exchange rates is not separately disclosed but is included with net realized and unrealized gain/appreciation and loss/depreciation on investments.
Securities Lending. Deutsche Bank AG, as lending agent, lends securities of the Fund to certain financial institutions under the terms of its securities lending agreement. During the term of the loans, the Fund continues to receive interest and dividends generated by the securities and to participate in any changes in their market value. The Fund requires the borrowers of the securities to maintain collateral with the Fund consisting of either cash or liquid, unencumbered assets having a value at least equal to the value of the securities loaned. When the collateral falls below specified amounts, the lending agent will use its best effort to obtain additional collateral on the next business day to meet required amounts under the securities lending agreement. As of period end, any securities on loan were collateralized by cash. During the six months ended June 30, 2017, the Fund invested the cash collateral into a joint trading account in affiliated money market funds managed by Deutsche Investment Management Americas Inc. As of June 30, 2017, the Fund invested the cash collateral in Deutsche Government & Agency Securities Portfolio. Deutsche Investment Management Americas Inc. receives a management/administration fee (0.13% annualized effective rate as of June 30, 2017) on the cash collateral invested in Deutsche Government & Agency Securities Portfolio. The Fund receives compensation for lending its securities either in the form of fees or by earning interest on invested cash collateral net of borrower rebates and fees paid to a lending agent. Either the Fund or the borrower may terminate the loan at any time, and the borrower, after notice, is required to return borrowed securities within a standard time period. There may be risks of delay and costs in recovery of securities or even loss of rights in the collateral should the borrower of the securities fail financially. If the Fund is not able to recover securities lent, the Fund may sell the collateral and purchase a replacement investment in the market, incurring the risk that the value of the replacement security is greater than the value of the collateral. The Fund is also subject to all investment risks associated with the reinvestment of any cash collateral received, including, but not limited to, interest rate, credit and liquidity risk associated with such investments.
As of June 30, 2017, the Fund had securities on loan, which were classified as corporate bonds and exchange-traded funds in the Investment Portfolio. The value of the related collateral exceeded the value of the securities loaned at period end.
| Remaining Contractual Maturity of the Agreements as of June 30, 2017 | |||||
| Overnight and Continuous | <30 days | Between 30 & 90 days | >90 days | Total | |
| Securities Lending Transactions | |||||
| Corporate Bonds | $ 311,375 | $ — | $ — | $ — | $ 311,375 |
| Exchange-Traded Funds | 783,000 | — | — | — | 783,000 |
| Total Borrowings | $ 1,094,375 | $ — | $ — | $ — | $ 1,094,375 |
| Gross amount of recognized liabilities for securities lending transactions | $ 1,094,375 | ||||
Loan Participations and Assignments. Loan Participations and Assignments are portions of loans originated by banks and sold in pieces to investors. These floating-rate loans ("Loans") in which the Fund invests are arranged between the borrower and one or more financial institutions ("Lenders"). These Loans may take the form of Senior Loans, which are corporate obligations often issued in connection with recapitalizations, acquisitions, leveraged buy outs and refinancing. The Fund invests in such Loans in the form of participations in Loans ("Participations") or assignments of all or a portion of Loans from third parties ("Assignments"). Participations typically result in the Fund having a contractual relationship with only the Lender, not with the borrower. The Fund has the right to receive payments of principal, interest and any fees to which it is entitled from the Lender selling the Participation and only upon receipt by the Lender of the payments from the borrower. In connection with purchasing Participations, the Fund generally has no right to enforce compliance by the borrower with the terms of the loan agreement relating to the Loan, or any rights of set off against the borrower, and the Fund will not benefit directly from any collateral supporting the Loan in which it has purchased the Participation. As a result, the Fund assumes the credit risk of both the borrower and the Lender that is selling the Participation. Assignments typically result in the Fund having a direct contractual relationship with the borrower, and the Fund may enforce compliance by the borrower with the terms of the loan agreement. Loans held by the Fund are generally in the form of Assignments, but the Fund may also invest in Participations. If affiliates of the Advisor participate in the primary and secondary market for senior loans, legal limitations may restrict the Fund's ability to participate in restructuring or acquiring some senior loans. All Loans involve interest rate risk, liquidity risk and credit risk, including the potential default or insolvency of the borrower.
When-Issued/Delayed Delivery Securities. The Fund may purchase or sell securities with delivery or payment to occur at a later date beyond the normal settlement period. At the time the Fund enters into a commitment to purchase or sell a security, the transaction is recorded and the value of the transaction is reflected in the net asset value. The price of such security and the date when the security will be delivered and paid for are fixed at the time the transaction is negotiated. The value of the security may vary with market fluctuations. At the time the Fund enters into this type of transaction, it is required to segregate cash or other liquid assets at least equal to the amount of the commitment. Additionally, the Fund may be required to post securities and/or cash collateral in accordance with the terms of the commitment.
Certain risks may arise upon entering into when-issued or delayed delivery transactions from the potential inability of counterparties to meet the terms of their contracts or if the issuer does not issue the securities due to political, economic, or other factors. Additionally, losses may arise due to changes in the value of the underlying securities.
Taxes. The Fund's policy is to comply with the requirements of the Internal Revenue Code, as amended, which are applicable to regulated investment companies and to distribute all of its taxable income to its shareholders.
Additionally, the Fund may be subject to taxes imposed by the governments of countries in which it invests and are generally based on income and/or capital gains earned or repatriated, a portion of which may be recoverable. Based upon the current interpretation of the tax rules and regulations, estimated tax liabilities and recoveries on certain foreign securities are recorded on an accrual basis and are reflected as components of interest income or net change in unrealized gain/loss on investments. Tax liabilities realized as a result of security sales are reflected as a component of net realized gain/loss on investments.
At December 31, 2016, the Fund had net tax basis capital loss carryforwards of approximately $5,075,000, which may be applied against realized net taxable capital gains indefinitely, including short-term losses ($2,624,000) and long-term losses ($2,451,000).
The Fund has reviewed the tax positions for the open tax years as of December 31, 2016 and has determined that no provision for income tax and/or uncertain tax provisions is required in the Fund's financial statements. The Fund's federal tax returns for the prior three fiscal years remain open subject to examination by the Internal Revenue Service.
Distribution of Income and Gains. Distributions from net investment income of the Fund, if any, are declared and distributed to shareholders annually. Net realized gains from investment transactions, in excess of available capital loss carryforwards, would be taxable to the Fund if not distributed and, therefore, will be distributed to shareholders at least annually. The Fund may also make additional distributions for tax purposes if necessary.
The timing and characterization of certain income and capital gain distributions are determined annually in accordance with federal tax regulations which may differ from accounting principles generally accepted in the United States of America. These differences primarily relate to investments in foreign denominated investments, forward currency contracts, futures contracts, swap contracts and certain securities sold at a loss. As a result, net investment income (loss) and net realized gain (loss) on investment transactions for a reporting period may differ significantly from distributions during such period. Accordingly, the Fund may periodically make reclassifications among certain of its capital accounts without impacting the net asset value of the Fund.
The tax character of current year distributions will be determined at the end of the current fiscal year.
Expenses. Expenses of the Trust arising in connection with a specific fund are allocated to that fund. Other Trust expenses which cannot be directly attributed to a fund are apportioned among the funds in the Trust based upon the relative net assets or other appropriate measures.
Contingencies. In the normal course of business, the Fund may enter into contracts with service providers that contain general indemnification clauses. The Fund's maximum exposure under these arrangements is unknown, as this would involve future claims that may be made against the Fund that have not yet been made. However, based on experience, the Fund expects the risk of loss to be remote.
Other. Investment transactions are accounted for on a trade date plus one basis for daily net asset value calculations. However, for financial reporting purposes, investment transactions are reported on trade date. Interest income is recorded on the accrual basis. Dividend income is recorded on the ex-dividend date net of foreign withholding taxes. Realized gains and losses from investment transactions are recorded on an identified cost basis. Proceeds from litigation payments, if any, are included in net realized gain (loss) from investments. All discounts and premiums are accreted/amortized for both tax and financial reporting purposes for the Fund, with the exception of securities in default of principal.
B. Derivative Instruments
Swaps. A swap is a contract between two parties to exchange future cash flows at periodic intervals based on the notional amount of the swap. A bilateral swap is a transaction between the fund and a counterparty where cash flows are exchanged between the two parties. A centrally cleared swap is a transaction executed between the fund and a counterparty, then cleared by a clearing member through a central clearinghouse. The central clearinghouse serves as the counterparty, with whom the fund exchanges cash flows.
The value of a swap is adjusted daily, and the change in value, if any, is recorded as unrealized appreciation or depreciation in the Statement of Assets and Liabilities. Gains or losses are realized when the swap expires or is closed. Certain risks may arise when entering into swap transactions including counterparty default; liquidity; or unfavorable changes in interest rates or the value of the underlying reference security, commodity or index. In connection with bilateral swaps, securities and/or cash may be identified as collateral in accordance with the terms of the swap agreement to provide assets of value and recourse in the event of default. The maximum counterparty credit risk is the net present value of the cash flows to be received from or paid to the counterparty over the term of the swap, to the extent that this amount is beneficial to the Fund, in addition to any related collateral posted to the counterparty by the Fund. This risk may be partially reduced by a master netting arrangement between the Fund and the counterparty. Upon entering into a centrally cleared swap, the Fund is required to deposit with a financial intermediary cash or securities ("initial margin") in an amount equal to a certain percentage of the notional amount of the swap. Subsequent payments ("variation margin") are made or received by the Fund dependent upon the daily fluctuations in the value of the swap. In a cleared swap transaction, counterparty risk is minimized as the central clearinghouse acts as the counterparty.
An upfront payment, if any, made by the Fund is recorded as an asset in the Statement of Assets and Liabilities. An upfront payment, if any, received by the Fund is recorded as a liability in the Statement of Assets and Liabilities. Payments received or made at the end of the measurement period are recorded as realized gain or loss in the Statement of Operations.
Interest Rate Swaps. Interest rate swaps are agreements in which the Fund agrees to pay to the counterparty a fixed rate payment in exchange for the counterparty agreeing to pay to the Fund a variable rate payment, or the Fund agrees to receive from the counterparty a fixed rate payment in exchange for the counterparty agreeing to receive from the Fund a variable rate payment. The payment obligations are based on the notional amount of the swap. For the six months ended June 30, 2017, the Fund entered into interest rate swap agreements to gain exposure to different parts of the yield curve while managing overall duration.
There were no open interest rate swap contracts as of June 30, 2017. For the six months ended June 30, 2017, the investment in interest rate swap contracts had a total notional amount generally indicative of a range from $0 to $17,200,000.
Credit Default Swaps. Credit default swaps are agreements between a buyer and a seller of protection against predefined credit events for the reference entity. The Fund may enter into credit default swaps to gain exposure to an underlying issuer's credit quality characteristics without directly investing in that issuer or to hedge against the risk of a credit event on debt securities. As a seller of a credit default swap, the Fund is required to pay the par (or other agreed-upon) value of the referenced entity to the counterparty with the occurrence of a credit event by a third party, such as a U.S. or foreign corporate issuer, on the reference entity, which would likely result in a loss to the Fund. In return, the Fund receives from the counterparty a periodic stream of payments over the term of the swap provided that no credit event has occurred. If no credit event occurs, the Fund keeps the stream of payments with no payment obligations. The Fund may also buy credit default swaps, in which case the Fund functions as the counterparty referenced above. This involves the risk that the swap may expire worthless. It also involves counterparty risk that the seller may fail to satisfy its payment obligations to the Fund with the occurrence of a credit event. When the Fund sells a credit default swap, it will cover its commitment. This may be achieved by, among other methods, maintaining cash or liquid assets equal to the aggregate notional value of the reference entities for all outstanding credit default swaps sold by the Fund. For the six months ended June 30, 2017, the Fund entered into credit default swap agreements to gain exposure to the underlying issuer's credit quality characteristics and to hedge the risk of default on fund securities.
Under the terms of a credit default swap, the Fund receives or makes periodic payments based on a specified interest rate on a fixed notional amount. These payments are recorded as a realized gain or loss in the Statement of Operations. Payments received or made as a result of a credit event or termination of the swap are recognized, net of a proportional amount of the upfront payment, as realized gains or losses in the Statement of Operations.
A summary of the open credit default swap contracts as of June 30, 2017 is included in a table following the Fund's Investment Portfolio. For the six months ended June 30, 2017, the investment in credit default swap contracts sold had a total notional value generally indicative of a range from $2,772,000 to $3,070,000.
Options. An option contract is a contract in which the writer (seller) of the option grants the buyer of the option, upon payment of a premium, the right to purchase from (call option), or sell to (put option), the writer a designated instrument at a specified price within a specified period of time. The Fund may write or purchase interest rate swaption agreements which are options to enter into a pre-defined swap agreement. The interest rate swaption agreement will specify whether the buyer of the swaption will be a fixed-rate receiver or a fixed-rate payer upon exercise. Certain options, including options on indices, will require cash settlement by the Fund if the option is exercised. For the six months ended June 30, 2017, the Fund entered into options on interest rate swaps in order to hedge against potential adverse interest rate movements of portfolio assets.
If the Fund writes a covered call option, the Fund foregoes, in exchange for the premium, the opportunity to profit during the option period from an increase in the market value of the underlying security above the exercise price. If the Fund writes a put option it accepts the risk of a decline in the value of the underlying security below the exercise price. Over-the-counter options have the risk of the potential inability of counterparties to meet the terms of their contracts. The Fund's maximum exposure to purchased options is limited to the premium initially paid. In addition, certain risks may arise upon entering into option contracts including the risk that an illiquid secondary market will limit the Fund's ability to close out an option contract prior to the expiration date and that a change in the value of the option contract may not correlate exactly with changes in the value of the securities.
There were no open purchased or written option contracts as of June 30, 2017 For the six months ended June 30, 2017, the investment in purchased option contracts had a total value generally indicative of a range from $0 to approximately $15,000, and written option contracts had a total value generally indicative of a range from $0 to approximately $116,000.
Futures Contracts. A futures contract is an agreement between a buyer or seller and an established futures exchange or its clearinghouse in which the buyer or seller agrees to take or make a delivery of a specific amount of a financial instrument at a specified price on a specific date (settlement date). For the six months ended June 30, 2017, the Fund entered into interest rate futures to gain exposure to different parts of the yield curve while managing overall duration and for non-hedging purposes to seek to enhance potential gains.
Upon entering into a futures contract, the Fund is required to deposit with a financial intermediary cash or securities ("initial margin") in an amount equal to a certain percentage of the face value indicated in the futures contract. Subsequent payments ("variation margin") are made or received by the Fund dependent upon the daily fluctuations in the value and are recorded for financial reporting purposes as unrealized gains or losses by the Fund. Gains or losses are realized when the contract expires or is closed. Since all futures contracts are exchange-traded, counterparty risk is minimized as the exchange's clearinghouse acts as the counterparty, and guarantees the futures against default.
Certain risks may arise upon entering into futures contracts, including the risk that an illiquid market will limit the Fund's ability to close out a futures contract prior to the settlement date and the risk that the futures contract is not well correlated with the security, index or currency to which it relates. Risk of loss may exceed amounts disclosed in the Statement of Assets and Liabilities.
A summary of the open futures contracts as of June 30, 2017 is included in a table following the Fund's Investment Portfolio. For the six months ended June 30, 2017, the investment in futures contracts purchased had a total notional value generally indicative of a range from approximately $2,375,000 to $8,144,000, and the investment in futures contracts sold had a total notional value generally indicative of a range from approximately $134,000 to $5,938,000.
Forward Foreign Currency Exchange Contracts. A forward foreign currency exchange contract ("forward currency contract") is a commitment to purchase or sell a foreign currency at the settlement date at a negotiated rate. For the six months ended June 30, 2017, the Fund entered into forward currency contracts in order to hedge against anticipated currency market changes and for non-hedging purposes to seek to enhance potential gains.
Forward currency contracts are valued at the prevailing forward exchange rate of the underlying currencies and unrealized gain (loss) is recorded daily. On the settlement date of the forward currency contract, the Fund records a realized gain or loss equal to the difference between the value of the contract at the time it was opened and the value of the contract at the time it was closed. Certain risks may arise upon entering into forward currency contracts from the potential inability of counterparties to meet the terms of their contracts. The maximum counterparty credit risk to the Fund is measured by the unrealized gain on appreciated contracts. Additionally, when utilizing forward currency contracts to hedge, the Fund gives up the opportunity to profit from favorable exchange rate movements during the term of the contract.
A summary of the open forward currency contracts as of June 30, 2017, is included in a table following the Fund’s Investment Portfolio. For the six months ended June 30, 2017, the investment in forward currency contracts short vs. U.S. dollars had a total contract value generally indicative of a range from approximately $1,240,000 to $2,150,000, and the investment in forward currency contracts long vs. U.S. dollars had a total contract value generally indicative of a range from approximately $638,000 to $1,551,000.
The following tables summarize the value of the Fund's derivative instruments held as of June 30, 2017 and the related location in the accompanying Statement of Assets and Liabilities, presented by primary underlying risk exposure:
| Asset Derivatives | Forward Contracts | Futures Contracts | Total |
| Interest Rate Contracts (a) | $ — | $ 37,430 | $ 37,430 |
| Foreign Exchange Contracts (b) | 5,188 | — | 5,188 |
| $ 5,188 | $ 37,430 | $ 42,618 | |
Each of the above derivatives is located in the following Statement of Assets and Liabilities accounts: (a) Includes cumulative appreciation of futures contracts as disclosed in the Investment Portfolio. Unsettled variation margin is disclosed separately within the Statement of Assets and Liabilities. (b) Unrealized appreciation on forward foreign currency exchange contracts | |||
| Liability Derivatives | Forward Contracts | Swap Contracts | Futures Contracts | Total |
| Interest Rate Contracts (c) | $ — | $ — | $ (19,429) | $ (19,429) |
| Credit Contracts (c) | — | (336) | — | (336) |
| Foreign Exchange Contracts (d) | (36,936) | — | — | (36,936) |
| $ (36,936) | $ (336) | $ (19,429) | $ (56,701) | |
Each of the above derivatives is located in the following Statement of Assets and Liabilities accounts: (c) Includes cumulative depreciation of futures and centrally cleared swaps as disclosed in the Investment Portfolio. Unsettled variation margin is disclosed separately within the Statement of Assets and Liabilities. (d) Unrealized depreciation on forward foreign currency exchange contracts | ||||
Additionally, the amount of unrealized and realized gains and losses on derivative instruments recognized in Fund earnings during the six months ended June 30, 2017 and the related location in the accompanying Statement of Operations is summarized in the following tables by primary underlying risk exposure:
| Realized Gain (Loss) | Purchased Options | Written Options | Forward Contracts | Swap Contracts | Futures Contracts | Total |
| Interest Rate Contracts (e) | $ (225,738) | $ 93,862 | $ — | $ 21,933 | $ 184,019 | $ 74,076 |
| Credit Contracts (e) | — | — | — | 156,916 | — | 156,916 |
| Foreign Exchange Contracts (f) | — | — | (63,636) | — | — | (63,636) |
| $ (225,738) | $ 93,862 | $ (63,636) | $ 178,849 | $ 184,019 | $ 167,356 | |
Each of the above derivatives is located in the following Statement of Operations accounts: (e) Net realized gain (loss) from investments (includes purchased options), written options, swap contracts and futures, respectively (f) Net realized gain (loss) from foreign currency (Statement of Operations includes both forward currency contracts and foreign currency transactions) | ||||||
| Change in Net Unrealized Appreciation (Depreciation) | Purchased Options | Written Options | Forward Contracts | Swap Contracts | Futures Contracts | Total |
| Interest Rate Contracts (g) | $ 210,480 | $ (86,505) | $ — | $ (290,521) | $ 118,956 | $ (47,590) |
| Credit Contracts (g) | — | — | — | (90,085) | — | (90,085) |
| Foreign Exchange Contracts (h) | — | — | (32,511) | — | — | (32,511) |
| $ 210,480 | $ (86,505) | $ (32,511) | $ (380,606) | $ 118,956 | $ (170,186) | |
Each of the above derivatives is located in the following Statement of Operations accounts: (g) Change in net unrealized appreciation (depreciation) on investments (includes purchased options), written options, swap contracts and futures, respectively (h) Change in net unrealized appreciation (depreciation) on foreign currency (Statement of Operations includes both forward currency contracts and foreign currency transactions) | ||||||
As of June 30, 2017, the Fund has transactions subject to enforceable master netting agreements which govern the terms of certain transactions, and reduce the counterparty risk associated with such transactions. Master netting agreements allow a Fund to close out and net total exposure to a counterparty in the event of a deterioration in the credit quality or contractual default with respect to all of the transactions with a counterparty. As defined by the master netting agreement, the Fund may have collateral agreements with certain counterparties to mitigate risk. For financial reporting purposes the Statement of Assets and Liabilities generally shows derivatives assets and liabilities on a gross basis, which reflects the full risks and exposures prior to netting. A reconciliation of the gross amounts on the Statement of Assets and Liabilities to the net amounts by a counterparty, including any collateral exposure, is included in the following tables:
| Counterparty | Gross Amounts of Assets Presented in the Statement of Assets and Liabilities | Financial Instruments and Derivatives Available for Offset | Collateral Received | Net Amount of Derivative Assets |
| BNP Paribas | $ 1,941 | $ — | $ — | $ 1,941 |
| Citigroup, Inc. | 3,247 | (3,247) | — | — |
| $ 5,188 | $ (3,247) | $ — | $ 1,941 | |
| Counterparty | Gross Amounts of Liabilities Presented in the Statement of Assets and Liabilities | Financial Instruments and Derivatives Available for Offset | Collateral Pledged | Net Amount of Derivative Liabilities |
| Citigroup, Inc. | $ 10,743 | $ (3,247) | $ — | $ 7,496 |
| JPMorgan Chase Securities, Inc. | 2,684 | — | — | 2,684 |
| Toronto-Dominion Bank | 23,509 | — | — | 23,509 |
| $ 36,936 | $ (3,247) | $ — | $ 33,689 |
C. Purchases and Sales of Securities
During the six months ended June 30, 2017, purchases and sales of investment transactions (excluding short-term investments and U.S. Treasury obligations) aggregated $12,103,935 and $12,697,181, respectively. Purchases and sales of U.S. Treasury obligations aggregated $1,002,989 and $1,070,344, respectively.
For the six months ended June 30, 2017, transactions for written options on interest rate swap contracts were as follows:
| Contract Amount | Premiums | |
| Outstanding, beginning of period | 2,800,000 | $ 202,062 |
| Options bought back | (1,400,000) | (101,031) |
| Options expired | (1,400,000) | (101,031) |
| Outstanding, end of period | — | $ — |
D. Related Parties
Management Agreement. Under the Investment Management Agreement with Deutsche Investment Management Americas Inc. ("DIMA" or the "Advisor"), an indirect, wholly owned subsidiary of Deutsche Bank AG, the Advisor directs the investments of the Fund in accordance with its investment objectives, policies and restrictions. The Advisor determines the securities, instruments and other contracts relating to investments to be purchased, sold or entered into by the Fund or delegates such responsibility to the Fund's subadvisor.
Effective March 1, 2017, Deutsche Alternative Asset Management (Global) Limited (DAAM Global), also an indirect, wholly owned subsidiary of Deutsche Bank AG, serves as subadvisor for the Fund and, as such, provides portfolio manager services to the Fund. Pursuant to a sub-advisory agreement between DIMA and DAAM Global, DIMA, not the Fund, compensates DAAM Global for the services it provides to the Fund.
Pursuant to the Investment Management Agreement with the Advisor, the Fund pays a monthly management fee based on the Fund's average daily net assets, computed and accrued daily and payable monthly, at the following annual rates:
| First $250 million | .550% |
| Next $750 million | .520% |
| Next $1.5 billion | .500% |
| Next $2.5 billion | .480% |
| Next $2.5 billion | .450% |
| Next $2.5 billion | .430% |
| Next $2.5 billion | .410% |
| Over $12.5 billion | .390% |
Accordingly, for the six months ended June 30, 2017, the fee pursuant to the Investment Management Agreement was equivalent to an annualized rate (exclusive of any applicable waivers/reimbursements) of 0.55% of the Fund's average daily net assets.
For the period from January 1, 2017 through April 30, 2018, the Advisor has contractually agreed to waive its fee and/or reimburse certain operating expenses to the extent necessary to maintain the total annual operating expenses (excluding certain expenses such as extraordinary expenses, taxes, brokerage and interest expense) at 0.67%.
For the six months ended June 30, 2017, fees waived and/or expenses reimbursed amounted to $81,255.
Administration Fee. Pursuant to an Administrative Services Agreement, DIMA provides most administrative services to the Fund. For all services provided under the Administrative Services Agreement, the Fund pays DIMA an annual fee ("Administration Fee") of 0.10% of the Fund's average daily net assets, computed and accrued daily and payable monthly. For the six months ended June 30, 2017, the Administration Fee was $12,143, of which $2,006 is unpaid.
Service Provider Fees. Deutsche AM Service Company ("DSC"), an affiliate of the Advisor, is the transfer agent, dividend-paying agent and shareholder service agent for the Fund. Pursuant to a sub-transfer agency agreement between DSC and DST Systems, Inc. ("DST"), DSC has delegated certain transfer agent, dividend-paying agent and shareholder service agent functions to DST. DSC compensates DST out of the shareholder servicing fee it receives from the Fund. For the six months ended June 30, 2017, the amounts charged to the Fund by DSC aggregated $65, of which $32 is unpaid.
Typesetting and Filing Service Fees. Under an agreement with DIMA, DIMA is compensated for providing typesetting and certain regulatory filing services to the Fund. For the six months ended June 30, 2017, the amount charged to the Fund by DIMA included in the Statement of Operations under "Reports to shareholders" aggregated $7,543, all of which is unpaid.
Trustees' Fees and Expenses. The Fund paid retainer fees to each Trustee not affiliated with the Advisor, plus specified amounts to the Board Chairperson and Vice Chairperson and to each committee Chairperson.
Affiliated Cash Management Vehicles. The Fund may invest uninvested cash balances in Deutsche Central Cash Management Government Fund and Deutsche Variable NAV Money Fund, affiliated money market funds which are managed by the Advisor. Each affiliated money market fund is managed in accordance with Rule 2a-7 under the 1940 Act, which governs the quality, maturity, diversity and liquidity of instruments in which a money market fund may invest. Deutsche Central Cash Management Government Fund seeks to maintain a stable net asset value, and Deutsche Variable NAV Money Fund maintains a floating net asset value. The Fund indirectly bears its proportionate share of the expenses of each affiliated money market fund in which it invests. Deutsche Central Cash Management Government Fund does not pay the Advisor an investment management fee. To the extent that Deutsche Variable NAV Money Fund pays an investment management fee to the Advisor, the Advisor will waive an amount of the investment management fee payable to the Advisor by the Fund equal to the amount of the investment management fee payable on the Fund's assets invested in Deutsche Variable NAV Money Fund.
Security Lending Fees. Deutsche Bank AG serves as securities lending agent for the Fund. For the six months ended June 30, 2017, the Fund incurred securities lending agent fees to Deutsche Bank AG in the amount of $434.
E. Investing in High-Yield Securities
High-yield debt securities or junk bonds are generally regarded as speculative with respect to the issuer’s continuing ability to meet principal and interest payments. The Fund’s performance could be hurt if an issuer of a debt security suffers an adverse change in financial condition that results in the issuer not making timely payments of interest or principal, a security downgrade or an inability to meet a financial obligation. High-yield debt securities’ total return and yield may generally be expected to fluctuate more than the total return and yield of investment-grade debt securities. A real or perceived economic downturn or an increase in market interest rates could cause a decline in the value of high-yield debt securities, result in increased redemptions and/or result in increased portfolio turnover, which could result in a decline in net asset value of the Fund, reduce liquidity for certain investments and/or increase costs. High-yield debt securities are often thinly traded and can be more difficult to sell and value accurately than investment-grade debt securities as there may be no established secondary market. Investments in high yield debt securities could increase liquidity risk for the Fund. In addition, the market for high-yield debt securities can experience sudden and sharp volatility which is generally associated more with investments in stocks.
F. Investing in Emerging Markets
Investing in emerging markets may involve special risks and considerations not typically associated with investing in developed markets. These risks include revaluation of currencies, high rates of inflation or deflation, repatriation restrictions on income and capital, and future adverse political, social and economic developments. Moreover, securities issued in these markets may be less liquid, subject to government ownership controls or delayed settlements, and may have prices that are more volatile or less easily assessed than those of comparable securities of issuers in developed markets.
G. Ownership of the Fund
At June 30, 2017, two participating insurance companies were owners of record of 10% or more of the total outstanding Class A shares of the Fund, each owning 55% and 41%.
H. Line of Credit
The Fund and other affiliated funds (the "Participants") share in a $400 million revolving credit facility provided by a syndication of banks. The Fund may borrow for temporary or emergency purposes, including the meeting of redemption requests that otherwise might require the untimely disposition of securities. The Participants are charged an annual commitment fee which is allocated based on net assets, among each of the Participants. Interest is calculated at a rate per annum equal to the sum of the Federal Funds Rate plus 1.25 percent plus if the one-month LIBOR exceeds the Federal Funds Rate, the amount of such excess. The Fund may borrow up to a maximum of 33 percent of its net assets under the agreement. The Fund had no outstanding loans at June 30, 2017.
I. Fund Name Change
Effective on or about October 2, 2017, the Fund will be renamed Deutsche Multisector Income VIP, to better reflect the Fund's investment strategy.
Information About Your Fund's Expenses (Unaudited)
As an investor of the Fund, you incur two types of costs: ongoing expenses and transaction costs. Ongoing expenses include management fees and other Fund expenses. Examples of transaction costs include contract charges, which are not shown in this section. The following tables are intended to help you understand your ongoing expenses (in dollars) of investing in the Fund and to help you compare these expenses with the ongoing expenses of investing in other mutual funds. In the most recent six-month period, the Fund limited these expenses; had it not done so, expenses would have been higher. The example in the table is based on an investment of $1,000 invested at the beginning of the six-month period and held for the entire period (January 1, 2017 to June 30, 2017).
The tables illustrate your Fund's expenses in two ways:
— Actual Fund Return. This helps you estimate the actual dollar amount of ongoing expenses (but not transaction costs) paid on a $1,000 investment in the Fund using the Fund's actual return during the period. To estimate the expenses you paid over the period, simply divide your account value by $1,000 (for example, an $8,600 account value divided by $1,000 = 8.6), then multiply the result by the number in the "Expenses Paid per $1,000" line under the share class you hold.
— Hypothetical 5% Fund Return. This helps you to compare your Fund's ongoing expenses (but not transaction costs) with those of other mutual funds using the Fund's actual expense ratio and a hypothetical rate of return of 5% per year before expenses. Examples using a 5% hypothetical Fund return may be found in the shareholder reports of other mutual funds. The hypothetical account values and expenses may not be used to estimate the actual ending account balance or expenses you paid for the period.
Please note that the expenses shown in these tables are meant to highlight your ongoing expenses only and do not reflect any transaction costs. The "Expenses Paid per $1,000" line of the tables is useful in comparing ongoing expenses only and will not help you determine the relative total expense of owning different funds. If these transaction costs had been included, your costs would have been higher.
| Expenses and Value of a $1,000 Investment for the six months ended June 30, 2017 | ||
| Actual Fund Return | Class A | |
| Beginning Account Value 1/1/17 | $ 1,000.00 | |
| Ending Account Value 6/30/17 | $ 1,039.60 | |
| Expenses Paid per $1,000* | $ 3.39 | |
| Hypothetical 5% Fund Return | Class A | |
| Beginning Account Value 1/1/17 | $ 1,000.00 | |
| Ending Account Value 6/30/17 | $ 1,021.47 | |
| Expenses Paid per $1,000* | $ 3.36 | |
* Expenses are equal to the Fund's annualized expense ratio, multiplied by the average account value over the period, multiplied by 181 (the number of days in the most recent six-month period), then divided by 365.
| Annualized Expense Ratio | Class A | |
| Deutsche Variable Series II — Deutsche Unconstrained Income VIP | .67% |
For more information, please refer to the Fund's prospectus.
These tables do not reflect charges and fees ("contract charges") associated with the separate account that invests in the Fund or any variable life insurance policy or variable annuity contract for which the Fund is an investment option.
For an analysis of the fees associated with an investment in the fund or similar funds, please refer to the current and hypothetical expense calculators for Variable Insurance Products which can be found at deutschefunds.com/EN/resources/calculators.jsp.
Proxy Voting
The Trust's policies and procedures for voting proxies for portfolio securities and information about how the Trust voted proxies related to its portfolio securities during the most recent 12-month period ended June 30 are available on our Web site — deutschefunds.com (click on "proxy voting" at the bottom of the page) — or on the SEC's Web site — sec.gov. To obtain a written copy of the Trust's policies and procedures without charge, upon request, call us toll free at (800) 728-3337.
Advisory Agreement Board Considerations and Fee Evaluation
The Board of Trustees (hereinafter referred to as the "Board" or "Trustees") approved the renewal of Deutsche Unconstrained Income VIP’s (the "Fund") investment management agreement (the "Agreement") with Deutsche Investment Management Americas Inc. ("DIMA") in September 2016.
In terms of the process that the Board followed prior to approving the Agreement, shareholders should know that:
— During the entire process, all of the Fund’s Trustees were independent of DIMA and its affiliates (the "Independent Trustees").
— The Board met frequently during the past year to discuss fund matters and dedicated a substantial amount of time to contract review matters. Over the course of several months, the Board’s Contract Committee reviewed extensive materials received from DIMA, independent third parties and independent counsel. These materials included an analysis of the Fund’s performance, fees and expenses, and profitability from a fee consultant retained by the Fund’s Independent Trustees (the "Fee Consultant"). The Board also received extensive information throughout the year regarding performance of the Fund.
— The Independent Trustees regularly meet privately with counsel to discuss contract review and other matters. In addition, the Independent Trustees were advised by the Fee Consultant in the course of their review of the Fund’s contractual arrangements and considered a comprehensive report prepared by the Fee Consultant in connection with their deliberations.
— In connection with reviewing the Agreement, the Board also reviewed the terms of the Fund’s distribution agreement, administrative services agreement, transfer agency agreement and other material service agreements.
— Based on its evaluation of the information provided, the Contract Committee presented its findings and recommendations to the Board. The Board then reviewed the Contract Committee’s findings and recommendations.
In connection with the contract review process, the Contract Committee and the Board considered the factors discussed below, among others. The Board also considered that DIMA and its predecessors have managed the Fund since its inception, and the Board believes that a long-term relationship with a capable, conscientious advisor is in the best interests of the Fund. The Board considered, generally, that shareholders chose to invest or remain invested in the Fund knowing that DIMA managed the Fund, and that the Agreement was approved by the Fund’s shareholders. DIMA is part of Deutsche Bank AG’s ("Deutsche Bank") Asset Management ("Deutsche AM") division. Deutsche AM is a global asset management business that offers a wide range of investing expertise and resources, including research capabilities in many countries throughout the world. Deutsche Bank has advised the Board that the U.S. asset management business continues to be a critical and integral part of Deutsche Bank, and that Deutsche Bank will continue to invest in Deutsche AM and seek to enhance Deutsche AM’s investment platform. Deutsche Bank also has confirmed its commitment to maintaining strong legal and compliance groups within the Deutsche AM division.
As part of the contract review process, the Board carefully considered the fees and expenses of each Deutsche fund overseen by the Board in light of the fund’s performance. In many cases, this led to the negotiation and implementation of expense caps. As part of these negotiations, the Board indicated that it would consider relaxing these caps in future years following sustained improvements in performance, among other considerations.
While shareholders may focus primarily on fund performance and fees, the Fund’s Board considers these and many other factors, including the quality and integrity of DIMA’s personnel and such other issues as back-office operations, fund valuations, and compliance policies and procedures.
Nature, Quality and Extent of Services. The Board considered the terms of the Agreement, including the scope of advisory services provided under the Agreement. The Board noted that, under the Agreement, DIMA provides portfolio management services to the Fund and that, pursuant to a separate administrative services agreement, DIMA provides administrative services to the Fund. The Board considered the experience and skills of senior management and investment personnel and the resources made available to such personnel. The Board reviewed the Fund’s performance over short-term and long-term periods and compared those returns to various agreed-upon performance measures, including market index(es) and a peer universe compiled using information supplied by Morningstar Direct ("Morningstar"), an independent fund data service. The Board also noted that it has put into place a process of identifying "Focus Funds" (e.g., funds performing poorly relative to a peer universe), and receives additional reporting from DIMA regarding such funds and, where appropriate, DIMA’s plans to address underperformance. The Board believes this process is an effective manner of identifying and addressing underperforming funds. Based on the information provided, the Board noted that for the one-, three- and five-year periods ended December 31, 2015, the Fund’s performance (Class A shares) was in the 4th quartile of the applicable Morningstar universe (the 1st quartile being the best performers and the 4th quartile being the worst performers). The Board also observed that the Fund has underperformed its benchmark in the one-, three- and five-year periods ended December 31, 2015. The Board noted the disappointing investment performance of the Fund in recent periods and continued to discuss with senior management of DIMA the factors contributing to such underperformance and actions being taken to improve performance. The Board recognized the efforts by DIMA in recent years to enhance its investment platform and improve long-term performance across the Deutsche fund complex.
Fees and Expenses. The Board considered the Fund’s investment management fee schedule, operating expenses and total expense ratios, and comparative information provided by Broadridge Financial Solutions, Inc. ("Broadridge") and the Fee Consultant regarding investment management fee rates paid to other investment advisors by similar funds (1st quartile being the most favorable and 4th quartile being the least favorable). With respect to management fees paid to other investment advisors by similar funds, the Board noted that the contractual fee rates paid by the Fund, which include a 0.10% fee paid to DIMA under the Fund’s administrative services agreement, were equal to the median (2nd quartile) of the applicable Broadridge peer group (based on Broadridge data provided as of December 31, 2015). The Board noted that the Fund’s Class A shares total (net) operating expenses were expected to be lower than the median (2nd quartile) of the applicable Broadridge expense universe (based on Broadridge data provided as of December 31, 2015, and analyzing Broadridge expense universe Class A (net) expenses less any applicable 12b-1 fees) ("Broadridge Universe Expenses"). The Board noted that the expense limitation agreed to by DIMA was expected to help the Fund’s total (net) operating expenses remain competitive. The Board considered the Fund’s management fee rate as compared to fees charged by DIMA to comparable Deutsche U.S. registered funds ("Deutsche Funds") and considered differences between the Fund and the comparable Deutsche Funds. The information requested by the Board as part of its review of fees and expenses also included information about institutional accounts (including any sub-advised funds and accounts) and funds offered primarily to European investors ("Deutsche Europe funds") managed by Deutsche AM. The Board noted that DIMA indicated that Deutsche AM does not manage any institutional accounts or Deutsche Europe funds comparable to the Fund.
On the basis of the information provided, the Board concluded that management fees were reasonable and appropriate in light of the nature, quality and extent of services provided by DIMA.
Profitability. The Board reviewed detailed information regarding revenues received by DIMA under the Agreement. The Board considered the estimated costs and pre-tax profits realized by DIMA from advising the Deutsche Funds, as well as estimates of the pre-tax profits attributable to managing the Fund in particular. The Board also received information regarding the estimated enterprise-wide profitability of DIMA and its affiliates with respect to all fund services in totality and by fund. The Board and the Fee Consultant reviewed DIMA’s methodology in allocating its costs to the management of the Fund. Based on the information provided, the Board concluded that the pre-tax profits realized by DIMA in connection with the management of the Fund were not unreasonable. The Board also reviewed certain publicly available information regarding the profitability of certain similar investment management firms. The Board noted that while information regarding the profitability of such firms is limited (and in some cases is not necessarily prepared on a comparable basis), DIMA and its affiliates’ overall profitability with respect to the Deutsche Funds (after taking into account distribution and other services provided to the funds by DIMA and its affiliates) was lower than the overall profitability levels of most comparable firms for which such data was available.
Economies of Scale. The Board considered whether there are economies of scale with respect to the management of the Fund and whether the Fund benefits from any economies of scale. The Board noted that the Fund’s investment management fee schedule includes fee breakpoints. The Board concluded that the Fund’s fee schedule represents an appropriate sharing between the Fund and DIMA of such economies of scale as may exist in the management of the Fund at current asset levels.
Other Benefits to DIMA and Its Affiliates. The Board also considered the character and amount of other incidental benefits received by DIMA and its affiliates, including any fees received by DIMA for administrative services provided to the Fund. The Board also considered benefits to DIMA related to brokerage and soft-dollar allocations, including allocating brokerage to pay for research generated by parties other than the executing broker dealers, which pertain primarily to funds investing in equity securities, along with the incidental public relations benefits to DIMA related to Deutsche Funds advertising and cross-selling opportunities among DIMA products and services. The Board considered these benefits in reaching its conclusion that the Fund’s management fees were reasonable.
Compliance. The Board considered the significant attention and resources dedicated by DIMA to documenting and enhancing its compliance processes in recent years. The Board noted in particular (i) the experience, seniority and time commitment of the individuals serving as DIMA’s and the Fund’s chief compliance officers; (ii) the large number of DIMA compliance personnel; and (iii) the substantial commitment of resources by DIMA and its affiliates to compliance matters.
Based on all of the information considered and the conclusions reached, the Board unanimously determined that the continuation of the Agreement is in the best interests of the Fund. In making this determination, the Board did not give particular weight to any single factor identified above. The Board considered these factors over the course of numerous meetings, certain of which were in executive session with only the Independent Trustees and counsel present. It is possible that individual Independent Trustees may have weighed these factors differently in reaching their individual decisions to approve the continuation of the Agreement.
Sub-Advisory Agreement Board Considerations and Fee Evaluation
The Board of Trustees of Deutsche Variable Series II (hereinafter referred to as the "Board" or "Trustees") approved a sub-advisory agreement (the "Sub-Advisory Agreement") between Deutsche Investment Management Americas Inc. ("DIMA") and Deutsche Alternative Asset Management (Global) Limited ("DAAM Global"), a U.K.-based affiliate of DIMA and an indirect, wholly owned subsidiary of Deutsche Bank AG, on behalf of Deutsche Unconstrained Income VIP (the "Fund") at an in-person meeting in February 2017. In February 2017, all of the Fund’s Trustees were independent of DIMA and its affiliates. DIMA relied on a manager of managers exemptive order granted to DIMA and the Fund by the SEC that permits DIMA, subject to the approval of the Board, to select sub-advisors that are affiliated with DIMA to manage all or a portion of the Fund’s assets without obtaining shareholder approval. The Sub-Advisory Agreement became effective on March 1, 2017.
In determining to approve the Sub-Advisory Agreement, the Board considered the capabilities of DAAM Global and the terms of the Sub-Advisory Agreement, including the sub-advisory fee schedule. The Board considered that the Sub-Advisory Agreement was proposed by DIMA to allow for the relocation of one of the Fund’s portfolio managers from New York to London. The Board considered that the appointment of DAAM Global was not expected to impact the Fund’s expenses, and that pursuant to the Sub-Advisory Agreement, DAAM Global would be paid for its services by DIMA from its fees as investment advisor to the Fund. The Board noted DIMA’s representation that its profitability in connection with the management of the Fund would likely decline under the new sub-advisory arrangement.
Given that DAAM Global is an affiliate of DIMA, the Board additionally took into account the factors that it considered as part of the process that it followed in approving the annual renewal of the Fund’s investment management agreement with DIMA in September 2016.
Based on all of the information considered and the conclusions reached, the Board unanimously determined that the approval of the Sub-Advisory Agreement was in the best interests of the Fund. In making this determination the Board did not give particular weight to any single factor. It is possible that individual Trustees may have weighed these factors differently in reaching their individual decisions to approve the Sub-Advisory Agreement.
Notes

VS2UI-3 (R-028389-6 8/17)
| ITEM 2. | CODE OF ETHICS | |
| Not applicable. | ||
| ITEM 3. | AUDIT COMMITTEE FINANCIAL EXPERT | |
| Not applicable | ||
| ITEM 4. | PRINCIPAL ACCOUNTANT FEES AND SERVICES | |
| Not applicable | ||
| ITEM 5. | AUDIT COMMITTEE OF LISTED REGISTRANTS | |
| Not applicable | ||
| ITEM 6. | SCHEDULE OF INVESTMENTS | |
| Not applicable | ||
| ITEM 7. | DISCLOSURE OF PROXY VOTING POLICIES AND PROCEDURES FOR CLOSED-END MANAGEMENT INVESTMENT COMPANIES | |
| Not applicable | ||
| ITEM 8. | PORTFOLIO MANAGERS OF CLOSED-END MANAGEMENT INVESTMENT COMPANIES | |
| Not applicable | ||
| ITEM 9. | PURCHASES OF EQUITY SECURITIES BY CLOSED-END MANAGEMENT INVESTMENT COMPANY AND AFFILIATED PURCHASERS | |
| Not applicable | ||
| ITEM 10. | SUBMISSION OF MATTERS TO A VOTE OF SECURITY HOLDERS | |
| There were no material changes to the procedures by which shareholders may recommend nominees to the Fund’s Board. The primary function of the Nominating and Governance Committee is to identify and recommend individuals for membership on the Board and oversee the administration of the Board Governance Guidelines. Shareholders may recommend candidates for Board positions by forwarding their correspondence by U.S. mail or courier service to Keith R. Fox, Deutsche Funds Board Chair, c/o Thomas R. Hiller, Ropes & Gray LLP, Prudential Tower, 800 Boylston Street, Boston, MA 02199-3600. | ||
| ITEM 11. | CONTROLS AND PROCEDURES | |
| (a) | The Chief Executive and Financial Officers concluded that the Registrant’s Disclosure Controls and Procedures are effective based on the evaluation of the Disclosure Controls and Procedures as of a date within 90 days of the filing date of this report. | |
| (b) | There have been no changes in the registrant’s internal control over financial reporting that occurred during the second fiscal quarter of the period covered by this report that has materially affected, or is reasonably likely to materially affect, the registrant’s internal controls over financial reporting. | |
ITEM 12. | EXHIBITS | |
| (a)(1) | Not applicable | |
| (a)(2) | Certification pursuant to Rule 30a-2(a) under the Investment Company Act of 1940 (17 CFR 270.30a-2(a)) is filed and attached hereto as Exhibit 99.CERT. | |
| (b) | Certification pursuant to Rule 30a-2(b) under the Investment Company Act of 1940 (17 CFR 270.30a-2(b)) is furnished and attached hereto as Exhibit 99.906CERT. | |
SIGNATURES
Pursuant to the requirements of the Securities Exchange Act of 1934 and the Investment Company Act of 1940, the registrant has duly caused this report to be signed on its behalf by the undersigned, thereunto duly authorized.
| Registrant: | Deutsche Variable Series II |
| By: | /s/Brian E. Binder Brian E. Binder President |
| Date: | 8/22/2017 |
Pursuant to the requirements of the Securities Exchange Act of 1934 and the Investment Company Act of 1940, this report has been signed below by the following persons on behalf of the registrant and in the capacities and on the dates indicated.
| By: | /s/Brian E. Binder Brian E. Binder President |
| Date: | 8/22/2017 |
| By: | /s/Paul Schubert Paul Schubert Chief Financial Officer and Treasurer |
| Date: | 8/22/2017 |