I am very pleased to tell you that the DWS funds have been renamed Deutsche funds, aligning more closely with the Deutsche Asset & Wealth Management brand. We are proud to adopt the Deutsche name — a brand that fully represents the global access, discipline and intelligence that support all of our products and services.
Deutsche Asset & Wealth Management combines the asset management and wealth management divisions of Deutsche Bank to deliver a comprehensive suite of active, passive and alternative investment capabilities. Your investment in the Deutsche funds means you have access to the thought leadership and resources of one of the world’s largest and most influential financial institutions.
In conjunction with your fund’s name change, please note that the Deutsche funds’ Web address has changed as well. The former dws-investments.com is now deutschefunds.com.
These changes have no effect on the day-to-day management of your investment, and there is no action required on your part. You will continue to experience the benefits that come from our decades of experience, in-depth research and worldwide network of investment professionals.
Thanks for your continued support. We appreciate your trust and the opportunity to put our capabilities to work for you.
Following the Fund's fiscal first and third quarter-end, a complete portfolio holdings listing is filed with the SEC on Form N-Q. The form will be available on the SEC's Web site at sec.gov, and it also may be reviewed and copied at the SEC's Public Reference Room in Washington, D.C. Information on the operation of the SEC's Public Reference Room may be obtained by calling (800) SEC-0330. The Fund's portfolio holdings are also posted on deutschefunds.com from time to time. Please see the Fund's current prospectus for more information.
(a) Affiliated fund managed by Deutsche Investment Management Americas Inc.
Deutsche Alternative Asset Allocation VIP (formerly DWS Alternative Asset Allocation VIP) (the "Fund") is a diversified series of Deutsche Variable Series II (formerly DWS Variable Series II) (the "Trust"), which is registered under the Investment Company Act of 1940, as amended (the "1940 Act"), as an open-end management investment company organized as a Massachusetts business trust. The Fund mainly invests in other affiliated Deutsche funds (i.e. mutual funds, exchange-traded funds and other pooled investment vehicles managed by Deutsche Investment Management Americas Inc. or one of its affiliates, together the "Underlying Deutsche Funds"), non-affiliated exchange-traded funds ("Non-affiliated ETFs") and derivative investments. Non-affiliated ETFs and Underlying Deutsche Funds are collectively referred to as "Underlying Funds." During the six months ended June 30, 2014, the Fund primarily invested in underlying Deutsche Funds and non-affiliated ETFs. Each Underlying Deutsche Fund's accounting policies and investment holdings are outlined in the Underlying Deutsche Funds' financial statements and are available upon request.
Investment income, realized and unrealized gains and losses, and certain fund-level expenses and expense reductions, if any, are borne pro rata on the basis of relative net assets by the holders of all classes of shares except that each class bears certain expenses unique to that class (including the applicable Rule 12b-1 fee). Differences in class-level expenses may result in payment of different per share dividends by class. All shares have equal rights with respect to voting subject to class-specific arrangements.
The Fund's financial statements are prepared in accordance with accounting principles generally accepted in the United States of America which require the use of management estimates. Actual results could differ from those estimates. The policies described below are followed consistently by the Fund in the preparation of its financial statements.
Various inputs are used in determining the value of the Fund's investments. These inputs are summarized in three broad levels. Level 1 includes quoted prices in active markets for identical securities. Level 2 includes other significant observable inputs (including quoted prices for similar securities, interest rates, prepayment speeds and credit risk). Level 3 includes significant unobservable inputs (including the Fund's own assumptions in determining the fair value of investments). The level assigned to the securities valuations may not be an indication of the risk or liquidity associated with investing in those securities.
Investments in mutual funds are valued at the net asset value per share of each class of the Underlying Deutsche Funds and are categorized as Level 1.
ETFs are valued at the most recent sale price or official closing price reported on the exchange (U.S. or foreign) or over-the-counter market on which they trade. ETFs for which no sales are reported are valued at the calculated mean between the most recent bid and asked quotations on the relevant market or, if a mean cannot be determined, at the most recent bid quotation. Equity securities are generally categorized as Level 1 securities.
Disclosure about the classification of fair value measurements is included in a table following the Fund's Investment Portfolio.
The Fund has reviewed the tax positions for the open tax years as of December 31, 2013 and has determined that no provision for income tax and/or uncertain tax provisions is required in the Fund's financial statements. The Fund's federal tax returns for the prior three fiscal years remain open subject to examination by the Internal Revenue Service.
The timing and characterization of certain income and capital gain distributions are determined annually in accordance with federal tax regulations which may differ from accounting principles generally accepted in the United States of America. These differences primarily relate to certain securities sold at a loss. As a result, net investment income (loss) and net realized gain (loss) on investment transactions for a reporting period may differ significantly from distributions during such period. Accordingly, the Fund may periodically make reclassifications among certain of its capital accounts without impacting the net asset value of the Fund.
The tax character of current year distributions will be determined at the end of the current fiscal year.
During the six months ended June 30, 2014, purchases and sales of affiliated Underlying Funds (excluding money market funds) aggregated $16,922,645 and $10,683,238, respectively. Purchases and sales of Non-affiliated ETFs aggregated $4,064,562 and $6,905,641, respectively.
RREEF America L.L.C. ("RREEF") acts as an investment subadvisor to the Fund. As an investment subadvisor to the Fund, RREEF provides investment management services to the portions of the Fund's portfolio allocated to direct investments in global real estate and global infrastructure securities. RREEF is paid by the Advisor for the services RREEF provides to the Fund. As of the date of this report, the Fund obtained its exposure to global real estate and global infrastructure securities indirectly through investments in other Underlying Deutsche Funds.
The Fund does not invest in the Underlying Deutsche Funds for the purpose of exercising management or control; however, investments within the set limits may represent 5% or more of an Underlying Deutsche Fund's outstanding shares. For the six months ended June 30, 2014, the Fund held 6% of Deutsche Enhanced Emerging Markets Fixed Income Fund.
Pursuant to the Investment Management Agreement with the Advisor, the Fund pays a monthly management fee based on the Fund's average daily net assets, computed and accrued daily and payable monthly, at the following annual rates:
In addition, the Advisor will receive management fees from managing the Underlying Deutsche Funds in which the Fund invests.
Accordingly, for the six months ended June 30, 2014, the fee pursuant to the Investment Management Agreement was equivalent to an annualized effective rate (exclusive of any applicable waivers/reimbursements) of 0.34% of the Fund's average daily net assets.
For the period from January 1, 2014 through April 30, 2015, the Advisor has contractually agreed to waive its fee and/or reimburse certain operating expenses to the extent necessary to maintain the operating expenses (excluding certain expenses such as extraordinary expenses, taxes, brokerage, interest expense and Underlying Funds) of each class as follows:
For the six months ended June 30, 2014, the Advisor agreed to waive 0.15% of the monthly management fee based on average daily net assets for the Fund.
For the six months ended June 30, 2014, fees waived and/or expenses reimbursed for each class are as follows:
The Fund indirectly bears its proportionate share of fees and expenses incurred by the Underlying Funds in which it is invested.
At June 30, 2014, one participating insurance company was the owner of record of 10% or more of the total outstanding Class A shares of the Fund, owning 98%. Two participating insurance companies were the owner of record of 10% or more of the total outstanding Class B shares of the Fund, owning 64% and 31%, respectively.
The Fund mainly invest in Underlying Deutsche Funds and Non-affiliated ETFs. The Underlying Deutsche Funds in which the Fund invests are considered to be affiliated investments. A summary of the Fund's transactions with affiliated Underlying Deutsche Funds during the six months ended June 30, 2014 is as follows:
As an investor of the Fund, you incur two types of costs: ongoing expenses and transaction costs. Ongoing expenses include management fees, distribution and service (12b-1) fees and other Fund expenses. Examples of transaction costs include contract charges and account maintenance fees, which are not shown in this section. The following tables are intended to help you understand your ongoing expenses (in dollars) of investing in the Fund and to help you compare these expenses with the ongoing expenses of investing in other mutual funds. In addition to the ongoing expenses which the Fund bears directly, the Fund's shareholders indirectly bear the expense of the Underlying Funds in which the Fund invests. These expenses are not included in the Fund's annualized expense ratios used to calculate the expense estimate in the tables. In the most recent six-month period, the Fund limited the ongoing expenses the Fund bears directly; had it not done so, expenses would have been higher. The examples in the table are based on an investment of $1,000 invested at the beginning of the six-month period and held for the entire period (January 1, 2014 to June 30, 2014).
Please note that the expenses shown in these tables are meant to highlight your ongoing expenses only and do not reflect any transaction costs. The "Expenses Paid per $1,000" line of the tables is useful in comparing ongoing expenses only and will not help you determine the relative total expense of owning different funds. If these transaction costs had been included, your costs would have been higher.
For more information, please refer to the Fund's prospectus.
These tables do not reflect charges and fees ("contract charges") associated with the separate account that invests in the Fund or any variable life insurance policy or variable annuity contract for which the Fund is an investment option.
For an analysis of the fees associated with an investment in the fund or similar funds, please refer to the current and hypothetical expense calculators for Variable Insurance Products which can be found at deutschefunds.com/EN/resources/calculators.jsp.
The Trust's policies and procedures for voting proxies for portfolio securities and information about how the Trust voted proxies related to its portfolio securities during the 12-month period ended June 30 are available on our Web site — deutschefunds.com (click on "proxy voting" at the bottom of the page) — or on the SEC's Web site — sec.gov. To obtain a written copy of the Trust's policies and procedures without charge, upon request, call us toll free at (800) 728-3337.
The Board of Trustees approved the renewal of DWS Alternative Asset Allocation VIP's investment management agreement (the "Agreement") with Deutsche Investment Management Americas Inc. ("DIMA") and sub-advisory agreement (the "Sub-Advisory Agreement" and together with the Agreement, the "Agreements") between DIMA and RREEF America L.L.C. ("RREEF"), an affiliate of DIMA, in September 2013.
In terms of the process that the Board followed prior to approving the Agreements, shareholders should know that:
In connection with the contract review process, the Contract Committee and the Board considered the factors discussed below, among others. The Board also considered that DIMA and its predecessors have managed the Fund since its inception, and the Board believes that a long-term relationship with a capable, conscientious advisor is in the best interests of the Fund. The Board considered, generally, that shareholders chose to invest or remain invested in the Fund knowing that DIMA managed the Fund. DIMA and RREEF are part of Deutsche Bank AG, a major global banking institution that is engaged in a wide range of financial services. The Board believes that there are advantages to being part of a global asset management business that offers a wide range of investing expertise and resources, including hundreds of portfolio managers and analysts with research capabilities in many countries throughout the world.
As part of the contract review process, the Board carefully considered the fees and expenses of each DWS fund overseen by the Board in light of the fund's performance. In many cases, this led to a negotiation with DIMA of lower expense caps as part of the 2012 and 2013 contract review processes than had previously been in place. As part of these negotiations, the Board indicated that it would consider relaxing these new lower caps in future years following sustained improvements in performance, among other considerations.
In June 2012, Deutsche Bank AG ("DB"), DIMA's parent company, announced that DB would combine its Asset Management (of which DIMA was a part) and Wealth Management divisions. DB has advised the Independent Trustees that the U.S. asset management business is a critical and integral part of DB, and that it has, and will continue to, reinvest a significant portion of the substantial savings it expects to realize by combining its Asset Management and Wealth Management divisions into the new Asset and Wealth Management ("AWM") division, including ongoing enhancements to its investment capabilities. DB also has confirmed its commitment to maintaining strong legal and compliance groups within the AWM division.
While shareholders may focus primarily on fund performance and fees, the Fund's Board considers these and many other factors, including the quality and integrity of DIMA's and RREEF's personnel and such other issues as back-office operations, fund valuations, and compliance policies and procedures.
The information considered by the Board as part of its review of management fees included information regarding fees charged by DIMA and its affiliates to similar institutional accounts and to similar funds offered primarily to European investors ("DWS Europe funds"), in each case as applicable. The Board observed that advisory fee rates for institutional accounts generally were lower than the management fees charged by similarly managed DWS U.S. mutual funds ("DWS Funds"), but also took note of the differences in services provided to DWS Funds as compared to institutional accounts. In the case of DWS Europe funds, the Board observed that fee rates for DWS Europe funds generally were higher than for similarly managed DWS Funds, but noted that differences in the types of services provided to DWS Funds relative to DWS Europe funds made it difficult to compare such fees.
On the basis of the information provided, the Board concluded that management fees were reasonable and appropriate in light of the nature, quality and extent of services provided by DIMA and RREEF.
Based on all of the information considered and the conclusions reached, the Board unanimously determined that the continuation of the Agreements is in the best interests of the Fund. In making this determination, the Board did not give particular weight to any single factor identified above. The Board considered these factors over the course of numerous meetings, certain of which were in executive session with only the Independent Trustees and their independent counsel present. It is possible that individual Trustees may have weighed these factors differently in reaching their individual decisions to approve the continuation of the Agreements.
DeAWM Distributors, Inc.
June 30, 2014
Semiannual Report
Deutsche Variable Series II
(formerly DWS Variable Series II)
Deutsche Global Equity VIP
(formerly DWS Global Equity VIP)
Contents
5 Portfolio Management Team 9 Statement of Assets and Liabilities 9 Statement of Operations 10 Statement of Changes in Net Assets 12 Notes to Financial Statements 17 Information About Your Fund's Expenses 19 Advisory Agreement Board Considerations and Fee Evaluation |
This report must be preceded or accompanied by a prospectus. To obtain an additional prospectus or summary prospectus, if available, call (800) 728-3337 or your financial representative. We advise you to consider the Fund's objectives, risks, charges and expenses carefully before investing. The summary prospectus and prospectus contain this and other important information about the Fund. Please read the prospectus carefully before you invest.
Investing in derivatives entails special risks relating to liquidity, leverage and credit that may reduce returns and/or increase volatility. Investing in foreign securities, particularly those of emerging markets, presents certain risks, such as currency fluctuations, political and economic changes, and market risks. The Fund may lend securities to approved institutions. Stocks may decline in value. See the prospectus for details.
Deutsche Asset & Wealth Management represents the asset management and wealth management activities conducted by Deutsche Bank AG or any of its subsidiaries, including the Advisor and DeAWM Distributors, Inc.
NOT FDIC/NCUA INSURED NO BANK GUARANTEE MAY LOSE VALUE NOT A DEPOSIT
NOT INSURED BY ANY FEDERAL GOVERNMENT AGENCY
Dear Shareholder:
I am very pleased to tell you that the DWS funds have been renamed Deutsche funds, aligning more closely with the Deutsche Asset & Wealth Management brand. We are proud to adopt the Deutsche name — a brand that fully represents the global access, discipline and intelligence that support all of our products and services.
Deutsche Asset & Wealth Management combines the asset management and wealth management divisions of Deutsche Bank to deliver a comprehensive suite of active, passive and alternative investment capabilities. Your investment in the Deutsche funds means you have access to the thought leadership and resources of one of the world’s largest and most influential financial institutions.
In conjunction with your fund’s name change, please note that the Deutsche funds’ Web address has changed as well. The former dws-investments.com is now deutschefunds.com.
In addition, key service providers have been renamed as follows:
| Former Name | New name, effective August 11, 2014 |
| DWS Investments Distributors, Inc. | DeAWM Distributors, Inc. |
| DWS Trust Company | DeAWM Trust Company |
| DWS Investments Service Company | DeAWM Service Company |
These changes have no effect on the day-to-day management of your investment, and there is no action required on your part. You will continue to experience the benefits that come from our decades of experience, in-depth research and worldwide network of investment professionals.
Thanks for your continued support. We appreciate your trust and the opportunity to put our capabilities to work for you.
Best regards,
Brian Binder
President, Deutsche Funds
Performance Summary June 30, 2014 (Unaudited)
Fund performance shown is historical, assumes reinvestment of all dividend and capital gain distributions and does not guarantee future results. Investment return and principal value fluctuate with changing market conditions so that, when redeemed, shares may be worth more or less than their original cost. Current performance may be lower or higher than the performance data quoted. Please contact your participating insurance company for the Fund's most recent month-end performance. Performance doesn't reflect charges and fees ("contract charges") associated with the separate account that invests in the Fund or any variable life insurance policy or variable annuity contract for which the Fund is an investment option. These charges and fees will reduce returns.
The gross expense ratio of the Fund, as stated in the fee table of the prospectus dated May 1, 2014 is 1.08% for Class A shares and may differ from the expense ratio disclosed in the Financial Highlights table in this report.
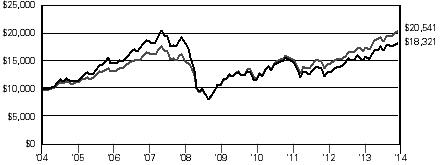
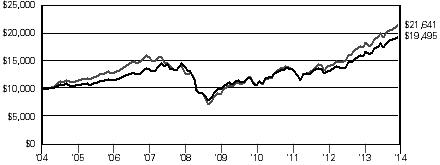
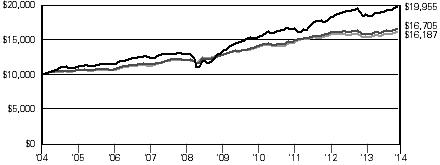
| Growth of an Assumed $10,000 Investment in Deutsche Global Equity VIP |
| The MSCI All Country World Index is a free float-adjusted market capitalization weighted index that is designed to measure the equity market performance of developed and emerging markets. The index consists of 45 country indices comprising 24 developed and 21 emerging market country indices. Index returns do not reflect any fees or expenses and it is not possible to invest directly into an index. |
| |
| Yearly periods ended June 30 | |
| Comparative Results | |
| Deutsche Global Equity VIP | | 6-Month‡ | | | 1-Year | | | 3-Year | | | 5-Year | | | 10-Year | |
| Class A | Growth of $10,000 | | $ | 10,421 | | | $ | 12,136 | | | $ | 12,226 | | | $ | 17,409 | | | $ | 18,321 | |
| Average annual total return | | | 4.21 | % | | | 21.36 | % | | | 6.93 | % | | | 11.73 | % | | | 6.24 | % |
| MSCI All Country World Index | Growth of $10,000 | | $ | 10,618 | | | $ | 12,295 | | | $ | 13,402 | | | $ | 19,493 | | | $ | 20,541 | |
| Average annual total return | | | 6.18 | % | | | 22.95 | % | | | 10.25 | % | | | 14.28 | % | | | 7.46 | % |
The growth of $10,000 is cumulative.
‡ Total returns shown for periods less than one year are not annualized.
Portfolio Summary (Unaudited) Asset Allocation (As a % of Investment Portfolio excluding Securities Lending Collateral) | 6/30/14 | 12/31/13 |
| | | |
| Common Stocks | 97% | 96% |
| Cash Equivalents | 2% | 3% |
| Participatory Notes | 1% | 1% |
| | 100% | 100% |
Sector Diversification (As a % of Common Stocks and Participatory Notes) | 6/30/14 | 12/31/13 |
| | | |
| Industrials | 19% | 9% |
| Health Care | 16% | 13% |
| Financials | 14% | 12% |
| Information Technology | 12% | 9% |
| Consumer Staples | 11% | 10% |
| Energy | 10% | 7% |
| Consumer Discretionary | 9% | 9% |
| Materials | 9% | 9% |
| Telecommunication Services | — | 13% |
| Utilities | — | 9% |
| | 100% | 100% |
Geographical Diversification
(As a % of Investment Portfolio excluding Cash Equivalents and Securities Lending Collateral) | 6/30/14 | 12/31/13 |
| | | |
| United States | 52% | 46% |
| Continental Europe | 25% | 32% |
| United Kingdom | 11% | 6% |
| Canada | 6% | 6% |
| Asia (excluding Japan) | 4% | 5% |
| Latin America | 1% | 1% |
| Other | 1% | 4% |
| | 100% | 100% |
Portfolio holdings and characteristics are subject to change.
For more complete details about the Fund's investment portfolio, see page 6.
Following the Fund's fiscal first and third quarter-end, a complete portfolio holdings listing is filed with the SEC on Form N-Q. The form will be available on the SEC's Web site at sec.gov, and it also may be reviewed and copied at the SEC's Public Reference Room in Washington, D.C. Information on the operation of the SEC's Public Reference Room may be obtained by calling (800) SEC-0330. The Fund's portfolio holdings are also posted on deutschefunds.com from time to time. Please see the Fund's current prospectus for more information.
Portfolio Management Team
Nils E. Ernst, PhD
Martin Berberich, CFA
Sebastian P. Werner, PhD
Portfolio Managers
Investment Portfolio June 30, 2014 (Unaudited) | | | Shares | | | Value ($) | |
| | | | |
| Common Stocks 94.9% | |
| Belgium 2.3% | |
| Anheuser-Busch InBev NV (Cost $1,166,385) | | | 15,000 | | | | 1,723,264 | |
| Brazil 0.8% | |
| CCR SA (Cost $532,266) | | | 72,000 | | | | 586,558 | |
| Canada 5.7% | |
| Agnico Eagle Mines Ltd. | | | 11,000 | | | | 421,300 | |
| Brookfield Asset Management, Inc. "A" | | | 35,000 | | | | 1,541,962 | |
| Canadian Oil Sands Ltd. | | | 35,000 | | | | 793,121 | |
| Canadian Pacific Railway Ltd. | | | 8,000 | | | | 1,449,304 | |
| (Cost $3,290,049) | | | | 4,205,687 | |
| Denmark 0.2% | |
| DS Norden AS (Cost $154,594) | | | 3,910 | | | | 131,199 | |
| Finland 0.7% | |
| Nokia Oyj (a) (Cost $534,657) | | | 70,000 | | | | 530,056 | |
| France 1.3% | |
| Pernod Ricard SA (a) (Cost $882,001) | | | 8,000 | | | | 960,701 | |
| Germany 2.8% | |
| BASF SE | | | 7,000 | | | | 815,021 | |
| Fresenius Medical Care AG & Co. KGaA | | | 19,000 | | | | 1,277,160 | |
| (Cost $1,814,353) | | | | 2,092,181 | |
| Indonesia 0.8% | |
| PT Indofood CBP Sukses Makmur Tbk (Cost $786,372) | | | 700,000 | | | | 590,468 | |
| Ireland 2.9% | |
| Accenture PLC "A" (b) | | | 10,000 | | | | 808,400 | |
| Alkermes PLC* (c) | | | 4,500 | | | | 226,485 | |
| Shire PLC | | | 14,000 | | | | 1,094,954 | |
| (Cost $1,285,819) | | | | 2,129,839 | |
| Italy 2.7% | |
| Sorin SpA* | | | 165,000 | | | | 484,404 | |
| Unipol Gruppo Finanziario SpA | | | 200,000 | | | | 1,130,494 | |
| World Duty Free SpA* | | | 28,400 | | | | 346,104 | |
| (Cost $1,494,315) | | | | 1,961,002 | |
| Luxembourg 1.3% | |
| Eurofins Scientific (a) (Cost $712,011) | | | 3,000 | | | | 922,635 | |
| Malaysia 0.6% | |
| IHH Healthcare Bhd. (Cost $390,629) | | | 300,000 | | | | 409,218 | |
| Mexico 0.5% | |
| Alsea SAB de CV* (Cost $335,642) | | | 96,000 | | | | 345,196 | |
| Netherlands 1.1% | |
| Yandex NV "A"* (c) (Cost $690,140) | | | 22,000 | | | | 784,080 | |
| Norway 2.3% | |
| DNO ASA* | | | 207,000 | | | | 796,095 | |
| Norsk Hydro ASA | | | 168,000 | | | | 899,181 | |
| (Cost $1,168,397) | | | | 1,695,276 | |
| | | Shares | | | Value ($) | |
| | | | | | | | | |
| Philippines 2.4% | |
| Metropolitan Bank & Trust Co. | | | 520,000 | | | | 1,041,191 | |
| Puregold Price Club, Inc. | | | 730,000 | | | | 725,819 | |
| (Cost $1,754,673) | | | | 1,767,010 | |
| Spain 1.1% | |
| Atresmedia Corp. de Medios de Comunicaion SA (Cost $885,741) | | | 56,000 | | | | 802,081 | |
| Sweden 4.6% | |
| Assa Abloy AB "B" | | | 7,500 | | | | 381,648 | |
| Atlas Copco AB "A" | | | 38,000 | | | | 1,098,218 | |
| Svenska Cellulosa AB "B" | | | 34,000 | | | | 885,932 | |
| Swedish Match AB | | | 30,000 | | | | 1,041,675 | |
| (Cost $3,175,780) | | | | 3,407,473 | |
| Switzerland 2.0% | |
| Nestle SA (Registered) | | | 12,515 | | | | 969,531 | |
| Novartis AG (Registered) | | | 5,500 | | | | 498,027 | |
| (Cost $649,478) | | | | 1,467,558 | |
| Thailand 0.2% | |
| Siam Cement PCL (NVDR) (Cost $109,174) | | | 8,700 | | | | 121,165 | |
| United Kingdom 8.8% | |
| Aberdeen Asset Management PLC | | | 100,000 | | | | 776,804 | |
| Anglo American PLC | | | 50,000 | | | | 1,223,651 | |
| Aon PLC (b) | | | 7,000 | | | | 630,630 | |
| Aveva Group PLC | | | 22,000 | | | | 767,323 | |
| British American Tobacco PLC | | | 14,500 | | | | 863,076 | |
| Halma PLC | | | 40,000 | | | | 403,548 | |
| IMI PLC | | | 15,000 | | | | 381,728 | |
| Intertek Group PLC | | | 17,000 | | | | 799,789 | |
| Rolls-Royce Holdings PLC* | | | 13,000 | | | | 237,833 | |
| Spirax-Sarco Engineering PLC | | | 8,000 | | | | 374,181 | |
| (Cost $6,389,788) | | | | 6,458,563 | |
| United States 49.8% | |
| Allergan, Inc. | | | 4,500 | | | | 761,490 | |
| Alliance Data Systems Corp.* (a) | | | 5,500 | | | | 1,546,875 | |
| Amgen, Inc. | | | 9,000 | | | | 1,065,330 | |
| Amphenol Corp. "A" | | | 17,000 | | | | 1,637,780 | |
| Bristol-Myers Squibb Co. | | | 14,000 | | | | 679,140 | |
| CBRE Group, Inc. "A"* | | | 30,000 | | | | 961,200 | |
| Cerner Corp.* | | | 17,000 | | | | 876,860 | |
| Colfax Corp.* | | | 18,000 | | | | 1,341,720 | |
| Cynosure, Inc. "A"* | | | 17,000 | | | | 361,250 | |
| Danaher Corp. | | | 13,000 | | | | 1,023,490 | |
| DIRECTV* | | | 12,200 | | | | 1,037,122 | |
| Discovery Communications, Inc. "A"* | | | 11,000 | | | | 817,080 | |
| Eaton Corp. PLC | | | 13,000 | | | | 1,003,340 | |
| Ecolab, Inc. | | | 9,000 | | | | 1,002,060 | |
| Express Scripts Holding Co.* | | | 16,000 | | | | 1,109,280 | |
| Exxon Mobil Corp. | | | 11,000 | | | | 1,107,480 | |
| Fastenal Co. (a) | | | 16,000 | | | | 791,840 | |
| Google, Inc. "C"* | | | 1,000 | | | | 575,280 | |
| JPMorgan Chase & Co. | | | 22,000 | | | | 1,267,640 | |
| Kansas City Southern | | | 3,500 | | | | 376,285 | |
| L Brands, Inc. | | | 13,000 | | | | 762,580 | |
| Las Vegas Sands Corp. | | | 15,000 | | | | 1,143,300 | |
| MasTec, Inc.* (a) | | | 16,000 | | | | 493,120 | |
| | | Shares | | | Value ($) | |
| | | | | | | | | |
| MasterCard, Inc. "A" | | | 21,000 | | | | 1,542,870 | |
| McDonald's Corp. | | | 9,000 | | | | 906,660 | |
| Mead Johnson Nutrition Co. | | | 9,000 | | | | 838,530 | |
| Monster Beverage Corp.* | | | 12,000 | | | | 852,360 | |
| National Oilwell Varco, Inc. | | | 9,000 | | | | 741,150 | |
| Noble Energy, Inc. | | | 20,000 | | | | 1,549,200 | |
| Pall Corp. | | | 14,000 | | | | 1,195,460 | |
| Praxair, Inc. | | | 12,000 | | | | 1,594,080 | |
| ResMed, Inc. (a) | | | 14,000 | | | | 708,820 | |
| Schlumberger Ltd. | | | 8,500 | | | | 1,002,575 | |
| The Travelers Companies, Inc. | | | 12,000 | | | | 1,128,840 | |
| United Technologies Corp. | | | 9,000 | | | | 1,039,050 | |
| W.R. Grace & Co.* | | | 4,000 | | | | 378,120 | |
| Yelp, Inc.* | | | 6,000 | | | | 460,080 | |
| Zoetis, Inc. | | | 25,000 | | | | 806,750 | |
| (Cost $31,903,672) | | | | 36,486,087 | |
Total Common Stocks (Cost $60,105,936) | | | | 69,577,297 | |
| | |
| | | Shares | | | Value ($) | |
| | | | | | | | | |
| Participatory Note 0.6% | |
| Nigeria | |
| Zenith Bank PLC (issuer Merrill Lynch International) Expiration Date 8/21/2015 (Cost $405,600) | | | 3,000,000 | | | | 461,184 | |
| | |
| Securities Lending Collateral 7.6% | |
| Daily Assets Fund Institutional, 0.08% (d) (e) (Cost $5,570,286) | | | 5,570,286 | | | | 5,570,286 | |
| | |
| Cash Equivalents 1.8% | |
| Central Cash Management Fund, 0.06% (d) (Cost $1,293,263) | | | 1,293,263 | | | | 1,293,263 | |
| | | % of Net Assets | | | Value ($) | |
| | | | |
Total Investment Portfolio (Cost $$67,375,085)† | | | 104.9 | | | | 76,902,030 | |
| Other Assets and Liabilities, Net | | | (4.9 | ) | | | (3,605,994 | ) |
| Net Assets | | | 100.0 | | | | 73,296,036 | |
* Non-income producing security.
† The cost for federal income tax purposes was $67,375,119. At June 30, 2014, net unrealized appreciation for all securities based on tax cost was $9,526,911. This consisted of aggregate gross unrealized appreciation for all securities in which there was an excess of value over tax cost of $10,315,107 and aggregate gross unrealized depreciation for all securities in which there was an excess of tax cost over value of $788,196.
(a) All or a portion of these securities were on loan. In addition, "Other Assets and Liabilities, Net" may include pending sales that are also on loan. The value of securities loaned at June 30, 2014 amounted to $5,361,623, which is 7.3% of net assets.
(b) Listed on the New York Stock Exchange.
(c) Listed on the NASDAQ Stock Market, Inc.
(d) Affiliated fund managed by Deutsche Investment Management Americas Inc. The rate shown is the annualized seven-day yield at period end.
(e) Represents collateral held in connection with securities lending. Income earned by the Fund is net of borrower rebates.
ADR: American Depositary Receipt
Fair Value Measurements
Various inputs are used in determining the value of the Fund's investments. These inputs are summarized in three broad levels. Level 1 includes quoted prices in active markets for identical securities. Level 2 includes other significant observable inputs (including quoted prices for similar securities, interest rates, prepayment speeds and credit risk). Level 3 includes significant unobservable inputs (including the Fund's own assumptions in determining the fair value of investments). The level assigned to the securities valuations may not be an indication of the risk or liquidity associated with investing in those securities.
The following is a summary of the inputs used as of June 30, 2014 in valuing the Fund's investments. For information on the Fund's policy regarding the valuation of investments, please refer to the Security Valuation section of Note A in the accompanying Notes to Financial Statements.
| Assets | | Level 1 | | | Level 2 | | | Level 3 | | | Total | |
| | |
| Common Stocks (f) | |
| Belgium | | $ | — | | | $ | 1,723,264 | | | $ | — | | | $ | 1,723,264 | |
| Brazil | | | 586,558 | | | | — | | | | — | | | | 586,558 | |
| Canada | | | 4,205,687 | | | | — | | | | — | | | | 4,205,687 | |
| Denmark | | | — | | | | 131,199 | | | | — | | | | 131,199 | |
| Finland | | | — | | | | 530,056 | | | | — | | | | 530,056 | |
| France | | | — | | | | 960,701 | | | | — | | | | 960,701 | |
| Germany | | | — | | | | 2,092,181 | | | | — | | | | 2,092,181 | |
| Indonesia | | | — | | | | 590,468 | | | | — | | | | 590,468 | |
| Ireland | | | 1,034,885 | | | | 1,094,954 | | | | — | | | | 2,129,839 | |
| Italy | | | — | | | | 1,961,002 | | | | — | | | | 1,961,002 | |
| Luxembourg | | | — | | | | 922,635 | | | | — | | | | 922,635 | |
| Malaysia | | | — | | | | 409,218 | | | | — | | | | 409,218 | |
| Mexico | | | 345,196 | | | | — | | | | — | | | | 345,196 | |
| Netherlands | | | 784,080 | | | | — | | | | — | | | | 784,080 | |
| Norway | | | — | | | | 1,695,276 | | | | — | | | | 1,695,276 | |
| Philippines | | | — | | | | 1,767,010 | | | | — | | | | 1,767,010 | |
| Spain | | | — | | | | 802,081 | | | | — | | | | 802,081 | |
| Sweden | | | — | | | | 3,407,473 | | | | — | | | | 3,407,473 | |
| Switzerland | | | — | | | | 1,467,558 | | | | — | | | | 1,467,558 | |
| Thailand | | | — | | | | 121,165 | | | | — | | | | 121,165 | |
| United Kingdom | | | 630,630 | | | | 5,827,933 | | | | — | | | | 6,458,563 | |
| United States | | | 36,486,087 | | | | — | | | | — | | | | 36,486,087 | |
| Participatory Notes (f) | | | — | | | | 461,184 | | | | — | | | | 461,184 | |
| Short-Term Investments (f) | | | 6,863,549 | | | | — | | | | — | | | | 6,863,549 | |
| Total | | $ | 50,936,672 | | | $ | 25,965,358 | | | $ | — | | | $ | 76,902,030 | |
There have been no transfers between fair value measurement levels during the period ended June 30, 2014.
(f) See Investment Portfolio for additional detailed categorizations.
The accompanying notes are an integral part of the financial statements.
Statement of Assets and Liabilities | as of June 30, 2014 (Unaudited) | |
| Assets | |
Investments: Investments in non-affiliated securities, at value (cost $60,511,536) — including $5,361,623 of securities loaned | | $ | 70,038,481 | |
| Investment in Daily Assets Fund Institutional (cost $5,570,286)* | | | 5,570,286 | |
| Investment in Central Cash Management Fund (cost $1,293,263) | | | 1,293,263 | |
| Total investments in securities, at value (cost $67,375,085) | | | 76,902,030 | |
| Foreign currency, at value (cost $564,942) | | | 569,231 | |
| Receivable for investments sold | | | 1,678,411 | |
| Receivable for Fund shares sold | | | 524 | |
| Dividends receivable | | | 94,173 | |
| Interest receivable | | | 7,512 | |
| Foreign taxes recoverable | | | 74,399 | |
| Other assets | | | 465 | |
| Total assets | | | 79,326,745 | |
| Liabilities | |
| Payable upon return of securities loaned | | | 5,570,286 | |
| Payable for investments purchased | | | 292,172 | |
| Payable for Fund shares redeemed | | | 27,434 | |
| Accrued management fee | | | 46,358 | |
| Accrued Trustees' fees | | | 192 | |
| Other accrued expenses and payables | | | 94,267 | |
| Total liabilities | | | 6,030,709 | |
| Net assets, at value | | $ | 73,296,036 | |
| Net Assets Consist of | |
| Undistributed net investment income | | | 349,476 | |
Net unrealized appreciation (depreciation) on: Investments | | | 9,526,945 | |
| Foreign currency | | | 7,421 | |
| Accumulated net realized gain (loss) | | | (45,382,583 | ) |
| Paid-in capital | | | 108,794,777 | |
| Net assets, at value | | $ | 73,296,036 | |
Class A Net Asset Value, offering and redemption price per share ($73,296,036 ÷ 7,722,167 outstanding shares of beneficial interest, no par value, unlimited number of shares authorized) | | $ | 9.49 | |
* Represents collateral on securities loaned.
The accompanying notes are an integral part of the financial statements.
Statement of Operations
| for the six months ended June 30, 2014 (Unaudited) | |
| Investment Income | |
Income: Dividends (net of foreign taxes withheld of $66,477) | | $ | 721,265 | |
| Income distributions — Central Cash Management Fund | | | 820 | |
| Securities lending income, including income from Daily Assets Fund Institutional, net of borrower rebates | | | 24,364 | |
| Total income | | | 746,449 | |
Expenses: Management fee | | | 232,387 | |
| Administration fee | | | 35,752 | |
| Services to shareholders | | | 554 | |
| Custodian fee | | | 23,254 | |
| Professional fees | | | 36,189 | |
| Reports to shareholders | | | 14,972 | |
| Trustees' fees and expenses | | | 2,277 | |
| Other | | | 13,626 | |
| Total expenses before expense reductions | | | 359,011 | |
| Expense reductions | | | (1,266 | ) |
| Total expenses after expense reductions | | | 357,745 | |
| Net investment income | | | 388,704 | |
| Realized and Unrealized Gain (Loss) | |
Net realized gain (loss) from: Investments | | | 2,064,510 | |
| Futures | | | 91,460 | |
| Foreign currency | | | (15,631 | ) |
| | | | 2,140,339 | |
Change in net unrealized appreciation (depreciation) on: Investments | | | 414,784 | |
| Foreign currency | | | 7,999 | |
| | | | 422,783 | |
| Net gain (loss) | | | 2,563,122 | |
| Net increase (decrease) in net assets resulting from operations | | $ | 2,951,826 | |
The accompanying notes are an integral part of the financial statements.
Statement of Changes in Net Assets | Increase (Decrease) in Net Assets | | Six Months Ended June 30, 2014 (Unaudited) | | | Year Ended December 31, 2013 | |
Operations: Net investment income | | $ | 388,704 | | | $ | 1,174,893 | |
Operations: Net investment income | | $ | 388,704 | | | $ | 1,174,893 | |
| Net realized gain (loss) | | | 2,140,339 | | | | 17,352,793 | |
| Change in net unrealized appreciation (depreciation) | | | 422,783 | | | | (6,262,438 | ) |
| Net increase (decrease) in net assets resulting from operations | | | 2,951,826 | | | | 12,265,248 | |
Distributions to shareholders from: Net investment income: Class A | | | (1,256,998 | ) | | | (1,676,904 | ) |
Fund share transactions: Class A Proceeds from shares sold | | | 1,087,663 | | | | 3,395,869 | |
| Reinvestment of distributions | | | 1,256,998 | | | | 1,676,904 | |
| Payments for shares redeemed | | | (3,730,928 | ) | | | (9,660,444 | ) |
| Net increase (decrease) in net assets from Class A share transactions | | | (1,386,267 | ) | | | (4,587,671 | ) |
| Increase (decrease) in net assets | | | 308,561 | | | | 6,000,673 | |
| Net assets at beginning of period | | | 72,987,475 | | | | 66,986,802 | |
| Net assets at end of period (including undistributed net investment income of $349,476 and $1,217,770, respectively) | | $ | 73,296,036 | | | $ | 72,987,475 | |
| Other Information | |
Class A Shares outstanding at beginning of period | | | 7,869,570 | | | | 8,411,945 | |
| Shares sold | | | 117,523 | | | | 404,553 | |
| Shares issued to shareholders in reinvestment of distributions | | | 138,132 | | | | 202,770 | |
| Shares redeemed | | | (403,058 | ) | | | (1,149,698 | ) |
| Net increase (decrease) in Class A shares | | | (147,403 | ) | | | (542,375 | ) |
| Shares outstanding at end of period | | | 7,722,167 | | | | 7,869,570 | |
The accompanying notes are an integral part of the financial statements.
| | | | | | Years Ended December 31, | |
| Class A | | Six Months Ended 6/30/14 (Unaudited) | | | 2013 | | | 2012 | | | 2011 | | | 2010 | | | 2009 | |
| Selected Per Share Data | |
| Net asset value, beginning of period | | $ | 9.27 | | | $ | 7.96 | | | $ | 6.98 | | | $ | 8.08 | | | $ | 7.45 | | | $ | 6.22 | |
Income (loss) from investment operations: Net investment incomea | | | .05 | | | | .14 | | | | .18 | | | | .19 | | | | .14 | | | | .12 | |
| Net realized and unrealized gain (loss) | | | .33 | | | | 1.37 | | | | 1.01 | | | | (1.14 | ) | | | .66 | | | | 1.51 | |
| Total from investment operations | | | .38 | | | | 1.51 | | | | 1.19 | | | | (.95 | ) | | | .80 | | | | 1.63 | |
Less distributions from: Net investment income | | | (.16 | ) | | | (.20 | ) | | | (.21 | ) | | | (.15 | ) | | | (.17 | ) | | | (.40 | ) |
| Net asset value, end of period | | $ | 9.49 | | | $ | 9.27 | | | $ | 7.96 | | | $ | 6.98 | | | $ | 8.08 | | | $ | 7.45 | |
| Total Return (%) | | | 4.21 | b** | | | 19.31 | b | | | 17.34 | | | | (12.07 | ) | | | 10.93 | | | | 29.36 | |
| Ratios to Average Net Assets and Supplemental Data | |
| Net assets, end of period ($ millions) | | | 73 | | | | 73 | | | | 67 | | | | 65 | | | | 83 | | | | 86 | |
| Ratio of expenses before expense reductions (%) | | | 1.00 | * | | | 1.06 | | | | 1.02 | | | | 1.03 | | | | .99 | | | | .94 | |
| Ratio of expenses after expense reductions (%) | | | 1.00 | * | | | .99 | | | | 1.02 | | | | 1.03 | | | | .99 | | | | .94 | |
| Ratio of net investment income (%) | | | 1.09 | * | | | 1.69 | | | | 2.46 | | | | 2.44 | | | | 1.90 | | | | 1.89 | |
| Portfolio turnover rate (%) | | | 39 | ** | | | 139 | | | | 18 | | | | 26 | | | | 14 | | | | 139 | |
a Based on average shares outstanding during the period. b Total return would have been lower had certain expenses not been reimbursed. * Annualized ** Not annualized | |
Notes to Financial Statements (Unaudited)
A. Organization and Significant Accounting Policies
Deutsche Global Equity VIP (formerly DWS Global Equity VIP) (the "Fund") is a diversified series of Deutsche Variable Series II (formerly DWS Variable Series II) (the "Trust"), which is registered under the Investment Company Act of 1940, as amended (the "1940 Act"), as an open-end management investment company organized as a Massachusetts business trust.
The Fund's financial statements are prepared in accordance with accounting principles generally accepted in the United States of America which require the use of management estimates. Actual results could differ from those estimates. The policies described below are followed consistently by the Fund in the preparation of its financial statements.
Security Valuation. Investments are stated at value determined as of the close of regular trading on the New York Stock Exchange on each day the exchange is open for trading.
Various inputs are used in determining the value of the Fund's investments. These inputs are summarized in three broad levels. Level 1 includes quoted prices in active markets for identical securities. Level 2 includes other significant observable inputs (including quoted prices for similar securities, interest rates, prepayment speeds and credit risk). Level 3 includes significant unobservable inputs (including the Fund's own assumptions in determining the fair value of investments). The level assigned to the securities valuations may not be an indication of the risk or liquidity associated with investing in those securities.
Equity securities are valued at the most recent sale price or official closing price reported on the exchange (U.S. or foreign) or over-the-counter market on which they trade. Securities for which no sales are reported are valued at the calculated mean between the most recent bid and asked quotations on the relevant market or, if a mean cannot be determined, at the most recent bid quotation. Equity securities are generally categorized as Level 1. For certain international equity securities, in order to adjust for events which may occur between the close of the foreign exchanges and the close of the New York Stock Exchange, a fair valuation model may be used. This fair valuation model takes into account comparisons to the valuation of American Depository Receipts (ADRs), futures contracts and certain indices and these securities are categorized as Level 2.
Futures contracts are generally valued at the settlement prices established each day on the exchange on which they are traded and are categorized as Level 1.
Investments in open-end investment companies are valued at their net asset value each business day and are categorized as Level 1.
Securities and other assets for which market quotations are not readily available or for which the above valuation procedures are deemed not to reflect fair value are valued in a manner that is intended to reflect their fair value as determined in accordance with procedures approved by the Board and are generally categorized as Level 3. In accordance with the Fund's valuation procedures, factors considered in determining value may include, but are not limited to, the type of the security; the size of the holding; the initial cost of the security; the existence of any contractual restrictions on the security's disposition; the price and extent of public trading in similar securities of the issuer or of comparable companies; quotations or evaluated prices from broker-dealers and/or pricing services; information obtained from the issuer, analysts, and/or the appropriate stock exchange (for exchange-traded securities); an analysis of the company's or issuer's financial statements; an evaluation of the forces that influence the issuer and the market(s) in which the security is purchased and sold; and with respect to debt securities, the maturity, coupon, creditworthiness, currency denomination and the movement of the market in which the security is normally traded. The value determined under these procedures may differ from published values for the same securities.
Disclosure about the classification of fair value measurements is included in a table following the Fund's Investment Portfolio.
Participatory Notes. The Fund invests in Participatory Notes (P-Notes). P-Notes are promissory notes designed to offer a return linked to the performance of a particular underlying equity security or market. P-Notes are issued by banks or broker-dealers and allow the Fund to gain exposure to local shares in foreign markets. Investments in P-Notes involve the same risks associated with a direct investment in the underlying foreign companies or foreign markets that they seek to replicate. Although each participation note is structured with a defined maturity date, early redemption may be possible. Risks associated with participation notes include the possible failure of a counterparty to perform in accordance with the terms of the agreement and potential delays or an inability to redeem before maturity under certain market conditions.
Securities Lending. Deutsche Bank AG, as lending agent, lends securities of the Fund to certain financial institutions under the terms of the Security Lending Agreement. The Fund retains the benefits of owning the securities it has loaned and continues to receive interest and dividends generated by the securities and to participate in any changes in their market value. The Fund requires the borrowers of the securities to maintain collateral with the Fund consisting of either cash or liquid, unencumbered assets having a value at least equal to the value of the securities loaned. When the collateral falls below specified amounts, the lending agent will use its best effort to obtain additional collateral on the next business day to meet required amounts under the security lending agreement. The Fund may invest the cash collateral into a joint trading account in an affiliated money market fund pursuant to Exemptive Orders issued by the SEC. The Fund receives compensation for lending its securities either in the form of fees or by earning interest on invested cash collateral net of borrower rebates and fees paid to a lending agent. Either the Fund or the borrower may terminate the loan. There may be risks of delay and costs in recovery of securities or even loss of rights in the collateral should the borrower of the securities fail financially. If the Fund is not able to recover securities lent, the Fund may sell the collateral and purchase a replacement investment in the market, incurring the risk that the value of the replacement security is greater than the value of the collateral. The Fund is also subject to all investment risks associated with the reinvestment of any cash collateral received, including, but not limited to, interest rate, credit and liquidity risk associated with such investments.
As of June 30, 2014, the Fund had securities on loan. The value of the related collateral exceeded the value of the securities loaned at period end.
Foreign Currency Translations. The books and records of the Fund are maintained in U.S. dollars. Investment securities and other assets and liabilities denominated in a foreign currency are translated into U.S. dollars at the prevailing exchange rates at period end. Purchases and sales of investment securities, income and expenses are translated into U.S. dollars at the prevailing exchange rates on the respective dates of the transactions.
Net realized and unrealized gains and losses on foreign currency transactions represent net gains and losses between trade and settlement dates on securities transactions, the acquisition and disposition of foreign currencies, and the difference between the amount of net investment income accrued and the U.S. dollar amount actually received. That portion of both realized and unrealized gains and losses on investments that results from fluctuations in foreign currency exchange rates is not separately disclosed but is included with net realized and unrealized gain/appreciation and loss/depreciation on investments.
Taxes. The Fund's policy is to comply with the requirements of the Internal Revenue Code, as amended, which are applicable to regulated investment companies, and to distribute all of its taxable income to its shareholders.
Additionally, the Fund may be subject to taxes imposed by the governments of countries in which it invests and are generally based on income and/or capital gains earned or repatriated. Estimated tax liabilities on certain foreign securities are recorded on an accrual basis and are reflected as components of interest income or net change in unrealized gain/loss on investments. Tax liabilities realized as a result of security sales are reflected as a component of net realized gain/loss on investments.
Under the Regulated Investment Company Modernization Act of 2010, net capital losses incurred post-enactment may be carried forward indefinitely, and their character is retained as short-term and/or long-term. Previously, net capital losses were carried forward for eight years and treated as short-term losses. As a transition rule, the Act requires that post-enactment net capital losses be used before pre-enactment net capital losses.
At December 31, 2013, the Fund had a net tax basis capital loss carryforward of approximately $47,342,000 of pre-enactment losses, which may be applied against any realized net taxable capital gains of each succeeding year until fully utilized or until December 31, 2016 ($8,178,000) and December 31, 2017 ($39,164,000), the respective expiration dates, whichever occurs first.
In addition, from November 1, 2013 through December 31, 2013, the Fund elected to defer qualified late year losses of approximately $36,000 of net long-term realized capital losses and $145,000 of net short-term capital losses and treat them as arising in the fiscal year ending December 31, 2014.
The Fund has reviewed the tax positions for the open tax years as of December 31, 2013 and has determined that no provision for income tax and/or uncertain tax provisions is required in the Fund's financial statements. The Fund's federal tax returns for the prior three fiscal years remain open subject to examination by the Internal Revenue Service.
Distribution of Income and Gains. Distributions from net investment income of the Fund, if any, are declared and distributed to shareholders annually. Net realized gains from investment transactions, in excess of available capital loss carryforwards, would be taxable to the Fund if not distributed and, therefore, will be distributed to shareholders at least annually. The Fund may also make additional distributions for tax purposes if necessary.
The timing and characterization of certain income and capital gain distributions are determined annually in accordance with federal tax regulations which may differ from accounting principles generally accepted in the United States of America. These differences primarily relate to investments in foreign denominated investments, investments in futures contracts, income received from passive foreign investment companies and certain securities sold at a loss. As a result, net investment income (loss) and net realized gain (loss) on investment transactions for a reporting period may differ significantly from distributions during such period. Accordingly, the Fund may periodically make reclassifications among certain of its capital accounts without impacting the net asset value of the Fund.
The tax character of current year distributions will be determined at the end of the current fiscal year.
Expenses. Expenses of the Trust arising in connection with a specific fund are allocated to that fund. Other Trust expenses which cannot be directly attributed to a fund are apportioned among the funds in the Trust based upon the relative net assets or other appropriate measures.
Contingencies. In the normal course of business, the Fund may enter into contracts with service providers that contain general indemnification clauses. The Fund's maximum exposure under these arrangements is unknown as this would involve future claims that may be made against the Fund that have not yet been made. However, based on experience, the Fund expects the risk of loss to be remote.
Other. Investment transactions are accounted for on a trade date plus one basis for daily net asset value calculations. However, for financial reporting purposes, investment transactions are reported on trade date. Interest income is recorded on the accrual basis. Dividend income is recorded on the ex-dividend date net of foreign withholding taxes. Certain dividends from foreign securities may be recorded subsequent to the ex-dividend date as soon as the Fund is informed of such dividends. Realized gains and losses from investment transactions are recorded on an identified cost basis. Proceeds from litigation payments, if any, are included in net realized gain (loss) from investments.
B. Derivative Instruments
Futures Contracts. A futures contract is an agreement between a buyer or seller and an established futures exchange or its clearinghouse in which the buyer or seller agrees to take or make a delivery of a specific amount of a financial instrument at a specified price on a specific date (settlement date). For the six months ended June 30, 2014, the Fund entered into futures contracts as a means of gaining exposure to a particular asset class or to keep cash on hand to meet shareholder redemptions or other needs while maintaining exposure to the market.
Upon entering into a futures contract, the Fund is required to deposit with a financial intermediary cash or securities ("initial margin") in an amount equal to a certain percentage of the face value indicated in the futures contract. Subsequent payments ("variation margin") are made or received by the Fund dependent upon the daily fluctuations in the value and are recorded for financial reporting purposes as unrealized gains or losses by the Fund. Gains or losses are realized when the contract expires or is closed. Since all futures contracts are exchange-traded, counterparty risk is minimized as the exchange's clearinghouse acts as the counterparty, and guarantees the futures against default.
Certain risks may arise upon entering into futures contracts, including the risk that an illiquid market will limit the Fund's ability to close out a futures contract prior to the settlement date and the risk that the futures contract is not well correlated with the security, index or currency to which it relates. Risk of loss may exceed amounts disclosed in the Statement of Assets and Liabilities.
There are no open futures contracts as of June 30, 2014. For the six months ended June 30, 2014, the investment in futures contracts purchased had a total notional value from $0 to $2,239,000.
The amount of unrealized and realized gains and losses on derivative instruments recognized in Fund earnings during the six months ended June 30, 2014 and the related location in the accompanying Statement of Operations is summarized in the following tables by primary underlying risk exposure:
| Realized Gain (Loss) | | Futures Contracts | |
| Equity Contracts (a) | | $ | 91,460 | |
The above derivative is located in the following Statement of Operations account: (a) Net realized gain (loss) from futures | |
C. Purchases and Sales of Securities
During the six months ended June 30, 2014, purchases and sales of investment transactions (excluding short-term investments) aggregated $26,830,837 and $29,630,539, respectively.
D. Related Parties
Management Agreement. Under the Investment Management Agreement with Deutsche Investment Management Americas Inc. ("DIMA" or the "Advisor"), an indirect, wholly owned subsidiary of Deutsche Bank AG, the Advisor directs the investments of the Fund in accordance with its investment objectives, policies and restrictions. The Advisor determines the securities, instruments and other contracts relating to investments to be purchased, sold or entered into by the Fund.
Pursuant to the Investment Management Agreement with the Advisor, the Fund pays a monthly management fee based on the Fund's average daily net assets, computed and accrued daily and payable monthly, at the following annual rates:
| First $1.5 billion | | | .650 | % |
| Next $1.75 billion | | | .635 | % |
| Next $1.75 billion | | | .620 | % |
| Over $5 billion | | | .605 | % |
Accordingly, for the six months ended June 30, 2014, the fee pursuant to the Investment Management Agreement was equivalent to an annualized effective rate (exclusive of any applicable waivers/reimbursements) of 0.65% of the Fund's average daily net assets.
For the period from January 1, 2014 through September 30, 2014, the Advisor has contractually agreed to waive its fee and/or reimburse certain operating expenses to the extent necessary to maintain the operating expenses (excluding certain expenses such as extraordinary expenses, taxes, brokerage and interest expense) of Class A shares at 1.00%.
For the six months ended June 30, 2014, fees waived and/or expenses reimbursed for Class A amounted to $1,266.
Administration Fee. Pursuant to an Administrative Services Agreement, DIMA provides most administrative services to the Fund. For all services provided under the Administrative Services Agreement, the Fund pays DIMA an annual fee ("Administration Fee") of 0.10% of the Fund's average daily net assets, computed and accrued daily and payable monthly. For the six months ended June 30, 2014, the Administration Fee was $35,752, of which $5,990 is unpaid.
Service Provider Fees. DeAWM Service Company ("DSC"), an affiliate of the Advisor, is the transfer agent, dividend-paying agent and shareholder service agent for the Fund. Pursuant to a sub-transfer agency agreement between DSC and DST Systems, Inc. ("DST"), DSC has delegated certain transfer agent, dividend-paying agent and shareholder service agent functions to DST. DSC compensates DST out of the shareholder servicing fee it receives from the Fund. For the six months ended June 30, 2014, the amounts charged to the Fund by DSC aggregated $56, of which $28 is unpaid.
Typesetting and Filing Service Fees. Under an agreement with DIMA, DIMA is compensated for providing typesetting and certain regulatory filing services to the Fund. For the six months ended June 30, 2014, the amount charged to the Fund by DIMA included in the Statement of Operations under "reports to shareholders" aggregated $7,971, of which $5,256 is unpaid.
Trustees' Fees and Expenses. The Fund paid retainer fees to each Trustee not affiliated with the Advisor, plus specified amounts to the Board Chairperson and Vice Chairperson and to each committee Chairperson.
Affiliated Cash Management Vehicles. The Fund may invest uninvested cash balances in Central Cash Management Fund and Deutsche Variable NAV Money Fund, affiliated money market funds which are managed by the Advisor. Each affiliated money market fund seeks to provide a high level of current income consistent with liquidity and the preservation of capital. Each affiliated money market fund is managed in accordance with Rule 2a-7 under the Investment Company Act of 1940, which governs the quality, maturity, diversity and liquidity of instruments in which a money market fund may invest. Central Cash Management Fund seeks to maintain a stable net asset value, and Deutsche Variable NAV Money Fund maintains a floating net asset value. The Fund indirectly bears its proportionate share of the expenses of each affiliated money market fund in which it invests. Central Cash Management Fund does not pay the Advisor an investment management fee. To the extent that Deutsche Variable NAV Money Fund pays an investment management fee to the Advisor, the Advisor will waive an amount of the investment management fee payable to the Advisor by the Fund equal to the amount of the investment management fee payable on the Fund's assets invested in Deutsche Variable NAV Money Fund.
Securities Lending Fees. Deutsche Bank AG serves as lending agent for the Fund. For the six months ended June 30, 2014, the Fund incurred lending agent fees to Deutsche Bank AG in the amount of $2,121.
E. Ownership of the Fund
At June 30, 2014, two participating insurance companies were owners of record of 10% or more of the total outstanding Class A shares of the Fund, each owning 76% and 23%.
F. Line of Credit
The Fund and other affiliated funds (the "Participants") share in a $400 million revolving credit facility provided by a syndication of banks. The Fund may borrow for temporary or emergency purposes, including the meeting of redemption requests that otherwise might require the untimely disposition of securities. The Participants are charged an annual commitment fee which is allocated based on net assets, among each of the Participants. Interest is calculated at a rate per annum equal to the sum of the Federal Funds Rate plus 1.25 percent plus if LIBOR exceeds the Federal Funds Rate the amount of such excess. The Fund may borrow up to a maximum of 33 percent of its net assets under the agreement. The Fund had no outstanding loans at June 30, 2014.
G. Fund Name Change
Effective August 11, 2014, the "DWS Funds" were rebranded "Deutsche Funds."
Information About Your Fund's Expenses (Unaudited)
As an investor of the Fund, you incur two types of costs: ongoing expenses and transaction costs. Ongoing expenses include management fees and other Fund expenses. Examples of transaction costs include contract charges and account maintenance fees, which are not shown in this section. The following tables are intended to help you understand your ongoing expenses (in dollars) of investing in the Fund and to help you compare these expenses with the ongoing expenses of investing in other mutual funds. In the most recent six-month period, the Fund limited these expenses, had it not done so, expenses would have ben higher. The example in the table is based on an investment of $1,000 invested at the beginning of the six-month period and held for the entire period (January 1, 2014 to June 30, 2014).
The tables illustrate your Fund's expenses in two ways:
—Actual Fund Return. This helps you estimate the actual dollar amount of ongoing expenses (but not transaction costs) paid on a $1,000 investment in the Fund using the Fund's actual return during the period. To estimate the expenses you paid over the period, simply divide your account value by $1,000 (for example, an $8,600 account value divided by $1,000 = 8.6), then multiply the result by the number in the "Expenses Paid per $1,000" line under the share class you hold.
—Hypothetical 5% Fund Return. This helps you to compare your Fund's ongoing expenses (but not transaction costs) with those of other mutual funds using the Fund's actual expense ratio and a hypothetical rate of return of 5% per year before expenses. Examples using a 5% hypothetical Fund return may be found in the shareholder reports of other mutual funds. The hypothetical account values and expenses may not be used to estimate the actual ending account balance or expenses you paid for the period.
Please note that the expenses shown in these tables are meant to highlight your ongoing expenses only and do not reflect any transaction costs. The "Expenses Paid per $1,000" line of the tables is useful in comparing ongoing expenses only and will not help you determine the relative total expense of owning different funds. If these transaction costs had been included, your costs would have been higher.
Expenses and Value of a $1,000 Investment for the six months ended June 30, 2014 | |
| Actual Fund Return | | Class A | |
| Beginning Account Value 1/1/14 | | $ | 1,000.00 | |
| Ending Account Value 6/30/14 | | $ | 1,042.10 | |
| Expenses Paid per $1,000* | | $ | 5.06 | |
| Hypothetical 5% Fund Return | | Class A | |
| Beginning Account Value 1/1/14 | | $ | 1,000.00 | |
| Ending Account Value 6/30/14 | | $ | 1,019.84 | |
| Expenses Paid per $1,000* | | $ | 5.01 | |
* Expenses are equal to the Fund's annualized expense ratio, multiplied by the average account value over the period, multiplied by 181 (the number of days in the most recent six-month period), then divided by 365.
| Annualized Expense Ratio | Class A | |
| Deutsche Variable Series II — Deutsche Global Equity VIP | 1.00% | |
For more information, please refer to the Fund's prospectus.
These tables do not reflect charges and fees ("contract charges") associated with the separate account that invests in the Fund or any variable life insurance policy or variable annuity contract for which the Fund is an investment option.
For an analysis of the fees associated with an investment in the fund or similar funds, please refer to the current and hypothetical expense calculators for Variable Insurance Products which can be found at deutschefunds.com/EN/resources/calculators.jsp.
The Trust's policies and procedures for voting proxies for portfolio securities and information about how the Trust voted proxies related to its portfolio securities during the 12-month period ended June 30 are available on our Web site — deutschefunds.com (click on "proxy voting" at the bottom of the page) — or on the SEC's Web site — sec.gov. To obtain a written copy of the Trust's policies and procedures without charge, upon request, call us toll free at (800) 728-3337.
Advisory Agreement Board Considerations and Fee Evaluation
The Board of Trustees approved the renewal of DWS Global Equity VIP's investment management agreement (the "Agreement") with Deutsche Investment Management Americas Inc. ("DIMA") in September 2013.
In terms of the process that the Board followed prior to approving the Agreement, shareholders should know that:
— In September 2013, all but one of the Fund's Trustees were independent of DIMA and its affiliates.
— The Trustees met frequently during the past year to discuss fund matters and dedicated a substantial amount of time to contract review matters. Over the course of several months, the Board's Contract Committee, in coordination with the Board's Fixed Income and Asset Allocation Oversight Committee, reviewed comprehensive materials received from DIMA, independent third parties and independent counsel. These materials included an analysis of the Fund's performance, fees and expenses, and profitability compiled by a fee consultant retained by the Fund's Independent Trustees (the "Fee Consultant"). The Board also received extensive information throughout the year regarding performance of the Fund.
— The Independent Trustees regularly meet privately with their independent counsel to discuss contract review and other matters. In addition, the Independent Trustees were also advised by the Fee Consultant in the course of their review of the Fund's contractual arrangements and considered a comprehensive report prepared by the Fee Consultant in connection with their deliberations.
— In connection with reviewing the Agreement, the Board also reviewed the terms of the Fund's distribution agreement, administrative services agreement, transfer agency agreement and other material service agreements.
— Based on its evaluation of the information provided, the Contract Committee presented its findings and recommendations to the Board. The Board then reviewed the Contract Committee's findings and recommendations.
In connection with the contract review process, the Contract Committee and the Board considered the factors discussed below, among others. The Board also considered that DIMA and its predecessors have managed the Fund since its inception, and the Board believes that a long-term relationship with a capable, conscientious advisor is in the best interests of the Fund. The Board considered, generally, that shareholders chose to invest or remain invested in the Fund knowing that DIMA managed the Fund, and that the Agreement was approved by the Fund's shareholders. DIMA is part of Deutsche Bank AG, a major global banking institution that is engaged in a wide range of financial services. The Board believes that there are advantages to being part of a global asset management business that offers a wide range of investing expertise and resources, including hundreds of portfolio managers and analysts with research capabilities in many countries throughout the world.
As part of the contract review process, the Board carefully considered the fees and expenses of each DWS fund overseen by the Board in light of the fund's performance. In many cases, this led to a negotiation with DIMA of lower expense caps as part of the 2012 and 2013 contract review processes than had previously been in place. As part of these negotiations, the Board indicated that it would consider relaxing these new lower caps in future years following sustained improvements in performance, among other considerations.
In June 2012, Deutsche Bank AG ("DB"), DIMA's parent company, announced that DB would combine its Asset Management (of which DIMA was a part) and Wealth Management divisions. DB has advised the Independent Trustees that the U.S. asset management business is a critical and integral part of DB, and that it has, and will continue to, reinvest a significant portion of the substantial savings it expects to realize by combining its Asset Management and Wealth Management divisions into the new Asset and Wealth Management ("AWM") division, including ongoing enhancements to its investment capabilities. DB also has confirmed its commitment to maintaining strong legal and compliance groups within the AWM division.
While shareholders may focus primarily on fund performance and fees, the Fund's Board considers these and many other factors, including the quality and integrity of DIMA's personnel and such other issues as back-office operations, fund valuations, and compliance policies and procedures.
Nature, Quality and Extent of Services. The Board considered the terms of the Agreement, including the scope of advisory services provided under the Agreement. The Board noted that, under the Agreement, DIMA provides portfolio management services to the Fund and that, pursuant to a separate administrative services agreement, DIMA provides administrative services to the Fund. The Board considered the experience and skills of senior management and investment personnel, the resources made available to such personnel, the ability of DIMA to attract and retain high-quality personnel, and the organizational depth and stability of DIMA. The Board reviewed the Fund's performance over short-term and long-term periods and compared those returns to various agreed-upon performance measures, including market indices and a peer universe compiled by the Fee Consultant using information supplied by Morningstar Direct ("Morningstar"), an independent fund data service. The Board also noted that it has put into place a process of identifying "Focus Funds" (e.g., funds performing poorly relative to their benchmark or a peer universe compiled by an independent fund data service), and receives more frequent reporting and information from DIMA regarding such funds, along with DIMA's remedial plans to address underperformance. The Board believes this process is an effective manner of identifying and addressing underperforming funds. Based on the information provided, the Board noted that for the one-, three- and five-year periods ended December 31, 2012, the Fund's performance (Class A shares) was in the 3rd quartile, 2nd quartile and 4th quartile, respectively, of the applicable Morningstar universe (the 1st quartile being the best performers and the 4th quartile being the worst performers). The Board also observed that the Fund has outperformed its benchmark in the one- and three-year periods and has underperformed its benchmark in the five-year period ended December 31, 2012.
Fees and Expenses. The Board considered the Fund's investment management fee schedule, operating expenses and total expense ratios, and comparative information provided by Lipper Inc. ("Lipper") and the Fee Consultant regarding investment management fee rates paid to other investment advisors by similar funds (1st quartile being the most favorable and 4th quartile being the least favorable). With respect to management fees paid to other investment advisors by similar funds, the Board noted that the contractual fee rates paid by the Fund, which include a 0.10% fee paid to DIMA under the Fund's administrative services agreement, were lower than the median (1st quartile) of the applicable Lipper peer group (based on Lipper data provided as of December 31, 2012). The Board noted that the Fund's Class A shares total (net) operating expenses were expected to be higher than the median (3rd quartile) of the applicable Lipper expense universe (based on Lipper data provided as of December 31, 2012, and analyzing Lipper expense universe Class A (net) expenses less any applicable 12b-1 fees) ("Lipper Universe Expenses"). The Board considered the Fund's management fee rate as compared to fees charged by DIMA to comparable funds and considered differences between the Fund and the comparable funds. The Board also considered how the Fund's total (net) operating expenses compared to the total (net) operating expenses of a more customized peer group selected by Lipper (based on such factors as asset size). The Board also noted that the expense limitation agreed to by DIMA helped to ensure that the Fund's total (net) operating expenses would remain competitive.
The information considered by the Board as part of its review of management fees included information regarding fees charged by DIMA and its affiliates to similar institutional accounts and to similar funds offered primarily to European investors ("DWS Europe funds"), in each case as applicable. The Board observed that advisory fee rates for institutional accounts generally were lower than the management fees charged by similarly managed DWS U.S. mutual funds ("DWS Funds"), but also took note of the differences in services provided to DWS Funds as compared to institutional accounts. In the case of DWS Europe funds, the Board observed that fee rates for DWS Europe funds generally were higher than for similarly managed DWS Funds, but noted that differences in the types of services provided to DWS Funds relative to DWS Europe funds made it difficult to compare such fees.
On the basis of the information provided, the Board concluded that management fees were reasonable and appropriate in light of the nature, quality and extent of services provided by DIMA.
Profitability. The Board reviewed detailed information regarding revenues received by DIMA under the Agreement. The Board considered the estimated costs and pre-tax profits realized by DIMA from advising the DWS Funds, as well as estimates of the pre-tax profits attributable to managing the Fund in particular. The Board also received information regarding the estimated enterprise-wide profitability of DWS and its affiliates with respect to all fund services in totality and by fund. The Board and the Fee Consultant reviewed DIMA's methodology in allocating its costs to the management of the Fund. Based on the information provided, the Board concluded that the pre-tax profits realized by DIMA in connection with the management of the Fund were not unreasonable. The Board also reviewed information regarding the profitability of certain similar investment management firms. The Board noted that while information regarding the profitability of such firms is limited (and in some cases is not necessarily prepared on a comparable basis), DIMA and its affiliates' overall profitability with respect to the DWS fund complex (after taking into account distribution and other services provided to the funds by DIMA and its affiliates) was lower than the overall profitability levels of many comparable firms for which such data was available.
Economies of Scale. The Board considered whether there are economies of scale with respect to the management of the Fund and whether the Fund benefits from any economies of scale. The Board noted that the Fund's management fee schedule includes fee breakpoints. The Board concluded that the Fund's fee schedule represents an appropriate sharing between the Fund and DIMA of such economies of scale as may exist in the management of the Fund at current asset levels.
Other Benefits to DIMA and Its Affiliates. The Board also considered the character and amount of other incidental benefits received by DIMA and its affiliates, including any fees received by DIMA for administrative services provided to the Fund and any fees received by an affiliate of DIMA for distribution services. The Board also considered benefits to DIMA related to brokerage and soft-dollar allocations, including allocating brokerage to pay for research generated by parties other than the executing broker dealers, which pertain primarily to funds investing in equity securities, along with the incidental public relations benefits to DIMA related to DWS Funds advertising and cross-selling opportunities among DIMA products and services. The Board concluded that management fees were reasonable in light of these fallout benefits.
Compliance. The Board considered the significant attention and resources dedicated by DIMA to documenting and enhancing its compliance processes in recent years. The Board noted in particular (i) the experience and seniority of both DIMA's chief compliance officer and the Fund's chief compliance officer; (ii) the large number of DIMA compliance personnel; and (iii) the substantial commitment of resources by DIMA and its affiliates to compliance matters.
Based on all of the information considered and the conclusions reached, the Board unanimously determined that the continuation of the Agreement is in the best interests of the Fund. In making this determination, the Board did not give particular weight to any single factor identified above. The Board considered these factors over the course of numerous meetings, certain of which were in executive session with only the Independent Trustees and their independent counsel present. It is possible that individual Trustees may have weighed these factors differently in reaching their individual decisions to approve the continuation of the Agreement.
DeAWM Distributors, Inc.
222 South Riverside Plaza
Chicago, IL 60606
(800) 621-1148
VS2GE-3 (R-028380-3 8/14)
June 30, 2014
Semiannual Report
Deutsche Variable Series II
(formerly DWS Variable Series II)
Deutsche Global Growth VIP
(formerly DWS Global Growth VIP)
Contents
5 Portfolio Management Team 10 Statement of Assets and Liabilities 10 Statement of Operations 11 Statement of Changes in Net Assets 14 Notes to Financial Statements 19 Information About Your Fund's Expenses 21 Advisory Agreement Board Considerations and Fee Evaluation |
This report must be preceded or accompanied by a prospectus. To obtain an additional prospectus or summary prospectus, if available, call (800) 728-3337 or your financial representative. We advise you to consider the Fund's objectives, risks, charges and expenses carefully before investing. The summary prospectus and prospectus contain this and other important information about the Fund. Please read the prospectus carefully before you invest.
Investing in derivatives entails special risks relating to liquidity, leverage and credit that may reduce returns and/or increase volatility. Investing in foreign securities, particularly those of emerging markets, presents certain risks, such as currency fluctuations, political and economic changes, and market risks. The fund may lend securities to approved institutions. Smaller company stocks tend to be more volatile than medium-sized or large company stocks. Stocks may decline in value. See the prospectus for details.
Deutsche Asset & Wealth Management represents the asset management and wealth management activities conducted by Deutsche Bank AG or any of its subsidiaries, including the Advisor and DeAWM Distributors, Inc.
NOT FDIC/NCUA INSURED NO BANK GUARANTEE MAY LOSE VALUE NOT A DEPOSIT
NOT INSURED BY ANY FEDERAL GOVERNMENT AGENCY
Dear Shareholder:
I am very pleased to tell you that the DWS funds have been renamed Deutsche funds, aligning more closely with the Deutsche Asset & Wealth Management brand. We are proud to adopt the Deutsche name — a brand that fully represents the global access, discipline and intelligence that support all of our products and services.
Deutsche Asset & Wealth Management combines the asset management and wealth management divisions of Deutsche Bank to deliver a comprehensive suite of active, passive and alternative investment capabilities. Your investment in the Deutsche funds means you have access to the thought leadership and resources of one of the world’s largest and most influential financial institutions.
In conjunction with your fund’s name change, please note that the Deutsche funds’ Web address has changed as well. The former dws-investments.com is now deutschefunds.com.
In addition, key service providers have been renamed as follows:
| Former Name | New name, effective August 11, 2014 |
| DWS Investments Distributors, Inc. | DeAWM Distributors, Inc. |
| DWS Trust Company | DeAWM Trust Company |
| DWS Investments Service Company | DeAWM Service Company |
These changes have no effect on the day-to-day management of your investment, and there is no action required on your part. You will continue to experience the benefits that come from our decades of experience, in-depth research and worldwide network of investment professionals.
Thanks for your continued support. We appreciate your trust and the opportunity to put our capabilities to work for you.
Best regards,
Brian Binder
President, Deutsche Funds
Performance Summary June 30, 2014 (Unaudited)
Fund performance shown is historical, assumes reinvestment of all dividend and capital gain distributions and does not guarantee future results. Investment return and principal value fluctuate with changing market conditions so that, when redeemed, shares may be worth more or less than their original cost. Current performance may be lower or higher than the performance data quoted. Please contact your participating insurance company for the Fund's most recent month-end performance. Performance doesn't reflect charges and fees ("contract charges") associated with the separate account that invests in the Fund or any variable life insurance policy or variable annuity contract for which the Fund is an investment option. These charges and fees will reduce returns. While all share classes have the same underlying portfolio, their performance will differ.
The gross expense ratios of the Fund, as stated in the fee table of the prospectus dated May 1, 2014 are 1.45% and 1.81% for Class A and Class B shares, respectively, and may differ from the expense ratios disclosed in the Financial Highlights tables in this report.
| Growth of an Assumed $10,000 Investment in Deutsche Global Growth VIP |
| The Morgan Stanley Capital International (MSCI) World Index is an unmanaged index that tracks the performance of stocks in select developed markets around the world, including the U.S. Index returns do not reflect any fees or expenses and it is not possible to invest directly into an index. |
| |
| Yearly periods ended June 30 | |
| Comparative Results | |
| Deutsche Global Growth VIP | | 6-Month‡ | | | 1-Year | | | 3-Year | | | 5-Year | | | 10-Year | |
| Class A | Growth of $10,000 | | $ | 10,465 | | | $ | 12,210 | | | $ | 12,494 | | | $ | 18,351 | | | $ | 21,549 | |
| Average annual total return | | | 4.65 | % | | | 22.10 | % | | | 7.71 | % | | | 12.91 | % | | | 7.98 | % |
| MSCI World Index | Growth of $10,000 | | $ | 10,618 | | | $ | 12,405 | | | $ | 13,977 | | | $ | 20,103 | | | $ | 20,134 | |
| Average annual total return | | | 6.18 | % | | | 24.05 | % | | | 11.81 | % | | | 14.99 | % | | | 7.25 | % |
| Deutsche Global Growth VIP | | 6-Month‡ | | | 1-Year | | | 3-Year | | | 5-Year | | | 10-Year | |
| Class B | Growth of $10,000 | | $ | 10,455 | | | $ | 12,170 | | | $ | 12,380 | | | $ | 18,039 | | | $ | 20,800 | |
| Average annual total return | | | 4.55 | % | | | 21.70 | % | | | 7.38 | % | | | 12.52 | % | | | 7.60 | % |
| MSCI World Index | Growth of $10,000 | | $ | 10,618 | | | $ | 12,405 | | | $ | 13,977 | | | $ | 20,103 | | | $ | 20,134 | |
| Average annual total return | | | 6.18 | % | | | 24.05 | % | | | 11.81 | % | | | 14.99 | % | | | 7.25 | % |
The growth of $10,000 is cumulative.
‡ Total returns shown for periods less than one year are not annualized.
Portfolio Summary (Unaudited) Asset Allocation (As a % of Investment Portfolio excluding Securities Lending Collateral) | 6/30/14 | 12/31/13 |
| | | |
| Common Stocks | 96% | 96% |
| Cash Equivalents | 3% | 3% |
| Participatory Notes | 1% | 1% |
| | 100% | 100% |
Sector Diversification
(As a % of Investment Portfolio excluding Cash Equivalents and Securities Lending Collateral) | 6/30/14 | 12/31/13 |
| | | |
| Industrials | 18% | 20% |
| Health Care | 14% | 14% |
| Financials | 14% | 15% |
| Information Technology | 13% | 14% |
| Consumer Discretionary | 13% | 14% |
| Consumer Staples | 12% | 12% |
| Energy | 8% | 7% |
| Materials | 8% | 4% |
| | 100% | 100% |
Geographical Diversification
(As a % of Investment Portfolio excluding Cash Equivalents and Securities Lending Collateral) | 6/30/14 | 12/31/13 |
| | | |
| United States | 48% | 45% |
| Europe | 26% | 30% |
| United Kingdom | 11% | 9% |
| Asia (excluding Japan) | 6% | 6% |
| Canada | 5% | 6% |
| Japan | 2% | 2% |
| Latin America | 1% | 1% |
| Africa | 1% | 1% |
| | 100% | 100% |
Portfolio holdings and characteristics are subject to change.
For more complete details about the Fund's investment portfolio, see page 6.
Following the Fund's fiscal first and third quarter-end, a complete portfolio holdings listing is filed with the SEC on Form N-Q. The form will be available on the SEC's Web site at sec.gov, and it also may be reviewed and copied at the SEC's Public Reference Room in Washington, D.C. Information on the operation of the SEC's Public Reference Room may be obtained by calling (800) SEC-0330. The Fund's portfolio holdings are also posted on deutschefunds.com from time to time. Please see the Fund's current prospectus for more information.
Portfolio Management Team
Joseph Axtell, CFA
Lead Portfolio Manager
Rafaelina M. Lee
Nils E. Ernst, PhD
Martin Berberich, CFA
Sebastien P. Werner, PhD
Portfolio Managers
Investment Portfolio June 30, 2014 (Unaudited) | | | Shares | | | Value ($) | |
| | | | |
| Common Stocks 96.3% | |
| Belgium 2.0% | |
| Anheuser-Busch InBev NV (Cost $877,251) | | | 9,200 | | | | 1,056,935 | |
| Bermuda 0.3% | |
| Lazard Ltd. "A" (Cost $59,462) | | | 2,531 | | | | 130,498 | |
| Brazil 0.8% | |
| CCR SA (Cost $379,260) | | | 49,000 | | | | 399,185 | |
| Canada 5.2% | |
| Brookfield Asset Management, Inc. "A" | | | 19,000 | | | | 837,065 | |
| Canadian Oil Sands Ltd. | | | 20,000 | | | | 453,212 | |
| Canadian Pacific Railway Ltd. | | | 4,500 | | | | 815,233 | |
| Goldcorp, Inc. | | | 12,000 | | | | 334,920 | |
| Quebecor, Inc. "B" | | | 5,040 | | | | 121,956 | |
| SunOpta, Inc.* | | | 11,711 | | | | 164,891 | |
| (Cost $2,333,446) | | | | 2,727,277 | |
| China 0.2% | |
| Minth Group Ltd. (Cost $115,171) | | | 65,770 | | | | 127,969 | |
| Cyprus 0.2% | |
| Prosafe SE (Cost $124,216) | | | 12,961 | | | | 106,919 | |
| Denmark 0.8% | |
| Coloplast AS "B" | | | 3,200 | | | | 289,389 | |
| GN Store Nord AS | | | 4,730 | | | | 135,519 | |
| (Cost $350,367) | | | | 424,908 | |
| Finland 1.0% | |
| Cramo Oyj | | | 3,851 | | | | 93,704 | |
| Nokia Oyj (a) | | | 55,000 | | | | 416,473 | |
| (Cost $494,770) | | | | 510,177 | |
| France 1.1% | |
| Pernod Ricard SA (Cost $567,369) | | | 4,600 | | | | 552,403 | |
| Germany 3.4% | |
| BASF SE | | | 4,100 | | | | 477,370 | |
| Bayer AG (Registered) | | | 2,000 | | | | 282,487 | |
| Fresenius Medical Care AG & Co. KGaA | | | 10,000 | | | | 672,190 | |
| Patrizia Immobilien AG | | | 4,667 | | | | 61,988 | |
| United Internet AG (Registered) | | | 4,323 | | | | 190,459 | |
| Vib Vermoegen AG | | | 4,650 | | | | 88,186 | |
| (Cost $1,604,983) | | | | 1,772,680 | |
| Hong Kong 1.3% | |
| Hong Kong Television Network Ltd.* | | | 94,719 | | | | 29,820 | |
| K Wah International Holdings Ltd. | | | 244,564 | | | | 170,713 | |
| Playmates Toys Ltd. | | | 226,681 | | | | 86,280 | |
| REXLot Holdings Ltd. (a) | | | 1,447,591 | | | | 169,966 | |
| Sun Hung Kai & Co., Ltd. | | | 101,067 | | | | 80,458 | |
| Techtronic Industries Co. | | | 41,213 | | | | 132,141 | |
| (Cost $563,715) | | | | 669,378 | |
| Indonesia 1.0% | |
| PT Arwana Citramulia Tbk | | | 1,118,618 | | | | 95,302 | |
| PT Indofood CBP Sukses Makmur Tbk | | | 380,000 | | | | 320,540 | |
| | | Shares | | | Value ($) | |
| | | | | | | | | |
| PT Multipolar Tbk | | | 1,697,639 | | | | 96,660 | |
| (Cost $647,416) | | | | 512,502 | |
| Ireland 2.7% | |
| Accenture PLC "A" (b) | | | 5,500 | | | | 444,620 | |
| C&C Group PLC | | | 12,120 | | | | 75,428 | |
| Paddy Power PLC | | | 1,574 | | | | 103,453 | |
| Ryanair Holdings PLC (ADR)* (a) | | | 2,796 | | | | 156,017 | |
| Shire PLC | | | 7,700 | | | | 602,225 | |
| (Cost $961,550) | | | | 1,381,743 | |
| Italy 1.9% | |
| Prysmian SpA | | | 4,738 | | | | 107,048 | |
| Sorin SpA* | | | 100,000 | | | | 293,578 | |
| Unipol Gruppo Finanziario SpA | | | 108,000 | | | | 610,467 | |
| (Cost $782,484) | | | | 1,011,093 | |
| Japan 1.5% | |
| Ai Holdings Corp. | | | 5,242 | | | | 95,365 | |
| Avex Group Holdings, Inc. | | | 5,967 | | | | 105,139 | |
| Kusuri No Aoki Co., Ltd. | | | 3,880 | | | | 140,562 | |
| MISUMI Group, Inc. | | | 2,238 | | | | 61,570 | |
| Nippon Seiki Co., Ltd. | | | 7,919 | | | | 152,978 | |
| United Arrows Ltd. | | | 2,032 | | | | 81,938 | |
| Universal Entertainment Corp. | | | 4,911 | | | | 87,114 | |
| UT Holdings Co., Ltd. | | | 10,080 | | | | 62,984 | |
| (Cost $776,014) | | | | 787,650 | |
| Luxembourg 1.0% | |
| Eurofins Scientific (a) (Cost $394,249) | | | 1,700 | | | | 522,826 | |
| Malaysia 0.8% | |
| Hartalega Holdings Bhd. | | | 59,558 | | | | 115,184 | |
| IHH Healthcare Bhd. | | | 150,000 | | | | 204,609 | |
| Tune Ins Holdings Bhd. | | | 110,328 | | | | 77,996 | |
| (Cost $381,743) | | | | 397,789 | |
| Netherlands 2.7% | |
| Brunel International NV | | | 4,058 | | | | 118,440 | |
| Chicago Bridge & Iron Co. NV (b) | | | 1,016 | | | | 69,291 | |
| Constellium NV "A"* (b) | | | 5,856 | | | | 187,743 | |
| ING Groep NV (CVA)* | | | 36,000 | | | | 505,765 | |
| SBM Offshore NV* | | | 7,196 | | | | 116,123 | |
| Yandex NV "A"* (b) | | | 12,000 | | | | 427,680 | |
| (Cost $1,242,047) | | | | 1,425,042 | |
| Norway 1.8% | |
| DNO ASA* | | | 105,000 | | | | 403,817 | |
| Norsk Hydro ASA | | | 95,000 | | | | 508,465 | |
| (Cost $621,064) | | | | 912,282 | |
| Panama 0.2% | |
| Banco Latinoamericano de Comercio Exterior SA "E" (Cost $96,167) | | | 4,277 | | | | 126,899 | |
| Philippines 1.6% | |
| Alliance Global Group, Inc. | | | 181,474 | | | | 120,982 | |
| Century Properties Group, Inc. | | | 143,180 | | | | 4,461 | |
| House of Investments, Inc. | | | 6,983 | | | | 960 | |
| Metropolitan Bank & Trust Co. | | | 350,000 | | | | 700,802 | |
| (Cost $880,612) | | | | 827,205 | |
| | | Shares | | | Value ($) | |
| | | | | | | | | |
| Singapore 0.4% | |
| Lian Beng Group Ltd. | | | 262,007 | | | | 146,038 | |
| UE E&C Ltd. | | | 66,923 | | | | 63,869 | |
| (Cost $160,580) | | | | 209,907 | |
| Spain 0.9% | |
| Mediaset Espana Communication SA* (Cost $478,060) | | | 41,000 | | | | 478,212 | |
| Sweden 4.0% | |
| Assa Abloy AB "B" | | | 5,000 | | | | 254,432 | |
| Atlas Copco AB "A" | | | 20,000 | | | | 578,010 | |
| Svenska Cellulosa AB "B" | | | 23,000 | | | | 599,307 | |
| Swedish Match AB | | | 18,500 | | | | 642,366 | |
| (Cost $2,021,471) | | | | 2,074,115 | |
| Switzerland 2.7% | |
| Dufry AG (Registered)* | | | 679 | | | | 123,427 | |
| Nestle SA (Registered) | | | 9,200 | | | | 712,720 | |
| Novartis AG (Registered) | | | 2,700 | | | | 244,486 | |
| Swatch Group AG (Bearer) | | | 500 | | | | 301,928 | |
| (Cost $1,279,311) | | | | 1,382,561 | |
| Taiwan 0.1% | |
| Kinpo Electronics, Inc. (Cost $58,427) | | | 145,443 | | | | 67,953 | |
| Thailand 0.1% | |
| Malee Sampran PCL (Foreign Registered) (Cost $82,517) | | | 47,499 | | | | 65,493 | |
| United Kingdom 9.8% | |
| Aberdeen Asset Management PLC | | | 54,000 | | | | 419,474 | |
| Anglo American PLC | | | 26,500 | | | | 648,535 | |
| Arrow Global Group PLC* | | | 25,631 | | | | 100,889 | |
| Aveva Group PLC | | | 13,000 | | | | 453,418 | |
| Babcock International Group PLC | | | 8,246 | | | | 163,984 | |
| British American Tobacco PLC | | | 8,500 | | | | 505,941 | |
| Clinigen Healthcare Ltd. | | | 7,944 | | | | 51,357 | |
| Crest Nicholson Holdings PLC | | | 19,578 | | | | 115,528 | |
| Domino's Pizza Group PLC | | | 9,411 | | | | 84,395 | |
| Halma PLC | | | 22,000 | | | | 221,952 | |
| Hargreaves Lansdown PLC | | | 5,254 | | | | 111,317 | |
| HellermannTyton Group PLC | | | 16,957 | | | | 90,369 | |
| Howden Joinery Group PLC | | | 15,355 | | | | 81,358 | |
| IG Group Holdings PLC | | | 8,745 | | | | 87,927 | |
| IMI PLC | | | 14,000 | | | | 356,279 | |
| Intertek Group PLC | | | 9,000 | | | | 423,418 | |
| Jardine Lloyd Thompson Group PLC | | | 4,191 | | | | 74,594 | |
| John Wood Group PLC | | | 7,650 | | | | 105,589 | |
| Monitise PLC* | | | 59,456 | | | | 52,657 | |
| Polypipe Group PLC* | | | 21,583 | | | | 92,343 | |
| Reckitt Benckiser Group PLC | | | 5,000 | | | | 436,407 | |
| Rolls-Royce Holdings PLC* | | | 12,000 | | | | 219,538 | |
| Rotork PLC | | | 2,254 | | | | 102,995 | |
| Spirax-Sarco Engineering PLC | | | 2,518 | | | | 117,773 | |
| (Cost $4,946,668) | | | | 5,118,037 | |
| United States 46.8% | |
| Advance Auto Parts, Inc. | | | 945 | | | | 127,499 | |
| Affiliated Managers Group, Inc.* | | | 573 | | | | 117,694 | |
| Agilent Technologies, Inc. | | | 5,000 | | | | 287,200 | |
| Alliance Data Systems Corp.* (a) | | | 3,200 | | | | 900,000 | |
| Altra Industrial Motion Corp. (a) | | | 2,692 | | | | 97,962 | |
| Amgen, Inc. | | | 5,000 | | | | 591,850 | |
| | | Shares | | | Value ($) | |
| | | | | | | | | |
| Amphenol Corp. "A" (a) | | | 9,500 | | | | 915,230 | |
| BE Aerospace, Inc.* | | | 1,162 | | | | 107,473 | |
| Biogen Idec, Inc.* | | | 600 | | | | 189,186 | |
| BorgWarner, Inc. | | | 1,707 | | | | 111,279 | |
| Bristol-Myers Squibb Co. | | | 10,000 | | | | 485,100 | |
| Cardtronics, Inc.* (a) | | | 2,673 | | | | 91,096 | |
| CBRE Group, Inc. "A"* | | | 14,000 | | | | 448,560 | |
| Cerner Corp.* (a) | | | 10,000 | | | | 515,800 | |
| Colfax Corp.* (a) | | | 10,700 | | | | 797,578 | |
| Danaher Corp. | | | 6,700 | | | | 527,491 | |
| DIRECTV* | | | 7,500 | | | | 637,575 | |
| Discovery Communications, Inc. "A"* | | | 7,500 | | | | 557,100 | |
| Dresser-Rand Group, Inc.* | | | 1,442 | | | | 91,899 | |
| Dril-Quip, Inc.* | | | 900 | | | | 98,316 | |
| Eaton Corp. PLC (a) | | | 8,500 | | | | 656,030 | |
| Ecolab, Inc. | | | 5,200 | | | | 578,968 | |
| Encore Capital Group, Inc.* (a) | | | 2,592 | | | | 117,729 | |
| Express Scripts Holding Co.* (a) | | | 10,000 | | | | 693,300 | |
| Exxon Mobil Corp. | | | 6,000 | | | | 604,080 | |
| Fox Factory Holding Corp.* (a) | | | 5,575 | | | | 98,064 | |
| Gentherm, Inc.* | | | 1,298 | | | | 57,696 | |
| Google, Inc. "A"* | | | 400 | | | | 233,868 | |
| Google, Inc. "C"* | | | 400 | | | | 230,112 | |
| Hain Celestial Group, Inc.* (a) | | | 929 | | | | 82,439 | |
| HeartWare International, Inc.* (a) | | | 853 | | | | 75,490 | |
| Jack in the Box, Inc. | | | 1,368 | | | | 81,861 | |
| JPMorgan Chase & Co. | | | 13,000 | | | | 749,060 | |
| Kansas City Southern | | | 3,200 | | | | 344,032 | |
| Kindred Healthcare, Inc. | | | 4,237 | | | | 97,875 | |
| L Brands, Inc. | | | 7,500 | | | | 439,950 | |
| Las Vegas Sands Corp. | | | 9,000 | | | | 685,980 | |
| Manitowoc Co., Inc. (a) | | | 3,394 | | | | 111,527 | |
| MasterCard, Inc. "A" | | | 12,500 | | | | 918,375 | |
| McDonald's Corp. | | | 5,000 | | | | 503,700 | |
| Middleby Corp.* (a) | | | 1,473 | | | | 121,847 | |
| Molina Healthcare, Inc.* (a) | | | 2,183 | | | | 97,427 | |
| Monster Beverage Corp.* | | | 8,000 | | | | 568,240 | |
| National Oilwell Varco, Inc. (a) | | | 5,700 | | | | 469,395 | |
| Noble Energy, Inc. (a) | | | 11,500 | | | | 890,790 | |
| NOW, Inc.* | | | 1,670 | | | | 60,471 | |
| Oaktree Capital Group LLC | | | 2,438 | | | | 121,876 | |
| Oasis Petroleum, Inc.* (a) | | | 1,968 | | | | 109,992 | |
| Ocwen Financial Corp.* (a) | | | 2,829 | | | | 104,956 | |
| Oil States International, Inc.* | | | 980 | | | | 62,808 | |
| Pacira Pharmaceuticals, Inc.* (a) | | | 696 | | | | 63,935 | |
| Pall Corp. | | | 8,100 | | | | 691,659 | |
| Polaris Industries, Inc. (a) | | | 816 | | | | 106,276 | |
| Praxair, Inc. (a) | | | 7,000 | | | | 929,880 | |
| Primoris Services Corp. | | | 1,822 | | | | 52,546 | |
| Providence Service Corp.* | | | 753 | | | | 27,552 | |
| PTC, Inc.* | | | 2,057 | | | | 79,812 | |
| ResMed, Inc. (a) | | | 9,000 | | | | 455,670 | |
| Retrophin, Inc.* | | | 4,363 | | | | 51,222 | |
| Roadrunner Transportation Systems, Inc.* (a) | | | 3,718 | | | | 104,476 | |
| Schlumberger Ltd. (a) | | | 5,500 | | | | 648,725 | |
| Sinclair Broadcast Group, Inc. "A" (a) | | | 3,152 | | | | 109,532 | |
| Synta Pharmaceuticals Corp.* | | | 8,416 | | | | 34,421 | |
| Tenneco, Inc.* | | | 1,972 | | | | 129,560 | |
| The Bancorp., Inc.* (a) | | | 3,261 | | | | 38,839 | |
| The Travelers Companies, Inc. (a) | | | 6,800 | | | | 639,676 | |
| Thermon Group Holdings, Inc.* | | | 3,340 | | | | 87,909 | |
| Thoratec Corp.* | | | 3,300 | | | | 115,038 | |
| | | Shares | | | Value ($) | |
| | | | | | | | | |
| TIBCO Software, Inc.* | | | 3,208 | | | | 64,705 | |
| TiVo, Inc.* | | | 5,065 | | | | 65,389 | |
| TriNet Group, Inc.* | | | 2,617 | | | | 62,991 | |
| Tristate Capital Holdings, Inc.* | | | 6,208 | | | | 87,719 | |
| United Rentals, Inc.* | | | 1,586 | | | | 166,102 | |
| United Technologies Corp. | | | 5,300 | | | | 611,885 | |
| Urban Outfitters, Inc.* (a) | | | 3,108 | | | | 105,237 | |
| VeriFone Systems, Inc.* | | | 3,409 | | | | 125,281 | |
| W.R. Grace & Co.* | | | 2,500 | | | | 236,325 | |
| WABCO Holdings, Inc.* | | | 1,270 | | | | 135,661 | |
| Waddell & Reed Financial, Inc. "A" | | | 2,376 | | | | 148,714 | |
| Western Digital Corp. | | | 2,503 | | | | 231,027 | |
| Yelp, Inc.* (a) | | | 2,700 | | | | 207,036 | |
| Zoe's Kitchen, Inc.* | | | 1,635 | | | | 56,211 | |
| (Cost $20,372,209) | | | | 24,334,837 | |
Total Common Stocks (Cost $43,652,599) | | | | 50,114,475 | |
| | | Shares | | | Value ($) | |
| | | | | | | | | |
| Participatory Note 0.4% | |
| Nigeria | |
| Zenith Bank PLC (issuer Merrill Lynch International), Expiration Date 8/21/2015 (Cost $195,000) | | | 1,500,000 | | | | 230,592 | |
| | |
| Securities Lending Collateral 20.3% | |
| Daily Assets Fund Institutional, 0.08% (c) (d) (Cost $10,578,615) | | | 10,578,615 | | | | 10,578,615 | |
| | |
| Cash Equivalents 3.5% | |
| Central Cash Management Fund, 0.06% (c) (Cost $1,796,885) | | | 1,796,885 | | | | 1,796,885 | |
| | | % of Net Assets | | | Value ($) | |
| | | | |
Total Investment Portfolio (Cost $56,223,099)† | | | 120.5 | | | | 62,720,567 | |
| Other Assets and Liabilities, Net | | | (20.5 | ) | | | (10,664,254 | ) |
| Net Assets | | | 100.0 | | | | 52,056,313 | |
* Non-income producing security.
† The cost for federal income tax purposes was $56,334,198. At June 30, 2014, net unrealized appreciation for all securities based on tax cost was $6,386,369. This consisted of aggregate gross unrealized appreciation for all securities in which there was an excess of value over tax cost of $7,395,225 and aggregate gross unrealized depreciation for all securities in which there was an excess of tax cost over value of $1,008,856.
(a) All or a portion of these securities were on loan. In addition, "Other Assets and Liabilities, Net" may include pending sales that are also on loan. The value of securities loaned at June 30, 2014 amounted to $10,243,981, which is 19.7% of net assets.
(b) Listed on the New York Stock Exchange.
(c) Affiliated fund managed by Deutsche Investment Management Americas Inc. The rate shown is the annualized seven-day yield at period end.
(d) Represents collateral held in connection with securities lending. Income earned by the Fund is net of borrower rebates.
ADR: American Depositary Receipt
CVA: Certificaten Van Aandelen (Certificate of Stock)
Fair Value Measurements
Various inputs are used in determining the value of the Fund's investments. These inputs are summarized in three broad levels. Level 1 includes quoted prices in active markets for identical securities. Level 2 includes other significant observable inputs (including quoted prices for similar securities, interest rates, prepayment speeds and credit risk). Level 3 includes significant unobservable inputs (including the Fund's own assumptions in determining the fair value of investments). The level assigned to the securities valuations may not be an indication of the risk or liquidity associated with investing in those securities.
The following is a summary of the inputs used as of June 30, 2014 in valuing the Fund's investments. For information on the Fund's policy regarding the valuation of investments, please refer to the Security Valuation section of Note A in the accompanying Notes to Financial Statements.
| Assets | | Level 1 | | | Level 2 | | | Level 3 | | | Total | |
| | |
| Common Stocks | |
| Belgium | | $ | — | | | $ | 1,056,935 | | | $ | — | | | $ | 1,056,935 | |
| Bermuda | | | 130,498 | | | | — | | | | — | | | | 130,498 | |
| Brazil | | | 399,185 | | | | — | | | | — | | | | 399,185 | |
| Canada | | | 2,727,277 | | | | — | | | | — | | | | 2,727,277 | |
| China | | | — | | | | 127,969 | | | | — | | | | 127,969 | |
| Cyprus | | | — | | | | 106,919 | | | | — | | | | 106,919 | |
| Denmark | | | — | | | | 424,908 | | | | — | | | | 424,908 | |
| Finland | | | — | | | | 510,177 | | | | — | | | | 510,177 | |
| France | | | — | | | | 552,403 | | | | — | | | | 552,403 | |
| Germany | | | — | | | | 1,772,680 | | | | — | | | | 1,772,680 | |
| Hong Kong | | | — | | | | 669,378 | | | | — | | | | 669,378 | |
| Indonesia | | | — | | | | 512,502 | | | | — | | | | 512,502 | |
| Ireland | | | 600,637 | | | | 781,106 | | | | — | | | | 1,381,743 | |
| Italy | | | — | | | | 1,011,093 | | | | — | | | | 1,011,093 | |
| Japan | | | — | | | | 787,650 | | | | — | | | | 787,650 | |
| Luxembourg | | | — | | | | 522,826 | | | | — | | | | 522,826 | |
| Malaysia | | | — | | | | 397,789 | | | | — | | | | 397,789 | |
| Netherlands | | | 684,714 | | | | 740,328 | | | | — | | | | 1,425,042 | |
| Norway | | | — | | | | 912,282 | | | | — | | | | 912,282 | |
| Panama | | | 126,899 | | | | — | | | | — | | | | 126,899 | |
| Philippines | | | — | | | | 827,205 | | | | — | | | | 827,205 | |
| Singapore | | | — | | | | 209,907 | | | | — | | | | 209,907 | |
| Spain | | | — | | | | 478,212 | | | | — | | | | 478,212 | |
| Sweden | | | — | | | | 2,074,115 | | | | — | | | | 2,074,115 | |
| Switzerland | | | — | | | | 1,382,561 | | | | — | | | | 1,382,561 | |
| Taiwan | | | — | | | | 67,953 | | | | — | | | | 67,953 | |
| Thailand | | | — | | | | 65,493 | | | | — | | | | 65,493 | |
| United Kingdom | | | — | | | | 5,118,037 | | | | — | | | | 5,118,037 | |
| United States | | | 24,334,837 | | | | — | | | | — | | | | 24,334,837 | |
| Participatory Notes (e) | | | — | | | | 230,592 | | | | — | | | | 230,592 | |
| Short-Term Investments (e) | | | 12,375,500 | | | | — | | | | — | | | | 12,375,500 | |
| Total | | $ | 41,379,547 | | | $ | 21,341,020 | | | $ | — | | | $ | 62,720,567 | |
There have been no transfers between fair value measurement levels during the period ended June 30, 2014.
(e) See Investment Portfolio for additional detailed categorizations.
The accompanying notes are an integral part of the financial statements.
Statement of Assets and Liabilities | as of June 30, 2014 (Unaudited) | |
| Assets | |
Investments: Investments in non-affiliated securities, at value (cost $43,847,599) — including $10,243,981 of securities loaned | | $ | 50,345,067 | |
| Investment in Daily Assets Fund Institutional (cost $10,578,615)* | | | 10,578,615 | |
| Investment in Central Cash Management Fund (cost $1,796,885) | | | 1,796,885 | |
| Total investments in securities, at value (cost $56,223,099) | | | 62,720,567 | |
| Cash | | | 52,217 | |
| Foreign currency, at value (cost $340,311) | | | 338,840 | |
| Receivable for investments sold | | | 724,431 | |
| Receivable for Fund shares sold | | | 8,620 | |
| Dividends receivable | | | 51,219 | |
| Interest receivable | | | 4,229 | |
| Foreign taxes recoverable | | | 36,396 | |
| Other assets | | | 766 | |
| Total assets | | | 63,937,285 | |
| Liabilities | |
| Payable upon return of securities loaned | | | 10,578,615 | |
| Payable for investments purchased | | | 1,051,815 | |
| Payable for Fund shares redeemed | | | 166,810 | |
| Accrued management fees | | | 13,390 | |
| Other accrued expenses and payables | | | 70,342 | |
| Total liabilities | | | 11,880,972 | |
| Net assets, at value | | | 52,056,313 | |
| Net Assets Consist of | |
| Undistributed net investment income | | | 266,782 | |
Net unrealized appreciation (depreciation) on: Investments | | | 6,497,468 | |
| Foreign currency | | | (716 | ) |
| Accumulated net realized gain (loss) | | | (42,549,845 | ) |
| Paid-in capital | | | 87,842,624 | |
| Net assets, at value | | | 52,056,313 | |
Class A Net Asset Value, offering and redemption price per share ($51,942,977 ÷ 4,505,150 outstanding shares of beneficial interest, no par value, unlimited number of shares authorized) | | $ | 11.53 | |
Class B Net Asset Value, offering and redemption price per share ($113,336 ÷ 9,801 outstanding shares of beneficial interest, no par value, unlimited number of shares authorized) | | $ | 11.56 | |
* Represents collateral on securities loaned.
The accompanying notes are an integral part of the financial statements.
Statement of Operations
| for the six months ended June 30, 2014 (Unaudited) | |
| Investment Income | |
Income: Dividends (net of foreign taxes withheld of $46,535) | | $ | 510,230 | |
| Income distributions — Central Cash Management Fund | | | 427 | |
| Securities lending income, including income from Daily Assets Fund Institutional, net of borrower rebates | | | 15,077 | |
| Total income | | | 525,734 | |
Expenses: Management fee | | | 239,018 | |
| Administration fee | | | 26,122 | |
| Services to shareholders | | | 735 | |
| Record keeping fees (Class B) | | | 817 | |
| Distribution service fee (Class B) | | | 2,110 | |
| Custodian fee | | | 35,776 | |
| Professional fees | | | 37,702 | |
| Reports to shareholders | | | 14,521 | |
| Trustees' fees and expenses | | | 2,087 | |
| Other | | | 15,896 | |
| Total expenses before expense reductions | | | 374,784 | |
| Expense reductions | | | (162,853 | ) |
| Total expenses after expense reductions | | | 211,931 | |
| Net investment income (loss) | | | 313,803 | |
| Realized and Unrealized Gain (Loss) | |
Net realized gain (loss) from: Investments | | | 1,723,280 | |
| Foreign currency | | | (3,636 | ) |
| | | | 1,719,644 | |
Change in net unrealized appreciation (depreciation) on: Investments | | | 284,834 | |
| Foreign currency | | | 1,945 | |
| | | | 286,779 | |
| Net gain (loss) | | | 2,006,423 | |
| Net increase (decrease) in net assets resulting from operations | | $ | 2,320,226 | |
The accompanying notes are an integral part of the financial statements.
Statement of Changes in Net Assets | Increase (Decrease) in Net Assets | | Six Months Ended June 30, 2014 (Unaudited) | | | Years Ended December 31, 2013 | |
Operations: Net investment income (loss) | | $ | 313,803 | | | $ | 518,403 | |
Operations: Net investment income (loss) | | $ | 313,803 | | | $ | 518,403 | |
| Net realized gain (loss) | | | 1,719,644 | | | | 9,003,948 | |
| Change in net unrealized appreciation (depreciation) | | | 286,779 | | | | 1,089,980 | |
| Net increase (decrease) in net assets resulting from operations | | | 2,320,226 | | | | 10,612,331 | |
Distributions to shareholders from: Net investment income: Class A | | | (509,707 | ) | | | (689,482 | ) |
| Class B | | | (15,999 | ) | | | (27,740 | ) |
| Total distributions | | | (525,706 | ) | | | (717,222 | ) |
Fund share transactions: Class A Proceeds from shares sold | | | 2,061,203 | | | | 4,242,450 | |
| Reinvestment of distributions | | | 509,707 | | | | 689,482 | |
| Payments for shares redeemed | | | (3,649,897 | ) | | | (16,663,817 | ) |
| Net increase (decrease) in net assets from Class A share transactions | | | (1,078,987 | ) | | | (11,731,885 | ) |
Class B Proceeds from shares sold | | | 26,121 | | | | 147,425 | |
| Reinvestment of distributions | | | 15,999 | | | | 27,740 | |
| Payments for shares redeemed | | | (2,655,611 | ) | | | (823,023 | ) |
| Net increase (decrease) in net assets from Class B share transactions | | | (2,613,491 | ) | | | (647,858 | ) |
| Increase (decrease) in net assets | | | (1,897,958 | ) | | | (2,484,634 | ) |
| Net assets at beginning of period | | | 53,954,271 | | | | 56,438,905 | |
Net assets at end of period (including undistributed net investment income of $266,782 and $478,685, respectively) | | $ | 52,056,313 | | | $ | 53,954,271 | |
| Other Information | |
Class A Shares outstanding at beginning of period | | | 4,601,327 | | | | 5,793,732 | |
| Shares sold | | | 184,507 | | | | 422,826 | |
| Shares issued to shareholders in reinvestment of distributions | | | 46,464 | | | | 71,746 | |
| Shares redeemed | | | (327,148 | ) | | | (1,686,977 | ) |
| Net increase (decrease) in Class A shares | | | (96,177 | ) | | | (1,192,405 | ) |
| Shares outstanding at end of period | | | 4,505,150 | | | | 4,601,327 | |
Class B Shares outstanding at beginning of period | | | 246,555 | | | | 311,300 | |
| Shares sold | | | 2,394 | | | | 14,554 | |
| Shares issued to shareholders in reinvestment of distributions | | | 1,453 | | | | 2,878 | |
| Shares redeemed | | | (240,601 | ) | | | (82,177 | ) |
| Net increase (decrease) in Class B shares | | | (236,754 | ) | | | (64,745 | ) |
| Shares outstanding at end of period | | | 9,801 | | | | 246,555 | |
The accompanying notes are an integral part of the financial statements.
| | | | | | Years Ended December 31, | |
| Class A | | Six Months Ended 6/30/14 (Unaudited) | | | 2013 | | | 2012 | | | 2011 | | | 2010 | | | 2009 | |
| Selected Per Share Data | |
| Net asset value, beginning of period | | $ | 11.13 | | | $ | 9.24 | | | $ | 7.90 | | | $ | 9.28 | | | $ | 8.24 | | | $ | 5.84 | |
Income (loss) from investment operations: Net investment incomea | | | .07 | | | | .10 | | | | .12 | | | | .11 | | | | .06 | | | | .08 | |
| Net realized and unrealized gain (loss) | | | .44 | | | | 1.92 | | | | 1.34 | | | | (1.43 | ) | | | 1.06 | | | | 2.42 | |
| Total from investment operations | | | .51 | | | | 2.02 | | | | 1.46 | | | | (1.32 | ) | | | 1.12 | | | | 2.50 | |
Less distributions from: Net investment income | | | (.11 | ) | | | (.13 | ) | | | (.12 | ) | | | (.06 | ) | | | (.08 | ) | | | (.10 | ) |
| Total distributions | | | (.11 | ) | | | (.13 | ) | | | (.12 | ) | | | (.06 | ) | | | (.08 | ) | | | (.10 | ) |
| Net asset value, end of period | | $ | 11.53 | | | $ | 11.13 | | | $ | 9.24 | | | $ | 7.90 | | | $ | 9.28 | | | $ | 8.24 | |
Total Return (%)b | | | 4.65 | ** | | | 22.08 | | | | 18.60 | | | | (14.39 | ) | | | 13.65 | | | | 43.82 | |
| Ratios to Average Net Assets and Supplemental Data | |
| Net assets, end of period ($ millions) | | | 52 | | | | 51 | | | | 54 | | | | 49 | | | | 68 | | | | 66 | |
| Ratio of expenses before expense reductions (%) | | | 1.42 | * | | | 1.45 | | | | 1.42 | | | | 1.37 | | | | 1.41 | | | | 1.38 | |
| Ratio of expenses after expense reductions (%) | | | .80 | * | | | .88 | | | | .99 | | | | 1.03 | | | | 1.05 | | | | 1.04 | |
| Ratio of net investment income (%) | | | 1.24 | * | | | 1.00 | | | | 1.40 | | | | 1.24 | | | | .77 | | | | 1.23 | |
| Portfolio turnover rate (%) | | | 31 | ** | | | 171 | | | | 107 | | | | 127 | | | | 165 | | | | 190 | |
a Based on average shares outstanding during the period. b Total return would have been lower had certain expenses not been reduced. * Annualized ** Not annualized | |
| | | | | | Years Ended December 31, | |
| Class B | | Six Months Ended 6/30/14 (Unaudited) | | | 2013 | | | 2012 | | | 2011 | | | 2010 | | | 2009 | |
| Selected Per Share Data | |
| Net asset value, beginning of period | | $ | 11.14 | | | $ | 9.25 | | | $ | 7.91 | | | $ | 9.29 | | | $ | 8.25 | | | $ | 5.85 | |
Income (loss) from investment operations: Net investment incomea | | | .01 | | | | .07 | | | | .09 | | | | .08 | | | | .04 | | | | .06 | |
| Net realized and unrealized gain (loss) | | | .48 | | | | 1.92 | | | | 1.34 | | | | (1.44 | ) | | | 1.05 | | | | 2.42 | |
| Total from investment operations | | | .49 | | | | 1.99 | | | | 1.43 | | | | (1.36 | ) | | | 1.09 | | | | 2.48 | |
Less distributions from: Net investment income | | | (.07 | ) | | | (.10 | ) | | | (.09 | ) | | | (.02 | ) | | | (.05 | ) | | | (.08 | ) |
| Total distributions | | | (.07 | ) | | | (.10 | ) | | | (.09 | ) | | | (.02 | ) | | | (.05 | ) | | | (.08 | ) |
| Net asset value, end of period | | $ | 11.56 | | | $ | 11.14 | | | $ | 9.25 | | | $ | 7.91 | | | $ | 9.29 | | | $ | 8.25 | |
Total Return (%)b | | | 4.55 | ** | | | 21.62 | | | | 18.16 | | | | (14.67 | ) | | | 13.24 | | | | 43.23 | |
| Ratios to Average Net Assets and Supplemental Data | |
| Net assets, end of period ($ millions) | | | .1 | | | | 3 | | | | 3 | | | | 3 | | | | 5 | | | | 5 | |
| Ratio of expenses before expense reductions (%) | | | 1.77 | * | | | 1.81 | | | | 1.76 | | | | 1.72 | | | | 1.76 | | | | 1.73 | |
| Ratio of expenses after expense reductions (%) | | | 1.15 | * | | | 1.23 | | | | 1.34 | | | | 1.38 | | | | 1.40 | | | | 1.39 | |
| Ratio of net investment income (%) | | | .16 | * | | | .66 | | | | 1.04 | | | | .88 | | | | .42 | | | | .88 | |
| Portfolio turnover rate (%) | | | 31 | ** | | | 171 | | | | 107 | | | | 127 | | | | 165 | | | | 190 | |
a Based on average shares outstanding during the period. b Total return would have been lower had certain expenses not been reduced. * Annualized ** Not annualized | |
Notes to Financial Statements (Unaudited)
A. Organization and Significant Accounting Policies
Deutsche Global Growth VIP (formerly DWS Global Growth VIP) (the "Fund") is a diversified series of Deutsche Variable Series II (formerly DWS Variable Series II) (the "Trust"), which is registered under the Investment Company Act of 1940, as amended (the "1940 Act"), as an open-end management investment company organized as a Massachusetts business trust.
Multiple Classes of Shares of Beneficial Interest. The Fund offers two classes of shares (Class A shares and Class B shares). Sales of Class B shares are subject to recordkeeping fees up to 0.15% and Rule 12b-1 fees under the 1940 Act equal to an annual rate of 0.25% of the average daily net assets for Class B shares of the Fund. Class A shares are not subject to such fees.
Investment income, realized and unrealized gains and losses, and certain fund-level expenses and expense reductions, if any, are borne pro rata on the basis of relative net assets by the holders of all classes of shares except that each class bears certain expenses unique to that class (including the applicable Rule 12b-1 fee and recordkeeping fees). Differences in class-level expenses may result in payment of different per share dividends by class. All shares have equal rights with respect to voting subject to class-specific arrangements.
The Fund's financial statements are prepared in accordance with accounting principles generally accepted in the United States of America which require the use of management estimates. Actual results could differ from those estimates. The policies described below are followed consistently by the Fund in the preparation of its financial statements.
Security Valuation. Investments are stated at value determined as of the close of regular trading on the New York Stock Exchange on each day the exchange is open for trading.
Various inputs are used in determining the value of the Fund's investments. These inputs are summarized in three broad levels. Level 1 includes quoted prices in active markets for identical securities. Level 2 includes other significant observable inputs (including quoted prices for similar securities, interest rates, prepayment speeds and credit risk). Level 3 includes significant unobservable inputs (including the Fund's own assumptions in determining the fair value of investments). The level assigned to the securities valuations may not be an indication of the risk or liquidity associated with investing in those securities.
Equity securities are valued at the most recent sale price or official closing price reported on the exchange (U.S. or foreign) or over-the-counter market on which they trade. Securities for which no sales are reported are valued at the calculated mean between the most recent bid and asked quotations on the relevant market or, if a mean cannot be determined, at the most recent bid quotation. Equity securities are generally categorized as Level 1. For certain international equity securities, in order to adjust for events which may occur between the close of the foreign exchanges and the close of the New York Stock Exchange, a fair valuation model may be used. This fair valuation model takes into account comparisons to the valuation of American Depository Receipts (ADRs), exchange-traded funds, futures contracts and certain indices and these securities are categorized as Level 2.
Investments in open-end investment companies are valued at their net asset value each business day and are categorized as Level 1.
Securities and other assets for which market quotations are not readily available or for which the above valuation procedures are deemed not to reflect fair value are valued in a manner that is intended to reflect their fair value as determined in accordance with procedures approved by the Board and are generally categorized as Level 3. In accordance with the Fund's valuation procedures, factors considered in determining value may include, but are not limited to, the type of the security; the size of the holding; the initial cost of the security; the existence of any contractual restrictions on the security's disposition; the price and extent of public trading in similar securities of the issuer or of comparable companies; quotations or evaluated prices from broker-dealers and/or pricing services; information obtained from the issuer, analysts, and/or the appropriate stock exchange (for exchange-traded securities); an analysis of the company's or issuer's financial statements; an evaluation of the forces that influence the issuer and the market(s) in which the security is purchased and sold; and with respect to debt securities, the maturity, coupon, creditworthiness, currency denomination and the movement of the market in which the security is normally traded. The value determined under these procedures may differ from published values for the same securities.
Disclosure about the classification of fair value measurements is included in a table following the Fund's Investment Portfolio.
Foreign Currency Translations. The books and records of the Fund are maintained in U.S. dollars. Investment securities and other assets and liabilities denominated in a foreign currency are translated into U.S. dollars at the prevailing exchange rates at period end. Purchases and sales of investment securities, income and expenses are translated into U.S. dollars at the prevailing exchange rates on the respective dates of the transactions.
Net realized and unrealized gains and losses on foreign currency transactions represent net gains and losses between trade and settlement dates on securities transactions, the acquisition and disposition of foreign currencies, and the difference between the amount of net investment income accrued and the U.S. dollar amount actually received. That portion of both realized and unrealized gains and losses on investments that results from fluctuations in foreign currency exchange rates is not separately disclosed but is included with net realized and unrealized gain/appreciation and loss/depreciation on investments.
Securities Lending. Brown Brothers Harriman & Co., as lending agent, lends securities of the Fund to certain financial institutions under the terms of the Security Lending Agreement. The Fund retains the benefits of owning the securities it has loaned and continues to receive interest and dividends generated by the securities and to participate in any changes in their market value. The Fund requires the borrowers of the securities to maintain collateral with the Fund consisting of either cash or liquid, unencumbered assets having a value at least equal to the value of the securities loaned. When the collateral falls below specified amounts, the lending agent will use its best effort to obtain additional collateral on the next business day to meet required amounts under the security lending agreement. The Fund may invest the cash collateral into a joint trading account in an affiliated money market fund pursuant to Exemptive Orders issued by the SEC. The Fund receives compensation for lending its securities either in the form of fees or by earning interest on invested cash collateral net of borrower rebates and fees paid to a lending agent. Either the Fund or the borrower may terminate the loan. There may be risks of delay and costs in recovery of securities or even loss of rights in the collateral should the borrower of the securities fail financially. If the Fund is not able to recover securities lent, the Fund may sell the collateral and purchase a replacement investment in the market, incurring the risk that the value of the replacement security is greater than the value of the collateral. The Fund is also subject to all investment risks associated with the reinvestment of any cash collateral received, including, but not limited to, interest rate, credit and liquidity risk associated with such investments.
As of June 30, 2014, the Fund had securities on loan. The value of the related collateral exceeded the value of the securities loaned at period end.
Participatory Notes. The Fund invests in Participatory Notes (P-Notes). P-Notes are promissory notes designed to offer a return linked to the performance of a particular underlying equity security or market. P-Notes are issued by banks or broker-dealers and allow the Fund to gain exposure to local shares in foreign markets. Investments in P-Notes involve the same risks associated with a direct investment in the underlying foreign companies or foreign markets that they seek to replicate. Although each participation note is structured with a defined maturity date, early redemption may be possible. Risks associated with participation notes include the possible failure of a counterparty to perform in accordance with the terms of the agreement and potential delays or an inability to redeem before maturity under certain market conditions.
Taxes. The Fund's policy is to comply with the requirements of the Internal Revenue Code, as amended, which are applicable to regulated investment companies and to distribute all of its taxable income to its shareholders.
Additionally, the Fund may be subject to taxes imposed by the governments of countries in which it invests and are generally based on income and/or capital gains earned or repatriated. Estimated tax liabilities on certain foreign securities are recorded on an accrual basis and are reflected as components of interest income or net change in unrealized gain/loss on investments. Tax liabilities realized as a result of security sales are reflected as a component of net realized gain/loss on investments.
Under the Regulated Investment Company Modernization Act of 2010, net capital losses incurred post-enactment may be carried forward indefinitely, and their character is retained as short-term and/or long-term. Previously, net capital losses were carried forward for eight years and treated as short-term. As a transition rule, the Act requires that post-enactment net capital losses be used before pre-enactment net capital losses.
At December 31, 2013, the Fund had a net tax basis capital loss carryforward of approximately $44,211,000 of pre-enactment losses, which may be applied against any realized net taxable capital gains of each succeeding year until fully utilized or until December 31, 2016 ($26,421,000) and December 31, 2017 ($17,790,000), the respective expiration dates, whichever occurs first.
The Fund has reviewed the tax positions for the open tax years as of December 31, 2013 and has determined that no provision for income tax and/or uncertain tax provisions is required in the Fund's financial statements. The Fund's federal tax returns for the prior three fiscal years remain open subject to examination by the Internal Revenue Service.
Distribution of Income and Gains. Distributions from net investment income of the Fund, if any, are declared and distributed to shareholders annually. Net realized gains from investment transactions, in excess of available capital loss carryforwards, would be taxable to the Fund if not distributed and, therefore, will be distributed to shareholders at least annually. The Fund may also make additional distributions for tax purposes if necessary.
The timing and characterization of certain income and capital gain distributions are determined annually in accordance with federal tax regulations which may differ from accounting principles generally accepted in the United States of America. These differences primarily relate to investments in foreign denominated investments, income received from Passive Foreign Investment Companies and certain securities sold at a loss. As a result, net investment income (loss) and net realized gain (loss) on investment transactions for a reporting period may differ significantly from distributions during such period. Accordingly, the Fund may periodically make reclassifications among certain of its capital accounts without impacting the net asset value of the Fund.
The tax character of current year distributions will be determined at the end of the current fiscal year.
Expenses. Expenses of the Trust arising in connection with a specific fund are allocated to that fund. Other Trust expenses which cannot be directly attributed to a fund are apportioned among the funds in the Trust based upon the relative net assets or other appropriate measures.
Contingencies. In the normal course of business, the Fund may enter into contracts with service providers that contain general indemnification clauses. The Fund's maximum exposure under these arrangements is unknown as this would involve future claims that may be made against the Fund that have not yet been made. However, based on experience, the Fund expects the risk of loss to be remote.
Other. Investment transactions are accounted for on a trade date plus one basis for daily net asset value calculations. However, for financial reporting purposes, investment transactions are reported on trade date. Interest income is recorded on the accrual basis. Dividend income is recorded on the ex-dividend date net of foreign withholding taxes. Realized gains and losses from investment transactions are recorded on an identified cost basis. Proceeds from litigation payments, if any, are included in net realized gain (loss) from investments.
B. Purchases and Sales of Securities
During the six months ended June 30, 2014, purchases and sales of investment transactions (excluding short-term investments) aggregated $15,780,080 and $19,619,448, respectively.
C. Related Parties
Management Agreement. Under the Investment Management Agreement with Deutsche Investment Management Americas Inc. ("DIMA" or the "Advisor"), an indirect, wholly owned subsidiary of Deutsche Bank AG, the Advisor directs the investments of the Fund in accordance with its investment objectives, policies and restrictions. The Advisor determines the securities, instruments and other contracts relating to investments to be purchased, sold or entered into by the Fund.
Pursuant to the Investment Management Agreement with the Advisor, the Fund pays a monthly management fee based on the Fund's average daily net assets, computed and accrued daily and payable monthly, at the following annual rates:
| First $250 million | | | .915 | % |
| Next $500 million | | | .865 | % |
| Next $750 million | | | .815 | % |
| Next $1.5 billion | | | .765 | % |
| Over $3 billion | | | .715 | % |
Accordingly, for the six months ended June 30, 2014, the fee pursuant to the Investment Management Agreement was equivalent to an annualized effective rate (exclusive of any applicable waivers/reimbursements) of 0.915% of the Fund's average daily net assets.
For the period from January 1, 2014 through September 30, 2014, the Advisor has contractually agreed to waive its fee and/or reimburse certain operating expenses to the extent necessary to maintain the operating expenses (excluding certain expenses such as extraordinary expenses, taxes, brokerage and interest expense) of each class as follows:
For the six months ended June 30, 2014, fees waived and/or expenses reimbursed for each class are as follows:
| Class A | | $ | 157,586 | |
| Class B | | | 5,267 | |
| | | $ | 162,853 | |
Administration Fee. Pursuant to an Administrative Services Agreement, DIMA provides most administrative services to the Fund. For all services provided under the Administrative Services Agreement, the Fund pays DIMA an annual fee ("Administration Fee") of 0.10% of the Fund's average daily net assets, computed and accrued daily and payable monthly. For the six months ended June 30, 2014, the Administration Fee was $26,122, of which $4,256 is unpaid.
Service Provider Fees. DeAWM Service Company ("DSC"), an affiliate of the Advisor, is the transfer agent, dividend-paying agent and shareholder service agent for the Fund. Pursuant to a sub-transfer agency agreement between DSC and DST Systems, Inc. ("DST"), DSC has delegated certain transfer agent, dividend-paying agent and shareholder service agent functions to DST. DSC compensates DST out of the shareholder servicing fee it receives from the Fund. For the six months ended June 30, 2014, the amounts charged to the Fund by DSC were as follows:
| Services to Shareholders | | Total Aggregated | | | Unpaid at June 30, 2014 | |
| Class A | | $ | 149 | | | $ | 73 | |
| Class B | | | 43 | | | | 27 | |
| | | $ | 192 | | | $ | 100 | |
Distribution Service Agreement. Under the Fund's Class B 12b-1 plan, DeAWM Distributors, Inc. ("DDI") received a fee ("Distribution Service Fee") of 0.25% of average daily net assets of Class B shares. For the six months ended June 30, 2014, the Distribution Service Fee aggregated $2,110, of which $23 is unpaid.
Typesetting and Filing Service Fees. Under an agreement with DIMA, DIMA is compensated for providing typesetting and certain regulatory filing services to the Fund. For the six months ended June 30, 2014, the amount charged to the Fund by DIMA included in the Statement of Operations under "reports to shareholders" aggregated $8,718, of which $1,442 is unpaid.
Trustees' Fees and Expenses. The Fund paid retainer fees to each Trustee not affiliated with the Advisor, plus specified amounts to the Board Chairperson and Vice Chairperson and to each committee Chairperson.
Affiliated Cash Management Vehicles. The Fund may invest uninvested cash balances in Central Cash Management Fund and Deutsche Variable NAV Money Fund, affiliated money market funds which are managed by the Advisor. Each affiliated money market fund seeks to provide a high level of current income consistent with liquidity and the preservation of capital. Each affiliated money market fund is managed in accordance with Rule 2a-7 under the Investment Company Act of 1940, which governs the quality, maturity, diversity and liquidity of instruments in which a money market fund may invest. Central Cash Management Fund seeks to maintain a stable net asset value, and Deutsche Variable NAV Money Fund maintains a floating net asset value. The Fund indirectly bears its proportionate share of the expenses of each affiliated money market fund in which it invests. Central Cash Management Fund does not pay the Advisor an investment management fee. To the extent that Deutsche Variable NAV Money Fund pays an investment management fee to the Advisor, the Advisor will waive an amount of the investment management fee payable to the Advisor by the Fund equal to the amount of the investment management fee payable on the Fund's assets invested in Deutsche Variable NAV Money Fund.
D. Investing in Emerging Markets
Investing in emerging markets may involve special risks and considerations not typically associated with investing in developed markets. These risks include revaluation of currencies, high rates of inflation or deflation, repatriation restrictions on income and capital, and future adverse political, social and economic developments. Moreover, securities issued in these markets may be less liquid, subject to government ownership controls or delayed settlements, and may have prices that are more volatile or less easily assessed than those of comparable securities of issuers in developed markets.
E. Ownership of the Fund
At June 30, 2014, two participating insurance companies were owners of record of 10% or more of the total outstanding Class A shares of the Fund, each owning 72% and 23%. Two participating insurance companies were owners of record of 10% or more of the total outstanding Class B shares of the Fund, owning 53% and 39%.
F. Line of Credit
The Fund and other affiliated funds (the "Participants") share in a $400 million revolving credit facility provided by a syndication of banks. The Fund may borrow for temporary or emergency purposes, including the meeting of redemption requests that otherwise might require the untimely disposition of securities. The Participants are charged an annual commitment fee which is allocated based on net assets, among each of the Participants. Interest is calculated at a rate per annum equal to the sum of the Federal Funds Rate plus 1.25 percent plus if LIBOR exceeds the Federal Funds Rate the amount of such excess. The Fund may borrow up to a maximum of 33 percent of its net assets under the agreement. The Fund had no outstanding loans at June 30, 2014.
G. Fund Name Change
Effective August 11, 2014, the "DWS Funds" were rebranded "Deutsche Funds."
Information About Your Fund's Expenses (Unaudited)
As an investor of the Fund, you incur two types of costs: ongoing expenses and transaction costs. Ongoing expenses include management fees, distribution and service (12b-1) fees and other Fund expenses. Examples of transaction costs include contract charges, redemption fees and account maintenance fees, which are not shown in this section. The following tables are intended to help you understand your ongoing expenses (in dollars) of investing in the Fund and to help you compare these expenses with the ongoing expenses of investing in other mutual funds. In the most recent six-month period, the Fund limited these expenses; had it not done so, expenses would have been higher. The example in the table is based on an investment of $1,000 invested at the beginning of the six-month period and held for the entire period (January 1, 2014 to June 30, 2014).
The tables illustrate your Fund's expenses in two ways:
—Actual Fund Return. This helps you estimate the actual dollar amount of ongoing expenses (but not transaction costs) paid on a $1,000 investment in the Fund using the Fund's actual return during the period. To estimate the expenses you paid over the period, simply divide your account value by $1,000 (for example, an $8,600 account value divided by $1,000 = 8.6), then multiply the result by the number in the "Expenses Paid per $1,000" line under the share class you hold.
—Hypothetical 5% Fund Return. This helps you to compare your Fund's ongoing expenses (but not transaction costs) with those of other mutual funds using the Fund's actual expense ratio and a hypothetical rate of return of 5% per year before expenses. Examples using a 5% hypothetical Fund return may be found in the shareholder reports of other mutual funds. The hypothetical account values and expenses may not be used to estimate the actual ending account balance or expenses you paid for the period.
Please note that the expenses shown in these tables are meant to highlight your ongoing expenses only and do not reflect any transaction costs. The "Expenses Paid per $1,000" line of the tables is useful in comparing ongoing expenses only and will not help you determine the relative total expense of owning different funds. If these transaction costs had been included, your costs would have been higher.
Expenses and Value of a $1,000 Investment for the six months ended June 30, 2014 | |
| Actual Fund Return | | Class A | | | Class B | |
| Beginning Account Value 1/1/14 | | $ | 1,000.00 | | | $ | 1,000.00 | |
| Ending Account Value 6/30/14 | | $ | 1,046.50 | | | $ | 1,045.50 | |
| Expenses Paid per $1,000* | | $ | 4.06 | | | $ | 5.83 | |
| Hypothetical 5% Fund Return | | Class A | | | Class B | |
| Beginning Account Value 1/1/14 | | $ | 1,000.00 | | | $ | 1,000.00 | |
| Ending Account Value 6/30/14 | | $ | 1,020.83 | | | $ | 1,019.09 | |
| Expenses Paid per $1,000* | | $ | 4.01 | | | $ | 5.76 | |
* Expenses are equal to the Fund's annualized expense ratio for each share class, multiplied by the average account value over the period, multiplied by 181 (the number of days in the most recent six-month period), then divided by 365.
| Annualized Expense Ratios | Class A | | Class B | |
| Deutsche Variable Series II — Deutsche Global Growth VIP | .80% | | 1.15% | |
For more information, please refer to the Fund's prospectus.
These tables do not reflect charges and fees ("contract charges") associated with the separate account that invests in the Fund or any variable life insurance policy or variable annuity contract for which the Fund is an investment option.
For an analysis of the fees associated with an investment in the fund or similar funds, please refer to the current and hypothetical expense calculators for Variable Insurance Products which can be found at deutschefunds.com/EN/resources/calculators.jsp.
The Trust's policies and procedures for voting proxies for portfolio securities and information about how the Trust voted proxies related to its portfolio securities during the 12-month period ended June 30 are available on our Web site — deutschefunds.com (click on "proxy voting" at the bottom of the page) — or on the SEC's Web site — sec.gov. To obtain a written copy of the Trust's policies and procedures without charge, upon request, call us toll free at (800) 728-3337.
Advisory Agreement Board Considerations and Fee Evaluation
The Board of Trustees approved the renewal of DWS Global Growth VIP's investment management agreement (the "Agreement") with Deutsche Investment Management Americas Inc. ("DIMA") in September 2013.
In terms of the process that the Board followed prior to approving the Agreement, shareholders should know that:
— In September 2013, all but one of the Fund's Trustees were independent of DIMA and its affiliates.
— The Trustees met frequently during the past year to discuss fund matters and dedicated a substantial amount of time to contract review matters. Over the course of several months, the Board's Contract Committee, in coordination with the Board's Equity Oversight Committee, reviewed comprehensive materials received from DIMA, independent third parties and independent counsel. These materials included an analysis of the Fund's performance, fees and expenses, and profitability compiled by a fee consultant retained by the Fund's Independent Trustees (the "Fee Consultant"). The Board also received extensive information throughout the year regarding performance of the Fund.
— The Independent Trustees regularly meet privately with their independent counsel to discuss contract review and other matters. In addition, the Independent Trustees were also advised by the Fee Consultant in the course of their review of the Fund's contractual arrangements and considered a comprehensive report prepared by the Fee Consultant in connection with their deliberations.
— In connection with reviewing the Agreement, the Board also reviewed the terms of the Fund's Rule 12b-1 plan, distribution agreement, administrative services agreement, transfer agency agreement and other material service agreements.
— Based on its evaluation of the information provided, the Contract Committee presented its findings and recommendations to the Board. The Board then reviewed the Contract Committee's findings and recommendations.
In connection with the contract review process, the Contract Committee and the Board considered the factors discussed below, among others. The Board also considered that DIMA and its predecessors have managed the Fund since its inception, and the Board believes that a long-term relationship with a capable, conscientious advisor is in the best interests of the Fund. The Board considered, generally, that shareholders chose to invest or remain invested in the Fund knowing that DIMA managed the Fund, and that the Agreement was approved by the Fund's shareholders. DIMA is part of Deutsche Bank AG, a major global banking institution that is engaged in a wide range of financial services. The Board believes that there are advantages to being part of a global asset management business that offers a wide range of investing expertise and resources, including hundreds of portfolio managers and analysts with research capabilities in many countries throughout the world.
As part of the contract review process, the Board carefully considered the fees and expenses of each DWS fund overseen by the Board in light of the fund's performance. In many cases, this led to a negotiation with DIMA of lower expense caps as part of the 2012 and 2013 contract review processes than had previously been in place. As part of these negotiations, the Board indicated that it would consider relaxing these new lower caps in future years following sustained improvements in performance, among other considerations.
In June 2012, Deutsche Bank AG ("DB"), DIMA's parent company, announced that DB would combine its Asset Management (of which DIMA was a part) and Wealth Management divisions. DB has advised the Independent Trustees that the U.S. asset management business is a critical and integral part of DB, and that it has, and will continue to, reinvest a significant portion of the substantial savings it expects to realize by combining its Asset Management and Wealth Management divisions into the new Asset and Wealth Management ("AWM") division, including ongoing enhancements to its investment capabilities. DB also has confirmed its commitment to maintaining strong legal and compliance groups within the AWM division.
While shareholders may focus primarily on fund performance and fees, the Fund's Board considers these and many other factors, including the quality and integrity of DIMA's personnel and such other issues as back-office operations, fund valuations, and compliance policies and procedures.
Nature, Quality and Extent of Services. The Board considered the terms of the Agreement, including the scope of advisory services provided under the Agreement. The Board noted that, under the Agreement, DIMA provides portfolio management services to the Fund and that, pursuant to a separate administrative services agreement, DIMA provides administrative services to the Fund. The Board considered the experience and skills of senior management and investment personnel, the resources made available to such personnel, the ability of DIMA to attract and retain high-quality personnel, and the organizational depth and stability of DIMA. The Board reviewed the Fund's performance over short-term and long-term periods and compared those returns to various agreed-upon performance measures, including market indices and a peer universe compiled by the Fee Consultant using information supplied by Morningstar Direct ("Morningstar"), an independent fund data service. The Board also noted that it has put into place a process of identifying "Focus Funds" (e.g., funds performing poorly relative to their benchmark or a peer universe compiled by an independent fund data service), and receives more frequent reporting and information from DIMA regarding such funds, along with DIMA's remedial plans to address underperformance. The Board believes this process is an effective manner of identifying and addressing underperforming funds. Based on the information provided, the Board noted that for the one-, three- and five-year periods ended December 31, 2012, the Fund's performance (Class A shares) was in the 3rd quartile, 4th quartile and 4th quartile, respectively, of the applicable Morningstar universe (the 1st quartile being the best performers and the 4th quartile being the worst performers). The Board also observed that the Fund has outperformed its benchmark in the one-year period and has underperformed its benchmark in the three- and five-year periods ended December 31, 2012. The Board noted the disappointing investment performance of the Fund in recent periods and continued to discuss with senior management of DIMA the factors contributing to such underperformance and actions being taken to improve performance. The Board recognized that DIMA has made changes to its investment personnel and processes in recent years in an effort to enhance its investment platform and improve long-term performance across the DWS fund complex.
Fees and Expenses. The Board considered the Fund's investment management fee schedule, operating expenses and total expense ratios, and comparative information provided by Lipper Inc. ("Lipper") and the Fee Consultant regarding investment management fee rates paid to other investment advisors by similar funds (1st quartile being the most favorable and 4th quartile being the least favorable). With respect to management fees paid to other investment advisors by similar funds, the Board noted that the contractual fee rates paid by the Fund, which include a 0.10% fee paid to DIMA under the Fund's administrative services agreement, were higher than the median (4th quartile) of the applicable Lipper peer group (based on Lipper data provided as of December 31, 2012). The Board noted that the Fund's Class A shares total (net) operating expenses were expected to be lower than the median (2nd quartile) of the applicable Lipper expense universe (based on Lipper data provided as of December 31, 2012, and analyzing Lipper expense universe Class A (net) expenses less any applicable 12b-1 fees) ("Lipper Universe Expenses"). The Board also reviewed data comparing each share class's total (net) operating expenses to the applicable Lipper Universe Expenses. The Board considered the Fund's management fee rate as compared to fees charged by DIMA to comparable funds and considered differences between the Fund and the comparable funds. The Board also considered how the Fund's total (net) operating expenses compared to the total (net) operating expenses of a more customized peer group selected by Lipper (based on such factors as asset size). The Board also noted that the expense limitations agreed to by DIMA helped to ensure that the Fund's total (net) operating expenses would remain competitive.
The information considered by the Board as part of its review of management fees included information regarding fees charged by DIMA and its affiliates to similar institutional accounts and to similar funds offered primarily to European investors ("DWS Europe funds"), in each case as applicable. The Board observed that advisory fee rates for institutional accounts generally were lower than the management fees charged by similarly managed DWS U.S. mutual funds ("DWS Funds"), but also took note of the differences in services provided to DWS Funds as compared to institutional accounts. In the case of DWS Europe funds, the Board observed that fee rates for DWS Europe funds generally were higher than for similarly managed DWS Funds, but noted that differences in the types of services provided to DWS Funds relative to DWS Europe funds made it difficult to compare such fees.
On the basis of the information provided, the Board concluded that management fees were reasonable and appropriate in light of the nature, quality and extent of services provided by DIMA.
Profitability. The Board reviewed detailed information regarding revenues received by DIMA under the Agreement. The Board considered the estimated costs and pre-tax profits realized by DIMA from advising the DWS Funds, as well as estimates of the pre-tax profits attributable to managing the Fund in particular. The Board also received information regarding the estimated enterprise-wide profitability of DWS and its affiliates with respect to all fund services in totality and by fund. The Board and the Fee Consultant reviewed DIMA's methodology in allocating its costs to the management of the Fund. Based on the information provided, the Board concluded that the pre-tax profits realized by DIMA in connection with the management of the Fund were not unreasonable. The Board also reviewed information regarding the profitability of certain similar investment management firms. The Board noted that while information regarding the profitability of such firms is limited (and in some cases is not necessarily prepared on a comparable basis), DIMA and its affiliates' overall profitability with respect to the DWS fund complex (after taking into account distribution and other services provided to the funds by DIMA and its affiliates) was lower than the overall profitability levels of many comparable firms for which such data was available.
Economies of Scale. The Board considered whether there are economies of scale with respect to the management of the Fund and whether the Fund benefits from any economies of scale. The Board noted that the Fund's management fee schedule includes fee breakpoints. The Board concluded that the Fund's fee schedule represents an appropriate sharing between the Fund and DIMA of such economies of scale as may exist in the management of the Fund at current asset levels.
Other Benefits to DIMA and Its Affiliates. The Board also considered the character and amount of other incidental benefits received by DIMA and its affiliates, including any fees received by DIMA for administrative services provided to the Fund and any fees received by an affiliate of DIMA for distribution services. The Board also considered benefits to DIMA related to brokerage and soft-dollar allocations, including allocating brokerage to pay for research generated by parties other than the executing broker dealers, which pertain primarily to funds investing in equity securities, along with the incidental public relations benefits to DIMA related to DWS Funds advertising and cross-selling opportunities among DIMA products and services. The Board concluded that management fees were reasonable in light of these fallout benefits.
Compliance. The Board considered the significant attention and resources dedicated by DIMA to documenting and enhancing its compliance processes in recent years. The Board noted in particular (i) the experience and seniority of both DIMA's chief compliance officer and the Fund's chief compliance officer; (ii) the large number of DIMA compliance personnel; and (iii) the substantial commitment of resources by DIMA and its affiliates to compliance matters.
Based on all of the information considered and the conclusions reached, the Board unanimously determined that the continuation of the Agreement is in the best interests of the Fund. In making this determination, the Board did not give particular weight to any single factor identified above. The Board considered these factors over the course of numerous meetings, certain of which were in executive session with only the Independent Trustees and their independent counsel present. It is possible that individual Trustees may have weighed these factors differently in reaching their individual decisions to approve the continuation of the Agreement.
Notes
DeAWM Distributors, Inc.
222 South Riverside Plaza
Chicago, IL 60606
(800) 621-1148
VS2GG-3 (R-028383-3 8/14)
June 30, 2014
Semiannual Report
Deutsche Variable Series II
(formerly DWS Variable Series II)
Deutsche Global Income Builder VIP
(formerly DWS Global Income Builder VIP)
Contents
5 Portfolio Management Team 27 Statement of Assets and Liabilities 28 Statement of Operations 29 Statement of Changes in Net Assets 31 Notes to Financial Statements 39 Information About Your Fund's Expenses 41 Advisory Agreement Board Considerations and Fee Evaluation |
This report must be preceded or accompanied by a prospectus. To obtain an additional prospectus or summary prospectus, if available, call (800) 728-3337 or your financial representative. We advise you to consider the Fund's objectives, risks, charges and expenses carefully before investing. The summary prospectus and prospectus contain this and other important information about the Fund. Please read the prospectus carefully before you invest.
Although allocation among different asset categories generally limits risk, Fund management may favor an asset category that underperforms other assets or markets as a whole. Bond investments are subject to interest-rate and credit risks. When interest rates rise, bond prices generally fall. Credit risk refers to the ability of an issuer to make timely payments of principal and interest. Investing in derivatives entails special risks relating to liquidity, leverage and credit that may reduce returns and/or increase volatility. Dividends are not guaranteed. If the dividend-paying stocks held by the Fund reduce or stop paying dividends, the Fund's ability to generate income may be adversely affected. Preferred stocks, a type of dividend-paying stock, present certain additional risks. Because Exchange Traded Funds (ETFs) trade on a securities exchange, their shares may trade at a premium or discount to their net asset value. ETFs also incur fees and expenses so they may not fully match the performance of the indexes they are designed to track. Investing in foreign securities, particularly those of emerging markets, presents certain risks, such as currency fluctuations, political and economic changes, and market risks. The Fund may lend securities to approved institutions. Stocks may decline in value. See the prospectus for details.
Deutsche Asset & Wealth Management represents the asset management and wealth management activities conducted by Deutsche Bank AG or any of its subsidiaries, including the Advisor and DeAWM Distributors, Inc.
NOT FDIC/NCUA INSURED NO BANK GUARANTEE MAY LOSE VALUE NOT A DEPOSIT
NOT INSURED BY ANY FEDERAL GOVERNMENT AGENCY
Dear Shareholder:
I am very pleased to tell you that the DWS funds have been renamed Deutsche funds, aligning more closely with the Deutsche Asset & Wealth Management brand. We are proud to adopt the Deutsche name — a brand that fully represents the global access, discipline and intelligence that support all of our products and services.
Deutsche Asset & Wealth Management combines the asset management and wealth management divisions of Deutsche Bank to deliver a comprehensive suite of active, passive and alternative investment capabilities. Your investment in the Deutsche funds means you have access to the thought leadership and resources of one of the world’s largest and most influential financial institutions.
In conjunction with your fund’s name change, please note that the Deutsche funds’ Web address has changed as well. The former dws-investments.com is now deutschefunds.com.
In addition, key service providers have been renamed as follows:
| Former Name | New name, effective August 11, 2014 |
| DWS Investments Distributors, Inc. | DeAWM Distributors, Inc. |
| DWS Trust Company | DeAWM Trust Company |
| DWS Investments Service Company | DeAWM Service Company |
These changes have no effect on the day-to-day management of your investment, and there is no action required on your part. You will continue to experience the benefits that come from our decades of experience, in-depth research and worldwide network of investment professionals.
Thanks for your continued support. We appreciate your trust and the opportunity to put our capabilities to work for you.
Best regards,
Brian Binder
President, Deutsche Funds
Performance Summary June 30, 2014 (Unaudited)
Fund performance shown is historical, assumes reinvestment of all dividend and capital gain distributions and does not guarantee future results. Investment return and principal value fluctuate with changing market conditions so that, when redeemed, shares may be worth more or less than their original cost. Current performance may be lower or higher than the performance data quoted. Please contact your participating insurance company for the Fund's most recent month-end performance. Performance doesn't reflect charges and fees ("contract charges") associated with the separate account that invests in the Fund or any variable life insurance policy or variable annuity contract for which the Fund is an investment option. These charges and fees will reduce returns.
The gross expense ratio of the Fund, as stated in the fee table of the prospectus dated May 1, 2014 is 0.60% for Class A shares and may differ from the expense ratio disclosed in the Financial Highlights table in this report.
| Growth of an Assumed $10,000 Investment in Deutsche Global Income Builder VIP |
| The Russell 1000® Index is an unmanaged index that measures the performance of the 1,000 largest companies in the Russell 3000® Index, which represents approximately 92% of the total market capitalization of the Russell 3000® Index. The Barclays U.S. Aggregate Bond Index is an unmanaged index representing domestic taxable investment-grade bonds, with index components for government and corporate securities, mortgage pass-through securities, and asset-backed securities with an average maturity of one year or more. The S&P® Target Risk Moderate Index is designed to measure the performance of S&P's proprietary moderate target risk allocation model. The S&P® Target Risk Moderate Index seeks to provide significant exposure to fixed income, while also allocating a smaller portion of exposure to equities in order to seek current income, some capital preservation, and an opportunity for moderate to low capital appreciation. Index returns do not reflect any fees or expenses and it is not possible to invest directly into an index. |
| |
| Yearly periods ended June 30 | |
| Comparative Results | |
| Deutsche Global Income Builder VIP | | 6-Month‡ | | | 1-Year | | | 3-Year | | | 5-Year | | | 10-Year | |
| Class A | Growth of $10,000 | | $ | 10,539 | | | $ | 11,724 | | | $ | 13,210 | | | $ | 17,532 | | | $ | 17,201 | |
| Average annual total return | | | 5.39 | % | | | 17.24 | % | | | 9.73 | % | | | 11.88 | % | | | 5.57 | % |
Russell 1000® Index | Growth of $10,000 | | $ | 10,727 | | | $ | 12,535 | | | $ | 15,863 | | | $ | 24,117 | | | $ | 21,967 | |
| Average annual total return | | | 7.27 | % | | | 25.35 | % | | | 16.63 | % | | | 19.25 | % | | | 8.19 | % |
| Barclays U.S. Aggregate Bond Index | Growth of $10,000 | | $ | 10,393 | | | $ | 10,437 | | | $ | 11,140 | | | $ | 12,674 | | | $ | 16,187 | |
| Average annual total return | | | 3.93 | % | | | 4.37 | % | | | 3.66 | % | | | 4.85 | % | | | 4.93 | % |
S&P® Target Risk Moderate Index | Growth of $10,000 | | $ | 10,442 | | | $ | 11,254 | | | $ | 12,367 | | | $ | 15,443 | | | $ | 17,301 | |
| Average annual total return | | | 4.42 | % | | | 12.54 | % | | | 7.34 | % | | | 9.08 | % | | | 5.64 | % |
The growth of $10,000 is cumulative.
‡ Total returns shown for periods less than one year are not annualized.
Portfolio Summary (Unaudited) Asset Allocation (As a % of Investment Portfolio excluding Securities Lending Collateral) | 6/30/14 | 12/31/13 |
| | | |
| Equity | 55% | 63% |
| Common Stocks | 55% | 63% |
| | | |
| Fixed Income | 37% | 33% |
| Corporate Bonds | 27% | 23% |
| Government & Agency Obligations | 7% | 5% |
| Collateralized Mortgage Obligations | 1% | 2% |
| Asset-Backed | 1% | 0% |
| Commercial Mortgage-Backed Securities | 1% | 1% |
| Municipal Bonds and Notes | 0% | 1% |
| Mortgage-Backed Securities Pass-Throughs | 0% | 1% |
| Loan Participations and Assignments | — | 0% |
| | | |
| Cash Equivalents | 8% | 4% |
| | 100% | 100% |
Sector Diversification
(As a % of Equities, Corporate Bonds, Preferred Securities, Convertible Bonds and Other Investments) | 6/30/14 | 12/31/13 |
| | | |
| Financials | 21% | 22% |
| Consumer Discretionary | 12% | 13% |
| Energy | 12% | 9% |
| Information Technology | 10% | 12% |
| Industrials | 10% | 11% |
| Telecommunication Services | 10% | 9% |
| Consumer Staples | 7% | 7% |
| Health Care | 7% | 6% |
| Materials | 6% | 5% |
| Utilities | 5% | 6% |
| | 100% | 100% |
Portfolio holdings and characteristics are subject to change.
For more complete details about the Fund's investment portfolio, see page 6.
Following the Fund's fiscal first and third quarter-end, a complete portfolio holdings listing is filed with the SEC on Form N-Q. The form will be available on the SEC's Web site at sec.gov, and it also may be reviewed and copied at the SEC's Public Reference Room in Washington, D.C. Information on the operation of the SEC's Public Reference Room may be obtained by calling (800) SEC-0330. The Fund's portfolio holdings are also posted on deutschefunds.com from time to time. Please see the Fund's current prospectus for more information.
Portfolio Management Team
Di Kumble, CFA
William Chepolis, CFA
Philip G. Condon
Gary Russell, CFA
John D. Ryan
Darwei Kung
Portfolio Managers
Investment Portfolio June 30, 2014 (Unaudited) | | | Shares | | | Value ($) | |
| | | | |
| Common Stocks 54.8% | |
| Consumer Discretionary 5.4% | |
| Auto Components 0.4% | |
| Aisin Seiki Co., Ltd. | | | 2,664 | | | | 105,976 | |
| Bridgestone Corp. | | | 3,605 | | | | 126,151 | |
| Cie Generale des Etablissements Michelin | | | 243 | | | | 29,035 | |
| Delphi Automotive PLC | | | 1,254 | | | | 86,200 | |
| Denso Corp. | | | 79 | | | | 3,770 | |
| Johnson Controls, Inc. | | | 1,959 | | | | 97,813 | |
| Magna International, Inc. | | | 1,176 | | | | 126,588 | |
| Sumitomo Rubber Industries Ltd. | | | 12,693 | | | | 183,181 | |
| Toyota Industries Corp. | | | 79 | | | | 4,078 | |
| TRW Automotive Holdings Corp.* | | | 236 | | | | 21,127 | |
| Yokohama Rubber Co., Ltd. | | | 23,087 | | | | 199,637 | |
| | | | | | | | 983,556 | |
| Automobiles 1.3% | |
| Bayerische Motoren Werke (BMW) AG | | | 1,177 | | | | 149,273 | |
| Daimler AG (Registered) | | | 1,727 | | | | 161,751 | |
| Fiat SpA* | | | 11,828 | | | | 116,774 | |
| Ford Motor Co. | | | 13,868 | | | | 239,084 | |
| Fuji Heavy Industries Ltd. | | | 4,153 | | | | 114,991 | |
| General Motors Co. | | | 16,140 | | | | 585,882 | |
| Honda Motor Co., Ltd. (a) | | | 5,250 | | | | 183,300 | |
| Isuzu Motors Ltd. | | | 7,052 | | | | 46,640 | |
| Mitsubishi Motors Corp. | | | 21,938 | | | | 242,107 | |
| Nissan Motor Co., Ltd. | | | 40,585 | | | | 384,998 | |
| Renault SA | | | 4,500 | | | | 406,867 | |
| Toyota Motor Corp. | | | 6,190 | | | | 371,748 | |
| Volkswagen AG | | | 1,470 | | | | 380,030 | |
| | | | | | | | 3,383,445 | |
| Diversified Consumer Services 0.0% | |
| H&R Block, Inc. | | | 3,134 | | | | 105,052 | |
| Hotels, Restaurants & Leisure 0.7% | |
| Carnival Corp. | | | 4,858 | | | | 182,904 | |
| Chipotle Mexican Grill, Inc.* | | | 79 | | | | 46,808 | |
| Compass Group PLC | | | 9,203 | | | | 160,178 | |
| Crown Resorts Ltd. | | | 4,907 | | | | 69,961 | |
| Dawn Holdings, Inc.* (b) | | | 1 | | | | 1,940 | |
| Galaxy Entertainment Group Ltd. | | | 10,969 | | | | 87,464 | |
| McDonald's Corp. | | | 3,056 | | | | 307,861 | |
| Royal Caribbean Cruises Ltd. | | | 2,899 | | | | 161,184 | |
| Sands China Ltd. | | | 26,326 | | | | 199,558 | |
| SJM Holdings Ltd. | | | 26,583 | | | | 66,471 | |
| Starbucks Corp. | | | 2,821 | | | | 218,289 | |
| Tatts Group Ltd. | | | 27,230 | | | | 83,962 | |
| Trump Entertainment Resorts, Inc.* | | | 2 | | | | 0 | |
| TUI Travel PLC | | | 10,382 | | | | 70,716 | |
| Whitbread PLC | | | 134 | | | | 10,111 | |
| Yum! Brands, Inc. | | | 1,959 | | | | 159,071 | |
| | | | | | | | 1,826,478 | |
| Household Durables 0.3% | |
| Leggett & Platt, Inc. (a) | | | 3,448 | | | | 118,197 | |
| Mohawk Industries, Inc.* | | | 784 | | | | 108,459 | |
| Newell Rubbermaid, Inc. | | | 2,351 | | | | 72,858 | |
| PulteGroup, Inc. | | | 2,351 | | | | 47,396 | |
| Sekisui Chemical Co., Ltd. | | | 5,485 | | | | 63,510 | |
| | | Shares | | | Value ($) | |
| | | | | | | | | |
| Sekisui House Ltd. | | | 13,454 | | | | 184,469 | |
| Whirlpool Corp. | | | 1,646 | | | | 229,156 | |
| | | | | | | | 824,045 | |
| Leisure Products 0.1% | |
| Bandai Namco Holdings, Inc. | | | 2,508 | | | | 58,723 | |
| Hasbro, Inc. (a) | | | 2,821 | | | | 149,654 | |
| Mattel, Inc. | | | 784 | | | | 30,553 | |
| | | | | | | | 238,930 | |
| Media 1.6% | |
| British Sky Broadcasting Group PLC | | | 10,533 | | | | 162,957 | |
| CBS Corp. "B" (a) | | | 1,176 | | | | 73,077 | |
| Comcast Corp. Special "A" | | | 7,914 | | | | 422,054 | |
| Comcast Corp. "A" | | | 6,974 | | | | 374,364 | |
| DIRECTV* | | | 4,545 | | | | 386,370 | |
| Discovery Communications, Inc. "A"* | | | 314 | | | | 23,324 | |
| Discovery Communications, Inc. "C"* | | | 1,019 | | | | 73,969 | |
| Liberty Global PLC "A"* | | | 2,978 | | | | 131,687 | |
| Liberty Global PLC "C"* | | | 3,420 | | | | 144,700 | |
| Liberty Media Corp. "A"* | | | 1,411 | | | | 192,856 | |
| News Corp. "A"* | | | 5,485 | | | | 98,401 | |
| Omnicom Group, Inc. | | | 627 | | | | 44,655 | |
| Reed Elsevier PLC | | | 4,714 | | | | 75,835 | |
| Scripps Networks Interactive, Inc. "A" | | | 2,273 | | | | 184,431 | |
| SES SA | | | 5 | | | | 190 | |
| Shaw Communications, Inc. "B" | | | 7,444 | | | | 190,870 | |
| Thomson Reuters Corp. | | | 4,231 | | | | 154,046 | |
| Time Warner Cable, Inc. | | | 1,254 | | | | 184,714 | |
| Time Warner, Inc. | | | 6,347 | | | | 445,877 | |
| Time, Inc.* | | | 793 | | | | 19,206 | |
| Twenty-First Century Fox, Inc. "A" | | | 3,056 | | | | 107,418 | |
| Twenty-First Century Fox, Inc. "B" | | | 4,701 | | | | 160,915 | |
| Viacom, Inc. "B" | | | 1,881 | | | | 163,139 | |
| Walt Disney Co. | | | 3,683 | | | | 315,780 | |
| WPP PLC | | | 4,538 | | | | 98,943 | |
| | | | | | | | 4,229,778 | |
| Multiline Retail 0.3% | |
| Canadian Tire Corp., Ltd. "A" | | | 157 | | | | 15,062 | |
| Dollar General Corp.* | | | 1,959 | | | | 112,368 | |
| Kohl's Corp. | | | 3,291 | | | | 173,370 | |
| Macy's, Inc. | | | 2,194 | | | | 127,296 | |
| Nordstrom, Inc. | | | 1,097 | | | | 74,519 | |
| Target Corp. (a) | | | 3,683 | | | | 213,430 | |
| | | | | | | | 716,045 | |
| Specialty Retail 0.3% | |
| AutoZone, Inc.* | | | 314 | | | | 168,379 | |
| Bed Bath & Beyond, Inc.* | | | 941 | | | | 53,995 | |
| GameStop Corp. "A" (a) | | | 392 | | | | 15,864 | |
| Home Depot, Inc. | | | 2,038 | | | | 164,997 | |
| Lowe's Companies, Inc. | | | 1,332 | | | | 63,923 | |
| O'Reilly Automotive, Inc.* | | | 314 | | | | 47,288 | |
| PetSmart, Inc. (a) | | | 1,097 | | | | 65,601 | |
| Staples, Inc. | | | 8,500 | | | | 92,140 | |
| The Gap, Inc. | | | 862 | | | | 35,833 | |
| TJX Companies, Inc. | | | 1,567 | | | | 83,286 | |
| | | | | | | | 791,306 | |
| | | Shares | | | Value ($) | |
| | | | | | | | | |
| Textiles, Apparel & Luxury Goods 0.4% | |
| Christian Dior SA | | | 933 | | | | 185,629 | |
| Cie Financiere Richemont SA (Registered) | | | 1,534 | | | | 160,959 | |
| Michael Kors Holdings Ltd.* | | | 706 | | | | 62,587 | |
| NIKE, Inc. "B" | | | 2,664 | | | | 206,593 | |
| Swatch Group AG (Bearer) | | | 205 | | | | 123,791 | |
| Swatch Group AG (Registered) | | | 1,724 | | | | 191,491 | |
| VF Corp. | | | 2,642 | | | | 166,446 | |
| Yue Yuen Industrial (Holdings) Ltd. | | | 18,804 | | | | 63,688 | |
| | | | | | | | 1,161,184 | |
| Consumer Staples 4.7% | |
| Beverages 0.6% | |
| Anheuser-Busch InBev NV | | | 450 | | | | 51,698 | |
| Carlsberg AS "B" | | | 1,729 | | | | 186,242 | |
| Coca-Cola Co. | | | 6,268 | | | | 265,512 | |
| Diageo PLC | | | 2,821 | | | | 90,088 | |
| Dr. Pepper Snapple Group, Inc. | | | 2,586 | | | | 151,488 | |
| Heineken Holding NV | | | 1,747 | | | | 114,860 | |
| Heineken NV | | | 355 | | | | 25,486 | |
| Molson Coors Brewing Co. "B" | | | 2,899 | | | | 214,990 | |
| PepsiCo, Inc. | | | 3,567 | | | | 318,676 | |
| SABMiller PLC | | | 1,353 | | | | 78,450 | |
| | | | | | | | 1,497,490 | |
| Food & Staples Retailing 1.7% | |
| Aeon Co., Ltd. | | | 12,615 | | | | 155,158 | |
| Alimentation Couche-Tard, Inc. "B" | | | 7,052 | | | | 193,177 | |
| Casino Guichard-Perrachon SA | | | 524 | | | | 69,477 | |
| Costco Wholesale Corp. | | | 1,332 | | | | 153,393 | |
| CVS Caremark Corp. | | | 5,642 | | | | 425,238 | |
| Empire Co., Ltd. "A" | | | 3,134 | | | | 213,114 | |
| George Weston Ltd. | | | 3,448 | | | | 254,339 | |
| J Sainsbury PLC | | | 65,372 | | | | 352,974 | |
| Jeronimo Martins, SGPS, SA | | | 3,507 | | | | 57,698 | |
| Koninklijke Ahold NV | | | 4,417 | | | | 82,921 | |
| Kroger Co. | | | 5,877 | | | | 290,500 | |
| Lawson, Inc. | | | 862 | | | | 64,668 | |
| Loblaw Companies Ltd. | | | 1,756 | | | | 78,366 | |
| Metro, Inc. | | | 1,332 | | | | 82,350 | |
| Safeway, Inc. | | | 2,899 | | | | 99,552 | |
| Seven & I Holdings Co., Ltd. | | | 1,567 | | | | 66,018 | |
| Sysco Corp. (a) | | | 3,761 | | | | 140,849 | |
| Tesco PLC | | | 70,901 | | | | 344,848 | |
| Wal-Mart Stores, Inc. | | | 6,112 | | | | 458,828 | |
| Walgreen Co. | | | 4,545 | | | | 336,921 | |
| Wesfarmers Ltd. | | | 5,098 | | | | 201,131 | |
| WM Morrison Supermarkets PLC | | | 77,061 | | | | 241,872 | |
| Woolworths Ltd. | | | 4,247 | | | | 141,046 | |
| | | | | | | | 4,504,438 | |
| Food Products 1.2% | |
| Archer-Daniels-Midland Co. | | | 5,328 | | | | 235,018 | |
| Aryzta AG* | | | 1,318 | | | | 124,845 | |
| Bunge Ltd. | | | 3,996 | | | | 302,258 | |
| ConAgra Foods, Inc. | | | 4,466 | | | | 132,551 | |
| General Mills, Inc. | | | 4,780 | | | | 251,141 | |
| Hormel Foods Corp. | | | 2,038 | | | | 100,575 | |
| Kellogg Co. | | | 2,899 | | | | 190,464 | |
| Kerry Group PLC "A" | | | 2,837 | | | | 213,076 | |
| Kraft Foods Group, Inc. | | | 2,116 | | | | 126,854 | |
| Lindt & Spruengli AG | | | 23 | | | | 117,075 | |
| McCormick & Co., Inc. | | | 941 | | | | 67,366 | |
| Mondelez International, Inc. "A" | | | 7,679 | | | | 288,807 | |
| | | Shares | | | Value ($) | |
| | | | | | | | | |
| Nestle SA (Registered) | | | 4,850 | | | | 375,728 | |
| Tate & Lyle PLC | | | 6,434 | | | | 75,371 | |
| The Hershey Co. | | | 706 | | | | 68,743 | |
| The JM Smucker Co. | | | 1,567 | | | | 166,995 | |
| Tyson Foods, Inc. "A" | | | 7,052 | | | | 264,732 | |
| Wilmar International Ltd. | | | 61,112 | | | | 156,346 | |
| | | | | | | | 3,257,945 | |
| Household Products 0.5% | |
| Church & Dwight Co., Inc. | | | 1,803 | | | | 126,120 | |
| Clorox Co. | | | 784 | | | | 71,658 | |
| Colgate-Palmolive Co. | | | 2,429 | | | | 165,609 | |
| Energizer Holdings, Inc. | | | 1,411 | | | | 172,184 | |
| Kimberly-Clark Corp. | | | 2,038 | | | | 226,666 | |
| Procter & Gamble Co. | | | 4,566 | | | | 358,842 | |
| Reckitt Benckiser Group PLC | | | 1,733 | | | | 151,259 | |
| | | | | | | | 1,272,338 | |
| Tobacco 0.7% | |
| Altria Group, Inc. | | | 8,110 | | | | 340,133 | |
| British American Tobacco PLC | | | 4,589 | | | | 273,149 | |
| Imperial Tobacco Group PLC | | | 7,662 | | | | 344,865 | |
| Japan Tobacco, Inc. | | | 5,877 | | | | 214,242 | |
| Lorillard, Inc. | | | 3,134 | | | | 191,080 | |
| Philip Morris International, Inc. | | | 3,918 | | | | 330,326 | |
| Reynolds American, Inc. | | | 4,623 | | | | 278,998 | |
| | | | | | | | 1,972,793 | |
| Energy 5.0% | |
| Energy Equipment & Services 0.5% | |
| Baker Hughes, Inc. | | | 1,254 | | | | 93,360 | |
| Ensco PLC "A" | | | 8,070 | | | | 448,450 | |
| Halliburton Co. | | | 1,254 | | | | 89,047 | |
| National Oilwell Varco, Inc. | | | 1,254 | | | | 103,267 | |
| Noble Corp. PLC | | | 10,969 | | | | 368,120 | |
| Schlumberger Ltd. | | | 2,273 | | | | 268,100 | |
| | | | | | | | 1,370,344 | |
| Oil, Gas & Consumable Fuels 4.5% | |
| Apache Corp. | | | 1,567 | | | | 157,672 | |
| BG Group PLC | | | 6,894 | | | | 145,710 | |
| BP PLC | | | 76,166 | | | | 671,175 | |
| Cabot Oil & Gas Corp. | | | 3,996 | | | | 136,423 | |
| Canadian Natural Resources Ltd. | | | 1,646 | | | | 75,632 | |
| Chesapeake Energy Corp. (a) | | | 11,155 | | | | 346,697 | |
| Chevron Corp. | | | 4,780 | | | | 624,029 | |
| ConocoPhillips | | | 6,336 | | | | 543,185 | |
| Devon Energy Corp. | | | 2,038 | | | | 161,817 | |
| Enbridge, Inc. | | | 392 | | | | 18,600 | |
| Eni SpA | | | 9,313 | | | | 254,791 | |
| EQT Corp. | | | 1,332 | | | | 142,391 | |
| Exxon Mobil Corp. | | | 4,701 | | | | 473,297 | |
| Hess Corp. | | | 3,134 | | | | 309,921 | |
| HollyFrontier Corp. (a) | | | 5,789 | | | | 252,921 | |
| Husky Energy, Inc. | | | 6,056 | | | | 195,576 | |
| Idemitsu Kosan Co., Ltd. | | | 12,627 | | | | 274,340 | |
| Imperial Oil Ltd. | | | 6,974 | | | | 367,507 | |
| JX Holdings, Inc. | | | 90,885 | | | | 486,251 | |
| Kinder Morgan, Inc. | | | 7,835 | | | | 284,097 | |
| Marathon Oil Corp. | | | 6,503 | | | | 259,600 | |
| Marathon Petroleum Corp. | | | 3,621 | | | | 282,692 | |
| Murphy Oil Corp. | | | 2,806 | | | | 186,543 | |
| Neste Oil Oyj (a) | | | 9,505 | | | | 185,467 | |
| Occidental Petroleum Corp. | | | 3,369 | | | | 345,761 | |
| OMV AG | | | 9,145 | | | | 413,234 | |
| Origin Energy Ltd. | | | 152 | | | | 2,095 | |
| | | Shares | | | Value ($) | |
| | | | | | | | | |
| Pacific Rubiales Energy Corp. | | | 4,623 | | | | 93,929 | |
| Phillips 66 | | | 4,075 | | | | 327,752 | |
| Repsol SA | | | 5,901 | | | | 155,625 | |
| Royal Dutch Shell PLC "A" | | | 18,660 | | | | 772,341 | |
| Royal Dutch Shell PLC "B" | | | 14,953 | | | | 650,640 | |
| Showa Shell Sekiyu KK | | | 28,239 | | | | 320,844 | |
| Spectra Energy Corp. (a) | | | 3,448 | | | | 146,471 | |
| Statoil ASA | | | 6,006 | | | | 184,473 | |
| Suncor Energy, Inc. | | | 4,780 | | | | 203,824 | |
| Tesoro Corp. | | | 5,015 | | | | 294,230 | |
| TonenGeneral Sekiyu KK (a) | | | 16,463 | | | | 156,334 | |
| Total SA | | | 7,515 | | | | 543,122 | |
| TransCanada Corp. | | | 2,273 | | | | 108,490 | |
| Valero Energy Corp. | | | 6,863 | | | | 343,836 | |
| Woodside Petroleum Ltd. | | | 2,606 | | | | 100,922 | |
| | | | | | | | 12,000,257 | |
| Financials 13.6% | |
| Banks 6.3% | |
| Aozora Bank Ltd. | | | 141,174 | | | | 464,053 | |
| Australia & New Zealand Banking Group Ltd. | | | 8,236 | | | | 258,923 | |
| Banco Bilbao Vizcaya Argentaria SA | | | 9,682 | | | | 123,415 | |
| Bank Hapoalim BM | | | 63,913 | | | | 369,528 | |
| Bank Leumi Le-Israel BM* | | | 98,723 | | | | 385,225 | |
| Bank of America Corp. | | | 31,653 | | | | 486,507 | |
| Bank of East Asia Ltd. | | | 21,938 | | | | 91,003 | |
| Bank of Montreal (a) | | | 5,328 | | | | 392,366 | |
| Bank of Nova Scotia (a) | | | 5,646 | | | | 376,418 | |
| Barclays PLC | | | 83,709 | | | | 304,856 | |
| BB&T Corp. | | | 6,190 | | | | 244,072 | |
| Bendigo & Adelaide Bank Ltd. | | | 5,567 | | | | 64,043 | |
| BNP Paribas SA | | | 4,637 | | | | 314,583 | |
| BOC Hong Kong (Holdings) Ltd. | | | 93,627 | | | | 271,202 | |
| Canadian Imperial Bank of Commerce (a) | | | 4,075 | | | | 370,819 | |
| CIT Group, Inc. | | | 6,582 | | | | 301,192 | |
| Citigroup, Inc. | | | 11,048 | | | | 520,361 | |
| Comerica, Inc. | | | 1,097 | | | | 55,025 | |
| Commonwealth Bank of Australia | | | 2,037 | | | | 155,353 | |
| Credit Agricole SA | | | 14,547 | | | | 205,168 | |
| Danske Bank AS | | | 11,160 | | | | 315,440 | |
| DBS Group Holdings Ltd. | | | 20,371 | | | | 273,650 | |
| Fifth Third Bancorp. | | | 14,103 | | | | 301,099 | |
| First Republic Bank | | | 1,332 | | | | 73,247 | |
| Fukuoka Financial Group, Inc. | | | 21,710 | | | | 104,794 | |
| Hang Seng Bank Ltd. | | | 16,924 | | | | 277,103 | |
| HSBC Holdings PLC | | | 66,333 | | | | 673,074 | |
| JPMorgan Chase & Co. | | | 9,167 | | | | 528,202 | |
| KeyCorp | | | 12,301 | | | | 176,273 | |
| Lloyds Banking Group PLC* | | | 166,742 | | | | 211,881 | |
| M&T Bank Corp. (a) | | | 1,959 | | | | 243,014 | |
| Mitsubishi UFJ Financial Group, Inc. | | | 36,354 | | | | 222,850 | |
| Mizrahi Tefahot Bank Ltd. | | | 15,580 | | | | 201,498 | |
| Mizuho Financial Group, Inc. | | | 162,573 | | | | 333,796 | |
| National Australia Bank Ltd. | | | 6,869 | | | | 212,320 | |
| National Bank of Canada (a) | | | 8,305 | | | | 352,265 | |
| Natixis | | | 31,878 | | | | 204,372 | |
| Nordea Bank AB | | | 21,868 | | | | 308,634 | |
| Oversea-Chinese Banking Corp., Ltd. | | | 25,855 | | | | 198,023 | |
| PNC Financial Services Group, Inc. | | | 4,780 | | | | 425,659 | |
| Raiffeisen Bank International AG | | | 2,759 | | | | 88,082 | |
| Regions Financial Corp. | | | 31,810 | | | | 337,822 | |
| | | Shares | | | Value ($) | |
| | | | | | | | | |
| Resona Holdings, Inc. | | | 47,156 | | | | 274,636 | |
| Royal Bank of Canada | | | 4,858 | | | | 347,283 | |
| Royal Bank of Scotland Group PLC* | | | 10,278 | | | | 57,765 | |
| Skandinaviska Enskilda Banken AB "A" | | | 23,014 | | | | 307,586 | |
| Societe Generale | | | 6,354 | | | | 332,839 | |
| Standard Chartered PLC | | | 11,679 | | | | 238,650 | |
| Sumitomo Mitsui Financial Group, Inc. | | | 5,407 | | | | 226,517 | |
| SunTrust Banks, Inc. | | | 5,877 | | | | 235,433 | |
| Svenska Handelsbanken AB "A" | | | 1,488 | | | | 72,846 | |
| Swedbank AB "A" | | | 13,741 | | | | 364,422 | |
| The Bank of Yokohama Ltd. | | | 27,744 | | | | 159,664 | |
| The Chiba Bank Ltd. | | | 10,186 | | | | 71,892 | |
| The Chugoku Bank Ltd. | | | 7,600 | | | | 116,883 | |
| The Gunma Bank Ltd. | | | 14,167 | | | | 83,767 | |
| The Hachijuni Bank Ltd. | | | 18,804 | | | | 116,382 | |
| The Iyo Bank Ltd. | | | 6,738 | | | | 68,108 | |
| The Toronto-Dominion Bank (a) | | | 8,229 | | | | 423,616 | |
| U.S. Bancorp. | | | 8,070 | | | | 349,592 | |
| United Overseas Bank Ltd. | | | 9,402 | | | | 169,808 | |
| Wells Fargo & Co. | | | 10,969 | | | | 576,531 | |
| Westpac Banking Corp. | | | 6,452 | | | | 206,123 | |
| Yamaguchi Financial Group, Inc. | | | 18,021 | | | | 189,985 | |
| | | | | | | | 16,807,538 | |
| Capital Markets 0.5% | |
| 3i Group PLC | | | 33,208 | | | | 228,409 | |
| Ameriprise Financial, Inc. | | | 627 | | | | 75,240 | |
| Bank of New York Mellon Corp. | | | 3,369 | | | | 126,270 | |
| BlackRock, Inc. | | | 314 | | | | 100,354 | |
| Credit Suisse Group AG (Registered)* | | | 6,854 | | | | 196,005 | |
| Morgan Stanley | | | 8,070 | | | | 260,903 | |
| State Street Corp. | | | 1,724 | | | | 115,956 | |
| The Goldman Sachs Group, Inc. | | | 1,097 | | | | 183,682 | |
| UBS AG (Registered)* | | | 913 | | | | 16,751 | |
| | | | | | | | 1,303,570 | |
| Consumer Finance 0.2% | |
| American Express Co. | | | 549 | | | | 52,084 | |
| Capital One Financial Corp. | | | 3,526 | | | | 291,247 | |
| Discover Financial Services | | | 1,959 | | | | 121,419 | |
| | | | | | | | 464,750 | |
| Diversified Financial Services 0.5% | |
| Berkshire Hathaway, Inc. "B"* | | | 3,134 | | | | 396,639 | |
| CME Group, Inc. | | | 2,038 | | | | 144,596 | |
| EXOR SpA | | | 1,762 | | | | 72,357 | |
| ING Groep NV (CVA)* | | | 3,416 | | | | 47,992 | |
| Intercontinental Exchange, Inc. | | | 314 | | | | 59,315 | |
| Investor AB "B" | | | 6,167 | | | | 231,393 | |
| Leucadia National Corp. | | | 627 | | | | 16,440 | |
| The NASDAQ OMX Group, Inc. | | | 1,176 | | | | 45,417 | |
| Voya Financial, Inc. | | | 4,800 | | | | 174,432 | |
| | | | | | | | 1,188,581 | |
| Insurance 5.0% | |
| ACE Ltd. | | | 3,526 | | | | 365,646 | |
| Aegon NV | | | 25,449 | | | | 222,117 | |
| Aflac, Inc. | | | 4,578 | | | | 284,980 | |
| Alleghany Corp.* | | | 471 | | | | 206,355 | |
| Allianz SE (Registered) | | | 1,307 | | | | 217,803 | |
| Allstate Corp. | | | 6,582 | | | | 386,495 | |
| American International Group, Inc. | | | 7,444 | | | | 406,294 | |
| Aon PLC | | | 471 | | | | 42,432 | |
| | | Shares | | | Value ($) | |
| | | | | | | | | |
| Arch Capital Group Ltd.* | | | 2,586 | | | | 148,540 | |
| Assurant, Inc. | | | 3,134 | | | | 205,434 | |
| AXA SA | | | 10,958 | | | | 261,909 | |
| Axis Capital Holdings Ltd. | | | 7,914 | | | | 350,432 | |
| Baloise Holding AG (Registered) | | | 3,543 | | | | 417,505 | |
| Chubb Corp. | | | 3,213 | | | | 296,142 | |
| CNP Assurances | | | 6,858 | | | | 142,362 | |
| Delta Lloyd NV | | | 4,442 | | | | 112,768 | |
| Direct Line Insurance Group PLC | | | 87,683 | | | | 404,864 | |
| Everest Re Group Ltd. | | | 3,369 | | | | 540,691 | |
| Friends Life Group Ltd. | | | 61,783 | | | | 333,384 | |
| Great-West Lifeco, Inc. | | | 4,466 | | | | 126,314 | |
| Hannover Rueck SE | | | 3,802 | | | | 342,612 | |
| Hartford Financial Services Group, Inc. | | | 6,626 | | | | 237,277 | |
| Insurance Australia Group Ltd. | | | 2,518 | | | | 13,866 | |
| Intact Financial Corp. | | | 3,134 | | | | 216,110 | |
| Legal & General Group PLC | | | 1,991 | | | | 7,680 | |
| Lincoln National Corp. | | | 4,351 | | | | 223,815 | |
| Loews Corp. | | | 5,877 | | | | 258,647 | |
| Manulife Financial Corp. | | | 4,100 | | | | 81,497 | |
| Mapfre SA | | | 24,168 | | | | 96,334 | |
| Marsh & McLennan Companies, Inc. | | | 1,097 | | | | 56,847 | |
| MetLife, Inc. | | | 6,836 | | | | 379,808 | |
Muenchener Rueckversicherungs- Gesellschaft AG (Registered) | | | 1,302 | | | | 288,640 | |
| Old Mutual PLC | | | 66,684 | | | | 225,621 | |
| PartnerRe Ltd. | | | 3,706 | | | | 404,732 | |
| Power Corp. of Canada | | | 2,429 | | | | 67,494 | |
| Power Financial Corp. | | | 4,075 | | | | 126,827 | |
| Principal Financial Group, Inc. | | | 1,097 | | | | 55,377 | |
| Progressive Corp. | | | 4,936 | | | | 125,177 | |
| Prudential Financial, Inc. | | | 2,351 | | | | 208,698 | |
| RenaissanceRe Holdings Ltd. (a) | | | 3,526 | | | | 377,282 | |
| Sampo Oyj "A" | | | 3,489 | | | | 176,528 | |
| SCOR SE | | | 8,888 | | | | 305,719 | |
| Suncorp Group Ltd. | | | 22,938 | | | | 292,862 | |
| Swiss Life Holding AG (Registered)* | | | 2,090 | | | | 495,633 | |
| Swiss Re AG.* | | | 7,110 | | | | 632,588 | |
| The Travelers Companies, Inc. | | | 3,918 | | | | 368,566 | |
| Torchmark Corp. | | | 1,881 | | | | 154,092 | |
| Unum Group | | | 7,757 | | | | 269,633 | |
| W.R. Berkley Corp. | | | 5,015 | | | | 232,245 | |
| XL Group PLC | | | 11,204 | | | | 366,707 | |
| Zurich Insurance Group AG* | | | 2,086 | | | | 628,764 | |
| | | | | | | | 13,190,145 | |
| Real Estate Investment Trusts 0.4% | |
| CFS Retail Property Trust (REIT) | | | 49,808 | | | | 95,812 | |
| Crown Castle International Corp. (REIT) | | | 1,091 | | | | 81,018 | |
| Dexus Property Group (REIT) | | | 77,801 | | | | 81,432 | |
| Federation Centres Ltd. (REIT) | | | 44,060 | | | | 103,450 | |
| GPT Group (REIT) | | | 19,958 | | | | 72,266 | |
| H&R Real Estate Investment Trust (REIT) (Units) | | | 14,386 | | | | 312,244 | |
| RioCan Real Estate Investment Trust (REIT) | | | 4,858 | | | | 124,335 | |
| Scentre Group (REIT)* | | | 47,536 | | | | 143,437 | |
| Stockland (REIT) | | | 26,778 | | | | 97,971 | |
| Westfield Corp. (REIT) | | | 3,020 | | | | 20,361 | |
| | | | | | | | 1,132,326 | |
| | | Shares | | | Value ($) | |
| | | | | | | | | |
| Real Estate Management & Development 0.5% | |
| Cheung Kong (Holdings) Ltd. | | | 15,670 | | | | 277,800 | |
| First Capital Realty, Inc. | | | 6,425 | | | | 112,116 | |
| Henderson Land Development Co., Ltd. | | | 14,774 | | | | 86,543 | |
| New World Development Co., Ltd. | | | 47,793 | | | | 54,389 | |
| Sun Hung Kai Properties Ltd. | | | 12,536 | | | | 172,098 | |
| Swire Pacific Ltd. "A" | | | 13,320 | | | | 163,870 | |
| Swiss Prime Site AG (Registered)* | | | 3,231 | | | | 267,793 | |
| Wharf Holdings Ltd. | | | 7,835 | | | | 56,611 | |
| Wheelock & Co., Ltd. | | | 14,103 | | | | 59,320 | |
| | | | | | | | 1,250,540 | |
| Thrifts & Mortgage Finance 0.2% | |
| New York Community Bancorp., Inc. (a) | | | 10,499 | | | | 167,774 | |
| Ocwen Financial Corp.* | | | 5,935 | | | | 220,189 | |
| People's United Financial, Inc. | | | 14,025 | | | | 212,759 | |
| | | | | | | | 600,722 | |
| Health Care 4.2% | |
| Biotechnology 1.0% | |
| Actelion Ltd. (Registered)* | | | 2,771 | | | | 350,593 | |
| Alexion Pharmaceuticals, Inc.* | | | 941 | | | | 147,031 | |
| Amgen, Inc. | | | 3,683 | | | | 435,957 | |
| Biogen Idec, Inc.* | | | 627 | | | | 197,699 | |
| Celgene Corp.* | | | 5,642 | | | | 484,535 | |
| CSL Ltd. | | | 4,391 | | | | 275,550 | |
| Gilead Sciences, Inc.* | | | 7,914 | | | | 656,150 | |
| | | | | | | | 2,547,515 | |
| Health Care Equipment & Supplies 0.4% | |
| Abbott Laboratories | | | 5,642 | | | | 230,758 | |
| Baxter International, Inc. | | | 2,664 | | | | 192,607 | |
| Becton, Dickinson & Co. | | | 862 | | | | 101,975 | |
| CareFusion Corp.* | | | 2,116 | | | | 93,845 | |
| Covidien PLC | | | 2,273 | | | | 204,979 | |
| Medtronic, Inc. | | | 3,683 | | | | 234,828 | |
| Stryker Corp. | | | 1,190 | | | | 100,341 | |
| Zimmer Holdings, Inc. | | | 549 | | | | 57,019 | |
| | | | | | | | 1,216,352 | |
| Health Care Providers & Services 1.1% | |
| Aetna, Inc. | | | 3,918 | | | | 317,672 | |
| AmerisourceBergen Corp. | | | 1,411 | | | | 102,523 | |
| Cardinal Health, Inc. | | | 1,959 | | | | 134,309 | |
| CIGNA Corp. | | | 2,508 | | | | 230,661 | |
| Express Scripts Holding Co.* | | | 3,134 | | | | 217,280 | |
| HCA Holdings, Inc.* | | | 3,213 | | | | 181,149 | |
| Humana, Inc. | | | 2,194 | | | | 280,218 | |
| Laboratory Corp. of America Holdings* | | | 862 | | | | 88,269 | |
| McKesson Corp. | | | 1,019 | | | | 189,748 | |
| Omnicare, Inc. (a) | | | 941 | | | | 62,642 | |
| Quest Diagnostics, Inc. (a) | | | 4,231 | | | | 248,317 | |
| UnitedHealth Group, Inc. | | | 4,701 | | | | 384,307 | |
| WellPoint, Inc. | | | 4,153 | | | | 446,904 | |
| | | | | | | | 2,883,999 | |
| Life Sciences Tools & Services 0.1% | |
| Thermo Fisher Scientific, Inc. | | | 2,038 | | | | 240,484 | |
| Pharmaceuticals 1.6% | |
| AbbVie, Inc. | | | 2,741 | | | | 154,702 | |
| Actavis PLC* (a) | | | 1,019 | | | | 227,288 | |
| AstraZeneca PLC | | | 1,718 | | | | 127,619 | |
| Bristol-Myers Squibb Co. | | | 3,369 | | | | 163,430 | |
| Eli Lilly & Co. | | | 3,213 | | | | 199,752 | |
| | | Shares | | | Value ($) | |
| | | | | | | | | |
| GlaxoSmithKline PLC | | | 11,399 | | | | 305,109 | |
| Johnson & Johnson | | | 3,605 | | | | 377,155 | |
| Merck & Co., Inc. | | | 5,563 | | | | 321,819 | |
| Mylan, Inc.* | | | 1,176 | | | | 60,635 | |
| Novartis AG (Registered) | | | 5,595 | | | | 506,629 | |
| Novo Nordisk AS ''B" | | | 3,854 | | | | 177,381 | |
| Otsuka Holdings Co., Ltd. | | | 6,895 | | | | 213,714 | |
| Perrigo Co. PLC | | | 392 | | | | 57,138 | |
| Pfizer, Inc. | | | 13,555 | | | | 402,312 | |
| Roche Holding AG (Genusschein) | | | 1,112 | | | | 331,669 | |
| Sanofi | | | 1,531 | | | | 162,639 | |
| Teva Pharmaceutical Industries Ltd. | | | 7,856 | | | | 415,293 | |
| | | | | | | | 4,204,284 | |
| Industrials 5.9% | |
| Aerospace & Defense 1.1% | |
| Airbus Group NV | | | 2,936 | | | | 196,752 | |
| BAE Systems PLC | | | 42,925 | | | | 318,016 | |
| Boeing Co. | | | 1,489 | | | | 189,445 | |
| General Dynamics Corp. | | | 1,567 | | | | 182,634 | |
| Honeywell International, Inc. | | | 2,821 | | | | 262,212 | |
| L-3 Communications Holdings, Inc. | | | 1,881 | | | | 227,131 | |
| Lockheed Martin Corp. | | | 1,567 | | | | 251,864 | |
| Meggitt PLC | | | 8,369 | | | | 72,473 | |
| Northrop Grumman Corp. | | | 2,038 | | | | 243,806 | |
| Precision Castparts Corp. | | | 627 | | | | 158,255 | |
| Raytheon Co. | | | 2,664 | | | | 245,754 | |
| Rockwell Collins, Inc. | | | 941 | | | | 73,530 | |
| Rolls-Royce Holdings PLC* | | | 7,501 | | | | 137,230 | |
| Safran SA | | | 1,352 | | | | 88,519 | |
| Thales SA | | | 506 | | | | 30,607 | |
| United Technologies Corp. | | | 2,586 | | | | 298,554 | |
| | | | | | | | 2,976,782 | |
| Air Freight & Logistics 0.2% | |
| FedEx Corp. | | | 784 | | | | 118,682 | |
| Royal Mail PLC* | | | 23,937 | | | | 204,419 | |
| United Parcel Service, Inc. "B" | | | 1,176 | | | | 120,728 | |
| | | | | | | | 443,829 | |
| Airlines 1.1% | |
| American Airlines Group, Inc.* | | | 2,600 | | | | 111,696 | |
| Cathay Pacific Airways Ltd. | | | 123,791 | | | | 231,277 | |
| Delta Air Lines, Inc. | | | 12,144 | | | | 470,216 | |
| Deutsche Lufthansa AG (Registered) | | | 22,684 | | | | 487,040 | |
| easyJet PLC | | | 9,936 | | | | 232,111 | |
| Japan Airlines Co., Ltd. | | | 7,365 | | | | 407,127 | |
| Singapore Airlines Ltd. | | | 34,474 | | | | 286,431 | |
| Southwest Airlines Co. | | | 14,253 | | | | 382,835 | |
| United Continental Holdings, Inc.* | | | 5,109 | | | | 209,827 | |
| | | | | | | | 2,818,560 | |
| Building Products 0.0% | |
| Congoleum Corp.* | | | 3,800 | | | | 0 | |
| Commercial Services & Supplies 0.2% | |
| Babcock International Group PLC | | | 5,273 | | | | 104,861 | |
| Cintas Corp. | | | 1,567 | | | | 99,567 | |
| G4S PLC | | | 30 | | | | 131 | |
| Republic Services, Inc. | | | 5,171 | | | | 196,343 | |
| Societe BIC SA | | | 577 | | | | 78,945 | |
| Tyco International Ltd. | | | 2,351 | | | | 107,206 | |
| Waste Management, Inc. | | | 2,194 | | | | 98,138 | |
| | | | | | | | 685,191 | |
| | | Shares | | | Value ($) | |
| | | | | | | | | |
| Construction & Engineering 0.0% | |
| Jacobs Engineering Group, Inc.* | | | 549 | | | | 29,251 | |
| Electrical Equipment 0.3% | |
| ABB Ltd. (Registered)* | | | 8,638 | | | | 198,904 | |
| AMETEK, Inc. | | | 1,332 | | | | 69,637 | |
| Eaton Corp. PLC | | | 2,821 | | | | 217,725 | |
| Emerson Electric Co. | | | 2,273 | | | | 150,836 | |
| Sumitomo Electric Industries Ltd. | | | 3,605 | | | | 50,710 | |
| | | | | | | | 687,812 | |
| Industrial Conglomerates 0.6% | |
| 3M Co. (a) | | | 1,724 | | | | 246,946 | |
| Danaher Corp. | | | 2,664 | | | | 209,737 | |
| General Electric Co. | | | 14,338 | | | | 376,803 | |
| Hutchison Whampoa Ltd. | | | 18,021 | | | | 246,235 | |
| Koninklijke Philips NV | | | 2,934 | | | | 93,106 | |
| Roper Industries, Inc. | | | 862 | | | | 125,861 | |
| Sembcorp Industries Ltd. | | | 21,938 | | | | 94,480 | |
| Siemens AG (Registered) | | | 1,248 | | | | 164,822 | |
| Smiths Group PLC | | | 250 | | | | 5,549 | |
| Toshiba Corp. | | | 10,031 | | | | 46,835 | |
| | | | | | | | 1,610,374 | |
| Machinery 0.4% | |
| AGCO Corp. | | | 3,761 | | | | 211,443 | |
| Caterpillar, Inc. | | | 862 | | | | 93,673 | |
| Deere & Co. | | | 3,996 | | | | 361,838 | |
| Illinois Tool Works, Inc. | | | 549 | | | | 48,070 | |
| PACCAR, Inc. | | | 1,254 | | | | 78,789 | |
| Parker Hannifin Corp. | | | 627 | | | | 78,833 | |
| Schindler Holding AG (Registered) | | | 503 | | | | 75,836 | |
| SKF AB "B" | | | 29 | | | | 740 | |
| Stanley Black & Decker, Inc. | | | 1,332 | | | | 116,976 | |
| Yangzijiang Shipbuilding Holdings Ltd. | | | 141,107 | | | | 122,220 | |
| | | | | | | | 1,188,418 | |
| Marine 0.3% | |
| A P Moller-Maersk AS "A" | | | 149 | | | | 350,550 | |
| A P Moller-Maersk AS "B" | | | 118 | | | | 293,220 | |
| Nippon Yusen Kabushiki Kaisha | | | 83,050 | | | | 239,382 | |
| | | | | | | | 883,152 | |
| Professional Services 0.2% | |
| Adecco SA (Registered)* | | | 393 | | | | 32,351 | |
| Equifax, Inc. | | | 1,411 | | | | 102,354 | |
| Nielsen NV | | | 4,545 | | | | 220,023 | |
| SGS SA (Registered) | | | 46 | | | | 110,228 | |
| | | | | | | | 464,956 | |
| Road & Rail 0.4% | |
| Canadian National Railway Co. | | | 236 | | | | 15,349 | |
| Central Japan Railway Co. | | | 1,411 | | | | 201,263 | |
| CSX Corp. | | | 3,840 | | | | 118,310 | |
| East Japan Railway Co. | | | 1,097 | | | | 86,402 | |
| MTR Corp., Ltd. | | | 27,814 | | | | 107,303 | |
| Norfolk Southern Corp. | | | 862 | | | | 88,812 | |
| Union Pacific Corp. | | | 2,194 | | | | 218,852 | |
| West Japan Railway Co. | | | 3,761 | | | | 165,580 | |
| | | | | | | | 1,001,871 | |
| Trading Companies & Distributors 1.1% | |
| ITOCHU Corp. | | | 41,839 | | | | 537,314 | |
| Marubeni Corp. | | | 78,349 | | | | 573,087 | |
| Mitsubishi Corp. | | | 28,128 | | | | 585,023 | |
| Mitsui & Co., Ltd. | | | 29,851 | | | | 478,535 | |
| Sumitomo Corp. | | | 39,566 | | | | 534,290 | |
| | | Shares | | | Value ($) | |
| | | | | | | | | |
| W.W. Grainger, Inc. (a) | | | 627 | | | | 159,427 | |
| | | | | | | | 2,867,676 | |
| Information Technology 6.9% | |
| Communications Equipment 1.0% | |
| Cisco Systems, Inc. | | | 25,699 | | | | 638,620 | |
| Harris Corp. | | | 3,369 | | | | 255,202 | |
| Juniper Networks, Inc.* | | | 7,764 | | | | 190,529 | |
| Motorola Solutions, Inc. | | | 6,190 | | | | 412,068 | |
| QUALCOMM, Inc. | | | 8,070 | | | | 639,144 | |
| Telefonaktiebolaget LM Ericsson "B" | | | 29,658 | | | | 358,432 | |
| | | | | | | | 2,493,995 | |
| Electronic Equipment, Instruments & Components 0.7% | |
| Amphenol Corp. "A" | | | 784 | | | | 75,531 | |
| Arrow Electronics, Inc.* | | | 5,328 | | | | 321,864 | |
| Avnet, Inc. | | | 6,660 | | | | 295,105 | |
| Corning, Inc. | | | 16,140 | | | | 354,273 | |
| Flextronics International Ltd.* | | | 30,008 | | | | 332,188 | |
| FUJIFILM Holdings Corp. | | | 2,821 | | | | 78,667 | |
| Hitachi Ltd. | | | 5,485 | | | | 40,174 | |
| Kyocera Corp. | | | 2,429 | | | | 115,282 | |
| Murata Manufacturing Co., Ltd. | | | 706 | | | | 66,074 | |
| TE Connectivity Ltd. | | | 4,388 | | | | 271,354 | |
| | | | | | | | 1,950,512 | |
| Internet Software & Services 0.6% | |
| Dena Co., Ltd. | | | 7,900 | | | | 106,836 | |
| eBay, Inc.* | | | 5,642 | | | | 282,438 | |
| Facebook, Inc. "A"* | | | 3,369 | | | | 226,700 | |
| Google, Inc. "A"* | | | 392 | | | | 229,191 | |
| Google, Inc. "C"* | | | 784 | | | | 451,019 | |
| LinkedIn Corp. "A"* | | | 127 | | | | 21,777 | |
| VeriSign, Inc.* (a) | | | 2,821 | | | | 137,693 | |
| Yahoo!, Inc.* | | | 6,347 | | | | 222,970 | |
| | | | | | | | 1,678,624 | |
| IT Services 1.7% | |
| Accenture PLC "A" | | | 4,075 | | | | 329,423 | |
| Alliance Data Systems Corp.* | | | 549 | | | | 154,406 | |
| AtoS | | | 1,677 | | | | 139,708 | |
| Automatic Data Processing, Inc. | | | 3,232 | | | | 256,233 | |
| CGI Group, Inc. "A"* | | | 4,701 | | | | 166,620 | |
| Cognizant Technology Solutions Corp. "A"* | | | 3,291 | | | | 160,963 | |
| Computer Sciences Corp. | | | 3,840 | | | | 242,688 | |
| Fidelity National Information Services, Inc. | | | 5,798 | | | | 317,382 | |
| Fiserv, Inc.* | | | 3,761 | | | | 226,863 | |
| FleetCor Technologies, Inc.* | | | 784 | | | | 103,331 | |
| International Business Machines Corp. | | | 3,056 | | | | 553,961 | |
| Itochu Techno-Solutions Corp. | | | 627 | | | | 27,264 | |
| MasterCard, Inc. "A" | | | 3,134 | | | | 230,255 | |
| Nomura Research Institute Ltd. | | | 1,803 | | | | 56,775 | |
| Paychex, Inc. | | | 3,056 | | | | 127,007 | |
| Total System Services, Inc. | | | 5,250 | | | | 164,902 | |
| Vantiv, Inc. "A"* | | | 3,369 | | | | 113,266 | |
| Visa, Inc. "A" | | | 1,646 | | | | 346,829 | |
| Western Union Co. (a) | | | 12,458 | | | | 216,022 | |
| Xerox Corp. | | | 34,004 | | | | 423,010 | |
| | | | | | | | 4,356,908 | |
| Semiconductors & Semiconductor Equipment 0.8% | |
| Analog Devices, Inc. | | | 2,586 | | | | 139,825 | |
| ASML Holding NV | | | 15 | | | | 1,397 | |
| | | Shares | | | Value ($) | |
| | | | | | | | | |
| Avago Technologies Ltd. | | | 1,646 | | | | 118,627 | |
| Broadcom Corp. "A" | | | 7,209 | | | | 267,598 | |
| Intel Corp. | | | 21,473 | | | | 663,516 | |
| KLA-Tencor Corp. | | | 3,056 | | | | 221,988 | |
| Lam Research Corp. | | | 2,664 | | | | 180,033 | |
| Marvell Technology Group Ltd. | | | 4,623 | | | | 66,248 | |
| Maxim Integrated Products, Inc. | | | 4,388 | | | | 148,358 | |
| Microchip Technology, Inc. (a) | | | 3,291 | | | | 160,634 | |
| Micron Technology, Inc.* | | | 5,093 | | | | 167,814 | |
| Texas Instruments, Inc. | | | 1,646 | | | | 78,662 | |
| | | | | | | | 2,214,700 | |
| Software 1.2% | |
| Activision Blizzard, Inc. | | | 15,827 | | | | 352,942 | |
| ANSYS, Inc.* | | | 784 | | | | 59,443 | |
| CA, Inc. | | | 12,536 | | | | 360,285 | |
| GungHo Online Entertainment, Inc. (a) | | | 10,734 | | | | 69,296 | |
| Intuit, Inc. | | | 3,134 | | | | 252,381 | |
| Microsoft Corp. | | | 14,249 | | | | 594,183 | |
| Nexon Co., Ltd. | | | 17,394 | | | | 166,033 | |
| NICE Systems Ltd. | | | 2,086 | | | | 85,227 | |
| Oracle Corp. | | | 10,813 | | | | 438,251 | |
| SAP AG | | | 2,389 | | | | 184,499 | |
| Symantec Corp. | | | 13,241 | | | | 303,219 | |
| Synopsys, Inc.* | | | 5,407 | | | | 209,900 | |
| The Sage Group PLC | | | 1,325 | | | | 8,710 | |
| VMware, Inc. "A"* | | | 784 | | | | 75,899 | |
| | | | | | | | 3,160,268 | |
| Technology Hardware, Storage & Peripherals 0.9% | |
| Apple, Inc. | | | 8,778 | | | | 815,739 | |
| Canon, Inc. (a) | | | 6,974 | | | | 226,902 | |
| EMC Corp. | | | 12,458 | | | | 328,144 | |
| Hewlett-Packard Co. | | | 13,006 | | | | 438,042 | |
| NetApp, Inc. | | | 2,586 | | | | 94,441 | |
| Ricoh Co., Ltd. | | | 12,047 | | | | 143,534 | |
| Seagate Technology PLC | | | 3,683 | | | | 209,268 | |
| Western Digital Corp. | | | 1,959 | | | | 180,816 | |
| | | | | | | | 2,436,886 | |
| Materials 2.0% | |
| Chemicals 0.5% | |
| Agrium, Inc. | | | 1,176 | | | | 107,731 | |
| Asahi Kasei Corp. | | | 19,219 | | | | 147,028 | |
| Ashland, Inc. | | | 862 | | | | 93,734 | |
| BASF SE | | | 8 | | | | 931 | |
| CF Industries Holdings, Inc. | | | 236 | | | | 56,765 | |
| Dow Chemical Co. | | | 784 | | | | 40,345 | |
| E.I. du Pont de Nemours & Co. | | | 1,489 | | | | 97,440 | |
| Ecolab, Inc. | | | 392 | | | | 43,645 | |
| LyondellBasell Industries NV "A" | | | 2,273 | | | | 221,958 | |
| Mitsubishi Chemical Holdings Corp. | | | 38,235 | | | | 169,464 | |
| Monsanto Co. | | | 1,019 | | | | 127,110 | |
| Praxair, Inc. | | | 549 | | | | 72,929 | |
| Syngenta AG (Registered) | | | 306 | | | | 113,974 | |
| | | | | | | | 1,293,054 | |
| Construction Materials 0.1% | |
| Fletcher Building Ltd. | | | 8,805 | | | | 67,918 | |
| Holcim Ltd. (Registered)* | | | 3,225 | | | | 283,479 | |
| | | | | | | | 351,397 | |
| Containers & Packaging 0.1% | |
| Rock-Tenn Co. "A" | | | 2,978 | | | | 314,447 | |
| | | Shares | | | Value ($) | |
| | | | | | | | | |
| Metals & Mining 1.2% | |
| Anglo American PLC | | | 6,850 | | | | 167,640 | |
| Barrick Gold Corp. | | | 15,984 | | | | 292,702 | |
| BHP Billiton Ltd. | | | 1,942 | | | | 65,740 | |
| BHP Billiton PLC | | | 3,311 | | | | 107,068 | |
| Boliden AB | | | 21,615 | | | | 313,636 | |
| Fortescue Metals Group Ltd. | | | 54,098 | | | | 221,901 | |
| Freeport-McMoRan Copper & Gold, Inc. | | | 7,600 | | | | 277,400 | |
| Glencore PLC | | | 26,125 | | | | 145,555 | |
| Goldcorp, Inc. | | | 5,485 | | | | 153,079 | |
| JFE Holdings, Inc. | | | 3,600 | | | | 74,306 | |
| Mitsubishi Materials Corp. | | | 18,804 | | | | 65,894 | |
| Newmont Mining Corp. | | | 7,383 | | | | 187,824 | |
| Nucor Corp. | | | 4,075 | | | | 200,694 | |
| Rio Tinto PLC | | | 5,732 | | | | 304,936 | |
| Silver Wheaton Corp. | | | 9,011 | | | | 237,129 | |
| Yamana Gold, Inc. | | | 37,843 | | | | 311,383 | |
| | | | | | | | 3,126,887 | |
| Paper & Forest Products 0.1% | |
| International Paper Co. | | | 6,974 | | | | 351,978 | |
| Telecommunication Services 3.4% | |
| Diversified Telecommunication Services 2.9% | |
| AT&T, Inc. | | | 18,726 | | | | 662,151 | |
| BCE, Inc. | | | 7,365 | | | | 334,067 | |
| Bell Aliant, Inc. | | | 4,153 | | | | 108,549 | |
| BT Group PLC | | | 57,981 | | | | 381,931 | |
| CenturyLink, Inc. | | | 10,891 | | | | 394,254 | |
| Deutsche Telekom AG (Registered) | | | 10,731 | | | | 188,083 | |
| Elisa Oyj | | | 5,325 | | | | 162,893 | |
| Frontier Communications Corp. (a) | | | 19,300 | | | | 112,712 | |
| HKT Trust & HKT Ltd. | | | 147,000 | | | | 172,408 | |
| Iliad SA | | | 47 | | | | 14,207 | |
| Nippon Telegraph & Telephone Corp. | | | 11,283 | | | | 703,677 | |
| Orange SA | | | 19,399 | | | | 306,139 | |
| PCCW Ltd. | | | 254,633 | | | | 151,786 | |
| Singapore Telecommunications Ltd. | | | 76,045 | | | | 234,801 | |
| Swisscom AG (Registered) | | | 606 | | | | 352,270 | |
| TDC AS | | | 29,141 | | | | 301,587 | |
| Telecom Corp. of New Zealand Ltd. | | | 113,327 | | | | 265,919 | |
| Telecom Italia SpA (RSP) | | | 204,986 | | | | 202,516 | |
| Telefonica SA | | | 14,181 | | | | 243,114 | |
| Telenor ASA | | | 8,848 | | | | 201,516 | |
| TeliaSonera AB | | | 52,444 | | | | 383,113 | |
| Telstra Corp., Ltd. | | | 66,244 | | | | 325,441 | |
| TELUS Corp. | | | 7,287 | | | | 271,594 | |
| Verizon Communications, Inc. (c) | | | 13,851 | | | | 677,729 | |
| Verizon Communications, Inc. (c) | | | 2,351 | | | | 115,199 | |
| Vivendi SA* | | | 4,103 | | | | 100,398 | |
| Ziggo NV | | | 3,186 | | | | 147,325 | |
| | | | | | | | 7,515,379 | |
| Wireless Telecommunication Services 0.5% | |
| KDDI Corp. | | | 4,780 | | | | 291,552 | |
| NTT DoCoMo, Inc. | | | 26,169 | | | | 447,408 | |
| Rogers Communications, Inc. "B" | | | 6,503 | | | | 261,692 | |
| Softbank Corp. | | | 471 | | | | 35,070 | |
| Vodafone Group PLC | | | 112,387 | | | | 375,061 | |
| | | | | | | | 1,410,783 | |
| | | Shares | | | Value ($) | |
| | | | | | | | | |
| Utilities 3.7% | |
| Electric Utilities 2.1% | |
| American Electric Power Co., Inc. | | | 4,388 | | | | 244,719 | |
| Cheung Kong Infrastructure Holdings Ltd. | | | 30,556 | | | | 211,515 | |
| CLP Holdings Ltd. | | | 10,969 | | | | 89,729 | |
| Duke Energy Corp. | | | 5,407 | | | | 401,145 | |
| E.ON SE | | | 13,270 | | | | 274,013 | |
| Edison International | | | 3,056 | | | | 177,584 | |
| EDP — Energias de Portugal SA | | | 90,266 | | | | 452,875 | |
| Electricite de France SA (a) | | | 4,493 | | | | 141,502 | |
| Enel SpA | | | 13,335 | | | | 77,676 | |
| Entergy Corp. | | | 5,171 | | | | 424,487 | |
| Exelon Corp. | | | 6,503 | | | | 237,229 | |
| FirstEnergy Corp. | | | 4,936 | | | | 171,378 | |
| Fortum Oyj | | | 9,387 | | | | 252,060 | |
| Iberdrola SA | | | 33,374 | | | | 255,138 | |
| NextEra Energy, Inc. | | | 2,743 | | | | 281,103 | |
| Northeast Utilities | | | 3,369 | | | | 159,253 | |
| OGE Energy Corp. | | | 6,660 | | | | 260,273 | |
| Pinnacle West Capital Corp. | | | 5,955 | | | | 344,437 | |
| Power Assets Holdings Ltd. | | | 26,247 | | | | 229,946 | |
| PPL Corp. | | | 6,112 | | | | 217,159 | |
| Southern Co. | | | 6,245 | | | | 283,398 | |
| SSE PLC | | | 7,389 | | | | 198,155 | |
| Tokyo Electric Power Co., Inc.* | | | 17,300 | | | | 72,066 | |
| Xcel Energy, Inc. | | | 6,738 | | | | 217,166 | |
| | | | | | | | 5,674,006 | |
| Gas Utilities 0.0% | |
| Enagas SA (a) | | | 22 | | | | 708 | |
| Independent Power & Renewable Eletricity Producers 0.2% | |
| AES Corp. | | | 7,914 | | | | 123,063 | |
| Electric Power Development Co., Ltd. | | | 9,402 | | | | 305,341 | |
| | | | | | | | 428,404 | |
| Multi-Utilities 1.3% | |
| AGL Energy Ltd. | | | 3,971 | | | | 57,964 | |
| Alliant Energy Corp. | | | 2,508 | | | | 152,637 | |
| Ameren Corp. | | | 5,955 | | | | 243,440 | |
| Centrica PLC | | | 42,247 | | | | 226,015 | |
| CMS Energy Corp. | | | 2,664 | | | | 82,984 | |
| Consolidated Edison, Inc. | | | 4,310 | | | | 248,859 | |
| Dominion Resources, Inc. | | | 3,291 | | | | 235,372 | |
| DTE Energy Co. | | | 2,194 | | | | 170,847 | |
| GDF Suez | | | 5,853 | | | | 161,132 | |
| Integrys Energy Group, Inc. (a) | | | 4,545 | | | | 323,286 | |
| National Grid PLC | | | 19,631 | | | | 282,210 | |
| NiSource, Inc. | | | 5,250 | | | | 206,535 | |
| PG&E Corp. | | | 6,738 | | | | 323,559 | |
| Public Service Enterprise Group, Inc. | | | 5,720 | | | | 233,319 | |
| SCANA Corp. | | | 3,605 | | | | 193,985 | |
| Sempra Energy | | | 1,567 | | | | 164,081 | |
| Wisconsin Energy Corp. | | | 1,332 | | | | 62,497 | |
| | | | | | | | 3,368,722 | |
| Water Utilities 0.1% | |
| American Water Works Co., Inc. | | | 6,503 | | | | 321,573 | |
Total Common Stocks (Cost $128,838,971) | | | | 145,273,333 | |
| | |
| | | Shares | | | Value ($) | |
| | | | | | | | | |
| Preferred Stocks 0.4% | |
| Consumer Discretionary 0.4% | |
| Bayerische Motoren Werke (BMW) AG | | | 2,391 | | | | 229,213 | |
| Porsche Automobil Holding SE | | | 3,859 | | | | 402,069 | |
| Volkswagen AG | | | 1,322 | | | | 347,199 | |
| | | | | | | | 978,481 | |
| Financials 0.0% | |
| Ally Financial, Inc. Series G, 144A, 7.0% | | | 75 | | | | 75,565 | |
Total Preferred Stocks (Cost $921,217) | | | | 1,054,046 | |
| | |
| Rights 0.0% | |
| Telecommunication Services | |
| HKT Trust & HKT Ltd., Expiration Date 7/15/2014* (Cost $0) | | | 26,460 | | | | 7,818 | |
| | |
| Warrants 0.0% | |
| Materials | |
| GEO Specialty Chemicals, Inc., Expiration Date 3/31/2015* | | | 19,324 | | | | 14,792 | |
| Hercules Trust II, Expiration Date 3/31/2029* | | | 170 | | | | 1,094 | |
Total Warrants (Cost $30,283) | | | | 15,886 | |
| | | Principal Amount ($)(d) | | | Value ($) | |
| | | | |
| Corporate Bonds 26.6% | |
| Consumer Discretionary 3.8% | |
| AmeriGas Finance LLC: | |
| 6.75%, 5/20/2020 | | | | 110,000 | | | | 119,350 | |
| 7.0%, 5/20/2022 | | | | 195,000 | | | | 215,962 | |
| APX Group, Inc.: | |
| 6.375%, 12/1/2019 (e) | | | | 50,000 | | | | 51,875 | |
| 144A, 8.75%, 12/1/2020 | | | | 50,000 | | | | 50,750 | |
| Asbury Automotive Group, Inc., 8.375%, 11/15/2020 | | | | 15,000 | | | | 16,650 | |
| Ashtead Capital, Inc., 144A, 6.5%, 7/15/2022 | | | | 80,000 | | | | 87,400 | |
| Ashton Woods U.S.A. LLC, 144A, 6.875%, 2/15/2021 | | | | 80,000 | | | | 80,000 | |
| Avis Budget Car Rental LLC, 5.5%, 4/1/2023 | | | | 50,000 | | | | 51,125 | |
| BC Mountain LLC, 144A, 7.0%, 2/1/2021 | | | | 50,000 | | | | 48,375 | |
| Block Communications, Inc., 144A, 7.25%, 2/1/2020 | | | | 20,000 | | | | 21,300 | |
| Boyd Gaming Corp., 9.0%, 7/1/2020 (a) | | | | 40,000 | | | | 44,100 | |
| CCO Holdings LLC: | |
| 6.5%, 4/30/2021 | | | | 420,000 | | | | 447,300 | |
| 6.625%, 1/31/2022 | | | | 705,000 | | | | 757,875 | |
| 7.375%, 6/1/2020 | | | | 10,000 | | | | 10,900 | |
| Cequel Communications Holdings I LLC: | | | | | | | | |
| 144A, 5.125%, 12/15/2021 | | | | 385,000 | | | | 383,556 | |
| 144A, 6.375%, 9/15/2020 | | | | 285,000 | | | | 302,812 | |
| Clear Channel Communications, Inc.: | |
| 9.0%, 12/15/2019 | | | | 250,000 | | | | 266,562 | |
| 11.25%, 3/1/2021 | | | | 70,000 | | | | 79,363 | |
| | | Principal Amount ($)(d) | | | Value ($) | |
| | | | | | | | | |
| Clear Channel Worldwide Holdings, Inc.: | | |
| Series A, 6.5%, 11/15/2022 | | | 65,000 | | | | 69,388 | |
| Series B, 6.5%, 11/15/2022 | | | 370,000 | | | | 398,675 | |
| Series A, 7.625%, 3/15/2020 | | | 10,000 | | | | 10,700 | |
| Series B, 7.625%, 3/15/2020 | | | 255,000 | | | | 275,081 | |
| Cogeco Cable, Inc., 144A, 4.875%, 5/1/2020 | | | | 5,000 | | | | 5,063 | |
| Columbus International, Inc., 144A, 7.375%, 3/30/2021 | | | 500,000 | | | | 538,750 | |
| Cumulus Media Holdings, Inc., 7.75%, 5/1/2019 (a) | | | 50,000 | | | | 52,688 | |
| Delphi Corp., 5.0%, 2/15/2023 | | | 70,000 | | | | 75,250 | |
| DISH DBS Corp.: | |
| 4.25%, 4/1/2018 | | | | 70,000 | | | | 72,800 | |
| 5.0%, 3/15/2023 | | | | 715,000 | | | | 728,406 | |
| 7.875%, 9/1/2019 | | | | 270,000 | | | | 320,625 | |
| Getty Images, Inc., 144A, 7.0%, 10/15/2020 (a) | | | | 60,000 | | | | 54,975 | |
| Harron Communications LP, 144A, 9.125%, 4/1/2020 | | | 45,000 | | | | 50,175 | |
| Hot Topic, Inc., 144A, 9.25%, 6/15/2021 | | | | 40,000 | | | | 44,400 | |
| Isle of Capri Casinos, Inc., 5.875%, 3/15/2021 | | | | 35,000 | | | | 35,394 | |
| Jo-Ann Stores Holdings, Inc., 144A, 9.75%, 10/15/2019 (PIK) | | | 40,000 | | | | 40,900 | |
| Johnson Controls, Inc., 4.95%, 7/2/2064 | | | | 100,000 | | | | 101,301 | |
| Live Nation Entertainment, Inc., 144A, 7.0%, 9/1/2020 | | | 90,000 | | | | 98,550 | |
| MDC Partners, Inc., 144A, 6.75%, 4/1/2020 | | | | 40,000 | | | | 42,200 | |
| Mediacom Broadband LLC, 6.375%, 4/1/2023 | | | | 35,000 | | | | 36,925 | |
| MGM Resorts International: | |
| 6.625%, 12/15/2021 (a) | | | | 250,000 | | | | 278,125 | |
| 6.75%, 10/1/2020 | | | | 130,000 | | | | 145,112 | |
| 8.625%, 2/1/2019 | | | | 240,000 | | | | 285,900 | |
| Numericable Group SA: | |
| 144A, 6.0%, 5/15/2022 | | | | 200,000 | | | | 208,000 | |
| 144A, 6.25%, 5/15/2024 | | | | 350,000 | | | | 365,312 | |
| Pinnacle Entertainment, Inc., 6.375%, 8/1/2021 | | | | 70,000 | | | | 73,850 | |
| Quebecor Media, Inc., 5.75%, 1/15/2023 | | | | 50,000 | | | | 51,375 | |
| RCI Banque SA, 144A, 3.5%, 4/3/2018 | | | | 100,000 | | | | 104,253 | |
| Schaeffler Finance BV, 144A, 7.75%, 2/15/2017 | | | | 845,000 | | | | 952,737 | |
| Seminole Hard Rock Entertainment, Inc., 144A, 5.875%, 5/15/2021 | | | | 35,000 | | | | 35,088 | |
| Serta Simmons Holdings LLC, 144A, 8.125%, 10/1/2020 | | | 55,000 | | | | 59,675 | |
| Sirius XM Radio, Inc., 144A, 5.875%, 10/1/2020 | | | | 60,000 | | | | 63,450 | |
| Springs Industries, Inc., 6.25%, 6/1/2021 | | | | 85,000 | | | | 86,700 | |
| Starz LLC, 5.0%, 9/15/2019 | | | | 40,000 | | | | 41,650 | |
| Taylor Morrison Communities, Inc., 144A, 5.25%, 4/15/2021 | | | 65,000 | | | | 65,975 | |
| The Men's Wearhouse, Inc., 144A, 7.0%, 7/1/2022 (a) | | | 50,000 | | | | 51,750 | |
| Time Warner Cable, Inc., 7.3%, 7/1/2038 | | | | 45,000 | | | | 60,535 | |
| Travelport LLC, 144A, 6.352%**, 3/1/2016 | | | | 11,826 | | | | 11,915 | |
| | | Principal Amount ($)(d) | | | Value ($) | |
| | | | | | | | | |
Unitymedia Hessen GmbH & Co., KG: | |
| 144A, 5.5%, 1/15/2023 | | | | 200,000 | | | | 207,000 | |
| 144A, 7.5%, 3/15/2019 | EUR | | | 400,000 | | | | 586,061 | |
| Unitymedia KabelBW GmbH, 144A, 9.625%, 12/1/2019 | EUR | | | 110,000 | | | | 161,584 | |
| Viking Cruises Ltd., 144A, 8.5%, 10/15/2022 | | | | 50,000 | | | | 55,250 | |
| Weyerhaeuser Real Estate Co.: | |
| 144A, 4.375%, 6/15/2019 | | | | 50,000 | | | | 50,125 | |
| 144A, 5.875%, 6/15/2024 | | | | 20,000 | | | | 20,575 | |
| | | | | 10,109,498 | |
| Consumer Staples 1.5% | |
| Ajecorp BV, 144A, 6.5%, 5/14/2022 | | | 500,000 | | | | 460,000 | |
| Big Heart Pet Brands, 7.625%, 2/15/2019 | | | | 66,000 | | | | 68,779 | |
| BRF SA, 144A, 5.875%, 6/6/2022 | | | 200,000 | | | | 216,500 | |
| Chiquita Brands International, Inc., 7.875%, 2/1/2021 | | | | 44,000 | | | | 47,905 | |
| Controladora Mabe SA de CV, 144A, 7.875%, 10/28/2019 | | | 100,000 | | | | 114,500 | |
| Cott Beverages, Inc., 144A, 5.375%, 7/1/2022 | | | | 85,000 | | | | 85,213 | |
| JBS Investments GmbH, 144A, 7.75%, 10/28/2020 | | | 250,000 | | | | 267,500 | |
| JBS U.S.A. LLC: | |
| 144A, 7.25%, 6/1/2021 | | | | 145,000 | | | | 155,512 | |
| 144A, 8.25%, 2/1/2020 | | | | 370,000 | | | | 401,450 | |
| Marfrig Overseas Ltd., 144A, 9.5%, 5/4/2020 | | | | 100,000 | | | | 107,500 | |
| Minerva Luxembourg SA, 144A, 12.25%, 2/10/2022 | | | | 250,000 | | | | 282,500 | |
| Pilgrim's Pride Corp., 7.875%, 12/15/2018 | | | | 430,000 | | | | 455,284 | |
| Post Holdings, Inc., 144A, 6.0%, 12/15/2022 | | | | 50,000 | | | | 51,000 | |
| Reynolds Group Issuer, Inc., 5.75%, 10/15/2020 | | | | 1,145,000 | | | | 1,207,975 | |
| Smithfield Foods, Inc., 6.625%, 8/15/2022 | | | | 90,000 | | | | 98,550 | |
| | | | | 4,020,168 | |
| Energy 4.5% | |
| Access Midstream Partners LP, 6.125%, 7/15/2022 | | | 15,000 | | | | 16,575 | |
| Afren PLC, 144A, 10.25%, 4/8/2019 | | | | 340,000 | | | | 385,475 | |
| Baytex Energy Corp.: | |
| 144A, 5.125%, 6/1/2021 | | | | 35,000 | | | | 35,219 | |
| 144A, 5.625%, 6/1/2024 | | | | 35,000 | | | | 35,131 | |
| Berry Petroleum Co., LLC: | |
| 6.375%, 9/15/2022 | | | | 50,000 | | | | 53,250 | |
| 6.75%, 11/1/2020 | | | | 50,000 | | | | 52,625 | |
| BreitBurn Energy Partners LP, 7.875%, 4/15/2022 | | | 350,000 | | | | 378,875 | |
| Chaparral Energy, Inc., 7.625%, 11/15/2022 | | | | 85,000 | | | | 91,800 | |
| DCP Midstream LLC, 144A, 9.75%, 3/15/2019 | | | | 200,000 | | | | 257,873 | |
| Delek & Avner Tamar Bond Ltd., 144A, 3.839%, 12/30/2018 | | | 500,000 | | | | 501,782 | |
| Ecopetrol SA, 5.875%, 5/28/2045 | | | 500,000 | | | | 517,140 | |
| Endeavor Energy Resources LP, 144A, 7.0%, 8/15/2021 | | | 85,000 | | | | 90,738 | |
| EP Energy LLC: | |
| 6.875%, 5/1/2019 | | | | 15,000 | | | | 15,956 | |
| 7.75%, 9/1/2022 | | | | 290,000 | | | | 326,975 | |
| | | Principal Amount ($)(d) | | | Value ($) | |
| | | | | | | | | |
| EV Energy Partners LP, 8.0%, 4/15/2019 | | | | 335,000 | | | | 351,750 | |
| Halcon Resources Corp.: | |
| 8.875%, 5/15/2021 | | | | 635,000 | | | | 682,625 | |
| 9.75%, 7/15/2020 | | | | 65,000 | | | | 70,931 | |
| Hilcorp Energy I LP, 144A, 5.0%, 12/1/2024 (e) | | | | 65,000 | | | | 65,000 | |
| Holly Energy Partners LP, 6.5%, 3/1/2020 | | | | 10,000 | | | | 10,775 | |
| Kodiak Oil & Gas Corp., 5.5%, 1/15/2021 | | | | 100,000 | | | | 104,250 | |
| Linn Energy LLC, 6.25%, 11/1/2019 | | | 515,000 | | | | 539,462 | |
| MEG Energy Corp., 144A, 7.0%, 3/31/2024 | | | | 375,000 | | | | 413,437 | |
| Memorial Resource Development Corp., 144A, 5.875%, 7/1/2022 (e) | | | 65,000 | | | | 65,488 | |
| Midstates Petroleum Co., Inc.: | |
| 9.25%, 6/1/2021 (a) | | | | 300,000 | | | | 329,250 | |
| 10.75%, 10/1/2020 | | | | 150,000 | | | | 170,250 | |
| Murphy Oil U.S.A., Inc., 6.0%, 8/15/2023 | | | | 85,000 | | | | 89,463 | |
| Northern Oil & Gas, Inc., 8.0%, 6/1/2020 | | | | 140,000 | | | | 149,450 | |
| Nostrum Oil & Gas Finance BV, 144A, 6.375%, 2/14/2019 | | | 200,000 | | | | 209,000 | |
| Oasis Petroleum, Inc.: | |
| 6.5%, 11/1/2021 | | | | 375,000 | | | | 403,125 | |
| 144A, 6.875%, 3/15/2022 | | | | 115,000 | | | | 125,350 | |
| 6.875%, 1/15/2023 | | | | 35,000 | | | | 38,150 | |
| 7.25%, 2/1/2019 | | | | 60,000 | | | | 63,600 | |
| Offshore Drilling Holding SA, 144A, 8.375%, 9/20/2020 (a) | | | 200,000 | | | | 221,500 | |
| Offshore Group Investment Ltd.: | |
| 7.125%, 4/1/2023 | | | | 300,000 | | | | 304,500 | |
| 7.5%, 11/1/2019 | | | | 140,000 | | | | 148,050 | |
| Pacific Rubiales Energy Corp., 144A, 7.25%, 12/12/2021 | | | 500,000 | | | | 555,000 | |
| Petrobras Global Finance BV, 6.25%, 3/17/2024 | | | | 500,000 | | | | 532,200 | |
| Petroleos de Venezuela SA, 144A, 9.0%, 11/17/2021 | | | 250,000 | | | | 212,475 | |
| PT Pertamina Persero: | |
| 144A, 5.625%, 5/20/2043 | | | | 200,000 | | | | 179,500 | |
| 144A, 6.45%, 5/30/2044 | | | | 500,000 | | | | 496,250 | |
| Reliance Holding U.S.A., Inc., 144A, 5.4%, 2/14/2022 | | | | 250,000 | | | | 269,940 | |
| Rowan Companies, Inc., 4.75%, 1/15/2024 | | | | 100,000 | | | | 105,803 | |
| Sabine Pass Liquefaction LLC: | |
| 5.625%, 2/1/2021 | | | | 175,000 | | | | 185,062 | |
| 144A, 5.75%, 5/15/2024 | | | | 200,000 | | | | 208,500 | |
| SandRidge Energy, Inc, 8.125%, 10/15/2022 | | | | 420,000 | | | | 462,525 | |
| SandRidge Energy, Inc., 7.5%, 3/15/2021 | | | | 240,000 | | | | 260,100 | |
| SESI LLC, 7.125%, 12/15/2021 | | | 380,000 | | | | 428,450 | |
| Seventy Seven Energy, Inc., 144A, 6.5%, 7/15/2022 | | | | 15,000 | | | | 15,375 | |
| Talisman Energy, Inc., 3.75%, 2/1/2021 | | | | 120,000 | | | | 124,058 | |
| Talos Production LLC, 144A, 9.75%, 2/15/2018 | | | | 95,000 | | | | 100,700 | |
| Transocean, Inc., 3.8%, 10/15/2022 | | | 370,000 | | | | 366,198 | |
| Whiting Petroleum Corp., 5.0%, 3/15/2019 | | | | 75,000 | | | | 78,938 | |
| | | | | 11,895,894 | |
| | | Principal Amount ($)(d) | | | Value ($) | |
| | | | | | | | | |
| Financials 3.8% | |
| AerCap Ireland Capital Ltd., 144A, 3.75%, 5/15/2019 | | | | 80,000 | | | | 80,600 | |
| Assured Guaranty U.S. Holdings, Inc., 5.0%, 7/1/2024 | | | | 135,000 | | | | 134,196 | |
| Banco de Bogota SA, 144A, 5.375%, 2/19/2023 | | | | 500,000 | | | | 517,500 | |
| Banco de Credito del Peru, 144A, 6.875%, 9/16/2026 | | | | 100,000 | | | | 111,750 | |
| Banco do Brasil SA, 144A, 9.0%, 12/31/2049 | | | | 500,000 | | | | 495,604 | |
| Banco Nacional de Costa Rica, 144A, 4.875%, 11/1/2018 | | | | 500,000 | | | | 512,500 | |
| Banco Santander Brasil SA, 144A, 8.0%, 3/18/2016 | BRL | | | 300,000 | | | | 129,667 | |
| Barclays Bank PLC, 7.625%, 11/21/2022 | | | | 250,000 | | | | 285,375 | |
| BBVA Bancomer SA, 144A, 6.5%, 3/10/2021 | | | | 500,000 | | | | 563,750 | |
| CIT Group, Inc.: | |
| 5.0%, 5/15/2017 | | | | 935,000 | | | | 996,359 | |
| 5.25%, 3/15/2018 | | | | 10,000 | | | | 10,738 | |
| Citigroup, Inc., 4.05%, 7/30/2022 | | | | 145,000 | | | | 148,552 | |
| Country Garden Holdings Co., Ltd., 144A, 7.25%, 4/4/2021 | | | | 200,000 | | | | 195,000 | |
| Development Bank of Kazakhstan JSC, Series 3, 6.5%, 6/3/2020 | | | | 500,000 | | | | 535,600 | |
| E*TRADE Financial Corp.: | |
| 6.375%, 11/15/2019 | | | | 140,000 | | | | 151,550 | |
| 6.75%, 6/1/2016 | | | | 745,000 | | | | 808,325 | |
| Everest Reinsurance Holdings, Inc., 4.868%, 6/1/2044 | | | | 305,000 | | | | 305,866 | |
| Hospitality Properties Trust, (REIT), 5.0%, 8/15/2022 | | | | 230,000 | | | | 243,322 | |
International Lease Finance Corp.: | |
| 3.875%, 4/15/2018 | | | | 100,000 | | | | 102,500 | |
| 6.25%, 5/15/2019 | | | | 410,000 | | | | 459,200 | |
| 8.75%, 3/15/2017 | | | | 40,000 | | | | 46,500 | |
| Intesa Sanpaolo SpA: | |
| 3.875%, 1/16/2018 | | | | 200,000 | | | | 210,787 | |
| 144A, 5.017%, 6/26/2024 | | | | 235,000 | | | | 237,777 | |
| Jefferies Group LLC, 5.125%, 1/20/2023 | | | | 60,000 | | | | 64,324 | |
| Macquarie Group Ltd., 144A, 6.0%, 1/14/2020 | | | | 235,000 | | | | 266,217 | |
| Morgan Stanley: | |
| 3.75%, 2/25/2023 | | | | 125,000 | | | | 127,160 | |
| 4.1%, 5/22/2023 | | | | 85,000 | | | | 86,225 | |
| MPT Operating Partnership LP, (REIT), 6.375%, 2/15/2022 | | | | 40,000 | | | | 42,900 | |
| Navient Corp., 5.5%, 1/25/2023 | | | | 125,000 | | | | 123,906 | |
| Neuberger Berman Group LLC, 144A, 5.625%, 3/15/2020 | | | | 10,000 | | | | 10,575 | |
| Omega Healthcare Investors, Inc., (REIT), 144A, 4.95%, 4/1/2024 | | | | 130,000 | | | | 132,777 | |
| Popular, Inc., 7.0%, 7/1/2019 (e) | | | | 50,000 | | | | 50,750 | |
| | | Principal Amount ($)(d) | | | Value ($) | |
| | | | | | | | | |
| Royal Bank of Scotland Group PLC, 6.1%, 6/10/2023 | | | 100,000 | | | | 109,459 | |
| Schahin II Finance Co. SPV Ltd., 144A, 5.875%, 9/25/2022 (a) | | | 185,733 | | | | 182,947 | |
| Trust F/1401, (REIT), 144A, 5.25%, 12/15/2024 | | | | 500,000 | | | | 525,000 | |
| Turkiye Is Bankasi: | |
| 144A, 3.875%, 11/7/2017 | | | | 250,000 | | | | 250,725 | |
| 144A, 6.0%, 10/24/2022 | | | | 250,000 | | | | 250,125 | |
| UniCredit SpA, 8.0%, 4/3/2049 | | | 200,000 | | | | 213,000 | |
| Wells Fargo & Co., 5.375%, 11/2/2043 | | | | 70,000 | | | | 77,003 | |
| Woori Bank Co., Ltd., 144A, 4.75%, 4/30/2024 | | | | 200,000 | | | | 201,901 | |
| Yapi ve Kredi Bankasi AS, 144A, 5.25%, 12/3/2018 | | | 200,000 | | | | 204,600 | |
| | | | | 10,202,612 | |
| Health Care 1.7% | |
| Aviv Healthcare Properties LP, 7.75%, 2/15/2019 | | | 10,000 | | | | 10,650 | |
| Biomet, Inc.: | |
| 6.5%, 8/1/2020 | | | | 85,000 | | | | 91,587 | |
| 6.5%, 10/1/2020 | | | | 25,000 | | | | 26,688 | |
| Community Health Systems, Inc.: | |
| 5.125%, 8/15/2018 | | | | 290,000 | | | | 304,137 | |
| 144A, 6.875%, 2/1/2022 | | | | 620,000 | | | | 657,200 | |
| 7.125%, 7/15/2020 | | | | 170,000 | | | | 184,025 | |
| Endo Finance LLC, 144A, 5.375%, 1/15/2023 | | | | 80,000 | | | | 79,900 | |
| Fresenius Medical Care U.S. Finance II, Inc., 144A, 5.625%, 7/31/2019 | | | | 10,000 | | | | 10,900 | |
| Fresenius Medical Care U.S. Finance, Inc., 144A, 6.5%, 9/15/2018 | | | | 10,000 | | | | 11,300 | |
| HCA, Inc.: | |
| 6.5%, 2/15/2020 | | | | 880,000 | | | | 990,000 | |
| 7.5%, 2/15/2022 | | | | 725,000 | | | | 836,469 | |
| Hologic, Inc., 6.25%, 8/1/2020 | | | 40,000 | | | | 42,200 | |
| IMS Health, Inc., 144A, 6.0%, 11/1/2020 | | | | 60,000 | | | | 63,000 | |
| Mallinckrodt International Finance SA, 4.75%, 4/15/2023 | | | 110,000 | | | | 106,975 | |
| Par Pharmaceutical Companies, Inc., 7.375%, 10/15/2020 | | | 90,000 | | | | 96,750 | |
| Physio-Control International, Inc., 144A, 9.875%, 1/15/2019 | | | 14,000 | | | | 15,470 | |
| Tenet Healthcare Corp., 6.25%, 11/1/2018 | | | | 230,000 | | | | 255,300 | |
| Valeant Pharmaceuticals International, Inc., 144A: 6.375%, 10/15/2020 | | | | 90,000 | | | | 95,625 | |
| 7.5%, 7/15/2021 | | | | 450,000 | | | | 498,375 | |
| | | | | 4,376,551 | |
| Industrials 2.2% | |
| ADT Corp.: | |
| 3.5%, 7/15/2022 | | | | 50,000 | | | | 45,500 | |
| 6.25%, 10/15/2021 (a) | | | | 45,000 | | | | 47,700 | |
| Alphabet Holding Co., Inc., 7.75%, 11/1/2017 (PIK) | | | | 50,000 | | | | 51,625 | |
| Artesyn Escrow, Inc., 144A, 9.75%, 10/15/2020 | | | | 70,000 | | | | 68,775 | |
| BE Aerospace, Inc., 6.875%, 10/1/2020 | | | | 185,000 | | | | 200,956 | |
| Belden, Inc., 144A, 5.5%, 9/1/2022 | | | 85,000 | | | | 87,975 | |
| | | Principal Amount ($)(d) | | | Value ($) | |
| | | | | | | | | |
| Bombardier, Inc., 144A, 5.75%, 3/15/2022 | | | | 328,000 | | | | 336,200 | |
| Cemex Finance LLC, 144A, 9.375%, 10/12/2022 | | | | 200,000 | | | | 235,250 | |
| DigitalGlobe, Inc., 5.25%, 2/1/2021 | | | 35,000 | | | | 34,650 | |
| FTI Consulting, Inc., 6.0%, 11/15/2022 | | | | 50,000 | | | | 51,438 | |
| Gates Global LLC, 144A, 6.0%, 7/15/2022 | | | | 65,000 | | | | 65,000 | |
| GenCorp, Inc., 7.125%, 3/15/2021 | | | 120,000 | | | | 131,100 | |
| Grupo KUO SAB de CV, 144A, 6.25%, 12/4/2022 | | | 400,000 | | | | 419,000 | |
| Huntington Ingalls Industries, Inc., 6.875%, 3/15/2018 | | | 560,000 | | | | 592,200 | |
| KazAgro National Management Holding JSC, 144A, 4.625%, 5/24/2023 | | | 500,000 | | | | 483,700 | |
| Kenan Advantage Group, Inc., 144A, 8.375%, 12/15/2018 | | | 100,000 | | | | 107,000 | |
| Meritor, Inc., 6.75%, 6/15/2021 | | | 55,000 | | | | 59,158 | |
| Navios Maritime Holdings, Inc., 144A, 7.375%, 1/15/2022 | | | 450,000 | | | | 463,500 | |
| Nortek, Inc., 8.5%, 4/15/2021 | | | | 155,000 | | | | 171,275 | |
| Odebrecht Offshore Drilling Finance Ltd., 144A, 6.75%, 10/1/2022 | | | 192,840 | | | | 206,435 | |
| Titan International, Inc., 6.875%, 10/1/2020 | | | | 170,000 | | | | 172,550 | |
| TransDigm, Inc.: | |
| 144A, 6.0%, 7/15/2022 | | | | 210,000 | | | | 215,775 | |
| 7.5%, 7/15/2021 | | | | 150,000 | | | | 166,125 | |
| United Rentals North America, Inc.: | |
| 6.125%, 6/15/2023 | | | | 10,000 | | | | 10,725 | |
| 7.375%, 5/15/2020 | | | | 25,000 | | | | 27,625 | |
| 7.625%, 4/15/2022 | | | | 620,000 | | | | 695,950 | |
| Votorantim Cimentos SA, 144A, 7.25%, 4/5/2041 | | | 500,000 | | | | 528,125 | |
| Watco Companies LLC, 144A, 6.375%, 4/1/2023 | | | 40,000 | | | | 40,800 | |
| | | | | 5,716,112 | |
| Information Technology 1.2% | |
| ACI Worldwide, Inc., 144A, 6.375%, 8/15/2020 | | | | 30,000 | | | | 31,575 | |
| Activision Blizzard, Inc., 144A, 5.625%, 9/15/2021 | | | 330,000 | | | | 355,575 | |
| Alliance Data Systems Corp., 144A, 5.25%, 12/1/2017 | | | 60,000 | | | | 62,700 | |
| Audatex North America, Inc., 144A, 6.0%, 6/15/2021 | | | 15,000 | | | | 16,013 | |
| BMC Software Finance, Inc., 144A, 8.125%, 7/15/2021 | | | 100,000 | | | | 102,875 | |
| CDW LLC, 8.5%, 4/1/2019 | | | | 610,000 | | | | 660,325 | |
| CyrusOne LP, 6.375%, 11/15/2022 | | | 25,000 | | | | 26,938 | |
| EarthLink Holdings Corp., 7.375%, 6/1/2020 | | | | 70,000 | | | | 74,637 | |
| Equinix, Inc., 5.375%, 4/1/2023 | | | 175,000 | | | | 178,937 | |
| First Data Corp.: | |
| 144A, 6.75%, 11/1/2020 | | | | 237,000 | | | | 256,552 | |
| 144A, 7.375%, 6/15/2019 | | | | 725,000 | | | | 778,469 | |
| Hughes Satellite Systems Corp.: | |
| 6.5%, 6/15/2019 | | | | 60,000 | | | | 66,900 | |
| 7.625%, 6/15/2021 | | | | 190,000 | | | | 217,550 | |
| NXP BV, 144A, 3.75%, 6/1/2018 | | | 90,000 | | | | 90,225 | |
| Tencent Holdings Ltd., 144A, 3.375%, 5/2/2019 | | | | 200,000 | | | | 204,474 | |
| | | | | 3,123,745 | |
| | | Principal Amount ($)(d) | | | Value ($) | |
| | | | | | | | | |
| Materials 2.6% | |
| ALROSA Finance SA, 144A, 7.75%, 11/3/2020 | | | | 700,000 | | | | 777,411 | |
| Anglo American Capital PLC: | |
| 144A, 4.125%, 4/15/2021 | | | | 200,000 | | | | 204,718 | |
| 144A, 4.125%, 9/27/2022 (a) | | | 250,000 | | | | 251,881 | |
| Berry Plastics Corp., 5.5%, 5/15/2022 | | | | 320,000 | | | | 321,800 | |
| BOE Intermediate Holding Corp., 144A, 9.0%, 11/1/2017 (PIK) | | | 87,717 | | | | 91,993 | |
| BOE Merger Corp., 144A, 9.5%, 11/1/2017 (PIK) | | | | 100,000 | | | | 105,375 | |
| Braskem Finance Ltd., 6.45%, 2/3/2024 | | | | 200,000 | | | | 213,750 | |
| Cascades, Inc., 144A, 5.5%, 7/15/2022 | | | | 50,000 | | | | 49,875 | |
| Cliffs Natural Resources, Inc., 3.95%, 1/15/2018 (a) | | | | 235,000 | | | | 238,132 | |
| First Quantum Minerals Ltd.: | |
| 144A, 6.75%, 2/15/2020 | | | | 259,000 | | | | 266,770 | |
| 144A, 7.0%, 2/15/2021 | | | | 129,000 | | | | 132,709 | |
| FMG Resources (August 2006) Pty Ltd., 144A, 6.0%, 4/1/2017 (a) | | | 195,000 | | | | 201,338 | |
| Fresnillo PLC, 144A, 5.5%, 11/13/2023 | | | 500,000 | | | | 522,500 | |
| Glencore Funding LLC, 144A, 4.125%, 5/30/2023 | | | | 50,000 | | | | 50,217 | |
| GTL Trade Finance, Inc., 144A, 5.893%, 4/29/2024 (a) | | | 600,000 | | | | 629,400 | |
| Hexion U.S. Finance Corp.: | |
| 6.625%, 4/15/2020 | | | | 385,000 | | | | 408,100 | |
| 8.875%, 2/1/2018 (a) | | | | 90,000 | | | | 93,600 | |
| IAMGOLD Corp., 144A, 6.75%, 10/1/2020 | | | | 75,000 | | | | 69,375 | |
| Kaiser Aluminum Corp., 8.25%, 6/1/2020 | | | | 40,000 | | | | 45,000 | |
| Metalloinvest Finance Ltd., 144A, 5.625%, 4/17/2020 | | | 200,000 | | | | 194,000 | |
| Novelis, Inc., 8.75%, 12/15/2020 | | | 955,000 | | | | 1,060,050 | |
| Plastipak Holdings, Inc., 144A, 6.5%, 10/1/2021 | | | 70,000 | | | | 73,850 | |
| Polymer Group, Inc., 7.75%, 2/1/2019 | | | | 229,000 | | | | 243,312 | |
| Samarco Mineracao SA, 144A, 5.75%, 10/24/2023 | | | 200,000 | | | | 209,940 | |
| Sealed Air Corp.: | |
| 144A, 8.125%, 9/15/2019 | | | | 10,000 | | | | 11,013 | |
| 144A, 8.375%, 9/15/2021 | | | | 10,000 | | | | 11,450 | |
| Tronox Finance LLC, 6.375%, 8/15/2020 | | | | 55,000 | | | | 56,788 | |
| Turkiye Sise ve Cam Fabrikalari AS, 144A, 4.25%, 5/9/2020 | | | 200,000 | | | | 193,000 | |
| Yamana Gold, Inc., 144A, 4.95%, 7/15/2024 | | | | 250,000 | | | | 251,644 | |
| | | | | 6,978,991 | |
| Telecommunication Services 4.5% | |
| Bharti Airtel International Netherlands BV, 144A, 5.35%, 5/20/2024 | | | | 500,000 | | | | 518,775 | |
| CC Holdings GS V LLC, 3.849%, 4/15/2023 | | | | 120,000 | | | | 120,466 | |
| CenturyLink, Inc., Series V, 5.625%, 4/1/2020 | | | | 25,000 | | | | 26,375 | |
| Cincinnati Bell, Inc.: | |
| 8.375%, 10/15/2020 | | | | 775,000 | | | | 849,594 | |
| 8.75%, 3/15/2018 | | | | 430,000 | | | | 450,962 | |
| | | Principal Amount ($)(d) | | | Value ($) | |
| | | | | | | | | |
| Colombia Telecomunicaciones SA ESP, 144A, 5.375%, 9/27/2022 | | | 200,000 | | | | 199,700 | |
| Digicel Group Ltd.: | |
| 144A, 7.125%, 4/1/2022 | | | | 250,000 | | | | 260,625 | |
| 144A, 8.25%, 9/30/2020 | | | | 200,000 | | | | 218,000 | |
| Digicel Ltd., 144A, 8.25%, 9/1/2017 | | | 750,000 | | | | 771,600 | |
| Frontier Communications Corp.: | |
| 7.125%, 1/15/2023 | | | | 390,000 | | | | 413,400 | |
| 8.5%, 4/15/2020 | | | | 290,000 | | | | 342,200 | |
| Intelsat Jackson Holdings SA: | |
| 5.5%, 8/1/2023 | | | | 265,000 | | | | 263,675 | |
| 7.25%, 10/15/2020 | | | | 690,000 | | | | 743,475 | |
| 7.5%, 4/1/2021 | | | | 340,000 | | | | 372,300 | |
| Intelsat Luxembourg SA: | |
| 7.75%, 6/1/2021 | | | | 165,000 | | | | 174,694 | |
| 8.125%, 6/1/2023 | | | | 25,000 | | | | 27,031 | |
| Level 3 Communications, Inc., 8.875%, 6/1/2019 | | | 205,000 | | | | 224,219 | |
| Level 3 Financing, Inc.: | |
| 144A, 6.125%, 1/15/2021 | | | | 100,000 | | | | 107,125 | |
| 7.0%, 6/1/2020 | | | | 185,000 | | | | 202,112 | |
| 8.625%, 7/15/2020 | | | | 450,000 | | | | 504,000 | |
| MetroPCS Wireless, Inc., 6.625%, 11/15/2020 | | | | 655,000 | | | | 699,212 | |
| Millicom International Cellular SA, 144A, 4.75%, 5/22/2020 | | | 200,000 | | | | 200,000 | |
| Oi SA, 144A, 5.75%, 2/10/2022 | | | 200,000 | | | | 199,600 | |
| SBA Communications Corp., 5.625%, 10/1/2019 | | | | 50,000 | | | | 52,938 | |
| Sprint Communications, Inc.: | |
| 6.0%, 11/15/2022 | | | | 85,000 | | | | 86,700 | |
| 144A, 7.0%, 3/1/2020 | | | | 85,000 | | | | 97,750 | |
| 144A, 9.0%, 11/15/2018 | | | | 420,000 | | | | 509,250 | |
| 9.125%, 3/1/2017 | | | | 15,000 | | | | 17,569 | |
| Sprint Corp., 144A, 7.125%, 6/15/2024 | | | | 175,000 | | | | 185,500 | |
| T-Mobile U.S.A., Inc., 6.625%, 4/1/2023 (a) | | | | 70,000 | | | | 75,950 | |
| tw telecom holdings, Inc.: | |
| 5.375%, 10/1/2022 | | | | 90,000 | | | | 98,437 | |
| 6.375%, 9/1/2023 | | | | 70,000 | | | | 79,625 | |
| UPCB Finance III Ltd., 144A, 6.625%, 7/1/2020 | | | | 370,000 | | | | 394,050 | |
| UPCB Finance V Ltd., 144A, 7.25%, 11/15/2021 | | | | 280,000 | | | | 308,000 | |
| Verizon Communications, Inc., 6.55%, 9/15/2043 | | | 225,000 | | | | 283,149 | |
| VimpelCom Holdings BV, 144A, 7.504%, 3/1/2022 | | | 200,000 | | | | 215,750 | |
| Wind Acquisition Finance SA, 144A, 6.5%, 4/30/2020 | | | 50,000 | | | | 54,188 | |
| Windstream Corp.: | |
| 6.375%, 8/1/2023 | | | | 60,000 | | | | 60,825 | |
| 7.5%, 4/1/2023 | | | | 20,000 | | | | 21,650 | |
| 7.75%, 10/15/2020 | | | | 1,075,000 | | | | 1,165,031 | |
| 7.75%, 10/1/2021 | | | | 185,000 | | | | 202,113 | |
| 7.875%, 11/1/2017 | | | | 130,000 | | | | 149,663 | |
| | | | | 11,947,278 | |
| Utilities 0.8% | |
| AES Corp.: | |
| 8.0%, 10/15/2017 | | | | 6,000 | | | | 6,990 | |
| 8.0%, 6/1/2020 | | | | 30,000 | | | | 36,075 | |
| | | Principal Amount ($)(d) | | | Value ($) | |
| | | | | | | | | |
| Calpine Corp.: | |
| 144A, 7.5%, 2/15/2021 | | | | 676,000 | | | | 733,460 | |
| 144A, 7.875%, 7/31/2020 | | | | 36,000 | | | | 39,060 | |
| Electricite de France SA, 144A, 5.25%, 1/29/2049 | | | 100,000 | | | | 102,013 | |
| Empresa de Energia de Bogota SA ESP, 144A, 6.125%, 11/10/2021 | | | 500,000 | | | | 546,250 | |
| FirstEnergy Transmission LLC, 144A, 4.35%, 1/15/2025 | | | 140,000 | | | | 141,445 | |
| NGL Energy Partners LP, 144A, 5.125%, 7/15/2019 (e) | | | 65,000 | | | | 65,162 | |
| NRG Energy, Inc., 144A, 6.25%, 5/1/2024 | | | | 360,000 | | | | 376,200 | |
| | | | | 2,046,655 | |
Total Corporate Bonds (Cost $68,241,756) | | | | 70,417,504 | |
| | |
| Asset-Backed 0.7% | |
| Automobile Receivables 0.2% | |
| AmeriCredit Automobile Receivables Trust, "E", Series 2011-2, 144A, 5.48%, 9/10/2018 | | | 528,181 | | | | 549,501 | |
| Miscellaneous 0.5% | |
| ARES CLO Ltd., "D", Series 2012-3A, 144A, 4.876%**, 1/17/2024 | | | 250,000 | | | | 250,544 | |
| Hilton Grand Vacations Trust, "B", Series 2014-AA, 144A, 2.07%, 11/25/2026 | | | 500,000 | | | | 499,972 | |
| VOLT XXIV LLC, "A1", Series 2014-NPL3, 144A, 3.25%, 11/25/2053 | | | 486,786 | | | | 487,965 | |
| | | | | 1,238,481 | |
Total Asset-Backed (Cost $1,784,644) | | | | 1,787,982 | |
| | |
| Mortgage-Backed Securities Pass-Throughs 0.0% | |
| Federal Home Loan Mortgage Corp., 6.0%, 3/1/2038 | | | 9,489 | | | | 10,655 | |
| Federal National Mortgage Association: | |
| 4.5%, 9/1/2035 | | | | 26,078 | | | | 28,405 | |
| 6.0%, 1/1/2024 | | | | 31,609 | | | | 35,692 | |
| 6.5%, with various maturities from 5/1/2017 until 1/1/2038 | | | | 6,338 | | | | 6,781 | |
Total Mortgage-Backed Securities Pass-Throughs (Cost $73,321) | | | | 81,533 | |
| | |
| Commercial Mortgage-Backed Securities 0.5% | |
| Del Coronado Trust, "M", Series 2013-HDMZ, 144A, 5.152%**, 3/15/2018 | | | 120,000 | | | | 120,756 | |
JPMorgan Chase Commercial Mortgage Securities Corp.: | |
| "C", Series 2012-HSBC, 144A, 4.021%, 7/5/2032 | | | 380,000 | | | | 395,419 | |
| "A4", Series 2007-C1, 5.716%, 2/15/2051 | | | | 225,000 | | | | 247,762 | |
| LB-UBS Commercial Mortgage Trust, "A4", Series 2007-C6, 5.858%, 7/15/2040 | | | 245,347 | | | | 262,888 | |
| | | Principal Amount ($)(d) | | | Value ($) | |
| | | | | | | | | |
| Prudential Commercial Mortgage Trust, "F", Series 2003-PWR1, 144A, 5.233%**, 2/11/2036 | | | 400,000 | | | | 400,625 | |
Total Commercial Mortgage-Backed Securities (Cost $1,409,937) | | | | 1,427,450 | |
| | |
| Collateralized Mortgage Obligations 1.3% | |
| Federal Home Loan Mortgage Corp.: | |
| "HI", Series 3979, Interest Only, 3.0%, 12/15/2026 | | | | 661,874 | | | | 72,410 | |
| "IK", Series 4048, Interest Only, 3.0%, 5/15/2027 | | | | 748,877 | | | | 96,737 | |
| "ZB", Series 4183, 3.0%, 3/15/2043 | | | 1,036,155 | | | | 879,664 | |
| "ZG", Series 4213, 3.5%, 6/15/2043 | | | | 108,429 | | | | 108,521 | |
| "LI", Series 3720, Interest Only, 4.5%, 9/15/2025 | | | | 1,289,697 | | | | 188,851 | |
| "PI", Series 3843, Interest Only, 4.5%, 5/15/2038 | | | | 680,938 | | | | 86,773 | |
| "H", Series 2278, 6.5%, 1/15/2031 | | | | 141 | | | | 157 | |
| Federal National Mortgage Association: | |
| "WO", Series 2013-27, Principal Only, Zero Coupon, 12/25/2042 | | | 220,000 | | | | 98,314 | |
| "I", Series 2003-84, Interest Only, 6.0%, 9/25/2033 | | | 232,817 | | | | 45,518 | |
| "PI", Series 2006-20, Interest Only, 6.528%***, 11/25/2030 | | | 419,504 | | | | 72,558 | |
Government National Mortgage Association: | |
| "ZJ", Series 2013-106, 3.5%, 7/20/2043 | | | | 141,571 | | | | 137,858 | |
| "QI", Series 2011-112, Interest Only, 4.0%, 5/16/2026 | | | 769,490 | | | | 79,721 | |
| "NI", Series 2011-80, Interest Only, 4.5%, 5/16/2038 | | | 1,067,046 | | | | 86,681 | |
| "BI", Series 2010-30, Interest Only, 4.5%, 7/20/2039 | | | 130,268 | | | | 19,364 | |
| "ND", Series 2010-130, 4.5%, 8/16/2039 | | | | 600,000 | | | | 648,150 | |
| "MI", Series 2009-76, Interest Only, 5.0%, 3/20/2035 | | | 18,207 | | | | 22 | |
| "IQ", Series 2011-18, Interest Only, 5.5%, 1/16/2039 | | | 327,800 | | | | 37,930 | |
| "IV", Series 2009-69, Interest Only, 5.5%, 8/20/2039 | | | 571,474 | | | | 100,549 | |
| "IN", Series 2009-69, Interest Only, 5.5%, 8/20/2039 | | | 575,580 | | | | 96,899 | |
| "IJ", Series 2009-75, Interest Only, 6.0%, 8/16/2039 | | | 422,168 | | | | 77,582 | |
| "AI", Series 2007-38, Interest Only, 6.308%***, 6/16/2037 | | | 98,515 | | | | 15,023 | |
| Residential Funding Mortgage Securities I, Inc., "M1", Series 2003-S17, 5.5%, 9/25/2033 | | | 474,675 | | | | 404,870 | |
Total Collateralized Mortgage Obligations (Cost $3,184,283) | | | | 3,354,152 | |
| | |
| Government & Agency Obligations 6.8% | |
| Other Government Related (f) 1.2% | |
| Banco de Costa Rica, 144A, 5.25%, 8/12/2018 | | | | 200,000 | | | | 205,000 | |
| Bank of Moscow, 144A, 6.699%, 3/11/2015 | | | | 250,000 | | | | 257,027 | |
| | | Principal Amount ($)(d) | | | Value ($) | |
| | | | | | | | | |
| MMC Norilsk Nickel OJSC, 144A, 5.55%, 10/28/2020 | | | | 200,000 | | | | 201,000 | |
| Queensland Treasury Corp., Series 33, 6.5%, 3/14/2033 | AUD | | | 1,225,000 | | | | 1,447,504 | |
| Sberbank of Russia, 144A, 5.25%, 5/23/2023 | | | | 500,000 | | | | 468,750 | |
| TMK OAO, 144A, 6.75%, 4/3/2020 | | | | 450,000 | | | | 438,750 | |
| VTB Bank OJSC, 144A, 6.0%, 4/12/2017 (a) | | | | 250,000 | | | | 263,500 | |
| | | | | 3,281,531 | |
| Sovereign Bonds 2.4% | |
| Government of France, 0.7%, 7/25/2030 | EUR | | | 1,119,099 | | | | 1,554,143 | |
| Kingdom of Morocco, 144A, 4.25%, 12/11/2022 | | | | 250,000 | | | | 250,312 | |
| Perusahaan Penerbit SBSN, 144A, 6.125%, 3/15/2019 | | | | 500,000 | | | | 555,625 | |
| Province of New Brunswick Canada, 3.55%, 6/3/2043 | CAD | | | 900,000 | | | | 806,926 | |
| Republic of Belarus, REG S, 8.75%, 8/3/2015 | | | | 100,000 | | | | 102,880 | |
| Republic of Croatia, 144A, 6.75%, 11/5/2019 | | | | 500,000 | | | | 560,625 | |
| Republic of El Salvador, 144A, 7.65%, 6/15/2035 | | | | 200,000 | | | | 216,300 | |
| Republic of Ghana, 144A, 8.5%, 10/4/2017 | | | | 200,000 | | | | 210,000 | |
| Republic of Hungary, 4.125%, 2/19/2018 | | | | 50,000 | | | | 52,125 | |
| Republic of Romania, 4.875%, 11/7/2019 | EUR | | | 100,000 | | | | 155,203 | |
| Republic of Singapore, 3.375%, 9/1/2033 | SGD | | | 1,575,000 | | | | 1,333,425 | |
| Republic of South Africa: | |
| 5.875%, 9/16/2025 | | | | 250,000 | | | | 277,875 | |
| Series R204, 8.0%, 12/21/2018 | ZAR | | | 800,000 | | | | 76,440 | |
| Republic of Sri Lanka, 144A, 5.125%, 4/11/2019 | | | | 200,000 | | | | 203,250 | |
| | | | | 6,355,129 | |
| U.S. Government Sponsored Agency 0.4% | |
| Federal National Mortgage Association, 3.0%, 11/15/2027 | | | 1,000,000 | | | | 928,596 | |
| U.S. Treasury Obligations 2.8% | |
| U.S. Treasury Bills: | |
| 0.015%****, 8/14/2014 (g) | | | 658,000 | | | | 657,982 | |
| 0.03%****, 12/11/2014 (g) | | | 85,000 | | | | 84,981 | |
| 0.055%****, 12/11/2014 (g) | | | 156,000 | | | | 155,965 | |
| 0.065%****, 8/14/2014 (g) | | | 355,000 | | | | 354,990 | |
| 0.07%****, 8/14/2014 (g) | | | | 314,000 | | | | 313,992 | |
| U.S. Treasury Bond, 5.375%, 2/15/2031 | | | | 1,071,000 | | | | 1,406,190 | |
| U.S. Treasury Notes: | |
| 1.0%, 8/31/2016 (h) | | | | 3,000,000 | | | | 3,030,936 | |
| 1.0%, 9/30/2016 | | | | 1,200,000 | | | | 1,211,626 | |
| 1.5%, 5/31/2019 | | | | 102,000 | | | | 101,490 | |
| 2.5%, 5/15/2024 | | | | 233,000 | | | | 232,672 | |
| | | | | 7,550,824 | |
Total Government & Agency Obligations (Cost $17,838,512) | | | | 18,116,080 | |
| | |
| | | Principal Amount ($)(d) | | | Value ($) | |
| | | | | | | | | |
| Municipal Bonds and Notes 0.1% | |
| Kentucky, Asset/Liability Commission, General Fund Revenue, 3.165%, 4/1/2018 (Cost $323,760) | | | 323,761 | | | | 336,242 | |
| | |
| Convertible Bond 0.2% | |
| Materials | |
| GEO Specialty Chemicals, Inc., 7.5%, 3/31/2015 (PIK) (Cost $207,614) | | | 209,283 | | | | 421,391 | |
| | |
| Preferred Security 0.0% | |
| Materials | |
| Hercules, Inc., 6.5%, 6/30/2029 (Cost $20,415) | | | 40,000 | | | | 36,200 | |
| | | Shares | | | Value ($) | |
| | | | |
| Securities Lending Collateral 3.0% | |
| Daily Assets Fund Institutional, 0.08% (i) (j) (Cost $7,981,988) | | | 7,981,988 | | | | 7,981,988 | |
| | |
| Cash Equivalents 8.2% | |
| Central Cash Management Fund, 0.06% (i) (Cost $21,611,026) | | | 21,611,026 | | | | 21,611,026 | |
| | | % of Net Assets | | | Value ($) | |
| | | | |
Total Investment Portfolio (Cost $252,467,727)† | | | 102.6 | | | | 271,922,631 | |
| Other Assets and Liabilities, Net | | | (2.6 | ) | | | (6,846,113 | ) |
| Net Assets | | | 100.0 | | | | 265,076,518 | |
* Non-income producing security.
** Floating rate securities' yields vary with a designated market index or market rate, such as the coupon-equivalent of the U.S. Treasury Bill rate. These securities are shown at their current rate as of June 30, 2014.
*** Current yield; not a coupon rate
****Annualized yield at time of purchase; not a coupon rate.
† The cost for federal income tax purposes was $252,802,480. At June 30, 2014, net unrealized appreciation for all securities based on tax cost was $19,120,151. This consisted of aggregate gross unrealized appreciation for all securities in which there was an excess of value over tax cost of $21,386,942 and aggregate gross unrealized depreciation for all securities in which there was an excess of tax cost over value of $2,266,791.
(a) All or a portion of these securities were on loan. In addition, "Other Assets and Liabilities, Net" may include pending sales that are also on loan. The value of securities loaned at June 30, 2014 amounted to $7,727,752, which is 2.9% of net assets.
(b) The Fund may purchase securities that are subject to legal or contractual restrictions on resale ("restricted securities"). Restricted securities are securities which have not been registered with the Securities and Exchange Commission under the Securities Act of 1933. The Fund may be unable to sell a restricted security and it may be more difficult to determine a market value for a restricted security. Moreover, if adverse market conditions were to develop during the period between the Fund's decision to sell a restricted security and the point at which the Fund is permitted or able to sell such security, the Fund might obtain a price less favorable than the price that prevailed when it decided to sell. This investment practice, therefore, could have the effect of increasing the level of illiquidity of the Fund. The future value of these securities is uncertain and there may be changes in the estimated value of these securities.
| Schedule of Restricted Securities | Acquisition Date | | Cost ($) | | | Value ($) | | | Value as % of Net Assets | |
| Dawn Holdings, Inc.* | August 2013 | | | 2,342 | | | | 1,940 | | | | 0.00 | |
(c) Securities with the same description are the same corporate entity but trade on different stock exchanges.
(d) Principal amount stated in U.S. dollars unless otherwise noted.
(e) When-issued security.
(f) Government-backed debt issued by financial companies or government sponsored enterprises.
(g) At June 30, 2014, this security has been pledged, in whole or in part, to cover initial margin requirements for open futures contracts.
(h) At June 30, 2014, this security has been pledged, in whole or in part, as collateral for open over-the-counter derivatives and initial margin requirements for centrally cleared swap contracts.
(i) Affiliated fund managed by Deutsche Investment Management Americas Inc. The rate shown is the annualized seven-day yield at period end.
(j) Represents collateral held in connection with securities lending. Income earned by the Fund is net of borrower rebates.
144A: Security exempt from registration under Rule 144A of the Securities Act of 1933. These securities may be resold in transactions exempt from registration, normally to qualified institutional buyers.
CLO: Collateralized Loan Obligation
CVA: Certificaten Van Aandelen (Certificate of Stock)
Interest Only: Interest Only (IO) bonds represent the "interest only" portion of payments on a pool of underlying mortgages or mortgage-backed securities. IO securities are subject to prepayment risk of the pool of underlying mortgages.
PIK: Denotes that all or a portion of the income is paid in-kind in the form of additional principal.
Principal Only: Principal Only (PO) bonds represent the "principal only" portion of payments on a pool of underlying mortgages or mortgage-backed securities.
REG S: Securities sold under Regulation S may not be offered, sold or delivered within the United States or to, or for the account or benefit of, U.S. persons, except pursuant to an exemption from, or in a transaction not subject to, the registration requirements of the Securities Act of 1933.
REIT: Real Estate Investment Trust
RSP: Risparmio (Convertible Savings Shares)
Included in the portfolio are investments in mortgage- or asset-backed securities which are interests in separate pools of mortgages or assets. Effective maturities of these investments may be shorter than stated maturities due to prepayments. Some separate investments in the Federal National Mortgage Association issues which have similar coupon rates have been aggregated for presentation purposes in this investment portfolio.
At June 30, 2014, open futures contracts purchased were as follows:
| Futures | Currency | Expiration Date | | Contracts | | | Notional Value ($) | | | Unrealized Appreciation ($) | |
| 10 Year U.S. Treasury Note | USD | 9/19/2014 | | | 183 | | | | 22,906,453 | | | | 78,200 | |
| 5 Year U.S. Treasury Note | USD | 9/30/2014 | | | 66 | | | | 7,884,422 | | | | 46,161 | |
| U.S. Treasury Long Bond | USD | 9/19/2014 | | | 14 | | | | 1,920,625 | | | | 9,993 | |
| Total unrealized appreciation | | | | 134,354 | |
At June 30, 2014, open futures contracts sold were as follows:
| Futures | Currency | Expiration Date | | Contracts | | | Notional Value ($) | | | Unrealized Depreciation ($) | |
| 10 Year Canadian Government Bond | CAD | 9/19/2014 | | | 27 | | | | 3,440,757 | | | | (36,564 | ) |
| Euro-BTP Italian Government Bond | EUR | 9/8/2014 | | | 13 | | | | 2,246,118 | | | | (40,254 | ) |
| Euro-OAT French Government Bond | EUR | 9/8/2014 | | | 24 | | | | 4,618,266 | | | | (67,697 | ) |
| U.S. Treasury Long Bond | USD | 9/19/2014 | | | 8 | | | | 1,097,500 | | | | (1,263 | ) |
| Ultra Long U.S. Treasury Bond | USD | 9/19/2014 | | | 13 | | | | 1,949,188 | | | | (24,942 | ) |
| Total unrealized depreciation | | | | (170,720 | ) |
At June 30, 2014, open written options contracts were as follows:
| Options on Interest Rate Swap Contracts | Swap Effective/ Expiration Date | | Contract Amount | | Option Expiration Date | | Premiums Received ($) | | | Value ($) (k) | |
Call Options Receive Fixed — 4.48% – Pay Floating — LIBOR | 5/11/2016 5/11/2026 | | | 2,100,000 | 1 | 5/5/2016 | | | 23,572 | | | | (18,120 | ) |
| Receive Fixed — 5.132% – Pay Floating — LIBOR | 3/17/2016 3/17/2026 | | | 2,100,000 | 1 | 3/15/2016 | | | 15,173 | | | | (5,543 | ) |
| Receive Fixed — 5.132% – Pay Floating — LIBOR | 3/17/2016 3/17/2026 | | | 2,100,000 | 2 | 3/15/2016 | | | 24,780 | | | | (5,543 | ) |
| Total Call Options | | | 63,525 | | | | (29,206 | ) |
Put Options Pay Fixed — 1.132% – Receive Floating — LIBOR | 3/17/2016 3/17/2026 | | | 2,100,000 | 1 | 3/15/2016 | | | 15,172 | | | | (591 | ) |
| Pay Fixed — 1.132% – Receive Floating — LIBOR | 3/17/2016 3/17/2026 | | | 2,100,000 | 2 | 3/15/2016 | | | 5,355 | | | | (591 | ) |
| Pay Fixed — 2.48% – Receive Floating — LIBOR | 5/11/2016 5/11/2026 | | | 2,100,000 | 1 | 5/5/2016 | | | 23,573 | | | | (22,027 | ) |
| Pay Fixed — 2.796% – Receive Floating — LIBOR | 6/5/2015 6/5/2045 | | | 1,900,000 | 2 | 6/3/2015 | | | 20,330 | | | | (16,260 | ) |
| Pay Fixed — 3.005% – Receive Floating — LIBOR | 3/6/2015 3/6/2045 | | | 1,900,000 | 1 | 3/4/2015 | | | 19,950 | | | | (21,925 | ) |
| Pay Fixed — 3.033% – Receive Floating — LIBOR | 10/24/2014 10/24/2044 | | | 4,900,000 | 3 | 10/22/2014 | | | 62,230 | | | | (27,586 | ) |
| Pay Fixed — 3.035% – Receive Floating — LIBOR | 2/15/2015 2/3/2045 | | | 1,900,000 | 2 | 1/30/2015 | | | 23,465 | | | | (21,675 | ) |
| Pay Fixed — 3.088% – Receive Floating — LIBOR | 1/28/2015 1/28/2045 | | | 2,100,000 | 4 | 1/26/2015 | | | 21,184 | | | | (27,677 | ) |
| Pay Fixed — 3.093% – Receive Floating — LIBOR | 10/21/2014 10/21/2044 | | | 4,900,000 | 2 | 10/17/2014 | | | 67,620 | | | | (36,419 | ) |
| Total Put Options | | | 258,879 | | | | (174,751 | ) |
| Total | | | 322,404 | | | | (203,957 | ) |
(k) Unrealized appreciation on written options on interest rate swap contracts at June 30, 2014 was $118,447.
As of June 30, 2014, open credit default swap contracts sold were as follows:
| Bilateral Swaps | |
Effective/ Expiration Dates | | Notional Amount ($) (l) | | | Fixed Cash Flows Received | | Underlying Debt Obligation/ Quality Rating (m) | | Value ($) | | | Upfront Payments Paid/ (Received) ($) | | | Unrealized Appreciation ($) | |
9/20/2012 12/20/2017 | | | 125,000 | 5 | | | 5.0 | % | General Motors Corp., 3.3%, 12/20/2017, BB+ | | | 17,876 | | | | 6,453 | | | | 11,423 | |
(l) The maximum potential amount of future undiscounted payments that the Fund could be required to make under a credit default swap contract would be the notional amount of the contract. These potential amounts would be partially offset by any recovery values of the referenced debt obligation or net amounts received from the settlement of buy protection credit default swap contracts entered into by the Fund for the same referenced debt obligation, if any.
(m) The quality ratings represent the higher of Moody's Investors Service, Inc. ("Moody's") or Standard & Poor's Corporation ("S&P") credit ratings and are unaudited.
At June 30, 2014, open interest rate swap contracts were as follows:
| Centrally Cleared Swaps | |
Effective/ Expiration Dates | | Notional Amount ($) | | Cash Flows Paid by the Fund | Cash Flows Received by the Fund | | Value ($) | | | Unrealized Appreciation/ (Depreciation) ($) | |
12/30/2014 12/30/2019 | | | 100,000 | | Floating — LIBOR | Fixed — 2.522% | | | 2,536 | | | | 2,622 | |
12/30/2014 12/30/2016 | | | 2,100,000 | | Floating — LIBOR | Fixed — 1.173% | | | 10,784 | | | | 11,063 | |
12/30/2014 12/30/2024 | | | 3,800,000 | | Fixed — 3.524% | Floating —- LIBOR | | | (243,556 | ) | | | (243,182 | ) |
12/30/2014 12/30/2044 | | | 300,000 | | Floating —- LIBOR | Fixed — 4.081% | | | 39,959 | | | | 40,331 | |
5/11/2015 5/11/2045 | | | 2,100,000 | | Fixed — 3.56% | Floating —- LIBOR | | | (44,167 | ) | | | (42,977 | ) |
6/3/2013 6/3/2025 | | | 2,100,000 | | Fixed — 3.0% | Floating —- LIBOR | | | (63,185 | ) | | | (60,121 | ) |
| Total net unrealized depreciation | | | | (292,264 | ) |
| Bilateral Swap | |
Effective/ Expiration Dates | | Notional Amount ($) | | Cash Flows Paid by the Fund | Cash Flows Received by the Fund | | Value ($) | | | Upfront Payment Paid/(Received) ($) | | | Unrealized Depreciation ($) | |
6/3/2013 6/3/2025 | | | 2,100,000 | 1 | Floating — LIBOR | Fixed — 3.0% | | | (12,686 | ) | | | — | | | | (12,686 | ) |
Counterparties:
1 Nomura International PLC
2 BNP Paribas
3 Citigroup, Inc.
4 Barclays Bank PLC
5 UBS AG
LIBOR: London Interbank Offered Rate
As of June 30, 2014, the Fund had the following open forward foreign currency exchange contracts:
| Contracts to Deliver | | In Exchange For | | Settlement Date | | Unrealized Appreciation ($) | | Counterparty |
| USD | | | 3,541,624 | | EUR | | | 2,600,000 | | 7/21/2014 | | | 18,812 | | Australia & New Zealand Banking Group Ltd. |
| USD | | | 1,004,953 | | CAD | | | 1,096,000 | | 7/23/2014 | | | 21,655 | | Canadian Imperial Bank of Commerce |
| USD | | | 3,452,838 | | JPY | | | 350,000,000 | | 8/4/2014 | | | 2,925 | | Macquarie Bank Ltd. |
| USD | | | 403,942 | | MXN | | | 5,300,000 | | 8/18/2014 | | | 3,265 | | Commonwealth Bank of Australia |
| USD | | | 864,732 | | ZAR | | | 9,400,000 | | 8/18/2014 | | | 12,300 | | Commonwealth Bank of Australia |
| ZAR | | | 9,400,000 | | USD | | | 877,527 | | 8/18/2014 | | | 495 | | Commonwealth Bank of Australia |
| ZAR | | | 810,000 | | USD | | | 75,969 | | 8/18/2014 | | | 395 | | Nomura International PLC |
| RUB | | | 19,550,000 | | USD | | | 567,746 | | 9/30/2014 | | | 4,100 | | Societe Generale |
| Total unrealized appreciation | | | | | 63,947 | |
| Contracts to Deliver | | In Exchange For | | Settlement Date | | Unrealized Depreciation ($) | | Counterparty |
| USD | | | 2,929,527 | | NOK | | | 17,700,000 | | 7/21/2014 | | | (45,918 | ) | Societe Generale |
| USD | | | 1,158,691 | | NOK | | | 7,000,000 | | 7/21/2014 | | | (18,280 | ) | Citigroup. Inc. |
| USD | | | 4,024,310 | | NZD | | | 4,600,000 | | 7/21/2014 | | | (3,727 | ) | Citigroup. Inc. |
| NZD | | | 3,300,000 | | USD | | | 2,862,011 | | 7/21/2014 | | | (22,320 | ) | Australia & New Zealand Banking Group Ltd. |
| NOK | | | 12,300,000 | | USD | | | 2,002,002 | | 7/21/2014 | | | (1,863 | ) | Barclays Bank PLC |
| NOK | | | 12,300,000 | | USD | | | 2,002,173 | | 7/21/2014 | | | (1,692 | ) | Societe Generale |
| NZD | | | 1,300,000 | | USD | | | 1,128,615 | | 7/21/2014 | | | (7,637 | ) | Citigroup. Inc. |
| SGD | | | 2,334,490 | | USD | | | 1,868,096 | | 7/23/2014 | | | (4,149 | ) | Commonwealth Bank of Australia |
| AUD | | | 1,411,800 | | USD | | | 1,312,673 | | 7/23/2014 | | | (16,584 | ) | Nomura International PLC |
| CAD | | | 852,544 | | USD | | | 773,795 | | 7/23/2014 | | | (24,771 | ) | Barclays Bank PLC |
| EUR | | | 1,121,400 | | USD | | | 1,521,999 | | 7/23/2014 | | | (13,656 | ) | Australia & New Zealand Banking Group Ltd. |
| EUR | | | 548,000 | | USD | | | 743,611 | | 7/25/2014 | | | (6,831 | ) | JPMorgan Chase Securities, Inc. |
| Total unrealized depreciation | | | | | (167,428 | ) |
| Currency Abbreviations |
AUD Australian Dollar BRL Brazilian Real CAD Canadian Dollar EUR Euro JPY Japanese Yen MXN Mexican Peso NOK Norwegian Krone NZD New Zealand Dollar RUB Russian Ruble SGD Singapore Dollar USD United States Dollar ZAR South African Rand |
For information on the Fund's policy and additional disclosures regarding futures contracts, credit default swap contracts, interest rate swap contracts, forward foreign currency exchange contracts and written options contracts, please refer to Note B in the accompanying Notes to Financial Statements.
Fair Value Measurements
Various inputs are used in determining the value of the Fund's investments. These inputs are summarized in three broad levels. Level 1 includes quoted prices in active markets for identical securities. Level 2 includes other significant observable inputs (including quoted prices for similar securities, interest rates, prepayment speeds and credit risk). Level 3 includes significant unobservable inputs (including the Fund's own assumptions in determining the fair value of investments). The level assigned to the securities valuations may not be an indication of the risk or liquidity associated with investing in those securities.
The following is a summary of the inputs used as of June 30, 2014 in valuing the Fund's investments. For information on the Fund's policy regarding the valuation of investments, please refer to the Security Valuation section of Note A in the accompanying Notes to Financial Statements. | Assets | | Level 1 | | | Level 2 | | | Level 3 | | | Total | |
| | |
| Common Stocks | | | | | | | | | | | | |
| Consumer Discretionary | | $ | 8,928,966 | | | $ | 5,328,913 | | | $ | 1,940 | | | $ | 14,259,819 | |
| Consumer Staples | | | 8,134,413 | | | | 4,370,591 | | | | — | | | | 12,505,004 | |
| Energy | | | 8,053,237 | | | | 5,317,364 | | | | — | | | | 13,370,601 | |
| Financials | | | 18,081,811 | | | | 17,856,361 | | | | — | | | | 35,938,172 | |
| Health Care | | | 8,226,438 | | | | 2,866,196 | | | | — | | | | 11,092,634 | |
| Industrials | | | 7,387,968 | | | | 8,269,904 | | | | 0 | | | | 15,657,872 | |
| Information Technology | | | 16,417,083 | | | | 1,874,810 | | | | — | | | | 18,291,893 | |
| Materials | | | 3,188,293 | | | | 2,249,470 | | | | — | | | | 5,437,763 | |
| Telecommunication Services | | | 2,822,748 | | | | 6,103,414 | | | | — | | | | 8,926,162 | |
| Utilities | | | 6,505,368 | | | | 3,288,045 | | | | — | | | | 9,793,413 | |
| Preferred Stocks (n) | | | — | | | | 1,054,046 | | | | — | | | | 1,054,046 | |
| Rights (n) | | | 7,818 | | | | — | | | | — | | | | 7,818 | |
| Warrants (n) | | | — | | | | — | | | | 15,886 | | | | 15,886 | |
| Fixed Income Investments (n) | | | | | | | | | | | | | | | | |
| Corporate Bonds | | | — | | | | 70,417,504 | | | | — | | | | 70,417,504 | |
| Asset-Backed | | | — | | | | 1,787,982 | | | | — | | | | 1,787,982 | |
| Mortgage-Backed Securities Pass-Throughs | | | — | | | | 81,533 | | | | — | | | | 81,533 | |
| Commercial Mortgage-Backed Securities | | | — | | | | 1,427,450 | | | | — | | | | 1,427,450 | |
| Collateralized Mortgage Obligations | | | — | | | | 3,354,152 | | | | — | | | | 3,354,152 | |
| Government & Agency Obligations | | | — | | | | 18,116,080 | | | | — | | | | 18,116,080 | |
| Municipal Bonds and Notes | | | — | | | | 336,242 | | | | — | | | | 336,242 | |
| Convertible Bond | | | — | | | | — | | | | 421,391 | | | | 421,391 | |
| Preferred Security | | | — | | | | 36,200 | | | | — | | | | 36,200 | |
| Short-Term Investments (n) | | | 29,593,014 | | | | — | | | | — | | | | 29,593,014 | |
| Derivatives (o) | | | | | | | | | | | | | | | | |
| Futures Contracts | | | 134,354 | | | | — | | | | — | | | | 134,354 | |
| Credit Default Swap Contracts | | | — | | | | 11,423 | | | | — | | | | 11,423 | |
| Interest Rate Swap Contracts | | | — | | | | 54,016 | | | | — | | | | 54,016 | |
| Forward Foreign Currency Exchange Contracts | | | — | | | | 63,947 | | | | — | | | | 63,947 | |
| Total | | $ | 117,481,511 | | | $ | 154,265,643 | | | $ | 439,217 | | | $ | 272,186,371 | |
| Liabilities | | Level 1 | | | Level 2 | | | Level 3 | | | Total | |
| | |
Derivatives (o) | |
| Futures Contracts | | $ | (170,720 | ) | | $ | — | | | $ | — | | | $ | (170,720 | ) |
| Written Options | | | — | | | | (203,957 | ) | | | — | | | | (203,957 | ) |
| Interest Rate Swap Contracts | | | — | | | | (358,966 | ) | | | — | | | | (358,966 | ) |
| Forward Foreign Currency Exchange Contracts | | | — | | | | (167,428 | ) | | | — | | | | (167,428 | ) |
| Total | | $ | (170,720 | ) | | $ | (730,351 | ) | | $ | — | | | $ | (901,071 | ) |
There have been no transfers between fair value measurement levels during the period ended June 30, 2014.
(n) See Investment Portfolio for additional detailed categorizations.
(o) Derivatives include value of unrealized appreciation (depreciation) on open futures contracts, credit default swap contracts, interest rate swap contracts and forward foreign currency exchange contracts, and written options, at value.
The accompanying notes are an integral part of the financial statements.
Statement of Assets and Liabilities | as of June 30, 2014 (Unaudited) | |
| Assets | |
Investments: Investments in non-affiliated securities, at value (cost $222,874,713) — including $7,727,752 of securities loaned | | $ | 242,329,617 | |
| Investment in Daily Assets Fund Institutional (cost $7,981,988)* | | | 7,981,988 | |
| Investment in Central Cash Management Fund (cost $21,611,026) | | | 21,611,026 | |
| Total investments in securities, at value (cost $252,467,727) | | | 271,922,631 | |
| Foreign currency, at value (cost $501,880) | | | 503,550 | |
| Receivable for investments sold | | | 1,103,677 | |
| Receivable for investments sold — when-issued/delayed delivery securities | | | 84,313 | |
| Receivable for Fund shares sold | | | 375,894 | |
| Dividends receivable | | | 293,894 | |
| Interest receivable | | | 1,211,027 | |
| Receivable for variation margin on futures contracts | | | 79,159 | |
| Unrealized appreciation on bilateral swap contracts | | | 11,423 | |
| Unrealized appreciation on forward foreign currency exchange contracts | | | 63,947 | |
| Upfront payments paid on bilateral swap contracts | | | 6,453 | |
| Foreign taxes recoverable | | | 125,910 | |
| Other assets | | | 1,722 | |
| Total assets | | | 275,783,600 | |
| Liabilities | |
| Cash overdraft | | | 758,170 | |
| Payable upon return of securities loaned | | | 7,981,988 | |
| Payable for investments purchased | | | 889,653 | |
| Payable for investments purchased — when-issued/delayed delivery securities | | | 391,247 | |
| Payable for Fund shares redeemed | | | 61,978 | |
| Options written, at value (premium received $322,404) | | | 203,957 | |
| Unrealized depreciation on bilateral swap contracts | | | 12,686 | |
| Unrealized depreciation on forward foreign currency exchange contracts | | | 167,428 | |
| Payable for variation margin on centrally cleared swaps | | | 20,111 | |
| Accrued management fee | | | 80,377 | |
| Accrued Trustees' fees | | | 22 | |
| Other accrued expenses and payables | | | 139,465 | |
| Total liabilities | | | 10,707,082 | |
| Net assets, at value | | $ | 265,076,518 | |
| Net Assets Consist of | |
| Undistributed net investment income | | | 3,924,017 | |
Net unrealized appreciation (depreciation) on: Investments | | | 19,454,904 | |
| Swap contracts | | | (293,527 | ) |
| Futures | | | (36,366 | ) |
| Foreign currency | | | (94,346 | ) |
| Written options | | | 118,447 | |
| Accumulated net realized gain (loss) | | | 4,194,458 | |
| Paid-in capital | | | 237,808,931 | |
| Net assets, at value | | $ | 265,076,518 | |
Class A Net Asset Value, offering and redemption price per share ($265,076,518 ÷ 10,607,493 outstanding shares of beneficial interest, no par value, unlimited number of shares authorized) | | $ | 24.99 | |
* Represents collateral on securities loaned.
The accompanying notes are an integral part of the financial statements.
| for the six months ended June 30, 2014 (Unaudited) | |
| Investment Income | |
Income: Dividends (net of foreign taxes withheld of $168,242) | | $ | 2,946,645 | |
| Interest | | | 2,128,103 | |
| Income distributions — Central Cash Management Fund | | | 3,947 | |
| Securities lending income, including income from Daily Assets Fund Institutional, net of borrower rebates | | | 45,913 | |
| Total income | | | 5,124,608 | |
Expenses: Management fee | | | 484,030 | |
| Administration fee | | | 131,319 | |
| Services to shareholders | | | 767 | |
| Custodian fee | | | 58,149 | |
| Professional fees | | | 47,394 | |
| Reports to shareholders | | | 34,201 | |
| Trustees' fees and expenses | | | 6,331 | |
| Other | | | 34,443 | |
| Total expenses | | | 796,634 | |
| Net investment income | | | 4,327,974 | |
| Realized and Unrealized Gain (Loss) | |
Net realized gain (loss) from: Investments | | | 4,225,697 | |
| Swap contracts | | | (225,496 | ) |
| Futures | | | 891,504 | |
| Written options | | | 89,880 | |
| Foreign currency | | | 413,621 | |
| | | | 5,395,206 | |
Change in net unrealized appreciation (depreciation) on: Investments | | | 5,715,502 | |
| Swap contracts | | | (217,751 | ) |
| Futures | | | (1,029,258 | ) |
| Written options | | | 2,060 | |
| Foreign currency | | | (320,812 | ) |
| | | | 4,149,741 | |
| Net gain (loss) | | | 9,544,947 | |
| Net increase (decrease) in net assets resulting from operations | | $ | 13,872,921 | |
The accompanying notes are an integral part of the financial statements.
Statement of Changes in Net Assets | Increase (Decrease) in Net Assets | | Six Months Ended June 30, 2014 (Unaudited) | | | Year Ended December 31, 2013 | |
Operations: Net investment income | | $ | 4,327,974 | | | $ | 8,106,989 | |
Operations: Net investment income | | $ | 4,327,974 | | | $ | 8,106,989 | |
| Net realized gain (loss) | | | 5,395,206 | | | | 30,650,529 | |
| Change in net unrealized appreciation (depreciation) | | | 4,149,741 | | | | 1,922,701 | |
| Net increase (decrease) in net assets resulting from operations | | | 13,872,921 | | | | 40,680,219 | |
Distributions to shareholders from: Net investment income: Class A | | | (8,047,271 | ) | | | (5,498,634 | ) |
| Net realized gains: Class A | | | (26,528,998 | ) | | | — | |
| Total distributions | | | (34,576,269 | ) | | | (5,498,634 | ) |
Fund share transactions: Class A Proceeds from shares sold | | | 2,949,911 | | | | 7,161,669 | |
| Shares issued to shareholders in reinvestment of distributions | | | 34,576,269 | | | | 5,498,634 | |
| Payments for shares redeemed | | | (20,829,088 | ) | | | (39,157,373 | ) |
| Net increase (decrease) in net assets from Class A share transactions | | | 16,697,092 | | | | (26,497,070 | ) |
| Increase (decrease) in net assets | | | (4,006,256 | ) | | | 8,684,515 | |
| Net assets at beginning of period | | | 269,082,774 | | | | 260,398,259 | |
| Net assets at end of period (including undistributed net investment income of $3,924,017 and $7,643,314, respectively) | | $ | 265,076,518 | | | $ | 269,082,774 | |
| Other Information | |
Class A Shares outstanding at beginning of period | | | 9,857,478 | | | | 10,896,924 | |
| Shares sold | | | 111,533 | | | | 284,532 | |
| Shares issued to shareholders in reinvestment of distributions | | | 1,433,510 | | | | 220,917 | |
| Shares redeemed | | | (795,028 | ) | | | (1,544,895 | ) |
| Net increase (decrease) in Class A shares | | | 750,015 | | | | (1,039,446 | ) |
| Shares outstanding at end of period | | | 10,607,493 | | | | 9,857,478 | |
The accompanying notes are an integral part of the financial statements.
| | | | | | Years Ended December 31, | |
| Class A | | Six Months Ended 6/30/14 (Unaudited) | | | 2013 | | | 2012 | | | 2011 | | | 2010 | | | 2009 | |
| Selected Per Share Data | |
| Net asset value, beginning of period | | $ | 27.30 | | | $ | 23.90 | | | $ | 21.49 | | | $ | 22.13 | | | $ | 20.52 | | | $ | 17.35 | |
Income (loss) from investment operations: Net investment incomea | | | .43 | | | | .78 | | | | .57 | | | | .46 | | | | .39 | | | | .44 | |
| Net realized and unrealized gain (loss) | | | .91 | | | | 3.14 | | | | 2.20 | | | | (.75 | ) | | | 1.88 | | | | 3.43 | |
| Total from investment operations | | | 1.34 | | | | 3.92 | | | | 2.77 | | | | (.29 | ) | | | 2.27 | | | | 3.87 | |
Less distributions from: Net investment income | | | (.85 | ) | | | (.52 | ) | | | (.36 | ) | | | (.35 | ) | | | (.66 | ) | | | (.70 | ) |
| Net realized gains | | | (2.80 | ) | | | — | | | | — | | | | — | | | | — | | | | — | |
| Total distributions | | | (3.65 | ) | | | (.52 | ) | | | (.36 | ) | | | (.35 | ) | | | (.66 | ) | | | (.70 | ) |
| Net asset value, end of period | | $ | 24.99 | | | $ | 27.30 | | | $ | 23.90 | | | $ | 21.49 | | | $ | 22.13 | | | $ | 20.52 | |
| Total Return (%) | | | 5.39 | ** | | | 16.63 | | | | 12.98 | | | | (1.42 | ) | | | 11.22 | | | | 23.43 | |
| Ratios to Average Net Assets and Supplemental Data | |
| Net assets, end of period ($ millions) | | | 265 | | | | 269 | | | | 260 | | | | 264 | | | | 308 | | | | 319 | |
| Ratio of expenses (%) | | | .61 | * | | | .60 | | | | .59 | | | | .58 | | | | .65 | | | | .60 | |
| Ratio of net investment income (%) | | | 3.30 | * | | | 3.07 | | | | 2.48 | | | | 2.09 | | | | 1.89 | | | | 2.40 | |
| Portfolio turnover rate (%) | | | 53 | ** | | | 182 | | | | 188 | | | | 109 | | | | 203 | | | | 207 | |
a Based on average shares outstanding during the period. * Annualized ** Not annualized | |
Notes to Financial Statements (Unaudited)
A. Organization and Significant Accounting Policies
Deutsche Global Income Builder VIP (formerly DWS Global Income Builder VIP) (the "Fund") is a diversified series of Deutsche Variable Series II (formerly DWS Variable Series II) (the "Trust"), which is registered under the Investment Company Act of 1940, as amended (the "1940 Act"), as an open-end management investment company organized as a Massachusetts business trust.
The Fund's financial statements are prepared in accordance with accounting principles generally accepted in the United States of America which require the use of management estimates. Actual results could differ from those estimates. The policies described below are followed consistently by the Fund in the preparation of its financial statements.
Security Valuation. Investments are stated at value determined as of the close of regular trading on the New York Stock Exchange on each day the exchange is open for trading.
Various inputs are used in determining the value of the Fund's investments. These inputs are summarized in three broad levels. Level 1 includes quoted prices in active markets for identical securities. Level 2 includes other significant observable inputs (including quoted prices for similar securities, interest rates, prepayment speeds and credit risk). Level 3 includes significant unobservable inputs (including the Fund's own assumptions in determining the fair value of investments). The level assigned to the securities valuations may not be an indication of the risk or liquidity associated with investing in those securities.
Equity securities are valued at the most recent sale price or official closing price reported on the exchange (U.S. or foreign) or over-the-counter market on which they trade. Securities for which no sales are reported are valued at the calculated mean between the most recent bid and asked quotations on the relevant market or, if a mean cannot be determined, at the most recent bid quotation. Equity securities are generally categorized as Level 1. For certain international equity securities, in order to adjust for events which may occur between the close of the foreign exchanges and the close of the New York Stock Exchange, a fair valuation model may be used. This fair valuation model takes into account comparisons to the valuation of American Depository Receipts (ADRs), exchange-traded funds, futures contracts and certain indices and these securities are categorized as Level 2.
Debt securities are valued at prices supplied by independent pricing services approved by the Fund's Board. Such services may use various pricing techniques which take into account appropriate factors such as yield, quality, coupon rate, maturity, type of issue, trading characteristics, prepayment speeds and other data, as well as broker quotes. If the pricing services are unable to provide valuations, debt securities are valued at the average of the most recent reliable bid quotations or evaluated prices, as applicable, obtained from broker-dealers. These securities are generally categorized as Level 2.
Money market instruments purchased with an original or remaining maturity of sixty days or less, maturing at par, are valued at amortized cost, which approximates value, and are categorized as Level 2. Investments in open-end investment companies are valued at their net asset value each business day and are categorized as Level 1.
Futures contracts are generally valued at the settlement prices established each day on the exchange on which they are traded and are categorized as Level 1.
Forward currency contracts are valued at the prevailing forward exchange rate of the underlying currencies and are categorized as Level 2.
Swap contracts are valued daily based upon prices supplied by a Board approved pricing vendor, if available, and otherwise are valued at the price provided by the broker-dealer. Swap contracts are generally categorized as Level 2.
Exchange-traded options are valued at the last sale price or, in the absence of a sale, the mean between the closing bid and asked prices or at the most recent asked price (bid for purchased options) if no bid or asked price are available. Exchange-traded options are categorized as Level 1. Over-the-counter written or purchased options are valued at prices supplied by a Board approved pricing vendor, if available, and otherwise are valued at the price provided by the broker-dealer with which the option was traded. Over-the-counter written or purchased options are generally categorized as Level 2.
Securities and other assets for which market quotations are not readily available or for which the above valuation procedures are deemed not to reflect fair value are valued in a manner that is intended to reflect their fair value as determined in accordance with procedures approved by the Board and are generally categorized as Level 3. In accordance with the Fund's valuation procedures, factors considered in determining value may include, but are not limited to, the type of the security; the size of the holding; the initial cost of the security; the existence of any contractual restrictions on the security's disposition; the price and extent of public trading in similar securities of the issuer or of comparable companies; quotations or evaluated prices from broker-dealers and/or pricing services; information obtained from the issuer, analysts, and/or the appropriate stock exchange (for exchange-traded securities); an analysis of the company's or issuer's financial statements; an evaluation of the forces that influence the issuer and the market(s) in which the security is purchased and sold; and with respect to debt securities, the maturity, coupon, creditworthiness, currency denomination and the movement of the market in which the security is normally traded. The value determined under these procedures may differ from published values for the same securities.
Disclosure about the classification of fair value measurements is included in a table following the Fund's Investment Portfolio.
Foreign Currency Translations. The books and records of the Fund are maintained in U.S. dollars. Investment securities and other assets and liabilities denominated in a foreign currency are translated into U.S. dollars at the prevailing exchange rates at period end. Purchases and sales of investment securities, income and expenses are translated into U.S. dollars at the prevailing exchange rates on the respective dates of the transactions.
Net realized and unrealized gains and losses on foreign currency transactions represent net gains and losses between trade and settlement dates on securities transactions, the acquisition and disposition of foreign currencies, and the difference between the amount of net investment income accrued and the U.S. dollar amount actually received. That portion of both realized and unrealized gains and losses on investments that results from fluctuations in foreign currency exchange rates is not separately disclosed but is included with net realized and unrealized gain/appreciation and loss/depreciation on investments.
Securities Lending. Deutsche Bank AG, as lending agent, lends securities of the Fund to certain financial institutions under the terms of the Security Lending Agreement. The Fund retains the benefits of owning the securities it has loaned and continues to receive interest and dividends generated by the securities and to participate in any changes in their market value. The Fund requires the borrowers of the securities to maintain collateral with the Fund consisting of either cash or liquid, unencumbered assets having a value at least equal to the value of the securities loaned. When the collateral falls below specified amounts, the lending agent will use its best effort to obtain additional collateral on the next business day to meet required amounts under the security lending agreement. The Fund may invest the cash collateral into a joint trading account in an affiliated money market fund pursuant to Exemptive Orders issued by the SEC. The Fund receives compensation for lending its securities either in the form of fees or by earning interest on invested cash collateral net of borrower rebates and fees paid to a lending agent. Either the Fund or the borrower may terminate the loan. There may be risks of delay and costs in recovery of securities or even loss of rights in the collateral should the borrower of the securities fail financially. If the Fund is not able to recover securities lent, the Fund may sell the collateral and purchase a replacement investment in the market, incurring the risk that the value of the replacement security is greater than the value of the collateral. The Fund is also subject to all investment risks associated with the reinvestment of any cash collateral received, including, but not limited to, interest rate, credit and liquidity risk associated with such investments.
As of June 30, 2014, the Fund had securities on loan. The value of the related collateral exceeded the value of the securities loaned at period end.
When-Issued/Delayed Delivery Securities. The Fund may purchase or sell securities with delivery or payment to occur at a later date beyond the normal settlement period. At the time the Fund enters into a commitment to purchase or sell a security, the transaction is recorded and the value of the transaction is reflected in the net asset value. The price of such security and the date when the security will be delivered and paid for are fixed at the time the transaction is negotiated. The value of the security may vary with market fluctuations. At the time the Fund enters into a purchase transaction it is required to segregate cash or other liquid assets at least equal to the amount of the commitment. Additionally, the Fund may be required to post securities and/or cash collateral in accordance with the terms of the commitment.
Certain risks may arise upon entering into when-issued or delayed delivery transactions from the potential inability of counterparties to meet the terms of their contracts or if the issuer does not issue the securities due to political, economic, or other factors. Additionally, losses may arise due to changes in the value of the underlying securities.
Taxes. The Fund's policy is to comply with the requirements of the Internal Revenue Code, as amended, which are applicable to regulated investment companies and to distribute all of its taxable income to its shareholders.
Additionally, the Fund may be subject to taxes imposed by the governments of countries in which it invests and are generally based on income and/or capital gains earned or repatriated. Estimated tax liabilities on certain foreign securities are recorded on an accrual basis and are reflected as components of interest income or net change in unrealized gain/loss on investments. Tax liabilities realized as a result of security sales are reflected as a component of net realized gain/loss on investments.
The Fund has reviewed the tax positions for the open tax years as of December 31, 2013 and has determined that no provision for income tax and/or uncertain tax provisions is required in the Fund's financial statements. The Fund's federal tax returns for the prior three fiscal years remain open subject to examination by the Internal Revenue Service.
Distribution of Income and Gains. Distributions from net investment income of the Fund, if any, are declared and distributed to shareholders annually. Net realized gains from investment transactions, in excess of available capital loss carryforwards, would be taxable to the Fund if not distributed and, therefore, will be distributed to shareholders at least annually. The Fund may also make additional distributions for tax purposes if necessary.
The timing and characterization of certain income and capital gain distributions are determined annually in accordance with federal tax regulations which may differ from accounting principles generally accepted in the United States of America. These differences primarily relate to investments in foreign denominated investments, forward currency contracts, futures contracts, swap contracts and certain securities sold at a loss. As a result, net investment income (loss) and net realized gain (loss) on investment transactions for a reporting period may differ significantly from distributions during such period. Accordingly, the Fund may periodically make reclassifications among certain of its capital accounts without impacting the net asset value of the Fund.
The tax character of current year distributions will be determined at the end of the current fiscal year.
Expenses. Expenses of the Trust arising in connection with a specific fund are allocated to that fund. Other Trust expenses which cannot be directly attributed to a fund are apportioned among the funds in the Trust based upon the relative net assets or other appropriate measures.
Contingencies. In the normal course of business, the Fund may enter into contracts with service providers that contain general indemnification clauses. The Fund's maximum exposure under these arrangements is unknown as this would involve future claims that may be made against the Fund that have not yet been made. However, based on experience, the Fund expects the risk of loss to be remote.
Other. Investment transactions are accounted for on a trade date plus one basis for daily net asset value calculations. However, for financial reporting purposes, investment transactions are reported on trade date. Interest income is recorded on the accrual basis. Dividend income is recorded on the ex-dividend date net of foreign withholding taxes. Certain dividends from foreign securities may be recorded subsequent to the ex-dividend date as soon as the Fund is informed of such dividends. Realized gains and losses from investment transactions are recorded on an identified cost basis. Proceeds from litigation payments, if any, are included in net realized gain (loss) from investments. All discounts and premiums are accreted/amortized for both tax and financial reporting purposes, with the exception of securities in default of principal.
B. Derivative Instruments
Swaps. A swap is a contract between two parties to exchange future cash flows at periodic intervals based on the notional amount of the swap. A bilateral swap is a transaction between the fund and a counterparty where cash flows are exchanged between the two parties. A centrally cleared swap is a transaction executed between the fund and a counterparty, then cleared by a clearing member through a central clearinghouse. The central clearinghouse serves as the counterparty, with whom the fund exchanges cash flows.
The value of a swap is adjusted daily, and the change in value, if any, is recorded as unrealized appreciation or depreciation in the Statement of Assets and Liabilities. Gains or losses are realized when the swap expires or is closed. Certain risks may arise when entering into swap transactions including counterparty default; liquidity; or unfavorable changes in interest rates or the value of the underlying reference security, commodity or index. In connection with bilateral swaps, securities and/or cash may be identified as collateral in accordance with the terms of the swap agreement to provide assets of value and recourse in the event of default. The maximum counterparty credit risk is the net present value of the cash flows to be received from or paid to the counterparty over the term of the swap, to the extent that this amount is beneficial to the Fund, in addition to any related collateral posted to the counterparty by the Fund. This risk may be partially reduced by a master netting arrangement between the Fund and the counterparty. Upon entering into a centrally cleared swap, the Fund is required to deposit with a financial intermediary cash or securities ("initial margin") in an amount equal to a certain percentage of the notional amount of the swap. Subsequent payments ("variation margin") are made or received by the Fund dependent upon the daily fluctuations in the value of the swap. In a cleared swap transaction, counterparty risk is minimized as the central clearinghouse acts as the counterparty.
An upfront payment, if any, made by the Fund is recorded as an asset in the Statement of Assets and Liabilities. An upfront payment, if any, received by the Fund is recorded as a liability in the Statement of Assets and Liabilities. Payments received or made at the end of the measurement period are recorded as realized gain or loss in the Statement of Operations.
Interest Rate Swaps. Interest rate swaps are agreements in which the Fund agrees to pay to the counterparty a fixed rate payment in exchange for the counterparty agreeing to pay to the Fund a variable rate payment, or the Fund agrees to receive from the counterparty a fixed rate payment in exchange for the counterparty agreeing to receive from the Fund a variable rate payment. The payment obligations are based on the notional amount of the swap. For the six months ended June 30, 2014, the Fund entered into interest rate swap agreements to gain exposure to different parts of the yield curve while managing overall duration.
A summary of the open interest rate swap contracts as of June 30, 2014 is included in a table following the Fund's Investment Portfolio. For the six months ended June 30, 2014, the investment in interest rate swap contracts had a total notional amount generally indicative of a range from $10,500,000 to $12,600,000.
Credit Default Swaps. Credit default swaps are agreements between a buyer and a seller of protection against predefined credit events for the reference entity. The Fund may enter into credit default swaps to gain exposure to an underlying issuer's credit quality characteristics without directly investing in that issuer or to hedge against the risk of a credit event on debt securities. As a seller of a credit default swap, the Fund is required to pay the par (or other agreed-upon) value of the referenced entity to the counterparty with the occurrence of a credit event by a third party, such as a U.S. or foreign corporate issuer, on the reference entity, which would likely result in a loss to the Fund. In return, the Fund receives from the counterparty a periodic stream of payments over the term of the swap provided that no credit event has occurred. If no credit event occurs, the Fund keeps the stream of payments with no payment obligations. The Fund may also buy credit default swaps, in which case the Fund functions as the counterparty referenced above. This involves the risk that the swap may expire worthless. It also involves counterparty risk that the seller may fail to satisfy its payment obligations to the Fund with the occurrence of a credit event. When the Fund sells a credit default swap, it will cover its commitment. This may be achieved by, among other methods, maintaining cash or liquid assets equal to the aggregate notional value of the reference entities for all outstanding credit default swaps sold by the Fund. For the six months ended June 30, 2014, the Fund entered into credit default swap agreements to gain exposure to the underlying issuer's credit quality characteristics.
Under the terms of a credit default swap, the Fund receives or makes periodic payments based on a specified interest rate on a fixed notional amount. These payments are recorded as a realized gain or loss in the Statement of Operations. Payments received or made as a result of a credit event or termination of the swap are recognized, net of a proportional amount of the upfront payment, as realized gains or losses in the Statement of Operations.
A summary of the open credit default swap contracts as of June 30, 2014 is included in a table following the Fund's Investment Portfolio. For the six months ended June 30, 2014, the investment in credit default swap contracts sold had a total notional value of $125,000.
Futures Contracts. A futures contract is an agreement between a buyer or seller and an established futures exchange or its clearinghouse in which the buyer or seller agrees to take or make a delivery of a specific amount of a financial instrument at a specified price on a specific date (settlement date). For the six months ended June 30, 2014, the Fund entered into interest rate futures to gain exposure to different parts of the yield curve while managing overall duration. The Fund also entered into interest rate futures contracts for non-hedging purposes to seek to enhance potential gains.
Upon entering into a futures contract, the Fund is required to deposit with a financial intermediary cash or securities ("initial margin") in an amount equal to a certain percentage of the face value indicated in the futures contract. Subsequent payments ("variation margin") are made or received by the Fund dependent upon the daily fluctuations in the value and are recorded for financial reporting purposes as unrealized gains or losses by the Fund. Gains or losses are realized when the contract expires or is closed. Since all futures contracts are exchange-traded, counterparty risk is minimized as the exchange's clearinghouse acts as the counterparty, and guarantees the futures against default.
Certain risks may arise upon entering into futures contracts, including the risk that an illiquid market will limit the Fund's ability to close out a futures contract prior to the settlement date and the risk that the futures contract is not well correlated with the security, index or currency to which it relates. Risk of loss may exceed amounts disclosed in the Statement of Assets and Liabilities.
A summary of the open futures contracts as of June 30, 2014 is included in a table following the Fund's Investment Portfolio. For the six months ended June 30, 2014, the investment in futures contracts purchased had a total notional value generally indicative of a range from approximately $7,994,000 to $32,712,000, and the investment in futures contracts sold had a total notional value generally indicative of a range from approximately $5,641,000 to $57,469,000.
Options. An option contract is a contract in which the writer (seller) of the option grants the buyer of the option, upon payment of a premium, the right to purchase from (call option), or sell to (put option), the writer a designated instrument at a specified price within a specified period of time. The Fund may write or purchase interest rate swaption agreements which are options to enter into a pre-defined swap agreement. The interest rate swaption agreement will specify whether the buyer of the swaption will be a fixed-rate receiver or a fixed-rate payer upon exercise. Certain options, including options on indices and interest rate options, will require cash settlement by the Fund if exercised. For the six months ended June 30, 2014, the Fund entered into options on interest rate swaps in order to hedge against potential adverse interest rate movements of portfolio assets.
If the Fund writes a covered call option, the Fund foregoes, in exchange for the premium, the opportunity to profit during the option period from an increase in the market value of the underlying security above the exercise price. If the Fund writes a put option it accepts the risk of a decline in the value of the underlying security below the exercise price. Over-the-counter options have the risk of the potential inability of counterparties to meet the terms of their contracts. For exchange traded contracts, the counterparty risk is minimized as the exchange's clearinghouse acts as the counterparty, and guarantees the futures against default. The Fund's maximum exposure to purchased options is limited to the premium initially paid. In addition, certain risks may arise upon entering into option contracts including the risk that an illiquid secondary market will limit the Fund's ability to close out an option contract prior to the expiration date and that a change in the value of the option contract may not correlate exactly with changes in the value of the securities or currencies hedged.
A summary of open written option contracts is included in a table following the Fund's Investment Portfolio. For the six months ended June 30, 2014, the investment in written option contracts had a total value generally indicative of a range from approximately $133,000 to $204,000.
Forward Foreign Currency Exchange Contracts. A forward foreign currency exchange contract ("forward currency contract") is a commitment to purchase or sell a foreign currency at the settlement date at a negotiated rate. For the six months ended June 30, 2014, the Fund entered into forward currency contracts in order to hedge its exposure to changes in foreign currency exchange rates on its foreign currency denominated portfolio holdings, to facilitate transactions in foreign currency denominated securities and to enhance total returns.
Forward currency contracts are valued at the prevailing forward exchange rate of the underlying currencies and unrealized gain (loss) is recorded daily. On the settlement date of the forward currency contract, the Fund records a realized gain or loss equal to the difference between the value of the contract at the time it was opened and the value of the contract at the time it was closed. Certain risks may arise upon entering into forward currency contracts from the potential inability of counterparties to meet the terms of their contracts. The maximum counterparty credit risk to the Fund is measured by the unrealized gain on appreciated contracts. Additionally, when utilizing forward currency contracts to hedge, the Fund gives up the opportunity to profit from favorable exchange rate movements during the term of the contract.
A summary of the open forward currency contracts as of June 30, 2014 is included in a table following the Fund's Investment Portfolio. For the six months ended June 30, 2014, the investment in forward currency contracts short vs. U.S. dollars had a total contract value generally indicative of a range from approximately $12,710,000 to $30,883,000, and the investment in forward currency contracts long vs. U.S. dollars had a total contract value generally indicative of a range from approximately $4,127,000 to $29,316,000. The investment in forward currency contracts long vs. other foreign currencies sold had a total contract value generally indicative of a range from $0 to approximately $7,981,000.
The following tables summarize the value of the Fund's derivative instruments held as of June 30, 2014 and the related location in the accompanying Statement of Assets and Liabilities, presented by primary underlying risk exposure:
| Asset Derivatives | | Forward Contracts | | | Swap Contracts | | | Futures Contracts | | | Total | |
| Interest Rate Contracts (a) | | $ | — | | | $ | 54,016 | | | $ | 134,354 | | | $ | 188,370 | |
| Credit Contracts (b) | | | — | | | | 11,423 | | | | — | | | | 11,423 | |
| Foreign Exchange Contracts (b) | | | 63,947 | | | | — | | | | — | | | | 63,947 | |
| | | $ | 63,947 | | | $ | 65,439 | | | $ | 134,354 | | | $ | 263,740 | |
Each of the above derivatives is located in the following Statement of Assets and Liabilities accounts: (a) Includes cumulative appreciation of futures and centrally cleared swap contracts as disclosed in the Investment Portfolio. Unsettled variation margin is disclosed separately within the Statement of Assets and Liabilities. (b) Unrealized appreciation on swap contracts and forward foreign currency exchange contracts | |
| Liability Derivatives | | Written Options | | | Forward Contracts | | | Swap Contracts | | | Futures Contracts | | | Total | |
| Interest Rate Contracts (a) (b) | | $ | (203,957 | ) | | $ | — | | | $ | (358,966 | ) | | $ | (170,720 | ) | | $ | (733,643 | ) |
| Foreign Exchange Contracts (c) | | | — | | | | (167,428 | ) | | | — | | | | — | | | | (167,428 | ) |
| | | $ | (203,957 | ) | | $ | (167,428 | ) | | $ | (358,966 | ) | | $ | (170,720 | ) | | $ | (901,071 | ) |
Each of the above derivatives is located in the following Statement of Assets and Liabilities accounts: (a) Includes cumulative depreciation of futures and centrally cleared swap contracts as disclosed in the Investment Portfolio. Unsettled variation margin is disclosed separately within the Statement of Assets and Liabilities. (b) Options written, at value and unrealized depreciation on bilateral swap contracts, respectively (c) Unrealized depreciation on forward foreign currency exchange contracts | |
Additionally, the amount of unrealized and realized gains and losses on derivative instruments recognized in Fund earnings during the six months ended June 30, 2014 and the related location in the accompanying Statement of Operations is summarized in the following tables by primary underlying risk exposure:
| Realized Gain (Loss) | | Written Options | | | Forward Contracts | | | Swap Contracts | | | Futures Contracts | | | Total | |
| Interest Rate Contracts (a) | | $ | 89,880 | | | $ | — | | | $ | (225,496 | ) | | $ | 891,504 | | | $ | 755,888 | |
| Foreign Exchange Contracts (b) | | | — | | | | 471,015 | | | | — | | | | — | | | | 471,015 | |
| | | $ | 89,880 | | | $ | 471,015 | | | $ | (225,496 | ) | | $ | 891,504 | | | $ | 1,226,903 | |
Each of the above derivatives is located in the following Statement of Operations accounts: (a) Net realized gain (loss) from written options, swap contracts and futures, respectively (b) Net realized gain (loss) from foreign currency (Statement of Operations includes both forward currency contracts and foreign currency transactions) | |
| Change in Net Unrealized Appreciation (Depreciation) | | Written Options | | | Forward Contracts | | | Swap Contracts | | | Futures Contracts | | | Total | |
| Interest Rate Contracts (a) | | $ | 2,060 | | | $ | — | | | $ | (218,167 | ) | | $ | (1,029,258 | ) | | $ | (1,245,365 | ) |
| Credit Contracts (a) | | | — | | | | — | | | | 416 | | | | — | | | | 416 | |
| Foreign Exchange Contracts (b) | | | — | | | | (327,074 | ) | | | — | | | | — | | | | (327,074 | ) |
| | | $ | 2,060 | | | $ | (327,074 | ) | | $ | (217,751 | ) | | $ | (1,029,258 | ) | | $ | (1,572,023 | ) |
Each of the above derivatives is located in the following Statement of Operations accounts: (a) Change in net unrealized appreciation (depreciation) on written options, swap contracts and futures, respectively (b) Change in net unrealized appreciation (depreciation) on foreign currency (Statement of Operations includes both forward currency contracts and foreign currency transactions) | |
As of June 30, 2014, the Fund has transactions subject to enforceable master netting agreements. A reconciliation of the gross amounts on the Statement of Assets and Liabilities to the net amounts by derivative type, including any collateral exposure, is included in the following tables:
| Counterparty | | Gross Amounts of Assets Presented in the Statement of Assets and Liabilities | | | Financial Instruments and Derivatives Available for Offset | | | Cash Collateral Received | | | Non-Cash Collateral Received | | | Net Amount of Derivative Assets | |
| Australia & New Zealand Banking Group Ltd | | $ | 18,812 | | | $ | (18,812 | ) | | $ | — | | | $ | — | | | $ | — | |
| Canadian Imperial Bank of Commerce | | | 21,655 | | | | — | | | | — | | | | — | | | | 21,655 | |
| Commonwealth Bank of Australia | | | 16,060 | | | | (4,149 | ) | | | — | | | | — | | | | 11,911 | |
| Macquarie Bank Ltd. | | | 2,925 | | | | — | | | | — | | | | — | | | | 2,925 | |
| Nomura International PLC | | | 395 | | | | (395 | ) | | | — | | | | — | | | | — | |
| Societe Generale | | | 4,100 | | | | (4,100 | ) | | | — | | | | — | | | | — | |
| UBS AG | | | 11,423 | | | | — | | | | — | | | | — | | | | 11,423 | |
| | | $ | 75,370 | | | $ | (27,456 | ) | | $ | — | | | $ | — | | | $ | 47,914 | |
| Counterparty | | Gross Amounts of Liabilities Presented in the Statement of Assets and Liabilities | | | Financial Instruments and Derivatives Available for Offset | | | Cash Collateral Pledged | | | Non-Cash Collateral Pledged (a) | | | Net Amount of Derivative Liabilities | |
| Australia & New Zealand Banking Group Ltd | | $ | 35,976 | | | $ | (18,812 | ) | | $ | — | | | $ | — | | | $ | 17,164 | |
| Barclays Bank PLC | | | 54,311 | | | | — | | | | — | | | | — | | | | 54,311 | |
| BNP Paribas | | | 80,489 | | | | — | | | | — | | | | — | | | | 80,489 | |
| Citigroup. Inc. | | | 57,230 | | | | — | | | | — | | | | — | | | | 57,230 | |
| Commonwealth Bank of Australia | | | 4,149 | | | | (4,149 | ) | | | — | | | | — | | | | — | |
| JPMorgan Chase Securities, Inc. | | | 6,831 | | | | — | | | | — | | | | — | | | | 6,831 | |
| Nomura International PLC | | | 97,475 | | | | (395 | ) | | | — | | | | (97,080 | ) | | | — | |
| Societe Generale | | | 47,610 | | | | (4,100 | ) | | | — | | | | — | | | | 43,510 | |
| | | $ | 384,071 | | | $ | (27,456 | ) | | $ | — | | | $ | (97,080 | ) | | $ | 259,535 | |
(a) The actual collateral pledged may be more than the amount shown.
C. Purchases and Sales of Securities
During the six months ended June 30, 2014, purchases and sales of investment transactions (excluding short-term investments and U.S. Treasury obligations) aggregated $122,953,106 and $149,623,066, respectively. Purchases and sales of U.S. Treasury obligations aggregated $7,226,065 and $5,474,811, respectively.
For the six months ended June 30, 2014, transactions for written options on interest rate swap contracts were as follows:
| | | Contract Amount | | | Premium | |
| Outstanding, beginning of period | | | 26,600,000 | | | $ | 280,210 | |
| Options written | | | 12,000,000 | | | | 132,074 | |
| Options closed | | | (6,300,000 | ) | | | (74,392 | ) |
| Options expired | | | (2,100,000 | ) | | | (15,488 | ) |
| Outstanding, end of period | | | 30,200,000 | | | $ | 322,404 | |
D. Related Parties
Management Agreement. Under the Investment Management Agreement with Deutsche Investment Management Americas Inc. ("DIMA" or the "Advisor"), an indirect, wholly owned subsidiary of Deutsche Bank AG, the Advisor directs the investments of the Fund in accordance with its investment objectives, policies and restrictions. The Advisor determines the securities, instruments and other contracts relating to investments to be purchased, sold or entered into by the Fund.
Under the Investment Management Agreement, the Fund pays a monthly management fee based on the Fund's average daily net assets, computed and accrued daily and payable monthly, at the following annual rates:
| First $250 million | | | .370 | % |
| Next $750 million | | | .345 | % |
| Over $1 billion | | | .310 | % |
Accordingly, for the six months ended June 30, 2014, the fee pursuant to the Investment Management Agreement was equivalent to an annualized effective rate (exclusive of any applicable waivers/reimbursements) of 0.37% of the Fund's average daily net assets.
For the period from January 1, 2014 through September 30, 2014, the Advisor has contractually agreed to waive its fees and/or reimburse certain operating expenses to the extent necessary to maintain the operating expenses (excluding certain expenses such as extraordinary expenses, taxes, brokerage and interest expense) of class A shares at 0.71%.
Administration Fee. Pursuant to an Administrative Services Agreement, DIMA provides most administrative services to the Fund. For all services provided under the Administrative Services Agreement, the Fund pays DIMA an annual fee ("Administration Fee") of 0.10% of the Fund's average daily net assets, computed and accrued daily and payable monthly. For the six months ended June 30, 2014, the Administration Fee was $131,319, of which $21,809 is unpaid.
Service Provider Fees. DeAWM Service Company ("DSC"), an affiliate of the Advisor, is the transfer agent, dividend-paying agent and shareholder service agent for the Fund. Pursuant to a sub-transfer agency agreement between DSC and DST Systems, Inc. ("DST"), DSC has delegated certain transfer agent, dividend-paying agent and shareholder service agent functions to DST. DSC compensates DST out of the shareholder servicing fee it receives from the Fund. For the six months ended June 30, 2014, the amounts charged to the Fund by DSC aggregated $196, of which $97 is unpaid.
Typesetting and Filing Service Fees. Under an agreement with DIMA, DIMA is compensated for providing typesetting and certain regulatory filing services to the Fund. For the six months ended June 30, 2014, the amount charged to the Fund by DIMA included in the Statement of Operations under "reports to shareholders" aggregated $10,263, of which $4,479 is unpaid.
Trustees' Fees and Expenses. The Fund paid retainer fees to each Trustee not affiliated with the Advisor, plus specified amounts to the Board Chairperson and Vice Chairperson and to each committee Chairperson.
Affiliated Cash Management Vehicles. The Fund may invest uninvested cash balances in Central Cash Management Fund and Deutsche Variable NAV Money Fund, affiliated money market funds which are managed by the Advisor. Each affiliated money market fund seeks to provide a high level of current income consistent with liquidity and the preservation of capital. Each affiliated money market fund is managed in accordance with Rule 2a-7 under the Investment Company Act of 1940, which governs the quality, maturity, diversity and liquidity of instruments in which a money market fund may invest. Central Cash Management Fund seeks to maintain a stable net asset value, and Deutsche Variable NAV Money Fund maintains a floating net asset value. The Fund indirectly bears its proportionate share of the expenses of each affiliated money market fund in which it invests. Central Cash Management Fund does not pay the Advisor an investment management fee. To the extent that Deutsche Variable NAV Money Fund pays an investment management fee to the Advisor, the Advisor will waive an amount of the investment management fee payable to the Advisor by the Fund equal to the amount of the investment management fee payable on the Fund's assets invested in Deutsche Variable NAV Money Fund.
Securities Lending Agent Fees. Deutsche Bank AG serves as securities lending agent for the Fund. For the six months ended June 30, 2014, the Fund incurred securities lending agent fees to Deutsche Bank AG in the amount of $4,041.
E. Ownership of the Fund
At June 30, 2014, two participating insurance companies were owners of record of 10% or more of the total outstanding shares of the Fund, each owning 60% and 21%.
F. Line of Credit
The Fund and other affiliated funds (the "Participants") share in a $400 million revolving credit facility provided by a syndication of banks. The Fund may borrow for temporary or emergency purposes, including the meeting of redemption requests that otherwise might require the untimely disposition of securities. The Participants are charged an annual commitment fee which is allocated based on net assets, among each of the Participants. Interest is calculated at a rate per annum equal to the sum of the Federal Funds Rate plus 1.25 percent plus if LIBOR exceeds the Federal Funds Rate the amount of such excess. The Fund may borrow up to a maximum of 33 percent of its net assets under the agreement. The Fund had no outstanding loans at June 30, 2014.
G. Fund Name Change
Effective August 11, 2014, the "DWS Funds" were rebranded "Deutsche Funds."
Information About Your Fund's Expenses (Unaudited)
As an investor of the Fund, you incur two types of costs: ongoing expenses and transaction costs. Ongoing expenses include management fees and other Fund expenses. Examples of transaction costs include contract charges, redemption fees and account maintenance fees, which are not shown in this section. The following tables are intended to help you understand your ongoing expenses (in dollars) of investing in the Fund and to help you compare these expenses with the ongoing expenses of investing in other mutual funds. The example in the table is based on an investment of $1,000 invested at the beginning of the six-month period and held for the entire period (January 1, 2014 to June 30, 2014).
The tables illustrate your Fund's expenses in two ways:
—Actual Fund Return. This helps you estimate the actual dollar amount of ongoing expenses (but not transaction costs) paid on a $1,000 investment in the Fund using the Fund's actual return during the period. To estimate the expenses you paid over the period, simply divide your account value by $1,000 (for example, an $8,600 account value divided by $1,000 = 8.6), then multiply the result by the number in the "Expenses Paid per $1,000" line under the share class you hold.
—Hypothetical 5% Fund Return. This helps you to compare your Fund's ongoing expenses (but not transaction costs) with those of other mutual funds using the Fund's actual expense ratio and a hypothetical rate of return of 5% per year before expenses. Examples using a 5% hypothetical Fund return may be found in the shareholder reports of other mutual funds. The hypothetical account values and expenses may not be used to estimate the actual ending account balance or expenses you paid for the period.
Please note that the expenses shown in these tables are meant to highlight your ongoing expenses only and do not reflect any transaction costs. The "Expenses Paid per $1,000" line of the tables is useful in comparing ongoing expenses only and will not help you determine the relative total expense of owning different funds. If these transaction costs had been included, your costs would have been higher.
Expenses and Value of a $1,000 Investment for the six months ended June 30, 2014 | |
| Actual Fund Return | | Class A | |
| Beginning Account Value 1/1/14 | | $ | 1,000.00 | |
| Ending Account Value 6/30/14 | | $ | 1,053.90 | |
| Expenses Paid per $1,000* | | $ | 3.11 | |
| Hypothetical 5% Fund Return | | Class A | |
| Beginning Account Value 1/1/14 | | $ | 1,000.00 | |
| Ending Account Value 6/30/14 | | $ | 1,021.77 | |
| Expenses Paid per $1,000* | | $ | 3.06 | |
* Expenses are equal to the Fund's annualized expense ratio, multiplied by the average account value over the period, multiplied by 181 (the number of days in the most recent six-month period), then divided by 365.
| Annualized Expense Ratio | Class A | |
| Deutsche Variable Series II — Deutsche Global Income Builder VIP | .61% | |
For more information, please refer to the Fund's prospectus.
These tables do not reflect charges and fees ("contract charges") associated with the separate account that invests in the Fund or any variable life insurance policy or variable annuity contract for which the Fund is an investment option.
For an analysis of the fees associated with an investment in the fund or similar funds, please refer to the current and hypothetical expense calculators for Variable Insurance Products which can be found at deutschefunds.com/EN/resources/calculators.jsp.
The Trust's policies and procedures for voting proxies for portfolio securities and information about how the Trust voted proxies related to its portfolio securities during the 12-month period ended June 30 are available on our Web site — deutschefunds.com (click on "proxy voting" at the bottom of the page) — or on the SEC's Web site — sec.gov. To obtain a written copy of the Trust's policies and procedures without charge, upon request, call us toll free at (800) 728-3337.
Advisory Agreement Board Considerations and Fee Evaluation
The Board of Trustees approved the renewal of DWS Global Income Builder VIP's investment management agreement (the "Agreement") with Deutsche Investment Management Americas Inc. ("DIMA") in September 2013.
In terms of the process that the Board followed prior to approving the Agreement, shareholders should know that:
— In September 2013, all but one of the Fund's Trustees were independent of DIMA and its affiliates.
— The Trustees met frequently during the past year to discuss fund matters and dedicated a substantial amount of time to contract review matters. Over the course of several months, the Board's Contract Committee, in coordination with the Board's Fixed Income and Asset Allocation Oversight Committee, reviewed comprehensive materials received from DIMA, independent third parties and independent counsel. These materials included an analysis of the Fund's performance, fees and expenses, and profitability compiled by a fee consultant retained by the Fund's Independent Trustees (the "Fee Consultant"). The Board also received extensive information throughout the year regarding performance of the Fund.
— The Independent Trustees regularly meet privately with their independent counsel to discuss contract review and other matters. In addition, the Independent Trustees were also advised by the Fee Consultant in the course of their review of the Fund's contractual arrangements and considered a comprehensive report prepared by the Fee Consultant in connection with their deliberations.
— In connection with reviewing the Agreement, the Board also reviewed the terms of the Fund's distribution agreement, administrative services agreement, transfer agency agreement and other material service agreements.
— Based on its evaluation of the information provided, the Contract Committee presented its findings and recommendations to the Board. The Board then reviewed the Contract Committee's findings and recommendations.
In connection with the contract review process, the Contract Committee and the Board considered the factors discussed below, among others. The Board also considered that DIMA and its predecessors have managed the Fund since its inception, and the Board believes that a long-term relationship with a capable, conscientious advisor is in the best interests of the Fund. The Board considered, generally, that shareholders chose to invest or remain invested in the Fund knowing that DIMA managed the Fund, and that the Agreement was approved by the Fund's shareholders. DIMA is part of Deutsche Bank AG, a major global banking institution that is engaged in a wide range of financial services. The Board believes that there are advantages to being part of a global asset management business that offers a wide range of investing expertise and resources, including hundreds of portfolio managers and analysts with research capabilities in many countries throughout the world.
As part of the contract review process, the Board carefully considered the fees and expenses of each DWS fund overseen by the Board in light of the fund's performance. In many cases, this led to a negotiation with DIMA of lower expense caps as part of the 2012 and 2013 contract review processes than had previously been in place. As part of these negotiations, the Board indicated that it would consider relaxing these new lower caps in future years following sustained improvements in performance, among other considerations.
In June 2012, Deutsche Bank AG ("DB"), DIMA's parent company, announced that DB would combine its Asset Management (of which DIMA was a part) and Wealth Management divisions. DB has advised the Independent Trustees that the U.S. asset management business is a critical and integral part of DB, and that it has, and will continue to, reinvest a significant portion of the substantial savings it expects to realize by combining its Asset Management and Wealth Management divisions into the new Asset and Wealth Management ("AWM") division, including ongoing enhancements to its investment capabilities. DB also has confirmed its commitment to maintaining strong legal and compliance groups within the AWM division.
While shareholders may focus primarily on fund performance and fees, the Fund's Board considers these and many other factors, including the quality and integrity of DIMA's personnel and such other issues as back-office operations, fund valuations, and compliance policies and procedures.
Nature, Quality and Extent of Services. The Board considered the terms of the Agreement, including the scope of advisory services provided under the Agreement. The Board noted that, under the Agreement, DIMA provides portfolio management services to the Fund and that, pursuant to a separate administrative services agreement, DIMA provides administrative services to the Fund. The Board considered the experience and skills of senior management and investment personnel, the resources made available to such personnel, the ability of DIMA to attract and retain high-quality personnel, and the organizational depth and stability of DIMA. The Board reviewed the Fund's performance over short-term and long-term periods and compared those returns to various agreed-upon performance measures, including market indices and a peer universe compiled by the Fee Consultant using information supplied by Morningstar Direct ("Morningstar"), an independent fund data service. The Board also noted that it has put into place a process of identifying "Focus Funds" (e.g., funds performing poorly relative to their benchmark or a peer universe compiled by an independent fund data service), and receives more frequent reporting and information from DIMA regarding such funds, along with DIMA's remedial plans to address underperformance. The Board believes this process is an effective manner of identifying and addressing underperforming funds. Based on the information provided, the Board noted that for the one-, three- and five-year periods ended December 31, 2012, the Fund's performance (Class A shares) was in the 2nd quartile, 2nd quartile and 3rd quartile, respectively, of the applicable Morningstar universe (the 1st quartile being the best performers and the 4th quartile being the worst performers). The Board also observed that the Fund has outperformed its benchmark in the one- and three-year periods and has underperformed its benchmark in the five-year period ended December 31, 2012.
Fees and Expenses. The Board considered the Fund's investment management fee schedule, operating expenses and total expense ratios, and comparative information provided by Lipper Inc. ("Lipper") and the Fee Consultant regarding investment management fee rates paid to other investment advisors by similar funds (1st quartile being the most favorable and 4th quartile being the least favorable). With respect to management fees paid to other investment advisors by similar funds, the Board noted that the contractual fee rates paid by the Fund, which include a 0.10% fee paid to DIMA under the Fund's administrative services agreement, were lower than the median (1st quartile) of the applicable Lipper peer group (based on Lipper data provided as of December 31, 2012). The Board noted that the Fund's Class A shares total (net) operating expenses were expected to be lower than the median (1st quartile) of the applicable Lipper expense universe (based on Lipper data provided as of December 31, 2012, and analyzing Lipper expense universe Class A (net) expenses less any applicable 12b-1 fees) ("Lipper Universe Expenses"). The Board considered the Fund's management fee rate as compared to fees charged by DIMA to a comparable fund and considered differences between the Fund and the comparable fund. The Board also considered how the Fund's total (net) operating expenses compared to the total (net) operating expenses of a more customized peer group selected by Lipper (based on such factors as asset size). The Board also noted that the expense limitation agreed to by DIMA helped to ensure that the Fund's total (net) operating expenses would remain competitive.
The information considered by the Board as part of its review of management fees included information regarding fees charged by DIMA and its affiliates to similar institutional accounts and to similar funds offered primarily to European investors ("DWS Europe funds"), in each case as applicable. The Board observed that advisory fee rates for institutional accounts generally were lower than the management fees charged by similarly managed DWS U.S. mutual funds ("DWS Funds"), but also took note of the differences in services provided to DWS Funds as compared to institutional accounts. In the case of DWS Europe funds, the Board observed that fee rates for DWS Europe funds generally were higher than for similarly managed DWS Funds, but noted that differences in the types of services provided to DWS Funds relative to DWS Europe funds made it difficult to compare such fees.
On the basis of the information provided, the Board concluded that management fees were reasonable and appropriate in light of the nature, quality and extent of services provided by DIMA.
Profitability. The Board reviewed detailed information regarding revenues received by DIMA under the Agreement. The Board considered the estimated costs and pre-tax profits realized by DIMA from advising the DWS Funds, as well as estimates of the pre-tax profits attributable to managing the Fund in particular. The Board also received information regarding the estimated enterprise-wide profitability of DWS and its affiliates with respect to all fund services in totality and by fund. The Board and the Fee Consultant reviewed DIMA's methodology in allocating its costs to the management of the Fund. Based on the information provided, the Board concluded that the pre-tax profits realized by DIMA in connection with the management of the Fund were not unreasonable. The Board also reviewed information regarding the profitability of certain similar investment management firms. The Board noted that while information regarding the profitability of such firms is limited (and in some cases is not necessarily prepared on a comparable basis), DIMA and its affiliates' overall profitability with respect to the DWS fund complex (after taking into account distribution and other services provided to the funds by DIMA and its affiliates) was lower than the overall profitability levels of many comparable firms for which such data was available.
Economies of Scale. The Board considered whether there are economies of scale with respect to the management of the Fund and whether the Fund benefits from any economies of scale. The Board noted that the Fund's management fee schedule includes fee breakpoints. The Board concluded that the Fund's fee schedule represents an appropriate sharing between the Fund and DIMA of such economies of scale as may exist in the management of the Fund at current asset levels.
Other Benefits to DIMA and Its Affiliates. The Board also considered the character and amount of other incidental benefits received by DIMA and its affiliates, including any fees received by DIMA for administrative services provided to the Fund and any fees received by an affiliate of DIMA for distribution services. The Board also considered benefits to DIMA related to brokerage and soft-dollar allocations, including allocating brokerage to pay for research generated by parties other than the executing broker dealers, which pertain primarily to funds investing in equity securities, along with the incidental public relations benefits to DIMA related to DWS Funds advertising and cross-selling opportunities among DIMA products and services. The Board concluded that management fees were reasonable in light of these fallout benefits.
Compliance. The Board considered the significant attention and resources dedicated by DIMA to documenting and enhancing its compliance processes in recent years. The Board noted in particular (i) the experience and seniority of both DIMA's chief compliance officer and the Fund's chief compliance officer; (ii) the large number of DIMA compliance personnel; and (iii) the substantial commitment of resources by DIMA and its affiliates to compliance matters.
Based on all of the information considered and the conclusions reached, the Board unanimously determined that the continuation of the Agreement is in the best interests of the Fund. In making this determination, the Board did not give particular weight to any single factor identified above. The Board considered these factors over the course of numerous meetings, certain of which were in executive session with only the Independent Trustees and their independent counsel present. It is possible that individual Trustees may have weighed these factors differently in reaching their individual decisions to approve the continuation of the Agreement.
Notes
DeAWM Distributors, Inc.
222 South Riverside Plaza
Chicago, IL 60606
(800) 621-1148
VS2GIB-3 (R-028382-3 8/14)
June 30, 2014
Semiannual Report
Deutsche Variable Series II
(formerly DWS Variable Series II)
Deutsche Government & Agency Securities VIP
(formerly DWS Government & Agency Securities VIP)
Contents
5 Portfolio Management Team 11 Statement of Assets and Liabilities 12 Statement of Operations 13 Statement of Changes in Net Assets 16 Notes to Financial Statements 23 Information About Your Fund's Expenses 25 Advisory Agreement Board Considerations and Fee Evaluation |
This report must be preceded or accompanied by a prospectus. To obtain an additional prospectus or summary prospectus, if available, call (800) 728-3337 or your financial representative. We advise you to consider the Fund's objectives, risks, charges and expenses carefully before investing. The summary prospectus and prospectus contain this and other important information about the Fund. Please read the prospectus carefully before you invest.
Bond investments are subject to interest-rate and credit risks. When interest rates rise, bond prices generally fall. Credit risk refers to the ability of an issuer to make timely payments of principal and interest. Investing in derivatives entails special risks relating to liquidity, leverage and credit that may reduce returns and/or increase volatility. The Fund may lend securities to approved institutions. The "full faith and credit" guarantee of the U.S. government applies to the timely repayment of interest, and does not eliminate market risk. Because of the rising U.S. government debt burden, it is possible that the U.S. government may not be able to meet its financial obligations or that securities issued by the U.S. government may experience credit downgrades. See the prospectus for details.
Deutsche Asset & Wealth Management represents the asset management and wealth management activities conducted by Deutsche Bank AG or any of its subsidiaries, including the Advisor and DeAWM Distributors, Inc.
NOT FDIC/NCUA INSURED NO BANK GUARANTEE MAY LOSE VALUE NOT A DEPOSIT
NOT INSURED BY ANY FEDERAL GOVERNMENT AGENCY
Dear Shareholder:
I am very pleased to tell you that the DWS funds have been renamed Deutsche funds, aligning more closely with the Deutsche Asset & Wealth Management brand. We are proud to adopt the Deutsche name — a brand that fully represents the global access, discipline and intelligence that support all of our products and services.
Deutsche Asset & Wealth Management combines the asset management and wealth management divisions of Deutsche Bank to deliver a comprehensive suite of active, passive and alternative investment capabilities. Your investment in the Deutsche funds means you have access to the thought leadership and resources of one of the world’s largest and most influential financial institutions.
In conjunction with your fund’s name change, please note that the Deutsche funds’ Web address has changed as well. The former dws-investments.com is now deutschefunds.com.
In addition, key service providers have been renamed as follows:
| Former Name | New name, effective August 11, 2014 |
| DWS Investments Distributors, Inc. | DeAWM Distributors, Inc. |
| DWS Trust Company | DeAWM Trust Company |
| DWS Investments Service Company | DeAWM Service Company |
These changes have no effect on the day-to-day management of your investment, and there is no action required on your part. You will continue to experience the benefits that come from our decades of experience, in-depth research and worldwide network of investment professionals.
Thanks for your continued support. We appreciate your trust and the opportunity to put our capabilities to work for you.
Best regards,
Brian Binder
President, Deutsche Funds
Performance Summary June 30, 2014 (Unaudited)
Fund performance shown is historical, assumes reinvestment of all dividend and capital gain distributions and does not guarantee future results. Investment return and principal value fluctuate with changing market conditions so that, when redeemed, shares may be worth more or less than their original cost. Current performance may be lower or higher than the performance data quoted. Please contact your participating insurance company for the Fund's most recent month-end performance. Performance doesn't reflect charges and fees ("contract charges") associated with the separate account that invests in the Fund or any variable life insurance policy or variable annuity contract for which the Fund is an investment option. These charges and fees will reduce returns. While all share classes have the same underlying portfolio, their performance will differ.
The gross expense ratios of the Fund, as stated in the fee table of the prospectus dated May 1, 2014 are 0.71% and 1.06% for Class A and Class B shares, respectively, and may differ from the expense ratios disclosed in the Financial Highlights tables in this report.
| Growth of an Assumed $10,000 Investment in Deutsche Government & Agency Securities VIP |
| The Barclays GNMA Index is an unmanaged, market-value-weighted measure of all fixed-rate securities backed by mortgage pools of the Government National Mortgage Association. Index returns do not reflect any fees or expenses and it is not possible to invest directly into an index. |
| |
| Yearly periods ended June 30 | |
| Comparative Results | |
| Deutsche Government & Agency Securities VIP | | 6-Month‡ | | | 1-Year | | | 3-Year | | | 5-Year | | | 10-Year | |
| Class A | Growth of $10,000 | | $ | 10,396 | | | $ | 10,377 | | | $ | 10,709 | | | $ | 12,319 | | | $ | 15,775 | |
| Average annual total return | | | 3.96 | % | | | 3.77 | % | | | 2.31 | % | | | 4.26 | % | | | 4.66 | % |
| Barclays GNMA Index | Growth of $10,000 | | $ | 10,414 | | | $ | 10,474 | | | $ | 10,881 | | | $ | 12,360 | | | $ | 16,352 | |
| Average annual total return | | | 4.14 | % | | | 4.74 | % | | | 2.86 | % | | | 4.33 | % | | | 5.04 | % |
| Deutsche Government & Agency Securities VIP | | 6-Month‡ | | | 1-Year | | | 3-Year | | | 5-Year | | | 10-Year | |
| Class B | Growth of $10,000 | | $ | 10,371 | | | $ | 10,335 | | | $ | 10,598 | | | $ | 12,104 | | | $ | 15,208 | |
| Average annual total return | | | 3.71 | % | | | 3.35 | % | | | 1.95 | % | | | 3.89 | % | | | 4.28 | % |
| Barclays GNMA Index | Growth of $10,000 | | $ | 10,414 | | | $ | 10,474 | | | $ | 10,881 | | | $ | 12,360 | | | $ | 16,352 | |
| Average annual total return | | | 4.14 | % | | | 4.74 | % | | | 2.86 | % | | | 4.33 | % | | | 5.04 | % |
The growth of $10,000 is cumulative.
‡ Total returns shown for periods less than one year are not annualized.
Portfolio Summary (Unaudited) Asset Allocation (As a % of Net Assets) | 6/30/14 | 12/31/13 |
| | | |
| Mortgage-Backed Securities Pass-Throughs | 89% | 89% |
| Collateralized Mortgage Obligations | 20% | 15% |
| Government & Agency Obligations | 17% | 21% |
| Cash Equivalents and Other Assets and Liabilities, net | –26% | –25% |
| | 100% | 100% |
| Coupons* | 6/30/14 | 12/31/13 |
| | | |
| Less than 4.5% | 33% | 32% |
| 4.5%–5.49% | 45% | 43% |
| 5.5%–6.49% | 19% | 21% |
| 6.5%–7.49% | 2% | 3% |
| 7.5% and Greater | 1% | 1% |
| | 100% | 100% |
| Interest Rate Sensitivity | 6/30/14 | 12/31/13 |
| | | |
| Effective Maturity | 6.6 years | 10.0 years |
| Effective Duration | 6.4 years | 6.3 years |
* Excludes Cash Equivalents, Securities Lending Collateral, U.S. Treasury Bills and Options Purchased.
Effective maturity is the weighted average of the maturity date of bonds held by the Fund taking into consideration any available maturity shortening features.
Effective duration is an approximate measure of the Fund's sensitivity to interest rate changes taking into consideration any maturity shortening features.
Portfolio holdings and characteristics are subject to change.
For more complete details about the Fund's investment portfolio, see page 6.
Following the Fund's fiscal first and third quarter-end, a complete portfolio holdings listing is filed with the SEC on Form N-Q. The form will be available on the SEC's Web site at sec.gov, and it also may be reviewed and copied at the SEC's Public Reference Room in Washington, D.C. Information on the operation of the SEC's Public Reference Room may be obtained by calling (800) SEC-0330. The Fund's portfolio holdings are also posted on deutschefunds.com from time to time. Please see the Fund's current prospectus for more information.
Portfolio Management Team
William Chepolis, CFA
Scott Agi, CFA
Portfolio Managers
Investment Portfolio June 30, 2014 (Unaudited) | | | Principal Amount ($) | | | Value ($) | |
| | | | |
| Mortgage-Backed Securities Pass-Throughs 89.0% | |
| Federal Home Loan Mortgage Corp., | |
| 4.0%, 8/1/2041 (a) | | | 9,000,000 | | | | 9,534,726 | |
| Federal National Mortgage Association, 4.5%, 1/1/2040 (a) | | | 8,000,000 | | | | 8,665,000 | |
| Government National Mortgage Association: | | | | | | | | |
| 3.5%, with various maturities from 2/15/2043 until 3/20/2043 | | | 4,563,172 | | | | 4,758,914 | |
| 4.0%, with various maturities from 9/20/2040 until 6/20/2043 (a) | | | 13,251,002 | | | | 14,193,652 | |
| 4.5%, with various maturities from 6/20/2033 until 2/20/2043 (a) | | | 11,420,181 | | | | 12,482,195 | |
| 4.55%, 1/15/2041 | | | 386,519 | | | | 423,839 | |
| 4.625%, 5/15/2041 | | | 194,030 | | | | 213,796 | |
| 5.0%, with various maturities from 11/20/2032 until 4/15/2042 | | | 14,184,328 | | | | 15,735,637 | |
| 5.5%, with various maturities from 10/15/2032 until 7/20/2040 | | | 7,644,729 | | | | 8,594,265 | |
| 6.0%, with various maturities from 2/15/2034 until 5/15/2040 | | | 7,697,683 | | | | 8,703,536 | |
| 6.5%, with various maturities from 9/15/2036 until 2/15/2039 | | | 945,659 | | | | 1,069,613 | |
| 7.0%, with various maturities from 2/20/2027 until 11/15/2038 | | | 222,687 | | | | 258,708 | |
| 7.5%, 10/20/2031 | | | 7,524 | | | | 9,040 | |
Total Mortgage-Backed Securities Pass-Throughs (Cost $82,974,335) | | | | 84,642,921 | |
| | |
| Collateralized Mortgage Obligations 19.6% | |
| Federal Home Loan Mortgage Corp.: | |
| "OA", Series 3179, Principal Only, Zero Coupon, 7/15/2036 | | | 192,964 | | | | 180,262 | |
| "KO", Series 4180, Principal Only, Zero Coupon, 1/15/2043 | | | 1,367,587 | | | | 813,590 | |
| "KB", Series 4144, 2.5%, 12/15/2042 | | | 214,837 | | | | 181,527 | |
| "YI", Series 3936, Interest Only, 3.0%, 6/15/2025 | | | 109,073 | | | | 8,278 | |
| "AI", Series 4016, Interest Only, 3.0%, 9/15/2025 | | | 1,204,739 | | | | 115,723 | |
| "WI", Series 3939, Interest Only, 3.0%, 10/15/2025 | | | 435,107 | | | | 34,744 | |
| "EI", Series 3953, Interest Only, 3.0%, 11/15/2025 | | | 620,642 | | | | 58,116 | |
| "IO", Series 3974, Interest Only, 3.0%, 12/15/2025 | | | 194,322 | | | | 17,741 | |
| "DI", Series 4010, Interest Only, 3.0%, 2/15/2027 | | | 157,342 | | | | 15,684 | |
| "IK", Series 4048, Interest Only, 3.0%, 5/15/2027 | | | 1,497,754 | | | | 193,474 | |
| "PZ", Series 4094, 3.0%, 8/15/2042 | | | 408,574 | | | | 358,956 | |
| "IK", Series 3754, Interest Only, 3.5%, 6/15/2025 | | | 919,360 | | | | 94,064 | |
| | | Principal Amount ($) | | | Value ($) | |
| | | | | | | | | |
| "DZ", Series 4199, 3.5%, 5/15/2043 | | | 242,880 | | | | 225,647 | |
| "ZG", Series 4213, 3.5%, 6/15/2043 | | | 361,429 | | | | 361,736 | |
| "KZ", Series 4328, 4.0%, 4/15/2044 | | | 336,007 | | | | 347,449 | |
| "UA", Series 4298, 4.0%, 2/15/2054 | | | 483,677 | | | | 495,558 | |
| "22", Series 243, Interest Only, 4.482%*, 6/15/2021 | | | 474,322 | | | | 26,662 | |
| "NI", Series 3657, Interest Only, 4.5%, 8/15/2027 | | | 260,262 | | | | 5,657 | |
| "PI", Series 2535, Interest Only, 6.0%, 9/15/2032 | | | 82,020 | | | | 1,745 | |
| "MI", Series 3871, Interest Only, 6.0%, 4/15/2040 | | | 143,404 | | | | 20,559 | |
| "A", Series 172, Interest Only, 6.5%, 1/1/2024 | | | 20,172 | | | | 3,722 | |
| "DS", Series 3199, Interest Only, 6.998%*, 8/15/2036 | | | 2,037,385 | | | | 416,711 | |
| "S", Series 2416, Interest Only, 7.948%*, 2/15/2032 | | | 273,416 | | | | 60,994 | |
| "ST", Series 2411, Interest Only, 8.598%*, 6/15/2021 | | | 698,057 | | | | 70,183 | |
| "KS", Series 2064, Interest Only, 9.998%*, 5/15/2022 | | | 276,598 | | | | 64,985 | |
| Federal National Mortgage Association: | |
| "DI", Series 2011-136, Interest Only, 3.0%, 1/25/2026 | | | 182,705 | | | | 17,581 | |
| "LZ", Series 2013-45, 3.0%, 5/25/2043 | | | 1,035,574 | | | | 879,652 | |
| "DZ", Series 2013-136, 3.0%, 1/25/2044 | | | 812,075 | | | | 667,377 | |
| "HI", Series 2010-123, Interest Only, 3.5%, 3/25/2024 | | | 326,241 | | | | 23,688 | |
| "KI", Series 2011-72, Interest Only, 3.5%, 3/25/2025 | | | 994,175 | | | | 69,401 | |
| ''IO", Series 2012-146, Interest Only, 3.5%, 1/25/2043 | | | 2,057,103 | | | | 476,296 | |
| "ZB", Series 2010-136, 4.0%, 12/25/2040 | | | 375,182 | | | | 391,203 | |
| "AZ", Series 2012-29, 4.0%, 4/25/2042 | | | 1,452,740 | | | | 1,455,430 | |
| "HZ", Series 2013-20, 4.0%, 3/25/2043 | | | 1,522,709 | | | | 1,504,726 | |
| "25", Series 351, Interest Only, 4.5%, 5/1/2019 | | | 146,271 | | | | 11,158 | |
| "HI", Series 2009-77, Interest Only, 4.5%, 9/25/2027 | | | 36,889 | | | �� | 132 | |
| "IN", Series 2003-49, Interest Only, 4.75%, 3/25/2018 | | | 696,299 | | | | 22,209 | |
| "21", Series 334, Interest Only, 5.0%, 3/1/2018 | | | 62,734 | | | | 4,157 | |
| "20", Series 334, Interest Only, 5.0%, 3/1/2018 | | | 99,208 | | | | 6,725 | |
| ''23", Series 339, Interest Only, 5.0%, 6/25/2018 | | | 141,233 | | | | 9,572 | |
| "26", Series 381, Interest Only, 5.0%, 12/25/2020 | | | 47,051 | | | | 4,451 | |
| "ZA", Series 2008-24, 5.0%, 4/25/2038 | | | 717,131 | | | | 776,597 | |
| "30", Series 381, Interest Only, 5.5%, 11/25/2019 | | | 273,138 | | | | 27,516 | |
| "PI", Series 2009-14, Interest Only, 5.5%, 3/25/2024 | | | 464,976 | | | | 63,981 | |
| "PJ", Series 2004-46, Interest Only, 5.848%*, 3/25/2034 | | | 341,369 | | | | 45,217 | |
| | | Principal Amount ($) | | | Value ($) | |
| | | | | | | | | |
| "WI", Series 2011-59, Interest Only, 6.0%, 5/25/2040 | | | 295,990 | | | | 31,946 | |
| "101", Series 383, Interest Only, 6.5%, 9/25/2022 | | | 936,928 | | | | 144,892 | |
| "SJ", Series 2007-36, Interest Only, 6.618%*, 4/25/2037 | | | 191,610 | | | | 30,665 | |
| "KI", Series 2005-65, Interest Only, 6.848%*, 8/25/2035 | | | 93,199 | | | | 17,957 | |
| "SA", Series G92-57, IOette, 83.384%*, 10/25/2022 | | | 34,789 | | | | 69,627 | |
| Government National Mortgage Association: | |
| "BI", Series 2014-22, Interest Only, 4.0%, 2/20/2029 | | | 1,161,602 | | | | 160,057 | |
| "JY", Series 2010-20, 4.0%, 12/20/2033 | | | 2,054,453 | | | | 2,178,783 | |
| "LI", Series 2009-104, Interest Only, 4.5%, 12/16/2018 | | | 190,053 | | | | 12,875 | |
| "NI", Series 2010-44, Interest Only, 4.5%, 10/20/2037 | | | 522,423 | | | | 45,497 | |
| "CI", Series 2010-87, Interest Only, 4.5%, 11/20/2038 | | | 1,251,588 | | | | 323,859 | |
| "MI", Series 2010-169, Interest Only, 4.5%, 8/20/2040 | | | 725,049 | | | | 107,639 | |
| "GZ", Series 2005-24, 5.0%, 3/20/2035 | | | 531,482 | | | | 599,552 | |
| "MI", Series 2009-76, Interest Only, 5.0%, 3/20/2035 | | | 45,517 | | | | 56 | |
| "ZA", Series 2005-75, 5.0%, 10/16/2035 | | | 597,909 | | | | 673,452 | |
| "MZ", Series 2009-98, 5.0%, 10/16/2039 | | | 1,072,862 | | | | 1,272,690 | |
| "Z", Series 2009-112, 5.0%, 11/20/2039 | | | 1,256,953 | | | | 1,391,542 | |
| "AI", Series 2008-46, Interest Only, 5.5%, 5/16/2023 | | | 195,880 | | | | 16,661 | |
| "GI", Series 2003-19, Interest Only, 5.5%, 3/16/2033 | | | 749,773 | | | | 151,183 | |
| "IB", Series 2010-130, Interest Only, 5.5%, 2/20/2038 | | | 226,173 | | | | 40,855 | |
| "BS", Series 2011-93, Interest Only, 5.948%*, 7/16/2041 | | | 1,147,962 | | | | 171,363 | |
| "MS", Series 2012-118, Interest Only, 5.997%, 9/20/2042* | | | 597,978 | | | | 80,797 | |
| "DI", Series 2009-10, Interest Only, 6.0%, 4/16/2038 | | | 293,729 | | | | 50,904 | |
| "SA", Series 2012-84, Interest Only, 6.147%*, 12/20/2038 | | | 1,347,793 | | | | 203,045 | |
| "QA", Series 2007-57, Interest Only, 6.347%*, 10/20/2037 | | | 287,137 | | | | 41,828 | |
| "IP", Series 2009-118, Interest Only, 6.5%, 12/16/2039 | | | 83,079 | | | | 15,733 | |
| "IC", Series 1997-4, Interest Only, 7.5%, 3/16/2027 | | | 543,621 | | | | 139,137 | |
| "SK", Series 2003-11, Interest Only, 7.548%*, 2/16/2033 | | | 457,050 | | | | 79,420 | |
Total Collateralized Mortgage Obligations (Cost $17,272,133) | | | | 18,682,851 | |
| | |
| | | Principal Amount ($) | | | Value ($) | |
| | | | | | | | | |
| Government & Agency Obligations 17.4% | |
| U.S. Government Sponsored Agency 10.5% | |
| Federal Home Loan Bank, 0.875%, 5/24/2017 | | | 10,000,000 | | | | 10,003,989 | |
| U.S. Treasury Obligations 6.9% | |
| U.S. Treasury Bill, 0.065%**, 8/14/2014 (b) | | | 1,045,000 | | | | 1,044,972 | |
| U.S. Treasury Notes: | |
| 1.0%, 8/31/2016 (c) | | | 3,450,000 | | | | 3,485,576 | |
| 1.0%, 9/30/2016 | | | 2,000,000 | | | | 2,019,376 | |
| | | | | 6,549,924 | |
Total Government & Agency Obligations (Cost $16,529,962) | | | | 16,553,913 | |
| | | Contract Amount | | | Value ($) | |
| | | | |
| Call Options Purchased 0.2% | |
| Options on Interest Rate Swap Contracts | |
Pay Fixed Rate — 3.72% – Receive Floating — LIBOR, Swap Expiration Date 4/22/2026, Option Expiration Date 4/20/20161 | | | 2,600,000 | | | | 56,132 | |
Pay Fixed Rate — 4.32% – Receive Floating — LIBOR, Swap Expiration Date 2/3/2027, Option Expiration Date 2/1/20172 | | | 6,000,000 | | | | 120,378 | |
Total Call Options Purchased (Cost $390,446) | | | | 176,510 | |
| | |
| Put Options Purchased 0.1% | |
| Options on Interest Rate Swap Contracts | |
Receive Fixed Rate — 2.32% – Pay Floating — LIBOR, Swap Expiration Date 2/3/2027, Option Expiration Date 2/1/20172 (Cost $203,884) | | | 6,000,000 | | | | 57,642 | |
| | | Shares | | | Value ($) | |
| | | | |
| Securities Lending Collateral 8.5% | |
| Daily Assets Fund Institutional, 0.08% (d) (e) (Cost $8,080,000) | | | 8,080,000 | | | | 8,080,000 | |
| | |
| Cash Equivalents 0.4% | |
| Central Cash Management Fund, 0.06% (d) (Cost $412,815) | | | 412,815 | | | | 412,815 | |
| | | % of Net Assets | | | Value ($) | |
| | | | |
Total Investment Portfolio (Cost $125,863,575)† | | | 135.2 | | | | 128,606,652 | |
Other Assets and Liabilities, Net (f) | | | (35.2 | ) | | | (33,492,429 | ) |
| Net Assets | | | 100.0 | | | | 95,114,223 | |
* These securities are shown at their current rate as of June 30, 2014.
** Annualized yield at time of purchase; not a coupon rate.
† The cost for federal income tax purposes was $125,926,867. At June 30, 2014, net unrealized appreciation for all securities based on tax cost was $2,679,785. This consisted of aggregate gross unrealized appreciation for all securities in which there was an excess of value over tax cost of $4,151,015 and aggregate gross unrealized depreciation for all securities in which there was an excess of tax cost over value of $1,471,230.
(a) When-issued or delayed delivery securities included.
(b) At June 30, 2014, this security has been pledged, in whole or in part, to cover initial margin requirements for open futures contracts.
(c) At June 30, 2014, this security has been pledged, in whole or in part, as collateral for open over-the-counter derivatives.
(d) Affiliated fund managed by Deutsche Investment Management Americas Inc. The rate shown is the annualized seven-day yield at period end.
(e) Represents collateral held in connection with securities lending. Income earned by the Fund is net of borrower rebates.
(f) All or a portion of these securities were on loan. In addition, "Other Assets and Liabilities, Net" may include pending sales that are also on loan. The value of securities loaned at June 30, 2014 amounted to $7,939,230, which is 8.3% of net assets.
Interest Only: Interest Only (IO) bonds represent the "interest only" portion of payments on a pool of underlying mortgages or mortgage-backed securities. IO securities are subject to prepayment risk of the pool of underlying mortgages.
IOettes: These securities represent the right to receive interest payments on an underlying pool of mortgages with similar features as those associated with IO securities. Unlike IO's, a nominal amount of principal is assigned to an IOette which is small in relation to the interest flow that constitutes almost all of the IOette cash flow. The effective yield of this security is lower than the stated interest rate.
LIBOR: London Interbank Offered Rate
Principal Only: Principal Only (PO) bonds represent the "principal only" portion of payments on a pool of underlying mortgages or mortgage-backed securities.
Included in the portfolio are investments in mortgage- or asset-backed securities which are interests in separate pools of mortgages or assets. Effective maturities of these investments may be shorter than stated maturities due to prepayments. Some separate investments in the Government National Mortgage Association issues which have similar coupon rates have been aggregated for presentation purposes in this investment portfolio.
At June 30, 2014, open futures contracts purchased were as follows:
| Futures | Currency | Expiration Date | | Contracts | | | Notional Value ($) | | | Unrealized Appreciation ($) | |
| 10 Year Interest Rate Swap | USD | 9/15/2014 | | | 35 | | | | 3,675,547 | | | | 35,124 | |
| 10 Year U.S. Treasury Note | USD | 9/19/2014 | | | 5 | | | | 625,859 | | | | 1,406 | |
| 5 Year U.S. Treasury Note | USD | 9/30/2014 | | | 36 | | | | 4,300,594 | | | | 12,026 | |
| Total unrealized appreciation | | | | 48,556 | |
At June 30, 2014, open futures contracts sold were as follows:
| Futures | Currency | Expiration Date | | Contracts | | | Notional Value ($) | | | Unrealized Depreciation ($) | |
| U.S. Treasury Long Bond | USD | 9/19/2014 | | | 65 | | | | 8,917,188 | | | | (97,868 | ) |
| Currency Abbreviation |
| USD United States Dollar |
At June 30, 2014, open written options contracts were as follows:
| Options on Interest Rate Swap Contracts | Swap Effective/ Expiration Dates | | Contract Amount | | Option Expiration Date | | Premiums Received ($) | | | Value ($) (g) | |
Call Options Receive Fixed — 4.48% – Pay Floating — LIBOR | 5/11/2016 5/11/2026 | | | 2,400,000 | 1 | 5/5/2016 | | | 26,940 | | | | (20,708 | ) |
| Receive Fixed — 3.32% – Pay Floating — LIBOR | 2/3/2017 2/3/2027 | | | 3,000,000 | 2 | 2/1/2017 | | | 216,990 | | | | (152,311 | ) |
| Receive Fixed — 4.22% – Pay Floating — LIBOR | 4/22/2016 4/22/2026 | | | 2,600,000 | 1 | 4/20/2016 | | | 92,690 | | | | (29,790 | ) |
| Receive Fixed — 5.132% – Pay Floating — LIBOR | 3/17/2016 3/17/2026 | | | 2,400,000 | 1 | 3/15/2016 | | | 17,340 | | | | (6,335 | ) |
| Receive Fixed — 5.132% – Pay Floating — LIBOR | 3/17/2016 3/17/2026 | | | 2,400,000 | 2 | 3/15/2016 | | | 28,320 | | | | (6,335 | ) |
| Total Call Options | | | 382,280 | | | | (215,479 | ) |
Put Options Pay Fixed — 1.132% – Receive Floating — LIBOR | 3/17/2016 3/17/2026 | | | 2,400,000 | 1 | 3/15/2016 | | | 17,341 | | | | (676 | ) |
| Pay Fixed — 1.132% – Receive Floating — LIBOR | 3/17/2016 3/17/2026 | | | 2,400,000 | 2 | 3/15/2016 | | | 6,120 | | | | (676 | ) |
| Pay Fixed — 2.480% – Receive Floating — LIBOR | 5/11/2016 5/11/2026 | | | 2,400,000 | 1 | 5/5/2016 | | | 26,940 | | | | (25,173 | ) |
| Pay Fixed — 2.796% – Receive Floating — LIBOR | 6/5/2015 6/5/2045 | | | 2,200,000 | 2 | 6/3/2015 | | | 23,540 | | | | (18,827 | ) |
| Pay Fixed — 3.005% – Receive Floating — LIBOR | 3/6/2015 3/6/2045 | | | 2,200,000 | 1 | 3/4/2015 | | | 23,100 | | | | (25,386 | ) |
| Pay Fixed — 3.033% – Receive Floating — LIBOR | 10/24/2014 10/24/2044 | | | 1,900,000 | 3 | 10/22/2014 | | | 24,130 | | | | (10,697 | ) |
| Pay Fixed — 3.035% – Receive Floating — LIBOR | 2/15/2015 2/3/2045 | | | 2,200,000 | 2 | 1/30/2015 | | | 27,170 | | | | (25,098 | ) |
| Pay Fixed — 3.088% – Receive Floating — LIBOR | 1/28/2015 1/28/2045 | | | 2,400,000 | 4 | 1/26/2015 | | | 24,210 | | | | (31,631 | ) |
| Pay Fixed — 3.093% – Receive Floating — LIBOR | 10/21/2014 10/21/2044 | | | 1,900,000 | 2 | 10/17/2014 | | | 26,220 | | | | (14,122 | ) |
| Pay Fixed — 3.32% – Receive Floating — LIBOR | 2/3/2017 2/3/2027 | | | 3,000,000 | 2 | 2/1/2017 | | | 216,990 | | | | (110,081 | ) |
| Total Put Options | | | 415,761 | | | | (262,367 | ) |
| Total | | | 798,041 | | | | (477,846 | ) |
(g) Unrealized appreciation on written options on interest rate swap contracts at June 30, 2014 was $320,195.
At June 30, 2014, open interest rate swap contracts were as follows:
| Centrally Cleared Swaps | |
Effective/ Expiration Dates | | Notional Amount ($) | | Cash Flows Paid by the Fund | Cash Flows Received by the Fund | | Value ($) | | | Unrealized Depreciation ($) | |
6/3/2014 6/3/2025 | | | 2,300,000 | | Fixed — 3.0% | Floating —- LIBOR | | | (69,202 | ) | | | (65,846 | ) |
12/30/2014 12/30/2016 | | | 23,200,000 | | Fixed — 1.173% | Floating — LIBOR | | | (119,146 | ) | | | (121,564 | ) |
12/30/2014 12/30/2019 | | | 400,000 | | Fixed — 2.522% | Floating —- LIBOR | | | (10,146 | ) | | | (10,489 | ) |
12/30/2014 12/30/2034 | | | 1,600,000 | | Fixed — 4.01% | Floating —- LIBOR | | | (171,149 | ) | | | (171,624 | ) |
12/30/2014 12/30/2044 | | | 1,400,000 | | Fixed — 4.081% | Floating — LIBOR | | | (186,471 | ) | | | (211,067 | ) |
5/11/2015 5/11/2045 | | | 2,400,000 | | Fixed — 3.56% | Floating —- LIBOR | | | (50,476 | ) | | | (49,116 | ) |
| Total unrealized depreciation | | | | (629,706 | ) |
| Bilateral Swaps | |
Effective/ Expiration Dates | | Notional Amount ($) | | Cash Flows Paid by the Fund | Cash Flows Received by the Fund | | Value ($) | | | Upfront Payments Paid/ (Received) ($) | | | Unrealized Depreciation ($) | |
6/3/2013 6/3/2025 | | | 2,300,000 | 1 | Floating — LIBOR | Fixed — 3.0% | | | (13,895 | ) | | | — | | | | (13,895 | ) |
Counterparties:
1 Nomura International PLC
2 BNP Paribas
3 Citigroup, Inc.
4 Barclays Bank PLC
For information on the Fund's policy and additional disclosures regarding futures contracts, purchased and written options contracts, and interest rate swap contracts, please refer to the Derivatives section of Note B in the accompanying Notes to Financial Statements.
Fair Value Measurements
Various inputs are used in determining the value of the Fund's investments. These inputs are summarized in three broad levels. Level 1 includes quoted prices in active markets for identical securities. Level 2 includes other significant observable inputs (including quoted prices for similar securities, interest rates, prepayment speeds and credit risk). Level 3 includes significant unobservable inputs (including the Fund's own assumptions in determining the fair value of investments). The level assigned to the securities valuations may not be an indication of the risk or liquidity associated with investing in those securities.
The following is a summary of the inputs used as of June 30, 2014 in valuing the Fund's investments. For information on the Fund's policy regarding the valuation of investments, please refer to the Security Valuation section of Note A in the accompanying Notes to Financial Statements.
| Assets | | Level 1 | | | Level 2 | | | Level 3 | | | Total | |
| | |
| Fixed-Income Investments (h) | |
| Mortgage-Backed Securities Pass-Throughs | | $ | — | | | $ | 84,642,921 | | | $ | — | | | $ | 84,642,921 | |
| Collateralized Mortgage Obligations | | | — | | | | 18,682,851 | | | | — | | | | 18,682,851 | |
| Government & Agency Obligations | | | — | | | | 16,553,913 | | | | — | | | | 16,553,913 | |
| Short-Term Investments | | | 8,492,815 | | | | — | | | | — | | | | 8,492,815 | |
| Derivatives (i) | |
| Purchased Options | | | — | | | | 234,152 | | | | — | | | | 234,152 | |
| Futures Contracts | | | 48,556 | | | | — | | | | — | | | | 48,556 | |
| Total | | $ | 8,541,371 | | | $ | 120,113,837 | | | $ | — | | | $ | 128,655,208 | |
| Liabilities | | Level 1 | | | Level 2 | | | Level 3 | | | Total | |
| | |
Derivatives (i) | |
| Futures Contracts | | $ | (97,868 | ) | | $ | — | | | $ | — | | | $ | (97,868 | ) |
| Written Options | | | — | | | | (477,846 | ) | | | — | | | | (477,846 | ) |
| Interest Rate Swap Contracts | | | — | | | | (643,601 | ) | | | — | | | | (643,601 | ) |
| Total | | $ | (97,868 | ) | | $ | (1,121,447 | ) | | $ | — | | | $ | (1,219,315 | ) |
There have been no transfers between fair value measurement levels during the period ended June 30, 2014.
(h) See Investment Portfolio for additional detailed categorizations.
(i) Derivatives include value of purchased options, unrealized appreciation (depreciation) on open futures contracts and interest rate swap contracts, and written options, at value.
The accompanying notes are an integral part of the financial statements.
Statement of Assets and Liabilities | as of June 30, 2014 (Unaudited) | |
| Assets | |
Investments Investments in non-affiliated securities, at value (cost $117,370,760) — including $7,939,230 of securities loaned | | $ | 120,113,837 | |
| Investment in Daily Assets Fund Institutional (cost $8,080,000)* | | | 8,080,000 | |
| Investment in Central Cash Management Fund (cost $412,815) | | | 412,815 | |
| Total investments in securities, at value (cost $125,863,575) | | | 128,606,652 | |
| Receivable for investments sold | | | 14,209,193 | |
| Receivable for investments sold — when-issued/delayed delivery securities | | | 28,556,219 | |
| Receivable for Fund shares sold | | | 2,049 | |
| Interest receivable | | | 420,173 | |
| Other assets | | | 1,394 | |
| Total assets | | | 171,795,680 | |
| Liabilities | |
| Payable upon return of securities loaned | | | 8,080,000 | |
| Payable for investments purchased | | | 9,993,625 | |
| Payable for investments purchased — when-issued/delayed delivery securities | | | 57,886,045 | |
| Payable for Fund shares redeemed | | | 75,231 | |
| Payable for variation margin on centrally cleared swaps | | | 36,842 | |
| Payable for variation margin on futures contracts | | | 8,251 | |
| Options written, at value (premium received $798,041) | | | 477,846 | |
| Unrealized depreciation on bilateral swap contracts | | | 13,895 | |
| Accrued management fee | | | 35,304 | |
| Accrued Trustees' fees | | | 751 | |
| Other accrued expenses and payables | | | 73,667 | |
| Total liabilities | | | 76,681,457 | |
| Net assets, at value | | $ | 95,114,223 | |
| Net Assets Consist of | |
| Undistributed net investment income | | | 1,142,061 | |
Unrealized appreciation (depreciation) on: Investments | | | 2,743,077 | |
| Swap contracts | | | (643,601 | ) |
| Futures | | | (49,312 | ) |
| Written options | | | 320,195 | |
| Accumulated net realized gain (loss) | | | 500,459 | |
| Paid-in capital | | | 91,101,344 | |
| Net assets, at value | | $ | 95,114,223 | |
Class A Net Asset Value, offering and redemption price per share ($91,796,470 ÷ 7,878,280 outstanding shares of beneficial interest, no par value, unlimited number of shares authorized) | | $ | 11.65 | |
Class B Net Asset Value, offering and redemption price per share ($3,317,753 ÷ 284,654 outstanding shares of beneficial interest, no par value, unlimited number of shares authorized) | | $ | 11.66 | |
* Represents collateral on securities loaned.
The accompanying notes are an integral part of the financial statements.
Statement of Operations
| for the six months ended June 30, 2014 (Unaudited) | |
| Investment Income | |
Income: Interest | | $ | 1,530,649 | |
| Income distributions — Central Cash Management Fund | | | 2,428 | |
| Securities lending income, including income from Daily Assets Fund Institutional, net of borrower rebates | | | 3,112 | |
| Total income | | | 1,536,189 | |
Expenses: Management fee | | | 219,931 | |
| Administration fee | | | 48,874 | |
| Services to shareholders | | | 695 | |
| Distribution service fees (Class B) | | | 4,273 | |
| Record keeping fees (Class B) | | | 1,575 | |
| Custodian fee | | | 18,464 | |
| Professional fees | | | 40,444 | |
| Reports to shareholders | | | 16,626 | |
| Trustees' fees and expenses | | | 3,107 | |
| Other | | | 5,464 | |
| Total expenses before expense reductions | | | 359,453 | |
| Expense reductions | | | (18,239 | ) |
| Total expenses after expense reductions | | | 341,214 | |
| Net investment income | | | 1,194,975 | |
| Realized and Unrealized Gain (Loss) | |
Net realized gain (loss) from: Investments | | | 1,279,998 | |
| Swap contracts | | | (292,770 | ) |
| Futures | | | (479,573 | ) |
| Written options | | | 102,720 | |
| | | | 610,375 | |
Change in net unrealized appreciation (depreciation) on: Investments | | | 2,115,269 | |
| Swap contracts | | | (522,151 | ) |
| Futures | | | 214,266 | |
| Written options | | | 226,931 | |
| | | | 2,034,315 | |
| Net gain (loss) | | | 2,644,690 | |
| Net increase (decrease) in net assets resulting from operations | | $ | 3,839,665 | |
The accompanying notes are an integral part of the financial statements.
Statement of Changes in Net Assets | Increase (Decrease) in Net Assets | | Six Months Ended June 30, 2014 (Unaudited) | | | Year Ended December 31, 2013 | |
Operations: Net investment income | | $ | 1,194,975 | | | $ | 2,293,792 | |
Operations: Net investment income | | $ | 1,194,975 | | | $ | 2,293,792 | |
| Net realized gain (loss) | | | 610,375 | | | | (119,888 | ) |
| Change in net unrealized appreciation (depreciation) | | | 2,034,315 | | | | (5,696,113 | ) |
| Net increase (decrease) in net assets resulting from operations | | | 3,839,665 | | | | (3,522,209 | ) |
Distributions to shareholders from: Net investment income: Class A | | | (2,179,180 | ) | | | (3,325,537 | ) |
| Class B | | | (66,035 | ) | | | (119,146 | ) |
Net realized gain: Class A | | | — | | | | (4,523,083 | ) |
| Class B | | | — | | | | (185,024 | ) |
| Total distributions | | | (2,245,215 | ) | | | (8,152,790 | ) |
Fund share transactions: Class A Proceeds from shares sold | | | 5,901,523 | | | | 9,306,924 | |
| Reinvestment of distributions | | | 2,179,180 | | | | 7,848,620 | |
| Payments for shares redeemed | | | (13,352,904 | ) | | | (31,059,765 | ) |
| Net increase (decrease) in net assets from Class A share transactions | | | (5,272,201 | ) | | | (13,904,221 | ) |
Class B Proceeds from shares sold | | | 169,269 | | | | 311,619 | |
| Reinvestment of distributions | | | 66,035 | | | | 304,170 | |
| Payments for shares redeemed | | | (614,425 | ) | | | (1,961,191 | ) |
| Net increase (decrease) in net assets from Class B share transactions | | | (379,121 | ) | | | (1,345,402 | ) |
| Increase (decrease) in net assets | | | (4,056,872 | ) | | | (26,924,622 | ) |
| Net assets at beginning of period | | | 99,171,095 | | | | 126,095,717 | |
| Net assets at end of period (including undistributed net investment income of $1,142,061 and $2,192,301, respectively) | | $ | 95,114,223 | | | $ | 99,171,095 | |
| Other Information | |
Class A Shares outstanding at beginning of period | | | 8,328,640 | | | | 9,511,241 | |
| Shares sold | | | 505,374 | | | | 782,217 | |
| Shares issued to shareholders in reinvestment of distributions | | | 189,659 | | | | 660,658 | |
| Shares redeemed | | | (1,145,393 | ) | | | (2,625,476 | ) |
| Net increase (decrease) in Class A shares | | | (450,360 | ) | | | (1,182,601 | ) |
| Shares outstanding at end of period | | | 7,878,280 | | | | 8,328,640 | |
Class B Shares outstanding at beginning of period | | | 317,145 | | | | 428,962 | |
| Shares sold | | | 14,600 | | | | 26,355 | |
| Shares issued to shareholders in reinvestment of distributions | | | 5,742 | | | | 25,582 | |
| Shares redeemed | | | (52,833 | ) | | | (163,754 | ) |
| Net increase (decrease) in Class B shares | | | (32,491 | ) | | | (111,817 | ) |
| Shares outstanding at end of period | | | 284,654 | | | | 317,145 | |
The accompanying notes are an integral part of the financial statements.
| | | | | | Years Ended December 31, | |
| Class A | | Six Months Ended 6/30/14 (Unaudited) | | | 2013 | | | 2012 | | | 2011 | | | 2010 | | | 2009 | |
| Selected Per Share Data | |
| Net asset value, beginning of period | | $ | 11.47 | | | $ | 12.69 | | | $ | 13.12 | | | $ | 12.98 | | | $ | 12.78 | | | $ | 12.40 | |
Income (loss) from investment operations: Net investment incomea | | | .14 | | | | .24 | | | | .34 | | | | .48 | | | | .50 | | | | .52 | |
| Net realized and unrealized gain (loss) | | | .31 | | | | (.59 | ) | | | .03 | | | | .45 | | | | .32 | | | | .45 | |
| Total from investment operations | | | .45 | | | | (.35 | ) | | | .37 | | | | .93 | | | | .82 | | | | .97 | |
Less distributions from: Net investment income | | | (.27 | ) | | | (.37 | ) | | | (.52 | ) | | | (.57 | ) | | | (.62 | ) | | | (.59 | ) |
| Net realized gains | | | — | | | | (.50 | ) | | | (.28 | ) | | | (.22 | ) | | | — | | | | — | |
| Total distributions | | | (.27 | ) | | | (.87 | ) | | | (.80 | ) | | | (.79 | ) | | | (.62 | ) | | | (.59 | ) |
| Net asset value, end of period | | $ | 11.65 | | | $ | 11.47 | | | $ | 12.69 | | | $ | 13.12 | | | $ | 12.98 | | | $ | 12.78 | |
| Total Return (%) | | | 3.96 | b** | | | (3.04 | )b | | | 2.93 | b | | | 7.46 | | | | 6.61 | | | | 8.08 | |
| Ratios to Average Net Assets and Supplemental Data | |
| Net assets, end of period ($ millions) | | | 92 | | | | 96 | | | | 121 | | | | 146 | | | | 157 | | | | 169 | |
| Ratio of expenses before expense reductions (%) | | | .72 | * | | | .71 | | | | .68 | | | | .67 | | | | .64 | | | | .58 | |
| Ratio of expenses after expense reductions (%) | | | .69 | * | | | .67 | | | | .66 | | | | .67 | | | | .64 | | | | .58 | |
| Ratio of net investment income (%) | | | 2.46 | * | | | 2.05 | | | | 2.65 | | | | 3.68 | | | | 3.86 | | | | 4.16 | |
| Portfolio turnover rate (%) | | | 301 | ** | | | 794 | | | | 796 | | | | 673 | | | | 423 | | | | 390 | |
a Based on average shares outstanding during the period. b Total return would have been lower had certain expenses not been reduced. * Annualized ** Not annualized | |
| | | | | | Years Ended December 31, | |
| Class B | | Six Months Ended 6/30/14 (Unaudited) | | | 2013 | | | 2012 | | | 2011 | | | 2010 | | | 2009 | |
| Selected Per Share Data | |
| Net asset value, beginning of period | | $ | 11.46 | | | $ | 12.67 | | | $ | 13.10 | | | $ | 12.95 | | | $ | 12.75 | | | $ | 12.37 | |
Income (loss) from investment operations: Net investment incomea | | | .12 | | | | .20 | | | | .29 | | | | .43 | | | | .46 | | | | .48 | |
| Net realized and unrealized gain (loss) | | | .31 | | | | (.59 | ) | | | .03 | | | | .46 | | | | .31 | | | | .45 | |
| Total from investment operations | | | .43 | | | | (.39 | ) | | | .32 | | | | .89 | | | | .77 | | | | .93 | |
Less distributions from: Net investment income | | | (.23 | ) | | | (.32 | ) | | | (.47 | ) | | | (.52 | ) | | | (.57 | ) | | | (.55 | ) |
| Net realized gains | | | — | | | | (.50 | ) | | | (.28 | ) | | | (.22 | ) | | | — | | | | — | |
| Total distributions | | | (.23 | ) | | | (.82 | ) | | | (.75 | ) | | | (.74 | ) | | | (.57 | ) | | | (.55 | ) |
| Net asset value, end of period | | $ | 11.66 | | | $ | 11.46 | | | $ | 12.67 | | | $ | 13.10 | | | $ | 12.95 | | | $ | 12.75 | |
| Total Return (%) | | | 3.71 | b** | | | (3.25 | )b | | | 2.48 | b | | | 7.15 | | | | 6.24 | | | | 7.70 | |
| Ratios to Average Net Assets and Supplemental Data | |
| Net assets, end of period ($ millions) | | | 3 | | | | 4 | | | | 5 | | | | 7 | | | | 6 | | | | 7 | |
| Ratio of expenses before expense reductions (%) | | | 1.07 | * | | | 1.06 | | | | 1.03 | | | | 1.01 | | | | .99 | | | | .92 | |
| Ratio of expenses after expense reductions (%) | | | 1.01 | * | | | .99 | | | | 1.01 | | | | 1.01 | | | | .99 | | | | .92 | |
| Ratio of net investment income (%) | | | 2.13 | * | | | 1.71 | | | | 2.29 | | | | 3.34 | | | | 3.51 | | | | 3.81 | |
| Portfolio turnover rate (%) | | | 301 | ** | | | 794 | | | | 796 | | | | 673 | | | | 423 | | | | 390 | |
a Based on average shares outstanding during the period. b Total return would have been lower had certain expenses not been reduced. * Annualized ** Not annualized | |
Notes to Financial Statements (Unaudited)
A. Organization and Significant Accounting Policies
Deutsche Government & Agency Securities VIP (formerly DWS Government & Agency Securities VIP) (the "Fund") is a diversified series of Deutsche Variable Series II (formerly DWS Variable Series II) (the "Trust"), which is registered under the Investment Company Act of 1940, as amended (the "1940 Act"), as an open-end management investment company organized as a Massachusetts business trust.
Multiple Classes of Shares of Beneficial Interest. The Fund offers two classes of shares (Class A shares and Class B shares). Sales of Class B shares are subject to recordkeeping fees up to 0.15% and Rule 12b-1 fees under the 1940 Act equal to an annual rate of 0.25% of the average daily net assets of the Class B shares of the Fund. Class A shares are not subject to such fees.
Investment income, realized and unrealized gains and losses, and certain fund-level expenses and expense reductions, if any, are borne pro rata on the basis of relative net assets by the holders of all classes of shares except that each class bears certain expenses unique to that class (including the applicable Rule 12b-1 fee and recordkeeping fees). Differences in class-level expenses may result in payment of different per share dividends by class. All shares have equal rights with respect to voting subject to class-specific arrangements.
The Fund's financial statements are prepared in accordance with accounting principles generally accepted in the United States of America which require the use of management estimates. Actual results could differ from those estimates. The policies described below are followed consistently by the Fund in the preparation of its financial statements.
Security Valuation. Investments are stated at value determined as of the close of regular trading on the New York Stock Exchange on each day the exchange is open for trading.
Various inputs are used in determining the value of the Fund's investments. These inputs are summarized in three broad levels. Level 1 includes quoted prices in active markets for identical securities. Level 2 includes other significant observable inputs (including quoted prices for similar securities, interest rates, prepayment speeds and credit risk). Level 3 includes significant unobservable inputs (including the Fund's own assumptions in determining the fair value of investments). The level assigned to the securities valuations may not be an indication of the risk or liquidity associated with investing in those securities.
Debt securities are valued at prices supplied by independent pricing services approved by the Fund's Board. If the pricing services are unable to provide valuations, securities are valued at the average of the most recent reliable bid quotation or evaluated price, as applicable, obtained from broker-dealers. Such services may use various pricing techniques which take into account appropriate factors such as yield, quality, coupon rate, maturity, type of issue, trading characteristics and other data, as well as broker quotes. These securities are generally categorized as Level 2.
Money market instruments purchased with an original or remaining maturity of sixty days or less, maturing at par, are valued at amortized cost, which approximates value, and are categorized as Level 2. Investments in open-end investment companies are valued at their net asset value each business day and are categorized as Level 1.
Futures contracts are generally valued at the settlement prices established each day on the exchange on which they are traded and are categorized as Level 1.
Swap contracts are valued daily based upon prices supplied by a Board approved pricing vendor, if available, and otherwise are valued at the price provided by the broker-dealer. Swap contracts are generally categorized as Level 2.
Exchange-traded options are valued at the last sale price or, in the absence of a sale, the mean between the closing bid and asked prices or at the most recent asked price (bid for purchased options) if no bid or asked price are available. Exchange-traded options are categorized as Level 1. Over-the-counter written or purchased options are valued at prices supplied by a Board approved pricing vendor, if available, and otherwise are valued at the price provided by the broker-dealer with which the option was traded. Over-the-counter written or purchased options are generally categorized as Level 2.
Securities and other assets for which market quotations are not readily available or for which the above valuation procedures are deemed not to reflect fair value are valued in a manner that is intended to reflect their fair value as determined in accordance with procedures approved by the Board and are generally categorized as Level 3. In accordance with the Fund's valuation procedures, factors considered in determining value may include, but are not limited to, the type of the security; the size of the holding; the initial cost of the security; the existence of any contractual restrictions on the security's disposition; the price and extent of public trading in similar securities of the issuer or of comparable companies; quotations or evaluated prices from broker-dealers and/or pricing services; information obtained from the issuer, analysts, and/or the appropriate stock exchange (for exchange-traded securities); an analysis of the company's or issuer's financial statements; an evaluation of the forces that influence the issuer and the market(s) in which the security is purchased and sold; and with respect to debt securities, the maturity, coupon, creditworthiness, currency denomination and the movement of the market in which the security is normally traded. The value determined under these procedures may differ from published values for the same securities.
Disclosure about the classification of fair value measurements is included in a table following the Fund's Investment Portfolio.
Securities Lending. Deutsche Bank AG, as lending agent, lends securities of the Fund to certain financial institutions under the terms of the Security Lending Agreement. The Fund retains the benefits of owning the securities it has loaned and continues to receive interest and dividends generated by the securities and to participate in any changes in their market value. The Fund requires the borrowers of the securities to maintain collateral with the Fund consisting of either cash or liquid, unencumbered assets having a value at least equal to the value of the securities loaned. When the collateral falls below specified amounts, the lending agent will use its best effort to obtain additional collateral on the next business day to meet required amounts under the security lending agreement. The Fund may invest the cash collateral into a joint trading account in an affiliated money market fund pursuant to Exemptive Orders issued by the SEC. The Fund receives compensation for lending its securities either in the form of fees or by earning interest on invested cash collateral net of borrower rebates and fees paid to a lending agent. Either the Fund or the borrower may terminate the loan. There may be risks of delay and costs in recovery of securities or even loss of rights in the collateral should the borrower of the securities fail financially. If the Fund is not able to recover securities lent, the Fund may sell the collateral and purchase a replacement investment in the market, incurring the risk that the value of the replacement security is greater than the value of the collateral. The Fund is also subject to all investment risks associated with the reinvestment of any cash collateral received, including, but not limited to, interest rate, credit and liquidity risk associated with such investments.
As of June 30, 2014, the Fund had securities on loan. The value of the related collateral exceeded the value of the securities on loan at period end.
Mortgage Dollar Rolls. The Fund may enter into mortgage dollar rolls in which the Fund sells to a bank or broker/dealer (the "counterparty") mortgage-backed securities for delivery in the current month and simultaneously contracts to repurchase similar, but not identical, securities on a fixed date. The counterparty receives all principal and interest payments, including prepayments, made on the security while it is the holder. The Fund receives compensation as consideration for entering into the commitment to repurchase. The compensation is paid in the form of a lower price for the security upon its repurchase, or alternatively, a fee. Mortgage dollar rolls may be renewed with a new sale and repurchase price and a cash settlement made at each renewal without physical delivery of the securities subject to the contract.
Certain risks may arise upon entering into mortgage dollar rolls from the potential inability of counterparties to meet the terms of their commitments. Additionally, the value of such securities may change adversely before the Fund is able to repurchase them. There can be no assurance that the Fund's use of the cash that it receives from a mortgage dollar roll will provide a return that exceeds its costs.
When-Issued/Delayed Delivery Securities. The Fund may purchase or sell securities with delivery or payment to occur at a later date beyond the normal settlement period. At the time the Fund enters into a commitment to purchase or sell a security, the transaction is recorded and the value of the transaction is reflected in the net asset value. The price of such security and the date when the security will be delivered and paid for are fixed at the time the transaction is negotiated. The value of the security may vary with market fluctuations. At the time the Fund enters into a purchase transaction it is required to segregate cash or other liquid assets at least equal to the amount of the commitment. Additionally, the Fund may be required to post securities and/or cash collateral in accordance with the terms of the commitment.
Certain risks may arise upon entering into when-issued or delayed delivery transactions from the potential inability of counterparties to meet the terms of their contracts or if the issuer does not issue the securities due to political, economic, or other factors. Additionally, losses may arise due to changes in the value of the underlying securities.
Federal Income Taxes. The Fund's policy is to comply with the requirements of the Internal Revenue Code, as amended, which are applicable to regulated investment companies and to distribute all of its taxable income to its shareholders.
At December 31, 2013, the Fund had a net tax basis capital loss carryforward of $310,000 of short-term losses, which may be applied against any realized net taxable capital gains indefinitely.
The Fund has reviewed the tax positions for the open tax years as of December 31, 2013 and has determined that no provision for income tax and/or uncertain tax provisions is required in the Fund's financial statements. The Fund's federal tax returns for the prior three fiscal years remain open subject to examination by the Internal Revenue Service.
Distribution of Income and Gains. Distributions from net investment income of the Fund, if any, are declared and distributed to shareholders annually. Net realized gains from investment transactions, in excess of available capital loss carryforwards, would be taxable to the Fund if not distributed and, therefore, will be distributed to shareholders at least annually. The Fund may also make additional distributions for tax purposes if necessary.
The timing and characterization of certain income and capital gain distributions are determined annually in accordance with federal tax regulations which may differ from accounting principles generally accepted in the United States of America. These differences primarily relate to investments in futures contracts, investments in swap contracts and certain securities sold at a loss. As a result, net investment income (loss) and net realized gain (loss) on investment transactions for a reporting period may differ significantly from distributions during such period. Accordingly, the Fund may periodically make reclassifications among certain of its capital accounts without impacting the net asset value of the Fund.
The tax character of current year distributions will be determined at the end of the current fiscal year.
Expenses. Expenses of the Trust arising in connection with a specific fund are allocated to that fund. Other Trust expenses which cannot be directly attributed to a fund are apportioned among the funds in the Trust based upon the relative net assets or other appropriate measures.
Contingencies. In the normal course of business, the Fund may enter into contracts with service providers that contain general indemnification clauses. The Fund's maximum exposure under these arrangements is unknown as this would involve future claims that may be made against the Fund that have not yet been made. However, based on experience, the Fund expects the risk of loss to be remote.
Other. Investment transactions are accounted for on a trade date plus one basis for daily net asset value calculations. However, for financial reporting purposes, investment transactions are reported on trade date. Interest income is recorded on the accrual basis. Realized gains and losses from investment transactions are recorded on an identified cost basis. All discounts and premiums are accreted/amortized for both tax and financial reporting purposes for the Fund.
B. Derivative Instruments
Swaps. A swap is a contract between two parties to exchange future cash flows at periodic intervals based on the notional amount of the swap. A bilateral swap is a transaction between the fund and a counterparty where cash flows are exchanged between the two parties. A centrally cleared swap is a transaction executed between the fund and a counterparty, then cleared by a clearing member through a central clearinghouse. The central clearinghouse serves as the counterparty, with whom the fund exchanges cash flows.
The value of a swap is adjusted daily, and the change in value, if any, is recorded as unrealized appreciation or depreciation in the Statement of Assets and Liabilities. Gains or losses are realized when the swap expires or is closed. Certain risks may arise when entering into swap transactions including counterparty default; liquidity; or unfavorable changes in interest rates or the value of the underlying reference security, commodity or index. In connection with bilateral swaps, securities and/or cash may be identified as collateral in accordance with the terms of the swap agreement to provide assets of value and recourse in the event of default. The maximum counterparty credit risk is the net present value of the cash flows to be received from or paid to the counterparty over the term of the swap, to the extent that this amount is beneficial to the Fund, in addition to any related collateral posted to the counterparty by the Fund. This risk may be partially reduced by a master netting arrangement between the Fund and the counterparty. Upon entering into a centrally cleared swap, the Fund is required to deposit with a financial intermediary cash or securities ("initial margin") in an amount equal to a certain percentage of the notional amount of the swap. Subsequent payments ("variation margin") are made or received by the Fund dependent upon the daily fluctuations in the value of the swap. In a cleared swap transaction, counterparty risk is minimized as the central clearinghouse acts as the counterparty.
An upfront payment, if any, made by the Fund is recorded as an asset in the Statement of Assets and Liabilities. An upfront payment, if any, received by the Fund is recorded as a liability in the Statement of Assets and Liabilities. Payments received or made at the end of the measurement period are recorded as realized gain or loss in the Statement of Operations.
Interest rate swaps are agreements in which the Fund agrees to pay to the counterparty a fixed rate payment in exchange for the counterparty agreeing to pay to the Fund a variable rate payment, or the Fund agrees to receive from the counterparty a fixed rate payment in exchange for the counterparty agreeing to receive from the Fund a variable rate payment. The payment obligations are based on the notional amount of the swap. For the six months ended June 30, 2014, the Fund entered into interest rate swap agreements to gain exposure to different parts of the yield curve while managing overall duration.
For the six months ended June 30, 2014, the investment in interest rate swap contracts had a total notional amount generally indicative of a range from $31,300,000 to $33,600,000.
Options. An option contract is a contract in which the writer (seller) of the option grants the buyer of the option, upon payment of a premium, the right to purchase from (call option), or sell to (put option), the writer a designated instrument at a specified price within a specified period of time. The Fund may write or purchase interest rate swaption agreements which are options to enter into a pre-defined swap agreement. The interest rate swaption agreement will specify whether the buyer of the swaption will be a fixed-rate receiver or a fixed-rate payer upon exercise. Certain options, including options on indices and interest rate options, will require cash settlement by the Fund if exercised. For the six months ended June 30, 2014, the Fund entered into options on interest rate swap contracts in order to hedge against potential adverse interest rate movements of portfolio assets.
If the Fund writes a covered call option, the Fund foregoes, in exchange for the premium, the opportunity to profit during the option period from an increase in the market value of the underlying security above the exercise price. If the Fund writes a put option it accepts the risk of a decline in the value of the underlying security below the exercise price. Over-the-counter options have the risk of the potential inability of counterparties to meet the terms of their contracts. For exchange-traded contracts, the counterparty risk is minimized as the exchange's clearinghouse acts as the counterparty, and guarantees the futures against default. The Fund's maximum exposure to purchased options is limited to the premium initially paid. In addition, certain risks may arise upon entering into option contracts, including the risk that an illiquid secondary market will limit the Fund's ability to close out an option contract prior to the expiration date and that a change in the value of the option contract may not correlate exactly with changes in the value of the securities or currencies hedged.
A summary of the open purchased option contracts as of June 30, 2014 is included in the Fund's Investment Portfolio. A summary of open written option contracts is included in a table following the Fund's Investment Portfolio. For the six months ended June 30, 2014, the investment in written option contracts had a total value generally indicative of a range from approximately $472,000 to $656,000, and purchased option contracts had a total value generally indicative of a range from approximately $234,000 to $551,000.
Futures Contracts. A futures contract is an agreement between a buyer or seller and an established futures exchange or its clearinghouse in which the buyer or seller agrees to take or make a delivery of a specific amount of a financial instrument at a specified price on a specific date (settlement date). For the six months ended June 30, 2014, the Fund entered into interest rate futures to gain exposure to different parts of the yield curve while managing overall duration.
Upon entering into a futures contract, the Fund is required to deposit with a financial intermediary cash or securities ("initial margin") in an amount equal to a certain percentage of the face value indicated in the futures contract. Subsequent payments ("variation margin") are made or received by the Fund dependent upon the daily fluctuations in the value and are recorded for financial reporting purposes as unrealized gains or losses by the Fund. Gains or losses are realized when the contract expires or is closed. Since all futures contracts are exchange-traded, counterparty risk is minimized as the exchange's clearinghouse acts as the counterparty, and guarantees the futures against default.
Certain risks may arise upon entering into futures contracts, including the risk that an illiquid market will limit the Fund's ability to close out a futures contract prior to the settlement date and the risk that the futures contract is not well correlated with the security, index or currency to which it relates. Risk of loss may exceed amounts disclosed in the Statement of Assets and Liabilities.
A summary of the open futures contracts as of June 30, 2014, is included in a table following the Fund's Investment Portfolio. For the six months ended June 30, 2014, the investment in futures contracts purchased had a total notional value generally indicative of a range from approximately $8,602,000 to $22,313,000, and the investment in futures contracts sold had a total notional value generally indicative of a range from approximately $5,608,000 to $10,835,000.
The following tables summarize the value of the Fund's derivative instruments held as of June 30, 2014 and the related location in the accompanying Statement of Assets and Liabilities, presented by primary underlying risk exposure:
| Asset Derivatives | | Purchased Options | | | Futures Contracts | | | Total | |
| Interest Rate Contracts (a) (b) | | $ | 234,152 | | | $ | 48,556 | | | $ | 282,708 | |
Each of the above derivatives is located in the following Statement of Assets and Liabilities accounts: (a) Investments in securities, at value (includes purchased options) (b) Includes cumulative appreciation of futures contracts as disclosed in the Investment Portfolio. Unsettled variation margin is disclosed separately within the Statement of Assets and Liabilities. | |
| Liability Derivatives | | Written Options | | | Swap Contracts | | | Futures Contracts | | | Total | |
| Interest Rate Contracts (a) (b) | | $ | (477,846 | ) | | $ | (643,601 | ) | | $ | (97,868 | ) | | $ | (1,219,315 | ) |
Each of the above derivatives is located in the following Statement of Assets and Liabilities accounts: (a) Options written, at value and unrealized depreciation on swap contracts. Unsettled variation margin for centrally cleared swaps is disclosed separately within the Statement of Assets and Liabilities. (b) Includes cumulative depreciation of futures contracts as disclosed in the Investment Portfolio. Unsettled variation margin is disclosed separately within the Statement of Assets and Liabilities. | |
Additionally, the amount of unrealized and realized gains and losses on derivative instruments recognized in Fund earnings during the six months ended June 30, 2014 and the related location in the accompanying Statement of Operations is summarized in the following tables by primary underlying risk exposure:
| Realized Gain (Loss) | | Written Options | | | Swap Contracts | | | Futures Contracts | | | Total | |
| Interest Rate Contracts (a) | | $ | 102,720 | | | $ | (292,770 | ) | | $ | (479,573 | ) | | $ | (669,623 | ) |
Each of the above derivatives is located in the following Statement of Operations accounts: (a) Net realized gain (loss) from written options, swap contracts and futures, respectively | |
| Change in Net Unrealized Appreciation (Depreciation) | | Purchased Options | | | Written Options | | | Swap Contracts | | | Futures Contracts | | | Total | |
| Interest Rate Contracts (a) | | $ | (317,287 | ) | | $ | 226,931 | | | $ | (522,151 | ) | | $ | 214,266 | | | $ | (398,241 | ) |
Each of the above derivatives is located in the following Statement of Operations accounts: (a) Change in net unrealized appreciation (depreciation) from investments (includes purchased options), written options, swap contracts and futures, respectively | |
As of June 30, 2014, the Fund has transactions subject to enforceable master netting agreements. A reconciliation of the gross amounts on the Statement of Assets and Liabilities to the net amounts by derivative type, including any collateral exposure, is included in the following tables:
| Counterparty | | Gross Amounts of Assets Presented in the Statement of Assets and Liabilities | | | Financial Instruments and Derivatives Available for Offset | | | Cash Collateral Received | | | Non-Cash Collateral Received | | | Net Amount of Derivative Assets | |
| BNP Paribas | | $ | 178,020 | | | $ | (178,020 | ) | | $ | — | | | $ | — | | | $ | — | |
| Nomura International PLC | | | 56,132 | | | | (56,132 | ) | | | — | | | | — | | | | — | |
| | | $ | 234,152 | | | $ | (234,152 | ) | | $ | — | | | $ | — | | | $ | — | |
| Counterparty | | Gross Amounts of Liabilities Presented in the Statement of Assets and Liabilities | | | Financial Instruments and Derivatives Available for Offset | | | Cash Collateral Pledged | | | Non-Cash Collateral Pledged (a) | | | Net Amount of Derivative Liabilities | |
| Barclays Bank PLC | | $ | 31,631 | | | $ | — | | | $ | — | | | $ | — | | | $ | 31,631 | |
| BNP Paribas | | | 327,450 | | | | (178,020 | ) | | | — | | | | — | | | | 149,430 | |
| Citigroup, Inc. | | | 10,697 | | | | — | | | | — | | | | — | | | | 10,697 | |
| Nomura International PLC | | | 121,963 | | | | (56,132 | ) | | | — | | | | (60,619 | ) | | | 5,212 | |
| | | $ | 491,741 | | | $ | (234,152 | ) | | $ | — | | | $ | (60,619 | ) | | $ | 196,970 | |
(a) The actual collateral received and/or pledged may be more than the amount shown.
C. Purchases and Sales of Securities
During the six months ended June 30, 2014, purchases and sales of investment securities (excluding short-term investments and U.S. Treasury securities) aggregated $343,648,130 and $345,992,361, respectively. Purchases and sales of U.S. Treasury securities aggregated $14,876,121 and $19,451,597, respectively.
For the six months ended June 30, 2014, transactions for written options on futures and interest rate swap contracts were as follows:
| | | Contract Amount | | | Premiums | |
| Outstanding, beginning of period | | | 31,600,000 | | | $ | 748,861 | |
| Options written | | | 13,800,000 | | | | 151,900 | |
| Options closed | | | (7,200,000 | ) | | | (85,020 | ) |
| Options expired | | | (2,400,000 | ) | | | (17,700 | ) |
| Outstanding, end of period | | | 35,800,000 | | | $ | 798,041 | |
D. Related Parties
Management Agreement. Under the Investment Management Agreement with Deutsche Investment Management Americas Inc. ("DIMA" or the "Advisor"), an indirect, wholly owned subsidiary of Deutsche Bank AG, the Advisor directs the investments of the Fund in accordance with its investment objectives, policies and restrictions. The Advisor determines the securities, instruments and other contracts relating to investments to be purchased, sold or entered into by the Fund.
Pursuant to the Investment Management Agreement with the Advisor, the Fund pays a monthly management fee based on the Fund's average daily net assets, computed and accrued daily and payable monthly, at the following annual rates:
| First $250 million | | | .450 | % |
| Next $750 million | | | .430 | % |
| Next $1.5 billion | | | .410 | % |
| Next $2.5 billion | | | .400 | % |
| Next $2.5 billion | | | .380 | % |
| Next $2.5 billion | | | .360 | % |
| Next $2.5 billion | | | .340 | % |
| Over $12.5 billion | | | .320 | % |
Accordingly, for the six months ended June 30, 2014, the fee pursuant to the Investment Management Agreement was equivalent to an annualized effective rate (exclusive of any applicable waivers/reimbursements) of 0.45% of the Fund's average daily net assets.
For the period from January 1, 2014 through April 30, 2014, the Advisor had contractually agreed to waive all or a portion of its fees and/or reimburse certain operating expenses of the Fund to the extent necessary to maintain the operating expenses (excluding certain expenses such as extraordinary expenses, taxes, brokerage and interest) of each class as follows:
Effective May 1, 2014 through September 30, 2014, the Advisor has contractually agreed to waive all or a portion of its fees and/or reimburse certain operating expenses of the Fund to the extent necessary to maintain the operating expenses (excluding certain expenses such as extraordinary expenses, taxes, brokerage and interest) of each class as follows:
For the six months ended June 30, 2014, fees waived and/or expenses reimbursed for each class are as follows:
| Class A | | $ | 17,280 | |
| Class B | | | 959 | |
| | | $ | 18,239 | |
Administration Fee. Pursuant to an Administrative Services Agreement, DIMA provides most administrative services to the Fund. For all services provided under the Administrative Services Agreement, the Fund pays DIMA an annual fee ("Administration Fee") of 0.10% of the Fund's average daily net assets, computed and accrued daily and payable monthly. For the six months ended June 30, 2014, the Administration Fee was $48,874, of which $7,845 is unpaid.
Service Provider Fees. DeAWM Service Company ("DSC"), an affiliate of the Advisor, is the transfer agent, dividend-paying agent and shareholder service agent for the Fund. Pursuant to a sub-transfer agency agreement between DSC and DST Systems, Inc. ("DST"), DSC has delegated certain transfer agent, dividend-paying agent and shareholder service agent functions to DST. DSC compensates DST out of the shareholder servicing fee it receives from the Fund. For the six months ended June 30, 2014, the amounts charged to the Fund by DSC were as follows:
| | | Total Aggregated | | | Unpaid at June 30, 2014 | |
| Class A | | $ | 148 | | | $ | 72 | |
| Class B | | | 34 | | | | 17 | |
| | | $ | 182 | | | $ | 89 | |
Distribution Service Agreement. Under the Fund's Class B 12b-1 plan, DeAWM Distributors, Inc. ("DDI") received a fee ("Distribution Service Fee") of 0.25% of average daily net assets of Class B shares. For the six months ended June 30, 2014, the Distribution Service Fee aggregated $4,273, of which $677 is unpaid.
Typesetting and Filing Service Fees. Under an agreement with DIMA, DIMA is compensated for providing typesetting and certain regulatory filing services to the Fund. For the six months ended June 30, 2014, the amount charged to the Fund by DIMA included in the Statement of Operations under "reports to shareholders" aggregated $9,082, of which $2,609 is unpaid.
Trustees' Fees and Expenses. The Fund paid retainer fees to each Trustee not affiliated with the Advisor, plus specified amounts to the Board Chairperson and Vice Chairperson and to each committee Chairperson.
Affiliated Cash Management Vehicles. The Fund may invest uninvested cash balances in Central Cash Management Fund and Deutsche Variable NAV Money Fund, affiliated money market funds which are managed by the Advisor. Each affiliated money market fund seeks to provide a high level of current income consistent with liquidity and the preservation of capital. Each affiliated money market fund is managed in accordance with Rule 2a-7 under the Investment Company Act of 1940, which governs the quality, maturity, diversity and liquidity of instruments in which a money market fund may invest. Central Cash Management Fund seeks to maintain a stable net asset value, and Deutsche Variable NAV Money Fund maintains a floating net asset value. The Fund indirectly bears its proportionate share of the expenses of each affiliated money market fund in which it invests. Central Cash Management Fund does not pay the Advisor an investment management fee. To the extent that Deutsche Variable NAV Money Fund pays an investment management fee to the Advisor, the Advisor will waive an amount of the investment management fee payable to the Advisor by the Fund equal to the amount of the investment management fee payable on the Fund's assets invested in Deutsche Variable NAV Money Fund.
Securities Lending Agent Fees. Deutsche Bank AG serves as securities lending agent for the Fund. For the six months ended June 30, 2014, the Fund incurred securities lending agent fees to Deutsche Bank AG in the amount of $272.
E. Ownership of the Fund
At June 30, 2014, two participating insurance companies were owners of record of 10% or more of the total outstanding Class A shares of the Fund, each owning 60% and 32%. One participating insurance company was the owner of record of 10% or more of the total outstanding Class B shares of the Fund, owning 95%.
F. Line of Credit
The Fund and other affiliated funds (the "Participants") share in a $400 million revolving credit facility provided by a syndication of banks. The Fund may borrow for temporary or emergency purposes, including the meeting of redemption requests that otherwise might require the untimely disposition of securities. The Participants are charged an annual commitment fee which is allocated based on net assets, among each of the Participants. Interest is calculated at a rate per annum equal to the sum of the Federal Funds Rate plus 1.25 percent plus if LIBOR exceeds the Federal Funds Rate the amount of such excess. The Fund may borrow up to a maximum of 33 percent of its net assets under the agreement. The Fund had no outstanding loans at June 30, 2014.
G. Fund Name Change
Effective August 11, 2014, the "DWS Funds" were rebranded "Deutsche Funds."
Information About Your Fund's Expenses (Unaudited)
As an investor of the Fund, you incur two types of costs: ongoing expenses and transaction costs. Ongoing expenses include management fees, distribution and service (12b-1) fees and other Fund expenses. Examples of transaction costs include contract charges, redemption fees and account maintenance fees, which are not shown in this section. The following tables are intended to help you understand your ongoing expenses (in dollars) of investing in the Fund and to help you compare these expenses with the ongoing expenses of investing in other mutual funds. In the most recent six-month period, the Fund limited these expenses; had it not done so, expenses would have been higher. The example in the table is based on an investment of $1,000 invested at the beginning of the six-month period and held for the entire period (January 1, 2014 to June 30, 2014).
The tables illustrate your Fund's expenses in two ways:
—Actual Fund Return. This helps you estimate the actual dollar amount of ongoing expenses (but not transaction costs) paid on a $1,000 investment in the Fund using the Fund's actual return during the period. To estimate the expenses you paid over the period, simply divide your account value by $1,000 (for example, an $8,600 account value divided by $1,000 = 8.6), then multiply the result by the number in the "Expenses Paid per $1,000" line under the share class you hold.
—Hypothetical 5% Fund Return. This helps you to compare your Fund's ongoing expenses (but not transaction costs) with those of other mutual funds using the Fund's actual expense ratio and a hypothetical rate of return of 5% per year before expenses. Examples using a 5% hypothetical Fund return may be found in the shareholder reports of other mutual funds. The hypothetical account values and expenses may not be used to estimate the actual ending account balance or expenses you paid for the period.
Please note that the expenses shown in these tables are meant to highlight your ongoing expenses only and do not reflect any transaction costs. The "Expenses Paid per $1,000" line of the tables is useful in comparing ongoing expenses only and will not help you determine the relative total expense of owning different funds. If these transaction costs had been included, your costs would have been higher.
Expenses and Value of a $1,000 Investment for the six months ended June 30, 2014 | |
| Actual Fund Return | | Class A | | | Class B | |
| Beginning Account Value 1/1/14 | | $ | 1,000.00 | | | $ | 1,000.00 | |
| Ending Account Value 6/30/14 | | $ | 1,039.60 | | | $ | 1,037.10 | |
| Expenses Paid per $1,000* | | $ | 3.49 | | | $ | 5.10 | |
| Hypothetical 5% Fund Return | | Class A | | | Class B | |
| Beginning Account Value 1/1/14 | | $ | 1,000.00 | | | $ | 1,000.00 | |
| Ending Account Value 6/30/14 | | $ | 1,021.37 | | | $ | 1,019.79 | |
| Expenses Paid per $1,000* | | $ | 3.46 | | | $ | 5.06 | |
* Expenses are equal to the Fund's annualized expense ratio for each share class, multiplied by the average account value over the period, multiplied by 181 (the number of days in the most recent six-month period), then divided by 365.
| Annualized Expense Ratios | Class A | | Class B | |
| Deutsche Variable Series II — Deutsche Government & Agency Securities VIP | .69% | | 1.01% | |
For more information, please refer to the Fund's prospectus.
These tables do not reflect charges and fees ("contract charges") associated with the separate account that invests in the Fund or any variable life insurance policy or variable annuity contract for which the Fund is an investment option.
For an analysis of the fees associated with an investment in the fund or similar funds, please refer to the current and hypothetical expense calculators for Variable Insurance Products which can be found at deutschefunds.com/EN/resources/calculators.jsp.
The Trust's policies and procedures for voting proxies for portfolio securities and information about how the Trust voted proxies related to its portfolio securities during the 12-month period ended June 30 are available on our Web site — deutschefunds.com (click on "proxy voting" at the bottom of the page) — or on the SEC's Web site — sec.gov. To obtain a written copy of the Trust's policies and procedures without charge, upon request, call us toll free at (800) 728-3337.
Advisory Agreement Board Considerations and Fee Evaluation
The Board of Trustees approved the renewal of DWS Government & Agency Securities VIP's investment management agreement (the "Agreement") with Deutsche Investment Management Americas Inc. ("DIMA") in September 2013.
In terms of the process that the Board followed prior to approving the Agreement, shareholders should know that:
— In September 2013, all but one of the Fund's Trustees were independent of DIMA and its affiliates.
— The Trustees met frequently during the past year to discuss fund matters and dedicated a substantial amount of time to contract review matters. Over the course of several months, the Board's Contract Committee, in coordination with the Board's Fixed Income and Asset Allocation Oversight Committee, reviewed comprehensive materials received from DIMA, independent third parties and independent counsel. These materials included an analysis of the Fund's performance, fees and expenses, and profitability compiled by a fee consultant retained by the Fund's Independent Trustees (the "Fee Consultant"). The Board also received extensive information throughout the year regarding performance of the Fund.
— The Independent Trustees regularly meet privately with their independent counsel to discuss contract review and other matters. In addition, the Independent Trustees were also advised by the Fee Consultant in the course of their review of the Fund's contractual arrangements and considered a comprehensive report prepared by the Fee Consultant in connection with their deliberations.
— In connection with reviewing the Agreement, the Board also reviewed the terms of the Fund's Rule 12b-1 plan, distribution agreement, administrative services agreement, transfer agency agreement and other material service agreements.
— Based on its evaluation of the information provided, the Contract Committee presented its findings and recommendations to the Board. The Board then reviewed the Contract Committee's findings and recommendations.
In connection with the contract review process, the Contract Committee and the Board considered the factors discussed below, among others. The Board also considered that DIMA and its predecessors have managed the Fund since its inception, and the Board believes that a long-term relationship with a capable, conscientious advisor is in the best interests of the Fund. The Board considered, generally, that shareholders chose to invest or remain invested in the Fund knowing that DIMA managed the Fund, and that the Agreement was approved by the Fund's shareholders. DIMA is part of Deutsche Bank AG, a major global banking institution that is engaged in a wide range of financial services. The Board believes that there are advantages to being part of a global asset management business that offers a wide range of investing expertise and resources, including hundreds of portfolio managers and analysts with research capabilities in many countries throughout the world.
As part of the contract review process, the Board carefully considered the fees and expenses of each DWS fund overseen by the Board in light of the fund's performance. In many cases, this led to a negotiation with DIMA of lower expense caps as part of the 2012 and 2013 contract review processes than had previously been in place. As part of these negotiations, the Board indicated that it would consider relaxing these new lower caps in future years following sustained improvements in performance, among other considerations.
In June 2012, Deutsche Bank AG ("DB"), DIMA's parent company, announced that DB would combine its Asset Management (of which DIMA was a part) and Wealth Management divisions. DB has advised the Independent Trustees that the U.S. asset management business is a critical and integral part of DB, and that it has, and will continue to, reinvest a significant portion of the substantial savings it expects to realize by combining its Asset Management and Wealth Management divisions into the new Asset and Wealth Management ("AWM") division, including ongoing enhancements to its investment capabilities. DB also has confirmed its commitment to maintaining strong legal and compliance groups within the AWM division.
While shareholders may focus primarily on fund performance and fees, the Fund's Board considers these and many other factors, including the quality and integrity of DIMA's personnel and such other issues as back-office operations, fund valuations, and compliance policies and procedures.
Nature, Quality and Extent of Services. The Board considered the terms of the Agreement, including the scope of advisory services provided under the Agreement. The Board noted that, under the Agreement, DIMA provides portfolio management services to the Fund and that, pursuant to a separate administrative services agreement, DIMA provides administrative services to the Fund. The Board considered the experience and skills of senior management and investment personnel, the resources made available to such personnel, the ability of DIMA to attract and retain high-quality personnel, and the organizational depth and stability of DIMA. The Board reviewed the Fund's performance over short-term and long-term periods and compared those returns to various agreed-upon performance measures, including market indices and a peer universe compiled by the Fee Consultant using information supplied by Morningstar Direct ("Morningstar"), an independent fund data service. The Board also noted that it has put into place a process of identifying "Focus Funds" (e.g., funds performing poorly relative to their benchmark or a peer universe compiled by an independent fund data service), and receives more frequent reporting and information from DIMA regarding such funds, along with DIMA's remedial plans to address underperformance. The Board believes this process is an effective manner of identifying and addressing underperforming funds. Based on the information provided, the Board noted that for the one-, three- and five-year periods ended December 31, 2012, the Fund's performance (Class A shares) was in the 3rd quartile, 1st quartile and 1st quartile, respectively, of the applicable Morningstar universe (the 1st quartile being the best performers and the 4th quartile being the worst performers). The Board also observed that the Fund has outperformed its benchmark in the one- and three-year periods and has underperformed its benchmark in the five-year period ended December 31, 2012.
Fees and Expenses. The Board considered the Fund's investment management fee schedule, operating expenses and total expense ratios, and comparative information provided by Lipper Inc. ("Lipper") and the Fee Consultant regarding investment management fee rates paid to other investment advisors by similar funds (1st quartile being the most favorable and 4th quartile being the least favorable). With respect to management fees paid to other investment advisors by similar funds, the Board noted that the contractual fee rates paid by the Fund, which include a 0.10% fee paid to DIMA under the Fund's administrative services agreement, were higher than the median (3rd quartile) of the applicable Lipper peer group (based on Lipper data provided as of December 31, 2012). The Board noted that the Fund's Class A shares total (net) operating expenses were expected to be equal to the median of the applicable Lipper expense universe (based on Lipper data provided as of December 31, 2012, and analyzing Lipper expense universe Class A (net) expenses less any applicable 12b-1 fees) ("Lipper Universe Expenses"). The Board also reviewed data comparing each share class's total (net) operating expenses to the applicable Lipper Universe Expenses. The Board considered the Fund's management fee rate as compared to fees charged by DIMA to a comparable fund and considered differences between the Fund and the comparable fund. The Board also considered how the Fund's total (net) operating expenses compared to the total (net) operating expenses of a more customized peer group selected by Lipper (based on such factors as asset size). The Board also noted that the expense limitations agreed to by DIMA helped to ensure that the Fund's total (net) operating expenses would remain competitive.
The information considered by the Board as part of its review of management fees included information regarding fees charged by DIMA and its affiliates to similar institutional accounts and to similar funds offered primarily to European investors ("DWS Europe funds"), in each case as applicable. The Board observed that advisory fee rates for institutional accounts generally were lower than the management fees charged by similarly managed DWS U.S. mutual funds ("DWS Funds"), but also took note of the differences in services provided to DWS Funds as compared to institutional accounts. In the case of DWS Europe funds, the Board observed that fee rates for DWS Europe funds generally were higher than for similarly managed DWS Funds, but noted that differences in the types of services provided to DWS Funds relative to DWS Europe funds made it difficult to compare such fees.
On the basis of the information provided, the Board concluded that management fees were reasonable and appropriate in light of the nature, quality and extent of services provided by DIMA.
Profitability. The Board reviewed detailed information regarding revenues received by DIMA under the Agreement. The Board considered the estimated costs and pre-tax profits realized by DIMA from advising the DWS Funds, as well as estimates of the pre-tax profits attributable to managing the Fund in particular. The Board also received information regarding the estimated enterprise-wide profitability of DWS and its affiliates with respect to all fund services in totality and by fund. The Board and the Fee Consultant reviewed DIMA's methodology in allocating its costs to the management of the Fund. Based on the information provided, the Board concluded that the pre-tax profits realized by DIMA in connection with the management of the Fund were not unreasonable. The Board also reviewed information regarding the profitability of certain similar investment management firms. The Board noted that while information regarding the profitability of such firms is limited (and in some cases is not necessarily prepared on a comparable basis), DIMA and its affiliates' overall profitability with respect to the DWS fund complex (after taking into account distribution and other services provided to the funds by DIMA and its affiliates) was lower than the overall profitability levels of many comparable firms for which such data was available.
Economies of Scale. The Board considered whether there are economies of scale with respect to the management of the Fund and whether the Fund benefits from any economies of scale. The Board noted that the Fund's management fee schedule includes fee breakpoints. The Board concluded that the Fund's fee schedule represents an appropriate sharing between the Fund and DIMA of such economies of scale as may exist in the management of the Fund at current asset levels.
Other Benefits to DIMA and Its Affiliates. The Board also considered the character and amount of other incidental benefits received by DIMA and its affiliates, including any fees received by DIMA for administrative services provided to the Fund and any fees received by an affiliate of DIMA for distribution services. The Board also considered benefits to DIMA related to brokerage and soft-dollar allocations, including allocating brokerage to pay for research generated by parties other than the executing broker dealers, which pertain primarily to funds investing in equity securities, along with the incidental public relations benefits to DIMA related to DWS Funds advertising and cross-selling opportunities among DIMA products and services. The Board concluded that management fees were reasonable in light of these fallout benefits.
Compliance. The Board considered the significant attention and resources dedicated by DIMA to documenting and enhancing its compliance processes in recent years. The Board noted in particular (i) the experience and seniority of both DIMA's chief compliance officer and the Fund's chief compliance officer; (ii) the large number of DIMA compliance personnel; and (iii) the substantial commitment of resources by DIMA and its affiliates to compliance matters.
Based on all of the information considered and the conclusions reached, the Board unanimously determined that the continuation of the Agreement is in the best interests of the Fund. In making this determination, the Board did not give particular weight to any single factor identified above. The Board considered these factors over the course of numerous meetings, certain of which were in executive session with only the Independent Trustees and their independent counsel present. It is possible that individual Trustees may have weighed these factors differently in reaching their individual decisions to approve the continuation of the Agreement.
DeAWM Distributors, Inc.
222 South Riverside Plaza
Chicago, IL 60606
(800) 621-1148
VS2GAS-3 (R-028384-3 8/14)
June 30, 2014
Semiannual Report
Deutsche Variable Series II
(formerly DWS Variable Series II)
Deutsche High Income VIP
(formerly DWS High Income VIP)
Contents
18 Statement of Assets and Liabilities 19 Statement of Operations 20 Statement of Changes in Net Assets 23 Notes to Financial Statements 30 Information About Your Fund's Expenses 32 Advisory Agreement Board Considerations and Fee Evaluation |
This report must be preceded or accompanied by a prospectus. To obtain an additional prospectus or summary prospectus, if available, call (800) 728-3337 or your financial representative. We advise you to consider the Fund's objectives, risks, charges and expenses carefully before investing. The summary prospectus and prospectus contain this and other important information about the Fund. Please read the prospectus carefully before you invest.
Bond investments are subject to interest-rate and credit risks. When interest rates rise, bond prices generally fall. Credit risk refers to the ability of an issuer to make timely payments of principal and interest. Investments in lower-quality ("junk bonds") and non-rated securities present greater risk of loss than investments in higher-quality securities. Investing in derivatives entails special risks relating to liquidity, leverage and credit that may reduce returns and/or increase volatility. The Fund may lend securities to approved institutions. See the prospectus for details.
Deutsche Asset & Wealth Management represents the asset management and wealth management activities conducted by Deutsche Bank AG or any of its subsidiaries, including the Advisor and DeAWM Distributors, Inc.
NOT FDIC/NCUA INSURED NO BANK GUARANTEE MAY LOSE VALUE NOT A DEPOSIT
NOT INSURED BY ANY FEDERAL GOVERNMENT AGENCY
Dear Shareholder:
I am very pleased to tell you that the DWS funds have been renamed Deutsche funds, aligning more closely with the Deutsche Asset & Wealth Management brand. We are proud to adopt the Deutsche name — a brand that fully represents the global access, discipline and intelligence that support all of our products and services.
Deutsche Asset & Wealth Management combines the asset management and wealth management divisions of Deutsche Bank to deliver a comprehensive suite of active, passive and alternative investment capabilities. Your investment in the Deutsche funds means you have access to the thought leadership and resources of one of the world’s largest and most influential financial institutions.
In conjunction with your fund’s name change, please note that the Deutsche funds’ Web address has changed as well. The former dws-investments.com is now deutschefunds.com.
In addition, key service providers have been renamed as follows:
| Former Name | New name, effective August 11, 2014 |
| DWS Investments Distributors, Inc. | DeAWM Distributors, Inc. |
| DWS Trust Company | DeAWM Trust Company |
| DWS Investments Service Company | DeAWM Service Company |
These changes have no effect on the day-to-day management of your investment, and there is no action required on your part. You will continue to experience the benefits that come from our decades of experience, in-depth research and worldwide network of investment professionals.
Thanks for your continued support. We appreciate your trust and the opportunity to put our capabilities to work for you.
Best regards,
Brian Binder
President, Deutsche Funds
Performance Summary June 30, 2014 (Unaudited)
Fund performance shown is historical, assumes reinvestment of all dividend and capital gain distributions and does not guarantee future results. Investment return and principal value fluctuate with changing market conditions so that, when redeemed, shares may be worth more or less than their original cost. Current performance may be lower or higher than the performance data quoted. Please contact your participating insurance company for the Fund's most recent month-end performance. Performance doesn't reflect charges and fees ("contract charges") associated with the separate account that invests in the Fund or any variable life insurance policy or variable annuity contract for which the Fund is an investment option. These charges and fees will reduce returns. While all share classes have the same underlying portfolio, their performance will differ.
The gross expense ratios of the Fund, as stated in the fee table of the prospectus dated May 1, 2014 are 0.73% and 1.10% for Class A and Class B shares, respectively, and may differ from the expense ratios disclosed in the Financial Highlights tables in this report.
| Growth of an Assumed $10,000 Investment in Deutsche High Income VIP |
| The Credit Suisse High Yield Index tracks the performance of the global high-yield debt market. Index returns do not reflect any fees or expenses and it is not possible to invest directly into an index. |
| |
| Yearly periods ended June 30 | |
| Comparative Results | |
| Deutsche High Income VIP | | 6-Month‡ | | | 1-Year | | | 3-Year | | | 5-Year | | | 10-Year | |
| Class A | Growth of $10,000 | | $ | 10,501 | | | $ | 11,124 | | | $ | 13,002 | | | $ | 18,126 | | | $ | 21,028 | |
| Average annual total return | | | 5.01 | % | | | 11.24 | % | | | 9.14 | % | | | 12.63 | % | | | 7.72 | % |
| Credit Suisse High Yield Index | Growth of $10,000 | | $ | 10,555 | | | $ | 11,181 | | | $ | 13,098 | | | $ | 19,048 | | | $ | 22,961 | |
| Average annual total return | | | 5.55 | % | | | 11.81 | % | | | 9.41 | % | | | 13.76 | % | | | 8.67 | % |
| Deutsche High Income VIP | | 6-Month‡ | | | 1-Year | | | 3-Year | | | 5-Year | | | 10-Year | |
| Class B | Growth of $10,000 | | $ | 10,504 | | | $ | 11,091 | | | $ | 12,905 | | | $ | 17,900 | | | $ | 20,384 | |
| Average annual total return | | | 5.04 | % | | | 10.91 | % | | | 8.87 | % | | | 12.35 | % | | | 7.38 | % |
| Credit Suisse High Yield Index | Growth of $10,000 | | $ | 10,555 | | | $ | 11,181 | | | $ | 13,098 | | | $ | 19,048 | | | $ | 22,961 | |
| Average annual total return | | | 5.55 | % | | | 11.81 | % | | | 9.41 | % | | | 13.76 | % | | | 8.67 | % |
The growth of $10,000 is cumulative.
‡ Total returns shown for periods less than one year are not annualized.
Portfolio Summary (Unaudited) Asset Allocation (As a % of Investment Portfolio excluding Securities Lending Collateral) | 6/30/14 | 12/31/13 |
| | | |
| Corporate Bonds | 89% | 82% |
| Cash Equivalents | 6% | 10% |
| Convertible Bonds | 1% | 2% |
| Loan Participations and Assignments | 1% | — |
| Preferred Stocks | 1% | 1% |
| Government & Agency Obligations | 1% | 4% |
| Preferred Securities | 1% | 1% |
| | 100% | 100% |
Sector Diversification (As a % of Investment Portfolio excluding Government & Agency Obligations, Cash Equivalents and Securities Lending Collateral) | 6/30/14 | 12/31/13 |
| | | |
| Telecommunication Services | 20% | 20% |
| Consumer Discretionary | 17% | 19% |
| Energy | 15% | 15% |
| Industrials | 11% | 10% |
| Materials | 9% | 10% |
| Financials | 7% | 6% |
| Information Technology | 7% | 6% |
| Health Care | 6% | 5% |
| Consumer Staples | 5% | 7% |
| Utilities | 3% | 2% |
| | 100% | 100% |
Quality (As a % of Investment Portfolio excluding Cash Equivalents and Securities Lending Collateral) | 6/30/14 | 12/31/13 |
| | | |
| AAA | 1% | 4% |
| BBB | 1% | 2% |
| BB | 40% | 36% |
| B | 44% | 44% |
| CCC | 12% | 12% |
| Not Rated | 2% | 2% |
| | 100% | 100% |
The quality ratings represent the higher of Moody's Investors Service, Inc. ("Moody's") or Standard & Poor's Corporation ("S&P") credit ratings. The ratings of Moody's and S&P represent their opinions as to the quality of the securities they rate. Credit quality measures a bond issuer's ability to repay interest and principal in a timely manner. Ratings are relative and subjective and are not absolute standards of quality. Credit quality does not remove market risk and is subject to change.
Portfolio holdings and characteristics are subject to change.
For more complete details about the Fund's investment portfolio, see page 6.
Following the Fund's fiscal first and third quarter-end, a complete portfolio holdings listing is filed with the SEC on Form N-Q. The form will be available on the SEC's Web site at sec.gov, and it also may be reviewed and copied at the SEC's Public Reference Room in Washington, D.C. Information on the operation of the SEC's Public Reference Room may be obtained by calling (800) SEC-0330. The Fund's portfolio holdings are also posted on deutschefunds.com from time to time. Please see the Fund's current prospectus for more information.
Gary Russell, CFA
Portfolio Manager
Investment Portfolio June 30, 2014 (Unaudited) | | | | Principal Amount ($)(a) | | | Value ($) | |
| | | | | |
| Corporate Bonds 88.0% | |
| Consumer Discretionary 16.2% | |
| AMC Entertainment, Inc., 5.875%, 2/15/2022 | | | | 220,000 | | | | 228,800 | |
| AMC Networks, Inc., 7.75%, 7/15/2021 | | | | 80,000 | | | | 89,500 | |
| AmeriGas Finance LLC: | |
| 6.75%, 5/20/2020 | | | | 460,000 | | | | 499,100 | |
| 7.0%, 5/20/2022 | | | | 350,000 | | | | 387,625 | |
| APX Group, Inc.: | |
| 6.375%, 12/1/2019 | | | | 205,000 | | | | 212,688 | |
| 144A, 8.75%, 12/1/2020 (c) | | | | 145,000 | | | | 147,175 | |
| 8.75%, 12/1/2020 | | | | 25,000 | | | | 25,375 | |
| Asbury Automotive Group, Inc., 8.375%, 11/15/2020 | | | 505,000 | | | | 560,550 | |
| Ashtead Capital, Inc., 144A, 6.5%, 7/15/2022 | | | | 330,000 | | | | 360,525 | |
| Ashton Woods U.S.A. LLC, 144A, 6.875%, 2/15/2021 | | | | 350,000 | | | | 350,000 | |
| Avis Budget Car Rental LLC, 5.5%, 4/1/2023 | | | | 205,000 | | | | 209,613 | |
| BC Mountain LLC, 144A, 7.0%, 2/1/2021 (b) | | | | 210,000 | | | | 203,175 | |
| Block Communications, Inc., 144A, 7.25%, 2/1/2020 | | | | 375,000 | | | | 399,375 | |
| Boyd Gaming Corp., 9.0%, 7/1/2020 (b) | | | | 155,000 | | | | 170,888 | |
| Cablevision Systems Corp.: | |
| 5.875%, 9/15/2022 | | | | 110,000 | | | | 112,063 | |
| 8.0%, 4/15/2020 (b) | | | | 65,000 | | | | 73,816 | |
| Carlson Wagonlit BV, 144A, 6.875%, 6/15/2019 | | | | 215,000 | | | | 231,125 | |
| CCO Holdings LLC: | |
| 6.5%, 4/30/2021 | | | | 655,000 | | | | 697,575 | |
| 6.625%, 1/31/2022 | | | | 650,000 | | | | 698,750 | |
| 7.0%, 1/15/2019 (b) | | | | 120,000 | | | | 126,600 | |
| 7.375%, 6/1/2020 | | | | 50,000 | | | | 54,500 | |
| 8.125%, 4/30/2020 | | | | 150,000 | | | | 162,375 | |
| Cequel Communications Holdings LLC: | | | | | | | | | |
| 144A, 5.125%, 12/15/2021 | | | | 602,000 | | | | 599,742 | |
| 144A, 6.375%, 9/15/2020 | | | | 1,215,000 | | | | 1,290,937 | |
| Clear Channel Communications, Inc.: | | | | | | | | | |
| 9.0%, 12/15/2019 | | | | 530,000 | | | | 565,112 | |
| 11.25%, 3/1/2021 | | | | 280,000 | | | | 317,450 | |
| Clear Channel Worldwide Holdings, Inc.: | | | | | | | | | |
| Series A, 6.5%, 11/15/2022 | | | 250,000 | | | | 266,875 | |
| Series B, 6.5%, 11/15/2022 | | | 365,000 | | | | 393,287 | |
| Series A, 7.625%, 3/15/2020 | | | 110,000 | | | | 117,700 | |
| Series B, 7.625%, 3/15/2020 | | | 1,115,000 | | | | 1,202,806 | |
| Cogeco Cable, Inc., 144A, 4.875%, 5/1/2020 | | | | 20,000 | | | | 20,250 | |
| CSC Holdings LLC, 144A, 5.25%, 6/1/2024 | | | | 510,000 | | | | 501,712 | |
| Cumulus Media Holdings, Inc., 7.75%, 5/1/2019 (b) | | | 375,000 | | | | 395,156 | |
| DISH DBS Corp.: | |
| 4.25%, 4/1/2018 | | | | 270,000 | | | | 280,800 | |
| 5.0%, 3/15/2023 | | | | 1,225,000 | | | | 1,247,969 | |
| 6.75%, 6/1/2021 | | | | 50,000 | | | | 57,000 | |
| 7.875%, 9/1/2019 | | | | 270,000 | | | | 320,625 | |
| | | | Principal Amount ($)(a) | | | Value ($) | |
| | | | | | | | | | |
| Getty Images, Inc., 144A, 7.0%, 10/15/2020 (b) | | | | 305,000 | | | | 279,456 | |
| Group 1 Automotive, Inc., 144A, 5.0%, 6/1/2022 | | | 205,000 | | | | 205,000 | |
| Harron Communications LP, 144A, 9.125%, 4/1/2020 | | | 395,000 | | | | 440,425 | |
| Hertz Corp., 6.75%, 4/15/2019 | | | 305,000 | | | | 323,300 | |
| Hot Topic, Inc., 144A, 9.25%, 6/15/2021 | | | | 140,000 | | | | 155,400 | |
| Isle of Capri Casinos, Inc., 5.875%, 3/15/2021 | | | | 100,000 | | | | 101,125 | |
| Jo-Ann Stores Holdings, Inc., 144A, 9.75%, 10/15/2019 (PIK) | | | 160,000 | | | | 163,600 | |
| Live Nation Entertainment, Inc.: | |
| 144A, 5.375%, 6/15/2022 | | | | 50,000 | | | | 50,625 | |
| 144A, 7.0%, 9/1/2020 | | | | 345,000 | | | | 377,775 | |
| MDC Partners, Inc., 144A, 6.75%, 4/1/2020 | | | | 370,000 | | | | 390,350 | |
| Mediacom Broadband LLC: | |
| 144A, 5.5%, 4/15/2021 | | | | 50,000 | | | | 50,625 | |
| 6.375%, 4/1/2023 | | | | 425,000 | | | | 448,375 | |
| Mediacom LLC, 7.25%, 2/15/2022 | | | 110,000 | | | | 119,900 | |
| MGM Resorts International: | |
| 6.75%, 10/1/2020 | | | | 526,000 | | | | 587,147 | |
| 8.625%, 2/1/2019 | | | | 510,000 | | | | 607,537 | |
| Numericable Group SA: | |
| 144A, 4.875%, 5/15/2019 | | | | 520,000 | | | | 533,650 | |
| 144A, 6.0%, 5/15/2022 | | | | 775,000 | | | | 806,000 | |
| 144A, 6.25%, 5/15/2024 | | | | 225,000 | | | | 234,844 | |
| Petco Animal Supplies, Inc., 144A, 9.25%, 12/1/2018 | | | 315,000 | | | | 338,231 | |
| Pinnacle Entertainment, Inc., 6.375%, 8/1/2021 | | | | 245,000 | | | | 258,475 | |
| Quebecor Media, Inc., 5.75%, 1/15/2023 | | | | 205,000 | | | | 210,638 | |
| Schaeffler Finance BV, 144A, 7.75%, 2/15/2017 | | | | 420,000 | | | | 473,550 | |
| Seminole Hard Rock Entertainment, Inc., 144A, 5.875%, 5/15/2021 | | | | 125,000 | | | | 125,313 | |
| Seminole Tribe of Florida, Inc., 144A, 7.804%, 10/1/2020 | | | 345,000 | | | | 388,125 | |
| Serta Simmons Holdings LLC, 144A, 8.125%, 10/1/2020 (b) | | | 230,000 | | | | 249,550 | |
| Sirius XM Radio, Inc., 144A, 5.875%, 10/1/2020 (b) | | | | 195,000 | | | | 206,213 | |
| Springs Industries, Inc., 6.25%, 6/1/2021 (b) | | | | 295,000 | | | | 300,900 | |
| Starz LLC, 5.0%, 9/15/2019 | | | | 175,000 | | | | 182,219 | |
| Taylor Morrison Communities, Inc., 144A, 5.25%, 4/15/2021 | | | 250,000 | | | | 253,750 | |
| The Men's Wearhouse, Inc., 144A, 7.0%, 7/1/2022 (b) | | | 145,000 | | | | 150,075 | |
| Travelport LLC: | |
| 144A, 6.352%**, 3/1/2016 | | | | 230,641 | | | | 232,371 | |
| 144A, 13.875%, 3/1/2016 (PIK) | | | 51,848 | | | | 53,403 | |
| UCI International, Inc., 8.625%, 2/15/2019 | | | | 310,000 | | | | 294,500 | |
| Unitymedia Hessen GmbH & Co., KG: | | | | | | | | |
| 144A, 5.5%, 1/15/2023 | | | | 945,000 | | | | 978,075 | |
| 144A, 7.5%, 3/15/2019 | | | | 435,000 | | | | 464,362 | |
| | | | Principal Amount ($)(a) | | | Value ($) | |
| | | | | | | | | | |
| Unitymedia KabelBW GmbH, 144A, 9.625%, 12/1/2019 | EUR | | | 550,000 | | | | 807,918 | |
| Univision Communications, Inc., 144A, 7.875%, 11/1/2020 | | | | 140,000 | | | | 154,000 | |
| Viking Cruises Ltd., 144A, 8.5%, 10/15/2022 | | | | 205,000 | | | | 226,525 | |
| Visant Corp., 10.0%, 10/1/2017 (b) | | | | 460,000 | | | | 428,950 | |
| Weyerhaeuser Real Estate Co.: | |
| 144A, 4.375%, 6/15/2019 | | | | 145,000 | | | | 145,363 | |
| 144A, 5.875%, 6/15/2024 | | | | 45,000 | | | | 46,294 | |
| | | | | 26,422,548 | |
| Consumer Staples 4.6% | |
| Big Heart Pet Brands, 7.625%, 2/15/2019 | | | | 284,000 | | | | 295,956 | |
| Chiquita Brands International, Inc., 7.875%, 2/1/2021 | | | | 195,000 | | | | 212,306 | |
| Cott Beverages, Inc., 144A, 5.375%, 7/1/2022 | | | | 240,000 | | | | 240,600 | |
| FAGE Dairy Industry SA, 144A, 9.875%, 2/1/2020 (b) | | | | 810,000 | | | | 866,700 | |
| JBS Investments GmbH: | |
| 144A, 7.25%, 4/3/2024 | | | | 525,000 | | | | 543,375 | |
| 144A, 7.75%, 10/28/2020 | | | | 405,000 | | | | 433,350 | |
| JBS U.S.A. LLC: | |
| 144A, 7.25%, 6/1/2021 | | | | 485,000 | | | | 520,163 | |
| 144A, 8.25%, 2/1/2020 | | | | 160,000 | | | | 173,600 | |
| Pilgrim's Pride Corp., 7.875%, 12/15/2018 | | | | 290,000 | | | | 307,052 | |
| Post Holdings, Inc.: | |
| 144A, 6.0%, 12/15/2022 | | | | 200,000 | | | | 204,000 | |
| 144A, 6.75%, 12/1/2021 | | | | 450,000 | | | | 478,125 | |
| Reynolds Group Issuer, Inc.: | |
| 5.75%, 10/15/2020 | | | | 1,390,000 | | | | 1,466,450 | |
| 6.875%, 2/15/2021 | | | | 540,000 | | | | 582,727 | |
| 8.25%, 2/15/2021 (b) | | | | 225,000 | | | | 244,688 | |
| Roundy's Supermarkets, Inc., 144A, 10.25%, 12/15/2020 | | | | 220,000 | | | | 232,375 | |
| Smithfield Foods, Inc., 6.625%, 8/15/2022 | | | | 190,000 | | | | 208,050 | |
| U.S. Foods, Inc., 8.5%, 6/30/2019 | | | | 400,000 | | | | 428,200 | |
| | | | | 7,437,717 | |
| Energy 13.7% | |
| Access Midstream Partners LP, 6.125%, 7/15/2022 | | | | 325,000 | | | | 359,125 | |
| Antero Resources Finance Corp., 5.375%, 11/1/2021 | | | | 110,000 | | | | 114,125 | |
| Baytex Energy Corp.: | |
| 144A, 5.125%, 6/1/2021 | | | | 95,000 | | | | 95,594 | |
| 144A, 5.625%, 6/1/2024 | | | | 95,000 | | | | 95,356 | |
| Berry Petroleum Co., LLC: | |
| 6.375%, 9/15/2022 | | | | 205,000 | | | | 218,325 | |
| 6.75%, 11/1/2020 | | | | 680,000 | | | | 715,700 | |
| BreitBurn Energy Partners LP: | |
| 7.875%, 4/15/2022 | | | | 700,000 | | | | 757,750 | |
| 8.625%, 10/15/2020 | | | | 225,000 | | | | 247,500 | |
| Chaparral Energy, Inc.: | |
| 7.625%, 11/15/2022 | | | | 465,000 | | | | 502,200 | |
| 8.25%, 9/1/2021 | | | | 300,000 | | | | 329,250 | |
| Chesapeake Energy Corp., 3.479%,** 4/15/2019 | | | | 300,000 | | | | 303,375 | |
| Chesapeake Oilfield Operating LLC, 6.625%, 11/15/2019 | | | | 150,000 | | | | 161,250 | |
| | | | Principal Amount ($)(a) | | | Value ($) | |
| | | | | | | | | | |
| CONSOL Energy, Inc., 144A, 5.875%, 4/15/2022 | | | | 105,000 | | | | 109,988 | |
| Crestwood Midstream Partners LP: | |
| 144A, 6.125%, 3/1/2022 | | | | 165,000 | | | | 173,663 | |
| 7.75%, 4/1/2019 | | | | 325,000 | | | | 348,562 | |
| Dresser-Rand Group, Inc., 6.5%, 5/1/2021 | | | | 420,000 | | | | 449,400 | |
| Endeavor Energy Resources LP, 144A, 7.0%, 8/15/2021 | | | | 545,000 | | | | 581,787 | |
| EP Energy LLC: | |
| 6.875%, 5/1/2019 | | | | 330,000 | | | | 351,037 | |
| 7.75%, 9/1/2022 | | | | 285,000 | | | | 321,338 | |
| 9.375%, 5/1/2020 | | | | 150,000 | | | | 171,750 | |
| EV Energy Partners LP, 8.0%, 4/15/2019 | | | | 835,000 | | | | 876,750 | |
| EXCO Resources, Inc., 8.5%, 4/15/2022 | | | | 155,000 | | | | 167,400 | |
| Halcon Resources Corp.: | |
| 8.875%, 5/15/2021 (b) | | | | 1,513,500 | | | | 1,627,012 | |
| 9.75%, 7/15/2020 | | | | 500,000 | | | | 545,625 | |
| Hilcorp Energy I LP, 144A, 5.0%, 12/1/2024 (c) | | | | 195,000 | | | | 195,000 | |
| Holly Energy Partners LP, 6.5%, 3/1/2020 | | | | 105,000 | | | | 113,138 | |
| Kodiak Oil & Gas Corp., 5.5%, 1/15/2021 (b) | | | | 400,000 | | | | 417,000 | |
| Linn Energy LLC, 6.25%, 11/1/2019 | | | | 490,000 | | | | 513,275 | |
| MEG Energy Corp.: | |
| 144A, 6.5%, 3/15/2021 | | | | 235,000 | | | | 249,100 | |
| 144A, 7.0%, 3/31/2024 | | | | 470,000 | | | | 518,175 | |
| Memorial Resource Development Corp., 144A, 5.875%, 7/1/2022 (c) | | | | 195,000 | | | | 196,463 | |
| Midstates Petroleum Co., Inc.: | |
| 9.25%, 6/1/2021 (b) | | | | 590,000 | | | | 647,525 | |
| 10.75%, 10/1/2020 | | | | 585,000 | | | | 663,975 | |
| Murphy Oil U.S.A., Inc., 6.0%, 8/15/2023 | | | | 290,000 | | | | 305,225 | |
| Northern Oil & Gas, Inc., 8.0%, 6/1/2020 | | | | 595,000 | | | | 635,162 | |
| Oasis Petroleum, Inc.: | |
| 6.5%, 11/1/2021 | | | | 175,000 | | | | 188,125 | |
| 144A, 6.875%, 3/15/2022 | | | | 385,000 | | | | 419,650 | |
| 6.875%, 1/15/2023 | | | | 130,000 | | | | 141,700 | |
| 7.25%, 2/1/2019 | | | | 665,000 | | | | 704,900 | |
| Offshore Group Investment Ltd.: | |
| 7.125%, 4/1/2023 | | | | 410,000 | | | | 416,150 | |
| 7.5%, 11/1/2019 | | | | 745,000 | | | | 787,837 | |
| Regency Energy Partners LP, 5.875%, 3/1/2022 | | | | 25,000 | | | | 27,156 | |
| Sabine Pass Liquefaction LLC: | |
| 5.625%, 2/1/2021 | | | | 690,000 | | | | 729,675 | |
| 5.625%, 4/15/2023 | | | | 155,000 | | | | 161,588 | |
| 144A, 5.75%, 5/15/2024 | | | | 175,000 | | | | 182,438 | |
| Samson Investment Co., 144A, 10.75%, 2/15/2020 | | | | 155,000 | | | | 163,331 | |
| SandRidge Energy, Inc., 7.5%, 3/15/2021 | | | | 1,935,000 | | | | 2,097,056 | |
| SESI LLC, 6.375%, 5/1/2019 | | | | 235,000 | | | | 250,863 | |
| Seventy Seven Energy, Inc., 144A, 6.5%, 7/15/2022 | | | | 50,000 | | | | 51,250 | |
| Swift Energy Co., 7.875%, 3/1/2022 (b) | | | | 290,000 | | | | 303,050 | |
| Talos Production LLC, 144A, 9.75%, 2/15/2018 | | | | 410,000 | | | | 434,600 | |
| Welltec AS, 144A, 8.0%, 2/1/2019 | | | 400,000 | | | | 426,000 | |
| | | | Principal Amount ($)(a) | | | Value ($) | |
| | | | | | | | | | |
| Whiting Petroleum Corp., 5.0%, 3/15/2019 | | | | 240,000 | | | | 252,600 | |
| WPX Energy, Inc., 5.25%, 1/15/2017 | | | | 510,000 | | | | 543,150 | |
| | | | | 22,359,019 | |
| Financials 6.0% | |
| AerCap Aviation Solutions BV, 6.375%, 5/30/2017 | | | | 470,000 | | | | 518,175 | |
| CIT Group, Inc.: | |
| 3.875%, 2/19/2019 | | | | 2,810,000 | | | | 2,853,836 | |
| 5.25%, 3/15/2018 | | | | 540,000 | | | | 579,825 | |
| Credit Agricole SA, 144A, 7.875%, 1/29/2049 (b) | | | | 330,000 | | | | 360,525 | |
| Credit Suisse Group AG, 144A, 6.25%, 12/29/2049 (b) | | | | 230,000 | | | | 231,495 | |
| E*TRADE Financial Corp.: | |
| 6.375%, 11/15/2019 | | | | 585,000 | | | | 633,262 | |
| 6.75%, 6/1/2016 | | | | 710,000 | | | | 770,350 | |
| Hellas Telecommunications Finance, 144A, 8.328%**, 7/15/2015 (PIK)* | EUR | | | 322,107 | | | | 0 | |
| International Lease Finance Corp.: | | | | | | | | | |
| 3.875%, 4/15/2018 | | | | 385,000 | | | | 394,625 | |
| 6.25%, 5/15/2019 | | | | 320,000 | | | | 358,400 | |
| 8.75%, 3/15/2017 | | | | 245,000 | | | | 284,813 | |
| Morgan Stanley, Series H, 5.45%, 7/29/2049 | | | | 155,000 | | | | 157,827 | |
| MPT Operating Partnership LP: | |
| (REIT), 6.375%, 2/15/2022 | | | | 290,000 | | | | 311,025 | |
| (REIT), 6.875%, 5/1/2021 | | | | 295,000 | | | | 321,550 | |
| Neuberger Berman Group LLC, 144A, 5.625%, 3/15/2020 | | | | 160,000 | | | | 169,200 | |
| Popular, Inc., 7.0%, 7/1/2019 (c) | | | | 145,000 | | | | 147,175 | |
| Societe Generale SA, 144A, 7.875%, 12/29/2049 (b) | | | | 825,000 | | | | 879,656 | |
| The Goldman Sachs Group, Inc., Series L, 5.7%, 12/29/2049 | | | | 260,000 | | | | 268,613 | |
| UniCredit SpA, 8.0%, 4/3/2049 | | | | 500,000 | | | | 532,500 | |
| | | | | 9,772,852 | |
| Health Care 5.7% | |
| Aviv Healthcare Properties LP: | |
| 6.0%, 10/15/2021 | | | | 100,000 | | | | 106,000 | |
| 7.75%, 2/15/2019 | | | | 500,000 | | | | 532,500 | |
| Biomet, Inc.: | |
| 6.5%, 8/1/2020 | | | | 355,000 | | | | 382,512 | |
| 6.5%, 10/1/2020 | | | | 100,000 | | | | 106,750 | |
| Community Health Systems, Inc.: | | | | | | | | |
| 5.125%, 8/15/2018 | | | | 1,155,000 | | | | 1,211,306 | |
| 144A, 5.125%, 8/1/2021 | | | | 55,000 | | | | 56,375 | |
| 144A, 6.875%, 2/1/2022 | | | | 220,000 | | | | 233,200 | |
| 7.125%, 7/15/2020 (b) | | | | 635,000 | | | | 687,387 | |
| Crimson Merger Sub, Inc., 144A, 6.625%, 5/15/2022 | | | | 525,000 | | | | 521,062 | |
| Endo Finance LLC: | |
| 144A, 5.375%, 1/15/2023 | | | | 215,000 | | | | 214,731 | |
| 144A, 5.75%, 1/15/2022 | | | | 220,000 | | | | 224,400 | |
| Fresenius Medical Care U.S. Finance II, Inc., 144A, 5.625%, 7/31/2019 | | | | 220,000 | | | | 239,800 | |
| | | | Principal Amount ($)(a) | | | Value ($) | |
| | | | | | | | | | |
| Fresenius U.S. Finance II, Inc., 144A, 9.0%, 7/15/2015 | | | 420,000 | | | | 452,550 | |
| HCA, Inc.: | |
| 6.5%, 2/15/2020 | | | | 890,000 | | | | 1,001,250 | |
| 7.5%, 2/15/2022 | | | | 305,000 | | | | 351,894 | |
| Hologic, Inc., 6.25%, 8/1/2020 | | | 200,000 | | | | 211,000 | |
| IMS Health, Inc., 144A, 6.0%, 11/1/2020 | | | | 250,000 | | | | 262,500 | |
| LifePoint Hospitals, Inc., 144A, 5.5%, 12/1/2021 | | | 275,000 | | | | 288,063 | |
| Par Pharmaceutical Companies, Inc., 7.375%, 10/15/2020 | | | 345,000 | | | | 370,875 | |
| Physio-Control International, Inc., 144A, 9.875%, 1/15/2019 | | | 299,000 | | | | 330,395 | |
| Salix Pharmaceuticals Ltd., 144A, 6.0%, 1/15/2021 | | | 165,000 | | | | 176,963 | |
Valeant Pharmaceuticals International, Inc. 144A: 6.375%, 10/15/2020 | | | | 245,000 | | | | 260,313 | |
| 7.5%, 7/15/2021 | | | | 1,050,000 | | | | 1,162,875 | |
| | | | | 9,384,701 | |
| Industrials 9.5% | |
| ADT Corp.: | |
| 3.5%, 7/15/2022 | | | | 150,000 | | | | 136,500 | |
| 4.125%, 4/15/2019 | | | | 45,000 | | | | 45,281 | |
| 6.25%, 10/15/2021 (b) | | | | 145,000 | | | | 153,700 | |
| Aguila 3 SA, 144A, 7.875%, 1/31/2018 | | | | 480,000 | | | | 506,400 | |
| Alphabet Holding Co., Inc., 7.75%, 11/1/2017 (PIK) | | | | 480,000 | | | | 495,600 | |
| Armored Autogroup, Inc., 9.25%, 11/1/2018 (b) | | | | 610,000 | | | | 642,025 | |
| Artesyn Escrow, Inc., 144A, 9.75%, 10/15/2020 | | | | 245,000 | | | | 240,713 | |
| AWAS Aviation Capital Ltd., 144A, 7.0%, 10/17/2016 | | | | 341,960 | | | | 352,219 | |
| BakerCorp International, Inc., 8.25%, 6/1/2019 | | | | 335,000 | | | | 345,887 | |
| BE Aerospace, Inc., 6.875%, 10/1/2020 | | | | 180,000 | | | | 195,525 | |
| Belden, Inc., 144A, 5.5%, 9/1/2022 | | | | 355,000 | | | | 367,425 | |
| Bombardier, Inc.: | |
| 144A, 4.75%, 4/15/2019 | | | | 160,000 | | | | 162,800 | |
| 144A, 5.75%, 3/15/2022 (b) | | | 225,000 | | | | 230,625 | |
| 144A, 6.0%, 10/15/2022 | | | | 265,000 | | | | 271,625 | |
| Casella Waste Systems, Inc., 7.75%, 2/15/2019 | | | | 275,000 | | | | 287,375 | |
| Covanta Holding Corp., 5.875%, 3/1/2024 | | | | 220,000 | | | | 227,425 | |
| CTP Transportation Products LLC, 144A, 8.25%, 12/15/2019 | | | | 275,000 | | | | 296,313 | |
| Darling Ingredients, Inc., 144A, 5.375%, 1/15/2022 | | | | 220,000 | | | | 228,250 | |
| DigitalGlobe, Inc., 5.25%, 2/1/2021 | | | | 160,000 | | | | 158,400 | |
| Ducommun, Inc., 9.75%, 7/15/2018 | | | | 305,000 | | | | 339,407 | |
| Florida East Coast Holdings Corp., 144A, 6.75%, 5/1/2019 | | | | 470,000 | | | | 496,437 | |
| FTI Consulting, Inc., 6.0%, 11/15/2022 | | | | 205,000 | | | | 210,894 | |
| Garda World Security Corp., 144A, 7.25%, 11/15/2021 | | | | 290,000 | | | | 304,863 | |
| | | | Principal Amount ($)(a) | | | Value ($) | |
| | | | | | | | | | |
| Gates Global LLC, 144A, 6.0%, 7/15/2022 | | | | 190,000 | | | | 190,000 | |
| GenCorp, Inc., 7.125%, 3/15/2021 | | | | 535,000 | | | | 584,487 | |
| Huntington Ingalls Industries, Inc.: | |
| 6.875%, 3/15/2018 | | | | 280,000 | | | | 296,100 | |
| 7.125%, 3/15/2021 | | | | 60,000 | | | | 65,550 | |
| Interactive Data Corp., 144A, 5.875%, 4/15/2019 | | | | 260,000 | | | | 263,900 | |
| Kenan Advantage Group, Inc., 144A, 8.375%, 12/15/2018 | | | 575,000 | | | | 615,250 | |
| Meritor, Inc.: | |
| 6.25%, 2/15/2024 | | | | 215,000 | | | | 225,213 | |
| 6.75%, 6/15/2021 | | | | 300,000 | | | | 322,680 | |
| Navios Maritime Holdings, Inc.: | |
| 144A, 7.375%, 1/15/2022 | | | | 830,000 | | | | 854,900 | |
| 8.125%, 2/15/2019 | | | | 410,000 | | | | 431,012 | |
| Nortek, Inc., 8.5%, 4/15/2021 | | | | 440,000 | | | | 486,200 | |
| Oshkosh Corp., 5.375%, 3/1/2022 | | | 165,000 | | | | 169,950 | |
| Ply Gem Industries, Inc., 144A, 6.5%, 2/1/2022 (b) | | | 275,000 | | | | 266,063 | �� |
| Spirit AeroSystems, Inc.: | |
| 144A, 5.25%, 3/15/2022 | | | | 285,000 | | | | 289,275 | |
| 6.75%, 12/15/2020 | | | | 205,000 | | | | 220,375 | |
| Titan International, Inc., 6.875%, 10/1/2020 | | | | 590,000 | | | | 598,850 | |
| TransDigm, Inc.: | |
| 144A, 6.0%, 7/15/2022 | | | | 260,000 | | | | 267,150 | |
| 144A, 6.5%, 7/15/2024 | | | | 155,000 | | | | 161,394 | |
| 7.5%, 7/15/2021 | | | | 470,000 | | | | 520,525 | |
| Triumph Group, Inc., 144A, 5.25%, 6/1/2022 | | | | 130,000 | | | | 130,325 | |
| United Rentals North America, Inc.: | |
| 5.75%, 7/15/2018 | | | | 365,000 | | | | 385,987 | |
| 6.125%, 6/15/2023 | | | | 25,000 | | | | 26,813 | |
| 7.375%, 5/15/2020 | | | | 595,000 | | | | 657,475 | |
| 7.625%, 4/15/2022 | | | | 595,000 | | | | 667,887 | |
| Watco Companies LLC, 144A, 6.375%, 4/1/2023 | | | 155,000 | | | | 158,100 | |
| | | | | 15,551,150 | |
| Information Technology 5.8% | |
| ACI Worldwide, Inc., 144A, 6.375%, 8/15/2020 | | | | 105,000 | | | | 110,513 | |
| Activision Blizzard, Inc., 144A, 5.625%, 9/15/2021 | | | | 805,000 | | | | 867,387 | |
| Alliance Data Systems Corp., 144A, 5.25%, 12/1/2017 | | | 255,000 | | | | 266,475 | |
| Audatex North America, Inc., 144A, 6.0%, 6/15/2021 | | | 200,000 | | | | 213,500 | |
| BMC Software Finance, Inc., 144A, 8.125%, 7/15/2021 | | | 450,000 | | | | 462,938 | |
| Boxer Parent Co., Inc., 144A, 9.0%, 10/15/2019 (PIK) | | | | 320,000 | | | | 312,000 | |
| CDW LLC, 8.5%, 4/1/2019 | | | | 1,180,000 | | | | 1,277,350 | |
| CyrusOne LP, 6.375%, 11/15/2022 | | | 105,000 | | | | 113,138 | |
| eAccess Ltd., 144A, 8.25%, 4/1/2018 | | | 335,000 | | | | 361,800 | |
| EarthLink Holdings Corp., 7.375%, 6/1/2020 | | | | 245,000 | | | | 261,231 | |
| Entegris, Inc., 144A, 6.0%, 4/1/2022 | | | 160,000 | | | | 164,800 | |
| Equinix, Inc.: | |
| 5.375%, 4/1/2023 | | | | 725,000 | | | | 741,312 | |
| 7.0%, 7/15/2021 | | | | 215,000 | | | | 237,575 | |
| | | | Principal Amount ($)(a) | | | Value ($) | |
| | | | | | | | | | |
| First Data Corp.: | |
| 144A, 6.75%, 11/1/2020 | | | | 611,000 | | | | 661,407 | |
| 144A, 7.375%, 6/15/2019 | | | | 250,000 | | | | 268,438 | |
| 144A, 8.75%, 1/15/2022 (PIK) | | | 910,000 | | | | 1,004,412 | |
| 144A, 8.875%, 8/15/2020 | | | | 495,000 | | | | 547,594 | |
| Freescale Semiconductor, Inc., 144A, 6.0%, 1/15/2022 | | | 275,000 | | | | 292,875 | |
| Hughes Satellite Systems Corp.: | |
| 6.5%, 6/15/2019 | | | | 445,000 | | | | 496,175 | |
| 7.625%, 6/15/2021 | | | | 230,000 | | | | 263,350 | |
| Micron Technology, Inc., 144A, 5.875%, 2/15/2022 | | | 110,000 | | | | 117,975 | |
| NCR Corp.: | |
| 144A, 5.875%, 12/15/2021 | | | | 55,000 | | | | 58,025 | |
| 144A, 6.375%, 12/15/2023 | | | | 135,000 | | | | 146,475 | |
| NXP BV, 144A, 3.75%, 6/1/2018 | | | 250,000 | | | | 250,625 | |
| Sanmina Corp., 144A, 4.375%, 6/1/2019 | | | | 25,000 | | | | 24,969 | |
| | | | | 9,522,339 | |
| Materials 5.7% | |
| Ardagh Packaging Finance PLC, 144A, 3.211%, 12/15/2019 (c) | | | 310,000 | | | | 309,225 | |
| AuRico Gold, Inc., 144A, 7.75%, 4/1/2020 | | | | 155,000 | | | | 153,450 | |
| Berry Plastics Corp.: | |
| 5.5%, 5/15/2022 | | | | 435,000 | | | | 437,447 | |
| 9.75%, 1/15/2021 | | | | 460,000 | | | | 524,400 | |
| BOE Intermediate Holding Corp., 144A, 9.0%, 11/1/2017 (PIK) | | | 317,975 | | | | 333,476 | |
| BOE Merger Corp., 144A, 9.5%, 11/1/2017 (PIK) | | | | 410,000 | | | | 432,037 | |
| Cascades, Inc., 144A, 5.5%, 7/15/2022 | | | | 145,000 | | | | 144,638 | |
| Clearwater Paper Corp., 7.125%, 11/1/2018 | | | | 390,000 | | | | 409,500 | |
| Crown Americas LLC, 6.25%, 2/1/2021 | | | | 50,000 | | | | 53,500 | |
| Exopack Holding Corp., 144A, 10.0%, 6/1/2018 | | | | 230,000 | | | | 247,250 | |
| Exopack Holdings SA, 144A, 7.875%, 11/1/2019 | | | | 275,000 | | | | 294,250 | |
| First Quantum Minerals Ltd.: | |
| 144A, 6.75%, 2/15/2020 | | | | 551,000 | | | | 567,530 | |
| 144A, 7.0%, 2/15/2021 | | | | 551,000 | | | | 566,841 | |
| FMG Resources (August 2006) Pty Ltd.: | | | | | | | | |
| 144A, 6.0%, 4/1/2017 (b) | | | | 315,000 | | | | 325,237 | |
| 144A, 8.25%, 11/1/2019 (b) | | | 270,000 | | | | 293,963 | |
| Hexion U.S. Finance Corp.: | |
| 6.625%, 4/15/2020 | | | | 505,000 | | | | 535,300 | |
| 8.875%, 2/1/2018 | | | | 270,000 | | | | 280,800 | |
| IAMGOLD Corp., 144A, 6.75%, 10/1/2020 | | | | 310,000 | | | | 286,750 | |
| Kaiser Aluminum Corp., 8.25%, 6/1/2020 | | | | 260,000 | | | | 292,500 | |
| Packaging Dynamics Corp., 144A, 8.75%, 2/1/2016 | | | 535,000 | | | | 549,445 | |
| Perstorp Holding AB, 144A, 8.75%, 5/15/2017 (b) | | | | 455,000 | | | | 487,987 | |
| Plastipak Holdings, Inc., 144A, 6.5%, 10/1/2021 | | | 250,000 | | | | 263,750 | |
| Polymer Group, Inc., 7.75%, 2/1/2019 | | | | 270,000 | | | | 286,875 | |
| Rain CII Carbon LLC: | |
| 144A, 8.0%, 12/1/2018 | | | | 270,000 | | | | 283,500 | |
| 144A, 8.25%, 1/15/2021 (b) | | | 200,000 | | | | 210,000 | |
| | | | Principal Amount ($)(a) | | | Value ($) | |
| | | | | | | | | | |
| Sealed Air Corp.: | |
| 144A, 8.125%, 9/15/2019 | | | | 150,000 | | | | 165,188 | |
| 144A, 8.375%, 9/15/2021 | | | | 150,000 | | | | 171,750 | |
| Signode Industrial Group Lux SA, 144A, 6.375%, 5/1/2022 | | | 210,000 | | | | 212,625 | |
| Tronox Finance LLC, 6.375%, 8/15/2020 (b) | | | | 200,000 | | | | 206,500 | |
| | | | | 9,325,714 | |
| Telecommunication Services 18.5% | |
| Altice Financing SA: | |
| 144A, 7.875%, 12/15/2019 | | | | 235,000 | | | | 257,208 | |
| 144A, 6.5%, 1/15/2022 | | | | 200,000 | | | | 213,000 | |
| Altice Finco SA, 144A, 9.875%, 12/15/2020 | | | | 235,000 | | | | 270,838 | |
| Altice SA, 144A, 7.75%, 5/15/2022 | | | 245,000 | | | | 261,538 | |
| B Communications Ltd., 144A, 7.375%, 2/15/2021 | | | 270,000 | | | | 290,250 | |
| CenturyLink, Inc.: | |
| Series V, 5.625%, 4/1/2020 | | | | 105,000 | | | | 110,775 | |
| Series W, 6.75%, 12/1/2023 | | | 280,000 | | | | 305,900 | |
| Cincinnati Bell, Inc.: | |
| 8.375%, 10/15/2020 | | | | 1,505,000 | | | | 1,649,856 | |
| 8.75%, 3/15/2018 | | | | 640,000 | | | | 671,200 | |
| CommScope, Inc., 144A, 5.0%, 6/15/2021 | | | | 260,000 | | | | 265,200 | |
| CPI International, Inc., 8.75%, 2/15/2018 | | | | 260,000 | | | | 272,350 | |
| Digicel Group Ltd.: | |
| 144A, 7.125%, 4/1/2022 | | | | 265,000 | | | | 276,263 | |
| 144A, 8.25%, 9/30/2020 | | | | 1,560,000 | | | | 1,700,400 | |
| Digicel Ltd.: | |
| 144A, 7.0%, 2/15/2020 | | | | 200,000 | | | | 211,000 | |
| 144A, 8.25%, 9/1/2017 | | | | 1,090,000 | | | | 1,121,392 | |
| Frontier Communications Corp.: | |
| 7.125%, 1/15/2023 | | | | 1,370,000 | | | | 1,452,200 | |
| 8.25%, 4/15/2017 | | | | 348,000 | | | | 404,115 | |
| 8.5%, 4/15/2020 | | | | 100,000 | | | | 118,000 | |
| Intelsat Jackson Holdings SA: | |
| 5.5%, 8/1/2023 | | | | 465,000 | | | | 462,675 | |
| 7.25%, 10/15/2020 | | | | 1,230,000 | | | | 1,325,325 | |
| 7.5%, 4/1/2021 | | | | 1,270,000 | | | | 1,390,650 | |
| 8.5%, 11/1/2019 | | | | 580,000 | | | | 616,250 | |
| Intelsat Luxembourg SA: | |
| 7.75%, 6/1/2021 | | | | 670,000 | | | | 709,362 | |
| 8.125%, 6/1/2023 | | | | 105,000 | | | | 113,531 | |
| Level 3 Communications, Inc., 8.875%, 6/1/2019 | | | 55,000 | | | | 60,156 | |
| Level 3 Financing, Inc.: | |
| 144A, 6.125%, 1/15/2021 | | | | 165,000 | | | | 176,756 | |
| 7.0%, 6/1/2020 | | | | 1,260,000 | | | | 1,376,550 | |
| 8.125%, 7/1/2019 | | | | 670,000 | | | | 731,137 | |
| 8.625%, 7/15/2020 | | | | 510,000 | | | | 571,200 | |
| MetroPCS Wireless, Inc.: | |
| 6.625%, 11/15/2020 | | | | 705,000 | | | | 752,587 | |
| 7.875%, 9/1/2018 | | | | 420,000 | | | | 441,126 | |
| Millicom International Cellular SA, 144A, 4.75%, 5/22/2020 | | | 720,000 | | | | 720,000 | |
| Pacnet Ltd., 144A, 9.0%, 12/12/2018 | | | 200,000 | | | | 216,500 | |
| SBA Communications Corp., 5.625%, 10/1/2019 | | | | 200,000 | | | | 211,750 | |
| Sprint Communications, Inc.: | |
| 144A, 7.0%, 3/1/2020 | | | | 245,000 | | | | 281,750 | |
| 144A, 9.0%, 11/15/2018 | | | | 845,000 | | | | 1,024,562 | |
| 9.125%, 3/1/2017 | | | | 310,000 | | | | 363,087 | |
| | | | Principal Amount ($)(a) | | | Value ($) | |
| | | | | | | | | | |
| Sprint Corp., 144A, 7.125%, 6/15/2024 | | | 770,000 | | | | 816,200 | |
| T-Mobile U.S.A., Inc.: | |
| 6.125%, 1/15/2022 | | | | 110,000 | | | | 116,738 | |
| 6.5%, 1/15/2024 | | | | 110,000 | | | | 117,563 | |
| 6.625%, 4/1/2023 (b) | | | | 245,000 | | | | 265,825 | |
| tw telecom holdings, Inc.: | |
| 5.375%, 10/1/2022 | | | | 320,000 | | | | 360,938 | |
| 6.375%, 9/1/2023 | | | | 245,000 | | | | 278,688 | |
| UPCB Finance III Ltd., 144A, 6.625%, 7/1/2020 | | | | 185,000 | | | | 197,025 | |
| UPCB Finance V Ltd., 144A, 7.25%, 11/15/2021 | | | | 1,480,000 | | | | 1,628,000 | |
| UPCB Finance VI Ltd., 144A, 6.875%, 1/15/2022 | | | | 300,000 | | | | 327,750 | |
| Wind Acquisition Finance SA: | |
| 144A, 6.5%, 4/30/2020 | | | | 195,000 | | | | 211,331 | |
| 144A, 7.25%, 2/15/2018 | | | | 410,000 | | | | 433,165 | |
| Windstream Corp.: | |
| 6.375%, 8/1/2023 | | | | 265,000 | | | | 268,644 | |
| 7.5%, 4/1/2023 | | | | 420,000 | | | | 454,650 | |
| 7.75%, 10/15/2020 | | | | 1,880,000 | | | | 2,037,450 | |
| 7.75%, 10/1/2021 | | | | 675,000 | | | | 737,437 | |
| 7.875%, 11/1/2017 | | | | 495,000 | | | | 569,869 | |
| | | | | 30,217,712 | |
| Utilities 2.3% | |
| AES Corp.: | |
| 3.229%,** 6/1/2019 | | | | 175,000 | | | | 176,313 | |
| 8.0%, 10/15/2017 | | | | 51,000 | | | | 59,415 | |
| 8.0%, 6/1/2020 | | | | 525,000 | | | | 631,312 | |
| Calpine Corp.: | |
| 144A, 7.5%, 2/15/2021 | | | | 387,000 | | | | 419,895 | |
| 144A, 7.875%, 7/31/2020 | | | | 428,000 | | | | 464,380 | |
| Enel SpA, 144A, 8.75%**, 9/24/2073 | | | | 360,000 | | | | 423,900 | |
| Energy Future Holdings Corp., Series Q, 6.5%, 11/15/2024* | | | 550,000 | | | | 415,250 | |
| NGL Energy Partners LP, 144A, 5.125%, 7/15/2019 (c) | | | 190,000 | | | | 190,475 | |
| NRG Energy, Inc.: | |
| 144A, 6.25%, 5/1/2024 | | | | 770,000 | | | | 804,650 | |
| 7.875%, 5/15/2021 | | | | 215,000 | | | | 238,379 | |
| | | | | 3,823,969 | |
Total Corporate Bonds (Cost $137,003,693) | | | | 143,817,721 | |
| | |
| Government & Agency Obligation 0.6% | |
| U.S. Treasury Obligation | |
| U.S. Treasury Note, 1.0%, 8/31/2016 (d) (Cost $1,060,442) | | | 1,050,000 | | | | 1,060,828 | |
| | |
| Loan Participations and Assignments 1.3% | |
| Senior Loans** | |
| Alliance Mortgage Cycle Loan, Term Loan A, 9.5%, 6/15/2010* | | | 700,000 | | | | 0 | |
| Ardagh Holdings U.S.A., Inc., Term Loan B, 4.25%, 12/17/2019 | | | 438,897 | | | | 441,092 | |
| Asurion LLC, Second Lien Term Loan, 8.5%, 3/3/2021 | | | | 310,000 | | | | 322,206 | |
| DaVita HealthCare Partners, Inc., Term Loan B, Zero Coupon, 6/24/2021 | | | 470,000 | | | | 472,698 | |
| | | | Principal Amount ($)(a) | | | Value ($) | |
| | | | | | | | | | |
| Freescale Semiconductor, Inc., Term Loan B4, 4.25%, 2/28/2020 | | | 309,223 | | | | 309,674 | |
| Ply Gem Industries, Inc., Term Loan, 4.0%, 2/1/2021 | | | 309,225 | | | | 307,756 | |
| Spansion LLC, Term Loan, Zero Coupon, 12/19/2019 | | | | 190,000 | | | | 190,791 | |
| Travelport LLC, Second Lien Term Loan, 9.5%, 1/29/2016 | | | 36,284 | | | | 37,463 | |
Total Loan Participations and Assignments (Cost $2,767,723) | | | | 2,081,680 | |
| | |
| Convertible Bonds 1.7% | |
| Consumer Discretionary 0.1% | |
| Live Nation Entertainment, Inc., 144A, 2.5%, 5/15/2019 | | | 145,000 | | | | 150,981 | |
| Materials 1.6% | |
| GEO Specialty Chemicals, Inc., 144A, 7.5%, 3/31/2015 (PIK) | | | 1,297,793 | | | | 2,613,106 | |
Total Convertible Bonds (Cost $1,433,710) | | | | 2,764,087 | |
| | |
| Preferred Security 0.6% | |
| Materials | |
| Hercules, Inc., 6.5%, 6/30/2029 (Cost $767,119) | | | 1,135,000 | | | | 1,027,175 | |
| | | Shares | | | Value ($) | |
| | | | |
| Common Stocks 0.0% | |
| Consumer Discretionary 0.0% | |
| Dawn Holdings, Inc.* (e) | | | 15 | | | | 44,160 | |
| Trump Entertainment Resorts, Inc.* | | | 45 | | | | 0 | |
| | | | | | | | 44,160 | |
| Industrials 0.0% | |
| Congoleum Corp.* | | | 24,000 | | | | 0 | |
| | | Shares | | | Value ($) | |
| | | | | | | | | |
| Materials 0.0% | |
| GEO Specialty Chemicals, Inc.* | | | 24,225 | | | | 18,726 | |
| GEO Specialty Chemicals, Inc. 144A* | | | 2,206 | | | | 1,705 | |
| | | | | | | | 20,431 | |
Total Common Stocks (Cost $345,217) | | | | 64,591 | |
| | |
| Preferred Stock 0.7% | |
| Financials | |
| Ally Financial, Inc. Series G, 144A, 7.0% (Cost $1,058,296) | | | 1,134 | | | | 1,142,541 | |
| | |
| Warrants 0.1% | |
| Materials | |
| GEO Specialty Chemicals, Inc., Expiration Date 3/31/2015* | | | 119,802 | | | | 91,708 | |
| Hercules Trust II, Expiration Date 3/31/2029* | | | 1,100 | | | | 7,077 | |
Total Warrants (Cost $244,286) | | | | 98,785 | |
| | |
| Securities Lending Collateral 5.6% | |
| Daily Assets Fund Institutional, 0.08% (f) (g) (Cost $9,098,382) | | | 9,098,382 | | | | 9,098,382 | |
| | |
| Cash Equivalents 5.8% | |
| Central Cash Management Fund, 0.06% (f) (Cost $9,427,233) | | | 9,427,233 | | | | 9,427,233 | |
| | | % of Net Assets | | | Value ($) | |
| | | | |
Total Investment Portfolio (Cost $163,206,101)† | | | 104.4 | | | | 170,583,023 | |
| Other Assets and Liabilities, Net | | | (4.4 | ) | | | (7,241,952 | ) |
| Net Assets | | | 100.0 | | | | 163,341,071 | |
The following table represents bonds and senior loans that are in default:
| Security | | Coupon | | Maturity Date | Principal Amount | | | Cost ($) | | | Value ($) | |
| Alliance Mortgage Cycle Loan* | | | 9.5% | % | 6/15/2010 | USD | | | 700,000 | | | | 700,000 | | | | 0 | |
| Energy Future Holdings Corp.* | | | 6.5 | % | 11/15/2024 | USD | | | 550,000 | | | | 322,434 | | | | 415,250 | |
| Hellas Telecommunications Finance* | | | 8.328 | % | 7/15/2015 | EUR | | | 322,107 | | | | 92,199 | | | | 0 | |
| | | | | | | | | | | | | | 1,114,633 | | | | 415,250 | |
* Non-income producing security.
** Floating rate securities' yields vary with a designated market index or market rate, such as the coupon-equivalent of the U.S. Treasury Bill rate. These securities are shown at their current rate as of June 30, 2014.
† The cost for federal income tax purposes was $163,206,101. At June 30, 2014, net unrealized appreciation for all securities based on tax cost was $7,376,922. This consisted of aggregate gross unrealized appreciation for all securities in which there was an excess of value over tax cost of $8,876,751 and aggregate gross unrealized depreciation for all securities in which there was an excess of tax cost over value of $1,499,829.
(a) Principal amount stated in U.S. dollars unless otherwise noted.
(b) All or a portion of these securities were on loan. In addition, "Other Assets and Liabilities, Net" may include pending sales that are also on loan. The value of securities loaned at June 30, 2014 amounted to $8,762,305, which is 5.4% of net assets.
(c) When-issued security.
(d) At June 30, 2014, this security has been pledged, in whole or in part, as collateral for open over-the-counter derivatives.
(e) The Fund may purchase securities that are subject to legal or contractual restrictions on resale ("restricted securities"). Restricted securities are securities which have not been registered with the Securities and Exchange Commission under the Securities Act of 1933. The Fund may be unable to sell a restricted security and it may be more difficult to determine a market value for a restricted security. Moreover, if adverse market conditions were to develop during the period between the Fund's decision to sell a restricted security and the point at which the Fund is permitted or able to sell such security, the Fund might obtain a price less favorable than the price that prevailed when it decided to sell. This investment practice, therefore, could have the effect of increasing the level of illiquidity of the Fund. The future value of these securities is uncertain and there may be changes in the estimated value of these securities.
| Schedule of Restricted Securities | Acquisition Date | | Cost ($) | | | Value ($) | | | Value as % of Net Assets | |
| Dawn Holdings, Inc. | August 2013 | | | 53,353 | | | | 44,160 | | | | 0.03 | |
(f) Affiliated fund managed by Deutsche Investment Management Americas Inc. The rate shown is the annualized seven-day yield at period end.
(g) Represents collateral held in connection with securities lending. Income earned by the Fund is net of borrower rebates.
144A: Security exempt from registration under Rule 144A of the Securities Act of 1933. These securities may be resold in transactions exempt from registration, normally to qualified institutional buyers.
PIK: Denotes that all or a portion of the income is paid in-kind in the form of additional principal.
REIT: Real Estate Investment Trust
At June 30, 2014, open credit default swap contracts sold were as follows:
| Centrally Cleared Swaps | |
Effective/ Expiration Dates | | Notional Amount ($) (h) | �� | | Fixed Cash Flows Received | | Underlying Debt Obligation/Quality Rating (i) | | Value ($) | | | Unrealized Appreciation ($) | |
10/19/2013 12/20/2018 | | | 11,880,000 | | | | 5.0 | % | Markit Dow Jones CDX North America High Yield Index | | | 1,106,046 | | | | 378,802 | |
| Bilateral Swaps | |
Effective/ Expiration Dates | | Notional Amount ($) (h) | | | Fixed Cash Flows Received | | Underlying Debt Obligation/ Quality Rating (i) | | Value ($) | | | Upfront Payments Paid/ (Received) ($) | | | Unrealized Appreciation/ (Depreciation) ($) | |
12/20/2011 3/20/2017 | | | 370,000 | 1 | | | 5.0 | % | CIT Group, Inc., 5.5%, 2/15/2019, BB– | | | 41,093 | | | | 8,486 | | | | 32,607 | |
9/30/2013 12/20/2018 | | | 300,000 | 2 | | | 5.0 | % | CSC Holdings LLC, 7.625%, 7/15/2018, BB | | | 38,566 | | | | 25,265 | | | | 13,301 | |
9/30/2013 12/20/2018 | | | 1,125,000 | 3 | | | 5.0 | % | CSC Holdings LLC, 7.625%, 7/15/2018, BB | | | 144,624 | | | | 100,063 | | | | 44,561 | |
6/20/2013 9/20/2018 | | | 245,000 | 1 | | | 5.0 | % | DISH DBS Corp., 6.75%, 6/1/2021, BB– | | | 37,264 | | | | 18,485 | | | | 18,779 | |
6/21/2010 9/20/2015 | | | 215,000 | 1 | | | 5.0 | % | Ford Motor Co., 6.5%, 8/1/2018, BBB– | | | 13,159 | | | | (19,350 | ) | | | 32,509 | |
6/21/2010 9/20/2015 | | | 105,000 | 1 | | | 5.0 | % | Ford Motor Co., 6.5%, 8/1/2018, BBB– | | | 6,426 | | | | (8,400 | ) | | | 14,826 | |
6/21/2010 9/20/2015 | | | 560,000 | 4 | | | 5.0 | % | Ford Motor Co., 6.5%, 8/1/2018, BBB– | | | 34,276 | | | | (9,983 | ) | | | 44,259 | |
6/21/2010 9/20/2015 | | | 175,000 | 3 | | | 5.0 | % | Ford Motor Co., 6.5%, 8/1/2018, BBB– | | | 10,711 | | | | (16,625 | ) | | | 27,336 | |
6/21/2010 9/20/2015 | | | 100,000 | 5 | | | 5.0 | % | Ford Motor Co., 6.5%, 8/1/2018, BBB– | | | 6,121 | | | | (6,896 | ) | | | 13,017 | |
6/20/2011 9/20/2016 | | | 575,000 | 4 | | | 5.0 | % | Ford Motor Co., 6.5%, 8/1/2018, BBB– | | | 61,378 | | | | 23,641 | | | | 37,737 | |
3/21/2011 6/20/2016 | | | 1,085,000 | 2 | | | 5.0 | % | Ford Motor Credit Co., LLC, 5.0%, 5/15/2018, BBB– | | | 103,702 | | | | 51,299 | | | | 52,403 | |
6/20/2011 9/20/2016 | | | 440,000 | 2 | | | 5.0 | % | Forest Oil Corp., 7.25%, 6/15/2019, CCC+ | | | 5,393 | | | | 7,292 | | | | (1,899 | ) |
9/20/2012 12/20/2017 | | | 485,000 | 6 | | | 5.0 | % | General Motors Corp., 3.3%, 12/20/2017, BB+ | | | 69,361 | | | | 25,038 | | | | 44,323 | |
6/20/2011 9/20/2015 | | | 1,145,000 | 5 | | | 5.0 | % | HCA, Inc., 6.375%, 1/15/2015, B– | | | 65,704 | | | | 17,820 | | | | 47,884 | |
3/21/2011 6/20/2016 | | | 610,000 | 3 | | | 5.0 | % | HCA, Inc., 6.375%, 1/15/2015, B– | | | 52,704 | | | | 9,005 | | | | 43,699 | |
6/20/2013 9/20/2018 | | | 470,000 | 5 | | | 5.0 | % | HCA, Inc., 8.0%, 10/1/2018, B– | | | 64,730 | | | | 31,728 | | | | 33,002 | |
6/20/2013 9/20/2018 | | | 730,000 | 4 | | | 5.0 | % | Sprint Communications, Inc., 6.0%, 12/1/2016, BB– | | | 89,956 | | | | 36,625 | | | | 53,331 | |
12/20/2013 3/20/2019 | | | 3,000,000 | 5 | | | 5.0 | % | Sprint Communications, Inc., 6.0%, 12/1/2016, BB– | | | 363,340 | | | | 293,847 | | | | 69,493 | |
| Total net unrealized appreciation | | | | | | | | | | | 621,168 | |
(h) The maximum potential amount of future undiscounted payments that the Fund could be required to make under a credit default swap contract would be the notional amount of the contract. These potential amounts would be partially offset by any recovery values of the referenced debt obligation or net amounts received from the settlement of buy protection credit default swap contracts entered into by the Fund for the same referenced debt obligation, if any.
(i) The quality ratings represent the higher of Moody's Investors Service, Inc. ("Moody's") or Standard & Poor's Corporation ("S&P") credit ratings and are unaudited.
Counterparties:
1 Credit Suisse
2 Barclays Bank PLC
3 JPMorgan Chase Securities, Inc.
4 Bank of America
5 Goldman Sachs & Co.
6 UBS AG
At June 30, 2014, the Fund had the following open forward foreign currency exchange contracts:
| Contracts to Deliver | | In Exchange For | | Settlement Date | | Unrealized Depreciation ($) | | Counterparty |
| EUR | | | 593,00 | | USD | | | 804,674 | | 7/25/2014 | | | (7,405 | ) | JPMorgan Chase Securities, Inc. |
| Currency Abbreviations |
EUR Euro USD United States Dollar |
For information on the Fund's policy and additional disclosures regarding credit default swap contracts and forward foreign currency exchange contracts, please refer to Note B in the accompanying Notes to Financial Statements.
Fair Value Measurements
Various inputs are used in determining the value of the Fund's investments. These inputs are summarized in three broad levels. Level 1 includes quoted prices in active markets for identical securities. Level 2 includes other significant observable inputs (including quoted prices for similar securities, interest rates, prepayment speeds and credit risk). Level 3 includes significant unobservable inputs (including the Fund's own assumptions in determining the fair value of investments). The level assigned to the securities valuations may not be an indication of the risk or liquidity associated with investing in those securities.
The following is a summary of the inputs used as of June 30, 2014 in valuing the Fund's investments. For information on the Fund's policy regarding the valuation of investments, please refer to the Security Valuation section of Note A in the accompanying Notes to Financial Statements.
| Assets | | Level 1 | | | Level 2 | | | Level 3 | | | Total | |
| | |
| Fixed Income Investments (j) | | | | | | | | | | | | |
| Corporate Bonds | | $ | — | | | $ | 143,817,721 | | | $ | 0 | | | $ | 143,817,721 | |
| Government & Agency Obligation | | | — | | | | 1,060,828 | | | | — | | | | 1,060,828 | |
| Loan Participations and Assignments | | | — | | | | 2,081,680 | | | | 0 | | | | 2,081,680 | |
| Convertible Bonds | | | — | | | | 150,981 | | | | 2,613,106 | | | | 2,764,087 | |
| Preferred Security | | | — | | | | 1,027,175 | | | | — | | | | 1,027,175 | |
| Common Stocks (j) | | | — | | | | — | | | | 64,591 | | | | 64,591 | |
| Preferred Stocks | | | — | | | | 1,142,541 | | | | — | | | | 1,142,541 | |
| Warrants (j) | | | — | | | | — | | | | 98,785 | | | | 98,785 | |
| Short-Term Investments (j) | | | 18,525,615 | | | | — | | | | — | | | | 18,525,615 | |
| Derivatives (k) | | | | | | | | | | | | | | | | |
| Credit Default Swap Contracts | | | — | | | | 1,001,869 | | | | — | | | | 1,001,869 | |
| Total | | $ | 18,525,615 | | | $ | 150,282,795 | | | $ | 2,776,482 | | | $ | 171,584,892 | |
| Liabilities | | Level 1 | | | Level 2 | | | Level 3 | | | Total | |
| | |
| Derivatives (k) | |
| Credit Default Swap Contracts | | $ | — | | | $ | (1,899 | ) | | $ | — | | | $ | (1,899 | ) |
| Forward Foreign Currency Exchange Contracts | | | — | | | | (7,405 | ) | | | — | | | | (7,405 | ) |
| Total | | $ | — | | | $ | (9,304 | ) | | $ | — | | | $ | (9,304 | ) |
There have been no transfers between fair value measurement levels during the period ended June 30, 2014.
(j) See Investment Portfolio for additional detailed categorizations.
(k) Derivatives include unrealized appreciation (depreciation) on credit default swap contracts and forward foreign currency exchange contracts.
Level 3 Reconciliation
The following is a reconciliation of the Fund's Level 3 investments for which significant unobservable inputs were used in determining value:
| | | Corporate Bonds | | | Loan Participations and Assignments | | | Convertible Bonds | | | Common Stocks | | | Warrants | | | Total | |
| Balance as of December 31, 2013 | | $ | 0 | | | $ | 0 | | | $ | 2,514,085 | | | $ | 289,546 | | | $ | 99,821 | | | $ | 2,903,452 | |
| Realized gains (loss) | | | (965,174 | ) | | | — | | | | — | | | | 44,875 | | | | — | | | | (920,299 | ) |
| Change in unrealized appreciation (depreciation) | | | 965,174 | | | | — | | | | 93,214 | | | | (42,629 | ) | | | (1,036 | ) | | | 1,014,723 | |
| Amortization of premium/accretion of discount | | | — | | | | — | | | | 5,807 | | | | — | | | | — | | | | 5,807 | |
| Purchases | | | — | | | | — | | | | — | | | | — | | | | — | | | | — | |
| (Sales) | | | — | | | | — | | | | — | | | | (227,201 | ) | | | — | | | | (227,201 | ) |
| Transfer into Level 3 | | | — | | | | — | | | | — | | | | — | | | | — | | | | — | |
| Balance as of June 30, 2014 | | $ | 0 | | | $ | 0 | | | $ | 2,613,106 | | | $ | 64,591 | | | $ | 98,785 | | | $ | 2,776,482 | |
| Net change in unrealized appreciation (depreciation) from investments still held as of June 30, 2014 | | $ | 0 | | | $ | 0 | | | $ | 93,214 | | | $ | 2,246 | | | $ | (1,036 | ) | | $ | 94,424 | |
| Quantitative Disclosure About Significant Unobservable Inputs | |
| Asset Class | | Fair Value at 6/30/14 | | Valuation Technique(s) | Unobservable Input | | Range (Weighted Average) | |
| Common Stocks | |
| Consumer Discretionary | | $ | 44,160 | | Asset Valuation | Book Value of Equity | | $3,753 per share | |
| Discount for lack of marketability | | | 20 | % |
| | | $ | 0 | | Asset Valuation | Book Value of Equity | | | 0 | % |
| Industrials | | $ | 0 | | Asset Valuation | Book Value of Equity | | | 0 | % |
| Materials | | $ | 20,431 | | Market Approach | EV/EBITDA Multiple | | | 6.37 | |
| Discount to public comparables | | | 20 | % |
| Discount for lack of marketability | | | 25 | % |
| Warrants | |
| Materials | | $ | 7,077 | | Black Scholes Option Pricing Model | Implied Volatility | | | 25.6 | % |
| | Discount for lack of marketability | | | 20 | % |
| | | $ | 91,708 | | Market Approach | EV/EBITDA Multiple | | | 6.37 | |
| | Discount to public comparables | | | 20 | % |
| | Discount for lack of marketability | | | 25 | % |
| Loan Participations & Assignments | |
| Senior Loans | | $ | 0 | | Market Approach | Evaluated Price | | | 0 | |
| Corporate Bonds | |
| Finance | | $ | 0 | | Asset Valuation | Book Value | | | 0 | |
| Convertible Bonds | |
| Consumer Discretionary | | $ | 2,613,106 | | Convertible Bond Methodology | EV/EBITDA Multiple | | | 6.37 | |
| | | | | | | Discount to public comparable | | | 20 | % |
| | | | | | | Discount for lack of marketability | | | 25 | % |
Qualitative Disclosure About Unobservable Inputs
Significant unobservable inputs developed by the Pricing Committee and used in the fair value measurement of the Fund’s equity investments include enterprise value (EV) to earnings before interest, taxes, depreciation and amortization (EBITDA) ratio with a discount for lack of marketability. A significant change in the EV to EBITDA ratio may result in a significant change in the fair value measurement, while a significant change in the discount for lack of marketability is unlikely to result in a materially higher or lower fair value measurement.
Significant unobservable inputs developed by the Pricing Committee and used in the fair value measurement of the Fund’s fixed income investments include the convertible bond methodology. A significant change in the EV to EBITDA ratio could have a material change on the fair value measurement, while a significant change in the discount for lack of marketability is unlikely to result in a materially higher or lower fair value measurement. Generally, there is an inverse relationship between the EV to EBITDA ratio and the fair value measurement of a fixed income investment.
The accompanying notes are an integral part of the financial statements.
Statement of Assets and Liabilities | as of June 30, 2014 (Unaudited) | |
| Assets | |
Investments: Investments in non-affiliated securities, at value (cost $144,680,486) — including $8,762,305 of securities loaned | | $ | 152,057,408 | |
| Investment in Daily Assets Fund Institutional (cost $9,098,382)* | | | 9,098,382 | |
| Investment in Central Cash Management Fund (cost $9,427,233) | | | 9,427,233 | |
| Total investments in securities, at value (cost $163,206,101) | | | 170,583,023 | |
| Cash | | | 21,804 | |
| Foreign currency, at value (cost $637) | | | 642 | |
| Receivable for investments sold | | | 755,066 | |
| Receivable for investments sold — when-issued/delayed delivery security | | | 268,138 | |
| Receivable for Fund shares sold | | | 7,923 | |
| Interest receivable | | | 2,389,685 | |
| Unrealized appreciation on bilateral swap contracts | | | 623,067 | |
| Upfront payments paid on bilateral swap contracts | | | 648,594 | |
| Other assets | | | 1,017 | |
| Total assets | | | 175,298,959 | |
| Liabilities | |
| Payable upon return of securities loaned | | | 9,098,382 | |
| Payable for investments purchased | | | 877,476 | |
| Payable for investments purchased — when-issued/delayed delivery security | | | 1,453,881 | |
| Payable for Fund shares redeemed | | | 276,898 | |
| Unrealized depreciation on bilateral swap contracts | | | 1,899 | |
| Unrealized depreciation on forward foreign currency exchange contracts | | | 7,405 | |
| Upfront payments received on swap contracts | | | 61,253 | |
| Accrued management fee | | | 67,242 | |
| Payable for variation margin on centrally cleared swaps | | | 12,788 | |
| Accrued Trustees' fees | | | 9 | |
| Other accrued expenses and payables | | | 100,655 | |
| Total liabilities | | | 11,957,888 | |
| Net assets, at value | | $ | 163,341,071 | |
| Net Assets Consist of | |
| Undistributed net investment income | | | 3,054,494 | |
Net unrealized appreciation (depreciation) on: Investments | | | 7,376,922 | |
| Swap contracts | | | 999,970 | |
| Foreign currency | | | (7,360 | ) |
| Accumulated net realized gain (loss) | | | (40,241,113 | ) |
| Paid-in capital | | | 192,158,158 | |
| Net assets, at value | | $ | 163,341,071 | |
Class A Net Asset Value, offering and redemption price per share ($160,221,247 ÷ 23,447,650 outstanding shares of beneficial interest, no par value, unlimited number of shares authorized) | | $ | 6.83 | |
Class B Net Asset Value, offering and redemption price per share ($3,119,824 ÷ 453,335 outstanding shares of beneficial interest, no par value, unlimited number of shares authorized) | | $ | 6.88 | |
* Represents collateral on securities loaned.
The accompanying notes are an integral part of the financial statements.
| for the six months ended June 30, 2014 (Unaudited) | |
| Investment Income | |
| Interest | | $ | 4,716,740 | |
| Dividends | | | 35,730 | |
| Income distributions — Central Cash Management Fund | | | 3,743 | |
| Securities lending income, including income from Daily Assets Fund Institutional, net of borrower rebates | | | 18,254 | |
| Total income | | | 4,774,467 | |
Expenses: Management fee | | | 407,316 | |
| Administration fee | | | 81,463 | |
| Distribution service fee (Class B) | | | 1,741 | |
| Recordkeeping fees (Class B) | | | 954 | |
| Services to shareholders | | | 892 | |
| Custodian fee | | | 15,585 | |
| Professional fees | | | 44,391 | |
| Reports to shareholders | | | 20,732 | |
| Trustees' fees and expenses | | | 4,305 | |
| Other | | | 21,526 | |
| Total expenses before expense reductions | | | 598,905 | |
| Expense reductions | | | (10,629 | ) |
| Total expenses after expense reductions | | | 588,276 | |
| Net investment income (loss) | | | 4,186,191 | |
| Realized and Unrealized Gain (Loss) | |
Net realized gain (loss) from: Investments | | | 421,661 | |
| Swap contracts | | | 487,614 | |
| Foreign currency | | | 6,059 | |
| | | | 915,334 | |
Change in net unrealized appreciation (depreciation) on: Investments | | | 3,133,624 | |
| Swap contracts | | | (15,161 | ) |
| Foreign currency | | | (4,568 | ) |
| | | | 3,113,895 | |
| Net gain (loss) | | | 4,029,229 | |
| Net increase (decrease) in net assets resulting from operations | | $ | 8,215,420 | |
The accompanying notes are an integral part of the financial statements.
Statement of Changes in Net Assets | Increase (Decrease) in Net Assets | | Six Months Ended June 30, 2014 (Unaudited) | | | Year Ended December 31, 2013 | |
Operations: Net investment income | | $ | 4,186,191 | | | $ | 9,500,105 | |
Operations: Net investment income | | $ | 4,186,191 | | | $ | 9,500,105 | |
| Net realized gain (loss) | | | 915,334 | | | | 3,917,069 | |
| Change in net unrealized appreciation (depreciation) | | | 3,113,895 | | | | (804,655 | ) |
| Net increase (decrease) in net assets resulting from operations | | | 8,215,420 | | | | 12,612,519 | |
Distributions to shareholders from: Net investment income: Class A | | | (10,554,088 | ) | | | (12,380,542 | ) |
| Class B | | | (119,183 | ) | | | (6,491 | ) |
| Total distributions | | | (10,673,271 | ) | | | (12,387,033 | ) |
Fund share transactions: Class A Proceeds from shares sold | | | 4,131,186 | | | | 37,136,318 | |
| Reinvestment of distributions | | | 10,554,088 | | | | 12,380,542 | |
| Payments for shares redeemed | | | (17,083,757 | ) | | | (63,021,014 | ) |
| Net increase (decrease) in net assets from Class A share transactions | | | (2,398,483 | ) | | | (13,504,154 | ) |
Class B Proceeds from shares sold | | | 3,059,469 | | | | 674,207 | |
| Reinvestment of distributions | | | 119,183 | | | | 6,491 | |
| Payments for shares redeemed | | | (333,255 | ) | | | (452,620 | ) |
| Net increase (decrease) in net assets from Class B share transactions | | | 2,845,397 | | | | 228,078 | |
| Increase (decrease) in net assets | | | (2,010,937 | ) | | | (13,050,590 | ) |
| Net assets at beginning of period | | | 165,352,008 | | | | 178,402,598 | |
| Net assets at end of period (including undistributed net investment income of $3,054,494 and $9,541,574, respectively) | | $ | 163,341,071 | | | $ | 165,352,008 | |
| Other Information | |
Class A Shares outstanding at beginning of period | | | 23,727,813 | | | | 25,717,511 | |
| Shares sold | | | 590,798 | | | | 5,481,259 | |
| Shares issued to shareholders in reinvestment of distributions | | | 1,575,237 | | | | 1,834,154 | |
| Shares redeemed | | | (2,446,198 | ) | | | (9,305,111 | ) |
| Net increase (decrease) in Class A shares | | | (280,163 | ) | | | (1,989,698 | ) |
| Shares outstanding at end of period | | | 23,447,650 | | | | 23,727,813 | |
Class B Shares outstanding at beginning of period | | | 46,339 | | | | 13,214 | |
| Shares sold | | | 436,688 | | | | 98,852 | |
| Shares issued to shareholders in reinvestment of distributions | | | 17,657 | | | | 955 | |
| Shares redeemed | | | (47,349 | ) | | | (66,682 | ) |
| Net increase (decrease) in Class B shares | | | 406,996 | | | | 33,125 | |
| Shares outstanding at end of period | | | 453,335 | | | | 46,339 | |
The accompanying notes are an integral part of the financial statements.
| | | | | | Years Ended December 31, | |
| Class A | | Six Months Ended 6/30/14 (Unaudited) | | | 2013 | | | 2012 | | | 2011 | | | 2010 | | | 2009 | |
| Selected Per Share Data | |
| Net asset value, beginning of period | | $ | 6.96 | | | $ | 6.93 | | | $ | 6.56 | | | $ | 6.90 | | | $ | 6.55 | | | $ | 5.30 | |
Income (loss) from investment operations: Net investment incomea | | | .18 | | | | .39 | | | | .45 | | | | .51 | | | | .52 | | | | .51 | |
| Net realized and unrealized gain (loss) | | | .16 | | | | .14 | | | | .48 | | | | (.24 | ) | | | .36 | | | | 1.40 | |
| Total from investment operations | | | .34 | | | | .53 | | | | .93 | | | | .27 | | | | .88 | | | | 1.91 | |
Less distributions from: Net investment income | | | (.47 | ) | | | (.50 | ) | | | (.56 | ) | | | (.61 | ) | | | (.53 | ) | | | (.66 | ) |
| Net asset value, end of period | | $ | 6.83 | | | $ | 6.96 | | | $ | 6.93 | | | $ | 6.56 | | | $ | 6.90 | | | $ | 6.55 | |
| Total Return (%) | | | 5.01 | b** | | | 7.91 | b | | | 14.91 | | | | 3.84 | | | | 14.00 | | | | 39.99 | |
| Ratios to Average Net Assets and Supplemental Data | |
| Net assets, end of period ($ millions) | | | 160 | | | | 165 | | | | 178 | | | | 169 | | | | 195 | | | | 197 | |
| Ratio of expenses before expense reductions (%) | | | .73 | * | | | .73 | | | | .72 | | | | .72 | | | | .72 | | | | .67 | |
| Ratio of expenses after expense reductions (%) | | | .72 | * | | | .72 | | | | .72 | | | | .72 | | | | .72 | | | | .67 | |
| Ratio of net investment income (%) | | | 5.14 | * | | | 5.69 | | | | 6.68 | | | | 7.59 | | | | 7.90 | | | | 8.81 | |
| Portfolio turnover rate (%) | | | 45 | ** | | | 58 | | | | 58 | | | | 59 | | | | 93 | | | | 66 | |
a Based on average shares outstanding during the period. b Total return would have been lower had certain expenses not been reduced. * Annualized ** Not annualized | |
| | | | | | Years Ended December 31, | |
| Class B | | Six Months Ended 6/30/14 (Unaudited) | | | 2013 | | | 2012 | | | 2011 | | | 2010 | | | 2009 | |
| Selected Per Share Data | |
| Net asset value, beginning of period | | $ | 6.99 | | | $ | 6.97 | | | $ | 6.59 | | | $ | 6.93 | | | $ | 6.58 | | | $ | 5.31 | |
Income (loss) from investment operations: Net investment incomea | | | .17 | | | | .36 | | | | .43 | | | | .49 | | | | .50 | | | | .49 | |
| Net realized and unrealized gain (loss) | | | .17 | | | | .15 | | | | .49 | | | | (.24 | ) | | | .36 | | | | 1.42 | |
| Total from investment operations | | | .34 | | | | .51 | | | | .92 | | | | .25 | | | | .86 | | | | 1.91 | |
Less distributions from: Net investment income | | | (.45 | ) | | | (.49 | ) | | | (.54 | ) | | | (.59 | ) | | | (.51 | ) | | | (.64 | ) |
| Net asset value, end of period | | $ | 6.88 | | | $ | 6.99 | | | $ | 6.97 | | | $ | 6.59 | | | $ | 6.93 | | | $ | 6.58 | |
| Total Return (%) | | | 5.04 | b** | | | 7.44 | b | | | 14.70 | b | | | 3.57 | | | | 13.64 | | | | 39.64 | |
| Ratios to Average Net Assets and Supplemental Data | |
| Net assets, end of period ($ millions) | | | 3 | | | | .3 | | | | .1 | | | | .1 | | | | .1 | | | | .2 | |
| Ratio of expenses before expense reductions (%) | | | 1.12 | * | | | 1.10 | | | | .99 | | | | .99 | | | | .99 | | | | .94 | |
| Ratio of expenses after expense reductions (%) | | | .97 | * | | | .97 | | | | .99 | | | | .99 | | | | .99 | | | | .94 | |
| Ratio of net investment income (%) | | | 4.97 | * | | | 5.29 | | | | 6.42 | | | | 7.33 | | | | 7.63 | | | | 8.54 | |
| Portfolio turnover rate (%) | | | 45 | ** | | | 58 | | | | 58 | | | | 59 | | | | 93 | | | | 66 | |
a Based on average shares outstanding during the period. b Total return would have been lower had certain expenses not been reduced. * Annualized ** Not annualized | |
Notes to Financial Statements (Unaudited)
A. Organization and Significant Accounting Policies
Deutsche High Income VIP (formerly DWS High Income VIP) (the "Fund") is a diversified series of Deutsche Variable Series II (formerly DWS Variable Series II) (the "Trust"), which is registered under the Investment Company Act of 1940, as amended (the "1940 Act"), as an open-end management investment company organized as a Massachusetts business trust.
Multiple Classes of Shares of Beneficial Interest. The Fund offers two classes of shares (Class A shares and Class B shares). Sales of Class B shares are subject to recordkeeping fees up to 0.15% and Rule 12b-1 fees under the 1940 Act equal to an annual rate of 0.25% of the average daily net assets of the Class B shares of the Fund. Class A shares are not subject to such fees.
Investment income, realized and unrealized gains and losses, and certain fund-level expenses and expense reductions, if any, are borne pro rata on the basis of relative net assets by the holders of all classes of shares except that each class bears certain expenses unique to that class (including the applicable Rule 12b-1 fee and recordkeeping fees). Differences in class-level expenses may result in payment of different per share dividends by class. All shares have equal rights with respect to voting subject to class-specific arrangements.
The Fund's financial statements are prepared in accordance with accounting principles generally accepted in the United States of America which require the use of management estimates. Actual results could differ from those estimates. The policies described below are followed consistently by the Fund in the preparation of its financial statements.
Security Valuation. Investments are stated at value determined as of the close of regular trading on the New York Stock Exchange on each day the exchange is open for trading.
Various inputs are used in determining the value of the Fund's investments. These inputs are summarized in three broad levels. Level 1 includes quoted prices in active markets for identical securities. Level 2 includes other significant observable inputs (including quoted prices for similar securities, interest rates, prepayment speeds and credit risk). Level 3 includes significant unobservable inputs (including the Fund's own assumptions in determining the fair value of investments). The level assigned to the securities valuations may not be an indication of the risk or liquidity associated with investing in those securities.
Debt securities and loan participations and assignments are valued at prices supplied by independent pricing services approved by the Fund's Board. If the pricing services are unable to provide valuations, debt securities are valued at the average of most recent reliable bid quotation or evaluated price, as applicable, obtained from broker-dealers and loan the participations and assignments are valued at the mean of the most recent bid and ask quotations or evaluated prices, as applicable, obtained from one or more broker-dealers. Such services may use various pricing techniques which take into account appropriate factors such as yield, quality, coupon rate, maturity, type of issue, trading characteristics and other data, as well as broker quotes. These securities are generally categorized as Level 2.
Equity securities are valued at the most recent sale price or official closing price reported on the exchange (U.S. or foreign) or over-the-counter market on which they trade. Securities for which no sales are reported are valued at the calculated mean between the most recent bid and asked quotations on the relevant market or, if a mean cannot be determined, at the most recent bid quotation. Equity securities are generally categorized as Level 1 securities.
Investments in open-end investment companies are valued at their net asset value each business day and are categorized as Level 1.
Forward currency contracts are valued at the prevailing forward exchange rate of the underlying currencies and are categorized as Level 2.
Swap contracts are valued daily based upon prices supplied by a Board approved pricing vendor, if available, and otherwise are valued at the price provided by the broker-dealer. Swap contracts are generally categorized as Level 2.
Securities and other assets for which market quotations are not readily available or for which the above valuation procedures are deemed not to reflect fair value are valued in a manner that is intended to reflect their fair value as determined in accordance with procedures approved by the Board and are generally categorized as Level 3. In accordance with the Fund's valuation procedures, factors considered in determining value may include, but are not limited to, the type of the security; the size of the holding; the initial cost of the security; the existence of any contractual restrictions on the security's disposition; the price and extent of public trading in similar securities of the issuer or of comparable companies; quotations or evaluated prices from broker-dealers and/or pricing services; information obtained from the issuer, analysts, and/or the appropriate stock exchange (for exchange-traded securities); an analysis of the company's or issuer's financial statements; an evaluation of the forces that influence the issuer and the market(s) in which the security is purchased and sold; and with respect to debt securities, the maturity, coupon, creditworthiness, currency denomination and the movement of the market in which the security is normally traded. The value determined under these procedures may differ from published values for the same securities.
Disclosure about the classification of fair value measurements is included in a table following the Fund's Investment Portfolio.
Foreign Currency Translations. The books and records of the Fund are maintained in U.S. dollars. Investment securities and other assets and liabilities denominated in a foreign currency are translated into U.S. dollars at the prevailing exchange rates at period end. Purchases and sales of investment securities, income and expenses are translated into U.S. dollars at the prevailing exchange rates on the respective dates of the transactions.
Net realized and unrealized gains and losses on foreign currency transactions represent net gains and losses between trade and settlement dates on securities transactions, the acquisition and disposition of foreign currencies, and the difference between the amount of net investment income accrued and the U.S. dollar amount actually received. That portion of both realized and unrealized gains and losses on investments that results from fluctuations in foreign currency exchange rates is not separately disclosed but is included with net realized and unrealized gain/appreciation and loss/depreciation on investments.
Securities Lending. Deutsche Bank AG, as lending agent, lends securities of the Fund to certain financial institutions under the terms of the Security Lending Agreement. The Fund retains the benefits of owning the securities it has loaned and continues to receive interest and dividends generated by the securities and to participate in any changes in their market value. The Fund requires the borrowers of the securities to maintain collateral with the Fund consisting of either cash or liquid, unencumbered assets having a value at least equal to the value of the securities loaned. When the collateral falls below specified amounts, the lending agent will use its best effort to obtain additional collateral on the next business day to meet required amounts under the security lending agreement. The Fund may invest the cash collateral into a joint trading account in an affiliated money market fund pursuant to Exemptive Orders issued by the SEC. The Fund receives compensation for lending its securities either in the form of fees or by earning interest on invested cash collateral net of borrower rebates and fees paid to a lending agent. Either the Fund or the borrower may terminate the loan. There may be risks of delay and costs in recovery of securities or even loss of rights in the collateral should the borrower of the securities fail financially. If the Fund is not able to recover securities lent, the Fund may sell the collateral and purchase a replacement investment in the market, incurring the risk that the value of the replacement security is greater than the value of the collateral. The Fund is also subject to all investment risks associated with the reinvestment of any cash collateral received, including, but not limited to, interest rate, credit and liquidity risk associated with such investments.
As of June 30, 2014, the Fund had securities on loan. The value of the related collateral exceeded the value of the securities loaned at period end.
Loan Participations and Assignments. Loan Participations and Assignments are portions of loans originated by banks and sold in pieces to investors. These floating-rate loans ("Loans") in which the Fund invests are arranged between the borrower and one or more financial institutions ("Lenders"). These Loans may take the form of Senior Loans, which are corporate obligations often issued in connection with recapitalizations, acquisitions, leveraged buy outs and refinancing. The Fund invests in such Loans in the form of participations in Loans ("Participations") or assignments of all or a portion of Loans from third parties ("Assignments"). Participations typically result in the Fund having a contractual relationship with only the Lender, not with the borrower. The Fund has the right to receive payments of principal, interest and any fees to which it is entitled from the Lender selling the Participation and only upon receipt by the Lender of the payments from the borrower. In connection with purchasing Participations, the Fund generally has no right to enforce compliance by the borrower with the terms of the loan agreement relating to the Loan, or any rights of set off against the borrower, and the Fund will not benefit directly from any collateral supporting the Loan in which it has purchased the Participation. As a result, the Fund assumes the credit risk of both the borrower and the Lender that is selling the Participation. Assignments typically result in the Fund having a direct contractual relationship with the borrower, and the Fund may enforce compliance by the borrower with the terms of the loan agreement. Loans held by the Fund are generally in the form of Assignments, but the Fund may also invest in Participations. All Loans involve interest rate risk, liquidity risk and credit risk, including the potential default or insolvency of the borrower.
When-Issued/Delayed Delivery Securities. The Fund may purchase securities with delivery or payment to occur at a later date beyond the normal settlement period. At the time the Fund enters into a commitment to purchase a security, the transaction is recorded and the value of the transaction is reflected in the net asset value. The price of such security and the date when the security will be delivered and paid for are fixed at the time the transaction is negotiated. The value of the security may vary with market fluctuations. At the time the Fund enters into a purchase transaction it is required to segregate cash or other liquid assets at least equal to the amount of the commitment. Additionally, the Fund may be required to post securities and/or cash collateral in accordance with the terms of the commitment.
Certain risks may arise upon entering into when-issued or delayed delivery transaction from the potential inability of counterparties to meet the terms of their contracts or if the issuer does not issue the securities due to political, economic, or other factors. Additionally, losses may arise due to changes in the value of the underlying securities.
Taxes. The Fund's policy is to comply with the requirements of the Internal Revenue Code, as amended, which are applicable to regulated investment companies and to distribute all of its taxable income to its shareholders.
Under the Regulated Investment Company Modernization Act of 2010, net capital losses incurred post-enactment may be carried forward indefinitely, and their character is retained as short-term and/or long-term. Previously, net capital losses were carried forward for eight years and treated as short-term losses. As a transition rule, the Act requires that post-enactment net capital losses be used before pre-enactment net capital losses.
At December 31, 2013, the Fund had a net tax basis capital loss carryforward of approximately $41,157,000, including $39,235,000 of pre-enactment losses, which may be applied against any realized net taxable capital gains of each succeeding year until fully utilized or until December 31, 2014 ($3,844,000), December 31, 2015 ($858,000), December 31, 2016 ($17,301,000) and December 31, 2017 ($17,232,000), the respective expiration dates, whichever occurs first; and approximately $1,922,000 of post-enactment long-term losses, which may be applied against realized net taxable capital gains indefinitely.
The Fund has reviewed the tax positions for the open tax years as of December 31, 2013 and has determined that no provision for income tax and/or uncertain tax provisions is required in the Fund's financial statements. The Fund's federal tax returns for the prior three fiscal years remain open subject to examination by the Internal Revenue Service.
Distribution of Income and Gains. Distributions from net investment income of the Fund, if any, are declared and distributed to shareholders annually. Net realized gains from investment transactions, in excess of available capital loss carryforwards, would be taxable to the Fund if not distributed and, therefore, will be distributed to shareholders at least annually. The Fund may also make additional distributions for tax purposes if necessary.
The timing and characterization of certain income and capital gain distributions are determined annually in accordance with federal tax regulations which may differ from accounting principles generally accepted in the United States of America. These differences primarily relate to investments in foreign denominated investments, investments in forward currency contracts, investments in swap contracts and certain securities sold at a loss. As a result, net investment income (loss) and net realized gain (loss) on investment transactions for a reporting period may differ significantly from distributions during such period. Accordingly, the Fund may periodically make reclassifications among certain of its capital accounts without impacting the net asset value of the Fund.
The tax character of current year distributions will be determined at the end of the current fiscal year.
Expenses. Expenses of the Trust arising in connection with a specific fund are allocated to that fund. Other Trust expenses which cannot be directly attributed to a fund are apportioned among the funds in the Trust based upon the relative net assets or other appropriate measures.
Contingencies. In the normal course of business, the Fund may enter into contracts with service providers that contain general indemnification clauses. The Fund's maximum exposure under these arrangements is unknown as this would involve future claims that may be made against the Fund that have not yet been made. However, based on experience, the Fund expects the risk of loss to be remote.
Other. Investment transactions are accounted for on a trade date plus one basis for daily net asset value calculations. However, for financial reporting purposes, investment transactions are reported on trade date. Interest income is recorded on the accrual basis. Dividend income is recorded on ex-dividend date. Realized gains and losses from investment transactions are recorded on an identified cost basis. Proceeds from litigation payments, if any, are included in net realized gain (loss) from investments. All discounts and premiums are accreted/amortized for both tax and financial reporting purposes for the Fund, with the exception of securities in default of principal.
B. Derivative Instruments
Swaps. A swap is a contract between two parties to exchange future cash flows at periodic intervals based on the notional amount of the swap. A bilateral swap is a transaction between the fund and a counterparty where cash flows are exchanged between the two parties. A centrally cleared swap is a transaction executed between the fund and a counterparty, then cleared by a clearing member through a central clearinghouse. The central clearinghouse serves as the counterparty, with whom the fund exchanges cash flows.
The value of a swap is adjusted daily, and the change in value, if any, is recorded as unrealized appreciation or depreciation in the Statement of Assets and Liabilities. Gains or losses are realized when the swap expires or is closed. Certain risks may arise when entering into swap transactions including counterparty default; liquidity; or unfavorable changes in interest rates or the value of the underlying reference security, commodity or index. In connection with bilateral swaps, securities and/or cash may be identified as collateral in accordance with the terms of the swap agreement to provide assets of value and recourse in the event of default. The maximum counterparty credit risk is the net present value of the cash flows to be received from or paid to the counterparty over the term of the swap, to the extent that this amount is beneficial to the Fund, in addition to any related collateral posted to the counterparty by the Fund. This risk may be partially reduced by a master netting arrangement between the Fund and the counterparty. Upon entering into a centrally cleared swap, the Fund is required to deposit with a financial intermediary cash or securities ("initial margin") in an amount equal to a certain percentage of the notional amount of the swap. Subsequent payments ("variation margin") are made or received by the Fund dependent upon the daily fluctuations in the value of the swap. In a cleared swap transaction, counterparty risk is minimized as the central clearinghouse acts as the counterparty.
An upfront payment, if any, made by the Fund is recorded as an asset in the Statement of Assets and Liabilities. An upfront payment, if any, received by the Fund is recorded as a liability in the Statement of Assets and Liabilities. Payments received or made at the end of the measurement period are recorded as realized gain or loss in the Statement of Operations.
Credit default swaps are agreements between a buyer and a seller of protection against predefined credit events for the reference entity. The Fund may enter into credit default swaps to gain exposure to an underlying issuer's credit quality characteristics without directly investing in that issuer or to hedge against the risk of a credit event on debt securities. As a seller of a credit default swap, the Fund is required to pay the par (or other agreed-upon) value of the referenced entity to the counterparty with the occurrence of a credit event by a third party, such as a U.S. or foreign corporate issuer, on the reference entity, which would likely result in a loss to the Fund. In return, the Fund receives from the counterparty a periodic stream of payments over the term of the swap provided that no credit event has occurred. If no credit event occurs, the Fund keeps the stream of payments with no payment obligations. The Fund may also buy credit default swaps, in which case the Fund functions as the counterparty referenced above. This involves the risk that the swap may expire worthless. It also involves counterparty risk that the seller may fail to satisfy its payment obligations to the Fund with the occurrence of a credit event. When the Fund sells a credit default swap, it will cover its commitment. This may be achieved by, among other methods, maintaining cash or liquid assets equal to the aggregate notional value of the reference entities for all outstanding credit default swaps sold by the Fund. For the six months ended June 30, 2014, the Fund entered into credit default swap agreements to gain exposure to the underlying issuer's credit quality characteristics.
Under the terms of a credit default swap, the Fund receives or makes periodic payments based on a specified interest rate on a fixed notional amount. These payments are recorded as a realized gain or loss in the Statement of Operations. Payments received or made as a result of a credit event or termination of the swap are recognized, net of a proportional amount of the upfront payment, as realized gains or losses in the Statement of Operations.
A summary of the open credit default swap contracts as of June 30, 2014 is included in a table following the Fund's Investment Portfolio. For the six months ended June 30, 2014, the Fund's investment in credit default swap contracts sold had a total notional value generally indicative of a range from $23,615,000 to $26,735,000.
Forward Foreign Currency Exchange Contracts. A forward foreign currency exchange contract ("forward currency contract") is a commitment to purchase or sell a foreign currency at the settlement date at a negotiated rate. For the six months ended June 30, 2014, the Fund entered into forward currency contracts in order to hedge its exposure to changes in foreign currency exchange rates on its foreign currency denominated portfolio holdings and to facilitate transactions in foreign currency denominated securities.
Forward currency contracts are valued at the prevailing forward exchange rate of the underlying currencies and unrealized gain (loss) is recorded daily. On the settlement date of the forward currency contract, the Fund records a realized gain or loss equal to the difference between the value of the contract at the time it was opened and the value of the contract at the time it was closed. Certain risks may arise upon entering into forward currency contracts from the potential inability of counterparties to meet the terms of their contracts. The maximum counterparty credit risk to the Fund is measured by the unrealized gain on appreciated contracts. Additionally, when utilizing forward currency contracts to hedge, the Fund gives up the opportunity to profit from favorable exchange rate movements during the term of the contract.
A summary of the open forward currency contracts as of June 30, 2014 is included in a table following the Fund's Investment Portfolio. For the six months ended June 30, 2014, the Fund's investment in forward currency contracts short vs. U.S. dollars had a total contract value generally indicative of a range from approximately $805,000 to $1,634,000.
The following tables summarize the value of the Fund's derivative instruments held as of June 30, 2014 and the related location in the accompanying Statement of Assets and Liabilities, presented by primary underlying risk exposure:
| Asset Derivative | | Swap Contracts | |
| Credit Contract (a) | | $ | 1,001,869 | |
The above derivative is located in the following Statement of Assets and Liabilities account: (a) Unrealized appreciation on swap contracts. Unsettled variation margin for centrally cleared swaps is disclosed separately within the Statement of Assets and Liabilities. | |
| Liability Derivative | | Forward Contracts | | | Swap Contracts | | | Total | |
| Credit Contracts (a) | | $ | — | | | $ | (1,899 | ) | | $ | (1,899 | ) |
| Foreign Exchange Contracts (b) | | | (7,405 | ) | | | — | | | | (7,405 | ) |
| | | $ | (7,405 | ) | | $ | (1,899 | ) | | $ | (9,304 | ) |
Each of the above derivatives is located in the following Statement of Assets and Liabilities account: (a) Unrealized depreciation on swap contracts (b) Unrealized appreciation on forward foreign currency exchange contracts | |
Additionally, the amount of unrealized and realized gains and losses on derivative instruments recognized in Fund earnings during the six months ended June 30, 2014 and the related location in the accompanying Statement of Operations is summarized in the following tables by primary underlying risk exposure:
| Realized Gain (Loss) | | Forward Contracts | | | Swap Contracts | | | Total | |
| Credit Contracts (a) | | $ | — | | | $ | 487,614 | | | $ | 487,614 | |
| Foreign Exchange Contracts (b) | | | 14,619 | | | | — | | | | 14,619 | |
| | | $ | 14,619 | | | $ | 487,614 | | | $ | 502,233 | |
Each of the above derivatives is located in the following Statement of Operations accounts: (a) Net realized gain (loss) from swap contracts (b) Net realized gain (loss) from foreign currency (Statement of Operations includes both forward currency contracts and foreign currency transactions) | |
| Change in Net Unrealized Appreciation (Depreciation) | | Forward Contracts | | | Swap Contracts | | | Total | |
| Credit Contracts (a) | | $ | — | | | $ | (15,161 | ) | | $ | (15,161 | ) |
| Foreign Exchange Contracts (b) | | | (4,552 | ) | | | — | | | | (4,552 | ) |
| | | $ | (4,552 | ) | | $ | (15,161 | ) | | $ | (19,713 | ) |
Each of the above derivatives is located in the following Statement of Operations accounts: (a) Change in net unrealized appreciation (depreciation) on swap contracts (b) Change in net unrealized appreciation (depreciation) on foreign currency (Statement of Operations includes both forward currency contracts and foreign currency transactions) | |
As of June 30, 2014, the Fund has transactions subject to enforceable master netting agreements. A reconciliation of the gross amounts on the Statement of Assets and Liabilities to the net amounts by derivative type, including any collateral exposure, is included in the following table:
| Counterparty | | Gross Amounts of Assets Presented in the Statement of Assets and Liabilities | | | Financial Instruments and Derivatives Available for Offset | | | Collateral Received | | | Net Amount of Derivative Assets | |
| Bank of America | | $ | 135,327 | | | $ | — | | | $ | — | | | $ | 135,327 | |
| Barclays Bank PLC | | | 65,704 | | | | (1,899 | ) | | | — | | | | 63,805 | |
| Credit Suisse | | | 98,721 | | | | — | | | | — | | | | 98,721 | |
| Goldman Sachs & Co. | | | 163,396 | | | | — | | | | — | | | | 163,396 | |
| JPMorgan Chase Securities, Inc. | | | 115,596 | | | | (7,405 | ) | | | — | | | | 108,191 | |
| UBS AG | | | 44,323 | | | | — | | | | — | | | | 44,323 | |
| | | $ | 623,067 | | | $ | (9,304 | ) | | $ | — | | | $ | 613,763 | |
| Counterparty | | Gross Amounts of Liabilities Presented in the Statement of Assets and Liabilities | | | Financial Instruments and Derivatives Available for Offset | | | Collateral Pledged | | | Net Amount of Derivative Liabilities | |
| Barclays Bank PLC | | $ | 1,899 | | | $ | (1,899 | ) | | $ | — | | | $ | — | |
| JPMorgan Chase Securities, Inc. | | | 7,405 | | | | (7,405 | ) | | | — | | | | — | |
| | | $ | 9,304 | | | $ | (9,304 | ) | | $ | — | | | $ | — | |
C. Purchases and Sales of Securities
During the six months ended June 30, 2014, purchases and sales of investment transactions (excluding short-term investments and U.S. Treasury securities) aggregated $68,556,490 and $60,116,213, respectively. Purchases and sales of U.S. Treasury obligations aggregated $1,062,179 and $5,838,862, respectively.
D. Related Parties
Management Agreement. Under the Investment Management Agreement with Deutsche Investment Management Americas Inc. ("DIMA" or the "Advisor"), an indirect, wholly owned subsidiary of Deutsche Bank AG, the Advisor directs the investments of the Fund in accordance with its investment objectives, policies and restrictions. The Advisor determines the securities, instruments and other contracts relating to investments to be purchased, sold or entered into by the Fund.
Pursuant to the Investment Management Agreement with the Advisor, the Fund pays a monthly management fee based on the Fund's average daily net assets, computed and accrued daily and payable monthly, at the following annual rates:
| First $250 million | | | .500 | % |
| Next $750 million | | | .470 | % |
| Next $1.5 billion | | | .450 | % |
| Next $2.5 billion | | | .430 | % |
| Next $2.5 billion | | | .400 | % |
| Next $2.5 billion | | | .380 | % |
| Next $2.5 billion | | | .360 | % |
| Over $12.5 billion | | | .340 | % |
Accordingly, for the six months ended June 30, 2014, the fee pursuant to the Investment Management Agreement was equivalent to an annualized effective rate (exclusive of any applicable waivers/reimbursements) of 0.50% of the Fund's average daily net assets.
For the period from January 1, 2014 through September 30, 2014, the Advisor has contractually agreed to waive all or a portion of its fees and/or reimburse certain operating expenses of the Fund to the extent necessary to maintain the operating expenses (excluding certain expenses such as extraordinary expenses, taxes, brokerage and interest) of each class as follows:
For the six months ended June 30, 2014, fees waived and/or expenses reimbursed for each class are as follows:
| Class A | | $ | 9,583 | |
| Class B | | | 1,046 | |
| | | $ | 10,629 | |
Administration Fee. Pursuant to an Administrative Services Agreement, DIMA provides most administrative services to the Fund. For all services provided under the Administrative Services Agreement, the Fund pays DIMA an annual fee ("Administration Fee") of 0.10% of the Fund's average daily net assets, computed and accrued daily and payable monthly. For the six months ended June 30, 2014, the Administration Fee was $81,463, of which $13,474 is unpaid.
Service Provider Fees. DeAWM Service Company ("DSC"), an affiliate of the Advisor, is the transfer agent, dividend-paying agent and shareholder service agent for the Fund. Pursuant to a sub-transfer agency agreement between DSC and DST Systems, Inc. ("DST"), DSC has delegated certain transfer agent, dividend-paying agent and shareholder service agent functions to DST. DSC compensates DST out of the shareholder servicing fee it receives from the Fund. For the six months ended June 30, 2014, the amounts charged to the Fund by DSC were as follows:
| Services to Shareholders | | Total Aggregated | | | Unpaid at June 30, 2014 | |
| Class A | | $ | 147 | | | $ | 72 | |
| Class B | | | 20 | | | | 5 | |
| | | $ | 167 | | | $ | 77 | |
Distribution Service Agreement. Under the Fund's Class B 12b-1 plans, DeAWM Distributors, Inc. ("DDI") received a fee ("Distribution Service Fee") of 0.25% of average daily net assets of Class B shares. For the six months ended June 30, 2014, the Distribution Service Fee was $1,741, of which $641 is unpaid.
Typesetting and Filing Service Fees. Under an agreement with DIMA, DIMA is compensated for providing typesetting and certain regulatory filing services to the Fund. For the six months ended June 30, 2014, the amount charged to the Fund by DIMA included in the Statement of Operations under "reports to shareholders" aggregated $9,750, of which $3,084 is unpaid.
Trustees' Fees and Expenses. The Fund paid retainer fees to each Trustee not affiliated with the Advisor, plus specified amounts to the Board Chairperson and Vice Chairperson and to each committee Chairperson.
Affiliated Cash Management Vehicles. The Fund may invest uninvested cash balances in Central Cash Management Fund and Deutsche Variable NAV Money Fund, affiliated money market funds which are managed by the Advisor. Each affiliated money market fund seeks to provide a high level of current income consistent with liquidity and the preservation of capital. Each affiliated money market fund is managed in accordance with Rule 2a-7 under the Investment Company Act of 1940, which governs the quality, maturity, diversity and liquidity of instruments in which a money market fund may invest. Central Cash Management Fund seeks to maintain a stable net asset value, and Deutsche Variable NAV Money Fund maintains a floating net asset value. The Fund indirectly bears its proportionate share of the expenses of each affiliated money market fund in which it invests. Central Cash Management Fund does not pay the Advisor an investment management fee. To the extent that Deutsche Variable NAV Money Fund pays an investment management fee to the Advisor, the Advisor will waive an amount of the investment management fee payable to the Advisor by the Fund equal to the amount of the investment management fee payable on the Fund's assets invested in Deutsche Variable NAV Money Fund.
Security Lending Fees. Deutsche Bank AG serves as lending agent for the Fund. For the six months ended June 30, 2014, the Fund incurred lending agent fees to Deutsche Bank AG for the amount of $1,608.
E. Investing in High-Yield Securities
The Fund's performance could be hurt if a security declines in credit quality or goes into default, or if an issuer does not make timely payments of interest or principal. Because the issuers of high-yield debt securities or junk bonds (debt securities rated below the fourth-highest category) may be in uncertain financial health, the risk of loss from default by the issuer is significantly greater. Prices and yields of high-yield securities will fluctuate over time and, during periods of economic uncertainty, volatility of high-yield securities may adversely affect a fund's net asset value. Because the Fund may invest in securities not paying current interest or in securities already in default, these risks may be more pronounced.
F. Ownership of the Fund
At June 30, 2014, two participating insurance companies were owners of record of 10% or more of the total outstanding Class A shares of the Fund, each owning 61% and 29%. One participating insurance company was the owner of record of 10% or more of the total outstanding Class B shares of the Fund, owning 97%.
G. Line of Credit
The Fund and other affiliated funds (the "Participants") share in a $400 million revolving credit facility provided by a syndication of banks. The Fund may borrow for temporary or emergency purposes, including the meeting of redemption requests that otherwise might require the untimely disposition of securities. The Participants are charged an annual commitment fee which is allocated based on net assets, among each of the Participants. Interest is calculated at a rate per annum equal to the sum of the Federal Funds Rate plus 1.25 percent plus if LIBOR exceeds the Federal Funds Rate the amount of such excess. The Fund may borrow up to a maximum of 33 percent of its net assets under the agreement. The Fund had no outstanding loans at June 30, 2014.
H. Fund Name Change
Effective August 11, 2014, the "DWS Funds" were rebranded "Deutsche Funds."
Information About Your Fund's Expenses (Unaudited)
As an investor of the Fund, you incur two types of costs: ongoing expenses and transaction costs. Ongoing expenses include management fees, distribution and service (12b-1) fees and other Fund expenses. Examples of transaction costs include contract charges, redemption fees and account maintenance fees, which are not shown in this section. The following tables are intended to help you understand your ongoing expenses (in dollars) of investing in the Fund and to help you compare these expenses with the ongoing expenses of investing in other mutual funds. In the most recent six-month period, the Fund limited these expenses; had it not done so, expenses would have been higher. The example in the table is based on an investment of $1,000 invested at the beginning of the six-month period and held for the entire period (January 1, 2014 to June 30, 2014).
The tables illustrate your Fund's expenses in two ways:
—Actual Fund Return. This helps you estimate the actual dollar amount of ongoing expenses (but not transaction costs) paid on a $1,000 investment in the Fund using the Fund's actual return during the period. To estimate the expenses you paid over the period, simply divide your account value by $1,000 (for example, an $8,600 account value divided by $1,000 = 8.6), then multiply the result by the number in the "Expenses Paid per $1,000" line under the share class you hold.
—Hypothetical 5% Fund Return. This helps you to compare your Fund's ongoing expenses (but not transaction costs) with those of other mutual funds using the Fund's actual expense ratio and a hypothetical rate of return of 5% per year before expenses. Examples using a 5% hypothetical Fund return may be found in the shareholder reports of other mutual funds. The hypothetical account values and expenses may not be used to estimate the actual ending account balance or expenses you paid for the period.
Please note that the expenses shown in these tables are meant to highlight your ongoing expenses only and do not reflect any transaction costs. The "Expenses Paid per $1,000" line of the tables is useful in comparing ongoing expenses only and will not help you determine the relative total expense of owning different funds. If these transaction costs had been included, your costs would have been higher.
Expenses and Value of a $1,000 Investment for the six months ended June 30, 2014 | |
| Actual Fund Return | | Class A | | | Class B | |
| Beginning Account Value 1/1/14 | | $ | 1,000.00 | | | $ | 1,000.00 | |
| Ending Account Value 6/30/14 | | $ | 1,050.10 | | | $ | 1,050.40 | |
| Expenses Paid per $1,000* | | $ | 3.66 | | | $ | 4.93 | |
| Hypothetical 5% Fund Return | | Class A | | | Class B | |
| Beginning Account Value 1/1/14 | | $ | 1,000.00 | | | $ | 1,000.00 | |
| Ending Account Value 6/30/14 | | $ | 1,021.22 | | | $ | 1.019.98 | |
| Expenses Paid per $1,000* | | $ | 3.61 | | | $ | 4.86 | |
* Expenses are equal to the Fund's annualized expense ratio for each share class, multiplied by the average account value over the period, multiplied by 181 (the number of days in the most recent six-month period), then divided by 365.
| Annualized Expense Ratios | Class A | | Class B | |
| Deutsche Variable Series II — Deutsche High Income VIP | .72% | | .97% | |
For more information, please refer to the Fund's prospectus.
These tables do not reflect charges and fees ("contract charges") associated with the separate account that invests in the Fund or any variable life insurance policy or variable annuity contract for which the Fund is an investment option.
For an analysis of the fees associated with an investment in the fund or similar funds, please refer to the current and hypothetical expense calculators for Variable Insurance Products which can be found at deutschefunds.com/EN/resources/calculators.jsp.
The Trust's policies and procedures for voting proxies for portfolio securities and information about how the Trust voted proxies related to its portfolio securities during the 12-month period ended June 30 are available on our Web site — deutschefunds.com (click on "proxy voting" at the bottom of the page) — or on the SEC's Web site — sec.gov. To obtain a written copy of the Trust's policies and procedures without charge, upon request, call us toll free at (800) 728-3337.
Advisory Agreement Board Considerations and Fee Evaluation
The Board of Trustees approved the renewal of DWS High Income VIP's investment management agreement (the "Agreement") with Deutsche Investment Management Americas Inc. ("DIMA") in September 2013.
In terms of the process that the Board followed prior to approving the Agreement, shareholders should know that:
— In September 2013, all but one of the Fund's Trustees were independent of DIMA and its affiliates.
— The Trustees met frequently during the past year to discuss fund matters and dedicated a substantial amount of time to contract review matters. Over the course of several months, the Board's Contract Committee, in coordination with the Board's Fixed Income and Asset Allocation Oversight Committee, reviewed comprehensive materials received from DIMA, independent third parties and independent counsel. These materials included an analysis of the Fund's performance, fees and expenses, and profitability compiled by a fee consultant retained by the Fund's Independent Trustees (the "Fee Consultant"). The Board also received extensive information throughout the year regarding performance of the Fund.
—The Independent Trustees regularly meet privately with their independent counsel to discuss contract review and other matters. In addition, the Independent Trustees were also advised by the Fee Consultant in the course of their review of the Fund's contractual arrangements and considered a comprehensive report prepared by the Fee Consultant in connection with their deliberations.
— In connection with reviewing the Agreement, the Board also reviewed the terms of the Fund's Rule 12b-1 plan, distribution agreement, administrative services agreement, transfer agency agreement and other material service agreements.
— Based on its evaluation of the information provided, the Contract Committee presented its findings and recommendations to the Board. The Board then reviewed the Contract Committee's findings and recommendations.
In connection with the contract review process, the Contract Committee and the Board considered the factors discussed below, among others. The Board also considered that DIMA and its predecessors have managed the Fund since its inception, and the Board believes that a long-term relationship with a capable, conscientious advisor is in the best interests of the Fund. The Board considered, generally, that shareholders chose to invest or remain invested in the Fund knowing that DIMA managed the Fund, and that the Agreement was approved by the Fund's shareholders. DIMA is part of Deutsche Bank AG, a major global banking institution that is engaged in a wide range of financial services. The Board believes that there are advantages to being part of a global asset management business that offers a wide range of investing expertise and resources, including hundreds of portfolio managers and analysts with research capabilities in many countries throughout the world.
As part of the contract review process, the Board carefully considered the fees and expenses of each DWS fund overseen by the Board in light of the fund's performance. In many cases, this led to a negotiation with DIMA of lower expense caps as part of the 2012 and 2013 contract review processes than had previously been in place. As part of these negotiations, the Board indicated that it would consider relaxing these new lower caps in future years following sustained improvements in performance, among other considerations.
In June 2012, Deutsche Bank AG ("DB"), DIMA's parent company, announced that DB would combine its Asset Management (of which DIMA was a part) and Wealth Management divisions. DB has advised the Independent Trustees that the U.S. asset management business is a critical and integral part of DB, and that it has, and will continue to, reinvest a significant portion of the substantial savings it expects to realize by combining its Asset Management and Wealth Management divisions into the new Asset and Wealth Management ("AWM") division, including ongoing enhancements to its investment capabilities. DB also has confirmed its commitment to maintaining strong legal and compliance groups within the AWM division.
While shareholders may focus primarily on fund performance and fees, the Fund's Board considers these and many other factors, including the quality and integrity of DIMA's personnel and such other issues as back-office operations, fund valuations, and compliance policies and procedures.
Nature, Quality and Extent of Services. The Board considered the terms of the Agreement, including the scope of advisory services provided under the Agreement. The Board noted that, under the Agreement, DIMA provides portfolio management services to the Fund and that, pursuant to a separate administrative services agreement, DIMA provides administrative services to the Fund. The Board considered the experience and skills of senior management and investment personnel, the resources made available to such personnel, the ability of DIMA to attract and retain high-quality personnel, and the organizational depth and stability of DIMA. The Board reviewed the Fund's performance over short-term and long-term periods and compared those returns to various agreed-upon performance measures, including market indices and a peer universe compiled by the Fee Consultant using information supplied by Morningstar Direct ("Morningstar"), an independent fund data service. The Board also noted that it has put into place a process of identifying "Focus Funds" (e.g., funds performing poorly relative to their benchmark or a peer universe compiled by an independent fund data service), and receives more frequent reporting and information from DIMA regarding such funds, along with DIMA's remedial plans to address underperformance. The Board believes this process is an effective manner of identifying and addressing underperforming funds. Based on the information provided, the Board noted that for the one-, three- and five-year periods ended December 31, 2012, the Fund's performance (Class A shares) was in the 2nd quartile, 3rd quartile and 3rd quartile, respectively, of the applicable Morningstar universe (the 1st quartile being the best performers and the 4th quartile being the worst performers). The Board also observed that the Fund has outperformed its benchmark in the one-year period and has underperformed its benchmark in the three- and five-year periods ended December 31, 2012.
Fees and Expenses. The Board considered the Fund's investment management fee schedule, operating expenses and total expense ratios, and comparative information provided by Lipper Inc. ("Lipper") and the Fee Consultant regarding investment management fee rates paid to other investment advisors by similar funds (1st quartile being the most favorable and 4th quartile being the least favorable). With respect to management fees paid to other investment advisors by similar funds, the Board noted that the contractual fee rates paid by the Fund, which include a 0.10% fee paid to DIMA under the Fund's administrative services agreement, were lower than the median (1st quartile) of the applicable Lipper peer group (based on Lipper data provided as of December 31, 2012). The Board noted that the Fund's Class A shares total (net) operating expenses were expected to be equal to the median of the applicable Lipper expense universe (based on Lipper data provided as of December 31, 2012, and analyzing Lipper expense universe Class A (net) expenses less any applicable 12b-1 fees) ("Lipper Universe Expenses"). The Board also reviewed data comparing each share class's total (net) operating expenses to the applicable Lipper Universe Expenses. The Board considered the Fund's management fee rate as compared to fees charged by DIMA to comparable funds and considered differences between the Fund and the comparable funds. The Board also considered how the Fund's total (net) operating expenses compared to the total (net) operating expenses of a more customized peer group selected by Lipper (based on such factors as asset size). The Board also noted that the expense limitations agreed to by DIMA helped to ensure that the Fund's total (net) operating expenses would remain competitive.
The information considered by the Board as part of its review of management fees included information regarding fees charged by DIMA and its affiliates to similar institutional accounts and to similar funds offered primarily to European investors ("DWS Europe funds"), in each case as applicable. The Board observed that advisory fee rates for institutional accounts generally were lower than the management fees charged by similarly managed DWS U.S. mutual funds ("DWS Funds"), but also took note of the differences in services provided to DWS Funds as compared to institutional accounts. In the case of DWS Europe funds, the Board observed that fee rates for DWS Europe funds generally were higher than for similarly managed DWS Funds, but noted that differences in the types of services provided to DWS Funds relative to DWS Europe funds made it difficult to compare such fees.
On the basis of the information provided, the Board concluded that management fees were reasonable and appropriate in light of the nature, quality and extent of services provided by DIMA.
Profitability. The Board reviewed detailed information regarding revenues received by DIMA under the Agreement. The Board considered the estimated costs and pre-tax profits realized by DIMA from advising the DWS Funds, as well as estimates of the pre-tax profits attributable to managing the Fund in particular. The Board also received information regarding the estimated enterprise-wide profitability of DWS and its affiliates with respect to all fund services in totality and by fund. The Board and the Fee Consultant reviewed DIMA's methodology in allocating its costs to the management of the Fund. Based on the information provided, the Board concluded that the pre-tax profits realized by DIMA in connection with the management of the Fund were not unreasonable. The Board also reviewed information regarding the profitability of certain similar investment management firms. The Board noted that while information regarding the profitability of such firms is limited (and in some cases is not necessarily prepared on a comparable basis), DIMA and its affiliates' overall profitability with respect to the DWS fund complex (after taking into account distribution and other services provided to the funds by DIMA and its affiliates) was lower than the overall profitability levels of many comparable firms for which such data was available.
Economies of Scale. The Board considered whether there are economies of scale with respect to the management of the Fund and whether the Fund benefits from any economies of scale. The Board noted that the Fund's management fee schedule includes fee breakpoints. The Board concluded that the Fund's fee schedule represents an appropriate sharing between the Fund and DIMA of such economies of scale as may exist in the management of the Fund at current asset levels.
Other Benefits to DIMA and Its Affiliates. The Board also considered the character and amount of other incidental benefits received by DIMA and its affiliates, including any fees received by DIMA for administrative services provided to the Fund and any fees received by an affiliate of DIMA for distribution services. The Board also considered benefits to DIMA related to brokerage and soft-dollar allocations, including allocating brokerage to pay for research generated by parties other than the executing broker dealers, which pertain primarily to funds investing in equity securities, along with the incidental public relations benefits to DIMA related to DWS Funds advertising and cross-selling opportunities among DIMA products and services. The Board concluded that management fees were reasonable in light of these fallout benefits.
Compliance. The Board considered the significant attention and resources dedicated by DIMA to documenting and enhancing its compliance processes in recent years. The Board noted in particular (i) the experience and seniority of both DIMA's chief compliance officer and the Fund's chief compliance officer; (ii) the large number of DIMA compliance personnel; and (iii) the substantial commitment of resources by DIMA and its affiliates to compliance matters.
Based on all of the information considered and the conclusions reached, the Board unanimously determined that the continuation of the Agreement is in the best interests of the Fund. In making this determination, the Board did not give particular weight to any single factor identified above. The Board considered these factors over the course of numerous meetings, certain of which were in executive session with only the Independent Trustees and their independent counsel present. It is possible that individual Trustees may have weighed these factors differently in reaching their individual decisions to approve the continuation of the Agreement.
Notes
DeAWM Distributors, Inc.
222 South Riverside Plaza
Chicago, IL 60606
(800) 621-1148
VS2HI-3 (R-028385-3 8/14)
June 30, 2014
Semiannual Report
Deutsche Variable Series II
(formerly DWS Variable Series II)
Deutsche Large Cap Value VIP
(formerly DWS Large Cap Value VIP)
Contents
5 Portfolio Management Team 9 Statement of Assets and Liabilities 9 Statement of Operations 10 Statement of Changes in Net Assets 13 Notes to Financial Statements 17 Information About Your Fund's Expenses 19 Advisory Agreement Board Considerations and Fee Evaluation |
This report must be preceded or accompanied by a prospectus. To obtain an additional prospectus or summary prospectus, if available, call (800) 728-3337 or your financial representative. We advise you to consider the Fund's objectives, risks, charges and expenses carefully before investing. The summary prospectus and prospectus contain this and other important information about the Fund. Please read the prospectus carefully before you invest.
Investing in derivatives entails special risks relating to liquidity, leverage and credit that may reduce returns and/or increase volatility. The Fund may lend securities to approved institutions. Stocks may decline in value. See the prospectus for details.
Deutsche Asset & Wealth Management represents the asset management and wealth management activities conducted by Deutsche Bank AG or any of its subsidiaries, including the Advisor and DeAWM Distributors, Inc.
NOT FDIC/NCUA INSURED NO BANK GUARANTEE MAY LOSE VALUE NOT A DEPOSIT
NOT INSURED BY ANY FEDERAL GOVERNMENT AGENCY
Dear Shareholder:
I am very pleased to tell you that the DWS funds have been renamed Deutsche funds, aligning more closely with the Deutsche Asset & Wealth Management brand. We are proud to adopt the Deutsche name — a brand that fully represents the global access, discipline and intelligence that support all of our products and services.
Deutsche Asset & Wealth Management combines the asset management and wealth management divisions of Deutsche Bank to deliver a comprehensive suite of active, passive and alternative investment capabilities. Your investment in the Deutsche funds means you have access to the thought leadership and resources of one of the world’s largest and most influential financial institutions.
In conjunction with your fund’s name change, please note that the Deutsche funds’ Web address has changed as well. The former dws-investments.com is now deutschefunds.com.
In addition, key service providers have been renamed as follows:
| Former Name | New name, effective August 11, 2014 |
| DWS Investments Distributors, Inc. | DeAWM Distributors, Inc. |
| DWS Trust Company | DeAWM Trust Company |
| DWS Investments Service Company | DeAWM Service Company |
These changes have no effect on the day-to-day management of your investment, and there is no action required on your part. You will continue to experience the benefits that come from our decades of experience, in-depth research and worldwide network of investment professionals.
Thanks for your continued support. We appreciate your trust and the opportunity to put our capabilities to work for you.
Best regards,
Brian Binder
President, Deutsche Funds
Performance Summary June 30, 2014 (Unaudited)
Fund performance shown is historical, assumes reinvestment of all dividend and capital gain distributions and does not guarantee future results. Investment return and principal value fluctuate with changing market conditions so that, when redeemed, shares may be worth more or less than their original cost. Current performance may be lower or higher than the performance data quoted. Please contact your participating insurance company for the Fund's most recent month-end performance. Performance doesn't reflect charges and fees ("contract charges") associated with the separate account that invests in the Fund or any variable life insurance policy or variable annuity contract for which the Fund is an investment option. These charges and fees will reduce returns. While all share classes have the same underlying portfolio, their performance will differ.
The gross expense ratios of the Fund, as stated in the fee table of the prospectus dated May 1, 2014 are 0.78% and 1.09% for Class A and Class B shares, respectively, and may differ from the expense ratios disclosed in the Financial Highlights tables in this report.
| Growth of an Assumed $10,000 Investment in Deutsche Large Cap Value VIP |
| The Russell 1000® Value Index is an unmanaged index that consists of those stocks in the Russell 1000® Index with less-than-average growth orientation. The Russell 1000® Index is an unmanaged price-only index of the 1,000 largest capitalized companies that are domiciled in the U.S. and whose common stocks are traded. Index returns do not reflect any fees or expenses and it is not possible to invest directly into an index. |
| |
| Yearly periods ended June 30 | |
| Comparative Results | |
| Deutsche Large Cap Value VIP | | 6-Month‡ | | | 1-Year | | | 3-Year | | | 5-Year | | | 10-Year | |
| Class A | Growth of $10,000 | | $ | 10,753 | | | $ | 12,293 | | | $ | 14,499 | | | $ | 20,017 | | | $ | 19,495 | |
| Average annual total return | | | 7.53 | % | | | 22.93 | % | | | 13.18 | % | | | 14.89 | % | | | 6.90 | % |
Russell 1000® Value Index | Growth of $10,000 | | $ | 10,828 | | | $ | 12,381 | | | $ | 15,982 | | | $ | 24,095 | | | $ | 21,641 | |
| Average annual total return | | | 8.28 | % | | | 23.81 | % | | | 16.92 | % | | | 19.23 | % | | | 8.03 | % |
| Deutsche Large Cap Value VIP | | 6-Month‡ | | | 1-Year | | | 3-Year | | | 5-Year | | | 10-Year | |
| Class B | Growth of $10,000 | | $ | 10,731 | | | $ | 12,257 | | | $ | 14,362 | | | $ | 19,716 | | | $ | 18,842 | |
| Average annual total return | | | 7.31 | % | | | 22.57 | % | | | 12.83 | % | | | 14.54 | % | | | 6.54 | % |
Russell 1000® Value Index | Growth of $10,000 | | $ | 10,828 | | | $ | 12,381 | | | $ | 15,982 | | | $ | 24,095 | | | $ | 21,641 | |
| Average annual total return | | | 8.28 | % | | | 23.81 | % | | | 16.92 | % | | | 19.23 | % | | | 8.03 | % |
The growth of $10,000 is cumulative.
‡ Total returns shown for periods less than one year are not annualized.
Portfolio Summary (Unaudited) Asset Allocation (As a % of Investment Portfolio excluding Securities Lending Collateral) | 6/30/14 | 12/31/13 |
| | | |
| Common Stocks | 96% | 99% |
| Cash Equivalents | 4% | 1% |
| | 100% | 100% |
Sector Diversification (As a % of Common Stocks) | 6/30/14 | 12/31/13 |
| | | |
| Financials | 22% | 24% |
| Health Care | 18% | 14% |
| Energy | 16% | 14% |
| Information Technology | 13% | 11% |
| Consumer Staples | 8% | 11% |
| Consumer Discretionary | 6% | 8% |
| Industrials | 6% | 7% |
| Utilities | 6% | 5% |
| Telecommunication Services | 3% | 2% |
| Materials | 2% | 4% |
| | 100% | 100% |
Portfolio holdings and characteristics are subject to change.
For more complete details about the Fund's investment portfolio, see page 6.
Following the Fund's fiscal first and third quarter-end, a complete portfolio holdings listing is filed with the SEC on Form N-Q. The form will be available on the SEC's Web site at sec.gov, and it also may be reviewed and copied at the SEC's Public Reference Room in Washington, D.C. Information on the operation of the SEC's Public Reference Room may be obtained by calling (800) SEC-0330. The Fund's portfolio holdings are also posted on deutschefunds.com from time to time. Please see the Fund's current prospectus for more information.
Portfolio Management Team
Thomas Schuessler, PhD
Lead Portfolio Manager
Peter Steffen, CFA
Oliver Pfeil, PhD
Portfolio Managers
Investment Portfolio June 30, 2014 (Unaudited) | | | Shares | | | Value ($) | |
| | | | |
| Common Stocks 96.4% | |
| Consumer Discretionary 6.3% | |
| Automobiles 0.8% | |
| Ford Motor Co. | | | 200,000 | | | | 3,448,000 | |
| Hotels, Restaurants & Leisure 0.9% | |
| McDonald's Corp. | | | 40,000 | | | | 4,029,600 | |
| Household Durables 0.9% | |
| Jarden Corp.* | | | 30,000 | | | | 1,780,500 | |
| MDC Holdings, Inc. (a) | | | 75,000 | | | | 2,271,750 | |
| | | | | | | | 4,052,250 | |
| Media 3.4% | |
| Comcast Corp. "A" | | | 170,000 | | | | 9,125,600 | |
| News Corp. "A"* | | | 100,000 | | | | 1,794,000 | |
| Time Warner, Inc. | | | 30,000 | | | | 2,107,500 | |
| Walt Disney Co. | | | 27,500 | | | | 2,357,850 | |
| | | | | | | | 15,384,950 | |
| Textiles, Apparel & Luxury Goods 0.3% | |
| Columbia Sportswear Co. | | | 13,615 | | | | 1,125,280 | |
| Consumer Staples 7.6% | |
| Beverages 1.3% | |
| PepsiCo, Inc. | | | 67,500 | | | | 6,030,450 | |
| Food & Staples Retailing 2.0% | |
| CVS Caremark Corp. | | | 55,000 | | | | 4,145,350 | |
| Sysco Corp. (a) | | | 50,000 | | | | 1,872,500 | |
| Walgreen Co. | | | 37,500 | | | | 2,779,875 | |
| | | | | | | | 8,797,725 | |
| Food Products 1.0% | |
| Kellogg Co. | | | 40,000 | | | | 2,628,000 | |
| Tyson Foods, Inc. "A" | | | 45,000 | | | | 1,689,300 | |
| | | | | | | | 4,317,300 | |
| Household Products 2.5% | |
| Energizer Holdings, Inc. | | | 20,000 | | | | 2,440,600 | |
| Procter & Gamble Co. | | | 112,500 | | | | 8,841,375 | |
| | | | | | | | 11,281,975 | |
| Tobacco 0.8% | |
| Altria Group, Inc. | | | 90,000 | | | | 3,774,600 | |
| Energy 15.4% | |
| Energy Equipment & Services 1.1% | |
| Diamond Offshore Drilling, Inc. (a) | | | 50,000 | | | | 2,481,500 | |
| National Oilwell Varco, Inc. | | | 32,500 | | | | 2,676,375 | |
| | | | | | | | 5,157,875 | |
| Oil, Gas & Consumable Fuels 14.3% | |
| Apache Corp. | | | 55,000 | | | | 5,534,100 | |
| ARC Resources Ltd. (a) | | | 49,896 | | | | 1,519,255 | |
| Canadian Oil Sands Ltd. | | | 180,000 | | | | 4,078,909 | |
| Chevron Corp. | | | 82,500 | | | | 10,770,375 | |
| ConocoPhillips | | | 42,500 | | | | 3,643,525 | |
| Devon Energy Corp. | | | 40,000 | | | | 3,176,000 | |
| Exxon Mobil Corp. | | | 165,000 | | | | 16,612,200 | |
| Hess Corp. (a) | | | 25,000 | | | | 2,472,250 | |
| Occidental Petroleum Corp. | | | 87,500 | | | | 8,980,125 | |
| Parkland Fuel Corp. (a) | | | 57,100 | | | | 1,100,207 | |
| Phillips 66 | | | 35,000 | | | | 2,815,050 | |
| Suncor Energy, Inc. | | | 75,000 | | | | 3,197,250 | |
| | | | | | | | 63,899,246 | |
| | | Shares | | | Value ($) | |
| | | | | | | | | |
| Financials 20.9% | |
| Banks 10.8% | |
| Bank of America Corp. | | | 350,000 | | | | 5,379,500 | |
| Canadian Imperial Bank of Commerce (a) | | | 40,000 | | | | 3,639,942 | |
| Citigroup, Inc. | | | 200,000 | | | | 9,420,000 | |
| JPMorgan Chase & Co. | | | 200,000 | | | | 11,524,000 | |
| PNC Financial Services Group, Inc. | | | 90,000 | | | | 8,014,500 | |
| U.S. Bancorp. | | | 75,000 | | | | 3,249,000 | |
| Wells Fargo & Co. | | | 135,000 | | | | 7,095,600 | |
| | | | | | | | 48,322,542 | |
| Capital Markets 2.4% | |
| Bank of New York Mellon Corp. | | | 70,000 | | | | 2,623,600 | |
| BlackRock, Inc. | | | 7,000 | | | | 2,237,200 | |
| Franklin Resources, Inc. | | | 62,500 | | | | 3,615,000 | |
| Legg Mason, Inc. (a) | | | 47,500 | | | | 2,437,225 | |
| | | | | | | | 10,913,025 | |
| Consumer Finance 1.3% | |
| Capital One Financial Corp. | | | 70,000 | | | | 5,782,000 | |
| Insurance 6.0% | |
| ACE Ltd. | | | 20,000 | | | | 2,074,000 | |
| Allstate Corp. | | | 47,500 | | | | 2,789,200 | |
| American International Group, Inc. | | | 52,500 | | | | 2,865,450 | |
| Fidelity National Financial, Inc. "A" | | | 65,000 | | | | 2,129,400 | |
| First American Financial Corp. | | | 77,500 | | | | 2,153,725 | |
| PartnerRe Ltd. | | | 27,500 | | | | 3,003,275 | |
| Prudential Financial, Inc. | | | 75,000 | | | | 6,657,750 | |
| The Travelers Companies, Inc. | | | 42,500 | | | | 3,997,975 | |
| Unum Group | | | 29,260 | | | | 1,017,078 | |
| | | | | | | | 26,687,853 | |
| Real Estate Management & Development 0.4% | |
| Brookfield Asset Management, Inc. "A" (a) | | | 40,000 | | | | 1,760,800 | |
| Health Care 17.4% | |
| Biotechnology 1.1% | |
| Amgen, Inc. | | | 40,000 | | | | 4,734,800 | |
| Health Care Equipment & Supplies 2.9% | |
| Abbott Laboratories | | | 50,000 | | | | 2,045,000 | |
| C.R. Bard, Inc. | | | 35,000 | | | | 5,005,350 | |
| Medtronic, Inc. | | | 95,000 | | | | 6,057,200 | |
| | | | | | | | 13,107,550 | |
| Health Care Providers & Services 3.7% | |
| Aetna, Inc. | | | 27,500 | | | | 2,229,700 | |
| Cardinal Health, Inc. | | | 57,500 | | | | 3,942,200 | |
| UnitedHealth Group, Inc. | | | 35,000 | | | | 2,861,250 | |
| WellPoint, Inc. | | | 70,000 | | | | 7,532,700 | |
| | | | | | | | 16,565,850 | |
| Life Sciences Tools & Services 0.6% | |
| Agilent Technologies, Inc. | | | 45,000 | | | | 2,584,800 | |
| Pharmaceuticals 9.1% | |
| Eli Lilly & Co. | | | 80,000 | | | | 4,973,600 | |
| Johnson & Johnson | | | 82,500 | | | | 8,631,150 | |
| Merck & Co., Inc. | | | 155,000 | | | | 8,966,750 | |
| Pfizer, Inc. | | | 517,500 | | | | 15,359,400 | |
| Questcor Pharmaceuticals, Inc. (a) | | | 32,500 | | | | 3,005,925 | |
| | | | | | | | 40,936,825 | |
| | | Shares | | | Value ($) | |
| | | | | | | | | |
| Industrials 6.2% | |
| Aerospace & Defense 0.8% | |
| Raytheon Co. | | | 37,500 | | | | 3,459,375 | |
| Airlines 0.5% | |
| Southwest Airlines Co. (a) | | | 80,000 | | | | 2,148,800 | |
| Commercial Services & Supplies 0.8% | |
| ABM Industries, Inc. | | | 42,877 | | | | 1,156,821 | |
| Republic Services, Inc. | | | 65,000 | | | | 2,468,050 | |
| | | | | | | | 3,624,871 | |
| Industrial Conglomerates 3.2% | |
| Danaher Corp. | | | 35,000 | | | | 2,755,550 | |
| General Electric Co. | | | 450,000 | | | | 11,826,000 | |
| | | | | | | | 14,581,550 | |
| Machinery 0.9% | |
| AGCO Corp. | | | 70,000 | | | | 3,935,400 | |
| Information Technology 12.1% | |
| Communications Equipment 2.2% | |
| Brocade Communications Systems, Inc. | | | 137,500 | | | | 1,265,000 | |
| Cisco Systems, Inc. | | | 350,000 | | | | 8,697,500 | |
| | | | | | | | 9,962,500 | |
| Electronic Equipment, Instruments & Components 0.8% | |
| Tech Data Corp.* | | | 56,514 | | | | 3,533,255 | |
| IT Services 0.4% | |
| Xerox Corp. | | | 125,000 | | | | 1,555,000 | |
| Semiconductors & Semiconductor Equipment 2.3% | |
| Analog Devices, Inc. | | | 60,000 | | | | 3,244,200 | |
| Intel Corp. | | | 150,000 | | | | 4,635,000 | |
| Texas Instruments, Inc. | | | 55,000 | | | | 2,628,450 | |
| | | | | | | | 10,507,650 | |
| Software 3.5% | |
| Activision Blizzard, Inc. | | | 125,000 | | | | 2,787,500 | |
| Microsoft Corp. | | | 160,000 | | | | 6,672,000 | |
| Oracle Corp. | | | 150,000 | | | | 6,079,500 | |
| | | | | | | | 15,539,000 | |
| Technology Hardware, Storage & Peripherals 2.9% | |
| Apple, Inc. | | | 49,000 | | | | 4,553,570 | |
| EMC Corp. | | | 82,500 | | | | 2,173,050 | |
| Hewlett-Packard Co. | | | 107,500 | | | | 3,620,600 | |
| Western Digital Corp. | | | 30,000 | | | | 2,769,000 | |
| | | | | | | | 13,116,220 | |
| Materials 1.8% | |
| Chemicals 1.5% | |
| Celanese Corp. "A" | | | 35,000 | | | | 2,249,800 | |
| CF Industries Holdings, Inc. | | | 7,500 | | | | 1,803,975 | |
| LyondellBasell Industries NV "A" | | | 25,000 | | | | 2,441,250 | |
| | | | | | | | 6,495,025 | |
| | | Shares | | | Value ($) | |
| | | | | | | | | |
| Paper & Forest Products 0.3% | |
| Western Forest Products, Inc. | | | 675,000 | | | | 1,410,665 | |
| Telecommunication Services 3.2% | |
| Diversified Telecommunication Services | |
| AT&T, Inc. | | | 140,000 | | | | 4,950,400 | |
| BCE, Inc. | | | 60,460 | | | | 2,742,466 | |
| Verizon Communications, Inc. | | | 140,000 | | | | 6,850,200 | |
| | | | | | | | 14,543,066 | |
| Utilities 5.5% | |
| Electric Utilities 3.0% | |
| American Electric Power Co., Inc. | | | 42,500 | | | | 2,370,225 | |
| Duke Energy Corp. | | | 27,500 | | | | 2,040,225 | |
| Entergy Corp. | | | 25,000 | | | | 2,052,250 | |
| Pinnacle West Capital Corp. | | | 30,000 | | | | 1,735,200 | |
| PPL Corp. | | | 62,500 | | | | 2,220,625 | |
| Southern Co. (a) | | | 65,000 | | | | 2,949,700 | |
| | | | | | | | 13,368,225 | |
| Gas Utilities 0.8% | |
| UGI Corp. | | | 70,000 | | | | 3,535,000 | |
| Independent Power & Renewable Electricity Producers 0.5% | |
| AES Corp. | | | 150,000 | | | | 2,332,500 | |
| Multi-Utilities 1.2% | |
| Public Service Enterprise Group, Inc. | | | 80,000 | | | | 3,263,200 | |
| Wisconsin Energy Corp. | | | 50,000 | | | | 2,346,000 | |
| | | | | | | | 5,609,200 | |
Total Common Stocks (Cost $328,855,658) | | | | 431,952,598 | |
| | |
| Securities Lending Collateral 4.6% | |
| Daily Assets Fund Institutional, 0.08% (b) (c) (Cost $20,493,704) | | | 20,493,704 | | | | 20,493,704 | |
| | |
| Cash Equivalents 4.3% | |
| Central Cash Management Fund, 0.06% (b) (Cost $19,448,993) | | | 19,448,993 | | | | 19,448,993 | |
| | | % of Net Assets | | | Value ($) | |
| | | | |
Total Investment Portfolio (Cost $368,798,355)† | | | 105.3 | | | | 471,895,295 | |
| Other Assets and Liabilities, Net | | | (5.3 | ) | | | (23,749,392 | ) |
| Net Assets | | | 100.0 | | | | 448,145,903 | |
* Non-income producing security.
† The cost for federal income tax purposes was $369,960,994. At June 30, 2014, net unrealized appreciation for all securities based on tax cost was $101,934,301. This consisted of aggregate gross unrealized appreciation for all securities in which there was an excess of value over tax cost of $103,192,767 and aggregate gross unrealized depreciation for all securities in which there was an excess of tax cost over value of $1,258,466.
(a) All or a portion of these securities were on loan. In addition, "Other Assets and Liabilities, Net" may include pending sales that are also on loan. The value of securities loaned at June 30, 2014 amounted to $19,964,910, which is 4.5% of net assets.
(b) Affiliated fund managed by Deutsche Investment Management Americas Inc. The rate shown is the annualized seven-day yield at period end.
(c) Represents collateral held in connection with securities lending. Income earned by the Fund is net of borrower rebates.
Fair Value Measurements
Various inputs are used in determining the value of the Fund's investments. These inputs are summarized in three broad levels. Level 1 includes quoted prices in active markets for identical securities. Level 2 includes other significant observable inputs (including quoted prices for similar securities, interest rates, prepayment speeds and credit risk). Level 3 includes significant unobservable inputs (including the Fund's own assumptions in determining the fair value of investments). The level assigned to the securities valuations may not be an indication of the risk or liquidity associated with investing in those securities.
The following is a summary of the inputs used as of June 30, 2014 in valuing the Fund's investments. For information on the Fund's policy regarding the valuation of investments, please refer to the Security Valuation section of Note A in the accompanying Notes to Financial Statements.
| Assets | | Level 1 | | | Level 2 | | | Level 3 | | | Total | |
| | |
| Common Stocks (d) | | $ | 431,952,598 | | | $ | — | | | $ | — | | | $ | 431,952,598 | |
| Short-Term Investments | | | 39,942,697 | | | | — | | | | — | | | | 39,942,697 | |
| Total | | $ | 471,895,295 | | | $ | — | | | $ | — | | | $ | 471,895,295 | |
There have been no transfers between fair value measurement levels during the period ended June 30, 2014.
(d) See Investment Portfolio for additional detailed categorizations.
The accompanying notes are an integral part of the financial statements.
Statement of Assets and Liabilities | as of June 30, 2014 (Unaudited) | |
| Assets | |
Investments: Investments in non-affiliated securities, at value (cost $328,855,658) — including $19,964,910 of securities loaned | | $ | 431,952,598 | |
| Investment in Daily Assets Fund Institutional (cost $20,493,704)* | | | 20,493,704 | |
| Investment in Central Cash Management Fund (cost $19,448,993) | | | 19,448,993 | |
| Total investments in securities, at value (cost $368,798,355) | | | 471,895,295 | |
| Cash | | | 47,441 | |
| Foreign currency, at value (cost $50,531) | | | 52,013 | |
| Receivable for investments sold | | | 32,664,997 | |
| Receivable for Fund shares sold | | | 47,594 | |
| Dividends receivable | | | 553,196 | |
| Interest receivable | | | 23,110 | |
| Foreign taxes recoverable | | | 3,840 | |
| Other assets | | | 2,527 | |
| Total assets | | | 505,290,013 | |
| Liabilities | |
| Payable upon return of securities loaned | | | 20,493,704 | |
| Payable for investments purchased | | | 35,766,063 | |
| Payable for Fund shares redeemed | | | 567,426 | |
| Accrued management fee | | | 218,519 | |
| Accrued Trustees' fees | | | 994 | |
| Other accrued expenses and payables | | | 97,404 | |
| Total liabilities | | | 57,144,110 | |
| Net assets, at value | | $ | 448,145,903 | |
| Net Assets Consist of | |
| Undistributed net investment income | | | 3,485,826 | |
Net unrealized appreciation (depreciation) on: Investments | | | 103,096,940 | |
| Foreign currency | | | 2,641 | |
| Accumulated net realized gain (loss) | | | (57,506,818 | ) |
| Paid-in capital | | | 399,067,314 | |
| Net assets, at value | | $ | 448,145,903 | |
Class A Net Asset Value, offering and redemption price per share ($442,899,036 ÷ 26,242,841 outstanding shares of beneficial interest, no par value, unlimited number of shares authorized) | | $ | 16.88 | |
Class B Net Asset Value, offering and redemption price per share ($5,246,867 ÷ 310,056 outstanding shares of beneficial interest, no par value, unlimited number of shares authorized) | | $ | 16.92 | |
* Represents collateral on securities loaned.
The accompanying notes are an integral part of the financial statements.
Statement of Operations
| for the year ended June 30, 2014 (Unaudited) | |
| Investment Income | |
Income: Dividends (net of foreign taxes withheld of $48,860) | | $ | 5,095,765 | |
| Income distributions — Central Cash Management Fund | | | 3,858 | |
| Securities lending income, including income from Daily Assets Fund Institutional, net of borrower rebates | | | 81,697 | |
| Total income | | | 5,181,320 | |
Expenses: Management fee | | | 1,379,701 | |
| Administration fee | | | 215,793 | |
| Services to shareholders | | | 2,903 | |
| Record keeping fees (Class B) | | | 1,345 | |
| Distribution and service fee (Class B) | | | 5,900 | |
| Custodian fee | | | 7,364 | |
| Professional fees | | | 35,241 | |
| Reports to shareholders | | | 19,346 | |
| Trustees' fees and expenses | | | 9,039 | |
| Other | | | 8,345 | |
| Total expenses before expense reductions | | | 1,684,977 | |
| Expense reductions | | | (102,370 | ) |
| Total expenses after expense reductions | | | 1,582,607 | |
| Net investment income | | $ | 3,598,713 | |
| Realized and Unrealized Gain (Loss) | |
Net realized gain (loss) from: Investments | | | 40,359,549 | |
| Foreign currency | | | 23,672 | |
| | | | 40,383,221 | |
Change in net unrealized appreciation (depreciation) on: Investments | | | (12,384,413 | ) |
| Foreign currency | | | 1,924 | |
| | | | (12,382,489 | ) |
| Net gain (loss) | | | 28,000,732 | |
| Net increase (decrease) in net assets resulting from operations | | | 31,599,445 | |
The accompanying notes are an integral part of the financial statements.
Statement of Changes in Net Assets | Increase (Decrease) in Net Assets | | Six Months Ended June 30, 2014 (Unaudited) | | | Year Ended December 31, 2013 | |
Operations: Net investment income | | $ | 3,598,713 | | | $ | 7,492,381 | |
Operations: Net investment income | | $ | 3,598,713 | | | $ | 7,492,381 | |
| Net realized gain (loss) | | | 40,383,221 | | | | 43,142,013 | |
| Change in net unrealized appreciation (depreciation) | | | (12,382,489 | ) | | | 59,914,889 | |
| Net increase (decrease) in net assets resulting from operations | | | 31,599,445 | | | | 110,549,283 | |
Distributions to shareholders from: Net investment income: Class A | | | (7,350,279 | ) | | | (8,048,782 | ) |
| Class B | | | (66,263 | ) | | | (66,664 | ) |
| Total distributions | | | (7,416,542 | ) | | | (8,115,446 | ) |
Fund share transactions: Class A Proceeds from shares sold | | | 5,906,580 | | | | 7,515,770 | |
| Reinvestment of distributions | | | 7,350,279 | | | | 8,048,782 | |
| Payments for shares redeemed | | | (26,691,245 | ) | | | (61,510,110 | ) |
| Net increase (decrease) in net assets from Class A share transactions | | | (13,434,386 | ) | | | (45,945,558 | ) |
Class B Proceeds from shares sold | | | 625,828 | | | | 822,748 | |
| Reinvestment of distributions | | | 66,263 | | | | 66,664 | |
| Payments for shares redeemed | | | (357,644 | ) | | | (844,581 | ) |
| Net increase (decrease) in net assets from Class B share transactions | | | 334,447 | | | | 44,831 | |
| Increase (decrease) in net assets | | | 11,082,964 | | | | 56,533,110 | |
| Net assets at beginning of period | | | 437,062,939 | | | | 380,529,829 | |
| Net assets at end of period (including undistributed net investment income of $3,485,826 and $7,303,655, respectively) | | $ | 448,145,903 | | | $ | 437,062,939 | |
| Other Information | |
Class A Shares outstanding at beginning of period | | | 27,072,074 | | | | 30,284,545 | |
| Shares sold | | | 367,175 | | | | 520,949 | |
| Shares issued to shareholders in reinvestment of distributions | | | 455,690 | | | | 590,520 | |
| Shares redeemed | | | (1,652,098 | ) | | | (4,323,940 | ) |
| Net increase (decrease) in Class A shares | | | (829,233 | ) | | | (3,212,471 | ) |
| Shares outstanding at end of period | | | 26,242,841 | | | | 27,072,074 | |
Class B Shares outstanding at beginning of period | | | 289,672 | | | | 286,965 | |
| Shares sold | | | 38,271 | | | | 55,598 | |
| Shares issued to shareholders in reinvestment of distributions | | | 4,095 | | | | 4,877 | |
| Shares redeemed | | | (21,982 | ) | | | (57,768 | ) |
| Net increase (decrease) in Class B shares | | | 20,384 | | | | 2,707 | |
| Shares outstanding at end of period | | | 310,056 | | | | 289,672 | |
The accompanying notes are an integral part of the financial statements.
| | | | | | Years Ended December 31, | |
| Class A | | Six Months Ended 6/30/14 (Unaudited) | | | 2013 | | | 2012 | | | 2011 | | | 2010 | | | 2009 | |
| Selected Per Share Data | |
| Net asset value, beginning of period | | $ | 15.97 | | | $ | 12.45 | | | $ | 11.56 | | | $ | 11.80 | | | $ | 10.86 | | | $ | 8.92 | |
Income (loss) from investment operations: Net investment income (loss)a | | | .13 | | | | .26 | | | | .25 | | | | .25 | | | | .23 | | | | .21 | |
| Net realized and unrealized gain (loss) | | | 1.06 | | | | 3.54 | | | | .87 | | | | (.24 | ) | | | .93 | | | | 1.97 | |
| Total from investment operations | | | 1.19 | | | | 3.80 | | | | 1.12 | | | | .01 | | | | 1.16 | | | | 2.18 | |
Less distributions from: Net investment income | | | (.28 | ) | | | (.28 | ) | | | (.23 | ) | | | (.25 | ) | | | (.22 | ) | | | (.24 | ) |
| Total distributions | | | (.28 | ) | | | (.28 | ) | | | (.23 | ) | | | (.25 | ) | | | (.22 | ) | | | (.24 | ) |
| Net asset value, end of period | | $ | 16.88 | | | $ | 15.97 | | | $ | 12.45 | | | $ | 11.56 | | | $ | 11.80 | | | $ | 10.86 | |
| Total Return (%) | | | 7.53 | b** | | | 30.89 | b | | | 9.79 | b | | | (.07 | ) | | | 10.77 | | | | 25.37 | |
| Ratios to Average Net Assets and Supplemental Data | |
| Net assets, end of period ($ millions) | | | 443 | | | | 432 | | | | 377 | | | | 396 | | | | 206 | | | | 214 | |
| Ratio of expenses before expense reductions (%) | | | .78 | * | | | .78 | | | | .78 | | | | .79 | | | | .82 | | | | .76 | |
| Ratio of expenses after expense reductions (%) | | | .73 | * | | | .74 | | | | .77 | | | | .79 | | | | .82 | | | | .76 | |
| Ratio of net investment income (loss) (%) | | | 1.67 | * | | | 1.82 | | | | 2.04 | | | | 2.15 | | | | 2.13 | | | | 2.22 | |
| Portfolio turnover rate (%) | | | 34 | ** | | | 54 | | | | 63 | | | | 28 | | | | 32 | | | | 76 | |
a Based on average shares outstanding during the period. b Total return would have been lower had certain expenses not been reduced. * Annualized ** Not annualized | |
| | | | | | Years Ended December 31, | |
| Class B | | Six Months Ended 6/30/14 (Unaudited) | | | 2013 | | | 2012 | | | 2011 | | | 2010 | | | 2009 | |
| Selected Per Share Data | |
| Net asset value, beginning of period | | $ | 15.99 | | | $ | 12.46 | | | $ | 11.57 | | | $ | 11.81 | | | $ | 10.86 | | | $ | 8.92 | |
Income (loss) from investment operations: Net investment income (loss)a | | | .11 | | | | .22 | | | | .21 | | | | .22 | | | | .20 | | | | .19 | |
| Net realized and unrealized gain (loss) | | | 1.05 | | | | 3.55 | | | | .88 | | | | (.25 | ) | | | .93 | | | | 1.96 | |
| Total from investment operations | | | 1.16 | | | | 3.77 | | | | 1.09 | | | | (.03 | ) | | | 1.13 | | | | 2.15 | |
Less distributions from: Net investment income | | | (.23 | ) | | | (.24 | ) | | | (.20 | ) | | | (.21 | ) | | | (.18 | ) | | | (.21 | ) |
| Total distributions | | | (.23 | ) | | | (.24 | ) | | | (.20 | ) | | | (.21 | ) | | | (.18 | ) | | | (.21 | ) |
| Net asset value, end of period | | $ | 16.92 | | | $ | 15.99 | | | $ | 12.46 | | | $ | 11.57 | | | $ | 11.81 | | | $ | 10.86 | |
| Total Return (%) | | | 7.31 | b** | | | 30.54 | b | | | 9.44 | b | | | (.36 | ) | | | 10.53 | | | | 24.86 | |
| Ratios to Average Net Assets and Supplemental Data | |
| Net assets, end of period ($ millions) | | | 5 | | | | 5 | | | | 4 | | | | 3 | | | | 1 | | | | 1 | |
| Ratio of expenses before expense reductions (%) | | | 1.09 | * | | | 1.09 | | | | 1.09 | | | | 1.10 | | | | 1.11 | | | | 1.06 | |
| Ratio of expenses after expense reductions (%) | | | 1.04 | * | | | 1.05 | | | | 1.08 | | | | 1.10 | | | | 1.11 | | | | 1.06 | |
| Ratio of net investment income (loss) (%) | | | 1.36 | * | | | 1.52 | | | | 1.73 | | | | 1.84 | | | | 1.84 | | | | 1.92 | |
| Portfolio turnover rate (%) | | | 34 | ** | | | 54 | | | | 63 | | | | 28 | | | | 32 | | | | 76 | |
a Based on average shares outstanding during the period. b Total return would have been lower had certain expenses not been reduced. * Annualized ** Not annualized | |
Notes to Financial Statements (Unaudited)
A. Organization and Significant Accounting Policies
Deutsche Large Cap Value VIP (formerly DWS Large Cap Value VIP) (the "Fund") is a diversified series of Deutsche Variable Series II (formerly DWS Variable Series II) (the "Trust"), which is registered under the Investment Company Act of 1940, as amended (the "1940 Act"), as an open-end management investment company organized as a Massachusetts business trust.
Multiple Classes of Shares of Beneficial Interest. The Fund offers two classes of shares (Class A shares and Class B shares). Sales of Class B shares are subject to recordkeeping fees up to 0.15% and Rule 12b-1 fees under the 1940 Act equal to an annual rate of 0.25% of the average daily net assets of the Class B shares of the Fund. Class A shares are not subject to such fees.
Investment income, realized and unrealized gains and losses, and certain fund-level expenses and expense reductions, if any, are borne pro rata on the basis of relative net assets by the holders of all classes of shares except that each class bears certain expenses unique to that class (including the applicable Rule 12b-1 fee and recordkeeping fees). Differences in class-level expenses may result in payment of different per share dividends by class. All shares have equal rights with respect to voting subject to class-specific arrangements.
The Fund's financial statements are prepared in accordance with accounting principles generally accepted in the United States of America which require the use of management estimates. Actual results could differ from those estimates. The policies described below are followed consistently by the Fund in the preparation of its financial statements.
Security Valuation. Investments are stated at value determined as of the close of regular trading on the New York Stock Exchange on each day the exchange is open for trading.
Various inputs are used in determining the value of the Fund's investments. These inputs are summarized in three broad levels. Level 1 includes quoted prices in active markets for identical securities. Level 2 includes other significant observable inputs (including quoted prices for similar securities, interest rates, prepayment speeds and credit risk). Level 3 includes significant unobservable inputs (including the Fund's own assumptions in determining the fair value of investments). The level assigned to the securities valuations may not be an indication of the risk or liquidity associated with investing in those securities.
Equity securities and exchange traded funds ("ETFs") are valued at the most recent sale price or official closing price reported on the exchange (U.S. or foreign) or over-the-counter market on which they trade. Securities for which no sales are reported are valued at the calculated mean between the most recent bid and asked quotations on the relevant market or, if a mean cannot be determined, at the most recent bid quotation. Equity securities and ETFs are generally categorized as Level 1.
Investments in open-end investment companies are valued at their net asset value each business day and are categorized as Level 1.
Securities and other assets for which market quotations are not readily available or for which the above valuation procedures are deemed not to reflect fair value are valued in a manner that is intended to reflect their fair value as determined in accordance with procedures approved by the Board and are generally categorized as Level 3. In accordance with the Fund's valuation procedures, factors considered in determining value may include, but are not limited to, the type of the security; the size of the holding; the initial cost of the security; the existence of any contractual restrictions on the security's disposition; the price and extent of public trading in similar securities of the issuer or of comparable companies; quotations or evaluated prices from broker-dealers and/or pricing services; information obtained from the issuer, analysts, and/or the appropriate stock exchange (for exchange-traded securities); an analysis of the company's or issuer's financial statements; an evaluation of the forces that influence the issuer and the market(s) in which the security is purchased and sold; and with respect to debt securities, the maturity, coupon, creditworthiness, currency denomination and the movement of the market in which the security is normally traded. The value determined under these procedures may differ from published values for the same securities.
Disclosure about the classification of fair value measurements is included in a table following the Fund's Investment Portfolio.
Foreign Currency Translations. The books and records of the Fund are maintained in U.S. dollars. Investment securities and other assets and liabilities denominated in a foreign currency are translated into U.S. dollars at the prevailing exchange rates at period end. Purchases and sales of investment securities, income and expenses are translated into U.S. dollars at the prevailing exchange rates on the respective dates of the transactions.
Net realized and unrealized gains and losses on foreign currency transactions represent net gains and losses between trade and settlement dates on securities transactions, the acquisition and disposition of foreign currencies, and the difference between the amount of net investment income accrued and the U.S. dollar amount actually received. That portion of both realized and unrealized gains and losses on investments that results from fluctuations in foreign currency exchange rates is not separately disclosed but is included with net realized and unrealized gain/appreciation and loss/depreciation on investments.
Securities Lending. Deutsche Bank AG, as lending agent, lends securities of the Fund to certain financial institutions under the terms of the Security Lending Agreement. The Fund retains the benefits of owning securities it has loaned and continues to receive interest and dividends generated by the securities and to participate in any changes in their market value. The Fund requires the borrowers of the securities to maintain collateral with the Fund consisting of either cash or liquid, unencumbered assets having a value at least equal to the value of the securities loaned. When the collateral falls below specified amounts, the lending agent will use its best effort to obtain additional collateral on the next business day to meet required amounts under the security lending agreement. The Fund may invest the cash collateral into a joint trading account in an affiliated money market fund pursuant to Exemptive Orders issued by the SEC. The Fund receives compensation for lending its securities either in the form of fees or by earning interest on invested cash collateral net of borrower rebates and fees paid to a lending agent. Either the Fund or the borrower may terminate the loan. There may be risks of delay and costs in recovery of securities or even loss of rights in the collateral should the borrower of the securities fail financially. If the Fund is not able to recover securities lent, the Fund may sell the collateral and purchase a replacement investment in the market, incurring the risk that the value of the replacement security is greater than the value of the collateral. The Fund is also subject to all investment risks associated with the reinvestment of any cash collateral received, including, but not limited to, interest rate, credit and liquidity risk associated with such investments.
As of June 30, 2014, the Fund had securities on loan. The value of the related collateral exceeded the value of the securities loaned at period end.
Federal Income Taxes. The Fund's policy is to comply with the requirements of the Internal Revenue Code, as amended, which are applicable to regulated investment companies and to distribute all of its taxable income to its shareholders.
Under the Regulated Investment Company Modernization Act of 2010, net capital losses incurred post-enactment may be carried forward indefinitely, and their character is retained as short-term and/or long-term. Previously, net capital losses were carried forward for eight years and treated as short-term losses. As a transition rule, the Act requires that post-enactment net capital losses be used before pre-enactment net capital losses.
At December 31, 2013, the Fund had a net tax basis capital loss carryforward of approximately $96,728,000 of pre-enactment losses, including approximately $88,212,000 inherited from its merger with an affiliated fund in previous years, which may be applied against any realized net taxable capital gains of each succeeding year until fully utilized or until December 31, 2016 ($88,418,000) and December 31, 2017 ($8,310,000), the respective expiration dates, whichever occurs first, and which may be subject to certain limitations under Section 382–384 of the Internal Revenue Code.
The Fund has reviewed the tax positions for the open tax years as of December 31, 2013 and has determined that no provision for income tax and/or uncertain tax provisions is required in the Fund's financial statements. The Fund's federal tax returns for the prior three fiscal years remain open subject to examination by the Internal Revenue Service.
Distribution of Income and Gains. Distributions from net investment income of the Fund, if any, is declared and distributed to shareholders annually. Net realized gains from investment transactions, in excess of available capital loss carryforwards, would be taxable to the Fund if not distributed and, therefore, will be distributed to shareholders at least annually. The Fund may also make additional distributions for tax purposes if necessary.
The timing and characterization of certain income and capital gain distributions are determined annually in accordance with federal tax regulations which may differ from accounting principles generally accepted in the United States of America. These differences primarily relate to certain securities sold at a loss. As a result, net investment income (loss) and net realized gain (loss) on investment transactions for a reporting period may differ significantly from distributions during such period. Accordingly, the Fund may periodically make reclassifications among certain of its capital accounts without impacting the net asset value of the Fund.
The tax character of current year distributions will be determined at the end of the current fiscal year.
Expenses. Expenses of the Trust arising in connection with a specific fund are allocated to that fund. Other Trust expenses which cannot be directly attributed to a fund are apportioned among the funds in the Trust based upon the relative net assets or other appropriate measures.
Contingencies. In the normal course of business, the Fund may enter into contracts with service providers that contain general indemnification clauses. The Fund's maximum exposure under these arrangements is unknown as this would involve future claims that may be made against the Fund that have not yet been made. However, based on experience, the Fund expects the risk of loss to be remote.
Other. Investment transactions are accounted for on a trade date plus one basis for daily net asset value calculations. However, for financial reporting purposes, investment transactions are reported on trade date. Interest income is recorded on the accrual basis. Dividend income is recorded on the ex-dividend date net of foreign withholding taxes. Realized gains and losses from investment transactions are recorded on an identified cost basis. Proceeds from litigation payments, if any, are included in net realized gain (loss) from investments.
B. Purchases and Sales of Securities
During the six months ended June 30, 2014, purchases and sales of investment transactions (excluding short-term investments) aggregated $145,742,150 and $173,459,667, respectively.
C. Related Parties
Management Agreement. Under the Investment Management Agreement with Deutsche Investment Management Americas Inc. ("DIMA" or the "Advisor"), an indirect, wholly owned subsidiary of Deutsche Bank AG, the Advisor directs the investments of the Fund in accordance with its investment objectives, policies and restrictions. The Advisor determines the securities, instruments and other contracts relating to investments to be purchased, sold or entered into by the Fund.
Under the Investment Management Agreement with the Advisor, the Fund pays a monthly management fee based on the Fund's average daily net assets, computed and accrued daily and payable monthly, at the following annual rates:
| First $250 million | | | .650 | % |
| Next $750 million | | | .625 | % |
| Next $1.5 billion | | | .600 | % |
| Next $2.5 billion | | | .575 | % |
| Next $2.5 billion | | | .550 | % |
| Next $2.5 billion | | | .525 | % |
| Next $2.5 billion | | | .500 | % |
| Over $12.5 billion | | | .475 | % |
Accordingly, for the six months ended June 30, 2014, the fee pursuant to the Investment Management Agreement was equivalent to an annualized effective rate (exclusive of any applicable waivers/reimbursements) of 0.64% of the Fund's average daily net assets.
For the period from January 1, 2014 through September 30, 2014, the Advisor has contractually agreed to waive all or a portion of its fees and/or reimburse certain operating expenses of the Fund to the extent necessary to maintain the operating expenses (excluding certain expenses such as extraordinary expenses, taxes, brokerage and interest) of each class as follows:
For the six months ended June 30, 2014, fees waived and/or expenses reimbursed for each class are as follows:
| Class A | | $ | 101,196 | |
| Class B | | | 1,174 | |
| | | $ | 102,370 | |
Administration Fee. Pursuant to an Administrative Services Agreement, DIMA provides most administrative services to the Fund. For all services provided under the Administrative Services Agreement, the Fund pays DIMA an annual fee ("Administration Fee") of 0.10% of the Fund's average daily net assets, computed and accrued daily and payable monthly. For the six months ended June 30, 2014, the Administration Fee was $215,793, of which $36,743 is unpaid.
Service Provider Fees. DeAWM Service Company ("DSC"), an affiliate of the Advisor, is the transfer agent, dividend-paying agent and shareholder service agent for the Fund. Pursuant to a sub-transfer agency agreement between DSC and DST Systems, Inc. ("DST"), DSC has delegated certain transfer agent, dividend-paying agent and shareholder service agent functions to DST. DSC compensates DST out of the shareholder servicing fee it receives from the Fund. For the six months ended June 30, 2014, the amounts charged to the Fund by DSC were as follows:
| Services to Shareholders | | Total Aggregated | | | Unpaid at June 30, 2014 | |
| Class A | | $ | 187 | | | $ | 92 | |
| Class B | | | 117 | | | | 63 | |
| | | $ | 304 | | | $ | 155 | |
Distribution Service Agreement. Under the Fund's Class B 12b-1 plan, DeAWM Distributors, Inc. ("DDI") received a fee ("Distribution Service Fee") of 0.25% of average daily net assets of Class B shares. For the six months ended June 30, 2014, the Distribution Service Fee aggregated $5,900, of which $1,059 is unpaid.
Typesetting and Filing Service Fees. Under an agreement with DIMA, DIMA is compensated for providing typesetting and certain regulatory filing services to the Fund. For the six months ended June 30, 2014, the amount charged to the Fund by DIMA included in the Statement of Operations under "reports to shareholders" aggregated $7,578, of which $955 is unpaid.
Trustees' Fees and Expenses. The Fund paid retainer fees to each Trustee not affiliated with the Advisor, plus specified amounts to the Board Chairperson and Vice Chairperson and to each committee Chairperson.
Affiliated Cash Management Vehicles. The Fund may invest uninvested cash balances in Central Cash Management Fund and Deutsche Variable NAV Money Fund, affiliated money market funds which are managed by the Advisor. Each affiliated money market fund seeks to provide a high level of current income consistent with liquidity and the preservation of capital. Each affiliated money market fund is managed in accordance with Rule 2a-7 under the Investment Company Act of 1940, which governs the quality, maturity, diversity and liquidity of instruments in which a money market fund may invest. Central Cash Management Fund seeks to maintain a stable net asset value, and Deutsche Variable NAV Money Fund maintains a floating net asset value. The Fund indirectly bears its proportionate share of the expenses of each affiliated money market fund in which it invests. Central Cash Management Fund does not pay the Advisor an investment management fee. To the extent that Deutsche Variable NAV Money Fund pays an investment management fee to the Advisor, the Advisor will waive an amount of the investment management fee payable to the Advisor by the Fund equal to the amount of the investment management fee payable on the Fund's assets invested in Deutsche Variable NAV Money Fund.
Securities Lending Agent Fees. Deutsche Bank AG serves as securities lending agent for the Fund. For the six months ended June 30, 2014, the Fund incurred securities lending agent fees to Deutsche Bank AG in the amount of $7,152.
D. Ownership of the Fund
At June 30, 2014, two participating insurance companies were owners of record of 10% or more of the total outstanding Class A shares of the Fund, each owning 60% and 26%. Two participating insurance companies were owners of record of 10% or more of the total outstanding Class B shares of the Fund, each owning 62% and 13%.
E. Line of Credit
The Fund and other affiliated funds (the "Participants") share in a $400 million revolving credit facility provided by a syndication of banks. The Fund may borrow for temporary or emergency purposes, including the meeting of redemption requests that otherwise might require the untimely disposition of securities. The Participants are charged an annual commitment fee which is allocated based on net assets, among each of the Participants. Interest is calculated at a rate per annum equal to the sum of the Federal Funds Rate plus 1.25 percent plus if LIBOR exceeds the Federal Funds Rate the amount of such excess. The Fund may borrow up to a maximum of 33 percent of its net assets under the agreement. The Fund had no outstanding loans at June 30, 2014.
F. Fund Name Change
Effective August 11, 2014, the "DWS Funds" were rebranded "Deutsche Funds."
Information About Your Fund's Expenses (Unaudited)
The tables illustrate your Fund's expenses in two ways:
As an investor of the Fund, you incur two types of costs: ongoing expenses and transaction costs. Ongoing expenses include management fees, distribution and service (12b-1) fees and other Fund expenses. Examples of transaction costs include contract charges and account maintenance fees, which are not shown in this section. The following tables are intended to help you understand your ongoing expenses (in dollars) of investing in the Fund and to help you compare these expenses with the ongoing expenses of investing in other mutual funds. In the most recent six-month period, the Fund limited these expenses; had it not done so, expenses would have been higher. The example in the table is based on an investment of $1,000 invested at the beginning of the six-month period and held for the entire period (January 1, 2014 to June 30, 2014).
—Actual Fund Return. This helps you estimate the actual dollar amount of ongoing expenses (but not transaction costs) paid on a $1,000 investment in the Fund using the Fund's actual return during the period. To estimate the expenses you paid over the period, simply divide your account value by $1,000 (for example, an $8,600 account value divided by $1,000 = 8.6), then multiply the result by the number in the "Expenses Paid per $1,000" line under the share class you hold.
—Hypothetical 5% Fund Return. This helps you to compare your Fund's ongoing expenses (but not transaction costs) with those of other mutual funds using the Fund's actual expense ratio and a hypothetical rate of return of 5% per year before expenses. Examples using a 5% hypothetical Fund return may be found in the shareholder reports of other mutual funds. The hypothetical account values and expenses may not be used to estimate the actual ending account balance or expenses you paid for the period.
Please note that the expenses shown in these tables are meant to highlight your ongoing expenses only and do not reflect any transaction costs. The "Expenses Paid per $1,000" line of the tables is useful in comparing ongoing expenses only and will not help you determine the relative total expense of owning different funds. If these transaction costs had been included, your costs would have been higher.
Expenses and Value of a $1,000 Investment for the six months ended June 30, 2014 | |
| Actual Fund Return | | Class A | | | Class B | |
| Beginning Account Value 1/1/14 | | $ | 1,000.00 | | | $ | 1,000.00 | |
| Ending Account Value 6/30/14 | | $ | 1,075.30 | | | $ | 1,073.10 | |
| Expenses Paid per $1,000* | | $ | 3.76 | | | $ | 5.35 | |
| Hypothetical 5% Fund Return | | Class A | | | Class B | |
| Beginning Account Value 1/1/14 | | $ | 1,000.00 | | | $ | 1,000.00 | |
| Ending Account Value 6/30/14 | | $ | 1,021.17 | | | $ | 1,019.64 | |
| Expenses Paid per $1,000* | | $ | 3.66 | | | $ | 5.21 | |
* Expenses are equal to the Fund's annualized expense ratio for each share class, multiplied by the average account value over the period, multiplied by 181 (the number of days in the most recent six-month period), then divided by 365.
| Annualized Expense Ratios | Class A | | Class B | |
| Deutsche Variable Series II — Deutsche Large Cap Value VIP | .73% | | 1.04% | |
For more information, please refer to the Fund's prospectus.
These tables do not reflect charges and fees ("contract charges") associated with the separate account that invests in the Fund or any variable life insurance policy or variable annuity contract for which the Fund is an investment option.
For an analysis of the fees associated with an investment in the fund or similar funds, please refer to the current and hypothetical expense calculators for Variable Insurance Products which can be found at deutschefunds.com/EN/resources/calculators.jsp.
The Trust's policies and procedures for voting proxies for portfolio securities and information about how the Trust voted proxies related to its portfolio securities during the 12-month period ended June 30 are available on our Web site — deutschefunds.com (click on "proxy voting" at the bottom of the page) — or on the SEC's Web site — sec.gov. To obtain a written copy of the Trust's policies and procedures without charge, upon request, call us toll free at (800) 728-3337.
Advisory Agreement Board Considerations and Fee Evaluation
The Board of Trustees approved the renewal of DWS Large Cap Value VIP's investment management agreement (the "Agreement") with Deutsche Investment Management Americas Inc. ("DIMA") in September 2013.
In terms of the process that the Board followed prior to approving the Agreement, shareholders should know that:
— In September 2013, all but one of the Fund's Trustees were independent of DIMA and its affiliates.
— The Trustees met frequently during the past year to discuss fund matters and dedicated a substantial amount of time to contract review matters. Over the course of several months, the Board's Contract Committee, in coordination with the Board's Equity Oversight Committee, reviewed comprehensive materials received from DIMA, independent third parties and independent counsel. These materials included an analysis of the Fund's performance, fees and expenses, and profitability compiled by a fee consultant retained by the Fund's Independent Trustees (the "Fee Consultant"). The Board also received extensive information throughout the year regarding performance of the Fund.
— The Independent Trustees regularly meet privately with their independent counsel to discuss contract review and other matters. In addition, the Independent Trustees were also advised by the Fee Consultant in the course of their review of the Fund's contractual arrangements and considered a comprehensive report prepared by the Fee Consultant in connection with their deliberations.
— In connection with reviewing the Agreement, the Board also reviewed the terms of the Fund's Rule 12b-1 plan, distribution agreement, administrative services agreement, transfer agency agreement and other material service agreements.
— Based on its evaluation of the information provided, the Contract Committee presented its findings and recommendations to the Board. The Board then reviewed the Contract Committee's findings and recommendations.
In connection with the contract review process, the Contract Committee and the Board considered the factors discussed below, among others. The Board also considered that DIMA and its predecessors have managed the Fund since its inception, and the Board believes that a long-term relationship with a capable, conscientious advisor is in the best interests of the Fund. The Board considered, generally, that shareholders chose to invest or remain invested in the Fund knowing that DIMA managed the Fund, and that the Agreement was approved by the Fund's shareholders. DIMA is part of Deutsche Bank AG, a major global banking institution that is engaged in a wide range of financial services. The Board believes that there are advantages to being part of a global asset management business that offers a wide range of investing expertise and resources, including hundreds of portfolio managers and analysts with research capabilities in many countries throughout the world.
As part of the contract review process, the Board carefully considered the fees and expenses of each DWS fund overseen by the Board in light of the fund's performance. In many cases, this led to a negotiation with DIMA of lower expense caps as part of the 2012 and 2013 contract review processes than had previously been in place. As part of these negotiations, the Board indicated that it would consider relaxing these new lower caps in future years following sustained improvements in performance, among other considerations.
In June 2012, Deutsche Bank AG ("DB"), DIMA's parent company, announced that DB would combine its Asset Management (of which DIMA was a part) and Wealth Management divisions. DB has advised the Independent Trustees that the U.S. asset management business is a critical and integral part of DB, and that it has, and will continue to, reinvest a significant portion of the substantial savings it expects to realize by combining its Asset Management and Wealth Management divisions into the new Asset and Wealth Management ("AWM") division, including ongoing enhancements to its investment capabilities. DB also has confirmed its commitment to maintaining strong legal and compliance groups within the AWM division.
While shareholders may focus primarily on fund performance and fees, the Fund's Board considers these and many other factors, including the quality and integrity of DIMA's personnel and such other issues as back-office operations, fund valuations, and compliance policies and procedures.
Nature, Quality and Extent of Services. The Board considered the terms of the Agreement, including the scope of advisory services provided under the Agreement. The Board noted that, under the Agreement, DIMA provides portfolio management services to the Fund and that, pursuant to a separate administrative services agreement, DIMA provides administrative services to the Fund. The Board considered the experience and skills of senior management and investment personnel, the resources made available to such personnel, the ability of DIMA to attract and retain high-quality personnel, and the organizational depth and stability of DIMA. The Board reviewed the Fund's performance over short-term and long-term periods and compared those returns to various agreed-upon performance measures, including market indices and a peer universe compiled by the Fee Consultant using information supplied by Morningstar Direct ("Morningstar"), an independent fund data service. The Board also noted that it has put into place a process of identifying "Focus Funds" (e.g., funds performing poorly relative to their benchmark or a peer universe compiled by an independent fund data service), and receives more frequent reporting and information from DIMA regarding such funds, along with DIMA's remedial plans to address underperformance. The Board believes this process is an effective manner of identifying and addressing underperforming funds. Based on the information provided, the Board noted that for the one-, three- and five-year periods ended December 31, 2012, the Fund's performance (Class A shares) was in the 4th quartile of the applicable Morningstar universe (the 1st quartile being the best performers and the 4th quartile being the worst performers). The Board also observed that the Fund has underperformed its benchmark in the one-, three- and five-year periods ended December 31, 2012. The Board noted the disappointing investment performance of the Fund in recent periods and continued to discuss with senior management of DIMA the factors contributing to such underperformance and actions being taken to improve performance. The Board recognized that DIMA has made changes to its investment personnel and processes in recent years in an effort to enhance its investment platform and improve long-term performance across the DWS fund complex.
Fees and Expenses. The Board considered the Fund's investment management fee schedule, operating expenses and total expense ratios, and comparative information provided by Lipper Inc. ("Lipper") and the Fee Consultant regarding investment management fee rates paid to other investment advisors by similar funds (1st quartile being the most favorable and 4th quartile being the least favorable). With respect to management fees paid to other investment advisors by similar funds, the Board noted that the contractual fee rates paid by the Fund, which include a 0.10% fee paid to DIMA under the Fund's administrative services agreement, were higher than the median (3rd quartile) of the applicable Lipper peer group (based on Lipper data provided as of December 31, 2012). The Board noted that the Fund's Class A shares total (net) operating expenses were expected to be lower than the median (2nd quartile) of the applicable Lipper expense universe (based on Lipper data provided as of December 31, 2012, and analyzing Lipper expense universe Class A (net) expenses less any applicable 12b-1 fees) ("Lipper Universe Expenses"). The Board also reviewed data comparing each share class's total (net) operating expenses to the applicable Lipper Universe Expenses. The Board considered the Fund's management fee rate as compared to fees charged by DIMA to comparable funds and considered differences between the Fund and the comparable funds. The Board also considered how the Fund's total (net) operating expenses compared to the total (net) operating expenses of a more customized peer group selected by Lipper (based on such factors as asset size). The Board also noted that the expense limitations agreed to by DIMA helped to ensure that the Fund's total (net) operating expenses would remain competitive.
The information considered by the Board as part of its review of management fees included information regarding fees charged by DIMA and its affiliates to similar institutional accounts and to similar funds offered primarily to European investors ("DWS Europe funds"), in each case as applicable. The Board observed that advisory fee rates for institutional accounts generally were lower than the management fees charged by similarly managed DWS U.S. mutual funds ("DWS Funds"), but also took note of the differences in services provided to DWS Funds as compared to institutional accounts. In the case of DWS Europe funds, the Board observed that fee rates for DWS Europe funds generally were higher than for similarly managed DWS Funds, but noted that differences in the types of services provided to DWS Funds relative to DWS Europe funds made it difficult to compare such fees.
On the basis of the information provided, the Board concluded that management fees were reasonable and appropriate in light of the nature, quality and extent of services provided by DIMA.
Profitability. The Board reviewed detailed information regarding revenues received by DIMA under the Agreement. The Board considered the estimated costs and pre-tax profits realized by DIMA from advising the DWS Funds, as well as estimates of the pre-tax profits attributable to managing the Fund in particular. The Board also received information regarding the estimated enterprise-wide profitability of DWS and its affiliates with respect to all fund services in totality and by fund. The Board and the Fee Consultant reviewed DIMA's methodology in allocating its costs to the management of the Fund. Based on the information provided, the Board concluded that the pre-tax profits realized by DIMA in connection with the management of the Fund were not unreasonable. The Board also reviewed information regarding the profitability of certain similar investment management firms. The Board noted that while information regarding the profitability of such firms is limited (and in some cases is not necessarily prepared on a comparable basis), DIMA and its affiliates' overall profitability with respect to the DWS fund complex (after taking into account distribution and other services provided to the funds by DIMA and its affiliates) was lower than the overall profitability levels of many comparable firms for which such data was available.
Economies of Scale. The Board considered whether there are economies of scale with respect to the management of the Fund and whether the Fund benefits from any economies of scale. The Board noted that the Fund's management fee schedule includes fee breakpoints. The Board concluded that the Fund's fee schedule represents an appropriate sharing between the Fund and DIMA of such economies of scale as may exist in the management of the Fund at current asset levels.
Other Benefits to DIMA and Its Affiliates. The Board also considered the character and amount of other incidental benefits received by DIMA and its affiliates, including any fees received by DIMA for administrative services provided to the Fund and any fees received by an affiliate of DIMA for distribution services. The Board also considered benefits to DIMA related to brokerage and soft-dollar allocations, including allocating brokerage to pay for research generated by parties other than the executing broker dealers, which pertain primarily to funds investing in equity securities, along with the incidental public relations benefits to DIMA related to DWS Funds advertising and cross-selling opportunities among DIMA products and services. The Board concluded that management fees were reasonable in light of these fallout benefits.
Compliance. The Board considered the significant attention and resources dedicated by DIMA to documenting and enhancing its compliance processes in recent years. The Board noted in particular (i) the experience and seniority of both DIMA's chief compliance officer and the Fund's chief compliance officer; (ii) the large number of DIMA compliance personnel; and (iii) the substantial commitment of resources by DIMA and its affiliates to compliance matters.
Based on all of the information considered and the conclusions reached, the Board unanimously determined that the continuation of the Agreement is in the best interests of the Fund. In making this determination, the Board did not give particular weight to any single factor identified above. The Board considered these factors over the course of numerous meetings, certain of which were in executive session with only the Independent Trustees and their independent counsel present. It is possible that individual Trustees may have weighed these factors differently in reaching their individual decisions to approve the continuation of the Agreement.
Notes
DeAWM Distributors, Inc.
222 South Riverside Plaza
Chicago, IL 60606
(800) 621-1148
VS2LCV-3 (R-028386-3 8/14)
June 30, 2014
Semiannual Report
Deutsche Variable Series II
(formerly DWS Variable Series II)
Deutsche Money Market VIP
(formerly DWS Money Market VIP)
Contents
10 Statement of Assets and Liabilities 10 Statement of Operations 11 Statement of Changes in Net Assets 13 Notes to Financial Statements 16 Information About Your Fund's Expenses 18 Advisory Agreement Board Considerations and Fee Evaluation |
This report must be preceded or accompanied by a prospectus. To obtain an additional prospectus or summary prospectus, if available, call (800) 728-3337 or your financial representative. We advise you to consider the Fund's objectives, risks, charges and expenses carefully before investing. The summary prospectus and prospectus contain this and other important information about the Fund. Please read the prospectus carefully before you invest.
An investment in this Fund is not insured or guaranteed by the Federal Deposit Insurance Corporation (FDIC) or by any other government agency. Although the Fund seeks to preserve the value of your investment at $1.00 per share, it is possible to lose money by investing in the Fund. The share price of money market funds can fall below the $1.00 share price. You should not rely on or expect the Advisor to enter into support agreements or take other actions to maintain the Fund's $1.00 share price. The credit quality of the Fund's holdings can change rapidly in certain markets, and the default of a single holding could have an adverse impact on the Fund's share price. The Fund's share price can also be negatively affected during periods of high redemption pressures and/or illiquid markets. The actions of a few large investors in the Fund may have a significant adverse effect on the share price of the Fund. See the prospectus for specific details regarding the Fund's risk profile.
Deutsche Asset & Wealth Management represents the asset management and wealth management activities conducted by Deutsche Bank AG or any of its subsidiaries, including the Advisor and DeAWM Distributors, Inc.
NOT FDIC/NCUA INSURED NO BANK GUARANTEE MAY LOSE VALUE NOT A DEPOSIT
NOT INSURED BY ANY FEDERAL GOVERNMENT AGENCY
Dear Shareholder:
I am very pleased to tell you that the DWS funds have been renamed Deutsche funds, aligning more closely with the Deutsche Asset & Wealth Management brand. We are proud to adopt the Deutsche name — a brand that fully represents the global access, discipline and intelligence that support all of our products and services.
Deutsche Asset & Wealth Management combines the asset management and wealth management divisions of Deutsche Bank to deliver a comprehensive suite of active, passive and alternative investment capabilities. Your investment in the Deutsche funds means you have access to the thought leadership and resources of one of the world’s largest and most influential financial institutions.
In conjunction with your fund’s name change, please note that the Deutsche funds’ Web address has changed as well. The former dws-investments.com is now deutschefunds.com.
In addition, key service providers have been renamed as follows:
| Former Name | New name, effective August 11, 2014 |
| DWS Investments Distributors, Inc. | DeAWM Distributors, Inc. |
| DWS Trust Company | DeAWM Trust Company |
| DWS Investments Service Company | DeAWM Service Company |
These changes have no effect on the day-to-day management of your investment, and there is no action required on your part. You will continue to experience the benefits that come from our decades of experience, in-depth research and worldwide network of investment professionals.
Thanks for your continued support. We appreciate your trust and the opportunity to put our capabilities to work for you.
Best regards,
Brian Binder
President, Deutsche Funds
Performance Summary June 30, 2014 (Unaudited)
Deutsche Money Market VIP
All performance shown is historical, assumes reinvestment of all dividend and capital gain distributions and does not guarantee future results. Investment return and principal value fluctuate with changing market conditions so that, when redeemed, shares may be worth more or less than their original cost. Current performance may be lower or higher than the performance data quoted. Please contact your participating insurance company for the Fund's most recent month-end performance. Performance doesn't reflect charges and fees ("contract charges") associated with the separate account that invests in the Fund or any variable life insurance policy or variable annuity contract for which the Fund is an investment option. These charges and fees will reduce returns. The yield quotation more closely reflects the current earnings of the Fund than the total return quotation.
An investment in this Fund is not insured or guaranteed by the Federal Deposit Insurance Corporation (FDIC) or by any other government agency. Although the Fund seeks to preserve the value of your investment at $1.00 per share, it is possible to lose money by investing in the Fund. The share price of money market funds can fall below the $1.00 share price.
| | 7-Day Current Yield |
| June 30, 2014 | 0.01%* |
| December 31, 2013 | 0.01%* |
* The investment advisor has agreed to waive fees/reimburse expenses. Without such fee waivers/expense reimbursements, the 7-day current yield would have been lower.
Yields are historical, will fluctuate and do not guarantee future performance. The 7-day current yield refers to the income paid by the Fund over a 7-day period expressed as an annual percentage rate of the Fund's shares outstanding.
Portfolio Summary (Unaudited) Asset Allocation (As a % of Investment Portfolio) | 6/30/14 | 12/31/13 |
| | | |
| Commercial Paper | 54% | 50% |
| Repurchase Agreements | 17% | 7% |
| Short-Term Notes | 9% | 16% |
| Certificates of Deposit and Bank Notes | 9% | 15% |
| Time Deposit | 6% | 4% |
| Government & Agency Obligations | 5% | 8% |
| | 100% | 100% |
| Weighted Average Maturity* | 6/30/14 | 12/31/13 |
| | | |
| Deutsche Variable Series II — Deutsche Money Market VIP | 40 days | 43 days |
| First Tier Retail Money Fund Average | 44 days | 43 days |
* The Fund is compared to its respective iMoneyNet Category: First Tier Retail Money Fund Average — Category includes a widely recognized composite of money market funds that invest in only first tier (highest rating) securities. Portfolio Holdings of First Tier funds include U.S. Treasury, U.S. Other, Repos, Time Deposits, Domestic Bank Obligations, Foreign Bank Obligations, First Tier Commercial Paper, Floating Rate Notes and Asset Backed Commercial Paper.
Weighted average maturity, also known as effective maturity, is the weighted average of the maturity date of bonds held by the Fund taking into consideration any available maturity shortening features.
Portfolio holdings and characteristics are subject to change.
For more complete details about the Fund's investment portfolio, see page 6.
Following the Fund's fiscal first and third quarter-end, a complete portfolio holdings listing is filed with the SEC on Form N-Q. In addition, each month, information about the Fund and its portfolio holdings is filed with the SEC on Form N-MFP. The SEC delays the public availability of the information filed on Form N-MFP for 60 days after the end of the reporting period included in the filing. These forms will be available on the SEC's Web site at sec.gov, and they may also be reviewed and copied at the SEC's Public Reference Room in Washington, D.C. Information on the operation of the SEC's Public Reference Room may be obtained by calling (800) SEC-0330. The Fund's portfolio holdings are also posted on deutschefunds.com from time to time. Please see the Fund's current prospectus for more information.
Investment Portfolio June 30, 2014 (Unaudited) | | | Principal Amount ($) | | | Value ($) | |
| | | | |
| Certificates of Deposit and Bank Notes 8.8% | |
| Banco del Estado de Chile, 0.24%, 11/4/2014 | | | 1,200,000 | | | | 1,200,000 | |
| Bank of America NA, 0.17%, 7/31/2014 | | | 1,500,000 | | | | 1,500,000 | |
| Bank of Montreal, 0.17%, 9/10/2014 | | | 1,000,000 | | | | 1,000,000 | |
| China Construction Bank Corp., 0.37%, 7/14/2014 | | | 1,500,000 | | | | 1,500,000 | |
| DNB Bank ASA, 0.23%, 10/9/2014 | | | 1,000,000 | | | | 1,000,000 | |
| DZ Bank AG: | |
| 0.25%, 9/10/2014 | | | 1,000,000 | | | | 1,000,000 | |
| 0.26%, 8/25/2014 | | | 1,000,000 | | | | 1,000,000 | |
| 0.27%, 11/7/2014 | | | 750,000 | | | | 750,000 | |
| Fortis Bank SA, 0.22%, 7/1/2014 | | | 2,000,000 | | | | 2,000,000 | |
| Industrial & Commercial Bank of China Ltd., 0.37%, 7/29/2014 | | | 750,000 | | | | 750,000 | |
| Natixis, 0.223%, 7/14/2014 | | | 850,000 | | | | 850,000 | |
| Nordea Bank Finland PLC, 0.21%, 7/7/2014 | | | 1,500,000 | | | | 1,500,000 | |
| Wal-Mart Stores, Inc., 5.319%, 6/1/2015 | | | 500,000 | | | | 523,525 | |
Total Certificates of Deposit and Bank Notes (Cost $14,573,525) | | | | 14,573,525 | |
| | |
| Commercial Paper 53.8% | |
| Issued at Discount** 41.5% | |
| Albion Capital Corp. SA, 0.13%, 7/7/2014 | | | 4,000,000 | | | | 3,999,913 | |
| Alpine Securitzation, 144A, 0.02%, 7/1/2014 | | | 7,000,000 | | | | 7,000,000 | |
| Apple, Inc., 0.07%, 7/7/2014 | | | 500,000 | | | | 499,994 | |
| Bank Nederlandse Gemeenten, 0.255%, 10/20/2014 | | | 1,500,000 | | | | 1,498,821 | |
| Bedford Row Funding Corp.: | |
| 144A, 0.3%, 4/14/2015 | | | 1,000,000 | | | | 997,608 | |
| 144A, 0.31%, 10/27/2014 | | | 750,000 | | | | 749,238 | |
| 144A, 0.32%, 12/17/2014 | | | 1,000,000 | | | | 998,498 | |
| BNZ International Funding Ltd., 144A, 0.155%, 7/23/2014 | | | 800,000 | | | | 799,924 | |
| Chevron Corp., 144A, 0.12%, 9/16/2014 | | | 750,000 | | | | 749,807 | |
| CNPC Finance HK Ltd.: | |
| 144A, 0.38%, 8/21/2014 | | | 500,000 | | | | 499,731 | |
| 144A, 0.4%, 7/2/2014 | | | 440,000 | | | | 439,995 | |
| Coca-Cola Co., 0.1%, 8/1/2014 | | | 722,000 | | | | 721,938 | |
| Collateralized Commercial Paper Co., LLC, 0.21%, 9/25/2014 | | | 1,500,000 | | | | 1,499,247 | |
| Collateralized Commercial Paper II Co., LLC, 144A, 0.2%, 8/25/2014 | | | 2,000,000 | | | | 1,999,389 | |
| CPPIB Capital, Inc., 0.3%, 2/11/2015 | | | 750,000 | | | | 748,594 | |
| DBS Bank Ltd., 144A, 0.235%, 9/10/2014 | | | 1,000,000 | | | | 999,537 | |
| Dexia Credit Local: | |
| 0.27%, 9/4/2014 | | | 1,000,000 | | | | 999,512 | |
| 0.33%, 8/18/2014 | | | 1,000,000 | | | | 999,560 | |
| DNB Bank ASA, 0.24%, 10/6/2014 | | | 1,750,000 | | | | 1,748,868 | |
| Erste Abwicklungsanstalt: | |
| 144A, 0.12%, 7/7/2014 | | | 3,000,000 | | | | 2,999,940 | |
| 144A, 0.16%, 9/8/2014 | | | 1,500,000 | | | | 1,499,540 | |
| 144A, 0.16%, 9/18/2014 | | | 1,000,000 | | | | 999,649 | |
| | | Principal Amount ($) | | | Value ($) | |
| | | | | | | | | |
| Gotham Funding Corp., 144A, 0.15%, 7/11/2014 | | | 3,000,000 | | | | 2,999,875 | |
| Hannover Funding Co., LLC: | |
| 0.18%, 8/4/2014 | | | 3,000,000 | | | | 2,999,490 | |
| 0.18%, 8/11/2014 | | | 500,000 | | | | 499,897 | |
| MetLife Short Term Funding LLC, 144A, 0.2%, 8/6/2014 | | | 600,000 | | | | 599,880 | |
| Nordea Bank AB: | |
| 0.165%, 7/28/2014 | | | 1,000,000 | | | | 999,876 | |
| 0.22%, 11/12/2014 | | | 500,000 | | | | 499,591 | |
| Old Line Funding LLC, 144A, 0.22%, 9/10/2014 | | | 1,500,000 | | | | 1,499,349 | |
| Oversea-Chinese Banking Corp., Ltd., 0.245%, 9/16/2014 | | | 2,000,000 | | | | 1,998,952 | |
| Philip Morris International, Inc.: | |
| 144A, 0.1%, 7/8/2014 | | | 2,000,000 | | | | 1,999,961 | |
| 144A, 0.12%, 7/21/2014 | | | 500,000 | | | | 499,967 | |
| Regency Markets No. 1 LLC, 144A, 0.12%, 7/3/2014 | | | 4,500,000 | | | | 4,499,970 | |
| Siemens Capital Co., LLC, 144A, 0.13%, 9/19/2014 | | | 1,000,000 | | | | 999,711 | |
| Sinopec Century Bright Capital Investment Ltd., 0.37%, 7/17/2014 | | | 1,000,000 | | | | 999,836 | |
| Skandinaviska Enskilda Banken AB, 0.235%, 9/2/2014 | | | 1,500,000 | | | | 1,499,383 | |
| Standard Chartered Bank: | |
| 0.28%, 11/3/2014 | | | 1,500,000 | | | | 1,498,542 | |
| 0.28%, 11/19/2014 | | | 1,500,000 | | | | 1,498,355 | |
| Swedbank AB: | |
| 0.175%, 8/19/2014 | | | 1,000,000 | | | | 999,762 | |
| 0.255%, 10/16/2014 | | | 1,300,000 | | | | 1,299,015 | |
| Sydney Capital Corp., 144A, 0.19%, 7/24/2014 | | | 3,000,000 | | | | 2,999,636 | |
| United Overseas Bank Ltd., 0.26%, 1/5/2015 | | | 1,000,000 | | | | 998,642 | |
| Victory Receivables Corp., 144A, 0.17%, 8/5/2014 | | | 1,000,000 | | | | 999,835 | |
| Wal-Mart Stores, Inc., 0.1%, 7/28/2014 | | | 1,600,000 | | | | 1,599,880 | |
| Walt Disney Co., 0.1%, 7/31/2014 | | | 1,000,000 | | | | 999,917 | |
| | | | | 68,938,625 | |
| Issued at Par 12.3% | |
| ANZ New Zealand International Ltd., 144A, 0.213%*, 1/12/2015 | | | 1,300,000 | | | | 1,300,000 | |
| ASB Finance Ltd.: | |
| 144A, 0.243%*, 5/22/2015 | | | 1,250,000 | | | | 1,250,000 | |
| 144A, 0.264%*, 10/9/2014 | | | 1,250,000 | | | | 1,249,976 | |
| Atlantic Asset Securitization LLC, 144A, 0.181%*, 8/7/2014 | | | 500,000 | | | | 500,000 | |
| Bank of Montreal: | |
| 0.181%*, 8/14/2014 | | | 1,000,000 | | | | 999,994 | |
| 0.22%*, 9/5/2014 | | | 1,000,000 | | | | 1,000,050 | |
| Bank of Nova Scotia, 0.28%*, 1/13/2015 | | | 800,000 | | | | 800,000 | |
| BNZ International Funding Ltd.: | |
| 144A, 0.243%*, 2/2/2015 | | | 1,000,000 | | | | 1,000,000 | |
| 144A, 0.247%*, 1/20/2015 | | | 1,250,000 | | | | 1,250,000 | |
| Caisse Centrale Desjardins, 144A, 0.227%*, 1/26/2015 | | | 800,000 | | | | 799,954 | |
| Canadian Imperial Bank of Commerce, 0.223%*, 5/8/2015 | | | 500,000 | | | | 500,000 | |
| | | Principal Amount ($) | | | Value ($) | |
| | | | | | | | | |
| Kells Funding LLC: | |
| 144A, 0.223%*, 10/28/2014 | | | 1,200,000 | | | | 1,200,000 | |
| 144A, 0.23%*, 1/27/2015 | | | 1,250,000 | | | | 1,249,963 | |
| 144A, 0.233%*, 2/13/2015 | | | 2,000,000 | | | | 2,000,111 | |
| Nederlandse Waterschapsbank NV, 144A, 0.265%*, 8/15/2014 | | | 800,000 | | | | 800,000 | |
| Old Line Funding LLC, 144A, 0.183%*, 10/10/2014 | | | 1,200,000 | | | | 1,200,000 | |
| PNC Bank NA, 0.27%, 9/5/2014 | | | 1,000,000 | | | | 1,000,000 | |
| Royal Bank of Canada, 0.27%*, 12/11/2014 | | | 1,000,000 | | | | 1,000,000 | |
| Westpac Banking Corp., 144A, 0.225%*, 2/19/2015 | | | 1,250,000 | | | | 1,250,004 | |
| | | | | 20,350,052 | |
Total Commercial Paper (Cost $89,288,677) | | | | 89,288,677 | |
| | |
| Short-Term Notes* 9.1% | |
| Australia & New Zealand Banking Group Ltd., 144A, 0.327%, 5/18/2015 | | | 800,000 | | | | 800,000 | |
| Bank of Nova Scotia: | |
| 0.28%, 9/3/2014 | | | 1,000,000 | | | | 1,000,000 | |
| 0.294%, 6/24/2015 | | | 1,000,000 | | | | 1,000,000 | |
| Canadian Imperial Bank of Commerce, 0.34%, 7/17/2015 | | | 1,800,000 | | | | 1,800,000 | |
| Commonwealth Bank of Australia, 144A, 0.241%, 7/10/2015 | | | 1,200,000 | | | | 1,200,000 | |
| JPMorgan Chase Bank NA, 0.347%, 6/22/2015 | | | 1,000,000 | | | | 1,000,000 | |
| Rabobank Nederland NV: | |
| 0.265%, 7/23/2014 | | | 1,000,000 | | | | 1,000,000 | |
| 0.277%, 12/1/2014 | | | 1,500,000 | | | | 1,500,000 | |
| 0.307%, 7/6/2015 | | | 1,500,000 | | | | 1,500,000 | |
| Svenska Handelsbanken AB, 144A, 0.308%, 10/3/2014 | | | 1,500,000 | | | | 1,500,000 | |
| Wells Fargo Bank NA: | |
| 0.25%, 6/16/2015 | | | 1,000,000 | | | | 1,000,000 | |
| 0.27%, 12/10/2014 | | | 1,000,000 | | | | 1,000,000 | |
| Westpac Banking Corp., 0.231%, 5/11/2015 | | | 800,000 | | | | 800,000 | |
Total Short-Term Notes (Cost $15,100,000) | | | | 15,100,000 | |
| | |
| Time Deposits 6.2% | |
| Citibank NA, 0.08%, 7/2/2014 | | | 4,000,000 | | | | 4,000,000 | |
| Credit Agricole Corporate & Investment Bank, 0.07%, 7/1/2014 | | | 6,344,418 | | | | 6,344,418 | |
Total Time Deposits (Cost $10,344,418) | | | | 10,344,418 | |
| | |
| | | Principal Amount ($) | | | Value ($) | |
| | | | | | | | | |
| Government & Agency Obligations 5.6% | |
| U.S. Government Sponsored Agencies 4.4% | |
| Federal Farm Credit Bank: | |
| 0.113%*, 10/29/2014 | | | 500,000 | | | | 500,025 | |
| 0.133%*, 10/20/2014 | | | 1,000,000 | | | | 1,000,017 | |
| Federal Home Loan Mortgage Corp.: | |
| 0.068%**, 8/7/2014 | | | 2,500,000 | | | | 2,499,820 | |
| 0.08%**, 11/26/2014 | | | 1,200,000 | | | | 1,199,606 | |
| 0.094%**, 10/2/2014 | | | 500,000 | | | | 499,877 | |
| 0.099%**, 10/24/2014 | | | 1,500,000 | | | | 1,499,521 | |
| | | | | 7,198,866 | |
| U.S. Treasury Obligation 1.2% | |
| U.S. Treasury Note, 0.5%, 8/15/2014 | | | 2,000,000 | | | | 2,000,864 | |
Total Government & Agency Obligations (Cost $9,199,730) | | | | 9,199,730 | |
| | |
| Repurchase Agreements 16.5% | |
| Barclays Capital, 0.07%, dated 6/30/2014, to be repurchased at $7,000,014 on 7/1/2014 (a) | | | 7,000,000 | | | | 7,000,000 | |
| BNP Paribas, 0.08%, dated 6/30/2014, to be repurchased at $8,000,622 on 8/4/2014 (b) | | | 8,000,000 | | | | 8,000,000 | |
| BNP Paribas, 0.23%***, dated 12/23/2013, to be repurchased at $1,502,147 on 8/4/2014 (c) | | | 1,500,000 | | | | 1,500,000 | |
| JPMorgan Securities, Inc., 0.36%***, dated 3/18/2014, to be repurchased at $2,503,725 on 8/14/2014 (d) | | | 2,500,000 | | | | 2,500,000 | |
| JPMorgan Securities, Inc., 0.39%***, dated 2/13/2014, to be repurchased at $1,253,087 on 9/29/2014 (e) | | | 1,250,000 | | | | 1,250,000 | |
| Nomura Securities International, 0.11%, dated 6/30/2014, to be repurchased at $5,000,015 on 7/1/2014 (f) | | | 5,000,000 | | | | 5,000,000 | |
| The Toronto-Dominion Bank, 0.11%, dated 6/30/2014, to be repurchased at $1,000,003 on 7/1/2014 (g) | | | 1,000,000 | | | | 1,000,000 | |
| Wells Fargo Bank, 0.38%, dated 5/8/2014, to be repurchased at $1,201,140 on 8/6/2014 (h) | | | 1,200,000 | | | | 1,200,000 | |
Total Repurchase Agreements (Cost $27,450,000) | | | | 27,450,000 | |
| | | % of Net Assets | | | Value ($) | |
| | | | |
Total Investment Portfolio (Cost $165,956,350)† | | | 100.0 | | | | 165,956,350 | |
| Other Assets and Liabilities, Net | | | 0.0 | | | | 67,338 | |
| Net Assets | | | 100.0 | | | | 166,023,688 | |
* Floating rate securities' yields vary with a designated market index or market rate, such as the coupon-equivalent of the U.S. Treasury Bill rate. These securities are shown at their current rate as of June 30, 2014.
** Annualized yield at time of purchase; not a coupon rate.
*** Open maturity repurchase agreement whose interest rate resets periodically and is shown at the current rate as of June 30, 2014. The dated date is the original day the repurchase agreement was entered into, the maturity date represents the next repurchase date. Upon notice, both the Fund and counterparty have the right to terminate the repurchase agreement at any time.
† The cost for federal income tax purposes was $165,956,350.
(a) Collateralized by $7,145,600 U.S. Treasury Note, 1.625%, maturing on 6/30/2019 with a value of $7,140,019.
(b) Collateralized by:
| Principal Amount ($) | | Security | | Rate (%) | | Maturity Date | | Collateral Value ($) | |
| | 1,092,900 | | Federal Home Loan Mortgage Corp. | | | 4.0–6.0 | | 10/1/2031–8/1/2038 | | | 1,224,897 | |
| | 4,306,281 | | Federal National Mortgage Association | | | 4.0–7.0 | | 4/1/2015–6/1/2041 | | | 4,737,894 | |
| | 2,000,334 | | Government National Mortgage Association | | | 2.5–5.5 | | 5/15/2037–12/15/2042 | | | 2,197,209 | |
| Total Collateral Value | | | | | | | | 8,160,000 | |
(c) Collateralized by:
| Principal Amount ($) | | Security | | Rate (%) | | Maturity Date | | Collateral Value ($) | |
| | 1,372,004 | | Bank of America Corp. | | | 6.0 | | 9/1/2017 | | | 1,578,564 | |
| | 254 | | Petroleos Mexicanos | | | 6.5 | | 6/2/2041 | | | 296 | |
| Total Collateral Value | | | | | | | | 1,578,860 | |
(d) Collateralized by $2,560,000 Bank of America Corp., 1.05%, maturing on 3/22/2016 with a value of $2,579,695.
(e) Collateralized by $1,280,000 Bank of America Corp., 1.05%, maturing on 3/22/2016 with a value of $1,289,847.
(f) Collateralized by:
| Principal Amount ($) | | Security | | Rate (%) | | Maturity Date | | Collateral Value ($) | |
| | 1,000 | | Federal National Mortgage Association | | | 4.0 | | 7/1/2044 | | | 1,065 | |
| | 4,735,519 | | Government National Mortgage Association | | | 2.49–6.0 | | 10/15/2033–6/20/2044 | | | 5,098,937 | |
| Total Collateral Value | | | | | | | | 5,100,002 | |
(g) Collateralized by:
| Principal Amount ($) | | Security | | Rate (%) | | Maturity Date | | Collateral Value ($) | |
| | 604,659 | | Apple, Inc. | | | 2.85 | | 5/6/2021 | | | 613,297 | |
| | 702 | | Bank of Nova Scotia | | | 1.75 | | 3/22/2017 | | | 719 | |
| | 1,683 | | Citigroup, Inc. | | | 3.75 | | 6/16/2024 | | | 1,689 | |
| | 416,250 | | MasterCard, Inc. | | | 3.375 | | 4/1/2024 | | | 421,170 | |
| | 679 | | Westpac Banking Corp. | | | 2.0 | | 5/21/2019 | | | 680 | |
| Total Collateral Value | | | | | | | | 1,037,555 | |
(h) Collateralized by $901,495 Wells Fargo Bank NA, 6.6%, maturing on 1/15/2038 with a value of $1,241,187.
144A: Security exempt from registration under Rule 144A of the Securities Act of 1933. These securities may be resold in transactions exempt from registration, normally to qualified institutional buyers.
Fair Value Measurements
Various inputs are used in determining the value of the Fund's investments. These inputs are summarized in three broad levels. Level 1 includes quoted prices in active markets for identical securities. Level 2 includes other significant observable inputs (including quoted prices for similar securities, interest rates, prepayment speeds and credit risk). Level 3 includes significant unobservable inputs (including the Fund's own assumptions in determining the fair value of investments). The level assigned to the securities valuations may not be an indication of the risk or liquidity associated with investing in those securities. Securities held by the Fund are reflected as Level 2 because the securities are valued at amortized cost (which approximates fair value) and, accordingly, the inputs used to determine value are not quoted prices in an active market.
The following is a summary of the inputs used as of June 30, 2014 in valuing the Fund's investments. For information on the Fund's policy regarding the valuation of investments, please refer to the Security Valuation section of Note A in the accompanying Notes to Financial Statements.
| Assets | | Level 1 | | | Level 2 | | | Level 3 | | | Total | |
| | |
| Investments in Securities (i) | | $ | | | | $ | 138,506,350 | | | $ | — | | | $ | 138,506,350 | |
| Repurchase Agreements | | | — | | | | 27,450,000 | | | | — | | | | 27,450,000 | |
| Total | | $ | — | | | $ | 165,956,350 | | | $ | — | | | $ | 165,956,350 | |
There have been no transfers between fair value measurement levels during the period ended June 30, 2014.
(i) See Investment Portfolio for additional detailed categorizations.
The accompanying notes are an integral part of the financial statements.
Statement of Assets and Liabilities | as of June 30, 2014 (Unaudited) | |
| Assets | |
| Investments in non-affiliated securities, valued at amortized cost | | $ | 138,506,350 | |
| Repurchase agreements, valued at amortized cost | | | 27,450,000 | |
| Total investments, valued at amortized cost | | | 165,956,350 | |
| Cash | | | 35 | |
| Receivable for Fund shares sold | | | 314,058 | |
| Interest receivable | | | 26,763 | |
| Due from Advisor | | | 8 | |
| Other assets | | | 1,329 | |
| Total assets | | | 166,298,543 | |
| Liabilities | |
| Payable for Fund shares redeemed | | | 185,182 | |
| Distributions payable | | | 636 | |
| Accrued Trustees' fees | | | 27 | |
| Other accrued expenses and payables | | | 89,010 | |
| Total liabilities | | | 274,855 | |
| Net assets, at value | | $ | 166,023,688 | |
| Net Assets Consist of | |
| Undistributed net investment income | | | 712 | |
| Accumulated net realized gain (loss) | | | (81 | ) |
| Paid-in capital | | | 166,023,057 | |
| Net assets, at value | | $ | 166,023,688 | |
Class A Net Asset Value, offering and redemption price per share ($166,023,688 ÷ 166,106,772 outstanding shares of beneficial interest, no par value, unlimited number of shares authorized) | | $ | 1.00 | |
The accompanying notes are an integral part of the financial statements.
Statement of Operations
| for the six months ended June 30, 2014 (Unaudited) | |
| Investment Income | |
Income: Interest | | $ | 158,452 | |
Expenses: Management fee | | | 239,350 | |
| Administration fee | | | 83,983 | |
| Services to shareholders | | | 1,066 | |
| Custodian fee | | | 12,961 | |
| Professional fees | | | 25,803 | |
| Reports to shareholders | | | 40,406 | |
| Trustees' fee and expenses | | | 4,344 | |
| Other | | | 4,726 | |
| Total expenses before expense reductions | | | 412,639 | |
| Expense reductions | | | (262,592 | ) |
| Total expenses after expense reductions | | | 150,047 | |
| Net investment income | | | 8,405 | |
| Net realized gain (loss) | | | (81 | ) |
| Net increase (decrease) in net assets resulting from operations | | $ | 8,324 | |
The accompanying notes are an integral part of the financial statements.
Statement of Changes in Net Assets | Increase (Decrease) in Net Assets | | Six Months Ended June 30, 2014 (Unaudited) | | | Year Ended December 31, 2013 | |
Operations: Net investment income | | $ | 8,405 | | | $ | 18,768 | |
Operations: Net investment income | | $ | 8,405 | | | $ | 18,768 | |
| Net realized gain (loss) | | | (81 | ) | | | 509 | |
| Net increase (decrease) in net assets resulting from operations | | | 8,324 | | | | 19,277 | |
Distributions to shareholders from: Net investment income Class A | | | (8,405 | ) | | | (18,768 | ) |
| Total distributions | | | (8,405 | ) | | | (18,768 | ) |
Fund share transactions: Class A Proceeds from shares sold | | | 29,657,906 | | | | 93,469,677 | |
| Reinvestment of distributions | | | 8,485 | | | | 18,849 | |
| Cost of shares redeemed | | | (37,322,402 | ) | | | (115,953,059 | ) |
| Net increase (decrease) in net assets from Class A share transactions | | | (7,656,011 | ) | | | (22,464,533 | ) |
| Increase (decrease) in net assets | | | (7,656,092 | ) | | | (22,464,024 | ) |
| Net assets at beginning of period | | | 173,679,780 | | | | 196,143,804 | |
| Net assets at end of period (including undistributed net investment income of $712 and $712, respectively) | | $ | 166,023,688 | | | $ | 173,679,780 | |
| Other Information | |
Class A Shares outstanding at beginning of period | | | 173,762,783 | | | | 196,227,316 | |
| Shares sold | | | 29,657,906 | | | | 93,469,677 | |
| Shares issued to shareholders in reinvestment of distributions | | | 8,485 | | | | 18,849 | |
| Shares redeemed | | | (37,322,402 | ) | | | (115,953,059 | ) |
| Net increase (decrease) in Class A shares | | | (7,656,011 | ) | | | (22,464,533 | ) |
| Shares outstanding at end of period | | | 166,106,772 | | | | 173,762,783 | |
The accompanying notes are an integral part of the financial statements.
| | | | | | Years Ended December 31, | |
| Class A | | Six Months Ended 6/30/14 (Unaudited) | | | 2013 | | | 2012 | | | 2011 | | | 2010 | | | 2009 | |
| Selected Per Share Data | |
| Net asset value, beginning of period | | $ | 1.000 | | | $ | 1.000 | | | $ | 1.000 | | | $ | 1.000 | | | $ | 1.000 | | | $ | 1.000 | |
Income from investment operations: Net investment income | | | .000 | *** | | | .000 | *** | | | .000 | *** | | | .000 | *** | | | .000 | *** | | | .003 | |
| Net realized gain (loss) | | | (.000 | )*** | | | .000 | *** | | | .000 | *** | | | .000 | *** | | | .000 | *** | | | .000 | *** |
| Total from investment operations | | | .000 | *** | | | .000 | *** | | | .000 | *** | | | .000 | *** | | | .000 | *** | | | .003 | |
Less distributions from: Net investment income | | | (.000 | )*** | | | (.000 | )*** | | | (.000 | )*** | | | (.000 | )*** | | | (.000 | )*** | | | (.003 | ) |
| Net asset value, end of period | | $ | 1.000 | | | $ | 1.000 | | | $ | 1.000 | | | $ | 1.000 | | | $ | 1.000 | | | $ | 1.000 | |
| Total Return (%) | | | .00 | a,b** | | | .01 | a | | | .01 | a | | | .01 | a | | | .01 | a | | | .34 | |
| Ratios to Average Net Assets and Supplemental Data | |
| Net assets, end of period ($ millions) | | | 166 | | | | 174 | | | | 196 | | | | 217 | | | | 220 | | | | 270 | |
| Ratio of expenses before expense reductions (%) | | | .49 | * | | | .49 | | | | .45 | | | | .51 | | | | .46 | | | | .43 | |
| Ratio of expenses after expense reductions (%) | | | .18 | * | | | .20 | | | | .31 | | | | .25 | | | | .34 | | | | .43 | |
| Ratio of net investment income (%) | | | .01 | * | | | .01 | | | | .01 | | | | .01 | | | | .01 | | | | .37 | |
a Total return would have been lower had certain expenses not been reduced. b Amount is less than .005%. * Annualized ** Not annualized *** Amount is less than $.0005. | |
Notes to Financial Statements (Unaudited)
A. Organization and Significant Accounting Policies
Deutsche Money Market VIP (formerly DWS Money Market VIP) (the "Fund") is a diversified series of Deutsche Variable Series II (formerly DWS Variable Series II) (the "Trust"), which is registered under the Investment Company Act of 1940, as amended (the "1940 Act"), as an open-end management investment company organized as a Massachusetts business trust.
The Fund's financial statements are prepared in accordance with accounting principles generally accepted in the United States of America which require the use of management estimates. Actual results could differ from those estimates. The policies described below are followed consistently by the Fund in the preparation of its financial statements.
Security Valuation. Various inputs are used in determining the value of the Fund's investments. These inputs are summarized in three broad levels. Level 1 includes quoted prices in active markets for identical securities. Level 2 includes other significant observable inputs (including quoted prices for similar securities, interest rates, prepayment speeds and credit risk). Level 3 includes significant unobservable inputs (including the Fund's own assumptions in determining the fair value of investments). The level assigned to the securities valuations may not be an indication of the risk or liquidity associated with investing in those securities.
The Fund values all securities utilizing the amortized cost method permitted in accordance with Rule 2a-7 under the 1940 Act and certain conditions therein. Under this method, which does not take into account unrealized capital gains or losses on securities, an instrument is initially valued at its cost and thereafter assumes a constant accretion/amortization rate to maturity of any discount or premium. Securities held by the Fund are reflected as Level 2 because the securities are valued at amortized cost (which approximates fair value) and, accordingly, the inputs used to determine value are not quoted prices in an active market.
Disclosure about the classification of fair value measurements is included in a table following the Fund's Investment Portfolio.
Repurchase Agreements. The Fund may enter into repurchase agreements, under the terms of a Master Repurchase Agreement, with certain banks and broker/dealers whereby the Fund, through its custodian or a sub-custodian bank, receives delivery of the underlying securities, the amount of which at the time of purchase and each subsequent business day is required to be maintained at such a level that the value is equal to at least the principal amount of the repurchase price plus accrued interest. The custodian bank or another designated sub-custodian holds the collateral in a separate account until the agreement matures. If the value of the securities falls below the principal amount of the repurchase agreement plus accrued interest, the financial institution deposits additional collateral by the following business day. If the financial institution either fails to deposit the required additional collateral or fails to repurchase the securities as agreed, the Fund has the right to sell the securities and recover any resulting loss from the financial institution. If the financial institution enters into bankruptcy, the Fund's claim on the collateral may be subject to legal proceedings.
As of June 30, 2014, the Fund held repurchase agreements with a gross value of $27,450,000. The value of the related collateral exceeded the value of the repurchase agreements at period end. The detail of the related collateral is included in the footnotes following the Fund's Investment Portfolio.
Federal Income Taxes. The Fund's policy is to comply with the requirements of the Internal Revenue Code, as amended, which are applicable to regulated investment companies and to distribute all of its taxable income to its shareholders.
The Fund has reviewed the tax positions for the open tax years as of December 31, 2013 and has determined that no provision for income tax and/or uncertain tax provisions is required in the Fund's financial statements. The Fund's federal tax returns for the prior three fiscal years remain open subject to examination by the Internal Revenue Service.
Distribution of Income and Gains. Net investment income of the Fund is declared as a daily dividend and is distributed to shareholders monthly. The Fund may take into account capital gains and losses in its daily dividend declarations. The Fund may also make additional distributions for tax purposes if necessary.
Permanent book and tax differences relating to shareholder distributions will result in reclassifications to paid-in capital. Temporary book and tax differences will reverse in a subsequent period. There were no significant book to tax differences for the Fund.
The tax character of current year distributions will be determined at the end of the current fiscal year.
Expenses. Expenses of the Trust arising in connection with a specific fund are allocated to that fund. Other Trust expenses which cannot be directly attributed to a fund are apportioned among the funds in the Trust based upon the relative net assets or other appropriate measures.
Contingencies. In the normal course of business, the Fund may enter into contracts with service providers that contain general indemnification clauses. The Fund's maximum exposure under these arrangements is unknown as this would involve future claims that may be made against the Fund that have not yet been made. However, based on experience, the Fund expects the risk of loss to be remote.
Other. Investment transactions are accounted for on a trade date. Interest income is recorded on the accrual basis. Realized gains and losses from investment transactions are recorded on an identified cost basis. All discounts and premiums are accreted/amortized for both tax and financial reporting purposes.
B. Related Parties
Management Agreement. Under the Investment Management Agreement with Deutsche Investment Management Americas Inc. ("DIMA" or the "Advisor"), an indirect, wholly owned subsidiary of Deutsche Bank AG, the Advisor directs the investments of the Fund in accordance with its investment objectives, policies and restrictions. The Advisor determines the securities, instruments and other contracts relating to investments to be purchased, sold or entered into by the Fund.
Pursuant to the Investment Management Agreement with the Advisor, the Fund pays a monthly management fee based on the Fund's average daily net assets, computed and accrued daily and payable monthly, at the following annual rates:
| First $500 million | | | .285 | % |
| Next $500 million | | | .270 | % |
| Next $1.0 billion | | | .255 | % |
| Over $2.0 billion | | | .240 | % |
For the period from January 1, 2014 through September 30, 2014, the Advisor has contractually agreed to waive its fee and/or reimburse certain operating expenses to the extent necessary to maintain the operating expenses (excluding certain expenses such as extraordinary expenses, taxes, brokerage and interest expense) at 0.51%.
In addition, the Advisor has agreed to voluntarily waive additional expenses for the Fund. The waiver may be changed or terminated at any time without notice. Under this arrangement, the Advisor waived certain expenses of the Fund.
Accordingly, for the six months ended June 30, 2014, the fee pursuant to the Investment Management Agreement aggregated $239,350, all of which was waived, resulting in an annualized effective rate of 0.00% of the Fund's average daily net assets.
Administration Fee. Pursuant to an Administrative Services Agreement, DIMA provides most administrative services to the Fund. For all services provided under the Administrative Services Agreement, the Fund pays DIMA an annual fee ("Administration Fee") of 0.10% of the Fund's average daily net assets, computed and accrued daily and payable monthly. For the six months ended June 30, 2014, the Administration Fee was $83,983, of which $22,929 was waived and $9,161 is unpaid.
Service Provider Fees. DeAWM Service Company ("DSC"), an affiliate of the Advisor, is the transfer agent, dividend-paying agent and shareholder service agent for the Fund. Pursuant to a sub-transfer agency agreement between DSC and DST Systems, Inc. ("DST"), DSC has delegated certain transfer agent, dividend-paying agent and shareholder service agent functions to DST. DSC compensates DST out of the shareholder servicing fee it receives from the Fund. For the six months ended June 30, 2014, the amounts charged to the Fund by DSC aggregated $313, all of which was waived.
Typesetting and Filing Service Fees. Under an agreement with DIMA, DIMA is compensated for providing typesetting and certain regulatory filing services to the Fund. For the six months ended June 30, 2014, the amount charged to the Fund by DIMA included in the Statement of Operations under "reports to shareholders" aggregated $6,501, of which $3,461 is unpaid.
Trustees' Fees and Expenses. The Fund paid retainer fees to each Trustee not affiliated with the Advisor, plus specified amounts to the Board Chairperson and Vice Chairperson and to each committee Chairperson.
C. Ownership of the Fund
At June 30, 2014, three participating insurance companies were owners of record of 10% or more of the total outstanding Class A shares of the Fund, each owning 52%, 20% and 12%.
D. Line of Credit
The Fund and other affiliated funds (the "Participants") share in a $400 million revolving credit facility provided by a syndication of banks. The Fund may borrow for temporary or emergency purposes, including the meeting of redemption requests that otherwise might require the untimely disposition of securities. The Participants are charged an annual commitment fee which is allocated based on net assets, among each of the Participants. Interest is calculated at a rate per annum equal to the sum of the Federal Funds Rate, plus 1.25 percent plus if LIBOR exceeds the Federal Funds Rate, the amount of such excess. The Fund may borrow up to a maximum of 33 percent of its net assets under the agreement: The Fund had no outstanding loans at June 30, 2014.
E. Fund Name Change
Effective August 11, 2014, the "DWS Funds" were rebranded "Deutsche Funds."
Information About Your Fund's Expenses (Unaudited)
As an investor of the Fund, you incur two types of costs: ongoing expenses and transaction costs. Ongoing expenses include management fees and other Fund expenses. Examples of transaction costs include contract charges and account maintenance fees, which are not shown in this section. The following tables are intended to help you understand your ongoing expenses (in dollars) of investing in the Fund and to help you compare these expenses with the ongoing expenses of investing in other mutual funds. In the most recent six-month period the Fund limited these expenses; had it not done so, expenses would have been higher. The example in the table is based on an investment of $1,000 invested at the beginning of the six-month period and held for the entire period (January 1, 2014 to June 30, 2014).
The tables illustrate your Fund's expenses in two ways:
—Actual Fund Return. This helps you estimate the actual dollar amount of ongoing expenses (but not transaction costs) paid on a $1,000 investment in the Fund using the Fund's actual return during the period. To estimate the expenses you paid over the period, simply divide your account value by $1,000 (for example, an $8,600 account value divided by $1,000 = 8.6), then multiply the result by the number in the "Expenses Paid per $1,000" line under the share class you hold.
—Hypothetical 5% Fund Return. This helps you to compare your Fund's ongoing expenses (but not transaction costs) with those of other mutual funds using the Fund's actual expense ratio and a hypothetical rate of return of 5% per year before expenses. Examples using a 5% hypothetical Fund return may be found in the shareholder reports of other mutual funds. The hypothetical account values and expenses may not be used to estimate the actual ending account balance or expenses you paid for the period.
Please note that the expenses shown in these tables are meant to highlight your ongoing expenses only and do not reflect any transaction costs. The "Expenses Paid per $1,000" line of the tables is useful in comparing ongoing expenses only and will not help you determine the relative total expense of owning different funds. If these transaction costs had been included, your costs would have been higher.
Expenses and Value of a $1,000 Investment for the six months ended June 30, 2014 | |
| Actual Fund Return | | Class A | |
| Beginning Account Value 1/1/14 | | $ | 1,000.00 | |
| Ending Account Value 6/30/14 | | $ | 1,000.05 | |
| Expenses Paid per $1,000* | | $ | .89 | |
| Hypothetical 5% Fund Return | | Class A | |
| Beginning Account Value 1/1/14 | | $ | 1,000.00 | |
| Ending Account Value 6/30/14 | | $ | 1,023.90 | |
| Expenses Paid per $1,000* | | $ | .90 | |
* Expenses are equal to the Fund's annualized expense ratio, multiplied by the average account value over the period, multiplied by 181 (the number of days in the most recent six-month period), then divided by 365.
| Annualized Expense Ratio | Class A | |
| Deutsche Variable Series II — Deutsche Money Market VIP | .18% | |
For more information, please refer to the Fund's prospectus.
These tables do not reflect charges and fees ("contract charges") associated with the separate account that invests in the Fund or any variable life insurance policy or variable annuity contract for which the Fund is an investment option.
For an analysis of the fees associated with an investment in the fund or similar funds, please refer to the current and hypothetical expense calculators for Variable Insurance Products which can be found at deutschefunds.com/EN/resources/calculators.jsp.
Proxy Voting
The Trust's policies and procedures for voting proxies for portfolio securities and information about how the Trust voted proxies related to its portfolio securities during the 12-month period ended June 30 are available on our Web site — deutschefunds.com (click on "proxy voting" at the bottom of the page) — or on the SEC's Web site — sec.gov. To obtain a written copy of the Trust's policies and procedures without charge, upon request, call us toll free at (800) 728-3337.
Money Market Fund Reform
In July 2014,the SEC adopted money market fund reform to address potential systemic risks associated with money market funds and to improve transparency for money market fund investors. The fund is required to comply with money market reform over the next two years. As a result, the fund may be required to take certain steps that will impact its structure and/or operations, which could impact the return potential of the fund.
Advisory Agreement Board Considerations and Fee Evaluation
The Board of Trustees approved the renewal of DWS Money Market VIP's investment management agreement (the "Agreement") with Deutsche Investment Management Americas Inc. ("DIMA") in September 2013.
In terms of the process that the Board followed prior to approving the Agreement, shareholders should know that:
— In September 2013, all but one of the Fund's Trustees were independent of DIMA and its affiliates.
— The Trustees met frequently during the past year to discuss fund matters and dedicated a substantial amount of time to contract review matters. Over the course of several months, the Board's Contract Committee, in coordination with the Board's Fixed Income and Asset Allocation Oversight Committee, reviewed comprehensive materials received from DIMA, independent third parties and independent counsel. These materials included an analysis of the Fund's performance, fees and expenses, and profitability compiled by a fee consultant retained by the Fund's Independent Trustees (the "Fee Consultant"). The Board also received extensive information throughout the year regarding performance of the Fund.
— The Independent Trustees regularly meet privately with their independent counsel to discuss contract review and other matters. In addition, the Independent Trustees were also advised by the Fee Consultant in the course of their review of the Fund's contractual arrangements and considered a comprehensive report prepared by the Fee Consultant in connection with their deliberations.
— In connection with reviewing the Agreement, the Board also reviewed the terms of the Fund's distribution agreement, administrative services agreement, transfer agency agreement and other material service agreements.
— Based on its evaluation of the information provided, the Contract Committee presented its findings and recommendations to the Board. The Board then reviewed the Contract Committee's findings and recommendations.
In connection with the contract review process, the Contract Committee and the Board considered the factors discussed below, among others. The Board also considered that DIMA and its predecessors have managed the Fund since its inception, and the Board believes that a long-term relationship with a capable, conscientious advisor is in the best interests of the Fund. The Board considered, generally, that shareholders chose to invest or remain invested in the Fund knowing that DIMA managed the Fund, and that the Agreement was approved by the Fund's shareholders. DIMA is part of Deutsche Bank AG, a major global banking institution that is engaged in a wide range of financial services. The Board believes that there are advantages to being part of a global asset management business that offers a wide range of investing expertise and resources, including hundreds of portfolio managers and analysts with research capabilities in many countries throughout the world.
As part of the contract review process, the Board carefully considered the fees and expenses of each DWS fund overseen by the Board in light of the fund's performance. In many cases, this led to a negotiation with DIMA of lower expense caps as part of the 2012 and 2013 contract review processes than had previously been in place. As part of these negotiations, the Board indicated that it would consider relaxing these new lower caps in future years following sustained improvements in performance, among other considerations.
In June 2012, Deutsche Bank AG ("DB"), DIMA's parent company, announced that DB would combine its Asset Management (of which DIMA was a part) and Wealth Management divisions. DB has advised the Independent Trustees that the U.S. asset management business is a critical and integral part of DB, and that it has, and will continue to, reinvest a significant portion of the substantial savings it expects to realize by combining its Asset Management and Wealth Management divisions into the new Asset and Wealth Management ("AWM") division, including ongoing enhancements to its investment capabilities. DB also has confirmed its commitment to maintaining strong legal and compliance groups within the AWM division.
While shareholders may focus primarily on fund performance and fees, the Fund's Board considers these and many other factors, including the quality and integrity of DIMA's personnel and such other issues as back-office operations, fund valuations, and compliance policies and procedures.
Nature, Quality and Extent of Services. The Board considered the terms of the Agreement, including the scope of advisory services provided under the Agreement. The Board noted that, under the Agreement, DIMA provides portfolio management services to the Fund and that, pursuant to a separate administrative services agreement, DIMA provides administrative services to the Fund. The Board considered the experience and skills of senior management and investment personnel, the resources made available to such personnel, the ability of DIMA to attract and retain high-quality personnel, and the organizational depth and stability of DIMA. The Board reviewed the Fund's performance over short-term and long-term periods and compared those returns to various agreed-upon performance measures, including a peer universe compiled by the Fee Consultant using information supplied by iMoneyNet, an independent fund data service. The Board also noted that it has put into place a process of identifying "Focus Funds" (e.g., funds performing poorly relative to their benchmark or a peer universe compiled by an independent fund data service), and receives more frequent reporting and information from DIMA regarding such funds, along with DIMA's remedial plans to address underperformance. The Board believes this process is an effective manner of identifying and addressing underperforming funds. Based on the information provided, the Board noted that for the one- and three-year periods ended December 31, 2012, the Fund's gross performance (Class A shares) was in the 1st quartile and 2nd quartile, respectively, of the applicable iMoneyNet universe (the 1st quartile being the best performers and the 4th quartile being the worst performers).
Fees and Expenses. The Board considered the Fund's investment management fee schedule, operating expenses and total expense ratios, and comparative information provided by Lipper Inc. ("Lipper") and the Fee Consultant regarding investment management fee rates paid to other investment advisors by similar funds (1st quartile being the most favorable and 4th quartile being the least favorable). With respect to management fees paid to other investment advisors by similar funds, the Board noted that the contractual fee rates paid by the Fund, which include a 0.10% fee paid to DIMA under the Fund's administrative services agreement, were lower than the median (2nd quartile) of the applicable Lipper peer group (based on Lipper data provided as of December 31, 2012). The Board noted that the Fund's Class A shares total (net) operating expenses were higher than the median (4th quartile) of the applicable Lipper expense universe (based on Lipper data provided as of December 31, 2012). The Board considered the Fund's management fee rate as compared to fees charged by DIMA to comparable funds and considered differences between the Fund and the comparable funds. The Board also considered how the Fund's total (net) operating expenses compared to the total (net) operating expenses of a more customized peer group selected by Lipper (based on such factors as asset size). The Board noted the expense limitation agreed to by DIMA. The Board also noted the significant voluntary fee waivers implemented by DIMA to ensure the Fund maintained a positive yield.
The information considered by the Board as part of its review of management fees included information regarding fees charged by DIMA and its affiliates to similar institutional accounts and to similar funds offered primarily to European investors ("DWS Europe funds"), in each case as applicable. The Board observed that advisory fee rates for institutional accounts generally were lower than the management fees charged by similarly managed DWS U.S. mutual funds ("DWS Funds"), but also took note of the differences in services provided to DWS Funds as compared to institutional accounts. In the case of DWS Europe funds, the Board observed that fee rates for DWS Europe funds generally were higher than for similarly managed DWS Funds, but noted that differences in the types of services provided to DWS Funds relative to DWS Europe funds made it difficult to compare such fees.
On the basis of the information provided, the Board concluded that management fees were reasonable and appropriate in light of the nature, quality and extent of services provided by DIMA.
Profitability. The Board reviewed detailed information regarding revenues received by DIMA under the Agreement. The Board considered the estimated costs and pre-tax profits realized by DIMA from advising the DWS Funds, as well as estimates of the pre-tax profits attributable to managing the Fund in particular. The Board also received information regarding the estimated enterprise-wide profitability of DWS and its affiliates with respect to all fund services in totality and by fund. The Board and the Fee Consultant reviewed DIMA's methodology in allocating its costs to the management of the Fund. Based on the information provided, the Board concluded that the pre-tax profits realized by DIMA in connection with the management of the Fund were not unreasonable. The Board also reviewed information regarding the profitability of certain similar investment management firms. The Board noted that while information regarding the profitability of such firms is limited (and in some cases is not necessarily prepared on a comparable basis), DIMA and its affiliates' overall profitability with respect to the DWS fund complex (after taking into account distribution and other services provided to the funds by DIMA and its affiliates) was lower than the overall profitability levels of many comparable firms for which such data was available.
Economies of Scale. The Board considered whether there are economies of scale with respect to the management of the Fund and whether the Fund benefits from any economies of scale. The Board noted that the Fund's management fee schedule includes fee breakpoints. The Board concluded that the Fund's fee schedule represents an appropriate sharing between the Fund and DIMA of such economies of scale as may exist in the management of the Fund at current asset levels.
Other Benefits to DIMA and Its Affiliates. The Board also considered the character and amount of other incidental benefits received by DIMA and its affiliates, including any fees received by DIMA for administrative services provided to the Fund and any fees received by an affiliate of DIMA for distribution services. The Board also considered benefits to DIMA related to brokerage and soft-dollar allocations, including allocating brokerage to pay for research generated by parties other than the executing broker dealers, which pertain primarily to funds investing in equity securities, along with the incidental public relations benefits to DIMA related to DWS Funds advertising and cross-selling opportunities among DIMA products and services. The Board concluded that management fees were reasonable in light of these fallout benefits.
Compliance. The Board considered the significant attention and resources dedicated by DIMA to documenting and enhancing its compliance processes in recent years. The Board noted in particular (i) the experience and seniority of both DIMA's chief compliance officer and the Fund's chief compliance officer; (ii) the large number of DIMA compliance personnel; and (iii) the substantial commitment of resources by DIMA and its affiliates to compliance matters.
Based on all of the information considered and the conclusions reached, the Board unanimously determined that the continuation of the Agreement is in the best interests of the Fund. In making this determination, the Board did not give particular weight to any single factor identified above. The Board considered these factors over the course of numerous meetings, certain of which were in executive session with only the Independent Trustees and their independent counsel present. It is possible that individual Trustees may have weighed these factors differently in reaching their individual decisions to approve the continuation of the Agreement.
DeAWM Distributors, Inc.
222 South Riverside Plaza
Chicago, IL 60606
(800) 621-1148
VS2MM-3 (R-028387-3 8/14)
June 30, 2014
Semiannual Report
Deutsche Variable Series II
(formerly DWS Variable Series II)
Deutsche Small Mid Cap Growth VIP
(formerly DWS Small Mid Cap Growth VIP)
Contents
5 Portfolio Management Team 9 Statement of Assets and Liabilities 9 Statement of Operations 10 Statement of Changes in Net Assets 12 Notes to Financial Statements 16 Information About Your Fund's Expenses 18 Advisory Agreement Board Considerations and Fee Evaluation |
This report must be preceded or accompanied by a prospectus. To obtain an additional prospectus or summary prospectus, if available, call (800) 728-3337 or your financial representative. We advise you to consider the Fund's objectives, risks, charges and expenses carefully before investing. The summary prospectus and prospectus contain this and other important information about the Fund. Please read the prospectus carefully before you invest.
Investing in derivatives entails special risks relating to liquidity, leverage and credit that may reduce returns and/or increase volatility. Smaller and medium company stocks tend to be more volatile than large company stocks. The Fund may lend securities to approved institutions. Stocks may decline in value. See the prospectus for details.
Deutsche Asset & Wealth Management represents the asset management and wealth management activities conducted by Deutsche Bank AG or any of its subsidiaries, including the Advisor and DeAWM Distributors, Inc.
NOT FDIC/NCUA INSURED NO BANK GUARANTEE MAY LOSE VALUE NOT A DEPOSIT
NOT INSURED BY ANY FEDERAL GOVERNMENT AGENCY
Dear Shareholder:
I am very pleased to tell you that the DWS funds have been renamed Deutsche funds, aligning more closely with the Deutsche Asset & Wealth Management brand. We are proud to adopt the Deutsche name — a brand that fully represents the global access, discipline and intelligence that support all of our products and services.
Deutsche Asset & Wealth Management combines the asset management and wealth management divisions of Deutsche Bank to deliver a comprehensive suite of active, passive and alternative investment capabilities. Your investment in the Deutsche funds means you have access to the thought leadership and resources of one of the world’s largest and most influential financial institutions.
In conjunction with your fund’s name change, please note that the Deutsche funds’ Web address has changed as well. The former dws-investments.com is now deutschefunds.com.
In addition, key service providers have been renamed as follows:
| Former Name | New name, effective August 11, 2014 |
| DWS Investments Distributors, Inc. | DeAWM Distributors, Inc. |
| DWS Trust Company | DeAWM Trust Company |
| DWS Investments Service Company | DeAWM Service Company |
These changes have no effect on the day-to-day management of your investment, and there is no action required on your part. You will continue to experience the benefits that come from our decades of experience, in-depth research and worldwide network of investment professionals.
Thanks for your continued support. We appreciate your trust and the opportunity to put our capabilities to work for you.
Best regards,
Brian Binder
President, Deutsche Funds
Performance Summary June 30, 2014 (Unaudited)
Fund performance shown is historical, assumes reinvestment of all dividend and capital gain distributions and does not guarantee future results. Investment return and principal value fluctuate with changing market conditions so that, when redeemed, shares may be worth more or less than their original cost. Current performance may be lower or higher than the performance data quoted. Please contact your participating insurance company for the Fund's most recent month-end performance. Performance doesn't reflect charges and fees ("contract charges") associated with the separate account that invests in the Fund or any variable life insurance policy or variable annuity contract for which the Fund is an investment option. These charges and fees will reduce returns.
The gross expense ratio of the Fund, as stated in the fee table of the prospectus dated May 1, 2014 is 0.72% for Class A shares and may differ from the expense ratio disclosed in the Financial Highlights table in this report.
| Growth of an Assumed $10,000 Investment in Deutsche Small Mid Cap Growth VIP |
| The Russell 2500™ Growth Index is an unmanaged index that measures the performance of the small- to mid-cap growth segment of the U.S. equity universe. It includes those Russell 2500 companies with higher price-to-book ratios and higher forecasted growth values. Index returns do not reflect any fees or expenses and it is not possible to invest directly into an index. |
| |
| Yearly periods ended June 30 | |
| Comparative Results | |
| Deutsche Small Mid Cap Growth VIP | | 6-Month‡ | | | 1-Year | | | 3-Year | | | 5-Year | | | 10-Year | |
| Class A | Growth of $10,000 | | $ | 10,181 | | | $ | 12,787 | | | $ | 14,460 | | | $ | 26,057 | | | $ | 18,389 | |
| Average annual total return | | | 1.81 | % | | | 27.87 | % | | | 13.08 | % | | | 21.11 | % | | | 6.28 | % |
| Russell 2500 Growth Index | Growth of $10,000 | | $ | 10,397 | | | $ | 12,626 | | | $ | 15,161 | | | $ | 26,643 | | | $ | 25,788 | |
| Average annual total return | | | 3.97 | % | | | 26.26 | % | | | 14.88 | % | | | 21.65 | % | | | 9.94 | % |
The growth of $10,000 is cumulative.
‡ Total returns shown for periods less than one year are not annualized.
Portfolio Summary (Unaudited) Asset Allocation (As a % of Investment Portfolio excluding Securities Lending Collateral) | 6/30/14 | 12/31/13 |
| | | |
| Common Stocks | 97% | 97% |
| Cash Equivalents | 2% | 2% |
| Exchange-Traded Fund | 1% | 1% |
| Warrants | 0% | — |
| | 100% | 100% |
Sector Diversification (As a % of Common Stocks, Exchange-Traded Fund and Warrants) | 6/30/14 | 12/31/13 |
| | | |
| Consumer Discretionary | 21% | 20% |
| Information Technology | 20% | 23% |
| Industrials | 19% | 16% |
| Health Care | 16% | 16% |
| Financials | 7% | 10% |
| Energy | 6% | 5% |
| Materials | 6% | 4% |
| Consumer Staples | 3% | 5% |
| Telecommunication Services | 2% | 1% |
| | 100% | 100% |
Portfolio holdings and characteristics are subject to change.
For more complete details about the Fund's investment portfolio, see page 6.
Following the Fund's fiscal first and third quarter-end, a complete portfolio holdings listing is filed with the SEC on Form N-Q. The form will be available on the SEC's Web site at sec.gov, and it also may be reviewed and copied at the SEC's Public Reference Room in Washington, D.C. Information on the operation of the SEC's Public Reference Room may be obtained by calling (800) SEC-0330. The Fund's portfolio holdings are also posted on deutschefunds.com from time to time. Please see the Fund's current prospectus for more information.
Portfolio Management Team
Joseph Axtell, CFA
Rafaelina M. Lee
Portfolio Managers
Investment Portfolio June 30, 2014 (Unaudited) | | | Shares | | | Value ($) | |
| | | | |
| Common Stocks 96.6% | |
| Consumer Discretionary 19.8% | |
| Auto Components 2.7% | |
| American Axle & Manufacturing Holdings, Inc.* | | | 91,630 | | | | 1,730,891 | |
| Gentherm, Inc.* | | | 20,569 | | | | 914,292 | |
| Tenneco, Inc.* | | | 32,782 | | | | 2,153,777 | |
| | | | | | | | 4,798,960 | |
| Hotels, Restaurants & Leisure 2.9% | |
| Jack in the Box, Inc. | | | 34,893 | | | | 2,087,997 | |
| Life Time Fitness, Inc.* (a) | | | 26,743 | | | | 1,303,454 | |
| Panera Bread Co. "A"* | | | 11,769 | | | | 1,763,349 | |
| | | | | | | | 5,154,800 | |
| Household Durables 2.3% | |
| Jarden Corp.* | | | 42,198 | | | | 2,504,451 | |
| Ryland Group, Inc. (a) | | | 40,629 | | | | 1,602,408 | |
| | | | | | | | 4,106,859 | |
| Leisure Products 1.3% | |
| Polaris Industries, Inc. (a) | | | 16,804 | | | | 2,188,553 | |
| Media 0.8% | |
| Cinemark Holdings, Inc. | | | 40,900 | | | | 1,446,224 | |
| Specialty Retail 7.4% | |
| Advance Auto Parts, Inc. | | | 12,291 | | | | 1,658,302 | |
| Ascena Retail Group, Inc.* | | | 74,530 | | | | 1,274,463 | |
| DSW, Inc. "A" | | | 42,345 | | | | 1,183,119 | |
| Outerwall, Inc.* (a) | | | 24,026 | | | | 1,425,943 | |
| Penske Automotive Group, Inc. | | | 27,392 | | | | 1,355,904 | |
| PetSmart, Inc. (a) | | | 24,023 | | | | 1,436,576 | |
| The Children's Place, Inc. (a) | | | 33,610 | | | | 1,668,064 | |
| Ulta Salon, Cosmetics & Fragrance, Inc.* | | | 19,007 | | | | 1,737,430 | |
| Urban Outfitters, Inc.* | | | 37,243 | | | | 1,261,048 | |
| | | | | | | | 13,000,849 | |
| Textiles, Apparel & Luxury Goods 2.4% | |
| Carter's, Inc. | | | 17,868 | | | | 1,231,641 | |
| Hanesbrands, Inc. | | | 31,125 | | | | 3,063,945 | |
| | | | | | | | 4,295,586 | |
| Consumer Staples 3.5% | |
| Food & Staples Retailing 1.0% | |
| United Natural Foods, Inc.* | | | 28,232 | | | | 1,837,903 | |
| Food Products 1.5% | |
| Hain Celestial Group, Inc.* | | | 19,720 | | | | 1,749,953 | |
| The WhiteWave Foods Co.* | | | 30,260 | | | | 979,516 | |
| | | | | | | | 2,729,469 | |
| Household Products 1.0% | |
| Church & Dwight Co., Inc. (a) | | | 23,957 | | | | 1,675,792 | |
| Energy 5.7% | |
| Energy Equipment & Services 2.3% | |
| Dresser-Rand Group, Inc.* | | | 17,075 | | | | 1,088,190 | |
| Dril-Quip, Inc.* | | | 16,577 | | | | 1,810,871 | |
| RPC, Inc. | | | 52,767 | | | | 1,239,497 | |
| �� | | | | | | | 4,138,558 | |
| Oil, Gas & Consumable Fuels 3.4% | |
| Diamondback Energy, Inc.* | | | 19,917 | | | | 1,768,630 | |
| Goodrich Petroleum Corp.* (a) | | | 60,043 | | | | 1,657,187 | |
| | | Shares | | | Value ($) | |
| | | | | | | | | |
| Oasis Petroleum, Inc.* | | | 29,199 | | | | 1,631,932 | |
| Western Refining, Inc. | | | 24,540 | | | | 921,477 | |
| | | | | | | | 5,979,226 | |
| Financials 7.1% | |
| Banks 1.2% | |
| Signature Bank* | | | 16,921 | | | | 2,135,092 | |
| Capital Markets 3.1% | |
| Financial Engines, Inc. (a) | | | 39,619 | | | | 1,793,948 | |
| Lazard Ltd. "A" | | | 37,921 | | | | 1,955,207 | |
| Oaktree Capital Group LLC | | | 34,742 | | | | 1,736,753 | |
| | | | | | | | 5,485,908 | |
| Consumer Finance 2.0% | |
| Encore Capital Group, Inc.* (a) | | | 33,531 | | | | 1,522,978 | |
| Portfolio Recovery Associates, Inc.* | | | 33,827 | | | | 2,013,721 | |
| | | | | | | | 3,536,699 | |
| Thrifts & Mortgage Finance 0.8% | |
| Ocwen Financial Corp.* | | | 36,283 | | | | 1,346,099 | |
| Health Care 14.9% | |
| Biotechnology 4.4% | |
| Alkermes PLC* | | | 23,937 | | | | 1,204,749 | |
| Cubist Pharmaceuticals, Inc.* | | | 11,690 | | | | 816,196 | |
| Isis Pharmaceuticals, Inc.* (a) | | | 35,226 | | | | 1,213,536 | |
| Momenta Pharmaceuticals, Inc.* | | | 35,575 | | | | 429,746 | |
| Orexigen Therapeutics, Inc.* (a) | | | 141,597 | | | | 875,070 | |
| Puma Biotechnology, Inc.* | | | 11,422 | | | | 753,852 | |
| Retrophin, Inc.* | | | 70,883 | | | | 832,166 | |
| Spectrum Pharmaceuticals, Inc.* (a) | | | 121,106 | | | | 984,592 | |
| Sunesis Pharmaceuticals, Inc.* (a) | | | 31,537 | | | | 205,621 | |
| Synta Pharmaceuticals Corp.* | | | 123,326 | | | | 504,403 | |
| | | | | | | | 7,819,931 | |
| Health Care Equipment & Supplies 3.9% | |
| HeartWare International, Inc.* | | | 17,274 | | | | 1,528,749 | |
| SurModics, Inc.* | | | 67,578 | | | | 1,447,521 | |
| Thoratec Corp.* | | | 56,331 | | | | 1,963,699 | |
| Zeltiq Aesthetics, Inc.* (a) | | | 129,287 | | | | 1,963,869 | |
| | | | | | | | 6,903,838 | |
| Health Care Providers & Services 4.9% | |
| Catamaran Corp.* | | | 33,508 | | | | 1,479,713 | |
| Centene Corp.* | | | 33,658 | | | | 2,544,881 | |
| Kindred Healthcare, Inc. | | | 68,707 | | | | 1,587,132 | |
| Molina Healthcare, Inc.* (a) | | | 39,939 | | | | 1,782,477 | |
| Providence Service Corp.* | | | 33,662 | | | | 1,231,693 | |
| | | | | | | | 8,625,896 | |
| Life Sciences Tools & Services 0.6% | |
| PAREXEL International Corp.* | | | 21,889 | | | | 1,156,615 | |
| Pharmaceuticals 1.1% | |
| Pacira Pharmaceuticals, Inc.* | | | 11,034 | | | | 1,013,583 | |
| Questcor Pharmaceuticals, Inc. (a) | | | 10,256 | | | | 948,578 | |
| | | | | | | | 1,962,161 | |
| Industrials 18.6% | |
| Aerospace & Defense 2.1% | |
| BE Aerospace, Inc.* | | | 18,848 | | | | 1,743,251 | |
| HEICO Corp.* | | | 36,222 | | | | 1,881,371 | |
| | | | | | | | 3,624,622 | |
| | | Shares | | | Value ($) | |
| | | | | | | | | |
| Building Products 0.8% | |
| Fortune Brands Home & Security, Inc. | | | 34,821 | | | | 1,390,403 | |
| Commercial Services & Supplies 1.7% | |
| Interface, Inc. (a) | | | 74,389 | | | | 1,401,489 | |
| Team, Inc.* | | | 40,219 | | | | 1,649,783 | |
| | | | | | | | 3,051,272 | |
| Construction & Engineering 1.0% | |
| Primoris Services Corp. | | | 63,365 | | | | 1,827,447 | |
| Electrical Equipment 3.0% | |
| Acuity Brands, Inc. | | | 9,303 | | | | 1,286,139 | |
| AZZ, Inc. | | | 40,373 | | | | 1,860,388 | |
| Thermon Group Holdings, Inc.* | | | 80,490 | | | | 2,118,497 | |
| | | | | | | | 5,265,024 | |
| Machinery 6.4% | |
| Altra Industrial Motion Corp. | | | 52,647 | | | | 1,915,824 | |
| Chart Industries, Inc.* (a) | | | 19,919 | | | | 1,648,098 | |
| Manitowoc Co., Inc. (a) | | | 82,944 | | | | 2,725,540 | |
| Middleby Corp.* | | | 15,240 | | | | 1,260,653 | |
| Valmont Industries, Inc. (a) | | | 8,530 | | | | 1,296,134 | |
| WABCO Holdings, Inc.* | | | 23,970 | | | | 2,560,475 | |
| | | | | | | | 11,406,724 | |
| Professional Services 0.6% | |
| Huron Consulting Group, Inc.* | | | 65 | | | | 4,603 | |
| TriNet Group, Inc.* | | | 40,684 | | | | 979,264 | |
| | | | | | | | 983,867 | |
| Road & Rail 1.3% | |
| Swift Transportation Co.* (a) | | | 94,328 | | | | 2,379,896 | |
| Trading Companies & Distributors 1.7% | |
| NOW, Inc.* | | | 26,570 | | | | 962,100 | |
| United Rentals, Inc.* (a) | | | 18,821 | | | | 1,971,123 | |
| | | | | | | | 2,933,223 | |
| Information Technology 19.7% | |
| Communications Equipment 2.0% | |
| Harris Corp. | | | 30,982 | | | | 2,346,887 | |
| Palo Alto Networks, Inc.* | | | 13,799 | | | | 1,157,046 | |
| | | | | | | | 3,503,933 | |
| Electronic Equipment, Instruments & Components 2.3% | |
| Cognex Corp.* | | | 65,096 | | | | 2,499,686 | |
| IPG Photonics Corp.* (a) | | | 24,459 | | | | 1,682,779 | |
| | | | | | | | 4,182,465 | |
| Internet Software & Services 1.7% | |
| Cornerstone OnDemand, Inc.* | | | 27,675 | | | | 1,273,604 | |
| CoStar Group, Inc.* | | | 11,084 | | | | 1,753,156 | |
| | | | | | | | 3,026,760 | |
| IT Services 4.9% | |
| Cardtronics, Inc.* | | | 64,591 | | | | 2,201,261 | |
| MAXIMUS, Inc. | | | 45,192 | | | | 1,944,160 | |
| VeriFone Systems, Inc.* | | | 69,916 | | | | 2,569,413 | |
| Virtusa Corp.* | | | 53,949 | | | | 1,931,374 | |
| | | | | | | | 8,646,208 | |
| Semiconductors & Semiconductor Equipment 1.7% | |
| Advanced Energy Industries, Inc.* | | | 108,432 | | | | 2,087,316 | |
| Ultra Clean Holdings, Inc.* | | | 97,325 | | | | 880,791 | |
| | | | | | | | 2,968,107 | |
| | | Shares | | | Value ($) | |
| | | | | | | | | |
| Software 5.9% | |
| Aspen Technology, Inc.* | | | 35,546 | | | | 1,649,334 | |
| Imperva, Inc.* | | | 36,830 | | | | 964,209 | |
| PTC, Inc.* | | | 65,897 | | | | 2,556,804 | |
| Splunk, Inc.* | | | 32,011 | | | | 1,771,169 | |
| Tyler Technologies, Inc.* | | | 27,373 | | | | 2,496,691 | |
| Ultimate Software Group, Inc.* | | | 7,250 | | | | 1,001,733 | |
| | | | | | | | 10,439,940 | |
| Technology Hardware, Storage & Peripherals 1.2% | |
| Western Digital Corp. | | | 23,146 | | | | 2,136,376 | |
| Materials 5.6% | |
| Chemicals 2.0% | |
| A. Schulman, Inc. | | | 46,359 | | | | 1,794,093 | |
| Minerals Technologies, Inc. | | | 26,308 | | | | 1,725,279 | |
| | | | | | | | 3,519,372 | |
| Construction Materials 1.4% | |
| Eagle Materials, Inc. | | | 26,276 | | | | 2,477,301 | |
| Containers & Packaging 0.7% | |
| Crown Holdings, Inc.* | | | 26,354 | | | | 1,311,375 | |
| Metals & Mining 1.5% | |
| Constellium NV "A"* | | | 49,879 | | | | 1,599,121 | |
| Haynes International, Inc. | | | 19,129 | | | | 1,082,510 | |
| | | | | | | | 2,681,631 | |
| Telecommunication Services 1.7% | |
| Diversified Telecommunication Services 0.8% | |
| inContact, Inc.* | | | 149,568 | | | | 1,374,530 | |
| Wireless Telecommunication Services 0.9% | |
| SBA Communications Corp. "A"* | | | 15,663 | | | | 1,602,325 | |
Total Common Stocks (Cost $124,499,601) | | | | 171,057,819 | |
| | |
| Exchange-Traded Fund 1.0% | |
| SPDR S&P Biotech (a) (Cost $1,281,707) | | | 11,388 | | | | 1,754,321 | |
| | |
| Warrants 0.1% | |
| Health Care | |
| Sunesis Pharmaceuticals, Inc.: | | | | | | | | |
| Series A, Expiration Date 3/31/2016* | | | 31,537 | | | | 89,881 | |
| Series B, Expiration Date 3/31/2016* | | | 31,537 | | | | 63,862 | |
Total Warrants (Cost $86,096) | | | | 153,743 | |
| | |
| Securities Lending Collateral 18.6% | |
| Daily Assets Fund Institutional, 0.08% (b) (c) (Cost $32,938,265) | | | 32,938,265 | | | | 32,938,265 | |
| | |
| Cash Equivalents 2.3% | |
| Central Cash Management Fund, 0.06% (b) (Cost $4,045,999) | | | 4,045,999 | | | | 4,045,999 | |
| | | % of Net Assets | | | Value ($) | |
| | | | |
Total Investment Portfolio (Cost $162,851,668)† | | | 118.6 | | | | 209,950,147 | |
| Other Assets and Liabilities, Net | | | (18.6 | ) | | | (32,858,536 | ) |
| Net Assets | | | 100.0 | | | | 177,091,611 | |
* Non-income producing security.
† The cost for federal income tax purposes was $163,106,674. At June 30, 2014, net unrealized appreciation for all securities based on tax cost was $46,843,473. This consisted of aggregate gross unrealized appreciation for all securities in which there was an excess of value over tax cost of $50,055,202 and aggregate gross unrealized depreciation for all securities in which there was an excess of tax cost over value of $3,211,729.
(a) All or a portion of these securities were on loan. In addition, "Other Assets and Liabilities, Net" may include pending sales that are also on loan. The value of securities loaned at June 30, 2014 amounted to $31,905,100, which is 18.0% of net assets.
(b) Affiliated fund managed by Deutsche Investment Management Americas Inc. The rate shown is the annualized seven-day yield at period end.
(c) Represents collateral held in connection with securities lending. Income earned by the Fund is net of borrower rebates.
S&P: Standard & Poor's
SPDR: Standard & Poor's Depositary Receipt
Fair Value Measurements
Various inputs are used in determining the value of the Fund's investments. These inputs are summarized in three broad levels. Level 1 includes quoted prices in active markets for identical securities. Level 2 includes other significant observable inputs (including quoted prices for similar securities, interest rates, prepayment speeds and credit risk). Level 3 includes significant unobservable inputs (including the Fund's own assumptions in determining the fair value of investments). The level assigned to the securities valuations may not be an indication of the risk or liquidity associated with investing in those securities.
The following is a summary of the inputs used as of June 30, 2014 in valuing the Fund's investments. For information on the Fund's policy regarding the valuation of investments, please refer to the Security Valuation section of Note A in the accompanying Notes to Financial Statements.
| Assets | | Level 1 | | | Level 2 | | | Level 3 | | | Total | |
| | |
| Common Stocks (d) | | $ | 171,057,819 | | | $ | — | | | $ | — | | | $ | 171,057,819 | |
| Exchange-Traded Fund | | | 1,754,321 | | | | — | | | | — | | | | 1,754,321 | |
| Warrant | | | 153,743 | | | | — | | | | — | | | | 153,743 | |
| Short-Term Investments (d) | | | 36,984,264 | | | | — | | | | — | | | | 36,984,264 | |
| Total | | $ | 209,950,147 | | | $ | — | | | $ | — | | | $ | 209,950,147 | |
There have been no transfers between fair value measurement levels during the period ended June 30, 2014.
(d) See Investment Portfolio for additional detailed categorizations.
The accompanying notes are an integral part of the financial statements.
Statement of Assets and Liabilities | as of June 30, 2014 (Unaudited) | |
| Assets | |
Investments: Investments in non-affiliated securities, at value (cost $125,867,404) — including $31,905,100 of securities loaned | | $ | 172,965,883 | |
| Investment in Daily Assets Fund Institutional (cost $32,938,265)* | | | 32,938,265 | |
| Investment in Central Cash Management Fund (cost $4,045,999) | | | 4,045,999 | |
| Total investments in securities, at value (cost $162,851,668) | | | 209,950,147 | |
| Cash | | | 367,141 | |
| Receivable for investments sold | | | 2,086,629 | |
| Receivable for Fund shares sold | | | 3,330 | |
| Dividends receivable | | | 34,265 | |
| Interest receivable | | | 13,858 | |
| Other assets | | | 1,093 | |
| Total assets | | | 212,456,463 | |
| Liabilities | |
| Payable upon return of securities loaned | | | 32,938,265 | |
| Payable for investments purchased | | | 2,083,874 | |
| Payable for Fund shares redeemed | | | 186,369 | |
| Accrued management fee | | | 78,586 | |
| Accrued Trustees' fees | | | 234 | |
| Other accrued expenses and payables | | | 77,524 | |
| Total liabilities | | | 35,364,852 | |
| Net assets, at value | | $ | 177,091,611 | |
| Net Assets Consist of | |
| Net investment income (loss) | | | (99,060 | ) |
| Net unrealized appreciation (depreciation) on investments | | | 47,098,479 | |
| Accumulated net realized gain (loss) | | | 9,187,532 | |
| Paid-in capital | | | 120,904,660 | |
| Net assets, at value | | $ | 177,091,611 | |
Class A Net Asset Value, offering and redemption price per share ($177,091,611 ÷ 8,057,925 outstanding shares of beneficial interest, no par value, unlimited number of shares authorized) | | $ | 21.98 | |
* Represents collateral on securities loaned.
The accompanying notes are an integral part of the financial statements.
Statement of Operations
| for the six months ended June 30, 2014 (Unaudited) | |
| Investment Income | |
Income: Dividends | | $ | 422,094 | |
| Income distributions — Central Cash Management Fund | | | 1,044 | |
| Securities lending income, including income from Daily Assets Fund Institutional, net of borrower rebates | | | 122,330 | |
| Total income | | | 545,468 | |
Expenses: Management fee | | | 487,813 | |
| Administration fee | | | 88,693 | |
| Services to shareholders | | | 1,440 | |
| Custodian fee | | | 6,001 | |
| Professional fees | | | 35,868 | |
| Reports to shareholders | | | 16,297 | |
| Trustees' fees and expenses | | | 4,222 | |
| Other | | | 4,194 | |
| Total expenses | | | 644,528 | |
| Net investment income (loss) | | | (99,060 | ) |
| Realized and Unrealized Gain (Loss) | |
| Net realized gain (loss) from investments | | | 17,013,722 | |
| Change in net unrealized appreciation (depreciation) on investments | | | (13,883,645 | ) |
| Net gain (loss) | | | 3,130,077 | |
| Net increase (decrease) in net assets resulting from operations | | $ | 3,031,017 | |
The accompanying notes are an integral part of the financial statements.
Statement of Changes in Net Assets | Increase (Decrease) in Net Assets | | Six Months Ended June 30, 2014 (Unaudited) | | | Year Ended December 31, 2013 | |
Operations: Net investment income (loss) | | $ | (99,060 | ) | | $ | (363,396 | ) |
Operations: Net investment income (loss) | | $ | (99,060 | ) | | $ | (363,396 | ) |
| Net realized gain (loss) | | | 17,013,722 | | | | 23,261,132 | |
| Change in net unrealized appreciation (depreciation) | | | (13,883,645 | ) | | | 35,857,105 | |
| Net increase (decrease) in net assets resulting from operations | | | 3,031,017 | | | | 58,754,841 | |
Distributions to shareholders from: Net investment income: Class A | | | — | | | | (194,886 | ) |
| Total distributions | | | — | | | | (194,886 | ) |
Fund share transactions: Class A Proceeds from shares sold | | | 3,139,745 | | | | 5,697,979 | |
| Reinvestment of distributions | | | — | | | | 194,886 | |
| Cost of shares redeemed | | | (16,356,558 | ) | | | (22,634,498 | ) |
| Net increase (decrease) in net assets from Class A share transactions | | | (13,216,813 | ) | | | (16,741,633 | ) |
| Increase (decrease) in net assets | | | (10,185,796 | ) | | | 41,818,322 | |
| Net assets at beginning of period | | | 187,277,407 | | | | 145,459,085 | |
| Net assets at end of period (including net investment loss and undistributed net investment income of $99,060 and $0, respectively) | | $ | 177,091,611 | | | $ | 187,277,407 | |
| Other Information | |
Class A Shares outstanding at beginning of period | | | 8,676,171 | | | | 9,604,576 | |
| Shares sold | | | 145,187 | | | | 313,223 | |
| Shares issued to shareholders in reinvestment of distributions | | | — | | | | 11,761 | |
| Shares redeemed | | | (763,433 | ) | | | (1,253,389 | ) |
| Net increase (decrease) in Class A shares | | | (618,246 | ) | | | (928,405 | ) |
| Shares outstanding at end of period | | | 8,057,925 | | | | 8,676,171 | |
The accompanying notes are an integral part of the financial statements.
| | | | | | Years Ended December 31, | |
| Class A | | Six Months Ended 6/30/14 (Unaudited) | | | 2013 | | | 2012 | | | 2011 | | | 2010 | | | 2009 | |
| Selected Per Share Data | |
| Net asset value, beginning of period | | $ | 21.59 | | | $ | 15.14 | | | $ | 13.24 | | | $ | 13.85 | | | $ | 10.70 | | | $ | 7.61 | |
Income (loss) from investment operations: Net investment income (loss)a | | | (.01 | ) | | | (.04 | ) | | | .02 | | | | (.03 | ) | | | (.01 | ) | | | (.02 | ) |
| Net realized and unrealized gain (loss) | | | .40 | | | | 6.51 | | | | 1.88 | | | | (.50 | ) | | | 3.16 | | | | 3.11 | |
| Total from investment operations | | | .39 | | | | 6.47 | | | | 1.90 | | | | (.53 | ) | | | 3.15 | | | | 3.09 | |
Less distributions from: Net investment income | | | — | | | | (.02 | ) | | | — | | | | (.08 | ) | | | — | | | | — | |
| Net asset value, end of period | | $ | 21.98 | | | $ | 21.59 | | | $ | 15.14 | | | $ | 13.24 | | | $ | 13.85 | | | $ | 10.70 | |
| Total Return (%) | | | 1.81 | ** | | | 42.78 | | | | 14.35 | | | | (3.91 | ) | | | 29.44 | | | | 40.60 | |
| Ratios to Average Net Assets and Supplemental Data | |
| Net assets, end of period ($ millions) | | | 177 | | | | 187 | | | | 145 | | | | 147 | | | | 88 | | | | 80 | |
| Ratio of expenses (%) | | | .73 | * | | | .72 | | | | .74 | | | | .73 | | | | .78 | | | | .77 | |
| Ratio of net investment income (loss) (%) | | | (.11 | )* | | | (.22 | ) | | | .11 | | | | (.23 | ) | | | (.12 | ) | | | (.22 | ) |
| Portfolio turnover rate (%) | | | 25 | ** | | | 56 | | | | 57 | | | | 84 | | | | 64 | | | | 93 | |
a Based on average shares outstanding during the period. * Annualized ** Not annualized | |
Notes to Financial Statements (Unaudited)
A. Organization and Significant Accounting Policies
Deutsche Small Mid Cap Growth VIP (formerly DWS Small Mid Cap Growth VIP) (the "Fund") is a diversified series of Deutsche Variable Series II (formerly DWS Variable Series II) (the "Trust"), which is registered under the Investment Company Act of 1940, as amended (the "1940 Act"), as an open-end management investment company organized as a Massachusetts business trust.
The Fund's financial statements are prepared in accordance with accounting principles generally accepted in the United States of America which require the use of management estimates. Actual results could differ from those estimates. The policies described below are followed consistently by the Fund in the preparation of its financial statements.
Security Valuation. Investments are stated at value determined as of the close of regular trading on the New York Stock Exchange on each day the exchange is open for trading.
Various inputs are used in determining the value of the Fund's investments. These inputs are summarized in three broad levels. Level 1 includes quoted prices in active markets for identical securities. Level 2 includes other significant observable inputs (including quoted prices for similar securities, interest rates, prepayment speeds and credit risk). Level 3 includes significant unobservable inputs (including the Fund's own assumptions in determining the fair value of investments). The level assigned to the securities valuations may not be an indication of the risk or liquidity associated with investing in those securities.
Equity securities and exchange-traded funds ("ETFs") are valued at the most recent sale price or official closing price reported on the exchange (U.S. or foreign) or over-the-counter market on which they trade. Securities or ETFs for which no sales are reported are valued at the calculated mean between the most recent bid and asked quotations on the relevant market or, if a mean cannot be determined, at the most recent bid quotation. Equity and ETF securities are generally categorized as Level 1.
Investments in open-end investment companies are valued at their net asset value each business day and are categorized as Level 1.
Securities and other assets for which market quotations are not readily available or for which the above valuation procedures are deemed not to reflect fair value are valued in a manner that is intended to reflect their fair value as determined in accordance with procedures approved by the Board and are generally categorized as Level 3. In accordance with the Fund's valuation procedures, factors considered in determining value may include, but are not limited to, the type of the security; the size of the holding; the initial cost of the security; the existence of any contractual restrictions on the security's disposition; the price and extent of public trading in similar securities of the issuer or of comparable companies; quotations or evaluated prices from broker-dealers and/or pricing services; information obtained from the issuer, analysts, and/or the appropriate stock exchange (for exchange-traded securities); an analysis of the company's or issuer's financial statements; an evaluation of the forces that influence the issuer and the market(s) in which the security is purchased and sold; and with respect to debt securities, the maturity, coupon, creditworthiness, currency denomination and the movement of the market in which the security is normally traded. The value determined under these procedures may differ from published values for the same securities.
Disclosure about the classification of fair value measurements is included in a table following the Fund's Investment Portfolio.
Securities Lending. Deutsche Bank AG, as lending agent, lends securities of the Fund to certain financial institutions under the terms of the Security Lending Agreement. The Fund retains the benefits of owning the securities it has loaned and continues to receive interest and dividends generated by the securities and to participate in any changes in their market value. The Fund requires the borrowers of the securities to maintain collateral with the Fund consisting of either cash or liquid, unencumbered assets having a value at least equal to the value of the securities loaned. When the collateral falls below specified amounts, the lending agent will use its best effort to obtain additional collateral on the next business day to meet required amounts under the security lending agreement. The Fund may invest the cash collateral into a joint trading account in an affiliated money market fund pursuant to Exemptive Orders issued by the SEC. The Fund receives compensation for lending its securities either in the form of fees or by earning interest on invested cash collateral net of borrower rebates and fees paid to a lending agent. Either the Fund or the borrower may terminate the loan. There may be risks of delay and costs in recovery of securities or even loss of rights in the collateral should the borrower of the securities fail financially. If the Fund is not able to recover securities lent, the Fund may sell the collateral and purchase a replacement investment in the market, incurring the risk that the value of the replacement security is greater than the value of the collateral. The Fund is also subject to all investment risks associated with the reinvestment of any cash collateral received, including, but not limited to, interest rate, credit and liquidity risk associated with such investments.
As of June 30, 2014, the Fund had securities on loan. The value of the related collateral exceeded the value of the securities loaned at period end.
Federal Income Taxes. The Fund's policy is to comply with the requirements of the Internal Revenue Code, as amended, which are applicable to regulated investment companies, and to distribute all of its taxable income to its shareholders.
Under the Regulated Investment Company Modernization Act of 2010, net capital losses incurred post-enactment may be carried forward indefinitely, and their character is retained as short-term and/or long-term. Previously, net capital losses were carried forward for eight years and treated as short-term losses. As a transition rule, the Act requires that post-enactment net capital losses be used before pre-enactment net capital losses.
At December 31, 2013, the Fund had a net tax basis capital loss carryforward of approximately $7,570,000 of pre-enactment losses, including approximately $2,020,000 inherited from its mergers with affiliated funds in previous years, which may be applied against any realized net taxable capital gains of each succeeding year until fully utilized or until December 31, 2016 ($2,020,000) and December 31, 2017 ($5,550,000), the respective expiration dates, whichever occurs first, and which may be subject to certain limitations under Section 382–384 of Internal Revenue Code.
The Fund has reviewed the tax positions for the open tax years as of December 31, 2013 and has determined that no provision for income tax and/or uncertain tax provisions is required in the Fund's financial statements. The Fund's federal tax returns for the prior three fiscal years remain open subject to examination by the Internal Revenue Service.
Distribution of Income and Gains. Distributions from net investment income of the Fund, if any, are declared and distributed to shareholders annually. Net realized gains from investment transactions, in excess of available capital loss carryforwards, would be taxable to the Fund if not distributed and, therefore, will be distributed to shareholders at least annually. The Fund may also make additional distributions for tax purposes if necessary.
The timing and characterization of certain income and capital gain distributions are determined annually in accordance with federal tax regulations which may differ from accounting principles generally accepted in the United States of America. These differences primarily relate to net operating losses and certain securities sold at a loss. As a result, net investment income (loss) and net realized gain (loss) on investment transactions for a reporting period may differ significantly from distributions during such period. Accordingly, the Fund may periodically make reclassifications among certain of its capital accounts without impacting the net asset value of the Fund.
The tax character of current year distributions will be determined at the end of the current fiscal year.
Expenses. Expenses of the Trust arising in connection with a specific fund are allocated to that fund. Other Trust expenses which cannot be directly attributed to a fund are apportioned among the funds in the Trust based upon the relative net assets or other appropriate measures.
Contingencies. In the normal course of business, the Fund may enter into contracts with service providers that contain general indemnification clauses. The Fund's maximum exposure under these arrangements is unknown as this would involve future claims that may be made against the Fund that have not yet been made. However, based on experience, the Fund expects the risk of loss to be remote.
Other. Investment transactions are accounted for on a trade date plus one basis for daily net asset value calculations. However, for financial reporting purposes, investment transactions are reported on trade date. Interest income is recorded on the accrual basis. Dividend income is recorded on the ex-dividend date net of foreign withholding taxes. Realized gains and losses from investment transactions are recorded on an identified cost basis. Proceeds from litigation payments, if any, are included in net realized gain (loss) from investments.
B. Purchases and Sales of Securities
During the six months ended June 30, 2014, purchases and sales of investment transactions (excluding short-term investments) aggregated $43,761,766 and $58,252,497, respectively.
C. Related Parties
Management Agreement. Under the Investment Management Agreement with Deutsche Investment Management Americas Inc. ("DIMA" or the "Advisor"), an indirect, wholly owned subsidiary of Deutsche Bank AG, the Advisor directs the investments of the Fund in accordance with its investment objectives, policies and restrictions. The Advisor determines the securities, instruments and other contracts relating to investments to be purchased, sold or entered into by the Fund.
Pursuant to the Investment Management Agreement with the Advisor, the Fund pays a monthly management fee based on the Fund's average daily net assets, computed and accrued daily and payable monthly, at the following annual rates:
| First $250 million | | | .550 | % |
| Next $750 million | | | .525 | % |
| Over $1 billion | | | .500 | % |
Accordingly, for the six months ended June 30, 2014, the fee pursuant to the Investment Management Agreement was equivalent to an annualized effective rate (exclusive of any applicable waivers/reimbursements) of 0.55% of the Fund's average daily net assets.
For the period from January 1, 2014 through September 30, 2014, the Advisor has contractually agreed to waive its fees and/or reimburse certain operating expenses to the extent necessary to maintain the operating expenses (excluding certain expenses such as extraordinary expenses, taxes, brokerage and interest expense) of Class A at 0.89%.
Administration Fee. Pursuant to an Administrative Services Agreement, DIMA provides most administrative services to the Fund. For all services provided under the Administrative Services Agreement, the Fund pays DIMA an annual fee ("Administration Fee") of 0.10% of the Fund's average daily net assets, computed and accrued daily and payable monthly. For the six months ended June 30, 2014, the Administration Fee was $88,693, of which $14,288 is unpaid.
Service Provider Fees. DeAWM Service Company ("DSC"), an affiliate of the Advisor, is the transfer agent, dividend-paying agent and shareholder service agent for the Fund. Pursuant to a sub-transfer agency agreement between DSC and DST Systems, Inc. ("DST"), DSC has delegated certain transfer agent, dividend-paying agent and shareholder service agent functions to DST. DSC compensates DST out of the shareholder servicing fee it receives from the Fund. For the six months ended June 30, 2014, the amounts charged to the Fund by DSC aggregated $172, of which $85 is unpaid.
Typesetting and Filing Service Fees. Under an agreement with DIMA, DIMA is compensated for providing typesetting and certain regulatory filing services to the Fund. For the six months ended June 30, 2014, the amount charged to the Fund by DIMA included in the Statement of Operations under "reports to shareholders" aggregated $5,916, of which $2,350 is unpaid.
Trustees' Fees and Expenses. The Fund paid retainer fees to each Trustee not affiliated with the Advisor, plus specified amounts to the Board Chairperson and Vice Chairperson and to each committee Chairperson.
Affiliated Cash Management Vehicles. The Fund may invest uninvested cash balances in Central Cash Management Fund and Deutsche Variable NAV Money Fund, affiliated money market funds which are managed by the Advisor. Each affiliated money market fund seeks to provide a high level of current income consistent with liquidity and the preservation of capital. Each affiliated money market fund is managed in accordance with Rule 2a-7 under the Investment Company Act of 1940, which governs the quality, maturity, diversity and liquidity of instruments in which a money market fund may invest. Central Cash Management Fund seeks to maintain a stable net asset value, and Deutsche Variable NAV Money Fund maintains a floating net asset value. The Fund indirectly bears its proportionate share of the expenses of each affiliated money market fund in which it invests. Central Cash Management Fund does not pay the Advisor an investment management fee. To the extent that Deutsche Variable NAV Money Fund pays an investment management fee to the Advisor, the Advisor will waive an amount of the investment management fee payable to the Advisor by the Fund equal to the amount of the investment management fee payable on the Fund's assets invested in Deutsche Variable NAV Money Fund.
Securities Lending Agent Fees. Deutsche Bank AG serves as securities lending agent for the Fund. For the six months ended June 30, 2014, the Fund incurred securities lending agent fees to Deutsche Bank AG in the amount of $11,536.
D. Ownership of the Fund
At June 30, 2014, two participating insurance companies were owners of record of 10% or more of the total outstanding Class A shares of the Fund, each owning 75% and 22%.
E. Line of Credit
The Fund and other affiliated funds (the "Participants") share in a $400 million revolving credit facility provided by a syndication of banks. The Fund may borrow for temporary or emergency purposes, including the meeting of redemption requests that otherwise might require the untimely disposition of securities. The Participants are charged an annual commitment fee which is allocated based on net assets, among each of the Participants. Interest is calculated at a rate per annum equal to the sum of the Federal Funds Rate plus 1.25 percent plus if LIBOR exceeds the Federal Funds Rate the amount of such excess. The Fund may borrow up to a maximum of 33 percent of its net assets under the agreement. The Fund had no outstanding loans at June 30, 2014.
F. Fund Name Change
Effective August 11, 2014, the "DWS Funds" were rebranded "Deutsche Funds."
Information About Your Fund's Expenses (Unaudited)
As an investor of the Fund, you incur two types of costs: ongoing expenses and transaction costs. Ongoing expenses include management fees and other Fund expenses. Examples of transaction costs include contract charges and account maintenance fees, which are not shown in this section. The following tables are intended to help you understand your ongoing expenses (in dollars) of investing in the Fund and to help you compare these expenses with the ongoing expenses of investing in other mutual funds. The example in the table is based on an investment of $1,000 invested at the beginning of the six-month period and held for the entire period (January 1, 2014 to June 30, 2014).
The tables illustrate your Fund's expenses in two ways:
—Actual Fund Return. This helps you estimate the actual dollar amount of ongoing expenses (but not transaction costs) paid on a $1,000 investment in the Fund using the Fund's actual return during the period. To estimate the expenses you paid over the period, simply divide your account value by $1,000 (for example, an $8,600 account value divided by $1,000 = 8.6), then multiply the result by the number in the "Expenses Paid per $1,000" line under the share class you hold.
—Hypothetical 5% Fund Return. This helps you to compare your Fund's ongoing expenses (but not transaction costs) with those of other mutual funds using the Fund's actual expense ratio and a hypothetical rate of return of 5% per year before expenses. Examples using a 5% hypothetical Fund return may be found in the shareholder reports of other mutual funds. The hypothetical account values and expenses may not be used to estimate the actual ending account balance or expenses you paid for the period.
Please note that the expenses shown in these tables are meant to highlight your ongoing expenses only and do not reflect any transaction costs. The "Expenses Paid per $1,000" line of the tables is useful in comparing ongoing expenses only and will not help you determine the relative total expense of owning different funds. If these transaction costs had been included, your costs would have been higher.
Expenses and Value of a $1,000 Investment for the six months ended June 30, 2014 | |
| Actual Fund Return | | Class A | |
| Beginning Account Value 1/1/14 | | $ | 1,000.00 | |
| Ending Account Value 6/30/14 | | $ | 1,018.10 | |
| Expenses Paid per $1,000* | | $ | 3.65 | |
| Hypothetical 5% Fund Return | | Class A | |
| Beginning Account Value 1/1/14 | | $ | 1,000.00 | |
| Ending Account Value 6/30/14 | | $ | 1,021.17 | |
| Expenses Paid per $1,000* | | $ | 3.66 | |
* Expenses are equal to the Fund's annualized expense ratio, multiplied by the average account value over the period, multiplied by 181 (the number of days in the most recent six-month period), then divided by 365.
| Annualized Expense Ratio | Class A | |
| Deutsche Variable Series II — Deutsche Small Mid Cap Growth VIP | .73% | |
For more information, please refer to the Fund's prospectus.
These tables do not reflect charges and fees ("contract charges") associated with the separate account that invests in the Fund or any variable life insurance policy or variable annuity contract for which the Fund is an investment option.
For an analysis of the fees associated with an investment in the fund or similar funds, please refer to the current and hypothetical expense calculators for Variable Insurance Products which can be found at deutschefunds.com/EN/resources/calculators.jsp.
The Trust's policies and procedures for voting proxies for portfolio securities and information about how the Trust voted proxies related to its portfolio securities during the 12-month period ended June 30 are available on our Web site — deutschefunds.com (click on "proxy voting" at the bottom of the page) — or on the SEC's Web site — sec.gov. To obtain a written copy of the Trust's policies and procedures without charge, upon request, call us toll free at (800) 728-3337.
Advisory Agreement Board Considerations and Fee Evaluation
The Board of Trustees approved the renewal of DWS Small Mid Cap Growth VIP's investment management agreement (the "Agreement") with Deutsche Investment Management Americas Inc. ("DIMA") in September 2013.
In terms of the process that the Board followed prior to approving the Agreement, shareholders should know that:
— In September 2013, all but one of the Fund's Trustees were independent of DIMA and its affiliates.
— The Trustees met frequently during the past year to discuss fund matters and dedicated a substantial amount of time to contract review matters. Over the course of several months, the Board's Contract Committee, in coordination with the Board's Equity Oversight Committee, reviewed comprehensive materials received from DIMA, independent third parties and independent counsel. These materials included an analysis of the Fund's performance, fees and expenses, and profitability compiled by a fee consultant retained by the Fund's Independent Trustees (the "Fee Consultant"). The Board also received extensive information throughout the year regarding performance of the Fund.
— The Independent Trustees regularly meet privately with their independent counsel to discuss contract review and other matters. In addition, the Independent Trustees were also advised by the Fee Consultant in the course of their review of the Fund's contractual arrangements and considered a comprehensive report prepared by the Fee Consultant in connection with their deliberations.
— In connection with reviewing the Agreement, the Board also reviewed the terms of the Fund's distribution agreement, administrative services agreement, transfer agency agreement and other material service agreements.
— Based on its evaluation of the information provided, the Contract Committee presented its findings and recommendations to the Board. The Board then reviewed the Contract Committee's findings and recommendations.
In connection with the contract review process, the Contract Committee and the Board considered the factors discussed below, among others. The Board also considered that DIMA and its predecessors have managed the Fund since its inception, and the Board believes that a long-term relationship with a capable, conscientious advisor is in the best interests of the Fund. The Board considered, generally, that shareholders chose to invest or remain invested in the Fund knowing that DIMA managed the Fund, and that the Agreement was approved by the Fund's shareholders. DIMA is part of Deutsche Bank AG, a major global banking institution that is engaged in a wide range of financial services. The Board believes that there are advantages to being part of a global asset management business that offers a wide range of investing expertise and resources, including hundreds of portfolio managers and analysts with research capabilities in many countries throughout the world.
As part of the contract review process, the Board carefully considered the fees and expenses of each DWS fund overseen by the Board in light of the fund's performance. In many cases, this led to a negotiation with DIMA of lower expense caps as part of the 2012 and 2013 contract review processes than had previously been in place. As part of these negotiations, the Board indicated that it would consider relaxing these new lower caps in future years following sustained improvements in performance, among other considerations.
In June 2012, Deutsche Bank AG ("DB"), DIMA's parent company, announced that DB would combine its Asset Management (of which DIMA was a part) and Wealth Management divisions. DB has advised the Independent Trustees that the U.S. asset management business is a critical and integral part of DB, and that it has, and will continue to, reinvest a significant portion of the substantial savings it expects to realize by combining its Asset Management and Wealth Management divisions into the new Asset and Wealth Management ("AWM") division, including ongoing enhancements to its investment capabilities. DB also has confirmed its commitment to maintaining strong legal and compliance groups within the AWM division.
While shareholders may focus primarily on fund performance and fees, the Fund's Board considers these and many other factors, including the quality and integrity of DIMA's personnel and such other issues as back-office operations, fund valuations, and compliance policies and procedures.
Nature, Quality and Extent of Services. The Board considered the terms of the Agreement, including the scope of advisory services provided under the Agreement. The Board noted that, under the Agreement, DIMA provides portfolio management services to the Fund and that, pursuant to a separate administrative services agreement, DIMA provides administrative services to the Fund. The Board considered the experience and skills of senior management and investment personnel, the resources made available to such personnel, the ability of DIMA to attract and retain high-quality personnel, and the organizational depth and stability of DIMA. The Board reviewed the Fund's performance over short-term and long-term periods and compared those returns to various agreed-upon performance measures, including market indices and a peer universe compiled by the Fee Consultant using information supplied by Morningstar Direct ("Morningstar"), an independent fund data service. The Board also noted that it has put into place a process of identifying "Focus Funds" (e.g., funds performing poorly relative to their benchmark or a peer universe compiled by an independent fund data service), and receives more frequent reporting and information from DIMA regarding such funds, along with DIMA's remedial plans to address underperformance. The Board believes this process is an effective manner of identifying and addressing underperforming funds. Based on the information provided, the Board noted that for the one-, three- and five-year periods ended December 31, 2012, the Fund's performance (Class A shares) was in the 3rd quartile, 2nd quartile and 3rd quartile, respectively, of the applicable Morningstar universe (the 1st quartile being the best performers and the 4th quartile being the worst performers). The Board also observed that the Fund has underperformed its benchmark in the one-, three- and five-year periods ended December 31, 2012.
Fees and Expenses. The Board considered the Fund's investment management fee schedule, operating expenses and total expense ratios, and comparative information provided by Lipper Inc. ("Lipper") and the Fee Consultant regarding investment management fee rates paid to other investment advisors by similar funds (1st quartile being the most favorable and 4th quartile being the least favorable). With respect to management fees paid to other investment advisors by similar funds, the Board noted that the contractual fee rates paid by the Fund, which include a 0.10% fee paid to DIMA under the Fund's administrative services agreement, were lower than the median (1st quartile) of the applicable Lipper peer group (based on Lipper data provided as of December 31, 2012). The Board noted that the Fund's Class A shares total (net) operating expenses were expected to be lower than the median (1st quartile) of the applicable Lipper expense universe (based on Lipper data provided as of December 31, 2012, and analyzing Lipper expense universe Class A (net) expenses less any applicable 12b-1 fees) ("Lipper Universe Expenses"). The Board considered the Fund's management fee rate as compared to fees charged by DIMA to a comparable fund and considered differences between the Fund and the comparable fund. The Board also considered how the Fund's total (net) operating expenses compared to the total (net) operating expenses of a more customized peer group selected by Lipper (based on such factors as asset size). The Board also noted that the expense limitation agreed to by DIMA helped to ensure that the Fund's total (net) operating expenses would remain competitive.
The information considered by the Board as part of its review of management fees included information regarding fees charged by DIMA and its affiliates to similar institutional accounts and to similar funds offered primarily to European investors ("DWS Europe funds"), in each case as applicable. The Board observed that advisory fee rates for institutional accounts generally were lower than the management fees charged by similarly managed DWS U.S. mutual funds ("DWS Funds"), but also took note of the differences in services provided to DWS Funds as compared to institutional accounts. In the case of DWS Europe funds, the Board observed that fee rates for DWS Europe funds generally were higher than for similarly managed DWS Funds, but noted that differences in the types of services provided to DWS Funds relative to DWS Europe funds made it difficult to compare such fees.
On the basis of the information provided, the Board concluded that management fees were reasonable and appropriate in light of the nature, quality and extent of services provided by DIMA.
Profitability. The Board reviewed detailed information regarding revenues received by DIMA under the Agreement. The Board considered the estimated costs and pre-tax profits realized by DIMA from advising the DWS Funds, as well as estimates of the pre-tax profits attributable to managing the Fund in particular. The Board also received information regarding the estimated enterprise-wide profitability of DWS and its affiliates with respect to all fund services in totality and by fund. The Board and the Fee Consultant reviewed DIMA's methodology in allocating its costs to the management of the Fund. Based on the information provided, the Board concluded that the pre-tax profits realized by DIMA in connection with the management of the Fund were not unreasonable. The Board also reviewed information regarding the profitability of certain similar investment management firms. The Board noted that while information regarding the profitability of such firms is limited (and in some cases is not necessarily prepared on a comparable basis), DIMA and its affiliates' overall profitability with respect to the DWS fund complex (after taking into account distribution and other services provided to the funds by DIMA and its affiliates) was lower than the overall profitability levels of many comparable firms for which such data was available.
Economies of Scale. The Board considered whether there are economies of scale with respect to the management of the Fund and whether the Fund benefits from any economies of scale. The Board noted that the Fund's management fee schedule includes fee breakpoints. The Board concluded that the Fund's fee schedule represents an appropriate sharing between the Fund and DIMA of such economies of scale as may exist in the management of the Fund at current asset levels.
Other Benefits to DIMA and Its Affiliates. The Board also considered the character and amount of other incidental benefits received by DIMA and its affiliates, including any fees received by DIMA for administrative services provided to the Fund and any fees received by an affiliate of DIMA for distribution services. The Board also considered benefits to DIMA related to brokerage and soft-dollar allocations, including allocating brokerage to pay for research generated by parties other than the executing broker dealers, which pertain primarily to funds investing in equity securities, along with the incidental public relations benefits to DIMA related to DWS Funds advertising and cross-selling opportunities among DIMA products and services. The Board concluded that management fees were reasonable in light of these fallout benefits.
Compliance. The Board considered the significant attention and resources dedicated by DIMA to documenting and enhancing its compliance processes in recent years. The Board noted in particular (i) the experience and seniority of both DIMA's chief compliance officer and the Fund's chief compliance officer; (ii) the large number of DIMA compliance personnel; and (iii) the substantial commitment of resources by DIMA and its affiliates to compliance matters.
Based on all of the information considered and the conclusions reached, the Board unanimously determined that the continuation of the Agreement is in the best interests of the Fund. In making this determination, the Board did not give particular weight to any single factor identified above. The Board considered these factors over the course of numerous meetings, certain of which were in executive session with only the Independent Trustees and their independent counsel present. It is possible that individual Trustees may have weighed these factors differently in reaching their individual decisions to approve the continuation of the Agreement.
Notes
DeAWM Distributors, Inc.
222 South Riverside Plaza
Chicago, IL 60606
(800) 621-1148
VS2SMCG-3 (R-028388-3 8/14)
June 30, 2014
Semiannual Report
Deutsche Variable Series II
(formerly DWS Variable Series II)
Deutsche Small Mid Cap Value VIP
(formerly DWS Small Mid Cap Value VIP)
Contents
8 Statement of Assets and Liabilities 8 Statement of Operations 9 Statement of Changes in Net Assets 12 Notes to Financial Statements 16 Information About Your Fund's Expenses 18 Advisory Agreement Board Considerations and Fee Evaluation |
This report must be preceded or accompanied by a prospectus. To obtain an additional prospectus or summary prospectus, if available, call (800) 728-3337 or your financial representative. We advise you to consider the Fund's objectives, risks, charges and expenses carefully before investing. The summary prospectus and prospectus contain this and other important information about the Fund. Please read the prospectus carefully before you invest.
Any fund that focuses in a particular segment of the market will generally be more volatile than a fund that invests more broadly. Smaller and medium company stocks tend to be more volatile than large company stocks. The fund may lend securities to approved institutions. Stocks may decline in value. See the prospectus for details.
Deutsche Asset & Wealth Management represents the asset management and wealth management activities conducted by Deutsche Bank AG or any of its subsidiaries, including the Advisor and DeAWM Distributors, Inc.
NOT FDIC/NCUA INSURED NO BANK GUARANTEE MAY LOSE VALUE NOT A DEPOSIT
NOT INSURED BY ANY FEDERAL GOVERNMENT AGENCY
Dear Shareholder:
I am very pleased to tell you that the DWS funds have been renamed Deutsche funds, aligning more closely with the Deutsche Asset & Wealth Management brand. We are proud to adopt the Deutsche name — a brand that fully represents the global access, discipline and intelligence that support all of our products and services.
Deutsche Asset & Wealth Management combines the asset management and wealth management divisions of Deutsche Bank to deliver a comprehensive suite of active, passive and alternative investment capabilities. Your investment in the Deutsche funds means you have access to the thought leadership and resources of one of the world’s largest and most influential financial institutions.
In conjunction with your fund’s name change, please note that the Deutsche funds’ Web address has changed as well. The former dws-investments.com is now deutschefunds.com.
In addition, key service providers have been renamed as follows:
| Former Name | New name, effective August 11, 2014 |
| DWS Investments Distributors, Inc. | DeAWM Distributors, Inc. |
| DWS Trust Company | DeAWM Trust Company |
| DWS Investments Service Company | DeAWM Service Company |
These changes have no effect on the day-to-day management of your investment, and there is no action required on your part. You will continue to experience the benefits that come from our decades of experience, in-depth research and worldwide network of investment professionals.
Thanks for your continued support. We appreciate your trust and the opportunity to put our capabilities to work for you.
Best regards,
Brian Binder
President, Deutsche Funds
Performance Summary June 30, 2014 (Unaudited)
Fund performance shown is historical, assumes reinvestment of all dividend and capital gain distributions and does not guarantee future results. Investment return and principal value fluctuate with changing market conditions so that, when redeemed, shares may be worth more or less than their original cost. Current performance may be lower or higher than the performance data quoted. Please contact your participating insurance company for the Fund's most recent month-end performance. Performance doesn't reflect charges and fees ("contract charges") associated with the separate account that invests in the Fund or any variable life insurance policy or variable annuity contract for which the Fund is an investment option. These charges and fees will reduce returns. While all share classes have the same underlying portfolio, their performance will differ.
The gross expense ratios of the Fund, as stated in the fee table of the prospectus dated May 1, 2014 are 0.82% and 1.17% for Class A and Class B shares, respectively, and may differ from the expense ratios disclosed in the Financial Highlights tables in this report.
| Growth of an Assumed $10,000 Investment in Deutsche Small Mid Cap Value VIP |
| The Russell 2500™ Value Index is an unmanaged Index of those securities in the Russell 3000® Index with lower price-to-book ratios and lower forecasted growth values. Index returns do not reflect any fees or expenses and it is not possible to invest directly into an index. |
| |
| Yearly periods ended June 30 | |
| Comparative Results | |
| Deutsche Small Mid Cap Value VIP | | 6-Month‡ | | | 1-Year | | | 3-Year | | | 5-Year | | | 10-Year | |
| Class A | Growth of $10,000 | | $ | 10,523 | | | $ | 12,430 | | | $ | 14,551 | | | $ | 23,965 | | | $ | 26,233 | |
| Average annual total return | | | 5.23 | % | | | 24.30 | % | | | 13.32 | % | | | 19.10 | % | | | 10.12 | % |
| Russell 2500 Value Index | Growth of $10,000 | | $ | 10,787 | | | $ | 12,494 | | | $ | 15,616 | | | $ | 26,570 | | | $ | 24,563 | |
| Average annual total return | | | 7.87 | % | | | 24.94 | % | | | 16.02 | % | | | 21.58 | % | | | 9.40 | % |
| Deutsche Small Mid Cap Value VIP | | 6-Month‡ | | | 1-Year | | | 3-Year | | | 5-Year | | | 10-Year | |
| Class B | Growth of $10,000 | | $ | 10,497 | | | $ | 12,375 | | | $ | 14,386 | | | $ | 23,535 | | | $ | 25,301 | |
| Average annual total return | | | 4.97 | % | | | 23.75 | % | | | 12.89 | % | | | 18.67 | % | | | 9.73 | % |
| Russell 2500 Value Index | Growth of $10,000 | | $ | 10,787 | | | $ | 12,494 | | | $ | 15,616 | | | $ | 26,570 | | | $ | 24,563 | |
| Average annual total return | | | 7.87 | % | | | 24.94 | % | | | 16.02 | % | | | 21.58 | % | | | 9.40 | % |
The growth of $10,000 is cumulative.
‡ Total returns shown for periods less than one year are not annualized.
Portfolio Summary (Unaudited) Asset Allocation (As a % of Investment Portfolio excluding Securities Lending Collateral) | 6/30/14 | 12/31/13 |
| | | |
| Common Stocks | 96% | 96% |
| Cash Equivalents | 4% | 4% |
| | 100% | 100% |
Sector Diversification (As a % of Common Stocks) | 6/30/14 | 12/31/13 |
| | | |
| Industrials | 23% | 29% |
| Information Technology | 21% | 14% |
| Financials | 15% | 16% |
| Consumer Discretionary | 13% | 12% |
| Materials | 9% | 7% |
| Energy | 8% | 5% |
| Health Care | 7% | 10% |
| Consumer Staples | 2% | 2% |
| Utilities | 2% | 5% |
| | 100% | 100% |
Portfolio holdings and characteristics are subject to change.
For more complete details about the Fund's investment portfolio, see page 6.
Following the Fund's fiscal first and third quarter-end, a complete portfolio holdings listing is filed with the SEC on Form N-Q. The form will be available on the SEC's Web site at sec.gov, and it also may be reviewed and copied at the SEC's Public Reference Room in Washington, D.C. Information on the operation of the SEC's Public Reference Room may be obtained by calling (800) SEC-0330. The Fund's portfolio holdings are also posted on deutschefunds.com from time to time. Please see the Fund's current prospectus for more information.
Richard Glass, CFA
Portfolio Manager
Investment Portfolio June 30, 2014 (Unaudited) | | | Shares | | | Value ($) | |
| | | | |
| Common Stocks 95.2% | |
| Consumer Discretionary 12.1% | |
| Auto Components 2.0% | |
| Visteon Corp.* | | | 50,570 | | | | 4,905,796 | |
| Diversified Consumer Services 1.4% | |
| Ascent Capital Group, Inc. "A"* | | | 51,303 | | | | 3,386,511 | |
| Hotels, Restaurants & Leisure 1.5% | |
| The Wendy's Co. | | | 421,696 | | | | 3,597,067 | |
| Household Durables 3.1% | |
| Newell Rubbermaid, Inc. | | | 245,170 | | | | 7,597,818 | |
| Media 1.5% | |
| Scripps Networks Interactive, Inc. "A" | | | 44,420 | | | | 3,604,239 | |
| Specialty Retail 1.4% | |
| Ross Stores, Inc. | | | 52,295 | | | | 3,458,268 | |
| Textiles, Apparel & Luxury Goods 1.2% | |
| Hanesbrands, Inc. | | | 28,238 | | | | 2,779,749 | |
| Consumer Staples 2.3% | |
| Food Products | |
| Ingredion, Inc. | | | 73,603 | | | | 5,523,169 | |
| Energy 7.1% | |
| Energy Equipment & Services 3.4% | |
| Superior Energy Services, Inc. | | | 124,276 | | | | 4,491,335 | |
| TETRA Technologies, Inc.* | | | 316,162 | | | | 3,724,388 | |
| | | | | | | | 8,215,723 | |
| Oil, Gas & Consumable Fuels 3.7% | |
| Cimarex Energy Co. | | | 29,351 | | | | 4,210,694 | |
| QEP Resources, Inc. | | | 140,350 | | | | 4,842,075 | |
| | | | | | | | 9,052,769 | |
| Financials 14.3% | |
| Banks 3.6% | |
| Capital Bank Financial Corp. "A"* | | | 150,950 | | | | 3,563,929 | |
| Investors Bancorp., Inc. | | | 470,281 | | | | 5,196,605 | |
| | | | | | | | 8,760,534 | |
| Capital Markets 2.4% | |
| Lazard Ltd. "A" | | | 114,296 | | | | 5,893,102 | |
| Insurance 6.7% | |
| Axis Capital Holdings Ltd. | | | 52,977 | | | | 2,345,822 | |
| CNO Financial Group, Inc. | | | 368,608 | | | | 6,561,222 | |
| PartnerRe Ltd. | | | 33,313 | | | | 3,638,113 | |
| Reinsurance Group of America, Inc. | | | 46,427 | | | | 3,663,090 | |
| | | | | | | | 16,208,247 | |
| Real Estate Investment Trusts 1.6% | |
| Plum Creek Timber Co., Inc. (REIT) | | | 86,738 | | | | 3,911,884 | |
| Health Care 6.9% | |
| Health Care Equipment & Supplies 1.9% | |
| CareFusion Corp.* | | | 104,820 | | | | 4,648,767 | |
| Health Care Providers & Services 3.7% | |
| HealthSouth Corp. | | | 148,405 | | | | 5,323,287 | |
| Omnicare, Inc. | | | 55,065 | | | | 3,665,677 | |
| | | | | | | | 8,988,964 | |
| | | Shares | | | Value ($) | |
| | | | | | | | | |
| Life Sciences Tools & Services 1.3% | |
| PerkinElmer, Inc. | | | 65,050 | | | | 3,046,942 | |
| Industrials 21.8% | |
| Aerospace & Defense 1.4% | |
| Curtiss-Wright Corp. | | | 53,300 | | | | 3,494,348 | |
| Air Freight & Logistics 0.2% | |
| Forward Air Corp. | | | 7,431 | | | | 355,573 | |
| Building Products 2.1% | |
| Owens Corning, Inc. | | | 130,702 | | | | 5,055,553 | |
| Commercial Services & Supplies 3.4% | |
| Covanta Holding Corp. | | | 186,540 | | | | 3,844,589 | |
| The Brink's Co. | | | 158,544 | | | | 4,474,112 | |
| | | | | | | | 8,318,701 | |
| Electrical Equipment 2.1% | |
| The Babcock & Wilcox Co. | | | 158,183 | | | | 5,134,620 | |
| Machinery 8.6% | |
| Harsco Corp. | | | 220,691 | | | | 5,877,001 | |
| ITT Corp. | | | 85,280 | | | | 4,101,968 | |
| Snap-on, Inc. | | | 25,653 | | | | 3,040,394 | |
| Stanley Black & Decker, Inc. | | | 39,090 | | | | 3,432,884 | |
| Xylem, Inc. | | | 111,667 | | | | 4,363,946 | |
| | | | | | | | 20,816,193 | |
| Marine 2.0% | |
| Kirby Corp.* | | | 42,382 | | | | 4,964,628 | |
| Trading Companies & Distributors 2.0% | |
| AerCap Holdings NV* | | | 104,598 | | | | 4,790,589 | |
| Information Technology 20.3% | |
| Communications Equipment 3.0% | |
| Harris Corp. | | | 49,741 | | | | 3,767,881 | |
| Juniper Networks, Inc.* | | | 144,586 | | | | 3,548,140 | |
| | | | | | | | 7,316,021 | |
| Electronic Equipment, Instruments & Components 6.0% | |
| Belden, Inc. | | | 69,500 | | | | 5,432,120 | |
| Dolby Laboratories, Inc. "A"* | | | 106,600 | | | | 4,605,120 | |
| Zebra Technologies Corp. "A"* | | | 54,513 | | | | 4,487,510 | |
| | | | | | | | 14,524,750 | |
| IT Services 7.8% | |
| Amdocs Ltd. | | | 96,752 | | | | 4,482,520 | |
| Convergys Corp. | | | 271,794 | | | | 5,827,263 | |
| Global Payments, Inc. | | | 65,730 | | | | 4,788,431 | |
| NeuStar, Inc. "A"* | | | 150,621 | | | | 3,919,159 | |
| | | | | | | | 19,017,373 | |
| Software 3.5% | |
| ACI Worldwide, Inc.* | | | 53,993 | | | | 3,014,429 | |
| Verint Systems, Inc.* | | | 109,912 | | | | 5,391,184 | |
| | | | | | | | 8,405,613 | |
| Materials 8.9% | |
| Chemicals 5.2% | |
| Ashland, Inc. | | | 44,523 | | | | 4,841,431 | |
| Celanese Corp. "A" | | | 60,868 | | | | 3,912,595 | |
| Cytec Industries, Inc. | | | 37,243 | | | | 3,926,157 | |
| | | | | | | | 12,680,183 | |
| | | Shares | | | Value ($) | |
| | | | | | | | | |
| Containers & Packaging 2.6% | |
| Sealed Air Corp. | | | 184,770 | | | | 6,313,591 | |
| Metals & Mining 1.1% | |
| Materion Corp. | | | 75,204 | | | | 2,781,796 | |
| Utilities 1.5% | |
| Electric Utilities 0.5% | |
| Northeast Utilities | | | 26,316 | | | | 1,243,957 | |
| Gas Utilities 0.5% | |
| UGI Corp. | | | 24,877 | | | | 1,256,289 | |
| Multi-Utilities 0.5% | |
| CMS Energy Corp. | | | 40,953 | | | | 1,275,687 | |
Total Common Stocks (Cost $192,884,395) | | | | 231,325,014 | |
| | | Shares | | | Value ($) | |
| | | | | | | | | |
| Cash Equivalents 3.7% | |
| Central Cash Management Fund, 0.06% (a) (Cost $9,066,705) | | | 9,066,705 | | | | 9,066,705 | |
| | | % of Net Assets | | | Value ($) | |
| | | | |
Total Investment Portfolio (Cost $201,951,100)† | | | 98.9 | | | | 240,391,719 | |
| Other Assets and Liabilities, Net | | | 1.1 | | | | 2,619,910 | |
| Net Assets | | | 100.0 | | | | 243,011,629 | |
* Non-income producing security.
† The cost for federal income tax purposes was $201,951,100. At June 30, 2014, net unrealized appreciation for all securities based on tax cost was $38,440,619. This consisted of aggregate gross unrealized appreciation for all securities in which there was an excess of value over tax cost of $42,936,064 and aggregate gross unrealized depreciation for all securities in which there was an excess of tax cost over value of $4,495,445.
(a) Affiliated fund managed by Deutsche Investment Management Americas Inc. The rate shown is the annualized seven-day yield at period end.
REIT: Real Estate Investment Trust
Fair Value Measurements
Various inputs are used in determining the value of the Fund's investments. These inputs are summarized in three broad levels. Level 1 includes quoted prices in active markets for identical securities. Level 2 includes other significant observable inputs (including quoted prices for similar securities, interest rates, prepayment speeds and credit risk). Level 3 includes significant unobservable inputs (including the Fund's own assumptions in determining the fair value of investments). The level assigned to the securities valuations may not be an indication of the risk or liquidity associated with investing in those securities.
The following is a summary of the inputs used as of June 30, 2014 in valuing the Fund's investments. For information on the Fund's policy regarding the valuation of investments, please refer to the Security Valuation section of Note A in the accompanying Notes to Financial Statements.
| Assets | | Level 1 | | | Level 2 | | | Level 3 | | | Total | |
| | |
| Common Stocks (b) | | $ | 231,325,014 | | | $ | — | | | $ | — | | | $ | 231,325,014 | |
| Short-Term Investments | | | 9,066,705 | | | | — | | | | — | | | | 9,066,705 | |
| Total | | $ | 240,391,719 | | | $ | — | | | $ | — | | | $ | 240,391,719 | |
There have been no transfers between fair value measurement levels during the period ended June 30, 2014.
(b) See Investment Portfolio for additional detailed categorizations.
The accompanying notes are an integral part of the financial statements.
Statement of Assets and Liabilities | as of June 30, 2014 (Unaudited) | |
| Assets | |
Investments: Investments in non-affiliated securities, at value (cost $192,884,395) | | $ | 231,325,014 | |
| Investment in Central Cash Management Fund (cost $9,066,705) | | | 9,066,705 | |
| Total investments in securities, at value (cost $201,951,100) | | | 240,391,719 | |
| Receivable for investments sold | | | 4,274,757 | |
| Receivable for Fund shares sold | | | 55,545 | |
| Dividends receivable | | | 167,628 | |
| Interest receivable | | | 444 | |
| Other assets | | | 1,625 | |
| Total assets | | | 244,891,718 | |
| Liabilities | |
| Payable for investments purchased | | | 829,342 | |
| Payable for Fund shares redeemed | | | 816,250 | |
| Accrued management fee | | | 129,511 | |
| Accrued Trustees' fees | | | 686 | |
| Other accrued expenses and payables | | | 104,300 | |
| Total liabilities | | | 1,880,089 | |
| Net assets, at value | | $ | 243,011,629 | |
| Net Assets Consist of | |
| Undistributed net investment income | | | 431,249 | |
| Net unrealized appreciation (depreciation) on investments | | | 38,440,619 | |
| Accumulated net realized gain (loss) | | | 8,915,203 | |
| Paid-in capital | | | 195,224,558 | |
| Net assets, at value | | $ | 243,011,629 | |
Class A Net Asset Value, offering and redemption price per share ($224,966,496 ÷ 12,683,655 outstanding shares of beneficial interest, no par value, unlimited number of shares authorized) | | $ | 17.74 | |
Class B Net Asset Value, offering and redemption price per share ($18,045,133 ÷ 1,016,345 outstanding shares of beneficial interest, no par value, unlimited number of shares authorized) | | $ | 17.75 | |
The accompanying notes are an integral part of the financial statements.
Statement of Operations
| for the six months ended June 30, 2014 (Unaudited) | |
| Investment Income | |
Income: Dividends | | $ | 1,467,450 | |
| Income distributions — Central Cash Management Fund | | | 2,481 | |
| Total income | | | 1,469,931 | |
Expenses: Management fee | | | 786,497 | |
| Administration fee | | | 121,021 | |
| Services to shareholders | | | 3,823 | |
| Record keeping fees (Class B) | | | 9,359 | |
| Distribution service fee (Class B) | | | 23,167 | |
| Custodian fee | | | 6,157 | |
| Professional fees | | | 33,696 | |
| Reports to shareholders | | | 27,157 | |
| Trustees' fees and expenses | | | 5,595 | |
| Other | | | 4,753 | |
| Total expenses | | | 1,021,225 | |
| Net investment income (loss) | | | 448,706 | |
| Realized and Unrealized Gain (Loss) | |
| Net realized gain (loss) from investments | | | 9,038,541 | |
| Change in net unrealized appreciation (depreciation) on investments | | | 2,349,037 | |
| Net gain (loss) | | | 11,387,578 | |
| Net increase (decrease) in net assets resulting from operations | | $ | 11,836,284 | |
The accompanying notes are an integral part of the financial statements.
Statement of Changes in Net Assets | Increase (Decrease) in Net Assets | | Six Months Ended June 30, 2014 (Unaudited) | | | Year Ended December 31, 2013 | |
Operations: Net investment income (loss) | | $ | 448,706 | | | $ | 1,914,959 | |
Operations: Net investment income (loss) | | $ | 448,706 | | | $ | 1,914,959 | |
| Net realized gain (loss) | | | 9,038,541 | | | | 72,681,616 | |
| Change in net unrealized appreciation (depreciation) | | | 2,349,037 | | | | (601,679 | ) |
| Net increase (decrease) in net assets resulting from operations | | | 11,836,284 | | | | 73,994,896 | |
Distributions to shareholders from: Net investment income: Class A | | | (1,782,045 | ) | | | (2,660,096 | ) |
| Class B | | | (85,579 | ) | | | (150,280 | ) |
Net realized gains: Class A | | | (1,065,847 | ) | | | — | |
| Class B | | | (91,018 | ) | | | — | |
| Total distributions | | | (3,024,489 | ) | | | (2,810,376 | ) |
Fund share transactions: Class A Proceeds from shares sold | | | 4,703,220 | | | | 17,897,526 | |
| Reinvestment of distributions | | | 2,847,892 | | | | 2,660,096 | |
| Payments for shares redeemed | | | (30,612,559 | ) | | | (65,359,482 | ) |
| Net increase (decrease) in net assets from Class A share transactions | | | (23,061,447 | ) | | | (44,801,860 | ) |
Class B Proceeds from shares sold | | | 1,754,326 | | | | 4,288,905 | |
| Reinvestment of distributions | | | 176,597 | | | | 150,280 | |
| Payments for shares redeemed | | | (4,367,974 | ) | | | (6,805,298 | ) |
| Net increase (decrease) in net assets from Class B share transactions | | | (2,437,051 | ) | | | (2,366,113 | ) |
| Increase (decrease) in net assets | | | (16,686,703 | ) | | | 24,016,547 | |
| Net assets at beginning of period | | | 259,698,332 | | | | 235,681,785 | |
| Net assets at end of period (including undistributed net investment income of $431,249 and $1,850,167, respectively) | | $ | 243,011,629 | | | $ | 259,698,332 | |
| Other Information | |
Class A Shares outstanding at beginning of period | | | 14,042,897 | | | | 17,113,875 | |
| Shares sold | | | 276,727 | | | | 1,211,679 | |
| Shares issued to shareholders in reinvestment of distributions | | | 170,839 | | | | 190,143 | |
| Shares redeemed | | | (1,806,808 | ) | | | (4,472,800 | ) |
| Net increase (decrease) in Class A shares | | | (1,359,242 | ) | | | (3,070,978 | ) |
| Shares outstanding at end of period | | | 12,683,655 | | | | 14,042,897 | |
Class B Shares outstanding at beginning of period | | | 1,160,889 | | | | 1,321,925 | |
| Shares sold | | | 103,397 | | | | 288,710 | |
| Shares issued to shareholders in reinvestment of distributions | | | 10,581 | | | | 10,719 | |
| Shares redeemed | | | (258,522 | ) | | | (460,465 | ) |
| Net increase (decrease) in Class B shares | | | (144,544 | ) | | | (161,036 | ) |
| Shares outstanding at end of period | | | 1,016,345 | | | | 1,160,889 | |
The accompanying notes are an integral part of the financial statements.
| | | | | | Years Ended December 31, | |
| Class A | | Six Months Ended 6/30/14 (Unaudited) | | | 2013 | | | 2012 | | | 2011 | | | 2010 | | | 2009 | |
| Selected Per Share Data | |
| Net asset value, beginning of period | | $ | 17.08 | | | $ | 12.78 | | | $ | 11.36 | | | $ | 12.21 | | | $ | 10.04 | | | $ | 7.93 | |
Income (loss) from investment operations: Net investment incomea | | | .03 | | | | .12 | | | | .14 | | | | .13 | | | | .12 | | | | .16 | |
| Net realized and unrealized gain (loss) | | | .85 | | | | 4.35 | | | | 1.42 | | | | (.85 | ) | | | 2.19 | | | | 2.11 | |
| Total from investment operations | | | .88 | | | | 4.47 | | | | 1.56 | | | | (.72 | ) | | | 2.31 | | | | 2.27 | |
Less distributions from: Net investment income | | | (.14 | ) | | | (.17 | ) | | | (.14 | ) | | | (.13 | ) | | | (.14 | ) | | | (.16 | ) |
| Net realized gains on investment transactions | | | (.08 | ) | | | — | | | | — | | | | — | | | | — | | | | — | |
| Total distributions | | | (.22 | ) | | | (.17 | ) | | | (.14 | ) | | | (.13 | ) | | | (.14 | ) | | | (.16 | ) |
| Net asset value, end of period | | $ | 17.74 | | | $ | 17.08 | | | $ | 12.78 | | | $ | 11.36 | | | $ | 12.21 | | | $ | 10.04 | |
| Total Return (%) | | | 5.23 | ** | | | 35.24 | | | | 13.77 | | | | (6.08 | ) | | | 23.07 | | | | 29.70 | |
| Ratios to Average Net Assets and Supplemental Data | | | | | |
| Net assets, end of period ($ millions) | | | 225 | | | | 240 | | | | 219 | | | | 216 | | | | 247 | | | | 235 | |
| Ratio of expenses (%) | | | .82 | * | | | .82 | | | | .82 | | | | .81 | | | | .82 | | | | .79 | |
| Ratio of net investment income (%) | | | .40 | * | | | .81 | | | | 1.18 | | | | 1.08 | | | | 1.14 | | | | 1.92 | |
| Portfolio turnover rate (%) | | | 20 | ** | | | 115 | | | | 11 | | | | 36 | | | | 38 | | | | 72 | |
a Based on average shares outstanding during the period. * Annualized ** Not annualized | |
| | | | | | Years Ended December 31, | |
| Class B | | Six Months Ended 6/30/14 (Unaudited) | | | 2013 | | | 2012 | | | 2011 | | | 2010 | | | 2009 | |
| Selected Per Share Data | |
| Net asset value, beginning of period | | $ | 17.07 | | | $ | 12.78 | | | $ | 11.36 | | | $ | 12.20 | | | $ | 10.03 | | | $ | 7.92 | |
Income (loss) from investment operations: Net investment incomea | | | .00 | *** | | | .07 | | | | .10 | | | | .09 | | | | .08 | | | | .13 | |
| Net realized and unrealized gain (loss) | | | .84 | | | | 4.34 | | | | 1.42 | | | | (.85 | ) | | | 2.19 | | | | 2.12 | |
| Total from investment operations | | | .84 | | | | 4.41 | | | | 1.52 | | | | (.76 | ) | | | 2.27 | | | | 2.25 | |
Less distributions from: Net investment income | | | (.08 | ) | | | (.12 | ) | | | (.10 | ) | | | (.08 | ) | | | (.10 | ) | | | (.14 | ) |
| Net realized gains on investment transactions | | | (.08 | ) | | | — | | | | — | | | | — | | | | — | | | | — | |
| Total distributions | | | (.16 | ) | | | (.12 | ) | | | (.10 | ) | | | (.08 | ) | | | (.10 | ) | | | (.14 | ) |
| Net asset value, end of period | | $ | 17.75 | | | $ | 17.07 | | | $ | 12.78 | | | $ | 11.36 | | | $ | 12.20 | | | $ | 10.03 | |
| Total Return (%) | | | 4.97 | ** | | | 34.70 | | | | 13.38 | | | | (6.33 | ) | | | 22.66 | | | | 29.28 | |
| Ratios to Average Net Assets and Supplemental Data | |
| Net assets, end of period ($ millions) | | | 18 | | | | 20 | | | | 17 | | | | 20 | | | | 26 | | | | 23 | |
| Ratio of expenses (%) | | | 1.17 | * | | | 1.17 | | | | 1.16 | | | | 1.15 | | | | 1.17 | | | | 1.14 | |
| Ratio of net investment income (%) | | | .04 | * | | | .45 | | | | .81 | | | | .74 | | | | .79 | | | | 1.57 | |
| Portfolio turnover rate (%) | | | 20 | ** | | | 115 | | | | 11 | | | | 36 | | | | 38 | | | | 72 | |
a Based on average shares outstanding during the period. * Annualized ** Not annualized *** Amount is less than $.005. | |
Notes to Financial Statements (Unaudited)
A. Organization and Significant Accounting Policies
Deutsche Small Mid Cap Value VIP (formerly DWS Small Mid Cap Value VIP) (the "Fund") is a diversified series of Deutsche Variable Series II (formerly DWS Variable Series II) (the "Trust"), which is registered under the Investment Company Act of 1940, as amended (the "1940 Act"), as an open-end management investment company organized as a Massachusetts business trust.
Multiple Classes of Shares of Beneficial Interest. The Fund offers two classes of shares (Class A shares and Class B shares). Sales of Class B shares are subject to recordkeeping fees up to 0.15% and Rule 12b-1 fees under the 1940 Act equal to an annual rate of 0.25% of the average daily net assets of the Class B shares of the Fund. Class A shares are not subject to such fees.
Investment income, realized and unrealized gains and losses, and certain fund-level expenses and expense reductions, if any, are borne pro rata on the basis of relative net assets by the holders of all classes of shares except that each class bears certain expenses unique to that class (including the applicable Rule 12b-1 fee and recordkeeping fees). Differences in class-level expenses may result in payment of different per share dividends by class. All shares have equal rights with respect to voting subject to class-specific arrangements.
The Fund's financial statements are prepared in accordance with accounting principles generally accepted in the United States of America which require the use of management estimates. Actual results could differ from those estimates. The policies described below are followed consistently by the Fund in the preparation of its financial statements.
Security Valuation. Investments are stated at value determined as of the close of regular trading on the New York Stock Exchange on each day the exchange is open for trading.
Various inputs are used in determining the value of the Fund's investments. These inputs are summarized in three broad levels. Level 1 includes quoted prices in active markets for identical securities. Level 2 includes other significant observable inputs (including quoted prices for similar securities, interest rates, prepayment speeds and credit risk). Level 3 includes significant unobservable inputs (including the Fund's own assumptions in determining the fair value of investments). The level assigned to the securities valuations may not be an indication of the risk or liquidity associated with investing in those securities.
Equity securities are valued at the most recent sale price or official closing price reported on the exchange (U.S. or foreign) or over-the-counter market on which they trade. Securities for which no sales are reported are valued at the calculated mean between the most recent bid and asked quotations on the relevant market or, if a mean cannot be determined, at the most recent bid quotation. Equity securities are generally categorized as Level 1.
Investments in open-end investment companies are valued at their net asset value each business day and are categorized as Level 1.
Securities and other assets for which market quotations are not readily available or for which the above valuation procedures are deemed not to reflect fair value are valued in a manner that is intended to reflect their fair value as determined in accordance with procedures approved by the Board and are generally categorized as Level 3. In accordance with the Fund's valuation procedures, factors considered in determining value may include, but are not limited to, the type of the security; the size of the holding; the initial cost of the security; the existence of any contractual restrictions on the security's disposition; the price and extent of public trading in similar securities of the issuer or of comparable companies; quotations or evaluated prices from broker-dealers and/or pricing services; information obtained from the issuer, analysts, and/or the appropriate stock exchange (for exchange-traded securities); an analysis of the company's or issuer's financial statements; an evaluation of the forces that influence the issuer and the market(s) in which the security is purchased and sold; and with respect to debt securities, the maturity, coupon, creditworthiness, currency denomination and the movement of the market in which the security is normally traded. The value determined under these procedures may differ from published values for the same securities.
Disclosure about the classification of fair value measurements is included in a table following the Fund's Investment Portfolio.
Foreign Currency Translations. The books and records of the Fund are maintained in U.S. dollars. Investment securities and other assets and liabilities denominated in a foreign currency are translated into U.S. dollars at the prevailing exchange rates at period end. Purchases and sales of investment securities, income and expenses are translated into U.S. dollars at the prevailing exchange rates on the respective dates of the transactions.
Net realized and unrealized gains and losses on foreign currency transactions represent net gains and losses between trade and settlement dates on securities transactions, the acquisition and disposition of foreign currencies, and the difference between the amount of net investment income accrued and the U.S. dollar amount actually received. That portion of both realized and unrealized gains and losses on investments that results from fluctuations in foreign currency exchange rates is not separately disclosed but is included with net realized and unrealized gain/appreciation and loss/depreciation on investments.
Securities Lending. Brown Brothers Harriman & Co., as lending agent, lends securities of the Fund to certain financial institutions under the terms of the Security Lending Agreement. The Fund retains the benefits of owning the securities it has loaned and continues to receive interest and dividends generated by the securities and to participate in any changes in their market value. The Fund requires the borrowers of the securities to maintain collateral with the Fund consisting of either cash or liquid, unencumbered assets having a value at least equal to the value of the securities loaned. When the collateral falls below specified amounts, the lending agent will use its best effort to obtain additional collateral on the next business day to meet required amounts under the security lending agreement. The Fund may invest the cash collateral into a joint trading account in an affiliated money market fund pursuant to Exemptive Orders issued by the SEC. The Fund receives compensation for lending its securities either in the form of fees or by earning interest on invested cash collateral net of borrower rebates and fees paid to a lending agent. Either the Fund or the borrower may terminate the loan. There may be risks of delay and costs in recovery of securities or even loss of rights in the collateral should the borrower of the securities fail financially. If the Fund is not able to recover securities lent, the Fund may sell the collateral and purchase a replacement investment in the market, incurring the risk that the value of the replacement security is greater than the value of the collateral. The Fund is also subject to all investment risks associated with the reinvestment of any cash collateral received, including, but not limited to, interest rate, credit and liquidity risk associated with such investments. For the six months ended June 30, 2014, the Fund had no securities on loan.
Taxes. The Fund's policy is to comply with the requirements of the Internal Revenue Code, as amended, which are applicable to regulated investment companies and to distribute all of its taxable income to its shareholders.
The Fund has reviewed the tax positions for the open tax years as of December 31, 2013 and has determined that no provision for income tax and/or uncertain tax provisions is required in the Fund's financial statements. The Fund's federal tax returns for the prior three fiscal years remain open subject to examination by the Internal Revenue Service.
Distribution of Income and Gains. Distributions from net investment income of the Fund, if any, are declared and distributed to shareholders annually. Net realized gains from investment transactions, in excess of available capital loss carryforwards, would be taxable to the Fund if not distributed and, therefore, will be distributed to shareholders at least annually. The Fund may also make additional distributions for tax purposes if necessary.
The timing and characterization of certain income and capital gain distributions are determined annually in accordance with federal tax regulations which may differ from accounting principles generally accepted in the United States of America. These differences primarily relate to income received from Real Estate Investment Trusts and certain securities sold at a loss. As a result, net investment income (loss) and net realized gain (loss) on investment transactions for a reporting period may differ significantly from distributions during such period. Accordingly, the Fund may periodically make reclassifications among certain of its capital accounts without impacting the net asset value of the Fund.
The tax character of current year distributions will be determined at the end of the current fiscal year.
Expenses. Expenses of the Trust arising in connection with a specific fund are allocated to that fund. Other Trust expenses which cannot be directly attributed to a fund are apportioned among the funds in the Trust based upon the relative net assets or other appropriate measures.
Contingencies. In the normal course of business, the Fund may enter into contracts with service providers that contain general indemnification clauses. The Fund's maximum exposure under these arrangements is unknown as this would involve future claims that may be made against the Fund that have not yet been made. However, based on experience, the Fund expects the risk of loss to be remote.
Real Estate Investment Trusts. The Fund periodically recharacterizes distributions received from a Real Estate Investment Trust ("REIT") investment based on information provided by the REIT into the following categories: ordinary income, long-term and short-term capital gains, and return of capital. If information is not available timely from a REIT, the recharacterization will be estimated for financial reporting purposes and a recharacterization will be made to the accounting records in the following year when such information becomes available. Distributions received from REITs in excess of income are recorded as either a reduction of cost of investments or realized gains. The Fund distinguishes between dividends received on a tax basis and a financial reporting basis and only distributions in excess of tax basis earnings and profits are reported in the financial statements as a return of capital.
Other. Investment transactions are accounted for on a trade date plus one basis for daily net asset value calculations. However, for financial reporting purposes, investment transactions are reported on trade date. Interest income is recorded on the accrual basis. Dividend income is recorded on the ex-dividend date net of foreign withholding taxes. Realized gains and losses from investment transactions are recorded on an identified cost basis. Proceeds from litigation payments, if any, are included in net realized gain (loss) from investments.
B. Purchases and Sales of Securities
During the six months ended June 30, 2014, purchases and sales of investment transactions (excluding short-term investments) aggregated $46,992,074 and $75,808,036, respectively.
C. Related Parties
Management Agreement. Under the Investment Management Agreement with Deutsche Investment Management Americas Inc. ("DIMA" or the "Advisor"), an indirect, wholly owned subsidiary of Deutsche Bank AG, the Advisor directs the investments of the Fund in accordance with its investment objectives, policies and restrictions. The Advisor determines the securities, instruments and other contracts relating to investments to be purchased, sold or entered into by the Fund.
Pursuant to the Investment Management Agreement with the Advisor, the Fund pays a monthly management fee based on the Fund's average daily net assets, computed and accrued daily and payable monthly, at the following annual rates:
| First $250 million | | | .650 | % |
| Next $750 million | | | .620 | % |
| Next $1.5 billion | | | .600 | % |
| Next $2.5 billion | | | .580 | % |
| Next $2.5 billion | | | .550 | % |
| Next $2.5 billion | | | .540 | % |
| Next $2.5 billion | | | .530 | % |
| Over $12.5 billion | | | .520 | % |
Accordingly, for the six months ended June 30, 2014, the fee pursuant to the Investment Management Agreement was equivalent to an annualized effective rate (exclusive of any applicable waivers/reimbursements) of 0.65% of the Fund's average daily net assets.
For the period from January 1, 2014 through September 30, 2014, the Advisor has contractually agreed to waive its fee and/or reimburse certain operating expenses to the extent necessary to maintain the operating expenses (excluding certain expenses such as extraordinary expenses, taxes, brokerage and interest expense) of each class as follows:
Administration Fee. Pursuant to an Administrative Services Agreement, DIMA provides most administrative services to the Fund. For all services provided under the Administrative Services Agreement, the Fund pays DIMA an annual fee ("Administration Fee") of 0.10% of the Fund's average daily net assets, computed and accrued daily and payable monthly. For the six months ended June 30, 2014, the Administration Fee was $121,021, of which $19,925 is unpaid.
Service Provider Fees. DeAWM Service Company ("DSC"), an affiliate of the Advisor, is the transfer agent, dividend-paying agent and shareholder service agent for the Fund. Pursuant to a sub-transfer agency agreement between DSC and DST Systems, Inc. ("DST"), DSC has delegated certain transfer agent, dividend-paying agent and shareholder service agent functions to DST. DSC compensates DST out of the shareholder servicing fee it receives from the Fund. For the six months ended June 30, 2014, the amounts charged to the Fund by DSC were as follows:
| Service to Shareholders | | Total Aggregated | | | Unpaid at June 30, 2014 | |
| Class A | | $ | 298 | | | $ | 147 | |
| Class B | | | 296 | | | | 145 | |
| | | $ | 594 | | | $ | 292 | |
Distribution Service Agreement. Under the Fund's Class B 12b-1 plan, DeAWM Distributors, Inc. ("DDI") received a fee ("Distribution Service Fee") of 0.25% of average daily net assets of Class B shares. For the six months ended June 30, 2014, the Distribution Service Fee aggregated $23,167, of which $3,662 is unpaid.
Typesetting and Filing Service Fees. Under an agreement with DIMA, DIMA is compensated for providing typesetting and certain regulatory filing services to the Fund. For the six months ended June 30, 2014, the amount charged to the Fund by DIMA included in the Statement of Operations under "reports to shareholders" aggregated $7,485, of which $690 is unpaid.
Trustees' Fees and Expenses. The Fund paid retainer fees to each Trustee not affiliated with the Advisor, plus specified amounts to the Board Chairperson and Vice Chairperson and to each committee Chairperson.
Affiliated Cash Management Vehicles. The Fund may invest uninvested cash balances in Central Cash Management Fund and Deutsche Variable NAV Money Fund, affiliated money market funds which are managed by the Advisor. Each affiliated money market fund seeks to provide a high level of current income consistent with liquidity and the preservation of capital. Each affiliated money market fund is managed in accordance with Rule 2a-7 under the Investment Company Act of 1940, which governs the quality, maturity, diversity and liquidity of instruments in which a money market fund may invest. Central Cash Management Fund seeks to maintain a stable net asset value, and Deutsche Variable NAV Money Fund maintains a floating net asset value. The Fund indirectly bears its proportionate share of the expenses of each affiliated money market fund in which it invests. Central Cash Management Fund does not pay the Advisor an investment management fee. To the extent that Deutsche Variable NAV Money Fund pays an investment management fee to the Advisor, the Advisor will waive an amount of the investment management fee payable to the Advisor by the Fund equal to the amount of the investment management fee payable on the Fund's assets invested in Deutsche Variable NAV Money Fund.
D. Ownership of the Fund
At June 30, 2014, two participating insurance companies were owners of record of 10% or more of the total outstanding Class A shares of the Fund, each owning 58% and 21%. Three participating insurance companies were owners of record of 10% or more of the total outstanding Class B shares of the Fund, each owning 41%, 24% and 17%.
E. Line of Credit
The Fund and other affiliated funds (the "Participants") share in a $400 million revolving credit facility provided by a syndication of banks. The Fund may borrow for temporary or emergency purposes, including the meeting of redemption requests that otherwise might require the untimely disposition of securities. The Participants are charged an annual commitment fee which is allocated based on net assets, among each of the Participants. Interest is calculated at a rate per annum equal to the sum of the Federal Funds Rate plus 1.25 percent plus if LIBOR exceeds the Federal Funds Rate the amount of such excess. The Fund may borrow up to a maximum of 33 percent of its net assets under the agreement. The Fund had no outstanding loans at June 30, 2014.
F. Fund Name Change
Effective August 11, 2014, the "DWS Funds" were rebranded "Deutsche Funds."
Information About Your Fund's Expenses (Unaudited)
As an investor of the Fund, you incur two types of costs: ongoing expenses and transaction costs. Ongoing expenses include management fees, distribution and service (12b-1) fees and other Fund expenses. Examples of transaction costs include contract charges and account maintenance fees, which are not shown in this section. The following tables are intended to help you understand your ongoing expenses (in dollars) of investing in the Fund and to help you compare these expenses with the ongoing expenses of investing in other mutual funds. The example in the table is based on an investment of $1,000 invested at the beginning of the six-month period and held for the entire period (January 1, 2014 to June 30, 2014).
The tables illustrate your Fund's expenses in two ways:
—Actual Fund Return. This helps you estimate the actual dollar amount of ongoing expenses (but not transaction costs) paid on a $1,000 investment in the Fund using the Fund's actual return during the period. To estimate the expenses you paid over the period, simply divide your account value by $1,000 (for example, an $8,600 account value divided by $1,000 = 8.6), then multiply the result by the number in the "Expenses Paid per $1,000" line under the share class you hold.
—Hypothetical 5% Fund Return. This helps you to compare your Fund's ongoing expenses (but not transaction costs) with those of other mutual funds using the Fund's actual expense ratio and a hypothetical rate of return of 5% per year before expenses. Examples using a 5% hypothetical Fund return may be found in the shareholder reports of other mutual funds. The hypothetical account values and expenses may not be used to estimate the actual ending account balance or expenses you paid for the period.
Please note that the expenses shown in these tables are meant to highlight your ongoing expenses only and do not reflect any transaction costs. The "Expenses Paid per $1,000" line of the tables is useful in comparing ongoing expenses only and will not help you determine the relative total expense of owning different funds. If these transaction costs had been included, your costs would have been higher.
Expenses and Value of a $1,000 Investment for the six months ended June 30, 2014 | |
| Actual Fund Return | | Class A | | | Class B | |
| Beginning Account Value 1/1/14 | | $ | 1,000.00 | | | $ | 1,000.00 | |
| Ending Account Value 6/30/14 | | $ | 1,052.30 | | | $ | 1,049.70 | |
| Expenses Paid per $1,000* | | $ | 4.17 | | | $ | 5.95 | |
| Hypothetical 5% Fund Return | | Class A | | | Class B | |
| Beginning Account Value 1/1/14 | | $ | 1,000.00 | | | $ | 1,000.00 | |
| Ending Account Value 6/30/14 | | $ | 1,020.73 | | | $ | 1,018.99 | |
| Expenses Paid per $1,000* | | $ | 4.11 | | | $ | 5.86 | |
* Expenses are equal to the Fund's annualized expense ratio for each share class, multiplied by the average account value over the period, multiplied by 181 (the number of days in the most recent six-month period), then divided by 365.
| Annualized Expense Ratios | Class A | | Class B | |
| Deutsche Variable Series II — Deutsche Small Mid Cap Value VIP | .82% | | 1.17% | |
For more information, please refer to the Fund's prospectus.
These tables do not reflect charges and fees ("contract charges") associated with the separate account that invests in the Fund or any variable life insurance policy or variable annuity contract for which the Fund is an investment option.
For an analysis of the fees associated with an investment in the fund or similar funds, please refer to the current and hypothetical expense calculators for Variable Insurance Products which can be found at deutschefunds.com/EN/resources/calculators.jsp.
The Trust's policies and procedures for voting proxies for portfolio securities and information about how the Trust voted proxies related to its portfolio securities during the 12-month period ended June 30 are available on our Web site — deutschefunds.com (click on "proxy voting" at the bottom of the page) — or on the SEC's Web site — sec.gov. To obtain a written copy of the Trust's policies and procedures without charge, upon request, call us toll free at (800) 728-3337.
Advisory Agreement Board Considerations and Fee Evaluation
The Board of Trustees approved the renewal of DWS Small Mid Cap Value VIP's investment management agreement (the "Agreement") with Deutsche Investment Management Americas Inc. ("DIMA") in September 2013.
In terms of the process that the Board followed prior to approving the Agreement, shareholders should know that:
— In September 2013, all but one of the Fund's Trustees were independent of DIMA and its affiliates.
— The Trustees met frequently during the past year to discuss fund matters and dedicated a substantial amount of time to contract review matters. Over the course of several months, the Board's Contract Committee, in coordination with the Board's Equity Oversight Committee, reviewed comprehensive materials received from DIMA, independent third parties and independent counsel. These materials included an analysis of the Fund's performance, fees and expenses, and profitability compiled by a fee consultant retained by the Fund's Independent Trustees (the "Fee Consultant"). The Board also received extensive information throughout the year regarding performance of the Fund.
— The Independent Trustees regularly meet privately with their independent counsel to discuss contract review and other matters. In addition, the Independent Trustees were also advised by the Fee Consultant in the course of their review of the Fund's contractual arrangements and considered a comprehensive report prepared by the Fee Consultant in connection with their deliberations.
— In connection with reviewing the Agreement, the Board also reviewed the terms of the Fund's Rule 12b-1 plan, distribution agreement, administrative services agreement, transfer agency agreement and other material service agreements.
— Based on its evaluation of the information provided, the Contract Committee presented its findings and recommendations to the Board. The Board then reviewed the Contract Committee's findings and recommendations.
In connection with the contract review process, the Contract Committee and the Board considered the factors discussed below, among others. The Board also considered that DIMA and its predecessors have managed the Fund since its inception, and the Board believes that a long-term relationship with a capable, conscientious advisor is in the best interests of the Fund. The Board considered, generally, that shareholders chose to invest or remain invested in the Fund knowing that DIMA managed the Fund, and that the Agreement was approved by the Fund's shareholders. DIMA is part of Deutsche Bank AG, a major global banking institution that is engaged in a wide range of financial services. The Board believes that there are advantages to being part of a global asset management business that offers a wide range of investing expertise and resources, including hundreds of portfolio managers and analysts with research capabilities in many countries throughout the world.
As part of the contract review process, the Board carefully considered the fees and expenses of each DWS fund overseen by the Board in light of the fund's performance. In many cases, this led to a negotiation with DIMA of lower expense caps as part of the 2012 and 2013 contract review processes than had previously been in place. As part of these negotiations, the Board indicated that it would consider relaxing these new lower caps in future years following sustained improvements in performance, among other considerations.
In June 2012, Deutsche Bank AG ("DB"), DIMA's parent company, announced that DB would combine its Asset Management (of which DIMA was a part) and Wealth Management divisions. DB has advised the Independent Trustees that the U.S. asset management business is a critical and integral part of DB, and that it has, and will continue to, reinvest a significant portion of the substantial savings it expects to realize by combining its Asset Management and Wealth Management divisions into the new Asset and Wealth Management ("AWM") division, including ongoing enhancements to its investment capabilities. DB also has confirmed its commitment to maintaining strong legal and compliance groups within the AWM division.
While shareholders may focus primarily on fund performance and fees, the Fund's Board considers these and many other factors, including the quality and integrity of DIMA's personnel and such other issues as back-office operations, fund valuations, and compliance policies and procedures.
Nature, Quality and Extent of Services. The Board considered the terms of the Agreement, including the scope of advisory services provided under the Agreement. The Board noted that, under the Agreement, DIMA provides portfolio management services to the Fund and that, pursuant to a separate administrative services agreement, DIMA provides administrative services to the Fund. The Board considered the experience and skills of senior management and investment personnel, the resources made available to such personnel, the ability of DIMA to attract and retain high-quality personnel, and the organizational depth and stability of DIMA. The Board reviewed the Fund's performance over short-term and long-term periods and compared those returns to various agreed-upon performance measures, including market indices and a peer universe compiled by the Fee Consultant using information supplied by Morningstar Direct ("Morningstar"), an independent fund data service. The Board also noted that it has put into place a process of identifying "Focus Funds" (e.g., funds performing poorly relative to their benchmark or a peer universe compiled by an independent fund data service), and receives more frequent reporting and information from DIMA regarding such funds, along with DIMA's remedial plans to address underperformance. The Board believes this process is an effective manner of identifying and addressing underperforming funds. Based on the information provided, the Board noted that for the one-, three- and five-year periods ended December 31, 2012, the Fund's performance (Class A shares) was in the 4th quartile, 4th quartile and 3rd quartile, respectively, of the applicable Morningstar universe (the 1st quartile being the best performers and the 4th quartile being the worst performers). The Board also observed that the Fund has underperformed its benchmark in the one-, three- and five-year periods ended December 31, 2012. The Board noted the disappointing investment performance of the Fund in recent periods and continued to discuss with senior management of DIMA the factors contributing to such underperformance and actions being taken to improve performance. The Board recognized that DIMA has made changes to its investment personnel and processes in recent years in an effort to enhance its investment platform and improve long-term performance across the DWS fund complex.
Fees and Expenses. The Board considered the Fund's investment management fee schedule, operating expenses and total expense ratios, and comparative information provided by Lipper Inc. ("Lipper") and the Fee Consultant regarding investment management fee rates paid to other investment advisors by similar funds (1st quartile being the most favorable and 4th quartile being the least favorable). With respect to management fees paid to other investment advisors by similar funds, the Board noted that the contractual fee rates paid by the Fund, which include a 0.10% fee paid to DIMA under the Fund's administrative services agreement, were lower than the median (1st quartile) of the applicable Lipper peer group (based on Lipper data provided as of December 31, 2012). The Board noted that the Fund's Class A shares total (net) operating expenses were expected to be lower than the median (2nd quartile) of the applicable Lipper expense universe (based on Lipper data provided as of December 31, 2012, and analyzing Lipper expense universe Class A (net) expenses less any applicable 12b-1 fees) ("Lipper Universe Expenses"). The Board also reviewed data comparing each share class's total (net) operating expenses to the applicable Lipper Universe Expenses. The Board considered the Fund's management fee rate as compared to fees charged by DIMA to a comparable fund and considered differences between the Fund and the comparable fund. The Board also considered how the Fund's total (net) operating expenses compared to the total (net) operating expenses of a more customized peer group selected by Lipper (based on such factors as asset size). The Board also noted that the expense limitations agreed to by DIMA helped to ensure that the Fund's total (net) operating expenses would remain competitive.
The information considered by the Board as part of its review of management fees included information regarding fees charged by DIMA and its affiliates to similar institutional accounts and to similar funds offered primarily to European investors ("DWS Europe funds"), in each case as applicable. The Board observed that advisory fee rates for institutional accounts generally were lower than the management fees charged by similarly managed DWS U.S. mutual funds ("DWS Funds"), but also took note of the differences in services provided to DWS Funds as compared to institutional accounts. In the case of DWS Europe funds, the Board observed that fee rates for DWS Europe funds generally were higher than for similarly managed DWS Funds, but noted that differences in the types of services provided to DWS Funds relative to DWS Europe funds made it difficult to compare such fees.
On the basis of the information provided, the Board concluded that management fees were reasonable and appropriate in light of the nature, quality and extent of services provided by DIMA.
Profitability. The Board reviewed detailed information regarding revenues received by DIMA under the Agreement. The Board considered the estimated costs and pre-tax profits realized by DIMA from advising the DWS Funds, as well as estimates of the pre-tax profits attributable to managing the Fund in particular. The Board also received information regarding the estimated enterprise-wide profitability of DWS and its affiliates with respect to all fund services in totality and by fund. The Board and the Fee Consultant reviewed DIMA's methodology in allocating its costs to the management of the Fund. Based on the information provided, the Board concluded that the pre-tax profits realized by DIMA in connection with the management of the Fund were not unreasonable. The Board also reviewed information regarding the profitability of certain similar investment management firms. The Board noted that while information regarding the profitability of such firms is limited (and in some cases is not necessarily prepared on a comparable basis), DIMA and its affiliates' overall profitability with respect to the DWS fund complex (after taking into account distribution and other services provided to the funds by DIMA and its affiliates) was lower than the overall profitability levels of many comparable firms for which such data was available.
Economies of Scale. The Board considered whether there are economies of scale with respect to the management of the Fund and whether the Fund benefits from any economies of scale. The Board noted that the Fund's management fee schedule includes fee breakpoints. The Board concluded that the Fund's fee schedule represents an appropriate sharing between the Fund and DIMA of such economies of scale as may exist in the management of the Fund at current asset levels.
Other Benefits to DIMA and Its Affiliates. The Board also considered the character and amount of other incidental benefits received by DIMA and its affiliates, including any fees received by DIMA for administrative services provided to the Fund and any fees received by an affiliate of DIMA for distribution services. The Board also considered benefits to DIMA related to brokerage and soft-dollar allocations, including allocating brokerage to pay for research generated by parties other than the executing broker dealers, which pertain primarily to funds investing in equity securities, along with the incidental public relations benefits to DIMA related to DWS Funds advertising and cross-selling opportunities among DIMA products and services. The Board concluded that management fees were reasonable in light of these fallout benefits.
Compliance. The Board considered the significant attention and resources dedicated by DIMA to documenting and enhancing its compliance processes in recent years. The Board noted in particular (i) the experience and seniority of both DIMA's chief compliance officer and the Fund's chief compliance officer; (ii) the large number of DIMA compliance personnel; and (iii) the substantial commitment of resources by DIMA and its affiliates to compliance matters.
Based on all of the information considered and the conclusions reached, the Board unanimously determined that the continuation of the Agreement is in the best interests of the Fund. In making this determination, the Board did not give particular weight to any single factor identified above. The Board considered these factors over the course of numerous meetings, certain of which were in executive session with only the Independent Trustees and their independent counsel present. It is possible that individual Trustees may have weighed these factors differently in reaching their individual decisions to approve the continuation of the Agreement.
DeAWM Distributors, Inc.
222 South Riverside Plaza
Chicago, IL 60606
(800) 621-1148
VS2SMCV-3 (R-028381-3 8/14)
June 30, 2014
Semiannual Report
Deutsche Variable Series II
(formerly DWS Variable Series II)
Deutsche Unconstrained Income VIP
(formerly DWS Unconstrained Income VIP)
Contents
5 Portfolio Management Team 21 Statement of Assets and Liabilities 22 Statement of Operations 23 Statement of Changes in Net Assets 25 Notes to Financial Statements 34 Information About Your Fund's Expenses 36 Advisory Agreement Board Considerations and Fee Evaluation |
This report must be preceded or accompanied by a prospectus. To obtain an additional prospectus or summary prospectus, if available, call (800) 728-3337 or your financial representative. We advise you to consider the Fund's objectives, risks, charges and expenses carefully before investing. The summary prospectus and prospectus contain this and other important information about the Fund. Please read the prospectus carefully before you invest.
Bond investments are subject to interest-rate and credit risks. When interest rates rise, bond prices generally fall. Credit risk refers to the ability of an issuer to make timely payments of principal and interest. Investments in lower-quality ("junk bonds") and non-rated securities present greater risk of loss than investments in higher-quality securities. Investing in derivatives entails special risks relating to liquidity, leverage and credit that may reduce returns and/or increase volatility. Investing in foreign securities, particularly those of emerging markets, presents certain risks, such as currency fluctuations, political and economic changes, and market risks. The Fund may lend securities to approved institutions. See the prospectus for details.
Deutsche Asset & Wealth Management represents the asset management and wealth management activities conducted by Deutsche Bank AG or any of its subsidiaries, including the Advisor and DeAWM Distributors, Inc.
NOT FDIC/NCUA INSURED NO BANK GUARANTEE MAY LOSE VALUE NOT A DEPOSIT
NOT INSURED BY ANY FEDERAL GOVERNMENT AGENCY
Dear Shareholder:
I am very pleased to tell you that the DWS funds have been renamed Deutsche funds, aligning more closely with the Deutsche Asset & Wealth Management brand. We are proud to adopt the Deutsche name — a brand that fully represents the global access, discipline and intelligence that support all of our products and services.
Deutsche Asset & Wealth Management combines the asset management and wealth management divisions of Deutsche Bank to deliver a comprehensive suite of active, passive and alternative investment capabilities. Your investment in the Deutsche funds means you have access to the thought leadership and resources of one of the world’s largest and most influential financial institutions.
In conjunction with your fund’s name change, please note that the Deutsche funds’ Web address has changed as well. The former dws-investments.com is now deutschefunds.com.
In addition, key service providers have been renamed as follows:
| Former Name | New name, effective August 11, 2014 |
| DWS Investments Distributors, Inc. | DeAWM Distributors, Inc. |
| DWS Trust Company | DeAWM Trust Company |
| DWS Investments Service Company | DeAWM Service Company |
These changes have no effect on the day-to-day management of your investment, and there is no action required on your part. You will continue to experience the benefits that come from our decades of experience, in-depth research and worldwide network of investment professionals.
Thanks for your continued support. We appreciate your trust and the opportunity to put our capabilities to work for you.
Best regards,
Brian Binder
President, Deutsche Funds
Performance Summary June 30, 2014 (Unaudited)
Fund performance shown is historical, assumes reinvestment of all dividend and capital gain distributions and does not guarantee future results. Investment return and principal value fluctuate with changing market conditions so that, when redeemed, shares may be worth more or less than their original cost. Current performance may be lower or higher than the performance data quoted. Please contact your participating insurance company for the Fund's most recent month-end performance. Performance doesn't reflect charges and fees ("contract charges") associated with the separate account that invests in the Fund or any variable life insurance policy or variable annuity contract for which the Fund is an investment option. These charges and fees will reduce returns.
The gross expense ratio of the Fund, as stated in the fee table of the prospectus dated May 1, 2014 is 1.02% for Class A shares and may differ from the expense ratio disclosed in the Financial Highlights table in this report.
| Growth of an Assumed $10,000 Investment in Deutsche Unconstrained Income VIP |
| The Barclays U.S. Universal Index represents the union of the U.S. Aggregate Index, the U.S. High-Yield Corporate Index, the 144A Index, the Eurodollar Index, the Emerging Markets Index and the non-ERISA portion of the CMBS Index. The Barclays U.S. Aggregate Bond Index is an unmanaged index representing domestic taxable investment-grade bonds, with index components for government and corporate securities, mortgage pass-through securities, and asset-backed securities with an average maturity of one year or more. Index returns do not reflect any fees or expenses and it is not possible to invest directly into an index. |
| |
| Yearly periods ended June 30 | |
| Comparative Results | |
| Deutsche Unconstrained Income VIP | | 6-Month‡ | | | 1-Year | | | 3-Year | | | 5-Year | | | 10-Year | |
| Class A | Growth of $10,000 | | $ | 10,487 | | | $ | 10,796 | | | $ | 12,018 | | | $ | 15,285 | | | $ | 19,955 | |
| Average annual total return | | | 4.87 | % | | | 7.96 | % | | | 6.32 | % | | | 8.86 | % | | | 7.15 | % |
| Barclays U.S. Universal Index | Growth of $10,000 | | $ | 10,419 | | | $ | 10,520 | | | $ | 11,321 | | | $ | 13,120 | | | $ | 16,705 | |
| Average annual total return | | | 4.19 | % | | | 5.20 | % | | | 4.22 | % | | | 5.58 | % | | | 5.27 | % |
| Barclays U.S. Aggregate Bond Index | Growth of $10,000 | | $ | 10,393 | | | $ | 10,437 | | | $ | 11,140 | | | $ | 12,674 | | | $ | 16,187 | |
| Average annual total return | | | 3.93 | % | | | 4.37 | % | | | 3.66 | % | | | 4.85 | % | | | 4.93 | % |
The growth of $10,000 is cumulative.
‡ Total returns shown for periods less than one year are not annualized.
Portfolio Summary (Unaudited) Asset Allocation (As a % of Investment Portfolio excluding Securities Lending Collateral) | 6/30/14 | 12/31/13 |
| | | |
| Corporate Bonds | 56% | 60% |
| Government & Agency Obligations | 14% | 19% |
| Cash Equivalents | 10% | 2% |
| Loan Participations and Assignments | 5% | 5% |
| Exchange-Traded Fund | 5% | 1% |
| Commercial Mortgage-Backed Securities | 3% | 3% |
| Collateralized Mortgage Obligations | 3% | 5% |
| Asset-Backed | 2% | 1% |
| Municipal Bonds and Notes | 2% | 2% |
| Mortgage-Backed Securities Pass-Throughs | — | 2% |
| | 100% | 100% |
Quality (Excludes Cash Equivalents and Securities Lending Collateral) | 6/30/14 | 12/31/13 |
| | | |
| AAA | 8% | 20% |
| AA | 5% | 3% |
| A | 4% | 3% |
| BBB | 17% | 18% |
| BB | 31% | 25% |
| B | 20% | 19% |
| CCC or Below | 6% | 4% |
| Not Rated | 9% | 8% |
| | 100% | 100% |
| Interest Rate Sensitivity | 6/30/14 | 12/31/13 |
| | | |
| Effective Maturity | 6.3 years | 6.6 years |
| Effective Duration | 3.9 years | 4.3 years |
The quality ratings represent the higher of Moody's Investors Service, Inc. ("Moody's") or Standard & Poor's Corporation ("S&P") credit ratings. The ratings of Moody's and S&P represent their opinions as to the quality of the securities they rate. Credit quality measures a bond issuer's ability to repay interest and principal in a timely manner. Ratings are relative and subjective and are not absolute standards of quality. Credit quality does not remove market risk and is subject to change.
Effective maturity is the weighted average of the maturity date of bonds held by the Fund taking into consideration any available maturity shortening features.
Effective duration is an approximate measure of the Fund's sensitivity to interest rate changes taking into consideration any maturity shortening features.
Portfolio holdings and characteristics are subject to change.
For more complete details about the Fund's investment portfolio, see page 6.
Following the Fund's fiscal first and third quarter-end, a complete portfolio holdings listing is filed with the SEC on Form N-Q. The form will be available on the SEC's Web site at sec.gov, and it also may be reviewed and copied at the SEC's Public Reference Room in Washington, D.C. Information on the operation of the SEC's Public Reference Room may be obtained by calling (800) SEC-0330. The Fund's portfolio holdings are also posted on deutschefunds.com from time to time. Please see the Fund's current prospectus for more information.
Portfolio Management Team
Gary Russell, CFA
William Chepolis, CFA
John D. Ryan
Philip G. Condon
Darwei Kung
Portfolio Managers
Investment Portfolio June 30, 2014 (Unaudited) | | | Principal Amount ($)(a) | | | Value ($) | |
| | | | |
| Corporate Bonds 56.1% | |
| Consumer Discretionary 6.8% | |
| Ally Financial, Inc., 8.3%, 2/12/2015 | | | 135,000 | | | | 140,653 | |
| AMC Entertainment, Inc., 5.875%, 2/15/2022 (b) | | | | 30,000 | | | | 31,200 | |
| AMC Networks, Inc., 7.75%, 7/15/2021 | | | | 15,000 | | | | 16,781 | |
| AmeriGas Finance LLC: | |
| 6.75%, 5/20/2020 | | | | 70,000 | | | | 75,950 | |
| 7.0%, 5/20/2022 | | | | 60,000 | | | | 66,450 | |
| APX Group, Inc.: | |
| 8.75%, 12/1/2020 | | | | 5,000 | | | | 5,075 | |
| 144A, 8.75%, 12/1/2020 | | | | 20,000 | | | | 20,300 | |
| Asbury Automotive Group, Inc., 8.375%, 11/15/2020 | | | 85,000 | | | | 94,350 | |
| Ashtead Capital, Inc., 144A, 6.5%, 7/15/2022 | | | | 45,000 | | | | 49,162 | |
| Ashton Woods U.S.A. LLC, 144A, 6.875%, 2/15/2021 | | | 50,000 | | | | 50,000 | |
| Avis Budget Car Rental LLC, 5.5%, 4/1/2023 | | | | 30,000 | | | | 30,675 | |
| BC Mountain LLC, 144A, 7.0%, 2/1/2021 | | | | 30,000 | | | | 29,025 | |
| Block Communications, Inc., 144A, 7.25%, 2/1/2020 | | | 65,000 | | | | 69,225 | |
| Boyd Gaming Corp., 9.0%, 7/1/2020 (b) | | | 25,000 | | | | 27,562 | |
| Cablevision Systems Corp.: | |
| 5.875%, 9/15/2022 | | | | 15,000 | | | | 15,281 | |
| 8.0%, 4/15/2020 (b) | | | | 10,000 | | | | 11,356 | |
| CCO Holdings LLC: | |
| 6.5%, 4/30/2021 | | | | 120,000 | | | | 127,800 | |
| 6.625%, 1/31/2022 | | | | 70,000 | | | | 75,250 | |
| 7.0%, 1/15/2019 (b) | | | | 20,000 | | | | 21,100 | |
| 7.25%, 10/30/2017 | | | | 90,000 | | | | 94,950 | |
| 7.375%, 6/1/2020 | | | | 10,000 | | | | 10,900 | |
| 8.125%, 4/30/2020 | | | | 25,000 | | | | 27,063 | |
| Cequel Communications Holdings I LLC: | | | | | | | | |
| 144A, 5.125%, 12/15/2021 | | | | 89,000 | | | | 88,666 | |
| 144A, 6.375%, 9/15/2020 | | | | 160,000 | | | | 170,000 | |
| Clear Channel Communications, Inc.: | |
| 9.0%, 12/15/2019 | | | | 70,000 | | | | 74,637 | |
| 11.25%, 3/1/2021 | | | | 40,000 | | | | 45,350 | |
| Clear Channel Worldwide Holdings, Inc.: | |
| Series A, 6.5%, 11/15/2022 | | | 15,000 | | | | 16,013 | |
| Series A, 7.625%, 3/15/2020 | | | 20,000 | | | | 21,400 | |
| Series B, 7.625%, 3/15/2020 | | | 185,000 | | | | 199,569 | |
| Cogeco Cable, Inc., 144A, 4.875%, 5/1/2020 | | | | 5,000 | | | | 5,063 | |
| Columbus International, Inc., 144A, 7.375%, 3/30/2021 | | | 200,000 | | | | 215,500 | |
| Crown Media Holdings, Inc., 10.5%, 7/15/2019 | | | | 55,000 | | | | 61,944 | |
| CSC Holdings LLC, 144A, 5.25%, 6/1/2024 | | | | 75,000 | | | | 73,781 | |
| Cumulus Media Holdings, Inc., 7.75%, 5/1/2019 (b) | | | 65,000 | | | | 68,494 | |
| Delphi Corp., 5.0%, 2/15/2023 | | | 40,000 | | | | 43,000 | |
| DISH DBS Corp.: | |
| 4.25%, 4/1/2018 | | | | 40,000 | | | | 41,600 | |
| 5.0%, 3/15/2023 | | | | 50,000 | | | | 50,937 | |
| 6.625%, 10/1/2014 | | | | 65,000 | | | | 65,812 | |
| | | Principal Amount ($)(a) | | | Value ($) | |
| | | | | | | | | |
| 6.75%, 6/1/2021 | | | | 10,000 | | | | 11,400 | |
| 7.125%, 2/1/2016 | | | | 155,000 | | | | 167,594 | |
| General Motors Financial Co., Inc., 3.25%, 5/15/2018 | | | 15,000 | | | | 15,225 | |
| Getty Images, Inc., 144A, 7.0%, 10/15/2020 | | | | 50,000 | | | | 45,812 | |
| Group 1 Automotive, Inc., 144A, 5.0%, 6/1/2022 | | | 25,000 | | | | 25,000 | |
| Harron Communications LP, 144A, 9.125%, 4/1/2020 | | | 60,000 | | | | 66,900 | |
| Hertz Corp., 6.75%, 4/15/2019 | | | 50,000 | | | | 53,000 | |
| Hot Topic, Inc., 144A, 9.25%, 6/15/2021 | | | 20,000 | | | | 22,200 | |
| Isle of Capri Casinos, Inc., 5.875%, 3/15/2021 | | | | 15,000 | | | | 15,169 | |
| Jo-Ann Stores Holdings, Inc., 144A, 9.75%, 10/15/2019 (PIK) | | | 25,000 | | | | 25,563 | |
| Johnson Controls, Inc., 4.95%, 7/2/2064 | | | | 40,000 | | | | 40,521 | |
| L Brands, Inc., 7.0%, 5/1/2020 | | | 20,000 | | | | 22,975 | |
| Live Nation Entertainment, Inc.: | |
| 144A, 5.375%, 6/15/2022 | | | | 5,000 | | | | 5,063 | |
| 144A, 7.0%, 9/1/2020 | | | | 50,000 | | | | 54,750 | |
| MDC Partners, Inc., 144A, 6.75%, 4/1/2020 | | | | 30,000 | | | | 31,650 | |
| Mediacom Broadband LLC: | |
| 144A, 5.5%, 4/15/2021 | | | | 5,000 | | | | 5,063 | |
| 6.375%, 4/1/2023 | | | | 65,000 | | | | 68,575 | |
| Mediacom LLC, 7.25%, 2/15/2022 | | | 20,000 | | | | 21,800 | |
| MGM Resorts International: | |
| 6.75%, 10/1/2020 | | | | 76,000 | | | | 84,835 | |
| 8.625%, 2/1/2019 | | | | 85,000 | | | | 101,256 | |
| Numericable Group SA, 144A, 4.875%, 5/15/2019 | | | 70,000 | | | | 71,837 | |
| Pinnacle Entertainment, Inc., 6.375%, 8/1/2021 | | | | 35,000 | | | | 36,925 | |
| Quebecor Media, Inc., 5.75%, 1/15/2023 | | | | 30,000 | | | | 30,825 | |
| RCI Banque SA, 144A, 3.5%, 4/3/2018 | | | | 200,000 | | | | 208,506 | |
| Sabre Holdings Corp., 8.35%, 3/15/2016 | | | | 55,000 | | | | 60,844 | |
| Seminole Hard Rock Entertainment, Inc., 144A, 5.875%, 5/15/2021 | | | 15,000 | | | | 15,038 | |
| Seminole Tribe of Florida, Inc., 144A, 7.804%, 10/1/2020 | | | 70,000 | | | | 78,750 | |
| Serta Simmons Holdings LLC, 144A, 8.125%, 10/1/2020 | | | 35,000 | | | | 37,975 | |
| Sirius XM Radio, Inc., 144A, 5.875%, 10/1/2020 | | | | 30,000 | | | | 31,725 | |
| Springs Industries, Inc., 6.25%, 6/1/2021 | | | | 35,000 | | | | 35,700 | |
| Starz LLC, 5.0%, 9/15/2019 | | | | 25,000 | | | | 26,031 | |
| Taylor Morrison Communities, Inc., 144A, 5.25%, 4/15/2021 | | | 40,000 | | | | 40,600 | |
| The Men's Wearhouse, Inc., 144A, 7.0%, 7/1/2022 (b) | | | 20,000 | | | | 20,700 | |
| Time Warner Cable, Inc., 7.3%, 7/1/2038 | | | | 35,000 | | | | 47,083 | |
| Travelport LLC, 144A, 13.875%, 3/1/2016 (PIK) | | | | 6,912 | | | | 7,119 | |
| UCI International, Inc., 8.625%, 2/15/2019 | | | | 20,000 | | | | 19,000 | |
| Univision Communications, Inc., 144A, 7.875%, 11/1/2020 | | | 25,000 | | | | 27,500 | |
| | | Principal Amount ($)(a) | | | Value ($) | |
| | | | | | | | | |
| Viking Cruises Ltd., 144A, 8.5%, 10/15/2022 | | | | 30,000 | | | | 33,150 | |
| Weyerhaeuser Real Estate Co.: | |
| 144A, 4.375%, 6/15/2019 | | | | 20,000 | | | | 20,050 | |
| 144A, 5.875%, 6/15/2024 | | | | 10,000 | | | | 10,288 | |
| | | | | 4,075,871 | |
| Consumer Staples 3.2% | |
| Ajecorp BV, 144A, 6.5%, 5/14/2022 (b) | | | 150,000 | | | | 138,000 | |
| Big Heart Pet Brands, 7.625%, 2/15/2019 | | | | 55,000 | | | | 57,315 | |
| BRF SA, 144A, 5.875%, 6/6/2022 | | | 200,000 | | | | 216,500 | |
| Chiquita Brands International, Inc., 7.875%, 2/1/2021 | | | 24,000 | | | | 26,130 | |
| Controladora Mabe SA de CV, 144A, 7.875%, 10/28/2019 | | | 100,000 | | | | 114,500 | |
| Cott Beverages, Inc., 144A, 5.375%, 7/1/2022 | | | | 35,000 | | | | 35,088 | |
| Delhaize Group SA, 4.125%, 4/10/2019 | | | | 140,000 | | | | 147,015 | |
| FAGE Dairy Industry SA, 144A, 9.875%, 2/1/2020 | | | 85,000 | | | | 90,950 | |
| JBS Investments GmbH: | |
| 144A, 7.25%, 4/3/2024 | | | | 70,000 | | | | 72,450 | |
| 144A, 7.75%, 10/28/2020 | | | | 200,000 | | | | 214,000 | |
| JBS U.S.A. LLC: | |
| 144A, 7.25%, 6/1/2021 | | | | 80,000 | | | | 85,800 | |
| 144A, 8.25%, 2/1/2020 | | | | 25,000 | | | | 27,125 | |
| Marfrig Overseas Ltd., 144A, 9.5%, 5/4/2020 | | | | 100,000 | | | | 107,500 | |
| Pilgrim's Pride Corp., 7.875%, 12/15/2018 | | | | 45,000 | | | | 47,646 | |
| Post Holdings, Inc.: | |
| 144A, 6.0%, 12/15/2022 | | | | 30,000 | | | | 30,600 | |
| 144A, 6.75%, 12/1/2021 | | | | 60,000 | | | | 63,750 | |
| Reynolds Group Issuer, Inc.: | |
| 5.75%, 10/15/2020 | | | | 235,000 | | | | 247,925 | |
| 6.875%, 2/15/2021 | | | | 100,000 | | | | 107,912 | |
| Roundy's Supermarkets, Inc., 144A, 10.25%, 12/15/2020 | | | 30,000 | | | | 31,688 | |
| Smithfield Foods, Inc., 6.625%, 8/15/2022 | | | | 30,000 | | | | 32,850 | |
| | | | | 1,894,744 | |
| Energy 9.3% | |
| Access Midstream Partners LP, 6.125%, 7/15/2022 | | | 55,000 | | | | 60,775 | |
| Afren PLC, 144A, 10.25%, 4/8/2019 | | | 140,000 | | | | 158,725 | |
| Antero Resources Finance Corp., 5.375%, 11/1/2021 | | | | 15,000 | | | | 15,563 | |
| Baytex Energy Corp.: | |
| 144A, 5.125%, 6/1/2021 | | | | 15,000 | | | | 15,094 | |
| 144A, 5.625%, 6/1/2024 | | | | 15,000 | | | | 15,056 | |
| Berry Petroleum Co., LLC: | |
| 6.375%, 9/15/2022 | | | | 30,000 | | | | 31,950 | |
| 6.75%, 11/1/2020 | | | | 140,000 | | | | 147,350 | |
| BreitBurn Energy Partners LP: | |
| 7.875%, 4/15/2022 | | | | 95,000 | | | | 102,837 | |
| 8.625%, 10/15/2020 | | | | 35,000 | | | | 38,500 | |
| Chaparral Energy, Inc., 7.625%, 11/15/2022 | | | | 20,000 | | | | 21,600 | |
| Chesapeake Energy Corp., 3.479%**, 4/15/2019 | | | | 40,000 | | | | 40,450 | |
| Chesapeake Oilfield Operating LLC, 6.625%, 11/15/2019 | | | 25,000 | | | | 26,875 | |
| | | Principal Amount ($)(a) | | | Value ($) | |
| | | | | | | | | |
| CITGO Petroleum Corp., 144A, 11.5%, 7/1/2017 | | | 105,000 | | | | 111,300 | |
| CONSOL Energy, Inc., 144A, 5.875%, 4/15/2022 | | | | 15,000 | | | | 15,713 | |
| Crestwood Midstream Partners LP: | |
| 144A, 6.125%, 3/1/2022 | | | | 20,000 | | | | 21,050 | |
| 7.75%, 4/1/2019 | | | | 65,000 | | | | 69,713 | |
| Dresser-Rand Group, Inc., 6.5%, 5/1/2021 | | | | 75,000 | | | | 80,250 | |
| Ecopetrol SA, 5.875%, 5/28/2045 | | | 250,000 | | | | 258,570 | |
| EDC Finance Ltd., 144A, 4.875%, 4/17/2020 | | | | 200,000 | | | | 195,500 | |
| El Paso LLC, 7.25%, 6/1/2018 | | | 55,000 | | | | 62,631 | |
| Endeavor Energy Resources LP, 144A, 7.0%, 8/15/2021 | | | 75,000 | | | | 80,063 | |
| EP Energy LLC: | |
| 6.875%, 5/1/2019 | | | | 60,000 | | | | 63,825 | |
| 7.75%, 9/1/2022 | | | | 40,000 | | | | 45,100 | |
| 9.375%, 5/1/2020 | | | | 25,000 | | | | 28,625 | |
| EV Energy Partners LP, 8.0%, 4/15/2019 | | | | 140,000 | | | | 147,000 | |
| EXCO Resources, Inc., 8.5%, 4/15/2022 | | | | 20,000 | | | | 21,600 | |
| Halcon Resources Corp.: | |
| 8.875%, 5/15/2021 | | | | 95,000 | | | | 102,125 | |
| 9.75%, 7/15/2020 | | | | 80,000 | | | | 87,300 | |
| Hilcorp Energy I LP, 144A, 5.0%, 12/1/2024 (c) | | | | 25,000 | | | | 25,000 | |
| Holly Energy Partners LP, 6.5%, 3/1/2020 | | | | 20,000 | | | | 21,550 | |
| Kodiak Oil & Gas Corp., 5.5%, 1/15/2021 (b) | | | | 60,000 | | | | 62,550 | |
| Linn Energy LLC, 6.25%, 11/1/2019 | | | 95,000 | | | | 99,512 | |
| MEG Energy Corp.: | |
| 144A, 6.5%, 3/15/2021 | | | | 40,000 | | | | 42,400 | |
| 144A, 7.0%, 3/31/2024 | | | | 75,000 | | | | 82,688 | |
| Memorial Resource Development Corp., 144A, 5.875%, 7/1/2022 (c) | | | 25,000 | | | | 25,188 | |
| Midstates Petroleum Co., Inc.: | |
| 9.25%, 6/1/2021 | | | | 85,000 | | | | 93,287 | |
| 10.75%, 10/1/2020 | | | | 85,000 | | | | 96,475 | |
| Murphy Oil U.S.A., Inc., 6.0%, 8/15/2023 | | | | 40,000 | | | | 42,100 | |
| Northern Oil & Gas, Inc., 8.0%, 6/1/2020 | | | | 90,000 | | | | 96,075 | |
| Nostrum Oil & Gas Finance BV, 144A, 6.375%, 2/14/2019 | | | 200,000 | | | | 209,000 | |
| Oasis Petroleum, Inc.: | |
| 6.5%, 11/1/2021 | | | | 25,000 | | | | 26,875 | |
| 144A, 6.875%, 3/15/2022 | | | | 60,000 | | | | 65,400 | |
| 6.875%, 1/15/2023 | | | | 25,000 | | | | 27,250 | |
| 7.25%, 2/1/2019 | | | | 40,000 | | | | 42,400 | |
| Offshore Drilling Holding SA, 144A, 8.375%, 9/20/2020 | | | 200,000 | | | | 221,500 | |
| Offshore Group Investment Ltd.: | |
| 7.125%, 4/1/2023 | | | | 60,000 | | | | 60,900 | |
| 7.5%, 11/1/2019 | | | | 20,000 | | | | 21,150 | |
| Pacific Rubiales Energy Corp., 144A, 7.25%, 12/12/2021 | | | 250,000 | | | | 277,500 | |
| Pertamina Persero PT, 144A, 5.625%, 5/20/2043 | | | | 200,000 | | | | 179,500 | |
| Petrobras Global Finance BV, 4.875%, 3/17/2020 | | | | 200,000 | | | | 205,420 | |
| Petroleos de Venezuela SA, 144A, 9.0%, 11/17/2021 | | | 300,000 | | | | 254,970 | |
| | | Principal Amount ($)(a) | | | Value ($) | |
| | | | | | | | | |
| Regency Energy Partners LP, 5.875%, 3/1/2022 | | | | 5,000 | | | | 5,431 | |
| Reliance Holding U.S.A., Inc., 144A, 5.4%, 2/14/2022 | | | 250,000 | | | | 269,940 | |
| Rowan Companies, Inc., 4.75%, 1/15/2024 | | | | 80,000 | | | | 84,642 | |
| Sabine Pass Liquefaction LLC, 5.625%, 2/1/2021 | | | 105,000 | | | | 111,037 | |
| Samson Investment Co., 144A, 10.75%, 2/15/2020 | | | 20,000 | | | | 21,075 | |
| SandRidge Energy, Inc., 7.5%, 3/15/2021 | | | | 105,000 | | | | 113,794 | |
| SESI LLC: | |
| 6.375%, 5/1/2019 | | | | 40,000 | | | | 42,700 | |
| 7.125%, 12/15/2021 | | | | 115,000 | | | | 129,662 | |
| Seventy Seven Energy, Inc., 144A, 6.5%, 7/15/2022 | | | 5,000 | | | | 5,125 | |
| Swift Energy Co., 7.875%, 3/1/2022 | | | 55,000 | | | | 57,475 | |
| Talos Production LLC, 144A, 9.75%, 2/15/2018 | | | | 60,000 | | | | 63,600 | |
| Tesoro Corp., 4.25%, 10/1/2017 | | | 35,000 | | | | 36,575 | |
| Transocean, Inc., 3.8%, 10/15/2022 | | | 145,000 | | | | 143,510 | |
| Whiting Petroleum Corp., 5.0%, 3/15/2019 | | | | 40,000 | | | | 42,100 | |
| WPX Energy, Inc., 5.25%, 1/15/2017 | | | 40,000 | | | | 42,600 | |
| | | | | 5,513,096 | |
| Financials 9.9% | |
| Assured Guaranty U.S. Holdings, Inc., 5.0%, 7/1/2024 | | | | 65,000 | | | | 64,613 | |
| Banco do Brasil SA, 144A, 9.0%, 12/31/2049 | | | | 200,000 | | | | 198,241 | |
| Banco Nacional de Costa Rica, 144A, 4.875%, 11/1/2018 | | | | 200,000 | | | | 205,000 | |
| Banco Santander Brasil SA, 144A, 8.0%, 3/18/2016 | BRL | | | 400,000 | | | | 172,890 | |
| Barclays Bank PLC, 7.625%, 11/21/2022 | | | | 400,000 | | | | 456,600 | |
| BBVA Bancomer SA, 144A, 6.5%, 3/10/2021 | | | | 200,000 | | | | 225,500 | |
| CIT Group, Inc.: | |
| 3.875%, 2/19/2019 | | | | 145,000 | | | | 147,262 | |
| 5.0%, 5/15/2017 | | | | 80,000 | | | | 85,250 | |
| 5.25%, 3/15/2018 | | | | 90,000 | | | | 96,637 | |
| Citigroup, Inc., 4.05%, 7/30/2022 | | | | 70,000 | | | | 71,715 | |
| Country Garden Holdings Co., Ltd., 144A, 11.125%, 2/23/2018 | | | | 200,000 | | | | 218,240 | |
| Development Bank of Kazakhstan JSC, Series 3, 6.5%, 6/3/2020 | | | | 500,000 | | | | 535,600 | |
| E*TRADE Financial Corp., 6.75%, 6/1/2016 | | | | 130,000 | | | | 141,050 | |
| Everest Reinsurance Holdings, Inc., 4.868%, 6/1/2044 | | | | 150,000 | | | | 150,426 | |
| Hellas Telecommunications Finance, 144A, 8.328%**, 7/15/2015 (PIK)* | EUR | | | 109,187 | | | | 0 | |
| Hospitality Properties Trust, (REIT), 5.0%, 8/15/2022 | | | | 110,000 | | | | 116,372 | |
| ING Bank NV, 144A, 2.0%, 9/25/2015 | | | | 200,000 | | | | 203,218 | |
| | | Principal Amount ($)(a) | | | Value ($) | |
| | | | | | | | | |
| International Lease Finance Corp.: | |
| 3.875%, 4/15/2018 | | | | 65,000 | | | | 66,625 | |
| 5.75%, 5/15/2016 | | | | 20,000 | | | | 21,425 | |
| 6.25%, 5/15/2019 | | | | 50,000 | | | | 56,000 | |
| 8.625%, 9/15/2015 | | | | 40,000 | | | | 43,300 | |
| 8.75%, 3/15/2017 | | | | 120,000 | | | | 139,500 | |
| Intesa Sanpaolo SpA: | |
| 3.875%, 1/16/2018 | | | | 240,000 | | | | 252,945 | |
| 144A, 5.017%, 6/26/2024 | | | | 200,000 | | | | 202,363 | |
| Jefferies Group LLC, 5.125%, 1/20/2023 | | | | 60,000 | | | | 64,324 | |
| Macquarie Group Ltd., 144A, 6.0%, 1/14/2020 | | | | 200,000 | | | | 226,568 | |
| Morgan Stanley: | |
| 3.75%, 2/25/2023 | | | | 85,000 | | | | 86,469 | |
| 4.1%, 5/22/2023 | | | | 85,000 | | | | 86,225 | |
| Series H, 5.45%, 7/29/2049 | | | 20,000 | | | | 20,365 | |
| MPT Operating Partnership LP: | |
| (REIT), 6.375%, 2/15/2022 | | | | 45,000 | | | | 48,262 | |
| (REIT), 6.875%, 5/1/2021 | | | | 50,000 | | | | 54,500 | |
| Navient Corp., 5.5%, 1/25/2023 | | | 125,000 | | | | 123,906 | |
| Neuberger Berman Group LLC: | |
| 144A, 5.625%, 3/15/2020 | | | | 25,000 | | | | 26,438 | |
| 144A, 5.875%, 3/15/2022 | | | | 45,000 | | | | 48,038 | |
| Omega Healthcare Investors, Inc., (REIT), 144A, 4.95%, 4/1/2024 | | | 130,000 | | | | 132,777 | |
| Popular, Inc., 7.0%, 7/1/2019 (c) | | | 20,000 | | | | 20,300 | |
| Royal Bank of Scotland Group PLC, 6.1%, 6/10/2023 | | | 100,000 | | | | 109,459 | |
| Schahin II Finance Co. SPV Ltd., 144A, 5.875%, 9/25/2023 (b) | | | 185,733 | | | | 182,947 | |
| Societe Generale SA, 144A, 7.875%, 12/29/2049 (b) | | | | 110,000 | | | | 117,287 | |
| The Goldman Sachs Group, Inc., Series L, 5.7%, 12/29/2049 | | | 35,000 | | | | 36,159 | |
| Trust F/1401, (REIT), 144A, 5.25%, 12/15/2024 | | | | 200,000 | | | | 210,000 | |
| Turkiye Is Bankasi, 144A, 6.0%, 10/24/2022 | | | | 250,000 | | | | 250,125 | |
| Yapi ve Kredi Bankasi AS, 144A, 5.5%, 12/6/2022 | | | 200,000 | | | | 189,860 | |
| | | | | 5,904,781 | |
| Health Care 2.9% | |
| Aviv Healthcare Properties LP: | |
| 6.0%, 10/15/2021 | | | | 15,000 | | | | 15,900 | |
| 7.75%, 2/15/2019 | | | | 85,000 | | | | 90,525 | |
| Biomet, Inc.: | |
| 6.5%, 8/1/2020 | | | | 55,000 | | | | 59,262 | |
| 6.5%, 10/1/2020 | | | | 15,000 | | | | 16,013 | |
| Community Health Systems, Inc.: | |
| 5.125%, 8/15/2018 | | | | 185,000 | | | | 194,019 | |
| 144A, 5.125%, 8/1/2021 | | | | 5,000 | | | | 5,125 | |
| 144A, 6.875%, 2/1/2022 | | | | 30,000 | | | | 31,800 | |
| 7.125%, 7/15/2020 | | | | 60,000 | | | | 64,950 | |
| Crimson Merger Sub, Inc., 144A, 6.625%, 5/15/2022 | | | 70,000 | | | | 69,475 | |
| Endo Finance LLC: | |
| 144A, 5.375%, 1/15/2023 | | | | 35,000 | | | | 34,956 | |
| 144A, 5.75%, 1/15/2022 | | | | 35,000 | | | | 35,700 | |
| Fresenius Medical Care U.S. Finance II, Inc., 144A, 5.625%, 7/31/2019 | | | | 35,000 | | | | 38,150 | |
| Fresenius Medical Care U.S. Finance, Inc., 144A, 6.5%, 9/15/2018 | | | | 20,000 | | | | 22,600 | |
| | | Principal Amount ($)(a) | | | Value ($) | |
| | | | | | | | | |
| HCA, Inc.: | |
| 6.5%, 2/15/2020 | | | | 210,000 | | | | 236,250 | |
| 7.5%, 2/15/2022 | | | | 80,000 | | | | 92,300 | |
| Hologic, Inc., 6.25%, 8/1/2020 | | | 30,000 | | | | 31,650 | |
| LifePoint Hospitals, Inc., 144A, 5.5%, 12/1/2021 | | | 35,000 | | | | 36,663 | |
| Mallinckrodt International Finance SA, 4.75%, 4/15/2023 | | | 75,000 | | | | 72,937 | |
| Par Pharmaceutical Companies, Inc., 7.375%, 10/15/2020 | | | 55,000 | | | | 59,125 | |
| Physio-Control International, Inc., 144A, 9.875%, 1/15/2019 | | | 48,000 | | | | 53,040 | |
| Salix Pharmaceuticals Ltd., 144A, 6.0%, 1/15/2021 | | | 30,000 | | | | 32,175 | |
| Tenet Healthcare Corp., 6.25%, 11/1/2018 | | | | 80,000 | | | | 88,800 | |
| Valeant Pharmaceuticals International, Inc.: | | | | | | | | |
| 144A, 6.375%, 10/15/2020 | | | | 35,000 | | | | 37,187 | |
| 144A, 6.75%, 8/15/2018 | | | | 70,000 | | | | 75,425 | |
| 144A, 7.5%, 7/15/2021 | | | | 140,000 | | | | 155,050 | |
| Warner Chilcott Co., LLC, 7.75%, 9/15/2018 | | | | 75,000 | | | | 78,847 | |
| | | | | 1,727,924 | |
| Industrials 5.5% | |
| ADT Corp.: | |
| 3.5%, 7/15/2022 | | | | 20,000 | | | | 18,200 | |
| 4.125%, 4/15/2019 | | | | 5,000 | | | | 5,031 | |
| 6.25%, 10/15/2021 (b) | | | | 25,000 | | | | 26,500 | |
| Alphabet Holding Co., Inc., 7.75%, 11/1/2017 (PIK) | | | | 65,000 | | | | 67,113 | |
| Armored Autogroup, Inc., 9.25%, 11/1/2018 | | | | 105,000 | | | | 110,512 | |
| Artesyn Escrow, Inc., 144A, 9.75%, 10/15/2020 | | | | 40,000 | | | | 39,300 | |
| BE Aerospace, Inc., 6.875%, 10/1/2020 | | | | 25,000 | | | | 27,156 | |
| Belden, Inc., 144A, 5.5%, 9/1/2022 | | | 55,000 | | | | 56,925 | |
| Bombardier, Inc.: | |
| 144A, 4.75%, 4/15/2019 | | | | 20,000 | | | | 20,350 | |
| 144A, 5.75%, 3/15/2022 | | | | 55,000 | | | | 56,375 | |
| 144A, 6.0%, 10/15/2022 | | | | 35,000 | | | | 35,875 | |
| 144A, 7.75%, 3/15/2020 | | | | 45,000 | | | | 50,857 | |
| Casella Waste Systems, Inc., 7.75%, 2/15/2019 | | | | 90,000 | | | | 94,050 | |
| Cemex Finance LLC, 144A, 9.375%, 10/12/2022 | | | | 200,000 | | | | 235,250 | |
| Covanta Holding Corp., 5.875%, 3/1/2024 | | | | 30,000 | | | | 31,013 | |
| CTP Transportation Products LLC, 144A, 8.25%, 12/15/2019 | | | 35,000 | | | | 37,713 | |
| Darling Ingredients, Inc., 144A, 5.375%, 1/15/2022 | | | 30,000 | | | | 31,125 | |
| DigitalGlobe, Inc., 5.25%, 2/1/2021 | | | 25,000 | | | | 24,750 | |
| Ducommun, Inc., 9.75%, 7/15/2018 | | | 65,000 | | | | 72,333 | |
| Florida East Coast Holdings Corp., 144A, 6.75%, 5/1/2019 | | | 65,000 | | | | 68,656 | |
| FTI Consulting, Inc., 6.75%, 10/1/2020 | | | 145,000 | | | | 154,787 | |
| Garda World Security Corp., 144A, 7.25%, 11/15/2021 | | | 45,000 | | | | 47,306 | |
| Gates Global LLC, 144A, 6.0%, 7/15/2022 | | | | 30,000 | | | | 30,000 | |
| GenCorp, Inc., 7.125%, 3/15/2021 | | | 80,000 | | | | 87,400 | |
| Grupo KUO SAB De CV, 144A, 6.25%, 12/4/2022 | | | 200,000 | | | | 209,500 | |
| | | Principal Amount ($)(a) | | | Value ($) | |
| | | | | | | | | |
| Huntington Ingalls Industries, Inc.: | |
| 6.875%, 3/15/2018 | | | | 50,000 | | | | 52,875 | |
| 7.125%, 3/15/2021 | | | | 10,000 | | | | 10,925 | |
| Interactive Data Corp., 144A, 5.875%, 4/15/2019 | | | | 35,000 | | | | 35,525 | |
| KazAgro National Management Holding JSC, 144A, 4.625%, 5/24/2023 | | | 200,000 | | | | 193,480 | |
| Kenan Advantage Group, Inc., 144A, 8.375%, 12/15/2018 | | | 25,000 | | | | 26,750 | |
| Meritor, Inc.: | |
| 6.25%, 2/15/2024 | | | | 30,000 | | | | 31,425 | |
| 6.75%, 6/15/2021 | | | | 40,000 | | | | 43,024 | |
| Navios Maritime Holdings, Inc.: | |
| 144A, 7.375%, 1/15/2022 | | | | 110,000 | | | | 113,300 | |
| 8.125%, 2/15/2019 | | | | 75,000 | | | | 78,844 | |
| Nortek, Inc., 8.5%, 4/15/2021 | | | | 75,000 | | | | 82,875 | |
| Odebrecht Offshore Drilling Finance Ltd., 144A, 6.75%, 10/1/2022 | | | 192,840 | | | | 206,435 | |
| Oshkosh Corp., 5.375%, 3/1/2022 | | | 22,500 | | | | 23,175 | |
| Ply Gem Industries, Inc., 144A, 6.5%, 2/1/2022 (b) | | | 40,000 | | | | 38,700 | |
| Spirit AeroSystems, Inc.: | |
| 144A, 5.25%, 3/15/2022 | | | | 40,000 | | | | 40,600 | |
| 6.75%, 12/15/2020 | | | | 75,000 | | | | 80,625 | |
| Titan International, Inc., 6.875%, 10/1/2020 | | | | 90,000 | | | | 91,350 | |
| TransDigm, Inc.: | |
| 144A, 6.0%, 7/15/2022 | | | | 40,000 | | | | 41,100 | |
| 144A, 6.5%, 7/15/2024 | | | | 25,000 | | | | 26,031 | |
| 7.5%, 7/15/2021 | | | | 75,000 | | | | 83,063 | |
| Triumph Group, Inc., 144A, 5.25%, 6/1/2022 | | | | 20,000 | | | | 20,050 | |
| United Rentals North America, Inc.: | |
| 5.75%, 7/15/2018 | | | | 60,000 | | | | 63,450 | |
| 7.375%, 5/15/2020 | | | | 95,000 | | | | 104,975 | |
| 7.625%, 4/15/2022 | | | | 95,000 | | | | 106,637 | |
| Watco Companies LLC, 144A, 6.375%, 4/1/2023 | | | 25,000 | | | | 25,500 | |
| | | | | 3,258,791 | |
| Information Technology 2.3% | |
| ACI Worldwide, Inc., 144A, 6.375%, 8/15/2020 | | | | 15,000 | | | | 15,788 | |
| Activision Blizzard, Inc., 144A, 5.625%, 9/15/2021 | | | 130,000 | | | | 140,075 | |
| Audatex North America, Inc., 144A, 6.0%, 6/15/2021 | | | 25,000 | | | | 26,688 | |
| BMC Software Finance, Inc., 144A, 8.125%, 7/15/2021 | | | 65,000 | | | | 66,869 | |
| Boxer Parent Co., Inc., 144A, 9.0%, 10/15/2019 (PIK) | | | | 40,000 | | | | 39,000 | |
| CDW LLC, 8.5%, 4/1/2019 | | | | 45,000 | | | | 48,712 | |
| eAccess Ltd., 144A, 8.25%, 4/1/2018 | | | | 60,000 | | | | 64,800 | |
| EarthLink Holdings Corp., 7.375%, 6/1/2020 | | | | 30,000 | | | | 31,988 | |
| Entegris, Inc., 144A, 6.0%, 4/1/2022 | | | 20,000 | | | | 20,600 | |
| Equinix, Inc.: | |
| 5.375%, 4/1/2023 | | | | 105,000 | | | | 107,362 | |
| 7.0%, 7/15/2021 | | | | 40,000 | | | | 44,200 | |
| First Data Corp.: | |
| 144A, 6.75%, 11/1/2020 | | | | 72,000 | | | | 77,940 | |
| 144A, 7.375%, 6/15/2019 | | | | 45,000 | | | | 48,319 | |
| | | Principal Amount ($)(a) | | | Value ($) | |
| | | | | | | | | |
| 144A, 8.75%, 1/15/2022 (PIK) | | | 60,000 | | | | 66,225 | |
| 144A, 8.875%, 8/15/2020 | | | | 85,000 | | | | 94,031 | |
| Freescale Semiconductor, Inc., 144A, 6.0%, 1/15/2022 | | | 40,000 | | | | 42,600 | |
| Hughes Satellite Systems Corp.: | |
| 6.5%, 6/15/2019 | | | | 70,000 | | | | 78,050 | |
| 7.625%, 6/15/2021 | | | | 40,000 | | | | 45,800 | |
| Jabil Circuit, Inc., 7.75%, 7/15/2016 | | | 30,000 | | | | 33,937 | |
| Micron Technology, Inc., 144A, 5.875%, 2/15/2022 | | | 15,000 | | | | 16,088 | |
| NCR Corp.: | |
| 144A, 5.875%, 12/15/2021 | | | | 10,000 | | | | 10,550 | |
| 144A, 6.375%, 12/15/2023 | | | | 20,000 | | | | 21,700 | |
| NXP BV, 144A, 3.75%, 6/1/2018 | | | 35,000 | | | | 35,087 | |
| Sanmina Corp., 144A, 4.375%, 6/1/2019 | | | | 5,000 | | | | 4,994 | |
| Tencent Holdings Ltd., 144A, 3.375%, 5/2/2019 | | | | 200,000 | | | | 204,474 | |
| | | | | 1,385,877 | |
| Materials 6.7% | |
| ALROSA Finance SA, 144A, 7.75%, 11/3/2020 | | | | 200,000 | | | | 221,260 | |
| Anglo American Capital PLC, 144A, 4.125%, 9/27/2022 | | | 250,000 | | | | 251,881 | |
| Ashland, Inc., 3.875%, 4/15/2018 | | | 20,000 | | | | 20,575 | |
| AuRico Gold, Inc., 144A, 7.75%, 4/1/2020 | | | | 20,000 | | | | 19,800 | |
| Berry Plastics Corp., 5.5%, 5/15/2022 | | | 60,000 | | | | 60,337 | |
| BOE Intermediate Holding Corp., 144A, 9.0%, 11/1/2017 (PIK) | | | 43,858 | | | | 45,996 | |
| Braskem Finance Ltd., 6.45%, 2/3/2024 | | | | 200,000 | | | | 213,750 | |
| Cascades, Inc., 144A, 5.5%, 7/15/2022 | | | | 20,000 | | | | 19,950 | |
| Clearwater Paper Corp., 7.125%, 11/1/2018 | | | | 65,000 | | | | 68,250 | |
| Cliffs Natural Resources, Inc., 3.95%, 1/15/2018 | | | | 115,000 | | | | 116,533 | |
| Crown Americas LLC, 6.25%, 2/1/2021 | | | | 10,000 | | | | 10,700 | |
| Exopack Holding Corp., 144A, 10.0%, 6/1/2018 | | | | 40,000 | | | | 43,000 | |
| First Quantum Minerals Ltd.: | |
| 144A, 6.75%, 2/15/2020 | | | | 70,000 | | | | 72,100 | |
| 144A, 7.0%, 2/15/2021 | | | | 70,000 | | | | 72,012 | |
| FMG Resources (August 2006) Pty Ltd.: | | | | | | | | |
| 144A, 6.0%, 4/1/2017 | | | | 55,000 | | | | 56,787 | |
| 144A, 8.25%, 11/1/2019 | | | | 45,000 | | | | 48,994 | |
| Fresnillo PLC, 144A, 5.5%, 11/13/2023 | | | | 200,000 | | | | 209,000 | |
| Glencore Funding LLC, 144A, 4.125%, 5/30/2023 | | | | 110,000 | | | | 110,478 | |
| Greif, Inc., 7.75%, 8/1/2019 | | | | 195,000 | | | | 224,250 | |
| GTL Trade Finance, Inc., 144A, 5.893%, 4/29/2024 (b) | | | 200,000 | | | | 209,800 | |
| Hexion U.S. Finance Corp.: | |
| 6.625%, 4/15/2020 | | | | 70,000 | | | | 74,200 | |
| 8.875%, 2/1/2018 | | | | 60,000 | | | | 62,400 | |
| Huntsman International LLC: | |
| 8.625%, 3/15/2020 | | | | 60,000 | | | | 64,950 | |
| 8.625%, 3/15/2021 | | | | 25,000 | | | | 27,625 | |
| IAMGOLD Corp., 144A, 6.75%, 10/1/2020 | | | | 40,000 | | | | 37,000 | |
| | | Principal Amount ($)(a) | | | Value ($) | |
| | | | | | | | | |
| Kaiser Aluminum Corp., 8.25%, 6/1/2020 | | | | 40,000 | | | | 45,000 | |
| KGHM International Ltd., 144A, 7.75%, 6/15/2019 | | | 115,000 | | | | 123,481 | |
| Metalloinvest Finance Ltd., 144A, 5.625%, 4/17/2020 | | | 200,000 | | | | 194,000 | |
| Novelis, Inc., 8.75%, 12/15/2020 | | | 215,000 | | | | 238,650 | |
| Owens-Brockway Glass Container, Inc., 7.375%, 5/15/2016 | | | 30,000 | | | | 33,000 | |
| Packaging Dynamics Corp., 144A, 8.75%, 2/1/2016 | | | 90,000 | | | | 92,430 | |
| Plastipak Holdings, Inc., 144A, 6.5%, 10/1/2021 | | | 40,000 | | | | 42,200 | |
| Polymer Group, Inc., 7.75%, 2/1/2019 | | | | 49,000 | | | | 52,063 | |
| Rain CII Carbon LLC, 144A, 8.0%, 12/1/2018 | | | | 45,000 | | | | 47,250 | |
| Samarco Mineracao SA, 144A, 5.75%, 10/24/2023 | | | 200,000 | | | | 209,940 | |
| Sealed Air Corp.: | |
| 144A, 8.125%, 9/15/2019 | | | | 30,000 | | | | 33,038 | |
| 144A, 8.375%, 9/15/2021 | | | | 30,000 | | | | 34,350 | |
| Signode Industrial Group Lux SA, 144A, 6.375%, 5/1/2022 | | | 30,000 | | | | 30,375 | |
| Tronox Finance LLC, 6.375%, 8/15/2020 | | | | 30,000 | | | | 30,975 | |
| Turkiye Sise ve Cam Fabrikalari AS, 144A, 4.25%, 5/9/2020 | | | 300,000 | | | | 289,500 | |
| Yamana Gold, Inc., 144A, 4.95%, 7/15/2024 | | | | 120,000 | | | | 120,789 | |
| | | | | 3,978,669 | |
| Telecommunication Services 7.9% | |
| B Communications Ltd., 144A, 7.375%, 2/15/2021 | | | 35,000 | | | | 37,625 | |
| CC Holdings GS V LLC, 3.849%, 4/15/2023 | | | | 70,000 | | | | 70,272 | |
| CenturyLink, Inc.: | |
| Series V, 5.625%, 4/1/2020 | | | 15,000 | | | | 15,825 | |
| Series W, 6.75%, 12/1/2023 | | | 35,000 | | | | 38,238 | |
| Cincinnati Bell, Inc.: | |
| 8.375%, 10/15/2020 | | | | 235,000 | | | | 257,619 | |
| 8.75%, 3/15/2018 (b) | | | | 210,000 | | | | 220,237 | |
| Colombia Telecomunicaciones SA ESP, 144A, 5.375%, 9/27/2022 | | | 200,000 | | | | 199,700 | |
| CommScope, Inc., 144A, 5.0%, 6/15/2021 | | | | 35,000 | | | | 35,700 | |
| CPI International, Inc., 8.75%, 2/15/2018 | | | | 45,000 | | | | 47,138 | |
| Digicel Group Ltd.: | |
| 144A, 7.125%, 4/1/2022 | | | | 35,000 | | | | 36,488 | |
| 144A, 8.25%, 9/30/2020 | | | | 105,000 | | | | 114,450 | |
| Digicel Ltd., 144A, 8.25%, 9/1/2017 | | | 300,000 | | | | 308,640 | |
| Frontier Communications Corp.: | |
| 7.125%, 1/15/2023 | | | | 200,000 | | | | 212,000 | |
| 8.25%, 4/15/2017 | | | | 62,000 | | | | 71,997 | |
| 8.5%, 4/15/2020 | | | | 20,000 | | | | 23,600 | |
| Intelsat Jackson Holdings SA: | |
| 5.5%, 8/1/2023 | | | | 55,000 | | | | 54,725 | |
| 7.25%, 10/15/2020 | | | | 195,000 | | | | 210,112 | |
| 7.5%, 4/1/2021 | | | | 215,000 | | | | 235,425 | |
| 8.5%, 11/1/2019 | | | | 100,000 | | | | 106,250 | |
| Intelsat Luxembourg SA: | |
| 7.75%, 6/1/2021 | | | | 95,000 | | | | 100,581 | |
| 8.125%, 6/1/2023 | | | | 10,000 | | | | 10,813 | |
| | | Principal Amount ($)(a) | | | Value ($) | |
| | | | | | | | | |
| Level 3 Communications, Inc., 8.875%, 6/1/2019 | | | 10,000 | | | | 10,938 | |
| Level 3 Financing, Inc.: | |
| 144A, 6.125%, 1/15/2021 | | | | 20,000 | | | | 21,425 | |
| 7.0%, 6/1/2020 | | | | 75,000 | | | | 81,937 | |
| 8.125%, 7/1/2019 | | | | 75,000 | | | | 81,844 | |
| 8.625%, 7/15/2020 | | | | 50,000 | | | | 56,000 | |
| MetroPCS Wireless, Inc.: | |
| 6.625%, 11/15/2020 | | | | 65,000 | | | | 69,387 | |
| 7.875%, 9/1/2018 | | | | 75,000 | | | | 78,772 | |
| Millicom International Cellular SA, 144A, 4.75%, 5/22/2020 | | | 200,000 | | | | 200,000 | |
| SBA Communications Corp., 5.625%, 10/1/2019 | | | | 30,000 | | | | 31,763 | |
| SBA Telecommunications, Inc., 8.25%, 8/15/2019 | | | | 16,000 | | | | 16,768 | |
| Sprint Communications, Inc.: | |
| 144A, 7.0%, 3/1/2020 | | | | 40,000 | | | | 46,000 | |
| 144A, 9.0%, 11/15/2018 | | | | 175,000 | | | | 212,187 | |
| 9.125%, 3/1/2017 | | | | 50,000 | | | | 58,563 | |
| Sprint Corp., 144A, 7.125%, 6/15/2024 | | | | 110,000 | | | | 116,600 | |
| T-Mobile U.S.A., Inc.: | |
| 6.125%, 1/15/2022 | | | | 15,000 | | | | 15,919 | |
| 6.5%, 1/15/2024 | | | | 15,000 | | | | 16,031 | |
| 6.625%, 4/1/2023 (b) | | | | 35,000 | | | | 37,975 | |
| tw telecom holdings, Inc.: | |
| 5.375%, 10/1/2022 | | | | 40,000 | | | | 43,750 | |
| 6.375%, 9/1/2023 | | | | 35,000 | | | | 39,813 | |
| UPCB Finance V Ltd., 144A, 7.25%, 11/15/2021 | | | | 30,000 | | | | 33,000 | |
| UPCB Finance VI Ltd., 144A, 6.875%, 1/15/2022 | | | | 10,000 | | | | 10,925 | |
| Verizon Communications, Inc., 6.55%, 9/15/2043 | | | 200,000 | | | | 251,688 | |
| VimpelCom Holdings BV, 144A, 7.504%, 3/1/2022 | | | 200,000 | | | | 215,750 | |
| Wind Acquisition Finance SA, 144A, 6.5%, 4/30/2020 | | | 30,000 | | | | 32,513 | |
| Windstream Corp.: | |
| 6.375%, 8/1/2023 | | | | 40,000 | | | | 40,550 | |
| 7.5%, 4/1/2023 | | | | 75,000 | | | | 81,187 | |
| 7.75%, 10/15/2020 | | | | 20,000 | | | | 21,675 | |
| 7.75%, 10/1/2021 | | | | 55,000 | | | | 60,087 | |
| 7.875%, 11/1/2017 | | | | 205,000 | | | | 236,006 | |
| 8.125%, 9/1/2018 | | | | 70,000 | | | | 73,500 | |
| | | | | 4,699,988 | |
| Utilities 1.6% | |
| AES Corp.: | |
| 3.229%**, 6/1/2019 | | | | 20,000 | | | | 20,150 | |
| 8.0%, 10/15/2017 | | | | 2,000 | | | | 2,330 | |
| 8.0%, 6/1/2020 | | | | 175,000 | | | | 210,437 | |
| Calpine Corp.: | |
| 144A, 7.5%, 2/15/2021 | | | | 64,000 | | | | 69,440 | |
| 144A, 7.875%, 7/31/2020 | | | | 70,000 | | | | 75,950 | |
| Electricite de France SA, 144A, 5.25%, 1/29/2049 | | | 100,000 | | | | 102,013 | |
| Energy Future Holdings Corp., Series Q, 6.5%, 11/15/2024* | | | 100,000 | | | | 75,500 | |
| FirstEnergy Transmission LLC, 144A, 4.35%, 1/15/2025 | | | 100,000 | | | | 101,032 | |
| IPALCO Enterprises, Inc., 5.0%, 5/1/2018 | | | | 145,000 | | | | 154,787 | |
| NGL Energy Partners LP, 144A, 5.125%, 7/15/2019 (c) | | | 30,000 | | | | 30,075 | |
| | | Principal Amount ($)(a) | | | Value ($) | |
| | | | | | | | | |
| NRG Energy, Inc.: | |
| 144A, 6.25%, 5/1/2024 | | | | 100,000 | | | | 104,500 | |
| 7.875%, 5/15/2021 | | | | 30,000 | | | | 33,263 | |
| | | | | 979,477 | |
Total Corporate Bonds (Cost $31,913,830) | | | | 33,419,218 | |
| | |
| Asset-Backed 1.6% | |
| Home Equity Loans 0.4% | |
| CIT Group Home Equity Loan Trust, "AF6", Series 2002-1, 6.2%, 2/25/2030 | | | 52,609 | | | | 52,467 | |
| Citifinancial Mortgage Securities, Inc., "AFS", Series 2003-4, 5.826%**, 10/25/2033 | | | 190,000 | | | | 198,205 | |
| | | | | 250,672 | |
| Miscellaneous 1.2% | |
| ARES CLO Ltd., "D", Series 2012-3A, 144A, 4.876%**, 1/17/2024 | | | 250,000 | | | | 250,544 | |
| Domino's Pizza Master Issuer LLC, "A2", Series 2012-1A, 144A, 5.216%, 1/25/2042 | | | 144,938 | | | | 155,753 | |
| Hilton Grand Vacations Trust, "B", Series 2014-AA, 144A, 2.07%, 11/25/2026 | | | 300,000 | | | | 299,983 | |
| | | | | 706,280 | |
Total Asset-Backed (Cost $923,823) | | | | 956,952 | |
| | |
| Commercial Mortgage-Backed Securities 3.3% | |
| Commercial Mortgage Trust, "AM", Series 2007-GG11, 5.867%, 12/10/2049 | | | | 290,000 | | | | 320,482 | |
| Del Coronado Trust, "M", Series 2013-HDMZ, 144A, 5.152%**, 3/15/2018 | | | | 80,000 | | | | 80,504 | |
| JPMorgan Chase Commercial Mortgage Securities Corp., "C", Series 2012-HSBC, 144A, 4.021%, 7/5/2032 | | | 150,000 | | | | 156,087 | |
| Prudential Commercial Mortgage Trust, "F", Series 2003-PWR1, 144A, 5.233%**, 2/11/2036 | | | 500,000 | | | | 500,782 | |
| Wachovia Bank Commercial Mortgage Trust, "A4", Series 2005-C22, 5.455%**, 12/15/2044 | | | 140,000 | | | | 146,814 | |
| WFRBS Commercial Mortgage Trust, "A5", Series 2013-C14, 3.337%, 6/15/2046 | | | 750,000 | | | | 757,990 | |
Total Commercial Mortgage-Backed Securities (Cost $1,903,454) | | | | 1,962,659 | |
| | |
| Collateralized Mortgage Obligations 3.2% | |
| Banc of America Mortgage Securities, "2A2", Series 2004-A, 2.680%**, 2/25/2034 | | | 100,950 | | | | 101,187 | |
| Bear Stearns Adjustable Rate Mortgage Trust, "2A1", Series 2005-11, 2.999%**, 12/25/2035 | | | 126,765 | | | | 127,680 | |
| Countrywide Home Loans, "2A5", Series 2004-13, 5.75%, 8/25/2034 | | | 90,126 | | | | 93,197 | |
| | | Principal Amount ($)(a) | | | Value ($) | |
| | | | | | | | | |
| Federal Home Loan Mortgage Corp.: | |
| "AI", Series 4016, Interest Only, 3.0%, 9/15/2025 | | | | 1,204,739 | | | | 115,723 | |
| "ZG", Series 4213, 3.5%, 6/15/2043 | | | | 108,429 | | | | 108,521 | |
| "JI", Series 3558, Interest Only, 4.5%, 12/15/2023 | | | 44,781 | | | | 1,657 | |
| "PI", Series 3843, Interest Only, 4.5%, 5/15/2038 | | | 431,567 | | | | 54,995 | |
| "HI", Series 2934, Interest Only, 5.0%, 2/15/2020 | | | 118,217 | | | | 11,844 | |
| "WI", Series 3010, Interest Only, 5.0%, 7/15/2020 | | | 186,375 | | | | 17,659 | |
| "JS", Series 3572, Interest Only, 6.648%***, 9/15/2039 | | | 700,892 | | | | 112,143 | |
| Federal National Mortgage Association: | |
| "BI", Series 2010-13, Interest Only, 5.0%, 12/25/2038 | | | 79,076 | | | | 6,267 | |
| "PI", Series 2006-20, Interest Only, 6.528%***, 11/25/2030 | | | 419,504 | | | | 72,558 | |
| "SI", Series 2007-23, Interest Only, 6.618%***, 3/25/2037 | | | 277,830 | | | | 39,284 | |
| Government National Mortgage Association: | | | | | | | | |
| "ZJ", Series 2013-106, 3.5%, 7/20/2043 | | | | 353,928 | | | | 344,646 | |
| "MI", Series 2009-76, Interest Only, 5.0%, 3/20/2035 | | | 18,207 | | | | 22 | |
| "IV", Series 2009-69, Interest Only, 5.5%, 8/20/2039 | | | 380,982 | | | | 67,033 | |
| "IN", Series 2009-69, Interest Only, 5.5%, 8/20/2039 | | | 383,720 | | | | 64,599 | |
| "IJ", Series 2009-75, Interest Only, 6.0%, 8/16/2039 | | | 353,566 | | | | 64,975 | |
| "AI", Series 2007-38, Interest Only, 6.308%***, 6/16/2037 | | | 98,515 | | | | 15,023 | |
| JPMorgan Mortgage Trust, "2A1", Series 2006-A2, 2.657%**, 4/25/2036 | | | 292,866 | | | | 267,337 | |
| Merrill Lynch Mortgage Investors Trust, "2A", Series 2003-A6, 2.654%**, 10/25/2033 | | | 80,061 | | | | 80,815 | |
| Wells Fargo Mortgage-Backed Securities Trust, "2A3", Series 2004-EE, 2.612%**, 12/25/2034 | | | 114,076 | | | | 114,722 | |
Total Collateralized Mortgage Obligations (Cost $1,729,312) | | | | 1,881,887 | |
| | |
| Government & Agency Obligations 14.6% | |
| Other Government Related (d) 3.0% | |
| Bank of Moscow, 144A, 6.699%, 3/11/2015 | | | | 250,000 | | | | 257,028 | |
| MMC Norilsk Nickel OJSC, 144A, 5.55%, 10/28/2020 | | | | 200,000 | | | | 201,000 | |
| Queensland Treasury Corp., Series 33, 6.5%, 3/14/2033 | AUD | | | 828,000 | | | | 978,394 | |
| Sberbank of Russia, 144A, 5.25%, 5/23/2023 | | | | 200,000 | | | | 187,500 | |
| TMK OAO, 144A, 6.75%, 4/3/2020 | | | | 200,000 | | | | 195,000 | |
| | | | | 1,818,922 | |
| Sovereign Bonds 8.1% | |
| Federative Republic of Brazil: | |
| 4.25%, 1/7/2025 | | | | 200,000 | | | | 202,700 | |
| 12.5%, 1/5/2016 | BRL | | | 250,000 | | | | 118,522 | |
| | | Principal Amount ($)(a) | | | Value ($) | |
| | | | | | | | | |
| Government of France, 0.7%, 7/25/2030 | EUR | | | 566,085 | | | | 786,148 | |
| Kingdom of Morocco, 144A, 4.25%, 12/11/2022 | | | | 250,000 | | | | 250,313 | |
| Province of New Brunswick Canada, 3.55%, 6/3/2043 | CAD | | | 900,000 | | | | 806,926 | |
| Republic of Argentina-Inflation Linked Bond, 5.83%, 12/31/2033 | ARS | | | 375 | | | | 122 | |
| Republic of Belarus, REG S, 8.75%, 8/3/2015 | | | | 145,000 | | | | 149,176 | |
| Republic of Croatia, 144A, 6.75%, 11/5/2019 | | | | 400,000 | | | | 448,500 | |
| Republic of El Salvador, 144A, 7.65%, 6/15/2035 | | | | 200,000 | | | | 216,300 | |
| Republic of Ghana, 144A, 8.5%, 10/4/2017 | | | | 100,000 | | | | 105,000 | |
| Republic of Hungary, 4.125%, 2/19/2018 | | | | 50,000 | | | | 52,125 | |
| Republic of Romania, 4.875%, 11/7/2019 | EUR | | | 100,000 | | | | 155,203 | |
| Republic of Singapore, 3.375%, 9/1/2033 | SGD | | | 1,243,000 | | | | 1,052,347 | |
| Republic of Slovenia, 144A, 4.75%, 5/10/2018 | | | | 200,000 | | | | 215,500 | |
| Republic of South Africa, Series R204, 8.0%, 12/21/2018 | ZAR | | | 550,000 | | | | 52,553 | |
| Republic of Sri Lanka, 144A, 5.125%, 4/11/2019 | | | | 200,000 | | | | 203,250 | |
| | | | | 4,814,685 | |
| U.S. Treasury Obligations 3.5% | |
| U.S. Treasury Bills: | |
| 0.03%****, 12/11/2014 (e) | | | 57,000 | | | | 56,987 | |
| 0.055%****, 8/14/2014 (e) | | | 15,000 | | | | 15,000 | |
| 0.055%****, 12/11/2014 (e) | | | 150,000 | | | | 149,966 | |
| 0.065%****, 8/14/2014 | | | | 239,000 | | | | 238,993 | |
| U.S. Treasury Notes: | |
| 1.0%, 8/31/2016 (f) | | | | 500,000 | | | | 505,156 | |
| 1.0%, 9/30/2016 | | | | 500,000 | | | | 504,844 | |
| 1.5%, 5/31/2019 | | | | 232,600 | | | | 231,437 | |
| 2.5%, 5/15/2024 | | | | 360,000 | | | | 359,494 | |
| | | | | 2,061,877 | |
Total Government & Agency Obligations (Cost $8,440,245) | | | | 8,695,484 | |
| | |
| Loan Participations and Assignments 5.0% | |
| Senior Loans** | |
| American Rock Salt Holdings LLC: | |
| First Lien Term Loan, 4.75%, 5/20/2021 | | | | 84,635 | | | | 84,725 | |
| Term Delay Draw, 4.75%, 5/20/2021 | | | 20,365 | | | | 20,387 | |
| Avis Budget Car Rental LLC, Term Loan B, 3.0%, 3/15/2019 | | | 59,548 | | | | 59,567 | |
| Buffalo Gulf Coast Terminals LLC, Term Loan, 5.25%, 10/31/2017 | | | 73,875 | | | | 74,337 | |
| Burger King Corp., Term Loan B, 3.75%, 9/28/2019 | | | 68,775 | | | | 69,162 | |
| Calpine Corp., Term Loan B1, 4.0%, 4/1/2018 | | | | 192,513 | | | | 193,455 | |
| Crown Castle International Corp., Term Loan B, 2.4%, 1/31/2019 | | | 49,005 | | | | 49,112 | |
| CSC Holdings, Inc., Term Loan B, 2.65%, 4/17/2020 | | | 128,256 | | | | 127,075 | |
| | | Principal Amount ($)(a) | | | Value ($) | |
| | | | | | | | | |
| Cumulus Media Holdings, Inc., Term Loan, 4.25%, 12/23/2020 | | | 29,539 | | | | 29,687 | |
| DaVita HealthCare Partners, Inc., Term Loan B, 3.75%, 6/24/2021 | | | 70,000 | | | | 70,402 | |
| Goodyear Tire & Rubber Co., Second Lien Term Loan, 4.75%, 4/30/2019 | | | | 220,000 | | | | 221,616 | |
| HJ Heinz Co., Term Loan B2, 3.5%, 6/5/2020 | | | | 247,500 | | | | 249,637 | |
| MacDermid, Inc., First Lien Term Loan, 4.0%, 6/7/2020 | | | 54,450 | | | | 54,552 | |
| MEG Energy Corp., Term Loan, 3.75%, 3/31/2020 | | | 256,710 | | | | 257,433 | |
| NRG Energy, Inc., Term Loan B, 2.75%, 7/2/2018 | | | 117,827 | | | | 117,753 | |
| Par Pharmaceutical Companies, Inc., Term Loan B2, 4.0%, 9/30/2019 | | | 117,324 | | | | 117,324 | |
| Pilot Travel Centers LLC: | |
| Term Loan B, 3.75%, 3/30/2018 | | | 89,374 | | | | 89,652 | |
| Term Loan B2, 4.25%, 8/7/2019 | | | 334,050 | | | | 335,511 | |
| Quebecor Media, Inc., Term Loan B1, 3.25%, 8/17/2020 | | | 89,325 | | | | 88,339 | |
| Samson Investment Co., Second Lien Term Loan, 5.0%, 9/25/2018 | | | 175,000 | | | | 175,066 | |
| Tallgrass Operations LLC: | |
| Term Loan B, 4.25%, 11/13/2018 | | | 161,008 | | | | 162,450 | |
| Term Delay Draw, 4.75%, 11/13/2017 | | | | 50,000 | | | | 50,344 | |
| Travelport LLC, Second Lien Term Loan, 9.5%, 1/29/2016 | | | 5,040 | | | | 5,204 | |
| Valeant Pharmaceuticals International, Inc.: | | | | | | | | |
| Term Loan B, 3.75%, 2/13/2019 | | | | 157,990 | | | | 158,237 | |
| Term Loan B, 3.75%, 12/11/2019 | | | 133,304 | | | | 133,373 | |
Total Loan Participations and Assignments (Cost $2,989,135) | | | | 2,994,400 | |
| | |
| Municipal Bonds and Notes 1.6% | |
| Chicago, IL, Airport Revenue, O'Hare International Airport, Series B, 6.0%, 1/1/2041 | | | 145,000 | | | | 166,237 | |
| Massachusetts, State School Building Authority, Sales Tax Revenue, Qualified School Construction Bond, Series A, 4.885%, 7/15/2028 | | | 300,000 | | | | 318,540 | |
| Orlando & Orange County, FL, Expressway Authority Revenue, Series C, 5.0%, 7/1/2040 | | | 145,000 | | | | 154,782 | |
| Port Authority of New York & New Jersey, 4.926%, 10/1/2051 | | | 260,000 | | | | 289,190 | |
Total Municipal Bonds and Notes (Cost $850,516) | | | | 928,749 | |
| | |
| Convertible Bond 0.4% | |
| Materials | |
| GEO Specialty Chemicals, Inc., 144A, 7.5%, 3/31/2015 (Cost $119,305) | | | 120,175 | | | | 241,972 | |
| | | Principal Amount ($)(a) | | | Value ($) | |
| | | | | | | | | |
| Preferred Security 0.1% | |
| Materials | |
| Hercules, Inc., 6.5%, 6/30/2029 (Cost $59,811) | | | 95,000 | | | | 85,975 | |
| | | Shares | | | Value ($) | |
| | | | |
| Common Stocks 0.0% | |
| Consumer Discretionary 0.0% | |
| Dawn Holdings, Inc.* (g) | | | 1 | | | | 4,366 | |
| Trump Entertainment Resorts, Inc.* | | | 6 | | | | 0 | |
| | | | | | | | 4,366 | |
| Industrials 0.0% | |
| Congoleum Corp.* | | | 2,500 | | | | 0 | |
| Materials 0.0% | |
| GEO Specialty Chemicals, Inc.* | | | 2,058 | | | | 1,590 | |
Total Common Stocks (Cost $25,217) | | | | 5,956 | |
| | |
| Preferred Stock 0.2% | |
| Financials | |
| Ally Financial, Inc., Series G, 144A, 7.0% (Cost $85,127) | | | 89 | | | | 89,670 | |
| | |
| Warrants 0.0% | |
| Materials | |
| GEO Specialty Chemicals, Inc., Expiration Date 3/31/2015* | | | 11,138 | | | | 8,526 | |
| Hercules Trust II, Expiration Date 3/31/2029* | | | 85 | | | | 547 | |
Total Warrants (Cost $17,432) | | | | 9,073 | |
| | |
| Exchange-Traded Fund 4.9% | |
| SPDR Barclays Convertible Securities (Cost $2,777,628) | | | 58,300 | | | | 2,944,150 | |
| | | Contract Amount | | | Value ($) | |
| | | | |
| Call Options Purchased 0.2% | |
| Options on Interest Rate Swap Contracts | |
Pay Fixed Rate — 3.72% – Receive Floating — LIBOR, Swap Expiration Date 4/22/2026, Option Expiration Date 4/20/20161 | | | 1,300,000 | | | | 28,066 | |
Pay Fixed Rate — 4.19% – Receive Floating — LIBOR, Swap Expiration Date 2/3/2027, Option Expiration Date 2/1/20172 | | | 1,500,000 | | | | 34,213 | |
Pay Fixed Rate — 4.32% – Receive Floating — LIBOR, Swap Expiration Date 2/3/2027, Option Expiration Date 2/1/20173 | | | 1,400,000 | | | | 28,088 | |
Total Call Options Purchased (Cost $191,320) | | | | 90,367 | |
| | | Contract Amount | | | Value ($) | |
| | | | | | | | | |
| Put Options Purchased 0.0% | |
| Options on Interest Rate Swap Contracts | |
Receive Fixed Rate — 2.19% – Pay Floating — LIBOR, Swap Expiration Date 2/3/2027, Option Expiration Date 2/1/20172 | | | 1,500,000 | | | | 11,638 | |
Receive Fixed Rate — 2.32% – Pay Floating — LIBOR, Swap Expiration Date 2/3/2027, Option Expiration Date 2/1/20173 | | | 1,400,000 | | | | 13,450 | |
Total Put Options Purchased (Cost $98,573) | | | | 25,088 | |
| | | Shares | | | Value ($) | |
| | | | |
| Securities Lending Collateral 2.1% | |
| Daily Assets Fund Institutional, 0.08% (h) (i) (Cost $1,252,899) | | | 1,252,899 | | | | 1,252,899 | |
| | |
| Cash Equivalents 9.9% | |
| Central Cash Management Fund, 0.06% (h) (Cost $5,887,663) | | | 5,887,663 | | | | 5,887,663 | |
| | | % of Net Assets | | | Value ($) | |
| | | | |
Total Investment Portfolio (Cost $59,265,290)† | | | 103.2 | | | | 61,472,162 | |
| Other Assets and Liabilities, Net (b) | | | (3.2 | ) | | | (1,921,405 | ) |
| Net Assets | | | 100.0 | | | | 59,550,757 | |
The following table represents bonds that are in default:
| Security | | Coupon | | Maturity Date | Principal Amount | | | Cost ($) | | | Value ($) | |
| Energy Future Holdings Corp.* | | | 6.5 | % | 11/15/2024 | USD | | | 100,000 | | | | 58,139 | | | | 75,500 | |
| Hellas Telecommunications Finance* | | | 8.328 | % | 7/15/2015 | EUR | | | 109,187 | | | | 32,169 | | | | 0 | |
| | | | | | | | | | | | | | 90,308 | | | | 75,500 | |
* Non-income producing security.
** Floating rate securities' yields vary with a designated market index or market rate, such as the coupon-equivalent of the U.S. Treasury Bill rate. These securities are shown at their current rate as of June 30, 2014.
*** These securities are shown at their current rate as of June 30, 2014.
****Annualized yield at time of purchase; not a coupon rate.
† The cost for federal income tax purposes was $59,272,071. At June 30, 2014, net unrealized appreciation for all securities based on tax cost was $2,200,091. This consisted of aggregate gross unrealized appreciation for all securities in which there was an excess of value over tax cost of $2,615,207 and aggregate gross unrealized depreciation for all securities in which there was an excess of tax cost over value of $415,116.
(a) Principal amount stated in U.S. dollars unless otherwise noted.
(b) All or a portion of these securities were on loan. In addition, "Other Assets and Liabilities, Net" may include pending sales that are also on loan. The value of securities loaned at June 30, 2014 amounted to $1,197,256, which is 2.0% of net assets.
(c) When-issued security.
(d) Government-backed debt issued by financial companies or government-sponsored enterprises.
(e) At June 30, 2014, this security has been pledged, in whole or in part, to cover initial margin requirements for open futures contracts.
(f) At June 30, 2014, this security has been pledged, in whole or in part, to cover initial margin requirements for open centrally cleared swaps.
(g) The Fund may purchase securities that are subject to legal or contractual restrictions on resale ("restricted securities"). Restricted securities are securities which have not been registered with the Securities and Exchange Commission under the Securities Act of 1933. The Fund may be unable to sell a restricted security and it may be more difficult to determine a market value for a restricted security. Moreover, if adverse market conditions were to develop during the period between the Fund's decision to sell a restricted security and the point at which the Fund is permitted or able to sell such security, the Fund might obtain a price less favorable than the price that prevailed when it decided to sell. This investment practice, therefore, could have the effect of increasing the level of illiquidity of the Fund. The future value of these securities is uncertain and there may be changes in the estimated value of these securities.
| Schedule of Restricted Securities | Acquisition Date | | Cost ($) | | | Value ($) | | | Value as % of Net Assets | |
| Dawn Holdings, Inc.* | August 2013 | | | 5,273 | | | | 4,366 | | | | .01 | |
(h) Affiliated fund managed by Deutsche Investment Management Americas Inc. The rate shown is the annualized seven-day yield at period end.
(i) Represents collateral held in connection with securities lending. Income earned by the Fund is net of borrower rebates.
144A: Security exempt from registration under Rule 144A of the Securities Act of 1933. These securities may be resold in transactions exempt from registration, normally to qualified institutional buyers.
CLO: Collateralized Loan Obligation
Interest Only: Interest Only (IO) bonds represent the "interest only" portion of payments on a pool of underlying mortgages or mortgage-backed securities. IO securities are subject to prepayment risk of the pool of underlying mortgages.
LIBOR: London Interbank Offered Rate
PIK: Denotes that all or a portion of the income is paid in-kind in the form of additional principal.
REG S: Securities sold under Regulation S may not be offered, sold or delivered within the United States or to, or for the account or benefit of, U.S. persons, except pursuant to an exemption from, or in a transaction not subject to, the registration requirements of the Securities Act of 1933.
REIT: Real Estate Investment Trust
SPDR: Standard & Poor's Depositary Receipt
At June 30, 2014, open futures contracts purchased were as follows:
| Futures | Currency | Expiration Date | | Contracts | | | Notional Value ($) | | | Unrealized Appreciation ($) | |
| 10 Year U.S. Treasury Note | USD | 9/19/2014 | | | 22 | | | | 2,753,781 | | | | 25,202 | |
| 5 Year U.S. Treasury Note | USD | 9/30/2014 | | | 48 | | | | 5,734,125 | | | | 33,415 | |
| Total unrealized appreciation | | | | 58,617 | |
At June 30, 2014, open futures contracts sold were as follows:
| Futures | Currency | Expiration Date | | Contracts | | | Notional Value ($) | | | Unrealized Depreciation ($) | |
| 10 Year Canadian Government Bond | CAD | 9/19/2014 | | | 19 | | | | 2,421,274 | | | | (25,713 | ) |
| 10 Year U.S. Treasury Note | USD | 9/19/2014 | | | 26 | | | | 3,254,469 | | | | (7,313 | ) |
| Euro-BTP Italian Government Bond | EUR | 9/8/2014 | | | 9 | | | | 1,555,005 | | | | (27,868 | ) |
| Euro-OAT French Government Bond | EUR | 9/8/2014 | | | 14 | | | | 2,693,989 | | | | (39,563 | ) |
| U.S. Treasury Long Bond | USD | 9/19/2014 | | | 7 | | | | 960,313 | | | | (2,695 | ) |
| Ultra Long U.S. Treasury Bond | USD | 9/19/2014 | | | 9 | | | | 1,349,438 | | | | (17,267 | ) |
| Total unrealized depreciation | | | | (120,419 | ) |
At June 30, 2014, open written options contracts were as follows:
| Options on Interest Rate Swap Contracts | Swap Effective/ Expiration Date | | Contract Amount | | Option Expiration Date | | Premiums Received ($) | | | Value ($) (j) | |
Call Options Receive Fixed — 3.19% – Pay Floating — LIBOR | 2/3/2017 2/3/2027 | | | 700,000 | 2 | 2/1/2017 | | | 50,400 | | | | (39,614 | ) |
| Receive Fixed — 3.32% – Pay Floating — LIBOR | 2/3/2017 2/3/2027 | | | 700,000 | 3 | 2/1/2017 | | | 50,631 | | | | (35,539 | ) |
| Receive Fixed — 4.22% – Pay Floating — LIBOR | 4/22/2016 4/22/2026 | | | 1,300,000 | 1 | 4/20/2016 | | | 46,345 | | | | (14,895 | ) |
| Total Call Options | | | 147,376 | | | | (90,048 | ) |
Put Options Pay Fixed — 3.19% – Receive Floating — LIBOR | 2/3/2017 2/3/2027 | | | 700,000 | 2 | 2/1/2017 | | | 50,400 | | | | (22,203 | ) |
| Pay Fixed — 3.32% – Receive Floating — LIBOR | 2/3/2017 2/3/2027 | | | 700,000 | 3 | 2/1/2017 | | | 50,631 | | | | (25,686 | ) |
| Total Put Options | | | 101,031 | | | | (47,889 | ) |
| Total | | | 248,407 | | | | (137,937 | ) |
(j) Unrealized appreciation on written options on interest rate swap contracts at June 30, 2014 was $110,470.
At June 30, 2014, open credit default swap contracts sold were as follows:
| Bilateral Swaps | |
Effective/ Expiration Dates | | Notional Amount ($) (k) | | | Fixed Cash Flows Received | | Underlying Debt Obligation/ Quality Rating (l) | | Value ($) | | | Upfront Payments Paid/ (Received) ($) | | | Unrealized Appreciation ($) | |
6/21/2010 9/20/2015 | | | 90,000 | 4 | | | 5.0 | % | Ford Motor Co., 6.5%, 8/1/2018, BBB– | | | 5,509 | | | | (391 | ) | | | 5,900 | |
3/21/2011 6/20/2016 | | | 120,000 | 2 | | | 5.0 | % | HCA, Inc., 6.375%, 1/15/2015, B– | | | 10,368 | | | | 1,772 | | | | 8,596 | |
12/20/2011 3/20/2017 | | | 60,000 | 5 | | | 5.0 | % | CIT Group, Inc., 5.5%, 2/15/2019, BB– | | | 6,664 | | | | 1,376 | | | | 5,288 | |
9/20/2012 12/20/2017 | | | 75,000 | 6 | | | 5.0 | % | General Motors Corp., 3.3%, 12/20/2017, BB+ | | | 10,727 | | | | 3,872 | | | | 6,855 | |
6/20/2013 9/20/2018 | | | 40,000 | 5 | | | 5.0 | % | DISH DBS Corp., 6.75%, 6/1/2021, BB– | | | 6,084 | | | | 3,018 | | | | 3,066 | |
6/20/2013 9/20/2018 | | | 125,000 | 7 | | | 5.0 | % | HCA, Inc., 8.0%, 10/1/2018, B– | | | 17,215 | | | | 8,438 | | | | 8,777 | |
6/20/2013 9/20/2018 | | | 100,000 | 4 | | | 5.0 | % | Sprint Communications, Inc., 6.0%, 12/1/2016, BB– | | | 12,322 | | | | 5,016 | | | | 7,306 | |
| Total unrealized appreciation | | | | 45,788 | |
(k) The maximum potential amount of future undiscounted payments that the Fund could be required to make under a credit default swap contract would be the notional amount of the contract. These potential amounts would be partially offset by any recovery values of the referenced debt obligation or net amounts received from the settlement of buy protection credit default swap contracts entered into by the Fund for the same referenced debt obligation, if any.
(l) The quality ratings represent the higher of Moody's Investors Service, Inc. ("Moody's") or Standard & Poor's Corporation ("S&P") credit ratings and are unaudited.
At June 30, 2014, open interest rate swap contracts were as follows:
| Centrally Cleared Swaps | |
Effective/ Expiration Dates | | Notional Amount ($) | | Cash Flows Paid by the Fund | Cash Flows Received by the Fund | | Value ($) | | | Unrealized Appreciation/ (Depreciation) ($) | |
12/30/2014 12/30/2016 | | | 1,900,000 | | Fixed — 1.173% | Floating — LIBOR | | | (9,758 | ) | | | (9,956 | ) |
12/30/2014 12/30/2019 | | | 500,000 | | Floating — LIBOR | Fixed — 2.522% | | | 12,683 | | | | 13,111 | |
12/30/2014 12/30/2024 | | | 2,300,000 | | Fixed — 3.524% | Floating — LIBOR | | | (147,415 | ) | | | (147,188 | ) |
12/30/2014 12/30/2034 | | | 100,000 | | Floating — LIBOR | Fixed — 4.01% | | | 10,697 | | | | 11,394 | |
12/30/2014 12/30/2044 | | | 200,000 | | Floating — LIBOR | Fixed — 4.081% | | | 26,639 | | | | 26,887 | |
| Total net unrealized depreciation | | | | (105,752 | ) |
Counterparties:
1 Nomura International PLC
2 JPMorgan Chase Securities, Inc.
3 BNP Paribas
4 Bank of America
5 Credit Suisse
6 UBS AG
7 Goldman Sachs & Co.
At June 30, 2014, the Fund had the following open forward foreign currency exchange contracts:
| Contracts to Deliver | | In Exchange For | | Settlement Date | | Unrealized Appreciation ($) | | Counterparty |
| USD | | | 1,770,812 | | EUR | | | 1,300,000 | | 7/21/2014 | | | 9,406 | | Australia & New Zealand Banking Group Ltd. |
| USD | | | 689,530 | | CAD | | | 752,000 | | 7/23/2014 | | | 14,859 | | Canadian Imperial Bank of Commerce |
| USD | | | 1,775,745 | | JPY | | | 180,000,000 | | 8/4/2014 | | | 1,504 | | Macquarie Bank Ltd. |
| USD | | | 289,619 | | MXN | | | 3,800,000 | | 8/18/2014 | | | 2,341 | | Commonwealth Bank of Australia |
| USD | | | 570,355 | | ZAR | | | 6,200,000 | | 8/18/2014 | | | 8,113 | | Commonwealth Bank of Australia |
| ZAR | | | 6,200,000 | | USD | | | 578,794 | | 8/18/2014 | | | 326 | | Commonwealth Bank of Australia |
| ZAR | | | 560,000 | | USD | | | 52,522 | | 8/18/2014 | | | 273 | | Nomura International PLC |
| RUB | | | 10,050,000 | | USD | | | 291,859 | | 9/30/2014 | | | 2,108 | | Societe Generale |
| Total unrealized appreciation | | | | | 38,930 | |
| Contracts to Deliver | | In Exchange For | | Settlement Date | | Unrealized Depreciation ($) | | Counterparty |
| USD | | | 1,473,039 | | NOK | | | 8,900,000 | | 7/21/2014 | | | (23,089 | ) | Societe Generale |
| USD | | | 595,898 | | NOK | | | 3,600,000 | | 7/21/2014 | | | (9,401 | ) | Citigroup. Inc. |
| USD | | | 2,099,640 | | NZD | | | 2,400,000 | | 7/21/2014 | | | (1,945 | ) | Citigroup. Inc. |
| NZD | | | 1,700,000 | | USD | | | 1,474,369 | | 7/21/2014 | | | (11,498 | ) | Australia & New Zealand Banking Group Ltd. |
| NOK | | | 6,300,000 | | USD | | | 1,025,416 | | 7/21/2014 | | | (954 | ) | Barclays Bank PLC |
| NOK | | | 6,300,000 | | USD | | | 1,025,503 | | 7/21/2014 | | | (866 | ) | Societe Generale |
| NZD | | | 700,000 | | USD | | | 607,716 | | 7/21/2014 | | | (4,112 | ) | Citigroup. Inc. |
| AUD | | | 1,154,230 | | USD | | | 1,073,188 | | 7/23/2014 | | | (13,559 | ) | Nomura International PLC |
| SGD | | | 1,641,500 | | USD | | | 1,313,554 | | 7/23/2014 | | | (2,918 | ) | Commonwealth Bank of Australia |
| CAD | | | 2,095,672 | | USD | | | 1,902,096 | | 7/23/2014 | | | (60,891 | ) | Barclays Bank PLC |
| EUR | | | 567,300 | | USD | | | 769,957 | | 7/23/2014 | | | (6,908 | ) | Australia & New Zealand Banking Group Ltd. |
| Total unrealized depreciation | | | | | (136,141 | ) |
| Currency Abbreviations |
ARS Argentine Peso AUD Australian Dollar BRL Brazilian Real CAD Canadian Dollar EUR Euro JPY Japanese Yen MXN Mexican Peso NOK Norwegian Krone NZD New Zealand Dollar RUB Russian Ruble SGD Singapore Dollar USD United States Dollar ZAR South African Rand |
For information on the Fund's policy and additional disclosures regarding options purchased, futures contracts, credit default swap contracts, interest rate swap contracts, forward foreign currency exchange contracts and written option contracts, please refer to Note B in the accompanying Notes to Financial Statements.
Fair Value Measurements
Various inputs are used in determining the value of the Fund's investments. These inputs are summarized in three broad levels. Level 1 includes quoted prices in active markets for identical securities. Level 2 includes other significant observable inputs (including quoted prices for similar securities, interest rates, prepayment speeds and credit risk). Level 3 includes significant unobservable inputs (including the Fund's own assumptions in determining the fair value of investments). The level assigned to the securities valuations may not be an indication of the risk or liquidity associated with investing in those securities.
The following is a summary of the inputs used as of June 30, 2014 in valuing the Fund's investments. For information on the Fund's policy regarding the valuation of investments, please refer to the Security Valuation section of Note A in the accompanying Notes to Financial Statements.
| Assets | | Level 1 | | | Level 2 | | | Level 3 | | | Total | |
| | |
| Fixed Income Investments (m) | |
| Corporate Bonds | | $ | — | | | $ | 33,419,218 | | | $ | 0 | | | $ | 33,419,218 | |
| Asset-Backed | | | — | | | | 956,952 | | | | — | | | | 956,952 | |
| Commercial Mortgage-Backed Securities | | | — | | | | 1,962,659 | | | | — | | | | 1,962,659 | |
| Collateralized Mortgage Obligations | | | — | | | | 1,881,887 | | | | — | | | | 1,881,887 | |
| Government & Agency Obligations | | | — | | | | 8,695,484 | | | | — | | | | 8,695,484 | |
| Loan Participations and Assignments | | | — | | | | 2,920,063 | | | | 74,337 | | | | 2,994,400 | |
| Municipal Bonds and Notes | | | — | | | | 928,749 | | | | — | | | | 928,749 | |
| Convertible Bond | | | — | | | | — | | | | 241,972 | | | | 241,972 | |
| Preferred Security | | | — | | | | 85,975 | | | | — | | | | 85,975 | |
| Common Stocks (m) | | | — | | | | — | | | | 5,956 | | | | 5,956 | |
| Preferred Stock | | | — | | | | 89,670 | | | | — | | | | 89,670 | |
| Warrants | | | — | | | | — | | | | 9,073 | | | | 9,073 | |
| Exchange-Traded Fund | | | 2,944,150 | | | | — | | | | — | | | | 2,944,150 | |
| Short-Term Investments (m) | | | 7,140,562 | | | | — | | | | — | | | | 7,140,562 | |
Derivatives (n) Purchased Options | | | — | | | | 115,455 | | | | — | | | | 115,455 | |
| Futures Contracts | | | 58,617 | | | | — | | | | — | | | | 58,617 | |
| Credit Default Swap Contracts | | | — | | | | 45,788 | | | | — | | | | 45,788 | |
| Interest Rate Swap Contracts | | | — | | | | 51,392 | | | | — | | | | 51,392 | |
| Forward Foreign Currency Exchange Contracts | | | — | | | | 38,930 | | | | — | | | | 38,930 | |
| Total | | $ | 10,143,329 | | | $ | 51,192,222 | | | $ | 331,338 | | | $ | 61,666,889 | |
| Liabilities | | Level 1 | | | Level 2 | | | Level 3 | | | Total | |
| | |
Derivatives (n) Futures Contracts | | $ | (120,419 | ) | | $ | — | | | $ | — | | | $ | (120,419 | ) |
| Written Options | | | — | | | | (137,937 | ) | | | — | | | | (137,937 | ) |
| Interest Rate Swap Contracts | | | — | | | | (157,144 | ) | | | — | | | | (157,144 | ) |
| Forward Foreign Currency Exchange Contracts | | | — | | | | (136,141 | ) | | | — | | | | (136,141 | ) |
| Total | | $ | (120,419 | ) | | $ | (431,222 | ) | | $ | — | | | $ | (551,641 | ) |
During the period ended June 30, 2014, the amount of transfers between Level 2 and Level 3 was $74,337. The investment was transferred from Level 2 to Level 3 because of the lack of observable market data due to a decrease in market activity.
Transfers between price levels are recognized at the beginning of the reporting period.
(m) See Investment Portfolio for additional detailed categorizations.
(n) Derivatives include value of options purchased, unrealized appreciation (depreciation) on futures contracts, credit default swap contracts, interest rate swap contracts and forward foreign currency exchange contracts; and written options, at value.
The accompanying notes are an integral part of the financial statements.
Statement of Assets and Liabilities | as of June 30, 2014 (Unaudited) | |
| Assets | |
Investments: Investments in non-affiliated securities, at value (cost $52,124,728) — including $1,197,256 of securities loaned | | $ | 54,331,600 | |
| Investment in Daily Assets Fund Institutional (cost $1,252,899)* | | | 1,252,899 | |
| Investment in Central Cash Management Fund (cost $5,887,663) | | | 5,887,663 | |
| Total investments in securities, at value (cost $59,265,290) | | | 61,472,162 | |
| Foreign currency, at value (cost $423,279) | | | 424,572 | |
| Receivable for investments sold | | | 1,046,928 | |
| Receivable for investments sold — when-issued/delayed delivery securities | | | 39,744 | |
| Receivable for Fund shares sold | | | 128 | |
| Interest receivable | | | 639,328 | |
| Receivable for variation margin on futures contracts | | | 4,180 | |
| Receivable for variation margin on centrally cleared swaps | | | 6,654 | |
| Unrealized appreciation on bilateral swap contracts | | | 45,788 | |
| Unrealized appreciation on forward foreign currency exchange contracts | | | 38,930 | |
| Upfront payments paid on bilateral swap contracts | | | 23,492 | |
| Other assets | | | 605 | |
| Total assets | | $ | 63,742,511 | |
| Liabilities | |
| Cash overdraft | | | 143,206 | |
| Payable upon return of securities loaned | | | 1,252,899 | |
| Payable for investments purchased | | | 2,229,489 | |
| Payable for investments purchased — when-issued/delayed delivery securities | | | 139,906 | |
| Payable for Fund shares redeemed | | | 51,581 | |
| Options written, at value (premiums received $248,407) | | | 137,937 | |
| Unrealized depreciation on forward foreign currency exchange contracts | | | 136,141 | |
| Upfront payments received on bilateral swap contracts | | | 391 | |
| Accrued management fee | | | 13,489 | |
| Accrued Trustees' fees | | | 573 | |
| Other accrued expenses and payables | | | 86,142 | |
| Total liabilities | | | 4,191,754 | |
| Net assets, at value | | $ | 59,550,757 | |
| Net Assets Consist of | |
| Undistributed net investment income | | | 988,899 | |
Net unrealized appreciation (depreciation) on: Investments | | | 2,206,872 | |
| Swap contracts | | | (59,964 | ) |
| Futures | | | (61,802 | ) |
| Foreign currency | | | (95,255 | ) |
| Written options | | | 110,470 | |
| Accumulated net realized gain (loss) | | | (1,105,169 | ) |
| Paid-in capital | | | 57,566,706 | |
| Net assets, at value | | $ | 59,550,757 | |
Class A Net Asset Value, offering and redemption price per share ($59,550,757 ÷ 5,183,668 outstanding shares of beneficial interest, no par value, unlimited number of shares authorized) | | $ | 11.49 | |
* Represents collateral on securities loaned.
The accompanying notes are an integral part of the financial statements.
| for the six months ended June 30, 2014 (Unaudited) | |
| Investment Income | |
Income: Interest | | $ | 1,491,595 | |
| Dividends | | | 21,026 | |
| Income distributions — Central Cash Management Fund | | | 705 | |
| Securities lending income, including income from Daily Assets Fund Institutional, net of borrower rebates | | | 2,031 | |
| Total income | | | 1,515,357 | |
Expenses: Management fee | | | 161,443 | |
| Administration fee | | | 29,353 | |
| Services to shareholders | | | 424 | |
| Custodian fee | | | 35,067 | |
| Professional fees | | | 40,952 | |
| Reports to shareholders | | | 13,941 | |
| Pricing fee | | | 25,645 | |
| Trustees' fees and expenses | | | 2,293 | |
| Other | | | 1,779 | |
| Total expenses before expense reductions | | | 310,897 | |
| Expense reductions | | | (87,682 | ) |
| Total expenses after expense reductions | | | 223,215 | |
| Net investment income | | | 1,292,142 | |
| Realized and Unrealized Gain (Loss) | |
Net realized gain (loss) from: Investments | | | (426,572 | ) |
| Swap contracts | | | 15,275 | |
| Futures | | | (70,584 | ) |
| Foreign currency | | | 413,907 | |
| | | | (67,974 | ) |
Change in net unrealized appreciation (depreciation) on: Investments | | | 1,974,254 | |
| Swap contracts | | | (109,289 | ) |
| Unfunded loan commitment | | | 125 | |
| Futures | | | (57,685 | ) |
| Written options | | | 99,763 | |
| Foreign currency | | | (346,572 | ) |
| | | | 1,560,596 | |
| Net gain (loss) | | | 1,492,622 | |
| Net increase (decrease) in net assets resulting from operations | | $ | 2,784,764 | |
The accompanying notes are an integral part of the financial statements.
Statement of Changes in Net Assets | Increase (Decrease) in Net Assets | | Six Months Ended June 30, 2014 (Unaudited) | | | Year Ended December 31, 2013 | |
Operations: Net investment income | | $ | 1,292,142 | | | $ | 2,911,005 | |
Operations: Net investment income | | $ | 1,292,142 | | | $ | 2,911,005 | |
| Net realized gain (loss) | | | (67,974 | ) | | | (1,186,626 | ) |
| Change in net unrealized appreciation (depreciation) | | | 1,560,596 | | | | (2,619,441 | ) |
| Net increase (decrease) in net assets resulting from operations | | | 2,784,764 | | | | (895,062 | ) |
Distributions to shareholders from: Net investment income: Class A | | | (2,905,554 | ) | | | (3,703,120 | ) |
Net realized gains: Class A | | | — | | | | (2,113,421 | ) |
| Total distributions | | | (2,905,554 | ) | | | (5,816,541 | ) |
Fund share transactions: Class A Proceeds from shares sold | | | 1,959,692 | | | | 8,233,284 | |
| Reinvestment of distributions | | | 2,905,554 | | | | 5,816,541 | |
| Payments for shares redeemed | | | (6,150,708 | ) | | | (19,881,192 | ) |
| Net increase (decrease) in net assets from Class A share transactions | | | (1,285,462 | ) | | | (5,831,367 | ) |
| Increase (decrease) in net assets | | | (1,406,252 | ) | | | (12,542,970 | ) |
| Net assets at beginning of period | | | 60,957,009 | | | | 73,499,979 | |
| Net assets at end of period (including undistributed net investment income of $988,899 and $2,602,311, respectively) | | $ | 59,550,757 | | | $ | 60,957,009 | |
| Other Information | |
Class A Shares outstanding at beginning of period | | | 5,284,551 | | | | 5,832,490 | |
| Shares sold | | | 171,230 | | | | 666,814 | |
| Shares issued to shareholders in reinvestment of distributions | | | 258,501 | | | | 491,677 | |
| Shares redeemed | | | (530,614 | ) | | | (1,706,430 | ) |
| Net increase (decrease) in Class A shares | | | (100,883 | ) | | | (547,939 | ) |
| Shares outstanding at end of period | | | 5,183,668 | | | | 5,284,551 | |
The accompanying notes are an integral part of the financial statements.
| | | | | | Years Ended December 31, | |
| Class A | | Six Months Ended 6/30/14 (Unaudited) | | | 2013 | | | 2012 | | | 2011 | | | 2010 | | | 2009 | |
| Selected Per Share Data | |
| Net asset value, beginning of period | | $ | 11.53 | | | $ | 12.60 | | | $ | 11.90 | | | $ | 11.96 | | | $ | 11.61 | | | $ | 10.03 | |
Income (loss) from investment operations: Net investment incomea | | | .25 | | | | .49 | | | | .57 | | | | .63 | | | | .66 | | | | .63 | |
| Net realized and unrealized gain (loss) | | | .30 | | | | (.59 | ) | | | .92 | | | | (.01 | ) | | | .47 | | | | 1.50 | |
| Total from investment operations | | | .55 | | | | (.10 | ) | | | 1.49 | | | | .62 | | | | 1.13 | | | | 2.13 | |
Less distributions from: Net investment income | | | (.59 | ) | | | (.62 | ) | | | (.76 | ) | | | (.68 | ) | | | (.78 | ) | | | (.55 | ) |
| Net realized gains | | | — | | | | (.35 | ) | | | (.03 | ) | | | — | | | | — | | | | — | |
| Total distributions | | | (.59 | ) | | | (.97 | ) | | | (.79 | ) | | | (.68 | ) | | | (.78 | ) | | | (.55 | ) |
| Net asset value, end of period | | $ | 11.49 | | | $ | 11.53 | | | $ | 12.60 | | | $ | 11.90 | | | $ | 11.96 | | | $ | 11.61 | |
Total Return (%)b | | | 4.87 | ** | | | (1.04 | ) | | | 13.08 | | | | 5.31 | | | | 10.05 | | | | 22.73 | |
| Ratios to Average Net Assets and Supplemental Data | |
| Net assets, end of period ($ millions) | | | 60 | | | | 61 | | | | 73 | | | | 69 | | | | 76 | | | | 74 | |
| Ratio of expenses before expense reductions (%) | | | 1.06 | * | | | 1.02 | | | | .99 | | | | .99 | | | | .95 | | | | .86 | |
| Ratio of expenses after expense reductions (%) | | | .76 | * | | | .74 | | | | .77 | | | | .79 | | | | .86 | | | | .80 | |
| Ratio of net investment income (%) | | | 4.40 | * | | | 4.16 | | | | 4.72 | | | | 5.38 | | | | 5.62 | | | | 5.96 | |
| Portfolio turnover rate (%) | | | 59 | ** | | | 183 | | | | 164 | | | | 144 | | | | 167 | | | | 370 | |
a Based on average shares outstanding during the period. b Total return would have been lower had certain expenses not been reduced. * Annualized ** Not annualized | |
Notes to Financial Statements (Unaudited)
A. Organization and Significant Accounting Policies
Deutsche Unconstrained Income VIP (formerly DWS Unconstrained Income VIP) (the "Fund") is a diversified series of Deutsche Variable Series II (formerly DWS Variable Series II) (the "Trust"), which is registered under the Investment Company Act of 1940, as amended (the "1940 Act"), as an open-end management investment company organized as a Massachusetts business trust.
The Fund's financial statements are prepared in accordance with accounting principles generally accepted in the United States of America which require the use of management estimates. Actual results could differ from those estimates. The policies described below are followed consistently by the Fund in the preparation of its financial statements.
Security Valuation. Investments are stated at value determined as of the close of regular trading on the New York Stock Exchange on each day the exchange is open for trading.
Various inputs are used in determining the value of the Fund's investments. These inputs are summarized in three broad levels. Level 1 includes quoted prices in active markets for identical securities. Level 2 includes other significant observable inputs (including quoted prices for similar securities, interest rates, prepayment speeds and credit risk). Level 3 includes significant unobservable inputs (including the Fund's own assumptions in determining the fair value of investments). The level assigned to the securities valuations may not be an indication of the risk or liquidity associated with investing in those securities.
Debt securities and loan participations and assignments are valued at prices supplied by independent pricing services approved by the Fund's Board. Such services may use various pricing techniques which take into account appropriate factors such as yield, quality, coupon rate, maturity, type of issue, trading characteristics, prepayment speeds and other data, as well as broker quotes. If the pricing services are unable to provide valuations, debt securities are valued at the average of the most recent reliable bid quotations or evaluated prices, as applicable, obtained from broker-dealers and loan participations and assignments are valued at the mean of the most recent bid and ask quotations or evaluated prices, as applicable, obtained from one or more broker-dealers. These securities are generally categorized as Level 2.
Equity securities and exchange-traded funds ("ETFs") are valued at the most recent sale price or official closing price reported on the exchange (U.S. or foreign) or over-the-counter market on which they trade. Securities or ETFs for which no sales are reported are valued at the calculated mean between the most recent bid and asked quotations on the relevant market or, if a mean cannot be determined, at the most recent bid quotation. Equity securities and ETFs are generally categorized as Level 1.
Money market instruments purchased with an original or remaining maturity of sixty days or less, maturing at par, are valued at amortized cost, which approximates value, and are categorized as Level 2. Investments in open-end investment companies are valued at their net asset value each business day and are categorized as Level 1.
Futures contracts are generally valued at the settlement prices established each day on the exchange on which they are traded and are categorized as Level 1.
Forward currency contracts are valued at the prevailing forward exchange rate of the underlying currencies and are categorized as Level 2.
Swap contracts are valued daily based upon prices supplied by a Board approved pricing vendor, if available, and otherwise are valued at the price provided by the broker-dealer. Swap contracts are generally categorized as Level 2.
Exchange-traded options are valued at the last sale price or, in the absence of a sale, the mean between the closing bid and asked prices or at the most recent asked price (bid for purchased options) if no bid or asked price are available. Exchange-traded options are categorized as Level 1. Over-the-counter written or purchased options are valued at prices supplied by a Board approved pricing vendor, if available, and otherwise are valued at the price provided by the broker-dealer with which the option was traded. Over-the-counter written or purchased options are generally categorized as Level 2.
Securities and other assets for which market quotations are not readily available or for which the above valuation procedures are deemed not to reflect fair value are valued in a manner that is intended to reflect their fair value as determined in accordance with procedures approved by the Board and are generally categorized as Level 3. In accordance with the Fund's valuation procedures, factors considered in determining value may include, but are not limited to, the type of the security; the size of the holding; the initial cost of the security; the existence of any contractual restrictions on the security's disposition; the price and extent of public trading in similar securities of the issuer or of comparable companies; quotations or evaluated prices from broker-dealers and/or pricing services; information obtained from the issuer, analysts, and/or the appropriate stock exchange (for exchange-traded securities); an analysis of the company's or issuer's financial statements; an evaluation of the forces that influence the issuer and the market(s) in which the security is purchased and sold; and with respect to debt securities, the maturity, coupon, creditworthiness, currency denomination and the movement of the market in which the security is normally traded. The value determined under these procedures may differ from published values for the same securities.
Disclosure about the classification of fair value measurements is included in a table following the Fund's Investment Portfolio.
Foreign Currency Translations. The books and records of the Fund are maintained in U.S. dollars. Investment securities and other assets and liabilities denominated in a foreign currency are translated into U.S. dollars at the prevailing exchange rates at period end. Purchases and sales of investment securities, income and expenses are translated into U.S. dollars at the prevailing exchange rates on the respective dates of the transactions.
Net realized and unrealized gains and losses on foreign currency transactions represent net gains and losses between trade and settlement dates on securities transactions, the acquisition and disposition of foreign currencies, and the difference between the amount of net investment income accrued and the U.S. dollar amount actually received. That portion of both realized and unrealized gains and losses on investments that results from fluctuations in foreign currency exchange rates is not separately disclosed but is included with net realized and unrealized gain/appreciation and loss/depreciation on investments.
Securities Lending. Deutsche Bank AG, as lending agent, lends securities of the Fund to certain financial institutions under the terms of the Security Lending Agreement. The Fund retains benefits of owning the securities it has loaned and continues to receive interest and dividends generated by the securities and to participate in any changes in their market value. The Fund requires the borrowers of the securities to maintain collateral with the Fund consisting of either cash or liquid, unencumbered assets having a value at least equal to the value of the securities loaned. When the collateral falls below specified amounts, the lending agent will use its best effort to obtain additional collateral on the next business day to meet required amounts under the security lending agreement. The Fund may invest the cash collateral into a joint trading account in an affiliated money market fund pursuant to Exemptive Orders issued by the SEC. The Fund receives compensation for lending its securities either in the form of fees or by earning interest on invested cash collateral net of borrower rebates and fees paid to a lending agent. Either the Fund or the borrower may terminate the loan. There may be risks of delay and costs in recovery of securities or even loss of rights in the collateral should the borrower of the securities fail financially. If the Fund is not able to recover securities lent, the Fund may sell the collateral and purchase a replacement investment in the market, incurring the risk that the value of the replacement security is greater than the value of the collateral. The Fund is also subject to all investment risks associated with the reinvestment of any cash collateral received, including, but not limited to, interest rate, credit and liquidity risk associated with such investments.
As of June 30, 2014, the Fund had securities on loan. The value of the related collateral exceeded the value of the securities loaned at period end.
Loan Participations and Assignments. Loan Participations and Assignments are portions of loans originated by banks and sold in pieces to investors. These floating-rate loans ("Loans") in which the Fund invests are arranged between the borrower and one or more financial institutions ("Lenders"). These Loans may take the form of Senior Loans, which are corporate obligations often issued in connection with recapitalizations, acquisitions, leveraged buy outs and refinancing. The Fund invests in such Loans in the form of participations in Loans ("Participations") or assignments of all or a portion of Loans from third parties ("Assignments"). Participations typically result in the Fund having a contractual relationship with only the Lender, not with the borrower. The Fund has the right to receive payments of principal, interest and any fees to which it is entitled from the Lender selling the Participation and only upon receipt by the Lender of the payments from the borrower. In connection with purchasing Participations, the Fund generally has no right to enforce compliance by the borrower with the terms of the loan agreement relating to the Loan, or any rights of set off against the borrower, and the Fund will not benefit directly from any collateral supporting the Loan in which it has purchased the Participation. As a result, the Fund assumes the credit risk of both the borrower and the Lender that is selling the Participation. Assignments typically result in the Fund having a direct contractual relationship with the borrower, and the Fund may enforce compliance by the borrower with the terms of the loan agreement. Loans held by the Fund are generally in the form of Assignments, but the Fund may also invest in Participations. All Loans involve interest rate risk, liquidity risk and credit risk, including the potential default or insolvency of the borrower.
When-Issued/Delayed Delivery Securities. The Fund may purchase or sell securities with delivery or payment to occur at a later date beyond the normal settlement period. At the time the Fund enters into a commitment to purchase or sell a security, the transaction is recorded and the value of the transaction is reflected in the net asset value. The price of such security and the date when the security will be delivered and paid for are fixed at the time the transaction is negotiated. The value of the security may vary with market fluctuations. At the time the Fund enters into this type of transaction, it is required to segregate cash or other liquid assets at least equal to the amount of the commitment. Additionally, the Fund may be required to post securities and/or cash collateral in accordance with the terms of the commitment.
Certain risks may arise upon entering into when-issued or delayed delivery transactions from the potential inability of counterparties to meet the terms of their contracts or if the issuer does not issue the securities due to political, economic, or other factors. Additionally, losses may arise due to changes in the value of the underlying securities.
Taxes. The Fund's policy is to comply with the requirements of the Internal Revenue Code, as amended, which are applicable to regulated investment companies and to distribute all of its taxable income to its shareholders.
Additionally, the Fund may be subject to taxes imposed by the governments of countries in which it invests and are generally based on income and/or capital gains earned or repatriated. Estimated tax liabilities on certain foreign securities are recorded on an accrual basis and are reflected as components of interest income or net change in unrealized gain/loss on investments. Tax liabilities realized as a result of security sales are reflected as a component of net realized gain/loss on investments.
At December 31, 2013, the Fund had net tax basis capital loss carryforwards of approximately $1,042,000, which may be applied against realized net taxable capital gains indefinitely, including short-term losses ($671,000) and long-term losses ($371,000).
The Fund has reviewed the tax positions for the open tax years as of December 31, 2013 and has determined that no provision for income tax and/or uncertain tax provisions is required in the Fund's financial statements. The Fund's federal tax returns for the prior three fiscal years remain open subject to examination by the Internal Revenue Service.
Distribution of Income and Gains. Distributions from net investment income of the Fund, if any, are declared and distributed to shareholders annually. Net realized gains from investment transactions, in excess of available capital loss carryforwards, would be taxable to the Fund if not distributed and, therefore, will be distributed to shareholders at least annually. The Fund may also make additional distributions for tax purposes if necessary.
The timing and characterization of certain income and capital gain distributions are determined annually in accordance with federal tax regulations which may differ from accounting principles generally accepted in the United States of America. These differences primarily relate to investments in foreign denominated investments, forward currency contracts, futures contracts, swap contracts and certain securities sold at a loss. As a result, net investment income (loss) and net realized gain (loss) on investment transactions for a reporting period may differ significantly from distributions during such period. Accordingly, the Fund may periodically make reclassifications among certain of its capital accounts without impacting the net asset value of the Fund.
The tax character of current year distributions will be determined at the end of the current fiscal year.
Expenses. Expenses of the Trust arising in connection with a specific fund are allocated to that fund. Other Trust expenses which cannot be directly attributed to a fund are apportioned among the funds in the Trust based upon the relative net assets or other appropriate measures.
Contingencies. In the normal course of business, the Fund may enter into contracts with service providers that contain general indemnification clauses. The Fund's maximum exposure under these arrangements is unknown, as this would involve future claims that may be made against the Fund that have not yet been made. However, based on experience, the Fund expects the risk of loss to be remote.
Other. Investment transactions are accounted for on a trade date plus one basis for daily net asset value calculations. However, for financial reporting purposes, investment transactions are reported on trade date. Interest income is recorded on the accrual basis. Dividend income is recorded on the ex-dividend date net of foreign withholding taxes. Realized gains and losses from investment transactions are recorded on an identified cost basis. Proceeds from litigation payments, if any, are included in net realized gain (loss) from investments. All discounts and premiums are accreted/amortized for both tax and financial reporting purposes for the Fund, with the exception of securities in default of principal.
B. Derivative Instruments
Swaps. A swap is a contract between two parties to exchange future cash flows at periodic intervals based on the notional amount of the swap. A bilateral swap is a transaction between the fund and a counterparty where cash flows are exchanged between the two parties. A centrally cleared swap is a transaction executed between the fund and a counterparty, then cleared by a clearing member through a central clearinghouse. The central clearinghouse serves as the counterparty, with whom the fund exchanges cash flows.
The value of a swap is adjusted daily, and the change in value, if any, is recorded as unrealized appreciation or depreciation in the Statement of Assets and Liabilities. Gains or losses are realized when the swap expires or is closed. Certain risks may arise when entering into swap transactions including counterparty default; liquidity; or unfavorable changes in interest rates or the value of the underlying reference security, commodity or index. In connection with bilateral swaps, securities and/or cash may be identified as collateral in accordance with the terms of the swap agreement to provide assets of value and recourse in the event of default. The maximum counterparty credit risk is the net present value of the cash flows to be received from or paid to the counterparty over the term of the swap, to the extent that this amount is beneficial to the Fund, in addition to any related collateral posted to the counterparty by the Fund. This risk may be partially reduced by a master netting arrangement between the Fund and the counterparty. Upon entering into a centrally cleared swap, the Fund is required to deposit with a financial intermediary cash or securities ("initial margin") in an amount equal to a certain percentage of the notional amount of the swap. Subsequent payments ("variation margin") are made or received by the Fund dependent upon the daily fluctuations in the value of the swap. In a cleared swap transaction, counterparty risk is minimized as the central clearinghouse acts as the counterparty.
An upfront payment, if any, made by the Fund is recorded as an asset in the Statement of Assets and Liabilities. An upfront payment, if any, received by the Fund is recorded as a liability in the Statement of Assets and Liabilities. Payments received or made at the end of the measurement period are recorded as realized gain or loss in the Statement of Operations.
Interest Rate Swaps. Interest rate swaps are agreements in which the Fund agrees to pay to the counterparty a fixed rate payment in exchange for the counterparty agreeing to pay to the Fund a variable rate payment, or the Fund agrees to receive from the counterparty a fixed rate payment in exchange for the counterparty agreeing to receive from the Fund a variable rate payment. The payment obligations are based on the notional amount of the swap. For the six months ended June 30, 2014, the Fund entered into interest rate swap agreements to gain exposure to different parts of the yield curve while managing overall duration.
A summary of the open interest rate swap contracts as of June 30, 2014 is included in a table following the Fund's Investment Portfolio. For the six months ended June 30, 2014, the investment in interest rate swap contracts had a total notional amount of $5,000,000.
Credit Default Swaps. Credit default swaps are agreements between a buyer and a seller of protection against predefined credit events for the reference entity. The Fund may enter into credit default swaps to gain exposure to an underlying issuer's credit quality characteristics without directly investing in that issuer or to hedge against the risk of a credit event on debt securities. As a seller of a credit default swap, the Fund is required to pay the par (or other agreed-upon) value of the referenced entity to the counterparty with the occurrence of a credit event by a third party, such as a U.S. or foreign corporate issuer, on the reference entity, which would likely result in a loss to the Fund. In return, the Fund receives from the counterparty a periodic stream of payments over the term of the swap provided that no credit event has occurred. If no credit event occurs, the Fund keeps the stream of payments with no payment obligations. The Fund may also buy credit default swaps, in which case the Fund functions as the counterparty referenced above. This involves the risk that the swap may expire worthless. It also involves counterparty risk that the seller may fail to satisfy its payment obligations to the Fund with the occurrence of a credit event. When the Fund sells a credit default swap, it will cover its commitment. This may be achieved by, among other methods, maintaining cash or liquid assets equal to the aggregate notional value of the reference entities for all outstanding credit default swaps sold by the Fund. For the six months ended June 30, 2014, the Fund entered into credit default swap agreements to gain exposure to the underlying issuer's credit quality characteristics.
Under the terms of a credit default swap, the Fund receives or makes periodic payments based on a specified interest rate on a fixed notional amount. These payments are recorded as a realized gain or loss in the Statement of Operations. Payments received or made as a result of a credit event or termination of the swap are recognized, net of a proportional amount of the upfront payment, as realized gains or losses in the Statement of Operations.
A summary of the open credit default swap contracts as of June 30, 2014 is included in a table following the Fund's Investment Portfolio. For the six months ended June 30, 2014, the investment in credit default swap contracts sold had a total notional value of $610,000.
Options. An option contract is a contract in which the writer (seller) of the option grants the buyer of the option, upon payment of a premium, the right to purchase from (call option), or sell to (put option), the writer a designated instrument at a specified price within a specified period of time. The Fund may write or purchase interest rate swaption agreements which are options to enter into a pre-defined swap agreement. The interest rate swaption agreement will specify whether the buyer of the swaption will be a fixed-rate receiver or a fixed-rate payer upon exercise. Certain options, including options on indices, will require cash settlement by the Fund if the option is exercised. For the six months ended June 30, 2014, the Fund entered into options on interest rate swaps in order to hedge against potential adverse interest rate movements of portfolio assets.
If the Fund writes a covered call option, the Fund foregoes, in exchange for the premium, the opportunity to profit during the option period from an increase in the market value of the underlying security above the exercise price. If the Fund writes a put option it accepts the risk of a decline in the value of the underlying security below the exercise price. Over-the-counter options have the risk of the potential inability of counterparties to meet the terms of their contracts. The Fund's maximum exposure to purchased options is limited to the premium initially paid. In addition, certain risks may arise upon entering into option contracts including the risk that an illiquid secondary market will limit the Fund's ability to close out an option contract prior to the expiration date and that a change in the value of the option contract may not correlate exactly with changes in the value of the securities.
A summary of the open purchased option contracts as of June 30, 2014 is included in the Fund's Investment Portfolio. A summary of open written option contracts is included in a table following the Fund's Investment Portfolio. For the six months ended June 30, 2014, the investment in written option contracts had a total value generally indicative of a range from approximately $138,000 to $238,000, and purchased option contracts had a total value generally indicative of a range from approximately $115,000 to $276,000.
Futures Contracts. A futures contract is an agreement between a buyer or seller and an established futures exchange or its clearinghouse in which the buyer or seller agrees to take or make a delivery of a specific amount of a financial instrument at a specified price on a specific date (settlement date). For the six months ended June 30, 2014, the Fund entered into interest rate futures to gain exposure to different parts of the yield curve while managing overall duration and for non-hedging purposes to seek to enhance potential gains.
Upon entering into a futures contract, the Fund is required to deposit with a financial intermediary cash or securities ("initial margin") in an amount equal to a certain percentage of the face value indicated in the futures contract. Subsequent payments ("variation margin") are made or received by the Fund dependent upon the daily fluctuations in the value and are recorded for financial reporting purposes as unrealized gains or losses by the Fund. Gains or losses are realized when the contract expires or is closed. Since all futures contracts are exchange-traded, counterparty risk is minimized as the exchange's clearinghouse acts as the counterparty, and guarantees the futures against default.
Certain risks may arise upon entering into futures contracts, including the risk that an illiquid market will limit the Fund's ability to close out a futures contract prior to the settlement date and the risk that the futures contract is not well correlated with the security, index or currency to which it relates. Risk of loss may exceed amounts disclosed in the Statement of Assets and Liabilities.
A summary of the open futures contracts as of June 30, 2014 is included in a table following the Fund's Investment Portfolio. For the six months ended June 30, 2014, the investment in futures contracts purchased had a total notional value generally indicative of a range from approximately $357,000 to $8,488,000, and the investment in futures contracts sold had a total notional value generally indicative of a range from approximately $5,598,000 to $12,234,000.
Forward Foreign Currency Exchange Contracts. A forward foreign currency exchange contract ("forward currency contract") is a commitment to purchase or sell a foreign currency at the settlement date at a negotiated rate. For the six months ended June 30, 2014, the Fund entered into forward currency contracts in order to hedge against anticipated currency market changes and for non-hedging purposes to seek to enhance potential gains.
Forward currency contracts are valued at the prevailing forward exchange rate of the underlying currencies and unrealized gain (loss) is recorded daily. On the settlement date of the forward currency contract, the Fund records a realized gain or loss equal to the difference between the value of the contract at the time it was opened and the value of the contract at the time it was closed. Certain risks may arise upon entering into forward currency contracts from the potential inability of counterparties to meet the terms of their contracts. The maximum counterparty credit risk to the Fund is measured by the unrealized gain on appreciated contracts. Additionally, when utilizing forward currency contracts to hedge, the Fund gives up the opportunity to profit from favorable exchange rate movements during the term of the contract.
A summary of the open forward currency contracts as of June 30, 2014 is included in a table following the Fund's Investment Portfolio. For the six months ended June 30, 2014, the investment in forward currency contracts short vs. U.S. dollars had a total contract value generally indicative of a range from approximately $9,544,000 to $22,228,000, and the investment in forward currency contracts long vs. U.S. dollars had a total contract value generally indicative of a range from approximately $2,864,000 to $20,021,000. The investment in forward currency contracts long vs. other foreign currencies sold had a total contract value generally indicative of a range from $0 to approximately $5,199,000.
The following tables summarize the value of the Fund's derivative instruments held as of June 30, 2014 and the related location in the accompanying Statement of Assets and Liabilities, presented by primary underlying risk exposure:
| Asset Derivatives | | Purchased Options | | | Forward Contracts | | | Swap Contracts | | | Futures Contracts | | | Total | |
| Interest Rate Contracts (a) (b) | | $ | 115,455 | | | $ | — | | | $ | 51,392 | | | $ | 58,617 | | | $ | 225,464 | |
| Credit Contracts (b) | | | — | | | | — | | | | 45,788 | | | | — | | | | 45,788 | |
| Foreign Exchange Contracts (c) | | | — | | | | 38,930 | | | | — | | | | — | | | | 38,930 | |
| | | $ | 115,455 | | | $ | 38,930 | | | $ | 97,180 | | | $ | 58,617 | | | $ | 310,182 | |
Each of the above derivatives is located in the following Statement of Assets and Liabilities accounts: (a) Includes cumulative appreciation of futures and centrally cleared swap contracts as disclosed in the Investment Portfolio. Unsettled variation margin is disclosed separately within the Statement of Assets and Liabilities. (b) Investments in securities, at value (includes purchased options) and unrealized appreciation on bilateral swap contracts, respectively (c) Unrealized appreciation on forward foreign currency exchange contracts | |
| Liability Derivatives | | Written Options | | | Forward Contracts | | | Swap Contracts | | | Futures Contracts | | | Total | |
| Interest Rate Contracts (a) (b) | | $ | (137,937 | ) | | $ | — | | | $ | (157,144 | ) | | $ | (120,419 | ) | | $ | (415,500 | ) |
| Foreign Exchange Contracts (c) | | | — | | | | (136,141 | ) | | | — | | | | — | | | | (136,141 | ) |
| | | $ | (137,937 | ) | | $ | (136,141 | ) | | $ | (157,144 | ) | | $ | (120,419 | ) | | $ | (551,641 | ) |
Each of the above derivatives is located in the following Statement of Assets and Liabilities accounts: (a) Includes cumulative depreciation of futures and centrally cleared swap contracts as disclosed in the Investment Portfolio. Unsettled variation margin is disclosed separately within the Statement of Assets and Liabilities. (b) Options written, at value (c) Unrealized depreciation on forward foreign currency exchange contracts | |
Additionally, the amount of unrealized and realized gains and losses on derivative instruments recognized in Fund earnings during the six months ended June 30, 2014 and the related location in the accompanying Statement of Operations is summarized in the following tables by primary underlying risk exposure:
| Realized Gain (Loss) | | Forward Contracts | | | Swap Contracts | | | Futures Contracts | | | Total | |
| Interest Rate Contracts (a) | | $ | — | | | $ | (3,036 | ) | | $ | (70,584 | ) | | $ | (73,620 | ) |
| Credit Contracts (a) | | | — | | | | 18,311 | | | | — | | | | 18,311 | |
| Foreign Exchange Contracts (b) | | | 386,528 | | | | — | | | | — | | | | 386,528 | |
| | | $ | 386,528 | | | $ | 15,275 | | | | (70,584 | ) | | $ | 331,219 | |
Each of the above derivatives is located in the following Statement of Operations accounts: (a) Net realized gain (loss) from swap contracts and futures, respectively (b) Net realized gain (loss) from foreign currency (Statement of Operations includes both forward currency contracts and foreign currency transactions) | |
| Change in Net Unrealized Appreciation (Depreciation) | | Purchased Options | | | Written Options | | | Forward Contracts | | | Swap Contracts | | | Futures Contracts | | | Total | |
| Interest Rate Contracts (a) | | $ | (160,242 | ) | | $ | 99,763 | | | $ | — | | | $ | (109,256 | ) | | $ | (57,685 | ) | | $ | (227,420 | ) |
| Credit Contracts (a) | | | — | | | | — | | | | — | | | | (33 | ) | | | — | | | | (33 | ) |
| Foreign Exchange Contracts (b) | | | — | | | | — | | | | (339,314 | ) | | | — | | | | — | | | | (339,314 | ) |
| | | $ | (160,242 | ) | | $ | 99,763 | | | $ | (339,314 | ) | | $ | (109,289 | ) | | $ | (57,685 | ) | | $ | (566,767 | ) |
Each of the above derivatives is located in the following Statement of Operations accounts: (a) Change in net unrealized appreciation (depreciation) on investments (includes purchased options), written options, swap contracts and futures, respectively (b) Change in net unrealized appreciation (depreciation) on foreign currency (Statement of Operations includes both forward currency contracts and foreign currency transactions) | |
As of June 30, 2014, the Fund has transactions subject to enforceable master netting agreements. A reconciliation of the gross amounts on the Statements of Assets and Liabilities to the net amounts by derivative type, including any collateral exposure, is included in the following tables:
| Counterparty | | Gross Amounts of Assets Presented in the Statement of Assets and Liabilities | | | Financial Instruments and Derivatives Available for Offset | | | Collateral Received | | | Net Amount of Derivative Assets | |
| Australia & New Zealand Banking Group Ltd. | | $ | 9,406 | | | $ | (9,406 | ) | | $ | — | | | $ | — | |
| Bank of America | | | 13,206 | | | | — | | | | — | | | | 13,206 | |
| BNP Paribas | | | 41,538 | | | | (41,538 | ) | | | — | | | | — | |
| Canadian Imperial Bank of Commerce | | | 14,859 | | | | — | | | | — | | | | 14,859 | |
| Commonwealth Bank of Australia | | | 10,780 | | | | (2,918 | ) | | | — | | | | 7,862 | |
| Credit Suisse | | | 8,354 | | | | — | | | | — | | | | 8,354 | |
| Goldman Sachs & Co. | | | 8,777 | | | | — | | | | — | | | | 8,777 | |
| JPMorgan Chase Securities, Inc. | | | 54,447 | | | | (54,447 | ) | | | — | | | | — | |
| Macquarie Bank Ltd. | | | 1,504 | | | | — | | | | — | | | | 1,504 | |
| Nomura International PLC | | | 28,339 | | | | (28,339 | ) | | | — | | | | — | |
| Societe Generale | | | 2,108 | | | | (2,108 | ) | | | — | | | | — | |
| UBS AG | | | 6,855 | | | | — | | | | — | | | | 6,855 | |
| | | $ | 200,173 | | | $ | (138,756 | ) | | $ | — | | | $ | 61,417 | |
| Counterparty | | Gross Amounts of Liabilities Presented in the Statement of Assets and Liabilities | | | Financial Instruments and Derivatives Available for Offset | | | Collateral Pledged | | | Net Amount of Derivative Liabilities | |
| Australia & New Zealand Banking Group Ltd. | | $ | 18,406 | | | $ | (9,406 | ) | | $ | — | | | $ | 9,000 | |
| Barclays Bank PLC | | | 61,845 | | | | — | | | | — | | | | 61,845 | |
| BNP Paribas | | | 61,225 | | | | (41,538 | ) | | | — | | | | 19,687 | |
| Citigroup, Inc. | | | 15,458 | | | | — | | | | — | | | | 15,458 | |
| Commonwealth Bank of Australia | | | 2,918 | | | | (2,918 | ) | | | — | | | | — | |
| JPMorgan Chase Securities, Inc. | | | 61,817 | | | | (54,447 | ) | | | — | | | | 7,370 | |
| Nomura International PLC | | | 28,454 | | | | (28,339 | ) | | | — | | | | 115 | |
| Societe Generale | | | 23,955 | | | | (2,108 | ) | | | — | | | | 21,847 | |
| | | $ | 274,078 | | | $ | (138,756 | ) | | $ | — | | | $ | 135,322 | |
C. Purchases and Sales of Securities
During the six months ended June 30, 2014, purchases and sales of investment transactions (excluding short-term investments and U.S. Treasury obligations) aggregated $28,874,174 and $34,513,230, respectively. Purchases and sales of U.S. Treasury obligations aggregated $5,316,804 and $7,552,263, respectively.
For the six months ended June 30, 2014, transactions for written options on interest rate swap contracts were as follows:
| | | Contract Amount | | | Premiums | |
| Outstanding, beginning of period | | | 4,100,000 | | | $ | 248,407 | |
| Outstanding, end of period | | | 4,100,000 | | | $ | 248,407 | |
D. Related Parties
Management Agreement. Under the Investment Management Agreement with Deutsche Investment Management Americas Inc. ("DIMA" or the "Advisor"), an indirect, wholly owned subsidiary of Deutsche Bank AG, the Advisor directs the investments of the Fund in accordance with its investment objectives, policies and restrictions. The Advisor determines the securities, instruments and other contracts relating to investments to be purchased, sold or entered into by the Fund.
Pursuant to the Investment Management Agreement with the Advisor, the Fund pays a monthly management fee based on the Fund's average daily net assets, computed and accrued daily and payable monthly, at the following annual rates:
| First $250 million | | | .550 | % |
| Next $750 million | | | .520 | % |
| Next $1.5 billion | | | .500 | % |
| Next $2.5 billion | | | .480 | % |
| Next $2.5 billion | | | .450 | % |
| Next $2.5 billion | | | .430 | % |
| Next $2.5 billion | | | .410 | % |
| Over $12.5 billion | | | .390 | % |
Accordingly, for the six months ended June 30, 2014, the fee pursuant to the Investment Management Agreement was equivalent to an annualized effective rate (exclusive of any applicable waivers/reimbursements) of 0.55% of the Fund's average daily net assets.
For the period from January 1, 2014 through April 30, 2015, the Advisor has contractually agreed to waive its fee and/or reimburse certain operating expenses to the extent necessary to maintain the operating expenses (excluding certain expenses such as extraordinary expenses, taxes, brokerage and interest expense) at 0.76%.
For the six months ended June 30, 2014, fees waived and/or expenses reimbursed amounted to $87,682.
Administration Fee. Pursuant to an Administrative Services Agreement, DIMA provides most administrative services to the Fund. For all services provided under the Administrative Services Agreement, the Fund pays DIMA an annual fee ("Administration Fee") of 0.10% of the Fund's average daily net assets, computed and accrued daily and payable monthly. For the six months ended June 30, 2014, the Administration Fee was $29,353, of which $4,883 is unpaid.
Service Provider Fees. DeAWM Service Company ("DSC"), an affiliate of the Advisor, is the transfer agent, dividend-paying agent and shareholder service agent for the Fund. Pursuant to a sub-transfer agency agreement between DSC and DST Systems, Inc. ("DST"), DSC has delegated certain transfer agent, dividend-paying agent and shareholder service agent functions to DST. DSC compensates DST out of the shareholder servicing fee it receives from the Fund. For the six months ended June 30, 2014, the amounts charged to the Fund by DSC aggregated $77, of which $37 is unpaid.
Typesetting and Filing Service Fees. Under an agreement with DIMA, DIMA is compensated for providing typesetting and certain regulatory filing services to the Fund. For the six months ended June 30, 2014, the amount charged to the Fund by DIMA included in the Statement of Operations under "reports to shareholders" aggregated $9,235, of which $5,659 is unpaid.
Trustees' Fees and Expenses. The Fund paid retainer fees to each Trustee not affiliated with the Advisor, plus specified amounts to the Board Chairperson and Vice Chairperson and to each committee Chairperson.
Affiliated Cash Management Vehicles. The Fund may invest uninvested cash balances in Central Cash Management Fund and Deutsche Variable NAV Money Fund, affiliated money market funds which are managed by the Advisor. Each affiliated money market fund seeks to provide a high level of current income consistent with liquidity and the preservation of capital. Each affiliated money market fund is managed in accordance with Rule 2a-7 under the Investment Company Act of 1940, which governs the quality, maturity, diversity and liquidity of instruments in which a money market fund may invest. Central Cash Management Fund seeks to maintain a stable net asset value, and Deutsche Variable NAV Money Fund maintains a floating net asset value. The Fund indirectly bears its proportionate share of the expenses of each affiliated money market fund in which it invests. Central Cash Management Fund does not pay the Advisor an investment management fee. To the extent that Deutsche Variable NAV Money Fund pays an investment management fee to the Advisor, the Advisor will waive an amount of the investment management fee payable to the Advisor by the Fund equal to the amount of the investment management fee payable on the Fund's assets invested in Deutsche Variable NAV Money Fund.
Security Lending Fees. Deutsche Bank AG serves as securities lending agent for the Fund. For the six months ended June 30, 2014, the Fund incurred securities lending agent fees to Deutsche Bank AG in the amount of $179.
E. Investing in High-Yield Securities
The Fund's performance could be hurt if a security declines in credit quality or goes into default, or if an issuer does not make timely payments of interest or principal. Because the issuers of high-yield debt securities or junk bonds (debt securities rated below the fourth-highest category) may be in uncertain financial health, the risk of loss from default by the issuer is significantly greater. Prices and yields of high-yield securities will fluctuate over time and, during periods of economic uncertainty, volatility of high-yield securities may adversely affect a fund's net asset value. Because the Fund may invest in securities not paying current interest or in securities already in default, these risks may be more pronounced.
F. Investing in Emerging Markets
Investing in emerging markets may involve special risks and considerations not typically associated with investing in developed markets. These risks include revaluation of currencies, high rates of inflation or deflation, repatriation restrictions on income and capital, and future adverse political, social and economic developments. Moreover, securities issued in these markets may be less liquid, subject to government ownership controls or delayed settlements, and may have prices that are more volatile or less easily assessed than those of comparable securities of issuers in developed markets.
G. Ownership of the Fund
At June 30, 2014, two participating insurance companies were owners of record of 10% or more of the total outstanding Class A shares of the Fund, each owning 65% and 32%.
H. Line of Credit
The Fund and other affiliated funds (the "Participants") share in a $400 million revolving credit facility provided by a syndication of banks. The Fund may borrow for temporary or emergency purposes, including the meeting of redemption requests that otherwise might require the untimely disposition of securities. The Participants are charged an annual commitment fee which is allocated based on net assets, among each of the Participants. Interest is calculated at a rate per annum equal to the sum of the Federal Funds Rate plus 1.25 percent plus if LIBOR exceeds the Federal Funds Rate the amount of such excess. The Fund may borrow up to a maximum of 33 percent of its net assets under the agreement. The Fund had no outstanding loans at June 30, 2014.
I. Fund Name Change
Effective August 11, 2014, the "DWS Funds" were rebranded "Deutsche Funds."
Information About Your Fund's Expenses (Unaudited)
As an investor of the Fund, you incur two types of costs: ongoing expenses and transaction costs. Ongoing expenses include management fees and other Fund expenses. Examples of transaction costs include contract charges and account maintenance fees, which are not shown in this section. The following tables are intended to help you understand your ongoing expenses (in dollars) of investing in the Fund and to help you compare these expenses with the ongoing expenses of investing in other mutual funds. In the most recent six-month period, the Fund limited these expenses; had it not done so, expenses would have been higher. The example in the table is based on an investment of $1,000 invested at the beginning of the six-month period and held for the entire period (January 1, 2014 to June 30, 2014).
The tables illustrate your Fund's expenses in two ways:
—Actual Fund Return. This helps you estimate the actual dollar amount of ongoing expenses (but not transaction costs) paid on a $1,000 investment in the Fund using the Fund's actual return during the period. To estimate the expenses you paid over the period, simply divide your account value by $1,000 (for example, an $8,600 account value divided by $1,000 = 8.6), then multiply the result by the number in the "Expenses Paid per $1,000" line under the share class you hold.
—Hypothetical 5% Fund Return. This helps you to compare your Fund's ongoing expenses (but not transaction costs) with those of other mutual funds using the Fund's actual expense ratio and a hypothetical rate of return of 5% per year before expenses. Examples using a 5% hypothetical Fund return may be found in the shareholder reports of other mutual funds. The hypothetical account values and expenses may not be used to estimate the actual ending account balance or expenses you paid for the period.
Please note that the expenses shown in these tables are meant to highlight your ongoing expenses only and do not reflect any transaction costs. The "Expenses Paid per $1,000" line of the tables is useful in comparing ongoing expenses only and will not help you determine the relative total expense of owning different funds. If these transaction costs had been included, your costs would have been higher.
Expenses and Value of a $1,000 Investment for the six months ended June 30, 2014 | |
| Actual Fund Return | | Class A | |
| Beginning Account Value 1/1/14 | | $ | 1,000.00 | |
| Ending Account Value 6/30/14 | | $ | 1,048.70 | |
| Expenses Paid per $1,000* | | $ | 3.86 | |
| Hypothetical 5% Fund Return | | Class A | |
| Beginning Account Value 1/1/14 | | $ | 1,000.00 | |
| Ending Account Value 6/30/14 | | $ | 1,021.03 | |
| Expenses Paid per $1,000* | | $ | 3.81 | |
* Expenses are equal to the Fund's annualized expense ratio, multiplied by the average account value over the period, multiplied by 181 (the number of days in the most recent six-month period), then divided by 365.
| Annualized Expense Ratio | Class A | |
| Deutsche Variable Series II — Deutsche Unconstrained Income VIP | .76% | |
For more information, please refer to the Fund's prospectus.
These tables do not reflect charges and fees ("contract charges") associated with the separate account that invests in the Fund or any variable life insurance policy or variable annuity contract for which the Fund is an investment option.
For an analysis of the fees associated with an investment in the fund or similar funds, please refer to the current and hypothetical expense calculators for Variable Insurance Products which can be found at deutschefunds.com/EN/resources/calculators.jsp.
The Trust's policies and procedures for voting proxies for portfolio securities and information about how the Trust voted proxies related to its portfolio securities during the 12-month period ended June 30 are available on our Web site — deutschefunds.com (click on "proxy voting" at the bottom of the page) — or on the SEC's Web site — sec.gov. To obtain a written copy of the Trust's policies and procedures without charge, upon request, call us toll free at (800) 728-3337.
Advisory Agreement Board Considerations and Fee Evaluation
The Board of Trustees approved the renewal of DWS Unconstrained Income VIP's investment management agreement (the "Agreement") with Deutsche Investment Management Americas Inc. ("DIMA") in September 2013.
In terms of the process that the Board followed prior to approving the Agreement, shareholders should know that:
— In September 2013, all but one of the Fund's Trustees were independent of DIMA and its affiliates.
— The Trustees met frequently during the past year to discuss fund matters and dedicated a substantial amount of time to contract review matters. Over the course of several months, the Board's Contract Committee, in coordination with the Board's Fixed Income and Asset Allocation Oversight Committee, reviewed comprehensive materials received from DIMA, independent third parties and independent counsel. These materials included an analysis of the Fund's performance, fees and expenses, and profitability compiled by a fee consultant retained by the Fund's Independent Trustees (the "Fee Consultant"). The Board also received extensive information throughout the year regarding performance of the Fund.
— The Independent Trustees regularly meet privately with their independent counsel to discuss contract review and other matters. In addition, the Independent Trustees were also advised by the Fee Consultant in the course of their review of the Fund's contractual arrangements and considered a comprehensive report prepared by the Fee Consultant in connection with their deliberations.
— In connection with reviewing the Agreement, the Board also reviewed the terms of the Fund's distribution agreement, administrative services agreement, transfer agency agreement and other material service agreements.
— Based on its evaluation of the information provided, the Contract Committee presented its findings and recommendations to the Board. The Board then reviewed the Contract Committee's findings and recommendations.
In connection with the contract review process, the Contract Committee and the Board considered the factors discussed below, among others. The Board also considered that DIMA and its predecessors have managed the Fund since its inception, and the Board believes that a long-term relationship with a capable, conscientious advisor is in the best interests of the Fund. The Board considered, generally, that shareholders chose to invest or remain invested in the Fund knowing that DIMA managed the Fund, and that the Agreement was approved by the Fund's shareholders. DIMA is part of Deutsche Bank AG, a major global banking institution that is engaged in a wide range of financial services. The Board believes that there are advantages to being part of a global asset management business that offers a wide range of investing expertise and resources, including hundreds of portfolio managers and analysts with research capabilities in many countries throughout the world.
As part of the contract review process, the Board carefully considered the fees and expenses of each DWS fund overseen by the Board in light of the fund's performance. In many cases, this led to a negotiation with DIMA of lower expense caps as part of the 2012 and 2013 contract review processes than had previously been in place. As part of these negotiations, the Board indicated that it would consider relaxing these new lower caps in future years following sustained improvements in performance, among other considerations.
In June 2012, Deutsche Bank AG ("DB"), DIMA's parent company, announced that DB would combine its Asset Management (of which DIMA was a part) and Wealth Management divisions. DB has advised the Independent Trustees that the U.S. asset management business is a critical and integral part of DB, and that it has, and will continue to, reinvest a significant portion of the substantial savings it expects to realize by combining its Asset Management and Wealth Management divisions into the new Asset and Wealth Management ("AWM") division, including ongoing enhancements to its investment capabilities. DB also has confirmed its commitment to maintaining strong legal and compliance groups within the AWM division.
While shareholders may focus primarily on fund performance and fees, the Fund's Board considers these and many other factors, including the quality and integrity of DIMA's personnel and such other issues as back-office operations, fund valuations, and compliance policies and procedures.
Nature, Quality and Extent of Services. The Board considered the terms of the Agreement, including the scope of advisory services provided under the Agreement. The Board noted that, under the Agreement, DIMA provides portfolio management services to the Fund and that, pursuant to a separate administrative services agreement, DIMA provides administrative services to the Fund. The Board considered the experience and skills of senior management and investment personnel, the resources made available to such personnel, the ability of DIMA to attract and retain high-quality personnel, and the organizational depth and stability of DIMA. The Board reviewed the Fund's performance over short-term and long-term periods and compared those returns to various agreed-upon performance measures, including market indices and a peer universe compiled by the Fee Consultant using information supplied by Morningstar Direct ("Morningstar"), an independent fund data service. The Board also noted that it has put into place a process of identifying "Focus Funds" (e.g., funds performing poorly relative to their benchmark or a peer universe compiled by an independent fund data service), and receives more frequent reporting and information from DIMA regarding such funds, along with DIMA's remedial plans to address underperformance. The Board believes this process is an effective manner of identifying and addressing underperforming funds. Based on the information provided, the Board noted that for the one-, three- and five-year periods ended December 31, 2012, the Fund's performance (Class A shares) was in the 2nd quartile, 2nd quartile and 1st quartile, respectively, of the applicable Morningstar universe (the 1st quartile being the best performers and the 4th quartile being the worst performers). The Board also observed that the Fund has outperformed its benchmark in the one-, three- and five-year periods ended December 31, 2012.
Fees and Expenses. The Board considered the Fund's investment management fee schedule, operating expenses and total expense ratios, and comparative information provided by Lipper Inc. ("Lipper") and the Fee Consultant regarding investment management fee rates paid to other investment advisors by similar funds (1st quartile being the most favorable and 4th quartile being the least favorable). With respect to management fees paid to other investment advisors by similar funds, the Board noted that the contractual fee rates paid by the Fund, which include a 0.10% fee paid to DIMA under the Fund's administrative services agreement, were equal to the median of the applicable Lipper peer group (based on Lipper data provided as of December 31, 2012). The Board noted that the Fund's Class A shares total (net) operating expenses were expected to be higher than the median (3rd quartile) of the applicable Lipper expense universe (based on Lipper data provided as of December 31, 2012, and analyzing Lipper expense universe Class A (net) expenses less any applicable 12b-1 fees) ("Lipper Universe Expenses"). The Board considered the Fund's management fee rate as compared to fees charged by DIMA to comparable funds and considered differences between the Fund and the comparable funds. The Board also considered how the Fund's total (net) operating expenses compared to the total (net) operating expenses of a more customized peer group selected by Lipper (based on such factors as asset size). The Board also noted that the expense limitation agreed to by DIMA helped to ensure that the Fund's total (net) operating expenses would remain competitive.
The information considered by the Board as part of its review of management fees included information regarding fees charged by DIMA and its affiliates to similar institutional accounts and to similar funds offered primarily to European investors ("DWS Europe funds"), in each case as applicable. The Board observed that advisory fee rates for institutional accounts generally were lower than the management fees charged by similarly managed DWS U.S. mutual funds ("DWS Funds"), but also took note of the differences in services provided to DWS Funds as compared to institutional accounts. In the case of DWS Europe funds, the Board observed that fee rates for DWS Europe funds generally were higher than for similarly managed DWS Funds, but noted that differences in the types of services provided to DWS Funds relative to DWS Europe funds made it difficult to compare such fees.
On the basis of the information provided, the Board concluded that management fees were reasonable and appropriate in light of the nature, quality and extent of services provided by DIMA.
Profitability. The Board reviewed detailed information regarding revenues received by DIMA under the Agreement. The Board considered the estimated costs and pre-tax profits realized by DIMA from advising the DWS Funds, as well as estimates of the pre-tax profits attributable to managing the Fund in particular. The Board also received information regarding the estimated enterprise-wide profitability of DWS and its affiliates with respect to all fund services in totality and by fund. The Board and the Fee Consultant reviewed DIMA's methodology in allocating its costs to the management of the Fund. Based on the information provided, the Board concluded that the pre-tax profits realized by DIMA in connection with the management of the Fund were not unreasonable. The Board also reviewed information regarding the profitability of certain similar investment management firms. The Board noted that while information regarding the profitability of such firms is limited (and in some cases is not necessarily prepared on a comparable basis), DIMA and its affiliates' overall profitability with respect to the DWS fund complex (after taking into account distribution and other services provided to the funds by DIMA and its affiliates) was lower than the overall profitability levels of many comparable firms for which such data was available.
Economies of Scale. The Board considered whether there are economies of scale with respect to the management of the Fund and whether the Fund benefits from any economies of scale. The Board noted that the Fund's management fee schedule includes fee breakpoints. The Board concluded that the Fund's fee schedule represents an appropriate sharing between the Fund and DIMA of such economies of scale as may exist in the management of the Fund at current asset levels.
Other Benefits to DIMA and Its Affiliates. The Board also considered the character and amount of other incidental benefits received by DIMA and its affiliates, including any fees received by DIMA for administrative services provided to the Fund and any fees received by an affiliate of DIMA for distribution services. The Board also considered benefits to DIMA related to brokerage and soft-dollar allocations, including allocating brokerage to pay for research generated by parties other than the executing broker dealers, which pertain primarily to funds investing in equity securities, along with the incidental public relations benefits to DIMA related to DWS Funds advertising and cross-selling opportunities among DIMA products and services. The Board concluded that management fees were reasonable in light of these fallout benefits.
Compliance. The Board considered the significant attention and resources dedicated by DIMA to documenting and enhancing its compliance processes in recent years. The Board noted in particular (i) the experience and seniority of both DIMA's chief compliance officer and the Fund's chief compliance officer; (ii) the large number of DIMA compliance personnel; and (iii) the substantial commitment of resources by DIMA and its affiliates to compliance matters.
Based on all of the information considered and the conclusions reached, the Board unanimously determined that the continuation of the Agreement is in the best interests of the Fund. In making this determination, the Board did not give particular weight to any single factor identified above. The Board considered these factors over the course of numerous meetings, certain of which were in executive session with only the Independent Trustees and their independent counsel present. It is possible that individual Trustees may have weighed these factors differently in reaching their individual decisions to approve the continuation of the Agreement.
DeAWM Distributors, Inc.
222 South Riverside Plaza
Chicago, IL 60606
(800) 621-1148
VS2UI-3 (R-028389-3 8/14)