WASHINGTON, D. C. 20549
JUNE 30, 2011
SEMIANNUAL REPORT
DWS VARIABLE SERIES II
DWS Alternative Asset Allocation Plus VIP
Contents
3 Performance Summary 4 Information About Your Fund's Expenses 5 Portfolio Summary 6 Investment Portfolio 7 Statement of Assets and Liabilities 7 Statement of Operations 8 Statement of Changes in Net Assets 9 Financial Highlights 12 Notes to Financial Statements 14 Proxy Voting 16 Summary of Management Fee Evaluation by Independent Fee Consultant |
This report must be preceded or accompanied by a prospectus. To obtain an additional prospectus or summary prospectus, if available, call (800) 728-3337 or your financial representative. We advise you to consider the Fund's objectives, risks, charges and expenses carefully before investing. The summary prospectus and prospectus contain this and other important information about the Fund. Please read the prospectus carefully before you invest.
Although allocation among different asset categories generally limits risk, Fund management may favor an asset category that underperforms other assets or markets as a whole. The Fund expects to invest in underlying funds that emphasize alternatives or non-traditional asset categories or investment strategies, and as a result, it is subject to the risk factors of those underlying funds. Some of those risks include stock market risk, credit and interest rate risk, volatility in commodity prices and high-yield debt securities, short sales risk and the political, general economic, liquidity and currency risks of foreign investments, which may be particularly significant for emerging markets. The Fund may use derivatives, including as part of its Global Tactical Asset Allocation (GTAA) strategy. The Fund also expects to have direct and indirect exposure to derivatives, which may be more volatile and less liquid than traditional securities. The Fund could suffer losses on its derivative positions. See the prospectus for additional risks and specific details regarding the Fund's risk profile.
DWS Investments is part of Deutsche Bank's Asset Management division and, within the US, represents the retail asset management activities of Deutsche Bank AG, Deutsche Bank Trust Company Americas, Deutsche Investment Management Americas Inc. and DWS Trust Company.
NOT FDIC/NCUA INSURED NO BANK GUARANTEE MAY LOSE VALUE NOT A DEPOSIT
NOT INSURED BY ANY FEDERAL GOVERNMENT AGENCY
Performance Summary June 30, 2011
Fund performance shown is historical, assumes reinvestment of all dividend and capital gain distributions and does not guarantee future results. Investment return and principal value fluctuate with changing market conditions so that, when redeemed, shares may be worth more or less than their original cost. Current performance may be lower or higher than the performance data quoted. Please contact your participating insurance company for the Fund's most recent month-end performance. Performance doesn't reflect charges and fees ("contract charges") associated with the separate account that invests in the Fund or any variable life insurance policy or variable annuity contract for which the Fund is an investment option. These charges and fees will reduce returns. While all share classes have the same underlying portfolio, their performance will differ.
The gross expense ratios of the Fund, as stated in the fee table of the prospectus dated May 1, 2011 are 2.33% and 2.58% for Class A and Class B shares, respectively, and may differ from the expense ratios disclosed in the Financial Highlights tables in this report. These expense ratios include net expenses of the underlying fund in which the Fund invests.
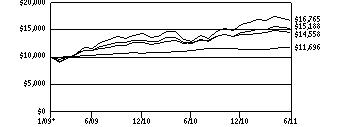
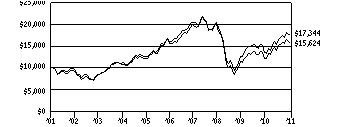
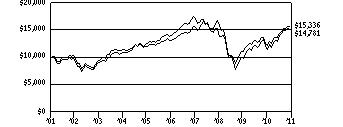
| Growth of an Assumed $10,000 Investment in DWS Alternative Asset Allocation Plus VIP from 2/2/09 to 6/30/11 |
[] DWS Asset Allocation Plus VIP — Class A [] MSCI World Index [] Barclays Capital US Aggregate Bond Index [] Blended Index | The Morgan Stanley Capital International (MSCI) World Index is an unmanaged, capitalization-weighted measure of global stock markets including the US, Canada, Europe, Australia and the Far East. The index is calculated using closing local market prices and translates into US dollars using the London close foreign exchange rates. The Barclays Capital US Aggregate Bond Index is an unmanaged, market-value-weighted measure of Treasury issues, agency issues, corporate bond issues and mortgage securities. The Blended Index is calculated using the performance of two unmanaged indices, representative of stocks (the Morgan Stanley Capital International (MSCI) World Index (70%)) and bonds (the Barclays Capital US Aggregate Bond Index (30%)). These results are summed to produce the aggregate benchmark. Index returns do not reflect any fees or expenses and it is not possible to invest directly into an index. |
| |
| | |
* The Fund commenced offering Class A shares on February 2, 2009. Index returns began on January 31, 2009.
| Comparative Results | |
| DWS Alternative Asset Allocation Plus VIP | | 6-Month‡ | | | 1-Year | | | Life of Fund* | |
| Class A | Growth of $10,000 | | $ | 10,249 | | | $ | 11,568 | | | $ | 14,558 | |
| Average annual total return | | | 2.49 | % | | | 15.68 | % | | | 16.85 | % |
| MSCI World Index | Growth of $10,000 | | $ | 10,529 | | | $ | 13,051 | | | $ | 16,765 | |
| Average annual total return | | | 5.29 | % | | | 30.51 | % | | | 23.84 | % |
| Barclays Capital US Aggregate Bond Index | Growth of $10,000 | | $ | 10,272 | | | $ | 10,390 | | | $ | 11,696 | |
| Average annual total return | | | 2.72 | % | | | 3.90 | % | | | 6.70 | % |
| Blended Index | Growth of $10,000 | | $ | 10,455 | | | $ | 12,222 | | | $ | 15,188 | |
| Average annual total return | | | 4.55 | % | | | 22.22 | % | | | 18.19 | % |
| DWS Alternative Asset Allocation Plus VIP | | 6-Month‡ | | | 1-Year | | | Life of Class** | |
| Class B | Growth of $10,000 | | $ | 10,230 | | | $ | 11,530 | | | $ | 13,310 | |
| Average annual total return | | | 2.30 | % | | | 15.30 | % | | | 14.46 | % |
| MSCI World Index | Growth of $10,000 | | $ | 10,529 | | | $ | 13,051 | | | $ | 14,318 | |
| Average annual total return | | | 5.29 | % | | | 30.51 | % | | | 18.80 | % |
| Barclays Capital US Aggregate Bond Index | Growth of $10,000 | | $ | 10,272 | | | $ | 10,390 | | | $ | 11,442 | |
| Average annual total return | | | 2.72 | % | | | 3.90 | % | | | 6.68 | % |
| Blended Index | Growth of $10,000 | | $ | 10,455 | | | $ | 12,222 | | | $ | 13,467 | |
| Average annual total return | | | 4.55 | % | | | 22.22 | % | | | 14.72 | % |
The growth of $10,000 is cumulative.
‡ Total returns shown for periods less than one year are not annualized.
* The Fund commenced offering Class A shares on February 2, 2009. Index returns began on January 31, 2009.
** The Fund commenced offering Class B shares on May 18, 2009. Index returns began on May 31, 2009.
Information About Your Fund's Expenses
As an investor of the Fund, you incur two types of costs: ongoing expenses and transaction costs. Ongoing expenses include management fees, distribution and service (12b-1) fees and other Fund expenses. Examples of transaction costs include contract charges and account maintenance fees, which are not shown in this section. The following tables are intended to help you understand your ongoing expenses (in dollars) of investing in the Fund and to help you compare these expenses with the ongoing expenses of investing in other mutual funds. In addition to the ongoing expenses which the Fund bears directly, the Fund's shareholders indirectly bear the expense of the Underlying Funds in which the Fund invests. These expenses are not included in the Fund's annualized expense ratios used to calculate the expense estimate in the tables. In the most recent six-month period, the Fund limited the ongoing expenses the Fund bears directly; had it not done so, expenses would have been higher. The examples in the table are based on an investment of $1,000 invested at the beginning of the six-month period and held for the entire period (January 1, 2011 to June 30, 2011).
The tables illustrate your Fund's expenses in two ways:
•Actual Fund Return. This helps you estimate the actual dollar amount of ongoing expenses (but not transaction costs) paid on a $1,000 investment in the Fund using the Fund's actual return during the period. To estimate the expenses you paid over the period, simply divide your account value by $1,000 (for example, an $8,600 account value divided by $1,000 = 8.6), then multiply the result by the number in the "Expenses Paid per $1,000" line under the share class you hold.
• Hypothetical 5% Fund Return. This helps you to compare your Fund's ongoing expenses (but not transaction costs) with those of other mutual funds using the Fund's actual expense ratio and a hypothetical rate of return of 5% per year before expenses. Examples using a 5% hypothetical Fund return may be found in the shareholder reports of other mutual funds. The hypothetical account values and expenses may not be used to estimate the actual ending account balance or expenses you paid for the period.
Please note that the expenses shown in these tables are meant to highlight your ongoing expenses only and do not reflect any transaction costs. The "Expenses Paid per $1,000" line of the tables is useful in comparing ongoing expenses only and will not help you determine the relative total expense of owning different funds. If these transaction costs had been included, your costs would have been higher.
Expenses and Value of a $1,000 Investment for the six months ended June 30, 2011 | |
| Actual Fund Return | | Class A | | | Class B | |
| Beginning Account Value 1/1/11 | | $ | 1,000.00 | | | $ | 1,000.00 | |
| Ending Account Value 6/30/11 | | $ | 1,024.90 | | | $ | 1,023.00 | |
| Expenses Paid per $1,000* | | $ | 1.31 | | | $ | 2.56 | |
| Hypothetical 5% Fund Return | | Class A | | | Class B | |
| Beginning Account Value 1/1/11 | | $ | 1,000.00 | | | $ | 1,000.00 | |
| Ending Account Value 6/30/11 | | $ | 1,023.51 | | | $ | 1,022.07 | |
| Expenses Paid per $1,000* | | $ | 1.30 | | | $ | 2.56 | |
* Expenses are equal to the Fund's annualized expense ratio for each share class, multiplied by the average account value over the period, multiplied by the number of days in the most recent six-month period, then divided by 365.
Annualized Expense Ratios** | Class A | Class B |
| DWS Variable Series II — DWS Alternative Asset Allocation Plus VIP | .26% | .51% |
** The Fund invests in other funds and indirectly bears its proportionate share of fees and expenses incurred by the Underlying Funds in which the Fund is invested. These ratios do not include these indirect fees and expenses.
For more information, please refer to the Fund's prospectus.
These tables do not reflect charges and fees ("contract charges") associated with the separate account that invests in the Fund or any variable life insurance policy or variable annuity contract for which the Fund is an investment option.
Asset Allocation (As a % of Investment Portfolio) | 6/30/11 | 12/31/10 |
| Emerging Markets | | DWS Emerging Markets Equity Fund DWS Enhanced Emerging Market Fixed Income Fund WisdomTree Emerging Markets Local Debt Fund | | 19% | 18% |
| Market Neutral | | DWS Disciplined Market Neutral Fund | | 15% | 18% |
| Commodities | | DWS Enhanced Commodity Strategy Fund | | 14% | 13% |
| Global Real Estate | | DWS RREEF Global Real Estate Securities Fund | | 14% | 14% |
| Treasury Inflation Protected Securities | | DWS Global Inflation Plus Fund | | 12% | 14% |
| Floating Rate Notes | | DWS Floating Rate Plus Fund | | 10% | 5% |
| Global Infrastructure | | DWS RREEF Global Infrastructure Fund | | 7% | 5% |
| International Small Cap | | iShares MSCI EAFE Small Cap Index ETF Vanguard FTSE All World ex-US Small-Cap Fund | | 3% | 2% |
| Money Market Fund | | Central Cash Management Fund | | 2% | 4% |
| Gold | | DWS Gold & Precious Metals Fund | | 2% | 5% |
| International Treasury Bond | | SPDR Barclays Capital International Treasury Bond | | 2% | 2% |
| | | | | 100% | 100% |
Asset allocation is subject to change.
For more complete details about the Fund's investment portfolio, see page 6.
Following the Fund's fiscal first and third quarter-end, a complete portfolio holdings listing is filed with the SEC on Form N-Q. The form will be available on the SEC's Web site at www.sec.gov, and it also may be reviewed and copied at the SEC's Public Reference Room in Washington, D.C. Information on the operation of the SEC's Public Reference Room may be obtained by calling (800) SEC-0330. The Fund's portfolio holdings are also posted on www.dws-investments.com from time to time. Please see the Fund's current prospectus for more information.
Investment Portfolio June 30, 2011 (Unaudited) | | | Shares | | | Value ($) | |
| | | | |
| Mutual Funds 92.0% | |
| DWS Disciplined Market Neutral Fund "Institutional" | | | 622,411 | | | | 6,031,161 | |
| DWS Emerging Markets Equity Fund "Institutional" | | | 215,525 | | | | 4,049,715 | |
| DWS Enhanced Commodity Strategy Fund "Institutional"* | | | 1,339,263 | | | | 5,999,899 | |
| DWS Enhanced Emerging Markets Fixed Income Fund "Institutional" | | | 300,546 | | | | 3,224,854 | |
| DWS Floating Rate Plus Fund "Institutional" | | | 427,895 | | | | 4,013,654 | |
| DWS Global Inflation Plus Fund "Institutional" | | | 449,784 | | | | 4,808,186 | |
| DWS Gold & Precious Metals Fund "Institutional" | | | 38,712 | | | | 807,155 | |
| DWS RREEF Global Infrastructure Fund "Institutional" | | | 269,056 | | | | 2,825,092 | |
| DWS RREEF Global Real Estate Securities Fund "Institutional" | | | 712,630 | | | | 5,658,282 | |
Total Mutual Funds (Cost $35,156,595) | | | | 37,417,998 | |
| | |
| | | Shares | | | Value ($) | |
| | | | | | | | | |
| Exchange-Traded Funds 6.9% | |
| iShares MSCI EAFE Small Cap Index Fund | | | 9,056 | | | | 395,113 | |
| SPDR Barclays Capital International Treasury Bond | | | 12,687 | | | | 783,676 | |
| Vanguard FTSE All World ex-US Small-Cap Fund | | | 6,823 | | | | 700,927 | |
| WisdomTree Emerging Markets Local Debt Fund | | | 14,745 | | | | 789,152 | |
| WisdomTree Emerging Markets SmallCap Dividend Fund | | | 2,319 | | | | 121,818 | |
Total Exchange-Traded Funds (Cost $2,605,238) | | | | 2,790,686 | |
| | |
| Cash Equivalents 2.4% | |
| Central Cash Management Fund (Cost $966,074) | | | 966,074 | | | | 966,074 | |
| | | % of Net Assets | | | Value ($) | |
| | | | |
Total Investment Portfolio (Cost $38,727,907)+ | | | 101.3 | | | | 41,174,758 | |
| Other Assets and Liabilities, Net | | | (1.3 | ) | | | (503,554 | ) |
| Net Assets | | | 100.0 | | | | 40,671,204 | |
* Non-income producing security.
+ The cost for federal income tax purposes was $38,745,386. At June 30, 2011, net unrealized appreciation for all securities based on tax cost was $2,429,372. This consisted of aggregate gross unrealized appreciation for all securities in which there was an excess of value over tax cost of $2,446,851 and aggregate gross unrealized depreciation for all securities in which there was an excess of tax cost over value of $17,479.
EAFE: Europe, Australasia and Far East
FTSE: Financial Times and the London Stock Exchange
MSCI: Morgan Stanley Capital International
SPDR: Standard & Poor's Depositary Receipt
Fair Value Measurements
Various inputs are used in determining the value of the Fund's investments. These inputs are summarized in three broad levels. Level 1 includes quoted prices in active markets for identical securities. Level 2 includes other significant observable inputs (including quoted prices for similar securities, interest rates, prepayment speeds, and credit risk). Level 3 includes significant unobservable inputs (including the Fund's own assumptions in determining the fair value of investments). The inputs or methodology used for valuing securities are not necessarily an indication of the risk associated with investing in those securities.
The following is a summary of the inputs used as of June 30, 2011 in valuing the Fund's investments. For information on the Fund's policy regarding the valuation of investments, please refer to the Security Valuation section of Note A in the accompanying Notes to Financial Statements.
| Assets | | Level 1 | | | Level 2 | | | Level 3 | | | Total | |
| | |
| Mutual Funds | | $ | 37,417,998 | | | $ | — | | | $ | — | | | $ | 37,417,998 | |
| Exchange-Traded Funds | | | 2,790,686 | | | | — | | | | — | | | | 2,790,686 | |
| Short-Term Investments | | | 966,074 | | | | — | | | | — | | | | 966,074 | |
| Total | | $ | 41,174,758 | | | $ | — | | | $ | — | | | $ | 41,174,758 | |
There have been no transfers between Level 1 and Level 2 fair value measurements during the period ended June 30, 2011.
The accompanying notes are an integral part of the financial statements.
Statement of Assets and Liabilities | as of June 30, 2011 (Unaudited) | |
| Assets | |
Investments: Investments in affiliated Underlying Funds, at value (cost $36,122,669) | | $ | 38,384,072 | |
| Investments in non-affiliated Underlying Funds, at value (cost $2,605,238) | | | 2,790,686 | |
| Total investments in securities, at value (cost $38,727,907) | | | 41,174,758 | |
| Receivable for investments sold | | | 210,000 | |
| Receivable for Fund shares sold | | | 92,894 | |
| Due from Advisor | | | 652 | |
| Other assets | | | 322 | |
| Total assets | | | 41,478,626 | |
| Liabilities | |
| Payable for investments purchased | | | 775,263 | |
| Payable for Fund shares redeemed | | | 37 | |
| Accrued expenses and other liabilities | | | 32,122 | |
| Total liabilities | | | 807,422 | |
| Net assets, at value | | $ | 40,671,204 | |
| Net Assets Consist of | |
| Undistributed net investment income | | | 108,161 | |
| Net unrealized appreciation (depreciation) on investments | | | 2,446,851 | |
| Accumulated net realized gain (loss) | | | (121,219 | ) |
| Paid-in capital | | | 38,237,411 | |
| Net assets, at value | | $ | 40,671,204 | |
Class A Net Asset Value, offering and redemption price per share ($7,523,616 ÷ 538,678 outstanding shares of beneficial interest, no par value, unlimited number of shares authorized) | | $ | 13.97 | |
Class B Net Asset Value, offering and redemption price per share ($33,147,588 ÷ 2,372,343 outstanding shares of beneficial interest, no par value, unlimited number of shares authorized) | | $ | 13.97 | |
The accompanying notes are an integral part of the financial statements.
Statement of Operations
| for the six months ended June 30, 2011 (Unaudited) | |
| Investment Income | |
Income: Income distributions from affiliated Underlying Funds | | $ | 182,452 | |
| Dividends | | | 17,563 | |
| Income distributions — Central Cash Management Fund | | | 526 | |
| Total income | | | 200,541 | |
Expenses: Management fee | | | 45,062 | |
| Administration fee | | | 17,428 | |
| Services to shareholders | | | 549 | |
| Distribution service fee (Class B) | | | 35,684 | |
| Custodian fee | | | 3,830 | |
| Audit and tax fees | | | 20,634 | |
| Legal fees | | | 6,851 | |
| Reports to shareholders | | | 12,440 | |
| Trustees' fees and expenses | | | 2,138 | |
| Other | | | 502 | |
| Total expenses before expense reductions | | | 145,118 | |
| Expense reductions | | | (63,828 | ) |
| Total expenses after expense reductions | | | 81,290 | |
| Net investment income (loss) | | | 119,251 | |
| Realized and Unrealized Gain (Loss) | |
Net realized gain (loss) from: Sale of affiliated Underlying Funds | | | (98,145 | ) |
| Change in net unrealized appreciation (depreciation) on investments | | | 850,428 | |
| Net gain (loss) | | | 752,283 | |
| Net increase (decrease) in net assets resulting from operations | | $ | 871,534 | |
The accompanying notes are an integral part of the financial statements.
Statement of Changes in Net Assets | Increase (Decrease) in Net Assets | | Six Months Ended June 30, 2011 (Unaudited) | | | Year Ended December 31, 2010 | |
Operations: Net investment income | | $ | 119,251 | | | $ | 432,715 | |
| Net realized gain (loss) | | | (98,145 | ) | | | 94,561 | |
| Change in net unrealized appreciation (depreciation) | | | 850,428 | | | | 1,382,244 | |
| Net increase (decrease) in net assets resulting from operations | | | 871,534 | | | | 1,909,520 | |
Distributions to shareholders from: Net investment income: Class A | | | (92,242 | ) | | | (29,328 | ) |
| Class B | | | (344,882 | ) | | | (74,563 | ) |
Net realized gains: Class A | | | (18,623 | ) | | | (23,912 | ) |
| Class B | | | (86,109 | ) | | | (82,873 | ) |
| Total distributions | | | (541,856 | ) | | | (210,676 | ) |
Fund share transactions: Class A Proceeds from shares sold | | | 2,796,002 | | | | 3,888,928 | |
| Reinvestment of distributions | | | 110,865 | | | | 53,240 | |
| Payments for shares redeemed | | | (456,780 | ) | | | (529,532 | ) |
| Net increase (decrease) in net assets from Class A share transactions | | | 2,450,087 | | | | 3,412,636 | |
Class B Proceeds from shares sold | | | 12,749,430 | | | | 19,061,697 | |
| Reinvestment of distributions | | | 430,991 | | | | 157,436 | |
| Payments for shares redeemed | | | (3,230,983 | ) | | | (1,070,014 | ) |
| Net increase (decrease) in net assets from Class B share transactions | | | 9,949,438 | | | | 18,149,119 | |
| Increase (decrease) in net assets | | | 12,729,203 | | | | 23,260,599 | |
| Net assets at beginning of period | | | 27,942,001 | | | | 4,681,402 | |
| Net assets at end of period (including undistributed net investment income of $108,161 and $426,034, respectively) | | $ | 40,671,204 | | | $ | 27,942,001 | |
| Other Information | |
Class A Shares outstanding at beginning of period | | | 362,411 | | | | 101,099 | |
| Shares sold | | | 201,461 | | | | 298,581 | |
| Shares issued to shareholders in reinvestment of distributions | | | 7,775 | | | | 4,172 | |
| Shares redeemed | | | (32,969 | ) | | | (41,441 | ) |
| Net increase (decrease) in Class A shares | | | 176,267 | | | | 261,312 | |
| Shares outstanding at end of period | | | 538,678 | | | | 362,411 | |
Class B Shares outstanding at beginning of period | | | 1,656,043 | | | | 270,064 | |
| Shares sold | | | 914,365 | | | | 1,454,814 | |
| Shares issued to shareholders in reinvestment of distributions | | | 30,202 | | | | 12,329 | |
| Shares redeemed | | | (228,267 | ) | | | (81,164 | ) |
| Net increase (decrease) in Class B shares | | | 716,300 | | | | 1,385,979 | |
| Shares outstanding at end of period | | | 2,372,343 | | | | 1,656,043 | |
The accompanying notes are an integral part of the financial statements.
Financial Highlights
| Class A | | Six Months Ended 6/30/11 (Unaudited) | | | Year Ended 12/31/10 | | | Period Ended 12/31/09a | |
| Selected Per Share Data | |
| Net asset value, beginning of period | | $ | 13.85 | | | $ | 12.63 | | | $ | 10.00 | |
Income (loss) from investment operations: Net investment incomeb | | | .06 | | | | .46 | | | | .57 | |
| Net realized and unrealized gain (loss) | | | .29 | | | | 1.09 | | | | 2.06 | |
| Total from investment operations | | | .35 | | | | 1.55 | | | | 2.63 | |
Less distributions from: Net investment income | | | (.19 | ) | | | (.18 | ) | | | — | |
| Net realized gains | | | (.04 | ) | | | (.15 | ) | | | — | |
| Total distributions | | | (.23 | ) | | | (.33 | ) | | | — | |
| Net asset value, end of period | | $ | 13.97 | | | $ | 13.85 | | | $ | 12.63 | |
Total Return (%)c,d | | | 2.49 | ** | | | 12.46 | | | | 26.30 | ** |
| Ratios to Average Net Assets and Supplemental Data | |
| Net assets, end of period ($ millions) | | | 8 | | | | 5 | | | | 1 | |
Ratio of expenses before expense reductions (%)e | | | .63 | * | | | .94 | | | | 11.67 | * |
Ratio of expenses after expense reductions (%)e | | | .26 | * | | | .21 | | | | .21 | * |
| Ratio of net investment income (%) | | | .89 | * | | | 3.51 | | | | 5.39 | * |
| Portfolio turnover rate (%) | | | 19 | ** | | | 6 | | | | 155 | ** |
a For the period from February 2, 2009 (commencement of operations of Class A shares) to December 31, 2009. b Based on average shares outstanding during the period. c Total return would have been lower had certain expenses not been reduced. d Total return would have been lower if the Advisor had not reduced some affiliated Underlying Funds' expenses. e The Fund invests in other Funds and indirectly bears its proportionate share of fees and expenses incurred by the affiliated Underlying Funds and non-affiliated funds in which the Fund is invested. This ratio does not include these indirect fees and expenses. * Annualized ** Not annualized | |
| Class B | | Six Months Ended 6/30/11 (Unaudited) | | | Year Ended 12/31/10 | | | Period Ended 12/31/09a | |
| Selected Per Share Data | |
| Net asset value, beginning of period | | $ | 13.84 | | | $ | 12.61 | | | $ | 10.87 | |
Income (loss) from investment operations: Net investment incomeb | | | .04 | | | | .42 | | | | .35 | |
| Net realized and unrealized gain (loss) | | | .28 | | | | 1.09 | | | | 1.39 | |
| Total from investment operations | | | .32 | | | | 1.51 | | | | 1.74 | |
Less distributions from: Net investment income | | | (.15 | ) | | | (.13 | ) | | | — | |
| Net realized gains | | | (.04 | ) | | | (.15 | ) | | | — | |
| Total distributions | | | (.19 | ) | | | (.28 | ) | | | — | |
| Net asset value, end of period | | $ | 13.97 | | | $ | 13.84 | | | $ | 12.61 | |
Total Return (%)c,d | | | 2.30 | ** | | | 12.15 | | | | 16.01 | ** |
| Ratios to Average Net Assets and Supplemental Data | |
| Net assets, end of period ($ millions) | | | 33 | | | | 23 | | | | 3 | |
Ratio of expenses before expense reductions (%)e | | | .88 | * | | | 1.19 | | | | 5.37 | * |
Ratio of expenses after expense reductions (%)e | | | .51 | * | | | .46 | | | | .61 | * |
| Ratio of net investment income (%) | | | .64 | * | | | 3.26 | | | | 4.66 | * |
| Portfolio turnover rate (%) | | | 19 | ** | | | 6 | | | | 155 | ** |
a For the period from May 18, 2009 (commencement of operations of Class B shares) to December 31, 2009. b Based on average shares outstanding during the period. c Total return would have been lower had certain expenses not been reduced. d Total return would have been lower if the Advisor had not reduced some affiliated Underlying Funds' expenses. e The Fund invests in other Funds and indirectly bears its proportionate share of fees and expenses incurred by the affiliated Underlying Funds and non-affiliated funds in which the Fund is invested. This ratio does not include these indirect fees and expenses. * Annualized ** Not annualized | |
Notes to Financial Statements (Unaudited)
A. Organization and Significant Accounting Policies
DWS Alternative Asset Allocation Plus VIP (the "Fund") is a diversified series of DWS Variable Series II (the "Trust"), which is registered under the Investment Company Act of 1940, as amended (the "1940 Act"), as an open-end management investment company organized as a Massachusetts business trust. The Fund mainly invests in other affiliated DWS funds (the "Underlying DWS Funds"), derivative investments and exchange-traded funds ("ETFs"). ETFs and Underlying DWS Funds are collectively referred to as "Underlying Funds." Each Underlying DWS Fund's accounting policies and investment holdings are outlined in the Underlying DWS Funds' financial statements and are available upon request.
Multiple Classes of Shares of Beneficial Interest. The Fund offers two classes of shares (Class A shares and Class B shares). Sales of Class B shares are subject to Rule 12b-1 fees under the 1940 Act equal to an annual rate of 0.25% of the average daily net assets of the Class B shares of the Fund. Class A shares are not subject to such fees.
Investment income, realized and unrealized gains and losses, and certain fund-level expenses and expense reductions, if any, are borne pro rata on the basis of relative net assets by the holders of all classes of shares except that each class bears certain expenses unique to that class (including the applicable Rule 12b-1 fee). Differences in class-level expenses may result in payment of different per share dividends by class. All shares have equal rights with respect to voting subject to class-specific arrangements.
The Fund's financial statements are prepared in accordance with accounting principles generally accepted in the United States of America which require the use of management estimates. Actual results could differ from those estimates. The policies described below are followed consistently by the Fund in the preparation of its financial statements.
Security Valuation. Investments are stated at value determined as of the close of regular trading on the New York Stock Exchange on each day the exchange is open for trading.
Various inputs are used in determining the value of the Fund's investments. These inputs are summarized in three broad levels. Level 1 includes quoted prices in active markets for identical securities. Level 2 includes other significant observable inputs (including quoted prices for similar securities, interest rates, prepayment speeds, and credit risk). Level 3 includes significant unobservable inputs (including the Fund's own assumptions in determining the fair value of investments). The inputs or methodology used for valuing securities are not necessarily an indication of the risk associated with investing in those securities.
Investments in the Underlying Funds are valued at the net asset value per share of each class of the Underlying Funds and are categorized as Level 1.
ETFs are valued at the most recent sale price or official closing price reported on the exchange (US or foreign) or over-the-counter market on which they trade and are categorized as Level 1 securities. ETFs for which no sales are reported are valued at the calculated mean between the most recent bid and asked quotations on the relevant market or, if a mean cannot be determined, at the most recent bid quotation.
Disclosure about the classification of fair value measurements is included in a table following the Fund's Investment Portfolio.
Federal Income Taxes. The Fund's policy is to comply with the requirements of the Internal Revenue Code, as amended, which are applicable to regulated investment companies and to distribute all of its taxable income to its shareholders.
On December 22, 2010, the Regulated Investment Company Modernization Act of 2010 (the "Act") was enacted. Under the Act, net capital losses may be carried forward indefinitely, and their character is retained as short-term and/or long-term losses. Previously, net capital losses were carried forward for eight years and treated as short-term losses. As a transition rule, the Act requires that post-enactment net capital losses be used before pre-enactment net capital losses. As a result of this ordering rule, pre-enactment capital loss carryforwards may expire unused, whereas under the previous rules these losses may have been utilized. This change is effective for fiscal years beginning after the date of enactment.
The Fund has reviewed the tax positions for the open tax years as of December 31, 2010 and has determined that no provision for income tax is required in the Fund's financial statements. The Fund's federal tax returns for the prior two fiscal years remain open subject to examination by the Internal Revenue Service.
Distribution of Income and Gains. Net investment income of the Fund, if any, is declared and distributed to shareholders annually. Net realized gains from investment transactions, in excess of available capital loss carryforwards, would be taxable to the Fund if not distributed and, therefore, will be distributed to shareholders at least annually. The Fund may also make additional distributions for tax purposes if necessary.
The timing and characterization of certain income and capital gains distributions are determined annually in accordance with federal tax regulations which may differ from accounting principles generally accepted in the United States of America. These differences primarily relate to certain securities sold at a loss. As a result, net investment income (loss) and net realized gain (loss) on investment transactions for a reporting period may differ significantly from distributions during such period. Accordingly, the Fund may periodically make reclassifications among certain of its capital accounts without impacting the net asset value of the Fund.
The tax character of current year distributions will be determined at the end of the current fiscal year.
Expenses. Expenses of the Trust arising in connection with a specific fund are allocated to that fund. Other Trust expenses which cannot be directly attributed to a fund are apportioned among the funds in the Trust.
Contingencies. In the normal course of business, the Fund may enter into contracts with service providers that contain general indemnification clauses. The Fund's maximum exposure under these arrangements is unknown as this would involve future claims that may be made against the Fund that have not yet been made. However, based on experience, the Fund expects the risk of loss to be remote.
Other. Investment transactions are accounted for on a trade date plus one basis for daily net asset value calculations. However, for financial reporting purposes, investment transactions are reported on trade date. Interest income is recorded on the accrual basis. Dividend Income is recorded on the ex-dividend date. Realized gains and losses from investment transactions are recorded on an identified cost basis and may include proceeds from litigation. Distributions of income and capital gains from the Underlying Funds are recorded on the ex-dividend date.
B. Purchases and Sales of Securities
During the six months ended June 30, 2011, purchases and sales of affiliated Underlying Funds (excluding short-term investments) aggregated $18,034,952 and $6,735,000, respectively. Purchases and sales of non-affiliated Underlying Funds (excluding short-term investments) aggregated $1,477,909 and $0, respectively.
C. Related Parties
Management Agreement. Under the Investment Management Agreement with Deutsche Investment Management Americas Inc. ("DIMA" or the "Advisor"), an indirect, wholly owned subsidiary of Deutsche Bank AG, the Advisor directs the investments of the Fund in accordance with its investment objectives, policies and restrictions. The Advisor determines the securities, instruments and other contracts relating to investments to be purchased, sold or entered into by the Fund or delegates such responsibility to the Fund's subadvisor.
QS Investors, LLC ("QS Investors") acts as an investment subadvisor to the Fund. As an investment subadvisor to the Fund, QS Investors renders strategic asset allocation services for the Fund. QS Investors is paid by the Advisor for the services QS Investors provides to the Fund.
RREEF America L.L.C. ("RREEF") acts as an investment sub-advisor to the Fund. As an investment subadvisor to the Funds, RREEF provides investment management services to the portions of Fund's portfolio allocated to direct investments in global real estate and global infrastructure securities. RREEF is paid by the Advisor for the services RREEF provides to the Fund. As of the date of this report, the Fund obtained its exposure to global real estate and global infrastructure securities indirectly through investments in other Underlying DWS Funds.
The Fund does not invest in the Underlying DWS Funds for the purpose of exercising management or control; however, investments within the set limits may represent 5% or more of an Underlying DWS Fund's outstanding shares. At June 30, 2011, the Fund did not invest in more than 5% of any Underlying DWS Fund.
Pursuant to the Investment Management Agreement with the Advisor, the Fund pays a monthly management fee based on the Fund's average daily net assets, computed and accrued daily and payable monthly, at the following annual rates:
| On assets invested in other DWS Funds | .200% |
| On assets invested in all other assets not considered DWS Funds | 1.200% |
In addition, the Advisor will receive management fees from managing the Underlying DWS Funds in which the Fund invests.
For the period from January 1, 2010 through April 30, 2011, the Advisor had contractually agreed to waive its fee and/or reimburse certain operating expenses to the extent necessary to maintain the operating expenses (excluding certain expenses such as extraordinary expenses, taxes, brokerage, interest expense and Underlying Funds) of each class as follows:
For the period from May 1, 2011 through April 30, 2012, the Advisor has contractually agreed to waive its fee and/or reimburse certain operating expenses to the extent necessary to maintain the operating expenses (excluding certain expenses such as extraordinary expenses, taxes, brokerage, interest expense and Underlying Funds) of each class as follows:
For the six months ended June 30, 2011, the Advisor has agreed to waive 0.15% of the monthly management fee based on average daily net assets for the Fund.
Accordingly, for the six months ended June 30, 2011, the fee pursuant to the Investment Management Agreement charged to the Fund was $45,062, all of which was waived, resulting in an annualized effective rate of 0.00% of the Fund's average daily net assets.
In addition, for the six months ended June 30, 2011, the Advisor waived $1,316 of other expenses.
The Fund indirectly bears its proportionate share of fees and expenses incurred by the Underlying Funds in which it is invested.
Administration Fee. Pursuant to an Administrative Services Agreement, DIMA provides most administrative services to the Fund. For all services provided under the Administrative Services Agreement, the Fund pays DIMA an annual fee ("Administration Fee") of 0.10% of the Fund's average daily net assets, computed and accrued daily and payable monthly. For the six months ended June 30, 2011, the Administration Fee was $17,428, all of which was waived.
Service Provider Fees. DWS Investments Service Company ("DISC"), an affiliate of the Advisor, is the transfer agent, dividend-paying agent and shareholder service agent for the Fund. Pursuant to a sub-transfer agency agreement between DISC and DST Systems, Inc. ("DST"), DISC has delegated certain transfer agent, dividend-paying agent and shareholder service agent functions to DST. DISC compensates DST out of the shareholder servicing fee it receives from the Fund. For the six months ended June 30, 2011, the amounts charged to the Fund by DISC were as follows:
| Services to Shareholders | | Total Aggregated | | | Waived | | | Unpaid at June 30, 2011 | |
| Class A | | $ | 22 | | | $ | 22 | | | $ | — | |
| Class B | | | 23 | | | | — | | | | 23 | |
| | | $ | 45 | | | $ | 22 | | | $ | 23 | |
Distribution Service Agreement. Under the Fund's Class B 12b-1 plans, DWS Investments Distributors, Inc. ("DIDI") received a fee ("Distribution Service Fee") of 0.25% of average daily net assets of Class B shares. For the six months ended June 30, 2011, the Distribution Service Fee aggregated $35,684, of which $6,566 is unpaid.
Typesetting and Filing Service Fees. Under an agreement with DIMA, DIMA is compensated for providing typesetting and certain regulatory filing services to the Fund. For the six months ended June 30, 2011, the amount charged to the Fund by DIMA included in the Statement of Operations under "reports to shareholders" aggregated $10,085, of which $568 is unpaid.
Trustees' Fees and Expenses. The Fund paid each Trustee not affiliated with the Advisor retainer fees plus specified amounts for various committee services and for the Board Chairperson.
Affiliated Cash Management Vehicle. The Fund may invest uninvested cash balances in Central Cash Management Fund, which is managed by the Advisor. The Fund indirectly bears its proportionate share of the expenses of Central Cash Management Fund. Central Cash Management Fund does not pay the Advisor an investment management fee. Central Cash Management Fund seeks a high level of current income consistent with liquidity and the preservation of capital.
D. Investing in Emerging Markets
Investing in emerging markets may involve special risks and considerations not typically associated with investing in developed markets. These risks include revaluation of currencies, high rates of inflation or deflation, repatriation restrictions on income and capital, and future adverse political, social and economic developments. Moreover, securities issued in these markets may be less liquid, subject to government ownership controls or delayed settlements, and may have prices that are more volatile or less easily assessed than those of comparable securities of issuers in developed markets.
E. Ownership of the Fund
At June 30, 2011, one Participating Insurance Company was the owner of record of 10% or more of the total outstanding Class A shares of the Fund, owning 98%. One Participating Insurance Company was the owner of record of 10% or more of the total outstanding Class B shares of the Fund, owning 95%.
The Trust's policies and procedures for voting proxies for portfolio securities and information about how the Trust voted proxies related to its portfolio securities during the 12-month period ended June 30 are available on our Web site — www.dws-investments.com (click on "proxy voting" at the bottom of the page) — or on the SEC's Web site — www.sec.gov. To obtain a written copy of the Trust's policies and procedures without charge, upon request, call us toll free at (800) 728-3337.
Summary of Management Fee Evaluation by Independent Fee Consultant
October 3, 2010
Pursuant to an Order entered into by Deutsche Investment Management Americas and affiliates (collectively, "DeAM") with the Attorney General of New York, I, Thomas H. Mack, have been appointed the Independent Fee Consultant for the DWS Funds (formerly the DWS Scudder Funds). My duties include preparing an annual written evaluation of the management fees DeAM charges the Funds, considering among other factors the management fees charged by other mutual fund companies for like services, management fees DeAM charges other clients for like services, DeAM's costs of supplying services under the management agreements and related profit margins, possible economies of scale if a Fund grows larger, and the nature and quality of DeAM's services, including fund performance. This report summarizes my evaluation for 2010, including my qualifications, the evaluation process for each of the DWS Funds, consideration of certain complex-level factors, and my conclusions. I served in substantially the same capacity in 2007, 2008, and 2009.
Qualifications
For more than 35 years I have served in various professional capacities within the investment management business. I have held investment analysis and advisory positions, including securities analyst, portfolio strategist and director of investment policy with a large investment firm. I have also performed business management functions, including business development, financial management and marketing research and analysis.
Since 1991, I have been an independent consultant within the asset management industry. I have provided services to over 125 client organizations, including investment managers, mutual fund boards, product distributors and related organizations. Over the past ten years I have completed a number of assignments for mutual fund boards, specifically including assisting boards with management contract renewal.
I hold a Master of Business Administration degree, with highest honors, from Harvard University and Master of Science and Bachelor of Science (highest honors) degrees from the University of California at Berkeley. I am an independent director and audit committee financial expert for two closed-end mutual funds and have served in various leadership and financial oversight capacities with non-profit organizations.
Evaluation of Fees for each DWS Fund
My work focused primarily on evaluating, fund-by-fund, the fees charged to each of the 118 publicly offered Fund portfolios in the DWS Fund family. For each Fund, I considered each of the key factors mentioned above, as well as any other relevant information. In doing so I worked closely with the Funds' Independent Directors in their annual contract renewal process, as well as in their approval of contracts for several new funds (documented separately).
In evaluating each Fund's fees, I reviewed comprehensive materials provided by or on behalf of DeAM, including expense information prepared by Lipper Analytical, comparative performance information, profitability data, manager histories, and other materials. I also accessed certain additional information from the Lipper and Morningstar databases and drew on my industry knowledge and experience.
To facilitate evaluating this considerable body of information, I prepared for each Fund a document summarizing the key data elements in each area as well as additional analytics discussed below. This made it possible to consider each key data element in the context of the others.
In the course of contract renewal, DeAM agreed to implement a number of fee and expense adjustments requested by the Independent Directors which will favorably impact future fees and expenses, and my evaluation includes the effects of these changes.
Fees and Expenses Compared with Other Funds
The competitive fee and expense evaluation for each fund focused on two primary comparisons:
The Fund's contractual management fee (the advisory fee plus the administration fee where applicable) compared with those of a group of typically 12-15 funds in the same Lipper investment category (e.g. Large Capitalization Growth) having similar distribution arrangements and being of similar size.
The Fund's total expenses compared with a broader universe of funds from the same Lipper investment category and having similar distribution arrangements.
These two comparisons provide a view of not only the level of the fee compared with funds of similar scale but also the total expense the Fund bears for all the services it receives, in comparison with the investment choices available in the Fund's investment category and distribution channel. The principal figure-of-merit used in these comparisons was the subject Fund's percentile ranking against peers.
DeAM's Fees for Similar Services to Others
DeAM provided management fee schedules for all of its US domiciled fund and non-fund investment management accounts in any of the investment categories where there is a DWS Fund. These similar products included the other DWS Funds, non-fund pooled accounts, institutional accounts and sub-advisory accounts. Using this information, I calculated for each Fund the fee that would be charged to each similar product, at the subject Fund's asset level.
Evaluating information regarding non-fund products is difficult because there are varying levels of services required for different types of accounts, with mutual funds generally requiring considerably more regulatory and administrative types of service as well as having more frequent cash flows than other types of accounts. Also, while mutual fund fees for similar fund products can be expected to be similar, there will be some differences due to different pricing conditions in different distribution channels (e.g. retail funds versus those used in variable insurance products), differences in underlying investment processes and other factors.
Costs and Profit Margins
DeAM provided a detailed profitability analysis for each Fund. After making some adjustments so that the presentation would be more comparable to the available industry figures, I reviewed profit margins from investment management alone, from investment management plus other fund services (excluding distribution) provided to the Funds by DeAM (principally shareholder services), and DeAM profits from all sources, including distribution. A later section comments on overall profitability.
Economies of Scale
Economies of scale — an expected decline in management cost per dollar of fund assets as fund assets grow — are very rarely quantified and documented because of inherent difficulties in collecting and analyzing relevant data. However, in virtually every investment category that I reviewed, larger funds tend to have lower fees and lower total expenses than smaller funds. To see how each DWS Fund compares with this industry observation, I reviewed:
The trend in Fund assets over the last five years and the accompanying trend in total expenses. This shows if the Fund has grown and, if so, whether total expense (management fees as well as other expenses) have declined as a percent of assets.
Whether the Fund has break-points in its management fee schedule, the extent of the fee reduction built into the schedule and the asset levels where the breaks take effect, and in the case of a sub-advised Fund how the Fund's break-points compare with those of the sub-advisory fee schedule.
How the Fund's contractual fee schedule compares with trends in the industry data. To accomplish this, I constructed a chart showing how actual latest-fiscal-year contractual fees of the Fund and of other similar funds relate to average fund assets, with the subject Fund's contractual fee schedule superimposed.
Quality of Service — Performance
The quality-of-service evaluation focused on investment performance, which is the principal result of the investment management service. Each Fund's performance was reviewed over the past 1, 3, 5 and 10 years, as applicable, and compared with that of other funds in the same investment category and with a suitable market index.
In addition, I calculated and reviewed risk-adjusted returns relative to an index of similar mutual funds' returns and a suitable market index. The risk-adjusted returns analysis provides a way of determining the extent to which the Fund's return comparisons are mainly the product of investment value-added (or lack thereof) or alternatively taking considerably more or less risk than is typical in its investment category.
I also received and considered the history of portfolio manager changes for each Fund, as this provided an important context for evaluating the performance results.
Complex-Level Considerations
While this evaluation was conducted mainly at the individual fund level, there are some issues relating to the reasonableness of fees that can alternatively be considered across the whole fund complex:
I reviewed DeAM's profitability analysis for all DWS Funds, with a view toward determining if the allocation procedures used were reasonable and how profit levels compared with public data for other investment managers.
I considered whether DeAM and affiliates receive any significant ancillary or "fall-out" benefits that should be considered in interpreting the direct profitability results. These would be situations where serving as the investment manager of the Funds is beneficial to another part of the Deutsche Bank organization.
I considered how aggregated DWS Fund expenses had varied over the years, by asset class and in the context of trends in asset levels.
I reviewed the structure of the DeAM organization, trends in staffing levels, and information on compensation of investment management and other professionals compared with industry data.
Findings
Based on the process and analysis discussed above, which included reviewing a wide range of information from management and external data sources and considering among other factors the fees DeAM charges other clients, the fees charged by other fund managers, DeAM's costs and profits associated with managing the Funds, economies of scale, possible fall-out benefits, and the nature and quality of services provided, in my opinion the management fees charged the DWS Funds are reasonable.
Thomas H. Mack
DWS Investments Distributors, Inc.
222 South Riverside Plaza
Chicago, IL 60606
(800) 621-1148
VS2AAAP-3 (R-023287-1 8/11)
JUNE 30, 2011
SEMIANNUAL REPORT
DWS VARIABLE SERIES II
DWS Balanced VIP
Contents
3 Performance Summary 4 Information About Your Fund's Expenses 5 Portfolio Summary 6 Investment Portfolio 22 Statement of Assets and Liabilities 22 Statement of Operations 23 Statement of Changes in Net Assets 25 Financial Highlights 26 Notes to Financial Statements 32 Proxy Voting 33 Summary of Management Fee Evaluation by Independent Fee Consultant |
This report must be preceded or accompanied by a prospectus. To obtain an additional prospectus or summary prospectus, if available, call (800) 728-3337 or your financial representative. We advise you to consider the Fund's objectives, risks, charges and expenses carefully before investing. The summary prospectus and prospectus contain this and other important information about the Fund. Please read the prospectus carefully before you invest.
Although allocation among different asset categories generally limits risk, fund management may favor an asset category that underperforms other assets or markets as a whole. Bond investments are subject to interest-rate and credit risks. When interest rates rise, bond prices generally fall. Credit risk refers to the ability of an issuer to make timely payments of principal and interest. The Fund may use derivatives, including as part of its Global Tactical Asset Allocation (GTAA) strategy. Investing in derivatives entails special risks relating to liquidity, leverage and credit that may reduce returns and/or increase volatility. Stocks may decline in value. See the prospectus for details
DWS Investments is part of Deutsche Bank's Asset Management division and, within the US, represents the retail asset management activities of Deutsche Bank AG, Deutsche Bank Trust Company Americas, Deutsche Investment Management Americas Inc. and DWS Trust Company.
NOT FDIC/NCUA INSURED NO BANK GUARANTEE MAY LOSE VALUE NOT A DEPOSIT
NOT INSURED BY ANY FEDERAL GOVERNMENT AGENCY
Performance Summary June 30, 2011
Fund performance shown is historical, assumes reinvestment of all dividend and capital gain distributions and does not guarantee future results. Investment return and principal value fluctuate with changing market conditions so that, when redeemed, shares may be worth more or less than their original cost. Current performance may be lower or higher than the performance data quoted. Please contact your participating insurance company for the Fund's most recent month-end performance. Performance doesn't reflect charges and fees ("contract charges") associated with the separate account that invests in the Fund or any variable life insurance policy or variable annuity contract for which the Fund is an investment option. These charges and fees will reduce returns.
The gross expense ratio of the Fund, as stated in the fee table of the prospectus dated May 1, 2011 is 0.67% for Class A shares and may differ from the expense ratio disclosed in the Financial Highlights table in this report.
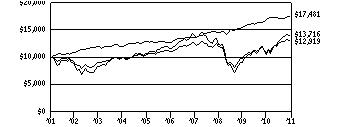
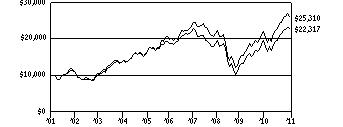
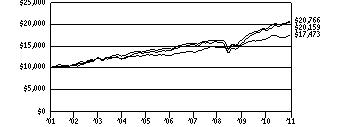
| Growth of an Assumed $10,000 Investment in DWS Balanced VIP |
[] DWS Balanced VIP — Class A [] Russell 1000® Index [] Barclays Capital US Aggregate Bond Index | |
| | The Russell 1000® Index is an unmanaged index that measures the performance of the 1,000 largest companies in the Russell 3000 Index, which represents approximately 92% of the total market capitalization of the Russell 3000 Index. The Barclays Capital US Aggregate Bond Index is an unmanaged, market-value-weighted measure of Treasury issues, agency issues, corporate bond issues and mortgage securities. Index returns do not reflect any fees or expenses and it is not possible to invest directly into an index. |
| Yearly periods ended June 30 | |
| Comparative Results | |
| DWS Balanced VIP | | 6-Month‡ | | | 1-Year | | | 3-Year | | | 5-Year | | | 10-Year | |
| Class A | Growth of $10,000 | | $ | 10,362 | | | $ | 11,875 | | | $ | 10,822 | | | $ | 11,751 | | | $ | 12,919 | |
| Average annual total return | | | 3.62 | % | | | 18.75 | % | | | 2.67 | % | | | 3.28 | % | | | 2.59 | % |
| Russell 1000 Index | Growth of $10,000 | | $ | 10,637 | | | $ | 13,193 | | | $ | 11,145 | | | $ | 11,763 | | | $ | 13,716 | |
| Average annual total return | | | 6.37 | % | | | 31.93 | % | | | 3.68 | % | | | 3.30 | % | | | 3.21 | % |
| Barclays Capital US Aggregate Bond Index | Growth of $10,000 | | $ | 10,272 | | | $ | 10,390 | | | $ | 12,065 | | | $ | 13,715 | | | $ | 17,481 | |
| Average annual total return | | | 2.72 | % | | | 3.90 | % | | | 6.46 | % | | | 6.52 | % | | | 5.74 | % |
The growth of $10,000 is cumulative.
‡ Total returns shown for periods less than one year are not annualized.
Information About Your Fund's Expenses
As an investor of the Fund, you incur two types of costs: ongoing expenses and transaction costs. Ongoing expenses include management fees and other Fund expenses. Examples of transaction costs include contract charges, redemption fees and account maintenance fees, which are not shown in this section. The following tables are intended to help you understand your ongoing expenses (in dollars) of investing in the Fund and to help you compare these expenses with the ongoing expenses of investing in other mutual funds. The example in the table is based on an investment of $1,000 invested at the beginning of the six-month period and held for the entire period (January 1, 2011 to June 30, 2011).
The tables illustrate your Fund's expenses in two ways:
•Actual Fund Return. This helps you estimate the actual dollar amount of ongoing expenses (but not transaction costs) paid on a $1,000 investment in the Fund using the Fund's actual return during the period. To estimate the expenses you paid over the period, simply divide your account value by $1,000 (for example, an $8,600 account value divided by $1,000 = 8.6), then multiply the result by the number in the "Expenses Paid per $1,000" line under the share class you hold.
• Hypothetical 5% Fund Return. This helps you to compare your Fund's ongoing expenses (but not transaction costs) with those of other mutual funds using the Fund's actual expense ratio and a hypothetical rate of return of 5% per year before expenses. Examples using a 5% hypothetical Fund return may be found in the shareholder reports of other mutual funds. The hypothetical account values and expenses may not be used to estimate the actual ending account balance or expenses you paid for the period.
Please note that the expenses shown in these tables are meant to highlight your ongoing expenses only and do not reflect any transaction costs. The "Expenses Paid per $1,000" line of the tables is useful in comparing ongoing expenses only and will not help you determine the relative total expense of owning different funds. If these transaction costs had been included, your costs would have been higher.
Expenses and Value of a $1,000 Investment for the six months ended June 30, 2011 | |
| Actual Fund Return | | Class A | |
| Beginning Account Value 1/1/11 | | $ | 1,000.00 | |
| Ending Account Value 6/30/11 | | $ | 1,036.20 | |
| Expenses Paid per $1,000* | | $ | 3.03 | |
| Hypothetical 5% Fund Return | | Class A | |
| Beginning Account Value 1/1/11 | | $ | 1,000.00 | |
| Ending Account Value 6/30/11 | | $ | 1,021.82 | |
| Expenses Paid per $1,000* | | $ | 3.01 | |
* Expenses are equal to the Fund's annualized expense ratio, multiplied by the average account value over the period, multiplied by the number of days in the most recent six-month period, then divided by 365.
| Annualized Expense Ratio | Class A | |
| DWS Variable Series II — DWS Balanced VIP | .60% | |
For more information, please refer to the Fund's prospectus.
These tables do not reflect charges and fees ("contract charges") associated with the separate account that invests in the Fund or any variable life insurance policy or variable annuity contract for which the Fund is an investment option.
Asset Allocation (As a % of Investment Portfolio excluding Securities Lending Collateral) | 6/30/11 | 12/31/10 |
| | | |
| Common Stocks | 53% | 55% |
| Exchange-Traded Funds — Equity | 5% | 5% |
| Total Equity | 58% | 60% |
| | | |
| Government & Agency Obligations | 10% | 9% |
| Exchange-Traded Funds — Fixed income | 8% | 7% |
| Corporate Bonds | 6% | 7% |
| Mortgage-Backed Securities Pass-Throughs | 6% | 7% |
| Commercial Mortgage-Backed Securities | 3% | 2% |
| Asset-Backed | 1% | 0% |
| Municipal Bonds and Notes | 0% | 1% |
| Preferred Stocks | 0% | 1% |
| Total Fixed Income | 34% | 34% |
| | | |
| Cash Equivalents | 8% | 6% |
| | 100% | 100% |
Sector Diversification (As a % of Equities, Corporate Bonds, Senior Loans and Preferred Securities) | 6/30/11 | 12/31/10 |
| | | |
| Information Technology | 16% | 16% |
| Financials | 15% | 13% |
| Energy | 12% | 14% |
| Health Care | 12% | 10% |
| Industrials | 11% | 11% |
| Consumer Discretionary | 11% | 12% |
| Consumer Staples | 9% | 9% |
| Materials | 5% | 6% |
| Utilities | 5% | 4% |
| Telecommunication Services | 4% | 5% |
| | 100% | 100% |
Asset allocation and sector diversification exclude derivatives and are subject to change.
For more complete details about the Fund's investment portfolio, see page 6.
Following the Fund's fiscal first and third quarter-end, a complete portfolio holdings listing is filed with the SEC on Form N-Q. The form will be available on the SEC's Web site at www.sec.gov, and it also may be reviewed and copied at the SEC's Public Reference Room in Washington, D.C. Information on the operation of the SEC's Public Reference Room may be obtained by calling (800) SEC-0330. The Fund's portfolio holdings are also posted on www.dws-investments.com from time to time. Please see the Fund's current prospectus for more information.
Investment Portfolio June 30, 2011 (Unaudited) | | | Shares | | | Value ($) | |
| | | | |
| Common Stocks 53.8% | |
| Consumer Discretionary 5.4% | |
| Auto Components 0.9% | |
| Autoliv, Inc. | | | 8,231 | | | | 645,722 | |
| BorgWarner, Inc.* | | | 10,596 | | | | 856,051 | |
| Continental AG* | | | 2,940 | | | | 308,683 | |
| Minth Group Ltd. | | | 90,486 | | | | 146,839 | |
| Nippon Seiki Co., Ltd. | | | 8,574 | | | | 113,740 | |
| TRW Automotive Holdings Corp.* | | | 7,920 | | | | 467,517 | |
| | | | | | | | 2,538,552 | |
| Automobiles 0.1% | |
| Honda Motor Co., Ltd. | | | 7,567 | | | | 291,659 | |
| Distributors 0.2% | |
| Genuine Parts Co. | | | 11,463 | | | | 623,587 | |
| Li & Fung Ltd. | | | 56,000 | | | | 112,629 | |
| | | | | | | | 736,216 | |
| Diversified Consumer Services 0.3% | |
| H&R Block, Inc. | | | 54,638 | | | | 876,394 | |
| Hotels Restaurants & Leisure 1.3% | |
| Bwin.Party Digital Entertainment PLC* | | | 15,660 | | | | 37,774 | |
| Carnival Corp. (Units) | | | 26,529 | | | | 998,286 | |
| Darden Restaurants, Inc. | | | 15,717 | | | | 782,078 | |
| Domino's Pizza UK & IRL PLC | | | 10,905 | | | | 70,658 | |
| McDonald's Corp. | | | 9,344 | | | | 787,886 | |
| Paddy Power PLC | | | 3,140 | | | | 170,649 | |
| REXLot Holdings Ltd. | | | 1,202,664 | | | | 116,312 | |
| Starwood Hotels & Resorts Worldwide, Inc. | | | 17,344 | | | | 971,958 | |
| Trump Entertainment Resorts, Inc.* | | | 2 | | | | 37 | |
| | | | | | | | 3,935,638 | |
| Household Durables 0.1% | |
| Hajime Construction Co., Ltd. | | | 3,264 | | | | 86,340 | |
| Jarden Corp. | | | 1,779 | | | | 61,393 | |
| | | | | | | | 147,733 | |
| Leisure Equipment & Products 0.1% | |
| Universal Entertainment Corp. | | | 5,166 | | | | 172,576 | |
| Media 0.4% | |
| Aegis Group PLC | | | 23,040 | | | | 59,137 | |
| Charm Communications, Inc. (ADR)* | | | 5,970 | | | | 71,043 | |
| Dex One Corp.* | | | 245 | | | | 620 | |
| JC Decaux SA* | | | 3,392 | | | | 108,661 | |
| News Corp. "A" | | | 58,237 | | | | 1,030,795 | |
| SuperMedia, Inc.* | | | 43 | | | | 161 | |
| Vertis Holdings, Inc.* | | | 111 | | | | 1,969 | |
| | | | | | | | 1,272,386 | |
| Multiline Retail 0.3% | |
| Dollar General Corp.* | | | 10,690 | | | | 362,284 | |
| Nordstrom, Inc. | | | 12,830 | | | | 602,240 | |
| | | | | | | | 964,524 | |
| Specialty Retail 1.1% | |
| Advance Auto Parts, Inc. | | | 1,691 | | | | 98,907 | |
| Aeropostale, Inc.* | | | 4,315 | | | | 75,512 | |
| AutoZone, Inc.* | | | 1,707 | | | | 503,309 | |
| Best Buy Co., Inc. | | | 10,732 | | | | 337,092 | |
| Dick's Sporting Goods, Inc.* | | | 18,212 | | | | 700,251 | |
| | | Shares | | | Value ($) | |
| | | | | | | | | |
| Guess?, Inc. | | | 2,261 | | | | 95,098 | |
| Hennes & Mauritz AB "B" | | | 3,500 | | | | 120,624 | |
| hhgregg, Inc.* | | | 3,791 | | | | 50,799 | |
| Industria de Diseno Textil SA | | | 1,660 | | | | 151,586 | |
| L'Occitane International SA* | | | 24,785 | | | | 66,357 | |
| Limited Brands, Inc. | | | 28,706 | | | | 1,103,746 | |
| Urban Outfitters, Inc.* | | | 3,012 | | | | 84,788 | |
| | | | | | | | 3,388,069 | |
| Textiles, Apparel & Luxury Goods 0.6% | |
| Burberry Group PLC | | | 4,013 | | | | 93,302 | |
| Deckers Outdoor Corp.* | | | 2,239 | | | | 197,346 | |
| Luxottica Group SpA | | | 4,500 | | | | 144,251 | |
| NIKE, Inc. "B" | | | 13,382 | | | | 1,204,112 | |
| | | | | | | | 1,639,011 | |
| Consumer Staples 5.1% | |
| Beverages 1.2% | |
| Anheuser-Busch InBev NV | | | 4,600 | | | | 266,731 | |
| C&C Group PLC | | | 27,420 | | | | 142,696 | |
| Carlsberg AS "B" | | | 2,500 | | | | 272,034 | |
| Central European Distribution Corp.* | | | 1,961 | | | | 21,963 | |
| Foster's Group Ltd. | | | 19,600 | | | | 108,504 | |
| Heineken NV | | | 14,200 | | | | 854,087 | |
| PepsiCo, Inc. | | | 28,509 | | | | 2,007,889 | |
| Treasury Wine Estates Ltd.* | | | 6,533 | | | | 23,824 | |
| | | | | | | | 3,697,728 | |
| Food & Staples Retailing 1.7% | |
| Costco Wholesale Corp. | | | 11,429 | | | | 928,492 | |
| CVS Caremark Corp. | | | 29,327 | | | | 1,102,109 | |
| Kroger Co. | | | 25,886 | | | | 641,973 | |
| Tesco PLC | | | 44,000 | | | | 284,173 | |
| Wal-Mart Stores, Inc. | | | 24,840 | | | | 1,319,998 | |
| Wesfarmers Ltd. | | | 4,077 | | | | 139,720 | |
| Whole Foods Market, Inc. | | | 4,958 | | | | 314,585 | |
| William Morrison Supermarkets PLC | | | 23,100 | | | | 110,375 | |
| Woolworths Ltd. | | | 10,200 | | | | 304,160 | |
| | | | | | | | 5,145,585 | |
| Food Products 1.3% | |
| Diamond Foods, Inc. | | | 2,594 | | | | 198,026 | |
| General Mills, Inc. | | | 14,715 | | | | 547,692 | |
| Golden Agri-Resources Ltd. | | | 274,000 | | | | 152,273 | |
| Green Mountain Coffee Roasters, Inc.* | | | 1,362 | | | | 121,572 | |
| Kellogg Co. | | | 31,919 | | | | 1,765,759 | |
| Mead Johnson Nutrition Co. | | | 9,016 | | | | 609,031 | |
| Nestle SA (Registered) | | | 2,006 | | | | 124,672 | |
| SunOpta, Inc.* | | | 17,401 | | | | 123,721 | |
| Unilever PLC | | | 4,600 | | | | 148,446 | |
| | | | | | | | 3,791,192 | |
| Household Products 0.1% | |
| Reckitt Benckiser Group PLC | | | 5,400 | | | | 298,152 | |
| Personal Products 0.1% | |
| Beiersdorf AG | | | 2,270 | | | | 147,305 | |
| Tobacco 0.7% | |
| Altria Group, Inc. | | | 44,430 | | | | 1,173,396 | |
| Philip Morris International, Inc. | | | 13,750 | | | | 918,088 | |
| | | | | | | | 2,091,484 | |
| | | Shares | | | Value ($) | |
| | | | | | | | | |
| Energy 6.7% | |
| Energy Equipment & Services 2.0% | |
| AMEC PLC | | | 7,384 | | | | 129,040 | |
| Complete Production Services, Inc.* | | | 3,070 | | | | 102,415 | |
| Dresser-Rand Group, Inc.* | | | 2,009 | | | | 107,984 | |
| Halliburton Co. | | | 9,600 | | | | 489,600 | |
| John Wood Group PLC | | | 10,486 | | | | 109,031 | |
| Lamprell PLC | | | 16,170 | | | | 97,951 | |
| National Oilwell Varco, Inc. | | | 13,484 | | | | 1,054,584 | |
| Noble Corp. | | | 22,458 | | | | 885,070 | |
| Oil States International, Inc.* | | | 7,043 | | | | 562,806 | |
| ProSafe SE | | | 8,450 | | | | 63,618 | |
| SBM Offshore NV | | | 5,583 | | | | 147,685 | |
| Schlumberger Ltd. | | | 12,763 | | | | 1,102,723 | |
| Seadrill Ltd. | | | 4,200 | | | | 147,844 | |
| Technip SA | | | 2,660 | | | | 284,936 | |
| Tecnicas Reunidas SA | | | 1,045 | | | | 53,775 | |
| Transocean Ltd. | | | 9,784 | | | | 631,655 | |
| | | | | | | | 5,970,717 | |
| Oil, Gas & Consumable Fuels 4.7% | |
| Anadarko Petroleum Corp. | | | 12,421 | | | | 953,436 | |
| Approach Resources, Inc.* | | | 2,573 | | | | 58,330 | |
| BP PLC | | | 121,700 | | | | 896,685 | |
| Canadian Natural Resources Ltd. | | | 20,140 | | | | 843,060 | |
| Chevron Corp. | | | 11,582 | | | | 1,191,093 | |
| Cloud Peak Energy, Inc.* | | | 3,229 | | | | 68,778 | |
| ConocoPhillips | | | 10,952 | | | | 823,481 | |
| EOG Resources, Inc. | | | 9,618 | | | | 1,005,562 | |
| Exxon Mobil Corp. | | | 10,516 | | | | 855,792 | |
| INPEX Corp. | | | 40 | | | | 295,309 | |
| Marathon Oil Corp. | | | 36,926 | | | | 1,945,262 | |
| Nexen, Inc. | | | 29,198 | | | | 656,955 | |
| Northern Oil & Gas, Inc.* | | | 2,904 | | | | 64,324 | |
| Occidental Petroleum Corp. | | | 20,458 | | | | 2,128,450 | |
| Origin Energy Ltd. | | | 8,300 | | | | 141,141 | |
| Plains Exploration & Production Co.* | | | 13,306 | | | | 507,225 | |
| Royal Dutch Shell PLC "B" | | | 7,700 | | | | 274,861 | |
| Suncor Energy, Inc. | | | 28,257 | | | | 1,104,849 | |
| Ultra Petroleum Corp.* | | | 1,274 | | | | 58,349 | |
| Woodside Petroleum Ltd. | | | 2,931 | | | | 129,292 | |
| | | | | | | | 14,002,234 | |
| Financials 6.5% | |
| Capital Markets 1.2% | |
| Affiliated Managers Group, Inc.* | | | 837 | | | | 84,914 | |
| Ameriprise Financial, Inc. | | | 7,094 | | | | 409,182 | |
| Ashmore Group PLC | | | 24,681 | | | | 157,747 | |
| Charles Schwab Corp. | | | 28,274 | | | | 465,107 | |
| ICAP PLC | | | 7,822 | | | | 59,358 | |
| Jefferies Group, Inc. | | | 4,267 | | | | 87,047 | |
| Lazard Ltd. "A" | | | 1,701 | | | | 63,107 | |
| Morgan Stanley | | | 29,583 | | | | 680,705 | |
| Partners Group Holding AG | | | 691 | | | | 122,299 | |
| T. Rowe Price Group, Inc. | | | 21,449 | | | | 1,294,233 | |
| UOB-Kay Hian Holdings Ltd. | | | 44,575 | | | | 58,833 | |
| Waddell & Reed Financial, Inc. "A" | | | 2,092 | | | | 76,044 | |
| | | | | | | | 3,558,576 | |
| Commercial Banks 1.0% | |
| Australia & New Zealand Banking Group Ltd. | | | 5,618 | | | | 132,678 | |
| BOC Hong Kong (Holdings) Ltd. | | | 146,000 | | | | 423,936 | |
| | | Shares | | | Value ($) | |
| | | | | | | | | |
| Dah Sing Banking Group Ltd. | | | 39,579 | | | | 55,706 | |
| DGB Financial Group, Inc.* | | | 6,545 | | | | 99,311 | |
| DnB NOR ASA | | | 18,200 | | | | 253,693 | |
| Lloyds Banking Group PLC* | | | 151,000 | | | | 118,650 | |
| National Australia Bank Ltd. | | | 9,961 | | | | 274,827 | |
| Prosperity Bancshares, Inc. | | | 2,109 | | | | 92,416 | |
| Resona Holdings, Inc. | | | 27,200 | | | | 128,091 | |
| Societe Generale | | | 23,364 | | | | 1,384,820 | |
| Zions Bancorp. | | | 3,112 | | | | 74,719 | |
| | | | | | | | 3,038,847 | |
| Consumer Finance 0.0% | |
| Kiatnakin Bank PCL (Foreign Registered) | | | 56,609 | | | | 60,800 | |
| Magma Fincorp Ltd. | | | 663 | | | | 1,086 | |
| | | | | | | | 61,886 | |
| Diversified Financial Services 0.4% | |
| ING Groep NV (CVA)* | | | 22,326 | | | | 275,398 | |
| JPMorgan Chase & Co. | | | 22,122 | | | | 905,675 | |
| | | | | | | | 1,181,073 | |
| Insurance 3.3% | |
| Allianz SE (Registered) | | | 10,280 | | | | 1,436,293 | |
| Assurant, Inc. | | | 22,130 | | | | 802,655 | |
| AXA SA | | | 42,424 | | | | 963,195 | |
| Fidelity National Financial, Inc. "A" | | | 43,138 | | | | 678,992 | |
| HCC Insurance Holdings, Inc. | | | 21,261 | | | | 669,722 | |
| Lincoln National Corp. | | | 39,101 | | | | 1,113,987 | |
| MetLife, Inc. | | | 14,617 | | | | 641,248 | |
| Old Mutual PLC | | | 63,969 | | | | 136,968 | |
| PartnerRe Ltd. | | | 14,850 | | | | 1,022,423 | |
| Prudential Financial, Inc. | | | 16,947 | | | | 1,077,660 | |
| Transatlantic Holdings, Inc. | | | 12,227 | | | | 599,245 | |
| Zurich Financial Services AG* | | | 3,400 | | | | 859,338 | |
| | | | | | | | 10,001,726 | |
| Real Estate Investment Trusts 0.3% | |
| CapitaMall Trust (REIT) | | | 350,000 | | | | 533,815 | |
| Klepierre (REIT) | | | 3,600 | | | | 148,559 | |
| Westfield Group (REIT) (Units) | | | 15,100 | | | | 140,713 | |
| | | | | | | | 823,087 | |
| Real Estate Management & Development 0.3% | |
| K Wah International Holdings Ltd. | | | 266,509 | | | | 98,732 | |
| Mitsubishi Estate Co., Ltd. | | | 17,600 | | | | 308,965 | |
| Mitsui Fudosan Co., Ltd. | | | 17,000 | | | | 293,088 | |
| Sumitomo Realty & Development Co., Ltd. | | | 4,000 | | | | 89,428 | |
| | | | | | | | 790,213 | |
| Health Care 6.5% | |
| Biotechnology 1.2% | |
| Amgen, Inc.* | | | 5,649 | | | | 329,619 | |
| Celgene Corp.* | | | 22,199 | | | | 1,339,044 | |
| Gilead Sciences, Inc.* | | | 41,865 | | | | 1,733,630 | |
| Metabolix, Inc.* | | | 3,431 | | | | 24,497 | |
| Onyx Pharmaceuticals, Inc.* | | | 1,688 | | | | 59,586 | |
| | | | | | | | 3,486,376 | |
| Health Care Equipment & Supplies 1.3% | |
| Accuray, Inc.* | | | 9,687 | | | | 77,593 | |
| Baxter International, Inc. | | | 20,984 | | | | 1,252,535 | |
| Becton, Dickinson & Co. | | | 9,573 | | | | 824,906 | |
| CareFusion Corp.* | | | 17,624 | | | | 478,844 | |
| CONMED Corp.* | | | 2,230 | | | | 63,510 | |
| Edwards Lifesciences Corp.* | | | 5,620 | | | | 489,952 | |
| Kinetic Concepts, Inc.* | | | 1,792 | | | | 103,273 | |
| | | Shares | | | Value ($) | |
| | | | | | | | | |
| Merit Medical Systems, Inc.* | | | 1,705 | | | | 30,639 | |
| NxStage Medical, Inc.* | | | 5,004 | | | | 104,183 | |
| Sirona Dental Systems, Inc.* | | | 1,420 | | | | 75,402 | |
| Terumo Corp. | | | 5,300 | | | | 286,403 | |
| Thoratec Corp.* | | | 4,537 | | | | 148,904 | |
| | | | | | | | 3,936,144 | |
| Health Care Providers & Services 2.0% | |
| Aetna, Inc. | | | 11,051 | | | | 487,239 | |
| Centene Corp.* | | | 4,013 | | | | 142,582 | |
| Express Scripts, Inc.* | | | 23,774 | | | | 1,283,321 | |
| Fleury SA | | | 9,033 | | | | 131,561 | |
| Fresenius Medical Care AG & Co. KGaA | | | 5,241 | | | | 391,847 | |
| Humana, Inc. | | | 7,952 | | | | 640,454 | |
| McKesson Corp. | | | 26,028 | | | | 2,177,242 | |
| WellPoint, Inc. | | | 7,999 | | | | 630,081 | |
| | | | | | | | 5,884,327 | |
| Health Care Technology 0.1% | |
| SXC Health Solutions Corp.* | | | 2,659 | | | | 156,668 | |
| Life Sciences Tools & Services 0.2% | |
| Life Technologies Corp.* | | | 2,261 | | | | 117,730 | |
| Thermo Fisher Scientific, Inc.* | | | 10,400 | | | | 669,656 | |
| | | | | | | | 787,386 | |
| Pharmaceuticals 1.7% | |
| AstraZeneca PLC | | | 2,942 | | | | 146,899 | |
| Eisai Co., Ltd. | | | 9,000 | | | | 351,510 | |
| Flamel Technologies SA (ADR)* | | | 11,590 | | | | 62,007 | |
| GlaxoSmithKline PLC | | | 65,900 | | | | 1,410,963 | |
| Merck & Co., Inc. | | | 31,487 | | | | 1,111,176 | |
| Merck KGaA | | | 1,390 | | | | 151,050 | |
| Novartis AG (Registered) | | | 2,510 | | | | 153,756 | |
| Novo Nordisk AS "B" | | | 2,317 | | | | 290,490 | |
| Pacira Pharmaceuticals. Inc.* | | | 8,434 | | | | 101,208 | |
| Questcor Pharmaceuticals, Inc.* | | | 7,602 | | | | 183,208 | |
| Teva Pharmaceutical Industries Ltd. (ADR) | | | 21,887 | | | | 1,055,391 | |
| VIVUS, Inc.* | | | 6,982 | | | | 56,834 | |
| | | | | | | | 5,074,492 | |
| Industrials 6.7% | |
| Aerospace & Defense 1.8% | |
| BAE Systems PLC | | | 16,300 | | | | 83,326 | |
| BE Aerospace, Inc.* | | | 3,097 | | | | 126,389 | |
| European Aeronautic Defence & Space Co. NV | | | 15,500 | | | | 518,807 | |
| Northrop Grumman Corp. | | | 12,413 | | | | 860,842 | |
| Raytheon Co. | | | 16,466 | | | | 820,830 | |
| TransDigm Group, Inc.* | | | 7,739 | | | | 705,719 | |
| United Technologies Corp. | | | 26,072 | | | | 2,307,633 | |
| | | | | | | | 5,423,546 | |
| Airlines 0.1% | |
| Cebu Air, Inc. | | | 33,058 | | | | 69,573 | |
| Ryanair Holdings PLC (ADR) | | | 3,097 | | | | 90,866 | |
| | | | | | | | 160,439 | |
| Building Products 0.4% | |
| Compagnie de Saint-Gobain | | | 13,500 | | | | 874,281 | |
| Congoleum Corp.* | | | 190,000 | | | | 0 | |
| Daikin Industries Ltd. | | | 4,600 | | | | 163,024 | |
| | | | | | | | 1,037,305 | |
| Commercial Services & Supplies 0.3% | |
| Babcock International Group PLC | | | 13,356 | | | | 152,609 | |
| Quad Graphics, Inc. | | | 38 | | | | 1,477 | |
| | | Shares | | | Value ($) | |
| | | | | | | | | |
| Serco Group PLC | | | 8,918 | | | | 79,035 | |
| Stericycle, Inc.* | | | 8,102 | | | | 722,050 | |
| | | | | | | | 955,171 | |
| Construction & Engineering 0.1% | |
| Aecom Technology Corp.* | | | 3,513 | | | | 96,045 | |
| Chicago Bridge & Iron Co. NV | | | 3,765 | | | | 146,459 | |
| Shui On Construction & Materials Ltd. | | | 48,522 | | | | 65,267 | |
| Yongnam Holdings Ltd. | | | 204,514 | | | | 44,274 | |
| | | | | | | | 352,045 | |
| Electrical Equipment 0.9% | |
| AMETEK, Inc. | | | 22,259 | | | | 999,429 | |
| Mitsubishi Electric Corp. | | | 28,900 | | | | 335,635 | |
| Prysmian SpA | | | 3,288 | | | | 66,137 | |
| Roper Industries, Inc. | | | 10,892 | | | | 907,303 | |
| Schneider Electric SA | | | 1,695 | | | | 283,187 | |
| | | | | | | | 2,591,691 | |
| Industrial Conglomerates 0.0% | |
| Keppel Corp., Ltd. | | | 1 | | | | 9 | |
| Machinery 1.9% | |
| Altra Holdings, Inc.* | | | 3,363 | | | | 80,678 | |
| Amtek Engineering Ltd.* | | | 114,245 | | | | 92,275 | |
| Andritz AG | | | 1,127 | | | | 116,044 | |
| Austal Ltd. | | | 25,013 | | | | 74,721 | |
| Charter International PLC | | | 5,093 | | | | 64,745 | |
| Dover Corp. | | | 22,913 | | | | 1,553,501 | |
| EVA Precision Industrial Holdings Ltd. | | | 404,394 | | | | 124,303 | |
| Joy Global, Inc. | | | 678 | | | | 64,573 | |
| Meritor, Inc.* | | | 23,973 | | | | 384,527 | |
| Nabtesco Corp. | | | 5,800 | | | | 140,625 | |
| Navistar International Corp.* | | | 12,553 | | | | 708,742 | |
| Parker Hannifin Corp. | | | 15,975 | | | | 1,433,596 | |
| Rational AG | | | 449 | | | | 118,334 | |
| Rotork PLC | | | 3,404 | | | | 92,115 | |
| SMC Corp. | | | 400 | | | | 72,067 | |
| SPX Corp. | | | 7,757 | | | | 641,194 | |
| | | | | | | | 5,762,040 | |
| Marine 0.1% | |
| Kawasaki Kisen Kaisha Ltd. | | | 43,000 | | | | 150,423 | |
| Mitsui O.S.K Lines Ltd. | | | 31,229 | | | | 168,055 | |
| | | | | | | | 318,478 | |
| Professional Services 0.0% | |
| Brunel International NV | | | 1,933 | | | | 85,273 | |
| Road & Rail 0.5% | |
| Norfolk Southern Corp. | | | 20,575 | | | | 1,541,685 | |
| Trading Companies & Distributors 0.6% | |
| JFE Shoji Holdings, Inc. | | | 13,581 | | | | 66,548 | |
| MISUMI Group, Inc. | | | 5,366 | | | | 138,946 | |
| Mitsubishi Corp. | | | 58,967 | | | | 1,477,415 | |
| Sumikin Bussan Corp. | | | 27,841 | | | | 67,586 | |
| | | | | | | | 1,750,495 | |
| Transportation Infrastructure 0.0% | |
| Koninklijke Vopak NV | | | 2,560 | | | | 125,449 | |
| Information Technology 9.4% | |
| Communications Equipment 1.2% | |
| Brocade Communications Systems, Inc.* | | | 72,290 | | | | 466,993 | |
| Cisco Systems, Inc. | | | 37,759 | | | | 589,418 | |
| Harris Corp. | | | 1,867 | | | | 84,127 | |
| Nokia Corp. | | | 16,000 | | | | 103,338 | |
| | | Shares | | | Value ($) | |
| | | | | | | | | |
| QUALCOMM, Inc. | | | 35,395 | | | | 2,010,082 | |
| Riverbed Technology, Inc.* | | | 8,971 | | | | 355,162 | |
| Sycamore Networks, Inc. | | | 2,491 | | | | 55,400 | |
| | | | | | | | 3,664,520 | |
| Computers & Peripherals 2.0% | |
| Apple, Inc.* | | | 10,432 | | | | 3,501,709 | |
| EMC Corp.* | | | 69,445 | | | | 1,913,210 | |
| Hewlett-Packard Co. | | | 13,344 | | | | 485,722 | |
| | | | | | | | 5,900,641 | |
| Electronic Equipment, Instruments & Components 0.2% | |
| Cognex Corp. | | | 2,280 | | | | 80,781 | |
| E Ink Holdings, Inc.* | | | 56,742 | | | | 106,990 | |
| Itron, Inc.* | | | 2,224 | | | | 107,108 | |
| Kingboard Chemical Holdings Ltd. | | | 19,661 | | | | 91,659 | |
| Nippon Electric Glass Co., Ltd. | | | 9,000 | | | | 115,293 | |
| Star Micronics Co., Ltd. | | | 5,833 | | | | 69,175 | |
| Venture Corp., Ltd. | | | 12,752 | | | | 88,787 | |
| | | | | | | | 659,793 | |
| Internet Software & Services 0.3% | |
| Google, Inc. "A"* | | | 1,288 | | | | 652,217 | |
| Internet Initiative Japan, Inc. | | | 23 | | | | 89,156 | |
| Meetic* | | | 879 | | | | 19,072 | |
| NIC, Inc. | | | 6,210 | | | | 83,587 | |
| United Internet AG (Registered) | | | 5,689 | | | | 119,577 | |
| | | | | | | | 963,609 | |
| IT Services 1.1% | |
| Accenture PLC "A" | | | 16,691 | | | | 1,008,470 | |
| Cap Gemini | | | 4,900 | | | | 287,090 | |
| Cardtronics, Inc.* | | | 5,271 | | | | 123,605 | |
| Digital Garage, Inc.* | | | 18 | | | | 73,528 | |
| International Business Machines Corp. | | | 4,928 | | | | 845,398 | |
| VeriFone Systems, Inc.* | | | 19,430 | | | | 861,721 | |
| | | | | | | | 3,199,812 | |
| Semiconductors & Semiconductor Equipment 1.1% | |
| ARM Holdings PLC | | | 13,511 | | | | 127,781 | |
| EZchip Semiconductor Ltd.* | | | 1,906 | | | | 70,465 | |
| FSI International, Inc.* | | | 14,306 | | | | 39,198 | |
| Intel Corp. | | | 101,555 | | | | 2,250,459 | |
| Lam Research Corp.* | | | 1,127 | | | | 49,904 | |
| Skyworks Solutions, Inc.* | | | 28,826 | | | | 662,421 | |
| | | | | | | | 3,200,228 | |
| Software 3.5% | |
| Adobe Systems, Inc.* | | | 10,005 | | | | 314,657 | |
| Check Point Software Technologies Ltd.* | | | 12,150 | | | | 690,727 | |
| Concur Technologies, Inc.* | | | 10,171 | | | | 509,262 | |
| Dassault Systemes SA | | | 16,200 | | | | 1,379,308 | |
| Microsoft Corp. | | | 94,287 | | | | 2,451,462 | |
| NetQin Mobile, Inc. "A" (ADR)* (b) | | | 2,799 | | | | 15,394 | |
| Oracle Corp. | | | 64,547 | | | | 2,124,242 | |
| Rovi Corp.* | | | 1,674 | | | | 96,021 | |
| SAP AG | | | 34,098 | | | | 2,062,319 | |
| Solera Holdings, Inc. | | | 11,561 | | | | 683,949 | |
| TiVo, Inc.* | | | 5,675 | | | | 58,396 | |
| VanceInfo Technologies, Inc. (ADR)* | | | 2,712 | | | | 62,674 | |
| | | | | | | | 10,448,411 | |
| | | Shares | | | Value ($) | |
| | | | | | | | | �� |
| Materials 2.8% | |
| Chemicals 1.6% | |
| Air Products & Chemicals, Inc. | | | 12,865 | | | | 1,229,637 | |
| Huntsman Corp. | | | 68,938 | | | | 1,299,481 | |
| Lanxess AG | | | 3,200 | | | | 262,343 | |
| Praxair, Inc. | | | 8,859 | | | | 960,227 | |
| STR Holdings, Inc.* | | | 3,279 | | | | 48,923 | |
| The Mosaic Co. | | | 11,742 | | | | 795,286 | |
| | | | | | | | 4,595,897 | |
| Containers & Packaging 0.5% | |
| Owens-Illinois, Inc.* | | | 18,058 | | | | 466,077 | |
| Sonoco Products Co. | | | 29,658 | | | | 1,054,045 | |
| | | | | | | | 1,520,122 | |
| Metals & Mining 0.7% | |
| Cliffs Natural Resources, Inc. | | | 718 | | | | 66,379 | |
| Freeport-McMoRan Copper & Gold, Inc. | | | 27,432 | | | | 1,451,153 | |
| Lynas Corp., Ltd.* | | | 47,284 | | | | 102,952 | |
| Newcrest Mining Ltd. | | | 6,550 | | | | 265,868 | |
| Northam Platinum Ltd. | | | 7,994 | | | | 50,310 | |
| Randgold Resources Ltd. (ADR) | | | 921 | | | | 77,410 | |
| Thompson Creek Metals Co., Inc.* | | | 5,513 | | | | 55,020 | |
| | | | | | | | 2,069,092 | |
| Paper & Forest Products 0.0% | |
| Schweitzer-Mauduit International, Inc. | | | 1,793 | | | | 100,677 | |
| Telecommunication Services 2.0% | |
| Diversified Telecommunication Services 1.3% | |
| AT&T, Inc. | | | 46,605 | | | | 1,463,863 | |
| CenturyLink, Inc. | | | 36,937 | | | | 1,493,363 | |
| Inmarsat PLC | | | 14,600 | | | | 130,329 | |
| TeliaSonera AB | | | 115,800 | | | | 849,507 | |
| | | | | | | | 3,937,062 | |
| Wireless Telecommunication Services 0.7% | |
| American Tower Corp. "A"* | | | 19,137 | | | | 1,001,439 | |
| Softbank Corp. | | | 7,300 | | | | 276,486 | |
| Vodafone Group PLC (ADR) | | | 33,702 | | | | 900,517 | |
| | | | | | | | 2,178,442 | |
| Utilities 2.7% | |
| Electric Utilities 2.0% | |
| American Electric Power Co., Inc. | | | 21,326 | | | | 803,564 | |
| Duke Energy Corp. | | | 37,361 | | | | 703,508 | |
| Entergy Corp. | | | 12,976 | | | | 886,001 | |
| Exelon Corp. | | | 25,175 | | | | 1,078,497 | |
| FirstEnergy Corp. | | | 29,293 | | | | 1,293,286 | |
| Kyushu Electric Power Co., Inc. | | | 8,100 | | | | 146,057 | |
| Red Electrica Corporacion SA | | | 4,600 | | | | 277,965 | |
| Southern Co. | | | 19,094 | | | | 771,016 | |
| Tokyo Electric Power Co., Inc. | | | 28,100 | | | | 115,421 | |
| | | | | | | | 6,075,315 | |
| Gas Utilities 0.1% | |
| Snam Rete Gas SpA | | | 50,800 | | | | 300,737 | |
| Multi-Utilities 0.6% | |
| Centrica PLC | | | 27,800 | | | | 144,256 | |
| GDF Suez | | | 7,294 | | | | 266,938 | |
| National Grid PLC | | | 14,500 | | | | 142,690 | |
| PG&E Corp. | | | 25,175 | | | | 1,058,105 | |
| | | | | | | | 1,611,989 | |
Total Common Stocks (Cost $130,132,762) | | | | 160,417,929 | |
| | |
| | | Shares | | | Value ($) | |
| | | | | | | | | |
| Preferred Stocks 0.2% | |
| Consumer Discretionary | |
| Porsche Automobil Holding SE | | | 4,100 | | | | 325,220 | |
| Volkswagen AG | | | 1,496 | | | | 308,438 | |
Total Preferred Stocks (Cost $571,209) | | | | 633,658 | |
| | |
| Warrants 0.0% | |
| Consumer Discretionary 0.0% | |
| Reader's Digest Association, Inc., Expiration Date 2/19/2014* | | | 80 | | | | 2 | |
| Information Technology 0.0% | |
| Kingboard Chemical Holdings Ltd., Expiration Date 10/31/2012* | | | 3,400 | | | | 1,770 | |
| Materials 0.0% | |
| Hercules Trust II, Expiration Date 3/31/2029* | | | 170 | | | | 1,708 | |
Total Warrants (Cost $30,283) | | | | 3,480 | |
| | | Principal Amount ($) (a) | | | Value ($) | |
| | | | |
| Corporate Bonds 6.2% | |
| Consumer Discretionary 0.9% | |
| AMC Entertainment, Inc.: | |
| 8.0%, 3/1/2014 | | | | 35,000 | | | | 35,087 | |
| 8.75%, 6/1/2019 | | | | 35,000 | | | | 36,925 | |
| Asbury Automotive Group, Inc., 7.625%, 3/15/2017 | | | 35,000 | | | | 34,738 | |
| Avis Budget Car Rental LLC, 8.25%, 1/15/2019 | | | 15,000 | | | | 15,188 | |
| CanWest LP, 144A, 9.25%, 8/1/2015* | | | 25,000 | | | | 4,250 | |
| Carrols Corp., 9.0%, 1/15/2013 | | | 15,000 | | | | 15,038 | |
| CBS Corp., 5.9%, 10/15/2040 | | | | 270,000 | | | | 258,426 | |
| DineEquity, Inc., 144A, 9.5%, 10/30/2018 | | | 10,000 | | | | 10,850 | |
| DIRECTV Holdings LLC: | |
| 6.0%, 8/15/2040 | | | | 530,000 | | | | 537,364 | |
| 6.35%, 3/15/2040 | | | | 51,000 | | | | 53,648 | |
| DISH DBS Corp.: | |
| 6.625%, 10/1/2014 | | | | 40,000 | | | | 42,100 | |
| 7.125%, 2/1/2016 | | | | 35,000 | | | | 36,925 | |
| Fontainebleau Las Vegas Holdings LLC, 144A, 11.0%, 6/15/2015* | | | 25,000 | | | | 13 | |
| Great Canadian Gaming Corp., 144A, 7.25%, 2/15/2015 | | | 30,000 | | | | 30,675 | |
| Home Depot, Inc.: | |
| 5.4%, 9/15/2040 | | | | 125,000 | | | | 119,190 | |
| 5.875%, 12/16/2036 | | | | 50,000 | | | | 51,172 | |
| Mediacom Broadband LLC, 8.5%, 10/15/2015 | | | 20,000 | | | | 20,500 | |
| NBCUniversal Media LLC, 144A, 5.95%, 4/1/2041 | | | 247,000 | | | | 251,172 | |
| Penske Automotive Group, Inc., 7.75%, 12/15/2016 | | | 50,000 | | | | 51,000 | |
| Sears Holdings Corp., 144A, 6.625%, 10/15/2018 | | | 10,000 | | | | 9,275 | |
| TCI Communications, Inc., 8.75%, 8/1/2015 | | | 135,000 | | | | 165,705 | |
| Time Warner, Inc.: | |
| 5.875%, 11/15/2016 | | | | 147,000 | | | | 168,027 | |
| 6.2%, 3/15/2040 | | | | 175,000 | | | | 179,283 | |
| 7.625%, 4/15/2031 | | | | 175,000 | | | | 209,961 | |
| | | Principal Amount ($) (a) | | | Value ($) | |
| | | | | | | | | |
| Travelport LLC, 4.879%**, 9/1/2014 | | | 20,000 | | | | 17,050 | |
| Unitymedia Hessen GmbH & Co., KG, 144A, 8.125%, 12/1/2017 | | | 100,000 | | | | 106,250 | |
| Yum! Brands, Inc.: | |
| 3.875%, 11/1/2020 | | | | 210,000 | | | | 203,840 | |
| 5.3%, 9/15/2019 | | | | 65,000 | | | | 69,867 | |
| | | | | 2,733,519 | |
| Consumer Staples 0.5% | |
| Anheuser-Busch InBev Worldwide, Inc., 7.75%, 1/15/2019 | | | 500,000 | | | | 629,022 | |
| CVS Caremark Corp., 5.75%, 5/15/2041 | | | 130,000 | | | | 127,820 | |
| Kraft Foods, Inc., 5.375%, 2/10/2020 | | | 600,000 | | | | 655,919 | |
| Kroger Co., 5.4%, 7/15/2040 | | | | 110,000 | | | | 105,703 | |
| North Atlantic Trading Co., 144A, 10.0%, 3/1/2012 | | | 108,750 | | | | 106,847 | |
| SUPERVALU, Inc., 8.0%, 5/1/2016 | | | 10,000 | | | | 10,200 | |
| | | | | 1,635,511 | |
| Energy 0.7% | |
| BreitBurn Energy Partners LP, 8.625%, 10/15/2020 | | | 10,000 | | | | 10,550 | |
| Bristow Group, Inc., 7.5%, 9/15/2017 | | | 30,000 | | | | 31,425 | |
| DCP Midstream LLC, 144A, 9.75%, 3/15/2019 | | | 200,000 | | | | 261,395 | |
| El Paso Corp., 7.25%, 6/1/2018 | | | 20,000 | | | | 22,464 | |
| Enterprise Products Operating LLC, 6.125%, 10/15/2039 | | | 230,000 | | | | 233,897 | |
| Kinder Morgan Energy Partners LP: | |
| 6.5%, 9/1/2039 | | | | 50,000 | | | | 51,919 | |
| 7.3%, 8/15/2033 | | | | 360,000 | | | | 410,165 | |
| ONEOK Partners LP, 6.15%, 10/1/2016 | | | 201,000 | | | | 231,280 | |
| Petrohawk Energy Corp., 7.875%, 6/1/2015 | | | 15,000 | | | | 15,712 | |
| Plains All American Pipeline LP, 8.75%, 5/1/2019 | | | 300,000 | | | | 377,406 | |
| Stone Energy Corp., 6.75%, 12/15/2014 | | | 25,000 | | | | 24,875 | |
| Weatherford International Ltd., 5.125%, 9/15/2020 | | | 300,000 | | | | 306,306 | |
| Williams Partners LP, 4.125%, 11/15/2020 | | | 253,000 | | | | 242,853 | |
| | | | | 2,220,247 | |
| Financials 2.4% | |
| American Express Co., 7.0%, 3/19/2018 | | | 390,000 | | | | 458,966 | |
| Ashton Woods USA LLC, 144A, Step-up Coupon, 0% to 6/30/2012, 11.0% to 6/30/2015 | | | 36,400 | | | | 22,022 | |
| Bank of America Corp., Series L, 7.625%, 6/1/2019 | | | 410,000 | | | | 474,941 | |
| Bunge Ltd. Finance Corp., 4.1%, 3/15/2016 | | | 110,000 | | | | 114,584 | |
| Calpine Construction Finance Co., LP, 144A, 8.0%, 6/1/2016 | | | 30,000 | | | | 32,400 | |
| CIT Group, Inc.: | |
| 7.0%, 5/1/2015 | | | | 355 | | | | 355 | |
| 144A, 7.0%, 5/4/2015 | | | | 65,000 | | | | 65,081 | |
| Citigroup, Inc., 5.375%, 8/9/2020 | | | 500,000 | | | | 521,781 | |
| CNA Financial Corp., 5.75%, 8/15/2021 | | | 365,000 | | | | 376,895 | |
| Fifth Third Bancorp., 5.45%, 1/15/2017 | | | 429,000 | | | | 459,511 | |
| | | Principal Amount ($) (a) | | | Value ($) | |
| | | | | | | | | |
| General Electric Capital Corp., 5.3%, 2/11/2021 | | | 185,000 | | | | 192,500 | |
| Hartford Financial Services Group, Inc., 5.95%, 10/15/2036 | | | 150,000 | | | | 141,242 | |
| JPMorgan Chase & Co., 2.6%, 1/15/2016 | | | 700,000 | | | | 690,360 | |
| KeyCorp, 5.1%, 3/24/2021 | | | | 250,000 | | | | 254,623 | |
| Lincoln National Corp., 8.75%, 7/1/2019 | | | 190,000 | | | | 239,761 | |
| MetLife, Inc.: | |
| 6.75%, 6/1/2016 | | | | 113,000 | | | | 131,527 | |
| 7.717%, 2/15/2019 | | | | 250,000 | | | | 302,606 | |
| Morgan Stanley: | |
| 3.45%, 11/2/2015 | | | | 45,000 | | | | 44,576 | |
| 5.75%, 1/25/2021 | | | | 260,000 | | | | 263,076 | |
| Nationwide Financial Services, Inc., 144A, 5.375%, 3/25/2021 | | | 119,000 | | | | 119,528 | |
| Navios Maritime Acquisition Corp., 8.625%, 11/1/2017 | | | 10,000 | | | | 9,850 | |
| Nielsen Finance LLC, 144A, 7.75%, 10/15/2018 | | | 10,000 | | | | 10,500 | |
| PNC Bank NA, 6.875%, 4/1/2018 | | | 300,000 | | | | 353,594 | |
| Prudential Financial, Inc.: | |
| Series B, 5.1%, 9/20/2014 | | | | 100,000 | | | | 108,718 | |
| 6.2%, 1/15/2015 | | | | 100,000 | | | | 111,954 | |
| 7.375%, 6/15/2019 | | | | 30,000 | | | | 35,577 | |
| Royal Bank of Scotland PLC, 6.125%, 1/11/2021 | | | 210,000 | | | | 215,274 | |
| Santander US Debt SA Unipersonal, 144A, 2.991%, 10/7/2013 | | | 500,000 | | | | 498,862 | |
| SunTrust Banks, Inc., 3.6%, 4/15/2016 | | | 98,000 | | | | 98,951 | |
| The Goldman Sachs Group, Inc., 6.15%, 4/1/2018 | | | 400,000 | | | | 435,337 | |
| Tropicana Entertainment LLC, 9.625%, 12/15/2014* | | | 75,000 | | | | 38 | |
| Wells Fargo & Co., 4.6%, 4/1/2021 | | | 310,000 | | | | 311,721 | |
| | | | | 7,096,711 | |
| Health Care 0.5% | |
| Amgen, Inc., 5.65%, 6/15/2042 | | | 89,000 | | | | 89,144 | |
| Express Scripts, Inc.: | |
| 6.25%, 6/15/2014 | | | | 250,000 | | | | 281,531 | |
| 7.25%, 6/15/2019 | | | | 320,000 | | | | 382,741 | |
| HCA, Inc., 8.5%, 4/15/2019 | | | | 10,000 | | | | 11,050 | |
| McKesson Corp., 4.75%, 3/1/2021 | | | 200,000 | | | | 207,535 | |
| Quest Diagnostics, Inc.: | |
| 4.7%, 4/1/2021 | | | | 300,000 | | | | 307,091 | |
| 6.4%, 7/1/2017 | | | | 250,000 | | | | 288,443 | |
| | | | | 1,567,535 | |
| Industrials 0.3% | |
| Actuant Corp., 6.875%, 6/15/2017 | | | 20,000 | | | | 20,450 | |
| ARAMARK Corp., 8.5%, 2/1/2015 | | | 10,000 | | | | 10,388 | |
| BE Aerospace, Inc., 8.5%, 7/1/2018 | | | 50,000 | | | | 54,562 | |
| Belden, Inc., 7.0%, 3/15/2017 | | | | 25,000 | | | | 25,625 | |
| Cenveo Corp., 144A, 10.5%, 8/15/2016 | | | 10,000 | | | | 9,825 | |
| Congoleum Corp., 9.0%, 12/31/2017 (PIK) | | | 62,700 | | | | 40,755 | |
| Corrections Corp. of America, 7.75%, 6/1/2017 | | | 10,000 | | | | 10,888 | |
| CSX Corp.: | |
| 6.15%, 5/1/2037 | | | | 150,000 | | | | 160,621 | |
| 6.25%, 3/15/2018 | | | | 190,000 | | | | 219,228 | |
| | | Principal Amount ($) (a) | | | Value ($) | |
| | | | | | | | | |
| Owens Corning, Inc., 9.0%, 6/15/2019 | | | 10,000 | | | | 11,944 | |
| Republic Services, Inc., 5.7%, 5/15/2041 | | | 155,000 | | | | 151,314 | |
| United Rentals North America, Inc., 10.875%, 6/15/2016 | | | 35,000 | | | | 39,156 | |
| | | | | 754,756 | |
| Information Technology 0.3% | �� |
| Alcatel-Lucent USA, Inc., 6.45%, 3/15/2029 | | | 30,000 | | | | 27,000 | |
| Applied Materials, Inc., 5.85%, 6/15/2041 | | | 260,000 | | | | 263,713 | |
| eBay, Inc., 1.625%, 10/15/2015 | | | 500,000 | | | | 488,565 | |
| MasTec, Inc., 7.625%, 2/1/2017 | | | 35,000 | | | | 35,613 | |
| Vangent, Inc., 9.625%, 2/15/2015 | | | 15,000 | | | | 15,150 | |
| | | | | 830,041 | |
| Materials 0.3% | |
| Appleton Papers, Inc., 11.25%, 12/15/2015 | | | 15,000 | | | | 15,150 | |
| Crown Americas LLC, 7.625%, 5/15/2017 | | | 10,000 | | | | 10,713 | |
| Domtar Corp., 10.75%, 6/1/2017 | | | 20,000 | | | | 26,025 | |
| Dow Chemical Co., 4.25%, 11/15/2020 | | | 185,000 | | | | 180,552 | |
| GEO Specialty Chemicals, Inc.: | |
| 7.5%, 3/31/2015 (PIK) | | | | 209,283 | | | | 192,540 | |
| 10.0%, 3/31/2015 | | | | 206,080 | | | | 204,019 | |
| Graphic Packaging International, Inc., 9.5%, 6/15/2017 | | | 30,000 | | | | 32,850 | |
| NewMarket Corp., 7.125%, 12/15/2016 | | | 65,000 | | | | 67,763 | |
| Owens-Brockway Glass Container, Inc., 7.375%, 5/15/2016 | | | 10,000 | | | | 10,875 | |
| Radnor Holdings Corp., 11.0%, 3/15/2010* | | | 40,000 | | | | 4 | |
| Silgan Holdings, Inc., 7.25%, 8/15/2016 | | | 20,000 | | | | 21,100 | |
| Wolverine Tube, Inc., 15.0%, 3/31/2012 (PIK)* | | | 43,120 | | | | 20,805 | |
| | | | | 782,396 | |
| Telecommunication Services 0.1% | |
| American Tower Corp., 7.25%, 5/15/2019 | | | | 175,000 | | | | 197,429 | |
| Cincinnati Bell, Inc., 8.375%, 10/15/2020 | | | | 20,000 | | | | 19,950 | |
| Cricket Communications, Inc., 10.0%, 7/15/2015 | | | | 50,000 | | | | 53,875 | |
| ERC Ireland Preferred Equity Ltd., 144A, 8.42%**, 2/15/2017 (PIK) | EUR | | | 112,944 | | | | 819 | |
| Verizon Communications, Inc., 4.6%, 4/1/2021 | | | | 116,000 | | | | 119,688 | |
| West Corp., 144A, 8.625%, 10/1/2018 | | | | 10,000 | | | | 10,100 | |
| Windstream Corp., 7.0%, 3/15/2019 | | | | 25,000 | | | | 25,250 | |
| | | | | 427,111 | |
| Utilities 0.2% | |
| AES Corp.: | |
| 8.0%, 10/15/2017 | | | | 35,000 | | | | 37,100 | |
| 8.0%, 6/1/2020 | | | | 30,000 | | | | 31,950 | |
| DTE Energy Co., 7.625%, 5/15/2014 | | | 81,000 | | | | 93,496 | |
| FirstEnergy Solutions Corp., 6.8%, 8/15/2039 | | | 234,000 | | | | 243,330 | |
| | | Principal Amount ($) (a) | | | Value ($) | |
| | | | | | | | | |
| Sempra Energy, 6.5%, 6/1/2016 | | | 135,000 | | | | 156,342 | |
| | | | | 562,218 | |
Total Corporate Bonds (Cost $18,045,716) | | | | 18,610,045 | |
| | |
| Asset-Backed 0.5% | |
| Automobile Receivables 0.1% | |
| Ford Credit Auto Owner Trust, "B", Series 2007-B, 5.69%, 11/15/2012 | | | 379,000 | | | | 388,109 | |
| Student Loans 0.4% | |
| Nelnet Student Loan Trust: | |
| "A1", Series 2007-1, 0.267%**, 11/27/2018 | | | 543,285 | | | | 536,162 | |
| "A4", Series 2006-1, 0.349%**, 11/23/2022 | | | 675,000 | | | | 662,531 | |
| | | | | 1,198,693 | |
Total Asset-Backed (Cost $1,579,235) | | | | 1,586,802 | |
| | |
| Mortgage-Backed Securities Pass-Throughs 5.6% | |
| Federal Home Loan Mortgage Corp.: | |
| 4.0%, 8/1/2039 | | | | 1,702,881 | | | | 1,709,600 | |
| 6.0%, 3/1/2038 | | | | 32,027 | | | | 35,172 | |
| Federal National Mortgage Association: | |
| 3.193%**, 8/1/2037 | | | | 158,426 | | | | 165,669 | |
| 3.5%, 8/1/2025 (c) | | | | 2,275,000 | | | | 2,316,234 | |
| 4.0%, 5/1/2039 | | | | 1,674,953 | | | | 1,683,917 | |
| 4.5%, with various maturities from 9/1/2035 until 5/1/2041 (c) | | | 3,544,157 | | | | 3,668,905 | |
| 5.0%, with various maturities from 7/1/2036 until 3/1/2040 (c) | | | 3,708,897 | | | | 3,937,988 | |
| 6.0%, with various maturities from 1/1/2024 until 8/1/2037 | | | 1,845,748 | | | | 2,037,918 | |
| 6.5%, with various maturities from 5/1/2017 until 1/1/2038 | | | 49,434 | | | | 54,819 | |
| 8.0%, 9/1/2015 | | | | 58,203 | | | | 63,164 | |
| Government National Mortgage Association, 4.5%, 6/1/2039 (c) | | | 875,000 | | | | 923,467 | |
Total Mortgage-Backed Securities Pass-Throughs (Cost $16,549,579) | | | | 16,596,853 | |
| | |
| Commercial Mortgage-Backed Securities 2.6% | |
| Banc of America Commercial Mortgage, Inc.: | | | | | | | | |
| "A5A", Series 2005-4, 4.933%, 7/10/2045 | | | 575,000 | | | | 613,362 | |
| "A4", Series 2006-3, 5.889%, 7/10/2044 | | | 750,000 | | | | 824,697 | |
| Bear Stearns Commercial Mortgage Securities, Inc., "A4", Series 2007-PW18, 5.7%, 6/11/2050 | | | 400,000 | | | | 434,777 | |
| Citigroup/Deutsche Bank Commercial Mortgage Trust, "A5", Series 2006-CD3, 5.617%, 10/15/2048 | | | 350,000 | | | | 379,900 | |
| Commercial Mortgage Pass-Through Certificates, "A4", Series 2007-C9, 6.008%**, 12/10/2049 | | | 550,000 | | | | 604,109 | |
| | | Principal Amount ($) (a) | | | Value ($) | |
| | | | | | | | | |
| Greenwich Capital Commercial Funding Corp., "A4", Series 2007-GG9, 5.444%, 3/10/2039 | | | 550,000 | | | | 589,983 | |
| GS Mortgage Securities Corp. II, "A4A", Series 2005-GG4, 4.751%, 7/10/2039 | | | 750,000 | | | | 799,459 | |
| LB-UBS Commercial Mortgage Trust: | |
| "A2", Series 2005-C2, 4.821%, 4/15/2030 | | | | 7,765 | | | | 7,771 | |
| "A4", Series 2006-C1, 5.156%, 2/15/2031 | | | | 1,250,000 | | | | 1,352,457 | |
| "A3", Series 2006-C7, 5.347%, 11/15/2038 | | | | 700,000 | | | | 753,542 | |
| "A4", Series 2007-C6, 5.858%, 7/15/2040 | | | | 260,000 | | | | 282,086 | |
| Wachovia Bank Commercial Mortgage Trust, "A4", Series 2005-C22, 5.44%**, 12/15/2044 | | | 885,000 | | | | 959,208 | |
Total Commercial Mortgage-Backed Securities (Cost $7,444,405) | | | | 7,601,351 | |
| | |
| Collateralized Mortgage Obligations 0.2% | |
| Federal Home Loan Mortgage Corp., "H", Series 2278, 6.5%, 1/15/2031 | | | 5,380 | | | | 6,047 | |
| Government National Mortgage Association: | | | | | | | | |
| "IU", Series 2010-164, Interest Only, 2.0%, 12/20/2013 | | | 1,640,757 | | | | 63,431 | |
| "PI", Series 2010-84, Interest Only, 4.5%, 2/20/2033 | | | 3,392,789 | | | | 319,157 | |
| "IA", Series 2010-58, Interest Only, 5.0%, 3/20/2039 | | | 1,054,753 | | | | 226,735 | |
Total Collateralized Mortgage Obligations (Cost $614,601) | | | | 615,370 | |
| | |
| Government & Agency Obligations 10.1% | |
| Sovereign Bonds 2.8% | |
| Federal Republic of Germany-Inflation Linked Note, 2.25%, 4/15/2013 | EUR | | | 219,896 | | | | 329,054 | |
| Government of Canada-Inflation Linked Bond, 4.0%, 12/1/2031 | CAD | | | 275,274 | | | | 444,869 | |
| Government of France-Inflation Linked Bonds: | | |
| 1.0%, 7/25/2017 | EUR | | | 247,523 | | | | 364,724 | |
| 2.25%, 7/25/2020 | EUR | | | 645,266 | | | | 1,022,474 | |
| 3.15%, 7/25/2032 | EUR | | | 496,877 | | | | 908,248 | |
| Government of Japan-Inflation Linked Bond, Series 9, 1.1%, 9/10/2016 | JPY | | | 41,790,000 | | | | 537,526 | |
| Government of Sweden-Inflation Linked Bond, Series 3105, 3.5%, 12/1/2015 | SEK | | | 2,650,000 | | | | 572,508 | |
| Republic of Italy-Inflation Linked Bond, 2.1%, 9/15/2017 | EUR | | | 89,394 | | | | 126,717 | |
| Republic of Poland, 6.375%, 7/15/2019 | | | | 100,000 | | | | 114,250 | |
| State of Qatar, 144A, 6.4%, 1/20/2040 | | | | 100,000 | | | | 110,500 | |
| | | Principal Amount ($) (a) | | | Value ($) | |
| | | | | | | | | |
| United Kingdom Treasury-Inflation Linked Bonds: | | |
| 1.125%, 11/22/2037 | GBP | | | 556,171 | | | | 996,797 | |
| 1.875%, 11/22/2022 | GBP | | | 524,147 | | | | 964,807 | |
| 2.0%, 1/26/2035 | GBP | | | 190,000 | | | | 529,712 | |
| 2.5%, 8/16/2013 | GBP | | | 75,000 | | | | 345,237 | |
| 2.5%, 7/26/2016 | GBP | | | 112,000 | | | | 593,495 | |
| 2.5%, 4/16/2020 | GBP | | | 71,000 | | | | 381,293 | |
| | | | | 8,342,211 | |
| US Treasury Obligations 7.3% | |
| US Treasury Bill, 0.135%***, 9/15/2011 (d) | | | | 221,000 | | | | 220,991 | |
| US Treasury Bonds: | |
| 4.75%, 2/15/2037 | | | | 1,500,000 | | | | 1,604,766 | |
| 5.375%, 2/15/2031 | | | | 1,000,000 | | | | 1,172,031 | |
| 7.125%, 2/15/2023 | | | | 2,800,000 | | | | 3,792,250 | |
| US Treasury Inflation-Indexed Bonds: | |
| 2.125%, 2/15/2040 | | | | 88,429 | | | | 96,229 | |
| 2.375%, 1/15/2025 | | | | 799,232 | | | | 918,618 | |
| 3.625%, 4/15/2028 | | | | 618,657 | | | | 814,645 | |
| 3.875%, 4/15/2029 | | | | 218,850 | | | | 299,875 | |
| US Treasury Inflation-Indexed Notes: | |
| 1.875%, 7/15/2015 | | | | 190,743 | | | | 210,324 | |
| 2.375%, 1/15/2017 | | | | 752,632 | | | | 858,588 | |
| 2.5%, 7/15/2016 | | | | 495,476 | | | | 567,011 | |
| 3.0%, 7/15/2012 | | | | 133,814 | | | | 139,627 | |
| US Treasury Notes: | |
| 1.0%, 1/15/2014 | | | | 605,000 | | | | 610,341 | |
| 1.75%, 1/31/2014 | | | | 8,000,000 | | | | 8,221,872 | |
| 3.125%, 5/15/2019 | | | | 500,000 | | | | 516,250 | |
| 4.5%, 11/15/2015 | | | | 1,500,000 | | | | 1,693,359 | |
| | | | | 21,736,777 | |
Total Government & Agency Obligations (Cost $28,069,461) | | | | 30,078,988 | |
| | |
| Loan Participations and Assignments 0.0% | |
| Senior Loans** | |
| Hawker Beechcraft Acquisition Co., LLC: | |
| Term Loan, 2.186%, 3/26/2014 | | | 21,604 | | | | 18,234 | |
| Letter of Credit, 2.246%, 3/26/2014 | | | 1,336 | | | | 1,127 | |
Total Loan Participations and Assignments (Cost $22,428) | | | | 19,361 | |
| | |
| Municipal Bonds and Notes 0.3% | |
| California, University Revenues, Build America Bonds, 5.946%, 5/15/2045 (e) | | | 125,000 | | | | 117,648 | |
| Chicago, IL, Transit Authority, Sales Tax Receipts Revenue, Build America Bonds, Series B, 6.2%, 12/1/2040 (e) | | | 185,000 | | | | 186,894 | |
| | | Principal Amount ($) (a) | | | Value ($) | |
| | | | | | | | | |
| Kentucky, Asset/Liability Commission, General Fund Revenue, 3.165%, 4/1/2018 (e) | | | 500,000 | | | | 502,285 | |
| Louisville & Jefferson County, KY, Metropolitan Sewer District & Drain System, Build America Bonds, 6.25%, 5/15/2043 (e) | | | 150,000 | | | | 157,269 | |
Total Municipal Bonds and Notes (Cost $960,265) | | | | 964,096 | |
| | |
| Preferred Securities 0.1% | |
| Financials 0.1% | |
| Farm Credit Bank of Texas, Series 1, 7.561%, 12/15/2013 (f) | | | 218,000 | | | | 228,440 | |
| Materials 0.0% | |
| Hercules, Inc., 6.5%, 6/30/2029 | | | 40,000 | | | | 33,800 | |
Total Preferred Securities (Cost $243,668) | | | | 262,240 | |
| | | Units | | | Value ($) | |
| | | | |
| Other Investments 0.0% | |
| Consumer Discretionary | |
| AOT Bedding Super Holdings LLC* (Cost $2,000) | | | 2 | | | | 2,000 | |
| | | Shares | | | Value ($) | |
| | | | |
| Exchange-Traded Funds 13.5% | |
| iShares JPMorgan USD Emerging Markets Bond Fund | | | 40,448 | | | | 4,421,775 | |
| iShares Russell 2000 Value Index Fund | | | 81,296 | | | | 5,967,939 | |
| SPDR Barclays Capital International Treasury Bond | | | 71,890 | | | | 4,440,645 | |
| Vanguard MSCI Emerging Markets | | | 185,417 | | | | 9,014,975 | |
| Vanguard Total Bond Market Fund | | | 200,217 | | | | 16,249,612 | |
Total Exchange-Traded Funds (Cost $33,830,689) | | | | 40,094,946 | |
| | |
| Securities Lending Collateral 0.0% | |
| Daily Assets Fund Institutional, 0.13% (g) (h) (Cost $14,479) | | | 14,479 | | | | 14,479 | |
| | |
| Cash Equivalents 8.1% | |
| Central Cash Management Fund, 0.11% (g) (Cost $24,016,675) | | | 24,016,675 | | | | 24,016,675 | |
| | | % of Net Assets | | | Value ($) | |
| | | | |
Total Investment Portfolio (Cost $262,127,455)+ | | | 101.2 | | | | 301,518,273 | |
| Other Assets and Liabilities, Net | | | (1.2 | ) | | | (3,501,249 | ) |
| Net Assets | | | 100.0 | | | | 298,017,024 | |
The following table represents bonds that are in default:
| | | Coupon | | Maturity Date | | Principal Amount ($) | | Acquisition Cost ($) | | | Value ($) | |
| CanWest LP* | | | 9.25 | % | 8/1/2015 | | | 25,000 | | USD | | | 25,000 | | | | 4,250 | |
| Fontainebleau Las Vegas Holdings LLC* | | | 11.0 | % | 6/15/2015 | | | 25,000 | | USD | | | 25,000 | | | | 13 | |
| Radnor Holdings Corp.* | | | 11.0 | % | 3/15/2010 | | | 40,000 | | USD | | | 25,775 | | | | 4 | |
| Tropicana Entertainment LLC* | | | 9.625 | % | 12/15/2014 | | | 75,000 | | USD | | | 55,245 | | | | 38 | |
| Wolverine Tube, Inc.* | | | 15.0 | % | 3/31/2012 | | | 43,120 | | USD | | | 43,120 | | | | 20,805 | |
| | | | | | | | | | | | | | 174,140 | | | | 25,110 | |
* Non-income producing security. In the case of a bond, generally denotes that the issuer has defaulted on the payment of principal or interest or has filed for bankruptcy.
** These securities are shown at their current rate as of June 30, 2011. Floating rate securities' yields vary with a designated market index or market rate, such as the coupon-equivalent of the US Treasury bill rate.
*** Annualized yield at time of purchase; not a coupon rate.
+ The cost for federal income tax purposes was $265,206,582. At June 30, 2011, net unrealized appreciation for all securities based on tax cost was $36,311,691. This consisted of aggregate gross unrealized appreciation for all securities in which there was an excess of value over tax cost of $42,887,291 and aggregate gross unrealized depreciation for all securities in which there was an excess of tax cost over value of $6,575,600.
(a) Principal amount stated in US dollars unless otherwise noted.
(b) All or a portion of these securities were on loan (see Notes to Financial Statements). The value of all securities loaned at June 30, 2011 amounted to $13,849, which is 0.0% of net assets.
(c) When-issued or delayed delivery security included.
(d) At June 30, 2011, this security has been pledged, in whole or in part, to cover initial margin requirements for open futures contracts.
(e) Taxable issue.
(f) Date shown is call date; not a maturity date for the perpetual preferred securities.
(g) Affiliated fund managed by Deutsche Investment Management Americas Inc. The rate shown is the annualized seven-day yield at period end.
(h) Represents collateral held in connection with securities lending. Income earned by the Fund is net of borrower rebates.
144A: Security exempt from registration under Rule 144A of the Securities Act of 1933. These securities may be resold in transactions exempt from registration, normally to qualified institutional buyers.
ADR: American Depositary Receipt
CVA: Certificaten Van Aandelen
Interest Only: Interest Only (IO) bonds represent the "interest only" portion of payments on a pool of underlying mortgages or mortgage-backed securities. IO securities are subject to prepayment risk of the pool of underlying mortgages.
MSCI: Morgan Stanley Capital International
PIK: Denotes that all or a portion of the income is paid in-kind.
REIT: Real Estate Investment Trust
SPDR: Standard & Poor's Depositary Receipt
Included in the portfolio are investments in mortgage- or asset-backed securities which are interests in separate pools of mortgages or assets. Effective maturities of these investments may be shorter than stated maturities due to prepayments. Some separate investments in the Federal National Mortgage Association issues which have similar coupon rates have been aggregated for presentation purposes in this investment portfolio.
At June 30, 2011, open futures contracts purchased were as follows:
| Futures | Currency | Expiration Date | | Contracts | | | Notional Value ($) | | | Unrealized Appreciation/ (Depreciation) ($) | |
| 10 Year Australian Treasury Bond | AUD | 9/15/2011 | | | 17 | | | | 1,933,777 | | | | (4,383 | ) |
| 10 Year Canadian Government Bond | CAD | 9/21/2011 | | | 31 | | | | 3,985,370 | | | | (28,928 | ) |
| 10 Year Japanese Government Bond | JPY | 9/8/2011 | | | 12 | | | | 21,023,290 | | | | 10,434 | |
| 2 Year US Treasury Note | USD | 9/30/2011 | | | 51 | | | | 11,186,531 | | | | 26,297 | |
| S&P 500 E-Mini Index | USD | 9/16/2011 | | | 20 | | | | 1,315,500 | | | | 30,950 | |
| United Kingdom Long Gilt Bond | GBP | 9/28/2011 | | | 4 | | | | 771,339 | | | | (3,964 | ) |
| Total net unrealized appreciation | | | | 30,406 | |
At June 30, 2011, open futures contracts sold were as follows:
| Futures | Currency | Expiration Date | | Contracts | | | Notional Value ($) | | | Unrealized Appreciation/ (Depreciation) ($) | |
| 10 Year US Treasury Note | USD | 9/21/2011 | | | 189 | | | | 23,120,016 | | | | (29,707 | ) |
| 30 Year US Treasury Bond | USD | 9/21/2011 | | | 20 | | | | 2,460,625 | | | | 63,750 | |
| Federal Republic of Germany Euro-Bund | EUR | 9/8/2011 | | | 30 | | | | 5,458,943 | | | | (16,097 | ) |
| Federal Republic of Germany Euro-Schatz | EUR | 9/8/2011 | | | 209 | | | | 32,597,907 | | | | (59,101 | ) |
| Total net unrealized depreciation | | | | (41,155 | ) |
As of June 30, 2011, the Fund had the following open forward foreign currency exchange contracts:
| Contracts to Deliver | | In Exchange For | | Settlement Date | | Unrealized Appreciation ($) | | Counterparty |
| USD | | | 2,654,108 | | EUR | | | 1,860,000 | | 7/19/2011 | | | 41,697 | | UBS AG |
| USD | | | 8,833,594 | | AUD | | | 8,320,000 | | 7/19/2011 | | | 67,864 | | UBS AG |
| USD | | | 346,778 | | CAD | | | 340,000 | | 7/19/2011 | | | 5,581 | | UBS AG |
| USD | | | 2,860,037 | | NZD | | | 3,540,000 | | 7/19/2011 | | | 68,970 | | UBS AG |
| USD | | | 9,182,782 | | SEK | | | 59,000,000 | | 7/19/2011 | | | 134,434 | | UBS AG |
| Total unrealized appreciation | | | | | 318,546 | |
| Contracts to Deliver | | In Exchange For | | Settlement Date | | Unrealized Depreciation ($) | | Counterparty |
| CAD | | | 5,530,000 | | USD | | | 5,681,322 | | 7/19/2011 | | | (49,693 | ) | UBS AG |
| CHF | | | 11,720,000 | | USD | | | 13,786,362 | | 7/19/2011 | | | (155,147 | ) | UBS AG |
| JPY | | | 170,200,000 | | USD | | | 2,106,631 | | 7/19/2011 | | | (7,724 | ) | UBS AG |
| NOK | | | 12,670,000 | | USD | | | 2,296,441 | | 7/19/2011 | | | (49,149 | ) | UBS AG |
| AUD | | | 4,280,000 | | USD | | | 4,526,802 | | 7/19/2011 | | | (52,313 | ) | UBS AG |
| EUR | | | 1,940,000 | | USD | | | 2,764,894 | | 7/19/2011 | | | (46,860 | ) | UBS AG |
| USD | | | 625,334 | | JPY | | | 50,210,000 | | 7/19/2011 | | | (1,587 | ) | UBS AG |
| USD | | | 4,624,619 | | GBP | | | 2,860,000 | | 7/19/2011 | | | (35,564 | ) | UBS AG |
| NZD | | | 9,600,000 | | USD | | | 7,784,928 | | 7/19/2011 | | | (158,143 | ) | UBS AG |
| Total unrealized depreciation | | | | | (556,180 | ) |
| Currency Abbreviations |
AUD Australian Dollar CAD Canadian Dollar CHF Swiss Franc EUR Euro GBP British Pound JPY Japanese Yen NOK Norwegian Krone NZD New Zealand Dollar SEK Swedish Krona USD United States Dollar |
For information on the Fund's policy and additional disclosures regarding futures contracts and forward foreign currency exchange contracts, please refer to Note B in the accompanying Notes to Financial Statements.
Fair Value Measurements
Various inputs are used in determining the value of the Fund's investments. These inputs are summarized in three broad levels. Level 1 includes quoted prices in active markets for identical securities. Level 2 includes other significant observable inputs (including quoted prices for similar securities, interest rates, prepayment speeds, and credit risk). Level 3 includes significant unobservable inputs (including the Fund's own assumptions in determining the fair value of investments). The inputs or methodology used for valuing securities are not necessarily an indication of the risk associated with investing in those securities.
The following is a summary of the inputs used as of June 30, 2011 in valuing the Fund's investments. For information on the Fund's policy regarding the valuation of investments, please refer to the Security Valuation section of Note A in the accompanying Notes to Financial Statements.
| Assets | | Level 1 | | | Level 2 | | | Level 3 | | | Total | |
| | |
Common Stocks and/or Other Equity Investments (i) Consumer Discretionary | | $ | 13,588,975 | | | $ | 3,005,435 | | | $ | 2,008 | | | $ | 16,596,418 | |
| Consumer Staples | | | 11,794,294 | | | | 3,377,152 | | | | — | | | | 15,171,446 | |
| Energy | | | 17,201,783 | | | | 2,771,168 | | | | — | | | | 19,972,951 | |
| Financials | | | 10,839,081 | | | | 8,616,327 | | | | — | | | | 19,455,408 | |
| Health Care | | | 16,142,475 | | | | 3,182,918 | | | | — | | | | 19,325,393 | |
| Industrials | | | 14,193,538 | | | | 5,910,088 | | | | 0 | | | | 20,103,626 | |
| Information Technology | | | 23,303,941 | | | | 4,734,843 | | | | — | | | | 28,038,784 | |
| Materials | | | 7,604,315 | | | | 681,473 | | | | 1,708 | | | | 8,287,496 | |
| Telecommunication Services | | | 4,859,182 | | | | 1,256,322 | | | | — | | | | 6,115,504 | |
| Utilities | | | 6,593,977 | | | | 1,394,064 | | | | — | | | | 7,988,041 | |
Fixed Income Investments (i) Corporate Bonds | | | — | | | | 18,168,477 | | | | 441,568 | | | | 18,610,045 | |
| Asset Backed | | | — | | | | 1,586,802 | | | | — | | | | 1,586,802 | |
| Mortgage-Backed Securities Pass-Throughs | | | — | | | | 16,596,853 | | | | — | | | | 16,596,853 | |
| Commercial Mortgage-Backed Securities | | | — | | | | 7,601,351 | | | | — | | | | 7,601,351 | |
| Collateralized Mortgage Obligations | | | — | | | | 615,370 | | | | — | | | | 615,370 | |
| Government & Agency Obligations | | | — | | | | 30,078,988 | | | | — | | | | 30,078,988 | |
| Loan Participations and Assignments | | | — | | | | 19,361 | | | | — | | | | 19,361 | |
| Municipal Bonds and Notes | | | — | | | | 964,096 | | | | — | | | | 964,096 | |
| Preferred Securities | | | — | | | | 262,240 | | | | — | | | | 262,240 | |
| Other Investments | | | — | | | | — | | | | 2,000 | | | | 2,000 | |
| Exchange-Traded Funds | | | 40,094,946 | | | | — | | | | — | | | | 40,094,946 | |
| Short-Term Investments (i) | | | 24,031,154 | | | | — | | | | — | | | | 24,031,154 | |
| Derivatives (j) | | | 131,431 | | | | 318,546 | | | | — | | | | 449,977 | |
| Total | | $ | 190,379,092 | | | $ | 111,141,874 | | | $ | 447,284 | | | $ | 301,968,250 | |
| Liabilities | | | | | | | | | | | | | | | | |
| Derivatives (j) | | $ | (142,180 | ) | | $ | (556,180 | ) | | $ | — | | | $ | (698,360 | ) |
| Total | | $ | (142,180 | ) | | $ | (556,180 | ) | | $ | — | | | $ | (698,360 | ) |
There have been no transfers between Level 1 and Level 2 fair value measurements during the period ended June 30, 2011.
(i) See Investment Portfolio for additional detailed categorizations.
(j) Derivatives include unrealized appreciation (depreciation) on open futures contracts and forward foreign currency exchange contracts.
Level 3 Reconciliation
The following is a reconciliation of the Fund's Level 3 investments for which significant unobservable inputs were used in determining value:
| | | Common Stocks and/or Other Equity Investments | | | | | | | | | | |
| | | Consumer Discretionary | | | Industrials | | | Materials | | | Corporate Bonds | | | Other Investments | | | Total | |
| Balance as of December 31, 2010 | | $ | 39 | | | $ | 0 | | | $ | 1,934 | | | $ | 414,996 | | | $ | 2,000 | | | $ | 418,969 | |
| Realized gains (loss) | | | — | | | | — | | | | — | | | | (121,142 | ) | | | — | | | | (121,142 | ) |
| Change in unrealized appreciation (depreciation) | | | 947 | | | | 0 | | | | (226 | ) | | | 145,989 | | | | 0 | | | | 146,710 | |
| Amortization premium/discount | | | — | | | | — | | | | — | | | | 1,725 | | | | — | | | | 1,725 | |
| Purchases | | | 1,022 | | | | — | | | | — | | | | — | | | | — | | | | 1,022 | |
| (Sales) | | | — | | | | — | | | | — | | | | 0 | | | | — | | | | 0 | |
| Transfers into Level 3 | | | — | | | | — | | | | — | | | | — | | | | — | | | | — | |
| Transfers (out) of Level 3 | | | — | | | | — | | | | — | | | | — | | | | — | | | | — | |
| Balance as of June 30, 2011 | | $ | 2,008 | | | $ | 0 | | | $ | 1,708 | | | $ | 441,568 | | | $ | 2,000 | | | $ | 447,284 | |
| Net change in unrealized appreciation (depreciation) from investments still held as of June 30, 2011 | | $ | 947 | | | $ | 0 | | | $ | (226 | ) | | $ | 25,334 | | | $ | 0 | | | $ | 26,055 | |
Transfers between price levels are recognized at the beginning of the reporting period.
The accompanying notes are an integral part of the financial statements.
Statement of Assets and Liabilities | as of June 30, 2011 (Unaudited) | |
| Assets | |
Investments: Investments in non-affiliated securities, at value (cost $238,096,301) — including $13,849 of securities loaned | | $ | 277,487,119 | |
| Investment in Daily Assets Fund Institutional (cost $14,479)* | | | 14,479 | |
| Investment in Central Cash Management Fund (cost $24,016,675) | | | 24,016,675 | |
| Total investments in securities, at value (cost $262,127,455) | | | 301,518,273 | |
| Cash | | | 88,040 | |
| Foreign currency, at value (cost $489,939) | | | 493,467 | |
| Deposits with broker for futures contracts | | | 1,305,784 | |
| Cash held as collateral for forward foreign currency exchange contracts | | | 1,770,000 | |
| Receivable for investments sold | | | 1,410,273 | |
| Receivable for Fund shares sold | | | 27,049 | |
| Dividends receivable | | | 256,568 | |
| Interest receivable | | | 690,678 | |
| Unrealized appreciation on forward foreign currency exchange contracts | | | 318,546 | |
| Foreign taxes recoverable | | | 67,705 | |
| Other assets | | | 2,115 | |
| Total assets | | | 307,948,498 | |
| Liabilities | |
| Payable upon return of securities loaned | | | 14,479 | |
| Payable for investments purchased | | | 571,637 | |
| Payable for investments purchased — when issued/delayed delivery securities | | | 8,279,884 | |
| Payable for Fund shares redeemed | | | 131,481 | |
| Payable for daily variation margin on futures contracts | | | 79,166 | |
| Unrealized depreciation on forward foreign currency exchange contracts | | | 556,180 | |
| Deferred foreign taxes payable | | | 1,570 | |
| Accrued management fee | | | 88,960 | |
| Other accrued expenses and payables | | | 208,117 | |
| Total liabilities | | | 9,931,474 | |
| Net assets, at value | | $ | 298,017,024 | |
| Net Assets Consist of | |
| Undistributed net investment income | | | 2,637,225 | |
Net unrealized appreciation (depreciation) on: Investments (net of deferred foreign taxes of $1,570) | | | 39,389,248 | |
| Futures | | | (10,749 | ) |
| Foreign currency | | | (220,126 | ) |
| Accumulated net realized gain (loss) | | | (42,805,158 | ) |
| Paid-in capital | | | 299,026,584 | |
| Net assets, at value | | $ | 298,017,024 | |
Class A Net Asset Value, offering and redemption price per share ($298,017,024 ÷ 13,194,914 outstanding shares of beneficial interest, no par value, unlimited number of shares authorized) | | $ | 22.59 | |
* Represents collateral of securities loaned.
The accompanying notes are an integral part of the financial statements.
Statement of Operations
| for the six months ended June 30, 2011 (Unaudited) | |
| Investment Income | |
Income: Dividends (net of foreign taxes withheld of $68,243) | | $ | 2,129,907 | |
| Interest | | | 1,666,450 | |
| Income distributions — Central Cash Management Fund | | | 18,589 | |
| Securities lending income, including income from Daily Assets Fund Institutional, net of borrower rebates | | | 18,539 | |
| Total income | | | 3,833,485 | |
Expenses: Management fee | | | 542,016 | |
| Administration fee | | | 151,513 | |
| Services to shareholders | | | 1,976 | |
| Custodian fee | | | 73,390 | |
| Professional fees | | | 45,493 | |
| Reports to shareholders | | | 37,925 | |
| Trustees' fees and expenses | | | 6,247 | |
| Other | | | 49,086 | |
| Total expenses | | | 907,646 | |
| Net investment income | | | 2,925,839 | |
| Realized and Unrealized Gain (Loss) | |
Net realized gain (loss) from: Investments (net of foreign taxes of $869) | | | 12,139,313 | |
| Swap contracts | | | 267 | |
| Futures | | | (18,311 | ) |
| Foreign currency | | | (772,384 | ) |
| | | | 11,348,885 | |
Change in net unrealized appreciation (depreciation) on: Investments (net of deferred foreign taxes credit of $4,028) | | | (3,244,891 | ) |
| Futures | | | 144,929 | |
| Foreign currency | | | (300,241 | ) |
| | | | (3,400,203 | ) |
| Net gain (loss) | | | 7,948,682 | |
| Net increase (decrease) in net assets resulting from operations | | $ | 10,874,521 | |
The accompanying notes are an integral part of the financial statements.
Statement of Changes in Net Assets | Increase (Decrease) in Net Assets | | Six Months Ended June 30, 2011 (Unaudited) | | | Year Ended December 31, 2010 | |
Operations: Net investment income (loss) | | $ | 2,925,839 | | | $ | 5,817,509 | |
| Net realized gain (loss) | | | 11,348,885 | | | | 18,663,004 | |
| Change in net unrealized appreciation (depreciation) | | | (3,400,203 | ) | | | 7,951,045 | |
| Net increase (decrease) in net assets resulting from operations | | | 10,874,521 | | | | 32,431,558 | |
Distributions to shareholders from: Net investment income: Class A | | | (4,612,028 | ) | | | (9,827,154 | ) |
| Total distributions | | | (4,612,028 | ) | | | (9,827,154 | ) |
Fund share transactions: Class A Proceeds from shares sold | | | 2,574,414 | | | | 4,966,734 | |
| Shares issued to shareholders in reinvestment of distributions | | | 4,612,028 | | | | 9,827,154 | |
| Payments for shares redeemed | | | (23,704,106 | ) | | | (48,195,061 | ) |
| Net increase (decrease) in net assets from Class A share transactions | | | (16,517,664 | ) | | | (33,401,173 | ) |
| Increase (decrease) in net assets | | | (10,255,171 | ) | | | (10,796,769 | ) |
| Net assets at beginning of period | | | 308,272,195 | | | | 319,068,964 | |
| Net assets at end of period (including undistributed net investment income of $2,637,225 and $4,323,414, respectively) | | $ | 298,017,024 | | | $ | 308,272,195 | |
| Other Information | |
Class A Shares outstanding at beginning of period | | | 13,930,205 | | | | 15,551,177 | |
| Shares sold | | | 113,816 | | | | 238,427 | |
| Shares issued to shareholders in reinvestment of distributions | | | 200,697 | | | | 467,070 | |
| Shares redeemed | | | (1,049,804 | ) | | | (2,326,469 | ) |
| Net increase (decrease) in Class A shares | | | (735,291 | ) | | | (1,620,972 | ) |
| Shares outstanding at end of period | | | 13,194,914 | | | | 13,930,205 | |
The accompanying notes are an integral part of the financial statements.
| | | | | Years Ended December 31, | |
| Class A | | Six Months Ended 6/30/11 (Unaudited) | 2010 | | 2009 | | | 2008 | | | 2007 | | | 2006 | |
| Selected Per Share Data | |
| Net asset value, beginning of period | | $ | 22.13 | | | $ | 20.52 | | | $ | 17.35 | | | $ | 24.81 | | | $ | 24.46 | | | $ | 22.75 | |
Income (loss) from investment operations: Net investment incomea | | | .22 | | | | .39 | | | | .44 | | | | .61 | | | | .74 | | | | .69 | c |
| Net realized and unrealized gain (loss) | | | .59 | | | | 1.88 | | | | 3.43 | | | | (7.20 | ) | | | .42 | | | | 1.60 | |
| Total from investment operations | | | .81 | | | | 2.27 | | | | 3.87 | | | | (6.59 | ) | | | 1.16 | | | | 2.29 | |
Less distributions from: Net investment income | | | (.35 | ) | | | (.66 | ) | | | (.70 | ) | | | (.87 | ) | | | (.81 | ) | | | (.58 | ) |
| Net asset value, end of period | | $ | 22.59 | | | $ | 22.13 | | | $ | 20.52 | | | $ | 17.35 | | | $ | 24.81 | | | $ | 24.46 | |
| Total Return (%) | | | 3.62 | ** | | | 11.22 | | | | 23.43 | | | | (27.33 | )b | | | 4.84 | b | | | 10.24 | b,c |
| Ratios to Average Net Assets and Supplemental Data | |
| Net assets, end of period ($ millions) | | | 298 | | | | 308 | | | | 319 | | | | 307 | | | | 528 | | | | 600 | |
| Ratio of expenses before expense reductions (%) | | | .60 | * | | | .65 | | | | .60 | | | | .64 | | | | .52 | | | | .55 | |
| Ratio of expenses after expense reductions (%) | | | .60 | * | | | .65 | | | | .60 | | | | .62 | | | | .51 | | | | .51 | |
| Ratio of net investment income (%) | | | 1.93 | * | | | 1.89 | | | | 2.40 | | | | 2.83 | | | | 3.00 | | | | 2.99 | c |
| Portfolio turnover rate (%) | | | 53 | ** | | | 203 | | | | 207 | | | | 263 | | | | 199 | | | | 108 | |
a Based on average shares outstanding during the period. b Total return would have been lower had certain expenses not been reduced. c Includes non-recurring income from the Advisor recorded as a result of an administrative proceeding regarding disclosure of brokerage allocation practices in connection with sales of DWS Funds. The non-recurring income resulted in an increase in net investment income of $0.024 per share and an increase in the ratio of net investment income of 0.10%. Excluding this non-recurring income, total return would have been 0.10% lower. * Annualized ** Not annualized | |
Notes to Financial Statements (Unaudited)
A. Organization and Significant Accounting Policies
DWS Balanced VIP (the "Fund") is a diversified series of DWS Variable Series II (the "Trust"), which is registered under the Investment Company Act of 1940, as amended (the "1940 Act"), as an open-end management investment company organized as a Massachusetts business trust.
The Fund's financial statements are prepared in accordance with accounting principles generally accepted in the United States of America which require the use of management estimates. Actual results could differ from those estimates. The policies described below are followed consistently by the Fund in the preparation of its financial statements.
Security Valuation. Investments are stated at value determined as of the close of regular trading on the New York Stock Exchange on each day the exchange is open for trading.
Various inputs are used in determining the value of the Fund's investments. These inputs are summarized in three broad levels. Level 1 includes quoted prices in active markets for identical securities. Level 2 includes other significant observable inputs (including quoted prices for similar securities, interest rates, prepayment speeds, and credit risk). Level 3 includes significant unobservable inputs (including the Fund's own assumptions in determining the fair value of investments). The inputs or methodology used for valuing securities are not necessarily an indication of the risk associated with investing in those securities.
Equity securities and exchange-traded funds ("ETFs") are valued at the most recent sale price or official closing price reported on the exchange (US or foreign) or over-the-counter market on which they trade and are categorized as Level 1 securities. Securities or ETFs for which no sales are reported are valued at the calculated mean between the most recent bid and asked quotations on the relevant market or, if a mean cannot be determined, at the most recent bid quotation. For certain international equity securities, in order to adjust for events which may occur between the close of the foreign exchanges and the close of the New York Stock Exchange, a fair valuation model may be used. This fair valuation model takes into account comparisons to the valuation of American Depository Receipts (ADRs), exchange-traded funds, futures contracts and certain indices and these securities are categorized as Level 2.
Debt securities and senior loans are valued by independent pricing services approved by the Fund's Board. If the pricing services are unable to provide valuations, securities are valued at the most recent bid quotation or evaluated price, as applicable, obtained from one or more broker-dealers. Such services may use various pricing techniques which take into account appropriate factors such as yield, quality, coupon rate, maturity, type of issue, trading characteristics and other data, as well as broker quotes. These securities are generally categorized as Level 2.
Money market instruments purchased with an original or remaining maturity of sixty days or less, maturing at par, are valued at amortized cost, which approximates value, and are categorized as Level 2. Investments in open-end investment companies are valued at their net asset value each business day and are categorized as Level 1.
Futures contracts are generally valued at the settlement prices established each day on the exchange on which they are traded and are categorized as Level 1.
Forward currency contracts are valued at the prevailing forward exchange rate of the underlying currencies and are categorized as Level 2.
Swap contracts are valued daily based upon prices supplied by a Board approved pricing vendor, if available, and otherwise are valued at the price provided by the broker-dealer. Swap contracts are generally categorized as Level 2.
Securities and other assets for which market quotations are not readily available or for which the above valuation procedures are deemed not to reflect fair value are valued in a manner that is intended to reflect their fair value as determined in accordance with procedures approved by the Board and are generally categorized as Level 3. In accordance with the Fund's valuation procedures, factors used in determining value may include, but are not limited to, the type of the security; the size of the holding; the initial cost of the security; the existence of any contractual restrictions on the security's disposition; the price and extent of public trading in similar securities of the issuer or of comparable companies; quotations or evaluated prices from broker-dealers and/or pricing services; information obtained from the issuer, analysts, and/or the appropriate stock exchange (for exchange-traded securities); an analysis of the company's or issuer's financial statements; an evaluation of the forces that influence the issuer and the market(s) in which the security is purchased and sold and with respect to debt securities; the maturity, coupon, creditworthiness, currency denomination and the movement of the market in which the security is normally traded. The value determined under these procedures may differ from published values for the same securities.
Disclosure about the classification of fair value measurements is included in a table following the Fund's Investment Portfolio.
Foreign Currency Translations. The books and records of the Fund are maintained in US dollars. Investment securities and other assets and liabilities denominated in a foreign currency are translated into US dollars at the prevailing exchange rates at period end. Purchases and sales of investment securities, income and expenses are translated into US dollars at the prevailing exchange rates on the respective dates of the transactions.
Net realized and unrealized gains and losses on foreign currency transactions represent net gains and losses between trade and settlement dates on securities transactions, the acquisition and disposition of foreign currencies, and the difference between the amount of net investment income accrued and the US dollar amount actually received. That portion of both realized and unrealized gains and losses on investments that results from fluctuations in foreign currency exchange rates is not separately disclosed but is included with net realized and unrealized gain/appreciation and loss/depreciation on investments.
Securities Lending. The Fund lends securities to certain financial institutions. The Fund retains beneficial ownership of the securities it has loaned and continues to receive interest and dividends paid by the issuer of securities and to participate in any changes in their market value. The Fund requires the borrowers of the securities to maintain collateral with the Fund consisting of either cash or liquid, unencumbered assets having a value at least equal to the value of the securities loaned. When the collateral falls below specified amounts, the lending agent will use its best effort to obtain additional collateral on the next business day to meet required amounts under the security lending agreement. The Fund may invest the cash collateral into a joint trading account in an affiliated money market fund pursuant to Exemptive Orders issued by the SEC. The Fund receives compensation for lending its securities either in the form of fees or by earning interest on invested cash collateral net of borrower rebates and fees paid to a lending agent. Either the Fund or the borrower may terminate the loan. There may be risks of delay and costs in recovery of securities or even loss of rights in the collateral should the borrower of the securities fail financially. The Fund is also subject to all investment risks associated with the reinvestment of any cash collateral received, including, but not limited to, interest rate, credit and liquidity risk associated with such investments.
Loan Participations and Assignments. Senior loans are portions of loans originated by banks and sold in pieces to investors. These US dollar-denominated fixed and floating rate loans ("Loans") in which the Fund invests, are arranged through private negotiations between the borrower and one or more financial institutions ("Lenders"). The Fund invests in such Loans in the form of participations in Loans ("Participations") or assignments of all or a portion of loans from third parties ("Assignments"). Participations typically result in the Fund having a contractual relationship only with the Lender, not with the borrower. The Fund has the right to receive payments of principal, interest and any fees to which it is entitled from the Lender selling the Participation and only upon receipt by the Lender of the payments from the borrower. In connection with purchasing Participations, the Fund generally has no right to enforce compliance by the borrower with the terms of the loan agreement relating to the Loan, nor any rights of set-off against the borrower, and the Fund will not benefit directly from any collateral supporting the Loan in which it has purchased the Participation. As a result, the Fund assumes the credit risk of both the borrower and the Lender that is selling the Participation. Assignments typically result in the Fund having a direct contractual relationship with the borrower, and the Fund may enforce compliance by the borrower with the terms of the loan agreement. All Senior Loans involve interest rate risk, liquidity risk and credit risk, including the potential default or insolvency of the borrower.
Mortgage Dollar Rolls. The Fund may enter into mortgage dollar rolls in which the Fund sells to a bank or broker/dealer (the "counterparty") mortgage-backed securities for delivery in the current month and simultaneously contracts to repurchase similar, but not identical, securities on a fixed date. The counterparty receives all principal and interest payments, including prepayments, made on the security while it is the holder. The Fund receives compensation as consideration for entering into the commitment to repurchase. The compensation is paid in the form of a lower price for the security upon its repurchase, or alternatively, a fee. Mortgage dollar rolls may be renewed with a new sale and repurchase price and a cash settlement made at each renewal without physical delivery of the securities subject to the contract.
Certain risks may arise upon entering into mortgage dollar rolls from the potential inability of counterparties to meet the terms of their commitments. Additionally, the value of such securities may change adversely before the Fund is able to repurchase them. There can be no assurance that the Fund's use of the cash that it receives from a mortgage dollar roll will provide a return that exceeds its costs.
When-Issued/Delayed Delivery Securities. The Fund may purchase or sell securities with delivery or payment to occur at a later date beyond the normal settlement period. At the time the Fund enters into a commitment to purchase or sell a security, the transaction is recorded and the value of the transaction is reflected in the net asset value. The price of such security and the date when the security will be delivered and paid for are fixed at the time the transaction is negotiated. The value of the security may vary with market fluctuations. At the time the Fund enters into a purchase transaction it is required to segregate cash or other liquid assets at least equal to the amount of the commitment.
Certain risks may arise upon entering into when-issued or delayed delivery transactions from the potential inability of counterparties to meet the terms of their contracts or if the issuer does not issue the securities due to political, economic, or other factors. Additionally, losses may arise due to changes in the value of the underlying securities.
Taxes. The Fund's policy is to comply with the requirements of the Internal Revenue Code, as amended, which are applicable to regulated investment companies and to distribute all of its taxable income to its shareholders.
Additionally, based on the Fund's understanding of the tax rules and rates related to income, gains and transactions for the foreign jurisdictions in which it invests, the Fund will provide for foreign taxes, and where appropriate, deferred foreign taxes.
At December 31, 2010, the Fund had a net tax basis capital loss carryforward of approximately $51,528,000, which may be applied against any realized net taxable capital gains of each succeeding year until fully utilized or until December 31, 2016 ($6,483,000) and December 31, 2017 ($45,045,000), the respective expiration dates, whichever occurs first.
On December 22, 2010, the Regulated Investment Company Modernization Act of 2010 (the "Act") was enacted. Under the Act, net capital losses may be carried forward indefinitely, and their character is retained as short-term and/or long-term losses. Previously, net capital losses were carried forward for eight years and treated as short-term losses. As a transition rule, the Act requires that post-enactment net capital losses be used before pre-enactment net capital losses. As a result of this ordering rule, pre-enactment capital loss carryforwards may expire unused, whereas under the previous rules these losses may have been utilized. This change is effective for fiscal years beginning after the date of enactment.
The Fund has reviewed the tax positions for the open tax years as of December 31, 2010 and has determined that no provision for income tax is required in the Fund's financial statements. The Fund's federal tax returns for the prior three fiscal years remain open subject to examination by the Internal Revenue Service.
Distribution of Income and Gains. Distributions of net investment income of the Fund, if any, are made annually. Net realized gains from investment transactions, in excess of available capital loss carryforwards, would be taxable to the Fund if not distributed and, therefore, will be distributed to shareholders at least annually. The Fund may also make additional distributions for tax purposes if necessary.
The timing and characterization of certain income and capital gains distributions are determined annually in accordance with federal tax regulations which may differ from accounting principles generally accepted in the United States of America. These differences primarily relate to investments in foreign denominated investments, forward currency contracts, futures contracts and certain securities sold at a loss. As a result, net investment income (loss) and net realized gain (loss) on investment transactions for a reporting period may differ significantly from distributions during such period. Accordingly, the Fund may periodically make reclassifications among certain of its capital accounts without impacting the net asset value of the Fund.
The tax character of current year distributions will be determined at the end of the current fiscal year.
Expenses. Expenses of the Trust arising in connection with a specific fund are allocated to that fund. Other Trust expenses which cannot be directly attributed to a fund are apportioned among the funds in the Trust.
Contingencies. In the normal course of business, the Fund may enter into contracts with service providers that contain general indemnification clauses. The Fund's maximum exposure under these arrangements is unknown as this would involve future claims that may be made against the Fund that have not yet been made. However, based on experience, the Fund expects the risk of loss to be remote.
Other. Investment transactions are accounted for on a trade date plus one basis for daily net asset value calculations. However, for financial reporting purposes, investment transactions are reported on trade date. Interest income is recorded on the accrual basis. Dividend income is recorded on the ex-dividend date net of foreign withholding taxes. Certain dividends from foreign securities may be recorded subsequent to the ex-dividend date as soon as the Fund is informed of such dividends. Realized gains and losses from investment transactions are recorded on an identified cost basis and may include proceeds from litigation. All discounts and premiums are accreted/amortized for both tax and financial reporting purposes, with the exception of securities in default of principal.
B. Derivative Instruments
Credit Default Swap Contracts. A credit default swap is a contract between a buyer and a seller of protection against pre-defined credit events for the reference entity. For the six months ended June 30, 2011, the Fund bought credit default swap contracts to gain exposure to an underlying issuer's credit quality characteristics without directly investing in that issuer, or to hedge the risk of default on Fund securities. As a seller in the credit default swap contract, the Fund is required to pay the par (or other agreed-upon) value of the referenced entity to the counterparty with the occurrence of a credit event by a third party, such as a US or foreign corporate issuer, on the reference entity, which would likely result in a loss to the Fund. In return, the Fund receives from the counterparty a periodic stream of payments over the term of the contract provided that no credit event has occurred. If no credit event occurs, the Fund keeps the stream of payments with no payment obligations. The Fund may also buy credit default swap contracts in order to hedge against the risk of a credit event on debt securities, in which case the Fund functions as the counterparty referenced above. This involves the risk that the contract may expire worthless. It also involves counterparty risk that the seller may fail to satisfy its payment obligations to the Fund with the occurrence of a credit event. When the Fund sells a credit default swap contract it will cover its commitment. This may be achieved by, among other methods, maintaining cash or liquid assets equal to the aggregate notional value of the reference entities for all outstanding credit default swap contracts sold by the Fund.
The value of the credit default swap is adjusted daily and the change in value, if any, is recorded daily as unrealized appreciation or depreciation in the Statement of Assets and Liabilities. An upfront payment, if any, made by the Fund is recorded as an asset in the Statement of Assets and Liabilities. An upfront payment, if any, received by the Fund is recorded as a liability in the Statement of Assets and Liabilities. Under the terms of the credit default swap contracts, the Fund receives or makes quarterly payments based on a specified interest rate on a fixed notional amount. These payments are recorded as a realized gain or loss in the Statement of Operations. Payments received or made as a result of a credit event or termination of the contract are recognized, net of a proportional amount of the upfront payment, as realized gains or losses in the Statement of Operations.
There were no open credit default swap contracts as of June 30, 2011. For the six months ended June 30, 2011, the investment in credit default swap contracts purchased had a total notional value generally indicative of a range from $0 to approximately $15,000.
Futures Contracts. A futures contract is an agreement between a buyer or seller and an established futures exchange or its clearinghouse in which the buyer or seller agrees to take or make a delivery of a specific amount of a financial instrument at a specified price on a specific date (settlement date). For the six months ended June 30, 2011, the Fund used futures contracts to gain exposure to different parts of the yield curve while managing overall duration, and to gain an exposure to a particular asset class or to keep cash on hand to meet shareholder redemptions or other needs while maintaining exposure to the stock market. In addition, the Fund seeks to enhance returns by employing a global tactical asset allocation overlay strategy by entering into futures contracts on fixed-income securities, including on bond and equity indices. For the six months ended June 30, 2011, as part of this strategy, the Fund used futures contracts to attempt to take advantage of inefficiencies within the global equity and bond markets.
Futures contracts are valued at the most recent settlement price. Upon entering into a futures contract, the Fund is required to deposit with a financial intermediary cash or securities ("initial margin") in an amount equal to a certain percentage of the face value indicated in the futures contract. Subsequent payments ("variation margin") are made or received by the Fund dependent upon the daily fluctuations in the value and are recorded for financial reporting purposes as unrealized gains or losses by the Fund. Gains or losses are realized when the contract expires or is closed. Since all futures contracts are exchange-traded, counterparty risk is minimized as the exchange's clearinghouse acts as the counterparty, and guarantees the futures against default.
Certain risks may arise upon entering into futures contracts, including the risk that an illiquid market will limit the Fund's ability to close out a futures contract prior to the settlement date and the risk that the futures contract is not well correlated with the security, index or currency to which it relates. Risk of loss may exceed amounts recognized in the Statement of Assets and Liabilities.
A summary of the open futures contracts as of June 30, 2011 is included in a table following the Fund's Investment Portfolio. For the six months ended June 30, 2011, the investment in futures contracts purchased had a total notional value generally indicative of a range from approximately $40,216,000 to $118,748,000, and the investment in futures contracts sold had a total notional value generally indicative of a range from approximately $55,224,000 to $95,480,000.
Forward Foreign Currency Exchange Contracts. A forward foreign currency exchange contract ("forward currency contract") is a commitment to purchase or sell a foreign currency at the settlement date at a negotiated rate. For the six months ended June 30, 2011, the Fund entered into forward currency contracts in order to hedge its exposure to changes in foreign currency exchange rates on its foreign currency denominated portfolio holdings, to facilitate transactions in foreign currency denominated securities and to enhance total returns. The Fund also entered into forward currency contracts as part of its global tactical asset allocation overlay strategy.
Forward currency contracts are valued at the prevailing forward exchange rate of the underlying currencies and unrealized gain (loss) is recorded daily. On the settlement date of the forward currency contract, the Fund records a realized gain or loss equal to the difference between the value of the contract at the time it was opened and the value of the contract at the time it was closed. Certain risks may arise upon entering into forward currency contracts from the potential inability of counterparties to meet the terms of their contracts. The maximum counterparty credit risk to the Fund is measured by the unrealized gain on appreciated contracts. Additionally, when utilizing forward currency contracts to hedge, the Fund gives up the opportunity to profit from favorable exchange rate movements during the term of the contract.
A summary of the open forward currency contracts as of June 30, 2011 is included in a table following the Fund's Investment Portfolio. For the six months ended June 30, 2011, the investment in forward currency contracts short vs. US dollars had a total contract value generally indicative of a range from approximately $21,862,000 to $38,947,000, and the investment in forward currency contracts long vs. US dollars had a total contract value generally indicative of a range from approximately $29,127,000 to $33,480,000.
The following tables summarize the value of the Fund's derivative instruments held as of June 30, 2011 and the related location in the accompanying Statement of Assets and Liabilities, presented by primary underlying risk exposure:
| Asset Derivatives | | Forward Contracts | | | Future Contracts | | | Total | |
| Equity Contracts (a) | | $ | — | | | $ | 30,950 | | | $ | 30,950 | |
| Interest Rate Contracts (a) | | | — | | | | 100,481 | | | | 100,481 | |
| Foreign Exchange Contracts (b) | | | 318,546 | | | | — | | | | 318,546 | |
| | | $ | 318,546 | | | $ | 131,431 | | | $ | 449,977 | |
Each of the above derivatives is located in the following Statement of Assets and Liabilities accounts:
(a) Includes cumulative appreciation of future contracts as disclosed in the Investment Portfolio. Unsettled variation margin is disclosed separately within the Statement of Assets and Liabilities.
(b) Unrealized appreciation on forward foreign currency exchange contracts
| Liability Derivatives | | Forward Contracts | | | Futures Contracts | | | Total | |
| Interest Rate Contracts (a) | | $ | — | | | $ | (142,180 | ) | | $ | (142,180 | ) |
| Foreign Exchange Contracts (b) | | | (556,180 | ) | | | — | | | | (556,180 | ) |
| | | $ | (556,180 | ) | | $ | (142,180 | ) | | $ | (698,360 | ) |
Each of the above derivatives is located in the following Statement of Assets and Liabilities accounts:
(a) Includes cumulative depreciation of future contracts as disclosed in the Investment Portfolio. Unsettled variation margin is disclosed separately within the Statement of Assets and Liabilities.
(b) Unrealized depreciation on forward foreign currency exchange contracts
Additionally, the amount of unrealized and realized gains and losses on derivative instruments recognized in Fund earnings during the six months ended June 30, 2011 and the related location in the accompanying Statement of Operations is summarized in the following tables by primary underlying risk exposure:
| Realized Gain (Loss) | | Forward Contracts | | | Futures Contracts | | | Swap Contracts | | | Total | |
| Equity Contracts (a) | | $ | — | | | $ | 22,771 | | | $ | — | | | $ | 22,771 | |
| Interest Rate Contracts (a) | | | — | | | | (41,082 | ) | | | — | | | | (41,082 | ) |
| Credit Contracts (a) | | | — | | | | — | | | | 267 | | | | 267 | |
| Foreign Exchange Contracts (b) | | | (758,134 | ) | | | — | | | | — | | | | (758,134 | ) |
| | | $ | (758,134 | ) | | $ | (18,311 | ) | | $ | 267 | | | $ | (776,178 | ) |
Each of the above derivatives is located in the following Statement of Operations accounts:
(a) Net realized gain (loss) from futures and swap contracts, respectively
(b) Net realized gain (loss) from foreign currency (Statement of Operations includes both forward currency contracts and foreign currency transactions)
| Change in Net Unrealized Appreciation (Depreciation) | | Forward Contracts | | | Futures Contracts | | | Total | |
| Equity Contracts (a) | | $ | — | | | $ | (81,898 | ) | | $ | (81,898 | ) |
| Interest Rate Contracts (a) | | | — | | | | 226,827 | | | | 226,827 | |
| Foreign Exchange Contracts (b) | | | (320,281 | ) | | | — | | | | (320,281 | ) |
| | | $ | (320,281 | ) | | $ | 144,929 | | | $ | (175,352 | ) |
Each of the above derivatives is located in the following Statement of Operations accounts:
(a) Change in net unrealized appreciation (depreciation) on futures
(b) Change in net unrealized appreciation (depreciation) on foreign currency (Statement of Operations includes both forward currency contracts and foreign currency transactions)
C. Purchases and Sales of Securities
During the six months ended June 30, 2011, purchases and sales of investment transactions (excluding short-term investments and US Treasury obligations) aggregated $142,907,195 and $170,965,529, respectively. Purchases and sales of US Treasury obligations aggregated $8,090,148 and $7,844,852, respectively.
D. Related Parties
Management Agreement. Under the Investment Management Agreement with Deutsche Investment Management Americas Inc. ("DIMA" or the "Advisor"), an indirect, wholly owned subsidiary of Deutsche Bank AG, the Advisor directs the investments of the Fund in accordance with its investment objectives, policies and restrictions. The Advisor determines the securities, instruments and other contracts relating to investments to be purchased, sold or entered into by the Fund or delegates such responsibility to the Fund's subadvisor.
QS Investors, LLC ("QS Investors") acts as an investment subadvisor to the Fund. QS Investors renders strategic asset allocation services and manages the portion of assets allocated to the Fund's global tactical asset allocation overlay strategy. QS Investors is paid by the Advisor for the services QS Investors provides to the Fund.
Pursuant to a written contract with the Advisor, Deutsche Asset Management International GmbH ("DeAMi"), a direct, wholly owned subsidiary of Deutsche Bank AG, serves as a subadvisor to the Fund and is responsible for portfolio management of a portion of the large cap value allocation of the Fund. DeAMi is paid for its services by the Advisor from its fee as Investment Advisor to the Fund.
Pursuant to the Investment Management Agreement with the Advisor, the Fund pays a monthly management fee based on the Fund's average daily net assets, computed and accrued daily and payable monthly, at the following annual rates:
| $0-$250 million | | | .370 | % |
| Next $750 million | | | .345 | % |
| Over $1 billion | | | .310 | % |
Accordingly, for the six months ended June 30, 2011, the fee pursuant to the Investment Management Agreement was equivalent to an annualized effective rate of 0.36% of the Fund's average daily net assets.
Administration Fee. Pursuant to an Administrative Services Agreement, DIMA provides most administrative services to the Fund. For all services provided under the Administrative Services Agreement, the Fund pays DIMA an annual fee ("Administration Fee") of 0.10% of the Fund's average daily net assets, computed and accrued daily and payable monthly. For the six months ended June 30, 2011, the Administration Fee was $151,513, of which $24,296 is unpaid.
Service Provider Fees. DWS Investments Service Company ("DISC"), an affiliate of the Advisor, is the transfer agent, dividend-paying agent and shareholder service agent for the Fund. Pursuant to a sub-transfer agency agreement between DISC and DST Systems, Inc. ("DST"), DISC has delegated certain transfer agent, dividend-paying agent and shareholder service agent functions to DST. DISC compensates DST out of the shareholder servicing fee it receives from the Fund. For the six months ended June 30, 2011, the amounts charged to the Fund by DISC aggregated $226, of which $171 is unpaid.
Typesetting and Filing Service Fees. Under an agreement with DIMA, DIMA is compensated for providing typesetting and certain regulatory filing services to the Fund. For the six months ended June 30, 2011, the amount charged to the Fund by DIMA included in the Statement of Operations under "reports to shareholders" aggregated $5,612, of which $2,573 is unpaid.
Trustees' Fees and Expenses. The Fund paid each Trustee not affiliated with the Advisor retainer fees plus specified amounts for various committee services and for the Board Chairperson.
Affiliated Cash Management Vehicle. The Fund may invest uninvested cash balances in Central Cash Management Fund, which is managed by the Advisor. The Fund indirectly bears its proportionate share of the expenses of Central Cash Management Fund. Central Cash Management Fund does not pay the Advisor an investment management fee. Central Cash Management Fund seeks a high level of current income consistent with liquidity and the preservation of capital.
E. Investing in High-Yield Securities
The Fund's performance could be hurt if a security declines in credit quality or goes into default, or if an issuer does not make timely payments of interest or principal. Because the issuers of high-yield debt securities or junk bonds (debt securities rated below the fourth-highest category) may be in uncertain financial health, the prices of their debt securities can be more vulnerable to bad economic news, or even the expectation of bad news, than investment-grade debt securities. Because the Fund may invest in securities not paying current interest or in securities already in default, these risks may be more pronounced.
F. Ownership of the Fund
At June 30, 2011, three Participating Insurance Companies were owners of record of 10% or more of the total outstanding shares of the Fund, each owning 45%, 22% and 14%.
G. Line of Credit
The Fund and other affiliated funds (the "Participants") share in a $450 million revolving credit facility provided by a syndication of banks. The Fund may borrow for temporary or emergency purposes, including the meeting of redemption requests that otherwise might require the untimely disposition of securities. The Participants are charged an annual commitment fee which is allocated based on net assets, among each of the Participants. Interest is calculated at a rate per annum equal to the sum of the Federal Funds Rate plus 1.25 percent plus if LIBOR exceeds the Federal Funds Rate the amount of such excess. The Fund may borrow up to a maximum of 33 percent of its net assets under the agreement. The Fund had no outstanding loans at June 30, 2011.
The Trust's policies and procedures for voting proxies for portfolio securities and information about how the Trust voted proxies related to its portfolio securities during the 12-month period ended June 30 are available on our Web site — www.dws-investments.com (click on "proxy voting" at the bottom of the page) — or on the SEC's Web site — www.sec.gov. To obtain a written copy of the Trust's policies and procedures without charge, upon request, call us toll free at (800) 728-3337.
Summary of Management Fee Evaluation by Independent Fee Consultant
October 3, 2010
Pursuant to an Order entered into by Deutsche Investment Management Americas and affiliates (collectively, "DeAM") with the Attorney General of New York, I, Thomas H. Mack, have been appointed the Independent Fee Consultant for the DWS Funds (formerly the DWS Scudder Funds). My duties include preparing an annual written evaluation of the management fees DeAM charges the Funds, considering among other factors the management fees charged by other mutual fund companies for like services, management fees DeAM charges other clients for like services, DeAM's costs of supplying services under the management agreements and related profit margins, possible economies of scale if a Fund grows larger, and the nature and quality of DeAM's services, including fund performance. This report summarizes my evaluation for 2010, including my qualifications, the evaluation process for each of the DWS Funds, consideration of certain complex-level factors, and my conclusions. I served in substantially the same capacity in 2007, 2008, and 2009.
Qualifications
For more than 35 years I have served in various professional capacities within the investment management business. I have held investment analysis and advisory positions, including securities analyst, portfolio strategist and director of investment policy with a large investment firm. I have also performed business management functions, including business development, financial management and marketing research and analysis.
Since 1991, I have been an independent consultant within the asset management industry. I have provided services to over 125 client organizations, including investment managers, mutual fund boards, product distributors and related organizations. Over the past ten years I have completed a number of assignments for mutual fund boards, specifically including assisting boards with management contract renewal.
I hold a Master of Business Administration degree, with highest honors, from Harvard University and Master of Science and Bachelor of Science (highest honors) degrees from the University of California at Berkeley. I am an independent director and audit committee financial expert for two closed-end mutual funds and have served in various leadership and financial oversight capacities with non-profit organizations.
Evaluation of Fees for each DWS Fund
My work focused primarily on evaluating, fund-by-fund, the fees charged to each of the 118 publicly offered Fund portfolios in the DWS Fund family. For each Fund, I considered each of the key factors mentioned above, as well as any other relevant information. In doing so I worked closely with the Funds' Independent Directors in their annual contract renewal process, as well as in their approval of contracts for several new funds (documented separately).
In evaluating each Fund's fees, I reviewed comprehensive materials provided by or on behalf of DeAM, including expense information prepared by Lipper Analytical, comparative performance information, profitability data, manager histories, and other materials. I also accessed certain additional information from the Lipper and Morningstar databases and drew on my industry knowledge and experience.
To facilitate evaluating this considerable body of information, I prepared for each Fund a document summarizing the key data elements in each area as well as additional analytics discussed below. This made it possible to consider each key data element in the context of the others.
In the course of contract renewal, DeAM agreed to implement a number of fee and expense adjustments requested by the Independent Directors which will favorably impact future fees and expenses, and my evaluation includes the effects of these changes.
Fees and Expenses Compared with Other Funds
The competitive fee and expense evaluation for each fund focused on two primary comparisons:
The Fund's contractual management fee (the advisory fee plus the administration fee where applicable) compared with those of a group of typically 12-15 funds in the same Lipper investment category (e.g. Large Capitalization Growth) having similar distribution arrangements and being of similar size.
The Fund's total expenses compared with a broader universe of funds from the same Lipper investment category and having similar distribution arrangements.
These two comparisons provide a view of not only the level of the fee compared with funds of similar scale but also the total expense the Fund bears for all the services it receives, in comparison with the investment choices available in the Fund's investment category and distribution channel. The principal figure-of-merit used in these comparisons was the subject Fund's percentile ranking against peers.
DeAM's Fees for Similar Services to Others
DeAM provided management fee schedules for all of its US domiciled fund and non-fund investment management accounts in any of the investment categories where there is a DWS Fund. These similar products included the other DWS Funds, non-fund pooled accounts, institutional accounts and sub-advisory accounts. Using this information, I calculated for each Fund the fee that would be charged to each similar product, at the subject Fund's asset level.
Evaluating information regarding non-fund products is difficult because there are varying levels of services required for different types of accounts, with mutual funds generally requiring considerably more regulatory and administrative types of service as well as having more frequent cash flows than other types of accounts. Also, while mutual fund fees for similar fund products can be expected to be similar, there will be some differences due to different pricing conditions in different distribution channels (e.g. retail funds versus those used in variable insurance products), differences in underlying investment processes and other factors.
Costs and Profit Margins
DeAM provided a detailed profitability analysis for each Fund. After making some adjustments so that the presentation would be more comparable to the available industry figures, I reviewed profit margins from investment management alone, from investment management plus other fund services (excluding distribution) provided to the Funds by DeAM (principally shareholder services), and DeAM profits from all sources, including distribution. A later section comments on overall profitability.
Economies of Scale
Economies of scale — an expected decline in management cost per dollar of fund assets as fund assets grow — are very rarely quantified and documented because of inherent difficulties in collecting and analyzing relevant data. However, in virtually every investment category that I reviewed, larger funds tend to have lower fees and lower total expenses than smaller funds. To see how each DWS Fund compares with this industry observation, I reviewed:
The trend in Fund assets over the last five years and the accompanying trend in total expenses. This shows if the Fund has grown and, if so, whether total expense (management fees as well as other expenses) have declined as a percent of assets.
Whether the Fund has break-points in its management fee schedule, the extent of the fee reduction built into the schedule and the asset levels where the breaks take effect, and in the case of a sub-advised Fund how the Fund's break-points compare with those of the sub-advisory fee schedule.
How the Fund's contractual fee schedule compares with trends in the industry data. To accomplish this, I constructed a chart showing how actual latest-fiscal-year contractual fees of the Fund and of other similar funds relate to average fund assets, with the subject Fund's contractual fee schedule superimposed.
Quality of Service — Performance
The quality-of-service evaluation focused on investment performance, which is the principal result of the investment management service. Each Fund's performance was reviewed over the past 1, 3, 5 and 10 years, as applicable, and compared with that of other funds in the same investment category and with a suitable market index.
In addition, I calculated and reviewed risk-adjusted returns relative to an index of similar mutual funds' returns and a suitable market index. The risk-adjusted returns analysis provides a way of determining the extent to which the Fund's return comparisons are mainly the product of investment value-added (or lack thereof) or alternatively taking considerably more or less risk than is typical in its investment category.
I also received and considered the history of portfolio manager changes for each Fund, as this provided an important context for evaluating the performance results.
Complex-Level Considerations
While this evaluation was conducted mainly at the individual fund level, there are some issues relating to the reasonableness of fees that can alternatively be considered across the whole fund complex:
I reviewed DeAM's profitability analysis for all DWS Funds, with a view toward determining if the allocation procedures used were reasonable and how profit levels compared with public data for other investment managers.
I considered whether DeAM and affiliates receive any significant ancillary or "fall-out" benefits that should be considered in interpreting the direct profitability results. These would be situations where serving as the investment manager of the Funds is beneficial to another part of the Deutsche Bank organization.
I considered how aggregated DWS Fund expenses had varied over the years, by asset class and in the context of trends in asset levels.
I reviewed the structure of the DeAM organization, trends in staffing levels, and information on compensation of investment management and other professionals compared with industry data.
Findings
Based on the process and analysis discussed above, which included reviewing a wide range of information from management and external data sources and considering among other factors the fees DeAM charges other clients, the fees charged by other fund managers, DeAM's costs and profits associated with managing the Funds, economies of scale, possible fall-out benefits, and the nature and quality of services provided, in my opinion the management fees charged the DWS Funds are reasonable.
Thomas H. Mack
Notes
DWS Investments Distributors, Inc.
222 South Riverside Plaza
Chicago, IL 60606
(800) 621-1148
VS2BAL-3 (R-023288-1 8/11)
JUNE 30, 2011
SEMIANNUAL REPORT
DWS VARIABLE SERIES II
DWS Blue Chip VIP
Contents
3 Performance Summary 4 Information About Your Fund's Expenses 5 Portfolio Summary 6 Investment Portfolio 12 Statement of Assets and Liabilities 12 Statement of Operations 13 Statement of Changes in Net Assets 15 Financial Highlights 17 Notes to Financial Statements 21 Proxy Voting 22 Summary of Management Fee Evaluation by Independent Fee Consultant |
This report must be preceded or accompanied by a prospectus. To obtain an additional prospectus or summary prospectus, if available, call (800) 728-3337 or your financial representative. We advise you to consider the Fund's objectives, risks, charges and expenses carefully before investing. The summary prospectus and prospectus contain this and other important information about the Fund. Please read the prospectus carefully before you invest.
Any Fund that focuses in a particular segment of the market will generally be more volatile than a Fund that invests more broadly. Stocks may decline in value. See the prospectus for details.
DWS Investments is part of Deutsche Bank's Asset Management division and, within the US, represents the retail asset management activities of Deutsche Bank AG, Deutsche Bank Trust Company Americas, Deutsche Investment Management Americas Inc. and DWS Trust Company.
NOT FDIC/NCUA INSURED NO BANK GUARANTEE MAY LOSE VALUE NOT A DEPOSIT
NOT INSURED BY ANY FEDERAL GOVERNMENT AGENCY
Performance Summary June 30, 2011
Fund performance shown is historical, assumes reinvestment of all dividend and capital gain distributions and does not guarantee future results. Investment return and principal value fluctuate with changing market conditions so that, when redeemed, shares may be worth more or less than their original cost. Current performance may be lower or higher than the performance data quoted. Please contact your participating insurance company for the Fund's most recent month-end performance. Performance doesn't reflect charges and fees ("contract charges") associated with the separate account that invests in the Fund or any variable life insurance policy or variable annuity contract for which the Fund is an investment option. These charges and fees will reduce returns. While all share classes have the same underlying portfolio, their performance will differ.
The gross expense ratios of the Fund, as stated in the fee table of the prospectus dated May 1, 2011 are 0.76% and 1.02% for Class A and Class B shares, respectively, and may differ from the expense ratios disclosed in the Financial Highlights tables in this report.
| Growth of an Assumed $10,000 Investment in DWS Blue Chip VIP |
[] DWS Blue Chip VIP — Class A [] Russell 1000® Index | The Russell 1000® Index is an unmanaged index that measures the performance of the 1,000 largest companies in the Russell 3000® Index, which measures the performance of the 3,000 largest US companies based on total market capitalization. The Russell 1000 Index represents approximately 92% of the total market capitalization of the Russell 3000 Index. Index returns do not reflect any fees or expenses and it is not possible to invest directly into an index. |
| |
| Yearly periods ended June 30 | |
| Comparative Results | |
| DWS Blue Chip VIP | | 6-Month‡ | | | 1-Year | | | 3-Year | | | 5-Year | | | 10-Year | |
| Class A | Growth of $10,000 | | $ | 10,850 | | | $ | 13,221 | | | $ | 11,441 | | | $ | 11,692 | | | $ | 14,038 | |
| Average annual total return | | | 8.50 | % | | | 32.21 | % | | | 4.59 | % | | | 3.18 | % | | | 3.45 | % |
| Russell 1000 Index | Growth of $10,000 | | $ | 10,637 | | | $ | 13,193 | | | $ | 11,145 | | | $ | 11,763 | | | $ | 13,716 | |
| Average annual total return | | | 6.37 | % | | | 31.93 | % | | | 3.68 | % | | | 3.30 | % | | | 3.21 | % |
| DWS Blue Chip VIP | | 6-Month‡ | | | 1-Year | | | 3-Year | | | 5-Year | | | Life of Class* | |
| Class B | Growth of $10,000 | | $ | 10,839 | | | $ | 13,184 | | | $ | 11,389 | | | $ | 11,556 | | | $ | 17,544 | |
| Average annual total return | | | 8.39 | % | | | 31.84 | % | | | 4.43 | % | | | 2.93 | % | | | 6.45 | % |
| Russell 1000 Index | Growth of $10,000 | | $ | 10,637 | | | $ | 13,193 | | | $ | 11,145 | | | $ | 11,763 | | | $ | 16,703 | |
| Average annual total return | | | 6.37 | % | | | 31.93 | % | | | 3.68 | % | | | 3.30 | % | | | 5.87 | % |
The growth of $10,000 is cumulative.
‡ Total returns shown for periods less than one year are not annualized.
* The Fund commenced offering Class B shares on July 1, 2002. Index returns began on June 30, 2002.
Information About Your Fund's Expenses
As an investor of the Fund, you incur two types of costs: ongoing expenses and transaction costs. Ongoing expenses include management fees, distribution and service (12b-1) fees and other Fund expenses. Examples of transaction costs include contract charges and account maintenance fees, which are not shown in this section. The following tables are intended to help you understand your ongoing expenses (in dollars) of investing in the Fund and to help you compare these expenses with the ongoing expenses of investing in other mutual funds. The example in the table is based on an investment of $1,000 invested at the beginning of the six-month period and held for the entire period (January 1, 2011 to June 30, 2011).
The tables illustrate your Fund's expenses in two ways:
•Actual Fund Return. This helps you estimate the actual dollar amount of ongoing expenses (but not transaction costs) paid on a $1,000 investment in the Fund using the Fund's actual return during the period. To estimate the expenses you paid over the period, simply divide your account value by $1,000 (for example, an $8,600 account value divided by $1,000 = 8.6), then multiply the result by the number in the "Expenses Paid per $1,000" line under the share class you hold.
• Hypothetical 5% Fund Return. This helps you to compare your Fund's ongoing expenses (but not transaction costs) with those of other mutual funds using the Fund's actual expense ratio and a hypothetical rate of return of 5% per year before expenses. Examples using a 5% hypothetical Fund return may be found in the shareholder reports of other mutual funds. The hypothetical account values and expenses may not be used to estimate the actual ending account balance or expenses you paid for the period.
Please note that the expenses shown in these tables are meant to highlight your ongoing expenses only and do not reflect any transaction costs. The "Expenses Paid per $1,000" line of the tables is useful in comparing ongoing expenses only and will not help you determine the relative total expense of owning different funds. If these transaction costs had been included, your costs would have been higher.
Expenses and Value of a $1,000 Investment for the six months ended June 30, 2011 | |
| Actual Fund Return | | Class A | | | Class B | |
| Beginning Account Value 1/1/11 | | $ | 1,000.00 | | | $ | 1,000.00 | |
| Ending Account Value 6/30/11 | | $ | 1,085.00 | | | $ | 1,083.90 | |
Expenses Paid per $1,000* | | $ | 3.93 | | | $ | 5.32 | |
| Hypothetical 5% Fund Return | | Class A | | | Class B | |
| Beginning Account Value 1/1/11 | | $ | 1,000.00 | | | $ | 1,000.00 | |
| Ending Account Value 6/30/11 | | $ | 1,021.03 | | | $ | 1,019.69 | |
Expenses Paid per $1,000* | | $ | 3.81 | | | $ | 5.16 | |
* Expenses are equal to the Fund's annualized expense ratio for each share class, multiplied by the average account value over the period, multiplied by the number of days in the most recent six-month period, then divided by 365.
| Annualized Expense Ratios | Class A | | Class B | |
| DWS Variable Series II — DWS Blue Chip VIP | .76% | | 1.03% | |
For more information, please refer to the Fund's prospectus.
These tables do not reflect charges and fees ("contract charges") associated with the separate account that invests in the Fund or any variable life insurance policy or variable annuity contract for which the Fund is an investment option.
Asset Allocation (As a % of Investment Portfolio excluding Securities Lending Collateral) | 6/30/11 | 12/31/10 |
| | | |
| Common Stocks | 99% | 99% |
| Cash Equivalents* | 1% | 1% |
| | 100% | 100% |
Sector Diversification (As a % of Common Stocks) | 6/30/11 | 12/31/10 |
| | | |
| Information Technology | 17% | 19% |
| Financials | 15% | 17% |
| Health Care | 15% | 14% |
| Industrials | 12% | 12% |
| Energy | 12% | 11% |
| Consumer Discretionary | 12% | 11% |
| Consumer Staples | 7% | 7% |
| Materials | 6% | 5% |
| Telecommunication Services | 2% | 2% |
| Utilities | 2% | 2% |
| | 100% | 100% |
* In order to keep cash on hand to meet shareholder redemptions or other needs while maintaining exposure to the market, the Fund invests in futures contracts.
Asset allocation and sector diversification are subject to change.
For more complete details about the Fund's investment portfolio, see page 6.
Following the Fund's fiscal first and third quarter-end, a complete portfolio holdings listing is filed with the SEC on Form N-Q. The form will be available on the SEC's Web site at www.sec.gov, and it also may be reviewed and copied at the SEC's Public Reference Room in Washington, D.C. Information on the operation of the SEC's Public Reference Room may be obtained by calling (800) SEC-0330. The Fund's portfolio holdings are also posted on www.dws-investments.com from time to time. Please see the Fund's current prospectus for more information.
Investment Portfolio June 30, 2011 (Unaudited) | | | Shares | | | Value ($) | |
| | | | |
| Common Stocks 98.5% | |
| Consumer Discretionary 11.2% | |
| Auto Components 0.1% | |
| Dana Holding Corp.* | | | 800 | | | | 14,640 | |
| TRW Automotive Holdings Corp.* | | | 2,100 | | | | 123,963 | |
| | | | | | | | 138,603 | |
| Diversified Consumer Services 0.1% | |
| Weight Watchers International, Inc. | | | 2,000 | | | | 150,940 | |
| Hotels Restaurants & Leisure 1.4% | |
| Chipotle Mexican Grill, Inc.* | | | 300 | | | | 92,457 | |
| Marriott International, Inc. "A" | | | 5,600 | | | | 198,744 | |
| Wynn Resorts Ltd. | | | 8,800 | | | | 1,263,152 | |
| | | | | | | | 1,554,353 | |
| Internet & Catalog Retail 0.8% | |
| Priceline.com, Inc.* (a) | | | 1,700 | | | | 870,281 | |
| Leisure Equipment & Products 0.1% | |
| Polaris Industries, Inc. | | | 500 | | | | 55,585 | |
| Media 5.0% | |
| CBS Corp. "B" | | | 59,800 | | | | 1,703,702 | |
| Comcast Corp. "A" | | | 77,500 | | | | 1,963,850 | |
| McGraw-Hill Companies, Inc. | | | 3,000 | | | | 125,730 | |
| Omnicom Group, Inc. | | | 1,500 | | | | 72,240 | |
| Time Warner, Inc. (a) | | | 22,033 | | | | 801,340 | |
| Viacom, Inc. "B" | | | 18,300 | | | | 933,300 | |
| | | | | | | | 5,600,162 | |
| Multiline Retail 1.3% | |
| Dillard's, Inc. "A" (a) | | | 22,108 | | | | 1,152,711 | |
| Macy's, Inc. | | | 11,500 | | | | 336,260 | |
| | | | | | | | 1,488,971 | |
| Specialty Retail 1.5% | |
| Aaron's, Inc. | | | 1,700 | | | | 48,042 | |
| Abercrombie & Fitch Co. "A" | | | 1,200 | | | | 80,304 | |
| Bed Bath & Beyond, Inc.* | | | 1,600 | | | | 93,392 | |
| Dick's Sporting Goods, Inc.* | | | 3,700 | | | | 142,265 | |
| Foot Locker, Inc. | | | 2,900 | | | | 68,904 | |
| Limited Brands, Inc. | | | 13,700 | | | | 526,765 | |
| TJX Companies, Inc. | | | 14,300 | | | | 751,179 | |
| Tractor Supply Co. | | | 200 | | | | 13,376 | |
| | | | | | | | 1,724,227 | |
| Textiles, Apparel & Luxury Goods 0.9% | |
| VF Corp. | | | 9,600 | | | | 1,042,176 | |
| Consumer Staples 6.9% | |
| Beverages 0.2% | |
| Coca-Cola Enterprises, Inc. | | | 6,900 | | | | 201,342 | |
| Food & Staples Retailing 2.0% | |
| Costco Wholesale Corp. | | | 10,300 | | | | 836,772 | |
| Kroger Co. | | | 11,600 | | | | 287,680 | |
| Safeway, Inc. (a) | | | 25,800 | | | | 602,946 | |
| Walgreen Co. | | | 9,600 | | | | 407,616 | |
| Whole Foods Market, Inc. (a) | | | 2,200 | | | | 139,590 | |
| | | | | | | | 2,274,604 | |
| Food Products 2.2% | |
| ConAgra Foods, Inc. | | | 2,800 | | | | 72,268 | |
| Corn Products International, Inc. | | | 2,800 | | | | 154,784 | |
| Fresh Del Monte Produce, Inc. | | | 5,500 | | | | 146,685 | |
| Hormel Foods Corp. | | | 6,500 | | | | 193,765 | |
| Smithfield Foods, Inc.* | | | 7,300 | | | | 159,651 | |
| | | Shares | | | Value ($) | |
| | | | | | | | | |
| The Hershey Co. | | | 10,700 | | | | 608,295 | |
| The JM Smucker Co. | | | 600 | | | | 45,864 | |
| Tyson Foods, Inc. "A" (a) | | | 57,300 | | | | 1,112,766 | |
| | | | | | | | 2,494,078 | |
| Household Products 0.2% | |
| Church & Dwight Co., Inc. | | | 1,000 | | | | 40,540 | |
| Colgate-Palmolive Co. | | | 2,800 | | | | 244,748 | |
| | | | | | | | 285,288 | |
| Personal Products 0.6% | |
| Herbalife Ltd. | | | 11,700 | | | | 674,388 | |
| Tobacco 1.7% | |
| Lorillard, Inc. | | | 1,800 | | | | 195,966 | |
| Philip Morris International, Inc. | | | 25,100 | | | | 1,675,927 | |
| | | | | | | | 1,871,893 | |
| Energy 11.8% | |
| Energy Equipment & Services 0.6% | |
| Complete Production Services, Inc.* | | | 10,800 | | | | 360,288 | |
| National Oilwell Varco, Inc. | | | 2,600 | | | | 203,346 | |
| Patterson-UTI Energy, Inc. (a) | | | 3,800 | | | | 120,118 | |
| | | | | | | | 683,752 | |
| Oil, Gas & Consumable Fuels 11.2% | |
| Anadarko Petroleum Corp. | | | 7,000 | | | | 537,320 | |
| Chevron Corp. | | | 25,700 | | | | 2,642,988 | |
| ConocoPhillips | | | 31,600 | | | | 2,376,004 | |
| CVR Energy, Inc.* | | | 6,600 | | | | 162,492 | |
| Devon Energy Corp. | | | 3,300 | | | | 260,073 | |
| Exxon Mobil Corp. | | | 21,900 | | | | 1,782,222 | |
| Hess Corp. | | | 7,100 | | | | 530,796 | |
| Marathon Oil Corp. | | | 33,800 | | | | 1,780,584 | |
| Murphy Oil Corp. | | | 8,800 | | | | 577,808 | |
| Stone Energy Corp.* | | | 1,400 | | | | 42,546 | |
| Tesoro Corp.* | | | 14,200 | | | | 325,322 | |
| Valero Energy Corp. | | | 55,700 | | | | 1,424,249 | |
| W&T Offshore, Inc. | | | 2,700 | | | | 70,524 | |
| | | | | | | | 12,512,928 | |
| Financials 15.0% | |
| Capital Markets 0.8% | |
| American Capital Ltd.* | | | 11,800 | | | | 117,174 | |
| BlackRock, Inc. | | | 800 | | | | 153,448 | |
| Franklin Resources, Inc. (a) | | | 4,800 | | | | 630,192 | |
| | | | | | | | 900,814 | |
| Commercial Banks 2.8% | |
| KeyCorp | | | 74,000 | | | | 616,420 | |
| M&T Bank Corp. (a) | | | 1,700 | | | | 149,515 | |
| Marshall & Ilsley Corp. | | | 11,600 | | | | 92,452 | |
| Regions Financial Corp. | | | 41,700 | | | | 258,540 | |
| SunTrust Banks, Inc. | | | 57,700 | | | | 1,488,660 | |
| Zions Bancorp. (a) | | | 21,600 | | | | 518,616 | |
| | | | | | | | 3,124,203 | |
| Consumer Finance 2.5% | |
| Capital One Financial Corp. | | | 33,300 | | | | 1,720,611 | |
| Discover Financial Services | | | 41,700 | | | | 1,115,475 | |
| | | | | | | | 2,836,086 | |
| Diversified Financial Services 2.7% | |
| CME Group, Inc. "A" | | | 900 | | | | 262,431 | |
| JPMorgan Chase & Co. | | | 61,800 | | | | 2,530,092 | |
| The NASDAQ OMX Group, Inc.* (a) | | | 8,300 | | | | 209,990 | |
| | | | | | | | 3,002,513 | |
| | | Shares | | | Value ($) | |
| | | | | | | | | |
| Insurance 5.0% | |
| ACE Ltd. | | | 11,900 | | | | 783,258 | |
| Allied World Assurance Co. Holding, AG | | | 3,700 | | | | 213,046 | |
| American International Group, Inc.* (a) | | | 26,100 | | | | 765,252 | |
| Chubb Corp. | | | 13,900 | | | | 870,279 | |
| Hartford Financial Services Group, Inc. | | | 9,900 | | | | 261,063 | |
| Lincoln National Corp. | | | 2,000 | | | | 56,980 | |
| Progressive Corp. | | | 9,700 | | | | 207,386 | |
| Prudential Financial, Inc. | | | 5,400 | | | | 343,386 | |
| Reinsurance Group of America, Inc. | | | 2,000 | | | | 121,720 | |
| RenaissanceRe Holdings Ltd. (a) | | | 600 | | | | 41,970 | |
| The Travelers Companies, Inc. | | | 33,600 | | | | 1,961,568 | |
| | | | | | | | 5,625,908 | |
| Real Estate Investment Trusts 1.0% | |
| HCP, Inc. (REIT) | | | 1,900 | | | | 69,711 | |
| Public Storage (REIT) | | | 3,200 | | | | 364,832 | |
| Rayonier, Inc. (REIT) | | | 3,500 | | | | 228,725 | |
| Vornado Realty Trust (REIT) | | | 5,200 | | | | 484,536 | |
| | | | | | | | 1,147,804 | |
| Thrifts & Mortgage Finance 0.2% | |
| People's United Financial, Inc. (a) | | | 13,800 | | | | 185,472 | |
| Health Care 14.9% | |
| Biotechnology 1.9% | |
| Biogen Idec, Inc.* | | | 13,900 | | | | 1,486,188 | |
| Cephalon, Inc.* | | | 8,300 | | | | 663,170 | |
| | | | | | | | 2,149,358 | |
| Health Care Providers & Services 6.7% | |
| Aetna, Inc. | | | 4,900 | | | | 216,041 | |
| AmerisourceBergen Corp. (a) | | | 11,800 | | | | 488,520 | |
| Cardinal Health, Inc. | | | 12,800 | | | | 581,376 | |
| CIGNA Corp. | | | 7,600 | | | | 390,868 | |
| Coventry Health Care, Inc.* | | | 22,900 | | | | 835,163 | |
| Health Net, Inc.* | | | 2,900 | | | | 93,061 | |
| Humana, Inc. | | | 20,700 | | | | 1,667,178 | |
| McKesson Corp. | | | 2,600 | | | | 217,490 | |
| UnitedHealth Group, Inc. | | | 47,000 | | | | 2,424,260 | |
| WellPoint, Inc. | | | 7,000 | | | | 551,390 | |
| | | | | | | | 7,465,347 | |
| Pharmaceuticals 6.3% | |
| Bristol-Myers Squibb Co. | | | 56,000 | | | | 1,621,760 | |
| Eli Lilly & Co. | | | 48,400 | | | | 1,816,452 | |
| Endo Pharmaceuticals Holdings, Inc.* | | | 5,400 | | | | 216,918 | |
| Forest Laboratories, Inc.* | | | 38,300 | | | | 1,506,722 | |
| Johnson & Johnson | | | 2,400 | | | | 159,648 | |
| Medicis Pharmaceutical Corp. "A" | | | 4,000 | | | | 152,680 | |
| Merck & Co., Inc. | | | 28,200 | | | | 995,178 | |
| Par Pharmaceutical Companies, Inc.* | | | 5,800 | | | | 191,284 | |
| Pfizer, Inc. | | | 10,000 | | | | 206,000 | |
| Warner Chilcott PLC "A" | | | 4,000 | | | | 96,520 | |
| Watson Pharmaceuticals, Inc.* | | | 1,700 | | | | 116,841 | |
| | | | | | | | 7,080,003 | |
| Industrials 12.4% | |
| Aerospace & Defense 4.7% | |
| General Dynamics Corp. | | | 12,700 | | | | 946,404 | |
| Honeywell International, Inc. | | | 17,000 | | | | 1,013,030 | |
| Lockheed Martin Corp. | | | 4,600 | | | | 372,462 | |
| Northrop Grumman Corp. | | | 26,600 | | | | 1,844,710 | |
| | | Shares | | | Value ($) | |
| | | | | | | | | |
| Raytheon Co. | | | 12,476 | | | | 621,929 | |
| United Technologies Corp. | | | 5,500 | | | | 486,805 | |
| | | | | | | | 5,285,340 | |
| Air Freight & Logistics 0.8% | |
| FedEx Corp. | | | 9,600 | | | | 910,560 | |
| Airlines 0.4% | |
| Alaska Air Group, Inc.* | | | 4,200 | | | | 287,532 | |
| Southwest Airlines Co. | | | 12,500 | | | | 142,750 | |
| | | | | | | | 430,282 | |
| Commercial Services & Supplies 0.2% | |
| R.R. Donnelley & Sons Co. (a) | | | 13,200 | | | | 258,852 | |
| Construction & Engineering 0.5% | |
| EMCOR Group, Inc.* | | | 4,800 | | | | 140,688 | |
| Fluor Corp. | | | 3,400 | | | | 219,844 | |
| KBR, Inc. | | | 4,700 | | | | 177,143 | |
| | | | | | | | 537,675 | |
| Industrial Conglomerates 0.9% | |
| General Electric Co. | | | 12,300 | | | | 231,978 | |
| Tyco International Ltd. | | | 16,000 | | | | 790,880 | |
| | | | | | | | 1,022,858 | |
| Machinery 3.0% | |
| Caterpillar, Inc. | | | 19,800 | | | | 2,107,908 | |
| Cummins, Inc. | | | 2,900 | | | | 300,121 | |
| Dover Corp. | | | 1,300 | | | | 88,140 | |
| Eaton Corp. | | | 13,800 | | | | 710,010 | |
| Joy Global, Inc. | | | 1,900 | | | | 180,956 | |
| Oshkosh Corp.* | | | 500 | | | | 14,470 | |
| | | | | | | | 3,401,605 | |
| Professional Services 0.2% | |
| Manpower, Inc. | | | 3,200 | | | | 171,680 | |
| Road & Rail 1.1% | |
| CSX Corp. | | | 8,100 | | | | 212,382 | |
| Norfolk Southern Corp. | | | 2,900 | | | | 217,297 | |
| Ryder System, Inc. | | | 13,800 | | | | 784,530 | |
| | | | | | | | 1,214,209 | |
| Trading Companies & Distributors 0.6% | |
| W.W. Grainger, Inc. | | | 4,200 | | | | 645,330 | |
| Information Technology 16.9% | |
| Communications Equipment 0.4% | |
| Motorola Solutions, Inc.* | | | 3,700 | | | | 170,348 | |
| Polycom, Inc.* | | | 1,900 | | | | 122,170 | |
| Riverbed Technology, Inc.* | | | 1,800 | | | | 71,262 | |
| Telefonaktiebolaget LM Ericsson (ADR) | | | 7,200 | | | | 103,536 | |
| | | | | | | | 467,316 | |
| Computers & Peripherals 2.6% | |
| Apple, Inc.* | | | 3,500 | | | | 1,174,845 | |
| Dell, Inc.* | | | 33,400 | | | | 556,778 | |
| Lexmark International, Inc. "A"* | | | 13,600 | | | | 397,936 | |
| SanDisk Corp.* | | | 4,500 | | | | 186,750 | |
| Western Digital Corp.* | | | 16,100 | | | | 585,718 | |
| | | | | | | | 2,902,027 | |
| Electronic Equipment, Instruments & Components 3.1% | |
| Anixter International, Inc. (a) | | | 3,000 | | | | 196,020 | |
| Arrow Electronics, Inc.* | | | 21,200 | | | | 879,800 | |
| Avnet, Inc.* | | | 12,000 | | | | 382,560 | |
| Ingram Micro, Inc. "A"* (a) | | | 11,800 | | | | 214,052 | |
| Jabil Circuit, Inc. | | | 1,500 | | | | 30,300 | |
| TE Connectivity Ltd. | | | 16,700 | | | | 613,892 | |
| | | Shares | | | Value ($) | |
| | | | | | | | | |
| Tech Data Corp.* (a) | | | 10,100 | | | | 493,789 | |
| Vishay Intertechnology, Inc.* (a) | | | 41,400 | | | | 622,656 | |
| | | | | | | | 3,433,069 | |
| Internet Software & Services 0.8% | |
| AOL, Inc.* (a) | | | 9,900 | | | | 196,614 | |
| IAC/InterActiveCorp.* (a) | | | 18,400 | | | | 702,328 | |
| | | | | | | | 898,942 | |
| IT Services 5.2% | |
| Automatic Data Processing, Inc. (a) | | | 21,600 | | | | 1,137,888 | |
| Computer Sciences Corp. | | | 22,136 | | | | 840,283 | |
| Fiserv, Inc.* | | | 5,500 | | | | 344,465 | |
| International Business Machines Corp. | | | 20,300 | | | | 3,482,465 | |
| SAIC, Inc.* | | | 3,400 | | | | 57,188 | |
| VeriFone Systems, Inc.* | | | 600 | | | | 26,610 | |
| | | | | | | | 5,888,899 | |
| Semiconductors & Semiconductor Equipment 2.0% | |
| Altera Corp. | | | 19,200 | | | | 889,920 | |
| Analog Devices, Inc. | | | 8,300 | | | | 324,862 | |
| Applied Materials, Inc. | | | 11,200 | | | | 145,712 | |
| Cypress Semiconductor Corp.* | | | 3,900 | | | | 82,446 | |
| GT Solar International, Inc.* (a) | | | 15,100 | | | | 244,620 | |
| Intel Corp. | | | 11,000 | | | | 243,760 | |
| Micron Technology, Inc.* | | | 29,300 | | | | 219,164 | |
| NVIDIA Corp.* (a) | | | 8,100 | | | | 129,073 | |
| | | | | | | | 2,279,557 | |
| Software 2.8% | |
| Activision Blizzard, Inc. | | | 14,300 | | | | 167,024 | |
| CA, Inc. | | | 2,600 | | | | 59,384 | |
| Citrix Systems, Inc.* | | | 200 | | | | 16,000 | |
| Oracle Corp. | | | 73,300 | | | | 2,412,303 | |
| Symantec Corp.* | | | 12,300 | | | | 242,556 | |
| TIBCO Software, Inc.* | | | 7,100 | | | | 206,042 | |
| | | | | | | | 3,103,309 | |
| Materials 5.8% | |
| Chemicals 3.6% | |
| Dow Chemical Co. | | | 27,200 | | | | 979,200 | |
| E.I. du Pont de Nemours & Co. | | | 30,300 | | | | 1,637,715 | |
| Eastman Chemical Co. | | | 4,800 | | | | 489,936 | |
| Georgia Gulf Corp.* | | | 1,400 | | | | 33,796 | |
| Lubrizol Corp. | | | 200 | | | | 26,854 | |
| OM Group, Inc.* | | | 500 | | | | 20,320 | |
| Potash Corp. of Saskatchewan, Inc. | | | 2,700 | | �� | | 153,873 | |
| PPG Industries, Inc. | | | 3,700 | | | | 335,923 | |
| Rockwood Holdings, Inc.* | | | 3,500 | | | | 193,515 | |
| Westlake Chemical Corp. (a) | | | 2,200 | | | | 114,180 | |
| | | | | | | | 3,985,312 | |
| | | Shares | | | Value ($) | |
| | | | | | | | | |
| Metals & Mining 1.0% | |
| Barrick Gold Corp. | | | 15,400 | | | | 697,466 | |
| Cliffs Natural Resources, Inc. | | | 4,700 | | | | 434,515 | |
| | | | | | | | 1,131,981 | |
| Paper & Forest Products 1.2% | |
| Domtar Corp. | | | 6,900 | | | | 653,568 | |
| International Paper Co. | | | 22,200 | | | | 662,004 | |
| MeadWestvaco Corp. | | | 900 | | | | 29,979 | |
| | | | | | | | 1,345,551 | |
| Telecommunication Services 2.1% | |
| Diversified Telecommunication Services 2.0% | |
| AT&T, Inc. | | | 8,500 | | | | 266,985 | |
| Verizon Communications, Inc. | | | 53,500 | | | | 1,991,805 | |
| | | | | | | | 2,258,790 | |
| Wireless Telecommunication Services 0.1% | |
| Vodafone Group PLC (ADR) | | | 3,400 | | | | 90,848 | |
| Utilities 1.5% | |
| Electric Utilities 0.5% | |
| Duke Energy Corp. (a) | | | 27,100 | | | | 510,293 | |
| Pepco Holdings, Inc. | | | 3,000 | | | | 58,890 | |
| | | | | | | | 569,183 | |
| Independent Power Producers & Energy Traders 0.8% | |
| NRG Energy, Inc.* (a) | | | 36,108 | | | | 887,535 | |
| Multi-Utilities 0.2% | |
| Ameren Corp. (a) | | | 9,000 | | | | 259,560 | |
Total Common Stocks (Cost $95,070,858) | | | | 110,521,349 | |
| | |
| Securities Lending Collateral 10.5% | |
| Daily Assets Fund Institutional, 0.13% (b) (c) (Cost $11,794,940) | | | 11,794,940 | | | | 11,794,940 | |
| | |
| Cash Equivalents 1.4% | |
| Central Cash Management Fund, 0.11% (b) (Cost $1,529,877) | | | 1,529,877 | | | | 1,529,877 | |
| | | % of Net Assets | | | Value ($) | |
| | | | |
Total Investment Portfolio (Cost $108,395,675)+ | | | 110.4 | | | | 123,846,166 | |
| Other Assets and Liabilities, Net (a) | | | (10.4 | ) | | | (11,678,224 | ) |
| Net Assets | | | 100.0 | | | | 112,167,942 | |
* Non-income producing security.
+ The cost for federal income tax purposes was $109,348,446. At June 30, 2011, net unrealized appreciation for all securities based on tax cost was $14,497,720. This consisted of aggregate gross unrealized appreciation for all securities in which there was an excess of value over tax cost of $16,473,451 and aggregate gross unrealized depreciation for all securities in which there was an excess of tax cost over value of $1,975,731.
(a) All or a portion of these securities were on loan amounting to $11,626,913. In addition, included in other assets and liabilities, net is a pending sale, amounting to $14,903, that is also on loan (see Notes to Financial Statements). The value of all securities loaned at June 30, 2011 amounted to $11,641,816, which is 10.4% of net assets
(b) Affiliated fund managed by Deutsche Investment Management Americas Inc. The rate shown is the annualized seven-day yield at period end.
(c) Represents collateral held in connection with securities lending. Income earned by the Fund is net of borrower rebates.
ADR: American Depositary Receipt
REIT: Real Estate Investment Trust
At June 30, 2011, open futures contracts purchased were as follows:
| Futures | Currency | Expiration Date | | Contracts | | | Notional Value ($) | | | Unrealized Appreciation ($) | |
| S&P 500 E-Mini Index | USD | 9/16/2011 | | | 23 | | | | 1,512,825 | | | | 53,820 | |
| Currency Abbreviation |
| USD United States Dollar |
Fair Value Measurements
Various inputs are used in determining the value of the Fund's investments. These inputs are summarized in three broad levels. Level 1 includes quoted prices in active markets for identical securities. Level 2 includes other significant observable inputs (including quoted prices for similar securities, interest rates, prepayment speeds, and credit risk). Level 3 includes significant unobservable inputs (including the Fund's own assumptions in determining the fair value of investments). The inputs or methodology used for valuing securities are not necessarily an indication of the risk associated with investing in those securities.
The following is a summary of the inputs used as of June 30, 2011 in valuing the Fund's investments. For information on the Fund's policy regarding the valuation of investments, please refer to the Security Valuation section of Note A in the accompanying Notes to Financial Statements.
| Assets | | Level 1 | | | Level 2 | | | Level 3 | | | Total | |
| | |
| Common Stocks (d) | | $ | 110,521,349 | | | $ | — | | | $ | — | | | $ | 110,521,349 | |
| Short-Term Investments (d) | | | 13,324,817 | | | | — | | | | — | | | | 13,324,817 | |
| Derivatives (e) | | | 53,820 | | | | — | | | | — | | | | 53,820 | |
| Total | | $ | 123,899,986 | | | $ | — | | | $ | — | | | $ | 123,899,986 | |
There have been no transfers between Level 1 and Level 2 fair value measurements during the period ended June 30, 2011.
(d) See Investment Portfolio for additional detailed categorizations.
(e) Derivatives include unrealized appreciation (depreciation) on open futures contracts.
The accompanying notes are an integral part of the financial statements.
Statement of Assets and Liabilities | as of June 30, 2011 (Unaudited) | |
| Assets | |
Investments: Investments in non-affiliated securities, at value (cost $95,070,858) — including $11,626,913 of securities loaned | | $ | 110,521,349 | |
Investment in Daily Assets Fund Institutional (cost $11,794,940)* | | | 11,794,940 | |
| Investment in Central Cash Management Fund (cost $1,529,877) | | | 1,529,877 | |
| Total investments in securities, at value (cost $108,395,675) | | | 123,846,166 | |
| Foreign currency, at value (cost $2,134) | | | 2,302 | |
| Deposit with brokers for futures contracts | | | 102,283 | |
| Receivable for investments sold | | | 65,795 | |
| Receivable for Fund shares sold | | | 4,984 | |
| Receivable for variation margin on futures contracts | | | 53,820 | |
| Dividends receivable | | | 132,493 | |
| Interest receivable | | | 392 | |
| Other assets | | | 672 | |
| Total assets | | | 124,208,907 | |
| Liabilities | |
| Cash overdraft | | | 53,750 | |
| Payable upon return of securities loaned | | | 11,794,940 | |
| Payable for Fund shares redeemed | | | 99,254 | |
| Accrued management fee | | | 49,455 | |
| Other accrued expenses and payables | | | 43,566 | |
| Total liabilities | | | 12,040,965 | |
| Net assets, at value | | $ | 112,167,942 | |
| Net Assets Consist of | |
| Undistributed net investment income | | | 524,401 | |
Net unrealized appreciation (depreciation) on: Investments | | | 15,450,491 | |
| Futures | | | 53,820 | |
| Foreign currency | | | 168 | |
| Accumulated net realized gain (loss) | | | (40,972,932 | ) |
| Paid-in capital | | | 137,111,994 | |
| Net assets, at value | | $ | 112,167,942 | |
Class A Net Asset Value, offering and redemption price per share ($111,995,123 ÷ 9,792,989 outstanding shares of beneficial interest, no par value, unlimited number of shares authorized) | | $ | 11.44 | |
Class B Net Asset Value, offering and redemption price per share ($172,819 ÷ 15,046 outstanding shares of beneficial interest, no par value, unlimited number of shares authorized) | | $ | 11.49 | |
* Represents collateral of securities loaned.
The accompanying notes are an integral part of the financial statements.
Statement of Operations
| for the six months ended June 30, 2011 (Unaudited) | |
| Investment Income | |
Income: Dividends (net of foreign taxes withheld of $455) | | $ | 976,208 | |
| Interest | | | 13 | |
| Income distributions — Central Cash Management Fund | | | 804 | |
| Securities lending income, including income from Daily Assets Fund Institutional, net of borrower rebates | | | 11,768 | |
| Total income | | | 988,793 | |
Expenses: Management fee | | | 312,274 | |
| Administration fee | | | 56,191 | |
| Services to shareholders | | | 1,178 | |
| Distribution service fee (Class B) | | | 215 | |
| Custodian fee | | | 9,654 | |
| Legal fees | | | 4,193 | |
| Audit and tax fees | | | 25,008 | |
| Reports to shareholders | | | 12,369 | |
| Trustees' fees and expenses | | | 2,685 | |
| Other | | | 4,561 | |
| Total expenses | | | 428,328 | |
| Net investment income (loss) | | | 560,465 | |
| Realized and Unrealized Gain (Loss) | |
Net realized gain (loss) from: Investments | | | 8,581,437 | |
| Futures | | | 137,064 | |
| | | | 8,718,501 | |
Change in net unrealized appreciation (depreciation) on: Investments | | | (181,019 | ) |
| Futures | | | 38,602 | |
| Foreign currency | | | 69 | |
| | | | (142,348 | ) |
| Net gain (loss) | | | 8,576,153 | |
| Net increase (decrease) in net assets resulting from operations | | $ | 9,136,618 | |
The accompanying notes are an integral part of the financial statements.
Statement of Changes in Net Assets | Increase (Decrease) in Net Assets | | Six Months Ended June 30, 2011 (Unaudited) | | | Year Ended December 31, 2010 | |
Operations: Net investment income (loss) | | $ | 560,465 | | | $ | 1,225,775 | |
| Net realized gain (loss) | | | 8,718,501 | | | | 11,654,348 | |
| Change in net unrealized appreciation (depreciation) | | | (142,348 | ) | | | 528,773 | |
| Net increase (decrease) in net assets resulting from operations | | | 9,136,618 | | | | 13,408,896 | |
Distributions to shareholders from: Net investment income: Class A | | | (1,181,666 | ) | | | (1,575,913 | ) |
| Class B | | | (1,333 | ) | | | (1,920 | ) |
| Total distributions | | | (1,182,999 | ) | | | (1,577,833 | ) |
Fund share transactions: Class A Proceeds from shares sold | | | 5,545,578 | | | | 4,447,701 | |
| Reinvestment of distributions | | | 1,181,666 | | | | 1,575,913 | |
| Payments for shares redeemed | | | (11,166,281 | ) | | | (20,221,768 | ) |
| Net increase (decrease) in net assets from Class A share transactions | | | (4,439,037 | ) | | | (14,198,154 | ) |
Class B Proceeds from shares sold | | | 133 | | | | 1,931 | |
| Reinvestment of distributions | | | 1,333 | | | | 1,920 | |
| Payments for shares redeemed | | | (7,805 | ) | | | (19,529 | ) |
| Net increase (decrease) in net assets from Class B share transactions | | | (6,339 | ) | | | (15,678 | ) |
| Increase (decrease) in net assets | | | 3,508,243 | | | | (2,382,769 | ) |
| Net assets at beginning of period | | | 108,659,699 | | | | 111,042,468 | |
| Net assets at end of period (including undistributed net investment income of $524,401 and $1,146,935, respectively) | | $ | 112,167,942 | | | $ | 108,659,699 | |
| Other Information | |
Class A Shares outstanding at beginning of period | | | 10,190,728 | | | | 11,688,302 | |
| Shares sold | | | 496,243 | | | | 457,619 | |
| Shares issued to shareholders in reinvestment of distributions | | | 101,084 | | | | 153,448 | |
| Shares redeemed | | | (995,066 | ) | | | (2,108,641 | ) |
| Net increase (decrease) in Class A shares | | | (397,739 | ) | | | (1,497,574 | ) |
| Shares outstanding at end of period | | | 9,792,989 | | | | 10,190,728 | |
Class B Shares outstanding at beginning of period | | | 15,598 | | | | 17,241 | |
| Shares sold | | | 12 | | | | 199 | |
| Shares issued to shareholders in reinvestment of distributions | | | 113 | | | | 186 | |
| Shares redeemed | | | (677 | ) | | | (2,028 | ) |
| Net increase (decrease) in Class B shares | | | (552 | ) | | | (1,643 | ) |
| Shares outstanding at end of period | | | 15,046 | | | | 15,598 | |
The accompanying notes are an integral part of the financial statements.
| | | | | | Years Ended December 31, | |
| Class A | | Six Months Ended 6/30/11 (Unaudited) | | | 2010 | | | 2009 | | | 2008 | | | 2007 | | | 2006 | |
| Selected Per Share Data | |
| Net asset value, beginning of period | | $ | 10.65 | | | $ | 9.49 | | | $ | 7.25 | | | $ | 14.65 | | | $ | 16.17 | | | $ | 14.88 | |
Income (loss) from investment operations: Net investment incomea | | | .06 | | | | .11 | | | | .12 | | | | .12 | | | | .17 | | | | .17 | c |
| Net realized and unrealized gain (loss) | | | .85 | | | | 1.19 | | | | 2.27 | | | | (4.97 | ) | | | .36 | | | | 2.07 | |
| Total from investment operations | | | .91 | | | | 1.30 | | | | 2.39 | | | | (4.85 | ) | | | .53 | | | | 2.24 | |
Less distributions from: Net investment income | | | (.12 | ) | | | (.14 | ) | | | (.15 | ) | | | (.21 | ) | | | (.18 | ) | | | (.14 | ) |
| Net realized gains | | | — | | | | — | | | | — | | | | (2.34 | ) | | | (1.87 | ) | | | (.81 | ) |
| Total distributions | | | (.12 | ) | | | (.14 | ) | | | (.15 | ) | | | (2.55 | ) | | | (2.05 | ) | | | (.95 | ) |
| Net asset value, end of period | | $ | 11.44 | | | $ | 10.65 | | | $ | 9.49 | | | $ | 7.25 | | | $ | 14.65 | | | $ | 16.17 | |
| Total Return (%) | | | 8.50 | ** | | | 13.77 | | | | 33.97 | | | | (38.49 | )b | | | 3.50 | | | | 15.65 | c |
| Ratios to Average Net Assets and Supplemental Data | |
| Net assets, end of period ($ millions) | | | 112 | | | | 108 | | | | 111 | | | | 106 | | | | 242 | | | | 314 | |
| Ratio of expenses before expense reductions (%) | | | .76 | * | | | .76 | | | | .75 | | | | .76 | | | | .71 | | | | .71 | |
| Ratio of expenses after expense reductions (%) | | | .76 | * | | | .76 | | | | .75 | | | | .76 | | | | .71 | | | | .71 | |
| Ratio of net investment income (%) | | | 1.00 | * | | | 1.16 | | | | 1.54 | | | | 1.12 | | | | 1.13 | | | | 1.12 | c |
| Portfolio turnover rate (%) | | | 99 | ** | | | 146 | | | | 82 | | | | 127 | | | | 275 | | | | 226 | |
a Based on average shares outstanding during the period. b Total return would have been lower had certain expenses not been reduced. c Includes non-recurring income from the Advisor recorded as a result of an administrative proceeding regarding disclosure of brokerage allocation practices in connection with sales of DWS Funds. The non-recurring income resulted in an increase in net investment income of $0.003 per share and an increase in the ratio of net investment income of 0.02%. Excluding this non-recurring income, total return would have been 0.02% lower. * Annualized ** Not annualized | |
| | | | | | Years Ended December 31, | |
| Class B | | Six Months Ended 6/30/11 (Unaudited) | | | 2010 | | | 2009 | | | 2008 | | | 2007 | | | 2006 | |
| Selected Per Share Data | |
| Net asset value, beginning of period | | $ | 10.68 | | | $ | 9.51 | | | $ | 7.26 | | | $ | 14.61 | | | $ | 16.12 | | | $ | 14.83 | |
Income (loss) from investment operations: Net investment incomea | | | .04 | | | | .09 | | | | .10 | | | | .04 | | | | .11 | | | | .11 | c |
| Net realized and unrealized gain (loss) | | | .86 | | | | 1.19 | | | | 2.27 | | | | (4.89 | ) | | | .36 | | | | 2.07 | |
| Total from investment operations | | | .90 | | | | 1.28 | | | | 2.37 | | | | (4.85 | ) | | | .47 | | | | 2.18 | |
Less distributions from: Net investment income | | | (.09 | ) | | | (.11 | ) | | | (.12 | ) | | | (.16 | ) | | | (.11 | ) | | | (.08 | ) |
| Net realized gains | | | — | | | | — | | | | — | | | | (2.34 | ) | | | (1.87 | ) | | | (.81 | ) |
| Total distributions | | | (.09 | ) | | | (.11 | ) | | | (.12 | ) | | | (2.50 | ) | | | (1.98 | ) | | | (.89 | ) |
| Net asset value, end of period | | $ | 11.49 | | | $ | 10.68 | | | $ | 9.51 | | | $ | 7.26 | | | $ | 14.61 | | | $ | 16.12 | |
| Total Return (%) | | | 8.39 | ** | | | 13.55 | | | | 33.46 | | | | (38.48 | )b | | | 3.15 | | | | 15.19 | c |
| Ratios to Average Net Assets and Supplemental Data | |
| Net assets, end of period ($ millions) | | | .17 | | | | .17 | | | | .16 | | | | .13 | | | | 11 | | | | 46 | |
| Ratio of expenses before expense reductions (%) | | | 1.03 | * | | | 1.02 | | | | 1.02 | | | | 1.22 | | | | 1.09 | | | | 1.09 | |
| Ratio of expenses after expense reductions (%) | | | 1.03 | * | | | 1.02 | | | | 1.02 | | | | 1.21 | | | | 1.09 | | | | 1.09 | |
| Ratio of net investment income (%) | | | .73 | * | | | .90 | | | | 1.27 | | | | .67 | | | | .75 | | | | .74 | c |
| Portfolio turnover rate (%) | | | 99 | ** | | | 146 | | | | 82 | | | | 127 | | | | 275 | | | | 226 | |
a Based on average shares outstanding during the period. b Total return would have been lower had certain expenses not been reduced. c Includes non-recurring income from the Advisor recorded as a result of an administrative proceeding regarding disclosure of brokerage allocation practices in connection with sales of DWS Funds. The non-recurring income resulted in an increase in net investment income of $0.003 per share and an increase in the ratio of net investment income of 0.02%. Excluding this non-recurring income, total return would have been 0.02% lower. * Annualized ** Not annualized | |
Notes to Financial Statements (Unaudited)
A. Organization and Significant Accounting Policies
DWS Blue Chip VIP (the "Fund") is a diversified series of DWS Variable Series II (the "Trust"), which is registered under the Investment Company Act of 1940, as amended (the "1940 Act"), as an open-end management investment company organized as a Massachusetts business trust.
Multiple Classes of Shares of Beneficial Interest. The Fund offers two classes of shares (Class A shares and Class B shares). Sales of Class B shares are subject to recordkeeping fees up to 0.15% and Rule 12b-1 fees under the 1940 Act equal to an annual rate of 0.25% of the average daily net assets of the Class B shares of the Fund. Class A shares are not subject to such fees.
Investment income, realized and unrealized gains and losses, and certain fund-level expenses and expense reductions, if any, are borne pro rata on the basis of relative net assets by the holders of all classes of shares except that each class bears certain expenses unique to that class (including the applicable Rule 12b-1 fee and recordkeeping fees). Differences in class-level expenses may result in payment of different per share dividends by class. All shares have equal rights with respect to voting subject to class-specific arrangements.
The Fund's financial statements are prepared in accordance with accounting principles generally accepted in the United States of America which require the use of management estimates. Actual results could differ from those estimates. The policies described below are followed consistently by the Fund in the preparation of its financial statements.
Security Valuation. Investments are stated at value determined as of the close of regular trading on the New York Stock Exchange on each day the exchange is open for trading.
Various inputs are used in determining the value of the Fund's investments. These inputs are summarized in three broad levels. Level 1 includes quoted prices in active markets for identical securities. Level 2 includes other significant observable inputs (including quoted prices for similar securities, interest rates, prepayment speeds, and credit risk). Level 3 includes significant unobservable inputs (including the Fund's own assumptions in determining the fair value of investments). The inputs or methodology used for valuing securities are not necessarily an indication of the risk associated with investing in those securities.
Equity securities are valued at the most recent sale price or official closing price reported on the exchange (US or foreign) or over-the-counter market on which they trade and are categorized as Level 1 securities. Securities for which no sales are reported are valued at the calculated mean between the most recent bid and asked quotations on the relevant market or, if a mean cannot be determined, at the most recent bid quotation.
Money market instruments purchased with an original or remaining maturity of sixty days or less, maturing at par, are valued at amortized cost, which approximates value, and are categorized as Level 2. Investments in open-end investment companies are valued at their net asset value each business day and are categorized as Level 1.
Futures contracts are generally valued at the settlement prices established each day on the exchange on which they are traded and are categorized as Level 1.
Securities and other assets for which market quotations are not readily available or for which the above valuation procedures are deemed not to reflect fair value are valued in a manner that is intended to reflect their fair value as determined in accordance with procedures approved by the Board and are generally categorized as Level 3. In accordance with the Fund's valuation procedures, factors used in determining value may include, but are not limited to, the type of the security; the size of the holding; the initial cost of the security; the existence of any contractual restrictions on the security's disposition; the price and extent of public trading in similar securities of the issuer or of comparable companies; quotations or evaluated prices from broker-dealers and/or pricing services; information obtained from the issuer, analysts, and/or the appropriate stock exchange (for exchange-traded securities); an analysis of the company's or issuer's financial statements; an evaluation of the forces that influence the issuer and the market(s) in which the security is purchased and sold and with respect to debt securities; the maturity, coupon, creditworthiness, currency denomination and the movement of the market in which the security is normally traded. The value determined under these procedures may differ from published values for the same securities.
Disclosure about the classification of fair value measurements is included in a table following the Fund's Investment Portfolio.
Foreign Currency Translations. The books and records of the Fund are maintained in US dollars. Investment securities and other assets and liabilities denominated in a foreign currency are translated into US dollars at the prevailing exchange rates at period end. Purchases and sales of investment securities, income and expenses are translated into US dollars at the prevailing exchange rates on the respective dates of the transactions.
Net realized and unrealized gains and losses on foreign currency transactions represent net gains and losses between trade and settlement dates on securities transactions, the acquisition and disposition of foreign currencies, and the difference between the amount of net investment income accrued and the US dollar amount actually received. That portion of both realized and unrealized gains and losses on investments that results from fluctuations in foreign currency exchange rates is not separately disclosed but is included with net realized and unrealized gain/appreciation and loss/depreciation on investments.
Securities Lending. The Fund lends securities to certain financial institutions. The Fund retains beneficial ownership of the securities it has loaned and continues to receive interest and dividends paid by the issuer of securities and to participate in any changes in their market value. The Fund requires the borrowers of the securities to maintain collateral with the Fund consisting of either cash or liquid, unencumbered assets having a value at least equal to the value of the securities loaned. When the collateral falls below specified amounts, the lending agent will use its best effort to obtain additional collateral on the next business day to meet required amounts under the security lending agreement. The Fund may invest the cash collateral into a joint trading account in an affiliated money market fund pursuant to Exemptive Orders issued by the SEC. The Fund receives compensation for lending its securities either in the form of fees or by earning interest on invested cash collateral net of borrower rebates and fees paid to a lending agent. Either the Fund or the borrower may terminate the loan. There may be risks of delay and costs in recovery of securities or even loss of rights in the collateral should the borrower of the securities fail financially. The Fund is also subject to all investment risks associated with the reinvestment of any cash collateral received, including, but not limited to, interest rate, credit and liquidity risk associated with such investments.
Federal Income Taxes. The Fund's policy is to comply with the requirements of the Internal Revenue Code, as amended, which are applicable to regulated investment companies and to distribute all of its taxable income to its shareholders.
At December 31, 2010, the Fund had a net tax basis capital loss carryforward of approximately $48,723,000, which may be applied against any realized net taxable capital gains of each succeeding year until fully utilized or until December 31, 2016 ($15,813,000) and December 31, 2017 ($32,910,000), the respective expiration dates, whichever occurs first.
On December 22, 2010, the Regulated Investment Company Modernization Act of 2010 (the "Act") was enacted. Under the Act, net capital losses may be carried forward indefinitely, and their character is retained as short-term and/or long-term losses. Previously, net capital losses were carried forward for eight years and treated as short-term losses. As a transition rule, the Act requires that post-enactment net capital losses be used before pre-enactment net capital losses. As a result of this ordering rule, pre-enactment capital loss carryforwards may expire unused, whereas under the previous rules these losses may have been utilized. This change is effective for fiscal years beginning after the date of enactment.
The Fund has reviewed the tax positions for the open tax years as of December 31, 2010 and has determined that no provision for income tax is required in the Fund's financial statements. The Fund's federal tax returns for the prior three fiscal years remain open subject to examination by the Internal Revenue Service.
Distribution of Income and Gains. Net investment income of the Fund, if any, is declared and distributed to shareholders annually. Net realized gains from investment transactions, in excess of available capital loss carryforwards, would be taxable to the Fund if not distributed and, therefore, will be distributed to shareholders at least annually. The Fund may also make additional distributions for tax purposes if necessary.
The timing and characterization of certain income and capital gains distributions are determined annually in accordance with federal tax regulations which may differ from accounting principles generally accepted in the United States of America. These differences primarily relate to investments in futures contracts and certain securities sold at a loss. As a result, net investment income (loss) and net realized gain (loss) on investment transactions for a reporting period may differ significantly from distributions during such period. Accordingly, the Fund may periodically make reclassifications among certain of its capital accounts without impacting the net asset value of the Fund.
The tax character of current year distributions will be determined at the end of the current fiscal year.
Expenses. Expenses of the Trust arising in connection with a specific fund are allocated to that fund. Other Trust expenses which cannot be directly attributed to a fund are apportioned among the funds in the Trust.
Contingencies. In the normal course of business, the Fund may enter into contracts with service providers that contain general indemnification clauses. The Fund's maximum exposure under these arrangements is unknown as this would involve future claims that may be made against the Fund that have not yet been made. However, based on experience, the Fund expects the risk of loss to be remote.
Other. Investment transactions are accounted for on a trade date plus one basis for daily net asset value calculations. However, for financial reporting purposes, investment transactions are reported on trade date. Interest income is recorded on the accrual basis. Dividend income is recorded on the ex-dividend date net of foreign withholding taxes. Realized gains and losses from investment transactions are recorded on an identified cost basis and may include proceeds from litigation.
B. Derivative Instruments
Futures Contracts. A futures contract is an agreement between a buyer or seller and an established futures exchange or its clearinghouse in which the buyer or seller agrees to take or make a delivery of a specific amount of a financial instrument at a specified price on a specific date (settlement date). For the six months ended June 30, 2011, the Fund used futures contracts to keep cash on hand to meet shareholder redemptions or other needs while maintaining exposure to the market.
Futures contracts are valued at the most recent settlement price. Upon entering into a futures contract, the Fund is required to deposit with a financial intermediary cash or securities ("initial margin") in an amount equal to a certain percentage of the face value indicated in the futures contract. Subsequent payments ("variation margin") are made or received by the Fund dependent upon the daily fluctuations in the value and are recorded for financial reporting purposes as unrealized gains or losses by the Fund. Gains or losses are realized when the contract expires or is closed. Since all futures contracts are exchange-traded, counterparty risk is minimized as the exchange's clearinghouse acts as the counterparty, and guarantees the futures against default.
Certain risks may arise upon entering into futures contracts, including the risk that an illiquid market will limit the Fund's ability to close out a futures contract prior to the settlement date and the risk that the futures contract is not well correlated with the security, index or currency to which it relates. Risk of loss may exceed amounts recognized in the Statement of Assets and Liabilities.
A summary of the open futures contracts as of June 30, 2011 is included in a table following the Fund's Investment Portfolio. For the six months ended June 30, 2011, the Fund's investment in futures contracts purchased had a total notional value generally indicative of a range from approximately $1,065,000 to $1,585,000.
The following table summarizes the value of the Fund's derivative instruments held as of June 30, 2011 and the related location in the accompanying Statement of Assets and Liabilities, presented by primary underlying risk exposure:
| Asset Derivative | | Futures Contracts | |
| Equity Contracts (a) | | $ | 53,820 | |
The above derivative is located in the following Statement of Assets and Liabilities account:
(a) Includes cumulative appreciation of futures contracts as disclosed in the Investment Portfolio. Unsettled variation margin is disclosed separately within the Statement of Assets and Liabilities.
Additionally, the amount of unrealized and realized gains and losses on derivative instruments recognized in Fund earnings during the six months ended June 30, 2011 and the related location in the accompanying Statement of Operations is summarized in the following tables by primary underlying risk exposure:
| Realized Gain (Loss) | | Futures Contracts | |
| Equity Contracts (a) | | $ | 137,064 | |
The above derivative is located in the following Statement of Operations account:
(a) Net realized gain (loss) from futures
| Change in Net Unrealized Appreciation (Depreciation) | | Futures Contracts | |
| Equity Contracts (a) | | $ | 38,602 | |
The above derivative is located in the following Statement of Operations account:
(a) Change in net unrealized appreciation (depreciation) on futures
C. Purchases and Sales of Securities
During the six months ended June 30, 2011, purchases and sales of investment transactions (excluding short-term investments) aggregated $111,920,772 and $117,166,748, respectively.
D. Related Parties
Management Agreement. Under the Investment Management Agreement with Deutsche Investment Management Americas Inc. ("DIMA" or the "Advisor"), an indirect, wholly owned subsidiary of Deutsche Bank AG, the Advisor directs the investments of the Fund in accordance with its investment objectives, policies and restrictions. The Advisor determines the securities, instruments and other contracts relating to investments to be purchased, sold or entered into by the Fund or delegates such responsibility to the Fund's subadvisor.
QS Investors, LLC ("QS Investors") serves as subadvisor. As a subadvisor to the Fund, QS Investors makes investment decisions and buys and sells securities for the Fund. QS Investors is paid by the Advisor for the services QS Investors provides to the Fund.
Pursuant to the Investment Management Agreement with the Advisor, the Fund pays a monthly management fee based on the Fund's average daily net assets, computed and accrued daily and payable monthly, at the following annual rates:
| $0-$250 million | | | .550 | % |
| next $750 million | | | .520 | % |
| next $1.5 billion | | | .500 | % |
| next $2.5 billion | | | .480 | % |
| next $2.5 billion | | | .450 | % |
| next $2.5 billion | | | .430 | % |
| next $2.5 billion | | | .410 | % |
| over $12.5 billion | | | .390 | % |
Accordingly, for the six months ended June 30, 2011, the fee pursuant to the Investment Management Agreement was equivalent to an annualized effective rate of 0.55% of the Fund's average daily net assets.
Administration Fee. Pursuant to an Administrative Services Agreement, DIMA provides most administrative services to the Fund. For all services provided under the Administrative Services Agreement, the Fund pays DIMA an annual fee ("Administration Fee") of 0.10% of the Fund's average daily net assets, computed and accrued daily and payable monthly. For the six months ended June 30, 2011, the Administration Fee was $56,191, of which $8,992 is unpaid.
Service Provider Fees. DWS Investments Service Company ("DISC"), an affiliate of the Advisor, is the transfer agent, dividend-paying agent and shareholder service agent for the Fund. Pursuant to a sub-transfer agency agreement between DISC and DST Systems, Inc. ("DST"), DISC has delegated certain transfer agent, dividend-paying agent and shareholder service agent functions to DST. DISC compensates DST out of the shareholder servicing fee it receives from the Fund. For the six months ended June 30, 2011, the amounts charged to the Fund by DISC were as follows:
| Services to Shareholders | | Total Aggregated ($) | | | Unpaid at June 30, 2011 | |
| Class A | | $ | 110 | | | $ | 78 | |
| Class B | | | 12 | | | | 6 | |
| | | $ | 122 | | | $ | 84 | |
Distribution Service Agreement. Under the Fund's Class B 12b-1 plans, DWS Investments Distributors, Inc. ("DIDI") received a fee ("Distribution Service Fee") of 0.25% of average daily net assets of Class B shares. For the six months ended June 30, 2011, the Distribution Service Fee aggregated $215, of which $196 is unpaid.
Typesetting and Filing Service Fees. Under an agreement with DIMA, DIMA is compensated for providing typesetting and certain regulatory filing services to the Fund. For the six months ended June 30, 2011, the amount charged to the Fund by DIMA included in the Statement of Operations under "reports to shareholders" aggregated $6,587, of which $624 is unpaid.
Trustees' Fees and Expenses. The Fund paid each Trustee not affiliated with the Advisor retainer fees plus specified amounts for various committee services and for the Board Chairperson.
Affiliated Cash Management Vehicle. The Fund may invest uninvested cash balances in Central Cash Management Fund, which is managed by the Advisor. The Fund indirectly bears its proportionate share of the expenses of Central Cash Management Fund. Central Cash Management Fund does not pay the Advisor an investment management fee. Central Cash Management Fund seeks a high level of current income consistent with liquidity and the preservation of capital.
E. Ownership of the Fund
At June 30, 2011, two Participating Insurance Companies were owners of record of 10% or more of the total outstanding Class A shares of the Fund, each owning 52% and 37%. One Participating Insurance Company was the owner of record of 10% or more of the total outstanding Class B shares of the Fund, owning 100%.
F. Line of Credit
The Fund and other affiliated funds (the "Participants") share in a $450 million revolving credit facility provided by a syndication of banks. The Fund may borrow for temporary or emergency purposes, including the meeting of redemption requests that otherwise might require the untimely disposition of securities. The Participants are charged an annual commitment fee which is allocated based on net assets, among each of the Participants. Interest is calculated at a rate per annum equal to the sum of the Federal Funds Rate plus 1.25 percent plus if LIBOR exceeds the Federal Funds Rate the amount of such excess. The Fund may borrow up to a maximum of 33 percent of its net assets under the agreement. The Fund had no outstanding loans at June 30, 2011.
The Trust's policies and procedures for voting proxies for portfolio securities and information about how the Trust voted proxies related to its portfolio securities during the 12-month period ended June 30 are available on our Web site — www.dws-investments.com (click on "proxy voting" at the bottom of the page) — or on the SEC's Web site — www.sec.gov. To obtain a written copy of the Trust's policies and procedures without charge, upon request, call us toll free at (800) 728-3337.
Summary of Management Fee Evaluation by Independent Fee Consultant
October 3, 2010
Pursuant to an Order entered into by Deutsche Investment Management Americas and affiliates (collectively, "DeAM") with the Attorney General of New York, I, Thomas H. Mack, have been appointed the Independent Fee Consultant for the DWS Funds (formerly the DWS Scudder Funds). My duties include preparing an annual written evaluation of the management fees DeAM charges the Funds, considering among other factors the management fees charged by other mutual fund companies for like services, management fees DeAM charges other clients for like services, DeAM's costs of supplying services under the management agreements and related profit margins, possible economies of scale if a Fund grows larger, and the nature and quality of DeAM's services, including fund performance. This report summarizes my evaluation for 2010, including my qualifications, the evaluation process for each of the DWS Funds, consideration of certain complex-level factors, and my conclusions. I served in substantially the same capacity in 2007, 2008, and 2009.
Qualifications
For more than 35 years I have served in various professional capacities within the investment management business. I have held investment analysis and advisory positions, including securities analyst, portfolio strategist and director of investment policy with a large investment firm. I have also performed business management functions, including business development, financial management and marketing research and analysis.
Since 1991, I have been an independent consultant within the asset management industry. I have provided services to over 125 client organizations, including investment managers, mutual fund boards, product distributors and related organizations. Over the past ten years I have completed a number of assignments for mutual fund boards, specifically including assisting boards with management contract renewal.
I hold a Master of Business Administration degree, with highest honors, from Harvard University and Master of Science and Bachelor of Science (highest honors) degrees from the University of California at Berkeley. I am an independent director and audit committee financial expert for two closed-end mutual funds and have served in various leadership and financial oversight capacities with non-profit organizations.
Evaluation of Fees for each DWS Fund
My work focused primarily on evaluating, fund-by-fund, the fees charged to each of the 118 publicly offered Fund portfolios in the DWS Fund family. For each Fund, I considered each of the key factors mentioned above, as well as any other relevant information. In doing so I worked closely with the Funds' Independent Directors in their annual contract renewal process, as well as in their approval of contracts for several new funds (documented separately).
In evaluating each Fund's fees, I reviewed comprehensive materials provided by or on behalf of DeAM, including expense information prepared by Lipper Analytical, comparative performance information, profitability data, manager histories, and other materials. I also accessed certain additional information from the Lipper and Morningstar databases and drew on my industry knowledge and experience.
To facilitate evaluating this considerable body of information, I prepared for each Fund a document summarizing the key data elements in each area as well as additional analytics discussed below. This made it possible to consider each key data element in the context of the others.
In the course of contract renewal, DeAM agreed to implement a number of fee and expense adjustments requested by the Independent Directors which will favorably impact future fees and expenses, and my evaluation includes the effects of these changes.
Fees and Expenses Compared with Other Funds
The competitive fee and expense evaluation for each fund focused on two primary comparisons:
The Fund's contractual management fee (the advisory fee plus the administration fee where applicable) compared with those of a group of typically 12-15 funds in the same Lipper investment category (e.g. Large Capitalization Growth) having similar distribution arrangements and being of similar size.
The Fund's total expenses compared with a broader universe of funds from the same Lipper investment category and having similar distribution arrangements.
These two comparisons provide a view of not only the level of the fee compared with funds of similar scale but also the total expense the Fund bears for all the services it receives, in comparison with the investment choices available in the Fund's investment category and distribution channel. The principal figure-of-merit used in these comparisons was the subject Fund's percentile ranking against peers.
DeAM's Fees for Similar Services to Others
DeAM provided management fee schedules for all of its US domiciled fund and non-fund investment management accounts in any of the investment categories where there is a DWS Fund. These similar products included the other DWS Funds, non-fund pooled accounts, institutional accounts and sub-advisory accounts. Using this information, I calculated for each Fund the fee that would be charged to each similar product, at the subject Fund's asset level.
Evaluating information regarding non-fund products is difficult because there are varying levels of services required for different types of accounts, with mutual funds generally requiring considerably more regulatory and administrative types of service as well as having more frequent cash flows than other types of accounts. Also, while mutual fund fees for similar fund products can be expected to be similar, there will be some differences due to different pricing conditions in different distribution channels (e.g. retail funds versus those used in variable insurance products), differences in underlying investment processes and other factors.
Costs and Profit Margins
DeAM provided a detailed profitability analysis for each Fund. After making some adjustments so that the presentation would be more comparable to the available industry figures, I reviewed profit margins from investment management alone, from investment management plus other fund services (excluding distribution) provided to the Funds by DeAM (principally shareholder services), and DeAM profits from all sources, including distribution. A later section comments on overall profitability.
Economies of Scale
Economies of scale — an expected decline in management cost per dollar of fund assets as fund assets grow — are very rarely quantified and documented because of inherent difficulties in collecting and analyzing relevant data. However, in virtually every investment category that I reviewed, larger funds tend to have lower fees and lower total expenses than smaller funds. To see how each DWS Fund compares with this industry observation, I reviewed:
The trend in Fund assets over the last five years and the accompanying trend in total expenses. This shows if the Fund has grown and, if so, whether total expense (management fees as well as other expenses) have declined as a percent of assets.
Whether the Fund has break-points in its management fee schedule, the extent of the fee reduction built into the schedule and the asset levels where the breaks take effect, and in the case of a sub-advised Fund how the Fund's break-points compare with those of the sub-advisory fee schedule.
How the Fund's contractual fee schedule compares with trends in the industry data. To accomplish this, I constructed a chart showing how actual latest-fiscal-year contractual fees of the Fund and of other similar funds relate to average fund assets, with the subject Fund's contractual fee schedule superimposed.
Quality of Service — Performance
The quality-of-service evaluation focused on investment performance, which is the principal result of the investment management service. Each Fund's performance was reviewed over the past 1, 3, 5 and 10 years, as applicable, and compared with that of other funds in the same investment category and with a suitable market index.
In addition, I calculated and reviewed risk-adjusted returns relative to an index of similar mutual funds' returns and a suitable market index. The risk-adjusted returns analysis provides a way of determining the extent to which the Fund's return comparisons are mainly the product of investment value-added (or lack thereof) or alternatively taking considerably more or less risk than is typical in its investment category.
I also received and considered the history of portfolio manager changes for each Fund, as this provided an important context for evaluating the performance results.
Complex-Level Considerations
While this evaluation was conducted mainly at the individual fund level, there are some issues relating to the reasonableness of fees that can alternatively be considered across the whole fund complex:
I reviewed DeAM's profitability analysis for all DWS Funds, with a view toward determining if the allocation procedures used were reasonable and how profit levels compared with public data for other investment managers.
I considered whether DeAM and affiliates receive any significant ancillary or "fall-out" benefits that should be considered in interpreting the direct profitability results. These would be situations where serving as the investment manager of the Funds is beneficial to another part of the Deutsche Bank organization.
I considered how aggregated DWS Fund expenses had varied over the years, by asset class and in the context of trends in asset levels.
I reviewed the structure of the DeAM organization, trends in staffing levels, and information on compensation of investment management and other professionals compared with industry data.
Findings
Based on the process and analysis discussed above, which included reviewing a wide range of information from management and external data sources and considering among other factors the fees DeAM charges other clients, the fees charged by other fund managers, DeAM's costs and profits associated with managing the Funds, economies of scale, possible fall-out benefits, and the nature and quality of services provided, in my opinion the management fees charged the DWS Funds are reasonable.
Thomas H. Mack
DWS Investments Distributors, Inc.
222 South Riverside Plaza
Chicago, IL 60606
(800) 621-1148
VS2BC-3 (R-023290-1 8/11)
JUNE 30, 2011
SEMIANNUAL REPORT
DWS VARIABLE SERIES II
DWS Core Fixed Income VIP
Contents
3 Performance Summary 4 Information About Your Fund's Expenses 5 Portfolio Summary 6 Investment Portfolio 11 Statement of Assets and Liabilities 12 Statement of Operations 12 Statement of Changes in Net Assets 14 Financial Highlights 15 Notes to Financial Statements 19 Proxy Voting 20 Summary of Management Fee Evaluation by Independent Fee Consultant |
This report must be preceded or accompanied by a prospectus. To obtain an additional prospectus or summary prospectus, if available, call (800) 728-3337 or your financial representative. We advise you to consider the Fund's objectives, risks, charges and expenses carefully before investing. The summary prospectus and prospectus contain this and other important information about the Fund. Please read the prospectus carefully before you invest.
Bond investments are subject to interest-rate and credit risks. When interest rates rise, bond prices generally fall. Credit risk refers to the ability of an issuer to make timely payments of principal and interest. In the current market environment, mortgage-backed securities are experiencing increased volatility. See the prospectus for details.
DWS Investments is part of Deutsche Bank's Asset Management division and, within the US, represents the retail asset management activities of Deutsche Bank AG, Deutsche Bank Trust Company Americas, Deutsche Investment Management Americas Inc. and DWS Trust Company.
NOT FDIC/NCUA INSURED NO BANK GUARANTEE MAY LOSE VALUE NOT A DEPOSIT
NOT INSURED BY ANY FEDERAL GOVERNMENT AGENCY
Performance Summary June 30, 2011
Fund performance shown is historical, assumes reinvestment of all dividend and capital gain distributions and does not guarantee future results. Investment return and principal value fluctuate with changing market conditions so that, when redeemed, shares may be worth more or less than their original cost. Current performance may be lower or higher than the performance data quoted. Please contact your participating insurance company for the Fund's most recent month-end performance. Performance doesn't reflect charges and fees ("contract charges") associated with the separate account that invests in the Fund or any variable life insurance policy or variable annuity contract for which the Fund is an investment option. These charges and fees will reduce returns.
The gross expense ratios of the Fund, as stated in the fee table of the prospectus dated May 1, 2011 is 0.72% for Class A shares, and may differ from the expense ratios disclosed in the Financial Highlights tables in this report.
| Growth of an Assumed $10,000 Investment in DWS Core Fixed Income VIP |
[] DWS Core Fixed Income VIP — Class A [] Barclays Capital US Aggregate Bond Index | Barclays Capital US Aggregate Bond Index is an unmanaged index representing domestic taxable investment-grade bonds, with index components for government and corporate securities, mortgage pass-through securities, and asset-backed securities with average maturities of one year or more. Index returns do not reflect any fees or expenses and it is not possible to invest directly into an index. |
| |
| Yearly periods ended June 30 | |
| Comparative Results | |
| DWS Core Fixed Income VIP | | 6-Month‡ | | | 1-Year | | | 3-Year | | | 5-Year | | | 10-Year | |
| Class A | Growth of $10,000 | | $ | 10,241 | | | $ | 10,360 | | | $ | 9,701 | | | $ | 10,364 | | | $ | 12,864 | |
| Average annual total return | | | 2.41 | % | | | 3.60 | % | | | -1.01 | % | | | 0.72 | % | | | 2.55 | % |
| Barclays Capital US Aggregate Bond Index | Growth of $10,000 | | $ | 10,272 | | | $ | 10,390 | | | $ | 12,065 | | | $ | 13,715 | | | $ | 17,481 | |
| Average annual total return | | | 2.72 | % | | | 3.90 | % | | | 6.46 | % | | | 6.52 | % | | | 5.74 | % |
The growth of $10,000 is cumulative.
‡ Total returns shown for periods less than one year are not annualized.
Information About Your Fund's Expenses
As an investor of the Fund, you incur two types of costs: ongoing expenses and transaction costs. Ongoing expenses include management fees, and other Fund expenses. Examples of transaction costs include contract charges and account maintenance fees, which are not shown in this section. The following tables are intended to help you understand your ongoing expenses (in dollars) of investing in the Fund and to help you compare these expenses with the ongoing expenses of investing in other mutual funds. In the most recent six-month period, the Fund limited these expenses; had it not done so, expenses would have been higher. The example in the table is based on an investment of $1,000 invested at the beginning of the six-month period and held for the entire period (January 1, 2011 to June 30, 2011).
•Actual Fund Return. This helps you estimate the actual dollar amount of ongoing expenses (but not transaction costs) paid on a $1,000 investment in the Fund using the Fund's actual return during the period. To estimate the expenses you paid over the period, simply divide your account value by $1,000 (for example, an $8,600 account value divided by $1,000 = 8.6), then multiply the result by the number in the "Expenses Paid per $1,000" line under the share class you hold.
• Hypothetical 5% Fund Return. This helps you to compare your Fund's ongoing expenses (but not transaction costs) with those of other mutual funds using the Fund's actual expense ratio and a hypothetical rate of return of 5% per year before expenses. Examples using a 5% hypothetical Fund return may be found in the shareholder reports of other mutual funds. The hypothetical account values and expenses may not be used to estimate the actual ending account balance or expenses you paid for the period.
Please note that the expenses shown in these tables are meant to highlight your ongoing expenses only and do not reflect any transaction costs. The "Expenses Paid per $1,000" line of the tables is useful in comparing ongoing expenses only and will not help you determine the relative total expense of owning different funds. If these transaction costs had been included, your costs would have been higher.
Expenses and Value of a $1,000 Investment for the six months ended June 30, 2011 | |
| Actual Fund Return | | Class A | |
| Beginning Account Value 1/1/11 | | $ | 1,000.00 | |
| Ending Account Value 6/30/11 | | $ | 1,024.10 | |
| Expenses Paid per $1,000* | | $ | 3.56 | |
| Hypothetical 5% Fund Return | | Class A | |
| Beginning Account Value 1/1/11 | | $ | 1,000.00 | |
| Ending Account Value 6/30/11 | | $ | 1,021.27 | |
| Expenses Paid per $1,000* | | $ | 3.56 | |
* Expenses are equal to the Fund's annualized expense ratio, multiplied by the average account value over the period, multiplied by the number of days in the most recent six-month period, then divided by 365.
| Annualized Expense Ratio | Class A | |
| DWS Variable Series II — DWS Core Fixed Income VIP | .71% | |
For more information, please refer to the Fund's prospectus.
These tables do not reflect charges and fees ("contract charges") associated with the separate account that invests in the Fund or any variable life insurance policy or variable annuity contract for which the Fund is an investment option.
Asset Allocation (As a % of Net Assets) | 6/30/11 | 12/31/10 |
| | | |
| Corporate Bonds | 31% | 29% |
| Mortgage-Backed Securities Pass-Throughs | 26% | 38% |
| Government & Agency Obligations | 16% | 34% |
| Commercial Mortgage-Backed Securities | 13% | 9% |
| Municipal Bonds and Notes | 7% | 8% |
| Collateralized Mortgage Obligations | 4% | 2% |
| Asset-Backed | 3% | 2% |
| Cash Equivalents and Other Assets and Liabilities, net | 0% | (22)% |
| | 100% | 100% |
Quality (Excludes Cash Equivalents and Securities Lending Collateral) | 6/30/11 | 12/31/10 |
| | | |
| US Government and Agencies | 41% | 59% |
| AAA | 8% | 3% |
| AA | 7% | 7% |
| A | 17% | 13% |
| BBB | 21% | 15% |
| BB | 1% | 2% |
| B | 1% | — |
| Not Rated | 4% | 1% |
| | 100% | 100% |
| Interest Rate Sensitivity | 6/30/11 | 12/31/10 |
| | | |
| Effective Maturity | 7.7 years | 7.0 years |
| Effective Duration | 5.4 years | 5.0 years |
Asset allocation and Interest Rate Sensitivity are subject to change.
Effective maturity is the weighted average of the bonds held by the Fund taking into consideration any available maturity shortening features.
Effective duration is an approximate measure of the Fund's sensitivity to interest rate changes taking into consideration any maturity shortening features.
The quality ratings represent the lower of Moody's Investors Service, Inc. ("Moody's") or Standard & Poor's Corporation ("S&P") credit ratings. The ratings of Moody's and S&P represent their opinions as to the quality of the securities they rate. Ratings are relative and subjective and are not absolute standards of quality. The Fund's credit quality does not remove market risk and is subject to change.
For more complete details about the Fund's investment portfolio, see page 6.
Following the Fund's fiscal first and third quarter-end, a complete portfolio holdings listing is filed with the SEC on Form N-Q. The form will be available on the SEC's Web site at www.sec.gov, and it also may be reviewed and copied at the SEC's Public Reference Room in Washington, D.C. Information on the operation of the SEC's Public Reference Room may be obtained by calling (800) SEC-0330. The Fund's portfolio holdings are also posted on www.dws-investments.com from time to time. Please see the Fund's current prospectus for more information.
Investment Portfolio June 30, 2011 (Unaudited) | | | Principal Amount ($) | | | Value ($) | |
| | | | |
| Corporate Bonds 31.0% | |
| Consumer Discretionary 4.5% | |
| AMC Entertainment, Inc., 8.75%, 6/1/2019 | | | 143,000 | | | | 150,865 | |
| CBS Corp., 5.9%, 10/15/2040 | | | 380,000 | | | | 363,711 | |
| CCO Holdings LLC, 7.0%, 1/15/2019 | | | 400,000 | | | | 412,000 | |
| Comcast Cable Holdings LLC, 10.125%, 4/15/2022 | | | 180,000 | | | | 248,965 | |
| DIRECTV Holdings LLC: | |
| 3.125%, 2/15/2016 | | | 200,000 | | | | 202,901 | |
| 6.35%, 3/15/2040 | | | 312,000 | | | | 328,197 | |
| Home Depot, Inc.: | |
| 5.4%, 9/15/2040 | | | 175,000 | | | | 166,867 | |
| 5.875%, 12/16/2036 | | | 75,000 | | | | 76,759 | |
| MGM Resorts International, 9.0%, 3/15/2020 | | | 500,000 | | | | 547,500 | |
| NBCUniversal Media LLC, 144A, 5.95%, 4/1/2041 | | | 172,000 | | | | 174,905 | |
| Time Warner, Inc.: | |
| 6.2%, 3/15/2040 | | | 250,000 | | | | 256,119 | |
| 7.625%, 4/15/2031 | | | 250,000 | | | | 299,945 | |
| Yum! Brands, Inc.: | |
| 3.875%, 11/1/2020 | | | 300,000 | | | | 291,200 | |
| 5.3%, 9/15/2019 | | | 100,000 | | | | 107,487 | |
| | | | | 3,627,421 | |
| Consumer Staples 2.4% | |
| Anheuser-Busch InBev Worldwide, Inc., 7.75%, 1/15/2019 | | | 400,000 | | | | 503,218 | |
| CVS Caremark Corp., 5.75%, 5/15/2041 | | | 190,000 | | | | 186,815 | |
| Kellogg Co., 4.0%, 12/15/2020 | | | 200,000 | | | | 199,700 | |
| Kraft Foods, Inc., 5.375%, 2/10/2020 | | | 825,000 | | | | 901,888 | |
| Kroger Co., 5.4%, 7/15/2040 | | | 150,000 | | | | 144,140 | |
| | | | | 1,935,761 | |
| Energy 3.6% | |
| DCP Midstream LLC, 144A, 9.75%, 3/15/2019 | | | 280,000 | | | | 365,953 | |
| Enterprise Products Operating LLC, 4.6%, 8/1/2012 | | | 500,000 | | | | 519,288 | |
| Kinder Morgan Energy Partners LP, 6.5%, 9/1/2039 | | | 300,000 | | | | 311,514 | |
| ONEOK Partners LP, 6.15%, 10/1/2016 | | | 321,000 | | | | 369,357 | |
| Plains All American Pipeline LP, 8.75%, 5/1/2019 | | | 350,000 | | | | 440,307 | |
| Weatherford International Ltd., 5.125%, 9/15/2020 | | | 550,000 | | | | 561,562 | |
| Williams Partners LP, 4.125%, 11/15/2020 | | | 360,000 | | | | 345,561 | |
| | | | | 2,913,542 | |
| Financials 12.4% | |
| American Express Co., 7.0%, 3/19/2018 | | | 700,000 | | | | 823,786 | |
| Bank of America Corp.: | |
| 5.65%, 5/1/2018 | | | 865,000 | | | | 911,996 | |
| 6.5%, 8/1/2016 | | | 80,000 | | | | 89,220 | |
| Bunge Ltd. Finance Corp., 4.1%, 3/15/2016 | | | 145,000 | | | | 151,042 | |
| Citigroup, Inc., 5.375%, 8/9/2020 | | | 800,000 | | | | 834,851 | |
| CNA Financial Corp., 5.75%, 8/15/2021 | | | 553,000 | | | | 571,022 | |
| | | Principal Amount ($) | | | Value ($) | |
| | | | | | | | | |
| Fifth Third Bancorp., 5.45%, 1/15/2017 | | | 430,000 | | | | 460,583 | |
| General Electric Capital Corp., 5.3%, 2/11/2021 | | | 285,000 | | | | 296,555 | |
| Hartford Financial Services Group, Inc., 5.95%, 10/15/2036 | | | 270,000 | | | | 254,236 | |
| JPMorgan Chase & Co., 5.125%, 9/15/2014 | | | 800,000 | | | | 864,519 | |
| KeyCorp, 5.1%, 3/24/2021 | | | 300,000 | | | | 305,548 | |
| Lincoln National Corp., 8.75%, 7/1/2019 | | | 350,000 | | | | 441,664 | |
| MetLife, Inc., 7.717%, 2/15/2019 | | | 395,000 | | | | 478,117 | |
| Morgan Stanley, 5.75%, 1/25/2021 | | | 400,000 | | | | 404,732 | |
| National Rural Utilities Cooperative Finance Corp., 10.375%, 11/1/2018 | | | 200,000 | | | | 276,985 | |
| Nationwide Financial Services, Inc., 144A, 5.375%, 3/25/2021 | | | 183,000 | | | | 183,812 | |
| Nordea Bank AB, 144A, 4.875%, 5/13/2021 | | | 350,000 | | | | 336,130 | |
| PNC Funding Corp., 5.25%, 11/15/2015 | | | 450,000 | | | | 490,325 | |
| Prudential Financial, Inc.: | |
| Series B, 5.1%, 9/20/2014 | | | 130,000 | | | | 141,333 | |
| 6.2%, 1/15/2015 | | | 90,000 | | | | 100,758 | |
| 7.375%, 6/15/2019 | | | 50,000 | | | | 59,295 | |
| Royal Bank of Scotland PLC, 6.125%, 1/11/2021 | | | 325,000 | | | | 333,162 | |
| SunTrust Banks, Inc., 3.6%, 4/15/2016 | | | 150,000 | | | | 151,455 | |
| The Goldman Sachs Group, Inc., 6.0%, 6/15/2020 | | | 550,000 | | | | 591,793 | |
| Wells Fargo & Co., 4.6%, 4/1/2021 | | | 475,000 | | | | 477,637 | |
| | | | | 10,030,556 | |
| Health Care 2.6% | |
| Amgen, Inc., 5.65%, 6/15/2042 | | | 156,000 | | | | 156,253 | |
| Express Scripts, Inc.: | |
| 6.25%, 6/15/2014 | | | 205,000 | | | | 230,855 | |
| 7.25%, 6/15/2019 | | | 405,000 | | | | 484,406 | |
| Quest Diagnostics, Inc.: | |
| 4.7%, 4/1/2021 | | | 650,000 | | | | 665,364 | |
| 6.4%, 7/1/2017 | | | 500,000 | | | | 576,886 | |
| | | | | 2,113,764 | |
| Industrials 1.2% | |
| CSX Corp.: | |
| 6.15%, 5/1/2037 | | | 250,000 | | | | 267,702 | |
| 6.25%, 3/15/2018 | | | 380,000 | | | | 438,456 | |
| Republic Services, Inc., 5.7%, 5/15/2041 | | | 245,000 | | | | 239,174 | |
| | | | | 945,332 | |
| Information Technology 0.5% | |
| Applied Materials, Inc., 5.85%, 6/15/2041 | | | 400,000 | | | | 405,712 | |
| Materials 1.6% | |
| ArcelorMittal, 6.125%, 6/1/2018 | | | 500,000 | | | | 535,539 | |
| Corp Nacional del Cobre de Chile, 144A, 3.75%, 11/4/2020 | | | 550,000 | | | | 522,540 | |
| Dow Chemical Co., 4.25%, 11/15/2020 | | | 285,000 | | | | 278,147 | |
| | | | | 1,336,226 | |
| | | Principal Amount ($) | | | Value ($) | |
| | | | | | | | | |
| Telecommunication Services 1.2% | |
| American Tower Corp., 7.25%, 5/15/2019 | | | 250,000 | | | | 282,041 | |
| Frontier Communications Corp., 7.875%, 4/15/2015 | | | 500,000 | | | | 542,500 | |
| Verizon Communications, Inc., 4.6%, 4/1/2021 | | | 187,000 | | | | 192,945 | |
| | | | | 1,017,486 | |
| Utilities 1.0% | |
| DTE Energy Co., 7.625%, 5/15/2014 | | | 148,000 | | | | 170,832 | |
| FirstEnergy Solutions Corp., 6.8%, 8/15/2039 | | | 292,000 | | | | 303,643 | |
| Sempra Energy, 6.5%, 6/1/2016 | | | 290,000 | | | | 335,846 | |
| | | | | 810,321 | |
Total Corporate Bonds (Cost $24,018,328) | | | | 25,136,121 | |
| | |
| Mortgage-Backed Securities Pass-Throughs 25.8% | |
| Federal Home Loan Mortgage Corp.: | |
| 4.0%, 8/1/2039 | | | 1,254,755 | | | | 1,259,705 | |
| 6.0%, with various maturities from 12/1/2034 until 3/1/2038 | | | 705,694 | | | | 779,558 | |
| Federal National Mortgage Association: | | | | | | | | |
| 3.193%*, 8/1/2037 | | | 192,347 | | | | 201,141 | |
| 3.5%, 8/1/2025 (a) | | | 2,487,500 | | | | 2,532,586 | |
| 4.0%, 9/1/2040 | | | 2,409,752 | | | | 2,415,118 | |
| 4.5%, with various maturities from 10/1/2033 until 2/1/2039 (a) | | | 4,374,328 | | | | 4,529,406 | |
| 5.0%, with various maturities from 7/1/2036 until 8/1/2040 (a) | | | 3,284,795 | | | | 3,481,770 | |
| 5.124%*, 9/1/2038 | | | 134,152 | | | | 141,825 | |
| 5.5%, with various maturities from 12/1/2032 until 9/1/2036 | | | 2,152,103 | | | | 2,340,460 | |
| 6.0%, 4/1/2024 | | | 618,914 | | | | 690,109 | |
| 6.5%, with various maturities from 3/1/2017 until 4/1/2037 | | | 936,022 | | | | 1,058,069 | |
| 8.0%, 9/1/2015 | | | 10,484 | | | | 11,377 | |
| Government National Mortgage Association, 4.5%, 6/1/2039 (a) | | | 1,450,000 | | | | 1,530,316 | |
Total Mortgage-Backed Securities Pass-Throughs (Cost $20,611,038) | | | | 20,971,440 | |
| | |
| Asset-Backed 2.6% | |
| Student Loans | |
| Nelnet Student Loan Trust: | |
| "A1", Series 2007-1, 0.267%*, 11/27/2018 | | | 843,029 | | | | 831,975 | |
| "A4", Series 2006-1, 0.349%*, 11/23/2022 | | | 1,300,000 | | | | 1,275,986 | |
Total Asset-Backed (Cost $2,110,732) | | | | 2,107,961 | |
| | |
| Commercial Mortgage-Backed Securities 12.8% | |
| Banc of America Merrill Lynch Commercial Mortgage, Inc.: | |
| "A5A", Series 2005-4, 4.933%, 7/10/2045 | | | 1,100,000 | | | | 1,173,388 | |
| "A2", Series 2007-2, 5.634%, 4/10/2049 | | | 216,986 | | | | 218,944 | |
| "A4", Series 2006-3, 5.889%, 7/10/2044 | | | 795,000 | | | | 874,178 | |
| | | Principal Amount ($) | | | Value ($) | |
| | | | | | | | | |
| Bear Stearns Commercial Mortgage Securities, Inc., "A4", Series 2007-PW18, 5.7%, 6/11/2050 | | | 1,000,000 | | | | 1,086,943 | |
| Citigroup/Deutsche Bank Commercial Mortgage Trust: | | | | | | | | |
| "A4", Series 2006-CD2, 5.524%*, 1/15/2046 | | | 250,000 | | | | 270,641 | |
| "A5", Series 2006-CD3, 5.617%, 10/15/2048 | | | 1,035,000 | | | | 1,123,420 | |
| Commercial Mortgage Pass-Through Certificates, "A4", Series 2007-C9, 6.008%*, 12/10/2049 | | | 825,000 | | | | 906,164 | |
| Greenwich Capital Commercial Funding Corp., "A4", Series 2007-GG9, 5.444%, 3/10/2039 | | | 850,000 | | | | 911,792 | |
| GS Mortgage Securities Corp. II, "A4A", Series 2005-GG4, 4.751%, 7/10/2039 | | | 1,300,000 | | | | 1,385,730 | |
| LB-UBS Commercial Mortgage Trust: | | | | | | | | |
| "A3", Series 2006-C7, 5.347%, 11/15/2038 | | | 400,000 | | | | 430,595 | |
| "A4", Series 2007-C6, 5.858%, 7/15/2040 | | | 400,000 | | | | 433,978 | |
| Merrill Lynch Mortgage Trust, "ASB", Series 2007-C1, 6.02%*, 6/12/2050 | | | 900,000 | | | | 965,639 | |
| Wachovia Bank Commercial Mortgage Trust, "A4", Series 2005-C22, 5.44%*, 12/15/2044 | | | 600,000 | | | | 650,311 | |
Total Commercial Mortgage-Backed Securities (Cost $10,252,893) | | | | 10,431,723 | |
| | |
| Collateralized Mortgage Obligations 4.1% | |
| Federal National Mortgage Association: | | | | | | | | |
| ''IO", Series 2010-143, Interest Only, 5.0%, 12/25/2025 | | | 82,194 | | | | 10,023 | |
| "QD", Series 2005-29, 5.0%, 8/25/2033 | | | 435,000 | | | | 475,719 | |
| Government National Mortgage Association: | | | | | | | | |
| "IU", Series 2010-164, Interest Only, 2.0%, 12/20/2013 | | | 2,412,877 | | | | 93,281 | |
| "CI", Series 2010-145, Interest Only, 4.0%, 11/20/2035 | | | 630,615 | | | | 75,491 | |
| "MI", Series 2010-85, Interest Only, 4.5%, 1/20/2036 | | | 1,069,948 | | | | 138,917 | |
| "GI", Series 2010-89, Interest Only, 4.5%, 5/20/2039 | | | 936,661 | | | | 181,992 | |
| "EI", Series 2010-134, Interest Only, 4.5%, 11/20/2039 | | | 487,501 | | | | 96,515 | |
| "DI", Series 2011-40, Interest Only, 4.5%, 12/20/2040 | | | 1,968,142 | | | | 319,866 | |
| "IM", Series 2010-87, Interest Only, 4.75%, 3/20/2036 | | | 1,230,359 | | | | 173,516 | |
| "JI", Series 2010-67, Interest Only, 5.0%, 10/20/2033 | | | 1,757,017 | | | | 171,626 | |
| "IA", Series 2010-58, Interest Only, 5.0%, 3/20/2039 | | | 1,894,877 | | | | 407,332 | |
| "BI", Series 2010-168, Interest Only, 5.0%, 4/20/2040 | | | 6,178,651 | | | | 871,219 | |
| MASTR Alternative Loans Trust, "5A1", Series 2005-1, 5.5%, 1/25/2020 | | | 285,530 | | | | 292,333 | |
Total Collateralized Mortgage Obligations (Cost $3,533,549) | | | | 3,307,830 | |
| | |
| | | Principal Amount ($) | | | Value ($) | |
| | | | | | | | | |
| Government & Agency Obligations 16.4% | |
| Sovereign Bonds 1.2% | |
| Republic of Poland, 6.375%, 7/15/2019 | | | 500,000 | | | | 571,250 | |
| Republic of South Africa, 6.25%, 3/8/2041 | | | 400,000 | | | | 429,000 | |
| | | | | 1,000,250 | |
| US Treasury Obligations 15.2% | |
| US Treasury Bill, 0.135%**, 9/15/2011 (b) | | | 391,000 | | | | 390,984 | |
| US Treasury Bonds: | |
| 4.75%, 2/15/2037 (c) | | | 2,000,000 | | | | 2,139,688 | |
| 5.375%, 2/15/2031 | | | 2,500,000 | | | | 2,930,077 | |
| 7.125%, 2/15/2023 | | | 2,400,000 | | | | 3,250,500 | |
| US Treasury Notes: | |
| 1.0%, 1/15/2014 | | | 955,000 | | | | 963,431 | |
| 3.625%, 2/15/2020 (c) | | | 2,500,000 | | | | 2,644,727 | |
| | | | | 12,319,407 | |
Total Government & Agency Obligations (Cost $13,329,477) | | | | 13,319,657 | |
| | |
| Municipal Bonds and Notes 7.4% | |
| California, University Revenues, Build America Bonds, 5.946%, 5/15/2045 (d) | | | 180,000 | | | | 169,412 | |
| Chicago, IL, Transit Authority, Sales Tax Receipts Revenue, Build America Bonds, Series B, 6.2%, 12/1/2040 (d) | | | 265,000 | | | | 267,714 | |
| Glendale, AZ, Municipal Property Corp., Excise Tax Revenue, Series B, 6.157%, 7/1/2033, INS: AGMC (d) | | | 420,000 | | | | 427,480 | |
| Jicarilla, NM, Sales & Special Tax Revenue, Apache Nation Revenue, 144A, 5.2%, 12/1/2013 (d) | | | 575,000 | | | | 573,016 | |
| Kentucky, Asset/Liability Commission, General Fund Revenue, 3.165%, 4/1/2018 (d) | | | 775,000 | | | | 778,542 | |
| | | Principal Amount ($) | | | Value ($) | |
| | | | | | | | | |
| Louisville & Jefferson County, KY, Metropolitan Sewer District & Drain System, Build America Bonds, 6.25%, 5/15/2043 (d) | | | 200,000 | | | | 209,692 | |
| Miami-Dade County, FL, Educational Facilities Authority Revenue, University of Miami, Series B, 6.1%, 4/1/2015 (d) | | | 680,000 | | | | 706,867 | |
| Michigan, Western Michigan University Revenue, 4.41%, 11/15/2014, INS: AMBAC (d) | | | 620,000 | | | | 630,986 | |
| Nashville & Davidson County, TN, Metropolitan Government, Convention Center Authority Revenue, Build America Bonds, Series A2, 7.431%, 7/1/2043 (d) | | | 250,000 | | | | 280,448 | |
| New Jersey, Economic Development Authority Revenue, Series B, 6.5%, 11/1/2014, INS: AGC (d) | | | 585,000 | | | | 663,706 | |
| New Jersey, State Educational Facilities Authority Revenue, NJ City University, Series F, 6.85%, 7/1/2036, INS: AGC (d) | | | 395,000 | | | | 427,659 | |
| Newark, NJ, Pension Obligation, 5.853%, 4/1/2022, INS: AGMC (d) | | | 865,000 | | | | 866,548 | |
Total Municipal Bonds and Notes (Cost $5,836,690) | | | | 6,002,070 | |
| | | Shares | | | Value ($) | |
| | | | |
| Securities Lending Collateral 5.3% | |
| Daily Assets Fund Institutional, 0.13% (e) (f) (Cost $4,305,743) | | | 4,305,743 | | | | 4,305,743 | |
| | |
| Cash Equivalents 13.1% | |
| Central Cash Management Fund, 0.11% (e) (Cost $10,598,158) | | | 10,598,158 | | | | 10,598,158 | |
| | | % of Net Assets | | | Value ($) | |
| | | | |
Total Investment Portfolio (Cost $94,596,608)+ | | | 118.5 | | | | 96,180,703 | |
| Other Assets and Liabilities, Net | | | (18.5 | ) | | | (15,045,058 | ) |
| Net Assets | | | 100.0 | | | | 81,135,645 | |
* These securities are shown at their current rate as of June 30, 2011. Floating rate securities' yields vary with a designated market index or market rate, such as the coupon-equivalent of the US Treasury bill rate.
** Annualized yield at time of purchase; not a coupon rate.
+ The cost for federal income tax purposes was $94,602,993. At June 30, 2011, net unrealized appreciation for all securities based on tax cost was $1,577,710. This consisted of aggregate gross unrealized appreciation for all securities in which there was an excess of value over tax cost of $2,257,163 and aggregate gross unrealized depreciation for all securities in which there was an excess of tax cost over value of $679,453.
(a) When-issued or delayed delivery security included.
(b) At June 30, 2011, this security has been pledged, in whole or in part, to cover initial margin requirements for open futures contracts.
(c) All or a portion of these securities were on loan (see Notes to Financial Statements). The value of all securities loaned at June 30, 2011 amounted to $4,148,485, which is 5.1% of net assets.
(d) Taxable issue.
(e) Affiliated fund managed by Deutsche Investment Management Americas Inc. The rate shown is the annualized seven-day yield at period end.
(f) Represents collateral held in connection with securities lending. Income earned by the Fund is net of borrower rebates.
144A: Security exempt from registration under Rule 144A of the Securities Act of 1933. These securities may be resold in transactions exempt from registration, normally to qualified institutional buyers.
AGC: Assured Guaranty Corp.
AGMC: Assured Guaranty Municipal Corp.
AMBAC: Ambac Financial Group, Inc.
INS: Insured
Interest Only: Interest Only (IO) bonds represent the "interest only" portion of payments on a pool of underlying mortgages or mortgage-backed securities. IO securities are subject to prepayment risk of the pool of underlying mortgages.
Included in the portfolio are investments in mortgage- or asset-backed securities, which are interests in separate pools of mortgages or assets. Effective maturities of these investments may be shorter than stated maturities due to prepayments. Some separate investments in the Federal Home Loan Mortgage Corp. and Federal National Mortgage Association issues which have similar coupon rates have been aggregated for presentation purposes in the investment portfolio.
At June 30, 2011, open futures contracts sold were as follows:
| Securities | Currency | Expiration Date | | Contracts | | | Notional Value ($) | | | Unrealized Appreciation ($) | |
| 10 Year US Treasury Note | USD | 9/21/2011 | | | 65 | | | | 7,951,328 | | | | 34,141 | |
| 30 Year US Treasury Bond | USD | 9/21/2011 | | | 25 | | | | 3,075,781 | | | | 52,062 | |
| Total unrealized appreciation | | | | 86,203 | |
At June 30, 2011, open credit default swap contracts purchased were as follows:
Effective/ Expiration Date | | Notional Amount ($) (g) | | | Fixed Cash Flows Paid | | Reference Entity | | Value ($) | | | Upfront Payment (Received) ($) | | | Unrealized Depreciation ($) | |
3/21/2011 6/20/2016 | | | 4,200,000 | 1 | | | 1.0 | % | Markit CDX.NA.IG Index | | | (17,198 | ) | | | (1,974 | ) | | | (15,224 | ) |
(g) The maximum potential amount of future undiscounted payments that the Fund could be required to make under a credit default swap contract would be the notional amount of the contract. These potential amounts would be partially offset by any recovery values of the referenced debt obligation or net amounts received from the settlement of buy protection credit default swap contracts entered into by the Fund for the same referenced debt obligation.
Counterparty:
1 Citigroup, Inc.
| Currency Abbreviation |
| USD United States Dollar |
For information on the Fund's policy and additional disclosures regarding futures contracts and credit default swap contracts, please refer to Note B in the accompanying Notes to Financial Statements.
Fair Value Measurements
Various inputs are used in determining the value of the Fund's investments. These inputs are summarized in three broad levels. Level 1 includes quoted prices in active markets for identical securities. Level 2 includes other significant observable inputs (including quoted prices for similar securities, interest rates, prepayment speeds, and credit risk). Level 3 includes significant unobservable inputs (including the Fund's own assumptions in determining the fair value of investments). The inputs or methodology used for valuing securities are not necessarily an indication of the risk associated with investing in those securities.
The following is a summary of the inputs used as of June 30, 2011 in valuing the Fund's investments. For information on the Fund's policy regarding the valuation of investments, please refer to the Security Valuation section of Note A in the accompanying Notes to Financial Statements.
| Assets | | Level 1 | | | Level 2 | | | Level 3 | | | Total | |
| | |
| Fixed Income (h) | | | | | | | | | | | | |
| Corporate Bonds | | $ | — | | | $ | 25,136,121 | | | $ | — | | | $ | 25,136,121 | |
| Mortgage-Backed Securities Pass-Throughs | | | — | | | | 20,971,440 | | | | — | | | | 20,971,440 | |
| Asset-Backed | | | — | | | | 2,107,961 | | | | — | | | | 2,107,961 | |
| Commercial Mortgage-Backed Securities | | | — | | | | 10,431,723 | | | | — | | | | 10,431,723 | |
| Collateralized Mortgage Obligations | | | — | | | | 3,307,830 | | | | — | | | | 3,307,830 | |
| Government & Agency Obligations | | | — | | | | 13,319,657 | | | | — | | | | 13,319,657 | |
| Municipal Bonds and Notes | | | — | | | | 6,002,070 | | | | — | | | | 6,002,070 | |
| Short-Term Investments (h) | | | 14,903,901 | | | | — | | | | — | | | | 14,903,901 | |
| Derivatives (i) | | | 86,203 | | | | — | | | | — | | | | 86,203 | |
| Total | | $ | 14,990,104 | | | $ | 81,276,802 | | | $ | — | | | $ | 96,266,906 | |
| Liabilities | |
| Derivatives (i) | | $ | — | | | $ | (15,224 | ) | | $ | — | | | $ | (15,224 | ) |
| Total | | $ | — | | | $ | (15,224 | ) | | $ | — | | | $ | (15,224 | ) |
There have been no transfers between Level 1 and Level 2 fair value measurements during the period ended June 30, 2011.
(h) See Investment Portfolio for additional detailed categorizations.
(i) Derivatives include unrealized appreciation (depreciation) on futures contracts and credit default swap contracts.
The accompanying notes are an integral part of the financial statements.
Statement of Assets and Liabilities | as of June 30, 2011 (Unaudited) | |
| Assets | |
Investments: Investments in non-affiliated securities, at value (cost $79,692,707) — including $4,148,485 of securities loaned | | $ | 81,276,802 | |
Investment in Daily Assets Fund Institutional (cost $4,305,743)* | | | 4,305,743 | |
| Investment in Central Cash Management Fund (cost $10,598,158) | | | 10,598,158 | |
| Total investments in securities, at value (cost $94,596,608) | | | 96,180,703 | |
| Cash | | | 10,000 | |
| Receivable for Fund shares sold | | | 43,593 | |
| Interest receivable | | | 835,905 | |
| Receivable for daily variation margin on futures contracts | | | 35,956 | |
| Foreign taxes recoverable | | | 1,880 | |
| Other assets | | | 575 | |
| Total assets | | | 97,108,612 | |
| Liabilities | |
| Payable upon return of securities loaned | | | 4,305,743 | |
| Payable for investment purchased | | | 93,499 | |
| Payable for investments purchased — delayed delivery securities | | | 11,431,833 | |
| Payable for Fund shares redeemed | | | 20,575 | |
| Net payable for closed swap contracts | | | 30,215 | |
| Unrealized depreciation on swap contracts | | | 15,224 | |
| Upfront payments received on swap contracts | | | 1,974 | |
| Accrued management fee | | | 34,932 | |
| Other accrued expenses and payables | | | 38,972 | |
| Total liabilities | | | 15,972,967 | |
| Net assets, at value | | $ | 81,135,645 | |
| Net Assets Consist of | |
| Undistributed net investment income | | | 1,434,359 | |
Net unrealized appreciation (depreciation) on: Investments | | | 1,584,095 | |
| Swap contracts | | | (15,224 | ) |
| Futures | | | 86,203 | |
| Accumulated net realized gain (loss) | | | (52,603,582 | ) |
| Paid-in capital | | | 130,649,794 | |
| Net assets, at value | | $ | 81,135,645 | |
Class A Net Asset Value, offering and redemption price per share ($81,135,645 ÷ 9,317,353 outstanding shares of beneficial interest, no par value, 24,742,586 shares authorized) | | $ | 8.71 | |
* Represents collateral of securities loaned.
The accompanying notes are an integral part of the financial statements.
Statement of Operations
| for the six months ended June 30, 2011 (Unaudited) | |
| Investment Income | |
Income: Interest | | $ | 1,755,969 | |
| Income distributions — Central Cash Management Fund | | | 6,156 | |
| Securities lending income, including income from Daily Assets Fund Institutional, net of borrower rebates | | | 2,309 | |
| Total income | | | 1,764,434 | |
Expenses: Management fee | | | 208,315 | |
| Administration fee | | | 41,663 | |
| Services to shareholders | | | 1,091 | |
| Custodian fee | | | 6,062 | |
| Audit and tax fees | | | 22,655 | |
| Legal fees | | | 4,615 | |
| Reports to shareholders | | | 11,525 | |
| Trustees' fees and expenses | | | 2,625 | |
| Other | | | 4,400 | |
| Total expenses before expense reductions | | | 302,951 | |
| Expense reductions | | | (7,088 | ) |
| Total expenses after expense reductions | | | 295,863 | |
| Net investment income (loss) | | | 1,468,571 | |
| Realized and Unrealized Gain (Loss) | |
Net realized gain (loss) from: Investments | | | 1,470,737 | |
| Swap contracts | | | (38,597 | ) |
| Futures | | | 295,848 | |
| | | | 1,727,988 | |
Change in net unrealized appreciation (depreciation) on: Investments | | | (689,990 | ) |
| Swap contracts | | | (15,224 | ) |
| Futures | | | (531,188 | ) |
| | | | (1,236,402 | ) |
| Net gain (loss) | | | 491,586 | |
| Net increase (decrease) in net assets resulting from operations | | $ | 1,960,157 | |
The accompanying notes are an integral part of the financial statements.
Statement of Changes in Net Assets | Increase (Decrease) in Net Assets | | Six Months Ended June 30, 2011 (Unaudited) | | | Year Ended December 31, 2010 | |
Operations: Net investment income (loss) | | $ | 1,468,571 | | | $ | 2,528,721 | |
| Net realized gain (loss) | | | 1,727,988 | | | | 4,071,997 | |
| Change in net unrealized appreciation (depreciation) | | | (1,236,402 | ) | | | (457,850 | ) |
| Net increase (decrease) in net assets resulting from operations | | | 1,960,157 | | | | 6,142,868 | |
Distributions to shareholders from: Net investment income: Class A | | | (2,313,385 | ) | | | (5,749,285 | ) |
| Total distributions | | | (2,313,385 | ) | | | (5,749,285 | ) |
Fund share transactions: Class A Proceeds from shares sold | | | 2,060,344 | | | | 26,314,018 | |
| Shares converted* | | | — | | | | 53,582 | |
| Reinvestment of distributions | | | 2,313,385 | | | | 5,749,285 | |
| Payments for shares redeemed | | | (10,733,108 | ) | | | (38,312,024 | ) |
| Net increase (decrease) in net assets from Class A share transactions | | | (6,359,379 | ) | | | (6,195,139 | ) |
Class B Proceeds from shares sold | | | — | | | | 785 | |
| Shares converted* | | | — | | | | (53,582 | ) |
| Payments for shares redeemed | | | — | | | | (78 | ) |
| Net increase (decrease) in net assets from Class B share transactions | | | — | | | | (52,875 | ) |
| Increase (decrease) in net assets | | | (6,712,607 | ) | | | (5,854,431 | ) |
| Net assets at beginning of period | | | 87,848,252 | | | | 93,702,683 | |
| Net assets at end of period (including undistributed net investment income of $1,434,359 and $2,279,173, respectively) | | $ | 81,135,645 | | | $ | 87,848,252 | |
| Other Information | |
Class A Shares outstanding at beginning of period | | | 10,037,687 | | | | 10,676,602 | |
| Shares sold | | | 235,645 | | | | 3,026,894 | |
| Shares converted* | | | — | | | | 5,994 | |
| Shares issued to shareholders in reinvestment of distributions | | | 268,063 | | | | 681,204 | |
| Shares redeemed | | | (1,224,042 | ) | | | (4,353,007 | ) |
| Net increase (decrease) in Class A shares | | | (720,334 | ) | | | (638,915 | ) |
| Shares outstanding at end of period | | | 9,317,353 | | | | 10,037,687 | |
Class B Shares outstanding at beginning of period | | | — | | | | 5,948 | |
| Shares sold | | | — | | | | 89 | |
| Shares converted* | | | — | | | | (6,028 | ) |
| Shares issued to shareholders in reinvestment of distributions | | | — | | | | (9 | ) |
| Net increase (decrease) in Class B shares | | | — | | | | (5,948 | ) |
| Shares outstanding at end of period | | | — | | | | — | |
* On February 5, 2010, Class B shares converted into Class A shares.
The accompanying notes are an integral part of the financial statements.
| | | | | Years Ended December 31, | |
| Class A | | Six Months Ended 6/30/11 (Unaudited) | 2010 | | 2009 | | | 2008 | | | 2007 | | | 2006 | |
| Selected Per Share Date | |
| Net asset value, beginning of period | | $ | 8.75 | | | $ | 8.77 | | | $ | 8.90 | | | $ | 11.82 | | | $ | 11.86 | | | $ | 11.81 | |
Income (loss) from investment operations: Net investment incomea | | | .15 | | | | .23 | | | | .39 | | | | .57 | | | | .56 | | | | .53 | |
| Net realized and unrealized gain (loss) | | | .06 | | | | .32 | | | | .24 | | | | (2.72 | ) | | | (.08 | ) | | | (.05 | ) |
| Total from investment operations | | | .21 | | | | .55 | | | | .63 | | | | (2.15 | ) | | | .48 | | | | .48 | |
Less distributions from: Net investment income | | | (.25 | ) | | | (.57 | ) | | | (.76 | ) | | | (.77 | ) | | | (.52 | ) | | | (.43 | ) |
| Net realized gains | | | — | | | | — | | | | — | | | | — | | | | — | | | | (.00 | )*** |
| Total distributions | | | (.25 | ) | | | (.57 | ) | | | (.76 | ) | | | (.77 | ) | | | (.52 | ) | | | (.43 | ) |
| Net asset value, end of period | | $ | 8.71 | | | $ | 8.75 | | | $ | 8.77 | | | $ | 8.90 | | | $ | 11.82 | | | $ | 11.86 | |
| Total Return (%) | | | 2.41 | b** | | | 6.51 | | | | 7.72 | c | | | (19.33 | )b | | | 4.17 | | | | 4.26 | |
| Ratios to Average Net Assets and Supplemental Data | |
| Net assets, end of period ($ millions) | | | 81 | | | | 88 | | | | 94 | | | | 110 | | | | 186 | | | | 277 | |
| Ratio of expenses before expense reductions (%) | | | .73 | * | | | .72 | | | | .59 | | | | .70 | | | | .66 | | | | .68 | |
| Ratio of expenses after expense reductions (%) | | | .71 | * | | | .72 | | | | .59 | | | | .70 | | | | .66 | | | | .68 | |
| Ratio of net investment income (%) | | | 3.52 | * | | | 2.62 | | | | 4.50 | | | | 5.36 | | | | 4.78 | | | | 4.56 | |
| Portfolio turnover rate (%) | | | 142 | ** | | | 356 | | | | 222 | | | | 215 | | | | 209 | | | | 198 | |
a Based on average shares outstanding during the period. b Total returns would have been lower had certain expenses not been reduced. c Includes a reimbursement from the Advisor to reimburse the effect of losses incurred as the result of certain operation errors during the period. Excluding this reimbursement, total return would have been 0.02% lower. * Annualized ** Not annualized *** Amount is less than $.005. | |
Notes to Financial Statements (Unaudited)
A. Organization and Significant Accounting Policies
DWS Core Fixed Income VIP (the "Fund") is a diversified series of DWS Variable Series II (the "Trust"), which is registered under the Investment Company Act of 1940, as amended (the "1940 Act"), as an open-end management investment company organized as a Massachusetts business trust.
The Fund's financial statements are prepared in accordance with accounting principles generally accepted in the United States of America which require the use of management estimates. Actual results could differ from those estimates. The policies described below are followed consistently by the Fund in the preparation of its financial statements.
Security Valuation. Investments are stated at value determined as of the close of regular trading on the New York Stock Exchange on each day the exchange is open for trading.
Various inputs are used in determining the value of the Fund's investments. These inputs are summarized in three broad levels. Level 1 includes quoted prices in active markets for identical securities. Level 2 includes other significant observable inputs (including quoted prices for similar securities, interest rates, prepayment speeds, and credit risk). Level 3 includes significant unobservable inputs (including the Fund's own assumptions in determining the fair value of investments). The inputs or methodology used for valuing securities are not necessarily an indication of the risk associated with investing in those securities.
Debt securities are valued by independent pricing services approved by the Fund's Board. If the pricing services are unable to provide valuations, securities are valued at the most recent bid quotation or evaluated price, as applicable, obtained from one or more broker-dealers. Such services may use various pricing techniques which take into account appropriate factors such as yield, quality, coupon rate, maturity, type of issue, trading characteristics and other data, as well as broker quotes. These securities are generally categorized as Level 2.
Money market instruments purchased with an original or remaining maturity of sixty days or less, maturing at par, are valued at amortized cost, which approximates value, and are categorized as Level 2. Investments in open-end investment companies are valued at their net asset value each business day and are categorized as Level 1.
Futures contracts are generally valued at the settlement prices established each day on the exchange on which they are traded and are categorized as Level 1.
Swap contracts are valued daily based upon prices supplied by a Board approved pricing vendor, if available, and otherwise are valued at the price provided by the broker-dealer. Swap contracts are generally categorized as Level 2.
Securities and other assets for which market quotations are not readily available or for which the above valuation procedures are deemed not to reflect fair value are valued in a manner that is intended to reflect their fair value as determined in accordance with procedures approved by the Board and are generally categorized as Level 3. In accordance with the Fund's valuation procedures, factors used in determining value may include, but are not limited to, the type of the security; the size of the holding; the initial cost of the security; the existence of any contractual restrictions on the security's disposition; the price and extent of public trading in similar securities of the issuer or of comparable companies; quotations or evaluated prices from broker-dealers and/or pricing services; information obtained from the issuer, analysts, and/or the appropriate stock exchange (for exchange-traded securities); an analysis of the company's or issuer's financial statements; an evaluation of the forces that influence the issuer and the market(s) in which the security is purchased and sold and with respect to debt securities; the maturity, coupon, creditworthiness, currency denomination and the movement of the market in which the security is normally traded. The value determined under these procedures may differ from published values for the same securities.
Disclosure about the classification of fair value measurements is included in a table following the Fund's Investment Portfolio.
Securities Lending. The Fund lends securities to certain financial institutions. The Fund retains beneficial ownership of the securities it has loaned and continues to receive interest and dividends paid by the issuer of securities and to participate in any changes in their market value. The Fund requires the borrowers of the securities to maintain collateral with the Fund consisting of either cash or liquid, unencumbered assets having a value at least equal to the value of the securities loaned. When the collateral falls below specified amounts, the lending agent will use its best effort to obtain additional collateral on the next business day to meet required amounts under the security lending agreement. The Fund may invest the cash collateral into a joint trading account in an affiliated money market fund pursuant to Exemptive Orders issued by the SEC. The Fund receives compensation for lending its securities either in the form of fees or by earning interest on invested cash collateral net of borrower rebates and fees paid to a lending agent. Either the Fund or the borrower may terminate the loan. There may be risks of delay and costs in recovery of securities or even loss of rights in the collateral should the borrower of the securities fail financially. The Fund is also subject to all investment risks associated with the reinvestment of any cash collateral received, including, but not limited to, interest rate, credit and liquidity risk associated with such investments.
Mortgage Dollar Rolls. The Fund may enter into mortgage dollar rolls in which the Fund sells to a bank or broker/dealer (the "counterparty") mortgage-backed securities for delivery in the current month and simultaneously contracts to repurchase similar, but not identical, securities on a fixed date. The counterparty receives all principal and interest payments, including prepayments, made on the security while it is the holder. The Fund receives compensation as consideration for entering into the commitment to repurchase. The compensation is paid in the form of a lower price for the security upon its repurchase, or alternatively, a fee. Mortgage dollar rolls may be renewed with a new sale and repurchase price and a cash settlement made at each renewal without physical delivery of the securities subject to the contract.
Certain risks may arise upon entering into mortgage dollar rolls from the potential inability of counterparties to meet the terms of their commitments. Additionally, the value of such securities may change adversely before the Fund is able to repurchase them. There can be no assurance that the Fund's use of the cash that it receives from a mortgage dollar roll will provide a return that exceeds its costs.
When-Issued/Delayed Delivery Securities. The Fund may purchase or sell securities with delivery or payment to occur at a later date beyond the normal settlement period. At the time the Fund enters into a commitment to purchase or sell a security, the transaction is recorded and the value of the transaction is reflected in the net asset value. The price of such security and the date when the security will be delivered and paid for are fixed at the time the transaction is negotiated. The value of the security may vary with market fluctuations. At the time the Fund enters into a purchase transaction it is required to segregate cash or other liquid assets at least equal to the amount of the commitment.
Certain risks may arise upon entering into when-issued or delayed delivery transactions from the potential inability of counterparties to meet the terms of their contracts or if the issuer does not issue the securities due to political, economic, or other factors. Additionally, losses may arise due to changes in the value of the underlying securities.
Federal Income Taxes. The Fund's policy is to comply with the requirements of the Internal Revenue Code, as amended, which are applicable to regulated investment companies, and to distribute all of its taxable income to its shareholders.
At December 31, 2010, the Fund had net tax basis capital loss carryforward of approximately $53,707,000, which may be applied against any realized net taxable capital gains of each succeeding year until fully utilized or until December 31, 2016 ($5,512,000) and December 31, 2017 ($48,195,000), the respective expiration dates, whichever occurs first.
On December 22, 2010, the Regulated Investment Company Modernization Act of 2010 (the "Act") was enacted. Under the Act, net capital losses may be carried forward indefinitely, and their character is retained as short-term and/or long-term losses. Previously, net capital losses were carried forward for eight years and treated as short-term losses. As a transition rule, the Act requires that post-enactment net capital losses be used before pre-enactment net capital losses. As a result of this ordering rule, pre-enactment capital loss carryforwards may expire unused, whereas under the previous rules these losses may have been utilized. This change is effective for fiscal years beginning after the date of enactment.
The Fund has reviewed the tax positions for the open tax years as of December 31, 2010 and has determined that no provision for income tax is required in the Fund's financial statements. The Fund's federal tax returns for the prior three fiscal years remain open subject to examination by the Internal Revenue Service.
Distribution of Income and Gains. Distributions of net investment income of the Fund, if any, are made annually. Net realized gains from investment transactions, in excess of available capital loss carryforwards, would be taxable to the Fund if not distributed and, therefore, will be distributed to shareholders at least annually. The Fund may also make additional distributions for tax purposes if necessary.
The timing and characterization of certain income and capital gains distributions are determined annually in accordance with federal tax regulations which may differ from accounting principles generally accepted in the United States of America. These differences primarily relate to investments in futures, swap contracts and certain securities sold at a loss. As a result, net investment income (loss) and net realized gain (loss) on investment transactions for a reporting period may differ significantly from distributions during such period. Accordingly, the Fund may periodically make reclassifications among certain of its capital accounts without impacting the net asset value of the Fund.
The tax character of current year distributions will be determined at the end of the current fiscal year.
Expenses. Expenses of the Trust arising in connection with a specific fund are allocated to that fund. Other Trust expenses which cannot be directly attributed to a fund are apportioned among the funds in the Trust.
Contingencies. In the normal course of business, the Fund may enter into contracts with service providers that contain general indemnification clauses. The Fund's maximum exposure under these arrangements is unknown as this would involve future claims that may be made against the Fund that have not yet been made. However, based on experience, the Fund expects the risk of loss to be remote.
Other. Investment transactions are accounted for on a trade date plus one basis for daily net asset value calculations. However, for financial reporting purposes, investment transactions are reported on trade date. Interest income is recorded on the accrual basis. Realized gains and losses from investment transactions are recorded on an identified cost basis and may include proceeds from litigation. All discounts and premiums are accreted/amortized for both tax and financial reporting purposes for the Fund.
B. Derivative Instruments
Credit Default Swap Contracts. A credit default swap is a contract between a buyer and a seller of protection against pre-defined credit events for the reference entity. For the six months ended June 30, 2011, the Fund bought credit default swap contracts to gain exposure to an underlying reference entity's credit quality characteristics without directly investing in that reference entity, or to hedge the risk of default on Fund securities. As a seller in the credit default swap contract, the Fund is required to pay the par (or other agreed-upon) value of the referenced entity to the counterparty with the occurrence of a credit event by a third party, such as a US or foreign corporate issuer, on the reference entity, which would likely result in a loss to the Fund. In return, the Fund receives from the counterparty a periodic stream of payments over the term of the contract provided that no credit event has occurred. If no credit event occurs, the Fund keeps the stream of payments with no payment obligations. The Fund may also buy credit default swap contracts in order to hedge against the risk of a credit event on debt securities, in which case the Fund functions as the counterparty referenced above. This involves the risk that the contract may expire worthless. It also involves counterparty risk that the seller may fail to satisfy its payment obligations to the Fund with the occurrence of a credit event. When the Fund sells a credit default swap contract it will cover its commitment. This may be achieved by, among other methods, maintaining cash or liquid assets equal to the aggregate notional value of the reference entities for all outstanding credit default swap contracts sold by the Fund.
The value of the credit default swap is adjusted daily and the change in value, if any, is recorded daily as unrealized appreciation or depreciation in the Statement of Assets and Liabilities. An upfront payment, if any, made by the Fund is recorded as an asset in the Statement of Assets and Liabilities. An upfront payment, if any, received by the Fund is recorded as a liability in the Statement of Assets and Liabilities. Under the terms of the credit default swap contracts, the Fund receives or makes quarterly payments based on a specified interest rate on a fixed notional amount. These payments are recorded as a realized gain or loss in the Statement of Operations. Payments received or made as a result of a credit event or termination of the contract are recognized, net of a proportional amount of the upfront payment, as realized gains or losses in the Statement of Operations.
A summary of the open credit default swap contracts as of June 30, 2011 is included in a table following the Fund's Investment Portfolio. For the six months ended June 30, 2011, the Fund's investment in credit default swap contracts purchased had a total notional value generally indicative of a range from $0 to approximately $4,200,000.
Futures Contracts. A futures contract is an agreement between a buyer or seller and an established futures exchange or its clearinghouse in which the buyer or seller agrees to take or make a delivery of a specific amount of a financial instrument at a specified price on a specific date (settlement date). For the six months ended June 30, 2011, the Fund entered into interest rate futures to gain exposure to different parts of the yield curve while managing overall duration.
Futures contracts are valued at the most recent settlement price. Upon entering into a futures contract, the Fund is required to deposit with a financial intermediary cash or securities ("initial margin") in an amount equal to a certain percentage of the face value indicated in the futures contract. Subsequent payments ("variation margin") are made or received by the Fund dependent upon the daily fluctuations in the value and are recorded for financial reporting purposes as unrealized gains or losses by the Fund. Gains or losses are realized when the contract expires or is closed. Since all futures contracts are exchange-traded, counterparty risk is minimized as the exchange's clearinghouse acts as the counterparty, and guarantees the futures against default.
Certain risks may arise upon entering into futures contracts, including the risk that an illiquid market will limit the Fund's ability to close out a futures contract prior to the settlement date and the risk that the futures contract is not well correlated with the security, index or currency to which it relates. Risk of loss may exceed amounts recognized in the Statement of Assets and Liabilities.
A summary of the open futures contracts as of June 30, 2011 is included in a table following the Fund's Investment Portfolio. For the six months ended June 30, 2011, the Fund's investment in futures contracts sold had a total notional value generally indicative of a range from approximately $11,027,000 to $23,345,000.
The following tables summarize the value of the Fund's derivative instruments held as of June 30, 2011 and the related location in the accompanying Statement of Assets and Liabilities, presented by primary underlying risk exposure:
| Asset Derivative | | Futures Contracts | |
| Interest Rate Contracts (a) | | $ | 86,203 | |
The above derivative is located in the following Statement of Assets and Liabilities account:
(a) Includes cumulative appreciation of futures contracts as disclosed in the Investment Portfolio. Unsettled variation margin is disclosed separately within the Statement of Assets and Liabilities.
| Liability Derivative | | Swap Contracts | |
| Credit Contracts (a) | | $ | (15,224 | ) |
The above derivative is located in the following Statement of Assets and Liabilities account:
(a) Unrealized depreciation on swap contracts
Additionally, the amount of unrealized and realized gains and losses on derivative instruments recognized in Fund earnings during the six months ended June 30, 2011 and the related location in the accompanying Statement of Operations is summarized in the following tables by primary underlying risk exposure:
| Realized Gain (Loss) | | Swap Contracts | | | Futures Contracts | | | Total | |
| Interest Rate Contracts (a) | | $ | — | | | $ | 295,848 | | | $ | 295,848 | |
| Credit Contracts (a) | | | (38,597 | ) | | | — | | | | (38,597 | ) |
| | | $ | (38,597 | ) | | $ | 295,848 | | | $ | 257,251 | |
Each of the above derivatives is located in the following Statement of Operations accounts:
(a) Net realized gain (loss) from swap contracts and futures, respectively
| Change in Net Unrealized Appreciation (Depreciation) | | Swap Contracts | | | Futures Contracts | | | Total | |
| Interest Rate Contracts (a) | | $ | — | | | $ | (531,188 | ) | | $ | (531,188 | ) |
| Credit Contracts (a) | | | (15,224 | ) | | | — | | | | (15,224 | ) |
| | | $ | (15,224 | ) | | $ | (531,188 | ) | | $ | (546,412 | ) |
Each of the above derivatives is located in the following Statement of Operations accounts:
(a) Change in net unrealized appreciation (depreciation) on swap contracts and futures, respectively
C. Purchases and Sales of Securities
During the six months ended June 30, 2011, purchases and sales of investment transactions (excluding short-term investments and US Treasury obligations) aggregated $108,700,006 and $118,448,131, respectively. Purchases and sales of US Treasury obligations aggregated $14,032,509 and $31,059,586, respectively.
D. Related Parties
Management Agreement. Under the Investment Management Agreement with Deutsche Investment Management Americas Inc. ("DIMA" or the "Advisor"), an indirect, wholly owned subsidiary of Deutsche Bank AG, the Advisor directs the investments of the Fund in accordance with its investment objectives, policies and restrictions. The Advisor determines the securities, instruments and other contracts relating to investments to be purchased, sold or entered into by the Fund.
Pursuant to the Investment Management Agreement with the Advisor, the Fund pays a monthly management fee based on the Fund's average daily net assets, computed and accrued daily and payable monthly, at the following annual rates:
| $0-$250 million | | | .500 | % |
| next $750 million | | | .470 | % |
| next $1.5 billion | | | .450 | % |
| next $2.5 billion | | | .430 | % |
| next $2.5 billion | | | .400 | % |
| next $2.5 billion | | | .380 | % |
| next $2.5 billion | | | .360 | % |
| over $12.5 billion | | | .340 | % |
For the period from January 1, 2011 through September 30, 2011, the Advisor has contractually agreed to waive its fee and/or reimburse certain operating expenses to the extent necessary to maintain the operating expenses (excluding certain expenses such as extraordinary expenses, taxes, brokerage and interest expense) at 0.71%.
Accordingly, for the six months ended June 30, 2011, the Advisor waived a portion of its management fee pursuant to the Investment Management Agreement aggregating $7,023, and the amount charged aggregated $201,292, which was equivalent to an annualized effective rate of 0.48% of the Fund's average daily net assets.
Administration Fee. Pursuant to an Administrative Services Agreement, DIMA provides most administrative services to the Fund. For all services provided under the Administrative Services Agreement, the Fund pays DIMA an annual fee ("Administration Fee") of 0.10% of the Fund's average daily net assets, computed and accrued daily and payable monthly. For the six months ended June 30, 2011, the Administration Fee was $41,663, of which $6,777 is unpaid.
Service Provider Fees. DWS Investments Service Company ("DISC"), an affiliate of the Advisor, is the transfer agent, dividend-paying agent and shareholder service agent for the Fund. Pursuant to a sub-transfer agency agreement between DISC and DST Systems, Inc. ("DST"), DISC has delegated certain transfer agent, dividend-paying agent and shareholder service agent functions to DST. DISC compensates DST out of the shareholder servicing fee it receives from the Fund. For the six months ended June 30, 2011, the amounts charged to the Fund by DISC aggregated $65, all of which was waived.
Typesetting and Filing Service Fees. Under an agreement with DIMA, DIMA is compensated for providing typesetting and certain regulatory filing services to the Fund. For the six months ended June 30, 2011, the amount charged to the Fund by DIMA included in the Statement of Operations under "reports to shareholders" aggregated $4,315, of which $659 is unpaid.
Trustees' Fees and Expenses. The Fund paid each Trustee not affiliated with the Advisor retainer fees plus specified amounts for various committee services and for the Board Chairperson.
Affiliated Cash Management Vehicle. The Fund may invest uninvested cash balances in Central Cash Management Fund, which is managed by the Advisor. The Fund indirectly bears its proportionate share of the expenses of Central Cash Management Fund. Central Cash Management Fund does not pay the Advisor an investment management fee. Central Cash Management Fund seeks a high level of current income consistent with liquidity and the preservation of capital.
E. Ownership of the Fund
At June 30, 2011, three Participating Insurance Companies were owners of record of 10% or more of the total outstanding Class A shares of the Fund, each owning 44%, 41% and 13%.
F. Line of Credit
The Fund and other affiliated funds (the "Participants") share in a $450 million revolving credit facility provided by a syndication of banks. The Fund may borrow for temporary or emergency purposes, including the meeting of redemption requests that otherwise might require the untimely disposition of securities. The Participants are charged an annual commitment fee which is allocated based on net assets, among each of the Participants. Interest is calculated at a rate per annum equal to the sum of the Federal Funds Rate plus 1.25 percent plus if LIBOR exceeds the Federal Funds Rate the amount of such excess. The Fund may borrow up to a maximum of 33 percent of its net assets under the agreement. The Fund had no outstanding loans at June 30, 2011.
The Trust's policies and procedures for voting proxies for portfolio securities and information about how the Trust voted proxies related to its portfolio securities during the 12-month period ended June 30 are available on our Web site — www.dws-investments.com (click on "proxy voting" at the bottom of the page) — or on the SEC's Web site — www.sec.gov. To obtain a written copy of the Trust's policies and procedures without charge, upon request, call us toll free at (800) 728-3337.
Summary of Management Fee Evaluation by Independent Fee Consultant
October 3, 2010
Pursuant to an Order entered into by Deutsche Investment Management Americas and affiliates (collectively, "DeAM") with the Attorney General of New York, I, Thomas H. Mack, have been appointed the Independent Fee Consultant for the DWS Funds (formerly the DWS Scudder Funds). My duties include preparing an annual written evaluation of the management fees DeAM charges the Funds, considering among other factors the management fees charged by other mutual fund companies for like services, management fees DeAM charges other clients for like services, DeAM's costs of supplying services under the management agreements and related profit margins, possible economies of scale if a Fund grows larger, and the nature and quality of DeAM's services, including fund performance. This report summarizes my evaluation for 2010, including my qualifications, the evaluation process for each of the DWS Funds, consideration of certain complex-level factors, and my conclusions. I served in substantially the same capacity in 2007, 2008, and 2009.
Qualifications
For more than 35 years I have served in various professional capacities within the investment management business. I have held investment analysis and advisory positions, including securities analyst, portfolio strategist and director of investment policy with a large investment firm. I have also performed business management functions, including business development, financial management and marketing research and analysis.
Since 1991, I have been an independent consultant within the asset management industry. I have provided services to over 125 client organizations, including investment managers, mutual fund boards, product distributors and related organizations. Over the past ten years I have completed a number of assignments for mutual fund boards, specifically including assisting boards with management contract renewal.
I hold a Master of Business Administration degree, with highest honors, from Harvard University and Master of Science and Bachelor of Science (highest honors) degrees from the University of California at Berkeley. I am an independent director and audit committee financial expert for two closed-end mutual funds and have served in various leadership and financial oversight capacities with non-profit organizations.
Evaluation of Fees for each DWS Fund
My work focused primarily on evaluating, fund-by-fund, the fees charged to each of the 118 publicly offered Fund portfolios in the DWS Fund family. For each Fund, I considered each of the key factors mentioned above, as well as any other relevant information. In doing so I worked closely with the Funds' Independent Directors in their annual contract renewal process, as well as in their approval of contracts for several new funds (documented separately).
In evaluating each Fund's fees, I reviewed comprehensive materials provided by or on behalf of DeAM, including expense information prepared by Lipper Analytical, comparative performance information, profitability data, manager histories, and other materials. I also accessed certain additional information from the Lipper and Morningstar databases and drew on my industry knowledge and experience.
To facilitate evaluating this considerable body of information, I prepared for each Fund a document summarizing the key data elements in each area as well as additional analytics discussed below. This made it possible to consider each key data element in the context of the others.
In the course of contract renewal, DeAM agreed to implement a number of fee and expense adjustments requested by the Independent Directors which will favorably impact future fees and expenses, and my evaluation includes the effects of these changes.
Fees and Expenses Compared with Other Funds
The competitive fee and expense evaluation for each fund focused on two primary comparisons:
The Fund's contractual management fee (the advisory fee plus the administration fee where applicable) compared with those of a group of typically 12-15 funds in the same Lipper investment category (e.g. Large Capitalization Growth) having similar distribution arrangements and being of similar size.
The Fund's total expenses compared with a broader universe of funds from the same Lipper investment category and having similar distribution arrangements.
These two comparisons provide a view of not only the level of the fee compared with funds of similar scale but also the total expense the Fund bears for all the services it receives, in comparison with the investment choices available in the Fund's investment category and distribution channel. The principal figure-of-merit used in these comparisons was the subject Fund's percentile ranking against peers.
DeAM's Fees for Similar Services to Others
DeAM provided management fee schedules for all of its US domiciled fund and non-fund investment management accounts in any of the investment categories where there is a DWS Fund. These similar products included the other DWS Funds, non-fund pooled accounts, institutional accounts and sub-advisory accounts. Using this information, I calculated for each Fund the fee that would be charged to each similar product, at the subject Fund's asset level.
Evaluating information regarding non-fund products is difficult because there are varying levels of services required for different types of accounts, with mutual funds generally requiring considerably more regulatory and administrative types of service as well as having more frequent cash flows than other types of accounts. Also, while mutual fund fees for similar fund products can be expected to be similar, there will be some differences due to different pricing conditions in different distribution channels (e.g. retail funds versus those used in variable insurance products), differences in underlying investment processes and other factors.
Costs and Profit Margins
DeAM provided a detailed profitability analysis for each Fund. After making some adjustments so that the presentation would be more comparable to the available industry figures, I reviewed profit margins from investment management alone, from investment management plus other fund services (excluding distribution) provided to the Funds by DeAM (principally shareholder services), and DeAM profits from all sources, including distribution. A later section comments on overall profitability.
Economies of Scale
Economies of scale — an expected decline in management cost per dollar of fund assets as fund assets grow — are very rarely quantified and documented because of inherent difficulties in collecting and analyzing relevant data. However, in virtually every investment category that I reviewed, larger funds tend to have lower fees and lower total expenses than smaller funds. To see how each DWS Fund compares with this industry observation, I reviewed:
The trend in Fund assets over the last five years and the accompanying trend in total expenses. This shows if the Fund has grown and, if so, whether total expense (management fees as well as other expenses) have declined as a percent of assets.
Whether the Fund has break-points in its management fee schedule, the extent of the fee reduction built into the schedule and the asset levels where the breaks take effect, and in the case of a sub-advised Fund how the Fund's break-points compare with those of the sub-advisory fee schedule.
How the Fund's contractual fee schedule compares with trends in the industry data. To accomplish this, I constructed a chart showing how actual latest-fiscal-year contractual fees of the Fund and of other similar funds relate to average fund assets, with the subject Fund's contractual fee schedule superimposed.
Quality of Service — Performance
The quality-of-service evaluation focused on investment performance, which is the principal result of the investment management service. Each Fund's performance was reviewed over the past 1, 3, 5 and 10 years, as applicable, and compared with that of other funds in the same investment category and with a suitable market index.
In addition, I calculated and reviewed risk-adjusted returns relative to an index of similar mutual funds' returns and a suitable market index. The risk-adjusted returns analysis provides a way of determining the extent to which the Fund's return comparisons are mainly the product of investment value-added (or lack thereof) or alternatively taking considerably more or less risk than is typical in its investment category.
I also received and considered the history of portfolio manager changes for each Fund, as this provided an important context for evaluating the performance results.
Complex-Level Considerations
While this evaluation was conducted mainly at the individual fund level, there are some issues relating to the reasonableness of fees that can alternatively be considered across the whole fund complex:
I reviewed DeAM's profitability analysis for all DWS Funds, with a view toward determining if the allocation procedures used were reasonable and how profit levels compared with public data for other investment managers.
I considered whether DeAM and affiliates receive any significant ancillary or "fall-out" benefits that should be considered in interpreting the direct profitability results. These would be situations where serving as the investment manager of the Funds is beneficial to another part of the Deutsche Bank organization.
I considered how aggregated DWS Fund expenses had varied over the years, by asset class and in the context of trends in asset levels.
I reviewed the structure of the DeAM organization, trends in staffing levels, and information on compensation of investment management and other professionals compared with industry data.
Findings
Based on the process and analysis discussed above, which included reviewing a wide range of information from management and external data sources and considering among other factors the fees DeAM charges other clients, the fees charged by other fund managers, DeAM's costs and profits associated with managing the Funds, economies of scale, possible fall-out benefits, and the nature and quality of services provided, in my opinion the management fees charged the DWS Funds are reasonable.
Thomas H. Mack
DWS Investments Distributors, Inc.
222 South Riverside Plaza
Chicago, IL 60606
(800) 621-1148
VS2CFI-3 (R-023292-1 8/11)

JUNE 30, 2011
SEMIANNUAL REPORT
DWS VARIABLE SERIES II
DWS Diversified International Equity VIP
Contents
3 Performance Summary 4 Information About Your Fund's Expenses 5 Portfolio Summary 6 Investment Portfolio 16 Statement of Assets and Liabilities 17 Statement of Operations 18 Statement of Changes in Net Assets 20 Financial Highlights 21 Notes to Financial Statements 25 Proxy Voting 26 Summary of Management Fee Evaluation by Independent Fee Consultant |
This report must be preceded or accompanied by a prospectus. To obtain an additional prospectus or summary prospectus, if available, call (800) 728-3337 or your financial representative. We advise you to consider the Fund's objectives, risks, charges and expenses carefully before investing. The summary prospectus and prospectus contain this and other important information about the Fund. Please read the prospectus carefully before you invest.
Investing in foreign securities, particularly those of emerging markets, presents certain risks, such as currency fluctuations, political and economic changes, and market risks. Stocks may decline in value. See the prospectus for details.
DWS Investments is part of Deutsche Bank's Asset Management division and, within the US, represents the retail asset management activities of Deutsche Bank AG, Deutsche Bank Trust Company Americas, Deutsche Investment Management Americas Inc. and DWS Trust Company.
NOT FDIC/NCUA INSURED NO BANK GUARANTEE MAY LOSE VALUE NOT A DEPOSIT
NOT INSURED BY ANY FEDERAL GOVERNMENT AGENCY
Performance Summary June 30, 2011
Fund performance shown is historical, assumes reinvestment of all dividend and capital gain distributions and does not guarantee future results. Investment return and principal value fluctuate with changing market conditions so that, when redeemed, shares may be worth more or less than their original cost. Current performance may be lower or higher than the performance data quoted. Please contact your participating insurance company for the Fund's most recent month-end performance. Performance doesn't reflect charges and fees ("contract charges") associated with the separate account that invests in the Fund or any variable life insurance policy or variable annuity contract for which the Fund is an investment option. These charges and fees will reduce returns.
The gross expense ratio of the Fund, as stated in the fee table of the prospectus dated May 1, 2011 is 0.99% for Class A shares and may differ from the expense ratio disclosed in the Financial Highlights table in this report.
| Growth of an Assumed $10,000 Investment in DWS Diversified International Equity VIP |
[] DWS Diversified International Equity VIP — Class A [] MSCI EAFE® Index | The Morgan Stanley Capital International (MSCI) Europe, Australasia and the Far East EAFE® Index is an unmanaged, free float-adjusted, market capitalization index that tracks international stock performance in the 21 developed markets of Europe, Australasia and the Far East. The index is calculated using closing local market prices and translates into US dollars using the London close foreign exchange rates. Index returns do not reflect any fees or expenses and it is not possible to invest directly into an index. |
| |
| Yearly periods ended June 30 | |
| Comparative Results | |
| DWS Diversified International Equity VIP | | 6-Month‡ | | | 1-Year | | | 3-Year | | | 5-Year | | | 10-Year | |
| Class A | Growth of $10,000 | | $ | 10,493 | | | $ | 13,064 | | | $ | 8,201 | | | $ | 10,304 | | | $ | 15,624 | |
| Average annual total return | | | 4.93 | % | | | 30.64 | % | | | -6.40 | % | | | 0.60 | % | | | 4.56 | % |
| MSCI EAFE Index | Growth of $10,000 | | $ | 10,498 | | | $ | 13,036 | | | $ | 9,478 | | | $ | 10,760 | | | $ | 17,344 | |
| Average annual total return | | | 4.98 | % | | | 30.36 | % | | | -1.77 | % | | | 1.48 | % | | | 5.66 | % |
The growth of $10,000 is cumulative.
‡ Total returns shown for periods less than one year are not annualized.
Information About Your Fund's Expenses
As an investor of the Fund, you incur two types of costs: ongoing expenses and transaction costs. Ongoing expenses include management fees and other Fund expenses. Examples of transaction costs include contract charges and account maintenance fees, which are not shown in this section. The following tables are intended to help you understand your ongoing expenses (in dollars) of investing in the Fund and to help you compare these expenses with the ongoing expenses of investing in other mutual funds. The example in the table is based on an investment of $1,000 invested at the beginning of the six-month period and held for the entire period (January 1, 2011 to June 30, 2011).
The tables illustrate your Fund's expenses in two ways:
•Actual Fund Return. This helps you estimate the actual dollar amount of ongoing expenses (but not transaction costs) paid on a $1,000 investment in the Fund using the Fund's actual return during the period. To estimate the expenses you paid over the period, simply divide your account value by $1,000 (for example, an $8,600 account value divided by $1,000 = 8.6), then multiply the result by the number in the "Expenses Paid per $1,000" line under the share class you hold.
• Hypothetical 5% Fund Return. This helps you to compare your Fund's ongoing expenses (but not transaction costs) with those of other mutual funds using the Fund's actual expense ratio and a hypothetical rate of return of 5% per year before expenses. Examples using a 5% hypothetical Fund return may be found in the shareholder reports of other mutual funds. The hypothetical account values and expenses may not be used to estimate the actual ending account balance or expenses you paid for the period.
Please note that the expenses shown in these tables are meant to highlight your ongoing expenses only and do not reflect any transaction costs. The "Expenses Paid per $1,000" line of the tables is useful in comparing ongoing expenses only and will not help you determine the relative total expense of owning different funds. If these transaction costs had been included, your costs would have been higher.
Expenses and Value of a $1,000 Investment for the six months ended June 30, 2011 | |
| Actual Fund Return | | Class A | |
| Beginning Account Value 1/1/11 | | $ | 1,000.00 | |
| Ending Account Value 6/30/11 | | $ | 1,049.30 | |
| Expenses Paid per $1,000* | | $ | 5.08 | |
| Hypothetical 5% Fund Return | | Class A | |
| Beginning Account Value 1/1/11 | | $ | 1,000.00 | |
| Ending Account Value 6/30/11 | | $ | 1,019.84 | |
| Expenses Paid per $1,000* | | $ | 5.01 | |
* Expenses are equal to the Fund's annualized expense ratio, multiplied by the average account value over the period, multiplied by the number of days in the most recent six-month period, then divided by 365.
| Annualized Expense Ratio | Class A | |
| DWS Variable Series II — DWS Diversified International Equity VIP | 1.00% | |
For more information, please refer to the Fund's prospectus.
These tables do not reflect charges and fees ("contract charges") associated with the separate account that invests in the Fund or any variable life insurance policy or variable annuity contract for which the Fund is an investment option.
Asset Allocation (As a % of Investment Portfolio excluding Securities Lending Collateral) | 6/30/11 | 12/31/10 |
| | | |
| Common Stocks | 87% | 87% |
| Exchange-Traded Funds | 10% | 9% |
| Cash Equivalents* | 2% | 3% |
| Preferred Stocks | 1% | 1% |
| | 100% | 100% |
Sector Diversification (As a % of Common and Preferred Stocks) | 6/30/11 | 12/31/10 |
| | | |
| Telecommunication Services | 14% | 16% |
| Consumer Staples | 13% | 12% |
| Health Care | 12% | 9% |
| Financials | 11% | 10% |
| Utilities | 11% | 8% |
| Consumer Discretionary | 10% | 8% |
| Materials | 9% | 11% |
| Industrials | 8% | 11% |
| Information Technology | 7% | 6% |
| Energy | 5% | 9% |
| | 100% | 100% |
Geographical Diversification (As a % of Investment Portfolio excluding Cash Equivalents and Securities Lending Collateral) | 6/30/11 | 12/31/10 |
| | | |
| Continental Europe | 49% | 49% |
| Japan | 13% | 21% |
| Canada | 11% | 5% |
| Emerging Markets | 11% | 10% |
| United Kingdom | 7% | 7% |
| Asia (excluding Japan) | 5% | 4% |
| Australia | 4% | 4% |
| | 100% | 100% |
* In order to keep cash on hand to meet shareholder redemptions or other needs while maintaining exposure to the market, the Fund invests in futures contracts.
Asset allocation, sector and geographical diversification are subject to change.
For more complete details about the Fund's investment portfolio, see page 6.
Following the Fund's fiscal first and third quarter-end, a complete portfolio holdings listing is filed with the SEC on Form N-Q. The form will be available on the SEC's Web site at www.sec.gov, and it also may be reviewed and copied at the SEC's Public Reference Room in Washington, D.C. Information on the operation of the SEC's Public Reference Room may be obtained by calling (800) SEC-0330. The Fund's portfolio holdings are also posted on www.dws-investments.com from time to time. Please see the Fund's current prospectus for more information.
Investment Portfolio June 30, 2011 (Unaudited) | | | Shares | | | Value ($) | |
| | | | |
| Common Stocks 86.4% | |
| Australia 3.7% | |
| AGL Energy Ltd. | | | 18,406 | | | | 289,695 | |
| Asciano Ltd. | | | 17,279 | | | | 30,585 | |
| Australia & New Zealand Banking Group Ltd. | | | 2,823 | | | | 66,669 | |
| BHP Billiton Ltd. | | | 4,758 | | | | 224,879 | |
| Brambles Ltd. | | | 13,105 | | | | 101,812 | |
| Coca-Cola Amatil Ltd. | | | 2,294 | | | | 28,148 | |
| Cochlear Ltd. | | | 674 | | | | 52,027 | |
| Commonwealth Bank of Australia | | | 1,574 | | | | 88,588 | |
| Crown Ltd. | | | 9,187 | | | | 88,210 | |
| CSL Ltd. | | | 5,197 | | | | 184,208 | |
| Fairfax Media Ltd. (a) | | | 54,011 | | | | 57,047 | |
| Foster's Group Ltd. | | | 7,671 | | | | 42,466 | |
| Leighton Holdings Ltd. | | | 1,643 | | | | 36,893 | |
| National Australia Bank Ltd. (a) | | | 2,600 | | | | 71,735 | |
| Newcrest Mining Ltd. | | | 1,231 | | | | 49,967 | |
| Origin Energy Ltd. | | | 6,869 | | | | 116,807 | |
| Qantas Airways Ltd.* | | | 18,444 | | | | 36,560 | |
| QBE Insurance Group Ltd. | | | 2,063 | | | | 38,300 | |
| QR National Ltd.* | | | 14,433 | | | | 52,435 | |
| Rio Tinto Ltd. | | | 735 | | | | 65,714 | |
| Santos Ltd. | | | 6,168 | | | | 89,877 | |
| Sonic Healthcare Ltd. | | | 4,124 | | | | 56,896 | |
| SP AusNet | | | 58,973 | | | | 59,797 | |
| TABCORP Holdings Ltd. | | | 15,130 | | | | 53,594 | |
| Tatts Group Ltd. | | | 24,689 | | | | 63,705 | |
| Telstra Corp., Ltd. | | | 88,649 | | | | 275,275 | |
| Toll Holdings Ltd. | | | 7,945 | | | | 41,500 | |
| Transurban Group (Units) | | | 14,907 | | | | 83,935 | |
| Wesfarmers Ltd. | | | 3,054 | | | | 104,661 | |
| Westfield Group (REIT) (Units) | | | 3,912 | | | | 36,455 | |
| Westpac Banking Corp. | | | 2,569 | | | | 61,625 | |
| Woodside Petroleum Ltd. | | | 3,950 | | | | 174,242 | |
| Woolworths Ltd. | | | 3,431 | | | | 102,311 | |
| WorleyParsons Ltd. | | | 1,721 | | | | 52,255 | |
| (Cost $1,947,949) | | | | 2,978,873 | |
| Austria 0.5% | |
| Erste Group Bank AG (a) | | | 3,560 | | | | 186,471 | |
| Immofinanz AG* (a) | | | 21,500 | | | | 91,637 | |
| Raiffeisen Bank International AG (a) | | | 881 | | | | 45,344 | |
| Vienna Insurance Group AG Wiener Versicherung Gruppe (a) | | | 1,323 | | | | 72,720 | |
| (Cost $228,099) | | | | 396,172 | |
| Belgium 1.1% | |
| Ageas | | | 34,376 | | | | 93,218 | |
| Anheuser-Busch InBev NV | | | 3,696 | | | | 214,313 | |
| Compagnie Nationale a Portefeuille* | | | 539 | | | | 38,198 | |
| Delhaize Group | | | 593 | | | | 44,460 | |
| Dexia SA* (a) | | | 10,150 | | | | 31,582 | |
| Groupe Bruxelles Lambert SA (a) | | | 588 | | | | 52,269 | |
| KBC Groep NV (a) | | | 2,458 | | | | 96,553 | |
| Solvay SA (a) | | | 1,159 | | | | 179,084 | |
| Umicore SA | | | 2,235 | | | | 121,819 | |
| (Cost $581,785) | | | | 871,496 | |
| Bermuda 0.1% | |
| Seadrill Ltd. (a) (Cost $31,566) | | | 3,016 | | | | 106,166 | |
| | | Shares | | | Value ($) | |
| | | | | | | | | |
| Canada 11.2% | |
| Agnico-Eagle Mines Ltd. | | | 700 | | | | 44,259 | |
| Alimentation Couche-Tard, Inc. "B" | | | 3,600 | | | | 104,963 | |
| Bank of Montreal | | | 1,300 | | | | 82,695 | |
| Bank of Nova Scotia | | | 2,500 | | | | 150,604 | |
| Barrick Gold Corp. (a) | | | 2,300 | | | | 104,429 | |
| BCE, Inc. (a) | | | 6,300 | | | | 247,049 | |
| Bell Aliant, Inc. | | | 2,300 | | | | 68,491 | |
| Bombardier, Inc. "B" | | | 19,900 | | | | 143,403 | |
| Brookfield Asset Management, Inc. "A" | | | 1,700 | | | | 56,564 | |
| CAE, Inc. | | | 3,800 | | | | 51,260 | |
| Canadian Imperial Bank of Commerce | | | 1,000 | | | | 78,957 | |
| Canadian National Railway Co. (a) | | | 6,400 | | | | 511,894 | |
| Canadian Natural Resources Ltd. | | | 1,800 | | | | 75,456 | |
| Canadian Pacific Railway Ltd. | | | 2,600 | | | | 162,208 | |
| Canadian Tire Corp., Ltd. "A" | | | 1,700 | | | | 111,224 | |
| Canadian Utilities Ltd. "A" | | | 5,900 | | | | 342,701 | |
| CGI Group, Inc. "A"* | | | 11,100 | | | | 274,033 | |
| Empire Co., Ltd. "A" | | | 900 | | | | 52,164 | |
| EnCana Corp. | | | 1,500 | | | | 46,317 | |
| Finning International, Inc. | | | 2,600 | | | | 77,101 | |
| Fortis, Inc. | | | 11,900 | | | | 399,155 | |
| George Weston Ltd. | | | 1,400 | | | | 101,525 | |
| Gildan Activewear, Inc. | | | 2,500 | | | | 88,107 | |
| Goldcorp, Inc. | | | 1,800 | | | | 87,065 | |
| Imperial Oil Ltd. | | | 1,000 | | | | 46,576 | |
| Kinross Gold Corp. | | | 2,300 | | | | 36,320 | |
| Loblaw Companies Ltd. | | | 2,900 | | | | 117,119 | |
| Magna International, Inc. "A" | | | 4,506 | | | | 243,650 | |
| Manulife Financial Corp. | | | 4,700 | | | | 83,235 | |
| Metro, Inc. "A" | | | 2,800 | | | | 139,325 | |
| National Bank of Canada | | | 600 | | | | 48,662 | |
| Open Text Corp.* (a) | | | 2,800 | | | | 179,505 | |
| Potash Corp. of Saskatchewan, Inc. (a) | | | 1,800 | | | | 102,813 | |
| Research In Motion Ltd.* | | | 21,100 | | | | 609,952 | |
| Ritchie Bros. Auctioneers, Inc. (a) | | | 1,600 | | | | 44,062 | |
| Rogers Communications, Inc. "B" (a) | | | 10,900 | | | | 431,615 | |
| Royal Bank of Canada | | | 3,300 | | | | 188,635 | |
| Saputo, Inc. | | | 3,800 | | | | 183,253 | |
| Shaw Communications, Inc. "B" | | | 7,800 | | | | 177,844 | |
| Shoppers Drug Mart Corp. | | | 5,700 | | | | 234,631 | |
| SNC-Lavalin Group, Inc. | | | 2,200 | | | | 134,311 | |
| Sun Life Financial, Inc. | | | 2,000 | | | | 60,242 | |
| Suncor Energy, Inc. | | | 2,420 | | | | 94,848 | |
| Teck Resources Ltd. "B" | | | 1,200 | | | | 60,992 | |
| Telus Corp. | | | 1,600 | | | | 88,092 | |
| Telus Corp. (Non-Voting Shares) (a) | | | 4,000 | | | | 210,773 | |
| Thomson Reuters Corp. (b) | | | 6,100 | | | | 229,023 | |
| Thomson Reuters Corp. (b) | | | 1,158 | | | | 43,494 | |
| Tim Hortons, Inc. | | | 3,600 | | | | 175,773 | |
| Toronto-Dominion Bank | | | 2,100 | | | | 178,068 | |
| TransAlta Corp. | | | 14,500 | | | | 309,560 | |
| Valeant Pharmaceuticals International, Inc. | | | 19,000 | | | | 987,972 | |
| Viterra, Inc. | | | 10,100 | | | | 109,750 | |
| Yellow Media, Inc. (a) | | | 11,800 | | | | 29,364 | |
| (Cost $7,800,152) | | | | 9,041,083 | |
| | | Shares | | | Value ($) | |
| | | | | | | | | |
| Cyprus 0.1% | |
| Bank of Cyprus Public Co., Ltd. (Cost $92,968) | | | 21,752 | | | | 64,190 | |
| Denmark 2.4% | |
| A P Moller-Maersk AS "A" | | | 7 | | | | 57,929 | |
| A P Moller-Maersk AS "B" (a) | | | 15 | | | | 129,424 | |
| Carlsberg AS "B" | | | 4,596 | | | | 500,108 | |
| Coloplast AS "B" (a) | | | 299 | | | | 45,457 | |
| Danske Bank AS* | | | 14,587 | | | | 270,907 | |
| DSV AS | | | 2,622 | | | | 62,917 | |
| Novo Nordisk AS "B" | | | 6,131 | | | | 768,663 | |
| Tryg AS | | | 621 | | | | 35,805 | |
| Vestas Wind Systems AS* | | | 2,251 | | | | 52,331 | |
| William Demant Holding AS* (a) | | | 427 | | | | 38,528 | |
| (Cost $1,426,185) | | | | 1,962,069 | |
| Finland 3.1% | |
| Fortum Oyj | | | 11,788 | | | | 341,390 | |
| Kone Oyj "B" (a) | | | 1,991 | | | | 125,012 | |
| Metso Corp. (a) | | | 1,709 | | | | 97,066 | |
| Nokia Corp. (a) | | | 52,222 | | | | 337,281 | |
| Outokumpu Oyj (a) | | | 7,460 | | | | 98,748 | |
| Pohjola Bank PLC (a) | | | 5,199 | | | | 67,231 | |
| Rautaruukki Oyj | | | 4,708 | | | | 106,371 | |
| Sampo Oyj "A" | | | 9,439 | | | | 304,761 | |
| Stora Enso Oyj "R" (a) | | | 34,707 | | | | 364,145 | |
| UPM-Kymmene Oyj (a) | | | 31,076 | | | | 568,271 | |
| Wartsila Corp. (a) | | | 2,307 | | | | 77,843 | |
| (Cost $1,981,271) | | | | 2,488,119 | |
| France 6.8% | |
| Air Liquide SA (a) | | | 1,503 | | | | 215,443 | |
| Alcatel-Lucent* | | | 19,719 | | | | 113,841 | |
| Atos Origin SA (a) | | | 697 | | | | 39,385 | |
| AXA SA (a) | | | 3,081 | | | | 69,951 | |
| BNP Paribas | | | 1,550 | | | | 119,544 | |
| Bouygues SA | | | 734 | | | | 32,270 | |
| Cap Gemini | | | 1,341 | | | | 78,569 | |
| Carrefour SA* (a) | | | 4,540 | | | | 186,461 | |
| Casino Guichard-Perrachon SA (a) | | | 794 | | | | 74,845 | |
| Compagnie de Saint-Gobain | | | 755 | | | | 48,895 | |
| Credit Agricole SA | | | 1,831 | | | | 27,538 | |
| DANONE SA (a) | | | 4,560 | | | | 340,242 | |
| Dassault Systemes SA | | | 830 | | | | 70,668 | |
| Electricite de France | | | 2,181 | | | | 85,621 | |
| Essilor International SA (a) | | | 3,351 | | | | 271,799 | |
| France Telecom SA (a) | | | 32,122 | | | | 683,342 | |
| GDF Suez | | | 11,364 | | | | 415,887 | |
| Iliad SA (a) | | | 426 | | | | 57,163 | |
| L'Oreal SA (a) | | | 1,857 | | | | 241,195 | |
| Lafarge SA (a) | | | 1,230 | | | | 78,385 | |
| LVMH Moet Hennessy Louis Vuitton SA | | | 420 | | | | 75,591 | |
| Pernod Ricard SA | | | 1,706 | | | | 168,164 | |
| Sanofi | | | 14,584 | | | | 1,172,175 | |
| Schneider Electric SA (a) | | | 447 | | | | 74,681 | |
| Societe Generale | | | 1,069 | | | | 63,361 | |
| Suez Environnement Co. | | | 1,869 | | | | 37,251 | |
| Total SA | | | 6,374 | | | | 368,647 | |
| Unibail-Rodamco SE (REIT) (a) | | | 265 | | | | 61,240 | |
| Vallourec SA (a) | | | 299 | | | | 36,410 | |
| Veolia Environnement | | | 2,754 | | | | 77,594 | |
| Vinci SA | | | 944 | | | | 60,471 | |
| | | Shares | | | Value ($) | |
| | | | | | | | | |
| Vivendi | | | 2,577 | | | | 71,663 | |
| (Cost $4,074,471) | | | | 5,518,292 | |
| Germany 5.9% | |
| Adidas AG | | | 1,331 | | | | 105,575 | |
| Allianz SE (Registered) | | | 1,458 | | | | 203,708 | |
| BASF SE | | | 1,618 | | | | 158,338 | |
| Bayer AG | | | 6,352 | | | | 510,676 | |
| Bayerische Motoren Werke (BMW) AG | | | 2,347 | | | | 233,870 | |
| Beiersdorf AG | | | 2,600 | | | | 168,719 | |
| Commerzbank AG* | | | 10,242 | | | | 44,042 | |
| Continental AG* (a) | | | 632 | | | | 66,356 | |
| Daimler AG (Registered) | | | 6,253 | | | | 470,606 | |
| Deutsche Boerse AG | | | 688 | | | | 52,215 | |
| Deutsche Post AG (Registered) | | | 3,555 | | | | 68,269 | |
| Deutsche Telekom AG (Registered) | | | 48,743 | | | | 764,538 | |
| E.ON AG | | | 7,336 | | | | 208,254 | |
| Fresenius Medical Care AG & Co. KGaA | | | 1,256 | | | | 93,906 | |
| Fresenius SE & Co. KGaA | | | 632 | | | | 65,965 | |
| HeidelbergCement AG | | | 310 | | | | 19,762 | |
| Henkel AG & Co. KGaA | | | 3,480 | | | | 199,452 | |
| Infineon Technologies AG (a) | | | 6,144 | | | | 68,943 | |
| K+S AG | | | 447 | | | | 34,354 | |
| Kabel Deutschland Holding AG* | | | 519 | | | | 31,911 | |
| Linde AG | | | 332 | | | | 58,208 | |
| Merck KGaA | | | 430 | | | | 46,728 | |
| Metro AG | | | 3,345 | | | | 202,494 | |
| Muenchener Rueckversicherungs-Gesellschaft AG (Registered) (a) | | | 598 | | | | 91,294 | |
| RWE AG | | | 1,527 | | | | 84,511 | |
| SAP AG | | | 6,095 | | | | 368,638 | |
| Siemens AG (Registered) (a) | | | 1,513 | | | | 207,742 | |
| Suedzucker AG | | | 2,222 | | | | 78,958 | |
| ThyssenKrupp AG | | | 776 | | | | 40,255 | |
| Volkswagen AG | | | 228 | | | | 41,890 | |
| (Cost $3,401,032) | | | | 4,790,177 | |
| Greece 0.4% | |
| Alpha Bank AE* | | | 13,183 | | | | 66,621 | |
| EFG Eurobank Ergasias* | | | 8,459 | | | | 39,803 | |
| National Bank of Greece SA* | | | 24,508 | | | | 176,087 | |
| (Cost $435,030) | | | | 282,511 | |
| Hong Kong 2.5% | |
| AIA Group Ltd.* | | | 23,000 | | | | 80,197 | |
| Cathay Pacific Airways Ltd. | | | 15,000 | | | | 34,888 | |
| Cheung Kong (Holdings) Ltd. | | | 5,000 | | | | 73,531 | |
| Cheung Kong Infrastructure Holdings Ltd. | | | 7,000 | | | | 36,369 | |
| CLP Holdings Ltd. | | | 27,000 | | | | 239,686 | |
| Esprit Holdings Ltd. | | | 14,495 | | | | 45,153 | |
| Genting Singapore PLC* (a) | | | 178,000 | | | | 280,882 | |
| Hang Seng Bank Ltd. | | | 2,200 | | | | 35,185 | |
| Hong Kong & China Gas Co., Ltd. (a) | | | 56,650 | | | | 128,905 | |
| Hong Kong Exchanges & Clearing Ltd. (a) | | | 3,500 | | | | 73,729 | |
| Hutchison Whampoa Ltd. | | | 31,000 | | | | 336,102 | |
| Li & Fung Ltd. | | | 42,000 | | | | 84,471 | |
| MTR Corp., Ltd. | | | 28,500 | | | | 101,360 | |
| Noble Group Ltd. | | | 29,363 | | | | 47,273 | |
| NWS Holdings Ltd. | | | 30,000 | | | | 40,199 | |
| Power Assets Holdings Ltd. | | | 17,500 | | | | 131,998 | |
| Shangri-La Asia Ltd. (a) | | | 18,000 | | | | 44,424 | |
| | | Shares | | | Value ($) | |
| | | | | | | | | |
| SJM Holdings Ltd. | | | 12,000 | | | | 28,679 | |
| Sun Hung Kai Properties Ltd. | | | 5,000 | | | | 72,777 | |
| Swire Pacific Ltd. "A" | | | 3,500 | | | | 51,700 | |
| Yue Yuen Industrial (Holdings) Ltd. (a) | | | 10,500 | | | | 33,493 | |
| (Cost $1,400,594) | | | | 2,001,001 | |
| Ireland 1.6% | |
| CRH PLC (b) | | | 20,956 | | | | 464,056 | |
| CRH PLC (b) | | | 34,837 | | | | 774,721 | |
| Experian PLC | | | 5,338 | | | | 67,984 | |
| (Cost $1,132,104) | | | | 1,306,761 | |
| Italy 3.4% | |
| A2A SpA | | | 20,926 | | | | 32,578 | |
| Assicurazioni Generali SpA | | | 3,242 | | | | 68,369 | |
| Atlantia SpA | | | 5,777 | | | | 122,987 | |
| Enel Green Power SpA | | | 16,188 | | | | 44,651 | |
| Enel SpA | | | 64,634 | | | | 422,176 | |
| Eni SpA | | | 11,687 | | | | 277,058 | |
| Fiat Industrial SpA* | | | 9,511 | | | | 122,956 | |
| Fiat SpA (a) | | | 12,889 | | | | 141,504 | |
| Finmeccanica SpA | | | 7,959 | | | | 96,320 | |
| Intesa Sanpaolo | | | 32,101 | | | | 85,369 | |
| Luxottica Group SpA | | | 2,649 | | | | 84,916 | |
| Mediaset SpA (a) | | | 10,870 | | | | 51,106 | |
| Pirelli & C. SpA | | | 4,802 | | | | 51,888 | |
| Prysmian SpA | | | 3,602 | | | | 72,453 | |
| Saipem SpA | | | 1,672 | | | | 86,323 | |
| Snam Rete Gas SpA | | | 9,753 | | | | 57,738 | |
| Telecom Italia SpA | | | 337,823 | | | | 470,074 | |
| Telecom Italia SpA (RSP) | | | 223,543 | | | | 260,159 | |
| Terna — Rete Elettrica Nationale SpA | | | 14,939 | | | | 69,420 | |
| UBI Banca — Unione di Banche Italiane ScpA (a) | | | 3,919 | | | | 22,063 | |
| UniCredit SpA | | | 41,574 | | | | 87,934 | |
| (Cost $2,253,559) | | | | 2,728,042 | |
| Japan 12.5% | |
| AEON Co., Ltd. (a) | | | 10,100 | | | | 121,902 | |
| Ajinomoto Co., Inc. | | | 10,000 | | | | 118,916 | |
| Alfresa Holdings Corp. | | | 1,000 | | | | 38,923 | |
| Asahi Breweries Ltd. | | | 5,900 | | | | 118,883 | |
| Asahi Kasei Corp. | | | 7,000 | | | | 47,267 | |
| Astellas Pharma, Inc. | | | 4,800 | | | | 185,603 | |
| Bridgestone Corp. | | | 2,100 | | | | 48,331 | |
| Canon, Inc. | | | 1,800 | | | | 85,836 | |
| Central Japan Railway Co. | | | 3 | | | | 23,580 | |
| Chubu Electric Power Co., Inc. | | | 13,700 | | | | 268,119 | |
| Chugai Pharmaceutical Co., Ltd. | | | 2,900 | | | | 47,579 | |
| Chugoku Electric Power Co., Inc. | | | 6,000 | | | | 104,085 | |
| Dai-ichi Life Insurance Co., Ltd. (a) | | | 35 | | | | 49,006 | |
| Daiichi Sankyo Co., Ltd. | | | 7,900 | | | | 154,523 | |
| Daiwa House Industry Co., Ltd. | | | 2,000 | | | | 25,181 | |
| Daiwa Securities Group, Inc. (a) | | | 10,000 | | | | 44,055 | |
| Denso Corp. | | | 1,100 | | | | 40,842 | |
| East Japan Railway Co. | | | 726 | | | | 41,719 | |
| Eisai Co., Ltd. | | | 2,900 | | | | 113,264 | |
| Electric Power Development Co., Ltd. | | | 2,600 | | | | 70,225 | |
| FamilyMart Co., Ltd. | | | 1,000 | | | | 36,758 | |
| FANUC Corp. | | | 300 | | | | 50,025 | |
| FUJIFILM Holdings Corp. | | | 1,800 | | | | 56,105 | |
| | | Shares | | | Value ($) | |
| | | | | | | | | |
| Hisamitsu Pharmaceutical Co., Inc. (a) | | | 900 | | | | 38,373 | |
| Hitachi Ltd. (a) | | | 9,000 | | | | 53,201 | |
| Hokkaido Electric Power Co., Inc. | | | 3,900 | | | | 64,975 | |
| Hokuriku Electric Power Co. | | | 2,800 | | | | 53,550 | |
| Honda Motor Co., Ltd. | | | 4,600 | | | | 177,301 | |
| HOYA Corp. | | | 1,400 | | | | 31,031 | |
| Idemitsu Kosan Co., Ltd. (a) | | | 400 | | | | 42,724 | |
| INPEX Corp. | | | 21 | | | | 155,037 | |
| Japan Tobacco, Inc. | | | 55 | | | | 212,258 | |
| JFE Holdings, Inc. | | | 2,300 | | | | 63,288 | |
| JX Holdings, Inc. | | | 22,920 | | | | 154,775 | |
| Kansai Electric Power Co., Inc. | | | 14,800 | | | | 295,396 | |
| Kao Corp. | | | 7,300 | | | | 191,850 | |
| KDDI Corp. | | | 40 | | | | 287,804 | |
| Keyence Corp. | | | 100 | | | | 28,361 | |
| Kikkoman Corp. | | | 3,000 | | | | 31,577 | |
| Kirin Holdings Co., Ltd. | | | 12,000 | | | | 167,774 | |
| Komatsu Ltd. | | | 1,300 | | | | 40,447 | |
| Kyocera Corp. | | | 500 | | | | 50,864 | |
| Kyowa Hakko Kirin Co., Ltd. | | | 5,000 | | | | 47,693 | |
| Kyushu Electric Power Co., Inc. | | | 8,100 | | | | 146,057 | |
| Lawson, Inc. (a) | | | 900 | | | | 47,268 | |
| MEIJI Holdings Co., Ltd. | | | 1,200 | | | | 50,569 | |
| Miraca Holdings, Inc. | | | 1,000 | | | | 40,570 | |
| Mitsubishi Chemical Holdings Corp. | | | 6,500 | | | | 46,110 | |
| Mitsubishi Corp. | | | 2,400 | | | | 60,132 | |
| Mitsubishi Estate Co., Ltd. | | | 5,000 | | | | 87,774 | |
| Mitsubishi Tanabe Pharma Corp. | | | 3,000 | | | | 50,335 | |
| Mitsubishi UFJ Financial Group, Inc. | | | 48,300 | | | | 235,138 | |
| Mitsui & Co., Ltd. | | | 3,200 | | | | 55,338 | |
| Mitsui Fudosan Co., Ltd. | | | 3,000 | | | | 51,721 | |
| Mitsui O.S.K Lines Ltd. | | | 7,000 | | | | 37,670 | |
| Mizuho Financial Group, Inc. | | | 77,200 | | | | 127,273 | |
| MS&AD Insurance Group Holdings, Inc. | | | 2,400 | | | | 56,294 | |
| Nintendo Co., Ltd. | | | 200 | | | | 37,664 | |
| Nippon Meat Packers, Inc. | | | 3,000 | | | | 43,015 | |
| Nippon Steel Corp. (a) | | | 21,000 | | | | 68,150 | |
| Nippon Telegraph & Telephone Corp. | | | 6,809 | | | | 331,091 | |
| Nishi-Nippon City Bank Ltd. | | | 13,000 | | | | 38,489 | |
| Nissan Motor Co., Ltd. | | | 6,000 | | | | 62,984 | |
| Nisshin Seifun Group, Inc. | | | 3,000 | | | | 37,483 | |
| Nissin Foods Holdings Co., Ltd. | | | 700 | | | | 25,475 | |
| NKSJ Holdings, Inc. | | | 7,000 | | | | 46,185 | |
| Nomura Holdings, Inc. (a) | | | 12,000 | | | | 59,371 | |
| NTT DoCoMo, Inc. | | | 213 | | | | 379,980 | |
| Olympus Corp. (a) | | | 2,900 | | | | 97,743 | |
| Ono Pharmaceutical Co., Ltd. | | | 1,200 | | | | 64,058 | |
| Oriental Land Co., Ltd. | | | 500 | | | | 42,384 | |
| Osaka Gas Co., Ltd. | | | 30,000 | | | | 113,951 | |
| Otsuka Holdings Co., Ltd. | | | 2,000 | | | | 53,019 | |
| Panasonic Corp. | | | 4,600 | | | | 56,210 | |
| Resona Holdings, Inc. | | | 6,900 | | | | 32,494 | |
| Santen Pharmaceutical Co., Ltd. | | | 1,000 | | | | 40,651 | |
| Seven & I Holdings Co., Ltd. | | | 10,200 | | | | 274,399 | |
| Sharp Corp. | | | 3,000 | | | | 27,361 | |
| Shikoku Electric Power Co., Inc. | | | 3,800 | | | | 86,316 | |
| Shin-Etsu Chemical Co., Ltd. | | | 1,500 | | | | 80,459 | |
| Shionogi & Co., Ltd. | | | 4,200 | | | | 68,804 | |
| Shiseido Co., Ltd. | | | 5,000 | | | | 93,508 | |
| SOFTBANK Corp. (a) | | | 11,900 | | | | 450,710 | |
| Sony Corp. | | | 2,100 | | | | 55,586 | |
| | | Shares | | | Value ($) | |
| | | | | | | | | |
| Sumitomo Chemical Co., Ltd. | | | 10,000 | | | | 49,946 | |
| Sumitomo Corp. | | | 4,200 | | | | 57,246 | |
| Sumitomo Mitsui Financial Group, Inc. | | | 5,200 | | | | 160,035 | |
| Sumitomo Mitsui Trust Holdings, Inc. | | | 13,410 | | | | 46,782 | |
| Sumitomo Realty & Development Co., Ltd. (a) | | | 2,000 | | | | 44,714 | |
| Suzuken Co., Ltd. | | | 1,300 | | | | 30,043 | |
| Sysmex Corp. | | | 1,200 | | | | 45,137 | |
| T&D Holdings, Inc. | | | 1,800 | | | | 42,760 | |
| Taisho Pharmaceutical Co., Ltd. (a) | | | 2,000 | | | | 45,090 | |
| Takeda Pharmaceutical Co., Ltd. | | | 8,200 | | | | 379,258 | |
| Terumo Corp. | | | 2,000 | | | | 108,077 | |
| Tohoku Electric Power Co., Inc. | | | 9,100 | | | | 131,295 | |
| Tokio Marine Holdings, Inc. | | | 2,200 | | | | 61,807 | |
| Tokyo Electric Power Co., Inc. (a) | | | 29,000 | | | | 119,118 | |
| Tokyo Gas Co., Ltd. | | | 50,000 | | | | 226,183 | |
| TonenGeneral Sekiyu KK (a) | | | 4,000 | | | | 49,183 | |
| Toray Industries, Inc. (a) | | | 6,000 | | | | 44,404 | |
| Toshiba Corp. | | | 8,000 | | | | 42,340 | |
| Toyo Suisan Kaisha Ltd. | | | 1,000 | | | | 23,636 | |
| Toyota Motor Corp. | | | 7,400 | | | | 311,561 | |
| Tsumura & Co. | | | 1,500 | | | | 47,994 | |
| Unicharm Corp. | | | 1,500 | | | | 65,552 | |
| Yakult Honsha Co., Ltd. (a) | | | 1,700 | | | | 49,219 | |
| (Cost $8,842,471) | | | | 10,120,175 | |
| Luxembourg 0.4% | |
| ArcelorMittal | | | 4,154 | | | | 144,548 | |
| Millicom International Cellular SA (SDR) (a) | | | 1,194 | | | | 124,575 | |
| Tenaris SA | | | 2,802 | | | | 63,976 | |
| (Cost $178,537) | | | | 333,099 | |
| Macau 0.1% | |
| Sands China Ltd.* | | | 20,800 | | | | 56,404 | |
| Wynn Macau Ltd. (a) | | | 13,600 | | | | 44,895 | |
| (Cost $50,091) | | | | 101,299 | |
| Netherlands 6.3% | |
| AEGON NV* (a) | | | 10,987 | | | | 74,879 | |
| Akzo Nobel NV | | | 2,534 | | | | 159,852 | |
| ASML Holding NV (a) | | | 30,585 | | | | 1,126,829 | |
| Fugro NV (CVA) | | | 2,406 | | | | 173,486 | |
| Heineken Holding NV | | | 913 | | | | 46,721 | |
| Heineken NV | | | 3,364 | | | | 202,334 | |
| ING Groep NV (CVA)* | | | 19,810 | | | | 244,362 | |
| Koninklijke (Royal) KPN NV | | | 49,296 | | | | 716,570 | |
| Koninklijke Ahold NV (a) | | | 14,948 | | | | 200,864 | |
| Koninklijke DSM NV | | | 1,774 | | | | 115,137 | |
| Koninklijke Philips Electronics NV | | | 6,373 | | | | 163,558 | |
| PostNL NV | | | 2,825 | | | | 23,970 | |
| Randstad Holding NV (a) | | | 918 | | | | 42,426 | |
| Reed Elsevier NV | | | 35,902 | | | | 482,147 | |
| Royal Dutch Shell PLC "A" | | | 3,949 | | | | 140,712 | |
| Royal Dutch Shell PLC "B" | | | 3,179 | | | | 113,479 | |
| SBM Offshore NV | | | 6,192 | | | | 163,794 | |
| TNT Express NV* | | | 3,139 | | | | 32,556 | |
| Unilever NV (CVA) | | | 16,399 | | | | 537,232 | |
| Wolters Kluwer NV (a) | | | 15,248 | | | | 337,887 | |
| (Cost $4,003,221) | | | | 5,098,795 | |
| Norway 1.7% | |
| Aker Solutions ASA | | | 1,915 | | | | 38,337 | |
| DnB NOR ASA | | | 16,840 | | | | 234,735 | |
| | | Shares | | | Value ($) | |
| | | | | | | | | |
| Norsk Hydro ASA (a) | | | 22,115 | | | | 169,337 | |
| Statoil ASA | | | 8,941 | | | | 226,392 | |
| Telenor ASA | | | 28,434 | | | | 465,653 | |
| Yara International ASA | | | 3,979 | | | | 224,895 | |
| (Cost $697,313) | | | | 1,359,349 | |
| Portugal 0.7% | |
| EDP — Energias de Portugal SA (Cost $536,855) | | | 152,492 | | | | 541,380 | |
| Singapore 2.5% | |
| CapitaLand Ltd. (a) | | | 20,000 | | | | 47,564 | |
| DBS Group Holdings Ltd. | | | 10,000 | | | | 119,696 | |
| Fraser & Neave Ltd. | | | 15,000 | | | | 70,815 | |
| Golden Agri-Resources Ltd. | | | 173,000 | | | | 96,143 | |
| Hutchison Port Holdings Trust (Units)* | | | 63,000 | | | | 53,324 | |
| Jardine Cycle & Carriage Ltd. | | | 3,000 | | | | 105,440 | |
| Keppel Corp., Ltd. | | | 15,400 | | | | 139,343 | |
| Olam International Ltd. | | | 35,000 | | | | 77,833 | |
| Oversea-Chinese Banking Corp., Ltd. | | | 14,000 | | | | 106,834 | |
| SembCorp Industries Ltd. | | | 19,000 | | | | 77,475 | |
| SembCorp Marine Ltd. | | | 8,000 | | | | 34,661 | |
| Singapore Airlines Ltd. | | | 6,000 | | | | 69,361 | |
| Singapore Exchange Ltd. (a) | | | 7,000 | | | | 42,973 | |
| Singapore Press Holdings Ltd. | | | 37,000 | | | | 117,602 | |
| Singapore Technologies Engineering Ltd. | | | 15,000 | | | | 36,889 | |
| Singapore Telecommunications Ltd. | | | 185,000 | | | | 476,375 | |
| United Overseas Bank Ltd. | | | 7,000 | | | | 112,465 | |
| Wilmar International Ltd. | | | 47,000 | | | | 207,801 | |
| (Cost $1,316,141) | | | | 1,992,594 | |
| Spain 3.5% | |
| Abertis Infraestructuras SA (a) | | | 4,785 | | | | 106,901 | |
| Acciona SA (a) | | | 263 | | | | 27,915 | |
| ACS, Actividades de Construccion y Servicios SA (a) | | | 2,437 | | | | 114,931 | |
| Banco Bilbao Vizcaya Argentaria SA (a) | | | 7,473 | | | | 87,589 | |
| Banco Santander SA | | | 14,432 | | | | 166,523 | |
| EDP Renovaveis SA* | | | 17,487 | | | | 115,363 | |
| Enagas (a) | | | 2,258 | | | | 54,754 | |
| Ferrovial SA (a) | | | 7,222 | | | | 91,193 | |
| Gas Natural SDG SA | | | 2,049 | | | | 42,959 | |
| Iberdrola Renovables SA (a) | | | 11,066 | | | | 48,882 | |
| Iberdrola SA* | | | 39,318 | | | | 349,930 | |
| Industria de Diseno Textil SA | | | 2,942 | | | | 268,654 | |
| Mediaset Espana Comunicacion SA (a) | | | 2,352 | | | | 20,435 | |
| Red Electrica Corporacion SA | | | 1,144 | | | | 69,129 | |
| Repsol YPF SA (a) | | | 12,042 | | | | 418,084 | |
| Telefonica SA (a) | | | 31,343 | | | | 766,460 | |
| Zardoya Otis SA | | | 3,050 | | | | 44,918 | |
| (Cost $2,016,364) | | | | 2,794,620 | |
| Sweden 2.4% | |
| Assa Abloy AB "B" | | | 1,207 | | | | 32,440 | |
| Atlas Copco AB "A" | | | 2,084 | | | | 54,862 | |
| Boliden AB | | | 5,037 | | | | 93,111 | |
| Electrolux AB "B" (a) | | | 1,929 | | | | 46,030 | |
| Hennes & Mauritz AB "B" (a) | | | 5,804 | | | | 200,029 | |
| Holmen AB "B" | | | 1,214 | | | | 37,849 | |
| Husqvarna AB "B" | | | 4,852 | | | | 32,108 | |
| Modern Times Group "B" (a) | | | 537 | | | | 35,482 | |
| Nordea Bank AB | | | 10,270 | | | | 110,358 | |
| | | Shares | | | Value ($) | |
| | | | | | | | | |
| Sandvik AB (a) | | | 3,095 | | | | 54,268 | |
| Skandinaviska Enskilda Banken AB "A" | | | 6,486 | | | | 53,018 | |
| Skanska AB "B" | | | 1,724 | | | | 30,855 | |
| SKF AB "B" (a) | | | 1,279 | | | | 37,006 | |
| SSAB AB "A" | | | 2,870 | | | | 42,904 | |
| Svenska Cellulosa AB "B" (a) | | | 9,672 | | | | 136,190 | |
| Svenska Handelsbanken AB "A" | | | 2,807 | | | | 86,585 | |
| Swedbank AB "A" | | | 2,295 | | | | 38,546 | |
| Tele2 AB "B" (a) | | | 4,023 | | | | 79,508 | |
| Telefonaktiebolaget LM Ericsson "B" | | | 34,517 | | | | 496,442 | |
| TeliaSonera AB (a) | | | 28,839 | | | | 211,562 | |
| Volvo AB "B" | | | 3,948 | | | | 68,976 | |
| (Cost $1,263,795) | | | | 1,978,129 | |
| Switzerland 6.6% | |
| ABB Ltd. (Registered)* | | | 7,290 | | | | 189,039 | |
| Adecco SA (Registered)* (a) | | | 824 | | | | 52,830 | |
| Compagnie Financiere Richemont SA "A" | | | 3,148 | | | | 206,140 | |
| Credit Suisse Group AG (Registered)* | | | 1,994 | | | | 77,503 | |
| Geberit AG (Registered)* (a) | | | 246 | | | | 58,288 | |
| Givaudan SA (Registered)* (a) | | | 61 | | | | 64,537 | |
| Holcim Ltd. (Registered)* | | | 1,480 | | | | 111,695 | |
| Lonza Group AG (Registered)* | | | 466 | | | | 36,471 | |
| Nestle SA (Registered) (a) | | | 19,933 | | | | 1,238,821 | |
| Novartis AG (Registered) (a) | | | 10,620 | | | | 650,554 | |
| Roche Holding AG (Genusschein) | | | 3,411 | | | | 570,657 | |
| Sika AG (a) | | | 19 | | | | 45,780 | |
| Sonova Holding AG (Registered)* | | | 289 | | | | 27,052 | |
| STMicroelectronics NV (a) | | | 5,378 | | | | 53,599 | |
| Swatch Group AG (Bearer) (a) | | | 214 | | | | 107,971 | |
| Swiss Re Ltd.* (a) | | | 723 | | | | 40,598 | |
| Swisscom AG (Registered) | | | 2,899 | | | | 1,328,580 | |
| Syngenta AG (Registered)* | | | 467 | | | | 157,650 | |
| UBS AG (Registered)* | | | 6,394 | | | | 116,595 | |
| Wolseley PLC | | | 1,218 | | | | 39,725 | |
| Xstrata PLC | | | 2,858 | | | | 63,030 | |
| Zurich Financial Services AG* | | | 398 | | | | 100,593 | |
| (Cost $3,085,191) | | | | 5,337,708 | |
| United Kingdom 6.9% | |
| Anglo American PLC | | | 1,947 | | | | 96,489 | |
| ARM Holdings PLC | | | 26,763 | | | | 253,113 | |
| AstraZeneca PLC | | | 8,743 | | | | 436,553 | |
| Autonomy Corp. PLC* | | | 4,292 | | | | 117,592 | |
| BAE Systems PLC | | | 10,946 | | | | 55,957 | |
| Barclays PLC | | | 8,467 | | | | 34,852 | |
| BG Group PLC | | | 3,267 | | | | 74,146 | |
| BHP Billiton PLC | | | 3,282 | | | | 128,640 | |
| BP PLC | | | 18,151 | | | | 133,736 | |
| British American Tobacco PLC | | | 3,987 | | | | 174,764 | |
| British Sky Broadcasting Group PLC | | | 4,941 | | | | 67,107 | |
| BT Group PLC | | | 44,070 | | | | 142,948 | |
| Burberry Group PLC | | | 1,367 | | | | 31,783 | |
| Capita Group PLC | | | 2,676 | | | | 30,731 | |
| Centrica PLC | | | 43,037 | | | | 223,322 | |
| Compass Group PLC | | | 7,663 | | | | 73,919 | |
| Diageo PLC | | | 4,423 | | | | 90,371 | |
| GlaxoSmithKline PLC | | | 32,547 | | | | 696,853 | |
| HSBC Holdings PLC | | | 12,924 | | | | 128,213 | |
| Imperial Tobacco Group PLC | | | 1,820 | | | | 60,512 | |
| | | Shares | | | Value ($) | |
| | | | | | | | | |
| Inmarsat PLC | | | 3,673 | | | | 32,787 | |
| International Consolidated Airlines Group SA* (a) | | | 9,009 | | | | 36,532 | |
| International Power PLC | | | 9,966 | | | | 51,458 | |
| Kingfisher PLC | | | 9,477 | | | | 40,644 | |
| Lloyds Banking Group PLC* | | | 35,330 | | | | 27,761 | |
| Marks & Spencer Group PLC | | | 6,157 | | | | 35,714 | |
| National Grid PLC | | | 28,023 | | | | 275,766 | |
| Next PLC (a) | | | 876 | | | | 32,715 | |
| Pearson PLC | | | 2,885 | | | | 54,649 | |
| Reckitt Benckiser Group PLC | | | 1,170 | | | | 64,600 | |
| Reed Elsevier PLC (a) | | | 4,792 | | | | 43,580 | |
| Rio Tinto PLC | | | 2,033 | | | | 146,802 | |
| Rolls-Royce Holdings PLC* | | | 6,738 | | | | 69,756 | |
| SABMiller PLC | | | 1,731 | | | | 63,109 | |
| Scottish & Southern Energy PLC | | | 7,747 | | | | 173,278 | |
| Severn Trent PLC | | | 2,133 | | | | 50,361 | |
| Shire PLC | | | 4,174 | | | | 130,303 | |
| Smith & Nephew PLC | | | 6,163 | | | | 65,751 | |
| Smiths Group PLC | | | 1,710 | | | | 32,963 | |
| Standard Chartered PLC | | | 1,687 | | | | 44,330 | |
| Subsea 7 SA* (a) | | | 1,418 | | | | 36,273 | |
| Tesco PLC | | | 15,136 | | | | 97,756 | |
| The Sage Group PLC | | | 30,436 | | | | 141,129 | |
| Unilever PLC | | | 1,529 | | | | 49,342 | |
| United Utilities Group PLC | | | 6,323 | | | | 60,751 | |
| Vodafone Group PLC | | | 225,520 | | | | 599,349 | |
| William Morrison Supermarkets PLC (a) | | | 8,072 | | | | 38,569 | |
| WPP PLC | | | 4,824 | | | | 60,395 | |
| (Cost $3,922,681) | | | | 5,608,024 | |
Total Common Stocks (Cost $52,699,425) | | | | 69,800,124 | |
| | |
| Preferred Stocks 0.8% | |
| Germany | |
| Bayerische Motoren Werke (BMW) AG | | | 634 | | | | 40,299 | |
| Henkel AG & Co. KGaA (a) | | | 4,546 | | | | 315,176 | |
| Porsche Automobil Holding SE | | | 1,116 | | | | 88,523 | |
| Volkswagen AG (a) | | | 1,019 | | | | 210,092 | |
Total Preferred Stocks (Cost $379,528) | | | | 654,090 | |
| | |
| Exchange-Traded Funds 10.3% | |
| Emerging Markets | |
| iShares MSCI Emerging Markets Index Fund (a) | | | 86,500 | | | | 4,117,400 | |
| Vanguard MSCI Emerging Markets Fund | | | 85,600 | | | | 4,161,872 | |
Total Exchange-Traded Funds (Cost $5,737,007) | | | | 8,279,272 | |
| | |
| Securities Lending Collateral 20.0% | |
| Daily Assets Fund Institutional, 0.13% (c) (d) (Cost $16,119,202) | | | 16,119,202 | | | | 16,119,202 | |
| | |
| Cash Equivalents 1.8% | |
| Central Cash Management Fund, 0.11% (d) (Cost $1,487,886) | | | 1,487,886 | | | | 1,487,886 | |
| | | % of Net Assets | | | Value ($) | |
| | | | |
Total Investment Portfolio (Cost $76,423,048)+ | | | 119.3 | | | | 96,340,574 | |
| Other Assets and Liabilities, Net | | | (19.3 | ) | | | (15,571,952 | ) |
| Net Assets | | | 100.0 | | | | 80,768,622 | |
* Non-income producing security.
+ The cost for federal income tax purposes was $76,885,148. At June 30, 2011, net unrealized appreciation for all securities based on tax cost was $19,455,426. This consisted of aggregate gross unrealized appreciation for all securities in which there was an excess of value over tax cost of $21,520,593 and aggregate gross unrealized depreciation for all securities in which there was an excess of tax cost over value of $2,065,167.
(a) All or a portion of these securities were on loan (see Notes to Financial Statements). The value of all securities loaned at June 30, 2011 amounted to $15,630,453, which is 19.4% of net assets.
(b) Securities with the same description are the same corporate entity but trade on different stock exchanges.
(c) Affiliated fund managed by Deutsche Investment Management Americas Inc. The rate shown is the annualized seven-day yield at period end.
(d) Represents collateral held in connection with securities lending. Income earned by the Fund is net of borrower rebates.
CVA: Certificaten Van Aandelen
MSCI: Morgan Stanley Capital International
REIT: Real Estate Investment Trust
RSP: Risparmio (Convertible Savings Shares)
SDR: Swedish Depositary Receipt
At June 30, 2011, open futures contracts purchased were as follows:
| Futures | Currency | Expiration Date | | Contracts | | | Notional Value ($) | | | Unrealized Appreciation ($) | |
| ASX SPI 200 Index | AUD | 9/15/2011 | | | 2 | | | | 246,740 | | | | 912 | |
| DJ Euro Stoxx 50 Index | EUR | 9/16/2011 | | | 29 | | | | 1,197,708 | | | | 25,233 | |
| FTSE 100 Index | GBP | 9/16/2011 | | | 1 | | | | 94,732 | | | | 1,990 | |
| Nikkei 225 Index | USD | 9/8/2011 | | | 6 | | | | 297,000 | | | | 15,150 | |
| S&P TSX 60 Index | CAD | 9/15/2011 | | | 1 | | | | 158,059 | | | | 4,286 | |
| Total net unrealized appreciation | | | | 47,571 | |
| Currency Abbreviations |
AUD Australian Dollar CAD Canadian Dollar EUR Euro GBP British Pound USD United States Dollar |
For information on the Fund's policy and additional disclosures regarding futures contracts, please refer to Note B in the accompanying Notes to Financial Statements.
Fair Value Measurements
Various inputs are used in determining the value of the Fund's investments. These inputs are summarized in three broad levels. Level 1 includes quoted prices in active markets for identical securities. Level 2 includes other significant observable inputs (including quoted prices for similar securities, interest rates, prepayment speeds, and credit risk). Level 3 includes significant unobservable inputs (including the Fund's own assumptions in determining the fair value of investments). The inputs or methodology used for valuing securities are not necessarily an indication of the risk associated with investing in those securities.
The following is a summary of the inputs used as of June 30, 2011 in valuing the Fund's investments. For information on the Fund's policy regarding the valuation of investments, please refer to the Security Valuation section of Note A in the accompanying Notes to Financial Statements.
| Assets | | Level 1 | | | Level 2 | | | Level 3 | | | Total | |
| | |
| Common and Preferred Stocks (e) | | | | | | | | | | | | |
| Australia | | $ | — | | | $ | 2,978,873 | | | $ | — | | | $ | 2,978,873 | |
| Austria | | | — | | | | 396,172 | | | | — | | | | 396,172 | |
| Belgium | | | — | | | | 871,496 | | | | — | | | | 871,496 | |
| Bermuda | | | — | | | | 106,166 | | | | — | | | | 106,166 | |
| Canada | | | 8,997,589 | | | | 43,494 | | | | — | | | | 9,041,083 | |
| Cyprus | | | — | | | | 64,190 | | | | — | | | | 64,190 | |
| Denmark | | | — | | | | 1,962,069 | | | | — | | | | 1,962,069 | |
| Finland | | | — | | | | 2,488,119 | | | | — | | | | 2,488,119 | |
| France | | | — | | | | 5,518,292 | | | | — | | | | 5,518,292 | |
| Germany | | | — | | | | 5,444,267 | | | | — | | | | 5,444,267 | |
| Greece | | | — | | | | 282,511 | | | | — | | | | 282,511 | |
| Hong Kong | | | — | | | | 2,001,001 | | | | — | | | | 2,001,001 | |
| Ireland | | | — | | | | 1,306,761 | | | | — | | | | 1,306,761 | |
| Italy | | | — | | | | 2,728,042 | | | | — | | | | 2,728,042 | |
| Japan | | | — | | | | 10,120,175 | | | | — | | | | 10,120,175 | |
| Luxembourg | | | — | | | | 333,099 | | | | — | | | | 333,099 | |
| Macau | | | — | | | | 101,299 | | | | — | | | | 101,299 | |
| Netherlands | | | — | | | | 5,098,795 | | | | — | | | | 5,098,795 | |
| Norway | | | — | | | | 1,359,349 | | | | — | | | | 1,359,349 | |
| Portugal | | | — | | | | 541,380 | | | | — | | | | 541,380 | |
| Singapore | | | — | | | | 1,992,594 | | | | — | | | | 1,992,594 | |
| Spain | | | — | | | | 2,794,620 | | | | — | | | | 2,794,620 | |
| Sweden | | | — | | | | 1,978,129 | | | | — | | | | 1,978,129 | |
| Switzerland | | | — | | | | 5,337,708 | | | | — | | | | 5,337,708 | |
| United Kingdom | | | — | | | | 5,608,024 | | | | — | | | | 5,608,024 | |
| Exchange-Traded Funds | | | 8,279,272 | | | | — | | | | — | | | | 8,279,272 | |
| Short-Term Investments (e) | | | 17,607,088 | | | | — | | | | — | | | | 17,607,088 | |
| Derivatives (f) | | | 47,571 | | | | — | | | | — | | | | 47,571 | |
| Total | | $ | 34,931,520 | | | $ | 61,456,625 | | | $ | — | | | $ | 96,388,145 | |
(e) See Investment Portfolio for additional detailed categorizations.
(f) Derivatives include unrealized appreciation (depreciation) on open futures contracts.
The accompanying notes are an integral part of the financial statements.
Statement of Assets and Liabilities | as of June 30, 2011 (Unaudited) | |
| Assets | |
Investments: Investments in non-affiliated securities, at value (cost $58,815,960) — including $15,630,453 of securities loaned | | $ | 78,733,486 | |
Investment in Daily Assets Fund Institutional (cost $16,119,202)* | | | 16,119,202 | |
| Investment in Central Cash Management Fund (cost $1,487,886) | | | 1,487,886 | |
| Total investments in securities, at value (cost $76,423,048) | | | 96,340,574 | |
| Foreign currency, at value (cost $351,694) | | | 357,499 | |
| Deposits with broker for futures contracts | | | 215,092 | |
| Receivable for investments sold | | | 1,576 | |
| Dividends receivable | | | 108,314 | |
| Interest receivable | | | 21,800 | |
| Receivable for daily variation margin on futures contracts | | | 47,571 | |
| Foreign taxes recoverable | | | 33,701 | |
| Other assets | | | 450 | |
| Total assets | | | 97,126,577 | |
| Liabilities | |
| Payable upon return of securities loaned | | | 16,119,202 | |
| Payable for Fund shares redeemed | | | 114,110 | |
| Accrued management fee | | | 53,352 | |
| Other accrued expenses and payables | | | 71,291 | |
| Total liabilities | | | 16,357,955 | |
| Net assets, at value | | $ | 80,768,622 | |
| Net Assets Consist of | |
| Undistributed net investment income | | | 1,189,359 | |
Net unrealized appreciation (depreciation) on: Investments | | | 19,917,526 | |
| Futures | | | 47,571 | |
| Foreign currency | | | 8,877 | |
| Accumulated net realized gain (loss) | | | (64,672,730 | ) |
| Paid-in capital | | | 124,278,019 | |
| Net assets, at value | | $ | 80,768,622 | |
Class A Net Asset Value, offering and redemption price per share ($80,768,622 ÷ 9,697,843 outstanding shares of beneficial interest, no par value, unlimited number of shares authorized) | | $ | 8.33 | |
* Represents collateral of securities loaned.
The accompanying notes are an integral part of the financial statements.
Statement of Operations
| for the six months ended June 30, 2011 (Unaudited) | |
| Investment Income | |
Income: Dividends (net of foreign taxes withheld of $206,252) | | $ | 1,718,393 | |
| Interest | | | 1,060 | |
| Income distributions — Central Cash Management Fund | | | 1,186 | |
| Securities lending income, including income from Daily Assets Fund Institutional, net of borrower rebates | | | 57,573 | |
| Other income | | | 211 | |
| Total income | | | 1,778,423 | |
Expenses: Management fee | | | 268,394 | |
| Administration fee | | | 41,291 | |
| Services to shareholders | | | 955 | |
| Custodian fee | | | 32,697 | |
| Legal fees | | | 4,276 | |
| Audit and tax fees | | | 29,044 | |
| Reports to shareholders | | | 15,290 | |
| Trustees' fees and expenses | | | 2,798 | |
| Other | | | 19,024 | |
| Total expenses | | | 413,769 | |
| Net investment income (loss) | | | 1,364,654 | |
| Realized and Unrealized Gain (Loss) | |
Net realized gain (loss) from: Investments | | | 4,917,960 | |
| Futures | | | (53,965 | ) |
| Foreign currency | | | 28,588 | |
| | | | 4,892,583 | |
Change in net unrealized appreciation (depreciation) on: Investments | | | (2,308,200 | ) |
| Futures | | | 86,598 | |
| Foreign currency | | | 6,495 | |
| | | | (2,215,107 | ) |
| Net gain (loss) | | | 2,677,476 | |
| Net increase (decrease) in net assets resulting from operations | | $ | 4,042,130 | |
The accompanying notes are an integral part of the financial statements.
Statement of Changes in Net Assets | Increase (Decrease) in Net Assets | | Six Months Ended June 30, 2011 (Unaudited) | | | Year Ended December 31, 2010 | |
Operations: Net investment income (loss) | | $ | 1,364,654 | | | $ | 1,519,774 | |
| Net realized gain (loss) | | | 4,892,583 | | | | 3,056,365 | |
| Change in net unrealized appreciation (depreciation) | | | (2,215,107 | ) | | | 3,397,247 | |
| Net increase (decrease) in net assets resulting from operations | | | 4,042,130 | | | | 7,973,386 | |
Distributions to shareholders from: Net investment income: Class A | | | (1,512,225 | ) | | | (1,843,687 | ) |
| Total distributions | | | (1,512,225 | ) | | | (1,843,687 | ) |
Fund share transactions: Class A Proceeds from shares sold | | | 1,623,224 | | | | 3,841,591 | |
| Reinvestment of distributions | | | 1,512,225 | | | | 1,843,687 | |
| Payments for shares redeemed | | | (8,069,165 | ) | | | (14,779,706 | ) |
| Net increase (decrease) in net assets from Class A share transactions | | | (4,933,716 | ) | | | (9,094,428 | ) |
| Increase (decrease) in net assets | | | (2,403,811 | ) | | | (2,964,729 | ) |
| Net assets at beginning of period | | | 83,172,433 | | | | 86,137,162 | |
| Net assets at end of period (including undistributed net investment income of $1,189,359 and $1,336,930, respectively) | | $ | 80,768,622 | | | $ | 83,172,433 | |
| Other Information | |
Class A Shares outstanding at beginning of period | | | 10,297,508 | | | | 11,562,525 | |
| Shares sold | | | 195,055 | | | | 508,055 | |
| Shares issued to shareholders in reinvestment of distributions | | | 175,432 | | | | 252,215 | |
| Shares redeemed | | | (970,152 | ) | | | (2,025,287 | ) |
| Net increase (decrease) in Class A shares | | | (599,665 | ) | | | (1,265,017 | ) |
| Shares outstanding at end of period | | | 9,697,843 | | | | 10,297,508 | |
The accompanying notes are an integral part of the financial statements.
| | | | | Years Ended December 31, | |
| Class A | | Six Months Ended 6/30/11 (Unaudited) | 2010 | | 2009 | | | 2008 | | | 2007 | | | 2006 | |
| Selected Per Share Data | |
| Net asset value, beginning of period | | $ | 8.08 | | | $ | 7.45 | | | $ | 6.22 | | | $ | 16.76 | | | $ | 16.31 | | | $ | 13.25 | |
Income (loss) from investment operations: Net investment incomea | | | .14 | | | | .14 | | | | .12 | | | | .33 | d | | | .25 | | | | .24 | b |
| Net realized and unrealized gain (loss) | | | .26 | | | | .66 | | | | 1.51 | | | | (6.67 | ) | | | 2.24 | | | | 3.11 | |
| Total from investment operations | | | .40 | | | | .80 | | | | 1.63 | | | | (6.34 | ) | | | 2.49 | | | | 3.35 | |
Less distributions from: Net investment income | | | (.15 | ) | | | (.17 | ) | | | (.40 | ) | | | (.13 | ) | | | (.46 | ) | | | (.29 | ) |
| Net realized gains | | | — | | | | — | | | | — | | | | (4.07 | ) | | | (1.58 | ) | | | — | |
| Total distributions | | | (.15 | ) | | | (.17 | ) | | | (.40 | ) | | | (4.20 | ) | | | (2.04 | ) | | | (.29 | ) |
| Net asset value, end of period | | $ | 8.33 | | | $ | 8.08 | | | $ | 7.45 | | | $ | 6.22 | | | $ | 16.76 | | | $ | 16.31 | |
| Total Return (%) | | | 4.93 | ** | | | 10.93 | | | | 29.36 | | | | (48.81 | )c,e | | | 16.71 | | | | 25.56 | |
| Ratios to Average Net Assets and Supplemental Data | |
| Net assets, end of period ($ millions) | | | 81 | | | | 83 | | | | 86 | | | | 91 | | | | 236 | | | | 223 | |
| Ratio of expenses before expense reductions (%) | | | 1.00 | * | | | .99 | | | | .94 | | | | 1.02 | | | | .93 | | | | .88 | |
| Ratio of expenses after expense reductions (%) | | | 1.00 | * | | | .99 | | | | .94 | | | | 1.01 | | | | .93 | | | | .88 | |
| Ratio of net investment income (%) | | | 1.64 | f** | | | 1.90 | | | | 1.89 | | | | 3.04 | d | | | 1.53 | | | | 1.65 | b |
| Portfolio turnover rate (%) | | | 19 | ** | | | 14 | | | | 139 | | | | 132 | | | | 117 | | | | 122 | |
a Based on average shares outstanding during the period. b Net investment income per share and the ratio of net investment income without non-recurring dividend income amounting to $0.20 per share and 1.39% of average daily net assets, respectively. c Total return would have been lower had certain expenses not been reimbursed. d Net investment income per share and ratio of net investment income include non-recurring dividend income amounting to $0.16 per share and 1.49% of average daily net assets, respectively. e Includes a reimbursement from the Advisor to reimburse the effect of losses incurred as the result of certain operation errors during the period. Excluding this reimbursement, total return would have been 0.14% lower. f The ratio for the six months ended June 30, 2011 has not been annualized since the Fund believes it would not be appropriate because the Fund's dividend income is not earned ratably throughout the fiscal year. * Annualized ** Not annualized | |
Notes to Financial Statements (Unaudited)
A. Organization and Significant Accounting Policies
DWS Diversified International Equity VIP (the "Fund") is a diversified series of DWS Variable Series II (the "Trust"), which is registered under the Investment Company Act of 1940, as amended (the "1940 Act"), as an open-end management investment company organized as a Massachusetts business trust.
The Fund's financial statements are prepared in accordance with accounting principles generally accepted in the United States of America which require the use of management estimates. Actual results could differ from those estimates. The policies described below are followed consistently by the Fund in the preparation of its financial statements.
Security Valuation. Investments are stated at value determined as of the close of regular trading on the New York Stock Exchange on each day the exchange is open for trading.
Various inputs are used in determining the value of the Fund's investments. These inputs are summarized in three broad levels. Level 1 includes quoted prices in active markets for identical securities. Level 2 includes other significant observable inputs (including quoted prices for similar securities, interest rates, prepayment speeds, and credit risk). Level 3 includes significant unobservable inputs (including the Fund's own assumptions in determining the fair value of investments). The inputs or methodology used for valuing securities are not necessarily an indication of the risk associated with investing in those securities.
Equity securities and exchange-traded funds ("ETFs") are valued at the most recent sale price or official closing price reported on the exchange (US or foreign) or over-the-counter market on which they trade and are categorized as Level 1 securities. Securities or ETFs for which no sales are reported are valued at the calculated mean between the most recent bid and asked quotations on the relevant market or, if a mean cannot be determined, at the most recent bid quotation. For certain international equity securities, in order to adjust for events which may occur between the close of the foreign exchanges and the close of the New York Stock Exchange, a fair valuation model may be used. This fair valuation model takes into account comparisons to the valuation of American Depository Receipts (ADRs), exchange-traded funds, futures contracts and certain indices and these securities are categorized as Level 2.
Futures contracts are generally valued at the settlement prices established each day on the exchange on which they are traded and are categorized as Level 1.
Money market instruments purchased with an original or remaining maturity of sixty days or less, maturing at par, are valued at amortized cost, which approximates value, and are categorized as Level 2. Investments in open-end investment companies are valued at their net asset value each business day and are categorized as Level 1.
Securities and other assets for which market quotations are not readily available or for which the above valuation procedures are deemed not to reflect fair value are valued in a manner that is intended to reflect their fair value as determined in accordance with procedures approved by the Board and are generally categorized as Level 3. In accordance with the Fund's valuation procedures, factors used in determining value may include, but are not limited to, the type of the security; the size of the holding; the initial cost of the security; the existence of any contractual restrictions on the security's disposition; the price and extent of public trading in similar securities of the issuer or of comparable companies; quotations or evaluated prices from broker-dealers and/or pricing services; information obtained from the issuer, analysts, and/or the appropriate stock exchange (for exchange-traded securities); an analysis of the company's or issuer's financial statements; an evaluation of the forces that influence the issuer and the market(s) in which the security is purchased and sold and with respect to debt securities; the maturity, coupon, creditworthiness, currency denomination and the movement of the market in which the security is normally traded. The value determined under these procedures may differ from published values for the same securities.
Disclosure about the classification of fair value measurements is included in a table following the Fund's Investment Portfolio.
Securities Lending. The Fund lends securities to certain financial institutions. The Fund retains beneficial ownership of the securities it has loaned and continues to receive interest and dividends paid by the issuer of securities and to participate in any changes in their market value. The Fund requires the borrowers of the securities to maintain collateral with the Fund consisting of either cash or liquid, unencumbered assets having a value at least equal to the value of the securities loaned. When the collateral falls below specified amounts, the lending agent will use its best effort to obtain additional collateral on the next business day to meet required amounts under the security lending agreement. The Fund may invest the cash collateral into a joint trading account in an affiliated money market fund pursuant to Exemptive Orders issued by the SEC. The Fund receives compensation for lending its securities either in the form of fees or by earning interest on invested cash collateral net of borrower rebates and fees paid to a lending agent. Either the Fund or the borrower may terminate the loan. There may be risks of delay and costs in recovery of securities or even loss of rights in the collateral should the borrower of the securities fail financially. The Fund is also subject to all investment risks associated with the reinvestment of any cash collateral received, including, but not limited to, interest rate, credit and liquidity risk associated with such investments.
Foreign Currency Translations. The books and records of the Fund are maintained in US dollars. Investment securities and other assets and liabilities denominated in a foreign currency are translated into US dollars at the prevailing exchange rates at period end. Purchases and sales of investment securities, income and expenses are translated into US dollars at the prevailing exchange rates on the respective dates of the transactions.
Net realized and unrealized gains and losses on foreign currency transactions represent net gains and losses between trade and settlement dates on securities transactions, the acquisition and disposition of foreign currencies, and the difference between the amount of net investment income accrued and the US dollar amount actually received. That portion of both realized and unrealized gains and losses on investments that results from fluctuations in foreign currency exchange rates is not separately disclosed but is included with net realized and unrealized gain/appreciation and loss/depreciation on investments.
Federal Income Taxes. The Fund's policy is to comply with the requirements of the Internal Revenue Code, as amended, which are applicable to regulated investment companies, and to distribute all of its taxable income to its shareholders.
Additionally, based on the Fund's understanding of the tax rules and rates related to income, gains and transactions for the foreign jurisdictions in which it invests, the Fund will provide for foreign taxes, and where appropriate, deferred foreign taxes.
At December 31, 2010, the Fund had a net tax basis capital loss carryforward of approximately $69,239,000, which may be applied against any realized net taxable capital gains of each succeeding year until fully utilized or until the December 31, 2016 ($30,075,000) and December 31, 2017 ($39,164,000), the respective expiration dates, whichever occurs first.
On December 22, 2010, the Regulated Investment Company Modernization Act of 2010 (the "Act") was enacted. Under the Act, net capital losses may be carried forward indefinitely, and their character is retained as short-term and/or long-term losses. Previously, net capital losses were carried forward for eight years and treated as short-term losses. As a transition rule, the Act requires that post-enactment net capital losses be used before pre-enactment net capital losses. As a result of this ordering rule, pre-enactment capital loss carryforwards may expire unused, whereas under the previous rules these losses may have been utilized. This change is effective for fiscal years beginning after the date of enactment.
The Fund has reviewed the tax positions for the open tax years as of December 31, 2010 and has determined that no provision for income tax is required in the Fund's financial statements. The Fund's federal tax returns for the prior three fiscal years remain open subject to examination by the Internal Revenue Service.
Distribution of Income and Gains. Net investment income of the Fund, if any, is declared and distributed to shareholders annually. Net realized gains from investment transactions, in excess of available capital loss carryforwards, would be taxable to the Fund if not distributed and, therefore, will be distributed to shareholders at least annually.
The timing and characterization of certain income and capital gains distributions are determined annually in accordance with federal tax regulations which may differ from accounting principles generally accepted in the United States of America. These differences primarily relate to investments in foreign denominated investments, investments in futures contracts, income received from passive foreign investment companies and and certain securities sold at a loss. As a result, net investment income (loss) and net realized gain (loss) on investment transactions for a reporting period may differ significantly from distributions during such period. Accordingly, the Fund may periodically make reclassifications among certain of its capital accounts without impacting the net asset value of the Fund.
The tax character of current year distributions will be determined at the end of the current fiscal year.
Expenses. Expenses of the Trust arising in connection with a specific fund are allocated to that fund. Other Trust expenses which cannot be directly attributed to a fund are apportioned among the funds in the Trust.
Contingencies. In the normal course of business, the Fund may enter into contracts with service providers that contain general indemnification clauses. The Fund's maximum exposure under these arrangements is unknown as this would involve future claims that may be made against the Fund that have not yet been made. However, based on experience, the Fund expects the risk of loss to be remote.
Other. Investment transactions are accounted for on a trade date plus one basis for daily net asset value calculations. However, for financial reporting purposes, investment transactions are reported on trade date. Interest income is recorded on the accrual basis. Dividend income is recorded on the ex-dividend date net of foreign withholding taxes. Certain dividends from foreign securities may be recorded subsequent to the ex-dividend date as soon as the Fund is informed of such dividends. Realized gains and losses from investment transactions are recorded on an identified cost basis and may include proceeds from litigation.
B. Derivative Instruments
Futures Contracts. A futures contract is an agreement between a buyer or seller and an established futures exchange or its clearinghouse in which the buyer or seller agrees to take or make a delivery of a specific amount of a financial instrument at a specified price on a specific date (settlement date). For the six months ended June 30, 2011, the Fund used futures contracts as a means of gaining exposure to a particular asset class or to keep cash on hand to meet shareholder redemptions or other needs while maintaining exposure to the market.
Futures contracts are valued at the most recent settlement price. Upon entering into a futures contract, the Fund is required to deposit with a financial intermediary cash or securities ("initial margin") in an amount equal to a certain percentage of the face value indicated in the futures contract. Subsequent payments ("variation margin") are made or received by the Fund dependent upon the daily fluctuations in the value and are recorded for financial reporting purposes as unrealized gains or losses by the Fund. Gains or losses are realized when the contract expires or is closed. Since all futures contracts are exchange-traded, counterparty risk is minimized as the exchange's clearinghouse acts as the counterparty, and guarantees the futures against default.
Certain risks may arise upon entering into futures contracts, including the risk that an illiquid market will limit the Fund's ability to close out a futures contract prior to the settlement date and the risk that the futures contract is not well correlated with the security, index or currency to which it relates. Risk of loss may exceed amounts recognized in the Statement of Assets and Liabilities.
A summary of the open futures contracts as of June 30, 2011 is included in a table following the Fund's Investment Portfolio. For the six months ended June 30, 2011, the Fund's investment in futures contracts purchased had a total notional value generally indicative of a range from approximately $1,994,000 to $2,905,000.
The following table summarizes the value of the Fund's derivative instruments held as of June 30, 2011 and the related location in the accompanying Statement of Assets and Liabilities, presented by primary underlying risk exposure:
| Asset Derivative | | Futures Contracts | |
| Equity Contracts (a) | | $ | 47,571 | |
The above derivative is located in the following Statement of Assets and Liabilities account:
(a) Includes cumulative appreciation of futures contracts as disclosed in the Investment Portfolio. Unsettled variation margin is disclosed separately within the Statement of Assets and Liabilities.
Additionally, the amount of unrealized and realized gains and losses on derivative instruments recognized in Fund earnings during the six months ended June 30, 2011 and the related location in the accompanying Statement of Operations is summarized in the following tables by primary underlying risk exposure:
| Realized Gain (Loss) | | Futures Contracts | |
| Equity Contracts (a) | | $ | (53,965 | ) |
The above derivative is located in the following Statement of Operations account:
(a) Net realized gain (loss) from futures
| Change in Net Unrealized Appreciation (Depreciation) | | Futures Contracts | |
| Equity Contracts (a) | | $ | 86,598 | |
The above derivative is located in the following Statement of Operations account:
(a) Change in net unrealized appreciation (depreciation) on futures
C. Purchases and Sales of Securities
During the six months ended June 30, 2011, purchases and sales of investment transactions (excluding short-term investments) aggregated $15,205,816 and $19,379,665, respectively.
D. Related Parties
Management Agreement. Under the Investment Management Agreement with Deutsche Investment Management Americas Inc. ("DIMA" or the "Advisor"), an indirect, wholly owned subsidiary of Deutsche Bank AG, the Advisor directs the investments of the Fund in accordance with its investment objectives, policies and restrictions. The Advisor determines the securities, instruments and other contracts relating to investments to be purchased, sold or entered into by the Fund or delegates such responsibility to the Fund's subadvisor.
QS Investors, LLC ("QS Investors") serves as subadvisor. As a subadvisor to the Fund, QS Investors makes investment decisions and buys and sells securities for the Fund. QS Investors is paid by the Advisor for the services QS Investors provides to the Fund.
Pursuant to the Investment Management Agreement with the Advisor, the Fund pays a monthly management fee based on the Fund's average daily net assets, computed and accrued daily and payable monthly, at the following annual rates:
| $0-$1.5 billion | | | .650 | % |
| Next $1.75 billion | | | .635 | % |
| Next $1.75 billion | | | .620 | % |
| Over $5 billion | | | .605 | % |
Accordingly, for the six months ended June 30, 2011, the fee pursuant to the Investment Management Agreement was equivalent to an annualized effective rate of 0.65% of the Fund's average daily net assets.
Administration Fee. Pursuant to an Administrative Services Agreement, DIMA provides most administrative services to the Fund. For all services provided under the Administrative Services Agreement, the Fund pays DIMA an annual fee ("Administration Fee") of 0.10% of the Fund's average daily net assets, computed and accrued daily and payable monthly. For the six months ended June 30, 2011, the Administration Fee was $41,291, of which $6,560 is unpaid.
Service Provider Fees. DWS Investments Service Company ("DISC"), an affiliate of the Advisor, is the transfer agent, dividend-paying agent and shareholder service agent for the Fund. Pursuant to a sub-transfer agency agreement between DISC and DST Systems, Inc. ("DST"), DISC has delegated certain transfer agent, dividend-paying agent and shareholder service agent functions to DST. DISC compensates DST out of the shareholder servicing fee it receives from the Fund. For the six months ended June 30, 2011, the amounts charged to the Fund by DISC aggregated $65, of which $46 is unpaid.
Typesetting and Filing Service Fees. Under an agreement with DIMA, DIMA is compensated for providing typesetting and certain regulatory filing services to the Fund. For the six months ended June 30, 2011, the amount charged to the Fund by DIMA included in the Statement of Operations under "reports to shareholders" aggregated $7,350, of which $3,799 is unpaid.
Trustees' Fees and Expenses. The Fund paid each Trustee not affiliated with the Advisor retainer fees plus specified amounts for various committee services and for the Board Chairperson.
Affiliated Cash Management Vehicle. The Fund may invest uninvested cash balances in Central Cash Management Fund, which is managed by the Advisor. The Fund indirectly bears its proportionate share of the expenses of Central Cash Management Fund. Central Cash Management Fund does not pay the Advisor an investment management fee. Central Cash Management Fund seeks a high level of current income consistent with liquidity and the preservation of capital.
E. Investing in Emerging Markets
Investing in emerging markets may involve special risks and considerations not typically associated with investing in developed markets. These risks include revaluation of currencies, high rates of inflation or deflation, repatriation restrictions on income and capital, and future adverse political, social and economic developments. Moreover, securities issued in these markets may be less liquid, subject to government ownership controls or delayed settlements, and may have prices that are more volatile or less easily assessed than those of comparable securities of issuers in developed markets.
F. Ownership of the Fund
At June 30, 2011, three Participating Insurance Companies were owners of record of 10% or more of the total outstanding Class A shares of the Fund, each owning 42%, 30% and 27%.
G. Line of Credit
The Fund and other affiliated funds (the "Participants") share in a $450 million revolving credit facility provided by a syndication of banks. The Fund may borrow for temporary or emergency purposes, including the meeting of redemption requests that otherwise might require the untimely disposition of securities. The Participants are charged an annual commitment fee which is allocated based on net assets, among each of the Participants. Interest is calculated at a rate per annum equal to the sum of the Federal Funds Rate plus 1.25 percent plus if LIBOR exceeds the Federal Funds Rate the amount of such excess. The Fund may borrow up to a maximum of 33 percent of its net assets under the agreement. The Fund had no outstanding loans at June 30, 2011.
The Trust's policies and procedures for voting proxies for portfolio securities and information about how the Trust voted proxies related to its portfolio securities during the 12-month period ended June 30 are available on our Web site — www.dws-investments.com (click on "proxy voting" at the bottom of the page) — or on the SEC's Web site — www.sec.gov. To obtain a written copy of the Trust's policies and procedures without charge, upon request, call us toll free at (800) 728-3337.
Summary of Management Fee Evaluation by Independent Fee Consultant
October 3, 2010
Pursuant to an Order entered into by Deutsche Investment Management Americas and affiliates (collectively, "DeAM") with the Attorney General of New York, I, Thomas H. Mack, have been appointed the Independent Fee Consultant for the DWS Funds (formerly the DWS Scudder Funds). My duties include preparing an annual written evaluation of the management fees DeAM charges the Funds, considering among other factors the management fees charged by other mutual fund companies for like services, management fees DeAM charges other clients for like services, DeAM's costs of supplying services under the management agreements and related profit margins, possible economies of scale if a Fund grows larger, and the nature and quality of DeAM's services, including fund performance. This report summarizes my evaluation for 2010, including my qualifications, the evaluation process for each of the DWS Funds, consideration of certain complex-level factors, and my conclusions. I served in substantially the same capacity in 2007, 2008, and 2009.
Qualifications
For more than 35 years I have served in various professional capacities within the investment management business. I have held investment analysis and advisory positions, including securities analyst, portfolio strategist and director of investment policy with a large investment firm. I have also performed business management functions, including business development, financial management and marketing research and analysis.
Since 1991, I have been an independent consultant within the asset management industry. I have provided services to over 125 client organizations, including investment managers, mutual fund boards, product distributors and related organizations. Over the past ten years I have completed a number of assignments for mutual fund boards, specifically including assisting boards with management contract renewal.
I hold a Master of Business Administration degree, with highest honors, from Harvard University and Master of Science and Bachelor of Science (highest honors) degrees from the University of California at Berkeley. I am an independent director and audit committee financial expert for two closed-end mutual funds and have served in various leadership and financial oversight capacities with non-profit organizations.
Evaluation of Fees for each DWS Fund
My work focused primarily on evaluating, fund-by-fund, the fees charged to each of the 118 publicly offered Fund portfolios in the DWS Fund family. For each Fund, I considered each of the key factors mentioned above, as well as any other relevant information. In doing so I worked closely with the Funds' Independent Directors in their annual contract renewal process, as well as in their approval of contracts for several new funds (documented separately).
In evaluating each Fund's fees, I reviewed comprehensive materials provided by or on behalf of DeAM, including expense information prepared by Lipper Analytical, comparative performance information, profitability data, manager histories, and other materials. I also accessed certain additional information from the Lipper and Morningstar databases and drew on my industry knowledge and experience.
To facilitate evaluating this considerable body of information, I prepared for each Fund a document summarizing the key data elements in each area as well as additional analytics discussed below. This made it possible to consider each key data element in the context of the others.
In the course of contract renewal, DeAM agreed to implement a number of fee and expense adjustments requested by the Independent Directors which will favorably impact future fees and expenses, and my evaluation includes the effects of these changes.
Fees and Expenses Compared with Other Funds
The competitive fee and expense evaluation for each fund focused on two primary comparisons:
The Fund's contractual management fee (the advisory fee plus the administration fee where applicable) compared with those of a group of typically 12-15 funds in the same Lipper investment category (e.g. Large Capitalization Growth) having similar distribution arrangements and being of similar size.
The Fund's total expenses compared with a broader universe of funds from the same Lipper investment category and having similar distribution arrangements.
These two comparisons provide a view of not only the level of the fee compared with funds of similar scale but also the total expense the Fund bears for all the services it receives, in comparison with the investment choices available in the Fund's investment category and distribution channel. The principal figure-of-merit used in these comparisons was the subject Fund's percentile ranking against peers.
DeAM's Fees for Similar Services to Others
DeAM provided management fee schedules for all of its US domiciled fund and non-fund investment management accounts in any of the investment categories where there is a DWS Fund. These similar products included the other DWS Funds, non-fund pooled accounts, institutional accounts and sub-advisory accounts. Using this information, I calculated for each Fund the fee that would be charged to each similar product, at the subject Fund's asset level.
Evaluating information regarding non-fund products is difficult because there are varying levels of services required for different types of accounts, with mutual funds generally requiring considerably more regulatory and administrative types of service as well as having more frequent cash flows than other types of accounts. Also, while mutual fund fees for similar fund products can be expected to be similar, there will be some differences due to different pricing conditions in different distribution channels (e.g. retail funds versus those used in variable insurance products), differences in underlying investment processes and other factors.
Costs and Profit Margins
DeAM provided a detailed profitability analysis for each Fund. After making some adjustments so that the presentation would be more comparable to the available industry figures, I reviewed profit margins from investment management alone, from investment management plus other fund services (excluding distribution) provided to the Funds by DeAM (principally shareholder services), and DeAM profits from all sources, including distribution. A later section comments on overall profitability.
Economies of Scale
Economies of scale — an expected decline in management cost per dollar of fund assets as fund assets grow — are very rarely quantified and documented because of inherent difficulties in collecting and analyzing relevant data. However, in virtually every investment category that I reviewed, larger funds tend to have lower fees and lower total expenses than smaller funds. To see how each DWS Fund compares with this industry observation, I reviewed:
The trend in Fund assets over the last five years and the accompanying trend in total expenses. This shows if the Fund has grown and, if so, whether total expense (management fees as well as other expenses) have declined as a percent of assets.
Whether the Fund has break-points in its management fee schedule, the extent of the fee reduction built into the schedule and the asset levels where the breaks take effect, and in the case of a sub-advised Fund how the Fund's break-points compare with those of the sub-advisory fee schedule.
How the Fund's contractual fee schedule compares with trends in the industry data. To accomplish this, I constructed a chart showing how actual latest-fiscal-year contractual fees of the Fund and of other similar funds relate to average fund assets, with the subject Fund's contractual fee schedule superimposed.
Quality of Service — Performance
The quality-of-service evaluation focused on investment performance, which is the principal result of the investment management service. Each Fund's performance was reviewed over the past 1, 3, 5 and 10 years, as applicable, and compared with that of other funds in the same investment category and with a suitable market index.
In addition, I calculated and reviewed risk-adjusted returns relative to an index of similar mutual funds' returns and a suitable market index. The risk-adjusted returns analysis provides a way of determining the extent to which the Fund's return comparisons are mainly the product of investment value-added (or lack thereof) or alternatively taking considerably more or less risk than is typical in its investment category.
I also received and considered the history of portfolio manager changes for each Fund, as this provided an important context for evaluating the performance results.
Complex-Level Considerations
While this evaluation was conducted mainly at the individual fund level, there are some issues relating to the reasonableness of fees that can alternatively be considered across the whole fund complex:
I reviewed DeAM's profitability analysis for all DWS Funds, with a view toward determining if the allocation procedures used were reasonable and how profit levels compared with public data for other investment managers.
I considered whether DeAM and affiliates receive any significant ancillary or "fall-out" benefits that should be considered in interpreting the direct profitability results. These would be situations where serving as the investment manager of the Funds is beneficial to another part of the Deutsche Bank organization.
I considered how aggregated DWS Fund expenses had varied over the years, by asset class and in the context of trends in asset levels.
I reviewed the structure of the DeAM organization, trends in staffing levels, and information on compensation of investment management and other professionals compared with industry data.
Findings
Based on the process and analysis discussed above, which included reviewing a wide range of information from management and external data sources and considering among other factors the fees DeAM charges other clients, the fees charged by other fund managers, DeAM's costs and profits associated with managing the Funds, economies of scale, possible fall-out benefits, and the nature and quality of services provided, in my opinion the management fees charged the DWS Funds are reasonable.
Thomas H. Mack
Notes
DWS Investments Distributors, Inc.
222 South Riverside Plaza
Chicago, IL 60606
(800) 621-1148
VS2DIE-3 (R-023293-1 8/11)
JUNE 30, 2011
SEMIANNUAL REPORT
DWS VARIABLE SERIES II
DWS Dreman Small Mid Cap Value VIP
Contents
3 Performance Summary 4 Information About Your Fund's Expenses 5 Portfolio Summary 6 Investment Portfolio 9 Statement of Assets and Liabilities 10 Statement of Operations 10 Statement of Changes in Net Assets 12 Financial Highlights 13 Notes to Financial Statements 16 Proxy Voting 17 Summary of Management Fee Evaluation by Independent Fee Consultant |
This report must be preceded or accompanied by a prospectus. To obtain an additional prospectus or summary prospectus, if available, call (800) 728-3337 or your financial representative. We advise you to consider the Fund's objectives, risks, charges and expenses carefully before investing. The summary prospectus and prospectus contain this and other important information about the Fund. Please read the prospectus carefully before you invest.
Any Fund that focuses in a particular segment of the market will generally be more volatile than a Fund that invests more broadly. Stocks of small and medium-sized companies involve greater risk than securities of larger, more-established companies. Any decline in value of a Fund security that is out on loan by the Fund will adversely affect performance. Financial failure of the borrower may mean a delay in recovery or loss of rights in the collateral. Stocks may decline in value. See the prospectus for details.
DWS Investments is part of Deutsche Bank's Asset Management division and, within the US, represents the retail asset management activities of Deutsche Bank AG, Deutsche Bank Trust Company Americas, Deutsche Investment Management Americas Inc. and DWS Trust Company.
NOT FDIC/NCUA INSURED NO BANK GUARANTEE MAY LOSE VALUE NOT A DEPOSIT
NOT INSURED BY ANY FEDERAL GOVERNMENT AGENCY
Performance Summary June 30, 2011
Fund performance shown is historical, assumes reinvestment of all dividend and capital gain distributions and does not guarantee future results. Investment return and principal value fluctuate with changing market conditions so that, when redeemed, shares may be worth more or less than their original cost. Current performance may be lower or higher than the performance data quoted. Please contact your participating insurance company for the Fund's most recent month-end performance. Performance doesn't reflect charges and fees ("contract charges") associated with the separate account that invests in the Fund or any variable life insurance policy or variable annuity contract for which the Fund is an investment option. These charges and fees will reduce returns. While all share classes have the same underlying portfolio, their performance will differ.
The gross expense ratios of the Fund, as stated in the fee table of the prospectus dated May 1, 2011 are 0.87% and 1.22% for Class A and Class B shares, respectively, and may differ from the expense ratios disclosed in the Financial Highlights tables in this report.
| Growth of an Assumed $10,000 Investment in DWS Dreman Small Mid Cap Value VIP |
[] DWS Dreman Small Mid Cap Value VIP — Class A [] Russell 2500™ Value Index | The Russell 2500™ Value Index is an unmanaged Index of those securities in the Russell 3000® Index with lower price-to-book ratios and lower forecasted growth values. Index returns do not reflect any fees or expenses and it is not possible to invest directly into an index. |
| |
| Yearly periods ended June 30 | |
| Comparative Results | |
| DWS Dreman Small Mid Cap Value VIP | | 6-Month‡ | | | 1-Year | | | 3-Year | | | 5-Year | | | 10-Year | |
| Class A | Growth of $10,000 | | $ | 10,450 | | | $ | 13,375 | | | $ | 12,271 | | | $ | 12,667 | | | $ | 25,310 | |
| Average annual total return | | | 4.50 | % | | | 33.75 | % | | | 7.06 | % | | | 4.84 | % | | | 9.73 | % |
| Russell 2500 Value Index | Growth of $10,000 | | $ | 10,610 | | | $ | 13,454 | | | $ | 12,550 | | | $ | 11,902 | | | $ | 22,317 | |
| Average annual total return | | | 6.10 | % | | | 34.54 | % | | | 7.87 | % | | | 3.54 | % | | | 8.36 | % |
| DWS Dreman Small Mid Cap Value VIP | | 6-Month‡ | | | 1-Year | | | 3-Year | | | 5-Year | | | Life of Class* | |
| Class B | Growth of $10,000 | | $ | 10,439 | | | $ | 13,335 | | | $ | 12,151 | | | $ | 12,447 | | | $ | 23,042 | |
| Average annual total return | | | 4.39 | % | | | 33.35 | % | | | 6.71 | % | | | 4.48 | % | | | 9.72 | % |
| Russell 2500 Value Index | Growth of $10,000 | | $ | 10,610 | | | $ | 13,454 | | | $ | 12,550 | | | $ | 11,902 | | | $ | 20,937 | |
| Average annual total return | | | 6.10 | % | | | 34.54 | % | | | 7.87 | % | | | 3.54 | % | | | 8.56 | % |
The growth of $10,000 is cumulative.
‡ Total returns shown for periods less than one year are not annualized.
* The Fund commenced offering Class B shares on July 1, 2002. Index returns began on June 30, 2002.
Information About Your Fund's Expenses
As an investor of the Fund, you incur two types of costs: ongoing expenses and transaction costs. Ongoing expenses include management fees, distribution and service (12b-1) fees and other Fund expenses. Examples of transaction costs include contract charges and account maintenance fees, which are not shown in this section. The following tables are intended to help you understand your ongoing expenses (in dollars) of investing in the Fund and to help you compare these expenses with the ongoing expenses of investing in other mutual funds. The example in the table is based on an investment of $1,000 invested at the beginning of the six-month period and held for the entire period (January 1, 2011 to June 30, 2011).
The tables illustrate your Fund's expenses in two ways:
•Actual Fund Return. This helps you estimate the actual dollar amount of ongoing expenses (but not transaction costs) paid on a $1,000 investment in the Fund using the Fund's actual return during the period. To estimate the expenses you paid over the period, simply divide your account value by $1,000 (for example, an $8,600 account value divided by $1,000 = 8.6), then multiply the result by the number in the "Expenses Paid per $1,000" line under the share class you hold.
• Hypothetical 5% Fund Return. This helps you to compare your Fund's ongoing expenses (but not transaction costs) with those of other mutual funds using the Fund's actual expense ratio and a hypothetical rate of return of 5% per year before expenses. Examples using a 5% hypothetical Fund return may be found in the shareholder reports of other mutual funds. The hypothetical account values and expenses may not be used to estimate the actual ending account balance or expenses you paid for the period.
Please note that the expenses shown in these tables are meant to highlight your ongoing expenses only and do not reflect any transaction costs. The "Expenses Paid per $1,000" line of the tables is useful in comparing ongoing expenses only and will not help you determine the relative total expense of owning different funds. If these transaction costs had been included, your costs would have been higher.
Expenses and Value of a $1,000 Investment for the six months ended June 30, 2011 | |
| Actual Fund Return | | Class A | | | Class B | |
| Beginning Account Value 1/1/11 | | $ | 1,000.00 | | | $ | 1,000.00 | |
| Ending Account Value 6/30/11 | | $ | 1,045.00 | | | $ | 1,043.90 | |
| Expenses Paid per $1,000* | | $ | 4.11 | | | $ | 5.83 | |
| Hypothetical 5% Fund Return | | Class A | | | Class B | |
| Beginning Account Value 1/1/11 | | $ | 1,000.00 | | | $ | 1,000.00 | |
| Ending Account Value 6/30/11 | | $ | 1,020.78 | | | $ | 1,019.09 | |
| Expenses Paid per $1,000* | | $ | 4.06 | | | $ | 5.76 | |
* Expenses are equal to the Fund's annualized expense ratio for each share class, multiplied by the average account value over the period, multiplied by the number of days in the most recent six-month period, then divided by 365.
| Annualized Expense Ratios | Class A | | Class B | |
| DWS Variable Series II — DWS Dreman Small Mid Cap Value VIP | .81% | | 1.15% | |
For more information, please refer to the Fund's prospectus.
These tables do not reflect charges and fees ("contract charges") associated with the separate account that invests in the Fund or any variable life insurance policy or variable annuity contract for which the Fund is an investment option.
Asset Allocation (As a % of Investment Portfolio excluding Securities Lending Collateral) | 6/30/11 | 12/31/10 |
| | | |
| Common Stocks | 96% | 99% |
| Cash Equivalents | 4% | 1% |
| | 100% | 100% |
Sector Diversification (As a % of Common Stocks) | 6/30/11 | 12/31/10 |
| | | |
| Financials | 22% | 19% |
| Information Technology | 15% | 14% |
| Industrials | 14% | 13% |
| Consumer Discretionary | 13% | 11% |
| Health Care | 11% | 11% |
| Energy | 10% | 11% |
| Materials | 6% | 9% |
| Consumer Staples | 5% | 6% |
| Utilities | 4% | 6% |
| | 100% | 100% |
Asset allocation and sector diversification are subject to change.
For more complete details about the Fund's investment portfolio, see page 6.
Following the Fund's fiscal first and third quarter-end, a complete portfolio holdings listing is filed with the SEC on Form N-Q. The form will be available on the SEC's Web site at www.sec.gov, and it also may be reviewed and copied at the SEC's Public Reference Room in Washington, D.C. Information on the operation of the SEC's Public Reference Room may be obtained by calling (800) SEC-0330. The Fund's portfolio holdings are also posted on www.dws-investments.com from time to time. Please see the Fund's current prospectus for more information.
Investment Portfolio June 30, 2011 (Unaudited) | | | Shares | | | Value ($) | |
| | | | |
| Common Stocks 95.9% | |
| Consumer Discretionary 12.5% | |
| Auto Components 1.1% | |
| Cooper Tire & Rubber Co. | | | 154,275 | | | | 3,053,102 | |
| Diversified Consumer Services 1.0% | |
| Regis Corp. (a) | | | 187,925 | | | | 2,879,011 | |
| Hotels Restaurants & Leisure 3.2% | |
| Brinker International, Inc. (a) | | | 156,300 | | | | 3,823,098 | |
| International Speedway Corp. "A" | | | 113,475 | | | | 3,223,825 | |
| LIFE TIME FITNESS, Inc.* (a) | | | 48,596 | | | | 1,939,466 | |
| | | | | | | | 8,986,389 | |
| Household Durables 1.3% | |
| Whirlpool Corp. (a) | | | 42,825 | | | | 3,482,529 | |
| Leisure Equipment & Products 1.3% | |
| Mattel, Inc. (a) | | | 131,425 | | | | 3,612,873 | |
| Media 1.2% | |
| Meredith Corp. (a) | | | 105,125 | | | | 3,272,541 | |
| Multiline Retail 1.1% | |
| Big Lots, Inc.* | | | 91,179 | | | | 3,022,584 | |
| Textiles, Apparel & Luxury Goods 2.3% | |
| Hanesbrands, Inc.* (a) | | | 129,900 | | | | 3,708,645 | |
| The Jones Group, Inc. | | | 239,790 | | | | 2,601,722 | |
| | | | | | | | 6,310,367 | |
| Consumer Staples 4.9% | |
| Beverages 1.2% | |
| Constellation Brands, Inc. "A"* | | | 160,525 | | | | 3,342,131 | |
| Food & Staples Retailing 1.1% | |
| SUPERVALU, Inc. (a) | | | 332,525 | | | | 3,129,060 | |
| Food Products 1.3% | |
| Ralcorp Holdings, Inc.* (a) | | | 40,500 | | | | 3,506,490 | |
| Household Products 1.3% | |
| Energizer Holdings, Inc.* (a) | | | 50,975 | | | | 3,688,551 | |
| Energy 9.2% | |
| Energy Equipment & Services 6.0% | |
| Atwood Oceanics, Inc.* (a) | | | 96,040 | | | | 4,238,245 | |
| Cal Dive International, Inc.* | | | 575,100 | | | | 3,439,098 | |
| McDermott International, Inc.* | | | 126,125 | | | | 2,498,536 | |
| Superior Energy Services, Inc.* (a) | | | 93,500 | | | | 3,472,590 | |
| Tidewater, Inc. (a) | | | 57,775 | | | | 3,108,873 | |
| | | | | | | | 16,757,342 | |
| Oil, Gas & Consumable Fuels 3.2% | |
| Arch Coal, Inc. (a) | | | 98,550 | | | | 2,627,343 | |
| Forest Oil Corp.* (a) | | | 102,800 | | | | 2,745,788 | |
| Ultra Petroleum Corp.* (a) | | | 77,022 | | | | 3,527,608 | |
| | | | | | | | 8,900,739 | |
| Financials 21.0% | |
| Capital Markets 2.3% | |
| Raymond James Financial, Inc. (a) | | | 104,600 | | | | 3,362,890 | |
| Apollo Investment Corp. | | | 302,775 | | | | 3,091,333 | |
| | | | | | | | 6,454,223 | |
| Commercial Banks 6.5% | |
| Associated Banc-Corp. | | | 251,475 | | | | 3,495,503 | |
| Bank of Hawaii Corp. (a) | | | 73,675 | | | | 3,427,361 | |
| BOK Financial Corp. (a) | | | 69,500 | | | | 3,806,515 | |
| East West Bancorp., Inc. (a) | | | 190,200 | | | | 3,843,942 | |
| Zions Bancorp. (a) | | | 149,500 | | | | 3,589,495 | |
| | | | | | | | 18,162,816 | |
| | | Shares | | | Value ($) | |
| | | | | | | | | |
| Insurance 4.7% | |
| Allied World Assurance Co. Holdings AG | | | 62,450 | | | | 3,595,871 | |
| Argo Group International Holdings Ltd. | | | 104,813 | | | | 3,115,042 | |
| Axis Capital Holdings Ltd. | | | 93,800 | | | | 2,904,048 | |
| Everest Re Group Ltd. (a) | | | 40,225 | | | | 3,288,394 | |
| | | | | | | | 12,903,355 | |
| Real Estate Investment Trusts 7.5% | |
| CBL & Associates Properties, Inc. (REIT) (a) | | | 196,250 | | | | 3,558,013 | |
| CommonWealth REIT (REIT) | | | 126,756 | | | | 3,275,375 | |
| Hospitality Properties Trust (REIT) | | | 146,750 | | | | 3,558,687 | |
| Medical Properties Trust, Inc. (REIT) (a) | | | 298,300 | | | | 3,430,450 | |
| MFA Financial, Inc. (REIT) | | | 411,975 | | | | 3,312,279 | |
| Weingarten Realty Investors (REIT) (a) | | | 149,400 | | | | 3,758,904 | |
| | | | | | | | 20,893,708 | |
| Health Care 11.0% | |
| Biotechnology 0.8% | |
| Cephalon, Inc.* | | | 28,600 | | | | 2,285,140 | |
| Health Care Equipment & Supplies 2.4% | |
| Alere, Inc.* (a) | | | 88,500 | | | | 3,240,870 | |
| Teleflex, Inc. (a) | | | 57,050 | | | | 3,483,473 | |
| | | | | | | | 6,724,343 | |
| Health Care Providers & Services 5.2% | |
| Amedisys, Inc.* (a) | | | 115,050 | | | | 3,063,782 | |
| Healthspring, Inc.* (a) | | | 84,675 | | | | 3,904,364 | |
| LifePoint Hospitals, Inc.* (a) | | | 88,825 | | | | 3,471,281 | |
| Owens & Minor, Inc. | | | 114,350 | | | | 3,943,931 | |
| | | | | | | | 14,383,358 | |
| Life Sciences Tools & Services 1.3% | |
| Charles River Laboratories International, Inc.* | | | 93,375 | | | | 3,795,694 | |
| Pharmaceuticals 1.3% | |
| Endo Pharmaceuticals Holdings, Inc.* (a) | | | 87,700 | | | | 3,522,909 | |
| Industrials 13.3% | |
| Aerospace & Defense 2.3% | |
| Alliant Techsystems, Inc. (a) | | | 45,250 | | | | 3,227,682 | |
| Spirit AeroSystems Holdings, Inc. "A"* | | | 137,150 | | | | 3,017,300 | |
| | | | | | | | 6,244,982 | |
| Commercial Services & Supplies 3.5% | |
| Pitney Bowes, Inc. (a) | | | 143,600 | | | | 3,301,364 | |
| R.R. Donnelley & Sons Co. (a) | | | 175,000 | | | | 3,431,750 | |
| The Brink's Co. | | | 101,475 | | | | 3,026,999 | |
| | | | | | | | 9,760,113 | |
| Construction & Engineering 2.4% | |
| Tutor Perini Corp. (a) | | | 155,900 | | | | 2,990,162 | |
| URS Corp.* | | | 81,850 | | | | 3,661,969 | |
| | | | | | | | 6,652,131 | |
| Electrical Equipment 1.3% | |
| Hubbell, Inc. "B" (a) | | | 57,425 | | | | 3,729,754 | |
| Machinery 2.7% | |
| Crane Co. | | | 74,500 | | | | 3,681,045 | |
| Oshkosh Corp.* | | | 131,500 | | | | 3,805,610 | |
| | | | | | | | 7,486,655 | |
| | | Shares | | | Value ($) | |
| | | | | | | | | |
| Trading Companies & Distributors 1.1% | |
| Textainer Group Holdings Ltd. (a) | | | 99,500 | | | | 3,058,630 | |
| Information Technology 14.1% | |
| Communications Equipment 1.2% | |
| Arris Group, Inc.* (a) | | | 292,375 | | | | 3,394,474 | |
| Computers & Peripherals 1.8% | |
| NCR Corp.* | | | 185,925 | | | | 3,512,123 | |
| Synaptics, Inc.* (a) | | | 59,211 | | | | 1,524,091 | |
| | | | | | | | 5,036,214 | |
| Electronic Equipment, Instruments & Components 2.4% | |
| Arrow Electronics, Inc.* | | | 79,215 | | | | 3,287,423 | |
| Jabil Circuit, Inc. (a) | | | 165,475 | | | | 3,342,595 | |
| | | | | | | | 6,630,018 | |
| IT Services 4.0% | |
| Amdocs Ltd.* | | | 125,900 | | | | 3,826,101 | |
| DST Systems, Inc. | | | 66,125 | | | | 3,491,400 | |
| ManTech International Corp. "A" (a) | | | 85,625 | | | | 3,803,463 | |
| | | | | | | | 11,120,964 | |
| Semiconductors & Semiconductor Equipment 3.4% | |
| Microsemi Corp.* | | | 156,150 | | | | 3,201,075 | |
| PMC-Sierra, Inc.* | | | 452,625 | | | | 3,426,371 | |
| Teradyne, Inc.* (a) | | | 191,775 | | | | 2,838,270 | |
| | | | | | | | 9,465,716 | |
| Software 1.3% | |
| Synopsys, Inc.* (a) | | | 138,575 | | | | 3,562,763 | |
| Materials 5.9% | |
| Chemicals 1.6% | |
| Lubrizol Corp. | | | 32,900 | | | | 4,417,483 | |
| | | Shares | | | Value ($) | |
| | | | | | | | | |
| Containers & Packaging 1.0% | |
| Owens-Illinois, Inc.* | | | 108,925 | | | | 2,811,354 | |
| Metals & Mining 3.3% | |
| Coeur d'Alene Mines Corp.* (a) | | | 116,350 | | | | 2,822,651 | |
| IAMGOLD Corp. | | | 158,475 | | | | 2,972,991 | |
| Reliance Steel & Aluminum Co. (a) | | | 68,800 | | | | 3,415,920 | |
| | | | | | | | 9,211,562 | |
| Utilities 4.0% | |
| Electric Utilities 1.4% | |
| Portland General Electric Co. | | | 150,350 | | | | 3,800,848 | |
| Gas Utilities 1.4% | |
| AGL Resources, Inc. (a) | | | 94,875 | | | | 3,862,361 | |
| Multi-Utilities 1.2% | |
| Ameren Corp. (a) | | | 121,650 | | | | 3,508,386 | |
Total Common Stocks (Cost $216,050,685) | | | | 266,823,663 | |
| | |
| Securities Lending Collateral 40.1% | |
| Daily Assets Fund Institutional, 0.13% (b) (c) (Cost $111,665,965) | | | 111,665,965 | | | | 111,665,965 | |
| | |
| Cash Equivalents 4.1% | |
| Central Cash Management Fund, 0.11% (b) (Cost $11,439,080) | | | 11,439,080 | | | | 11,439,080 | |
| | | % of Net Assets | | | Value ($) | |
| | | | |
Total Investment Portfolio (Cost $339,155,730)+ | | | 140.1 | | | | 389,928,708 | |
| Other Assets and Liabilities, Net | | | (40.1 | ) | | | (111,627,763 | ) |
| Net Assets | | | 100.0 | | | | 278,300,945 | |
* Non-income producing security.
+ The cost for federal income tax purposes was $340,118,310. At June 30, 2011, net unrealized appreciation for all securities based on tax cost was $49,810,398. This consisted of aggregate gross unrealized appreciation for all securities in which there was an excess of value over tax cost of $62,341,834 and aggregate gross unrealized depreciation for all securities in which there was an excess of tax cost over value of $12,531,436.
(a) All or a portion of these securities were on loan (see Notes to Financial Statements). The value of all securities loaned at June 30, 2011 amounted to $110,095,962, which is 39.6% of net assets.
(b) Affiliated fund managed by Deutsche Investment Management Americas Inc. The rate shown is the annualized seven-day yield at period end.
(c) Represents collateral held in connection with securities lending. Income earned by the Fund is net of borrower rebates.
REIT: Real Estate Investment Trust
Fair Value Measurements
Various inputs are used in determining the value of the Fund's investments. These inputs are summarized in three broad levels. Level 1 includes quoted prices in active markets for identical securities. Level 2 includes other significant observable inputs (including quoted prices for similar securities, interest rates, prepayment speeds, and credit risk). Level 3 includes significant unobservable inputs (including the Fund's own assumptions in determining the fair value of investments). The inputs or methodology used for valuing securities are not necessarily an indication of the risk associated with investing in those securities.
The following is a summary of the inputs used as of June 30, 2011 in valuing the Fund's investments. For information on the Fund's policy regarding the valuation of investments, please refer to the Security Valuation section of Note A in the accompanying Notes to Financial Statements.
| Assets | | Level 1 | | | Level 2 | | | Level 3 | | | Total | |
| | |
| Common Stocks (d) | | $ | 266,823,663 | | | $ | — | | | $ | — | | | $ | 266,823,663 | |
| Short-Term Investments (d) | | | 123,105,045 | | | | — | | | | — | | | | 123,105,045 | |
| Total | | $ | 389,928,708 | | | $ | — | | | $ | — | | | $ | 389,928,708 | |
There have been no transfers between Level 1 and Level 2 fair value measurements during the period ended June 30, 2011.
(d) See Investment Portfolio for additional detailed categorizations.
The accompanying notes are an integral part of the financial statements.
Statement of Assets and Liabilities | as of June 30, 2011 (Unaudited) | |
| Assets | |
Investments: Investments in non-affiliated securities, at value (cost $216,050,685) — including $110,095,962 of securities loaned | | $ | 266,823,663 | |
| Investment in Daily Assets Fund Institutional (cost $111,665,965)* | | | 111,665,965 | |
| Investment in Central Cash Management Fund (cost $11,439,080) | | | 11,439,080 | |
| Total investments in securities, at value (cost $339,155,730) | | | 389,928,708 | |
| Cash | | | 10,000 | |
| Receivable for investments sold | | | 54,489 | |
| Receivable for Fund shares sold | | | 353,593 | |
| Dividends receivable | | | 297,602 | |
| Interest receivable | | | 6,389 | |
| Other assets | | | 1,802 | |
| Total assets | | | 390,652,583 | |
| Liabilities | |
| Payable upon return of securities loaned | | | 111,665,965 | |
| Payable for Fund shares redeemed | | | 434,959 | |
| Accrued management fee | | | 158,990 | |
| Accrued expenses and payables | | | 91,724 | |
| Total liabilities | | | 112,351,638 | |
| Net assets, at value | | $ | 278,300,945 | |
| Net Assets Consist of: | |
| Undistributed net investment income | | | 1,070,064 | |
| Net unrealized appreciation (depreciation) on investments | | | 50,772,978 | |
| Accumulated net realized gain (loss) | | | (83,070,722 | ) |
| Paid-in capital | | | 309,528,625 | |
| Net assets, at value | | $ | 278,300,945 | |
Class A Net Asset Value, offering and redemption price per share ($252,284,899 ÷ 19,956,897 outstanding shares of beneficial interest, no par value, unlimited number of shares authorized) | | $ | 12.64 | |
Class B Net Asset Value, offering and redemption price per share ($26,016,046 ÷ 2,055,404 outstanding shares of beneficial interest, no par value, unlimited number of shares authorized) | | $ | 12.66 | |
* Represents collateral on securities loaned.
The accompanying notes are an integral part of the financial statements.
Statement of Operations
| for the six months ended June 30, 2011 (Unaudited) | |
| Investment Income | |
Income: Dividends (net of foreign taxes witheld of $2,375) | | $ | 2,236,813 | |
| Income distributions — Central Cash Management Fund | | | 7,649 | |
| Securities lending income, including income from Daily Assets Fund Institutional, net of borrower rebates | | | 36,336 | |
| Total income | | | 2,280,798 | |
Expenses: Management fee | | | 906,528 | |
| Administration fee | | | 140,216 | |
| Services to shareholders | | | 4,063 | |
| Distribution service fee (Class B) | | | 32,966 | |
| Record keeping fees (Class B) | | | 11,384 | |
| Custodian fee | | | 6,848 | |
| Professional fees | | | 31,675 | |
| Trustees fees and expenses | | | 4,918 | |
| Reports to shareholders | | | 33,105 | |
| Other | | | 7,617 | |
| Total expenses | | | 1,179,320 | |
| Net investment income (loss) | | | 1,101,478 | |
| Realized and Unrealized Gain (Loss) | |
| Net realized gain (loss) from investments | | | 21,393,064 | |
| Change in net unrealized appreciation (depreciation) on investments | | | (9,922,300 | ) |
| Net gain (loss) | | | 11,470,764 | |
| Net increase (decrease) in net assets resulting from operations | | $ | 12,572,242 | |
The accompanying notes are an integral part of the financial statements.
Statement of Changes in Net Assets | Increase (Decrease) in Net Assets | | Six Months Ended June 30, 2011 (Unaudited) | | | Year Ended December 31, 2010 | |
Operations: Net investment income (loss) | | $ | 1,101,478 | | | $ | 2,826,446 | |
| Net realized gain (loss) | | | 21,393,064 | | | | 30,809,807 | |
| Change in net unrealized appreciation (depreciation) | | | (9,922,300 | ) | | | 18,581,828 | |
| Net increase (decrease) in net assets resulting from operations | | | 12,572,242 | | | | 52,218,081 | |
Distributions to shareholders from: Net investment income: Class A | | | (2,506,080 | ) | | | (3,068,046 | ) |
| Class B | | | (161,946 | ) | | | (217,515 | ) |
| Total distributions | | | (2,668,026 | ) | | | (3,285,561 | ) |
Fund share transactions: Class A Proceeds from shares sold | | | 20,769,273 | | | | 28,003,012 | |
| Reinvestment of distributions | | | 2,506,080 | | | | 3,068,046 | |
| Payments for shares redeemed | | | (27,424,088 | ) | | | (62,437,627 | ) |
| Net increase (decrease) in net assets from Class A share transactions | | | (4,148,735 | ) | | | (31,366,569 | ) |
Class B Proceeds from shares sold | | | 2,095,735 | | | | 3,472,987 | |
| Reinvestment of distributions | | | 161,946 | | | | 217,515 | |
| Payments for shares redeemed | | | (3,417,429 | ) | | | (5,804,013 | ) |
| Net increase (decrease) in net assets from Class B share transactions | | | (1,159,748 | ) | | | (2,113,511 | ) |
| Increase (decrease) in net assets | | | 4,595,733 | | | | 15,452,440 | |
| Net assets at beginning of period | | | 273,705,212 | | | | 258,252,772 | |
| Net assets at end of period (including undistributed net investment income of $1,070,064 and $2,636,612, respectively) | | $ | 278,300,945 | | | $ | 273,705,212 | |
| Other Information | |
Class A Shares outstanding at beginning of period | | | 20,271,172 | | | | 23,383,684 | |
| Shares sold | | | 1,635,347 | | | | 2,611,387 | |
| Shares issued to shareholders in reinvestment of distributions | | | 187,021 | | | | 271,509 | |
| Shares redeemed | | | (2,136,643 | ) | | | (5,995,408 | ) |
| Net increase (decrease) in Class A shares | | | (314,275 | ) | | | (3,112,512 | ) |
| Shares outstanding at end of period | | | 19,956,897 | | | | 20,271,172 | |
Class B Shares outstanding at beginning of period | | | 2,147,844 | | | | 2,341,698 | |
| Shares sold | | | 163,074 | | | | 327,236 | |
| Shares issued to shareholders in reinvestment of distributions | | | 12,067 | | | | 19,214 | |
| Shares redeemed | | | (267,581 | ) | | | (540,304 | ) |
| Net increase (decrease) in Class B shares | | | (92,440 | ) | | | (193,854 | ) |
| Shares outstanding at end of period | | | 2,055,404 | | | | 2,147,844 | |
The accompanying notes are an integral part of the financial statements.
| | | | | Years Ended December 31, | |
| Class A | | Six Months Ended 6/30/11 (Unaudited) | 2010 | | 2009 | | | 2008 | | | 2007 | | | 2006 | |
| Selected Per Share Data | |
| Net asset value, beginning of period | | $ | 12.21 | | | $ | 10.04 | | | $ | 7.93 | | | $ | 20.12 | | | $ | 22.93 | | | $ | 19.98 | |
Income (loss) from investment operations: Net investment incomea | | | .05 | | | | .12 | | | | .16 | | | | .13 | | | | .18 | | | | .15 | |
| Net realized and unrealized gain (loss) | | | .51 | | | | 2.19 | | | | 2.11 | | | | (4.92 | ) | | | .54 | | | | 4.69 | |
| Total from investment operations | | | .56 | | | | 2.31 | | | | 2.27 | | | | (4.79 | ) | | | .72 | | | | 4.84 | |
Less distributions from: Net investment income | | | (.13 | ) | | | (.14 | ) | | | (.16 | ) | | | (.29 | ) | | | (.23 | ) | | | (.18 | ) |
| Net realized gains | | | — | | | | — | | | | — | | | | (7.11 | ) | | | (3.30 | ) | | | (1.71 | ) |
| Total distributions | | | (.13 | ) | | | (.14 | ) | | | (.16 | ) | | | (7.40 | ) | | | (3.53 | ) | | | (1.89 | ) |
| Net asset value, end of period | | $ | 12.64 | | | $ | 12.21 | | | $ | 10.04 | | | $ | 7.93 | | | $ | 20.12 | | | $ | 22.93 | |
| Total Return (%) | | | 4.50 | ** | | | 23.07 | | | | 29.70 | | | | (33.42 | )b | | | 3.06 | | | | 25.06 | |
| Ratios to Average Net Assets and Supplemental Data | |
| Net assets, end of period ($ millions) | | | 252 | | | | 247 | | | | 235 | | | | 223 | | | | 468 | | | | 562 | |
| Ratio of expenses before expense reductions (%) | | | .81 | * | | | .82 | | | | .79 | | | | .83 | | | | .78 | | | | .79 | |
| Ratio of expenses after expense reductions (%) | | | .81 | * | | | .82 | | | | .79 | | | | .82 | | | | .78 | | | | .79 | |
| Ratio of net investment income (%) | | | .82 | * | | | 1.14 | | | | 1.92 | | | | 1.13 | | | | .85 | | | | .71 | |
| Portfolio turnover rate (%) | | | 20 | ** | | | 38 | | | | 72 | | | | 49 | | | | 110 | | | | 52 | |
a Based on average shares outstanding during the period. b Total return would have been lower had certain expenses not been reduced. * Annualized ** Not annualized | |
| | | | | Years Ended December 31, | |
| Class B | | Six Months Ended 6/30/11 (Unaudited) | | | 2009 | | | 2008 | | | 2007 | | | 2006 | |
| Selected Per Share Data | |
| Net asset value, beginning of period | | $ | 12.20 | | | $ | 10.03 | | | $ | 7.92 | | | $ | 20.08 | | | $ | 22.88 | | | $ | 19.93 | |
Income (loss) from investment operations: Net investment incomea | | | .03 | | | | .08 | | | | .13 | | | | .09 | | | | .10 | | | | .07 | |
| Net realized and unrealized gain (loss) | | | .51 | | | | 2.19 | | | | 2.12 | | | | (4.92 | ) | | | .54 | | | | 4.67 | |
| Total from investment operations | | | .54 | | | | 2.27 | | | | 2.25 | | | | (4.83 | ) | | | .64 | | | | 4.74 | |
Less distributions from: Net investment income | | | (.08 | ) | | | (.10 | ) | | | (.14 | ) | | | (.22 | ) | | | (.14 | ) | | | (.08 | ) |
| Net realized gains | | | — | | | | — | | | | — | | | | (7.11 | ) | | | (3.30 | ) | | | (1.71 | ) |
| Total distributions | | | (.08 | ) | | | (.10 | ) | | | (.14 | ) | | | (7.33 | ) | | | (3.44 | ) | | | (1.79 | ) |
| Net asset value, end of period | | $ | 12.66 | | | $ | 12.20 | | | $ | 10.03 | | | $ | 7.92 | | | $ | 20.08 | | | $ | 22.88 | |
| Total Return (%) | | | 4.39 | ** | | | 22.66 | | | | 29.28 | | | | (33.67 | )b | | | 2.67 | | | | 24.59 | |
| Ratios to Average Net Assets and Supplemental Data | |
| Net assets, end of period ($ millions) | | | 26 | | | | 26 | | | | 23 | | | | 24 | | | | 34 | | | | 90 | |
| Ratio of expenses before expense reductions (%) | | | 1.15 | * | | | 1.17 | | | | 1.14 | | | | 1.18 | | | | 1.16 | | | | 1.17 | |
| Ratio of expenses after expense reductions (%) | | | 1.15 | * | | | 1.17 | | | | 1.14 | | | | 1.17 | | | | 1.16 | | | | 1.17 | |
| Ratio of net investment income (%) | | | .48 | * | | | .79 | | | | 1.57 | | | | .78 | | | | .47 | | | | .33 | |
| Portfolio turnover rate (%) | | | 20 | ** | | | 38 | | | | 72 | | | | 49 | | | | 110 | | | | 52 | |
a Based on average shares outstanding during the period. b Total return would have been lower had certain expenses not been reduced. * Annualized ** Not annualized | |
Notes to Financial Statements (Unaudited)
A. Organization and Significant Accounting Policies
DWS Dreman Small Mid Cap Value VIP (the "Fund") is a diversified series of DWS Variable Series II (the "Trust"), which is registered under the Investment Company Act of 1940, as amended (the "1940 Act"), as an open-end management investment company organized as a Massachusetts business trust.
Multiple Classes of Shares of Beneficial Interest. The Fund offers two classes of shares (Class A shares and Class B shares). Sales of Class B shares are subject to recordkeeping fees up to 0.15% and Rule 12b-1 fees under the 1940 Act equal to an annual rate of 0.25% of the average daily net assets of the Class B shares of the Fund. Class A shares are not subject to such fees.
Investment income, realized and unrealized gains and losses, and certain fund-level expenses and expense reductions, if any, are borne pro rata on the basis of relative net assets by the holders of all classes of shares except that each class bears certain expenses unique to that class (including the applicable Rule 12b-1 fee and recordkeeping fees). Differences in class-level expenses may result in payment of different per share dividends by class. All shares have equal rights with respect to voting subject to class-specific arrangements.
The Fund's financial statements are prepared in accordance with accounting principles generally accepted in the United States of America which require the use of management estimates. Actual results could differ from those estimates. The policies described below are followed consistently by the Fund in the preparation of its financial statements.
Security Valuation. Investments are stated at value determined as of the close of regular trading on the New York Stock Exchange on each day the exchange is open for trading.
Various inputs are used in determining the value of the Fund's investments. These inputs are summarized in three broad levels. Level 1 includes quoted prices in active markets for identical securities. Level 2 includes other significant observable inputs (including quoted prices for similar securities, interest rates, prepayment speeds, and credit risk). Level 3 includes significant unobservable inputs (including the Fund's own assumptions in determining the fair value of investments). The inputs or methodology used for valuing securities are not necessarily an indication of the risk associated with investing in those securities.
Equity securities are valued at the most recent sale price or official closing price reported on the exchange (US or foreign) or over-the-counter market on which they trade and are categorized as Level 1 securities. Securities for which no sales are reported are valued at the calculated mean between the most recent bid and asked quotations on the relevant market or, if a mean cannot be determined, at the most recent bid quotation.
Money market instruments purchased with an original or remaining maturity of sixty days or less, maturing at par, are valued at amortized cost, which approximates value, and are categorized as Level 2. Investments in open-end investment companies are valued at their net asset value each business day and are categorized as Level 1.
Securities and other assets for which market quotations are not readily available or for which the above valuation procedures are deemed not to reflect fair value are valued in a manner that is intended to reflect their fair value as determined in accordance with procedures approved by the Board and are generally categorized as Level 3. In accordance with the Fund's valuation procedures, factors used in determining value may include, but are not limited to, the type of the security; the size of the holding; the initial cost of the security; the existence of any contractual restrictions on the security's disposition; the price and extent of public trading in similar securities of the issuer or of comparable companies; quotations or evaluated prices from broker-dealers and/or pricing services; information obtained from the issuer, analysts, and/or the appropriate stock exchange (for exchange-traded securities); an analysis of the company's or issuer's financial statements; an evaluation of the forces that influence the issuer and the market(s) in which the security is purchased and sold and with respect to debt securities; the maturity, coupon, creditworthiness, currency denomination and the movement of the market in which the security is normally traded. The value determined under these procedures may differ from published values for the same securities.
Disclosure about the classification of fair value measurements is included in a table following the Fund's Investment Portfolio.
Foreign Currency Translations. The books and records of the Fund are maintained in US dollars. Investment securities and other assets and liabilities denominated in a foreign currency are translated into US dollars at the prevailing exchange rates at period end. Purchases and sales of investment securities, income and expenses are translated into US dollars at the prevailing exchange rates on the respective dates of the transactions.
Net realized and unrealized gains and losses on foreign currency transactions represent net gains and losses between trade and settlement dates on securities transactions, the acquisition and disposition of foreign currencies, and the difference between the amount of net investment income accrued and the US dollar amount actually received. That portion of both realized and unrealized gains and losses on investments that results from fluctuations in foreign currency exchange rates is not separately disclosed but is included with net realized and unrealized gain/appreciation and loss/depreciation on investments.
Securities Lending. The Fund lends securities to certain financial institutions. The Fund retains beneficial ownership of the securities it has loaned and continues to receive interest and dividends paid by the issuer of securities and to participate in any changes in their market value. The Fund requires the borrowers of the securities to maintain collateral with the Fund consisting of either cash or liquid, unencumbered assets having a value at least equal to the value of the securities loaned. When the collateral falls below specified amounts, the lending agent will use its best effort to obtain additional collateral on the next business day to meet required amounts under the security lending agreement. The Fund may invest the cash collateral into a joint trading account in an affiliated money market fund pursuant to Exemptive Orders issued by the SEC. The Fund receives compensation for lending its securities either in the form of fees or by earning interest on invested cash collateral net of borrower rebates and fees paid to a lending agent. Either the Fund or the borrower may terminate the loan. There may be risks of delay and costs in recovery of securities or even loss of rights in the collateral should the borrower of the securities fail financially. The Fund is also subject to all investment risks associated with the reinvestment of any cash collateral received, including, but not limited to, interest rate, credit and liquidity risk associated with such investments.
Federal Income Taxes. The Fund's policy is to comply with the requirements of the Internal Revenue Code, as amended, which are applicable to regulated investment companies and to distribute all of its taxable income to its shareholders.
At December 31, 2010, the Fund had a net tax basis capital loss carryforward of approximately $103,501,000, which may be applied against any realized net taxable capital gains of each succeeding year until fully utilized or until December 31, 2016 ($10,090,000) and December 31, 2017 ($93,411,000), the respective expiration dates, whichever occurs first.
On December 22, 2010, the Regulated Investment Company Modernization Act of 2010 (the "Act") was enacted. Under the Act, net capital losses may be carried forward indefinitely, and their character is retained as short-term and/or long-term losses. Previously, net capital losses were carried forward for eight years and treated as short-term losses. As a transition rule, the Act requires that post-enactment net capital losses be used before pre-enactment net capital losses. As a result of this ordering rule, pre-enactment capital loss carryforwards may expire unused, whereas under the previous rules these losses may have been utilized. This change is effective for fiscal years beginning after the date of enactment.
The Fund has reviewed the tax positions for the open tax years as of December 31, 2010 and has determined that no provision for income tax is required in the Fund's financial statements. The Fund's federal tax returns for the prior three fiscal years remain open subject to examination by the Internal Revenue Service.
Distribution of Income and Gains. Net investment income of the Fund, if any, is declared and distributed to shareholders annually. Net realized gains from investment transactions, in excess of available capital loss carryforwards, would be taxable to the Fund if not distributed and, therefore, will be distributed to shareholders at least annually. The Fund may also make additional distributions for tax purposes if necessary.
The timing and characterization of certain income and capital gains distributions are determined annually in accordance with federal tax regulations which may differ from accounting principles generally accepted in the United States of America. These differences primarily relate to income received from Real Estate Investment Trusts and certain securities sold at a loss. As a result, net investment income (loss) and net realized gain (loss) on investment transactions for a reporting period may differ significantly from distributions during such period. Accordingly, the Fund may periodically make reclassifications among certain of its capital accounts without impacting the net asset value of the Fund.
The tax character of current year distributions will be determined at the end of the current fiscal year.
Expenses. Expenses of the Trust arising in connection with a specific fund are allocated to that fund. Other Trust expenses which cannot be directly attributed to a fund are apportioned among the funds in the Trust.
Contingencies. In the normal course of business, the Fund may enter into contracts with service providers that contain general indemnification clauses. The Fund's maximum exposure under these arrangements is unknown as this would involve future claims that may be made against the Fund that have not yet been made. However, based on experience, the Fund expects the risk of loss to be remote.
Real Estate Investment Trusts. The Fund periodically recharacterizes distributions received from a Real Estate Investment Trust ("REIT") investment based on information provided by the REIT into the following categories: ordinary income, long-term and short-term capital gains, and return of capital. If information is not available timely from a REIT, the recharacterization will be estimated for financial reporting purposes and a recharacterization will be made to the accounting records in the following year when such information becomes available. Distributions received from REITs in excess of income are recorded as either a reduction of cost of investments or realized gains. The Fund distinguishes between dividends on a tax basis and a financial reporting basis and only distributions in excess of tax basis earnings and profits are reported in the financial statements as a return of capital.
Other. Investment transactions are accounted for on a trade date plus one basis for daily net asset value calculations. However, for financial reporting purposes, investment transactions are reported on trade date. Interest income is recorded on the accrual basis. Dividend income is recorded on the ex-dividend date net of foreign withholding taxes. Realized gains and losses from investment transactions are recorded on an identified cost basis and may include proceeds from litigation.
B. Purchases and Sales of Securities
During the six months ended June 30, 2011, purchases and sales of investment transactions (excluding short-term investments) aggregated $55,002,638 and $70,624,642, respectively.
C. Related Parties
Management Agreement. Under the Investment Management Agreement with Deutsche Investment Management Americas Inc. ("DIMA" or the "Advisor"), an indirect, wholly owned subsidiary of Deutsche Bank AG, the Advisor directs the investments of the Fund in accordance with its investment objectives, policies and restrictions. The Advisor determines the securities, instruments and other contracts relating to investments to be purchased, sold or entered into by the Fund or delegates such responsibility to the Fund's subadvisor.
Dreman Value Management, L.L.C. ("DVM") serves as subadvisor. As a subadvisor to the Fund, DVM makes investment decisions and buys and sells securities for the Fund. DVM is paid by the Advisor for the services DVM provides to the Fund.
Pursuant to the Investment Management Agreement with the Advisor, the Fund pays a monthly management fee based on the Fund's average daily net assets, computed and accrued daily and payable monthly, at the following annual rates:
| $0-$250 million | | | .650 | % |
| Next $750 million | | | .620 | % |
| Next $1.5 billion | | | .600 | % |
| Next $2.5 billion | | | .580 | % |
| Next $2.5 billion | | | .550 | % |
| Next $2.5 billion | | | .540 | % |
| Next $2.5 billion | | | .530 | % |
| Over $12.5 billion | | | .520 | % |
Accordingly, for the six months ended June 30, 2011, the fee pursuant to the Investment Management Agreement was equivalent to an annualized effective rate of 0.65% of the Fund's average daily net assets.
Administration Fee. Pursuant to an Administrative Services Agreement, DIMA provides most administrative services to the Fund. For all services provided under the Administrative Services Agreement, the Fund pays DIMA an annual fee ("Administration Fee") of 0.10% of the Fund's average daily net assets, computed and accrued daily and payable monthly. For the six months ended June 30, 2011, the Administration Fee was $140,216, of which $22,449 is unpaid.
Service Provider Fees. DWS Investments Service Company ("DISC"), an affiliate of the Advisor, is the transfer agent, dividend-paying agent and shareholder service agent for the Fund. Pursuant to a sub-transfer agency agreement between DISC and DST Systems, Inc. ("DST"), DISC has delegated certain transfer agent, dividend-paying agent and shareholder service agent functions to DST. DISC compensates DST out of the shareholder servicing fee it receives from the Fund. For the six months ended June 30, 2011, the amounts charged to the Fund by DISC were as follows:
| Service to Shareholders | | Total Aggregated | | | Unpaid at June 30, 2011 | |
| Class A | | $ | 313 | | | $ | 225 | |
| Class B | | | 194 | | | | 134 | |
| | | $ | 507 | | | $ | 359 | |
Distribution Service Agreement. Under the Fund's Class B 12b-1 plans, DWS Investments Distributors, Inc. ("DIDI") received a fee ("Distribution Service Fee") of 0.25% of average daily net assets of Class B shares. For the six months ended June 30, 2011, the Distribution Service Fee aggregated $32,966, of which $5,242 is unpaid.
Typesetting and Filing Service Fees. Under an agreement with DIMA, DIMA is compensated for providing typesetting and certain regulatory filing services to the Fund. For the six months ended June 30, 2011, the amount charged to the Fund by DIMA included in the Statement of Operations under "reports to shareholders" aggregated $10,031, of which $3,367 is unpaid.
Trustees' Fees and Expenses. The Fund paid each Trustee not affiliated with the Advisor retainer fees plus specified amounts for various committee services and for the Board Chairperson.
Affiliated Cash Management Vehicle. The Fund may invest uninvested cash balances in Central Cash Management Fund, which is managed by the Advisor. The Fund indirectly bears its proportionate share of the expenses of Central Cash Management Fund. Central Cash Management Fund does not pay the Advisor an investment management fee. Central Cash Management Fund seeks a high level of current income consistent with liquidity and the preservation of capital.
D. Ownership of the Fund
At June 30, 2011, three Participating Insurance Companies were owners of record of 10% or more of the total outstanding Class A shares of the Fund, each owning 38%, 25% and 14%. Four participating Insurance Companies were owners of record of 10% or more of the total outstanding Class B shares of the Fund, each owning 39%, 18%, 11% and 11%.
E. Line of Credit
The Fund and other affiliated funds (the "Participants") share in a $450 million revolving credit facility provided by a syndication of banks. The Fund may borrow for temporary or emergency purposes, including the meeting of redemption requests that otherwise might require the untimely disposition of securities. The Participants are charged an annual commitment fee which is allocated based on net assets, among each of the Participants. Interest is calculated at a rate per annum equal to the sum of the Federal Funds Rate plus 1.25 percent plus if LIBOR exceeds the Federal Funds Rate the amount of such excess. The Fund may borrow up to a maximum of 33 percent of its net assets under the agreement. The Fund had no outstanding loans at June 30, 2011.
The Trust's policies and procedures for voting proxies for portfolio securities and information about how the Trust voted proxies related to its portfolio securities during the 12-month period ended June 30 are available on our Web site — www.dws-investments.com (click on "proxy voting" at the bottom of the page) — or on the SEC's Web site — www.sec.gov. To obtain a written copy of the Trust's policies and procedures without charge, upon request, call us toll free at (800) 728-3337.
Summary of Management Fee Evaluation by Independent Fee Consultant
October 3, 2010
Pursuant to an Order entered into by Deutsche Investment Management Americas and affiliates (collectively, "DeAM") with the Attorney General of New York, I, Thomas H. Mack, have been appointed the Independent Fee Consultant for the DWS Funds (formerly the DWS Scudder Funds). My duties include preparing an annual written evaluation of the management fees DeAM charges the Funds, considering among other factors the management fees charged by other mutual fund companies for like services, management fees DeAM charges other clients for like services, DeAM's costs of supplying services under the management agreements and related profit margins, possible economies of scale if a Fund grows larger, and the nature and quality of DeAM's services, including fund performance. This report summarizes my evaluation for 2010, including my qualifications, the evaluation process for each of the DWS Funds, consideration of certain complex-level factors, and my conclusions. I served in substantially the same capacity in 2007, 2008, and 2009.
Qualifications
For more than 35 years I have served in various professional capacities within the investment management business. I have held investment analysis and advisory positions, including securities analyst, portfolio strategist and director of investment policy with a large investment firm. I have also performed business management functions, including business development, financial management and marketing research and analysis.
Since 1991, I have been an independent consultant within the asset management industry. I have provided services to over 125 client organizations, including investment managers, mutual fund boards, product distributors and related organizations. Over the past ten years I have completed a number of assignments for mutual fund boards, specifically including assisting boards with management contract renewal.
I hold a Master of Business Administration degree, with highest honors, from Harvard University and Master of Science and Bachelor of Science (highest honors) degrees from the University of California at Berkeley. I am an independent director and audit committee financial expert for two closed-end mutual funds and have served in various leadership and financial oversight capacities with non-profit organizations.
Evaluation of Fees for each DWS Fund
My work focused primarily on evaluating, fund-by-fund, the fees charged to each of the 118 publicly offered Fund portfolios in the DWS Fund family. For each Fund, I considered each of the key factors mentioned above, as well as any other relevant information. In doing so I worked closely with the Funds' Independent Directors in their annual contract renewal process, as well as in their approval of contracts for several new funds (documented separately).
In evaluating each Fund's fees, I reviewed comprehensive materials provided by or on behalf of DeAM, including expense information prepared by Lipper Analytical, comparative performance information, profitability data, manager histories, and other materials. I also accessed certain additional information from the Lipper and Morningstar databases and drew on my industry knowledge and experience.
To facilitate evaluating this considerable body of information, I prepared for each Fund a document summarizing the key data elements in each area as well as additional analytics discussed below. This made it possible to consider each key data element in the context of the others.
In the course of contract renewal, DeAM agreed to implement a number of fee and expense adjustments requested by the Independent Directors which will favorably impact future fees and expenses, and my evaluation includes the effects of these changes.
Fees and Expenses Compared with Other Funds
The competitive fee and expense evaluation for each fund focused on two primary comparisons:
The Fund's contractual management fee (the advisory fee plus the administration fee where applicable) compared with those of a group of typically 12-15 funds in the same Lipper investment category (e.g. Large Capitalization Growth) having similar distribution arrangements and being of similar size.
The Fund's total expenses compared with a broader universe of funds from the same Lipper investment category and having similar distribution arrangements.
These two comparisons provide a view of not only the level of the fee compared with funds of similar scale but also the total expense the Fund bears for all the services it receives, in comparison with the investment choices available in the Fund's investment category and distribution channel. The principal figure-of-merit used in these comparisons was the subject Fund's percentile ranking against peers.
DeAM's Fees for Similar Services to Others
DeAM provided management fee schedules for all of its US domiciled fund and non-fund investment management accounts in any of the investment categories where there is a DWS Fund. These similar products included the other DWS Funds, non-fund pooled accounts, institutional accounts and sub-advisory accounts. Using this information, I calculated for each Fund the fee that would be charged to each similar product, at the subject Fund's asset level.
Evaluating information regarding non-fund products is difficult because there are varying levels of services required for different types of accounts, with mutual funds generally requiring considerably more regulatory and administrative types of service as well as having more frequent cash flows than other types of accounts. Also, while mutual fund fees for similar fund products can be expected to be similar, there will be some differences due to different pricing conditions in different distribution channels (e.g. retail funds versus those used in variable insurance products), differences in underlying investment processes and other factors.
Costs and Profit Margins
DeAM provided a detailed profitability analysis for each Fund. After making some adjustments so that the presentation would be more comparable to the available industry figures, I reviewed profit margins from investment management alone, from investment management plus other fund services (excluding distribution) provided to the Funds by DeAM (principally shareholder services), and DeAM profits from all sources, including distribution. A later section comments on overall profitability.
Economies of Scale
Economies of scale — an expected decline in management cost per dollar of fund assets as fund assets grow — are very rarely quantified and documented because of inherent difficulties in collecting and analyzing relevant data. However, in virtually every investment category that I reviewed, larger funds tend to have lower fees and lower total expenses than smaller funds. To see how each DWS Fund compares with this industry observation, I reviewed:
The trend in Fund assets over the last five years and the accompanying trend in total expenses. This shows if the Fund has grown and, if so, whether total expense (management fees as well as other expenses) have declined as a percent of assets.
Whether the Fund has break-points in its management fee schedule, the extent of the fee reduction built into the schedule and the asset levels where the breaks take effect, and in the case of a sub-advised Fund how the Fund's break-points compare with those of the sub-advisory fee schedule.
How the Fund's contractual fee schedule compares with trends in the industry data. To accomplish this, I constructed a chart showing how actual latest-fiscal-year contractual fees of the Fund and of other similar funds relate to average fund assets, with the subject Fund's contractual fee schedule superimposed.
Quality of Service — Performance
The quality-of-service evaluation focused on investment performance, which is the principal result of the investment management service. Each Fund's performance was reviewed over the past 1, 3, 5 and 10 years, as applicable, and compared with that of other funds in the same investment category and with a suitable market index.
In addition, I calculated and reviewed risk-adjusted returns relative to an index of similar mutual funds' returns and a suitable market index. The risk-adjusted returns analysis provides a way of determining the extent to which the Fund's return comparisons are mainly the product of investment value-added (or lack thereof) or alternatively taking considerably more or less risk than is typical in its investment category.
I also received and considered the history of portfolio manager changes for each Fund, as this provided an important context for evaluating the performance results.
Complex-Level Considerations
While this evaluation was conducted mainly at the individual fund level, there are some issues relating to the reasonableness of fees that can alternatively be considered across the whole fund complex:
I reviewed DeAM's profitability analysis for all DWS Funds, with a view toward determining if the allocation procedures used were reasonable and how profit levels compared with public data for other investment managers.
I considered whether DeAM and affiliates receive any significant ancillary or "fall-out" benefits that should be considered in interpreting the direct profitability results. These would be situations where serving as the investment manager of the Funds is beneficial to another part of the Deutsche Bank organization.
I considered how aggregated DWS Fund expenses had varied over the years, by asset class and in the context of trends in asset levels.
I reviewed the structure of the DeAM organization, trends in staffing levels, and information on compensation of investment management and other professionals compared with industry data.
Findings
Based on the process and analysis discussed above, which included reviewing a wide range of information from management and external data sources and considering among other factors the fees DeAM charges other clients, the fees charged by other fund managers, DeAM's costs and profits associated with managing the Funds, economies of scale, possible fall-out benefits, and the nature and quality of services provided, in my opinion the management fees charged the DWS Funds are reasonable.
Thomas H. Mack
Notes
DWS Investments Distributors, Inc.
222 South Riverside Plaza
Chicago, IL 60606
(800) 621-1148
VS2DSMC-3 (R-023294-1 8/11)
JUNE 30, 2011
SEMIANNUAL REPORT
DWS VARIABLE SERIES II
DWS Global Thematic VIP
Contents
3 Performance Summary 4 Information About Your Fund's Expenses 5 Portfolio Summary 6 Investment Portfolio 10 Statement of Assets and Liabilities 11 Statement of Operations 12 Statement of Changes in Net Assets 14 Financial Highlights 16 Notes to Financial Statements 20 Proxy Voting 21 Summary of Management Fee Evaluation by Independent Fee Consultant |
This report must be preceded or accompanied by a prospectus. To obtain an additional prospectus or summary prospectus, if available, call (800) 728-3337 or your financial representative. We advise you to consider the Fund's objectives, risks, charges and expenses carefully before investing. The summary prospectus and prospectus contain this and other important information about the Fund. Please read the prospectus carefully before you invest.
Investing in derivatives entails special risks relating to liquidity, leverage and credit that may reduce returns and/or increase volatility. Investing in foreign securities, particularly those of emerging markets, presents certain risks, such as currency fluctuations, political and economic changes, and market risks. Any decline in value of a Fund security that is out on loan by the Fund will adversely affect performance. Financial failure of the borrower may mean a delay in recovery or loss of rights in the collateral. Stocks may decline in value. See the prospectus for details.
DWS Investments is part of Deutsche Bank's Asset Management division and, within the US, represents the retail asset management activities of Deutsche Bank AG, Deutsche Bank Trust Company Americas, Deutsche Investment Management Americas Inc. and DWS Trust Company.
NOT FDIC/NCUA INSURED NO BANK GUARANTEE MAY LOSE VALUE NOT A DEPOSIT
NOT INSURED BY ANY FEDERAL GOVERNMENT AGENCY
Performance Summary June 30, 2011
Fund performance shown is historical, assumes reinvestment of all dividend and capital gain distributions and does not guarantee future results. Investment return and principal value fluctuate with changing market conditions so that, when redeemed, shares may be worth more or less than their original cost. Current performance may be lower or higher than the performance data quoted. Please contact your participating insurance company for the Fund's most recent month-end performance. Performance doesn't reflect charges and fees ("contract charges") associated with the separate account that invests in the Fund or any variable life insurance policy or variable annuity contract for which the Fund is an investment option. These charges and fees will reduce returns. While all share classes have the same underlying portfolio, their performance will differ.
The gross expense ratios of the Fund, as stated in the fee table of the prospectus dated May 1, 2011 are 1.41% and 1.76% for Class A and Class B shares, respectively, and may differ from the expense ratios disclosed in the Financial Highlights tables in this report.
| Growth of an Assumed $10,000 Investment in DWS Global Thematic VIP |
[] DWS Global Thematic VIP — Class A [] MSCI World Index | The Morgan Stanley Capital International (MSCI) World Index is an unmanaged, capitalization-weighted measure of global stock markets including the US, Canada, Europe, Australia and the Far East. The index is calculated using closing local market prices and translates into US dollars using the London close foreign exchange rates. Index returns do not reflect any fees or expenses and it is not possible to invest directly into an index. |
| |
| Yearly periods ended June 30 | |
| Comparative Results | |
| DWS Global Thematic VIP | | 6-Month‡ | | | 1-Year | | | 3-Year | | | 5-Year | | | 10-Year | |
| Class A | Growth of $10,000 | | $ | 10,382 | | | $ | 12,932 | | | $ | 10,082 | | | $ | 11,060 | | | $ | 17,552 | |
| Average annual total return | | | 3.82 | % | | | 29.32 | % | | | 0.27 | % | | | 2.04 | % | | | 5.79 | % |
| MSCI World Index | Growth of $10,000 | | $ | 10,529 | | | $ | 13,051 | | | $ | 10,140 | | | $ | 11,194 | | | $ | 14,786 | |
| Average annual total return | | | 5.29 | % | | | 30.51 | % | | | 0.47 | % | | | 2.28 | % | | | 3.99 | % |
| DWS Global Thematic VIP | | 6-Month‡ | | | 1-Year | | | 3-Year | | | 5-Year | | | Life of Class* | |
| Class B | Growth of $10,000 | | $ | 10,356 | | | $ | 12,880 | | | $ | 9,967 | | | $ | 10,854 | | | $ | 19,480 | |
| Average annual total return | | | 3.56 | % | | | 28.80 | % | | | -0.11 | % | | | 1.65 | % | | | 7.69 | % |
| MSCI World Index | Growth of $10,000 | | $ | 10,529 | | | $ | 13,051 | | | $ | 10,140 | | | $ | 11,194 | | | $ | 17,439 | |
| Average annual total return | | | 5.29 | % | | | 30.51 | % | | | 0.47 | % | | | 2.28 | % | | | 6.37 | % |
The growth of $10,000 is cumulative.
‡ Total returns shown for periods less than one year are not annualized.
* The Fund commenced offering Class B shares on July 1, 2002. Index returns began on June 30, 2002.
Information About Your Fund's Expenses
As an investor of the Fund, you incur two types of costs: ongoing expenses and transaction costs. Ongoing expenses include management fees, distribution and service (12b-1) fees and other Fund expenses. Examples of transaction costs include contract charges, redemption fees and account maintenance fees, which are not shown in this section. The following tables are intended to help you understand your ongoing expenses (in dollars) of investing in the Fund and to help you compare these expenses with the ongoing expenses of investing in other mutual funds. In the most recent six-month period, the Fund limited these expenses; had it not done so, expenses would have been higher. The example in the table is based on an investment of $1,000 invested at the beginning of the six-month period and held for the entire period (January 1, 2011 to June 30, 2011).
The tables illustrate your Fund's expenses in two ways:
•Actual Fund Return. This helps you estimate the actual dollar amount of ongoing expenses (but not transaction costs) paid on a $1,000 investment in the Fund using the Fund's actual return during the period. To estimate the expenses you paid over the period, simply divide your account value by $1,000 (for example, an $8,600 account value divided by $1,000 = 8.6), then multiply the result by the number in the "Expenses Paid per $1,000" line under the share class you hold.
• Hypothetical 5% Fund Return. This helps you to compare your Fund's ongoing expenses (but not transaction costs) with those of other mutual funds using the Fund's actual expense ratio and a hypothetical rate of return of 5% per year before expenses. Examples using a 5% hypothetical Fund return may be found in the shareholder reports of other mutual funds. The hypothetical account values and expenses may not be used to estimate the actual ending account balance or expenses you paid for the period.
Please note that the expenses shown in these tables are meant to highlight your ongoing expenses only and do not reflect any transaction costs. The "Expenses Paid per $1,000" line of the tables is useful in comparing ongoing expenses only and will not help you determine the relative total expense of owning different funds. If these transaction costs had been included, your costs would have been higher.
Expenses and Value of a $1,000 Investment for the six months ended June 30, 2011 | |
| Actual Fund Return | | Class A | | | Class B | |
| Beginning Account Value 1/1/11 | | $ | 1,000.00 | | | $ | 1,000.00 | |
| Ending Account Value 6/30/11 | | $ | 1,038.20 | | | $ | 1,035.60 | |
| Expenses Paid per $1,000* | | $ | 5.21 | | | $ | 6.97 | |
| Hypothetical 5% Fund Return | | Class A | | | Class B | |
| Beginning Account Value 1/1/11 | | $ | 1,000.00 | | | $ | 1,000.00 | |
| Ending Account Value 6/30/11 | | $ | 1,019.69 | | | $ | 1,017.95 | |
| Expenses Paid per $1,000* | | $ | 5.16 | | | $ | 6.90 | |
* Expenses are equal to the Fund's annualized expense ratio for each share class, multiplied by the average account value over the period, multiplied by the number of days in the most recent six-month period, then divided by 365.
| Annualized Expense Ratios | Class A | | Class B | |
| DWS Variable Series II — DWS Global Thematic VIP | 1.03% | | 1.38% | |
For more information, please refer to the Fund's prospectus.
These tables do not reflect charges and fees ("contract charges") associated with the separate account that invests in the Fund or any variable life insurance policy or variable annuity contract for which the Fund is an investment option.
Asset Allocation (As a % of Investment Portfolio excluding Securities Lending Collateral) | 6/30/11 | 12/31/10 |
| | | |
| Common Stocks | 95% | 94% |
| Participatory Notes | 2% | 3% |
| Preferred Stocks | 2% | 1% |
| Cash Equivalents | 1% | 2% |
| | 100% | 100% |
Sector Diversification (As a % of Investment Portfolio excluding Cash Equivalents and Securities Lending Collateral) | 6/30/11 | 12/31/10 |
| | | |
| Financials | 22% | 21% |
| Information Technology | 15% | 14% |
| Health Care | 12% | 12% |
| Consumer Discretionary | 11% | 6% |
| Industrials | 11% | 11% |
| Materials | 9% | 9% |
| Energy | 7% | 5% |
| Consumer Staples | 6% | 11% |
| Telecommunication Services | 4% | 7% |
| Utilities | 3% | 4% |
| | 100% | 100% |
Geographical Diversification (As a % of Investment Portfolio excluding Cash Equivalents and Securities Lending Collateral) | 6/30/11 | 12/31/10 |
| | | |
| United States | 36% | 32% |
| Continental Europe | 28% | 23% |
| Asia (excluding Japan) | 9% | 8% |
| Latin America | 8% | 8% |
| Japan | 7% | 9% |
| United Kingdom | 4% | 8% |
| Middle East | 3% | 4% |
| Africa | 3% | 4% |
| Bermuda | 1% | 1% |
| Other | 1% | 3% |
| | 100% | 100% |
Asset allocation, sector and geographical diversification are subject to change.
For more complete details about the Fund's investment portfolio, see page 6.
Following the Fund's fiscal first and third quarter-end, a complete portfolio holdings listing is filed with the SEC on Form N-Q. The form will be available on the SEC's Web site at www.sec.gov, and it also may be reviewed and copied at the SEC's Public Reference Room in Washington, D.C. Information on the operation of the SEC's Public Reference Room may be obtained by calling (800) SEC-0330. The Fund's portfolio holdings are also posted on www.dws-investments.com from time to time. Please see the Fund's current prospectus for more information.
Investment Portfolio June 30, 2011 (Unaudited) | | | Shares | | | Value ($) | |
| | | | |
| Common Stocks 94.6% | |
| Australia 0.4% | |
| Centamin Egypt Ltd.* (a) (Cost $312,232) | | | 148,825 | | | | 301,385 | |
| Austria 2.5% | |
| Erste Group Bank AG | | | 24,981 | | | | 1,308,491 | |
| Raiffeisen Bank International AG | | | 6,975 | | | | 358,994 | |
| (Cost $1,121,668) | | | | 1,667,485 | |
| Bahrain 0.4% | |
| Aluminium Bahrain (GDR) 144A (Cost $263,463) | | | 21,937 | | | | 241,088 | |
| Bermuda 0.7% | |
| Frontline Ltd. (b) (c) | | | 14,347 | | | | 211,475 | |
| Lazard Ltd. "A" (b) | | | 7,284 | | | | 270,236 | |
| (Cost $571,717) | | | | 481,711 | |
| Brazil 3.4% | |
| All America Latina Logistica | | | 72,817 | | | | 612,621 | |
| Gol Linhas Aereas Inteligentes SA (ADR) (Preferred) (c) | | | 26,956 | | | | 327,515 | |
| Itau Unibanco Holding SA (ADR) (Preferred) | | | 15,612 | | | | 367,663 | |
| SLC Agricola SA | | | 63,318 | | | | 750,168 | |
| Tam SA (ADR) (Preferred) (c) | | | 11,749 | | | | 256,481 | |
| (Cost $2,207,042) | | | | 2,314,448 | |
| Cayman Islands 0.4% | |
| Herbalife Ltd. (b) (Cost $100,710) | | | 4,946 | | | | 285,087 | |
| China 2.3% | |
| Home Inns & Hotels Management, Inc. (ADR)* | | | 7,418 | | | | 282,181 | |
| Li Ning Co., Ltd. (c) | | | 101,452 | | | | 175,612 | |
| Mindray Medical International Ltd. (ADR) (c) | | | 22,649 | | | | 635,304 | |
| Trina Solar Ltd. (ADR)* (c) | | | 19,840 | | | | 444,813 | |
| (Cost $1,739,635) | | | | 1,537,910 | |
| Colombia 0.4% | |
| Bancolombia SA (ADR) (Preferred) (Cost $230,654) | | | 4,248 | | | | 283,469 | |
| Denmark 0.9% | |
| Vestas Wind Systems AS* (Cost $811,836) | | | 26,326 | | | | 612,023 | |
| Egypt 0.5% | |
| Orascom Telecom Holding SAE (GDR) REG S* (Cost $177,339) | | | 97,029 | | | | 335,929 | |
| France 0.8% | |
| Carrefour SA* (c) (Cost $640,011) | | | 13,166 | | | | 540,737 | |
| Germany 10.2% | |
| Axel Springer AG | | | 13,694 | | | | 676,345 | |
| Commerzbank AG* | | | 231,496 | | | | 995,458 | |
| Deutsche Lufthansa AG (Registered) | | | 69,505 | | | | 1,513,805 | |
| Deutsche Post AG (Registered) | | | 29,139 | | | | 559,576 | |
| E.ON AG | | | 24,872 | | | | 706,066 | |
| Muenchener Rueckversicherungs-Gesellschaft AG (Registered) | | | 6,498 | | | | 992,018 | |
| RWE AG | | | 9,398 | | | | 520,128 | |
| Siemens AG (Registered) | | | 7,218 | | | | 991,067 | |
| (Cost $6,624,138) | | | | 6,954,463 | |
| | | Shares | | | Value ($) | |
| | | | | | | | | |
| Greece 0.3% | |
| Hellenic Exchanges SA (Cost $204,528) | | | 28,382 | | | | 202,451 | |
| India 3.2% | |
| ICICI Bank Ltd. (ADR) | | | 16,810 | | | | 828,733 | |
| Larsen & Toubro Ltd. | | | 10,052 | | | | 413,291 | |
| Mahindra & Mahindra Ltd. | | | 30,627 | | | | 481,559 | |
| Reliance Industries Ltd. | | | 22,566 | | | | 453,200 | |
| (Cost $2,066,130) | | | | 2,176,783 | |
| Indonesia 0.5% | |
| PT Semen Gresik (Persero) Tbk (Cost $236,713) | | | 305,993 | | | | 343,226 | |
| Israel 1.6% | |
| NICE Systems Ltd. (ADR)* | | | 5,702 | | | | 207,324 | |
| Teva Pharmaceutical Industries Ltd. (ADR) | | | 18,558 | | | | 894,867 | |
| (Cost $1,064,304) | | | | 1,102,191 | |
| Japan 6.6% | |
| Dai-ichi Life Insurance Co., Ltd. | | | 193 | | | | 270,233 | |
| FANUC Corp. | | | 1,900 | | | | 316,828 | |
| Hitachi Ltd. | | | 126,000 | | | | 744,821 | |
| INPEX Corp. | | | 181 | | | | 1,336,274 | |
| Mitsubishi UFJ Financial Group, Inc. | | | 121,600 | | | | 591,982 | |
| Toyota Motor Corp. | | | 25,200 | | | | 1,060,991 | |
| Toyota Motor Corp. (ADR) | | | 1,736 | | | | 143,081 | |
| (Cost $3,627,928) | | | | 4,464,210 | |
| Kazakhstan 0.0% | |
| Kazakhstan Kagazy PLC (GDR)* (Cost $886,300) | | | 174,800 | | | | 12,236 | |
| Korea 2.6% | |
| NHN Corp.* | | | 2,018 | | | | 357,980 | |
| Samsung Electronics Co., Ltd. | | | 1,843 | | | | 1,432,452 | |
| (Cost $1,660,241) | | | | 1,790,432 | |
| Luxembourg 0.2% | |
| Ternium SA (ADR) (d) (Cost $119,285) | | | 3,529 | | | | 104,211 | |
| Malaysia 0.4% | |
| Axiata Group Bhd. (Cost $196,103) | | | 169,800 | | | | 281,908 | |
| Mexico 0.9% | |
| Grupo Aeroportuario del Sureste SAB de CV (ADR) | | | 4,205 | | | | 247,843 | |
| Grupo Financiero Banorte SAB de CV "O" | | | 86,640 | | | | 393,371 | |
| (Cost $584,002) | | | | 641,214 | |
| Netherlands 4.3% | |
| Koninklijke (Royal) KPN NV | | | 39,955 | | | | 580,789 | |
| QIAGEN NV* | | | 22,841 | | | | 437,872 | |
| Unilever NV (CVA) | | | 36,614 | | | | 1,199,476 | |
| VimpelCom Ltd. (ADR) (e) | | | 55,206 | | | | 704,429 | |
| (Cost $2,955,511) | | | | 2,922,566 | |
| Panama 1.7% | |
| Copa Holdings SA "A" (Cost $750,332) | | | 16,997 | | | | 1,134,380 | |
| Peru 0.4% | |
| Credicorp Ltd. (Cost $300,398) | | | 3,065 | | | | 263,896 | |
| | | Shares | | | Value ($) | |
| | | | | | | | | |
| Puerto Rico 1.4% | |
| Popular, Inc.* (c) (Cost $978,172) | | | 336,183 | | | | 927,865 | |
| Russia 0.9% | |
| Aeroflot-Russian Airlines | | | 122,917 | | | | 304,808 | |
| VTB Bank OJSC (GDR) REG S | | | 53,416 | | | | 329,020 | |
| (Cost $652,052) | | | | 633,828 | |
| South Africa 2.6% | |
| MTN Group Ltd. | | | 31,639 | | | | 674,138 | |
| Murray & Roberts Holdings Ltd. | | | 62,871 | | | | 279,125 | |
| Standard Bank Group Ltd. | | | 37,732 | | | | 558,330 | |
| Tiger Brands Ltd. | | | 9,049 | | | | 264,474 | |
| (Cost $1,546,951) | | | | 1,776,067 | |
| Sweden 2.1% | |
| Telefonaktiebolaget LM Ericsson "B" (Cost $1,118,046) | | | 97,949 | | | | 1,408,756 | |
| Switzerland 1.9% | |
| Julius Baer Group Ltd.* | | | 12,607 | | | | 520,372 | |
| Roche Holding AG (Genusschein) | | | 4,789 | | | | 801,195 | |
| (Cost $1,215,793) | | | | 1,321,567 | |
| Thailand 0.1% | |
| Seamico Securities PCL (Foreign Registered)* (Cost $153,906) | | | 1,403,300 | | | | 79,014 | |
| Turkey 1.3% | |
| Turkiye Garanti Bankasi AS | | | 147,649 | | | | 669,792 | |
| Turkiye Vakiflar Bankasi TAO "D" | | | 86,720 | | | | 196,135 | |
| (Cost $880,513) | | | | 865,927 | |
| United Kingdom 3.5% | |
| African Minerals Ltd.* (f) | | | 14,153 | | | | 117,666 | |
| Anglo American PLC | | | 6,722 | | | | 333,127 | |
| Barratt Developments PLC* | | | 200,908 | | | | 368,399 | |
| GlaxoSmithKline PLC | | | 37,163 | | | | 795,685 | |
| Tesco PLC | | | 113,551 | | | | 733,367 | |
| (Cost $2,075,008) | | | | 2,348,244 | |
| United States 35.2% | |
| Abbott Laboratories | | | 13,475 | | | | 709,055 | |
| Advanced Micro Devices, Inc.* (c) | | | 81,702 | | | | 571,097 | |
| AGCO Corp.* | | | 1,182 | | | | 58,344 | |
| Allscripts Healthcare Solutions, Inc.* (c) | | | 27,878 | | | | 541,391 | |
| Apple, Inc.* | | | 6,059 | | | | 2,033,825 | |
| Bank of America Corp. | | | 104,443 | | | | 1,144,695 | |
| Calpine Corp.* (c) | | | 40,228 | | | | 648,878 | |
| Chevron Corp. | | | 5,310 | | | | 546,080 | |
| Cisco Systems, Inc. | | | 30,572 | | | | 477,229 | |
| DreamWorks Animation SKG, Inc. "A"* (c) | | | 12,409 | | | | 249,421 | |
| Electronic Arts, Inc.* | | | 14,543 | | | | 343,215 | |
| Exxon Mobil Corp. | | | 8,938 | | | | 727,374 | |
| General Motors Co.* | | | 35,460 | | | | 1,076,566 | |
| Harris Corp. (c) | | | 12,188 | | | | 549,191 | |
| Interpublic Group of Companies, Inc. (c) | | | 49,863 | | | | 623,288 | |
| iRobot Corp.* (c) | | | 2,970 | | | | 104,811 | |
| JPMorgan Chase & Co. | | | 31,914 | | | | 1,306,559 | |
| Kinetic Concepts, Inc.* (c) | | | 12,582 | | | | 725,101 | |
| Laboratory Corp. of America Holdings* | | | 9,464 | | | | 916,021 | |
| Life Technologies Corp.* | | | 20,881 | | | | 1,087,274 | |
| Medco Health Solutions, Inc.* | | | 6,415 | | | | 362,576 | |
| | | Shares | | | Value ($) | |
| | | | | | | | | |
| Monsanto Co. | | | 13,280 | | | | 963,331 | |
| Morgan Stanley (c) | | | 52,902 | | | | 1,217,275 | |
| NCR Corp.* | | | 33,724 | | | | 637,046 | |
| New York Times Co. "A"* (c) | | | 33,206 | | | | 289,556 | |
| Newmont Mining Corp. | | | 17,051 | | | | 920,242 | |
| RadioShack Corp. (c) | | | 26,308 | | | | 350,159 | |
| Schlumberger Ltd. | | | 6,503 | | | | 561,859 | |
| Symantec Corp.* | | | 36,009 | | | | 710,097 | |
| The Mosaic Co. | | | 23,398 | | | | 1,584,747 | |
| WebMD Health Corp.* (c) | | | 4,388 | | | | 200,005 | |
| Whirlpool Corp. (c) | | | 10,964 | | | | 891,592 | |
| Williams Companies, Inc. (c) | | | 24,191 | | | | 731,778 | |
| (Cost $22,423,883) | | | | 23,859,678 | |
Total Common Stocks (Cost $60,496,544) | | | | 64,216,385 | |
| | |
| Preferred Stock 1.6% | |
| Germany | |
| Volkswagen AG (Cost $811,860) | | | 5,070 | | | | 1,045,308 | |
| | |
| Participatory Notes 2.2% | |
| Jordan 0.2% | |
| Arab Bank PLC (issuer HSBC Bank PLC), Expiration Date 4/12/2013* (Cost $162,698) | | | 10,256 | | | | 121,118 | |
| Nigeria 0.5% | |
| Bank of Nigeria (issuer HSBC Bank PLC), Expiration Date 11/5/2013* | | | 2,034,569 | | | | 166,767 | |
| Guaranty Trust Bank PLC (issuer Morgan Stanley BV), Expiration Date 3/25/2013* | | | 536,764 | | | | 54,838 | |
| Zenith Bank Ltd. (issuer Morgan Stanley BV), Expiration Date 3/25/2013* | | | 1,015,714 | | | | 97,642 | |
| (Cost $307,700) | | | | 319,247 | |
| Pakistan 0.2% | |
| National Bank of Pakistan (issuer Merrill Lynch International & Co.), Expiration Date 2/25/2015* (Cost $200,357) | | | 296,691 | | | | 174,005 | |
| Saudi Arabia 1.3% | |
| Saudi Basic Industrial Corp. (issuer HSBC Bank PLC), Expiration Date 3/26/2012* | | | 18,969 | | | | 526,059 | |
| Yanbu National Petrochemicals Co. (issuer HSBC Bank PLC), Expiration Date 1/7/2013 | | | 28,701 | | | | 362,006 | |
| (Cost $829,726) | | | | 888,065 | |
Total Participatory Notes (Cost $1,500,481) | | | | 1,502,435 | |
| | |
| Securities Lending Collateral 13.6% | |
| Daily Assets Fund Institutional, 0.13% (g) (h) (Cost $9,252,532) | | | 9,252,532 | | | | 9,252,532 | |
| | |
| Cash Equivalents 1.5% | |
| Central Cash Management Fund, 0.11% (g) (Cost $1,012,516) | | | 1,012,516 | | | | 1,012,516 | |
| | | % of Net Assets | | | Value ($) | |
| | | | |
Total Investment Portfolio (Cost $73,073,933)+ | | | 113.5 | | | | 77,029,176 | |
| Other Assets and Liabilities, Net | | | (13.5 | ) | | | (9,150,490 | ) |
| Net Assets | | | 100.0 | | | | 67,878,686 | |
* Non-income producing security.
+ The cost for federal income tax purposes was $73,473,607. At June 30, 2011, net unrealized appreciation for all securities based on tax cost was $3,555,569. This consisted of aggregate gross unrealized appreciation for all securities in which there was an excess of value over tax cost of $7,048,493 and aggregate gross unrealized depreciation for all securities in which there was an excess of tax cost over value of $3,492,924.
(a) Security is listed in country of domicile. Significant business activities of company are in Egypt.
(b) Listed on the New York Stock Exchange.
(c) All or a portion of these securities were on loan (see Notes to Financial Statements). The value of all securities loaned at June 30, 2011 amounted to $9,129,036, which is 13.4% of net assets.
(d) Security is listed in country of domicile. Significant business activities of company are in Argentina, Mexico and Venezuela.
(e) Security is listed in country of domicile. Significant business activities of company are in Eastern Europe and South Asia.
(f) Security is listed in country of domicile. Significant business activities of company are in Africa.
(g) Affiliated fund managed by Deutsche Investment Management Americas Inc. The rate shown is the annualized seven-day yield at period end.
(h) Represents collateral held in connection with securities lending. Income earned by the Fund is net of borrower rebates.
144A: Security exempt from registration under Rule 144A of the Securities Act of 1933. These securities may be resold in transactions exempt from registration, normally to qualified institutional buyers.
ADR: American Depositary Receipt
CVA: Certificaten Van Aandelen
GDR: Global Depositary Receipt
REG S: Securities sold under Regulation S may not be offered, sold or delivered within the United States or to, or for the account or benefit of, US persons, except pursuant to an exemption from, or in a transaction not subject to, the registration requirements of the Securities Act of 1933.
Fair Value Measurements
Various inputs are used in determining the value of the Fund's investments. These inputs are summarized in three broad levels. Level 1 includes quoted prices in active markets for identical securities. Level 2 includes other significant observable inputs (including quoted prices for similar securities, interest rates, prepayment speeds, and credit risk). Level 3 includes significant unobservable inputs (including the Fund's own assumptions in determining the fair value of investments). The inputs or methodology used for valuing securities are not necessarily an indication of the risk associated with investing in those securities.
The following is a summary of the inputs used as of June 30, 2011 in valuing the Fund's investments. For information on the Fund's policy regarding the valuation of investments, please refer to the Security Valuation section of Note A in the accompanying Notes to Financial Statements.
| Assets | | Level 1 | | | Level 2 | | | Level 3 | | | Total | |
| | |
| Common Stocks & Preferred Stock (i) | | | | | | | | | | | | |
| Australia | | $ | — | | | $ | 301,385 | | | $ | — | | | $ | 301,385 | |
| Austria | | | — | | | | 1,667,485 | | | | — | | | | 1,667,485 | |
| Bahrain | | | — | | | | 241,088 | | | | — | | | | 241,088 | |
| Bermuda | | | 481,711 | | | | — | | | | — | | | | 481,711 | |
| Brazil | | | 2,314,448 | | | | — | | | | — | | | | 2,314,448 | |
| Cayman Islands | | | 285,087 | | | | — | | | | — | | | | 285,087 | |
| China | | | 1,362,298 | | | | 175,612 | | | | — | | | | 1,537,910 | |
| Colombia | | | 283,469 | | | | — | | | | — | | | | 283,469 | |
| Denmark | | | — | | | | 612,023 | | | | — | | | | 612,023 | |
| Egypt | | | — | | | | 335,929 | | | | — | | | | 335,929 | |
| France | | | — | | | | 540,737 | | | | — | | | | 540,737 | |
| Germany | | | — | | | | 7,999,771 | | | | — | | | | 7,999,771 | |
| Greece | | | — | | | | 202,451 | | | | — | | | | 202,451 | |
| India | | | 828,733 | | | | 1,348,050 | | | | — | | | | 2,176,783 | |
| Indonesia | | | — | | | | 343,226 | | | | — | | | | 343,226 | |
| Israel | | | 1,102,191 | | | | — | | | | — | | | | 1,102,191 | |
| Japan | | | 143,081 | | | | 4,321,129 | | | | — | | | | 4,464,210 | |
| Kazakhstan | | | — | | | | 12,236 | | | | — | | | | 12,236 | |
| Korea | | | — | | | | 1,790,432 | | | | — | | | | 1,790,432 | |
| Luxembourg | | | 104,211 | | | | — | | | | — | | | | 104,211 | |
| Malaysia | | | — | | | | 281,908 | | | | — | | | | 281,908 | |
| Mexico | | | 641,214 | | | | — | | | | — | | | | 641,214 | |
| Netherlands | | | 704,429 | | | | 2,218,137 | | | | — | | | | 2,922,566 | |
| Panama | | | 1,134,380 | | | | — | | | | — | | | | 1,134,380 | |
| Peru | | | 263,896 | | | | — | | | | — | | | | 263,896 | |
| Puerto Rico | | | 927,865 | | | | — | | | | — | | | | 927,865 | |
| Russia | | | — | | | | 633,828 | | | | — | | | | 633,828 | |
| South Africa | | | — | | | | 1,776,067 | | | | — | | | | 1,776,067 | |
| Sweden | | | — | | | | 1,408,756 | | | | — | | | | 1,408,756 | |
| Switzerland | | | — | | | | 1,321,567 | | | | — | | | | 1,321,567 | |
| Thailand | | | — | | | | 79,014 | | | | — | | | | 79,014 | |
| Turkey | | | — | | | | 865,927 | | | | — | | | | 865,927 | |
| United Kingdom | | | — | | | | 2,348,244 | | | | — | | | | 2,348,244 | |
| United States | | | 23,859,678 | | | | — | | | | — | | | | 23,859,678 | |
| Participatory Notes (i) | | | — | | | | 1,502,435 | | | | — | | | | 1,502,435 | |
| Short-Term Investments (i) | | | 10,265,048 | | | | — | | | | — | | | | 10,265,048 | |
| Total | | $ | 44,701,739 | | | $ | 32,327,437 | | | $ | — | | | $ | 77,029,176 | |
There have been no transfers between Level 1 and Level 2 fair value measurements during the period ended June 30, 2011.
(i) See Investment Portfolio for additional detailed categorizations.
The accompanying notes are an integral part of the financial statements.
Statement of Assets and Liabilities | as of June 30, 2011 (Unaudited) | |
| Assets | |
Investments: Investments in non-affiliated securities, at value (cost $62,808,885) — including $9,129,036 of securities loaned | | $ | 66,764,128 | |
Investment in Daily Assets Fund Institutional (cost $9,252,532)* | | | 9,252,532 | |
| Investment in Central Cash Management Fund (cost $1,012,516) | | | 1,012,516 | |
| Total investments in securities, at value (cost $73,073,933) | | | 77,029,176 | |
| Foreign currency, at value (cost $86,043) | | | 87,072 | |
| Receivable for investments sold | | | 395,812 | |
| Receivable for Fund shares sold | | | 16,462 | |
| Dividends receivable | | | 114,430 | |
| Interest receivable | | | 1,642 | |
| Foreign taxes recoverable | | | 19,921 | |
| Other assets | | | 444 | |
| Total assets | | | 77,664,959 | |
| Liabilities | |
| Payable upon return of securities loaned | | | 9,252,532 | |
| Payable for investments purchased | | | 322,707 | |
| Payable for Fund shares redeemed | | | 97,112 | |
| Accrued management fee | | | 29,092 | |
| Other accrued expenses and payables | | | 84,830 | |
| Total liabilities | | | 9,786,273 | |
| Net assets, at value | | $ | 67,878,686 | |
| Net Assets Consist of | |
| Undistributed net investment income | | | 592,982 | |
Net unrealized appreciation (depreciation) on: Investments | | | 3,955,243 | |
| Foreign currency | | | 482 | |
| Accumulated net realized gain (loss) | | | (48,711,711 | ) |
| Paid-in capital | | | 112,041,690 | |
| Net assets, at value | | $ | 67,878,686 | |
Class A Net Asset Value, offering and redemption price per share ($63,773,789 ÷ 6,659,301 outstanding shares of beneficial interest, no par value, unlimited number of shares authorized) | | $ | 9.58 | |
Class B Net Asset Value, offering and redemption price per share ($4,104,897 ÷ 427,416 outstanding shares of beneficial interest, no par value, unlimited number of shares authorized) | | $ | 9.60 | |
* Represents collateral on securities loaned.
The accompanying notes are an integral part of the financial statements.
Statement of Operations
| for the six months ended June 30, 2011 (Unaudited) | |
| Investment Income | |
Income: Dividends (net of foreign taxes withheld of $100,814) | | $ | 971,842 | |
| Income distributions — Central Cash Management Fund | | | 519 | |
| Securities lending income, including income from Daily Assets Fund Institutional, net of borrower rebates | | | 35,500 | |
| Total income | | | 1,007,861 | |
Expenses: Management fee | | | 324,753 | |
| Administration fee | | | 35,492 | |
| Services to shareholders | | | 1,499 | |
| Distribution service fee (Class B) | | | 5,740 | |
| Record keeping fees (Class B) | | | 2,273 | |
| Custodian fee | | | 65,657 | |
| Audit and tax fees | | | 31,313 | |
| Legal fees | | | 4,282 | |
| Reports to shareholders | | | 10,011 | |
| Trustees' fees and expenses | | | 2,445 | |
| Other | | | 19,646 | |
| Total expenses before expense reductions | | | 503,111 | |
| Expense reductions | | | (128,529 | ) |
| Total expenses after expense reductions | | | 374,582 | |
| Net investment income (loss) | | | 633,279 | |
| Realized and Unrealized Gain (Loss) | |
Net realized gain (loss) from: Investments | | | 4,804,780 | |
| Foreign currency | | | (62,483 | ) |
| | | | 4,742,297 | |
Change in net unrealized appreciation (depreciation) on: Investments | | | (2,663,021 | ) |
| Foreign currency | | | (1,626 | ) |
| | | | (2,664,647 | ) |
| Net gain (loss) | | | 2,077,650 | |
| Net increase (decrease) in net assets resulting from operations | | $ | 2,710,929 | |
The accompanying notes are an integral part of the financial statements.
Statement of Changes in Net Assets | Increase (Decrease) in Net Assets | | Six Months Ended June 30, 2011 (Unaudited) | | | Year Ended December 31, 2010 | |
Operations: Net investment income (loss) | | $ | 633,279 | | | $ | 514,123 | |
| Net realized gain (loss) | | | 4,742,297 | | | | 7,206,315 | |
| Change in net unrealized appreciation (depreciation) | | | (2,664,647 | ) | | | 899,469 | |
| Net increase (decrease) in net assets resulting from operations | | | 2,710,929 | | | | 8,619,907 | |
Distributions to shareholders from: Net investment income: Class A | | | (391,766 | ) | | | (621,927 | ) |
| Class B | | | (9,700 | ) | | | (28,358 | ) |
| Total distributions | | | (401,466 | ) | | | (650,285 | ) |
Fund share transactions: Class A Proceeds from shares sold | | | 1,408,415 | | | | 5,854,566 | |
| Reinvestment of distributions | | | 391,766 | | | | 621,927 | |
| Payments for shares redeemed | | | (7,948,644 | ) | | | (12,215,497 | ) |
| Net increase (decrease) in net assets from Class A share transactions | | | (6,148,463 | ) | | | (5,739,004 | ) |
Class B Proceeds from shares sold | | | 24,012 | | | | 308,827 | |
| Reinvestment of distributions | | | 9,700 | | | | 28,358 | |
| Payments for shares redeemed | | | (933,653 | ) | | | (1,123,823 | ) |
| Net increase (decrease) in net assets from Class B share transactions | | | (899,941 | ) | | | (786,638 | ) |
| Increase (decrease) in net assets | | | (4,738,941 | ) | | | 1,443,980 | |
| Net assets at beginning of period | | | 72,617,627 | | | | 71,173,647 | |
| Net assets at end of period (including undistributed net investment income of $592,982 and $361,169, respectively) | | $ | 67,878,686 | | | $ | 72,617,627 | |
| Other Information | |
Class A Shares outstanding at beginning of period | | | 7,301,949 | | | | 8,018,621 | |
| Shares sold | | | 146,685 | | | | 692,269 | |
| Shares issued to shareholders in reinvestment of distributions | | | 39,334 | | | | 72,065 | |
| Shares redeemed | | | (828,667 | ) | | | (1,481,006 | ) |
| Net increase (decrease) in Class A shares | | | (642,648 | ) | | | (716,672 | ) |
| Shares outstanding at end of period | | | 6,659,301 | | | | 7,301,949 | |
Class B Shares outstanding at beginning of period | | | 519,624 | | | | 617,302 | |
| Shares sold | | | 2,486 | | | | 36,659 | |
| Shares issued to shareholders in reinvestment of distributions | | | 971 | | | | 3,275 | |
| Shares redeemed | | | (95,665 | ) | | | (137,612 | ) |
| Net increase (decrease) in Class B shares | | | (92,208 | ) | | | (97,678 | ) |
| Shares outstanding at end of period | | | 427,416 | | | | 519,624 | |
The accompanying notes are an integral part of the financial statements.
| | | | | | Years Ended December 31, | |
| Class A | | Six Months Ended 6/30/11 (Unaudited) | | | 2010 | | | 2009 | | | 2008 | | | 2007 | | | 2006 | |
| Selected Per Share Data | |
| Net asset value, beginning of period | | $ | 9.28 | | | $ | 8.24 | | | $ | 5.84 | | | $ | 15.66 | | | $ | 17.39 | | | $ | 14.44 | |
Income (loss) from investment operations: Net investment incomea | | | .09 | | | | .06 | | | | .08 | | | | .11 | | | | .14 | | | | .15 | c |
| Net realized and unrealized gain (loss) | | | .27 | | | | 1.06 | | | | 2.42 | | | | (5.83 | ) | | | .88 | | | | 4.02 | |
| Total from investment operations | | | .36 | | | | 1.12 | | | | 2.50 | | | | (5.72 | ) | | | 1.02 | | | | 4.17 | |
Less distributions from: Net investment income | | | (.06 | ) | | | (.08 | ) | | | (.10 | ) | | | (.19 | ) | | | (.11 | ) | | | (.09 | ) |
| Net realized gains | | | — | | | | — | | | | — | | | | (3.91 | ) | | | (2.64 | ) | | | (1.13 | ) |
| Total distributions | | | (.06 | ) | | | (.08 | ) | | | (.10 | ) | | | (4.10 | ) | | | (2.75 | ) | | | (1.22 | ) |
| Net asset value, end of period | | $ | 9.58 | | | $ | 9.28 | | | $ | 8.24 | | | $ | 5.84 | | | $ | 15.66 | | | $ | 17.39 | |
Total Return (%)b | | | 3.82 | ** | | | 13.65 | | | | 43.82 | | | | (47.75 | ) | | | 6.29 | | | | 30.14 | c |
| Ratios to Average Net Assets and Supplemental Data | |
| Net assets, end of period ($ millions) | | | 64 | | | | 68 | | | | 66 | | | | 59 | | | | 151 | | | | 143 | |
| Ratio of expenses before expense reductions (%) | | | 1.39 | * | | | 1.41 | | | | 1.38 | | | | 1.47 | | | | 1.44 | | | | 1.38 | |
| Ratio of expenses after expense reductions (%) | | | 1.03 | * | | | 1.05 | | | | 1.04 | | | | 1.09 | | | | 1.11 | | | | 1.04 | |
| Ratio of net investment income (%) | | | 1.81 | * | | | .77 | | | | 1.23 | | | | 1.09 | | | | .82 | | | | .92 | c |
| Portfolio turnover rate (%) | | | 71 | ** | | | 165 | | | | 190 | | | | 229 | | | | 191 | | | | 136 | |
a Based on average shares outstanding during the period. b Total return would have been lower had certain expenses not been reduced. c Includes non-recurring income from the Advisor recorded as a result of an administrative proceeding regarding disclosure of brokerage allocation practices in connection with sales of DWS Funds. The non-recurring income resulted in an increase in net investment income of $0.004 per share and an increase in the ratio of net investment income of 0.03%. Excluding this non-recurring income, total return would have been 0.02% lower. * Annualized ** Not annualized | |
| | | | | | Years Ended December 31, | |
| Class B | | Six Months Ended 6/30/11 (Unaudited) | | | 2010 | | | 2009 | | | 2008 | | | 2007 | | | 2006 | |
| Selected Per Share Data | |
| Net asset value, beginning of period | | $ | 9.29 | | | $ | 8.25 | | | $ | 5.85 | | | $ | 15.66 | | | $ | 17.38 | | | $ | 14.43 | |
Income (loss) from investment operations: Net investment incomea | | | .07 | | | | .04 | | | | .06 | | | | .07 | | | | .07 | | | | .09 | c |
| Net realized and unrealized gain (loss) | | | .26 | | | | 1.05 | | | | 2.42 | | | | (5.83 | ) | | | .90 | | | | 4.02 | |
| Total from investment operations | | | .33 | | | | 1.09 | | | | 2.48 | | | | (5.76 | ) | | | .97 | | | | 4.11 | |
Less distributions from: Net investment income | | | (.02 | ) | | | (.05 | ) | | | (.08 | ) | | | (.14 | ) | | | (.05 | ) | | | (.03 | ) |
| Net realized gains | | | — | | | | — | | | | — | | | | (3.91 | ) | | | (2.64 | ) | | | (1.13 | ) |
| Total distributions | | | (.02 | ) | | | (.05 | ) | | | (.08 | ) | | | (4.05 | ) | | | (2.69 | ) | | | (1.16 | ) |
| Net asset value, end of period | | $ | 9.60 | | | $ | 9.29 | | | $ | 8.25 | | | $ | 5.85 | | | $ | 15.66 | | | $ | 17.38 | |
Total Return (%)b | | | 3.56 | ** | | | 13.24 | | | | 43.23 | | | | (47.87 | ) | | | 5.84 | | | | 29.65 | c |
| Ratios to Average Net Assets and Supplemental Data | |
| Net assets, end of period ($ millions) | | | 4 | | | | 5 | | | | 5 | | | | 4 | | | | 10 | | | | 25 | |
| Ratio of expenses before expense reductions (%) | | | 1.75 | * | | | 1.76 | | | | 1.73 | | | | 1.82 | | | | 1.81 | | | | 1.76 | |
| Ratio of expenses after expense reductions (%) | | | 1.38 | * | | | 1.40 | | | | 1.39 | | | | 1.45 | | | | 1.47 | | | | 1.43 | |
| Ratio of net investment income (%) | | | 1.46 | * | | | .42 | | | | .88 | | | | .73 | | | | .46 | | | | .53 | c |
| Portfolio turnover rate (%) | | | 71 | ** | | | 165 | | | | 190 | | | | 229 | | | | 191 | | | | 136 | |
a Based on average shares outstanding during the period. b Total return would have been lower had certain expenses not been reduced. c Includes non-recurring income from the Advisor recorded as a result of an administrative proceeding regarding disclosure of brokerage allocation practices in connection with sales of DWS Funds. The non-recurring income resulted in an increase in net investment income of $0.004 per share and an increase in the ratio of net investment income of 0.03%. Excluding this non-recurring income, total return would have been 0.02% lower. * Annualized ** Not annualized | |
Notes to Financial Statements (Unaudited)
A. Organization and Significant Accounting Policies
DWS Global Thematic VIP (the "Fund") is a diversified series of DWS Variable Series II (the "Trust"), which is registered under the Investment Company Act of 1940, as amended (the "1940 Act"), as an open-end management investment company organized as a Massachusetts business trust.
Multiple Classes of Shares of Beneficial Interest. The Fund offers two classes of shares (Class A shares and Class B shares). Sales of Class B shares are subject to recordkeeping fees up to 0.15% and Rule 12b-1 fees under the 1940 Act equal to an annual rate of 0.25% of the average daily net assets for Class B shares of the Fund. Class A shares are not subject to such fees.
Investment income, realized and unrealized gains and losses, and certain fund-level expenses and expense reductions, if any, are borne pro rata on the basis of relative net assets by the holders of all classes of shares except that each class bears certain expenses unique to that class (including the applicable Rule 12b-1 fee and recordkeeping fees). Differences in class-level expenses may result in payment of different per share dividends by class. All shares have equal rights with respect to voting subject to class-specific arrangements.
The Fund's financial statements are prepared in accordance with accounting principles generally accepted in the United States of America which require the use of management estimates. Actual results could differ from those estimates. The policies described below are followed consistently by the Fund in the preparation of its financial statements.
Security Valuation. Investments are stated at value determined as of the close of regular trading on the New York Stock Exchange on each day the exchange is open for trading.
Various inputs are used in determining the value of the Fund's investments. These inputs are summarized in three broad levels. Level 1 includes quoted prices in active markets for identical securities. Level 2 includes other significant observable inputs (including quoted prices for similar securities, interest rates, prepayment speeds, and credit risk). Level 3 includes significant unobservable inputs (including the Fund's own assumptions in determining the fair value of investments). The inputs or methodology used for valuing securities are not necessarily an indication of the risk associated with investing in those securities.
Equity securities are valued at the most recent sale price or official closing price reported on the exchange (US or foreign) or over-the-counter market on which they trade and are categorized as Level 1 securities. Securities for which no sales are reported are valued at the calculated mean between the most recent bid and asked quotations on the relevant market or, if a mean cannot be determined, at the most recent bid quotation. For certain international equity securities, in order to adjust for events which may occur between the close of the foreign exchanges and the close of the New York Stock Exchange, a fair valuation model may be used. This fair valuation model takes into account comparisons to the valuation of American Depository Receipts (ADRs), exchange-traded funds, futures contracts and certain indices and these securities are categorized as Level 2.
Money market instruments purchased with an original or remaining maturity of sixty days or less, maturing at par, are valued at amortized cost, which approximates value, and are categorized as Level 2. Investments in open-end investment companies are valued at their net asset value each business day and are categorized as Level 1.
Securities and other assets for which market quotations are not readily available or for which the above valuation procedures are deemed not to reflect fair value are valued in a manner that is intended to reflect their fair value as determined in accordance with procedures approved by the Board and are generally categorized as Level 3. In accordance with the Fund's valuation procedures, factors used in determining value may include, but are not limited to, the type of the security; the size of the holding; the initial cost of the security; the existence of any contractual restrictions on the security's disposition; the price and extent of public trading in similar securities of the issuer or of comparable companies; quotations or evaluated prices from broker-dealers and/or pricing services; information obtained from the issuer, analysts, and/or the appropriate stock exchange (for exchange-traded securities); an analysis of the company's or issuer's financial statements; an evaluation of the forces that influence the issuer and the market(s) in which the security is purchased and sold and with respect to debt securities; the maturity, coupon, creditworthiness, currency denomination and the movement of the market in which the security is normally traded. The value determined under these procedures may differ from published values for the same securities.
Disclosure about the classification of fair value measurements is included in a table following the Fund's Investment Portfolio.
Foreign Currency Translations. The books and records of the Fund are maintained in US dollars. Investment securities and other assets and liabilities denominated in a foreign currency are translated into US dollars at the prevailing exchange rates at period end. Purchases and sales of investment securities, income and expenses are translated into US dollars at the prevailing exchange rates on the respective dates of the transactions.
Net realized and unrealized gains and losses on foreign currency transactions represent net gains and losses between trade and settlement dates on securities transactions, the acquisition and disposition of foreign currencies, and the difference between the amount of net investment income accrued and the US dollar amount actually received. That portion of both realized and unrealized gains and losses on investments that results from fluctuations in foreign currency exchange rates is not separately disclosed but is included with net realized and unrealized gain/appreciation and loss/depreciation on investments.
Securities Lending. The Fund lends securities to certain financial institutions. The Fund retains beneficial ownership of the securities it has loaned and continues to receive interest and dividends paid by the issuer of securities and to participate in any changes in their market value. The Fund requires the borrowers of the securities to maintain collateral with the Fund consisting of either cash or liquid, unencumbered assets having a value at least equal to the value of the securities loaned. When the collateral falls below specified amounts, the lending agent will use its best effort to obtain additional collateral on the next business day to meet required amounts under the security lending agreement. The Fund may invest the cash collateral into a joint trading account in an affiliated money market fund pursuant to Exemptive Orders issued by the SEC. The Fund receives compensation for lending its securities either in the form of fees or by earning interest on invested cash collateral net of borrower rebates and fees paid to a lending agent. Either the Fund or the borrower may terminate the loan. There may be risks of delay and costs in recovery of securities or even loss of rights in the collateral should the borrower of the securities fail financially. The Fund is also subject to all investment risks associated with the reinvestment of any cash collateral received, including, but not limited to, interest rate, credit and liquidity risk associated with such investments.
Participatory Notes. The Fund invests in Participatory Notes (P-Notes). P-Notes are promissory notes designed to offer a return linked to the performance of a particular underlying equity security or market. P-Notes are issued by banks or broker-dealers and allow the Fund to gain exposure to local shares in foreign markets. Investments in P-Notes involve the same risks associated with a direct investment in the underlying foreign companies or foreign markets that they seek to replicate. Although each participation note is structured with a defined maturity date, early redemption may be possible. Risks associated with participation notes include the possible failure of a counterparty to perform in accordance with the terms of the agreement and potential delays or an inability to redeem before maturity under certain market conditions.
Taxes. The Fund's policy is to comply with the requirements of the Internal Revenue Code, as amended, which are applicable to regulated investment companies and to distribute all of its taxable income to its shareholders.
Additionally, based on the Fund's understanding of the tax rules and rates related to income, gains and transactions for the foreign jurisdictions in which it invests, the Fund will provide for foreign taxes and, where appropriate, deferred foreign taxes.
At December 31, 2010, the Fund had a net tax basis capital loss carryforward of approximately $53,053,000, which may be applied against any realized net taxable capital gains of each succeeding year until fully utilized or until December 31, 2016 ($35,242,000) and December 31, 2017 ($17,811,000), the respective expiration dates, whichever occurs first.
In addition, from November 1, 2010 through December 31, 2010, the Fund incurred $43,000 of net realized capital losses. As permitted by tax regulations, the Fund intends to elect to defer these losses and treat them as arising in the fiscal year ended December 31, 2011.
On December 22, 2010, the Regulated Investment Company Modernization Act of 2010 (the "Act") was enacted. Under the Act, net capital losses may be carried forward indefinitely, and their character is retained as short-term and/or long-term losses. Previously, net capital losses were carried forward for eight years and treated as short-term losses. As a transition rule, the Act requires that post-enactment net capital losses be used before pre-enactment net capital losses. As a result of this ordering rule, pre-enactment capital loss carryforwards may expire unused, whereas under the previous rules these losses may have been utilized. This change is effective for fiscal years beginning after the date of enactment.
The Fund has reviewed the tax positions for the open tax years as of December 31, 2010 and has determined that no provision for income tax is required in the Fund's financial statements. The Fund's federal tax returns for the prior three fiscal years remain open subject to examination by the Internal Revenue Service.
Distribution of Income and Gains. Distributions of net investment income of the Fund, if any, are made annually. Net realized gains from investment transactions, in excess of available capital loss carryforwards, would be taxable to the Fund if not distributed and, therefore, will be distributed to shareholders at least annually. The Fund may also make additional distributions for tax purposes if necessary.
The timing and characterization of certain income and capital gains distributions are determined annually in accordance with federal tax regulations which may differ from accounting principles generally accepted in the United States of America. These differences primarily relate to investments in foreign denominated investments, income received from Passive Foreign Investment Companies and certain securities sold at a loss. As a result, net investment income (loss) and net realized gain (loss) on investment transactions for a reporting period may differ significantly from distributions during such period. Accordingly, the Fund may periodically make reclassifications among certain of its capital accounts without impacting the net asset value of the Fund.
The tax character of current year distributions will be determined at the end of the current fiscal year.
Expenses. Expenses of the Trust arising in connection with a specific fund are allocated to that fund. Other Trust expenses which cannot be directly attributed to a fund are apportioned among the funds in the Trust.
Contingencies. In the normal course of business, the Fund may enter into contracts with service providers that contain general indemnification clauses. The Fund's maximum exposure under these arrangements is unknown as this would involve future claims that may be made against the Fund that have not yet been made. However, based on experience, the Fund expects the risk of loss to be remote.
Other. Investment transactions are accounted for on a trade date plus one basis for daily net asset value calculations. However, for financial reporting purposes, investment transactions are reported on trade date. Interest income is recorded on the accrual basis. Dividend income is recorded on the ex-dividend date net of foreign withholding taxes. Certain dividends from foreign securities may be recorded subsequent to the ex-dividend date as soon as the Fund is informed of such dividends. Realized gains and losses from investment transactions are recorded on an identified cost basis and may include proceeds from litigation.
B. Purchases and Sales of Securities
During the six months ended June 30, 2011, purchases and sales of investment transactions (excluding short-term investments) aggregated $50,034,729 and $57,332,573, respectively.
C. Related Parties
Management Agreement. Under the Investment Management Agreement with Deutsche Investment Management Americas Inc. ("DIMA" or the "Advisor"), an indirect, wholly owned subsidiary of Deutsche Bank AG, the Advisor directs the investments of the Fund in accordance with its investment objectives, policies and restrictions. The Advisor determines the securities, instruments and other contracts relating to investments to be purchased, sold or entered into by the Fund or delegates such responsibility to the Fund's subadvisor.
Global Thematic Partners, LLC ("GTP") serves as subadvisor. As a subadvisor to the Fund, GTP makes investment decisions and buys and sells securities for the Fund. GTP is paid by the Advisor for the services GTP provides to the Fund.
Pursuant to the Investment Management Agreement with the Advisor, the Fund pays a monthly management fee based on the Fund's average daily net assets, computed and accrued daily and payable monthly, at the following annual rates:
| $0-$250 million | | | .915 | % |
| Next $500 million | | | .865 | % |
| Next $750 million | | | .815 | % |
| Next $1.5 billion | | | .765 | % |
| Over $3 billion | | | .715 | % |
For the period from January 1, 2011 through September 30, 2011, the Advisor has contractually agreed to waive its fee and/or reimburse certain operating expenses to the extent necessary to maintain the operating expenses (excluding certain expenses such as extraordinary expenses, taxes, brokerage and interest expense) of each class as follows:
Accordingly, for the six months ended June 30, 2011, the Advisor waived a portion of its management fee pursuant to the Investment Management Agreement aggregating $128,362, and the amount charged aggregated $196,391, which was equivalent to an annualized effective rate of 0.55% of the Fund's average daily net assets.
Administration Fee. Pursuant to an Administrative Services Agreement, DIMA provides most administrative services to the Fund. For all services provided under the Administrative Services Agreement, the Fund pays DIMA an annual fee ("Administration Fee") of 0.10% of the Fund's average daily net assets, computed and accrued daily and payable monthly. For the six months ended June 30, 2011, the Administration Fee was $35,492, of which $5,534 is unpaid.
Service Provider Fees. DWS Investments Service Company ("DISC"), an affiliate of the Advisor, is the transfer agent, dividend-paying agent and shareholder service agent for the Fund. Pursuant to a sub-transfer agency agreement between DISC and DST Systems, Inc. ("DST"), DISC has delegated certain transfer agent, dividend-paying agent and shareholder service agent functions to DST. DISC compensates DST out of the shareholder servicing fee it receives from the Fund. For the six months ended June 30, 2011, the amounts charged to the Fund by DISC were as follows:
| Services to Shareholders | | Total Aggregated | | | Waived | | | Unpaid at June 30, 2011 | |
| Class A | | $ | 167 | | | $ | 167 | | | $ | — | |
| Class B | | | 35 | | | | — | | | | 21 | |
| | | $ | 202 | | | $ | 167 | | | $ | 21 | |
Distribution Service Agreement. Under the Fund's Class B 12b-1 plans, DWS Investments Distributors, Inc. ("DIDI") received a fee ("Distribution Service Fee") of 0.25% of average daily net assets of Class B shares. For the six months ended June 30, 2011, the Distribution Service Fee aggregated $5,740, of which $837 is unpaid.
Typesetting and Filing Service Fees. Under an agreement with DIMA, DIMA is compensated for providing typesetting and certain regulatory filing services to the Fund. For the six months ended June 30, 2011, the amount charged to the Fund by DIMA included in the Statement of Operations under "reports to shareholders" aggregated $8,090, of which $333 is unpaid.
Trustees' Fees and Expenses. The Fund paid each Trustee not affiliated with the Advisor retainer fees plus specified amounts for various committee services and for the Board Chairperson.
Affiliated Cash Management Vehicle. The Fund may invest uninvested cash balances in Central Cash Management Fund, which is managed by the Advisor. The Fund indirectly bears its proportionate share of the expenses of Central Cash Management Fund. Central Cash Management Fund does not pay the Advisor an investment management fee. Central Cash Management Fund seeks a high level of current income consistent with liquidity and the preservation of capital.
D. Investing in Emerging Markets
Investing in emerging markets may involve special risks and considerations not typically associated with investing in developed markets. These risks include revaluation of currencies, high rates of inflation or deflation, repatriation restrictions on income and capital, and future adverse political, social and economic developments. Moreover, securities issued in these markets may be less liquid, subject to government ownership controls or delayed settlements, and may have prices that are more volatile or less easily assessed than those of comparable securities of issuers in developed markets.
E. Ownership of the Fund
At June 30, 2011, two Participating Insurance Companies were owners of record of 10% or more of the total outstanding Class A shares of the Fund, each owning 58% and 32%. One Participating Insurance Company was the owner of record of 10% or more of the total outstanding Class B shares of the Fund, owning 98%.
F. Line of Credit
The Fund and other affiliated funds (the "Participants") share in a $450 million revolving credit facility provided by a syndication of banks. The Fund may borrow for temporary or emergency purposes, including the meeting of redemption requests that otherwise might require the untimely disposition of securities. The Participants are charged an annual commitment fee which is allocated based on net assets, among each of the Participants. Interest is calculated at a rate per annum equal to the sum of the Federal Funds Rate plus 1.25 percent plus if LIBOR exceeds the Federal Funds Rate the amount of such excess. The Fund may borrow up to a maximum of 33 percent of its net assets under the agreement. The Fund had no outstanding loans at June 30, 2011.
The Trust's policies and procedures for voting proxies for portfolio securities and information about how the Trust voted proxies related to its portfolio securities during the 12-month period ended June 30 are available on our Web site — www.dws-investments.com (click on "proxy voting" at the bottom of the page) — or on the SEC's Web site — www.sec.gov. To obtain a written copy of the Trust's policies and procedures without charge, upon request, call us toll free at (800) 728-3337.
Summary of Management Fee Evaluation by Independent Fee Consultant
October 3, 2010
Pursuant to an Order entered into by Deutsche Investment Management Americas and affiliates (collectively, "DeAM") with the Attorney General of New York, I, Thomas H. Mack, have been appointed the Independent Fee Consultant for the DWS Funds (formerly the DWS Scudder Funds). My duties include preparing an annual written evaluation of the management fees DeAM charges the Funds, considering among other factors the management fees charged by other mutual fund companies for like services, management fees DeAM charges other clients for like services, DeAM's costs of supplying services under the management agreements and related profit margins, possible economies of scale if a Fund grows larger, and the nature and quality of DeAM's services, including fund performance. This report summarizes my evaluation for 2010, including my qualifications, the evaluation process for each of the DWS Funds, consideration of certain complex-level factors, and my conclusions. I served in substantially the same capacity in 2007, 2008, and 2009.
Qualifications
For more than 35 years I have served in various professional capacities within the investment management business. I have held investment analysis and advisory positions, including securities analyst, portfolio strategist and director of investment policy with a large investment firm. I have also performed business management functions, including business development, financial management and marketing research and analysis.
Since 1991, I have been an independent consultant within the asset management industry. I have provided services to over 125 client organizations, including investment managers, mutual fund boards, product distributors and related organizations. Over the past ten years I have completed a number of assignments for mutual fund boards, specifically including assisting boards with management contract renewal.
I hold a Master of Business Administration degree, with highest honors, from Harvard University and Master of Science and Bachelor of Science (highest honors) degrees from the University of California at Berkeley. I am an independent director and audit committee financial expert for two closed-end mutual funds and have served in various leadership and financial oversight capacities with non-profit organizations.
Evaluation of Fees for each DWS Fund
My work focused primarily on evaluating, fund-by-fund, the fees charged to each of the 118 publicly offered Fund portfolios in the DWS Fund family. For each Fund, I considered each of the key factors mentioned above, as well as any other relevant information. In doing so I worked closely with the Funds' Independent Directors in their annual contract renewal process, as well as in their approval of contracts for several new funds (documented separately).
In evaluating each Fund's fees, I reviewed comprehensive materials provided by or on behalf of DeAM, including expense information prepared by Lipper Analytical, comparative performance information, profitability data, manager histories, and other materials. I also accessed certain additional information from the Lipper and Morningstar databases and drew on my industry knowledge and experience.
To facilitate evaluating this considerable body of information, I prepared for each Fund a document summarizing the key data elements in each area as well as additional analytics discussed below. This made it possible to consider each key data element in the context of the others.
In the course of contract renewal, DeAM agreed to implement a number of fee and expense adjustments requested by the Independent Directors which will favorably impact future fees and expenses, and my evaluation includes the effects of these changes.
Fees and Expenses Compared with Other Funds
The competitive fee and expense evaluation for each fund focused on two primary comparisons:
The Fund's contractual management fee (the advisory fee plus the administration fee where applicable) compared with those of a group of typically 12-15 funds in the same Lipper investment category (e.g. Large Capitalization Growth) having similar distribution arrangements and being of similar size.
The Fund's total expenses compared with a broader universe of funds from the same Lipper investment category and having similar distribution arrangements.
These two comparisons provide a view of not only the level of the fee compared with funds of similar scale but also the total expense the Fund bears for all the services it receives, in comparison with the investment choices available in the Fund's investment category and distribution channel. The principal figure-of-merit used in these comparisons was the subject Fund's percentile ranking against peers.
DeAM's Fees for Similar Services to Others
DeAM provided management fee schedules for all of its US domiciled fund and non-fund investment management accounts in any of the investment categories where there is a DWS Fund. These similar products included the other DWS Funds, non-fund pooled accounts, institutional accounts and sub-advisory accounts. Using this information, I calculated for each Fund the fee that would be charged to each similar product, at the subject Fund's asset level.
Evaluating information regarding non-fund products is difficult because there are varying levels of services required for different types of accounts, with mutual funds generally requiring considerably more regulatory and administrative types of service as well as having more frequent cash flows than other types of accounts. Also, while mutual fund fees for similar fund products can be expected to be similar, there will be some differences due to different pricing conditions in different distribution channels (e.g. retail funds versus those used in variable insurance products), differences in underlying investment processes and other factors.
Costs and Profit Margins
DeAM provided a detailed profitability analysis for each Fund. After making some adjustments so that the presentation would be more comparable to the available industry figures, I reviewed profit margins from investment management alone, from investment management plus other fund services (excluding distribution) provided to the Funds by DeAM (principally shareholder services), and DeAM profits from all sources, including distribution. A later section comments on overall profitability.
Economies of Scale
Economies of scale — an expected decline in management cost per dollar of fund assets as fund assets grow — are very rarely quantified and documented because of inherent difficulties in collecting and analyzing relevant data. However, in virtually every investment category that I reviewed, larger funds tend to have lower fees and lower total expenses than smaller funds. To see how each DWS Fund compares with this industry observation, I reviewed:
The trend in Fund assets over the last five years and the accompanying trend in total expenses. This shows if the Fund has grown and, if so, whether total expense (management fees as well as other expenses) have declined as a percent of assets.
Whether the Fund has break-points in its management fee schedule, the extent of the fee reduction built into the schedule and the asset levels where the breaks take effect, and in the case of a sub-advised Fund how the Fund's break-points compare with those of the sub-advisory fee schedule.
How the Fund's contractual fee schedule compares with trends in the industry data. To accomplish this, I constructed a chart showing how actual latest-fiscal-year contractual fees of the Fund and of other similar funds relate to average fund assets, with the subject Fund's contractual fee schedule superimposed.
Quality of Service — Performance
The quality-of-service evaluation focused on investment performance, which is the principal result of the investment management service. Each Fund's performance was reviewed over the past 1, 3, 5 and 10 years, as applicable, and compared with that of other funds in the same investment category and with a suitable market index.
In addition, I calculated and reviewed risk-adjusted returns relative to an index of similar mutual funds' returns and a suitable market index. The risk-adjusted returns analysis provides a way of determining the extent to which the Fund's return comparisons are mainly the product of investment value-added (or lack thereof) or alternatively taking considerably more or less risk than is typical in its investment category.
I also received and considered the history of portfolio manager changes for each Fund, as this provided an important context for evaluating the performance results.
Complex-Level Considerations
While this evaluation was conducted mainly at the individual fund level, there are some issues relating to the reasonableness of fees that can alternatively be considered across the whole fund complex:
I reviewed DeAM's profitability analysis for all DWS Funds, with a view toward determining if the allocation procedures used were reasonable and how profit levels compared with public data for other investment managers.
I considered whether DeAM and affiliates receive any significant ancillary or "fall-out" benefits that should be considered in interpreting the direct profitability results. These would be situations where serving as the investment manager of the Funds is beneficial to another part of the Deutsche Bank organization.
I considered how aggregated DWS Fund expenses had varied over the years, by asset class and in the context of trends in asset levels.
I reviewed the structure of the DeAM organization, trends in staffing levels, and information on compensation of investment management and other professionals compared with industry data.
Findings
Based on the process and analysis discussed above, which included reviewing a wide range of information from management and external data sources and considering among other factors the fees DeAM charges other clients, the fees charged by other fund managers, DeAM's costs and profits associated with managing the Funds, economies of scale, possible fall-out benefits, and the nature and quality of services provided, in my opinion the management fees charged the DWS Funds are reasonable.
Thomas H. Mack
DWS Investments Distributors, Inc.
222 South Riverside Plaza
Chicago, IL 60606
(800) 621-1148
VS2GT-3 (R-023295-1 8/11)
JUNE 30, 2011
SEMIANNUAL REPORT
DWS VARIABLE SERIES II
DWS Government & Agency Securities VIP
Contents
3 Performance Summary 4 Information About Your Fund's Expenses 5 Portfolio Summary 6 Investment Portfolio 10 Statement of Assets and Liabilities 10 Statement of Operations 11 Statement of Changes in Net Assets 13 Financial Highlights 15 Notes to Financial Statements 20 Proxy Voting 21 Summary of Management Fee Evaluation by Independent Fee Consultant |
This report must be preceded or accompanied by a prospectus. To obtain an additional prospectus or summary prospectus, if available, call (800) 728-3337 or your financial representative. We advise you to consider the Fund's objectives, risks, charges and expenses carefully before investing. The summary prospectus and prospectus contain this and other important information about the Fund. Please read the prospectus carefully before you invest.
Bond investments are subject to interest-rate and credit risks. When interest rates rise, bond prices generally fall. Credit risk refers to the ability of an issuer to make timely payments of principal and interest. In the current market environment, mortgage backed securities are experiencing increased volatility. The "full faith and credit" guarantee of the US government applies to the timely repayment of interest, and does not eliminate market risk. See the prospectus for details.
DWS Investments is part of Deutsche Bank's Asset Management division and, within the US, represents the retail asset management activities of Deutsche Bank AG, Deutsche Bank Trust Company Americas, Deutsche Investment Management Americas Inc. and DWS Trust Company.
NOT FDIC/NCUA INSURED NO BANK GUARANTEE MAY LOSE VALUE NOT A DEPOSIT
NOT INSURED BY ANY FEDERAL GOVERNMENT AGENCY
Performance Summary June 30, 2011
Fund performance shown is historical, assumes reinvestment of all dividend and capital gain distributions and does not guarantee future results. Investment return and principal value fluctuate with changing market conditions so that, when redeemed, shares may be worth more or less than their original cost. Current performance may be lower or higher than the performance data quoted. Please contact your participating insurance company for the Fund's most recent month-end performance. Performance doesn't reflect charges and fees ("contract charges") associated with the separate account that invests in the Fund or any variable life insurance policy or variable annuity contract for which the Fund is an investment option. These charges and fees will reduce returns. While all share classes have the same underlying portfolio, their performance will differ.
The gross expense ratios of the Fund, as stated in the fee table of the prospectus dated May 1, 2011 are 0.64% and 0.99% for Class A and Class B shares, respectively, and may differ from the expense ratios disclosed in the Financial Highlights tables in this report.
| Growth of an Assumed $10,000 Investment in DWS Government & Agency Securities VIP |
[] DWS Government & Agency Securities VIP — Class A [] Barclays Capital GNMA Index | The Barclays Capital GNMA Index is an unmanaged, market-value-weighted measure of all fixed-rate securities backed by mortgage pools of the Government National Mortgage Association. Index returns do not reflect any fees or expenses and it is not possible to invest directly into an index. |
| |
| Yearly periods ended June 30 | |
| Comparative Results | |
| DWS Government & Agency Securities VIP | | 6-Month‡ | | | 1-Year | | | 3-Year | | | 5-Year | | | 10-Year | |
| Class A | Growth of $10,000 | | $ | 10,411 | | | $ | 10,427 | | | $ | 12,385 | | | $ | 13,986 | | | $ | 16,982 | |
| Average annual total return | | | 4.11 | % | | | 4.27 | % | | | 7.39 | % | | | 6.94 | % | | | 5.44 | % |
| Barclays Capital GNMA Index | Growth of $10,000 | | $ | 10,352 | | | $ | 10,491 | | | $ | 12,326 | | | $ | 14,122 | | | $ | 17,594 | |
| Average annual total return | | | 3.52 | % | | | 4.91 | % | | | 7.22 | % | | | 7.15 | % | | | 5.81 | % |
| DWS Government & Agency Securities VIP | | 6-Month‡ | | | 1-Year | | | 3-Year | | | 5-Year | | | Life of Class* | |
| Class B | Growth of $10,000 | | $ | 10,396 | | | $ | 10,388 | | | $ | 12,262 | | | $ | 13,723 | | | $ | 15,190 | |
| Average annual total return | | | 3.96 | % | | | 3.88 | % | | | 7.03 | % | | | 6.54 | % | | | 4.76 | % |
| Barclays Capital GNMA Index | Growth of $10,000 | | $ | 10,352 | | | $ | 10,491 | | | $ | 12,326 | | | $ | 14,122 | | | $ | 16,207 | |
| Average annual total return | | | 3.52 | % | | | 4.91 | % | | | 7.22 | % | | | 7.15 | % | | | 5.51 | % |
The growth of $10,000 is cumulative.
‡ Total returns shown for periods less than one year are not annualized.
* The Fund commenced offering Class B shares on July 1, 2002. Index returns began on June 30, 2002.
Information About Your Fund's Expenses
As an investor of the Fund, you incur two types of costs: ongoing expenses and transaction costs. Ongoing expenses include management fees, distribution and service (12b-1) fees and other Fund expenses. Examples of transaction costs include contract charges, redemption fees and account maintenance fees, which are not shown in this section. The following tables are intended to help you understand your ongoing expenses (in dollars) of investing in the Fund and to help you compare these expenses with the ongoing expenses of investing in other mutual funds. The example in the table is based on an investment of $1,000 invested at the beginning of the six-month period and held for the entire period (January 1, 2011 to June 30, 2011).
The tables illustrate your Fund's expenses in two ways:
•Actual Fund Return. This helps you estimate the actual dollar amount of ongoing expenses (but not transaction costs) paid on a $1,000 investment in the Fund using the Fund's actual return during the period. To estimate the expenses you paid over the period, simply divide your account value by $1,000 (for example, an $8,600 account value divided by $1,000 = 8.6), then multiply the result by the number in the "Expenses Paid per $1,000" line under the share class you hold.
• Hypothetical 5% Fund Return. This helps you to compare your Fund's ongoing expenses (but not transaction costs) with those of other mutual funds using the Fund's actual expense ratio and a hypothetical rate of return of 5% per year before expenses. Examples using a 5% hypothetical Fund return may be found in the shareholder reports of other mutual funds. The hypothetical account values and expenses may not be used to estimate the actual ending account balance or expenses you paid for the period.
Please note that the expenses shown in these tables are meant to highlight your ongoing expenses only and do not reflect any transaction costs. The "Expenses Paid per $1,000" line of the tables is useful in comparing ongoing expenses only and will not help you determine the relative total expense of owning different funds. If these transaction costs had been included, your costs would have been higher.
Expenses and Value of a $1,000 Investment for the six months ended June 30, 2011 | |
| Actual Fund Return | | Class A | | | Class B | |
| Beginning Account Value 1/1/11 | | $ | 1,000.00 | | | $ | 1,000.00 | |
| Ending Account Value 6/30/11 | | $ | 1,041.10 | | | $ | 1,039.60 | |
| Expenses Paid per $1,000* | | $ | 3.49 | | | $ | 5.21 | |
| Hypothetical 5% Fund Return | | Class A | | | Class B | |
| Beginning Account Value 1/1/11 | | $ | 1,000.00 | | | $ | 1,000.00 | |
| Ending Account Value 6/30/11 | | $ | 1,021.37 | | | $ | 1,019.69 | |
| Expenses Paid per $1,000* | | $ | 3.46 | | | $ | 5.16 | |
* Expenses are equal to the Fund's annualized expense ratio for each share class, multiplied by the average account value over the period, multiplied by the number of days in the most recent six-month period, then divided by 365.
| Annualized Expense Ratios | Class A | | Class B | |
| DWS Variable Series II — DWS Government & Agency Securities VIP | .69% | | 1.03% | |
For more information, please refer to the Fund's prospectus.
These tables do not reflect charges and fees ("contract charges") associated with the separate account that invests in the Fund or any variable life insurance policy or variable annuity contract for which the Fund is an investment option.
Asset Allocation (As a % of Investment Portfolio excluding Securities Lending Collateral) | 6/30/11 | 12/31/10 |
| | | |
| Mortgage-Backed Securities Pass-Throughs | 62% | 69% |
| Government & Agency Obligations | 19% | 14% |
| Collateralized Mortgage Obligation | 19% | 15% |
| Cash Equivalents | 0% | 2% |
| | 100% | 100% |
| Coupons* | 6/30/11 | 12/31/10 |
| | | |
| Less than 4.5% | 52% | 4% |
| 4.5%-5.49% | 31% | 50% |
| 5.5%-6.49% | 10% | 40% |
| 6.5%-7.49% | 5% | 4% |
| 7.5% and Greater | 2% | 2% |
| | 100% | 100% |
| Interest Rate Sensitivity | 6/30/11 | 12/31/10 |
| | | |
| Effective Maturity | 5.5 years | 5.9 years |
| Effective Duration | 5.4 years | 5.0 years |
* Excludes Cash Equivalents, Securities Lending Collateral, US Treasury Bills and Options Purchased.
Asset allocation, coupons and interest rate sensitivity are subject to change.
Effective maturity is the weighted average of the bonds held by the Fund taking into consideration any available maturity shortening features.
Effective duration is an approximate measure of the Fund's sensitivity to interest rate changes taking into consideration any maturity shortening features.
For more complete details about the Fund's investment portfolio, see page 6.
Following the Fund's fiscal first and third quarter-end, a complete portfolio holdings listing is filed with the SEC on Form N-Q. The form will be available on the SEC's Web site at www.sec.gov, and it also may be reviewed and copied at the SEC's Public Reference Room in Washington, D.C. Information on the operation of the SEC's Public Reference Room may be obtained by calling (800) SEC-0330. The Fund's portfolio holdings are also posted on www.dws-investments.com from time to time. Please see the Fund's current prospectus for more information.
Investment Portfolio June 30, 2011 (Unaudited) | | | Principal Amount ($) | | | Value ($) | |
| | | | |
| Mortgage-Backed Securities Pass-Throughs 66.8% | |
| Federal Home Loan Mortgage Corp.: | | | |
| 4.5%, 3/1/2039 (a) | | | 12,000,000 | | | | 12,396,563 | |
| 5.0%, 11/1/2036 (a) | | | 3,000,000 | | | | 3,182,344 | |
| 7.0%, with various maturities from 6/1/2032 until 8/1/2035 | | | 204,258 | | | | 227,692 | |
| Federal National Mortgage Association: | | | | | | | | |
| 4.0%, 10/1/2039 (a) | | | 12,000,000 | | | | 12,000,000 | |
| 4.5%, with various maturities from 2/1/2039 until 5/1/2041 (a) | | | 11,667,884 | | | | 12,074,048 | |
| 5.0%, with various maturities from 10/1/2033 until 7/1/2036 (a) | | | 364,943 | | | | 389,662 | |
| Government National Mortgage Association: | | | | | | | | |
| 4.5%, with various maturities from 2/15/2039 until 5/20/2041 (a) | | | 11,168,865 | | | | 11,781,275 | |
| 5.0%, with various maturities from 12/15/2032 until 5/20/2041 (a) (b) | | | 5,601,634 | | | | 6,280,272 | |
| 5.5%, with various maturities from 3/15/2029 until 7/20/2040 (a) | | | 12,135,156 | | | | 13,478,774 | |
| 6.0%, with various maturities from 7/15/2014 until 7/20/2039 | | | 18,854,844 | | | | 21,067,874 | |
| 6.5%, with various maturities from 4/15/2031 until 2/15/2039 | | | 4,979,903 | | | | 5,626,830 | |
| 7.0%, with various maturities from 2/20/2027 until 11/15/2038 | | | 862,829 | | | | 979,583 | |
| 7.5%, with various maturities from 4/15/2026 until 1/15/2037 | | | 727,913 | | | | 839,252 | |
Total Mortgage-Backed Securities Pass-Throughs (Cost $93,881,789) | | | | 100,324,169 | |
| | |
| Collateralized Mortgage Obligations 20.4% | |
| Fannie Mae Benchmark Remic, "ZA", Series 2007-B2, 5.5%, 6/25/2037 | | | 1,751,622 | | | | 1,913,463 | |
| FannieMae Whole Loan, "1A6", Series 2007-W8, 6.482%*, 9/25/2037 | | | 746,276 | | | | 784,807 | |
| Federal Home Loan Mortgage Corp.: | |
| "OA", Series 3179, Principal Only, Zero Coupon, 7/15/2036 | | | 810,057 | | | | 687,663 | |
| "FO", Series 2418, 1.087%*, 2/15/2032 | | | 463,839 | | | | 471,713 | |
| "FA", Series 2419, 1.187%*, 2/15/2032 | | | 382,914 | | | | 390,618 | |
| "FA", Series 2436, 1.187%*, 3/15/2032 | | | 364,615 | | | | 371,830 | |
| "IK", Series 3754, Interest Only, 3.5%, 6/15/2025 | | | 2,456,890 | | | | 324,056 | |
| "NI", Series 3657, Interest Only, 4.5%, 8/15/2027 | | | 2,258,386 | | | | 239,106 | |
| "ZK", Series 3382, 5.0%, 7/15/2037 | | | 1,195,775 | | | | 1,232,393 | |
| "22", Series 243, Interest Only, 5.239%**, 6/15/2021 | | | 1,989,430 | | | | 231,412 | |
| "PI", Series 2535, Interest Only, 6.0%, 9/15/2032 | | | 847,620 | | | | 59,091 | |
| "WS", Series 2877, Interest Only, 6.413%**, 10/15/2034 | | | 913,423 | | | | 78,468 | |
| "A", Series 172, Interest Only, 6.5%, 1/1/2024 | | | 43,683 | | | | 7,857 | |
| | | Principal Amount ($) | | | Value ($) | |
| | | | | | | | | |
| "S", Series 2416, Interest Only, 7.913%**, 2/15/2032 | | | 573,715 | | | | 109,074 | |
| "ST", Series 2411, Interest Only, 8.563%**, 6/15/2021 | | | 2,127,944 | | | | 315,754 | |
| "KS", Series 2064, Interest Only, 9.963%**, 5/15/2022 | | | 529,222 | | | | 105,552 | |
| Federal National Mortgage Association: | | | | | | | | |
| "FA", Series G92-53, 0.969%*, 9/25/2022 | | | 1,201,680 | | | | 1,215,477 | |
| "OF", Series 2001-60, 1.136%*, 10/25/2031 | | | 193,561 | | | | 196,845 | |
| "FB", Series 2002-30, 1.186%*, 8/25/2031 | | | 419,857 | | | | 428,262 | |
| "FG", Series 2002-66, 1.186%*, 9/25/2032 | | | 639,459 | | | | 652,205 | |
| "25", Series 351, Interest Only, 4.5%, 5/1/2019 | | | 436,034 | | | | 44,577 | |
| "HI", Series 2009-77, Interest Only, 4.5%, 9/25/2027 | | | 1,878,999 | | | | 274,352 | |
| "20", Series 334, Interest Only, 5.0%, 3/1/2018 | | | 317,093 | | | | 31,598 | |
| "21", Series 334, Interest Only, 5.0%, 3/1/2018 | | | 212,599 | | | | 22,044 | |
| ''23", Series 339, Interest Only, 5.0%, 7/1/2018 | | | 448,044 | | | | 43,953 | |
| "ZA", Series 2008-24, 5.0%, 4/25/2038 | | | 617,433 | | | | 659,272 | |
| "PI", Series 2009-14, Interest Only, 5.5%, 3/25/2024 | | | 1,526,754 | | | | 172,019 | |
| "ZQ", Series G93-39, 6.5%, 12/25/2023 | | | 416,322 | | | | 467,268 | |
| "SA", Series G92-57, IOette, 82.85%**, 10/25/2022 | | | 66,978 | | | | 130,955 | |
| Government National Mortgage Association: | | | | | | | | |
| "FB", Series 2001-28, 0.686%*, 6/16/2031 | | | 450,621 | | | | 454,182 | |
| "JY", Series 2010-20, 4.0%, 12/20/2033 | | | 1,822,500 | | | | 1,767,099 | |
| "LI", Series 2009-104, Interest Only, 4.5%, 12/16/2018 | | | 521,601 | | | | 53,701 | |
| "NI", Series 2010-44, Interest Only, 4.5%, 10/20/2037 | | | 923,050 | | | | 132,273 | |
| "CI", Series 2010-87, Interest Only, 4.5%, 11/20/2038 | | | 1,251,588 | | | | 391,775 | |
| "MI", Series 2010-169, Interest Only, 4.5%, 8/20/2040 | | | 1,186,353 | | | | 201,583 | |
| "VB", Series 2010-26, 5.0%, 1/20/2024 | | | 600,000 | | | | 650,691 | |
| "KE", Series 2004-19, 5.0%, 3/16/2034 | | | 500,000 | | | | 539,770 | |
| "ZM", Series 2004-24, 5.0%, 4/20/2034 | | | 2,144,816 | | | | 2,302,116 | |
| "Z", Series 2004-61, 5.0%, 8/16/2034 | | | 1,054,719 | | | | 1,098,268 | |
| "LE", Series 2004-87, 5.0%, 10/20/2034 | | | 1,000,000 | | | | 1,057,478 | |
| "ZB", Series 2005-15, 5.0%, 2/16/2035 | | | 1,508,807 | | | | 1,614,585 | |
| "GZ", Series 2005-24, 5.0%, 3/20/2035 | | | 457,594 | | | | 450,623 | |
| "ZA", Series 2005-75, 5.0%, 10/16/2035 | | | 514,785 | | | | 539,687 | |
| "CK", Series 2007-31, 5.0%, 5/16/2037 | | | 1,000,000 | | | | 1,090,825 | |
| | | Principal Amount ($) | | | Value ($) | |
| | | | | | | | | |
| "MZ", Series 2009-98, 5.0%, 10/16/2039 | | | 923,709 | | | | 951,815 | |
| "AI", Series 2008-46, Interest Only, 5.5%, 5/16/2023 | | | 498,651 | | | | 63,974 | |
| "AI", Series 2008-51, Interest Only, 5.5%, 5/16/2023 | | | 1,034,249 | | | | 128,100 | |
| "GI", Series 2003-19, Interest Only, 5.5%, 3/16/2033 | | | 1,090,909 | | | | 325,010 | |
| "ZA", Series 2006-7, 5.5%, 2/20/2036 | | | 2,277,985 | | | | 2,539,112 | |
| "IB", Series 2010-130, Interest Only, 5.5%, 2/20/2038 | | | 1,964,508 | | | | 147,559 | |
| "NZ", Series 2009-65, 5.5%, 8/20/2039 | | | 367,138 | | | | 404,490 | |
| "KZ", Series 2009-78, 5.5%, 9/16/2039 | | | 336,842 | | | | 357,178 | |
| "DI", Series 2009-10, Interest Only, 6.0%, 4/16/2038 | | | 552,833 | | | | 98,817 | |
| "PY", Series 2009-122, 6.0%, 12/20/2039 | | | 561,709 | | | | 619,260 | |
| "SA", Series 2008-44, Interest Only, 6.214%**, 5/20/2038 | | | 1,239,406 | | | | 168,520 | |
| "QA", Series 2007-57, Interest Only, 6.314%**, 10/20/2037 | | | 752,524 | | | | 102,810 | |
| "IP", Series 2009-118, Interest Only, 6.5%, 12/16/2039 | | | 230,829 | | | | 45,338 | |
| "SA", Series 2006-69, Interest Only, 6.614%**, 12/20/2036 | | | 1,348,781 | | | | 204,338 | |
| "PS", Series 2004-34, Interest Only, 6.964%**, 4/16/2034 | | | 314,168 | | | | 53,799 | |
| "IC", Series 1997-4, Interest Only, 7.5%, 3/16/2027 | | | 892,755 | | | | 198,045 | |
| "SK", Series 2003-11, Interest Only, 7.514%**, 2/16/2033 | | | 818,559 | | | | 149,828 | |
Total Collateralized Mortgage Obligations (Cost $27,496,088) | | | | 30,564,333 | |
| | |
| Government & Agency Obligations 20.4% | |
| US Government Sponsored Agency 11.4% | |
| Federal Home Loan Bank, 3.625%, 10/18/2013 | | | 16,000,000 | | | | 17,077,024 | |
| | | Principal Amount ($) | | | Value ($) | |
| | | | | | | | | |
| US Treasury Obligations 9.0% | |
| US Treasury Bill, 0.135%***, 9/15/2011 (c) | | | 1,045,000 | | | | 1,044,956 | |
| US Treasury Notes: | |
| 0.75%, 6/15/2014 | | | 10,000,000 | | | | 9,988,280 | |
| 0.875%, 2/29/2012 | | | 2,500,000 | | | | 2,512,100 | |
| | | | | 13,545,336 | |
Total Government & Agency Obligations (Cost $30,672,485) | | | | 30,622,360 | |
| | | Contracts | | | Value ($) | |
| | | | |
| Call Options Purchased 0.0% | |
| Floating Rate — LIBOR, Effective Date 6/28/2011, Expiration Date 9/28/2011, Cap Rate 3.205% (Cost $14,756) | | | 3,261,000 | | | | 14,756 | |
| | |
| Put Options Purchased 0.0% | |
| 10 Year US Treasury Note Future, Expiration Date 8/26/2011, Strike Price $122.0 | | | 35 | | | | 44,297 | |
| Floating Rate — LIBOR, Effective Date 6/27/2011, Expiration Date 9/17/2011, Cap Rate 3.178% | | | 3,261,000 | | | | 14,674 | |
Total Put Options Purchased (Cost $41,424) | | | | 58,971 | |
| | | Shares | | | Value ($) | |
| | | | |
| Securities Lending Collateral 5.7% | |
| Daily Assets Fund Institutional, 0.13% (d) (e) (Cost $8,614,278) | | | 8,614,278 | | | | 8,614,278 | |
| | |
| Cash Equivalents 0.0% | |
| Central Cash Management Fund, 0.11% (d) (Cost $11,974) | | | 11,974 | | | | 11,974 | |
| | | % of Net Assets | | | Value ($) | |
| | | | |
Total Investment Portfolio (Cost $160,732,794)+ | | | 113.3 | | | | 170,210,841 | |
| Other Assets and Liabilities, Net (b) | | | (13.0 | ) | | | (19,951,241 | ) |
| Net Assets | | | 100.0 | | | | 150,259,600 | |
* These securities are shown at their current rate as of June 30, 2011. Floating rate securities' yields vary with a designated market index or market rate, such as the coupon-equivalent of the US Treasury bill rate.
** These securities are shown at their current rate as of June 30, 2011.
*** Annualized yield at time of purchase; not a coupon rate.
+ The cost for federal income tax purposes was $160,732,834. At June 30, 2011, net unrealized appreciation for all securities based on tax cost was $9,478,007. This consisted of aggregate gross unrealized appreciation for all securities in which there was an excess of value over tax cost of $9,965,884 and aggregate gross unrealized depreciation for all securities in which there was an excess of tax cost over value of $487,877.
(a) When-issued or delayed delivery securities included.
(b) All or a portion of these securities were on loan amounting to $6,280,272 (see Notes to Financial Statements). In addition, included in other assets and liabilities, net are pending sales, amounting to $2,178,861, that is also on loan. The value of all securities loaned at June 30, 2011 amounted to $8,437,424, which is 5.6% of net assets.
(c) At June 30, 2011, this security has been pledged, in whole or in part, to cover initial margin requirements for open futures contracts.
(d) Affiliated fund managed by Deutsche Investment Management Americas Inc. The rate shown is the annualized seven-day yield at period end.
(e) Represents collateral held in connection with securities lending. Income earned by the Fund is net of borrower rebates.
Interest Only: Interest Only (IO) bonds represent the "interest only" portion of payments on a pool of underlying mortgages or mortgage-backed securities. IO securities are subject to prepayment risk of the pool of underlying mortgages.
IOettes: These securities represent the right to receive interest payments on an underlying pool of mortgages with similar features as those associated with IO securities. Unlike IO's, a nominal amount of principal is assigned to an IOette which is small in relation to the interest flow that constitutes almost all of the IOette cash flow. The effective yield of this security is lower than the stated interest rate.
Principal Only: Principal Only (PO) bonds represent the "principal only" portion of payments on a pool of underlying mortgages or mortgage-backed securities.
Included in the portfolio are investments in mortgage- or asset-backed securities which are interests in separate pools of mortgages or assets. Effective maturities of these investments may be shorter than stated maturities due to prepayments. Some separate investments in the Federal Home Loan Mortgage Corp., Federal National Mortgage Association and Government National Mortgage Association issues which have similar coupon rates have been aggregated for presentation purposes in this investment portfolio.
At June 30, 2011, open futures contracts sold were as follows:
| Futures | Currency | Expiration Date | | Contracts | | | Notional Value ($) | | | Unrealized Depreciation ($) | |
| 10 Year US Treasury Note | USD | 9/21/2011 | | | 3 | | | | 366,984 | | | | (328 | ) |
| Currency Abbreviation |
| USD United States Dollar |
At June 30, 2011, open interest rate swap contracts were as follows:
Effective/ Expiration Dates | | Notional Amount ($) | | Cash Flows Paid by the Fund | Cash Flows Received by the Fund | | Value ($) | | | Upfront Payments Paid/ (Received) ($) | | | Unrealized Depreciation ($) | |
10/28/2010 10/28/2025 | | | 320,000 | 1 | Floating — LIBOR | Floating — 4.154%++ | | | (12,441 | ) | | | — | | | | (12,441 | ) |
11/1/2010 11/1/2025 | | | 540,000 | 2 | Floating — LIBOR | Floating — 4.123%++ | | | (36,426 | ) | | | — | | | | (36,426 | ) |
11/12/2010 11/12/2025 | | | 640,000 | 1 | Floating — LIBOR | Floating — 4.264%++ | | | (24,015 | ) | | | — | | | | (24,015 | ) |
11/15/2010 11/15/2025 | | | 640,000 | 2 | Floating — LIBOR | Floating — 4.560%++ | | | (39,671 | ) | | | — | | | | (39,671 | ) |
11/16/2010 11/16/2025 | | | 320,000 | 1 | Floating — LIBOR | Floating — 4.560%++ | | | (9,275 | ) | | | — | | | | (9,275 | ) |
11/19/2010 11/19/2025 | | | 320,000 | 2 | Floating — LIBOR | Floating — 5.072%++ | | | (18,426 | ) | | | — | | | | (18,426 | ) |
11/23/2010 11/23/2025 | | | 150,000 | 1 | Floating — LIBOR | Floating — 4.808%++ | | | (3,498 | ) | | | — | | | | (3,498 | ) |
| Total unrealized depreciation | | | | (143,752 | ) |
++ These interest rate swaps are shown at their current rate as of June 30, 2011.
At June 30, 2011, open total return swap contracts were as follows:
Effective/ Expiration Date | | Notional Amount ($) | | | Fixed Cash Flows Paid | | Reference Entity | | Value ($) | | | Upfront Payments Paid/ (Received) ($) | | | Unrealized Depreciation ($) | |
5/28/2010 6/1/2012 | | | 6,900,000 | 3 | | | 0.45 | % | Citi Global Interest Rate Strategy Index | | | (48,605 | ) | | | — | | | | (48,605 | ) |
Counterparties:
1 Morgan Stanley
2 Barclays Capital Securities, Inc.
3 Citigroup, Inc.
LIBOR: London Interbank Offered Rate
For information on the Fund's policy and additional disclosures regarding options purchased, futures contracts, options contracts, interest rate swap contracts and total return swap contracts, please refer to the Derivatives section of Note B in the accompanying Notes to Financial Statements.
Fair Value Measurements
Various inputs are used in determining the value of the Fund's investments. These inputs are summarized in three broad levels. Level 1 includes quoted prices in active markets for identical securities. Level 2 includes other significant observable inputs (including quoted prices for similar securities, interest rates, prepayment speeds, and credit risk). Level 3 includes significant unobservable inputs (including the Fund's own assumptions in determining the fair value of investments). The inputs or methodology used for valuing securities are not necessarily an indication of the risk associated with investing in those securities.
The following is a summary of the inputs used as of June 30, 2011 in valuing the Fund's investments. For information on the Fund's policy regarding the valuation of investments, please refer to the Security Valuation section of Note A in the accompanying Notes to Financial Statements.
| Assets | | Level 1 | | | Level 2 | | | Level 3 | | | Total | |
| | |
Fixed-Income Investments (f) Mortgage-Backed Securities Pass-Throughs | | $ | — | | | $ | 100,324,169 | | | $ | — | | | $ | 100,324,169 | |
| Collateralized Mortgage Obligations | | | — | | | | 30,564,333 | | | | | | | | 30,564,333 | |
| Government & Agency Obligations | | | — | | | | 30,622,360 | | | | — | | | | 30,622,360 | |
| Short-Term Investments (f) | | | 8,626,252 | | | | — | | | | — | | | | 8,626,252 | |
| Derivatives (g) | | | 44,297 | | | | — | | | | 29,430 | | | | 73,727 | |
| Total | | $ | 8,670,549 | | | $ | 161,510,862 | | | $ | 29,430 | | | $ | 170,210,841 | |
| Liabilities | | | | | | | | | | | | | | | | |
Derivatives (g) | | $ | (328 | ) | | $ | (192,357 | ) | | $ | — | | | $ | (192,685 | ) |
| Total | | $ | (328 | ) | | $ | (192,357 | ) | | $ | — | | | $ | (192,685 | ) |
There have been no transfers between Level 1 and Level 2 fair value measurements during the period ended June 30, 2011.
(f) See Investment Portfolio for additional detailed categorizations.
(g) Derivatives include value of options purchased, unrealized appreciation (depreciation) on open futures contracts, interest rate swap contracts and total return swap contracts.
Level 3 Reconciliation
The following is a reconciliation of the Fund's Level 3 investments for which significant unobservable inputs were used in determining value:
| | | Collateralized Mortgage Obligations | | | Put Options Purchased | | | Total | |
| Balance as of December 31, 2010 | | $ | 518,128 | | | $ | — | | | $ | 518,128 | |
| Realized gains (loss) | | | 42,664 | | | | — | | | | 42,664 | |
| Change in unrealized appreciation (depreciation) | | | (44,578 | ) | | | 0 | | | | (44,578 | ) |
| Amortization premium/discount | | | (9,779 | ) | | | — | | | | (9,779 | ) |
| Purchases | | | — | | | | 29,430 | | | | 29,430 | |
| (Sales) | | | (506,435 | ) | | | — | | | | (506,435 | ) |
| Transfers into Level 3 | | | — | | | | — | | | | — | |
| Transfers (out) of Level 3 | | | — | | | | — | | | | — | |
| Balance as of June 30, 2011 | | $ | — | | | $ | 29,430 | | | $ | 29,430 | |
| Net change in unrealized appreciation (depreciation) from investments still held as of June 30, 2011 | | $ | — | | | $ | 0 | | | $ | 0 | |
Transfers between price levels are recognized at the beginning of the reporting period.
The accompanying notes are an integral part of the financial statements.
Statement of Assets and Liabilities | as of June 30, 2011 (Unaudited) | |
| Assets | |
Investments Investments in non-affiliated securities, at value (cost $152,106,542) — including $8,437,424 of securities loaned | | $ | 161,584,589 | |
| Investment in Daily Assets Fund Institutional Fund (cost $8,614,278)* | | | 8,614,278 | |
| Investment in Central Cash Management Fund (cost $11,974) | | | 11,974 | |
| Total investments in securities, at value (cost $160,732,794) | | | 170,210,841 | |
| Cash | | | 10,310 | |
| Receivable for variation margin on futures contracts | | | 69,842 | |
| Receivable for investments sold | | | 17,355,350 | |
| Receivable for investments sold — when-issued/delayed delivery securities | | | 76,126,530 | |
| Receivable for Fund shares sold | | | 223 | |
| Interest receivable | | | 717,739 | |
| Other assets | | | 1,231 | |
| Total assets | | | 264,492,066 | |
| Liabilities | |
| Payable upon return of securities loaned | | | 8,614,278 | |
| Payable for investments purchased | | | 11,672,929 | |
| Payable for investments purchased — when-issued/delayed delivery securities | | | 92,841,642 | |
| Line of credit loan payable | | | 500,000 | |
| Payable for Fund shares redeemed | | | 271,082 | |
| Unrealized depreciation on swap contracts | | | 192,357 | |
| Accrued management fee | | | 59,403 | |
| Other accrued expenses and payables | | | 80,775 | |
| Total liabilities | | | 114,232,466 | |
| Net assets, at value | | $ | 150,259,600 | |
| Net Assets Consist of | |
| Undistributed net investment income | | | 2,957,833 | |
Net unrealized appreciation (depreciation) on: Investments | | | 9,478,047 | |
| Swap contracts | | | (192,357 | ) |
| Futures | | | (328 | ) |
| Accumulated net realized gain (loss) | | | 1,819,265 | |
| Paid-in capital | | | 136,197,140 | |
| Net assets, at value | | $ | 150,259,600 | |
Class A Net Asset Value, offering and redemption price per share ($144,473,331 ÷ 11,370,982 outstanding shares of beneficial interest, no par value, unlimited number of shares authorized) | | $ | 12.71 | |
Class B Net Asset Value, offering and redemption price per share ($5,786,269 ÷ 455,391 outstanding shares of beneficial interest, no par value, unlimited number of shares authorized) | | $ | 12.71 | |
* Represents collateral on securities loaned
The accompanying notes are an integral part of the financial statements.
Statement of Operations
| for the six months ended June 30, 2011 (Unaudited) | |
| Investment Income | |
Income: Interest | | $ | 3,518,878 | |
| Income distributions — Central Cash Management Fund | | | 2,855 | |
| Securities lending income, including income from Daily Assets Fund Institutional, net of borrower rebates | | | 902 | |
| Total income | | | 3,522,635 | |
Expenses: Management fee | | | 348,283 | |
| Administration fee | | | 77,396 | |
| Services to shareholders | | | 1,192 | |
| Distribution service fee (Class B) | | | 7,195 | |
| Record keeping fees (Class B) | | | 2,543 | |
| Custodian fee | | | 23,094 | |
| Audit and tax fees | | | 31,886 | |
| Legal fees | | | 4,826 | |
| Reports to shareholders | | | 20,566 | |
| Trustees' fees and expenses | | | 3,893 | |
| Interest expense | | | 1,187 | |
| Other | | | 21,709 | |
| Total expenses | | | 543,770 | |
| Net investment income | | | 2,978,865 | |
| Realized and Unrealized Gain (Loss) | |
Net realized gain (loss) from: Investments | | | 1,728,061 | |
| Swap contracts | | | 139,913 | |
| Futures | | | (115,531 | ) |
| Written options | | | (16,517 | ) |
| | | | 1,735,926 | |
Change in net unrealized appreciation (depreciation) on: Investments | | | 1,343,891 | |
| Swap contracts | | | (33,822 | ) |
| Futures | | | 145,355 | |
| | | | 1,455,424 | |
| Net gain (loss) | | | 3,191,350 | |
| Net increase (decrease) in net assets resulting from operations | | $ | 6,170,215 | |
The accompanying notes are an integral part of the financial statements.
Statement of Changes in Net Assets | Increase (Decrease) in Net Assets | | Six Months Ended June 30, 2011 (Unaudited) | | | Year Ended December 31, 2010 | |
Operations: Net investment income | | $ | 2,978,865 | | | $ | 6,744,096 | |
| Net realized gain (loss) | | | 1,735,926 | | | | 3,185,188 | |
| Change in net unrealized appreciation (depreciation) | | | 1,455,424 | | | | 1,407,447 | |
| Net increase (decrease) in net assets resulting from operations | | | 6,170,215 | | | | 11,336,731 | |
Distributions to shareholders from: Net investment income: Class A | | | (6,311,902 | ) | | | (7,785,441 | ) |
| Class B | | | (230,895 | ) | | | (277,185 | ) |
Net realized gain: Class A | | | (2,391,762 | ) | | | — | |
| Class B | | | (95,528 | ) | | | — | |
| Total distributions | | | (9,030,087 | ) | | | (8,062,626 | ) |
Fund share transactions: Class A Proceeds from shares sold | | | 15,071,235 | | | | 38,574,553 | |
| Reinvestment of distributions | | | 8,703,664 | | | | 7,785,441 | |
| Payments for shares redeemed | | | (33,813,043 | ) | | | (61,339,038 | ) |
| Net increase (decrease) in net assets from Class A share transactions | | | (10,038,144 | ) | | | (14,979,044 | ) |
Class B Proceeds from shares sold | | | 150,198 | | | | 653,336 | |
| Reinvestment of distributions | | | 326,423 | | | | 277,185 | |
| Payments for shares redeemed | | | (446,055 | ) | | | (1,704,050 | ) |
| Net increase (decrease) in net assets from Class B share transactions | | | 30,566 | | | | (773,529 | ) |
| Increase (decrease) in net assets | | | (12,867,450 | ) | | | (12,478,468 | ) |
| Net assets at beginning of period | | | 163,127,050 | | | | 175,605,518 | |
| Net assets at end of period (including undistributed net investment income of $2,957,833 and $6,521,765, respectively) | | $ | 150,259,600 | | | $ | 163,127,050 | |
| Other Information | |
Class A Shares outstanding at beginning of period | | | 12,120,178 | | | | 13,231,519 | |
| Shares sold | | | 1,173,826 | | | | 2,996,102 | |
| Shares issued to shareholders in reinvestment of distributions | | | 700,214 | | | | 623,833 | |
| Shares redeemed | | | (2,623,236 | ) | | | (4,731,276 | ) |
| Net increase (decrease) in Class A shares | | | (749,196 | ) | | | (1,111,341 | ) |
| Shares outstanding at end of period | | | 11,370,982 | | | | 12,120,178 | |
Class B Shares outstanding at beginning of period | | | 452,192 | | | | 510,999 | |
| Shares sold | | | 11,742 | | | | 50,683 | |
| Shares issued to shareholders in reinvestment of distributions | | | 26,240 | | | | 22,193 | |
| Shares redeemed | | | (34,783 | ) | | | (131,683 | ) |
| Net increase (decrease) in Class B shares | | | 3,199 | | | | (58,807 | ) |
| Shares outstanding at end of period | | | 455,391 | | | | 452,192 | |
The accompanying notes are an integral part of the financial statements.
| | | | | | Years Ended December 31, | |
| Class A | | Six Months Ended 6/30/11 (Unaudited) | | | 2010 | | | 2009 | | | 2008 | | | 2007 | | | 2006 | |
| Selected Per Share Data | |
| Net asset value, beginning of period | | $ | 12.98 | | | $ | 12.78 | | | $ | 12.40 | | | $ | 12.38 | | | $ | 12.28 | | | $ | 12.26 | |
Income (loss) from investment operations: Net investment incomea | | | .25 | | | | .50 | | | | .52 | | | | .56 | | | | .58 | | | | .55 | |
| Net realized and unrealized gain (loss) | | | .27 | | | | .32 | | | | .45 | | | | .04 | | | | .12 | | | | (.06 | ) |
| Total from investment operations | | | .52 | | | | .82 | | | | .97 | | | | .60 | | | | .70 | | | | .49 | |
Less distributions from: Net investment income | | | (.57 | ) | | | (.62 | ) | | | (.59 | ) | | | (.58 | ) | | | (.60 | ) | | | (.47 | ) |
| Net realized gains | | | (.22 | ) | | | — | | | | — | | | | — | | | | — | | | | — | |
| Total distributions | | | (.79 | ) | | | (.62 | ) | | | (.59 | ) | | | (.58 | ) | | | (.60 | ) | | | (.47 | ) |
| Net asset value, end of period | | $ | 12.71 | | | $ | 12.98 | | | $ | 12.78 | | | $ | 12.40 | | | $ | 12.38 | | | $ | 12.28 | |
| Total Return (%) | | | 4.11 | ** | | | 6.61 | | | | 8.08 | | | | 4.93 | b | | | 5.95 | b | | | 4.16 | |
| Ratios to Average Net Assets and Supplemental Data | |
| Net assets, end of period ($ millions) | | | 144 | | | | 157 | | | | 169 | | | | 211 | | | | 199 | | | | 211 | |
| Ratio of expenses before expense reductions (%) | | | .69 | * | | | .64 | | | | .58 | | | | .66 | | | | .66 | | | | .67 | |
| Ratio of expenses after expense reductions (%) | | | .69 | * | | | .64 | | | | .58 | | | | .65 | | | | .63 | | | | .67 | |
| Ratio of net investment income (%) | | | 3.86 | * | | | 3.86 | | | | 4.16 | | | | 4.58 | | | | 4.77 | | | | 4.56 | |
| Portfolio turnover rate (%) | | | 315 | ** | | | 423 | | | | 390 | | | | 543 | | | | 465 | | | | 241 | |
a Based on average shares outstanding during the period. b Total return would have been lower had certain expenses not been reduced. * Annualized ** Not annualized | |
| | | | | | Years Ended December 31, | |
| Class B | | Six Months Ended 6/30/11 (Unaudited) | | | 2010 | | | 2009 | | | 2008 | | | 2007 | | | 2006 | |
| Selected Per Share Data | |
| Net asset value, beginning of period | | $ | 12.95 | | | $ | 12.75 | | | $ | 12.37 | | | $ | 12.35 | | | $ | 12.25 | | | $ | 12.23 | |
Income (loss) from investment operations: Net investment incomea | | | .23 | | | | .46 | | | | .48 | | | | .52 | | | | .53 | | | | .50 | |
| Net realized and unrealized gain (loss) | | | .27 | | | | .31 | | | | .45 | | | | .03 | | | | .12 | | | | (.06 | ) |
| Total from investment operations | | | .50 | | | | .77 | | | | .93 | | | | .55 | | | | .65 | | | | .44 | |
Less distributions from: Net investment income | | | (.52 | ) | | | (.57 | ) | | | (.55 | ) | | | (.53 | ) | | | (.55 | ) | | | (.42 | ) |
| Net realized gains | | | (.22 | ) | | | — | | | | — | | | | — | | | | — | | | | — | |
| Total distributions | | | (.74 | ) | | | (.57 | ) | | | (.55 | ) | | | (.53 | ) | | | (.55 | ) | | | (.42 | ) |
| Net asset value, end of period | | $ | 12.71 | | | $ | 12.95 | | | $ | 12.75 | | | $ | 12.37 | | | $ | 12.35 | | | $ | 12.25 | |
| Total Return (%) | | | 3.96 | ** | | | 6.24 | | | | 7.70 | | | | 4.60 | b | | | 5.43 | b | | | 3.74 | |
| Ratios to Average Net Assets and Supplemental Data | |
| Net assets, end of period ($ millions) | | | 6 | | | | 6 | | | | 7 | | | | 8 | | | | 5 | | | | 33 | |
| Ratio of expenses before expense reductions (%) | | | 1.03 | * | | | .99 | | | | .92 | | | | 1.00 | | | | 1.04 | | | | 1.07 | |
| Ratio of expenses after expense reductions (%) | | | 1.03 | * | | | .99 | | | | .92 | | | | 1.00 | | | | 1.01 | | | | 1.07 | |
| Ratio of net investment income (%) | | | 3.52 | * | | | 3.51 | | | | 3.81 | | | | 4.24 | | | | 4.39 | | | | 4.16 | |
| Portfolio turnover rate (%) | | | 315 | ** | | | 423 | | | | 390 | | | | 543 | | | | 465 | | | | 241 | |
a Based on average shares outstanding during the period. b Total return would have been lower had certain expenses not been reduced. * Annualized ** Not annualized | |
Notes to Financial Statements (Unaudited)
A. Organization and Significant Accounting Policies
DWS Government & Agency Securities VIP (the "Fund") is a diversified series of DWS Variable Series II (the "Trust"), which is registered under the Investment Company Act of 1940, as amended (the "1940 Act"), as an open-end management investment company organized as a Massachusetts business trust.
Multiple Classes of Shares of Beneficial Interest. The Fund offers two classes of shares (Class A shares and Class B shares). Sales of Class B shares are subject to recordkeeping fees up to 0.15% and Rule 12b-1 fees under the 1940 Act equal to an annual rate of 0.25% of the average daily net assets of the Class B shares of the Fund. Class A shares are not subject to such fees.
Investment income, realized and unrealized gains and losses, and certain fund-level expenses and expense reductions, if any, are borne pro rata on the basis of relative net assets by the holders of all classes of shares except that each class bears certain expenses unique to that class (including the applicable Rule 12b-1 fee and recordkeeping fees). Differences in class-level expenses may result in payment of different per share dividends by class. All shares have equal rights with respect to voting subject to class-specific arrangements.
The Fund's financial statements are prepared in accordance with accounting principles generally accepted in the United States of America which require the use of management estimates. Actual results could differ from those estimates. The policies described below are followed consistently by the Fund in the preparation of its financial statements.
Security Valuation. Investments are stated at value determined as of the close of regular trading on the New York Stock Exchange on each day the exchange is open for trading.
Various inputs are used in determining the value of the Fund's investments. These inputs are summarized in three broad levels. Level 1 includes quoted prices in active markets for identical securities. Level 2 includes other significant observable inputs (including quoted prices for similar securities, interest rates, prepayment speeds, and credit risk). Level 3 includes significant unobservable inputs (including the Fund's own assumptions in determining the fair value of investments). The inputs or methodology used for valuing securities are not necessarily an indication of the risk associated with investing in those securities.
Debt securities are valued by independent pricing services approved by the Fund's Board. If the pricing services are unable to provide valuations, securities are valued at the most recent bid quotation or evaluated price, as applicable, obtained from one or more broker-dealers. Such services may use various pricing techniques which take into account appropriate factors such as yield, quality, coupon rate, maturity, type of issue, trading characteristics and other data, as well as broker quotes. These securities are generally categorized as Level 2.
Money market instruments purchased with an original or remaining maturity of sixty days or less, maturing at par, are valued at amortized cost, which approximates value, and are categorized as Level 2. Investments in open-end investment companies are valued at their net asset value each business day and are categorized as Level 1.
Futures contracts are generally valued at the settlement prices established each day on the exchange on which they are traded and are categorized as Level 1.
Swap contracts are valued daily based upon prices supplied by a Board approved pricing vendor, if available, and otherwise are valued at the price provided by the broker-dealer. Swap contracts are generally categorized as Level 2.
Exchange-traded options are valued at the last sale price or, in the absence of a sale, the mean between the closing bid and asked prices or at the most recent asked price (bid for purchased options) if no bid or asked price are available. Exchange-traded options are categorized as Level 1. Over-the-counter written or purchased options are valued based upon a price provided by the broker-dealer with which the option, was traded and are generally categorized as Level 3.
Securities and other assets for which market quotations are not readily available or for which the above valuation procedures are deemed not to reflect fair value are valued in a manner that is intended to reflect their fair value as determined in accordance with procedures approved by the Board and are generally categorized as Level 3. In accordance with the Fund's valuation procedures, factors used in determining value may include, but are not limited to, the type of the security; the size of the holding; the initial cost of the security; the existence of any contractual restrictions on the security's disposition; the price and extent of public trading in similar securities of the issuer or of comparable companies; quotations or evaluated prices from broker-dealers and/or pricing services; information obtained from the issuer, analysts, and/or the appropriate stock exchange (for exchange-traded securities); an analysis of the company's or issuer's financial statements; an evaluation of the forces that influence the issuer and the market(s) in which the security is purchased and sold and with respect to debt securities; the maturity, coupon, creditworthiness, currency denomination and the movement of the market in which the security is normally traded. The value determined under these procedures may differ from published values for the same securities.
Disclosure about the classification of fair value measurements is included in a table following the Fund's Investment Portfolio.
Securities Lending. The Fund lends securities to certain financial institutions. The Fund retains beneficial ownership of the securities it has loaned and continues to receive interest and dividends paid by the issuer of securities and to participate in any changes in their market value. The Fund requires the borrowers of the securities to maintain collateral with the Fund consisting of either cash or liquid, unencumbered assets having a value at least equal to the value of the securities loaned. When the collateral falls below specified amounts, the lending agent will use its best effort to obtain additional collateral on the next business day to meet required amounts under the security lending agreement. The Fund may invest the cash collateral into a joint trading account in an affiliated money market fund pursuant to Exemptive Orders issued by the SEC. The Fund receives compensation for lending its securities either in the form of fees or by earning interest on invested cash collateral net of borrower rebates and fees paid to a lending agent. Either the Fund or the borrower may terminate the loan. There may be risks of delay and costs in recovery of securities or even loss of rights in the collateral should the borrower of the securities fail financially. The Fund is also subject to all investment risks associated with the reinvestment of any cash collateral received, including, but not limited to, interest rate, credit and liquidity risk associated with such investments.
Mortgage Dollar Rolls. The Fund may enter into mortgage dollar rolls in which the Fund sells to a bank or broker/dealer (the "counterparty") mortgage-backed securities for delivery in the current month and simultaneously contracts to repurchase similar, but not identical, securities on a fixed date. The counterparty receives all principal and interest payments, including prepayments, made on the security while it is the holder. The Fund receives compensation as consideration for entering into the commitment to repurchase. The compensation is paid in the form of a lower price for the security upon its repurchase, or alternatively, a fee. Mortgage dollar rolls may be renewed with a new sale and repurchase price and a cash settlement made at each renewal without physical delivery of the securities subject to the contract.
Certain risks may arise upon entering into mortgage dollar rolls from the potential inability of counterparties to meet the terms of their commitments. Additionally, the value of such securities may change adversely before the Fund is able to repurchase them. There can be no assurance that the Fund's use of the cash that it receives from a mortgage dollar roll will provide a return that exceeds its costs.
When-Issued/Delayed Delivery Securities. The Fund may purchase or sell securities with delivery or payment to occur at a later date beyond the normal settlement period. At the time the Fund enters into a commitment to purchase or sell a security, the transaction is recorded and the value of the transaction is reflected in the net asset value. The price of such security and the date when the security will be delivered and paid for are fixed at the time the transaction is negotiated. The value of the security may vary with market fluctuations. At the time the Fund enters into a purchase transaction it is required to segregate cash or other liquid assets at least equal to the amount of the commitment.
Certain risks may arise upon entering into when-issued or delayed delivery transactions from the potential inability of counterparties to meet the terms of their contracts or if the issuer does not issue the securities due to political, economic, or other factors. Additionally, losses may arise due to changes in the value of the underlying securities.
Federal Income Taxes. The Fund's policy is to comply with the requirements of the Internal Revenue Code, as amended, which are applicable to regulated investment companies and to distribute all of its taxable income to its shareholders.
On December 22, 2010, the Regulated Investment Company Modernization Act of 2010 (the "Act") was enacted. Under the Act, net capital losses may be carried forward indefinitely, and their character is retained as short-term and/or long-term losses. Previously, net capital losses were carried forward for eight years and treated as short-term losses. As a transition rule, the Act requires that post-enactment net capital losses be used before pre-enactment net capital losses. As a result of this ordering rule, pre-enactment capital loss carryforwards may expire unused, whereas under the previous rules these losses may have been utilized. This change is effective for fiscal years beginning after the date of enactment.
The Fund has reviewed the tax positions for the open tax years as of December 31, 2010 and has determined that no provision for income tax is required in the Fund's financial statements. The Fund's federal tax returns for the prior three fiscal years remain open subject to examination by the Internal Revenue Service.
Distribution of Income and Gains. Distributions of net investment income of the Fund, if any, are made annually. Net realized gains from investment transactions, in excess of available capital loss carryforwards, would be taxable to the Fund if not distributed and, therefore, will be distributed to shareholders at least annually. The Fund may also make additional distributions for tax purposes if necessary.
The timing and characterization of certain income and capital gains distributions are determined annually in accordance with federal tax regulations which may differ from accounting principles generally accepted in the United States of America. These differences primarily relate to investments in futures contracts, investments in swap contracts and certain securities sold at a loss. As a result, net investment income (loss) and net realized gain (loss) on investment transactions for a reporting period may differ significantly from distributions during such period. Accordingly, the Fund may periodically make reclassifications among certain of its capital accounts without impacting the net asset value of the Fund.
The tax character of current year distributions will be determined at the end of the current fiscal year.
Expenses. Expenses of the Trust arising in connection with a specific fund are allocated to that fund. Other Trust expenses which cannot be directly attributed to a fund are apportioned among the funds in the Trust.
Contingencies. In the normal course of business, the Fund may enter into contracts with service providers that contain general indemnification clauses. The Fund's maximum exposure under these arrangements is unknown as this would involve future claims that may be made against the Fund that have not yet been made. However, based on experience, the Fund expects the risk of loss to be remote.
Other. Investment transactions are accounted for on a trade date plus one basis for daily net asset value calculations. However, for financial reporting purposes, investment transactions are reported on trade date. Interest income is recorded on the accrual basis. Realized gains and losses from investment transactions are recorded on an identified cost basis and may include proceeds from litigation. All discounts and premiums are accreted/amortized for both tax and financial reporting purposes for the Fund.
B. Derivative Instruments
Interest Rate Swap Contracts. For the six months ended June 30, 2011, the Fund entered into interest rate swap transactions to gain exposure to different parts of the yield curve while managing overall duration. The use of interest rate swaps is a highly specialized activity that involves investment techniques and risks different from those associated with ordinary portfolio security transactions. In an interest rate swap, the Fund agrees to pay to the other party to the interest rate swap (which is known as the "counterparty") a fixed rate payment in exchange for the counterparty agreeing to pay to the Fund a variable rate payment, or the Fund agrees to receive from the counterparty a fixed rate payment in exchange for the counterparty agreeing to receive from the Fund a variable rate payment. The payment obligations are based on the notional amount of the swap. Certain risks may arise when entering into swap transactions including counterparty default, liquidity or unfavorable changes in interest rates. In connection with these agreements, securities and or cash may be identified as collateral in accordance with the terms of the swap agreements to provide assets of value and recourse in the event of default. The maximum counterparty credit risk is the net present value of the cash flows to be received from or paid to the counterparty over the term of the interest rate swap contract, to the extent that this amount is beneficial to the Fund, in addition to any related collateral posted to the counterparty by the Fund. This risk may be partially reduced by a master netting arrangement between the Fund and the counterparty. The value of the swap is adjusted daily and the change in value, if any, is recorded as unrealized appreciation or depreciation in the Statement of Assets and Liabilities. An upfront payment, if any, made by the Fund is recorded as an asset in the Statement of Assets and Liabilities. An upfront payment, if any, received by the Fund is recorded as a liability in the Statement of Assets and Liabilities. Payments received or made at the end of the measurement period are recorded as realized gain or loss in the Statement of Operations.
A summary of the open interest rate swap contracts as of June 30, 2011 is included in a table following the Fund's Investment Portfolio. For the six months ended June 30, 2011, the investment in interest rate swap contracts had a total notional amount of $2,930,000.
Total Return Swap Contracts. Total return swaps involve commitments to pay interest in exchange for a market-linked return based on a notional amount. For the six months ended June 30, 2011, the Fund entered into total return swap transactions to enhance potential gains. To the extent the total return of the reference security or index underlying the total return swap exceeds or falls short of the offsetting interest rate obligation, the Fund will receive a payment or make a payment to the counterparty, respectively. Certain risks may arise when entering into swap transactions including counterparty default, liquidity or unfavorable changes in the value of underlying reference security or index. The value of the swap is adjusted daily and the change in value, if any, is recorded as unrealized appreciation or depreciation in the Statement of Assets and Liabilities. An upfront payment, if any, made by the Fund is recorded as an asset in the Statement of Assets and Liabilities. An upfront payment, if any, received by the Fund is recorded as a liability in the Statement of Assets and Liabilities. Payments received or made at the end of each measurement period are recorded as realized gain or loss in the Statement of Operations.
A summary of the open total return swap contracts as of June 30, 2011 is included in a table following the Fund's Investment Portfolio.
Options. An option contract is a contract in which the writer (seller) of the option grants the buyer of the option, upon payment of a premium, the right to purchase from (call option), or sell to (put option), the writer a designated instrument at a specified price within a specified period of time. Certain options, including options on indices, will require cash settlement by the Fund if the option is exercised. Interest rate options are comprised of multiple European style options that have periodic exercise dates within the terms of the contract. For the six months ended June 30, 2011, the Fund entered into purchased option contracts on interest rates in order to hedge portfolio assets against potential adverse interest rate movements.
The liability representing the Fund's obligation under an exchange-traded written option or investment in a purchased option is valued at the last sale price or, in the absence of a sale, the mean between the closing bid and asked prices or at the most recent asked price (bid for purchased options) if no bid and asked price are available. Over-the-counter written or purchased options are valued using dealer-supplied quotations. Gain or loss is recognized when the option contract expires, exercised or is closed.
If the Fund writes a covered call option, the Fund foregoes, in exchange for the premium, the opportunity to profit during the option period from an increase in the market value of the underlying security above the exercise price. If the Fund writes a put option it accepts the risk of a decline in the value of the underlying security below the exercise price. Over-the-counter options have the risk of the potential inability of counterparties to meet the terms of their contracts. The Fund's maximum exposure to purchased options is limited to the premium initially paid. In addition, certain risks may arise upon entering into option contracts including the risk that an illiquid secondary market will limit the Fund's ability to close out an option contract prior to the expiration date and that a change in the value of the option contract may not correlate exactly with changes in the value of the securities or currencies hedged.
A summary of the option contracts as of June 30, 2011 is included in the Fund's Investment Portfolio. During the six months ended June 30, 2011, the Fund's investment in written option contracts had a total value generally indicative of a range from $0 to approximately $26,000 and purchased option contracts had a total value generally indicative of a range from $0 to approximately $74,000.
Futures Contracts. A futures contract is an agreement between a buyer or seller and an established futures exchange or its clearinghouse in which the buyer or seller agrees to take or make a delivery of a specific amount of a financial instrument at a specified price on a specific date (settlement date). For the six months ended June 30, 2011, the Fund entered into interest rate futures to gain exposure to different parts of the yield curve while managing overall duration.
Futures contracts are valued at the most recent settlement price. Upon entering into a futures contract, the Fund is required to deposit with a financial intermediary cash or securities ("initial margin") in an amount equal to a certain percentage of the face value indicated in the futures contract. Subsequent payments ("variation margin") are made or received by the Fund dependent upon the daily fluctuations in the value and are recorded for financial reporting purposes as unrealized gains or losses by the Fund. Gains or losses are realized when the contract expires or is closed. Since all futures contracts are exchange-traded, counterparty risk is minimized as the exchange's clearinghouse acts as the counterparty, and guarantees the futures against default.
Certain risks may arise upon entering into futures contracts, including the risk that an illiquid market will limit the Fund's ability to close out a futures contract prior to the settlement date and the risk that the futures contract is not well correlated with the security, index or currency to which it relates. Risk of loss may exceed amounts recognized in the Statement of Assets and Liabilities.
A summary of the open futures contracts as of June 30, 2011, is included in a table following the Fund's Investment Portfolio. For the period ended June 30, 2011, the investment in futures contracts purchased had a total notional value generally indicative of a range from $0 to approximately $2,288,000, and the investment in futures contracts sold had a total notional value generally indicative of a range from approximately $367,000 to $16,307,000.
The following tables summarize the value of the Fund's derivative instruments held as of June 30, 2011 and the related location in the accompanying Statement of Assets and Liabilities, presented by primary underlying risk exposure:
| Asset Derivative | | Purchased Options | |
| Interest Rate Contracts (a) | | $ | 73,727 | |
The above derivative is located in the following Statement of Assets and Liabilities account:
(a) Investments in securities, at value (includes purchased options)
| Liability Derivatives | | Futures Contracts | | | Swap Contracts | | | Total | |
| Interest Rate Contracts (a) | | $ | (328 | ) | | $ | (192,357 | ) | | $ | (192,685 | ) |
Each of the above derivatives is located in the following Statement of Assets and Liabilities accounts:
(a) Unrealized depreciation on futures and swap contracts. Includes cumulative depreciation of futures contracts as disclosed in the Investment Portfolio. Unsettled variation margin is disclosed separately within the Statement of Assets and Liabilities.
Additionally, the amount of unrealized and realized gains and losses on derivative instruments recognized in Fund earnings during the six months ended June 30, 2011 and the related location in the accompanying Statement of Operations is summarized in the following tables by primary underlying risk exposure:
| Realized Gain (Loss) | | Purchased Options | | | Written Options | | | Swap Contracts | | | Futures Contracts | | | Total | |
| Interest Rate Contracts (a) | | $ | 51,730 | | | $ | (16,517 | ) | | $ | 139,913 | | | $ | (115,531 | ) | | $ | 59,595 | |
Each of the above derivatives is located in the following Statement of Operations accounts:
(a) Net realized gain (loss) from investments (includes purchased options), written options, swap contracts and futures, respectively
| Change in Net Unrealized Appreciation (Depreciation) | | Purchased Options | | | Swap Contracts | | | Futures Contracts | | | Total | |
| Interest Rate Contracts (a) | | $ | 17,547 | | | $ | (33,822 | ) | | $ | 145,355 | | | $ | 129,080 | |
Each of the above derivatives is located in the following Statement of Operations accounts:
(a) Change in net unrealized appreciation (depreciation) from investments (includes purchased options), swap contracts and futures, respectively
C. Purchases and Sales of Securities
During the six months ended June 30, 2011, purchases and sales of investment securities (excluding short-term investments and US Treasury obligations) aggregated $551,867,958 and $595,491,446, respectively. Purchases and sales of US Treasury obligations aggregated $10,034,018 and $0, respectively.
For the six months ended June 30, 2011, transactions for written options were as follows:
| | | Number of Contracts | | | Premiums | |
| Outstanding, beginning of period | | | — | | | $ | — | |
| Options written | | | 70 | | | | 26,096 | |
| Options closed | | | (70 | ) | | | (26,096 | ) |
| Outstanding, end of period | | | — | | | $ | — | |
D. Related Parties
Management Agreement. Under the Investment Management Agreement with Deutsche Investment Management Americas Inc. ("DIMA" or the "Advisor"), an indirect, wholly owned subsidiary of Deutsche Bank AG, the Advisor directs the investments of the Fund in accordance with its investment objectives, policies and restrictions. The Advisor determines the securities, instruments and other contracts relating to investments to be purchased, sold or entered into by the Fund.
Pursuant to the Investment Management Agreement with the Advisor, the Fund pays a monthly management fee based on the Fund's average daily net assets, computed and accrued daily and payable monthly, at the following annual rates:
| $0-$250 million | | | .450 | % |
| Next $750 million | | | .430 | % |
| Next $1.5 billion | | | .410 | % |
| Next $2.5 billion | | | .400 | % |
| Next $2.5 billion | | | .380 | % |
| Next $2.5 billion | | | .360 | % |
| Next $2.5 billion | | | .340 | % |
| Over $12.5 billion | | | .320 | % |
Accordingly, for the six months ended June 30, 2011, the fee pursuant to the Investment Management Agreement was equivalent to an annualized effective rate of 0.45% of the Fund's average daily net assets.
Administration Fee. Pursuant to an Administrative Services Agreement, DIMA provides most administrative services to the Fund. For all services provided under the Administrative Services Agreement, the Fund pays DIMA an annual fee ("Administration Fee") of 0.10% of the Fund's average daily net assets, computed and accrued daily and payable monthly. For the six months ended June 30, 2011, the Administration Fee was $77,396, of which $12,900 is unpaid.
Service Provider Fees. DWS Investments Service Company ("DISC"), an affiliate of the Advisor, is the transfer agent, dividend-paying agent and shareholder service agent for the Fund. Pursuant to a sub-transfer agency agreement between DISC and DST Systems, Inc. ("DST"), DISC has delegated certain transfer agent, dividend-paying agent and shareholder service agent functions to DST. DISC compensates DST out of the shareholder servicing fee it receives from the Fund. For the six months ended June 30, 2011, the amounts charged to the Fund by DISC were as follows:
| | | Total Aggregated | | | Unpaid at June 30, 2011 | |
| Class A | | $ | 144 | | | $ | 103 | |
| Class B | | | 23 | | | | 12 | |
| | | $ | 167 | | | $ | 115 | |
Distribution Service Agreement. Under the Fund's Class B 12b-1 plans, DWS Investments Distributors, Inc. ("DIDI") received a fee ("Distribution Service Fee") of 0.25% of average daily net assets of Class B shares. For the six months ended June 30, 2011, the Distribution Service Fee aggregated $7,195, of which $1,206 is unpaid.
Typesetting and Filing Service Fees. Under an agreement with DIMA, DIMA is compensated for providing typesetting and certain regulatory filing services to the Fund. For the six months ended June 30, 2011, the amount charged to the Fund by DIMA included in the Statement of Operations under "reports to shareholders" aggregated $9,525, of which $3,483 is unpaid.
Trustees' Fees and Expenses. The Fund paid each Trustee not affiliated with the Advisor retainer fees plus specified amounts for various committee services and for the Board Chairperson.
Affiliated Cash Management Vehicle. The Fund may invest uninvested cash balances in Central Cash Management Fund, which is managed by the Advisor. The Fund indirectly bears its proportionate share of the expenses of Central Cash Management Fund. Central Cash Management Fund does not pay the Advisor an investment management fee. Central Cash Management Fund seeks a high level of current income consistent with liquidity and the preservation of capital.
E. Ownership of the Fund
At June 30, 2011, three Participating Insurance Companies were owners of record of 10% or more of the total outstanding Class A shares of the Fund, each owning 40%, 38% and 16%. One Participating Insurance Company was the owner of record of 10% or more of the total outstanding Class B shares of the Fund, owning 96%.
F. Line of Credit
The Fund and other affiliated funds (the "Participants") share in a $450 million revolving credit facility provided by a syndication of banks. The Fund may borrow for temporary or emergency purposes, including the meeting of redemption requests that otherwise might require the untimely disposition of securities. The Participants are charged an annual commitment fee which is allocated based on net assets, among each of the Participants. Interest is calculated at a rate per annum equal to the sum of the Federal Funds Rate plus 1.25 percent plus if LIBOR exceeds the Federal Funds Rate the amount of such excess. The Fund may borrow up to a maximum of 33 percent of its net assets under the agreement.
At June 30, 2011, DWS Government & Agency Securities VIP had a $500,000 outstanding loan. Interest expense incurred on the borrowing was $1,159 for the six months ended June 30, 2011. The average dollar amount of the borrowings was $2,640,909, the weighted average interest rate on these borrowings was 1.44% and the Fund had a loan outstanding for eleven days throughout the period. The borrowings were valued at cost, which approximates fair value.
The Trust's policies and procedures for voting proxies for portfolio securities and information about how the Trust voted proxies related to its portfolio securities during the 12-month period ended June 30 are available on our Web site — www.dws-investments.com (click on "proxy voting" at the bottom of the page) — or on the SEC's Web site — www.sec.gov. To obtain a written copy of the Trust's policies and procedures without charge, upon request, call us toll free at (800) 728-3337.
Summary of Management Fee Evaluation by Independent Fee Consultant
October 3, 2010
Pursuant to an Order entered into by Deutsche Investment Management Americas and affiliates (collectively, "DeAM") with the Attorney General of New York, I, Thomas H. Mack, have been appointed the Independent Fee Consultant for the DWS Funds (formerly the DWS Scudder Funds). My duties include preparing an annual written evaluation of the management fees DeAM charges the Funds, considering among other factors the management fees charged by other mutual fund companies for like services, management fees DeAM charges other clients for like services, DeAM's costs of supplying services under the management agreements and related profit margins, possible economies of scale if a Fund grows larger, and the nature and quality of DeAM's services, including fund performance. This report summarizes my evaluation for 2010, including my qualifications, the evaluation process for each of the DWS Funds, consideration of certain complex-level factors, and my conclusions. I served in substantially the same capacity in 2007, 2008, and 2009.
Qualifications
For more than 35 years I have served in various professional capacities within the investment management business. I have held investment analysis and advisory positions, including securities analyst, portfolio strategist and director of investment policy with a large investment firm. I have also performed business management functions, including business development, financial management and marketing research and analysis.
Since 1991, I have been an independent consultant within the asset management industry. I have provided services to over 125 client organizations, including investment managers, mutual fund boards, product distributors and related organizations. Over the past ten years I have completed a number of assignments for mutual fund boards, specifically including assisting boards with management contract renewal.
I hold a Master of Business Administration degree, with highest honors, from Harvard University and Master of Science and Bachelor of Science (highest honors) degrees from the University of California at Berkeley. I am an independent director and audit committee financial expert for two closed-end mutual funds and have served in various leadership and financial oversight capacities with non-profit organizations.
Evaluation of Fees for each DWS Fund
My work focused primarily on evaluating, fund-by-fund, the fees charged to each of the 118 publicly offered Fund portfolios in the DWS Fund family. For each Fund, I considered each of the key factors mentioned above, as well as any other relevant information. In doing so I worked closely with the Funds' Independent Directors in their annual contract renewal process, as well as in their approval of contracts for several new funds (documented separately).
In evaluating each Fund's fees, I reviewed comprehensive materials provided by or on behalf of DeAM, including expense information prepared by Lipper Analytical, comparative performance information, profitability data, manager histories, and other materials. I also accessed certain additional information from the Lipper and Morningstar databases and drew on my industry knowledge and experience.
To facilitate evaluating this considerable body of information, I prepared for each Fund a document summarizing the key data elements in each area as well as additional analytics discussed below. This made it possible to consider each key data element in the context of the others.
In the course of contract renewal, DeAM agreed to implement a number of fee and expense adjustments requested by the Independent Directors which will favorably impact future fees and expenses, and my evaluation includes the effects of these changes.
Fees and Expenses Compared with Other Funds
The competitive fee and expense evaluation for each fund focused on two primary comparisons:
The Fund's contractual management fee (the advisory fee plus the administration fee where applicable) compared with those of a group of typically 12-15 funds in the same Lipper investment category (e.g. Large Capitalization Growth) having similar distribution arrangements and being of similar size.
The Fund's total expenses compared with a broader universe of funds from the same Lipper investment category and having similar distribution arrangements.
These two comparisons provide a view of not only the level of the fee compared with funds of similar scale but also the total expense the Fund bears for all the services it receives, in comparison with the investment choices available in the Fund's investment category and distribution channel. The principal figure-of-merit used in these comparisons was the subject Fund's percentile ranking against peers.
DeAM's Fees for Similar Services to Others
DeAM provided management fee schedules for all of its US domiciled fund and non-fund investment management accounts in any of the investment categories where there is a DWS Fund. These similar products included the other DWS Funds, non-fund pooled accounts, institutional accounts and sub-advisory accounts. Using this information, I calculated for each Fund the fee that would be charged to each similar product, at the subject Fund's asset level.
Evaluating information regarding non-fund products is difficult because there are varying levels of services required for different types of accounts, with mutual funds generally requiring considerably more regulatory and administrative types of service as well as having more frequent cash flows than other types of accounts. Also, while mutual fund fees for similar fund products can be expected to be similar, there will be some differences due to different pricing conditions in different distribution channels (e.g. retail funds versus those used in variable insurance products), differences in underlying investment processes and other factors.
Costs and Profit Margins
DeAM provided a detailed profitability analysis for each Fund. After making some adjustments so that the presentation would be more comparable to the available industry figures, I reviewed profit margins from investment management alone, from investment management plus other fund services (excluding distribution) provided to the Funds by DeAM (principally shareholder services), and DeAM profits from all sources, including distribution. A later section comments on overall profitability.
Economies of Scale
Economies of scale — an expected decline in management cost per dollar of fund assets as fund assets grow — are very rarely quantified and documented because of inherent difficulties in collecting and analyzing relevant data. However, in virtually every investment category that I reviewed, larger funds tend to have lower fees and lower total expenses than smaller funds. To see how each DWS Fund compares with this industry observation, I reviewed:
The trend in Fund assets over the last five years and the accompanying trend in total expenses. This shows if the Fund has grown and, if so, whether total expense (management fees as well as other expenses) have declined as a percent of assets.
Whether the Fund has break-points in its management fee schedule, the extent of the fee reduction built into the schedule and the asset levels where the breaks take effect, and in the case of a sub-advised Fund how the Fund's break-points compare with those of the sub-advisory fee schedule.
How the Fund's contractual fee schedule compares with trends in the industry data. To accomplish this, I constructed a chart showing how actual latest-fiscal-year contractual fees of the Fund and of other similar funds relate to average fund assets, with the subject Fund's contractual fee schedule superimposed.
Quality of Service — Performance
The quality-of-service evaluation focused on investment performance, which is the principal result of the investment management service. Each Fund's performance was reviewed over the past 1, 3, 5 and 10 years, as applicable, and compared with that of other funds in the same investment category and with a suitable market index.
In addition, I calculated and reviewed risk-adjusted returns relative to an index of similar mutual funds' returns and a suitable market index. The risk-adjusted returns analysis provides a way of determining the extent to which the Fund's return comparisons are mainly the product of investment value-added (or lack thereof) or alternatively taking considerably more or less risk than is typical in its investment category.
I also received and considered the history of portfolio manager changes for each Fund, as this provided an important context for evaluating the performance results.
Complex-Level Considerations
While this evaluation was conducted mainly at the individual fund level, there are some issues relating to the reasonableness of fees that can alternatively be considered across the whole fund complex:
I reviewed DeAM's profitability analysis for all DWS Funds, with a view toward determining if the allocation procedures used were reasonable and how profit levels compared with public data for other investment managers.
I considered whether DeAM and affiliates receive any significant ancillary or "fall-out" benefits that should be considered in interpreting the direct profitability results. These would be situations where serving as the investment manager of the Funds is beneficial to another part of the Deutsche Bank organization.
I considered how aggregated DWS Fund expenses had varied over the years, by asset class and in the context of trends in asset levels.
I reviewed the structure of the DeAM organization, trends in staffing levels, and information on compensation of investment management and other professionals compared with industry data.
Findings
Based on the process and analysis discussed above, which included reviewing a wide range of information from management and external data sources and considering among other factors the fees DeAM charges other clients, the fees charged by other fund managers, DeAM's costs and profits associated with managing the Funds, economies of scale, possible fall-out benefits, and the nature and quality of services provided, in my opinion the management fees charged the DWS Funds are reasonable.
Thomas H. Mack
DWS Investments Distributors, Inc.
222 South Riverside Plaza
Chicago, IL 60606
(800) 621-1148
VS2GAS-3 (R-023296-1 8/11)
JUNE 30, 2011
SEMIANNUAL REPORT
DWS VARIABLE SERIES II
DWS High Income VIP
Contents
3 Performance Summary 4 Information About Your Fund's Expenses 5 Portfolio Summary 6 Investment Portfolio 18 Statement of Assets and Liabilities 19 Statement of Operations 19 Statement of Changes in Net Assets 21 Financial Highlights 22 Notes to Financial Statements 27 Proxy Voting 28 Summary of Management Fee Evaluation by Independent Fee Consultant |
This report must be preceded or accompanied by a prospectus. To obtain an additional prospectus or summary prospectus, if available, call (800) 728-3337 or your financial representative. We advise you to consider the Fund's objectives, risks, charges and expenses carefully before investing. The summary prospectus and prospectus contain this and other important information about the Fund. Please read the prospectus carefully before you invest.
Bond investments are subject to interest-rate and credit risks. When interest rates rise, bond prices generally fall. Credit risk refers to the ability of an issuer to make timely payments of principal and interest. Investments in lower-quality and non-rated securities present greater risk of loss than investments in higher-quality securities. See the prospectus for details.
DWS Investments is part of Deutsche Bank's Asset Management division and, within the US, represents the retail asset management activities of Deutsche Bank AG, Deutsche Bank Trust Company Americas, Deutsche Investment Management Americas Inc. and DWS Trust Company.
NOT FDIC/NCUA INSURED NO BANK GUARANTEE MAY LOSE VALUE NOT A DEPOSIT
NOT INSURED BY ANY FEDERAL GOVERNMENT AGENCY
Performance Summary June 30, 2011
Fund performance shown is historical, assumes reinvestment of all dividend and capital gain distributions and does not guarantee future results. Investment return and principal value fluctuate with changing market conditions so that, when redeemed, shares may be worth more or less than their original cost. Current performance may be lower or higher than the performance data quoted. Please contact your participating insurance company for the Fund's most recent month-end performance. Performance doesn't reflect charges and fees ("contract charges") associated with the separate account that invests in the Fund or any variable life insurance policy or variable annuity contract for which the Fund is an investment option. These charges and fees will reduce returns. While all share classes have the same underlying portfolio, their performance will differ.
The gross expense ratios of the Fund, as stated in the fee table of the prospectus dated May 1, 2011 are 0.72% and 0.99% for Class A and Class B shares, respectively, and may differ from the expense ratios disclosed in the Financial Highlights tables in this report.
| Growth of an Assumed $10,000 Investment in DWS High Income VIP |
[] DWS High Income VIP — Class A [] Credit Suisse High Yield Index | The Credit Suisse High Yield Index is an unmanaged, trader-priced portfolio constructed to mirror the global high-yield debt market. Index returns do not reflect any fees or expenses and it is not possible to invest directly into an index. |
| |
| Yearly periods ended June 30 | |
| Comparative Results | |
| DWS High Income VIP | | 6-Month‡ | | | 1-Year | | | 3-Year | | | 5-Year | | | 10-Year | |
| Class A | Growth of $10,000 | | $ | 10,400 | | | $ | 11,426 | | | $ | 12,796 | | | $ | 13,622 | | | $ | 20,353 | |
| Average annual total return | | | 4.00 | % | | | 14.26 | % | | | 8.56 | % | | | 6.38 | % | | | 7.36 | % |
| Credit Suisse High Yield Index | Growth of $10,000 | | $ | 10,484 | | | $ | 11,459 | | | $ | 13,816 | | | $ | 15,161 | | | $ | 24,040 | |
| Average annual total return | | | 4.84 | % | | | 14.59 | % | | | 11.38 | % | | | 8.68 | % | | | 9.17 | % |
| DWS High Income VIP | | 6-Month‡ | | | 1-Year | | | 3-Year | | | 5-Year | | | Life of Class* | |
| Class B | Growth of $10,000 | | $ | 10,388 | | | $ | 11,409 | | | $ | 12,715 | | | $ | 13,406 | | | $ | 20,420 | |
| Average annual total return | | | 3.88 | % | | | 14.09 | % | | | 8.34 | % | | | 6.04 | % | | | 8.26 | % |
| Credit Suisse High Yield Index | Growth of $10,000 | | $ | 10,484 | | | $ | 11,459 | | | $ | 13,816 | | | $ | 15,161 | | | $ | 23,657 | |
| Average annual total return | | | 4.84 | % | | | 14.59 | % | | | 11.38 | % | | | 8.68 | % | | | 10.03 | % |
The growth of $10,000 is cumulative.
‡ Total returns shown for periods less than one year are not annualized.
* The Fund commenced offering Class B shares on July 1, 2002. Index returns began on June 30, 2002.
Information About Your Fund's Expenses
As an investor of the Fund, you incur two types of costs: ongoing expenses and transaction costs. Ongoing expenses include management fees, distribution and service (12b-1) fees and other Fund expenses. Examples of transaction costs include contract charges, redemption fees and account maintenance fees, which are not shown in this section. The following tables are intended to help you understand your ongoing expenses (in dollars) of investing in the Fund and to help you compare these expenses with the ongoing expenses of investing in other mutual funds. The example in the table is based on an investment of $1,000 invested at the beginning of the six-month period and held for the entire period (January 1, 2011 to June 30, 2011).
The tables illustrate your Fund's expenses in two ways:
•Actual Fund Return. This helps you estimate the actual dollar amount of ongoing expenses (but not transaction costs) paid on a $1,000 investment in the Fund using the Fund's actual return during the period. To estimate the expenses you paid over the period, simply divide your account value by $1,000 (for example, an $8,600 account value divided by $1,000 = 8.6), then multiply the result by the number in the "Expenses Paid per $1,000" line under the share class you hold.
• Hypothetical 5% Fund Return. This helps you to compare your Fund's ongoing expenses (but not transaction costs) with those of other mutual funds using the Fund's actual expense ratio and a hypothetical rate of return of 5% per year before expenses. Examples using a 5% hypothetical Fund return may be found in the shareholder reports of other mutual funds. The hypothetical account values and expenses may not be used to estimate the actual ending account balance or expenses you paid for the period.
Please note that the expenses shown in these tables are meant to highlight your ongoing expenses only and do not reflect any transaction costs. The "Expenses Paid per $1,000" line of the tables is useful in comparing ongoing expenses only and will not help you determine the relative total expense of owning different funds. If these transaction costs had been included, your costs would have been higher.
Expenses and Value of a $1,000 Investment for the six months ended June 30, 2011 | |
| Actual Fund Return | | Class A | | | Class B | |
| Beginning Account Value 1/1/11 | | $ | 1,000.00 | | | $ | 1,000.00 | |
| Ending Account Value 6/30/11 | | $ | 1,040.00 | | | $ | 1,038.80 | |
| Expenses Paid per $1,000* | | $ | 3.64 | | | $ | 4.95 | |
| Hypothetical 5% Fund Return | | Class A | | | Class B | |
| Beginning Account Value 1/1/11 | | $ | 1,000.00 | | | $ | 1,000.00 | |
| Ending Account Value 6/30/11 | | $ | 1,021.22 | | | $ | 1,019.93 | |
| Expenses Paid per $1,000* | | $ | 3.61 | | | $ | 4.91 | |
* Expenses are equal to the Fund's annualized expense ratio for each share class, multiplied by the average account value over the period, multiplied by the number of days in the most recent six-month period, then divided by 365.
| Annualized Expense Ratios | Class A | | Class B | |
| DWS Variable Series II — DWS High Income VIP | .72% | | .98% | |
For more information, please refer to the Fund's prospectus.
These tables do not reflect charges and fees ("contract charges") associated with the separate account that invests in the Fund or any variable life insurance policy or variable annuity contract for which the Fund is an investment option.
Asset Allocation (As a % of Investment Portfolio excluding Securities Lending Collateral) | 6/30/11 | 12/31/10 |
| | | |
| Corporate Bonds | 97% | 87% |
| Loan Participations and Assignments | 1% | 4% |
| Preferred Stocks | 1% | 0% |
| Preferred Securities | 1% | 1% |
| Cash Equivalents | — | 8% |
| | 100% | 100% |
Sector Diversification (As a % of Investment Portfolio excluding Cash Equivalents and Securities Lending Collateral) | 6/30/11 | 12/31/10 |
| | | |
| Consumer Discretionary | 21% | 20% |
| Financials | 16% | 19% |
| Materials | 13% | 12% |
| Industrials | 12% | 10% |
| Telecommunication Services | 11% | 11% |
| Energy | 11% | 12% |
| Information Technology | 6% | 4% |
| Consumer Staples | 5% | 4% |
| Utilities | 4% | 3% |
| Health Care | 1% | 5% |
| | 100% | 100% |
Quality (As a % of Investment Portfolio excluding Cash Equivalents and Securities Lending Collateral) | 6/30/11 | 12/31/10 |
| | | |
| BB | 13% | 15% |
| B | 54% | 54% |
| CCC | 30% | 26% |
| D | 1% | 1% |
| Not Rated | 2% | 4% |
| | 100% | 100% |
| Interest Rate Sensitivity | 6/30/11 | 12/31/10 |
| | | |
| Effective Maturity | 6.1 years | 5.5 years |
| Effective Duration | 4.1 years | 3.5 years |
Asset allocation, sector diversification and interest rate sensitivity are subject to change.
The quality ratings represent the lower of Moody's Investors Service, Inc. ("Moody's") or Standard & Poor's Corporation ("S&P") credit ratings. The ratings of Moody's and S&P represent their opinions as to the quality of the securities they rate. Ratings are relative and subjective and are not absolute standards of quality. The Fund's credit quality does not remove market risk and is subject to change.
Effective maturity is the weighted average of the bonds held by the Fund taking into consideration any available maturity shortening features.
Effective duration is an approximate measure of the Fund's sensitivity to interest rate changes taking into consideration any maturity shortening features.
For more complete details about the Fund's investment portfolio, see page 6.
Following the Fund's fiscal first and third quarter-end, a complete portfolio holdings listing is filed with the SEC on Form N-Q. The form will be available on the SEC's Web site at www.sec.gov, and it also may be reviewed and copied at the SEC's Public Reference Room in Washington, D.C. Information on the operation of the SEC's Public Reference Room may be obtained by calling (800) SEC-0330. The Fund's portfolio holdings are also posted on www.dws-investments.com from time to time. Please see the Fund's current prospectus for more information.
Investment Portfolio June 30, 2011 (Unaudited) | | | Principal Amount ($) (a) | | | Value ($) | |
| | | | |
| Corporate Bonds 94.4% | |
| Consumer Discretionary 19.8% | |
| Allison Transmission, Inc., 144A, 7.125%, 5/15/2019 | | | | 270,000 | | | | 262,575 | |
| AMC Entertainment, Inc.: | |
| 8.0%, 3/1/2014 | | | | 590,000 | | | | 591,475 | |
| 8.75%, 6/1/2019 | | | | 765,000 | | | | 807,075 | |
| AMC Networks, Inc., 144A, 7.75%, 7/15/2021 | | | | 80,000 | | | | 83,600 | |
| American Achievement Corp., 144A, 10.875%, 4/15/2016 | | | | 260,000 | | | | 234,000 | |
| Asbury Automotive Group, Inc.: | |
| 7.625%, 3/15/2017 | | | | 590,000 | | | | 585,575 | |
| 144A, 8.375%, 11/15/2020 | | | | 460,000 | | | | 468,050 | |
| Avis Budget Car Rental LLC: | |
| 8.25%, 1/15/2019 | | | | 535,000 | | | | 541,687 | |
| 9.625%, 3/15/2018 | | | | 260,000 | | | | 277,550 | |
| Beazer Homes USA, Inc., 9.125%, 6/15/2018 | | | | 135,000 | | | | 116,438 | |
| Bon-Ton Department Stores, Inc., 10.25%, 3/15/2014 | | | | 105,000 | | | | 105,000 | |
| Burlington Coat Factory Warehouse Corp., 144A, 10.0%, 2/15/2019 | | | | 250,000 | | | | 247,500 | |
| Cablevision Systems Corp.: | |
| 7.75%, 4/15/2018 | | | | 65,000 | | | | 69,306 | |
| 8.0%, 4/15/2020 | | | | 65,000 | | | | 69,713 | |
| Caesar's Entertainment Operating Co., Inc.: | | |
| 10.0%, 12/15/2018 | | | | 790,000 | | | | 712,975 | |
| 11.25%, 6/1/2017 | | | | 715,000 | | | | 789,181 | |
| 12.75%, 4/15/2018 | | | | 295,000 | | | | 294,263 | |
| CanWest LP, 144A, 9.25%, 8/1/2015* | | | | 340,000 | | | | 57,800 | |
| Carrols Corp., 9.0%, 1/15/2013 | | | | 225,000 | | | | 225,563 | |
| CCO Holdings LLC: | |
| 6.5%, 4/30/2021 | | | | 1,155,000 | | | | 1,139,119 | |
| 7.0%, 1/15/2019 | | | | 120,000 | | | | 123,600 | |
| 7.25%, 10/30/2017 | | | | 520,000 | | | | 538,850 | |
| 7.875%, 4/30/2018 | | | | 225,000 | | | | 237,094 | |
| 8.125%, 4/30/2020 | | | | 150,000 | | | | 162,000 | |
| Cequel Communications Holdings I LLC, 144A, 8.625%, 11/15/2017 | | | | 1,495,000 | | | | 1,554,800 | |
| Claire's Stores, Inc.: | |
| 144A, 8.875%, 3/15/2019 | | | | 145,000 | | | | 135,575 | |
| 9.625%, 6/1/2015 (PIK) | | | | 115,706 | | | | 112,524 | |
| Clear Channel Communications, Inc., 144A, 9.0%, 3/1/2021 | | | | 140,000 | | | | 134,050 | |
| Clear Channel Worldwide Holdings, Inc.: | | |
| Series A, 9.25%, 12/15/2017 | | | | 100,000 | | | | 108,750 | |
| Series B, 9.25%, 12/15/2017 | | | | 150,000 | | | | 163,500 | |
| Cumulus Media, Inc., 144A, 7.75%, 5/1/2019 | | | | 135,000 | | | | 130,275 | |
| DineEquity, Inc., 144A, 9.5%, 10/30/2018 | | | | 620,000 | | | | 672,700 | |
| DISH DBS Corp.: | |
| 144A, 6.75%, 6/1/2021 | | | | 50,000 | | | | 51,250 | |
| 7.125%, 2/1/2016 | | | | 465,000 | | | | 490,575 | |
| 7.875%, 9/1/2019 | | | | 270,000 | | | | 291,263 | |
| Dunkin' Brands, Inc., 144A, 9.625%, 12/1/2018 | | | | 147,000 | | | | 148,285 | |
| | | Principal Amount ($) (a) | | | Value ($) | |
| | | | | | | | | |
| EH Holding Corp., 144A, 7.625%, 6/15/2021 | | | | 230,000 | | | | 234,600 | |
| Fontainebleau Las Vegas Holdings LLC, 144A, 11.0%, 6/15/2015* | | | | 490,000 | | | | 245 | |
| Gannett Co., Inc., 9.375%, 11/15/2017 | | | | 295,000 | | | | 324,500 | |
| Great Canadian Gaming Corp., 144A, 7.25%, 2/15/2015 | | | | 505,000 | | | | 516,362 | |
| Hertz Corp.: | |
| 144A, 6.75%, 4/15/2019 | | | | 660,000 | | | | 653,400 | |
| 144A, 7.5%, 10/15/2018 | | | | 905,000 | | | | 932,150 | |
| J. Crew Group, Inc., 144A, 8.125%, 3/1/2019 (b) | | | | 190,000 | | | | 182,875 | |
| Kabel BW Erste Beteiligungs GmbH, 144A, 7.5%, 3/15/2019 | | | | 435,000 | | | | 443,700 | |
| Lear Corp.: | |
| 7.875%, 3/15/2018 | | | | 235,000 | | | | 252,625 | |
| 8.125%, 3/15/2020 | | | | 230,000 | | | | 247,825 | |
| Lions Gate Entertainment, Inc., 144A, 10.25%, 11/1/2016 | | | | 540,000 | | | | 549,450 | |
| Macy's Retail Holdings, Inc., 8.125%, 7/15/2015 | | | | 85,000 | | | | 100,831 | |
| Mediacom Broadband LLC, 8.5%, 10/15/2015 (b) | | | | 635,000 | | | | 650,875 | |
| Mediacom LLC, 9.125%, 8/15/2019 (b) | | | | 560,000 | | | | 590,800 | |
| MGM Resorts International: | |
| 7.5%, 6/1/2016 | | | | 205,000 | | | | 194,750 | |
| 7.625%, 1/15/2017 | | | | 560,000 | | | | 539,000 | |
| 9.0%, 3/15/2020 | | | | 145,000 | | | | 158,775 | |
| 144A, 10.0%, 11/1/2016 (b) | | | | 225,000 | | | | 238,500 | |
| 11.125%, 11/15/2017 | | | | 235,000 | | | | 268,488 | |
| Michaels Stores, Inc., Step-up Coupon, 0% to 11/1/2011, 13.0% to 11/1/2016 | | | | 150,000 | | | | 155,250 | |
| Needle Merger Sub Corp., 144A, 8.125%, 3/15/2019 | | | | 280,000 | | | | 282,100 | |
| Neiman Marcus Group, Inc., 10.375%, 10/15/2015 | | | | 155,000 | | | | 162,750 | |
| Norcraft Companies LP, 10.5%, 12/15/2015 | | | | 1,260,000 | | | | 1,278,900 | |
| Palace Entertainment Holdings LLC, 144A, 8.875%, 4/15/2017 | | | | 435,000 | | | | 436,087 | |
| Penske Automotive Group, Inc., 7.75%, 12/15/2016 | | | | 1,085,000 | | | | 1,106,700 | |
| PETCO Animal Supplies, Inc., 144A, 9.25%, 12/1/2018 | | | | 315,000 | | | | 334,687 | |
| Phillips-Van Heusen Corp., 7.375%, 5/15/2020 | | | | 160,000 | | | | 171,200 | |
| Regal Entertainment Group, 9.125%, 8/15/2018 | | | | 180,000 | | | | 186,300 | |
| Sabre Holdings Corp., 8.35%, 3/15/2016 | | | | 515,000 | | | | 453,200 | |
| Sears Holdings Corp., 144A, 6.625%, 10/15/2018 | | | | 345,000 | | | | 319,988 | |
| Seminole Indian Tribe of Florida: | |
| 144A, 7.75%, 10/1/2017 | | | | 200,000 | | | | 207,000 | |
| 144A, 7.804%, 10/1/2020 | | | | 450,000 | | | | 442,260 | |
| Simmons Bedding Co., 144A, 11.25%, 7/15/2015 | | | | 315,000 | | | | 330,750 | |
| Sirius XM Radio, Inc., 144A, 8.75%, 4/1/2015 | | | | 340,000 | | | | 374,850 | |
| | | Principal Amount ($) (a) | | | Value ($) | |
| | | | | | | | | |
| Sonic Automotive, Inc., Series B, 9.0%, 3/15/2018 | | | | 565,000 | | | | 594,662 | |
| Standard Pacific Corp.: | |
| 8.375%, 5/15/2018 | | | | 240,000 | | | | 237,900 | |
| 10.75%, 9/15/2016 | | | | 440,000 | | | | 498,300 | |
| Toys "R" Us, Inc., 7.375%, 10/15/2018 | | | | 695,000 | | | | 675,019 | |
| Toys "R" Us-Delaware, Inc., 144A, 7.375%, 9/1/2016 | | | | 200,000 | | | | 202,000 | |
| Travelport LLC: | |
| 4.879%**, 9/1/2014 | | | | 390,000 | | | | 332,475 | |
| 9.0%, 3/1/2016 | | | | 390,000 | | | | 348,075 | |
| UCI International, Inc., 8.625%, 2/15/2019 | | | | 120,000 | | | | 123,600 | |
| Unitymedia GmbH, 144A, 9.625%, 12/1/2019 | EUR | | | 550,000 | | | | 865,377 | |
| Unitymedia Hessen GmbH & Co., KG, 144A, 8.125%, 12/1/2017 | | | | 945,000 | | | | 1,004,062 | |
Univision Communications, Inc.: | | |
| 144A, 6.875%, 5/15/2019 | | | | 60,000 | | | | 59,400 | |
| 144A, 7.875%, 11/1/2020 | | | | 140,000 | | | | 143,500 | |
| UPC Holding BV: | |
| 144A, 8.375%, 8/15/2020 | EUR | | | 210,000 | | | | 309,099 | |
| 144A, 9.75%, 4/15/2018 | EUR | | | 425,000 | | | | 656,374 | |
Valassis Communications, Inc., 144A, 6.625%, 2/1/2021 | | | | 180,000 | | | | 178,200 | |
Visant Corp., 10.0%, 10/1/2017 | | | | 460,000 | | | | 476,100 | |
| Visteon Corp., 144A, 6.75%, 4/15/2019 | | | | 435,000 | | | | 419,775 | |
| Yonkers Racing Corp., 144A, 11.375%, 7/15/2016 | | | | 335,000 | | | | 363,475 | |
| | | | | 33,542,702 | |
| Consumer Staples 4.9% | |
| American Rock Salt Co., LLC, 144A, 8.25%, 5/1/2018 | | | | 340,000 | | | | 341,275 | |
| B&G Foods, Inc., 7.625%, 1/15/2018 | | | | 230,000 | | | | 242,075 | |
| Del Monte Foods Co., 144A, 7.625%, 2/15/2019 | | | | 710,000 | | | | 717,100 | |
| Dole Food Co., Inc., 144A, 8.0%, 10/1/2016 | | | | 215,000 | | | | 225,213 | |
| FAGE Dairy Industry SA, 144A, 9.875%, 2/1/2020 | | | | 555,000 | | | | 556,387 | |
| NBTY, Inc., 144A, 9.0%, 10/1/2018 | | | | 140,000 | | | | 147,700 | |
| North Atlantic Trading Co., 144A, 10.0%, 3/1/2012 | | | | 2,081,750 | | | | 2,045,319 | |
| Rite Aid Corp.: | |
| 7.5%, 3/1/2017 | | | | 295,000 | | | | 292,788 | |
| 8.0%, 8/15/2020 | | | | 580,000 | | | | 624,950 | |
| 10.25%, 10/15/2019 | | | | 230,000 | | | | 253,000 | |
| Smithfield Foods, Inc., 7.75%, 7/1/2017 | | | | 1,880,000 | | | | 1,950,500 | |
| Stater Bros. Holdings, Inc., 144A, 7.375%, 11/15/2018 | | | | 180,000 | | | | 186,750 | |
| SUPERVALU, Inc., 8.0%, 5/1/2016 (b) | | | | 210,000 | | | | 214,200 | |
| Tops Holding Corp., 10.125%, 10/15/2015 | | | | 330,000 | | | | 350,212 | |
| US Foodservice, 144A, 8.5%, 6/30/2019 | | | | 200,000 | | | | 194,000 | |
| | | | | 8,341,469 | |
| | | Principal Amount ($) (a) | | | Value ($) | |
| | | | | | | | | |
| Energy 10.6% | |
| Alpha Natural Resources, Inc., 6.0%, 6/1/2019 | | | | 345,000 | | | | 344,138 | |
| Arch Coal, Inc., 7.25%, 10/1/2020 | | | | 110,000 | | | | 111,925 | |
| Berry Petroleum Co., 6.75%, 11/1/2020 | | | | 535,000 | | | | 537,675 | |
| BreitBurn Energy Partners LP, 8.625%, 10/15/2020 | | | | 300,000 | | | | 316,500 | |
| Brigham Exploration Co., 144A, 6.875%, 6/1/2019 | | | | 115,000 | | | | 114,425 | |
| Bristow Group, Inc., 7.5%, 9/15/2017 | | | | 485,000 | | | | 508,037 | |
| Chaparral Energy, Inc., 8.25%, 9/1/2021 | | | | 645,000 | | | | 649,837 | |
| Cloud Peak Energy Resources LLC: | |
| 8.25%, 12/15/2017 | | | | 145,000 | | | | 155,150 | |
| 8.5%, 12/15/2019 | | | | 150,000 | | | | 162,188 | |
| CONSOL Energy, Inc.: | |
| 144A, 6.375%, 3/1/2021 | | | | 90,000 | | | | 89,550 | |
| 8.0%, 4/1/2017 | | | | 655,000 | | | | 713,950 | |
| 8.25%, 4/1/2020 | | | | 250,000 | | | | 272,500 | |
| Continental Resources, Inc.: | |
| 7.125%, 4/1/2021 | | | | 175,000 | | | | 184,625 | |
| 7.375%, 10/1/2020 | | | | 195,000 | | | | 207,188 | |
| 8.25%, 10/1/2019 | | | | 105,000 | | | | 114,713 | |
| Crestwood Midstream Partners LP, 144A, 7.75%, 4/1/2019 | | | | 920,000 | | | | 913,100 | |
| Crosstex Energy LP, 8.875%, 2/15/2018 | | | | 365,000 | | | | 388,725 | |
| Dresser-Rand Group, Inc., 144A, 6.5%, 5/1/2021 | | | | 420,000 | | | | 432,600 | |
| Eagle Rock Energy Partners LP, 144A, 8.375%, 6/1/2019 | | | | 535,000 | | | | 533,662 | |
| Energy Transfer Equity LP, 7.5%, 10/15/2020 | | | | 215,000 | | | | 227,900 | |
| Frontier Oil Corp., 6.875%, 11/15/2018 | | | | 315,000 | | | | 332,325 | |
| Genesis Energy LP, 144A, 7.875%, 12/15/2018 | | | | 230,000 | | | | 228,850 | |
| Global Geophysical Services, Inc., 10.5%, 5/1/2017 | | | | 775,000 | | | | 813,750 | |
| Harvest Operations Corp., 144A, 6.875%, 10/1/2017 | | | | 140,000 | | | | 144,550 | |
| Holly Corp., 9.875%, 6/15/2017 | | | | 545,000 | | | | 607,675 | |
| Holly Energy Partners LP, 8.25%, 3/15/2018 | | | | 330,000 | | | | 349,800 | |
| Linn Energy LLC: | |
| 144A, 6.5%, 5/15/2019 | | | | 285,000 | | | | 282,150 | |
| 144A, 7.75%, 2/1/2021 | | | | 335,000 | | | | 348,400 | |
| 8.625%, 4/15/2020 | | | | 305,000 | | | | 330,925 | |
| MEG Energy Corp., 144A, 6.5%, 3/15/2021 | | | | 235,000 | | | | 236,175 | |
| Newfield Exploration Co., 7.125%, 5/15/2018 | | | | 270,000 | | | | 286,200 | |
| Oasis Petroleum, Inc., 144A, 7.25%, 2/1/2019 | | | | 435,000 | | | | 431,737 | |
| Offshore Group Investments Ltd.: | |
| 11.5%, 8/1/2015 | | | | 275,000 | | | | 299,063 | |
| 144A, 11.5%, 8/1/2015 | | | | 30,000 | | | | 32,625 | |
| Petrohawk Energy Corp.: | |
| 7.25%, 8/15/2018 | | | | 700,000 | | | | 718,375 | |
| 7.875%, 6/1/2015 | | | | 220,000 | | | | 230,450 | |
| 10.5%, 8/1/2014 | | | | 380,000 | | | | 427,500 | |
| Plains Exploration & Production Co., 7.625%, 6/1/2018 | | | | 320,000 | | | | 336,000 | |
| | | Principal Amount ($) (a) | | | Value ($) | |
| | | | | | | | | |
| Range Resources Corp., 6.75%, 8/1/2020 | | | | 105,000 | | | | 108,675 | |
| Regency Energy Partners LP, 6.875%, 12/1/2018 | | | | 205,000 | | | | 212,175 | |
| Sabine Pass LNG LP: | |
| 7.25%, 11/30/2013 | | | | 930,000 | | | | 953,250 | |
| 7.5%, 11/30/2016 | | | | 355,000 | | | | 363,875 | |
| SandRidge Energy, Inc., 144A, 7.5%, 3/15/2021 | | | | 300,000 | | | | 303,750 | |
| SESI LLC, 144A, 6.375%, 5/1/2019 | | | | 235,000 | | | | 232,650 | |
| Southwestern Energy Co., 7.5%, 2/1/2018 | | | | 585,000 | | | | 665,437 | |
| Stone Energy Corp.: | |
| 6.75%, 12/15/2014 | | | | 590,000 | | | | 587,050 | |
| 8.625%, 2/1/2017 | | | | 125,000 | | | | 128,750 | |
| Venoco, Inc., 144A, 8.875%, 2/15/2019 | | | | 590,000 | | | | 590,000 | |
| Xinergy Corp., 144A, 9.25%, 5/15/2019 | | | | 335,000 | | | | 338,350 | |
| | | | | 17,898,900 | |
| Financials 14.0% | |
| Abengoa Finance SAU, 144A, 8.875%, 11/1/2017 | | | | 775,000 | | | | 791,469 | |
| Algoma Acquisition Corp., 144A, 9.875%, 6/15/2015 | | | | 450,000 | | | | 418,500 | |
| Antero Resources Finance Corp., 9.375%, 12/1/2017 | | | | 390,000 | | | | 419,250 | |
| Ardagh Packaging Finance PLC, 144A, 7.375%, 10/15/2017 | | | | 215,000 | | | | 221,450 | |
| Ashton Woods USA LLC, 144A, Step-up Coupon, 0% to 6/30/2012, 11.0% to 6/30/2015 | | | | 712,400 | | | | 431,002 | |
| AWAS Aviation Capital Ltd., 144A, 7.0%, 10/15/2016 | | | | 571,200 | | | | 586,194 | |
| Bumble Bee Acquisition Corp., 144A, 9.0%, 12/15/2017 | | | | 150,000 | | | | 150,750 | |
| Calpine Construction Finance Co., LP, 144A, 8.0%, 6/1/2016 | | | | 570,000 | | | | 615,600 | |
| CIT Group, Inc.: | |
| 7.0%, 5/1/2015 | | | | 195 | | | | 195 | |
| 144A, 7.0%, 5/4/2015 | | | | 623,000 | | | | 623,779 | |
| 144A, 7.0%, 5/2/2017 | | | | 2,085,000 | | | | 2,079,787 | |
| CPI International Acquisition, Inc., 144A, 8.0%, 2/15/2018 | | | | 260,000 | | | | 245,700 | |
| DuPont Fabros Technology LP, (REIT), 8.5%, 12/15/2017 | | | | 435,000 | | | | 475,237 | |
| E*TRADE Financial Corp.: | |
| 6.75%, 6/1/2016 | | | | 570,000 | | | | 558,600 | |
| 12.5%, 11/30/2017 (PIK) | | | | 632,000 | | | | 739,440 | |
| Felcor Lodging LP, (REIT), 144A, 6.75%, 6/1/2019 | | | | 410,000 | | | | 393,600 | |
| Ford Motor Credit Co., LLC: | |
| 6.625%, 8/15/2017 | | | | 355,000 | | | | 377,380 | |
| 8.125%, 1/15/2020 | | | | 100,000 | | | | 115,841 | |
| Fresenius US Finance II, Inc., 144A, 9.0%, 7/15/2015 | | | | 420,000 | | | | 475,125 | |
| Giraffe Acquisition Corp., 144A, 9.125%, 12/1/2018 | | | | 330,000 | | | | 310,200 | |
| Hellas Telecommunications Finance SCA, 144A, 8.985%**, 7/15/2015 (PIK)* | EUR | | | 322,107 | | | | 280 | |
| Hexion US Finance Corp., 8.875%, 2/1/2018 | | | | 2,000,000 | | | | 2,080,000 | |
| | | Principal Amount ($) (a) | | | Value ($) | |
| | | | | | | | | |
| Inmarsat Finance PLC, 144A, 7.375%, 12/1/2017 | | | | 670,000 | | | | 710,200 | |
| International Lease Finance Corp.: | |
| 5.75%, 5/15/2016 | | | | 105,000 | | | | 103,395 | |
| 6.25%, 5/15/2019 | | | | 270,000 | | | | 263,808 | |
| 8.625%, 9/15/2015 | | | | 235,000 | | | | 254,681 | |
| 8.75%, 3/15/2017 | | | | 465,000 | | | | 508,594 | |
| Level 3 Escrow, Inc., 144A, 8.125%, 7/1/2019 | | | | 400,000 | | | | 402,000 | |
| MPT Operating Partnership LP, (REIT), 144A, 6.875%, 5/1/2021 | | | | 295,000 | | | | 289,838 | |
| National Money Mart Co., 10.375%, 12/15/2016 | | | | 790,000 | | | | 867,025 | |
| Navios Maritime Acquisition Corp., 8.625%, 11/1/2017 | | | | 150,000 | | | | 147,750 | |
| Nielsen Finance LLC, 144A, 7.75%, 10/15/2018 | | | | 50,000 | | | | 52,500 | |
| NII Capital Corp., 7.625%, 4/1/2021 | | | | 335,000 | | | | 350,075 | |
| Nuveen Investments, Inc.: | |
| 10.5%, 11/15/2015 | | | | 725,000 | | | | 741,312 | |
| 144A, 10.5%, 11/15/2015 | | | | 525,000 | | | | 531,562 | |
| OMEGA Healthcare Investors, Inc., (REIT), 144A, 6.75%, 10/15/2022 | | | | 305,000 | | | | 300,806 | |
| Pinnacle Foods Finance LLC: | |
| 8.25%, 9/1/2017 | | | | 425,000 | | | | 440,938 | |
| 9.25%, 4/1/2015 | | | | 695,000 | | | | 721,062 | |
| Reynolds Group Issuer, Inc.: | |
| 144A, 6.875%, 2/15/2021 | | | | 540,000 | | | | 526,500 | |
| 144A, 7.125%, 4/15/2019 | | | | 415,000 | | | | 411,888 | |
| 144A, 8.25%, 2/15/2021 | | | | 225,000 | | | | 210,375 | |
| 144A, 8.5%, 10/15/2016 | | | | 550,000 | | | | 573,375 | |
| 144A, 8.75%, 5/15/2018 | | | | 610,000 | | | | 599,325 | |
| 144A, 9.0%, 4/15/2019 | | | | 590,000 | | | | 582,625 | |
| Susser Holdings LLC, 8.5%, 5/15/2016 | | | | 175,000 | | | | 184,188 | |
| Tomkins LLC, 144A, 9.0%, 10/1/2018 | | | | 230,000 | | | | 247,825 | |
| Tropicana Entertainment LLC, 9.625%, 12/15/2014* | | | | 1,220,000 | | | | 610 | |
| UPCB Finance III Ltd., 144A, 6.625%, 7/1/2020 | | | | 185,000 | | | | 182,688 | |
| Virgin Media Finance PLC, Series 1, 9.5%, 8/15/2016 | | | | 1,135,000 | | | | 1,282,550 | |
| | | | | 23,596,874 | |
| Health Care 1.4% | |
| Aviv Healthcare Properties LP, 144A, 7.75%, 2/15/2019 | | | | 235,000 | | | | 240,288 | |
| HCA Holdings, Inc., 144A, 7.75%, 5/15/2021 (b) | | | | 605,000 | | | | 627,687 | |
| Mylan, Inc., 144A, 7.875%, 7/15/2020 | | | | 95,000 | | | | 104,263 | |
| STHI Holding Corp., 144A, 8.0%, 3/15/2018 | | | | 345,000 | | | | 350,175 | |
| Vanguard Health Holding Co. II, LLC, 8.0%, 2/1/2018 | | | | 590,000 | | | | 609,175 | |
| Warner Chilcott Co., LLC, 144A, 7.75%, 9/15/2018 | | | | 420,000 | | | | 423,675 | |
| | | | | 2,355,263 | |
| Industrials 11.8% | |
| Accuride Corp., 9.5%, 8/1/2018 | | | | 405,000 | | | | 433,350 | |
| Actuant Corp., 6.875%, 6/15/2017 | | | | 300,000 | | | | 306,750 | |
| Aguila 3 SA, 144A, 7.875%, 1/31/2018 | | | | 310,000 | | | | 311,937 | |
| | | Principal Amount ($) (a) | | | Value ($) | |
| | | | | | | | | |
| American Airlines, Inc., 144A, 7.5%, 3/15/2016 (b) | | | | 490,000 | | | | 480,200 | |
| AMGH Merger Sub, Inc., 144A, 9.25%, 11/1/2018 | | | | 190,000 | | | | 200,450 | |
| ARAMARK Corp., 8.5%, 2/1/2015 | | | | 560,000 | | | | 581,700 | |
| ARAMARK Holdings Corp., 144A, 8.625%, 5/1/2016 (PIK) | | | | 105,000 | | | | 106,838 | |
| Armored Autogroup, Inc., 144A, 9.25%, 11/1/2018 | | | | 610,000 | | | | 603,900 | |
| B-Corp Merger Sub, Inc., 144A, 8.25%, 6/1/2019 | | | | 335,000 | | | | 331,650 | |
| BE Aerospace, Inc.: | |
| 6.875%, 10/1/2020 | | | | 210,000 | | | | 219,975 | |
| 8.5%, 7/1/2018 | | | | 300,000 | | | | 327,375 | |
| Belden, Inc., 7.0%, 3/15/2017 | | | | 420,000 | | | | 430,500 | |
| Boart Longyear Management Pty Ltd., 144A, 7.0%, 4/1/2021 | | | | 190,000 | | | | 194,275 | |
| Briggs & Stratton Corp., 6.875%, 12/15/2020 | | | | 195,000 | | | | 206,700 | |
| Casella Waste Systems, Inc., 144A, 7.75%, 2/15/2019 | | | | 415,000 | | | | 416,037 | |
| Cenveo Corp., 8.875%, 2/1/2018 | | | | 1,055,000 | | | | 1,023,350 | |
| CHC Helicopter SA, 144A, 9.25%, 10/15/2020 | | | | 950,000 | | | | 857,375 | |
| Congoleum Corp., 9.0%, 12/31/2017 (PIK) | | | | 396,000 | | | | 257,400 | |
| Corrections Corp. of America, 7.75%, 6/1/2017 | | | | 35,000 | | | | 38,106 | |
| Delta Air Lines, Inc., 144A, 9.5%, 9/15/2014 | | | | 99,000 | | | | 105,559 | |
| Deluxe Corp., 144A, 7.0%, 3/15/2019 | | | | 180,000 | | | | 178,200 | |
| Ducommun, Inc., 144A, 9.75%, 7/15/2018 | | | | 305,000 | | | | 313,387 | |
| DynCorp International, Inc., 144A, 10.375%, 7/1/2017 | | | | 490,000 | | | | 502,250 | |
| Florida East Coast Railway Corp., 144A, 8.125%, 2/1/2017 | | | | 225,000 | | | | 232,313 | |
| FTI Consulting, Inc., 6.75%, 10/1/2020 | | | | 195,000 | | | | 196,950 | |
| Garda World Security Corp., 144A, 9.75%, 3/15/2017 | | | | 375,000 | | | | 396,562 | |
| H&E Equipment Services, Inc., 8.375%, 7/15/2016 | | | | 615,000 | | | | 628,837 | |
| Heckler & Koch GmbH, 144A, 9.5%, 5/15/2018 | EUR | | | 580,000 | | | | 799,032 | |
| Huntington Ingalls Industries, Inc.: | | |
| 144A, 6.875%, 3/15/2018 | | | | 180,000 | | | | 184,500 | |
| 144A, 7.125%, 3/15/2021 | | | | 60,000 | | | | 62,100 | |
| Interline Brands, Inc., 7.0%, 11/15/2018 | | | | 295,000 | | | | 298,688 | |
| K. Hovnanian Enterprises, Inc., 10.625%, 10/15/2016 | | | | 365,000 | | | | 364,087 | |
| Kansas City Southern de Mexico SA de CV, 8.0%, 2/1/2018 | | | | 205,000 | | | | 222,425 | |
| Meritor, Inc., 8.125%, 9/15/2015 | | | | 280,000 | | | | 291,900 | |
| Navios Maritime Holdings, Inc., 144A, 8.125%, 2/15/2019 | | | | 760,000 | | | | 729,600 | |
| Navios South American Logistics, Inc., 144A, 9.25%, 4/15/2019 | | | | 295,000 | | | | 297,213 | |
| | | Principal Amount ($) (a) | | | Value ($) | |
| | | | | | | | | |
| Nortek, Inc., 144A, 8.5%, 4/15/2021 | | | | 720,000 | | | | 666,000 | |
| Ply Gem Industries, Inc.: | |
| 144A, 8.25%, 2/15/2018 | | | | 275,000 | | | | 260,563 | |
| 13.125%, 7/15/2014 | | | | 515,000 | | | | 540,750 | |
| RailAmerica, Inc., 9.25%, 7/1/2017 | | | | 304,000 | | | | 333,640 | |
| RBS Global, Inc. & Rexnord Corp.: | |
| 8.5%, 5/1/2018 | | | | 715,000 | | | | 755,219 | |
| 11.75%, 8/1/2016 (b) | | | | 120,000 | | | | 126,900 | |
| Rearden G Holdings EINS GmbH, 144A, 7.875%, 3/30/2020 | | | | 135,000 | | | | 147,150 | |
| Sitel LLC, 11.5%, 4/1/2018 | | | | 565,000 | | | | 516,975 | |
| Spirit AeroSystems, Inc.: | |
| 6.75%, 12/15/2020 | | | | 205,000 | | | | 208,075 | |
| 7.5%, 10/1/2017 | | | | 215,000 | | | | 226,288 | |
| SPX Corp., 144A, 6.875%, 9/1/2017 | | | | 130,000 | | | | 139,100 | |
| Titan International, Inc., 144A, 7.875%, 10/1/2017 | | | | 945,000 | | | | 987,525 | |
| Triumph Group, Inc., 8.0%, 11/15/2017 | | | | 75,000 | | | | 78,938 | |
| Tutor Perini Corp., 7.625%, 11/1/2018 | | | | 325,000 | | | | 312,000 | |
| United Rentals North America, Inc.: | |
| 9.25%, 12/15/2019 | | | | 830,000 | | | | 900,550 | |
| 10.875%, 6/15/2016 | | | | 390,000 | | | | 436,312 | |
| USG Corp., 144A, 9.75%, 8/1/2014 | | | | 220,000 | | | | 233,200 | |
| | | | | 20,000,656 | |
| Information Technology 5.4% | |
| Alcatel-Lucent USA, Inc., 6.45%, 3/15/2029 | | | | 570,000 | | | | 513,000 | |
| Allen Systems Group, Inc., 144A, 10.5%, 11/15/2016 | | | | 210,000 | | | | 211,050 | |
| Amkor Technology, Inc.: | |
| 144A, 6.625%, 6/1/2021 | | | | 50,000 | | | | 48,125 | |
| 7.375%, 5/1/2018 | | | | 250,000 | | | | 254,063 | |
| Aspect Software, Inc., 10.625%, 5/7/2017 | | | | 350,000 | | | | 376,250 | |
| Avaya, Inc., 144A, 7.0%, 4/1/2019 | | | | 830,000 | | | | 803,025 | |
| CDW LLC: | |
| 144A, 8.5%, 4/1/2019 | | | | 600,000 | | | | 588,000 | |
| 11.0%, 10/12/2015 | | | | 52,000 | | | | 54,730 | |
| CommScope, Inc., 144A, 8.25%, 1/15/2019 | | | | 485,000 | | | | 499,550 | |
| eAccess Ltd., 144A, 8.25%, 4/1/2018 | | | | 335,000 | | | | 334,162 | |
| Equinix, Inc., 8.125%, 3/1/2018 | | | | 120,000 | | | | 130,650 | |
| Fidelity National Information Services, Inc., 7.625%, 7/15/2017 | | | | 95,000 | | | | 100,819 | |
| First Data Corp.: | |
| 144A, 7.375%, 6/15/2019 | | | | 170,000 | | | | 171,275 | |
| 144A, 8.25%, 1/15/2021 | | | | 785,000 | | | | 769,300 | |
| 144A, 8.875%, 8/15/2020 | | | | 495,000 | | | | 528,412 | |
| Freescale Semiconductor, Inc., 144A, 9.25%, 4/15/2018 | | | | 990,000 | | | | 1,066,725 | |
| Jabil Circuit, Inc., 7.75%, 7/15/2016 | | | | 145,000 | | | | 160,588 | |
| MasTec, Inc., 7.625%, 2/1/2017 | | | | 610,000 | | | | 620,675 | |
| MEMC Electronic Materials, Inc., 144A, 7.75%, 4/1/2019 | | | | 240,000 | | | | 237,000 | |
| Sanmina-SCI Corp., 144A, 7.0%, 5/15/2019 | | | | 245,000 | | | | 231,525 | |
| | | Principal Amount ($) (a) | | | Value ($) | |
| | | | | | | | | |
| Seagate HDD Cayman, 144A, 7.0%, 11/1/2021 | | | | 290,000 | | | | 290,000 | |
| Sensata Technologies BV, 144A, 6.5%, 5/15/2019 | | | | 290,000 | | | | 289,275 | |
| SunGard Data Systems, Inc.: | |
| 7.375%, 11/15/2018 | | | | 140,000 | | | | 140,000 | |
| 10.625%, 5/15/2015 | | | | 365,000 | | | | 395,112 | |
| Vangent, Inc., 9.625%, 2/15/2015 | | | | 350,000 | | | | 353,500 | |
| | | | | 9,166,811 | |
| Materials 11.8% | |
| Aleris International, Inc., 144A, 7.625%, 2/15/2018 | | | | 220,000 | | | | 219,450 | |
| APERAM: | |
| 144A, 7.375%, 4/1/2016 | | | | 215,000 | | | | 216,075 | |
| 144A, 7.75%, 4/1/2018 | | | | 260,000 | | | | 261,950 | |
| Appleton Papers, Inc., 11.25%, 12/15/2015 | | | | 237,000 | | | | 239,370 | |
| Berry Plastics Corp.: | |
| 8.25%, 11/15/2015 | | | | 660,000 | | | | 696,300 | |
| 9.5%, 5/15/2018 | | | | 390,000 | | | | 387,075 | |
| 9.75%, 1/15/2021 | | | | 460,000 | | | | 445,050 | |
| Boise Paper Holdings LLC, 8.0%, 4/1/2020 | | | | 170,000 | | | | 178,500 | |
| BWAY Parent Co., Inc., 144A, 10.125%, 11/1/2015 (PIK) | | | | 242,853 | | | | 242,853 | |
| Celanese US Holdings LLC: | |
| 5.875%, 6/15/2021 | | | | 165,000 | | | | 168,713 | |
| 6.625%, 10/15/2018 | | | | 200,000 | | | | 211,000 | |
| China Lumena New Materials Corp., 144A, 12.0%, 10/27/2014 | | | | 1,120,000 | | | | 1,096,200 | |
| Clearwater Paper Corp., 7.125%, 11/1/2018 | | | | 390,000 | | | | 399,750 | |
| Clondalkin Acquisition BV, 144A, 2.247%**, 12/15/2013 | | | | 265,000 | | | | 253,075 | |
| Crown Americas LLC, 144A, 6.25%, 2/1/2021 | | | | 50,000 | | | | 50,500 | |
| Domtar Corp., 10.75%, 6/1/2017 | | | | 380,000 | | | | 494,475 | |
| Essar Steel Algoma, Inc., 144A, 9.375%, 3/15/2015 | | | | 1,410,000 | | | | 1,413,525 | |
| Exopack Holding Corp., 144A, 10.0%, 6/1/2018 | | | | 230,000 | | | | 228,275 | |
| FMG Resources August 2006 Pty Ltd., 144A, 7.0%, 11/1/2015 | | | | 140,000 | | | | 142,800 | |
| GEO Specialty Chemicals, Inc.: | |
| 144A, 7.5%, 3/31/2015 (PIK) | | | | 1,297,793 | | | | 1,193,970 | |
| 10.0%, 3/31/2015 | | | | 1,277,440 | | | | 1,264,666 | |
| Graham Packaging Co., LP, 8.25%, 10/1/2018 | | | | 135,000 | | | | 150,188 | |
| Graphic Packaging International, Inc.: | | |
| 7.875%, 10/1/2018 | | | | 70,000 | | | | 74,200 | |
| 9.5%, 6/15/2017 | | | | 810,000 | | | | 886,950 | |
| Hexcel Corp., 6.75%, 2/1/2015 | | | | 475,000 | | | | 483,312 | |
| Huntsman International LLC: | |
| 8.625%, 3/15/2020 | | | | 330,000 | | | | 359,700 | |
| 8.625%, 3/15/2021 | | | | 140,000 | | | | 152,250 | |
| JMC Steel Group, 144A, 8.25%, 3/15/2018 | | | | 350,000 | | | | 355,250 | |
| Koppers, Inc., 7.875%, 12/1/2019 | | | | 440,000 | | | | 469,700 | |
| Longview Fibre Paper & Packaging, Inc., 144A, 8.0%, 6/1/2016 | | | | 335,000 | | | | 336,675 | |
| | | Principal Amount ($) (a) | | | Value ($) | |
| | | | | | | | | |
| Lyondell Chemical Co., 144A, 8.0%, 11/1/2017 | | | | 290,000 | | | | 322,625 | |
| Momentive Performance Materials, Inc.: | | |
| 9.0%, 1/15/2021 | | | | 385,000 | | | | 392,700 | |
| 9.5%, 1/15/2021 | EUR | | | 385,000 | | | | 552,725 | |
| NewMarket Corp., 7.125%, 12/15/2016 | | | | 1,005,000 | | | | 1,047,712 | |
| OI European Group BV, 144A, 6.75%, 9/15/2020 | EUR | | | 130,000 | | | | 187,577 | |
| Packaging Dynamics Corp., 144A, 8.75%, 2/1/2016 | | | | 535,000 | | | | 543,025 | |
| Phibro Animal Health Corp., 144A, 9.25%, 7/1/2018 | | | | 70,000 | | | | 73,850 | |
| Polymer Group, Inc., 144A, 7.75%, 2/1/2019 | | | | 300,000 | | | | 300,750 | |
| Radnor Holdings Corp., 11.0%, 3/15/2010* | | | | 265,000 | | | | 27 | |
| Rain CII Carbon LLC, 144A, 8.0%, 12/1/2018 | | | | 270,000 | | | | 287,550 | |
| Silgan Holdings, Inc., 7.25%, 8/15/2016 | | | | 415,000 | | | | 437,825 | |
Solo Cup Co., 10.5%, 11/1/2013 | | | | 210,000 | | | | 218,400 | |
| Texas Industries, Inc., 9.25%, 8/15/2020 | | | | 465,000 | | | | 449,887 | |
| United States Steel Corp., 7.375%, 4/1/2020 (b) | | | | 480,000 | | | | 493,200 | |
| Verso Paper Holdings LLC, 144A, 8.75%, 2/1/2019 | | | | 130,000 | | | | 115,700 | |
| Viskase Companies, Inc., 144A, 9.875%, 1/15/2018 | | | | 940,000 | | | | 979,949 | |
| Wolverine Tube, Inc., 15.0%, 3/31/2012 (PIK)* | | | | 830,088 | | | | 400,517 | |
| | | | | 19,875,816 | |
| Telecommunication Services 11.2% | |
| Buccaneer Merger Sub, Inc., 144A, 9.125%, 1/15/2019 | | | | 130,000 | | | | 135,200 | |
| Cincinnati Bell, Inc.: | |
| 8.25%, 10/15/2017 | | | | 1,020,000 | | | | 1,025,100 | |
| 8.375%, 10/15/2020 | | | | 1,030,000 | | | | 1,027,425 | |
| 8.75%, 3/15/2018 | | | | 350,000 | | | | 332,500 | |
Clearwire Communications LLC: | |
| 144A, 12.0%, 12/1/2015 | | | | 425,000 | | | | 453,688 | |
| 144A, 12.0%, 12/1/2015 | | | | 465,000 | | | | 498,131 | |
| Cricket Communications, Inc.: | |
| 7.75%, 10/15/2020 (b) | | | | 1,795,000 | | | | 1,759,100 | |
| 10.0%, 7/15/2015 | | | | 380,000 | | | | 409,450 | |
| Digicel Group Ltd., 144A, 10.5%, 4/15/2018 | | | | 495,000 | | | | 554,400 | |
| Digicel Ltd., 144A, 8.25%, 9/1/2017 | | | | 1,090,000 | | | | 1,130,875 | |
| ERC Ireland Preferred Equity Ltd., 144A, 8.42%**, 2/15/2017 (PIK) | EUR | | | 665,001 | | | | 4,822 | |
Frontier Communications Corp.: | | |
| 7.875%, 4/15/2015 | | | | 65,000 | | | | 70,525 | |
| 8.25%, 4/15/2017 | | | | 395,000 | | | | 429,563 | |
| 8.5%, 4/15/2020 | | | | 195,000 | | | | 212,550 | |
| 8.75%, 4/15/2022 | | | | 70,000 | | | | 76,300 | |
| Intelsat Jackson Holdings SA: | |
| 144A, 7.25%, 10/15/2020 | | | | 695,000 | | | | 691,525 | |
| 144A, 7.5%, 4/1/2021 | | | | 855,000 | | | | 849,656 | |
| 8.5%, 11/1/2019 | | | | 580,000 | | | | 614,800 | |
| | | Principal Amount ($) (a) | | | Value ($) | |
| | | | | | | | | |
| Intelsat Luxembourg SA: | |
| 11.25%, 2/4/2017 | | | | 1,450,000 | | | | 1,556,937 | |
| 11.5%, 2/4/2017 (PIK) | | | | 1,340,625 | | | | 1,441,172 | |
| 144A, 11.5%, 2/4/2017 (PIK) | | | | 445,000 | | | | 478,375 | |
| MetroPCS Wireless, Inc.: | |
| 6.625%, 11/15/2020 | | | | 480,000 | | | | 475,200 | |
| 7.875%, 9/1/2018 | | | | 420,000 | | | | 444,675 | |
| Pacnet Ltd., 144A, 9.25%, 11/9/2015 | | | | 225,000 | | | | 214,875 | |
| Sprint Nextel Corp., 8.375%, 8/15/2017 | | | | 590,000 | | | | 648,262 | |
| Telesat Canada, 11.0%, 11/1/2015 | | | | 1,545,000 | | | | 1,689,844 | |
| West Corp.: | |
| 144A, 7.875%, 1/15/2019 | | | | 285,000 | | | | 276,450 | |
| 144A, 8.625%, 10/1/2018 | | | | 75,000 | | | | 75,750 | |
| Windstream Corp.: | |
| 7.0%, 3/15/2019 | | | | 430,000 | | | | 434,300 | |
| 7.5%, 4/1/2023 | | | | 40,000 | | | | 40,000 | |
| 7.75%, 10/15/2020 | | | | 180,000 | | | | 188,550 | |
| 7.875%, 11/1/2017 | | | | 495,000 | | | | 525,319 | |
| 8.125%, 9/1/2018 | | | | 180,000 | | | | 190,800 | |
| | | | | 18,956,119 | |
| Utilities 3.5% | |
| AES Corp.: | |
| 144A, 7.375%, 7/1/2021 | | | | 540,000 | | | | 548,100 | |
| 8.0%, 10/15/2017 | | | | 415,000 | | | | 439,900 | |
| 8.0%, 6/1/2020 | | | | 525,000 | | | | 559,125 | |
| Calpine Corp.: | |
| 144A, 7.5%, 2/15/2021 | | | | 485,000 | | | | 494,700 | |
| 144A, 7.875%, 7/31/2020 | | | | 560,000 | | | | 585,200 | |
| Edison Mission Energy, 7.0%, 5/15/2017 | | | | 1,570,000 | | | | 1,271,700 | |
| Energy Future Holdings Corp., Series Q, 6.5%, 11/15/2024 | | | | 1,110,000 | | | | 555,000 | |
| Energy Future Intermediate Holding Co. LLC, 10.0%, 12/1/2020 | | | | 125,000 | | | | 133,308 | |
| Ferrellgas LP, 144A, 6.5%, 5/1/2021 | | | | 120,000 | | | | 113,400 | |
| NRG Energy, Inc.: | |
| 7.375%, 1/15/2017 | | | | 320,000 | | | | 335,200 | |
| 144A, 7.625%, 1/15/2018 | | | | 200,000 | | | | 200,500 | |
| 8.25%, 9/1/2020 | | | | 220,000 | | | | 224,400 | |
| Texas Competitive Electric Holdings Co., LLC: | | |
| Series A, 10.25%, 11/1/2015 | | | | 275,000 | | | | 166,376 | |
| 144A, 11.5%, 10/1/2020 | | | | 360,000 | | | | 353,700 | |
| | | | | 5,980,609 | |
Total Corporate Bonds (Cost $159,590,828) | | | | 159,715,219 | |
| | |
| Loan Participations and Assignments 1.2% | |
| Senior Loans** | |
| Alliance Mortgage Cycle Loan, Term Loan A, 9.5%, 6/1/2010* | | | | 700,000 | | | | 0 | |
| Buffets, Inc., Letter of Credit, First Lien, 7.496%, 4/22/2015 | | | | 96,058 | | | | 77,087 | |
Hawker Beechcraft Acquisition Co., LLC: | |
| Term Loan, 2.186%, 3/26/2014 | | | 980,677 | | | | 827,677 | |
| Letter of Credit, 2.246%, 3/26/2014 | | | 60,643 | | | | 51,181 | |
| | | Principal Amount ($) (a) | | | Value ($) | |
| | | | | | | | | |
| Roundy's Supermarkets, Inc., Second Lien Term Loan, 10.0%, 4/18/2016 | | | 325,000 | | | | 329,368 | |
| Tribune Co., Term Loan B, LIBOR plus 3.0%, 6/4/2014* | | | 1,009,426 | | | | 686,409 | |
Total Loan Participations and Assignments (Cost $2,955,324) | | | | 1,971,722 | |
| | |
| Convertible Bonds 0.4% | |
| Consumer Discretionary | |
| Group 1 Automotive, Inc., 144A, 3.0%, 3/15/2020 | | | 375,000 | | | | 467,344 | |
| Sonic Automotive, Inc., 5.0%, 10/1/2029 | | | 155,000 | | | | 204,600 | |
Total Convertible Bonds (Cost $530,313) | | | | 671,944 | |
| | |
| Preferred Security 0.6% | |
| Materials | |
| Hercules, Inc., 6.5%, 6/30/2029 (Cost $737,867) | | | 1,135,000 | | | | 959,075 | |
| | | Units | | | Value ($) | |
| | | | |
| Other Investments 0.0% | |
| Consumer Discretionary | |
| AOT Bedding Super Holdings LLC* (Cost $31,000) | | | 31 | | | | 31,000 | |
| | | Shares | | | Value ($) | |
| | | | |
| Common Stocks 0.1% | |
| Consumer Discretionary 0.1% | |
| Buffets Restaurants Holdings, Inc.* | | | 18,256 | | | | 73,024 | |
| Dex One Corp.* | | | 3,884 | | | | 9,827 | |
| SuperMedia, Inc.* | | | 726 | | | | 2,722 | |
| Trump Entertainment Resorts, Inc.* | | | 45 | | | | 821 | |
| Vertis Holdings, Inc. | | | 676 | | | | 11,992 | |
| | | | | 98,386 | |
| Industrials 0.0% | |
| Congoleum Corp.* | | | 1,200,000 | | | | 1 | |
| Quad Graphics, Inc. | | | 649 | | | | 25,220 | |
| | | | | 25,221 | |
| Materials 0.0% | |
| GEO Specialty Chemicals, Inc.* | | | 24,225 | | | | 20,592 | |
| GEO Specialty Chemicals, Inc. 144A* | | | 2,206 | | | | 1,875 | |
| | | | | 22,467 | |
Total Common Stocks (Cost $2,412,740) | | | | 146,074 | |
| | |
| Warrants 0.0% | |
| Consumer Discretionary 0.0% | |
| Reader's Digest Association, Inc., Expiration Date 2/19/2014* | | | 1,115 | | | | 33 | |
| Materials 0.0% | |
| Hercules Trust II, Expiration Date 3/31/2029* | | | 1,100 | | | | 11,053 | |
Total Warrants (Cost $244,286) | | | | 11,086 | |
| | | Shares | | | Value ($) | |
| | | | | | | | | |
| Preferred Stocks 0.8% | |
| Financials | |
| Ally Financial, Inc. Series G, 144A, 7.0% | | | 440 | | | | 413,545 | |
| Ally Financial, Inc. Series A, 8.5% | | | 18,090 | | | | 454,104 | |
| GMAC Capital Trust I Series 2, 8.125% | | | 19,000 | | | | 486,400 | |
Total Preferred Stocks (Cost $1,330,112) | | | | 1,354,049 | |
| | |
| | | Shares | | | Value ($) | |
| | | | | | | | | |
| Securities Lending Collateral 3.0% | |
| Daily Assets Fund Institutional, 0.13% (c) (d) (Cost $5,138,221) | | | 5,138,221 | | | | 5,138,221 | |
| | | % of Net Assets | | | Value ($) | |
| | | | |
Total Investment Portfolio (Cost $172,970,691)+ | | | 100.5 | | | | 169,998,390 | |
| Other Assets and Liabilities, Net (b) | | | (0.5 | ) | | | (856,604 | ) |
| Net Assets | | | 100.0 | | | | 169,141,786 | |
The following table represents bonds and senior loans that are in default:
| Securities | | Coupon | | Maturity Date | | Principal Amount ($) | | Acquisition Cost ($) | | | Value ($) | |
| Alliance Mortgage Cycle Loan* | | | 9.5 | % | 6/1/2010 | | | 700,000 | | USD | | | 700,000 | | | | 0 | |
| CanWest LP* | | | 9.25 | % | 8/1/2015 | | | 340,000 | | USD | | | 340,000 | | | | 57,800 | |
| Fontainebleau Las Vegas Holdings LLC* | | | 11.0 | % | 6/15/2015 | | | 490,000 | | USD | | | 495,963 | | | | 245 | |
| Hellas Telecommunications Finance SCA* | | | 8.985 | % | 7/15/2015 | | | 322,107 | | EUR | | | 92,199 | | | | 280 | |
| Radnor Holdings Corp.* | | | 11.0 | % | 3/15/2010 | | | 265,000 | | USD | | | 234,313 | | | | 27 | |
| Tribune Co.* | | LIBOR plus 3.0% | | 6/4/2014 | | | 1,009,426 | | USD | | | 905,407 | | | | 686,409 | |
| Tropicana Entertainment LLC* | | | 9.625 | % | 12/15/2014 | | | 1,220,000 | | USD | | | 959,601 | | | | 610 | |
| Wolverine Tube, Inc.* | | | 15.0 | % | 3/31/2012 | | | 830,088 | | USD | | | 830,088 | | | | 400,517 | |
| | | | | | | | | | | | | | 4,557,571 | | | | 1,145,888 | |
* Non-income producing security. In the case of a bond, generally denotes that the issuer has defaulted on the payment of principal or interest or has filed for bankruptcy.
** These securities are shown at their current rate as of June 30, 2011. Floating rate securities' yields vary with a designated market index or market rate, such as the coupon-equivalent of the US Treasury bill rate.
+ The cost for federal income tax purposes was $172,970,724. At June 30, 2011, net unrealized depreciation for all securities based on tax cost was $2,972,334. This consisted of aggregate gross unrealized appreciation for all securities in which there was an excess of value over tax cost of $6,337,420 and aggregate gross unrealized depreciation for all securities in which there was an excess of tax cost over value of $9,309,754.
(a) Principal amount stated in US dollars unless otherwise noted.
(b) All or a portion of these securities were on loan amounting to $4,925,225. In addition, included in other assets and liabilities, net is a pending sale, amounting to $43,313, that is also on loan (see Notes to Financial Statements). The value of all securities loaned at June 30, 2011 amounted to $4,968,538, which is 2.9% of net assets.
(c) Affiliated fund managed by Deutsche Investment Management Americas Inc. The rate shown is the annualized seven-day yield at period end.
(d) Represents collateral held in connection with securities lending. Income earned by the Fund is net of borrower rebates.
144A: Security exempt from registration under Rule 144A of the Securities Act of 1933. These securities may be resold in transactions exempt from registration, normally to qualified institutional buyers.
LIBOR: London Interbank Offered Rate
PIK: Denotes that all or a portion of the income is paid in kind.
REIT: Real Estate Investment Trust
At June 30, 2011, open credit default swap contracts sold were as follows:
Effective/ Expiration Date | | Notional Amount ($) (e) | | | Fixed Cash Flows Received | | Underlying Debt Obligation/Quality Rating (f) | | Value ($) | | | Upfront Payments Paid/ (Received) ($) | | | Unrealized Appreciation/ (Depreciation) ($) | |
3/21/2011 6/20/2016 | | | 610,000 | 1 | | | 5.0 | % | Ally Financial Corp., 8.3%, 2/12/2015, B+ | | | 40,762 | | | | 34,677 | | | | 6,085 | |
3/21/2011 6/20/2016 | | | 540,000 | 2 | | | 5.0 | % | Ally Financial Corp., 6.75%, 12/1/2014, B+ | | | 36,085 | | | | 58,646 | | | | (22,561 | ) |
6/21/2010 9/20/2013 | | | 1,230,000 | 1 | | | 5.0 | % | Ford Motor Co., 6.5%, 8/1/2018, B+ | | | 109,934 | | | | (37,769 | ) | | | 147,703 | |
6/21/2010 9/20/2013 | | | 380,000 | 3 | | | 5.0 | % | Ford Motor Co., 6.5%, 8/1/2018, B+ | | | 33,963 | | | | 4,657 | | | | 29,306 | |
6/21/2010 9/20/2015 | | | 175,000 | 4 | | | 5.0 | % | Ford Motor Co., 6.5%, 8/1/2018, B+ | | | 19,051 | | | | (16,625 | ) | | | 35,676 | |
6/21/2010 9/20/2015 | | | 320,000 | 5 | | | 5.0 | % | Ford Motor Co., 6.5%, 8/1/2018, B+ | | | 34,837 | | | | (27,750 | ) | | | 62,587 | |
6/21/2010 9/20/2015 | | | 100,000 | 1 | | | 5.0 | % | Ford Motor Co., 6.5%, 8/1/2018, B+ | | | 10,887 | | | | (6,896 | ) | | | 17,783 | |
6/21/2010 9/20/2015 | | | 560,000 | 6 | | | 5.0 | % | Ford Motor Co., 6.5%, 8/1/2018, B+ | | | 60,966 | | | | (9,982 | ) | | | 70,948 | |
6/20/2011 9/20/2016 | | | 575,000 | 6 | | | 5.0 | % | Ford Motor Co., 6.5%, 8/1/2018, B+ | | | 56,234 | | | | 55,435 | | | | 799 | |
3/21/2011 6/20/2016 | | | 1,085,000 | 2 | | | 5.0 | % | Ford Motor Credit Co., LLC, 7.25%, 10/25/2011, B+ | | | 124,793 | | | | 129,387 | | | | (4,594 | ) |
6/20/2011 9/20/2015 | | | 1,145,000 | 1 | | | 5.0 | % | HCA, Inc., 6.375%, 1/15/2015, B- | | | 63,040 | | | | 61,450 | | | | 1,590 | |
3/21/2011 6/20/2016 | | | 610,000 | 4 | | | 5.0 | % | HCA, Inc., 6.375%, 1/15/2015, B- | | | 28,871 | | | | 22,713 | | | | 6,158 | |
6/20/2011 9/20/2016 | | | 1,145,000 | 7 | | | 5.0 | % | International Lease Finance Corp., 8.25%, 12/15/2020, B+ | | | 39,329 | | | | 37,739 | | | | 1,590 | |
6/20/2011 9/20/2016 | | | 1,145,000 | 3 | | | 5.0 | % | Neiman Marcus Group, Inc., 7.12%, 06/01/2028, B | | | 53,643 | | | | 52,053 | | | | 1,590 | |
6/20/2011 9/20/2016 | | | 1,145,000 | 5 | | | 5.0 | % | Smithfield Foods, Inc., 7.75%, 7/1/2017, B- | | | 53,643 | | | | 52,053 | | | | 1,590 | |
| Total net unrealized appreciation | | | | 356,250 | |
(e) The maximum potential amount of future undiscounted payments that the Fund could be required to make under a credit default swap contract would be the notional amount of the contract. These potential amounts would be partially offset by any recovery values of the referenced debt obligation or net amounts received from the settlement of buy protection credit default swap contracts entered into by the Fund for the same referenced debt obligation.
(f) The quality ratings represent the lower of Moody's Investors Service, Inc. ("Moody's") or Standard & Poor's Corporation ("S&P") credit ratings.
Counterparties:
1 The Goldman Sachs & Co.
2 Barclays Bank PLC
3 Citigroup, Inc.
4 JPMorgan Chase Securities, Inc.
5 Credit Suisse
6 Bank of America
7 Morgan Stanley
At June 30, 2011, the Fund had the following open forward foreign currency exchange contracts:
| Contracts to Deliver | | In Exchange For | | Settlement Date | | Unrealized Appreciation ($) | | Counterparty |
| USD | | | 1,090,733 | | EUR | | | 755,734 | | 7/11/2011 | | | 4,848 | | JPMorgan Chase Securities, Inc. |
| USD | | | 47,861 | | EUR | | | 33,800 | | 7/11/2011 | | | 1,138 | | Citigroup, Inc. |
| Total unrealized appreciation | | | 5,986 | | |
| Contracts to Deliver | | In Exchange For | | Settlement Date | | Unrealized Depreciation ($) | | Counterparty |
| EUR | | | 3,100,100 | | USD | | | 4,464,532 | | 7/11/2011 | | | (29,656 | ) | Citigroup, Inc. |
| Currency Abbreviations |
EUR Euro USD United States Dollar |
For information on the Fund's policy and additional disclosures regarding credit default swap contracts and forward foreign currency exchange contracts, please refer to Note A in the accompanying Notes to Financial Statements.
Fair Value Measurements
Various inputs are used in determining the value of the Fund's investments. These inputs are summarized in three broad levels. Level 1 includes quoted prices in active markets for identical securities. Level 2 includes other significant observable inputs (including quoted prices for similar securities, interest rates, prepayment speeds, and credit risk). Level 3 includes significant unobservable inputs (including the Fund's own assumptions in determining the fair value of investments). The inputs or methodology used for valuing securities are not necessarily an indication of the risk associated with investing in those securities.
The following is a summary of the inputs used as of June 30, 2011 in valuing the Fund's investments. For information on the Fund's policy regarding the valuation of investments, please refer to the Security Valuation section of Note A in the accompanying Notes to Financial Statements.
| Assets | | Level 1 | | | Level 2 | | | Level 3 | | | Total | |
| | |
Fixed Income Investments (g) | | | | | | | | | | | | |
| Corporate Bonds | | $ | — | | | $ | 156,941,356 | | | $ | 2,773,863 | | | $ | 159,715,219 | |
| Loan Participations and Assignments | | | — | | | | 1,971,722 | | | | 0 | | | | 1,971,722 | |
| Convertible Bonds | | | — | | | | 671,944 | | | | — | | | | 671,944 | |
| Preferred Securities | | | — | | | | 959,075 | | | | — | | | | 959,075 | |
| Other Investments | | | — | | | | — | | | | 31,000 | | | | 31,000 | |
| Common Stocks (g) | | | 110,793 | | | | — | | | | 35,281 | | | | 146,074 | |
| Preferred Stock | | | 940,504 | | | | 413,545 | | | | — | | | | 1,354,049 | |
| Warrants (g) | | | — | | | | — | | | | 11,086 | | | | 11,086 | |
| Short-Term Investments | | | 5,138,221 | | | | — | | | | — | | | | 5,138,221 | |
| Derivatives (h) | | | — | | | | 389,391 | | | | — | | | | 389,391 | |
| Total | | $ | 6,189,518 | | | $ | 161,347,033 | | | $ | 2,851,230 | | | $ | 170,387,781 | |
| Liabilities | | | | | | | | | | | | | | | | |
| Derivatives (h) | | $ | — | | | $ | (56,811 | ) | | $ | — | | | $ | (56,811 | ) |
| Total | | $ | — | | | $ | (56,811 | ) | | $ | — | | | $ | (56,811 | ) |
There have been no transfers between Level 1 and Level 2 fair value measurements during the period ended June 30, 2011.
(g) See Investment Portfolio for additional detailed categorizations.
(h) Derivatives include unrealized appreciation (depreciation) on credit default swap contracts and forward foreign currency exchange contracts.
Level 3 Reconciliation
The following is a reconciliation of the Fund's Level 3 investments for which significant unobservable inputs were used in determining value:
| | | Corporate Bonds | | | Loan Participations and Assignments | | | Other Investments | | | Common Stocks | | | Warrants | | | Total | |
| Balance as of December 31, 2010 | | $ | 2,784,439 | | | $ | 0 | | | $ | 31,000 | | | $ | 23,288 | | | $ | 12,547 | | | $ | 2,851,274 | |
| Realized gains (loss) | | | (2,014,745 | ) | | | — | | | | — | | | | — | | | | — | | | | (2,014,745 | ) |
| Change in unrealized appreciation (depreciation) | | | 2,166,957 | | | | 0 | | | | 0 | | | | 5,767 | | | | (1,461 | ) | | | 2,171,263 | |
| Amortization premium/discount | | | 12,234 | | | | — | | | | — | | | | — | | | | — | | | | 12,234 | |
| Purchases | | | — | | | | — | | | | — | | | | 6,226 | | | | — | | | | 6,226 | |
| (Sales) | | | 0 | | | | — | | | | — | | | | — | | | | — | | | | 0 | |
| Transfers into Level 3 | | | — | | | | — | | | | — | | | | — | | | | — | | | | — | |
| Transfers (out) of Level 3 | | | (175,022 | ) (i) | | | — | | | | — | | | | — | | | | — | | | | (175,022 | ) |
| Balance as of June 30, 2011 | | $ | 2,773,863 | | | $ | 0 | | | $ | 31,000 | | | $ | 35,281 | | | $ | 11,086 | | | $ | 2,851,230 | |
| Net change in unrealized appreciation (depreciation) from investments still held as of June 30, 2011 | | $ | 153,566 | | | $ | 0 | | | $ | 0 | | | $ | 5,767 | | | $ | (1,461 | ) | | $ | 157,872 | |
Transfers between price levels are recognized at the beginning of the reporting period.
(i) The investment was transferred from Level 3 to Level 2 as a result of the availability of a pricing source supported by observable inputs.
The accompanying notes are an integral part of the financial statements.
Statement of Assets and Liabilities | as of June 30, 2011 (Unaudited) | |
| Assets | |
Investments: Investments in non-affiliated securities, at value (cost $167,832,470) — including $4,925,225 of securities loaned | | $ | 164,860,169 | |
| Investment in Daily Assets Fund Institutional (cost $5,138,221)* | | | 5,138,221 | |
| Total investments in securities, at value (cost $172,970,691) | | | 169,998,390 | |
| Foreign currency, at value (cost $70) | | | 71 | |
| Deposit from broker on swap contracts | | | 10,000 | |
| Receivable for investments sold | | | 2,190,757 | |
| Receivable for Fund shares sold | | | 47,763 | |
| Interest receivable | | | 3,231,678 | |
| Unrealized appreciation on swap contracts | | | 383,405 | |
| Unrealized appreciation on forward foreign currency exchange contracts | | | 5,986 | |
| Upfront payments paid on swap contracts | | | 508,810 | |
| Foreign taxes recoverable | | | 588 | |
| Other assets | | | 1,463 | |
| Total assets | | | 176,378,911 | |
| Liabilities | |
| Cash overdraft | | | 752,304 | |
| Payable upon return of securities loaned | | | 5,138,221 | |
| Line of credit loan payable | | | 650,000 | |
| Payable for Fund shares redeemed | | | 83,475 | |
| Payable upon return of deposit for swap contracts | | | 10,000 | |
| Net payable for open swap contracts | | | 265,889 | |
| Unrealized depreciation on swap contracts | | | 27,155 | |
| Unrealized depreciation on forward foreign currency exchange contracts | | | 29,656 | |
| Upfront payments received on swap contracts | | | 99,022 | |
| Accrued management fee | | | 72,776 | |
| Other accrued expenses and payables | | | 108,627 | |
| Total liabilities | | | 7,237,125 | |
| Net assets, at value | | $ | 169,141,786 | |
| Net Assets Consist of | |
| Undistributed net investment income | | | 7,008,620 | |
Net unrealized appreciation (depreciation) on: Investments | | | (2,972,301 | ) |
| Swap contracts | | | 356,250 | |
| Foreign currency | | | (21,987 | ) |
| Accumulated net realized gain (loss) | | | (52,334,737 | ) |
| Paid-in capital | | | 217,105,941 | |
| Net assets, at value | | $ | 169,141,786 | |
Class A Net Asset Value, offering and redemption price per share ($168,996,214 ÷ 25,708,819 outstanding shares of beneficial interest, no par value, unlimited number of shares authorized) | | $ | 6.57 | |
Class B Net Asset Value, offering and redemption price per share ($145,572 ÷ 22,021 outstanding shares of beneficial interest, no par value, unlimited number of shares authorized) | | $ | 6.61 | |
* Represents collateral of securities loaned.
The accompanying notes are an integral part of the financial statements.
Statement of Operations
| for the six months ended June 30, 2011 (Unaudited) | |
| Investment Income | |
| Interest (net of foreign taxes withheld of $545) | | $ | 8,066,103 | |
| Dividends | | | 20,954 | |
| Income distributions — Central Cash Management Fund | | | 4,059 | |
| Securities lending income, including income from Daily Assets Fund Institutional, net of borrower rebates | | | 8,578 | |
| Total income | | | 8,099,694 | |
Expenses: Management fee | | | 478,886 | |
| Administration fee | | | 95,777 | |
| Services to shareholders | | | 2,863 | |
| Distribution service fee (Class B) | | | 181 | |
| Custodian fee | | | 17,814 | |
| Audit and tax fees | | | 35,506 | |
| Legal fees | | | 7,094 | |
| Reports to shareholders | | | 19,574 | |
| Trustees' fees and expenses | | | 4,316 | |
| Interest expense | | | 2,987 | |
| Other | | | 20,312 | |
| Total expenses | | | 685,310 | |
| Net investment income (loss) | | | 7,414,384 | |
| Realized and Unrealized Gain (Loss) | |
Net realized gain (loss) from: Investments | | | 1,433,918 | |
| Swap contracts | | | 141,883 | |
| Foreign currency | | | (595,090 | ) |
| | | | 980,711 | |
Change in net unrealized appreciation (depreciation) on: Investments | | | (608,534 | ) |
| Swap contracts | | | (30,006 | ) |
| Foreign currency | | | 36,361 | |
| | | | (602,179 | ) |
| Net gain (loss) | | | 378,532 | |
| Net increase (decrease) in net assets resulting from operations | | $ | 7,792,916 | |
The accompanying notes are an integral part of the financial statements.
Statement of Changes in Net Assets | Increase (Decrease) in Net Assets | | Six Months Ended June 30, 2011 (Unaudited) | | | Year Ended December 31, 2010 | |
Operations: Net investment income | | $ | 7,414,384 | | | $ | 14,943,059 | |
| Net realized gain (loss) | | | 980,711 | | | | 2,920,800 | |
| Change in net unrealized appreciation (depreciation) | | | (602,179 | ) | | | 6,951,753 | |
| Net increase (decrease) in net assets resulting from operations | | | 7,792,916 | | | | 24,815,612 | |
Distributions to shareholders from: Net investment income: Class A | | | (16,387,608 | ) | | | (15,325,538 | ) |
| Class B | | | (11,864 | ) | | | (11,524 | ) |
| Total distributions | | | (16,399,472 | ) | | | (15,337,062 | ) |
Fund share transactions: Class A Proceeds from shares sold | | | 5,782,373 | | | | 73,550,670 | |
| Reinvestment of distributions | | | 16,387,608 | | | | 15,325,538 | |
| Payments for shares redeemed | | | (39,447,282 | ) | | | (100,347,223 | ) |
| Net increase (decrease) in net assets from Class A share transactions | | | (17,277,301 | ) | | | (11,471,015 | ) |
Class B Proceeds from shares sold | | | 8,880 | | | | 2,173 | |
| Reinvestment of distributions | | | 11,864 | | | | 11,524 | |
| Payments for shares redeemed | | | (13,027 | ) | | | (27,277 | ) |
| Net increase (decrease) in net assets from Class B share transactions | | | 7,717 | | | | (13,580 | ) |
| Increase (decrease) in net assets | | | (25,876,140 | ) | | | (2,006,045 | ) |
| Net assets at beginning of period | | | 195,017,926 | | | | 197,023,971 | |
| Net assets at end of period (including undistributed net investment income of $7,008,620 and $15,993,708, respectively) | | $ | 169,141,786 | | | $ | 195,017,926 | |
| Other Information | |
Class A Shares outstanding at beginning of period | | | 28,235,548 | | | | 30,057,940 | |
| Shares sold | | | 829,063 | | | | 11,151,687 | |
| Shares issued to shareholders in reinvestment of distributions | | | 2,479,215 | | | | 2,379,742 | |
| Shares redeemed | | | (5,835,007 | ) | | | (15,353,821 | ) |
| Net increase (decrease) in Class A shares | | | (2,526,729 | ) | | | (1,822,392 | ) |
| Shares outstanding at end of period | | | 25,708,819 | | | | 28,235,548 | |
Class B Shares outstanding at beginning of period | | | 20,802 | | | | 22,888 | |
| Shares sold | | | 1,265 | | | | 319 | |
| Shares issued to shareholders in reinvestment of distributions | | | 1,784 | | | | 1,778 | |
| Shares redeemed | | | (1,830 | ) | | | (4,183 | ) |
| Net increase (decrease) in Class B shares | | | 1,219 | | | | (2,086 | ) |
| Shares outstanding at end of period | | | 22,021 | | | | 20,802 | |
The accompanying notes are an integral part of the financial statements.
| | | | | Years Ended December 31, | |
| Class A | | Six Months Ended 6/30/11 (Unaudited) | 2010 | | 2009 | | | 2008 | | | 2007 | | | 2006 | |
| Selected Per Share Data | |
| Net asset value, beginning of period | | $ | 6.90 | | | $ | 6.55 | | | $ | 5.30 | | | $ | 7.81 | | | $ | 8.38 | | | $ | 8.23 | |
Income (loss) from investment operations: Net investment incomea | | | .27 | | | | .52 | | | | .51 | | | | .57 | | | | .63 | | | | .62 | |
| Net realized and unrealized gain (loss) | | | .01 | | | | .36 | | | | 1.40 | | | | (2.29 | ) | | | (.54 | ) | | | .19 | |
| Total from investment operations | | | .28 | | | | .88 | | | | 1.91 | | | | (1.72 | ) | | | .09 | | | | .81 | |
Less distributions from: Net investment income | | | (.61 | ) | | | (.53 | ) | | | (.66 | ) | | | (.79 | ) | | | (.66 | ) | | | (.66 | ) |
| Net asset value, end of period | | $ | 6.57 | | | $ | 6.90 | | | $ | 6.55 | | | $ | 5.30 | | | $ | 7.81 | | | $ | 8.38 | |
| Total Return (%) | | | 4.00 | ** | | | 14.00 | | | | 39.99 | | | | (23.94 | )b | | | .96 | | | | 10.47 | |
| Ratios to Average Net Assets and Supplemental Data | |
| Net assets, end of period ($ millions) | | | 169 | | | | 195 | | | | 197 | | | | 154 | | | | 248 | | | | 322 | |
| Ratio of expenses before expense reductions (%) | | | .72 | * | | | .72 | | | | .67 | | | | .80 | | | | .69 | | | | .71 | |
| Ratio of expenses after expense reductions (%) | | | .72 | * | | | .72 | | | | .67 | | | | .79 | | | | .69 | | | | .71 | |
| Ratio of net investment income (%) | | | 7.74 | * | | | 7.90 | | | | 8.81 | | | | 8.42 | | | | 7.84 | | | | 7.73 | |
| Portfolio turnover rate (%) | | | 38 | ** | | | 93 | | | | 66 | | | | 38 | | | | 61 | | | | 93 | |
a Based on average shares outstanding during the period. b Total return would have been lower had certain expenses not been reduced. * Annualized ** Not annualized | |
| | | | | Years Ended December 31, | |
| Class B | | Six Months Ended 6/30/11 (Unaudited) | 2010 | | 2009 | | | 2008 | | | 2007 | | | 2006 | |
| Selected Per Share Data | |
| Net asset value, beginning of period | | $ | 6.93 | | | $ | 6.58 | | | $ | 5.31 | | | $ | 7.81 | | | $ | 8.38 | | | $ | 8.22 | |
Income (loss) from investment operations: Net investment incomea | | | .26 | | | | .50 | | | | .49 | | | | .53 | | | | .60 | | | | .59 | |
| Net realized and unrealized gain (loss) | | | .01 | | | | .36 | | | | 1.42 | | | | (2.27 | ) | | | (.54 | ) | | | .20 | |
| Total from investment operations | | | .27 | | | | .86 | | | | 1.91 | | | | (1.74 | ) | | | .06 | | | | .79 | |
Less distributions from: Net investment income | | | (.59 | ) | | | (.51 | ) | | | (.64 | ) | | | (.76 | ) | | | (.63 | ) | | | (.63 | ) |
| Net asset value, end of period | | $ | 6.61 | | | $ | 6.93 | | | $ | 6.58 | | | $ | 5.31 | | | $ | 7.81 | | | $ | 8.38 | |
| Total Return (%) | | | 3.88 | ** | | | 13.64 | | | | 39.64 | | | | (24.13 | )b | | | .54 | | | | 10.11 | |
| Ratios to Average Net Assets and Supplemental Data | |
| Net assets, end of period ($ millions) | | | .1 | | | | .1 | | | | .2 | | | | .1 | | | | 10 | | | | 53 | |
| Ratio of expenses before expense reductions (%) | | | .98 | * | | | .99 | | | | .94 | | | | 1.25 | | | | 1.08 | | | | 1.10 | |
| Ratio of expenses after expense reductions (%) | | | .98 | * | | | .99 | | | | .94 | | | | 1.23 | | | | 1.08 | | | | 1.10 | |
| Ratio of net investment income (%) | | | 7.47 | * | | | 7.63 | | | | 8.54 | | | | 7.98 | | | | 7.45 | | | | 7.34 | |
| Portfolio turnover rate (%) | | | 38 | ** | | | 93 | | | | 66 | | | | 38 | | | | 61 | | | | 93 | |
a Based on average shares outstanding during the period. b Total return would have been lower had certain expenses not been reduced. * Annualized ** Not annualized | |
Notes to Financial Statements (Unaudited)
A. Organization and Significant Accounting Policies
DWS High Income VIP (the "Fund") is a diversified series of DWS Variable Series II (the "Trust"), which is registered under the Investment Company Act of 1940, as amended (the "1940 Act"), as an open-end management investment company organized as a Massachusetts business trust.
Multiple Classes of Shares of Beneficial Interest. The Fund offers two classes of shares (Class A shares and Class B shares). Sales of Class B shares are subject to Rule 12b-1 fees under the 1940 Act equal to an annual rate of 0.25% of the average daily net assets of the Class B shares of the Fund. Class A shares are not subject to such fees.
Investment income, realized and unrealized gains and losses, and certain fund-level expenses and expense reductions, if any, are borne pro rata on the basis of relative net assets by the holders of all classes of shares except that each class bears certain expenses unique to that class (including the applicable Rule 12b-1 fee and recordkeeping fees). Differences in class-level expenses may result in payment of different per share dividends by class. All shares have equal rights with respect to voting subject to class-specific arrangements.
The Fund's financial statements are prepared in accordance with accounting principles generally accepted in the United States of America which require the use of management estimates. Actual results could differ from those estimates. The policies described below are followed consistently by the Fund in the preparation of its financial statements.
Security Valuation. Investments are stated at value determined as of the close of regular trading on the New York Stock Exchange on each day the exchange is open for trading.
Various inputs are used in determining the value of the Fund's investments. These inputs are summarized in three broad levels. Level 1 includes quoted prices in active markets for identical securities. Level 2 includes other significant observable inputs (including quoted prices for similar securities, interest rates, prepayment speeds, and credit risk). Level 3 includes significant unobservable inputs (including the Fund's own assumptions in determining the fair value of investments). The inputs or methodology used for valuing securities are not necessarily an indication of the risk associated with investing in those securities.
Equity securities are valued at the most recent sale price or official closing price reported on the exchange (US or foreign) or over-the-counter market on which they trade and are categorized as Level 1 securities. Securities for which no sales are reported are valued at the calculated mean between the most recent bid and asked quotations on the relevant market or, if a mean cannot be determined, at the most recent bid quotation.
Debt securities and senior loans are valued by independent pricing services approved by the Fund's Board. If the pricing services are unable to provide valuations, securities are valued at the most recent bid quotation or evaluated price, as applicable, obtained from one or more broker-dealers. Such services may use various pricing techniques which take into account appropriate factors such as yield, quality, coupon rate, maturity, type of issue, trading characteristics and other data, as well as broker quotes. These securities are generally categorized as Level 2.
Money market instruments purchased with an original or remaining maturity of sixty days or less, maturing at par, are valued at amortized cost, which approximates value, and are categorized as Level 2. Investments in open-end investment companies are valued at their net asset value each business day and are categorized as Level 1.
Forward currency contracts are valued at the prevailing forward exchange rate of the underlying currencies and are categorized as Level 2.
Swap contracts are valued daily based upon prices supplied by a Board approved pricing vendor, if available, and otherwise are valued at the price provided by the broker-dealer. Swap contracts are generally categorized as Level 2.
Securities and other assets for which market quotations are not readily available or for which the above valuation procedures are deemed not to reflect fair value are valued in a manner that is intended to reflect their fair value as determined in accordance with procedures approved by the Board and are generally categorized as Level 3. In accordance with the Fund's valuation procedures, factors used in determining value may include, but are not limited to, the type of the security; the size of the holding; the initial cost of the security; the existence of any contractual restrictions on the security's disposition; the price and extent of public trading in similar securities of the issuer or of comparable companies; quotations or evaluated prices from broker-dealers and/or pricing services; information obtained from the issuer, analysts, and/or the appropriate stock exchange (for exchange-traded securities); an analysis of the company's or issuer's financial statements; an evaluation of the forces that influence the issuer and the market(s) in which the security is purchased and sold and with respect to debt securities; the maturity, coupon, creditworthiness, currency denomination and the movement of the market in which the security is normally traded. The value determined under these procedures may differ from published values for the same securities.
Disclosure about the classification of fair value measurements is included in a table following the Fund's Investment Portfolio.
Foreign Currency Translations. The books and records of the Fund are maintained in US dollars. Investment securities and other assets and liabilities denominated in a foreign currency are translated into US dollars at the prevailing exchange rates at period end. Purchases and sales of investment securities, income and expenses are translated into US dollars at the prevailing exchange rates on the respective dates of the transactions.
Net realized and unrealized gains and losses on foreign currency transactions represent net gains and losses between trade and settlement dates on securities transactions, the acquisition and disposition of foreign currencies, and the difference between the amount of net investment income accrued and the US dollar amount actually received. That portion of both realized and unrealized gains and losses on investments that results from fluctuations in foreign currency exchange rates is not separately disclosed but is included with net realized and unrealized gain/appreciation and loss/depreciation on investments.
Securities Lending. The Fund lends securities to certain financial institutions. The Fund retains beneficial ownership of the securities it has loaned and continues to receive interest and dividends paid by the issuer of securities and to participate in any changes in their market value. The Fund requires the borrowers of the securities to maintain collateral with the Fund consisting of either cash or liquid, unencumbered assets having a value at least equal to the value of the securities loaned. When the collateral falls below specified amounts, the lending agent will use its best effort to obtain additional collateral on the next business day to meet required amounts under the security lending agreement. The Fund may invest the cash collateral into a joint trading account in an affiliated money market fund pursuant to Exemptive Orders issued by the SEC. The Fund receives compensation for lending its securities either in the form of fees or by earning interest on invested cash collateral net of borrower rebates and fees paid to a lending agent. Either the Fund or the borrower may terminate the loan. There may be risks of delay and costs in recovery of securities or even loss of rights in the collateral should the borrower of the securities fail financially. The Fund is also subject to all investment risks associated with the reinvestment of any cash collateral received, including, but not limited to, interest rate, credit and liquidity risk associated with such investments.
Loan Participations and Assignments. Senior loans are portions of loans originated by banks and sold in pieces to investors. These US dollar-denominated fixed and floating rate loans ("Loans") in which the Fund invests are arranged through private negotiations between the borrower and one or more financial institutions ("Lenders"). The Fund invests in such Loans in the form of participations in Loans ("Participations") or assignments of all or a portion of loans from third parties ("Assignments"). Participations typically result in the Fund having a contractual relationship only with the Lender, not with the borrower. The Fund has the right to receive payments of principal, interest and any fees to which it is entitled from the Lender selling the Participation and only upon receipt by the Lender of the payments from the borrower. In connection with purchasing Participations, the Fund generally has no right to enforce compliance by the borrower with the terms of the loan agreement relating to the Loan, nor any rights of set-off against the borrower, and the Fund will not benefit directly from any collateral supporting the Loan in which it has purchased the Participation. As a result, the Fund assumes the credit risk of both the borrower and the Lender that is selling the Participation. Assignments typically result in the Fund having a direct contractual relationship with the borrower, and the Fund may enforce compliance by the borrower with the terms of the loan agreement. All senior loans involve interest rate risk, liquidity risk and credit risk, including the potential default or insolvency of the borrower.
When-Issued/Delayed Delivery Securities. The Fund may purchase or sell securities with delivery or payment to occur at a later date beyond the normal settlement period. At the time the Fund enters into a commitment to purchase or sell a security, the transaction is recorded and the value of the transaction is reflected in the net asset value. The price of such security and the date when the security will be delivered and paid for are fixed at the time the transaction is negotiated. The value of the security may vary with market fluctuations. At the time the Fund enters into a purchase transaction it is required to segregate cash or other liquid assets at least equal to the amount of the commitment.
Certain risks may arise upon entering into when-issued or delayed delivery transactions from the potential inability of counterparties to meet the terms of their contracts or if the issuer does not issue the securities due to political, economic, or other factors. Additionally, losses may arise due to changes in the value of the underlying securities.
Federal Income Taxes. The Fund's policy is to comply with the requirements of the Internal Revenue Code, as amended, which are applicable to regulated investment companies and to distribute all of its taxable income to its shareholders.
At December 31, 2010, the Fund had a net tax basis capital loss carryforward of approximately $53,111,000, which may be applied against any realized net taxable capital gains of each succeeding year until fully utilized or until December 31, 2011 ($13,877,000), December 31, 2014 ($3,844,000), December 31, 2015 ($858,000), December 31, 2016 ($17,300,000) and December 31, 2017 ($17,232,000), the respective expiration dates, whichever occurs first.
In addition, from November 1, 2010 through December 31, 2010, the Fund incurred $185,000 of net realized capital losses. As permitted by tax regulations, the Fund intends to elect to defer these losses and treat them as arising in the fiscal year ended December 31, 2011.
On December 22, 2010, the Regulated Investment Company Modernization Act of 2010 (the "Act") was enacted. Under the Act, net capital losses may be carried forward indefinitely, and their character is retained as short-term and/or long-term losses. Previously, net capital losses were carried forward for eight years and treated as short-term losses. As a transition rule, the Act requires that post-enactment net capital losses be used before pre-enactment net capital losses. As a result of this ordering rule, pre-enactment capital loss carryforwards may expire unused, whereas under the previous rules these losses may have been utilized. This change is effective for fiscal years beginning after the date of enactment.
The Fund has reviewed the tax positions for the open tax years as of December 31, 2010 and has determined that no provision for income tax is required in the Fund's financial statements. The Fund's federal tax returns for the prior three fiscal years remain open subject to examination by the Internal Revenue Service.
Distribution of Income and Gains. Distributions of net investment income of the Fund, if any, are made annually. Net realized gains from investment transactions, in excess of available capital loss carryforwards, would be taxable to the Fund if not distributed and, therefore, will be distributed to shareholders at least annually. The Fund may also make additional distributions for tax purposes if necessary.
The timing and characterization of certain income and capital gains distributions are determined annually in accordance with federal tax regulations which may differ from accounting principles generally accepted in the United States of America. These differences primarily relate to investments in foreign denominated investments, investments in forward currency contracts, investments in swap contracts and certain securities sold at a loss. As a result, net investment income (loss) and net realized gain (loss) on investment transactions for a reporting period may differ significantly from distributions during such period. Accordingly, the Fund may periodically make reclassifications among certain of its capital accounts without impacting the net asset value of the Fund.
The tax character of current year distributions will be determined at the end of the current fiscal year.
Expenses. Expenses of the Trust arising in connection with a specific fund are allocated to that fund. Other Trust expenses which cannot be directly attributed to a fund are apportioned among the funds in the Trust.
Contingencies. In the normal course of business, the Fund may enter into contracts with service providers that contain general indemnification clauses. The Fund's maximum exposure under these arrangements is unknown as this would involve future claims that may be made against the Fund that have not yet been made. However, based on experience, the Fund expects the risk of loss to be remote.
Other. Investment transactions are accounted for on a trade date plus one basis for daily net asset value calculations. However, for financial reporting purposes, investment transactions are reported on trade date. Interest income is recorded on the accrual basis. Realized gains and losses from investment transactions are recorded on an identified cost basis and may include proceeds from litigation. All discounts and premiums are accreted/amortized for both tax and financial reporting purposes for the Fund, with the exception of securities in default of principal.
B. Derivative Instruments
Credit Default Swap Contracts. A credit default swap is a contract between a buyer and a seller of protection against pre-defined credit events for the reference entity. For the six months ended June 30, 2011, the Fund bought or sold credit default swap contracts to gain exposure to an underlying issuer's credit quality characteristics without directly investing in that issuer, or to hedge the risk of default on Fund securities. As a seller in the credit default swap contract, the Fund is required to pay the par (or other agreed-upon) value of the referenced entity to the counterparty with the occurrence of a credit event by a third party, such as a US or foreign corporate issuer, on the reference entity, which would likely result in a loss to the Fund. In return, the Fund receives from the counterparty a periodic stream of payments over the term of the contract provided that no credit event has occurred. If no credit event occurs, the Fund keeps the stream of payments with no payment obligations. The Fund may also buy credit default swap contracts in order to hedge against the risk of a credit event on debt securities, in which case the Fund functions as the counterparty referenced above. This involves the risk that the contract may expire worthless. It also involves counterparty risk that the seller may fail to satisfy its payment obligations to the Fund with the occurrence of a credit event. When the Fund sells a credit default swap contract it will cover its commitment. This may be achieved by, among other methods, maintaining cash or liquid assets equal to the aggregate notional value of the reference entities for all outstanding credit default swap contracts sold by the Fund.
The value of the credit default swap is adjusted daily and the change in value, if any, is recorded daily as unrealized appreciation or depreciation in the Statement of Assets and Liabilities. An upfront payment, if any, made by the Fund is recorded as an asset in the Statement of Assets and Liabilities. An upfront payment, if any, received by the Fund is recorded as a liability in the Statement of Assets and Liabilities. Under the terms of the credit default swap contracts, the Fund receives or makes quarterly payments based on a specified interest rate on a fixed notional amount. These payments are recorded as a realized gain or loss in the Statement of Operations. Payments received or made as a result of a credit event or termination of the contract are recognized, net of a proportional amount of the upfront payment, as realized gains or losses in the Statement of Operations.
A summary of the open credit default swap contracts as of June 30, 2011 is included in a table following the Fund's Investment Portfolio. For the six months ended June 30, 2011, the Fund's investment in credit default swap contracts purchased had a total notional value generally indicative of a range from $0 to $280,000, and the investment in credit default swap contracts sold had a total notional value generally indicative of a range from approximately $2,765,000 to $10,765,000.
Forward Foreign Currency Exchange Contracts. A forward foreign currency exchange contract ("forward currency contract") is a commitment to purchase or sell a foreign currency at the settlement date at a negotiated rate. For the six months ended June 30, 2011, the Fund entered into forward currency contracts in order to hedge its exposure to changes in foreign currency exchange rates on its foreign currency denominated portfolio holdings and to facilitate transactions in foreign currency denominated securities.
Forward currency contracts are valued at the prevailing forward exchange rate of the underlying currencies and unrealized gain (loss) is recorded daily. On the settlement date of the forward currency contract, the Fund records a realized gain or loss equal to the difference between the value of the contract at the time it was opened and the value of the contract at the time it was closed. Certain risks may arise upon entering into forward currency contracts from the potential inability of counterparties to meet the terms of their contracts. The maximum counterparty credit risk to the Fund is measured by the unrealized gain on appreciated contracts. Additionally, when utilizing forward currency contracts to hedge, the Fund gives up the opportunity to profit from favorable exchange rate movements during the term of the contract.
A summary of the open forward currency contracts as of June 30, 2011 is included in a table following the Fund's Investment Portfolio. For the six months ended June 30, 2011, the Fund's investment in forward currency contracts short vs. US dollars had a total contract value generally indicative of a range from approximately $4,465,000 to $7,198,000. The Fund's investment in forward currency contracts long vs. US dollars had a total contract value generally indicative of a range from $0 to approximately $1,139,000.
The following tables summarize the value of the Fund's derivative instruments held as of June 30, 2011 and the related location in the accompanying Statement of Assets and Liabilities, presented by primary underlying risk exposure:
| Asset Derivatives | | Forward Contracts | | | Swap Contracts | | | Total | |
| Credit Contracts (a) | | $ | — | | | $ | 383,405 | | | $ | 383,405 | |
| Foreign Exchange Contracts (b) | | | 5,986 | | | | — | | | | 5,986 | |
| | | $ | 5,986 | | | $ | 383,405 | | | $ | 389,391 | |
Each of the above derivatives is located in the following Statement of Assets and Liabilities accounts:
(a) Unrealized appreciation on swap contracts
(b) Unrealized appreciation on forward foreign currency exchange contracts
| Liability Derivatives | | Forward Contracts | | | Swap Contracts | | | Total | |
| Credit Contracts (a) | | $ | — | | | $ | (27,155 | ) | | $ | (27,155 | ) |
| Foreign Exchange Contracts (b) | | | (29,656 | ) | | | — | | | | (29,656 | ) |
| | | $ | (29,656 | ) | | $ | (27,155 | ) | | $ | (56,811 | ) |
Each of the above derivatives is located in the following Statement of Assets and Liabilities accounts:
(a) Unrealized depreciation on swap contracts
(b) Unrealized depreciation on forward foreign currency exchange contracts
Additionally, the amount of unrealized and realized gains and losses on derivative instruments recognized in Fund earnings during the six months ended June 30, 2011 and the related location in the accompanying Statement of Operations is summarized in the following tables by primary underlying risk exposure:
| Realized Gain (Loss) | | Forward Contracts | | | Swap Contracts | | | Total | |
| Credit Contracts (a) | | $ | — | | | $ | 141,883 | | | $ | 141,883 | |
| Foreign Exchange Contracts (b) | | | (581,356 | ) | | | — | | | | (581,356 | ) |
| | | $ | (581,356 | ) | | $ | 141,883 | | | $ | (439,473 | ) |
Each of the above derivatives is located in the following Statement of Operations accounts:
(a) Net realized gain (loss) from swap contracts
(b) Net realized gain (loss) from foreign currency (Statement of Operations includes both forward currency contracts and foreign currency transactions)
| Change in Net Unrealized Appreciation (Depreciation) | | Forward Contracts | | | Swap Contracts | | | Total | |
| Credit Contracts (a) | | $ | — | | | $ | (30,006 | ) | | $ | (30,006 | ) |
| Foreign Exchange Contracts (b) | | | 34,761 | | | | — | | | | 34,761 | |
| | | $ | 34,761 | | | $ | (30,006 | ) | | $ | 4,755 | |
Each of the above derivatives is located in the following Statement of Operations accounts:
(a) Change in net unrealized appreciation (depreciation) on swap contracts
(b) Change in net unrealized appreciation (depreciation) on foreign currency (Statement of Operations includes both forward currency contracts and foreign currency transactions)
C. Purchases and Sales of Securities
During the six months ended June 30, 2011, purchases and sales of investment transactions (excluding short-term investments) aggregated $69,260,296 and $82,300,868, respectively.
D. Related Parties
Management Agreement. Under the Investment Management Agreement with Deutsche Investment Management Americas Inc. ("DIMA" or the "Advisor"), an indirect, wholly owned subsidiary of Deutsche Bank AG, the Advisor directs the investments of the Fund in accordance with its investment objectives, policies and restrictions. The Advisor determines the securities, instruments and other contracts relating to investments to be purchased, sold or entered into by the Fund.
Pursuant to the Investment Management Agreement with the Advisor, the Fund pays a monthly management fee based on the Fund's average daily net assets, computed and accrued daily and payable monthly, at the following annual rates:
| $0-$250 million | | | .500 | % |
| next $750 million | | | .470 | % |
| next $1.5 billion | | | .450 | % |
| next $2.5 billion | | | .430 | % |
| next $2.5 billion | | | .400 | % |
| next $2.5 billion | | | .380 | % |
| next $2.5 billion | | | .360 | % |
| over $12.5 billion | | | .340 | % |
Accordingly, for the six months ended June 30, 2011, the fee pursuant to the Investment Management Agreement was equivalent to an annualized effective rate of 0.50% of the Fund's average daily net assets.
Administration Fee. Pursuant to an Administrative Services Agreement, DIMA provides most administrative services to the Fund. For all services provided under the Administrative Services Agreement, the Fund pays DIMA an annual fee ("Administration Fee") of 0.10% of the Fund's average daily net assets, computed and accrued daily and payable monthly. For the six months ended June 30, 2011, the Administration Fee was $95,777, of which $14,664 is unpaid.
Service Provider Fees. DWS Investments Service Company ("DISC"), an affiliate of the Advisor, is the transfer agent, dividend-paying agent and shareholder service agent for the Fund. Pursuant to a sub-transfer agency agreement between DISC and DST Systems, Inc. ("DST"), DISC has delegated certain transfer agent, dividend-paying agent and shareholder service agent functions to DST. DISC compensates DST out of the shareholder servicing fee it receives from the Fund. For the six months ended June 30, 2011, the amounts charged to the Fund by DISC were as follows:
| Services to Shareholders | | Total Aggregated | | | Unpaid at June 30, 2011 | |
| Class A | | $ | 135 | | | $ | 97 | |
| Class B | | | 13 | | | | 6 | |
| | | $ | 148 | | | $ | 103 | |
Distribution Service Agreement. Under the Fund's Class B 12b-1 plans, DWS Investments Distributors, Inc. ("DIDI") received a fee ("Distribution Service Fee") of 0.25% of average daily net assets of Class B shares. For the six months ended June 30, 2011, the Distribution Service Fee aggregated $181, of which $30 is unpaid.
Typesetting and Filing Service Fees. Under an agreement with DIMA, DIMA is compensated for providing typesetting and certain regulatory filing services to the Fund. For the six months ended June 30, 2011, the amount charged to the Fund by DIMA included in the Statement of Operations under "reports to shareholders" aggregated $7,110, of which $370 is unpaid.
Trustees' Fees and Expenses. The Fund paid each Trustee not affiliated with the Advisor retainer fees plus specified amounts for various committee services and for the Board Chairperson.
Affiliated Cash Management Vehicle. The Fund may invest uninvested cash balances in Central Cash Management Fund, which is managed by the Advisor. The Fund indirectly bears its proportionate share of the expenses of Central Cash Management Fund. Central Cash Management Fund does not pay the Advisor an investment management fee. Central Cash Management Fund seeks a high level of current income consistent with liquidity and the preservation of capital.
E. Investing in High-Yield Securities
The Fund's performance could be hurt if a security declines in credit quality or goes into default, or if an issuer does not make timely payments of interest or principal. Because the issuers of high-yield debt securities or junk bonds (debt securities rated below the fourth-highest category) may be in uncertain financial health, the prices of their debt securities can be more vulnerable to bad economic news, or even the expectation of bad news, than investment-grade debt securities. Because the Fund may invest in securities not paying current interest or in securities already in default, these risks may be more pronounced.
F. Ownership of the Fund
At June 30, 2011, three Participating Insurance Companies were owners of record of 10% or more of the total outstanding Class A shares of the Fund, each owning 32%, 31% and 30%. One Participating Insurance Company was the owner of record of 10% or more of the total outstanding Class B shares of the Fund, owning 100%.
G. Line of Credit
The Fund and other affiliated funds (the "Participants") share in a $450 million revolving credit facility provided by a syndication of banks. The Fund may borrow for temporary or emergency purposes, including the meeting of redemption requests that otherwise might require the untimely disposition of securities. The Participants are charged an annual commitment fee which is allocated based on net assets, among each of the Participants. Interest is calculated at a rate per annum equal to the sum of the Federal Funds Rate plus 1.25 percent plus if LIBOR exceeds the Federal Funds Rate the amount of such excess. The Fund may borrow up to a maximum of 33 percent of its net assets under the agreement.
At June 30, 2011, the Fund had a $650,000 outstanding loan. Interest expense incurred on the borrowings was $2,987 for the six months ended June 30, 2011. The average dollar amount of the borrowings was $1,898,718, the weighted average interest rate on these borrowings was 1.45% and the Fund had a loan outstanding for thirty-nine days throughout the period. The borrowings were valued at cost, which approximates fair value.
The Trust's policies and procedures for voting proxies for portfolio securities and information about how the Trust voted proxies related to its portfolio securities during the 12-month period ended June 30 are available on our Web site — www.dws-investments.com (click on "proxy voting" at the bottom of the page) — or on the SEC's Web site — www.sec.gov. To obtain a written copy of the Trust's policies and procedures without charge, upon request, call us toll free at (800) 728-3337.
Summary of Management Fee Evaluation by Independent Fee Consultant
October 3, 2010
Pursuant to an Order entered into by Deutsche Investment Management Americas and affiliates (collectively, "DeAM") with the Attorney General of New York, I, Thomas H. Mack, have been appointed the Independent Fee Consultant for the DWS Funds (formerly the DWS Scudder Funds). My duties include preparing an annual written evaluation of the management fees DeAM charges the Funds, considering among other factors the management fees charged by other mutual fund companies for like services, management fees DeAM charges other clients for like services, DeAM's costs of supplying services under the management agreements and related profit margins, possible economies of scale if a Fund grows larger, and the nature and quality of DeAM's services, including fund performance. This report summarizes my evaluation for 2010, including my qualifications, the evaluation process for each of the DWS Funds, consideration of certain complex-level factors, and my conclusions. I served in substantially the same capacity in 2007, 2008, and 2009.
Qualifications
For more than 35 years I have served in various professional capacities within the investment management business. I have held investment analysis and advisory positions, including securities analyst, portfolio strategist and director of investment policy with a large investment firm. I have also performed business management functions, including business development, financial management and marketing research and analysis.
Since 1991, I have been an independent consultant within the asset management industry. I have provided services to over 125 client organizations, including investment managers, mutual fund boards, product distributors and related organizations. Over the past ten years I have completed a number of assignments for mutual fund boards, specifically including assisting boards with management contract renewal.
I hold a Master of Business Administration degree, with highest honors, from Harvard University and Master of Science and Bachelor of Science (highest honors) degrees from the University of California at Berkeley. I am an independent director and audit committee financial expert for two closed-end mutual funds and have served in various leadership and financial oversight capacities with non-profit organizations.
Evaluation of Fees for each DWS Fund
My work focused primarily on evaluating, fund-by-fund, the fees charged to each of the 118 publicly offered Fund portfolios in the DWS Fund family. For each Fund, I considered each of the key factors mentioned above, as well as any other relevant information. In doing so I worked closely with the Funds' Independent Directors in their annual contract renewal process, as well as in their approval of contracts for several new funds (documented separately).
In evaluating each Fund's fees, I reviewed comprehensive materials provided by or on behalf of DeAM, including expense information prepared by Lipper Analytical, comparative performance information, profitability data, manager histories, and other materials. I also accessed certain additional information from the Lipper and Morningstar databases and drew on my industry knowledge and experience.
To facilitate evaluating this considerable body of information, I prepared for each Fund a document summarizing the key data elements in each area as well as additional analytics discussed below. This made it possible to consider each key data element in the context of the others.
In the course of contract renewal, DeAM agreed to implement a number of fee and expense adjustments requested by the Independent Directors which will favorably impact future fees and expenses, and my evaluation includes the effects of these changes.
Fees and Expenses Compared with Other Funds
The competitive fee and expense evaluation for each fund focused on two primary comparisons:
The Fund's contractual management fee (the advisory fee plus the administration fee where applicable) compared with those of a group of typically 12-15 funds in the same Lipper investment category (e.g. Large Capitalization Growth) having similar distribution arrangements and being of similar size.
The Fund's total expenses compared with a broader universe of funds from the same Lipper investment category and having similar distribution arrangements.
These two comparisons provide a view of not only the level of the fee compared with funds of similar scale but also the total expense the Fund bears for all the services it receives, in comparison with the investment choices available in the Fund's investment category and distribution channel. The principal figure-of-merit used in these comparisons was the subject Fund's percentile ranking against peers.
DeAM's Fees for Similar Services to Others
DeAM provided management fee schedules for all of its US domiciled fund and non-fund investment management accounts in any of the investment categories where there is a DWS Fund. These similar products included the other DWS Funds, non-fund pooled accounts, institutional accounts and sub-advisory accounts. Using this information, I calculated for each Fund the fee that would be charged to each similar product, at the subject Fund's asset level.
Evaluating information regarding non-fund products is difficult because there are varying levels of services required for different types of accounts, with mutual funds generally requiring considerably more regulatory and administrative types of service as well as having more frequent cash flows than other types of accounts. Also, while mutual fund fees for similar fund products can be expected to be similar, there will be some differences due to different pricing conditions in different distribution channels (e.g. retail funds versus those used in variable insurance products), differences in underlying investment processes and other factors.
Costs and Profit Margins
DeAM provided a detailed profitability analysis for each Fund. After making some adjustments so that the presentation would be more comparable to the available industry figures, I reviewed profit margins from investment management alone, from investment management plus other fund services (excluding distribution) provided to the Funds by DeAM (principally shareholder services), and DeAM profits from all sources, including distribution. A later section comments on overall profitability.
Economies of Scale
Economies of scale — an expected decline in management cost per dollar of fund assets as fund assets grow — are very rarely quantified and documented because of inherent difficulties in collecting and analyzing relevant data. However, in virtually every investment category that I reviewed, larger funds tend to have lower fees and lower total expenses than smaller funds. To see how each DWS Fund compares with this industry observation, I reviewed:
The trend in Fund assets over the last five years and the accompanying trend in total expenses. This shows if the Fund has grown and, if so, whether total expense (management fees as well as other expenses) have declined as a percent of assets.
Whether the Fund has break-points in its management fee schedule, the extent of the fee reduction built into the schedule and the asset levels where the breaks take effect, and in the case of a sub-advised Fund how the Fund's break-points compare with those of the sub-advisory fee schedule.
How the Fund's contractual fee schedule compares with trends in the industry data. To accomplish this, I constructed a chart showing how actual latest-fiscal-year contractual fees of the Fund and of other similar funds relate to average fund assets, with the subject Fund's contractual fee schedule superimposed.
Quality of Service — Performance
The quality-of-service evaluation focused on investment performance, which is the principal result of the investment management service. Each Fund's performance was reviewed over the past 1, 3, 5 and 10 years, as applicable, and compared with that of other funds in the same investment category and with a suitable market index.
In addition, I calculated and reviewed risk-adjusted returns relative to an index of similar mutual funds' returns and a suitable market index. The risk-adjusted returns analysis provides a way of determining the extent to which the Fund's return comparisons are mainly the product of investment value-added (or lack thereof) or alternatively taking considerably more or less risk than is typical in its investment category.
I also received and considered the history of portfolio manager changes for each Fund, as this provided an important context for evaluating the performance results.
Complex-Level Considerations
While this evaluation was conducted mainly at the individual fund level, there are some issues relating to the reasonableness of fees that can alternatively be considered across the whole fund complex:
I reviewed DeAM's profitability analysis for all DWS Funds, with a view toward determining if the allocation procedures used were reasonable and how profit levels compared with public data for other investment managers.
I considered whether DeAM and affiliates receive any significant ancillary or "fall-out" benefits that should be considered in interpreting the direct profitability results. These would be situations where serving as the investment manager of the Funds is beneficial to another part of the Deutsche Bank organization.
I considered how aggregated DWS Fund expenses had varied over the years, by asset class and in the context of trends in asset levels.
I reviewed the structure of the DeAM organization, trends in staffing levels, and information on compensation of investment management and other professionals compared with industry data.
Findings
Based on the process and analysis discussed above, which included reviewing a wide range of information from management and external data sources and considering among other factors the fees DeAM charges other clients, the fees charged by other fund managers, DeAM's costs and profits associated with managing the Funds, economies of scale, possible fall-out benefits, and the nature and quality of services provided, in my opinion the management fees charged the DWS Funds are reasonable.
Thomas H. Mack
DWS Investments Distributors, Inc.
222 South Riverside Plaza
Chicago, IL 60606
(800) 621-1148
VS2HI-3 (R-023297-1 8/11)
JUNE 30, 2011
SEMIANNUAL REPORT
DWS VARIABLE SERIES II
DWS Large Cap Value VIP
Contents
3 Performance Summary 4 Information About Your Fund's Expenses 5 Portfolio Summary 7 Investment Portfolio 10 Statement of Assets and Liabilities 11 Statement of Operations 12 Statement of Changes in Net Assets 13 Financial Highlights 15 Notes to Financial Statements 19 Proxy Voting 20 Summary of Management Fee Evaluation by Independent Fee Consultant |
This report must be preceded or accompanied by a prospectus. To obtain an additional prospectus or summary prospectus, if available, call (800) 728-3337 or your financial representative. We advise you to consider the Fund's objectives, risks, charges and expenses carefully before investing. The summary prospectus and prospectus contain this and other important information about the Fund. Please read the prospectus carefully before you invest.
Stocks may decline in value. See the prospectus for details.
DWS Investments is part of Deutsche Bank's Asset Management division and, within the US, represents the retail asset management activities of Deutsche Bank AG, Deutsche Bank Trust Company Americas, Deutsche Investment Management Americas Inc. and DWS Trust Company.
NOT FDIC/NCUA INSURED NO BANK GUARANTEE MAY LOSE VALUE NOT A DEPOSIT
NOT INSURED BY ANY FEDERAL GOVERNMENT AGENCY
Performance Summary June 30, 2011
Fund performance shown is historical, assumes reinvestment of all dividend and capital gain distributions and does not guarantee future results. Investment return and principal value fluctuate with changing market conditions so that, when redeemed, shares may be worth more or less than their original cost. Current performance may be lower or higher than the performance data quoted. Please contact your participating insurance company for the Fund's most recent month-end performance. Performance doesn't reflect charges and fees ("contract charges") associated with the separate account that invests in the Fund or any variable life insurance policy or variable annuity contract for which the Fund is an investment option. These charges and fees will reduce returns. While all share classes have the same underlying portfolio, their performance will differ.
The gross expense ratios of the Fund, as stated in the fee table of the prospectus dated May 1, 2011 are 0.82% and 1.11% for Class A and Class B shares, respectively, and may differ from the expense ratios disclosed in the Financial Highlights tables in this report.
| Growth of an Assumed $10,000 Investment in DWS Large Cap Value VIP |
[] DWS Large Cap Value VIP — Class A [] Russell 1000® Value Index | The Russell 1000® Value Index is an unmanaged index that consists of those stocks in the Russell 1000 Index with less-than-average growth orientation. Russell 1000® Index is an unmanaged price-only index of the 1,000 largest capitalized companies that are domiciled in the US and whose common stocks are traded. Index returns do not reflect any fees or expenses and it is not possible to invest directly into an index. |
| |
| Yearly periods ended June 30 | |
| Comparative Results | |
| DWS Large Cap Value VIP | 6-Month‡ | | | 1-Year | | | 3-Year | | | 5-Year | | | 10-Year | |
| Class A | Growth of $10,000 | $ | 10,650 | | | $ | 12,720 | | | $ | 9,736 | | | $ | 11,822 | | | $ | 15,336 | |
| Average annual total return | | 6.50 | % | | | 27.20 | % | | | -0.89 | % | | | 3.40 | % | | | 4.37 | % |
| Russell 1000 Value Index | Growth of $10,000 | $ | 10,592 | | | $ | 12,894 | | | $ | 10,699 | | | $ | 10,590 | | | $ | 14,781 | |
| Average annual total return | | 5.92 | % | | | 28.94 | % | | | 2.28 | % | | | 1.15 | % | | | 3.99 | % |
| DWS Large Cap Value VIP | 6-Month‡ | | | 1-Year | | | 3-Year | | | 5-Year | | | Life of Class* | |
| Class B | Growth of $10,000 | $ | 10,636 | | | $ | 12,688 | | | $ | 9,648 | | | $ | 11,620 | | | $ | 15,608 | |
| Average annual total return | | 6.36 | % | | | 26.88 | % | | | -1.19 | % | | | 3.05 | % | | | 5.07 | % |
| Russell 1000 Value Index | Growth of $10,000 | $ | 10,592 | | | $ | 12,894 | | | $ | 10,699 | | | $ | 10,590 | | | $ | 16,234 | |
| Average annual total return | | 5.92 | % | | | 28.94 | % | | | 2.28 | % | | | 1.15 | % | | | 5.53 | % |
The growth of $10,000 is cumulative.
‡ Total returns shown for periods less than one year are not annualized.
* The Fund commenced offering Class B shares on July 1, 2002. Index returns began on June 30, 2002.
Information About Your Fund's Expenses
As an investor of the Fund, you incur two types of costs: ongoing expenses and transaction costs. Ongoing expenses include management fees, distribution and service (12b-1) fees and other Fund expenses. Examples of transaction costs include contract charges and account maintenance fees, which are not shown in this section. The following tables are intended to help you understand your ongoing expenses (in dollars) of investing in the Fund and to help you compare these expenses with the ongoing expenses of investing in other mutual funds. The example in the table is based on an investment of $1,000 invested at the beginning of the six-month period and held for the entire period (January 1, 2011 to June 30, 2011).
The tables illustrate your Fund's expenses in two ways:
•Actual Fund Return. This helps you estimate the actual dollar amount of ongoing expenses (but not transaction costs) paid on a $1,000 investment in the Fund using the Fund's actual return during the period. To estimate the expenses you paid over the period, simply divide your account value by $1,000 (for example, an $8,600 account value divided by $1,000 = 8.6), then multiply the result by the number in the "Expenses Paid per $1,000" line under the share class you hold.
• Hypothetical 5% Fund Return. This helps you to compare your Fund's ongoing expenses (but not transaction costs) with those of other mutual funds using the Fund's actual expense ratio and a hypothetical rate of return of 5% per year before expenses. Examples using a 5% hypothetical Fund return may be found in the shareholder reports of other mutual funds. The hypothetical account values and expenses may not be used to estimate the actual ending account balance or expenses you paid for the period.
Please note that the expenses shown in these tables are meant to highlight your ongoing expenses only and do not reflect any transaction costs. The "Expenses Paid per $1,000" line of the tables is useful in comparing ongoing expenses only and will not help you determine the relative total expense of owning different funds. If these transaction costs had been included, your costs would have been higher.
Expenses and Value of a $1,000 Investment for the six months ended June 30, 2011 | |
| Actual Fund Return | | Class A | | | Class B | |
| Beginning Account Value 1/1/11 | | $ | 1,000.00 | | | $ | 1,000.00 | |
| Ending Account Value 6/30/11 | | $ | 1,065.00 | | | $ | 1,063.60 | |
| Expenses Paid per $1,000* | | $ | 4.10 | | | $ | 5.58 | |
| Hypothetical 5% Fund Return | | Class A | | | Class B | |
| Beginning Account Value 1/1/11 | | $ | 1,000.00 | | | $ | 1,000.00 | |
| Ending Account Value 6/30/11 | | $ | 1,020.83 | | | $ | 1,019.39 | |
| Expenses Paid per $1,000* | | $ | 4.01 | | | $ | 5.46 | |
* Expenses are equal to the Fund's annualized expense ratio for each share class, multiplied by the average account value over the period, multiplied by the number of days in the most recent six-month period, then divided by 365.
| Annualized Expense Ratios | Class A | | Class B | |
| DWS Variable Series II — DWS Large Cap Value VIP | .80% | | 1.09% | |
For more information, please refer to the Fund's prospectus.
These tables do not reflect charges and fees ("contract charges") associated with the separate account that invests in the Fund or any variable life insurance policy or variable annuity contract for which the Fund is an investment option.
Asset Allocation (As a % of Investment Portfolio excluding Securities Lending Collateral) | 6/30/11 | 12/31/10 |
| | | |
| Common Stocks | 94% | 98% |
| Cash Equivalents | 6% | 2% |
| | 100% | 100% |
Sector Diversification (As a % of Common Stocks) | 6/30/11 | 12/31/10 |
| | | |
| Energy | 15% | 18% |
| Health Care | 14% | 12% |
| Financials | 13% | 13% |
| Consumer Staples | 13% | 12% |
| Utilities | 11% | 10% |
| Consumer Discretionary | 8% | 7% |
| Telecommunication Services | 7% | 9% |
| Materials | 7% | 5% |
| Industrials | 6% | 6% |
| Information Technology | 6% | 8% |
| | 100% | 100% |
Asset allocation and sector diversification are subject to change.
For more complete details about the Fund's investment portfolio, see page 7.
Following the Fund's fiscal first and third quarter-end, a complete portfolio holdings listing is filed with the SEC on Form N-Q. The form will be available on the SEC's Web site at www.sec.gov, and it also may be reviewed and copied at the SEC's Public Reference Room in Washington, D.C. Information on the operation of the SEC's Public Reference Room may be obtained by calling (800) SEC-0330. The Fund's portfolio holdings are also posted on www.dws-investments.com from time to time. Please see the Fund's current prospectus for more information.
Investment Portfolio June 30, 2011 (Unaudited) | | | Shares | | | Value ($) | |
| | | | |
| Common Stocks 94.2% | |
| Consumer Discretionary 7.8% | |
| Auto Components 0.8% | |
| TRW Automotive Holdings Corp.* | | | 60,706 | | | | 3,583,475 | |
| Distributors 1.0% | |
| Genuine Parts Co. | | | 87,404 | | | | 4,754,778 | |
| Diversified Consumer Services 1.4% | |
| H&R Block, Inc. | | | 418,772 | | | | 6,717,103 | |
| Hotels Restaurants & Leisure 1.6% | |
| Carnival Corp. (Units) | | | 201,697 | | | | 7,589,858 | |
| Media 1.7% | |
| News Corp. "A" | | | 439,358 | | | | 7,776,637 | |
| Specialty Retail 1.3% | |
| AutoZone, Inc.* | | | 12,934 | | | | 3,813,590 | |
| Best Buy Co., Inc. | | | 79,591 | | | | 2,499,953 | |
| | | | | | | | 6,313,543 | |
| Consumer Staples 12.0% | |
| Beverages 1.8% | |
| PepsiCo, Inc. | | | 117,687 | | | | 8,288,695 | |
| Food & Staples Retailing 3.9% | |
| CVS Caremark Corp. | | | 224,691 | | | | 8,443,888 | |
| Kroger Co. | | | 194,356 | | | | 4,820,029 | |
| Wal-Mart Stores, Inc. | | | 90,153 | | | | 4,790,730 | |
| | | | | | | | 18,054,647 | |
| Food Products 3.0% | |
| General Mills, Inc. | | | 111,180 | | | | 4,138,120 | |
| Kellogg Co. | | | 96,060 | | | | 5,314,039 | |
| Mead Johnson Nutrition Co. | | | 68,763 | | | | 4,644,941 | |
| | | | | | | | 14,097,100 | |
| Tobacco 3.3% | |
| Altria Group, Inc. | | | 335,875 | | | | 8,870,459 | |
| Philip Morris International, Inc. | | | 102,032 | | | | 6,812,676 | |
| | | | | | | | 15,683,135 | |
| Energy 14.3% | |
| Energy Equipment & Services 2.5% | |
| Noble Corp. | | | 170,405 | | | | 6,715,661 | |
| Transocean Ltd. | | | 74,573 | | | | 4,814,433 | |
| | | | | | | | 11,530,094 | |
| Oil, Gas & Consumable Fuels 11.8% | |
| Canadian Natural Resources Ltd. | | | 152,938 | | | | 6,401,985 | |
| Chevron Corp. | | | 88,802 | | | | 9,132,398 | |
| ConocoPhillips | | | 83,415 | | | | 6,271,974 | |
| Marathon Oil Corp. | | | 213,883 | | | | 11,267,356 | |
| Nexen, Inc. | | | 223,844 | | | | 5,036,490 | |
| Occidental Petroleum Corp. | | | 85,791 | | | | 8,925,695 | |
| Suncor Energy, Inc. | | | 215,019 | | | | 8,407,243 | |
| | | | | | | | 55,443,141 | |
| Financials 12.2% | |
| Diversified Financial Services 1.4% | |
| JPMorgan Chase & Co. | | | 160,129 | | | | 6,555,681 | |
| Insurance 10.7% | |
| Assurant, Inc. | | | 165,254 | | | | 5,993,763 | |
| Fidelity National Financial, Inc. "A" | | | 329,427 | | | | 5,185,181 | |
| HCC Insurance Holdings, Inc. | | | 163,173 | | | | 5,139,949 | |
| Lincoln National Corp. | | | 298,871 | | | | 8,514,835 | |
| | | Shares | | | Value ($) | |
| | | | | | | | | |
| MetLife, Inc. | | | 113,575 | | | | 4,982,535 | |
| PartnerRe Ltd. | | | 112,743 | | | | 7,762,356 | |
| Prudential Financial, Inc. | | | 128,129 | | | | 8,147,723 | |
| Transatlantic Holdings, Inc. | | | 91,161 | | | | 4,467,801 | |
| | | | | | | | 50,194,143 | |
| Thrifts & Mortgage Finance 0.1% | |
| Washington Mutual, Inc.* | | | 1,394,944 | | | | 180,645 | |
| Health Care 13.4% | |
| Biotechnology 1.8% | |
| Gilead Sciences, Inc.* | | | 201,149 | | | | 8,329,580 | |
| Health Care Equipment & Supplies 3.4% | |
| Baxter International, Inc. | | | 160,977 | | | | 9,608,717 | |
| Becton, Dickinson & Co. | | | 72,578 | | | | 6,254,046 | |
| | | | | | | | 15,862,763 | |
| Health Care Providers & Services 4.7% | |
| Aetna, Inc. | | | 83,536 | | | | 3,683,102 | |
| Humana, Inc. | | | 60,114 | | | | 4,841,582 | |
| McKesson Corp. | | | 104,862 | | | | 8,771,706 | |
| WellPoint, Inc. | | | 60,471 | | | | 4,763,301 | |
| | | | | | | | 22,059,691 | |
| Pharmaceuticals 3.5% | |
| Merck & Co., Inc. | | | 235,416 | | | | 8,307,831 | |
| Teva Pharmaceutical Industries Ltd. (ADR) | | | 166,389 | | | | 8,023,277 | |
| | | | | | | | 16,331,108 | |
| Industrials 5.7% | |
| Aerospace & Defense 4.1% | |
| Northrop Grumman Corp. | | | 94,141 | | | | 6,528,678 | |
| Raytheon Co. | | | 126,669 | | | | 6,314,450 | |
| United Technologies Corp. | | | 70,356 | | | | 6,227,209 | |
| | | | | | | | 19,070,337 | |
| Machinery 1.6% | |
| Dover Corp. | | | 109,936 | | | | 7,453,661 | |
| Information Technology 5.6% | |
| Communications Equipment 1.7% | |
| Brocade Communications Systems, Inc.* | | | 564,336 | | | | 3,645,611 | |
| Cisco Systems, Inc. | | | 286,487 | | | | 4,472,062 | |
| | | | | | | | 8,117,673 | |
| Computers & Peripherals 0.8% | |
| Hewlett-Packard Co. | | | 100,084 | | | | 3,643,058 | |
| Semiconductors & Semiconductor Equipment 1.4% | |
| Intel Corp. | | | 300,491 | | | | 6,658,880 | |
| Software 1.7% | |
| Microsoft Corp. | | | 307,643 | | | | 7,998,718 | |
| Materials 6.1% | |
| Chemicals 3.6% | |
| Air Products & Chemicals, Inc. | | | 98,147 | | | | 9,380,891 | |
| Praxair, Inc. | | | 67,262 | | | | 7,290,528 | |
| | | | | | | | 16,671,419 | |
| Containers & Packaging 1.7% | |
| Sonoco Products Co. | | | 225,373 | | | | 8,009,756 | |
| Metals & Mining 0.8% | |
| Freeport-McMoRan Copper & Gold, Inc. | | | 72,320 | | | | 3,825,728 | |
| | | Shares | | | Value ($) | |
| | | | | | | | | |
| Telecommunication Services 6.3% | |
| Diversified Telecommunication Services 4.8% | |
| AT&T, Inc. | | | 355,776 | | | | 11,174,924 | |
| CenturyLink, Inc. | | | 280,135 | | | | 11,325,858 | |
| | | | | | | | 22,500,782 | |
| Wireless Telecommunication Services 1.5% | |
| Vodafone Group PLC (ADR) | | | 252,849 | | | | 6,756,126 | |
| Utilities 10.8% | |
| Electric Utilities 9.0% | |
| American Electric Power Co., Inc. | | | 165,290 | | | | 6,228,127 | |
| Duke Energy Corp. | | | 289,099 | | | | 5,443,734 | |
| Entergy Corp. | | | 96,989 | | | | 6,622,409 | |
| Exelon Corp. | | | 191,280 | | | | 8,194,435 | |
| FirstEnergy Corp. | | | 224,956 | | | | 9,931,808 | |
| Southern Co. | | | 143,460 | | | | 5,792,915 | |
| | | | | | | | 42,213,428 | |
| | | Shares | | | Value ($) | |
| | | | | | | | | |
| Multi-Utilities 1.8% | |
| PG&E Corp. | | | 194,622 | | | | 8,179,962 | |
Total Common Stocks (Cost $382,582,979) | | | | 440,445,345 | |
| | |
| Cash Equivalents 5.8% | |
| Central Cash Management Fund, 0.11% (a) (Cost $26,971,272) | | | 26,971,272 | | | | 26,971,272 | |
| | | % of Net Assets | | | Value ($) | |
| | | | |
Total Investment Portfolio (Cost $409,554,251)+ | | | 100.0 | | | | 467,416,617 | |
| Other Assets and Liabilities, Net | | | 0.0 | | | | 170,628 | |
| Net Assets | | | 100.0 | | | | 467,587,245 | |
* Non-income producing security.
+ The cost for federal income tax purposes was $411,650,680. At June 30, 2011, net unrealized appreciation for all securities based on tax cost was $55,765,937. This consisted of aggregate gross unrealized appreciation for all securities in which there was an excess of value over tax cost of $73,040,564 and aggregate gross unrealized depreciation for all securities in which there was an excess of tax cost over value of $17,274,627.
(a) Affiliated fund managed by Deutsche Investment Management Americas Inc. The rate shown is the annualized seven-day yield at period end.
ADR: American Depositary Receipt
Fair Value Measurements
Various inputs are used in determining the value of the Fund's investments. These inputs are summarized in three broad levels. Level 1 includes quoted prices in active markets for identical securities. Level 2 includes other significant observable inputs (including quoted prices for similar securities, interest rates, prepayment speeds, and credit risk). Level 3 includes significant unobservable inputs (including the Fund's own assumptions in determining the fair value of investments). The inputs or methodology used for valuing securities are not necessarily an indication of the risk associated with investing in those securities.
The following is a summary of the inputs used as of June 30, 2011 in valuing the Fund's investments. For information on the Fund's policy regarding the valuation of investments, please refer to the Security Valuation section of Note A in the accompanying Notes to Financial Statements.
| Assets | | Level 1 | | | Level 2 | | | Level 3 | | | Total | |
| | |
| Common Stocks (b) | | $ | 440,445,345 | | | $ | — | | | $ | — | | | $ | 440,445,345 | |
| Short-Term Investments (b) | | | 26,971,272 | | | | — | | | | — | | | | 26,971,272 | |
| Total | | $ | 467,416,617 | | | $ | — | | | $ | — | | | $ | 467,416,617 | |
There have been no transfers between Level 1 and Level 2 fair value measurements during the period ended June 30, 2011.
(b) See Investment Portfolio for additional detailed categorizations.
The accompanying notes are an integral part of the financial statements.
Statement of Assets and Liabilities | as of June 30, 2011 (Unaudited) | |
| Assets | |
Investments: Investments in non-affiliated securities, at value (cost $382,582,979) | | $ | 440,445,345 | |
| Investment in Central Cash Management Fund (cost $26,971,272) | | | 26,971,272 | |
| Total investments in securities, at value (cost $409,554,251) | | | 467,416,617 | |
| Cash | | | 24,014 | |
| Foreign currency, at value (cost $31,425) | | | 36,375 | |
| Receivable for Fund shares sold | | | 20,224 | |
| Dividends receivable | | | 1,007,666 | |
| Interest receivable | | | 4,562 | |
| Foreign taxes recoverable | | | 2,107 | |
| Other assets | | | 6,313 | |
| Total assets | | | 468,517,878 | |
| Liabilities | |
| Payable for Fund shares redeemed | | | 536,948 | |
| Accrued management fee | | | 251,766 | |
| Other accrued expenses and payables | | | 141,919 | |
| Total liabilities | | | 930,633 | |
| Net assets, at value | | $ | 467,587,245 | |
| Net Assets Consist of | |
| Undistributed net investment income | | | 3,041,277 | |
Net unrealized appreciation (depreciation) on: Investments | | | 57,862,366 | |
| Foreign currency | | | 5,733 | |
| Accumulated net realized gain (loss) | | | (35,300,023 | ) |
| Paid-in capital | | | 441,977,892 | |
| Net assets, at value | | $ | 467,587,245 | |
Class A Net Asset Value, offering and redemption price per share ($464,586,946 ÷ 37,707,504 outstanding shares of beneficial interest, no par value, unlimited number of shares authorized) | | $ | 12.32 | |
Class B Net Asset Value, offering and redemption price per share ($3,000,299 ÷ 242,922 outstanding shares of beneficial interest, no par value, unlimited number of shares authorized) | | $ | 12.35 | |
The accompanying notes are an integral part of the financial statements.
Statement of Operations
| for the six months ended June 30, 2011 (Unaudited) | |
| Investment Income | |
Income: Dividends (net of foreign taxes withheld of $17,969) | | $ | 4,265,621 | |
| Income distributions — Central Cash Management Fund | | | 9,709 | |
| Securities lending income, including income from Daily Assets Fund Institutional, net of borrower rebates | | | 7,583 | |
| Total income | | | 4,282,913 | |
Expenses: Management fee | | | 955,384 | |
| Administration fee | | | 147,458 | |
| Services to shareholders | | | 5,428 | |
| Distribution service fee (Class B) | | | 2,382 | |
| Record keeping fees (Class B) | | | 353 | |
| Custodian fee | | | 6,609 | |
| Professional fees | | | 33,988 | |
| Reports to shareholders | | | 19,995 | |
| Trustees' fees and expenses | | | 5,543 | |
| Other | | | 5,245 | |
| Total expenses | | | 1,182,385 | |
| Net investment income | | | 3,100,528 | |
| Realized and Unrealized Gain (Loss) | |
Net realized gain (loss) from: Investments | | | 7,878,919 | |
| Foreign currency | | | 4,009 | |
| | | | 7,882,928 | |
Change in net unrealized appreciation (depreciation) on: Investments | | | (1,589,902 | ) |
| Foreign currency | | | (519 | ) |
| | | | (1,590,421 | ) |
| Net gain (loss) | | | 6,292,507 | |
| Net increase (decrease) in net assets resulting from operations | | $ | 9,393,035 | |
The accompanying notes are an integral part of the financial statements.
Statement of Changes in Net Assets | Increase (Decrease) in Net Assets | | Six Months Ended June 30, 2011 (Unaudited) | | | Year Ended December 31, 2010 | |
Operations: Net investment income (loss) | | $ | 3,100,528 | | | $ | 4,298,825 | |
| Net realized gain (loss) | | | 7,882,928 | | | | 8,028,746 | |
| Change in net unrealized appreciation (depreciation) | | | (1,590,421 | ) | | | 7,889,692 | |
| Net increase (decrease) in net assets resulting from operations | | | 9,393,035 | | | | 20,217,263 | |
Distributions to shareholders from: Net investment income: Class A | | | (4,120,416 | ) | | | (4,108,146 | ) |
| Class B | | | (23,046 | ) | | | (14,019 | ) |
| Total distributions | | $ | (4,143,462 | ) | | $ | (4,122,165 | ) |
Fund share transactions: Class A Proceeds from shares sold | | | 7,690,497 | | | | 8,671,405 | |
| Net assets acquired in tax-free reorganization | | | 273,358,779 | | | | — | |
| Reinvestment of distributions | | | 4,120,416 | | | | 4,108,146 | |
| Payments for shares redeemed | | | (31,314,531 | ) | | | (36,788,065 | ) |
| Net increase (decrease) in net assets from Class A share transactions | | | 253,855,161 | | | | (24,008,514 | ) |
Class B Proceeds from shares sold | | | 327,344 | | | | 506,629 | |
| Net assets acquired in tax-free reorganization | | | 1,731,132 | | | | — | |
| Reinvestment of distributions | | | 23,046 | | | | 14,019 | |
| Payments for shares redeemed | | | (357,751 | ) | | | (88,091 | ) |
| Net increase (decrease) in net assets from Class B share transactions | | | 1,723,771 | | | | 432,557 | |
| Increase (decrease) in net assets | | | 260,828,505 | | | | (7,480,859 | ) |
| Net assets at beginning of period | | | 206,758,740 | | | | 214,239,599 | |
| Net assets at end of period (including undistributed net investment income of $3,041,277 and $4,084,211, respectively) | | $ | 467,587,245 | | | $ | 206,758,740 | |
| Other Information | |
Class A Shares outstanding at beginning of period | | | 17,416,427 | | | | 19,667,770 | |
| Shares sold | | | 627,562 | | | | 778,508 | |
| Shares issued in tax-free reorganization | | | 21,886,687 | | | | — | |
| Shares issued to shareholders in reinvestment of distributions | | | 332,560 | | | | 366,145 | |
| Shares redeemed | | | (2,555,732 | ) | | | (3,395,996 | ) |
| Net increase (decrease) in Class A shares | | | 20,291,077 | | | | (2,251,343 | ) |
| Shares outstanding at end of period | | | 37,707,504 | | | | 17,416,427 | |
Class B Shares outstanding at beginning of period | | | 105,172 | | | | 66,594 | |
| Shares sold | | | 26,654 | | | | 45,434 | |
| Shares issued in tax-free reorganization | | | 138,157 | | | | — | |
| Shares issued to shareholders in reinvestment of distributions | | | 1,855 | | | | 1,246 | |
| Shares redeemed | | | (28,916 | ) | | | (8,102 | ) |
| Net increase (decrease) in Class B shares | | | 137,750 | | | | 38,578 | |
| Shares outstanding at end of period | | | 242,922 | | | | 105,172 | |
The accompanying notes are an integral part of the financial statements.
| | | | | | Years Ended December 31, | |
| Class A | | Six Months Ended 6/30/11 (Unaudited) | | | 2010 | | | 2009 | | | 2008 | | | 2007 | | | 2006 | |
| Selected Per Share Data | |
| Net asset value, beginning of period | | $ | 11.80 | | | $ | 10.86 | | | $ | 8.92 | | | $ | 19.21 | | | $ | 17.96 | | | $ | 15.81 | |
Income (loss) from investment operations: Net investment income (loss)a | | | .13 | | | | .23 | | | | .21 | | | | .21 | | | | .26 | | | | .29 | c |
| Net realized and unrealized gain (loss) | | | .64 | | | | .93 | | | | 1.97 | | | | (5.68 | ) | | | 1.98 | | | | 2.12 | |
| Total from investment operations | | | .77 | | | | 1.16 | | | | 2.18 | | | | (5.47 | ) | | | 2.24 | | | | 2.41 | |
Less distributions from: Net investment income | | | (.25 | ) | | | (.22 | ) | | | (.24 | ) | | | (.34 | ) | | | (.32 | ) | | | (.26 | ) |
| Net realized gains | | | — | | | | — | | | | — | | | | (4.48 | ) | | | (.67 | ) | | | — | |
| Total distributions | | | (.25 | ) | | | (.22 | ) | | | (.24 | ) | | | (4.82 | ) | | | (.99 | ) | | | (.26 | ) |
| Net asset value, end of period | | $ | 12.32 | | | $ | 11.80 | | | $ | 10.86 | | | $ | 8.92 | | | $ | 19.21 | | | $ | 17.96 | |
| Total Return (%) | | | 6.50 | ** | | | 10.77 | | | | 25.37 | | | | (36.40 | )b | | | 13.15 | b,d | | | 15.41 | c |
| Ratios to Average Net Assets and Supplemental Data | |
| Net assets, end of period ($ millions) | | | 465 | | | | 206 | | | | 214 | | | | 118 | | | | 229 | | | | 275 | |
| Ratio of expenses before expense reductions (%) | | | .80 | * | | | .82 | | | | .76 | | | | .87 | | | | .83 | | | | .83 | |
| Ratio of expenses after expense reductions (%) | | | .80 | * | | | .82 | | | | .76 | | | | .86 | | | | .82 | | | | .83 | |
| Ratio of net investment income (loss) (%) | | | 2.10 | * | | | 2.13 | | | | 2.22 | | | | 1.59 | | | | 1.43 | | | | 1.73 | c |
| Portfolio turnover rate (%) | | | 14 | ** | | | 32 | | | | 76 | | | | 97 | | | | 103 | | | | 76 | |
a Based on average shares outstanding during the period. b Total return would have been lower had certain expenses not been reduced. c Includes non-recurring income from the Advisor recorded as a result of an administrative proceeding regarding disclosure of brokerage allocation practices in connection with sales of DWS Funds. The non-recurring income resulted in an increase in net investment income of $0.008 per share and an increase in the ratio of net investment income of 0.04%. Excluding this non-recurring income, total return would have been 0.04% lower. d Includes a reimbursement from the Advisor to reimburse the effect of losses incurred as the result of certain operation errors during the period. Excluding this reimbursement, total return would have been 0.04% lower. * Annualized ** Not annualized | |
| | | | | | Years Ended December 31, | |
| Class B | | Six Months Ended 6/30/11 (Unaudited) | | | 2010 | | | 2009 | | | 2008 | | | 2007 | | | 2006 | |
| Selected Per Share Data | |
| Net asset value, beginning of period | | $ | 11.81 | | | $ | 10.86 | | | $ | 8.92 | | | $ | 19.20 | | | $ | 17.94 | | | $ | 15.79 | |
Income (loss) from investment operations: Net investment income (loss)a | | | .11 | | | | .20 | | | | .19 | | | | .12 | | | | .19 | | | | .23 | c |
| Net realized and unrealized gain (loss) | | | .64 | | | | .93 | | | | 1.96 | | | | (5.64 | ) | | | 1.99 | | | | 2.11 | |
| Total from investment operations | | | .75 | | | | 1.13 | | | | 2.15 | | | | (5.52 | ) | | | 2.18 | | | | 2.34 | |
Less distributions from: Net investment income | | | (.21 | ) | | | (.18 | ) | | | (.21 | ) | | | (.28 | ) | | | (.25 | ) | | | (.19 | ) |
| Net realized gains | | | — | | | | — | | | | — | | | | (4.48 | ) | | | (.67 | ) | | | — | |
| Total distributions | | | (.21 | ) | | | (.18 | ) | | | (.21 | ) | | | (4.76 | ) | | | (.92 | ) | | | (.19 | ) |
| Net asset value, end of period | | $ | 12.35 | | | $ | 11.81 | | | $ | 10.86 | | | $ | 8.92 | | | $ | 19.20 | | | $ | 17.94 | |
| Total Return (%) | | | 6.36 | ** | | | 10.53 | | | | 24.86 | | | | (36.64 | )b | | | 12.77 | b,d | | | 14.96 | c |
| Ratios to Average Net Assets and Supplemental Data | |
| Net assets, end of period ($ millions) | | | 3 | | | | 1 | | | | 1 | | | | .29 | | | | 8 | | | | 40 | |
| Ratio of expenses before expense reductions (%) | | | 1.09 | * | | | 1.11 | | | | 1.06 | | | | 1.28 | | | | 1.21 | | | | 1.21 | |
| Ratio of expenses after expense reductions (%) | | | 1.09 | * | | | 1.11 | | | | 1.06 | | | | 1.26 | | | | 1.20 | | | | 1.21 | |
| Ratio of net investment income (loss) (%) | | | 1.81 | * | | | 1.84 | | | | 1.92 | | | | 1.20 | | | | 1.06 | | | | 1.35 | c |
| Portfolio turnover rate (%) | | | 14 | ** | | | 32 | | | | 76 | | | | 97 | | | | 103 | | | | 76 | |
a Based on average shares outstanding during the period. b Total return would have been lower had certain expenses not been reduced. c Includes non-recurring income from the Advisor recorded as a result of an administrative proceeding regarding disclosure of brokerage allocation practices in connection with sales of DWS Funds. The non-recurring income resulted in an increase in net investment income of $0.008 per share and an increase in the ratio of net investment income of 0.04%. Excluding this non-recurring income, total return would have been 0.04% lower. d Includes a reimbursement from the Advisor to reimburse the effect of losses incurred as the result of certain operation errors during the period. Excluding this reimbursement, total return would have been 0.04% lower. * Annualized ** Not annualized | |
Notes to Financial Statements (Unaudited)
A. Organization and Significant Accounting Policies
DWS Large Cap Value VIP (the "Fund") is a diversified series of DWS Variable Series II (the "Trust"), which is registered under the Investment Company Act of 1940, as amended (the "1940 Act"), as an open-end management investment company organized as a Massachusetts business trust.
Multiple Classes of Shares of Beneficial Interest. The Fund offers two classes of shares (Class A shares and Class B shares). Sales of Class B shares are subject to recordkeeping fees up to 0.15% and Rule 12b-1 fees under the 1940 Act equal to an annual rate of 0.25% of the average daily net assets of the Class B shares of the Fund. Class A shares are not subject to such fees.
Investment income, realized and unrealized gains and losses, and certain fund-level expenses and expense reductions, if any, are borne pro rata on the basis of relative net assets by the holders of all classes of shares except that each class bears certain expenses unique to that class (including the applicable Rule 12b-1 fee and recordkeeping fees). Differences in class-level expenses may result in payment of different per share dividends by class. All shares have equal rights with respect to voting subject to class-specific arrangements.
The Fund's financial statements are prepared in accordance with accounting principles generally accepted in the United States of America which require the use of management estimates. Actual results could differ from those estimates. The policies described below are followed consistently by the Fund in the preparation of its financial statements.
Security Valuation. Investments are stated at value determined as of the close of regular trading on the New York Stock Exchange on each day the exchange is open for trading.
Various inputs are used in determining the value of the Fund's investments. These inputs are summarized in three broad levels. Level 1 includes quoted prices in active markets for identical securities. Level 2 includes other significant observable inputs (including quoted prices for similar securities, interest rates, prepayment speeds, and credit risk). Level 3 includes significant unobservable inputs (including the Fund's own assumptions in determining the fair value of investments). The inputs or methodology used for valuing securities are not necessarily an indication of the risk associated with investing in those securities.
Equity securities are valued at the most recent sale price or official closing price reported on the exchange (US or foreign) or over-the-counter market on which they trade and are categorized as Level 1 securities. Securities for which no sales are reported are valued at the calculated mean between the most recent bid and asked quotations on the relevant market or, if a mean cannot be determined, at the most recent bid quotation.
Money market instruments purchased with an original or remaining maturity of sixty days or less, maturing at par, are valued at amortized cost, which approximates value, and are categorized as Level 2. Investments in open-end investment companies are valued at their net asset value each business day and are categorized as Level 1.
Securities and other assets for which market quotations are not readily available or for which the above valuation procedures are deemed not to reflect fair value are valued in a manner that is intended to reflect their fair value as determined in accordance with procedures approved by the Board and are generally categorized as Level 3. In accordance with the Fund's valuation procedures, factors used in determining value may include, but are not limited to, the type of the security; the size of the holding; the initial cost of the security; the existence of any contractual restrictions on the security's disposition; the price and extent of public trading in similar securities of the issuer or of comparable companies; quotations or evaluated prices from broker-dealers and/or pricing services; information obtained from the issuer, analysts, and/or the appropriate stock exchange (for exchange-traded securities); an analysis of the company's or issuer's financial statements; an evaluation of the forces that influence the issuer and the market(s) in which the security is purchased and sold and with respect to debt securities; the maturity, coupon, creditworthiness, currency denomination and the movement of the market in which the security is normally traded. The value determined under these procedures may differ from published values for the same securities.
Disclosure about the classification of fair value measurements is included in a table following the Fund's Investment Portfolio.
Foreign Currency Translations. The books and records of the Fund are maintained in US dollars. Investment securities and other assets and liabilities denominated in a foreign currency are translated into US dollars at the prevailing exchange rates at period end. Purchases and sales of investment securities, income and expenses are translated into US dollars at the prevailing exchange rates on the respective dates of the transactions.
Net realized and unrealized gains and losses on foreign currency transactions represent net gains and losses between trade and settlement dates on securities transactions, the acquisition and disposition of foreign currencies, and the difference between the amount of net investment income accrued and the US dollar amount actually received. That portion of both realized and unrealized gains and losses on investments that results from fluctuations in foreign currency exchange rates is not separately disclosed but is included with net realized and unrealized gain/appreciation and loss/depreciation on investments.
Federal Income Taxes. The Fund's policy is to comply with the requirements of the Internal Revenue Code, as amended, which are applicable to regulated investment companies and to distribute all of its taxable income to its shareholders.
At December 31, 2010, the Fund had a net tax basis capital loss carryforward of approximately $41,087,000, including $19,469,000 inherited from its merger with an affiliated fund in fiscal year 2009, which may be applied against any realized net taxable capital gains of each succeeding year until fully utilized or until December 31, 2016 ($29,003,000) and December 31, 2017 ($12,084,000), the respective expiration dates, whichever occurs first, and which may be subject to certain limitations under Sections 381-384 of the Internal Revenue Code.
On December 22, 2010, the Regulated Investment Company Modernization Act of 2010 (the "Act") was enacted. Under the Act, net capital losses may be carried forward indefinitely, and their character is retained as short-term and/or long-term losses. Previously, net capital losses were carried forward for eight years and treated as short-term losses. As a transition rule, the Act requires that post-enactment net capital losses be used before pre-enactment net capital losses. As a result of this ordering rule, pre-enactment capital loss carryforwards may expire unused, whereas under the previous rules these losses may have been utilized. This change is effective for fiscal years beginning after the date of enactment.
The Fund has reviewed the tax positions for the open tax years as of December 31, 2010 and has determined that no provision for income tax is required in the Fund's financial statements. The Fund's federal tax returns for the prior three fiscal years remain open subject to examination by the Internal Revenue Service.
Distribution of Income and Gains. Net investment income of the Fund, if any, is declared and distributed to shareholders annually. Net realized gains from investment transactions, in excess of available capital loss carryforwards, would be taxable to the Fund if not distributed and, therefore, will be distributed to shareholders at least annually. The Fund may also make additional distributions for tax purposes if necessary.
The timing and characterization of certain income and capital gains distributions are determined annually in accordance with federal tax regulations which may differ from accounting principles generally accepted in the United States of America. These differences primarily relate to certain securities sold at a loss. As a result, net investment income (loss) and net realized gain (loss) on investment transactions for a reporting period may differ significantly from distributions during such period. Accordingly, the Fund may periodically make reclassifications among certain of its capital accounts without impacting the net asset value of the Fund.
The tax character of current year distributions will be determined at the end of the current fiscal year.
Expenses. Expenses of the Trust arising in connection with a specific fund are allocated to that fund. Other Trust expenses which cannot be directly attributed to a fund are apportioned among the funds in the Trust.
Contingencies. In the normal course of business, the Fund may enter into contracts with service providers that contain general indemnification clauses. The Fund's maximum exposure under these arrangements is unknown as this would involve future claims that may be made against the Fund that have not yet been made. However, based on experience, the Fund expects the risk of loss to be remote.
Other. Investment transactions are accounted for on a trade date plus one basis for daily net asset value calculations. However, for financial reporting purposes, investment transactions are reported on trade date. Interest income is recorded on the accrual basis. Dividend income is recorded on the ex-dividend date net of foreign withholding taxes. Realized gains and losses from investment transactions are recorded on an identified cost basis and may include proceeds from litigation.
B. Purchases and Sales of Securities
During the six months ended June 30, 2011, purchases and sales of investment transactions (excluding short-term investments) aggregated $43,777,742 and $75,079,022, respectively.
C. Related Parties
Management Agreement. Under the Investment Management Agreement with Deutsche Investment Management Americas Inc. ("DIMA" or the "Advisor"), an indirect, wholly owned subsidiary of Deutsche Bank AG, the Advisor directs the investments of the Fund in accordance with its investment objectives, policies and restrictions. The Advisor determines the securities, instruments and other contracts relating to investments to be purchased, sold or entered into by the Fund or delegates such responsibility to the Fund's subadvisor.
Deutsche Asset Management International GmbH ("DeAMi"), an affiliate of the Advisor, serves as subadvisor. As a subadvisor to the Fund, DeAMi makes investment decisions and buys and sells securities for the Fund. DeAMi is paid by the Advisor for the services DeAMi provides to the Fund.
Pursuant to the Investment Management Agreement with the Advisor, the Fund pays a monthly management fee based on the Fund's average daily net assets, computed and accrued daily and payable monthly, at the following annual rates:
| $0-$250 million | | | .650 | % |
| next $750 million | | | .625 | % |
| next $1.5 billion | | | .600 | % |
| next $2.5 billion | | | .575 | % |
| next $2.5 billion | | | .550 | % |
| next $2.5 billion | | | .525 | % |
| next $2.5 billion | | | .500 | % |
| over $12.5 billion | | | .475 | % |
For the six months ended June 30, 2011, the fee pursuant to the Investment Management Agreement was equivalent to an annualized effective rate of 0.65% of the Fund's average daily net assets.
Administration Fee. Pursuant to an Administrative Services Agreement, DIMA provides most administrative services to the Fund. For all services provided under the Administrative Services Agreement, the Fund pays DIMA an annual fee ("Administration Fee") of 0.10% of the Fund's average daily net assets, computed and accrued daily and payable monthly. For the six months ended June 30, 2011, the Administration Fee was $147,458, of which $39,452 is unpaid.
Service Provider Fees. DWS Investments Service Company ("DISC"), an affiliate of the Advisor, is the transfer agent, dividend-paying agent and shareholder service agent for the Fund. Pursuant to a sub-transfer agency agreement between DISC and DST Systems, Inc. ("DST"), DISC has delegated certain transfer agent, dividend-paying agent and shareholder service agent functions to DST. DISC compensates DST out of the shareholder servicing fee it receives from the Fund. For the six months ended June 30, 2011, the amounts charged to the Fund by DISC were as follows:
| Services to Shareholders | | Total Aggregated | | | Unpaid at June 30, 2011 | |
| Class A | | $ | 190 | | | $ | 190 | |
| Class B | | | 48 | | | | 48 | |
| | | $ | 238 | | | $ | 238 | |
Distribution Service Agreement. Under the Fund's Class B 12b-1 plans, DWS Investments Distributors, Inc. ("DIDI") received a fee ("Distribution Service Fee") of 0.25% of average daily net assets of Class B shares. For the six months ended June 30, 2011, the Distribution Service Fee aggregated $2,382, of which $665 is unpaid.
Typesetting and Filing Service Fees. Under an agreement with DIMA, DIMA is compensated for providing typesetting and certain regulatory filing services to the Fund. For the six months ended June 30, 2011, the amount charged to the Fund by DIMA included in the Statement of Operations under "reports to shareholders" aggregated $5,936, of which $540 is unpaid.
Trustees' Fees and Expenses. The Fund paid each Trustee not affiliated with the Advisor retainer fees plus specified amounts for various committee services and for the Board Chairperson.
Affiliated Cash Management Vehicle. The Fund may invest uninvested cash balances in Central Cash Management Fund, which is managed by the Advisor. The Fund indirectly bears its proportionate share of the expenses of Central Cash Management Fund. Central Cash Management Fund does not pay the Advisor an investment management fee. Central Cash Management Fund seeks a high level of current income consistent with liquidity and the preservation of capital.
D. Ownership of the Fund
At June 30, 2011, two Participating Insurance Companies were owners of record of 10% or more of the total outstanding Class A shares of the Fund, each owning 54% and 29%. Two Participating Insurance Companies were owners of record of 10% or more of the total outstanding Class B shares of the Fund, each owning 52% and 16%.
E. Line of Credit
The Fund and other affiliated funds (the "Participants") share in a $450 million revolving credit facility provided by a syndication of banks. The Fund may borrow for temporary or emergency purposes, including the meeting of redemption requests that otherwise might require the untimely disposition of securities. The Participants are charged an annual commitment fee which is allocated based on net assets, among each of the Participants. Interest is calculated at a rate per annum equal to the sum of the Federal Funds Rate plus 1.25 percent plus if LIBOR exceeds the Federal Funds Rate the amount of such excess. The Fund may borrow up to a maximum of 33 percent of its net assets under the agreement. The Fund had no outstanding loans at June 30, 2011.
F. Acquisition of Assets
On April 29, 2011, the Fund acquired all of the net assets of DWS Strategic Value VIP pursuant to a plan of reorganization approved by shareholders on January 12, 2011. The acquisition was accomplished by a tax-free exchange of 31,515,416 Class A shares and 198,385 Class B shares of DWS Strategic Value VIP for 21,886,687 Class A shares and 138,157 Class B shares of the Fund, respectively, outstanding on April 29, 2011. DWS Strategic Value VIP's net assets at that date, $275,089,911, including $20,489,725 of net unrealized appreciation, were combined with those of the Fund. The aggregate net assets of the Fund immediately before the acquisition were $212,494,328. The combined net assets of the Fund immediately following the acquisition were $487,584,239.
The financial statements reflect the operations of the Fund for the period prior to the acquisition and the combined portfolio for the period subsequent to the portfolio merger. Assuming the acquisition had been completed on January 1, 2011, the Fund's pro forma results of operations for the six months ended June 30, 2011, are as follows:
| | | Total Aggregated | |
Net investment income* | | $ | 3,898,552 | |
| Net gain (loss) on investments | | $ | 27,675,421 | |
| Net increase (decrease) in net assets resulting from operations | | $ | 31,573,973 | |
* Net investment income includes $36,372 of pro forma eliminated expenses.
Because the combined investment portfolio has been managed as a single integrated Fund since the acquisition was completed, it is not practicable to separate the amounts of revenue and earnings of DWS Strategic Value VIP that have been included in the Fund's Statement of Operations since April 29, 2011.
The Trust's policies and procedures for voting proxies for portfolio securities and information about how the Trust voted proxies related to its portfolio securities during the 12-month period ended June 30 are available on our Web site — www.dws-investments.com (click on "proxy voting" at the bottom of the page) — or on the SEC's Web site — www.sec.gov. To obtain a written copy of the Trust's policies and procedures without charge, upon request, call us toll free at (800) 728-3337.
Summary of Management Fee Evaluation by Independent Fee Consultant
October 3, 2010
Pursuant to an Order entered into by Deutsche Investment Management Americas and affiliates (collectively, "DeAM") with the Attorney General of New York, I, Thomas H. Mack, have been appointed the Independent Fee Consultant for the DWS Funds (formerly the DWS Scudder Funds). My duties include preparing an annual written evaluation of the management fees DeAM charges the Funds, considering among other factors the management fees charged by other mutual fund companies for like services, management fees DeAM charges other clients for like services, DeAM's costs of supplying services under the management agreements and related profit margins, possible economies of scale if a Fund grows larger, and the nature and quality of DeAM's services, including fund performance. This report summarizes my evaluation for 2010, including my qualifications, the evaluation process for each of the DWS Funds, consideration of certain complex-level factors, and my conclusions. I served in substantially the same capacity in 2007, 2008, and 2009.
Qualifications
For more than 35 years I have served in various professional capacities within the investment management business. I have held investment analysis and advisory positions, including securities analyst, portfolio strategist and director of investment policy with a large investment firm. I have also performed business management functions, including business development, financial management and marketing research and analysis.
Since 1991, I have been an independent consultant within the asset management industry. I have provided services to over 125 client organizations, including investment managers, mutual fund boards, product distributors and related organizations. Over the past ten years I have completed a number of assignments for mutual fund boards, specifically including assisting boards with management contract renewal.
I hold a Master of Business Administration degree, with highest honors, from Harvard University and Master of Science and Bachelor of Science (highest honors) degrees from the University of California at Berkeley. I am an independent director and audit committee financial expert for two closed-end mutual funds and have served in various leadership and financial oversight capacities with non-profit organizations.
Evaluation of Fees for each DWS Fund
My work focused primarily on evaluating, fund-by-fund, the fees charged to each of the 118 publicly offered Fund portfolios in the DWS Fund family. For each Fund, I considered each of the key factors mentioned above, as well as any other relevant information. In doing so I worked closely with the Funds' Independent Directors in their annual contract renewal process, as well as in their approval of contracts for several new funds (documented separately).
In evaluating each Fund's fees, I reviewed comprehensive materials provided by or on behalf of DeAM, including expense information prepared by Lipper Analytical, comparative performance information, profitability data, manager histories, and other materials. I also accessed certain additional information from the Lipper and Morningstar databases and drew on my industry knowledge and experience.
To facilitate evaluating this considerable body of information, I prepared for each Fund a document summarizing the key data elements in each area as well as additional analytics discussed below. This made it possible to consider each key data element in the context of the others.
In the course of contract renewal, DeAM agreed to implement a number of fee and expense adjustments requested by the Independent Directors which will favorably impact future fees and expenses, and my evaluation includes the effects of these changes.
Fees and Expenses Compared with Other Funds
The competitive fee and expense evaluation for each fund focused on two primary comparisons:
The Fund's contractual management fee (the advisory fee plus the administration fee where applicable) compared with those of a group of typically 12-15 funds in the same Lipper investment category (e.g. Large Capitalization Growth) having similar distribution arrangements and being of similar size.
The Fund's total expenses compared with a broader universe of funds from the same Lipper investment category and having similar distribution arrangements.
These two comparisons provide a view of not only the level of the fee compared with funds of similar scale but also the total expense the Fund bears for all the services it receives, in comparison with the investment choices available in the Fund's investment category and distribution channel. The principal figure-of-merit used in these comparisons was the subject Fund's percentile ranking against peers.
DeAM's Fees for Similar Services to Others
DeAM provided management fee schedules for all of its US domiciled fund and non-fund investment management accounts in any of the investment categories where there is a DWS Fund. These similar products included the other DWS Funds, non-fund pooled accounts, institutional accounts and sub-advisory accounts. Using this information, I calculated for each Fund the fee that would be charged to each similar product, at the subject Fund's asset level.
Evaluating information regarding non-fund products is difficult because there are varying levels of services required for different types of accounts, with mutual funds generally requiring considerably more regulatory and administrative types of service as well as having more frequent cash flows than other types of accounts. Also, while mutual fund fees for similar fund products can be expected to be similar, there will be some differences due to different pricing conditions in different distribution channels (e.g. retail funds versus those used in variable insurance products), differences in underlying investment processes and other factors.
Costs and Profit Margins
DeAM provided a detailed profitability analysis for each Fund. After making some adjustments so that the presentation would be more comparable to the available industry figures, I reviewed profit margins from investment management alone, from investment management plus other fund services (excluding distribution) provided to the Funds by DeAM (principally shareholder services), and DeAM profits from all sources, including distribution. A later section comments on overall profitability.
Economies of Scale
Economies of scale — an expected decline in management cost per dollar of fund assets as fund assets grow — are very rarely quantified and documented because of inherent difficulties in collecting and analyzing relevant data. However, in virtually every investment category that I reviewed, larger funds tend to have lower fees and lower total expenses than smaller funds. To see how each DWS Fund compares with this industry observation, I reviewed:
The trend in Fund assets over the last five years and the accompanying trend in total expenses. This shows if the Fund has grown and, if so, whether total expense (management fees as well as other expenses) have declined as a percent of assets.
Whether the Fund has break-points in its management fee schedule, the extent of the fee reduction built into the schedule and the asset levels where the breaks take effect, and in the case of a sub-advised Fund how the Fund's break-points compare with those of the sub-advisory fee schedule.
How the Fund's contractual fee schedule compares with trends in the industry data. To accomplish this, I constructed a chart showing how actual latest-fiscal-year contractual fees of the Fund and of other similar funds relate to average fund assets, with the subject Fund's contractual fee schedule superimposed.
Quality of Service — Performance
The quality-of-service evaluation focused on investment performance, which is the principal result of the investment management service. Each Fund's performance was reviewed over the past 1, 3, 5 and 10 years, as applicable, and compared with that of other funds in the same investment category and with a suitable market index.
In addition, I calculated and reviewed risk-adjusted returns relative to an index of similar mutual funds' returns and a suitable market index. The risk-adjusted returns analysis provides a way of determining the extent to which the Fund's return comparisons are mainly the product of investment value-added (or lack thereof) or alternatively taking considerably more or less risk than is typical in its investment category.
I also received and considered the history of portfolio manager changes for each Fund, as this provided an important context for evaluating the performance results.
Complex-Level Considerations
While this evaluation was conducted mainly at the individual fund level, there are some issues relating to the reasonableness of fees that can alternatively be considered across the whole fund complex:
I reviewed DeAM's profitability analysis for all DWS Funds, with a view toward determining if the allocation procedures used were reasonable and how profit levels compared with public data for other investment managers.
I considered whether DeAM and affiliates receive any significant ancillary or "fall-out" benefits that should be considered in interpreting the direct profitability results. These would be situations where serving as the investment manager of the Funds is beneficial to another part of the Deutsche Bank organization.
I considered how aggregated DWS Fund expenses had varied over the years, by asset class and in the context of trends in asset levels.
I reviewed the structure of the DeAM organization, trends in staffing levels, and information on compensation of investment management and other professionals compared with industry data.
Findings
Based on the process and analysis discussed above, which included reviewing a wide range of information from management and external data sources and considering among other factors the fees DeAM charges other clients, the fees charged by other fund managers, DeAM's costs and profits associated with managing the Funds, economies of scale, possible fall-out benefits, and the nature and quality of services provided, in my opinion the management fees charged the DWS Funds are reasonable.
Thomas H. Mack
Notes
DWS Investments Distributors, Inc.
222 South Riverside Plaza
Chicago, IL 60606
(800) 621-1148
VS2LCV-3 (R-023298-1 8/11)
JUNE 30, 2011
SEMIANNUAL REPORT
DWS VARIABLE SERIES II
DWS Money Market VIP
Contents
3 Information About Your Fund's Expenses 4 Portfolio Summary 5 Investment Portfolio 8 Statement of Assets and Liabilities 9 Statement of Operations 10 Statement of Changes in Net Assets 12 Financial Highlights 13 Notes to Financial Statements 15 Proxy Voting 16 Summary of Management Fee Evaluation by Independent Fee Consultant 18 Summary of Administrative Fee Evaluation by Independent Fee Consultant |
This report must be preceded or accompanied by a prospectus. To obtain an additional prospectus or summary prospectus, if available, call (800) 728-3337 or your financial representative. We advise you to consider the Fund's objectives, risks, charges and expenses carefully before investing. The summary prospectus and prospectus contain this and other important information about the Fund. Please read the prospectus carefully before you invest.
An investment in this Fund is not insured or guaranteed by the Federal Deposit Insurance Corporation (FDIC) or by any other government agency. Although the Fund seeks to preserve the value of your investment at $1.00 per share, it is possible to lose money by investing in the Fund. The share price of money market funds can fall below the $1.00 share price. You should not rely on or expect the Advisor to enter into support agreements or take other actions to maintain the Fund's $1.00 share price. The credit quality of the Fund's holdings can change rapidly in certain markets, and the default of a single holding could have an adverse impact on the Fund's share price. The Fund's share price can also be negatively affected during periods of high redemption pressures and/or illiquid markets. The actions of a few large investors in the Fund may have a significant adverse effect on the share price of the Fund. See the prospectus for specific details regarding the Fund's risk profile.
DWS Investments is part of Deutsche Bank's Asset Management division and, within the US, represents the retail asset management activities of Deutsche Bank AG, Deutsche Bank Trust Company Americas, Deutsche Investment Management Americas Inc. and DWS Trust Company.
NOT FDIC/NCUA INSURED NO BANK GUARANTEE MAY LOSE VALUE NOT A DEPOSIT
NOT INSURED BY ANY FEDERAL GOVERNMENT AGENCY
Information About Your Fund's Expenses
As an investor of the Fund, you incur two types of costs: ongoing expenses and transaction costs. Ongoing expenses include management fees and other Fund expenses. Examples of transaction costs include contract charges and account maintenance fees, which are not shown in this section. The following tables are intended to help you understand your ongoing expenses (in dollars) of investing in the Fund and to help you compare these expenses with the ongoing expenses of investing in other mutual funds. In the most recent six-month period the Fund limited these expenses; had it not done so, expenses would have been higher. The example in the table is based on an investment of $1,000 invested at the beginning of the six-month period and held for the entire period (January 1, 2011 to June 30, 2011).
The tables illustrate your Fund's expenses in two ways:
•Actual Fund Return. This helps you estimate the actual dollar amount of ongoing expenses (but not transaction costs) paid on a $1,000 investment in the Fund using the Fund's actual return during the period. To estimate the expenses you paid over the period, simply divide your account value by $1,000 (for example, an $8,600 account value divided by $1,000 = 8.6), then multiply the result by the number in the "Expenses Paid per $1,000" line under the share class you hold.
• Hypothetical 5% Fund Return. This helps you to compare your Fund's ongoing expenses (but not transaction costs) with those of other mutual funds using the Fund's actual expense ratio and a hypothetical rate of return of 5% per year before expenses. Examples using a 5% hypothetical Fund return may be found in the shareholder reports of other mutual funds. The hypothetical account values and expenses may not be used to estimate the actual ending account balance or expenses you paid for the period.
Please note that the expenses shown in these tables are meant to highlight your ongoing expenses only and do not reflect any transaction costs. The "Expenses Paid per $1,000" line of the tables is useful in comparing ongoing expenses only and will not help you determine the relative total expense of owning different funds. If these transaction costs had been included, your costs would have been higher.
Expenses and Value of a $1,000 Investment for the six months ended June 30, 2011 | |
| Actual Fund Return | | Class A | |
| Beginning Account Value 1/1/11 | | $ | 1,000.00 | |
| Ending Account Value 6/30/11 | | $ | 1,000.05 | |
| Expenses Paid per $1,000* | | $ | 1.39 | |
| Hypothetical 5% Fund Return | | Class A | |
| Beginning Account Value 1/1/11 | | $ | 1,000.00 | |
| Ending Account Value 6/30/11 | | $ | 1,023.41 | |
| Expenses Paid per $1,000* | | $ | 1.40 | |
* Expenses are equal to the Fund's annualized expense ratio, multiplied by the average account value over the period, multiplied by the number of days in the most recent six-month period, then divided by 365.
| Annualized Expense Ratio | Class A | |
| DWS Variable Series II — DWS Money Market VIP | .28% | |
For more information, please refer to the Fund's prospectus.
These tables do not reflect charges and fees ("contract charges") associated with the separate account that invests in the Fund or any variable life insurance policy or variable annuity contract for which the Fund is an investment option.
Asset Allocation (As a % of Investment Portfolio) | 6/30/11 | 12/31/10 |
| | | |
| Repurchase Agreements | 27% | 20% |
| Commercial Paper | 27% | 31% |
| Short-Term Notes | 22% | 21% |
| Government & Agency Obligations | 13% | 14% |
| Certificates of Deposit and Bank Notes | 11% | 14% |
| | 100% | 100% |
| Weighted Average Maturity* | | |
| | | |
| DWS Variable Series II — DWS Money Market VIP | 42 days | 51 days |
| First Tier Retail Money Fund Average | 39 days | 39 days |
* The Fund is compared to its respective iMoneyNet Category: First Tier Retail Money Fund Average — Category includes a widely recognized composite of money market funds that invest in only first tier (highest rating) securities. Portfolio Holdings of First Tier funds include US Treasury, US Other, Repos, Time Deposits, Domestic Bank Obligations, Foreign Bank Obligations, First Tier Commercial Paper, Floating Rate Notes and Asset Backed Commercial Paper.
Weighted average maturity, also known as effective maturity, is the weighted average of the bonds held by the Fund taking into consideration any available maturity shortening features.
Asset allocation and weighted average maturity are subject to change.
For more complete details about the Fund's investment portfolio, see page 5.
Following the Fund's fiscal first and third quarter-end, a complete portfolio holdings listing is filed with the SEC on Form N-Q. In addition, each month, information about the Fund and its portfolio holdings is filed with the SEC on Form N-MFP. The SEC delays the public availability of the information filed on Form N-MFP for 60 days after the end of the reporting period included in the filing. These forms will be available on the SEC's Web site at www.sec.gov, and they may also be reviewed and copied at the SEC's Public Reference Room in Washington, D.C. Information on the operation of the SEC's Public Reference Room may be obtained by calling (800) SEC-0330. The Fund's portfolio holdings are also posted on www.dws-investments.com from time to time. Please see the Fund's current prospectus for more information.
Investment Portfolio June 30, 2011 (Unaudited) | | | Principal Amount ($) | | | Value ($) | |
| | | | |
| Certificates of Deposit and Bank Notes 11.4% | |
| Banco Del Estado De Chile, 0.32%, 8/17/2011 | | | 1,250,000 | | | | 1,250,000 | |
| Bank Nederlandse Gemeenten NV, 6.0%, 3/26/2012 | | | 500,000 | | | | 520,588 | |
| Bank of Montreal, 0.14%, 7/6/2011 | | | 1,800,000 | | | | 1,800,001 | |
| BNP Paribas, 0.35%, 8/8/2011 | | | 1,500,000 | | | | 1,500,000 | |
| Credit Agricole SA, 0.3%, 8/4/2011 | | | 1,000,000 | | | | 1,000,000 | |
| Dexia Credit Local, 144A, 2.375%, 9/23/2011 | | | 665,000 | | | | 667,689 | |
| International Finance Corp., 3.0%, 11/15/2011 | | | 500,000 | | | | 504,852 | |
| Intesa Sanpaolo SpA, 0.25%, 7/5/2011 | | | 1,000,000 | | | | 1,000,000 | |
| Mitsubishi UFJ Trust & Banking Corp., 0.32%, 8/19/2011 | | | 1,200,000 | | | | 1,200,000 | |
| Mizuho Corporate Bank Ltd., 0.19%, 7/8/2011 | | | 2,000,000 | | | | 2,000,000 | |
| Nederlandse Waterschapsbank NV, 1.375%, 2/17/2012 | | | 800,000 | | | | 804,997 | |
| Nordea Bank Finland PLC, 0.28%, 7/5/2011 | | | 1,250,000 | | | | 1,250,001 | |
| Skandinaviska Enskilda Banken AB: | |
| 0.2%, 8/17/2011 | | | 1,000,000 | | | | 1,000,000 | |
| 0.21%, 7/8/2011 | | | 1,000,000 | | | | 1,000,000 | |
| 0.24%, 7/1/2011 | | | 2,300,000 | | | | 2,300,000 | |
| Societe Generale: | |
| 0.2%, 7/5/2011 | | | 1,000,000 | | | | 1,000,000 | |
| 0.24%, 9/1/2011 | | | 2,000,000 | | | | 2,000,000 | |
| Sumitomo Mitsui Banking Corp.: | |
| 0.19%, 7/6/2011 | | | 1,000,000 | | | | 1,000,000 | |
| 0.19%, 7/8/2011 | | | 1,800,000 | | | | 1,800,000 | |
| Svenska Handelsbanken AB, 0.24%, 7/6/2011 | | | 1,500,000 | | | | 1,500,000 | |
Total Certificates of Deposit and Bank Notes (Cost $25,098,128) | | | | 25,098,128 | |
| | |
| Commercial Paper 26.8% | |
| Issued at Discount** | |
| Abbey National North America LLC, 0.35%, 8/29/2011 | | | 348,000 | | | | 347,800 | |
| Argento Variable Funding, 144A, 0.26%, 8/1/2011 | | | 1,000,000 | | | | 999,776 | |
| Bank of Montreal, 0.2%, 7/5/2011 | | | 5,000,000 | | | | 4,999,889 | |
| Barclays Bank PLC, 0.22%, 9/1/2011 | | | 1,000,000 | | | | 999,621 | |
| BPCE SA, 0.27%, 7/26/2011 | | | 1,000,000 | | | | 999,813 | |
| Caisse d'Amortissement de la Dette Sociale, 0.22%, 8/5/2011 | | | 2,000,000 | | | | 1,999,572 | |
| DnB NOR Bank ASA, 0.21%, 10/3/2011 | | | 1,000,000 | | | | 999,452 | |
| Erste Abwicklungsanstalt: | |
| 0.24%, 9/29/2011 | | | 2,500,000 | | | | 2,498,500 | |
| 0.37%, 1/9/2012 | | | 1,000,000 | | | | 998,027 | |
| 0.39%, 2/16/2012 | | | 1,200,000 | | | | 1,197,010 | |
| 0.4%, 3/9/2012 | | | 600,000 | | | | 598,320 | |
| 0.4%, 3/29/2012 | | | 800,000 | | | | 797,582 | |
| Google, Inc., 0.4%, 9/16/2011 | | | 800,000 | | | | 799,316 | |
| Grampian Funding LLC: | |
| 144A, 0.22%, 9/8/2011 | | | 1,000,000 | | | | 999,578 | |
| 144A, 0.25%, 8/9/2011 | | | 1,000,000 | | | | 999,729 | |
| 144A, 0.26%, 7/19/2011 | | | 1,000,000 | | | | 999,870 | |
| | | Principal Amount ($) | | | Value ($) | |
| | | | | | | | | |
| 144A, 0.28%, 7/7/2011 | | | 500,000 | | | | 499,977 | |
| 144A, 0.28%, 7/8/2011 | | | 1,000,000 | | | | 999,946 | |
| Johnson & Johnson, 144A, 0.19%, 8/22/2011 | | | 1,500,000 | | | | 1,499,588 | |
| Kells Funding LLC: | |
| 144A, 0.35%, 2/17/2012 | | | 800,000 | | | | 798,203 | |
| 144A, 0.37%, 3/19/2012 | | | 700,000 | | | | 698,115 | |
| 144A, 0.38%, 4/17/2012 | | | 700,000 | | | | 697,850 | |
| 144A, 0.39%, 7/5/2011 | | | 850,000 | | | | 849,963 | |
| 144A, 0.39%, 9/6/2011 | | | 1,750,000 | | | | 1,748,730 | |
| 144A, 0.4%, 7/1/2011 | | | 650,000 | | | | 650,000 | |
| NRW.Bank: | |
| 0.22%, 7/14/2011 | | | 1,000,000 | | | | 999,921 | |
| 0.24%, 11/1/2011 | | | 1,500,000 | | | | 1,498,770 | |
| SBAB Bank AB: | |
| 144A, 0.29%, 9/8/2011 | | | 1,000,000 | | | | 999,444 | |
| 144A, 0.39%, 7/5/2011 | | | 1,500,000 | | | | 1,499,935 | |
| Scaldis Capital LLC, 0.21%, 8/1/2011 | | | 1,500,000 | | | | 1,499,729 | |
| Straight-A Funding LLC: | |
| 144A, 0.15%, 7/25/2011 | | | 2,000,000 | | | | 1,999,800 | |
| 144A, 0.17%, 8/9/2011 | | | 1,158,000 | | | | 1,157,787 | |
| Swedbank AB: | |
| 0.215%, 8/24/2011 | | | 1,500,000 | | | | 1,499,516 | |
| 0.27%, 7/11/2011 | | | 600,000 | | | | 599,955 | |
| 0.27%, 7/26/2011 | | | 800,000 | | | | 799,850 | |
| 0.34%, 7/5/2011 | | | 1,000,000 | | | | 999,962 | |
| Tasman Funding, Inc., 144A, 0.23%, 9/6/2011 | | | 1,000,000 | | | | 999,572 | |
| Total Capital Canada Ltd., 144A, 0.31%, 9/15/2011 | | | 800,000 | | | | 799,476 | |
| Victory Receivables Corp.: | |
| 144A, 0.18%, 7/5/2011 | | | 2,500,000 | | | | 2,499,950 | |
| 144A, 0.19%, 7/7/2011 | | | 1,500,000 | | | | 1,499,953 | |
| 144A, 0.2%, 7/26/2011 | | | 2,200,000 | | | | 2,199,694 | |
| Wal-Mart Stores Inc., 0.08%, 7/29/2011 | | | 7,500,000 | | | | 7,499,533 | |
Total Commercial Paper (Cost $58,729,074) | | | | 58,729,074 | |
| | |
| Short-Term Notes* 21.7% | |
| Abbey National Treasury Services PLC, 0.38%, 9/2/2011 | | | 1,500,000 | | | | 1,500,000 | |
| Australia & New Zealand Banking Group Ltd., 144A, 0.31%, 1/20/2012 | | | 1,200,000 | | | | 1,200,000 | |
| Bank of Nova Scotia: | |
| 0.2%, 8/25/2011 | | | 1,400,000 | | | | 1,400,000 | |
| 0.25%, 9/12/2011 | | | 800,000 | | | | 800,000 | |
| 0.3%, 7/10/2012 | | | 1,000,000 | | | | 1,000,000 | |
| 0.33%, 12/8/2011 | | | 800,000 | | | | 800,000 | |
| Barclays Bank PLC, 0.505%, 7/19/2011 | | | 2,000,000 | | | | 2,000,000 | |
| Caisse d'Amortissement de la Dette Sociale, 144A, 0.273%, 5/25/2012 | | | 2,000,000 | | | | 1,999,801 | |
| Canadian Imperial Bank of Commerce, 0.265%, 4/26/2012 | | | 1,200,000 | | | | 1,200,000 | |
| Commonwealth Bank of Australia: | |
| 144A, 0.279%, 5/11/2012 | | | 2,000,000 | | | | 2,000,000 | |
| 144A, 0.288%, 2/3/2012 | | | 1,000,000 | | | | 1,000,000 | |
| JPMorgan Chase Bank NA, 0.275%, 7/9/2012 | | | 2,000,000 | | | | 2,000,000 | |
| | | Principal Amount ($) | | | Value ($) | |
| | | | | | | | | |
| Kells Funding LLC: | |
| 144A, 0.287%, 8/15/2011 | | | 1,200,000 | | | | 1,200,000 | |
| 144A, 0.291%, 2/27/2012 | | | 1,000,000 | | | | 1,000,000 | |
| 144A, 0.315%, 2/24/2012 | | | 1,750,000 | | | | 1,750,000 | |
| 144A, 0.331%, 12/1/2011 | | | 1,000,000 | | | | 1,000,000 | |
| Landesbank Baden-Wuerttemberg, 144A, 0.465%, 6/22/2012 | | | 7,250,000 | | | | 7,250,000 | |
| Lloyds TSB Bank PLC, 0.265%, 5/11/2012 | | | 2,000,000 | | | | 2,000,000 | |
| Nordea Bank Finland PLC: | |
| 0.574%, 10/20/2011 | | | 2,000,000 | | | | 2,001,782 | |
| 0.58%, 10/14/2011 | | | 2,000,000 | | | | 2,001,680 | |
| Rabobank Nederland NV: | |
| 0.269%, 1/10/2012 | | | 750,000 | | | | 750,000 | |
| 144A, 0.396%, 9/28/2011 | | | 1,000,000 | | | | 1,000,365 | |
| Royal Bank of Canada, 0.29%, 8/12/2011 | | | 1,200,000 | | | | 1,200,000 | |
| Societe Generale, 0.19%, 8/1/2011 | | | 2,000,000 | | | | 2,000,000 | |
| Svenska Handelsbanken AB, 144A, 0.291%, 6/29/2012 | | | 750,000 | | | | 750,000 | |
| Toronto-Dominion Bank, 0.209%, 5/11/2012 | | | 1,000,000 | | | | 1,000,000 | |
| Westpac Banking Corp.: | |
| 0.25%, 10/12/2011 | | | 1,000,000 | | | | 1,000,000 | |
| 0.278%, 7/11/2012 | | | 750,000 | | | | 750,000 | |
| 0.279%, 5/9/2012 | | | 1,500,000 | | | | 1,500,000 | |
| 144A, 0.323%, 10/28/2011 | | | 1,000,000 | | | | 1,000,075 | |
| 0.34%, 1/10/2012 | | | 1,500,000 | | | | 1,500,000 | |
Total Short-Term Notes (Cost $47,553,703) | | | | 47,553,703 | |
| | |
| Government & Agency Obligations 12.9% | |
| Foreign Government Obligations 0.5% | |
| Kingdom of Denmark, 2.75%, 11/15/2011 | | | 1,000,000 | | | | 1,008,642 | |
| Other Government Related 1.0% | |
| European Investment Bank, 2.625%, 11/15/2011 (a) | | | 2,100,000 | | | | 2,117,706 | |
| US Government Sponsored Agencies 6.5% | |
| Federal Farm Credit Bank: | |
| 0.17%*, 11/2/2011 | | | 750,000 | | | | 749,987 | |
| 0.318%**, 12/16/2011 | | | 800,000 | | | | 798,805 | |
| | | Principal Amount ($) | | | Value ($) | |
| | | | | | | | | |
| Federal Home Loan Bank: | |
| 0.089%**, 9/21/2011 | | | 1,000,000 | | | | 999,795 | |
| 0.13%, 1/23/2012 | | | 2,000,000 | | | | 1,999,628 | |
| 0.24%, 10/28/2011 | | | 1,800,000 | | | | 1,799,625 | |
| 0.25%, 10/28/2011 | | | 750,000 | | | | 749,980 | |
| 0.267%**, 9/12/2011 | | | 2,500,000 | | | | 2,498,631 | |
| Federal National Mortgage Association: | |
| 0.086%*, 7/27/2011 | | | 1,200,000 | | | | 1,199,944 | |
| 0.149%**, 1/17/2012 | | | 2,500,000 | | | | 2,497,917 | |
| 0.159%**, 11/21/2011 | | | 1,000,000 | | | | 999,365 | |
| | | | | 14,293,677 | |
| US Treasury Obligations 4.9% | |
| US Treasury Bill, 0.217%**, 10/20/2011 | | | 1,000,000 | | | | 999,329 | |
| US Treasury Notes: | |
| 0.875%, 1/31/2012 | | | 1,250,000 | | | | 1,254,884 | |
| 1.0%, 9/30/2011 | | | 2,000,000 | | | | 2,003,611 | |
| 1.0%, 10/31/2011 | | | 1,000,000 | | | | 1,002,514 | |
| 1.125%, 12/15/2011 | | | 1,200,000 | | | | 1,204,494 | |
| 4.625%, 8/31/2011 | | | 2,800,000 | | | | 2,820,427 | |
| 4.625%, 10/31/2011 | | | 1,500,000 | | | | 1,521,729 | |
| | | | | 10,806,988 | |
Total Government & Agency Obligations (Cost $28,227,013) | | | | 28,227,013 | |
| | |
| Repurchase Agreements 27.8% | |
| JPMorgan Securities, Inc., 0.0001%, dated 6/30/2011, to be repurchased at $39,000,000 on 7/1/2011 (b) | | | 39,000,000 | | | | 39,000,000 | |
| Merrill Lynch & Co., Inc., 0.05%, dated 6/30/2011, to be repurchased at $21,823,789 on 7/1/2011 (c) | | | 21,823,759 | | | | 21,823,759 | |
Total Repurchase Agreements (Cost $60,823,759) | | | | 60,823,759 | |
| | | % of Net Assets | | | Value ($) | |
| | | | |
Total Investment Portfolio (Cost $220,431,677)+ | | | 100.6 | | | | 220,431,677 | |
| Other Assets and Liabilities, Net | | | (0.6 | ) | | | (1,375,565 | ) |
| Net Assets | | | 100.0 | | | | 219,056,112 | |
* These securities are shown at their current rate as of June 30, 2011. Floating rate securities' yields vary with a designated market index or market rate, such as the coupon-equivalent of the US Treasury bill rate.
** Annualized yield at time of purchase; not a coupon rate.
+ The cost for federal income tax purposes was $220,431,677.
(a) Government-backed debt issued by financial companies or government sponsored enterprises.
(b) Collateralized by $39,825,000 US Treasury Note, 1.375% maturing on 11/30/2015 with a value of $39,825,864.
(c) Collateralized by:
| Principal Amount ($) | | Security | | Rate % | | Maturity Date | | Collateral Value ($) | |
| | 18,400,000 | | Federal National Morgage Association | | Zero Coupon | | 5/1/2012 | | | 18,371,848 | |
| | 3,890,000 | | Federal Home Loan Bank | | | 0.136 | | 11/26/2012 | | | 3,888,250 | |
| Total Collateral Value | | | 22,260,098 | |
144A: Security exempt from registration under Rule 144A of the Securities Act of 1933. These securities may be resold in transactions exempt from registration, normally to qualified institutional buyers.
Fair Value Measurements
Various inputs are used in determining the value of the Fund's investments. These inputs are summarized in three broad levels. Level 1 includes quoted prices in active markets for identical securities. Level 2 includes other significant observable inputs (including quoted prices for similar securities, interest rates, prepayment speeds, and credit risk). Level 3 includes significant unobservable inputs (including the Fund's own assumptions in determining the fair value of investments). The inputs or methodology used for valuing securities are not necessarily an indication of the risk associated with investing in those securities. Securities held by the Fund are reflected as Level 2 because the securities are valued at amortized cost (which approximates fair value) and, accordingly, the inputs used to determine value are not quoted prices in an active market.
The following is a summary of the inputs used as of June 30, 2011 in valuing the Fund's investments. For information on the Fund's policy regarding the valuation of investments, please refer to the Security Valuation section of Note A in the accompanying Notes to Financial Statements.
| Assets | | Level 1 | | | Level 2 | | | Level 3 | | | Total | |
| | |
| Investments in Securities (d) | | $ | — | | | $ | 159,607,918 | | | $ | — | | | $ | 159,607,918 | |
| Repurchase Agreements | | | — | | | | 60,823,759 | | | | — | | | | 60,823,759 | |
| Total | | $ | — | | | $ | 220,431,677 | | | $ | — | | | $ | 220,431,677 | |
There have been no transfers between Level 1 and Level 2 fair value measurements during the period ended June 30, 2011.
(d) See Investment Portfolio for additional detailed categorizations.
The accompanying notes are an integral part of the financial statements.
Statement of Assets and Liabilities | as of June 30, 2011 (Unaudited) | |
| Assets | |
Investments: Investment in non-affiliated securities, valued at amortized cost | | $ | 159,607,918 | |
| Repurchase agreements, valued at amortized cost | | | 60,823,759 | |
| Total investments, valued at amortized cost | | | 220,431,677 | |
| Cash | | | 8 | |
| Receivable for Fund shares sold | | | 382,406 | |
| Interest receivable | | | 133,833 | |
| Due from Advisor | | | 12,700 | |
| Other assets | | | 1,216 | |
| Total assets | | | 220,961,840 | |
| Liabilities | |
| Payable for investments purchased | | | 1,498,770 | |
| Payable for Fund shares redeemed | | | 347,601 | |
| Distributions payable | | | 878 | |
| Other accrued expenses and payables | | | 58,479 | |
| Total liabilities | | | 1,905,728 | |
| Net assets, at value | | $ | 219,056,112 | |
| Net Assets Consist of | |
| Distributions in excess of net investment income | | | (1,007 | ) |
| Accumulated net realized gain (loss) | | | 1,198 | |
| Paid-in capital | | | 219,055,921 | |
| Net assets, at value | | $ | 219,056,112 | |
Class A Net Asset Value, offering and redemption price per share ($219,056,112 ÷ 219,139,637 outstanding shares of beneficial interest, no par value, unlimited number of shares authorized) | | $ | 1.00 | |
The accompanying notes are an integral part of the financial statements.
Statement of Operations
| for the six months ended June 30, 2011 (Unaudited) | |
| Investment Income | |
Income: Interest | | $ | 297,371 | |
Expenses: Management fee | | | 293,960 | |
| Administration fee | | | 103,147 | |
| Services to shareholders | | | 824 | |
| Custodian fee | | | 11,922 | |
| Professional fees | | | 28,329 | |
| Reports to shareholders | | | 72,148 | |
| Trustees' fee and expenses | | | 4,889 | |
| Other | | | 6,488 | |
| Total expenses | | | 521,707 | |
| Expense reductions | | | (234,654 | ) |
| Total expenses after expense reductions | | | 287,053 | |
| Net investment income | | | 10,318 | |
| Net realized gain (loss) | | | 1,198 | |
| Net increase (decrease) in net assets resulting from operations | | $ | 11,516 | |
The accompanying notes are an integral part of the financial statements.
Statement of Changes in Net Assets | Increase (Decrease) in Net Assets | | Six Months Ended June 30, 2011 (Unaudited) | | | Year Ended December 31, 2010 | |
Operations: Net investment income | | $ | 10,318 | | | $ | 24,815 | |
| Net realized gain (loss) | | | 1,198 | | | | 1,201 | |
| Net increase (decrease) in net assets resulting from operations | | | 11,516 | | | | 26,016 | |
Distributions to shareholders from: Net investment income Class A | | | (10,318 | ) | | | (24,815 | ) |
| Total distributions | | $ | (10,318 | ) | | $ | (24,815 | ) |
Fund share transactions: Class A Proceeds from shares sold | | | 54,737,578 | | | | 111,590,276 | |
| Reinvestment of distributions | | | 10,447 | | | | 26,864 | |
| Payments for shares redeemed | | | (55,609,656 | ) | | | (161,340,354 | ) |
| Net increase (decrease) in net assets from Class A share transactions | | | (861,631 | ) | | | (49,723,214 | ) |
| Increase (decrease) in net assets | | | (860,433 | ) | | | (49,722,013 | ) |
| Net assets at beginning of period | | | 219,916,545 | | | | 269,638,558 | |
| Net assets at end of period (including distributions in excess of net investment income of $1,007 and $1,007, respectively) | | $ | 219,056,112 | | | $ | 219,916,545 | |
| Other Information | |
Class A Shares outstanding at beginning of period | | | 220,001,268 | | | | 269,724,482 | |
| Shares sold | | | 54,737,578 | | | | 111,590,276 | |
| Shares issued to shareholders in reinvestment of distributions | | | 10,447 | | | | 26,864 | |
| Shares redeemed | | | (55,609,656 | ) | | | (161,340,354 | ) |
| Net increase (decrease) in Class A shares | | | (861,631 | ) | | | (49,723,214 | ) |
| Shares outstanding at end of period | | | 219,139,637 | | | | 220,001,268 | |
The accompanying notes are an integral part of the financial statements.
| | | | | | Years Ended December 31, | |
| Class A | | Six Months Ended 6/30/11 (Unaudited) | | | 2010 | | | 2009 | | | 2008 | | | 2007 | | | 2006 | |
| Selected Per Share Data | |
| Net asset value, beginning of period | | $ | 1.000 | | | $ | 1.000 | | | $ | 1.000 | | | $ | 1.000 | | | $ | 1.000 | | | $ | 1.000 | |
Income from investment operations: Net investment income | | | .000 | *** | | | .000 | *** | | | .003 | | | | .026 | | | | .049 | | | | .046 | |
| Total from investment operations | | | .000 | *** | | | .000 | *** | | | .003 | | | | .026 | | | | .049 | | | | .046 | |
Less distributions from: Net investment income | | | .000 | *** | | | .000 | *** | | | (.003 | ) | | | (.026 | ) | | | (.049 | ) | | | (.046 | ) |
| Net asset value, end of period | | $ | 1.000 | | | $ | 1.000 | | | $ | 1.000 | | | $ | 1.000 | | | $ | 1.000 | | | $ | 1.000 | |
| Total Return (%) | | | .00 | a** | | | .01 | a | | | .34 | | | | 2.64 | a | | | 5.00 | a | | | 4.65 | a |
| Ratios to Average Net Assets and Supplemental Data | |
| Net assets, end of period ($ millions) | | | 219 | | | | 220 | | | | 270 | | | | 398 | | | | 355 | | | | 294 | |
| Ratio of expenses before expense reductions (%) | | | .51 | * | | | .46 | | | | .43 | | | | .52 | | | | .46 | | | | .52 | |
| Ratio of expenses after expense reductions (%) | | | .28 | * | | | .34 | | | | .43 | | | | .50 | | | | .45 | | | | .51 | |
| Ratio of net investment income (%) | | | .01 | * | | | .01 | | | | .37 | | | | 2.56 | | | | 4.88 | | | | 4.58 | |
a Total return would have been lower had certain expenses not been reduced. * Annualized ** Not annualized *** Amount is less than $.0005. | |
Notes to Financial Statements (Unaudited)
A. Organization and Significant Accounting Policies
DWS Money Market VIP (the "Fund") is a diversified series of DWS Variable Series II (the "Trust"), which is registered under the Investment Company Act of 1940, as amended (the "1940 Act"), as an open-end management investment company organized as a Massachusetts business trust.
The Fund's financial statements are prepared in accordance with accounting principles generally accepted in the United States of America which require the use of management estimates. Actual results could differ from those estimates. The policies described below are followed consistently by the Fund in the preparation of its financial statements.
Security Valuation. Various inputs are used in determining the value of the Fund's investments. These inputs are summarized in three broad levels. Level 1 includes quoted prices in active markets for identical securities. Level 2 includes other significant observable inputs (including quoted prices for similar securities, interest rates, prepayment speeds, and credit risk). Level 3 includes significant unobservable inputs (including the Fund's own assumptions in determining the fair value of investments). The inputs or methodology used for valuing securities are not necessarily an indication of the risk associated with investing in those securities.
The Fund values all securities utilizing the amortized cost method permitted in accordance with Rule 2a-7 under the 1940 Act and certain conditions therein. Under this method, which does not take into account unrealized capital gains or losses on securities, an instrument is initially valued at its cost and thereafter assumes a constant accretion/amortization rate to maturity of any discount or premium. Securities held by the Fund are reflected as Level 2 because the securities are valued at amortized cost (which approximates fair value) and, accordingly, the inputs used to determine value are not quoted prices in an active market.
Disclosure about the classification of fair value measurements is included in a table following the Fund's Investment Portfolio.
Repurchase Agreements. The Fund may enter into repurchase agreements with certain banks and broker/dealers whereby the Fund, through its custodian or a sub-custodian bank, receives delivery of the underlying securities, the amount of which at the time of purchase and each subsequent business day is required to be maintained at such a level that the value is equal to at least the principal amount of the repurchase price plus accrued interest. The custodian or another designated sub-custodian bank holds the collateral in a separate account until the agreement matures. If the value of the securities falls below the principal amount of the repurchase agreement plus accrued interest, the financial institution deposits additional collateral by the following business day. If the financial institution either fails to deposit the required additional collateral or fails to repurchase the securities as agreed, the Fund has the right to sell the securities and recover any resulting loss from the financial institution. If the financial institution enters into bankruptcy, the Fund's claim on the collateral may be subject to legal proceedings.
Federal Income Taxes. The Fund's policy is to comply with the requirements of the Internal Revenue Code, as amended, which are applicable to regulated investment companies and to distribute all of its taxable income to its shareholders.
The Fund has reviewed the tax positions for the open tax years as of December 31, 2010 and has determined that no provision for income tax is required in the Fund's financial statements. The Fund's federal tax returns for the prior three fiscal years remain open subject to examination by the Internal Revenue Service.
Distribution of Income and Gains. Net investment income of the Fund is declared as a daily dividend and is distributed to shareholders monthly. The Fund may take into account capital gains and losses in its daily dividend declarations. The Fund may also make additional distributions for tax purposes if necessary.
Permanent book and tax differences relating to shareholder distributions will result in reclassifications to paid-in capital. Temporary book and tax differences will reverse in a subsequent period. There were no significant book to tax differences for the Fund.
The tax character of current year distributions will be determined at the end of the current fiscal year.
Expenses. Expenses of the Trust arising in connection with a specific fund are allocated to that fund. Other Trust expenses which cannot be directly attributed to a fund are apportioned among the funds in the Trust.
Contingencies. In the normal course of business, the Fund may enter into contracts with service providers that contain general indemnification clauses. The Fund's maximum exposure under these arrangements is unknown as this would involve future claims that may be made against the Fund that have not yet been made. However, based on experience, the Fund expects the risk of loss to be remote.
Other. Investment transactions are accounted for on a trade date. Interest income is recorded on the accrual basis. Realized gains and losses from investment transactions are recorded on an identified cost basis. All discounts and premiums are accreted/amortized for both tax and financial reporting purposes.
B. Related Parties
Management Agreement. Under the Investment Management Agreement with Deutsche Investment Management Americas Inc. ("DIMA" or the "Advisor"), an indirect, wholly owned subsidiary of Deutsche Bank AG, the Advisor directs the investments of the Fund in accordance with its investment objectives, policies and restrictions. The Advisor determines the securities, instruments and other contracts relating to investments to be purchased, sold or entered into by the Fund.
Pursuant to the Investment Management Agreement with the Advisor, the Fund pays a monthly management fee based on the Fund's average daily net assets, computed and accrued daily and payable monthly, at the following annual rates:
| $0-$500 million | | | .285 | % |
| next $500 million | | | .270 | % |
| next $1.0 billion | | | .255 | % |
| over $2.0 billion | | | .240 | % |
For the period from January 1, 2011 through September 30, 2011, the Advisor has contractually agreed to waive its fee and/or reimburse certain operating expenses to the extent necessary to maintain the operating expenses (excluding certain expenses such as extraordinary expenses, taxes, brokerage and interest expense) at 0.51%.
Accordingly, for the six months ended June 30, 2011, the Advisor waived a portion of its management fee pursuant to the Investment Management Agreement aggregating $234,313, and the amount charged aggregated $59,647, which was equivalent to an annualized effective rate of 0.06% of the Fund's average daily net assets.
In addition, the Advisor has agreed to voluntarily waive additional expenses for the Fund. The waiver may be changed or terminated at any time without notice. Under this arrangement, the Advisor waived certain expenses of the Fund.
Administration Fee. Pursuant to an Administrative Services Agreement, DIMA provides most administrative services to the Fund. For all services provided under the Administrative Services Agreement, the Fund pays DIMA an annual fee ("Administration Fee") of 0.10% of the Fund's average daily net assets, computed and accrued daily and payable monthly. For the six months ended June 30, 2011, the Administration Fee was $103,147, of which $16,965 is unpaid.
Service Provider Fees. DWS Investments Service Company ("DISC"), an affiliate of the Advisor, is the transfer agent, dividend-paying agent and shareholder service agent for the Fund. Pursuant to a sub-transfer agency agreement between DISC and DST Systems, Inc. ("DST"), DISC has delegated certain transfer agent, dividend-paying agent and shareholder service agent functions to DST. DISC compensates DST out of the shareholder servicing fee it receives from the Fund. For the six months ended June 30, 2011, the amounts charged to the Fund by DISC aggregated $341, all of which was waived.
Typesetting and Filing Service Fees. Under an agreement with DIMA, DIMA is compensated for providing typesetting and certain regulatory filing services to the Fund. For the six months ended June 30, 2011, the amount charged to the Fund by DIMA included in the Statement of Operations under "reports to shareholders" aggregated $5,036, of which $496 is unpaid.
Trustees' Fees and Expenses. The Fund paid each Trustee not affiliated with the Advisor retainer fees plus specified amounts for various committee services and for the Board Chairperson.
C. Ownership of the Fund
At June 30, 2011, three Participating Insurance Companies were owners of record of 10% or more of the total outstanding Class A shares of the Fund, each owning 31%, 22% and 14%.
D. Line of Credit
The Fund and other affiliated funds (the "Participants") share in a $450 million revolving credit facility provided by a syndication of banks. The Fund may borrow for temporary or emergency purposes, including the meeting of redemption requests that otherwise might require the untimely disposition of securities. The Participants are charged an annual commitment fee which is allocated based on net assets, among each of the Participants. Interest is calculated at a rate per annum equal to the sum of the Federal Funds Rate plus 1.25 percent plus if LIBOR exceeds the Federal Funds Rate the amount of such excess. The Fund may borrow up to a maximum of 33 percent of its net assets under the agreement: The Fund had no outstanding loans at June 30, 2011.
The Trust's policies and procedures for voting proxies for portfolio securities and information about how the Trust voted proxies related to its portfolio securities during the 12-month period ended June 30 are available on our Web site — www.dws-investments.com (click on "proxy voting" at the bottom of the page) — or on the SEC's Web site — www.sec.gov. To obtain a written copy of the Trust's policies and procedures without charge, upon request, call us toll free at (800) 728-3337.
Summary of Management Fee Evaluation by Independent Fee Consultant
October 3, 2010
Pursuant to an Order entered into by Deutsche Investment Management Americas and affiliates (collectively, "DeAM") with the Attorney General of New York, I, Thomas H. Mack, have been appointed the Independent Fee Consultant for the DWS Funds (formerly the DWS Scudder Funds). My duties include preparing an annual written evaluation of the management fees DeAM charges the Funds, considering among other factors the management fees charged by other mutual fund companies for like services, management fees DeAM charges other clients for like services, DeAM's costs of supplying services under the management agreements and related profit margins, possible economies of scale if a Fund grows larger, and the nature and quality of DeAM's services, including fund performance. This report summarizes my evaluation for 2010, including my qualifications, the evaluation process for each of the DWS Funds, consideration of certain complex-level factors, and my conclusions. I served in substantially the same capacity in 2007, 2008, and 2009.
Qualifications
For more than 35 years I have served in various professional capacities within the investment management business. I have held investment analysis and advisory positions, including securities analyst, portfolio strategist and director of investment policy with a large investment firm. I have also performed business management functions, including business development, financial management and marketing research and analysis.
Since 1991, I have been an independent consultant within the asset management industry. I have provided services to over 125 client organizations, including investment managers, mutual fund boards, product distributors and related organizations. Over the past ten years I have completed a number of assignments for mutual fund boards, specifically including assisting boards with management contract renewal.
I hold a Master of Business Administration degree, with highest honors, from Harvard University and Master of Science and Bachelor of Science (highest honors) degrees from the University of California at Berkeley. I am an independent director and audit committee financial expert for two closed-end mutual funds and have served in various leadership and financial oversight capacities with non-profit organizations.
Evaluation of Fees for each DWS Fund
My work focused primarily on evaluating, fund-by-fund, the fees charged to each of the 118 publicly offered Fund portfolios in the DWS Fund family. For each Fund, I considered each of the key factors mentioned above, as well as any other relevant information. In doing so I worked closely with the Funds' Independent Directors in their annual contract renewal process, as well as in their approval of contracts for several new funds (documented separately).
In evaluating each Fund's fees, I reviewed comprehensive materials provided by or on behalf of DeAM, including expense information prepared by Lipper Analytical, comparative performance information, profitability data, manager histories, and other materials. I also accessed certain additional information from the Lipper and Morningstar databases and drew on my industry knowledge and experience.
To facilitate evaluating this considerable body of information, I prepared for each Fund a document summarizing the key data elements in each area as well as additional analytics discussed below. This made it possible to consider each key data element in the context of the others.
In the course of contract renewal, DeAM agreed to implement a number of fee and expense adjustments requested by the Independent Directors which will favorably impact future fees and expenses, and my evaluation includes the effects of these changes.
Fees and Expenses Compared with Other Funds
The competitive fee and expense evaluation for each fund focused on two primary comparisons:
The Fund's contractual management fee (the advisory fee plus the administration fee where applicable) compared with those of a group of typically 12-15 funds in the same Lipper investment category (e.g. Large Capitalization Growth) having similar distribution arrangements and being of similar size.
The Fund's total expenses compared with a broader universe of funds from the same Lipper investment category and having similar distribution arrangements.
These two comparisons provide a view of not only the level of the fee compared with funds of similar scale but also the total expense the Fund bears for all the services it receives, in comparison with the investment choices available in the Fund's investment category and distribution channel. The principal figure-of-merit used in these comparisons was the subject Fund's percentile ranking against peers.
DeAM's Fees for Similar Services to Others
DeAM provided management fee schedules for all of its US domiciled fund and non-fund investment management accounts in any of the investment categories where there is a DWS Fund. These similar products included the other DWS Funds, non-fund pooled accounts, institutional accounts and sub-advisory accounts. Using this information, I calculated for each Fund the fee that would be charged to each similar product, at the subject Fund's asset level.
Evaluating information regarding non-fund products is difficult because there are varying levels of services required for different types of accounts, with mutual funds generally requiring considerably more regulatory and administrative types of service as well as having more frequent cash flows than other types of accounts. Also, while mutual fund fees for similar fund products can be expected to be similar, there will be some differences due to different pricing conditions in different distribution channels (e.g. retail funds versus those used in variable insurance products), differences in underlying investment processes and other factors.
Costs and Profit Margins
DeAM provided a detailed profitability analysis for each Fund. After making some adjustments so that the presentation would be more comparable to the available industry figures, I reviewed profit margins from investment management alone, from investment management plus other fund services (excluding distribution) provided to the Funds by DeAM (principally shareholder services), and DeAM profits from all sources, including distribution. A later section comments on overall profitability.
Economies of Scale
Economies of scale — an expected decline in management cost per dollar of fund assets as fund assets grow — are very rarely quantified and documented because of inherent difficulties in collecting and analyzing relevant data. However, in virtually every investment category that I reviewed, larger funds tend to have lower fees and lower total expenses than smaller funds. To see how each DWS Fund compares with this industry observation, I reviewed:
The trend in Fund assets over the last five years and the accompanying trend in total expenses. This shows if the Fund has grown and, if so, whether total expense (management fees as well as other expenses) have declined as a percent of assets.
Whether the Fund has break-points in its management fee schedule, the extent of the fee reduction built into the schedule and the asset levels where the breaks take effect, and in the case of a sub-advised Fund how the Fund's break-points compare with those of the sub-advisory fee schedule.
How the Fund's contractual fee schedule compares with trends in the industry data. To accomplish this, I constructed a chart showing how actual latest-fiscal-year contractual fees of the Fund and of other similar funds relate to average fund assets, with the subject Fund's contractual fee schedule superimposed.
Quality of Service — Performance
The quality-of-service evaluation focused on investment performance, which is the principal result of the investment management service. Each Fund's performance was reviewed over the past 1, 3, 5 and 10 years, as applicable, and compared with that of other funds in the same investment category and with a suitable market index.
In addition, I calculated and reviewed risk-adjusted returns relative to an index of similar mutual funds' returns and a suitable market index. The risk-adjusted returns analysis provides a way of determining the extent to which the Fund's return comparisons are mainly the product of investment value-added (or lack thereof) or alternatively taking considerably more or less risk than is typical in its investment category.
I also received and considered the history of portfolio manager changes for each Fund, as this provided an important context for evaluating the performance results.
Complex-Level Considerations
While this evaluation was conducted mainly at the individual fund level, there are some issues relating to the reasonableness of fees that can alternatively be considered across the whole fund complex:
I reviewed DeAM's profitability analysis for all DWS Funds, with a view toward determining if the allocation procedures used were reasonable and how profit levels compared with public data for other investment managers.
I considered whether DeAM and affiliates receive any significant ancillary or "fall-out" benefits that should be considered in interpreting the direct profitability results. These would be situations where serving as the investment manager of the Funds is beneficial to another part of the Deutsche Bank organization.
I considered how aggregated DWS Fund expenses had varied over the years, by asset class and in the context of trends in asset levels.
I reviewed the structure of the DeAM organization, trends in staffing levels, and information on compensation of investment management and other professionals compared with industry data.
Findings
Based on the process and analysis discussed above, which included reviewing a wide range of information from management and external data sources and considering among other factors the fees DeAM charges other clients, the fees charged by other fund managers, DeAM's costs and profits associated with managing the Funds, economies of scale, possible fall-out benefits, and the nature and quality of services provided, in my opinion the management fees charged the DWS Funds are reasonable.
Thomas H. Mack
Summary of Administrative Fee Evaluation by Independent Fee Consultant
October 4, 2010
Pursuant to an Order entered into by Deutsche Asset Management (DeAM) with the Attorney General of New York, I, Thomas H. Mack, have been appointed the Independent Fee Consultant for the DWS Funds and have as part of my duties evaluated the reasonableness of a proposed pass-through to the funds of certain reporting costs associated with new regulations for money funds. My evaluation considered the following:
• My recently completed annual evaluation (please see my summary report of October 3, 2010), concluding that the prospective fees and expenses of all the DWS-sponsored money funds are reasonable.
• The fact that in my opinion the services DWS would provide under the combination of the Advisory and proposed Administration Agreements continues to be comparable with those typically provided to competitive funds under their management agreements.
• Management's analysis showing that the maximum total expense ratio impact of this change on any fund share class would be 1.3 basis points, which in my opinion is not material to my conclusions about the reasonableness of expenses.
Based on the foregoing considerations, in my opinion the proposed fees and expenses for the affected DWS-sponsored money funds are reasonable.
Thomas H. Mack
Notes
DWS Investments Distributors, Inc.
222 South Riverside Plaza
Chicago, IL 60606
(800) 621-1148
VS2MM-3 (R-023299-1 8/11)
JUNE 30, 2011
SEMIANNUAL REPORT
DWS VARIABLE SERIES II
DWS Small Mid Cap Growth VIP
(formerly DWS Small Cap Growth VIP)
Contents
3 Performance Summary 4 Information About Your Fund's Expenses 5 Portfolio Summary 6 Investment Portfolio 9 Statement of Assets and Liabilities 10 Statement of Operations 11 Statement of Changes in Net Assets 13 Financial Highlights 14 Notes to Financial Statements 17 Proxy Voting 18 Summary of Management Fee Evaluation by Independent Fee Consultant |
This report must be preceded or accompanied by a prospectus. To obtain an additional prospectus or summary prospectus, if available, call (800) 728-3337 or your financial representative. We advise you to consider the Fund's objectives, risks, charges and expenses carefully before investing. The summary prospectus and prospectus contain this and other important information about the Fund. Please read the prospectus carefully before you invest.
Stocks of smaller and medium-sized companies involve greater risk than securities of larger, more-established companies. Stocks may decline in value. See the prospectus for details.
DWS Investments is part of Deutsche Bank's Asset Management division and, within the US, represents the retail asset management activities of Deutsche Bank AG, Deutsche Bank Trust Company Americas, Deutsche Investment Management Americas Inc. and DWS Trust Company.
NOT FDIC/NCUA INSURED NO BANK GUARANTEE MAY LOSE VALUE NOT A DEPOSIT
NOT INSURED BY ANY FEDERAL GOVERNMENT AGENCY
Performance Summary June 30, 2011
Fund performance shown is historical, assumes reinvestment of all dividend and capital gain distributions and does not guarantee future results. Investment return and principal value fluctuate with changing market conditions so that, when redeemed, shares may be worth more or less than their original cost. Current performance may be lower or higher than the performance data quoted. Please contact your participating insurance company for the Fund's most recent month-end performance. Performance doesn't reflect charges and fees ("contract charges") associated with the separate account that invests in the Fund or any variable life insurance policy or variable annuity contract for which the Fund is an investment option. These charges and fees will reduce returns.
The gross expense ratio of the Fund, as stated in the fee table of the prospectus dated May 1, 2011 is 0.78% for Class A shares and may differ from the expense ratio disclosed in the Financial Highlights table in this report.
| Growth of an Assumed $10,000 Investment in DWS Small Mid Cap Growth VIP |
[] DWS Small Mid Cap Growth VIP — Class A [] Russell 2500™ Growth Index [] Russell 2000® Growth Index | The Russell 2500™ Growth Index is an unmanaged index that measures the performance of the small to mid-cap growth segment of the U.S. equity universe. It includes those Russell 2500 companies with higher price-to-book ratios and higher forecasted growth values. Effective May 1, 2011, the Russell 2500 Growth Index replaces the Russell 2000 Growth Index as the fund's benchmark index because the Advisor believes that it better reflects the fund's investment strategy. The Russell 2000® Growth Index is an unmanaged, capitalization-weighted measure of 2,000 of the smallest capitalized US companies with a greater-than-average growth orientation and whose common stocks trade on the NYSE, NYSE Alternext US (formerly known as "Amex") and Nasdaq. Index returns do not reflect any fees or expenses and it is not possible to invest directly into an index. |
| |
| Yearly periods ended June 30 | |
| Comparative Results | |
| DWS Small Mid Cap Growth VIP | | 6-Month‡ | | | 1-Year | | | 3-Year | | | 5-Year | | | 10-Year | |
| Class A | Growth of $10,000 | | $ | 11,046 | | | $ | 14,725 | | | $ | 12,104 | | | $ | 10,975 | | | $ | 10,132 | |
| Average annual total return | | | 10.46 | % | | | 47.25 | % | | | 6.57 | % | | | 1.88 | % | | | 0.13 | % |
| Russell 2500 Growth Index | Growth of $10,000 | | $ | 11,025 | | | $ | 14,471 | | | $ | 12,778 | | | $ | 13,810 | | | $ | 17,117 | |
| Average annual total return | | | 10.25 | % | | | 44.71 | % | | | 8.51 | % | | | 6.67 | % | | | 5.52 | % |
| Russell 2000 Growth Index | Growth of $10,000 | | $ | 10,859 | | | $ | 14,350 | | | $ | 12,721 | | | $ | 13,252 | | | $ | 15,730 | |
| Average annual total return | | | 8.59 | % | | | 43.50 | % | | | 8.35 | % | | | 5.79 | % | | | 4.63 | % |
The growth of $10,000 is cumulative.
‡ Total returns shown for periods less than one year are not annualized.
Information About Your Fund's Expenses
As an investor of the Fund, you incur two types of costs: ongoing expenses and transaction costs. Ongoing expenses include management fees and other Fund expenses. Examples of transaction costs include contract charges and account maintenance fees, which are not shown in this section. The following tables are intended to help you understand your ongoing expenses (in dollars) of investing in the Fund and to help you compare these expenses with the ongoing expenses of investing in other mutual funds. The example in the table is based on an investment of $1,000 invested at the beginning of the six-month period and held for the entire period (January 1, 2011 to June 30, 2011).
The tables illustrate your Fund's expenses in two ways:
•Actual Fund Return. This helps you estimate the actual dollar amount of ongoing expenses (but not transaction costs) paid on a $1,000 investment in the Fund using the Fund's actual return during the period. To estimate the expenses you paid over the period, simply divide your account value by $1,000 (for example, an $8,600 account value divided by $1,000 = 8.6), then multiply the result by the number in the "Expenses Paid per $1,000" line under the share class you hold.
• Hypothetical 5% Fund Return. This helps you to compare your Fund's ongoing expenses (but not transaction costs) with those of other mutual funds using the Fund's actual expense ratio and a hypothetical rate of return of 5% per year before expenses. Examples using a 5% hypothetical Fund return may be found in the shareholder reports of other mutual funds. The hypothetical account values and expenses may not be used to estimate the actual ending account balance or expenses you paid for the period.
Please note that the expenses shown in these tables are meant to highlight your ongoing expenses only and do not reflect any transaction costs. The "Expenses Paid per $1,000" line of the tables is useful in comparing ongoing expenses only and will not help you determine the relative total expense of owning different funds. If these transaction costs had been included, your costs would have been higher.
Expenses and Value of a $1,000 Investment for the six months ended June 30, 2011 | |
| Actual Fund Return | | Class A | |
| Beginning Account Value 1/1/11 | | $ | 1,000.00 | |
| Ending Account Value 6/30/11 | | $ | 1,104.60 | |
| Expenses Paid per $1,000* | | $ | 4.12 | |
| Hypothetical 5% Fund Return | | Class A | |
| Beginning Account Value 1/1/11 | | $ | 1,000.00 | |
| Ending Account Value 6/30/11 | | $ | 1,020.88 | |
| Expenses Paid per $1,000* | | $ | 3.96 | |
* Expenses are equal to the Fund's annualized expense ratio, multiplied by the average account value over the period, multiplied by the number of days in the most recent six-month period, then divided by 365.
| Annualized Expense Ratio | Class A | |
| DWS Variable Series II — DWS Small Mid Cap Growth VIP | .79% | |
For more information, please refer to the Fund's prospectus.
These tables do not reflect charges and fees ("contract charges") associated with the separate account that invests in the Fund or any variable life insurance policy or variable annuity contract for which the Fund is an investment option.
Asset Allocation (As a % of Investment Portfolio excluding Securities Lending Collateral) | 6/30/11 | 12/31/10 |
| | | |
| Common Stocks | 98% | 97% |
| Cash Equivalents | 2% | 3% |
| | 100% | 100% |
Sector Diversification (As a % of Common Stocks) | 6/30/11 | 12/31/10 |
| | | |
| Information Technology | 24% | 25% |
| Consumer Discretionary | 17% | 16% |
| Health Care | 15% | 20% |
| Industrials | 15% | 16% |
| Energy | 9% | 9% |
| Financials | 8% | 6% |
| Consumer Staples | 6% | 3% |
| Materials | 5% | 5% |
| Telecommunication Services | 1% | — |
| | 100% | 100% |
Asset allocation and sector diversification are subject to change.
For more complete details about the Fund's investment portfolio, see page 6.
Following the Fund's fiscal first and third quarter-end, a complete portfolio holdings listing is filed with the SEC on Form N-Q. The form will be available on the SEC's Web site at www.sec.gov, and it also may be reviewed and copied at the SEC's Public Reference Room in Washington, D.C. Information on the operation of the SEC's Public Reference Room may be obtained by calling (800) SEC-0330. The Fund's portfolio holdings are also posted on www.dws-investments.com from time to time. Please see the Fund's current prospectus for more information.
Investment Portfolio June 30, 2011 (Unaudited) | | | Shares | | | Value ($) | |
| | | | |
| Common Stocks 98.4% | |
| Consumer Discretionary 16.3% | |
| Auto Components 2.0% | |
| BorgWarner, Inc.* | | | 25,321 | | | | 2,045,684 | |
| TRW Automotive Holdings Corp.* | | | 27,381 | | | | 1,616,300 | |
| | | | | | | | 3,661,984 | |
| Hotels Restaurants & Leisure 1.5% | |
| Panera Bread Co. "A"* | | | 21,889 | | | | 2,750,572 | |
| Household Durables 1.0% | |
| Jarden Corp. | | | 52,942 | | | | 1,827,028 | |
| Internet & Catalog Retail 1.1% | |
| Shutterfly, Inc.* | | | 36,621 | | | | 2,102,778 | |
| Media 1.8% | |
| Cinemark Holdings, Inc. | | | 94,221 | | | | 1,951,317 | |
| Interpublic Group of Companies, Inc. | | | 117,895 | | | | 1,473,687 | |
| | | | | | | | 3,425,004 | |
| Specialty Retail 6.3% | |
| Advance Auto Parts, Inc. | | | 21,496 | | | | 1,257,301 | |
| Children's Place Retail Stores, Inc.* | | | 39,540 | | | | 1,759,135 | |
| DSW, Inc. "A"* | | | 43,305 | | | | 2,191,666 | |
| Guess?, Inc. | | | 47,672 | | | | 2,005,084 | |
| PetSmart, Inc. | | | 44,662 | | | | 2,026,315 | |
| Ulta Salon, Cosmetics & Fragrance, Inc.* | | | 36,806 | | | | 2,376,931 | |
| | | | | | | | 11,616,432 | |
| Textiles, Apparel & Luxury Goods 2.6% | |
| Deckers Outdoor Corp.* | | | 31,900 | | | | 2,811,666 | |
| Hanesbrands, Inc.* | | | 68,923 | | | | 1,967,752 | |
| | | | | | | | 4,779,418 | |
| Consumer Staples 5.8% | |
| Food Products 3.0% | |
| Diamond Foods, Inc. | | | 46,970 | | | | 3,585,690 | |
| Green Mountain Coffee Roasters, Inc.* | | | 20,866 | | | | 1,862,499 | |
| | | | | | | | 5,448,189 | |
| Household Products 1.3% | |
| Church & Dwight Co., Inc. | | | 59,120 | | | | 2,396,725 | |
| Personal Products 1.5% | |
| Herbalife Ltd. | | | 49,349 | | | | 2,844,476 | |
| Energy 8.4% | |
| Energy Equipment & Services 4.0% | |
| Complete Production Services, Inc.* | | | 65,039 | | | | 2,169,701 | |
| Core Laboratories NV | | | 19,419 | | | | 2,165,995 | |
| Dresser-Rand Group, Inc.* | | | 35,943 | | | | 1,931,936 | |
| Dril-Quip, Inc.* | | | 15,983 | | | | 1,084,127 | |
| | | | | | | | 7,351,759 | |
| Oil, Gas & Consumable Fuels 4.4% | |
| Approach Resources, Inc.* | | | 97,661 | | | | 2,213,975 | |
| Clean Energy Fuels Corp.* | | | 45,722 | | | | 601,244 | |
| Cloud Peak Energy, Inc.* | | | 65,425 | | | | 1,393,553 | |
| Northern Oil & Gas, Inc.* | | | 57,576 | | | | 1,275,308 | |
| Rosetta Resources, Inc.* | | | 35,422 | | | | 1,825,650 | |
| Whiting Petroleum Corp.* | | | 15,516 | | | | 883,016 | |
| | | | | | | | 8,192,746 | |
| Financials 8.3% | |
| Capital Markets 2.9% | |
| Affiliated Managers Group, Inc.* | | | 26,690 | | | | 2,707,700 | |
| Lazard Ltd. "A" | | | 44,535 | | | | 1,652,249 | |
| | | Shares | | | Value ($) | |
| | | | | | | | | |
| Stifel Financial Corp.* | | | 25,124 | | | | 900,947 | |
| | | | | | | | 5,260,896 | |
| Commercial Banks 0.9% | |
| Zions Bancorp. | | | 69,716 | | | | 1,673,881 | |
| Consumer Finance 1.0% | |
| Dollar Financial Corp.* | | | 83,523 | | | | 1,808,273 | |
| Diversified Financial Services 1.6% | |
| Portfolio Recovery Associates, Inc.* | | | 34,236 | | | | 2,902,870 | |
| Insurance 1.0% | |
| W.R. Berkley Corp. | | | 59,059 | | | | 1,915,874 | |
| Real Estate Management & Development 0.9% | |
| CB Richard Ellis Group, Inc. "A"* | | | 68,596 | | | | 1,722,446 | |
| Health Care 14.8% | |
| Biotechnology 0.8% | |
| Onyx Pharmaceuticals, Inc.* | | | 41,813 | | | | 1,475,999 | |
| Health Care Equipment & Supplies 3.8% | |
| Accuray, Inc.* | | | 141,982 | | | | 1,137,276 | |
| Kinetic Concepts, Inc.* | | | 51,400 | | | | 2,962,182 | |
| Merit Medical Systems, Inc.* | | | 78,093 | | | | 1,403,331 | |
| Sirona Dental Systems, Inc.* | | | 30,013 | | | | 1,593,690 | |
| | | | | | | | 7,096,479 | |
| Health Care Providers & Services 3.4% | |
| Centene Corp.* | | | 87,787 | | | | 3,119,072 | |
| ExamWorks Group, Inc.* | | | 125,496 | | | | 3,186,344 | |
| | | | | | | | 6,305,416 | |
| Health Care Technology 1.1% | |
| SXC Health Solutions Corp.* | | | 34,806 | | | | 2,050,770 | |
| Life Sciences Tools & Services 1.0% | |
| Life Technologies Corp.* | | | 35,376 | | | | 1,842,028 | |
| Pharmaceuticals 4.7% | |
| Hospira, Inc.* | | | 37,110 | | | | 2,102,653 | |
| Pacira Pharmaceuticals. Inc.* | | | 76,306 | | | | 915,672 | |
| Par Pharmaceutical Companies, Inc.* | | | 51,389 | | | | 1,694,809 | |
| Questcor Pharmaceuticals, Inc.* | | | 161,403 | | | | 3,889,812 | |
| | | | | | | | 8,602,946 | |
| Industrials 14.5% | |
| Commercial Services & Supplies 1.0% | |
| United Stationers, Inc. | | | 52,216 | | | | 1,850,013 | |
| Construction & Engineering 2.0% | |
| Chicago Bridge & Iron Co. NV | | | 46,140 | | | | 1,794,846 | |
| MYR Group, Inc.* | | | 78,695 | | | | 1,841,463 | |
| | | | | | | | 3,636,309 | |
| Electrical Equipment 2.3% | |
| General Cable Corp.* | | | 52,198 | | | | 2,222,591 | |
| Thomas & Betts Corp.* | | | 37,093 | | | | 1,997,458 | |
| | | | | | | | 4,220,049 | |
| Machinery 6.3% | |
| Altra Holdings, Inc.* | | | 83,109 | | | | 1,993,785 | |
| Flowserve Corp. | | | 12,703 | | | | 1,395,933 | |
| Gardner Denver, Inc. | | | 18,212 | | | | 1,530,718 | |
| Joy Global, Inc. | | | 17,452 | | | | 1,662,128 | |
| Sauer-Danfoss, Inc.* | | | 35,948 | | | | 1,811,420 | |
| Terex Corp.* | | | 41,995 | | | | 1,194,758 | |
| Timken Co. | | | 39,302 | | | | 1,980,821 | |
| | | | | | | | 11,569,563 | |
| Professional Services 0.9% | |
| Robert Half International, Inc. | | | 62,533 | | | | 1,690,267 | |
| | | Shares | | | Value ($) | |
| | | | | | | | | |
| Road & Rail 1.2% | |
| Kansas City Southern* | | | 39,042 | | | | 2,316,362 | |
| Trading Companies & Distributors 0.8% | |
| United Rentals, Inc.* | | | 59,021 | | | | 1,499,133 | |
| Information Technology 23.8% | |
| Communications Equipment 7.0% | |
| Acme Packet, Inc.* | | | 22,232 | | | | 1,559,130 | |
| Aruba Networks, Inc.* | | | 28,666 | | | | 847,080 | |
| Ciena Corp.* | | | 39,306 | | | | 722,444 | |
| F5 Networks, Inc.* | | | 19,910 | | | | 2,195,078 | |
| Harris Corp. | | | 37,215 | | | | 1,676,908 | |
| Polycom, Inc.* | | | 41,125 | | | | 2,644,338 | |
| Riverbed Technology, Inc.* | | | 62,483 | | | | 2,473,702 | |
| Sycamore Networks, Inc. | | | 39,696 | | | | 882,839 | |
| | | | | | | | 13,001,519 | |
| Computers & Peripherals 1.0% | |
| Western Digital Corp.* | | | 48,570 | | | | 1,766,977 | |
| Electronic Equipment, Instruments & Components 2.1% | |
| Cognex Corp. | | | 65,952 | | | | 2,336,679 | |
| Coherent, Inc.* | | | 28,729 | | | | 1,587,852 | |
| | | | | | | | 3,924,531 | |
| IT Services 3.6% | |
| Cardtronics, Inc.* | | | 96,542 | | | | 2,263,910 | |
| Syntel, Inc. | | | 33,421 | | | | 1,975,850 | |
| VeriFone Systems, Inc.* | | | 54,287 | | | | 2,407,628 | |
| | | | | | | | 6,647,388 | |
| Semiconductors & Semiconductor Equipment 2.4% | |
| Cavium, Inc.* | | | 26,197 | | | | 1,141,927 | |
| Cypress Semiconductor Corp.* | | | 88,347 | | | | 1,867,655 | |
| Netlogic Microsystems, Inc.* | | | 34,597 | | | | 1,398,411 | |
| | | | | | | | 4,407,993 | |
| Software 7.7% | |
| Compuware Corp.* | | | 112,517 | | | | 1,098,166 | |
| Concur Technologies, Inc.* | | | 25,287 | | | | 1,266,120 | |
| MICROS Systems, Inc.* | | | 40,634 | | | | 2,019,916 | |
| NetQin Mobile, Inc. (ADR)* (a) | | | 42,133 | | | | 231,731 | |
| OPNET Technologies, Inc. | | | 28,827 | | | | 1,180,177 | |
| Red Hat, Inc.* | | | 33,312 | | | | 1,529,021 | |
| | | Shares | | | Value ($) | |
| | | | | | | | | |
| Rovi Corp.* | | | 36,974 | | | | 2,120,829 | |
| Taleo Corp. "A"* | | | 52,290 | | | | 1,936,299 | |
| Ultimate Software Group, Inc.* | | | 35,354 | | | | 1,924,318 | |
| VanceInfo Technologies, Inc. (ADR)* | | | 41,579 | | | | 960,891 | |
| | | | | | | | 14,267,468 | |
| Materials 5.4% | |
| Chemicals 2.3% | |
| CF Industries Holdings, Inc. | | | 10,420 | | | | 1,476,201 | |
| Solutia, Inc.* | | | 60,429 | | | | 1,380,803 | |
| STR Holdings, Inc.* | | | 97,236 | | | | 1,450,761 | |
| | | | | | | | 4,307,765 | |
| Containers & Packaging 1.2% | |
| Crown Holdings, Inc.* | | | 57,325 | | | | 2,225,357 | |
| Metals & Mining 1.9% | |
| Cliffs Natural Resources, Inc. | | | 11,236 | | | | 1,038,768 | |
| Molycorp, Inc.* | | | 18,324 | | | | 1,118,864 | |
| Thompson Creek Metals Co., Inc.* | | | 128,882 | | | | 1,286,242 | |
| | | | | | | | 3,443,874 | |
| Telecommunication Services 1.1% | |
| Wireless Telecommunication Services | |
| MetroPCS Communications, Inc.* | | | 112,065 | | | | 1,928,638 | |
Total Common Stocks (Cost $151,132,728) | | | | 181,758,195 | |
| | |
| Securities Lending Collateral 0.1% | |
| Daily Assets Fund Institutional, 0.13% (b) (c) (Cost $201,929) | | | 201,929 | | | | 201,929 | |
| | |
| Cash Equivalents 1.9% | |
| Central Cash Management Fund, 0.11% (b) (Cost $3,581,871) | | | 3,581,871 | | | | 3,581,871 | |
| | | % of Net Assets | | | Value ($) | |
| | | | |
Total Investment Portfolio (Cost $154,916,528)+ | | | 100.4 | | | | 185,541,995 | |
| Other Assets and Liabilities, Net | | | (0.4 | ) | | | (810,044 | ) |
| Net Assets | | | 100.0 | | | | 184,731,951 | |
* Non-income producing security.
+ The cost for federal income tax purposes was $155,320,917. At June 30, 2011, net unrealized appreciation for all securities based on tax cost was $30,221,078. This consisted of aggregate gross unrealized appreciation for all securities in which there was an excess of value over tax cost of $34,001,526 and aggregate gross unrealized depreciation for all securities in which there was an excess of tax cost over value of $3,780,448.
(a) All or a portion of these securities were on loan (see Notes to Financial Statements). The value of all securities loaned at June 30, 2011 amounted to $193,149, which is 0.1% of net assets.
(b) Affiliated fund managed by Deutsche Investment Management Americas Inc. The rate shown is the annualized seven-day yield at period end.
(c) Represents collateral held in connection with securities lending. Income earned by the Fund is net of borrower rebates.
ADR: American Depositary Receipt
Fair Value Measurements
Various inputs are used in determining the value of the Fund's investments. These inputs are summarized in three broad levels. Level 1 includes quoted prices in active markets for identical securities. Level 2 includes other significant observable inputs (including quoted prices for similar securities, interest rates, prepayment speeds, and credit risk). Level 3 includes significant unobservable inputs (including the Fund's own assumptions in determining the fair value of investments). The inputs or methodology used for valuing securities are not necessarily an indication of the risk associated with investing in those securities.
The following is a summary of the inputs used as of June 30, 2011 in valuing the Fund's investments. For information on the Fund's policy regarding the valuation of investments, please refer to the Security Valuation section of Note A in the accompanying Notes to Financial Statements.
| Assets | | Level 1 | | | Level 2 | | | Level 3 | | | Total | |
| | |
| Common Stocks (d) | | $ | 181,758,195 | | | $ | — | | | $ | — | | | $ | 181,758,195 | |
| Short-Term Investments (d) | | | 3,783,800 | | | | — | | | | — | | | | 3,783,800 | |
| Total | | $ | 185,541,995 | | | $ | — | | | $ | — | | | $ | 185,541,995 | |
There have been no transfers between Level 1 and Level 2 fair value measurements during the period ended June 30, 2011.
(d) See Investment Portfolio for additional detailed categorizations.
The accompanying notes are an integral part of the financial statements.
Statement of Assets and Liabilities | as of June 30, 2011 (Unaudited) | |
| Assets | |
Investments: Investments in non-affiliated securities, at value (cost $151,132,728) — including $193,149 of securities loaned | | $ | 181,758,195 | |
Investment in Daily Assets Fund Institutional (cost $201,929)* | | | 201,929 | |
| Investment in Central Cash Management Fund (cost $3,581,871) | | | 3,581,871 | |
| Total investments in securities, at value (cost $154,916,528) | | | 185,541,995 | |
| Cash | | | 1,961 | |
| Foreign currency, at value (cost $10,174) | | | 10,223 | |
| Receivable for investments sold | | | 93,601 | |
| Receivable for Fund shares sold | | | 849 | |
| Dividends receivable | | | 18,873 | |
| Interest receivable | | | 7,683 | |
| Foreign taxes recoverable | | | 319 | |
| Other assets | | | 1,704 | |
| Total assets | | | 185,677,208 | |
| Liabilities | |
| Payable upon return of securities loaned | | | 201,929 | |
| Payable for Fund shares redeemed | | | 485,172 | |
| Accrued management fee | | | 83,922 | |
| Other accrued expenses and payables | | | 174,234 | |
| Total liabilities | | | 945,257 | |
| Net assets, at value | | $ | 184,731,951 | |
| Net Assets Consist of | |
| Net investment loss | | | (310,859 | ) |
Net unrealized appreciation (depreciation) on: Investments | | | 30,625,467 | |
| Foreign currency | | | 49 | |
| Accumulated net realized gain (loss) | | | (25,323,085 | ) |
| Paid-in capital | | | 179,740,379 | |
| Net assets, at value | | $ | 184,731,951 | |
Class A Net Asset Value, offering and redemption price per share ($184,731,951 ÷ 12,135,791 outstanding shares of beneficial interest, no par value, unlimited number of shares authorized) | | $ | 15.22 | |
* Represents collateral on securities loaned.
The accompanying notes are an integral part of the financial statements.
Statement of Operations
| for the six months ended June 30, 2011 (Unaudited) | |
| Investment Income | |
Income: Dividends (net of foreign taxes withheld of $731) | | $ | 186,497 | |
| Income distributions — Central Cash Management Fund | | | 2,081 | |
| Securities lending income, including income from Daily Assets Fund Institutional, net of borrower rebates | | | 19,031 | |
| Total income | | | 207,609 | |
Expenses: Management fee | | | 341,202 | |
| Administration fee | | | 62,281 | |
| Services to shareholders | | | 1,640 | |
| Custodian fee | | | 6,124 | |
| Audit and tax fees | | | 28,779 | |
| Legal fees | | | 4,403 | |
| Reports to shareholders | | | 37,915 | |
| Trustees' fees and expenses | | | 3,431 | |
| Other | | | 3,750 | |
| Total expenses | | | 489,525 | |
| Net investment income (loss) | | | (281,916 | ) |
| Realized and Unrealized Gain (Loss) | |
Net realized gain (loss) from: Investments | | | 17,405,299 | |
| Foreign currency | | | (173 | ) |
| Payments by affiliates (see Note F) | | | 75,429 | |
| | | | 17,480,555 | |
Change in net unrealized appreciation (depreciation) on: Investments | | | (10,495,321 | ) |
| Foreign currency | | | 49 | |
| | | | (10,495,272 | ) |
| Net gain (loss) | | | 6,985,283 | |
| Net increase (decrease) in net assets resulting from operations | | $ | 6,703,367 | |
The accompanying notes are an integral part of the financial statements.
Statement of Changes in Net Assets | Increase (Decrease) in Net Assets | | Six Months Ended June 30, 2011 (Unaudited) | | | Year Ended December 31, 2010 | |
Operations: Net investment income (loss) | | $ | (281,916 | ) | | $ | (87,977 | ) |
| Net realized gain (loss) | | | 17,480,555 | | | | 11,959,891 | |
| Change in net unrealized appreciation (depreciation) | | | (10,495,272 | ) | | | 8,823,086 | |
| Net increase (decrease) in net assets resulting from operations | | | 6,703,367 | | | | 20,695,000 | |
Distributions to shareholders from: Net investment income: Class A | | | (545,355 | ) | | | — | |
| Total distributions | | | (545,355 | ) | | | — | |
Fund share transactions: Class A Proceeds from shares sold | | | 11,935,184 | | | | 6,051,148 | |
| Net assets acquired in tax free reorganization | | | 93,892,921 | | | | — | |
| Reinvestment of distributions | | | 545,355 | | | | — | |
| Cost of shares redeemed | | | (16,228,784 | ) | | | (17,902,129 | ) |
| Net increase (decrease) in net assets from Class A share transactions | | | 90,144,676 | | | | (11,850,981 | ) |
| Increase (decrease) in net assets | | | 96,302,688 | | | | 8,844,019 | |
| Net assets at beginning of period | | | 88,429,263 | | | | 79,585,244 | |
| Net assets at end of period (including net investment loss and undistributed net investment income of $310,859 and $516,412, respectively) | | $ | 184,731,951 | | | $ | 88,429,263 | |
| Other Information | |
Class A Shares outstanding at beginning of period | | | 6,384,947 | | | | 7,439,067 | |
| Shares sold | | | 814,620 | | | | 517,480 | |
| Shares issued in tax free reorganization | | | 6,003,455 | | | | — | |
| Shares issued to shareholders in reinvestment of distributions | | | 34,959 | | | | — | |
| Shares redeemed | | | (1,102,190 | ) | | | (1,571,600 | ) |
| Net increase (decrease) in Class A shares | | | 5,750,844 | | | | (1,054,120 | ) |
| Shares outstanding at end of period | | | 12,135,791 | | | | 6,384,947 | |
The accompanying notes are an integral part of the financial statements.
| | | | | Years Ended December 31, | |
| Class A | | Six Months Ended 6/30/11 (Unaudited) | 2010 | | 2009 | | | 2008 | | | 2007 | | | 2006 | |
| Selected Per Share Data | |
| Net asset value, beginning of period | | $ | 13.85 | | | $ | 10.70 | | | $ | 7.61 | | | $ | 15.07 | | | $ | 14.19 | | | $ | 13.48 | |
Income (loss) from investment operations: Net investment income (loss)a | | | (.03 | ) | | | (.01 | ) | | | (.02 | ) | | | (.01 | ) | | | (.01 | ) | | | (.04 | )c |
| Net realized and unrealized gain (loss) | | | 1.48 | | | | 3.16 | | | | 3.11 | | | | (7.45 | ) | | | .89 | | | | .75 | |
| Total from investment operations | | | 1.45 | | | | 3.15 | | | | 3.09 | | | | (7.46 | ) | | | .88 | | | | .71 | |
Less distributions from: Net investment income | | | | (.08 | ) | | | — | | | | — | | | | — | | | | — | | | | — | |
| Net asset value, end of period | | $ | 15.22 | | | $ | 13.85 | | | $ | 10.70 | | | $ | 7.61 | | | $ | 15.07 | | | $ | 14.19 | |
| Total Return (%) | | | 10.46 | ** | | | 29.44 | | | | 40.60 | | | | (49.50 | )b | | | 6.20 | b | | | 5.27 | b,c |
| Ratios to Average Net Assets and Supplemental Data | |
| Net assets, end of period ($ millions) | | | 185 | | | | 88 | | | | 80 | | | | 69 | | | | 174 | | | | 208 | |
| Ratio of expenses before expense reductions (%) | | | .79 | * | | | .78 | | | | .77 | | | | .88 | | | | .75 | | | | .73 | |
| Ratio of expenses after expense reductions (%) | | | .79 | * | | | .78 | | | | .77 | | | | .85 | | | | .72 | | | | .72 | |
| Ratio of net investment income (loss) (%) | | | (.45 | )* | | | (.12 | ) | | | (.22 | ) | | | (.04 | ) | | | (.09 | ) | | | (.32 | )c |
| Portfolio turnover rate (%) | | | 59 | ** | | | 64 | | | | 93 | | | | 67 | | | | 67 | | | | 73 | |
a Based on average shares outstanding during the period. b Total return would have been lower had certain expenses not been reduced. c Includes non-recurring income from the Advisor recorded as a result of an administrative proceeding regarding disclosure of brokerage allocation practices in connection with sales of DWS Funds. The non-recurring income resulted in an increase in net investment income of $0.008 per share and an increase in the ratio of net investment income of 0.06%. Excluding this non-recurring income, total return would have been 0.06% lower. * Annualized ** Not annualized | |
Notes to Financial Statements (Unaudited)
A. Organization and Significant Accounting Policies
DWS Small Mid Cap Growth VIP (the "Fund") is a diversified series of DWS Variable Series II (the "Trust"), which is registered under the Investment Company Act of 1940, as amended (the "1940 Act"), as an open-end management investment company organized as a Massachusetts business trust.
The Fund's financial statements are prepared in accordance with accounting principles generally accepted in the United States of America which require the use of management estimates. Actual results could differ from those estimates. The policies described below are followed consistently by the Fund in the preparation of its financial statements.
Security Valuation. Investments are stated at value determined as of the close of regular trading on the New York Stock Exchange on each day the exchange is open for trading.
Various inputs are used in determining the value of the Fund's investments. These inputs are summarized in three broad levels. Level 1 includes quoted prices in active markets for identical securities. Level 2 includes other significant observable inputs (including quoted prices for similar securities, interest rates, prepayment speeds, and credit risk). Level 3 includes significant unobservable inputs (including the Fund's own assumptions in determining the fair value of investments). The inputs or methodology used for valuing securities are not necessarily an indication of the risk associated with investing in those securities.
Equity securities are valued at the most recent sale price or official closing price reported on the exchange (US or foreign) or over-the-counter market on which they trade and are categorized as Level 1 securities. Securities for which no sales are reported are valued at the calculated mean between the most recent bid and asked quotations on the relevant market or, if a mean cannot be determined, at the most recent bid quotation. For certain international equity securities, in order to adjust for events which may occur between the close of the foreign exchanges and the close of the New York Stock Exchange, a fair valuation model may be used. This fair valuation model takes into account comparisons to the valuation of American Depository Receipts (ADRs), exchange-traded funds, futures contracts and certain indices and these securities are categorized as Level 2.
Money market instruments purchased with an original or remaining maturity of sixty days or less, maturing at par, are valued at amortized cost, which approximates value, and are categorized as Level 2. Investments in open-end investment companies are valued at their net asset value each business day and are categorized as Level 1.
Securities and other assets for which market quotations are not readily available or for which the above valuation procedures are deemed not to reflect fair value are valued in a manner that is intended to reflect their fair value as determined in accordance with procedures approved by the Board and are generally categorized as Level 3. In accordance with the Fund's valuation procedures, factors used in determining value may include, but are not limited to, the type of the security; the size of the holding; the initial cost of the security; the existence of any contractual restrictions on the security's disposition; the price and extent of public trading in similar securities of the issuer or of comparable companies; quotations or evaluated prices from broker-dealers and/or pricing services; information obtained from the issuer, analysts, and/or the appropriate stock exchange (for exchange-traded securities); an analysis of the company's or issuer's financial statements; an evaluation of the forces that influence the issuer and the market(s) in which the security is purchased and sold and with respect to debt securities; the maturity, coupon, creditworthiness, currency denomination and the movement of the market in which the security is normally traded. The value determined under these procedures may differ from published values for the same securities.
Disclosure about the classification of fair value measurements is included in a table following the Fund's Investment Portfolio.
Securities Lending. The Fund lends securities to certain financial institutions. The Fund retains beneficial ownership of the securities it has loaned and continues to receive interest and dividends paid by the issuer of securities and to participate in any changes in their market value. The Fund requires the borrowers of the securities to maintain collateral with the Fund consisting of either cash or liquid, unencumbered assets having a value at least equal to the value of the securities loaned. When the collateral falls below specified amounts, the lending agent will use its best effort to obtain additional collateral on the next business day to meet required amounts under the security lending agreement. The Fund may invest the cash collateral into a joint trading account in an affiliated money market fund pursuant to Exemptive Orders issued by the SEC. The Fund receives compensation for lending its securities either in the form of fees or by earning interest on invested cash collateral net of borrower rebates and fees paid to a lending agent. Either the Fund or the borrower may terminate the loan. There may be risks of delay and costs in recovery of securities or even loss of rights in the collateral should the borrower of the securities fail financially. The Fund is also subject to all investment risks associated with the reinvestment of any cash collateral received, including, but not limited to, interest rate, credit and liquidity risk associated with such investments.
Federal Income Taxes. The Fund's policy is to comply with the requirements of the Internal Revenue Code, as amended, which are applicable to regulated investment companies, and to distribute all of its taxable income to its shareholders.
At December 31, 2010, the Fund had a net tax basis capital loss carryforward of approximately $42,400,000, which may be applied against any realized net taxable capital gains of each succeeding year until fully utilized or until December 31, 2016 ($8,113,000) and December 31, 2017 ($34,287,000), the respective expiration dates, whichever occurs first.
On December 22, 2010, the Regulated Investment Company Modernization Act of 2010 (the "Act") was enacted. Under the Act, net capital losses may be carried forward indefinitely, and their character is retained as short-term and/or long-term losses. Previously, net capital losses were carried forward for eight years and treated as short-term losses. As a transition rule, the Act requires that post-enactment net capital losses be used before pre-enactment net capital losses. As a result of this ordering rule, pre-enactment capital loss carryforwards may expire unused, whereas under the previous rules these losses may have been utilized. This change is effective for fiscal years beginning after the date of enactment.
The Fund has reviewed the tax positions for the open tax years as of December 31, 2010 and has determined that no provision for income tax is required in the Fund's financial statements. The Fund's federal tax returns for the prior three fiscal years remain open subject to examination by the Internal Revenue Service.
Distribution of Income and Gains. Net investment income of the Fund, if any, is declared and distributed to shareholders annually. Net realized gains from investment transactions, in excess of available capital loss carryforwards, would be taxable to the Fund if not distributed and, therefore, will be distributed to shareholders at least annually. The Fund may also make additional distributions for tax purposes if necessary.
The timing and characterization of certain income and capital gains distributions are determined annually in accordance with federal tax regulations which may differ from accounting principles generally accepted in the United States of America. These differences primarily relate to net operating losses and certain securities sold at a loss. As a result, net investment income (loss) and net realized gain (loss) on investment transactions for a reporting period may differ significantly from distributions during such period. Accordingly, the Fund may periodically make reclassifications among certain of its capital accounts without impacting the net asset value of the Fund.
The tax character of current year distributions will be determined at the end of the current fiscal year.
Expenses. Expenses of the Trust arising in connection with a specific fund are allocated to that fund. Other Trust expenses which cannot be directly attributed to a fund are apportioned among the funds in the Trust.
Contingencies. In the normal course of business, the Fund may enter into contracts with service providers that contain general indemnification clauses. The Fund's maximum exposure under these arrangements is unknown as this would involve future claims that may be made against the Fund that have not yet been made. However, based on experience, the Fund expects the risk of loss to be remote.
Other. Investment transactions are accounted for on a trade date plus one basis for daily net asset value calculations. However, for financial reporting purposes, investment transactions are reported on trade date. Interest income is recorded on the accrual basis. Dividend income is recorded on the ex-dividend date net of foreign withholding taxes. Realized gains and losses from investment transactions are recorded on an identified cost basis and may include proceeds from litigation.
B. Purchases and Sales of Securities
During the six months ended June 30, 2011, purchases and sales of investment transactions (excluding short-term investments) aggregated $78,701,900 and $81,717,360, respectively.
C. Related Parties
Management Agreement. Under the Investment Management Agreement with Deutsche Investment Management Americas Inc. ("DIMA" or the "Advisor"), an indirect, wholly owned subsidiary of Deutsche Bank AG, the Advisor directs the investments of the Fund in accordance with its investment objectives, policies and restrictions. The Advisor determines the securities, instruments and other contracts relating to investments to be purchased, sold or entered into by the Fund.
Pursuant to the Investment Management Agreement with the Advisor, the Fund pays a monthly management fee based on the Fund's average daily net assets, computed and accrued daily and payable monthly, at the following annual rates:
| $0-$250 million | | | .550 | % |
| next $750 million | | | .525 | % |
| over $1 billion | | | .500 | % |
Accordingly, for the six months ended June 30, 2011, the fee pursuant to the Investment Management Agreement was equivalent to an annualized effective rate of 0.55% of the Fund's average daily net assets.
Administration Fee. Pursuant to an Administrative Services Agreement, DIMA provides most administrative services to the Fund. For all services provided under the Administrative Services Agreement, the Fund pays DIMA an annual fee ("Administration Fee") of 0.10% of the Fund's average daily net assets, computed and accrued daily and payable monthly. For the six months ended June 30, 2011, the Administration Fee was $62,281, of which $15,258 is unpaid.
Service Provider Fees. DWS Investments Service Company ("DISC"), an affiliate of the Advisor, is the transfer agent, dividend-paying agent and shareholder service agent for the Fund. Pursuant to a sub-transfer agency agreement between DISC and DST Systems, Inc. ("DST"), DISC has delegated certain transfer agent, dividend-paying agent and shareholder service agent functions to DST. DISC compensates DST out of the shareholder servicing fee it receives from the Fund. For the six months ended June 30, 2011, the amounts charged to the Fund by DISC aggregated $162, all of which is unpaid.
Typesetting and Filing Service Fees. Under an agreement with DIMA, DIMA is compensated for providing typesetting and certain regulatory filing services to the Fund. For the six months ended June 30, 2011, the amount charged to the Fund by DIMA included in the Statement of Operations under "reports to shareholders" aggregated $5,189, of which $1,435 is unpaid.
Trustees' Fees and Expenses. The Fund paid each Trustee not affiliated with the Advisor retainer fees plus specified amounts for various committee services and for the Board Chairperson.
Affiliated Cash Management Vehicle. The Fund may invest uninvested cash balances in Central Cash Management Fund, which is managed by the Advisor. The Fund indirectly bears its proportionate share of the expenses of Central Cash Management Fund. Central Cash Management Fund does not pay the Advisor an investment management fee. Central Cash Management Fund seeks a high level of current income consistent with liquidity and the preservation of capital.
D. Ownership of the Fund
At June 30, 2011, three Participating Insurance Companies were owners of record of 10% or more of the total outstanding Class A shares of the Fund, each owning 54%, 24% and 14%.
E. Line of Credit
The Fund and other affiliated funds (the "Participants") share in a $450 million revolving credit facility provided by a syndication of banks. The Fund may borrow for temporary or emergency purposes, including the meeting of redemption requests that otherwise might require the untimely disposition of securities. The Participants are charged an annual commitment fee which is allocated based on net assets, among each of the Participants. Interest is calculated at a rate per annum equal to the sum of the Federal Funds Rate plus 1.25 percent plus if LIBOR exceeds the Federal Funds Rate the amount of such excess. The Fund may borrow up to a maximum of 33 percent of its net assets under the agreement. The Fund had no outstanding loans at June 30, 2011.
F. Changes to Investment Strategy and Fund Name
On January 12, 2011, the Board approved changes to the name and strategy of the Fund. Effective May 1, 2011, the Fund's investment objective changed from maximum appreciation of investor's capital to long-term capital appreciation and the name changed from DWS Small Cap Growth VIP to DWS Small Mid Cap Growth VIP. The Advisor agreed to reimburse the Fund for transaction costs of $75,429 incurred in connection with the repositioning of the Fund's investments.
G. Acquisition of Assets
On April 29, 2011, the Fund acquired all of the net assets of DWS Mid Cap Growth VIP and DWS Turner Mid Cap Growth VIP pursuant to a plan of reorganization approved by shareholders on January 12, 2011. The acquisition was accomplished by a tax-free exchange of 2,029,578 Class A shares of DWS Mid Cap Growth VIP and 6,543,235 Class A shares of DWS Turner Mid Cap Growth VIP for 1,818,964 Class A shares and 4,184,491 Class A shares of the Fund, respectively, outstanding on April 29, 2011. DWS Mid Cap Growth VIP and DWS Turner Mid Cap Growth VIP's net assets at that date, $28,448,304 and $65,444,617, respectively, including $6,234,926 and $6,931,871 of net unrealized appreciation, respectively, were combined with those of the Fund. The aggregate net assets of the Fund immediately before the acquisition were $105,299,610. The combined net assets of the Fund immediately following the acquisition were $199,192,531.
The financial statements reflect the operations of the Fund for the period prior to the acquisition and the combined portfolio for the period subsequent to the portfolio merger. Assuming the acquisition had been completed on January 1, 2011, the Fund's pro forma results of operations for the six months ended June 30, 2011, are as follows:
| Net investment income* | | $ | (495,648 | ) |
| Net gain (loss) on investments | | $ | 18,139,716 | |
| Net increase (decrease) in net assets resulting from operations | | $ | 17,644,068 | |
* Net investment income includes $42,719 of pro forma eliminated expenses.
Because the combined investment portfolio has been managed as a single integrated portfolio since the acquisitions were completed, it is not practicable to separate the amounts of revenue and earnings of DWS Mid Cap Growth VIP and DWS Turner Mid Cap Growth VIP that have been included in the Fund's Statement of Operations since April 29, 2011.
The Trust's policies and procedures for voting proxies for portfolio securities and information about how the Trust voted proxies related to its portfolio securities during the 12-month period ended June 30 are available on our Web site — www.dws-investments.com (click on "proxy voting" at the bottom of the page) — or on the SEC's Web site — www.sec.gov. To obtain a written copy of the Trust's policies and procedures without charge, upon request, call us toll free at (800) 728-3337.
Summary of Management Fee Evaluation by Independent Fee Consultant
October 3, 2010
Pursuant to an Order entered into by Deutsche Investment Management Americas and affiliates (collectively, "DeAM") with the Attorney General of New York, I, Thomas H. Mack, have been appointed the Independent Fee Consultant for the DWS Funds (formerly the DWS Scudder Funds). My duties include preparing an annual written evaluation of the management fees DeAM charges the Funds, considering among other factors the management fees charged by other mutual fund companies for like services, management fees DeAM charges other clients for like services, DeAM's costs of supplying services under the management agreements and related profit margins, possible economies of scale if a Fund grows larger, and the nature and quality of DeAM's services, including fund performance. This report summarizes my evaluation for 2010, including my qualifications, the evaluation process for each of the DWS Funds, consideration of certain complex-level factors, and my conclusions. I served in substantially the same capacity in 2007, 2008, and 2009.
Qualifications
For more than 35 years I have served in various professional capacities within the investment management business. I have held investment analysis and advisory positions, including securities analyst, portfolio strategist and director of investment policy with a large investment firm. I have also performed business management functions, including business development, financial management and marketing research and analysis.
Since 1991, I have been an independent consultant within the asset management industry. I have provided services to over 125 client organizations, including investment managers, mutual fund boards, product distributors and related organizations. Over the past ten years I have completed a number of assignments for mutual fund boards, specifically including assisting boards with management contract renewal.
I hold a Master of Business Administration degree, with highest honors, from Harvard University and Master of Science and Bachelor of Science (highest honors) degrees from the University of California at Berkeley. I am an independent director and audit committee financial expert for two closed-end mutual funds and have served in various leadership and financial oversight capacities with non-profit organizations.
Evaluation of Fees for each DWS Fund
My work focused primarily on evaluating, fund-by-fund, the fees charged to each of the 118 publicly offered Fund portfolios in the DWS Fund family. For each Fund, I considered each of the key factors mentioned above, as well as any other relevant information. In doing so I worked closely with the Funds' Independent Directors in their annual contract renewal process, as well as in their approval of contracts for several new funds (documented separately).
In evaluating each Fund's fees, I reviewed comprehensive materials provided by or on behalf of DeAM, including expense information prepared by Lipper Analytical, comparative performance information, profitability data, manager histories, and other materials. I also accessed certain additional information from the Lipper and Morningstar databases and drew on my industry knowledge and experience.
To facilitate evaluating this considerable body of information, I prepared for each Fund a document summarizing the key data elements in each area as well as additional analytics discussed below. This made it possible to consider each key data element in the context of the others.
In the course of contract renewal, DeAM agreed to implement a number of fee and expense adjustments requested by the Independent Directors which will favorably impact future fees and expenses, and my evaluation includes the effects of these changes.
Fees and Expenses Compared with Other Funds
The competitive fee and expense evaluation for each fund focused on two primary comparisons:
The Fund's contractual management fee (the advisory fee plus the administration fee where applicable) compared with those of a group of typically 12-15 funds in the same Lipper investment category (e.g. Large Capitalization Growth) having similar distribution arrangements and being of similar size.
The Fund's total expenses compared with a broader universe of funds from the same Lipper investment category and having similar distribution arrangements.
These two comparisons provide a view of not only the level of the fee compared with funds of similar scale but also the total expense the Fund bears for all the services it receives, in comparison with the investment choices available in the Fund's investment category and distribution channel. The principal figure-of-merit used in these comparisons was the subject Fund's percentile ranking against peers.
DeAM's Fees for Similar Services to Others
DeAM provided management fee schedules for all of its US domiciled fund and non-fund investment management accounts in any of the investment categories where there is a DWS Fund. These similar products included the other DWS Funds, non-fund pooled accounts, institutional accounts and sub-advisory accounts. Using this information, I calculated for each Fund the fee that would be charged to each similar product, at the subject Fund's asset level.
Evaluating information regarding non-fund products is difficult because there are varying levels of services required for different types of accounts, with mutual funds generally requiring considerably more regulatory and administrative types of service as well as having more frequent cash flows than other types of accounts. Also, while mutual fund fees for similar fund products can be expected to be similar, there will be some differences due to different pricing conditions in different distribution channels (e.g. retail funds versus those used in variable insurance products), differences in underlying investment processes and other factors.
Costs and Profit Margins
DeAM provided a detailed profitability analysis for each Fund. After making some adjustments so that the presentation would be more comparable to the available industry figures, I reviewed profit margins from investment management alone, from investment management plus other fund services (excluding distribution) provided to the Funds by DeAM (principally shareholder services), and DeAM profits from all sources, including distribution. A later section comments on overall profitability.
Economies of Scale
Economies of scale — an expected decline in management cost per dollar of fund assets as fund assets grow — are very rarely quantified and documented because of inherent difficulties in collecting and analyzing relevant data. However, in virtually every investment category that I reviewed, larger funds tend to have lower fees and lower total expenses than smaller funds. To see how each DWS Fund compares with this industry observation, I reviewed:
The trend in Fund assets over the last five years and the accompanying trend in total expenses. This shows if the Fund has grown and, if so, whether total expense (management fees as well as other expenses) have declined as a percent of assets.
Whether the Fund has break-points in its management fee schedule, the extent of the fee reduction built into the schedule and the asset levels where the breaks take effect, and in the case of a sub-advised Fund how the Fund's break-points compare with those of the sub-advisory fee schedule.
How the Fund's contractual fee schedule compares with trends in the industry data. To accomplish this, I constructed a chart showing how actual latest-fiscal-year contractual fees of the Fund and of other similar funds relate to average fund assets, with the subject Fund's contractual fee schedule superimposed.
Quality of Service — Performance
The quality-of-service evaluation focused on investment performance, which is the principal result of the investment management service. Each Fund's performance was reviewed over the past 1, 3, 5 and 10 years, as applicable, and compared with that of other funds in the same investment category and with a suitable market index.
In addition, I calculated and reviewed risk-adjusted returns relative to an index of similar mutual funds' returns and a suitable market index. The risk-adjusted returns analysis provides a way of determining the extent to which the Fund's return comparisons are mainly the product of investment value-added (or lack thereof) or alternatively taking considerably more or less risk than is typical in its investment category.
I also received and considered the history of portfolio manager changes for each Fund, as this provided an important context for evaluating the performance results.
Complex-Level Considerations
While this evaluation was conducted mainly at the individual fund level, there are some issues relating to the reasonableness of fees that can alternatively be considered across the whole fund complex:
I reviewed DeAM's profitability analysis for all DWS Funds, with a view toward determining if the allocation procedures used were reasonable and how profit levels compared with public data for other investment managers.
I considered whether DeAM and affiliates receive any significant ancillary or "fall-out" benefits that should be considered in interpreting the direct profitability results. These would be situations where serving as the investment manager of the Funds is beneficial to another part of the Deutsche Bank organization.
I considered how aggregated DWS Fund expenses had varied over the years, by asset class and in the context of trends in asset levels.
I reviewed the structure of the DeAM organization, trends in staffing levels, and information on compensation of investment management and other professionals compared with industry data.
Findings
Based on the process and analysis discussed above, which included reviewing a wide range of information from management and external data sources and considering among other factors the fees DeAM charges other clients, the fees charged by other fund managers, DeAM's costs and profits associated with managing the Funds, economies of scale, possible fall-out benefits, and the nature and quality of services provided, in my opinion the management fees charged the DWS Funds are reasonable.
Thomas H. Mack
Notes
DWS Investments Distributors, Inc.
222 South Riverside Plaza
Chicago, IL 60606
(800) 621-1148
VS2SCG-3 (R-023301-1 8/11)
JUNE 30, 2011
SEMIANNUAL REPORT
DWS VARIABLE SERIES II
DWS Strategic Income VIP
(Effective on or about September 22, 2011: DWS Unconstrained Income Fund)
Contents
3 Performance Summary 4 Information About Your Fund's Expenses 5 Portfolio Summary 6 Investment Portfolio 24 Statement of Assets and Liabilities 25 Statement of Operations 26 Statement of Changes in Net Assets 27 Financial Highlights 29 Notes to Financial Statements 36 Proxy Voting 37 Summary of Management Fee Evaluation by Independent Fee Consultant |
This report must be preceded or accompanied by a prospectus. To obtain an additional prospectus or summary prospectus, if available, call (800) 728-3337 or your financial representative. We advise you to consider the Fund's objectives, risks, charges and expenses carefully before investing. The summary prospectus and prospectus contain this and other important information about the Fund. Please read the prospectus carefully before you invest.
Bond investments are subject to interest-rate and credit risks. When interest rates rise, bond prices generally fall. Credit risk refers to the ability of an issuer to make timely payments of principal and interest. Investments in lower-quality and non-rated securities present greater risk of loss than investments in higher-quality securities. The Fund may use derivatives, including as part of its Global Tactical Asset Allocation (GTAA) strategy. Investing in derivatives entails special risks relating to liquidity, leverage and credit that may reduce returns and/or increase volatility. Investing in foreign securities, particularly those of emerging markets, presents certain risks, such as currency fluctuations, political and economic changes, and market risks. See the prospectus for details.
DWS Investments is part of Deutsche Bank's Asset Management division and, within the US, represents the retail asset management activities of Deutsche Bank AG, Deutsche Bank Trust Company Americas, Deutsche Investment Management Americas Inc. and DWS Trust Company.
NOT FDIC/NCUA INSURED NO BANK GUARANTEE MAY LOSE VALUE NOT A DEPOSIT
NOT INSURED BY ANY FEDERAL GOVERNMENT AGENCY
Performance Summary June 30, 2011
Fund performance shown is historical, assumes reinvestment of all dividend and capital gain distributions and does not guarantee future results. Investment return and principal value fluctuate with changing market conditions so that, when redeemed, shares may be worth more or less than their original cost. Current performance may be lower or higher than the performance data quoted. Please contact your participating insurance company for the Fund's most recent month-end performance. Performance doesn't reflect charges and fees ("contract charges") associated with the separate account that invests in the Fund or any variable life insurance policy or variable annuity contract for which the Fund is an investment option. These charges and fees will reduce returns.
The gross expense ratio of the Fund, as stated in the fee table of the prospectus dated May 1, 2011 is 0.95% for Class A shares and may differ from the expense ratio disclosed in the Financial Highlights table in this report.
| Growth of an Assumed $10,000 Investment in DWS Strategic Income VIP |
[] DWS Strategic Income VIP — Class A [] Barclays Capital US Government/Credit Index [] Blended Index | The Barclays Capital US Government/Credit Index is an unmanaged index comprising intermediate- and long-term government and investment-grade corporate debt securities. The Blended Index consists of the Credit Suisse High Yield Index (35%), Barclays Capital US Government/Credit Index (35%), JPMorgan Emerging Markets Bond Index Global Diversified (15%) and Citigroup Non US Hedged World Government Bond Index ("WGBI") (15%). The Advisor believes this blended benchmark, which is a secondary benchmark, more accurately reflects typical portfolio asset allocations and represents the overall investment process. Index returns do not reflect any fees or expenses and it is not possible to invest directly into an index. |
| |
| Yearly periods ended June 30 | |
| Comparative Results | |
| DWS Strategic Income VIP | | 6-Month‡ | | | 1-Year | | | 3-Year | | | 5-Year | | | 10-Year | |
| Class A | Growth of $10,000 | | $ | 10,283 | | | $ | 10,817 | | | $ | 12,790 | | | $ | 14,439 | | | $ | 20,159 | |
| Average annual total return | | | 2.83 | % | | | 8.17 | % | | | 8.55 | % | | | 7.62 | % | | | 7.26 | % |
| Barclays Capital US Government/Credit Index | Growth of $10,000 | | $ | 10,261 | | | $ | 10,368 | | | $ | 11,966 | | | $ | 13,603 | | | $ | 17,473 | |
| Average annual total return | | | 2.61 | % | | | 3.68 | % | | | 6.17 | % | | | 6.35 | % | | | 5.74 | % |
| Blended Index | Growth of $10,000 | | $ | 10,339 | | | $ | 10,803 | | | $ | 12,833 | | | $ | 14,389 | | | $ | 20,766 | |
| Average annual total return | | | 3.39 | % | | | 8.03 | % | | | 8.67 | % | | | 7.55 | % | | | 7.58 | % |
The growth of $10,000 is cumulative.
‡ Total returns shown for periods less than one year are not annualized.
Information About Your Fund's Expenses
As an investor of the Fund, you incur two types of costs: ongoing expenses and transaction costs. Ongoing expenses include management fees and other Fund expenses. Examples of transaction costs include contract charges and account maintenance fees, which are not shown in this section. The following tables are intended to help you understand your ongoing expenses (in dollars) of investing in the Fund and to help you compare these expenses with the ongoing expenses of investing in other mutual funds. In the most recent six-month period, the Fund limited these expenses; had it not done so, expenses would have been higher. The example in the table is based on an investment of $1,000 invested at the beginning of the six-month period and held for the entire period (January 1, 2011 to June 30, 2011).
The tables illustrate your Fund's expenses in two ways:
•Actual Fund Return. This helps you estimate the actual dollar amount of ongoing expenses (but not transaction costs) paid on a $1,000 investment in the Fund using the Fund's actual return during the period. To estimate the expenses you paid over the period, simply divide your account value by $1,000 (for example, an $8,600 account value divided by $1,000 = 8.6), then multiply the result by the number in the "Expenses Paid per $1,000" line under the share class you hold.
• Hypothetical 5% Fund Return. This helps you to compare your Fund's ongoing expenses (but not transaction costs) with those of other mutual funds using the Fund's actual expense ratio and a hypothetical rate of return of 5% per year before expenses. Examples using a 5% hypothetical Fund return may be found in the shareholder reports of other mutual funds. The hypothetical account values and expenses may not be used to estimate the actual ending account balance or expenses you paid for the period.
Please note that the expenses shown in these tables are meant to highlight your ongoing expenses only and do not reflect any transaction costs. The "Expenses Paid per $1,000" line of the tables is useful in comparing ongoing expenses only and will not help you determine the relative total expense of owning different funds. If these transaction costs had been included, your costs would have been higher.
Expenses and Value of a $1,000 Investment for the six months ended June 30, 2011 | |
| Actual Fund Return | | Class A | |
| Beginning Account Value 1/1/11 | | $ | 1,000.00 | |
| Ending Account Value 6/30/11 | | $ | 1,028.30 | |
| Expenses Paid per $1,000* | | $ | 3.97 | |
| Hypothetical 5% Fund Return | | Class A | |
| Beginning Account Value 1/1/11 | | $ | 1,000.00 | |
| Ending Account Value 6/30/11 | | $ | 1,020.88 | |
| Expenses Paid per $1,000* | | $ | 3.96 | |
* Expenses are equal to the Fund's annualized expense ratio, multiplied by the average account value over the period, multiplied by the number of days in the most recent six-month period, then divided by 365.
| Annualized Expense Ratio | Class A | |
| DWS Variable Series II — DWS Strategic Income VIP | .79% | |
For more information, please refer to the Fund's prospectus.
These tables do not reflect charges and fees ("contract charges") associated with the separate account that invests in the Fund or any variable life insurance policy or variable annuity contract for which the Fund is an investment option.
Asset Allocation (As a % of Investment Portfolio excluding Securities Lending Collateral) | 6/30/11 | 12/31/10 |
| | | |
| Corporate Bonds | 68% | 62% |
| Government & Agency Obligations | 10% | 17% |
| Cash Equivalents | 9% | 5% |
| Collateralized Mortgage Obligations | 4% | 3% |
| Loan Participations and Assignments | 3% | 4% |
| Convertible Bonds | 3% | 0% |
| Commercial Mortgage-Backed Securities | 2% | 3% |
| Preferred Securities | 1% | 1% |
| Mortgage-Backed Securities Pass-Throughs | — | 5% |
| | 100% | 100% |
Quality (Excludes Cash Equivalents and Securities Lending Collateral) | 6/30/11 | 12/31/10 |
| | | |
| AAA | 7% | 20% |
| AA | 2% | 2% |
| A | 7% | 5% |
| BBB | 17% | 16% |
| BB | 20% | 16% |
| B | 29% | 28% |
| CCC | 15% | 11% |
| Not Rated | 3% | 2% |
| | 100% | 100% |
| Interest Rate Sensitivity | 6/30/11 | 12/31/10 |
| | | |
| Effective Maturity | 6.4 years | 7.2 years |
| Effective Duration | 4.6 years | 4.7 years |
Asset allocation and interest rate sensitivity are subject to change.
The quality ratings represent the lower of Moody's Investors Service, Inc. ("Moody's") or Standard & Poor's Corporation ("S&P") credit ratings. The ratings of Moody's and S&P represent their opinions as to the quality of the securities they rate. Ratings are relative and subjective and are not absolute standards of quality. The Fund's credit quality does not remove market risk and is subject to change.
Effective maturity is the weighted average of the bonds held by the Fund taking into consideration any available maturity shortening features.
Effective duration is an approximate measure of the Fund's sensitivity to interest rate changes taking into consideration any maturity shortening features.
For more complete details about the Fund's investment portfolio, see page 6.
Following the Fund's fiscal first and third quarter-end, a complete portfolio holdings listing is filed with the SEC on Form N-Q. The form will be available on the SEC's Web site at www.sec.gov, and it also may be reviewed and copied at the SEC's Public Reference Room in Washington, D.C. Information on the operation of the SEC's Public Reference Room may be obtained by calling (800) SEC-0330. The Fund's portfolio holdings are also posted on www.dws-investments.com from time to time. Please see the Fund's current prospectus for more information.
Investment Portfolio June 30, 2011 (Unaudited) | | | Principal Amount ($) (a) | | | Value ($) | |
| | | | |
| Corporate Bonds 67.1% | |
| Consumer Discretionary 9.6% | |
| Allison Transmission, Inc., 144A, 7.125%, 5/15/2019 | | | | 50,000 | | | | 48,625 | |
| AMC Entertainment, Inc., 8.0%, 3/1/2014 | | | | 105,000 | | | | 105,262 | |
| AMC Networks, Inc., 144A, 7.75%, 7/15/2021 | | | | 15,000 | | | | 15,675 | |
| American Achievement Corp., 144A, 10.875%, 4/15/2016 | | | | 45,000 | | | | 40,500 | |
| Asbury Automotive Group, Inc.: | |
| 7.625%, 3/15/2017 | | | | 65,000 | | | | 64,512 | |
| 144A, 8.375%, 11/15/2020 | | | | 80,000 | | | | 81,400 | |
| Avis Budget Car Rental LLC: | |
| 8.25%, 1/15/2019 | | | | 95,000 | | | | 96,187 | |
| 9.625%, 3/15/2018 | | | | 45,000 | | | | 48,038 | |
| Beazer Homes USA, Inc., 9.125%, 6/15/2018 | | | | 25,000 | | | | 21,563 | |
| Bon-Ton Department Stores, Inc., 10.25%, 3/15/2014 | | | | 50,000 | | | | 50,000 | |
| Bresnan Broadband Holdings LLC, 144A, 8.0%, 12/15/2018 | | | | 95,000 | | | | 97,969 | |
| Burlington Coat Factory Warehouse Corp., 144A, 10.0%, 2/15/2019 | | | | 45,000 | | | | 44,550 | |
| Cablevision Systems Corp.: | |
| 7.75%, 4/15/2018 | | | | 10,000 | | | | 10,663 | |
| 8.0%, 4/15/2020 | | | | 10,000 | | | | 10,725 | |
| Caesar's Entertainment Operating Co., Inc.: | | |
| 10.0%, 12/15/2018 | | | | 135,000 | | | | 121,837 | |
| 11.25%, 6/1/2017 | | | | 240,000 | | | | 264,900 | |
| 12.75%, 4/15/2018 | | | | 55,000 | | | | 54,863 | |
| CanWest LP, 144A, 9.25%, 8/1/2015* | | | | 50,000 | | | | 8,500 | |
| Carnival Corp., 6.65%, 1/15/2028 | | | | 145,000 | | | | 150,373 | |
| Carrols Corp., 9.0%, 1/15/2013 | | | | 30,000 | | | | 30,075 | |
| CCO Holdings LLC: | |
| 6.5%, 4/30/2021 | | | | 215,000 | | | | 212,044 | |
| 7.0%, 1/15/2019 | | | | 20,000 | | | | 20,600 | |
| 7.25%, 10/30/2017 | | | | 90,000 | | | | 93,262 | |
| 7.875%, 4/30/2018 | | | | 40,000 | | | | 42,150 | |
| 8.125%, 4/30/2020 | | | | 25,000 | | | | 27,000 | |
| Cequel Communications Holdings I LLC, 144A, 8.625%, 11/15/2017 | | | | 270,000 | | | | 280,800 | |
| Claire's Stores, Inc.: | |
| 144A, 8.875%, 3/15/2019 | | | | 25,000 | | | | 23,375 | |
| 9.625%, 6/1/2015 (PIK) | | | | 21,037 | | | | 20,458 | |
| Clear Channel Communications, Inc., 144A, 9.0%, 3/1/2021 | | | | 25,000 | | | | 23,938 | |
| Clear Channel Worldwide Holdings, Inc.: | | |
| Series A, 9.25%, 12/15/2017 | | | | 15,000 | | | | 16,313 | |
| Series B, 9.25%, 12/15/2017 | | | | 25,000 | | | | 27,250 | |
| Crown Media Holdings, Inc., 144A, 10.5%, 7/15/2019 (b) | | | | 55,000 | | | | 56,719 | |
| | | Principal Amount ($) (a) | | | Value ($) | |
| | | | | | | | | |
| Cumulus Media, Inc., 144A, 7.75%, 5/1/2019 | | | | 25,000 | | | | 24,125 | |
| DineEquity, Inc., 144A, 9.5%, 10/30/2018 | | | | 180,000 | | | | 195,300 | |
| DIRECTV Holdings LLC, 6.375%, 3/1/2041 | | | | 145,000 | | | | 154,814 | |
| DISH DBS Corp.: | |
| 6.625%, 10/1/2014 | | | | 65,000 | | | | 68,412 | |
| 144A, 6.75%, 6/1/2021 | | | | 10,000 | | | | 10,250 | |
| 7.125%, 2/1/2016 | | | | 155,000 | | | | 163,525 | |
| Dunkin' Brands, Inc., 144A, 9.625%, 12/1/2018 | | | | 27,000 | | | | 27,236 | |
| EH Holding Corp., 144A, 7.625%, 6/15/2021 | | | | 40,000 | | | | 40,800 | |
| Fontainebleau Las Vegas Holdings LLC, 144A, 11.0%, 6/15/2015* | | | | 65,000 | | | | 33 | |
| Ford Motor Co., 7.45%, 7/16/2031 | | | | 65,000 | | | | 73,686 | |
| Great Canadian Gaming Corp., 144A, 7.25%, 2/15/2015 | | | | 55,000 | | | | 56,237 | |
| Hertz Corp.: | |
| 144A, 6.75%, 4/15/2019 | | | | 115,000 | | | | 113,850 | |
| 144A, 7.5%, 10/15/2018 | | | | 155,000 | | | | 159,650 | |
| 8.875%, 1/1/2014 | | | | 26,000 | | | | 26,650 | |
| Hyundai Motor Manufacturing Czech, 144A, 4.5%, 4/15/2015 | | | | 145,000 | | | | 151,295 | |
| J. Crew Group, Inc., 144A, 8.125%, 3/1/2019 | | | | 35,000 | | | | 33,688 | |
| Kabel BW Erste Beteiligungs GmbH, 144A, 7.5%, 3/15/2019 | | | | 150,000 | | | | 153,000 | |
| Kia Motors Corp., 144A, 3.625%, 6/14/2016 | | | | 200,000 | | | | 197,839 | |
| Lear Corp.: | |
| 7.875%, 3/15/2018 | | | | 40,000 | | | | 43,000 | |
| 8.125%, 3/15/2020 | | | | 40,000 | | | | 43,100 | |
| Limited Brands, Inc., 7.0%, 5/1/2020 | | | | 20,000 | | | | 21,050 | |
| Lions Gate Entertainment, Inc., 144A, 10.25%, 11/1/2016 | | | | 95,000 | | | | 96,662 | |
| Macy's Retail Holdings, Inc., 8.125%, 7/15/2015 | | | | 10,000 | | | | 11,863 | |
| Mediacom Broadband LLC, 8.5%, 10/15/2015 | | | | 110,000 | | | | 112,750 | |
| Mediacom LLC, 9.125%, 8/15/2019 (c) | | | | 30,000 | | | | 31,650 | |
| MGM Resorts International: | |
| 7.5%, 6/1/2016 | | | | 30,000 | | | | 28,500 | |
| 7.625%, 1/15/2017 | | | | 100,000 | | | | 96,250 | |
| 9.0%, 3/15/2020 | | | | 65,000 | | | | 71,175 | |
| 144A, 10.0%, 11/1/2016 | | | | 45,000 | | | | 47,700 | |
| 10.375%, 5/15/2014 | | | | 45,000 | | | | 51,075 | |
| 11.125%, 11/15/2017 | | | | 50,000 | | | | 57,125 | |
| Michaels Stores, Inc., Step-up Coupon, 0% to 11/1/2011, 13.0% to 11/1/2016 | | | | 25,000 | | | | 25,875 | |
| National CineMedia LLC, 144A, 7.875%, 7/15/2021 | | | | 45,000 | | | | 45,675 | |
| Needle Merger Sub Corp., 144A, 8.125%, 3/15/2019 | | | | 50,000 | | | | 50,375 | |
| | | Principal Amount ($) (a) | | | Value ($) | |
| | | | | | | | | |
| Neiman Marcus Group, Inc., 10.375%, 10/15/2015 | | | | 25,000 | | | | 26,250 | |
| Palace Entertainment Holdings LLC, 144A, 8.875%, 4/15/2017 | | | | 75,000 | | | | 75,187 | |
| Penske Automotive Group, Inc., 7.75%, 12/15/2016 | | | | 175,000 | | | | 178,500 | |
| PETCO Animal Supplies, Inc., 144A, 9.25%, 12/1/2018 | | | | 60,000 | | | | 63,750 | |
| Phillips-Van Heusen Corp., 7.375%, 5/15/2020 | | | | 25,000 | | | | 26,750 | |
| Regal Entertainment Group, 9.125%, 8/15/2018 | | | | 35,000 | | | | 36,225 | |
| Sabre Holdings Corp., 8.35%, 3/15/2016 | | | | 90,000 | | | | 79,200 | |
| Sears Holdings Corp., 144A, 6.625%, 10/15/2018 | | | | 60,000 | | | | 55,650 | |
| Seminole Indian Tribe of Florida: | | |
| 144A, 7.75%, 10/1/2017 | | | | 40,000 | | | | 41,400 | |
| 144A, 7.804%, 10/1/2020 | | | | 70,000 | | | | 68,796 | |
| Servicios Corporativos Javer SAPI de CV, 144A, 9.875%, 4/6/2021 | | | | 100,000 | | | | 104,250 | |
| Simmons Bedding Co., 144A, 11.25%, 7/15/2015 | | | | 50,000 | | | | 52,500 | |
| Sirius XM Radio, Inc., 144A, 8.75%, 4/1/2015 | | | | 155,000 | | | | 170,887 | |
| Sonic Automotive, Inc., Series B, 9.0%, 3/15/2018 | | | | 95,000 | | | | 99,987 | |
| Standard Pacific Corp.: | |
| 8.375%, 5/15/2018 | | | | 100,000 | | | | 99,125 | |
| 10.75%, 9/15/2016 | | | | 80,000 | | | | 90,600 | |
| Toys "R" Us-Delaware, Inc., 144A, 7.375%, 9/1/2016 | | | | 35,000 | | | | 35,350 | |
| Travelport LLC: | |
| 4.879%**, 9/1/2014 | | | | 45,000 | | | | 38,363 | |
| 9.0%, 3/1/2016 | | | | 65,000 | | | | 58,012 | |
| UCI International, Inc., 8.625%, 2/15/2019 | | | | 20,000 | | | | 20,600 | |
| Unitymedia Hessen GmbH & Co., KG, 144A, 8.125%, 12/1/2017 | | | | 200,000 | | | | 212,500 | |
| Univision Communications, Inc.: | | |
| 144A, 6.875%, 5/15/2019 | | | | 10,000 | | | | 9,900 | |
| 144A, 7.875%, 11/1/2020 | | | | 25,000 | | | | 25,625 | |
| 144A, 8.5%, 5/15/2021 | | | | 25,000 | | | | 24,938 | |
| UPC Holding BV, 144A, 9.75%, 4/15/2018 | EUR | | | 100,000 | | | | 154,441 | |
| Valassis Communications, Inc., 144A, 6.625%, 2/1/2021 | | | | 30,000 | | | | 29,700 | |
| Visant Corp., 10.0%, 10/1/2017 | | | | 80,000 | | | | 82,800 | |
| Visteon Corp., 144A, 6.75%, 4/15/2019 | | | | 75,000 | | | | 72,375 | |
| Wyndham Worldwide Corp., 5.75%, 2/1/2018 | | | | 210,000 | | | | 216,844 | |
| Wynn Las Vegas LLC, 7.75%, 8/15/2020 | | | | 50,000 | | | | 54,313 | |
| Yonkers Racing Corp., 144A, 11.375%, 7/15/2016 | | | | 60,000 | | | | 65,100 | |
| | | | | 7,064,259 | |
| | | Principal Amount ($) (a) | | | Value ($) | |
| | | | | | | | | |
| Consumer Staples 2.7% | |
| Alliance One International, Inc., 10.0%, 7/15/2016 | | | | 25,000 | | | | 24,125 | |
| Altria Group, Inc.: | |
| 4.75%, 5/5/2021 | | | | 155,000 | | | | 154,894 | |
| 9.95%, 11/10/2038 | | | | 145,000 | | | | 203,732 | |
| American Rock Salt Co., LLC, 144A, 8.25%, 5/1/2018 | | | | 60,000 | | | | 60,225 | |
| B&G Foods, Inc., 7.625%, 1/15/2018 | | | | 35,000 | | | | 36,837 | |
| Central Garden & Pet Co., 8.25%, 3/1/2018 | | | | 35,000 | | | | 36,138 | |
| Darling International, Inc., 144A, 8.5%, 12/15/2018 | | | | 80,000 | | | | 86,400 | |
| Del Monte Foods Co., 144A, 7.625%, 2/15/2019 | | | | 130,000 | | | | 131,300 | |
| Dole Food Co., Inc., 144A, 8.0%, 10/1/2016 | | | | 35,000 | | | | 36,663 | |
| FAGE Dairy Industry SA, 144A, 9.875%, 2/1/2020 | | | | 85,000 | | | | 85,212 | |
| NBTY, Inc., 144A, 9.0%, 10/1/2018 | | | | 25,000 | | | | 26,375 | |
| North Atlantic Trading Co., 144A, 10.0%, 3/1/2012 | | | | 223,000 | | | | 219,097 | |
| Reynolds American, Inc., 6.75%, 6/15/2017 | | | | 200,000 | | | | 230,915 | |
| Rite Aid Corp.: | |
| 7.5%, 3/1/2017 | | | | 60,000 | | | | 59,550 | |
| 8.0%, 8/15/2020 | | | | 100,000 | | | | 107,750 | |
| Smithfield Foods, Inc.: | |
| 7.75%, 7/1/2017 | | | | 220,000 | | | | 228,250 | |
| 10.0%, 7/15/2014 | | | | 85,000 | | | | 98,600 | |
| Stater Bros. Holdings, Inc., 144A, 7.375%, 11/15/2018 | | | | 30,000 | | | | 31,125 | |
| SUPERVALU, Inc., 8.0%, 5/1/2016 | | | | 35,000 | | | | 35,700 | |
| TreeHouse Foods, Inc., 7.75%, 3/1/2018 | | | | 25,000 | | | | 26,563 | |
| US Foodservice, 144A, 8.5%, 6/30/2019 | | | | 35,000 | | | | 33,950 | |
| | | | | 1,953,401 | |
| Energy 6.8% | |
| Allis-Chalmers Energy, Inc., 9.0%, 1/15/2014 | | | | 24,000 | | | | 24,510 | |
| Alpha Natural Resources, Inc., 6.0%, 6/1/2019 | | | | 60,000 | | | | 59,850 | |
| Anadarko Petroleum Corp., 6.375%, 9/15/2017 | | | | 215,000 | | | | 246,462 | |
| Arch Coal, Inc.: | |
| 144A, 7.0%, 6/15/2019 | | | | 20,000 | | | | 19,950 | |
| 7.25%, 10/1/2020 | | | | 20,000 | | | | 20,350 | |
| 144A, 7.25%, 6/15/2021 | | | | 35,000 | | | | 35,044 | |
| 8.75%, 8/1/2016 | | | | 90,000 | | | | 97,650 | |
| Berry Petroleum Co., 6.75%, 11/1/2020 | | | | 90,000 | | | | 90,450 | |
| Bill Barrett Corp., 9.875%, 7/15/2016 | | | | 40,000 | | | | 44,800 | |
| BreitBurn Energy Partners LP, 8.625%, 10/15/2020 | | | | 50,000 | | | | 52,750 | |
| Brigham Exploration Co., 144A, 6.875%, 6/1/2019 | | | | 20,000 | | | | 19,900 | |
| Bristow Group, Inc., 7.5%, 9/15/2017 | | | | 70,000 | | | | 73,325 | |
| Chaparral Energy, Inc., 8.25%, 9/1/2021 | | | | 115,000 | | | | 115,862 | |
| CITGO Petroleum Corp., 144A, 11.5%, 7/1/2017 | | | | 105,000 | | | | 121,800 | |
| | | Principal Amount ($) (a) | | | Value ($) | |
| | | | | | | | | |
| CONSOL Energy, Inc.: | |
| 144A, 6.375%, 3/1/2021 | | | | 15,000 | | | | 14,925 | |
| 8.0%, 4/1/2017 | | | | 115,000 | | | | 125,350 | |
| 8.25%, 4/1/2020 | | | | 60,000 | | | | 65,400 | |
| Continental Resources, Inc.: | |
| 7.125%, 4/1/2021 | | | | 30,000 | | | | 31,650 | |
| 7.375%, 10/1/2020 | | | | 35,000 | | | | 37,188 | |
| 8.25%, 10/1/2019 | | | | 20,000 | | | | 21,850 | |
| Crestwood Midstream Partners LP, 144A, 7.75%, 4/1/2019 | | | | 160,000 | | | | 158,800 | |
| Crosstex Energy LP, 8.875%, 2/15/2018 | | | | 55,000 | | | | 58,575 | |
| Dresser-Rand Group, Inc., 144A, 6.5%, 5/1/2021 | | | | 75,000 | | | | 77,250 | |
| Eagle Rock Energy Partners LP, 144A, 8.375%, 6/1/2019 | | | | 95,000 | | | | 94,763 | |
| El Paso Corp., 7.25%, 6/1/2018 | | | | 55,000 | | | | 61,777 | |
| Energy Transfer Equity LP, 7.5%, 10/15/2020 | | | | 35,000 | | | | 37,100 | |
| Frontier Oil Corp., 6.875%, 11/15/2018 | | | | 55,000 | | | | 58,025 | |
| Genesis Energy LP, 144A, 7.875%, 12/15/2018 | | | | 40,000 | | | | 39,800 | |
| Global Geophysical Services, Inc., 10.5%, 5/1/2017 | | | | 130,000 | | | | 136,500 | |
| Harvest Operations Corp., 144A, 6.875%, 10/1/2017 | | | | 25,000 | | | | 25,813 | |
| Holly Energy Partners LP, 8.25%, 3/15/2018 | | | | 55,000 | | | | 58,300 | |
| Inergy LP: | |
| 144A, 6.875%, 8/1/2021 | | | | 10,000 | | | | 10,000 | |
| 7.0%, 10/1/2018 | | | | 60,000 | | | | 60,600 | |
| KazMunayGaz National Co., 144A, 6.375%, 4/9/2021 | | | | 200,000 | | | | 211,720 | |
| Linn Energy LLC: | |
| 144A, 6.5%, 5/15/2019 | | | | 50,000 | | | | 49,500 | |
| 144A, 7.75%, 2/1/2021 | | | | 60,000 | | | | 62,400 | |
| 8.625%, 4/15/2020 | | | | 55,000 | | | | 59,675 | |
| Marathon Petroleum Corp., 144A, 5.125%, 3/1/2021 | | | | 120,000 | | | | 123,366 | |
| MEG Energy Corp., 144A, 6.5%, 3/15/2021 | | | | 40,000 | | | | 40,200 | |
| Newfield Exploration Co., 7.125%, 5/15/2018 | | | | 90,000 | | | | 95,400 | |
| Nexen, Inc., 5.875%, 3/10/2035 | | | | 75,000 | | | | 71,018 | |
| Niska Gas Storage US LLC, 8.875%, 3/15/2018 | | | | 55,000 | | | | 57,750 | |
| Oasis Petroleum, Inc., 144A, 7.25%, 2/1/2019 | | | | 20,000 | | | | 19,850 | |
| Offshore Group Investments Ltd., 144A, 11.5%, 8/1/2015 | | | | 10,000 | | | | 10,875 | |
| Petrohawk Energy Corp.: | |
| 7.25%, 8/15/2018 | | | | 125,000 | | | | 128,281 | |
| 7.875%, 6/1/2015 | | | | 30,000 | | | | 31,425 | |
| Plains All American Pipeline LP, 5.0%, 2/1/2021 | | | | 170,000 | | | | 172,864 | |
| Plains Exploration & Production Co., 7.625%, 6/1/2018 | | | | 60,000 | | | | 63,000 | |
| Quicksilver Resources, Inc., 11.75%, 1/1/2016 | | | | 15,000 | | | | 17,175 | |
| Range Resources Corp., 6.75%, 8/1/2020 | | | | 20,000 | | | | 20,700 | |
| | | Principal Amount ($) (a) | | | Value ($) | |
| | | | | | | | | |
| Regency Energy Partners LP: | |
| 6.875%, 12/1/2018 | | | | 35,000 | | | | 36,225 | |
| 9.375%, 6/1/2016 | | | | 115,000 | | | | 128,225 | |
| Reliance Holdings USA, Inc., 144A, 6.25%, 10/19/2040 | | | | 250,000 | | | | 230,644 | |
| Sabine Pass LNG LP: | |
| 7.25%, 11/30/2013 | | | | 115,000 | | | | 117,875 | |
| 7.5%, 11/30/2016 | | | | 100,000 | | | | 102,500 | |
| SandRidge Energy, Inc.: | |
| 144A, 7.5%, 3/15/2021 | | | | 50,000 | | | | 50,625 | |
| 144A, 8.0%, 6/1/2018 | | | | 45,000 | | | | 45,900 | |
| SESI LLC, 144A, 6.375%, 5/1/2019 | | | | 40,000 | | | | 39,600 | |
| Southwestern Energy Co., 7.5%, 2/1/2018 | | | | 85,000 | | | | 96,688 | |
| Stone Energy Corp.: | |
| 6.75%, 12/15/2014 | | | | 95,000 | | | | 94,525 | |
| 8.625%, 2/1/2017 | | | | 25,000 | | | | 25,750 | |
| Transocean, Inc., 6.5%, 11/15/2020 | | | | 215,000 | | | | 240,421 | |
| Valero Energy Corp., 6.125%, 2/1/2020 | | | | 160,000 | | | | 175,830 | |
| Venoco, Inc., 144A, 8.875%, 2/15/2019 | | | | 105,000 | | | | 105,000 | |
| Xinergy Corp., 144A, 9.25%, 5/15/2019 | | | | 60,000 | | | | 60,600 | |
| | | | | 4,981,976 | |
| Financials 19.1% | |
| Akbank TAS, 144A, 5.125%, 7/22/2015 | | | | 145,000 | | | | 144,275 | |
| Algoma Acquisition Corp., 144A, 9.875%, 6/15/2015 | | | | 85,000 | | | | 79,050 | |
| Ally Financial, Inc.: | |
| 144A, 6.25%, 12/1/2017 | | | | 95,000 | | | | 94,367 | |
| 8.0%, 3/15/2020 | | | | 115,000 | | | | 122,187 | |
| 8.3%, 2/12/2015 | | | | 135,000 | | | | 150,862 | |
| ALROSA Finance SA, 144A, REG S, 7.75%, 11/3/2020 | | | | 200,000 | | | | 217,500 | |
| American International Group, Inc., Series G, 5.6%, 10/18/2016 | | | | 290,000 | | | | 303,623 | |
| Antero Resources Finance Corp., 9.375%, 12/1/2017 | | | | 30,000 | | | | 32,250 | |
| Ashton Woods USA LLC, 144A, Step-up Coupon, 0% to 6/30/2012, 11.0% to 6/30/2015 | | | | 75,400 | | | | 45,617 | |
| Banco do Brasil SA, 144A, 5.875%, 1/26/2022 | | | | 121,000 | | | | 119,669 | |
| Banco Votorantim SA, 144A, 7.375%, 1/21/2020 | | | | 100,000 | | | | 106,000 | |
| Bank of America Corp., 5.0%, 5/13/2021 | | | | 245,000 | | | | 242,023 | |
| Barclays Bank PLC, 5.14%, 10/14/2020 | | | | 140,000 | | | | 132,778 | |
| BBVA Bancomer SA, 144A, 6.5%, 3/10/2021 | | | | 290,000 | | | | 295,800 | |
| BNP Paribas, 3.6%, 2/23/2016 | | | | 145,000 | | | | 146,620 | |
| BP Capital Markets PLC, 4.5%, 10/1/2020 | | | | 120,000 | | | | 122,375 | |
| Bumble Bee Acquisition Corp., 144A, 9.0%, 12/15/2017 | | | | 55,000 | | | | 55,275 | |
| Calpine Construction Finance Co., LP, 144A, 8.0%, 6/1/2016 | | | | 200,000 | | | | 216,000 | |
| | | Principal Amount ($) (a) | | | Value ($) | |
| | | | | | | | | |
| Case New Holland, Inc., 7.75%, 9/1/2013 | | | | 45,000 | | | | 48,713 | |
| CIT Group, Inc.: | |
| Series C, 144A, 5.25%, 4/1/2014 | | | | 275,000 | | | | 273,625 | |
| 7.0%, 5/1/2015 | | | | 970 | | | | 971 | |
| 144A, 7.0%, 5/4/2015 | | | | 105,000 | | | | 105,131 | |
| 144A, 7.0%, 5/2/2017 | | | | 355,000 | | | | 354,112 | |
| Citigroup, Inc., 5.375%, 8/9/2020 | | | | 145,000 | | | | 151,317 | |
| CNA Financial Corp., 5.75%, 8/15/2021 | | | | 75,000 | | | | 77,444 | |
| Country Garden Holdings Co., 144A, 11.125%, 2/23/2018 | | | | 200,000 | | | | 206,000 | |
| CPI International Acquisition, Inc., 144A, 8.0%, 2/15/2018 | | | | 45,000 | | | | 42,525 | |
| Credit Agricole SA, 144A, 3.5%, 4/13/2015 | | | | 171,000 | | | | 171,492 | |
| Discover Bank, 7.0%, 4/15/2020 | | | | 145,000 | | | | 161,050 | |
| E*TRADE Financial Corp., 6.75%, 6/1/2016 | | | | 105,000 | | | | 102,900 | |
| Felcor Lodging LP, (REIT), 144A, 6.75%, 6/1/2019 | | | | 70,000 | | | | 67,200 | |
| Ford Motor Credit Co., LLC: | |
| 7.25%, 10/25/2011 | | | | 60,000 | | | | 60,900 | |
| 7.5%, 8/1/2012 | | | | 500,000 | | | | 523,202 | |
| 9.875%, 8/10/2011 | | | | 145,000 | | | | 145,917 | |
| FUEL Trust, 144A, 3.984%, 6/15/2016 | | | | 290,000 | | | | 287,644 | |
| General Electric Capital Corp., 5.3%, 2/11/2021 | | | | 75,000 | | | | 78,041 | |
| Giraffe Acquisition Corp., 144A, 9.125%, 12/1/2018 | | | | 55,000 | | | | 51,700 | |
| Gruposura Finance, 144A, 5.7%, 5/18/2021 | | | | 200,000 | | | | 199,500 | |
| Hartford Financial Services Group, Inc., 5.5%, 3/30/2020 | | | | 145,000 | | | | 149,467 | |
| HCP, Inc., (REIT), 5.375%, 2/1/2021 | | | | 143,000 | | | | 147,494 | |
| Health Care REIT, Inc., (REIT), 5.25%, 1/15/2022 | | | | 145,000 | | | | 144,443 | |
| Hellas Telecommunications Finance SCA, 144A, 8.985%**, 7/15/2015 (PIK)* | EUR | | | 109,187 | | | | 95 | |
| Hexion US Finance Corp., 8.875%, 2/1/2018 | | | | 340,000 | | | | 353,600 | |
| Hospitality Properties Trust, (REIT), 7.875%, 8/15/2014 | | | | 200,000 | | | | 225,659 | |
| Host Hotels & Resorts LP, (REIT), 6.875%, 11/1/2014 | | | | 165,000 | | | | 169,125 | |
| HSBC Finance Corp., 144A, 6.676%, 1/15/2021 | | | | 120,000 | | | | 123,122 | |
| Intergas Finance BV, REG S, 6.875%, 11/4/2011 | | | | 275,000 | | | | 279,125 | |
| International Finance Corp., 5.75%, 3/16/2015 | AUD | | | 285,000 | | | | 308,404 | |
| International Lease Finance Corp.: | | |
| 5.75%, 5/15/2016 | | | | 20,000 | | | | 19,694 | |
| 6.25%, 5/15/2019 | | | | 50,000 | | | | 48,853 | |
| 8.625%, 9/15/2015 | | | | 40,000 | | | | 43,350 | |
| 8.75%, 3/15/2017 | | | | 180,000 | | | | 196,875 | |
| Intesa Sanpaolo SpA, 144A, 2.658%**, 2/24/2014 | | | | 205,000 | | | | 204,498 | |
| | | Principal Amount ($) (a) | | | Value ($) | |
| | | | | | | | | |
| JBS Finance II Ltd., 144A, 8.25%, 1/29/2018 | | | | 100,000 | | | | 102,000 | |
| Jefferies Group, Inc., 5.125%, 4/13/2018 | | | | 290,000 | | | | 290,585 | |
| KeyCorp, 5.1%, 3/24/2021 | | | | 130,000 | | | | 132,404 | |
| Level 3 Escrow, Inc., 144A, 8.125%, 7/1/2019 | | | | 75,000 | | | | 75,375 | |
| Lincoln National Corp., 7.0%, 6/15/2040 | | | | 145,000 | | | | 163,509 | |
| Lloyds TSB Bank PLC, 144A, 6.5%, 9/14/2020 | | | | 215,000 | | | | 202,806 | |
| Lukoil International Finance BV, 144A, 7.25%, 11/5/2019 | | | | 145,000 | | | | 161,109 | |
| Macquarie Group Ltd., 144A, 6.25%, 1/14/2021 | | | | 210,000 | | | | 209,877 | |
| Manulife Financial Corp., 4.9%, 9/17/2020 | | | | 135,000 | | | | 134,911 | |
| Morgan Stanley, 5.75%, 1/25/2021 | | | | 290,000 | | | | 293,430 | |
| MPT Operating Partnership LP, (REIT), 144A, 6.875%, 5/1/2021 | | | | 50,000 | | | | 49,125 | |
| Navios Maritime Acquisition Corp., 8.625%, 11/1/2017 | | | | 25,000 | | | | 24,625 | |
| Nielsen Finance LLC: | |
| 144A, 7.75%, 10/15/2018 | | | | 25,000 | | | | 26,250 | |
| 11.5%, 5/1/2016 | | | | 13,000 | | | | 15,210 | |
| NII Capital Corp., 7.625%, 4/1/2021 | | | | 60,000 | | | | 62,700 | |
| Nomura Holdings, Inc., 6.7%, 3/4/2020 | | | | 90,000 | | | | 98,339 | |
| Nuveen Investments, Inc.: | |
| 10.5%, 11/15/2015 | | | | 140,000 | | | | 143,150 | |
| 144A, 10.5%, 11/15/2015 | | | | 95,000 | | | | 96,188 | |
| Odebrecht Finance Ltd., 144A, 6.0%, 4/5/2023 | | | | 145,000 | | | | 144,094 | |
| OMEGA Healthcare Investors, Inc., (REIT), 144A, 6.75%, 10/15/2022 | | | | 55,000 | | | | 54,244 | |
| Petrobras International Finance Co., 5.375%, 1/27/2021 | | | | 145,000 | | | | 148,887 | |
| Pinnacle Foods Finance LLC: | |
| 8.25%, 9/1/2017 | | | | 70,000 | | | | 72,625 | |
| 9.25%, 4/1/2015 | | | | 35,000 | | | | 36,313 | |
| PNC Bank NA, 6.875%, 4/1/2018 | | | | 180,000 | | | | 212,156 | |
| Qtel International Finance Ltd., 144A, 4.75%, 2/16/2021 | | | | 200,000 | | | | 195,000 | |
| Reynolds Group Issuer, Inc.: | |
| 144A, 6.875%, 2/15/2021 | | | | 100,000 | | | | 97,500 | |
| 144A, 7.125%, 4/15/2019 | | | | 100,000 | | | | 99,250 | |
| 144A, 8.75%, 5/15/2018 | | | | 195,000 | | | | 191,587 | |
| 144A, 9.0%, 4/15/2019 | | | | 105,000 | | | | 103,688 | |
| Santander US Debt SA Unipersonal, 144A, 3.724%, 1/20/2015 | | | | 145,000 | | | | 140,355 | |
| Shinhan Bank, 144A, 4.125%, 10/4/2016 | | | | 145,000 | | | | 147,656 | |
| Societe Generale, 144A, 3.5%, 1/15/2016 | | | | 145,000 | | | | 143,402 | |
| Susser Holdings LLC, 8.5%, 5/15/2016 | | | | 30,000 | | | | 31,575 | |
| Telecom Italia Capital SA, 4.95%, 9/30/2014 | | | | 174,000 | | | | 181,424 | |
| Telemovil Finance Co., Ltd., 144A, 8.0%, 10/1/2017 | | | | 100,000 | | | | 105,350 | |
| | | Principal Amount ($) (a) | | | Value ($) | |
| | | | | | | | | |
| The Goldman Sachs Group, Inc., 6.25%, 2/1/2041 | | | | 155,000 | | | | 156,267 | |
| Tomkins LLC, 144A, 9.0%, 10/1/2018 | | | | 40,000 | | | | 43,100 | |
| Toys "R" Us Property Co. I, LLC, 10.75%, 7/15/2017 | | | | 50,000 | | | | 55,625 | |
| Tropicana Entertainment LLC, 9.625%, 12/15/2014* | | | | 150,000 | | | | 75 | |
| Virgin Media Finance PLC, Series 1, 9.5%, 8/15/2016 | | | | 300,000 | | | | 339,000 | |
| Virgin Media Secured Finance PLC, 6.5%, 1/15/2018 | | | | 375,000 | | | | 411,094 | |
| Wells Fargo & Co., 4.6%, 4/1/2021 | | | | 170,000 | | | | 170,944 | |
| Woori Bank, 144A, 5.875%, 4/13/2021 | | | | 290,000 | | | | 290,332 | |
| | | | | 14,002,595 | |
| Health Care 2.1% | |
| Aviv Healthcare Properties LP, 144A, 7.75%, 2/15/2019 | | | | 40,000 | | | | 40,900 | |
| Community Health Systems, Inc., 8.875%, 7/15/2015 | | | | 80,000 | | | | 82,400 | |
| Endo Pharmaceuticals Holdings, Inc.: | | |
| 144A, 7.0%, 7/15/2019 | | | | 55,000 | | | | 56,375 | |
| 144A, 7.25%, 1/15/2022 | | | | 50,000 | | | | 50,750 | |
| HCA Holdings, Inc., 144A, 7.75%, 5/15/2021 (c) | | | | 105,000 | | | | 108,938 | |
| HCA, Inc.: | |
| 7.875%, 2/15/2020 | | | | 365,000 | | | | 396,025 | |
| 8.5%, 4/15/2019 | | | | 45,000 | | | | 49,725 | |
| 9.25%, 11/15/2016 | | | | 310,000 | | | | 328,987 | |
| 9.625%, 11/15/2016 (PIK) | | | | 152,000 | | | | 161,690 | |
| Mylan, Inc., 144A, 7.875%, 7/15/2020 | | | | 15,000 | | | | 16,463 | |
| STHI Holding Corp., 144A, 8.0%, 3/15/2018 | | | | 60,000 | | | | 60,900 | |
| Vanguard Health Holding Co. II, LLC, 8.0%, 2/1/2018 | | | | 100,000 | | | | 103,250 | |
| Warner Chilcott Co., LLC, 144A, 7.75%, 9/15/2018 | | | | 75,000 | | | | 75,656 | |
| | | | | 1,532,059 | |
| Industrials 6.1% | |
| Accuride Corp., 9.5%, 8/1/2018 | | | | 75,000 | | | | 80,250 | |
| Actuant Corp., 6.875%, 6/15/2017 | | | | 40,000 | | | | 40,900 | |
| American Airlines, Inc., 144A, 7.5%, 3/15/2016 | | | | 85,000 | | | | 83,300 | |
| AMGH Merger Sub, Inc., 144A, 9.25%, 11/1/2018 | | | | 30,000 | | | | 31,650 | |
| ARAMARK Corp., 8.5%, 2/1/2015 | | | | 20,000 | | | | 20,775 | |
| ARAMARK Holdings Corp., 144A, 8.625%, 5/1/2016 (PIK) | | | | 20,000 | | | | 20,350 | |
| Armored Autogroup, Inc., 144A, 9.25%, 11/1/2018 | | | | 105,000 | | | | 103,950 | |
| B-Corp Merger Sub, Inc., 144A, 8.25%, 6/1/2019 | | | | 60,000 | | | | 59,400 | |
| BAA Funding Ltd., "A", 144A, 4.875%, 7/15/2021 | | | | 290,000 | | | | 282,519 | |
| BE Aerospace, Inc.: | |
| 6.875%, 10/1/2020 | | | | 35,000 | | | | 36,663 | |
| 8.5%, 7/1/2018 | | | | 105,000 | | | | 114,581 | |
| | | Principal Amount ($) (a) | | | Value ($) | |
| | | | | | | | | |
| Belden, Inc.: | |
| 7.0%, 3/15/2017 | | | | 45,000 | | | | 46,125 | |
| 9.25%, 6/15/2019 | | | | 40,000 | | | | 44,500 | |
| Boart Longyear Management Pty Ltd., 144A, 7.0%, 4/1/2021 | | | | 35,000 | | | | 35,788 | |
| Bombardier, Inc., 144A, 7.75%, 3/15/2020 | | | | 55,000 | | | | 61,875 | |
| Briggs & Stratton Corp., 6.875%, 12/15/2020 | | | | 35,000 | | | | 37,100 | |
| Casella Waste Systems, Inc., 144A, 7.75%, 2/15/2019 | | | | 110,000 | | | | 110,275 | |
| Cenveo Corp.: | |
| 8.875%, 2/1/2018 | | | | 100,000 | | | | 97,000 | |
| 144A, 10.5%, 8/15/2016 | | | | 55,000 | | | | 54,037 | |
| CHC Helicopter SA, 144A, 9.25%, 10/15/2020 | | | | 215,000 | | | | 194,037 | |
| Congoleum Corp., 9.0%, 12/31/2017 (PIK) | | | | 41,250 | | | | 26,813 | |
| Corrections Corp. of America, 7.75%, 6/1/2017 | | | | 30,000 | | | | 32,663 | |
| Deluxe Corp., 144A, 7.0%, 3/15/2019 | | | | 30,000 | | | | 29,700 | |
| Ducommun, Inc., 144A, 9.75%, 7/15/2018 | | | | 65,000 | | | | 66,787 | |
| DynCorp International, Inc., 144A, 10.375%, 7/1/2017 | | | | 85,000 | | | | 87,125 | |
| Florida East Coast Railway Corp., 144A, 8.125%, 2/1/2017 | | | | 40,000 | | | | 41,300 | |
| FTI Consulting, Inc., 6.75%, 10/1/2020 | | | | 145,000 | | | | 146,450 | |
| Garda World Security Corp., 144A, 9.75%, 3/15/2017 | | | | 60,000 | | | | 63,450 | |
| H&E Equipment Services, Inc., 8.375%, 7/15/2016 | | | | 110,000 | | | | 112,475 | |
| Huntington Ingalls Industries, Inc.: | | |
| 144A, 6.875%, 3/15/2018 | | | | 30,000 | | | | 30,750 | |
| 144A, 7.125%, 3/15/2021 | | | | 10,000 | | | | 10,350 | |
| Interline Brands, Inc., 7.0%, 11/15/2018 | | | | 50,000 | | | | 50,625 | |
| Kansas City Southern de Mexico SA de CV, 8.0%, 2/1/2018 | | | | 105,000 | | | | 113,925 | |
| Kansas City Southern Railway Co., 8.0%, 6/1/2015 | | | | 100,000 | | | | 107,250 | |
| Masco Corp., 7.125%, 3/15/2020 | | | | 145,000 | | | | 148,427 | |
| Meritor, Inc.: | |
| 8.125%, 9/15/2015 | | | | 55,000 | | | | 57,337 | |
| 10.625%, 3/15/2018 | | | | 60,000 | | | | 67,350 | |
| Navios Maritime Holdings, Inc., 144A, 8.125%, 2/15/2019 | | | | 135,000 | | | | 129,600 | |
| Nortek, Inc., 144A, 8.5%, 4/15/2021 | | | | 125,000 | | | | 115,625 | |
| Oshkosh Corp.: | |
| 8.25%, 3/1/2017 | | | | 10,000 | | | | 10,725 | |
| 8.5%, 3/1/2020 | | | | 25,000 | | | | 27,063 | |
| Owens Corning, Inc., 9.0%, 6/15/2019 | | | | 217,000 | | | | 259,184 | |
| Ply Gem Industries, Inc.: | |
| 144A, 8.25%, 2/15/2018 | | | | 50,000 | | | | 47,375 | |
| 13.125%, 7/15/2014 | | | | 95,000 | | | | 99,750 | |
| RailAmerica, Inc., 9.25%, 7/1/2017 | | | | 36,000 | | | | 39,510 | |
| | | Principal Amount ($) (a) | | | Value ($) | |
| | | | | | | | | |
| RBS Global, Inc. & Rexnord Corp., 8.5%, 5/1/2018 | | | | 120,000 | | | | 126,750 | |
| Republic Services, Inc., 5.7%, 5/15/2041 | | | | 185,000 | | | | 180,601 | |
| Sitel LLC, 11.5%, 4/1/2018 | | | | 95,000 | | | | 86,925 | |
| Spirit AeroSystems, Inc., 6.75%, 12/15/2020 | | | | 75,000 | | | | 76,125 | |
| SPX Corp., 144A, 6.875%, 9/1/2017 | | | | 20,000 | | | | 21,400 | |
| Titan International, Inc., 144A, 7.875%, 10/1/2017 | | | | 160,000 | | | | 167,200 | |
| TransDigm, Inc., 144A, 7.75%, 12/15/2018 | | | | 65,000 | | | | 68,250 | |
| Tutor Perini Corp., 7.625%, 11/1/2018 | | | | 55,000 | | | | 52,800 | |
| USG Corp., 144A, 9.75%, 8/1/2014 | | | | 45,000 | | | | 47,700 | |
| Votorantim Cimentos SA, 144A, 7.25%, 4/5/2041 | | | | 145,000 | | | | 143,187 | |
| | | | | 4,447,622 | |
| Information Technology 3.0% | |
| Alcatel-Lucent USA, Inc., 6.45%, 3/15/2029 | | | | 70,000 | | | | 63,000 | |
| Allen Systems Group, Inc., 144A, 10.5%, 11/15/2016 | | | | 35,000 | | | | 35,175 | |
| Amkor Technology, Inc.: | |
| 144A, 6.625%, 6/1/2021 | | | | 10,000 | | | | 9,625 | |
| 7.375%, 5/1/2018 | | | | 45,000 | | | | 45,731 | |
| Aspect Software, Inc., 10.625%, 5/15/2017 | | | | 60,000 | | | | 64,500 | |
| Avaya, Inc., 144A, 7.0%, 4/1/2019 | | | | 145,000 | | | | 140,287 | |
| CDW LLC: | |
| 144A, 8.5%, 4/1/2019 | | | | 110,000 | | | | 107,800 | |
| 11.0%, 10/12/2015 | | | | 9,000 | | | | 9,473 | |
| CommScope, Inc., 144A, 8.25%, 1/15/2019 | | | | 85,000 | | | | 87,550 | |
| eAccess Ltd., 144A, 8.25%, 4/1/2018 | | | | 60,000 | | | | 59,850 | |
| Equinix, Inc., 8.125%, 3/1/2018 | | | | 140,000 | | | | 152,425 | |
| Fidelity National Information Services, Inc., 7.625%, 7/15/2017 | | | | 20,000 | | | | 21,225 | |
| First Data Corp.: | |
| 144A, 7.375%, 6/15/2019 | | | | 30,000 | | | | 30,225 | |
| 144A, 8.25%, 1/15/2021 | | | | 190,000 | | | | 186,200 | |
| 144A, 8.875%, 8/15/2020 | | | | 85,000 | | | | 90,737 | |
| Freescale Semiconductor, Inc.: | |
| 144A, 8.05%, 2/1/2020 | | | | 85,000 | | | | 85,425 | |
| 144A, 9.25%, 4/15/2018 | | | | 190,000 | | | | 204,725 | |
| Jabil Circuit, Inc., 7.75%, 7/15/2016 | | | | 30,000 | | | | 33,225 | |
| MasTec, Inc., 7.625%, 2/1/2017 | | | | 65,000 | | | | 66,138 | |
| MEMC Electronic Materials, Inc., 144A, 7.75%, 4/1/2019 | | | | 40,000 | | | | 39,500 | |
| Sanmina-SCI Corp., 144A, 7.0%, 5/15/2019 | | | | 45,000 | | | | 42,525 | |
| Seagate HDD Cayman, 144A, 7.0%, 11/1/2021 | | | | 50,000 | | | | 50,000 | |
| Sensata Technologies BV, 144A, 6.5%, 5/15/2019 | | | | 50,000 | | | | 49,875 | |
| SunGard Data Systems, Inc.: | |
| 7.375%, 11/15/2018 | | | | 25,000 | | | | 25,000 | |
| 10.25%, 8/15/2015 | | | | 225,000 | | | | 232,875 | |
| | | Principal Amount ($) (a) | | | Value ($) | |
| | | | | | | | | |
| Unisys Corp., 144A, 12.75%, 10/15/2014 | | | | 41,000 | | | | 47,765 | |
| Vangent, Inc., 9.625%, 2/15/2015 | | | | 35,000 | | | | 35,350 | |
| Western Union Co., 6.2%, 6/21/2040 | | | | 145,000 | | | | 145,598 | |
| | | | | 2,161,804 | |
| Materials 6.7% | |
| Aleris International, Inc., 144A, 7.625%, 2/15/2018 | | | | 40,000 | | | | 39,900 | |
| APERAM, 144A, 7.375%, 4/1/2016 | | | | 150,000 | | | | 150,750 | |
| Appleton Papers, Inc., 11.25%, 12/15/2015 | | | | 25,000 | | | | 25,250 | |
| ArcelorMittal, 6.125%, 6/1/2018 | | | | 250,000 | | | | 267,769 | |
| Ball Corp.: | |
| 7.125%, 9/1/2016 | | | | 30,000 | | | | 32,700 | |
| 7.375%, 9/1/2019 | | | | 25,000 | | | | 27,313 | |
| Berry Plastics Corp.: | |
| 9.5%, 5/15/2018 | | | | 65,000 | | | | 64,512 | |
| 9.75%, 1/15/2021 | | | | 80,000 | | | | 77,400 | |
| Boise Paper Holdings LLC, 8.0%, 4/1/2020 | | | | 30,000 | | | | 31,500 | |
| BWAY Parent Co., Inc., 144A, 10.125%, 11/1/2015 (PIK) | | | | 42,235 | | | | 42,235 | |
| Celanese US Holdings LLC: | |
| 5.875%, 6/15/2021 | | | | 30,000 | | | | 30,675 | |
| 6.625%, 10/15/2018 | | | | 35,000 | | | | 36,925 | |
| Cemex SAB de CV, 144A, 9.0%, 1/11/2018 | | | | 150,000 | | | | 152,625 | |
| China Oriental Group Co., Ltd., 144A, 8.0%, 8/18/2015 | | | | 100,000 | | | | 101,500 | |
| Clearwater Paper Corp., 7.125%, 11/1/2018 | | | | 65,000 | | | | 66,625 | |
| Cliffs Natural Resources, Inc., 6.25%, 10/1/2040 | | | | 145,000 | | | | 143,085 | |
| Clondalkin Acquisition BV, 144A, 2.247%**, 12/15/2013 | | | | 75,000 | | | | 71,625 | |
| Crown Americas LLC: | |
| 144A, 6.25%, 2/1/2021 | | | | 10,000 | | | | 10,100 | |
| 7.625%, 5/15/2017 | | | | 30,000 | | | | 32,138 | |
| Essar Steel Algoma, Inc., 144A, 9.375%, 3/15/2015 | | | | 240,000 | | | | 240,600 | |
| Exopack Holding Corp., 144A, 10.0%, 6/1/2018 | | | | 40,000 | | | | 39,700 | |
| FMG Resources August 2006 Pty Ltd., 144A, 7.0%, 11/1/2015 | | | | 25,000 | | | | 25,500 | |
| GEO Specialty Chemicals, Inc.: | |
| 144A, 7.5%, 3/31/2015 (PIK) | | | | 120,175 | | | | 110,561 | |
| 10.0%, 3/31/2015 | | | | 119,040 | | | | 117,850 | |
| Georgia-Pacific LLC, 144A, 5.4%, 11/1/2020 | | | | 145,000 | | | | 147,774 | |
| Graham Packaging Co., LP, 8.25%, 10/1/2018 | | | | 25,000 | | | | 27,813 | |
| Graphic Packaging International, Inc.: | | |
| 7.875%, 10/1/2018 | | | | 10,000 | | | | 10,600 | |
| 9.5%, 6/15/2017 | | | | 130,000 | | | | 142,350 | |
| Greif, Inc., 7.75%, 8/1/2019 | | | | 195,000 | | | | 210,600 | |
| Hexcel Corp., 6.75%, 2/1/2015 | | | | 93,000 | | | | 94,627 | |
| | | Principal Amount ($) (a) | | | Value ($) | |
| | | | | | | | | |
| Huntsman International LLC: | |
| 8.625%, 3/15/2020 | | | | 60,000 | | | | 65,400 | |
| 8.625%, 3/15/2021 | | | | 25,000 | | | | 27,188 | |
| International Paper Co., 7.95%, 6/15/2018 | | | | 145,000 | | | | 172,651 | |
| JMC Steel Group, 144A, 8.25%, 3/15/2018 | | | | 60,000 | | | | 60,900 | |
| Longview Fibre Paper & Packaging, Inc., 144A, 8.0%, 6/1/2016 | | | | 60,000 | | | | 60,300 | |
| Lyondell Chemical Co., 144A, 8.0%, 11/1/2017 | | | | 100,000 | | | | 111,250 | |
| Momentive Performance Materials, Inc., 9.0%, 1/15/2021 | | | | 230,000 | | | | 234,600 | |
| Nalco Co., 144A, 6.625%, 1/15/2019 | | | | 45,000 | | | | 46,125 | |
| NewMarket Corp., 7.125%, 12/15/2016 | | | | 110,000 | | | | 114,675 | |
| Novelis, Inc.: | |
| 8.375%, 12/15/2017 | | | | 140,000 | | | | 149,450 | |
| 8.75%, 12/15/2020 | | | | 110,000 | | | | 118,800 | |
| Owens-Brockway Glass Container, Inc., 7.375%, 5/15/2016 | | | | 110,000 | | | | 119,625 | |
| Packaging Dynamics Corp., 144A, 8.75%, 2/1/2016 | | | | 90,000 | | | | 91,350 | |
| Phibro Animal Health Corp., 144A, 9.25%, 7/1/2018 | | | | 10,000 | | | | 10,550 | |
| Polymer Group, Inc., 144A, 7.75%, 2/1/2019 | | | | 55,000 | | | | 55,137 | |
| Quadra FNX Mining Ltd., 144A, 7.75%, 6/15/2019 | | | | 115,000 | | | | 116,150 | |
| Radnor Holdings Corp., 11.0%, 3/15/2010* | | | | 25,000 | | | | 3 | |
| Rain CII Carbon LLC, 144A, 8.0%, 12/1/2018 | | | | 45,000 | | | | 47,925 | |
| Silgan Holdings, Inc., 7.25%, 8/15/2016 | | | | 50,000 | | | | 52,750 | |
| Solo Cup Co., 10.5%, 11/1/2013 | | | | 170,000 | | | | 176,800 | |
| Texas Industries, Inc., 9.25%, 8/15/2020 | | | | 75,000 | | | | 72,562 | |
| United States Steel Corp., 7.375%, 4/1/2020 | | | | 80,000 | | | | 82,200 | |
| Verso Paper Holdings LLC, 144A, 8.75%, 2/1/2019 | | | | 25,000 | | | | 22,250 | |
| Viskase Companies, Inc., | |
| Viskase Companies, Inc., 144A, 9.875%, 1/15/2018 | | | | 145,000 | | | | 151,162 | |
| Vulcan Materials Co., 6.5%, 12/1/2016 | | | | 145,000 | | | | 144,107 | |
| Wolverine Tube, Inc., 15.0%, 3/31/2012* | | | | 91,631 | | | | 44,212 | |
| | | | | 4,920,724 | |
| Telecommunication Services 7.7% | |
| American Tower Corp., 4.5%, 1/15/2018 | | | | 125,000 | | | | 124,942 | |
| Buccaneer Merger Sub, Inc., 144A, 9.125%, 1/15/2019 | | | | 25,000 | | | | 26,000 | |
| CC Holdings GS V LLC, 144A, 7.75%, 5/1/2017 | | | | 350,000 | | | | 378,875 | |
| CenturyLink, Inc., 6.45%, 6/15/2021 | | | | 145,000 | | | | 143,343 | |
| Cincinnati Bell, Inc.: | |
| 8.25%, 10/15/2017 | | | | 55,000 | | | | 55,275 | |
| 8.375%, 10/15/2020 | | | | 180,000 | | | | 179,550 | |
| 8.75%, 3/15/2018 | | | | 170,000 | | | | 161,500 | |
| | | Principal Amount ($) (a) | | | Value ($) | |
| | | | | | | | | |
| Clearwire Communications LLC, 144A, 12.0%, 12/1/2015 | | | | 20,000 | | | | 21,425 | |
| Cricket Communications, Inc.: | |
| 7.75%, 10/15/2020 | | | | 310,000 | | | | 303,800 | |
| 10.0%, 7/15/2015 | | | | 100,000 | | | | 107,750 | |
| Crown Castle International Corp., 9.0%, 1/15/2015 | | | | 195,000 | | | | 211,575 | |
| Digicel Group Ltd., 144A, 10.5%, 4/15/2018 | | | | 100,000 | | | | 112,000 | |
| Digicel Ltd., 144A, 8.25%, 9/1/2017 | | | | 300,000 | | | | 311,250 | |
| ERC Ireland Preferred Equity Ltd., 144A, 8.42%**, 2/15/2017 (PIK) | EUR | | | 82,823 | | | | 601 | |
| Frontier Communications Corp.: | | |
| 7.875%, 4/15/2015 | | | | 10,000 | | | | 10,850 | |
| 8.25%, 4/15/2017 | | | | 70,000 | | | | 76,125 | |
| 8.5%, 4/15/2020 | | | | 90,000 | | | | 98,100 | |
| 8.75%, 4/15/2022 | | | | 10,000 | | | | 10,900 | |
| Hughes Network Systems LLC, 9.5%, 4/15/2014 | | | | 150,000 | | | | 153,750 | |
| Intelsat Jackson Holdings SA: | |
| 144A, 7.25%, 10/15/2020 | | | | 120,000 | | | | 119,400 | |
| 144A, 7.5%, 4/1/2021 | | | | 150,000 | | | | 149,062 | |
| 8.5%, 11/1/2019 | | | | 100,000 | | | | 106,000 | |
| 11.25%, 6/15/2016 | | | | 60,000 | | | | 63,600 | |
| Intelsat Luxembourg SA: | |
| 11.25%, 2/4/2017 | | | | 145,000 | | | | 155,694 | |
| 11.5%, 2/4/2017 (PIK) | | | | 304,218 | | | | 327,034 | |
| 144A, 11.5%, 2/4/2017 (PIK) | | | | 80,000 | | | | 86,000 | |
| iPCS, Inc., 2.398%**, 5/1/2013 | | | | 35,000 | | | | 34,213 | |
| MetroPCS Wireless, Inc.: | |
| 6.625%, 11/15/2020 | | | | 90,000 | | | | 89,100 | |
| 7.875%, 9/1/2018 | | | | 75,000 | | | | 79,406 | |
| Qwest Communications International, Inc.: | | |
| 7.125%, 4/1/2018 | | | | 55,000 | | | | 59,056 | |
| 8.0%, 10/1/2015 | | | | 60,000 | | | | 65,250 | |
| Qwest Corp., 7.5%, 10/1/2014 | | | | 285,000 | | | | 319,556 | |
| SBA Telecommunications, Inc.: | | |
| 8.0%, 8/15/2016 | | | | 35,000 | | | | 37,231 | |
| 8.25%, 8/15/2019 | | | | 25,000 | | | | 26,750 | |
| Sprint Nextel Corp., 8.375%, 8/15/2017 | | | | 115,000 | | | | 126,356 | |
| Telefonica Emisiones SAU, 6.421%, 6/20/2016 | | | | 290,000 | | | | 323,797 | |
| Telesat Canada, 11.0%, 11/1/2015 | | | | 190,000 | | | | 207,812 | |
| Verizon Communications, Inc., 8.95%, 3/1/2039 | | | | 110,000 | | | | 155,283 | |
| VimpelCom Holdings BV, 144A, 7.504%, 3/1/2022 | | | | 200,000 | | | | 200,200 | |
| West Corp.: | |
| 144A, 7.875%, 1/15/2019 | | | | 50,000 | | | | 48,500 | |
| 144A, 8.625%, 10/1/2018 | | | | 15,000 | | | | 15,150 | |
| Windstream Corp.: | |
| 7.0%, 3/15/2019 | | | | 60,000 | | | | 60,600 | |
| 7.5%, 4/1/2023 | | | | 60,000 | | | | 60,000 | |
| 7.75%, 10/15/2020 | | | | 35,000 | | | | 36,663 | |
| 7.875%, 11/1/2017 | | | | 135,000 | | | | 143,269 | |
| | | Principal Amount ($) (a) | | | Value ($) | |
| | | | | | | | | |
| 8.125%, 9/1/2018 | | | | 70,000 | | | | 74,200 | |
| | | | | 5,656,793 | |
| Utilities 3.3% | |
| AES Corp.: | |
| 144A, 7.375%, 7/1/2021 | | | | 100,000 | | | | 101,500 | |
| 8.0%, 10/15/2017 | | | | 10,000 | | | | 10,600 | |
| 8.0%, 6/1/2020 | | | | 175,000 | | | | 186,375 | |
| Calpine Corp.: | |
| 144A, 7.5%, 2/15/2021 | | | | 80,000 | | | | 81,600 | |
| 144A, 7.875%, 7/31/2020 | | | | 95,000 | | | | 99,275 | |
| Centrais Eletricas Brasileiras SA, 144A, 6.875%, 7/30/2019 | | | | 145,000 | | | | 164,212 | |
| Edison Mission Energy, 7.0%, 5/15/2017 | | | | 125,000 | | | | 101,250 | |
| Energy Future Holdings Corp., Series Q, 6.5%, 11/15/2024 | | | | 205,000 | | | | 102,500 | |
| Energy Future Intermediate Holding Co., LLC, 10.0%, 12/1/2020 | | | | 25,000 | | | | 26,661 | |
| Ferrellgas LP, 144A, 6.5%, 5/1/2021 | | | | 20,000 | | | | 18,900 | |
| IPALCO Enterprises, Inc., 144A, 5.0%, 5/1/2018 | | | | 290,000 | | | | 283,288 | |
| Korea Gas Corp., 144A, 4.25%, 11/2/2020 | | | | 185,000 | | | | 175,970 | |
| Majapahit Holding BV, 144A, 8.0%, 8/7/2019 | | | | 290,000 | | | | 342,925 | |
| NRG Energy, Inc.: | |
| 7.375%, 1/15/2017 | | | | 90,000 | | | | 94,275 | |
| 144A, 7.625%, 1/15/2018 | | | | 35,000 | | | | 35,087 | |
| 8.25%, 9/1/2020 | | | | 45,000 | | | | 45,900 | |
| San Diego Gas & Electric Co., 6.0%, 6/1/2026 | | | | 180,000 | | | | 202,633 | |
| Suburban Propane Partners LP, 7.375%, 3/15/2020 | | | | 15,000 | | | | 15,675 | |
| Texas Competitive Electric Holdings Co., LLC, Series A, 10.25%, 11/1/2015 | | | 50,000 | | | | 30,250 | |
| Toledo Edison Co., 7.25%, 5/1/2020 | | | | 230,000 | | | | 277,144 | |
| | | | | 2,396,020 | |
Total Corporate Bonds (Cost $48,012,575) | | | | 49,117,253 | |
| | |
| Commercial Mortgage-Backed Securities 2.3% | |
| Citigroup Commercial Mortgage Trust, "AMP3", Series 2006-C5, 144A, 5.684%**, 10/15/2049 | | | | 126,345 | | | | 113,778 | |
| CS First Boston Mortgage Securities Corp., "H", Series 2002-CKP1, 144A, 7.418%**, 12/15/2035 | | | | 290,000 | | | | 290,986 | |
| Greenwich Capital Commercial Funding Corp., "AM", Series 2007-GG11, 5.867%, 12/10/2049 | | | | 290,000 | | | | 265,166 | |
| JPMorgan Chase Commercial Mortgage Securities Corp., "A4", Series 2006-LDP7, 6.067%**, 4/15/2045 | | | | 140,000 | | | | 155,379 | |
| | | Principal Amount ($) (a) | | | Value ($) | |
| | | | | | | | | |
| LB-UBS Commercial Mortgage Trust: | | |
| "A3", Series 2006-C7, 5.347%, 11/15/2038 | | | | 440,000 | | | | 473,655 | |
| "E", Series 2005-C2, 5.522%**, 4/15/2040 | | | | 300,000 | | | | 241,489 | |
| Wachovia Bank Commercial Mortgage Trust, "A4", Series 2005-C22, 5.44%**, 12/15/2044 | | | | 140,000 | | | | 151,739 | |
Total Commercial Mortgage-Backed Securities (Cost $1,679,604) | | | | 1,692,192 | |
| | |
| Collateralized Mortgage Obligations 3.5% | |
| Banc of America Mortgage Securities, "2A2", Series 2004-A, 2.848%**, 2/25/2034 | | | | 174,498 | | | | 151,931 | |
| Bear Stearns Adjustable Rate Mortgage Trust, "2A1", Series 2005-11, 3.301%**, 12/25/2035 | | | | 243,748 | | | | 226,662 | |
| Citicorp Mortgage Securities, Inc., "1A7", Series 2006-4, 6.0%, 8/25/2036 | | | | 10,285 | | | | 10,157 | |
| Countrywide Home Loans, "2A5", Series 2004-13, 5.75%, 8/25/2034 | | | | 171,270 | | | | 151,361 | |
| Federal National Mortgage Association, "BI", Series 2010-13, Interest Only, 5.0%, 12/25/2038 | | | | 414,574 | | | | 54,391 | |
| Government National Mortgage Association, "XA", Series 2009-118, 5.0%, 12/20/2039 | | | | 321,571 | | | | 325,367 | |
| JPMorgan Mortgage Trust, "2A1", Series 2006-A2, 5.655%**, 4/25/2036 | | | | 574,194 | | | | 500,789 | |
| Merrill Lynch Mortgage Investors Trust: | | |
| "2A1A", Series 2005-A9, 2.655%**, 12/25/2035 | | | | 56,127 | | | | 55,277 | |
| "2A", Series 2003-A6, 3.188%**, 10/25/2033 | | | | 126,607 | | | | 119,701 | |
| Morgan Stanley Mortgage Loan Trust, "5A5", Series 2005-4, 5.5%, 8/25/2035 | | | | 115,887 | | | | 112,371 | |
| Vericrest Opportunity Loan Transferee, "M", Series 2010-NPL1, 144A, 6.0%, 5/25/2039 | | | | 133,115 | | | | 131,095 | |
| Washington Mutual Mortgage Pass-Through Certificates Trust, "1A1", Series 2005-AR12, 2.722%**, 10/25/2035 | | | | 94,278 | | | | 88,349 | |
| Wells Fargo Mortgage- Backed Securities Trust: | | |
| "2A3",Series 2004-EE, 2.771%**, 12/25/2034 | | | | 232,125 | | | | 208,506 | |
| "A3", Series 2005-4, 5.0%, 4/25/2035 | | | | 82,891 | | | | 82,654 | |
| "B1", Series 2004-1, 5.5%, 2/25/2034 | | | | 292,185 | | | | 279,592 | |
| "A19", Series 2006-11, 6.0%, 9/25/2036 | | | | 56,537 | | | | 56,535 | |
Total Collateralized Mortgage Obligations (Cost $2,543,873) | | | | 2,554,738 | |
| | | Principal Amount ($) (a) | | | Value ($) | |
| | | | | | | | | |
| Government & Agency Obligations 10.2% | |
| Other Government Related (d) 2.0% | |
| Citibank NA, FDIC Guaranteed, 0.298%**, 5/7/2012 | | | | 650,000 | | | | 650,613 | |
| International Bank for Reconstruction & Development, 5.25%**, 4/9/2025 | | | | 290,000 | | | | 282,750 | |
| JPMorgan Chase & Co., Series 3, FDIC Guaranteed, 0.497%**, 12/26/2012 | | | | 232,000 | | | | 233,044 | |
| NAK Naftogaz Ukraine, 9.5%, 9/30/2014 | | | | 100,000 | | | | 110,125 | |
| Qatari Diar Finance QSC, 144A, 5.0%, 7/21/2020 | | | | 150,000 | | | | 153,750 | |
| | | | | 1,430,282 | |
| Sovereign Bonds 5.4% | |
| Dominican Republic, 144A, 7.5%, 5/6/2021 | | | | 100,000 | | | | 104,000 | |
| Federative Republic of Brazil, 12.5%, 1/5/2016 | BRL | | | 250,000 | | | | 188,623 | |
| Government of Canada, 4.5%, 6/1/2015 | CAD | | | 350,000 | | | | 395,479 | |
| Government of Ukraine, 144A, 7.75%, 9/23/2020 | | | | 145,000 | | | | 150,438 | |
| MDC-GMTN BV, 144A, 5.5%, 4/20/2021 | | | | 200,000 | | | | 200,455 | |
| Republic of Argentina: | |
| Series NY, 8.28%, 12/31/2033 | | | | 131,728 | | | | 116,250 | |
| Series 1, 8.75%, 6/2/2017 | | | | 145,000 | | | | 150,800 | |
| Republic of Argentina-Inflation Linked Bond, 5.83%, 12/31/2033 | ARS | | | 456 | | | | 139 | |
| Republic of Belarus, REG S, 8.75%, 8/3/2015 | | | | 145,000 | | | | 130,500 | |
| Republic of Croatia, 144A, 6.375%, 3/24/2021 | | | | 290,000 | | | | 301,600 | |
| Republic of Greece, 4.5%, 9/20/2037 | EUR | | | 1,000,000 | | | | 614,138 | |
| Republic of Lithuania, 144A, 7.375%, 2/11/2020 | | | | 140,000 | | | | 162,050 | |
| Republic of Peru, 8.75%, 11/21/2033 | | | | 145,000 | | | | 197,708 | |
| Republic of South Africa, 6.25%, 3/8/2041 | | | | 250,000 | | | | 268,125 | |
| Republic of Uruguay, 7.625%, 3/21/2036 | | | | 60,000 | | | | 75,600 | |
| Republic of Venezuela, 7.65%, 4/21/2025 | | | | 290,000 | | | | 188,500 | |
| Russian Federation, REG S, 7.5%, 3/31/2030 | | | | 376,184 | | | | 443,427 | |
| Wakala Global Sukuk Bhd., 144A, 4.646%, 7/6/2021 (b) | | | | 250,000 | | | | 249,490 | |
| | | | | 3,937,322 | |
| US Government Sponsored Agency 0.1% | |
| Federal Home Loan Mortgage Corp., 1.125%, 12/15/2011 | | | | 100,000 | | | | 100,450 | |
| US Treasury Obligations 2.7% | |
| US Treasury Bills: | |
| 0.01%***, 9/15/2011 (e) | | | | 56,000 | | | | 55,998 | |
| 0.135%***, 9/15/2011 (e) | | | | 143,000 | | | | 142,994 | |
| | | Principal Amount ($) (a) | | | Value ($) | |
| | | | | | | | | |
| US Treasury Bonds: | |
| 3.875%, 8/15/2040 | | | | 55,000 | | | | 50,359 | |
| 4.25%, 11/15/2040 | | | | 115,000 | | | | 112,412 | |
| US Treasury Notes: | |
| 0.875%, 2/29/2012 | | | | 1,500,000 | | | | 1,507,260 | |
| 3.625%, 2/15/2021 | | | | 125,000 | | | | 130,342 | |
| | | | | 1,999,365 | |
Total Government & Agency Obligations (Cost $7,381,814) | | | | 7,467,419 | |
| | |
| Loan Participations and Assignments 2.8% | |
| Senior Loans** 1.9% | |
| Buffets, Inc., Letter of Credit, First Lien, 7.496%, 4/22/2015 | | | | 12,198 | | | | 9,788 | |
| Charter Communications Operating LLC: | | |
| Replacement Term Loan, 2.19%, 3/6/2014 | | | | 598 | | | | 597 | |
| Term Loan, 3.5%, 9/6/2016 | | | | 207,101 | | | | 206,737 | |
| New Term Loan, 7.25%, 3/6/2014 | | | | 3,106 | | | | 3,122 | |
| Chrysler Group LLC, Term Loan, 6.0%, 5/24/2017 | | | | 10,000 | | | | 9,788 | |
| Clear Channel Communications, Inc., Term Loan B, 3.836%, 1/28/2016 | | | | 106,043 | | | | 90,136 | |
| Dunkin' Brands, Inc., Term Loan B, 4.25%, 11/23/2017 | | | | 69,650 | | | | 69,678 | |
| Ford Motor Co., Term Loan B1, 2.94%, 12/16/2013 | | | | 79,840 | | | | 79,905 | |
| Hawker Beechcraft Acquisition Co., LLC: | | |
| Term Loan, 2.186%, 3/26/2014 | | | | 160,140 | | | | 135,156 | |
| Letter of Credit, 2.246%, 3/26/2014 | | | | 9,903 | | | | 8,358 | |
| Roundy's Supermarkets, Inc., Second Lien Term Loan, 10.0%, 4/18/2016 | | | | 65,000 | | | | 65,874 | |
| Syniverse Technologies, Inc., Term Loan B, 5.25%, 12/21/2017 | | | | 49,750 | | | | 50,061 | |
| Tomkins LLC, New Term Loan B, 4.25%, 9/29/2016 | | | | 520,295 | | | | 521,210 | |
| Tribune Co., Term Loan B, LIBOR plus 3.0%, 6/4/2014* | | | | 88,875 | | | | 60,435 | |
| VML US Finance LLC: | |
| Term Delay Draw B, 4.69%, 5/25/2012 | | | | 17,934 | | | | 17,925 | |
| Term Loan B, 4.69%, 5/27/2013 | | | | 31,049 | | | | 31,033 | |
| | | | | 1,359,803 | |
| Sovereign Loans 0.9% | |
| Alfa Bank OJSC, 144A, 7.75%, 4/28/2021 | | | | 200,000 | | | | 201,760 | |
| Gazprom OAO, 144A, 9.25%, 4/23/2019 | | | | 150,000 | | | | 187,312 | |
| Russian Railways, 5.739%, 4/3/2017 | | | | 145,000 | | | | 154,063 | |
| | | Principal Amount ($) (a) | | | Value ($) | |
| | | | | | | | | |
| VTB Bank OJSC, 144A, 6.875%, 5/29/2018 | | | | 145,000 | | | | 155,585 | |
| | | | | 698,720 | |
Total Loan Participations and Assignments (Cost $2,043,329) | | | | 2,058,523 | |
| | |
| Municipal Bonds and Notes 0.4% | |
| Chicago, IL, O'Hare International Airport Revenue, Series B, 6.0%, 1/1/2041 | | | 145,000 | | | | 151,785 | |
| Orlando & Orange County, FL, Expressway Authority Revenue, Series C, 5.0%, 7/1/2040 | | | 145,000 | | | | 141,211 | |
Total Municipal Bonds and Notes (Cost $292,404) | | | | 292,996 | |
| | |
| Convertible Bonds 2.6% | |
| Consumer Discretionary 0.2% | |
| Group 1 Automotive, Inc., 144A, 3.0%, 3/15/2020 | | | | 65,000 | | | | 81,006 | |
| Sonic Automotive, Inc., 5.0%, 10/1/2029 | | | | 25,000 | | | | 33,000 | |
| Virgin Media, Inc., 6.5%, 11/15/2016 | | | | 17,000 | | | | 30,409 | |
| | | | | 144,415 | |
| Consumer Staples 0.3% | |
| AEON Co., Ltd., Series 7, 0.3%, 11/22/2013 | JPY | | | 2,000,000 | | | | 28,073 | |
| Archer-Daniels-Midland Co., 0.875%, 2/15/2014 | | | | 50,000 | | | | 52,750 | |
| Molson Coors Brewing Co., 2.5%, 7/30/2013 | | | | 40,000 | | | | 43,900 | |
| TEM, Series DG, 4.25%, 1/1/2015 | EUR | | | 12,500 | | | | 10,089 | |
| Tyson Foods, Inc., 3.25%, 10/15/2013 | | | | 30,000 | | | | 38,700 | |
| | | | | 173,512 | |
| Energy 0.0% | |
| China Petroleum & Chemical Corp., Zero Coupon, 4/24/2014 | HKD | | | 70,000 | | | | 10,322 | |
| Financials 0.9% | |
| Billion Express Investments Ltd., 0.75%, 10/18/2015 | | | | 100,000 | | | | 116,950 | |
| Boston Properties LP, 144A, 3.625%, 2/15/2014 | | | | 30,000 | | | | 33,337 | |
| Glory River Holdings Ltd., 1.0%, 7/29/2015 | HKD | | | 100,000 | | | | 13,573 | |
| Industrivarden AB, REG S, 1.875%, 2/27/2017 | EUR | | | 50,000 | | | | 71,094 | |
| Kloeckner & Co. Financial Services SA, 1.5%, 7/27/2012 | EUR | | | 100,000 | | | | 141,535 | |
| Lukoil International Finance BV, 2.625%, 6/16/2015 | | | | 100,000 | | | | 116,309 | |
| NASDAQ OMX Group, Inc., 2.5%, 8/15/2013 | | | | 40,000 | | | | 40,150 | |
| ORIX Corp., Series 3, 1.0%, 3/31/2014 | JPY | | | 5,000,000 | | | | 77,724 | |
| | | | | 610,672 | |
| | | Principal Amount ($) (a) | | | Value ($) | |
| | | | | | | | | |
| Health Care 0.4% | |
| Amgen, Inc., Series B, 0.375%, 2/1/2013 | | | | 50,000 | | | | 50,187 | |
| Dendreon Corp., 2.875%, 1/15/2016 | | | | 10,000 | | | | 10,988 | |
| Gilead Sciences, Inc., Series C, 144A, 1.0%, 5/1/2014 | | | | 50,000 | | | | 55,625 | |
| Medtronic, Inc., Series B, 1.625%, 4/15/2013 | | | | 50,000 | | | | 51,125 | |
| Mylan, Inc., 1.25%, 3/15/2012 | | | | 20,000 | | | | 22,250 | |
| Shire PLC, 2.75%, 5/9/2014 | | | | 100,000 | | | | 116,600 | |
| | | | | 306,775 | |
| Industrials 0.1% | |
| Asahi Glass Co., Ltd., Zero Coupon, 11/14/2014 | JPY | | | 5,000,000 | | | | 66,875 | |
| Information Technology 0.5% | |
| Advanced Micro Devices, Inc., 6.0%, 5/1/2015 | | | | 50,000 | | | | 50,687 | |
| EMC Corp., Series B, 1.75%, 12/1/2013 | | | | 20,000 | | | | 35,050 | |
| Hitachi Ltd., Series 8, 0.1%, 12/12/2014 | JPY | | | 3,000,000 | | | | 56,363 | |
| Intel Corp., 2.95%, 12/15/2035 | | | | 90,000 | | | | 93,037 | |
| Microsoft Corp., 144A, Zero Coupon, 6/15/2013 | | | | 60,000 | | | | 61,350 | |
| SanDisk Corp., 1.0%, 5/15/2013 | | | | 30,000 | | | | 28,988 | |
| Symantec Corp., Series B, 1.0%, 6/15/2013 | | | | 50,000 | | | | 60,750 | |
| | | | | 386,225 | |
| Materials 0.0% | |
| Newmont Mining Corp., Series A, 1.25%, 7/15/2014 | | | | 17,000 | | | | 22,143 | |
| Other Government Related (d) 0.2% | |
| Kreditanstalt fuer Wiederaufbau, 3.25%, 6/27/2013 | EUR | | | 100,000 | | | | 151,613 | |
Total Convertible Bonds (Cost $1,838,487) | | | | 1,872,552 | |
| | |
| Preferred Securities 0.8% | |
| Financials 0.7% | |
| Capital One Capital VI, 8.875%, 5/15/2040 | | | | 330,000 | | | | 340,365 | |
| USB Capital XIII Trust, 6.625%, 12/15/2039 | | | | 145,000 | | | | 149,048 | |
| | | | | 489,413 | |
| Materials 0.1% | |
| Hercules, Inc., 6.5%, 6/30/2029 | | | | 95,000 | | | | 80,275 | |
Total Preferred Securities (Cost $527,345) | | | | 569,688 | |
| | | Units | | | Value ($) | |
| | | | |
| Other Investments 0.0% | |
| Consumer Discretionary | |
| AOT Bedding Super Holdings LLC* (Cost $4,000) | | | 4 | | | | 4,000 | |
| | | Shares | | | Value ($) | |
| | | | |
| Common Stocks 0.0% | |
| Consumer Discretionary 0.0% | |
| Buffets Restaurants Holdings, Inc.* | | | 2,318 | | | | 9,272 | |
| Dex One Corp.* | | | 540 | | | | 1,366 | |
| SuperMedia, Inc.* | | | 99 | | | | 371 | |
| Trump Entertainment Resorts, Inc.* | | | 6 | | | | 110 | |
| Vertis Holdings, Inc.* | | | 63 | | | | 1,118 | |
| | | | | | | | 12,237 | |
| Industrials 0.0% | |
| Congoleum Corp.* | | | 125,000 | | | | 0 | |
| Quad Graphics, Inc. | | | 69 | | | | 2,681 | |
| | | | | | | | 2,681 | |
| Materials 0.0% | |
| GEO Specialty Chemicals, Inc.* | | | 2,058 | | | | 1,749 | |
Total Common Stocks (Cost $280,047) | | | | 16,667 | |
| | |
| Preferred Stock 0.1% | |
| Financials | |
| Ally Financial, Inc., Series G, 144A, 7.0% (Cost $99,895) | | | 110 | | | | 103,386 | |
| | |
| Warrants 0.0% | |
| Consumer Discretionary 0.0% | |
| Reader's Digest Association, Inc., Expiration Date 2/19/2014* | | | 159 | | | | 5 | |
| Materials 0.0% | |
| Hercules Trust II, Expiration Date 3/31/2029* | | | 85 | | | | 854 | |
Total Warrants (Cost $17,432) | | | | 859 | |
| | | Principal Amount ($) (a) | | | Value ($) | |
| | | | |
| Call Options Purchased 0.0% | |
| Floating Rate — LIBOR, Effective Date 6/28/2011, Expiration Date 9/28/2011, Cap Rate 3.205% (Cost $6,760) | | | 1,494,000 | | | | 6,760 | |
| | |
| Put Options Purchased 0.0% | |
| Floating Rate — LIBOR, Effective Date 6/27/2011, Expiration Date 9/17/2011, Cap Rate 3.178% (Cost $6,723) | | | 1,494,000 | | | | 6,723 | |
| | | Shares | | | Value ($) | |
| | | | |
| Securities Lending Collateral 0.2% | |
| Daily Assets Fund Institutional, 0.13% (f) (g) (Cost $127,606) | | | 127,606 | | | | 127,606 | |
| | |
| Cash Equivalents 9.2% | |
| Central Cash Management Fund, 0.11% (f) (Cost $6,720,710) | | | 6,720,710 | | | | 6,720,710 | |
| | | % of Net Assets | | | Value ($) | |
| | | | |
Total Investment Portfolio (Cost $71,582,604)+ | | | 99.2 | | | | 72,612,072 | |
| Other Assets and Liabilities, Net | | | 0.8 | | | | 576,484 | |
| Net Assets | | | 100.0 | | | | 73,188,556 | |
The following table represents bonds and senior loans that are in default:
| Securities | | Coupon | | Maturity Date | | Principal Amount ($) | | Acquisition Cost ($) | | | Value ($) | |
| CanWest LP* | | | 9.25 | % | 8/1/2015 | | | 50,000 | | USD | | | 50,000 | | | | 8,500 | |
| Fontainebleau Las Vegas Holdings LLC* | | | 11.0 | % | 6/15/2015 | | | 65,000 | | USD | | | 65,225 | | | | 33 | |
| Hellas Telecommunications Finance SCA* | | | 8.985 | % | 7/15/2015 | | | 109,187 | | EUR | | | 32,169 | | | | 95 | |
| Radnor Holdings Corp.* | | | 11.00 | % | 3/15/2010 | | | 25,000 | | USD | | | 15,888 | | | | 3 | |
| Tribune Co.* | | LIBOR plus 3.0 | % | 6/4/2014 | | | 88,875 | | USD | | | 88,819 | | | | 60,435 | |
| Tropicana Entertainment LLC* | | | 9.625 | % | 12/15/2014 | | | 150,000 | | USD | | | 122,979 | | | | 75 | |
| Wolverine Tube, Inc.* | | | 15.0 | % | 3/31/2012 | | | 91,631 | | USD | | | 91,631 | | | | 44,212 | |
| | | | | | | | | | | | | | 466,711 | | | | 113,353 | |
* Non-income producing security. In the case of a bond, generally denotes that the issuer has defaulted on the payment of principal or interest or has filed for bankruptcy.
** These securities are shown at their current rate as of June 30, 2011. Floating rate securities' yields vary with a designated market index or market rate, such as the coupon-equivalent of the US Treasury bill rate.
*** Annualized yield at time of purchase; not a coupon rate.
+ The cost for federal income tax purposes was $71,651,109. At June 30, 2011, net unrealized appreciation for all securities based on tax cost was $960,963. This consisted of aggregate gross unrealized appreciation for all securities in which there was an excess of value over tax cost of $2,499,073 and aggregate gross unrealized depreciation for all securities in which there was an excess of tax cost over value of $1,538,110.
(a) Principal amount stated in US dollars unless otherwise noted.
(b) When-issued security.
(c) All or a portion of these securities were on loan (see Notes to Financial Statements). The value of all securities loaned at June 30, 2011 amounted to $122,915, which is 0.2% of net assets.
(d) Government-backed debt issued by financial companies or government sponsored enterprises.
(e) At June 30, 2011, this security has been pledged, in whole or in part, to cover initial margin requirements for open futures contracts.
(f) Affiliated fund managed by Deutsche Investment Management Americas Inc. The rate shown is the annualized seven-day yield at period end.
(g) Represents collateral held in connection with securities lending. Income earned by the Fund is net of borrower rebates.
144A: Security exempt from registration under Rule 144A of the Securities Act of 1933. These securities may be resold in transactions exempt from registration, normally to qualified institutional buyers.
FDIC: Federal Deposit Insurance Corp.
Interest Only: Interest Only (IO) bonds represent the "interest only" portion of payments on a pool of underlying mortgages or mortgage-backed securities. IO securities are subject to prepayment risk of the pool of underlying mortgages.
LIBOR: London Interbank Offered Rate
PIK: Denotes that all or a portion of the income is paid in-kind.
REG S: Securities sold under Regulation S may not be offered, sold or delivered within the United States or to, or for the account or benefit of, US persons, except pursuant to an exemption from, or in a transaction not subject to, the registration requirements of the Securities Act of 1933.
REIT: Real Estate Investment Trust
At June 30, 2011, open futures contracts purchased were as follows:
| Futures | Currency | Expiration Date | | Contracts | | | Notional Value ($) | | | Unrealized Appreciation/ (Depreciation) ($) | |
| 10 Year Australian Treasury bond | AUD | 9/15/2011 | | | 4 | | | | 455,006 | | | | (1,031 | ) |
| 10 Year Canadian Government Bond | CAD | 9/21/2011 | | | 7 | | | | 899,922 | | | | (6,532 | ) |
| 10 Year Japanese Government Bond | JPY | 9/8/2011 | | | 3 | | | | 5,255,823 | | | | 2,609 | |
| 2 Year US Treasury Note | USD | 9/30/2011 | | | 12 | | | | 2,632,125 | | | | 6,187 | |
| Federal Republic of Germany Euro-Bobl | EUR | 9/8/2011 | | | 7 | | | | 1,183,409 | | | | 2,842 | |
| United Kingdom Long Gilt Bond | GBP | 9/28/2011 | | | 17 | | | | 3,278,193 | | | | 3,631 | |
| Total net unrealized appreciation | | | | 7,706 | |
At June 30, 2011, open futures contracts sold were as follows:
| Futures | Currency | Expiration Date | | Contracts | | | Notional Value ($) | | | Unrealized Appreciation/ (Depreciation) ($) | |
| 10 Year US Treasury Note | USD | 9/21/2011 | | | 64 | | | | 7,829,000 | | | | 50,652 | |
| Federal Republic of Germany Euro-Bund | EUR | 9/8/2011 | | | 7 | | | | 1,273,753 | | | | (3,756 | ) |
| Federal Republic of Germany Euro-Schatz | EUR | 9/8/2011 | | | 49 | | | | 7,642,571 | | | | (13,856 | ) |
| Total net unrealized appreciation | | | | 33,040 | |
At June 30, 2011, open credit default swap contracts sold were as follows:
Effective/ Expiration Date | | Notional Amount ($) (i) | | | Fixed Cash Flows Received | | Underlying Debt Obligation/Quality Rating (h) | | Value ($) | | | Upfront Payments Paid/ (Received) ($) | | | Unrealized Appreciation/ (Depreciation) ($) | |
3/21/2011 6/20/2016 | | | 120,000 | 1 | | | 5.0 | % | Ally Financial Corp., 8.3%, 02/12/2015, B+ | | | 8,019 | | | | 6,822 | | | | 1,197 | |
9/21/2009 12/20/2014 | | | 290,000 | 2 | | | 1.0 | % | Berkshire Hathaway Finance Corp., 4.625%, 10/15/2013, AA | | | 2,384 | | | | (7,340 | ) | | | 9,724 | |
3/21/2011 6/20/2016 | | | 120,000 | 2 | | | 5.0 | % | HCA, Inc., 6.375%, 1/15/2015, B- | | | 5,679 | | | | 4,468 | | | | 1,211 | |
6/21/2010 9/20/2013 | | | 70,000 | 3 | | | 5.0 | % | Ford Motor Co., 6.5%, 8/1/2018, B+ | | | 6,257 | | | | 858 | | | | 5,399 | |
6/21/2010 9/20/2015 | | | 90,000 | 4 | | | 5.0 | % | Ford Motor Co., 6.5%, 8/1/2018, B+ | | | 9,798 | | | | (1,605 | ) | | | 11,403 | |
12/20/2010 3/20/2016 | | | 290,000 | 5 | | | 1.0 | % | Freeport-McMoRan Copper & Gold, Inc., 8.375%, 4/1/2017, BBB- | | | (3,915 | ) | | | (127 | ) | | | (3,788 | ) |
| Total net unrealized appreciation | | | | 25,146 | |
(h) The quality ratings represent the lower of Moody's Investors Service, Inc. ("Moody's") or Standard & Poor's Corporation ("S&P") credit ratings and are unaudited.
(i) The maximum potential amount of future undiscounted payments that the Fund could be required to make under a credit default swap contract would be the notional amount of the contract. These potential amounts would be partially offset by any recovery values of the referenced debt obligation or net amounts received from the settlement of buy protection credit default swap contracts entered into by the Fund for the same referenced debt obligation.
At June 30, 2011, open interest rate swaps contracts were as follows:
| Effective/ Expiration Date | | Notional Amount ($) | | Cash Flows Paid by the Fund | Cash Flows Received by the Fund | | Value ($) | | | Upfront Payments Paid/ (Received) ($) | | | Unrealized Appreciation/ (Depreciation) ($) | |
4/13/2012 4/13/2016 | | | 1,500,000 | 6 | Floating — LIBOR | Fixed — 3.04% | | | 45,889 | | | | 135 | | | | 45,754 | |
6/23/2012 6/23/2022 | | | 2,000,000 | 6 | Fixed — 3.6% | Floating — LIBOR | | | 23,696 | | | | (4,222 | ) | | | 27,918 | |
10/28/2010 10/28/2025 | | | 140,000 | 5 | Floating — LIBOR | Floating — 4.154%++ | | | (5,443 | ) | | | — | | | | (5,443 | ) |
11/1/2010 11/1/2025 | | | 240,000 | 7 | Floating — LIBOR | Floating — 4.123%++ | | | (16,189 | ) | | | — | | | | (16,189 | ) |
11/12/2010 11/12/2025 | | | 280,000 | 5 | Floating — LIBOR | Floating — 4.264%++ | | | (10,507 | ) | | | — | | | | (10,507 | ) |
11/15/2010 11/15/2025 | | | 280,000 | 7 | Floating — LIBOR | Floating — 4.56%++ | | | (17,356 | ) | | | — | | | | (17,356 | ) |
11/16/2010 11/16/2025 | | | 140,000 | 5 | Floating — LIBOR | Floating — 4.56%++ | | | (4,058 | ) | | | — | | | | (4,058 | ) |
11/19/2010 11/19/2025 | | | 140,000 | 7 | Floating — LIBOR | Floating — 5.072%++ | | | (8,062 | ) | | | — | | | | (8,062 | ) |
11/23/2010 11/23/2025 | | | 70,000 | 5 | Floating — LIBOR | Floating — 4.808%++ | | | (1,633 | ) | | | — | | | | (1,633 | ) |
| Total net unrealized appreciation | | | | 10,424 | |
++ These interest rate swaps are shown at their current rate as of June 30, 2011.
At June 30, 2011, open total return swap contracts were as follows:
Effective/ Expiration Date | | Notional Amount ($) | | | Fixed Cash Flows Paid | | Reference Entity | | Value ($) | | | Upfront Payments Paid/ (Received) ($) | | | Unrealized Depreciation ($) | |
4/26/2011 4/26/2012 | | | 1,100,000 | 6 | | | .07 | % | BNP Paribas BPSTAR Enhanced Momentum Index | | | (236 | ) | | | — | | | | (236 | ) |
5/28/2010 6/1/2012 | | | 2,800,000 | 3 | | | .45 | % | Global Interest Rate Strategy Index | | | (19,724 | ) | | | — | | | | (19,724 | ) |
| Total unrealized depreciation | | | | (19,960 | ) |
Counterparties:
1 The Goldman Sachs & Co.
2 JPMorgan Chase Securities, Inc.
3 Citigroup, Inc.
4 Bank of America NA
5 Morgan Stanley
6 BNP Paribas
7 Barclays Bank PLC
At June 30, 2011, the Fund had the following open forward foreign currency exchange contracts:
| Contracts to Deliver | | In Exchange For | | Settlement Date | | Unrealized Appreciation ($) | | Counterparty |
| USD | | | 230,476 | | EUR | | | 160,000 | | 7/11/2011 | | | 1,474 | | JPMorgan Chase Securities, Inc. |
| USD | | | 112,998 | | EUR | | | 79,800 | | 7/11/2011 | | | 2,687 | | Citigroup, Inc. |
| USD | | | 2,155,617 | | SEK | | | 13,850,000 | | 7/19/2011 | | | 31,561 | | UBS AG |
| USD | | | 2,070,374 | | AUD | | | 1,950,000 | | 7/19/2011 | | | 15,906 | | UBS AG |
| USD | | | 627,854 | | EUR | | | 440,000 | | 7/19/2011 | | | 9,864 | | UBS AG |
| USD | | | 670,574 | | NZD | | | 830,000 | | 7/19/2011 | | | 16,171 | | UBS AG |
| USD | | | 81,595 | | CAD | | | 80,000 | | 7/19/2011 | | | 1,313 | | UBS AG |
| JPY | | | 30,000,000 | | USD | | | 374,768 | | 7/21/2011 | | | 2,739 | | UBS AG |
| USD | | | 285,195 | | EUR | | | 200,000 | | 8/15/2011 | | | 4,941 | | BNP Paribas |
| EUR | | | 1,000,000 | | USD | | | 1,459,200 | | 8/15/2011 | | | 8,518 | | Nomura International PLC |
| GBP | | | 1,075,000 | | USD | | | 1,758,978 | | 8/15/2011 | | | 32,543 | | Credit Suisse |
| Total unrealized appreciation | | | | | 127,717 | |
| Contracts to Deliver | | In Exchange For | | Settlement Date | | Unrealized Depreciation ($) | | Counterparty |
| EUR | | | 346,000 | | USD | | | 498,283 | | 7/11/2011 | | | (3,310 | ) | Citigroup, Inc. |
| EUR | | | 400,000 | | USD | | | 571,096 | | 7/19/2011 | | | (9,620 | ) | State Street Bank & Trust Co. |
| USD | | | 1,083,375 | | GBP | | | 670,000 | | 7/19/2011 | | | (8,317 | ) | UBS AG |
| USD | | | 146,712 | | JPY | | | 11,780,000 | | 7/19/2011 | | | (372 | ) | UBS AG |
| NOK | | | 2,970,000 | | USD | | | 538,312 | | 7/19/2011 | | | (11,522 | ) | UBS AG |
| AUD | | | 1,000,000 | | USD | | | 1,057,664 | | 7/19/2011 | | | (12,223 | ) | UBS AG |
| CHF | | | 2,750,000 | | USD | | | 3,234,868 | | 7/19/2011 | | | (36,391 | ) | UBS AG |
| EUR | | | 460,000 | | USD | | | 655,593 | | 7/19/2011 | | | (11,111 | ) | UBS AG |
| CAD | | | 1,300,000 | | USD | | | 1,335,573 | | 7/19/2011 | | | (11,682 | ) | UBS AG |
| NZD | | | 2,250,000 | | USD | | | 1,824,593 | | 7/19/2011 | | | (37,065 | ) | UBS AG |
| JPY | | | 39,940,000 | | USD | | | 494,353 | | 7/19/2011 | | | (1,812 | ) | UBS AG |
| EUR | | | 200,000 | | USD | | | 287,459 | | 8/15/2011 | | | (2,678 | ) | BNP Paribas |
| CAD | | | 236,000 | | USD | | | 240,733 | | 8/15/2011 | | | (3,767 | ) | BNP Paribas |
| Total unrealized depreciation | | | | | (149,870 | ) |
| Currency Abbreviations |
ARS Argentine Peso AUD Australian Dollar BRL Brazilian Real CAD Canadian Dollar CHF Swiss Franc EUR Euro GBP British Pound HKD Hong Kong Dollar JPY Japanese Yen NOK Norwegian Krone NZD New Zealand Dollar SEK Swedish Krona USD United States Dollar |
For information on the Fund's policy and additional disclosures regarding options purchased, futures contracts, credit default swap contracts, interest rate swap contracts, total return swap contracts and forward foreign currency exchange contracts, please refer to Note B in the accompanying Notes to Financial Statements.
Fair Value Measurements
Various inputs are used in determining the value of the Fund's investments. These inputs are summarized in three broad levels. Level 1 includes quoted prices in active markets for identical securities. Level 2 includes other significant observable inputs (including quoted prices for similar securities, interest rates, prepayment speeds, and credit risk). Level 3 includes significant unobservable inputs (including the Fund's own assumptions in determining the fair value of investments). The inputs or methodology used for valuing securities are not necessarily an indication of the risk associated with investing in those securities.
The following is a summary of the inputs used as of June 30, 2011 in valuing the Fund's investments. For information on the Fund's policy regarding the valuation of investments, please refer to the Security Valuation section of Note A in the accompanying Notes to Financial Statements.
| Assets | | Level 1 | | | Level 2 | | | Level 3 | | | Total | |
| | |
| Fixed Income Investments (j) | | | | | | | | | | | | |
| Corporate Bonds | | $ | — | | | $ | 48,853,526 | | | $ | 263,727 | | | $ | 49,117,253 | |
| Commercial Mortgage-Backed Securities | | | — | | | | 1,692,192 | | | | — | | | | 1,692,192 | |
| Collateralized Mortgage Obligations | | | — | | | | 2,554,738 | | | | — | | | | 2,554,738 | |
| Government & Agency Obligations | | | — | | | | 7,184,669 | | | | 282,750 | | | | 7,467,419 | |
| Loan Participations and Assignments | | | — | | | | 2,058,523 | | | | — | | | | 2,058,523 | |
| Municipal Bonds and Notes | | | — | | | | 292,996 | | | | — | | | | 292,996 | |
| Convertible Bonds | | | — | | | | 1,872,552 | | | | — | | | | 1,872,552 | |
| Preferred Securities | | | — | | | | 569,688 | | | | — | | | | 569,688 | |
| Common Stocks (j) | | | 13,690 | | | | — | | | | 2,977 | | | | 16,667 | |
| Preferred Stock | | | — | | | | 103,386 | | | | — | | | | 103,386 | |
| Warrants (j) | | | — | | | | — | | | | 859 | | | | 859 | |
| Other Investments | | | — | | | | — | | | | 4,000 | | | | 4,000 | |
| Short-Term Investments (j) | | | 6,848,316 | | | | — | | | | — | | | | 6,848,316 | |
| Derivatives (k) | | | 65,921 | | | | 230,323 | | | | 13,483 | | | | 309,727 | |
| Total | | $ | 6,927,927 | | | $ | 65,412,593 | | | $ | 567,796 | | | $ | 72,908,316 | |
| Liabilities | | | | | | | | | | | | | | | | |
| Derivatives (k) | | $ | (25,175 | ) | | $ | (236,866 | ) | | $ | — | | | $ | (262,041 | ) |
| Total | | $ | (25,175 | ) | | $ | (236,866 | ) | | $ | — | | | $ | (262,041 | ) |
There have been no transfers between Level 1 and Level 2 fair value measurements during the period ended June 30, 2011.
(j) See Investment Portfolio for additional detailed categorizations.
(k) Derivatives include value of options purchased, unrealized appreciation (depreciation) on futures contracts, credit default swap contracts, interest rate swap contracts, total return swap contracts and forward foreign currency exchange contracts.
Level 3 Reconciliation
The following is a reconciliation of the Fund's Level 3 investments for which significant unobservable inputs were used in determining value:
| | | Corporate Bonds | | | Government & Agency Obligations | | | Common Stocks | | | Warrants | | | Call Options Purchased | | | Put Options Purchased | | | Other Investments | | | Total | | | Written Options | |
| Balance as of December 31, 2010 | | $ | 543,619 | | | $ | 284,461 | | | $ | 1,858 | | | $ | 972 | | | $ | 467 | | | $ | — | | | $ | 4,000 | | | $ | 835,377 | | | $ | (35,163 | ) |
| Total realized gain (loss) | | | (229,279 | ) | | | — | | | | — | | | | — | | | | (53,970 | ) | | | — | | | | — | | | | (283,249 | ) | | | (9,135 | ) |
| Change in unrealized appreciation (depreciation) | | | 240,022 | | | | (1,711 | ) | | | 538 | | | | (113 | ) | | | 53,993 | | | | 0 | | | | 0 | | | | 292,729 | | | | 4,423 | |
| Amortization premium/discount | | | 4,365 | | | | — | | | | — | | | | — | | | | — | | | | — | | | | — | | | | 4,365 | | | | — | |
| Purchases | | | 274,920 | | | | — | | | | 581 | | | | — | | | | 61,220 | | | | 6,723 | | | | — | | | | 343,444 | | | | 70,615 | |
| (Sales) | | | (569,920 | ) | | | — | | | | — | | | | — | | | | (54,950 | ) | | | — | | | | — | | | | (624,870 | ) | | | (30,740 | ) |
| Transfers into Level 3 | | | — | | | | — | | | | — | | | | — | | | | — | | | | — | | | | — | | | | — | | | | — | |
| Transfers (out) of Level 3 | | | — | | | | — | | | | — | | | | — | | | | — | | | | — | | | | — | | | | — | | | | — | |
| Balance as of June 30, 2011 | | $ | 263,727 | | | $ | 282,750 | | | $ | 2,977 | | | $ | 859 | | | $ | 6,760 | | | $ | 6,723 | | | $ | 4,000 | | | $ | 567,796 | | | $ | — | |
| Net change in unrealized appreciation (depreciation) from investments still held as of June 30, 2011 | | $ | 14,478 | | | $ | (1,711 | ) | | $ | 538 | | | $ | (113 | ) | | $ | 0 | | | $ | 0 | | | $ | 0 | | | $ | 13,192 | | | $ | — | |
Transfers between price levels are recognized at the beginning of the reporting period.
The accompanying notes are an integral part of the financial statements.
Statement of Assets and Liabilities | as of June 30, 2011 (Unaudited) | |
| Assets | |
Investments: Investments in non-affiliated securities, at value (cost $64,734,288) — including $122,915 of securities loaned | | $ | 65,763,756 | |
| Investment in Daily Assets Fund Institutional (cost $127,606)* | | | 127,606 | |
| Investment in Central Cash Management Fund (cost $6,720,710) | | | 6,720,710 | |
| Total investments in securities, at value (cost $71,582,604) | | | 72,612,072 | |
| Cash | | | 57,504 | |
| Foreign currency, at value (cost $130,708) | | | 132,842 | |
| Deposit with broker for futures contracts | | | 272,434 | |
| Receivable for investments sold | | | 521,456 | |
| Receivable for Fund shares sold | | | 65,761 | |
| Interest receivable | | | 1,069,740 | |
| Unrealized appreciation on swap contracts | | | 102,606 | |
| Unrealized appreciation on forward foreign currency exchange contracts | | | 127,717 | |
| Upfront payments paid on swap contracts | | | 12,283 | |
| Foreign taxes recoverable | | | 1,591 | |
| Other assets | | | 472 | |
| Total assets | | | 74,976,478 | |
| Liabilities | |
| Payable upon return of securities loaned | | | 127,606 | |
| Payable for investments purchased | | | 952,633 | |
| Payable for investments purchased — when-issued securities | | | 305,000 | |
| Payable for Fund shares redeemed | | | 8,862 | |
| Payable for daily variation margin on open futures contracts | | | 62,154 | |
| Unrealized depreciation on swap contracts | | | 86,996 | |
| Unrealized depreciation on forward foreign currency exchange contracts | | | 149,870 | |
| Upfront payments received on swap contracts | | | 13,294 | |
| Accrued management fee | | | 12,747 | |
| Other accrued expenses and payables | | | 68,760 | |
| Total liabilities | | | 1,787,922 | |
| Net assets, at value | | $ | 73,188,556 | |
| Net Assets Consist of | |
| Undistributed net investment income | | | 2,047,660 | |
Net unrealized appreciation (depreciation) on: Investments | | | 1,029,468 | |
| Swap contracts | | | 15,610 | |
| Futures | | | 40,746 | |
| Foreign currency | | | (6,171 | ) |
| Accumulated net realized gain (loss) | | | (191,536 | ) |
| Paid-in capital | | | 70,252,779 | |
| Net assets, at value | | $ | 73,188,556 | |
Class A Net Asset Value, offering and redemption price per share ($73,188,556 ÷ 6,300,090 outstanding shares of beneficial interest, no par value, unlimited number of shares authorized) | | $ | 11.62 | |
* Represents collateral of securities loaned.
The accompanying notes are an integral part of the financial statements.
Statement of Operations
| for the six months ended June 30, 2011 (Unaudited) | |
| Investment Income | |
Income: Interest (net of foreign taxes withheld of $1,100) | | $ | 2,346,218 | |
| Dividends | | | 3,885 | |
| Income distributions — Central Cash Management Fund | | | 3,896 | |
| Securities lending income, including income from Daily Assets Fund Institutional, net of borrower rebates | | | 233 | |
| Total income | | | 2,354,232 | |
Expenses: Management fee | | | 202,097 | |
| Administration fee | | | 36,745 | |
| Services to shareholders | | | 618 | |
| Custodian fee | | | 32,345 | |
| Audit and tax fees | | | 32,500 | |
| Legal fees | | | 7,196 | |
| Reports to shareholders | | | 9,682 | |
| Trustees' fees and expenses | | | 2,586 | |
| Other | | | 22,796 | |
| Total expenses before expense reductions | | | 346,565 | |
| Expense reductions | | | (56,527 | ) |
| Total expenses after expense reductions | | | 290,038 | |
| Net investment income (loss) | | | 2,064,194 | |
| Realized and Unrealized Gain (Loss) | |
Net realized gain (loss) from: Investments | | | 1,289,353 | |
| Swap contracts | | | (110,227 | ) |
| Futures | | | 127,344 | |
| Written options | | | (9,135 | ) |
| Foreign currency | | | (544,033 | ) |
| | | | 753,302 | |
Change in net unrealized appreciation (depreciation) on: Investments | | | (1,136,978 | ) |
| Swap contracts | | | 270,344 | |
| Futures | | | 136,046 | |
| Written options | | | 4,423 | |
| Foreign currency | | | (15,095 | ) |
| | | | (741,260 | ) |
| Net gain (loss) | | | 12,042 | |
| Net increase (decrease) in net assets resulting from operations | | $ | 2,076,236 | |
The accompanying notes are an integral part of the financial statements.
Statement of Changes in Net Assets | Increase (Decrease) in Net Assets | | Six Months Ended June 30, 2011 (Unaudited) | | | Year Ended December 31, 2010 | |
Operations: Net investment income | | $ | 2,064,194 | | | $ | 4,195,261 | |
| Net realized gain (loss) | | | 753,302 | | | | 2,382,740 | |
| Change in net unrealized appreciation (depreciation) | | | (741,260 | ) | | | 522,516 | |
| Net increase (decrease) in net assets resulting from operations | | | 2,076,236 | | | | 7,100,517 | |
Distributions to shareholders from: Net investment income: Class A | | | (4,074,552 | ) | | | (4,806,010 | ) |
Fund share transactions: Class A Proceeds from shares sold | | | 3,807,805 | | | | 11,245,997 | |
| Reinvestment of distributions | | | 4,074,552 | | | | 4,806,010 | |
| Payments for shares redeemed | | | (8,402,339 | ) | | | (16,514,815 | ) |
| Net increase (decrease) in net assets from Class A share transactions | | | (519,982 | ) | | | (462,808 | ) |
| Increase (decrease) in net assets | | | (2,518,298 | ) | | | 1,831,699 | |
| Net assets at beginning of period | | | 75,706,854 | | | | 73,875,155 | |
| Net assets at end of period (including undistributed net investment income of $2,047,660 and $4,058,018, respectively) | | $ | 73,188,556 | | | $ | 75,706,854 | |
| Other Information | |
Class A Shares outstanding at beginning of period | | | 6,329,747 | | | | 6,362,456 | |
| Shares sold | | | 320,957 | | | | 957,272 | |
| Shares issued to shareholders in reinvestment of distributions | | | 348,849 | | | | 420,473 | |
| Shares redeemed | | | (699,463 | ) | | | (1,410,454 | ) |
| Net increase (decrease) in Class A shares | | | (29,657 | ) | | | (32,709 | ) |
| Shares outstanding at end of period | | | 6,300,090 | | | | 6,329,747 | |
The accompanying notes are an integral part of the financial statements.
Financial Highlights
| | | | | | Years Ended December 31, | |
| Class A | | Six Months Ended 6/30/11 (Unaudited) | | | 2010 | | | 2009 | | | 2008 | | | 2007 | | | 2006 | |
| Selected Per Share Data | |
| Net asset value, beginning of period | | $ | 11.96 | | | $ | 11.61 | | | $ | 10.03 | | | $ | 11.70 | | | $ | 11.80 | | | $ | 11.50 | |
Income (loss) from investment operations: Net investment incomea | | | .33 | | | | .66 | | | | .63 | | | | .55 | | | | .63 | | | | .62 | |
| Net realized and unrealized gain (loss) | | | .01 | | | | .47 | | | | 1.50 | | | | (1.38 | ) | | | (.01 | ) | | | .36 | |
| Total from investment operations | | | .34 | | | | 1.13 | | | | 2.13 | | | | (.83 | ) | | | .62 | | | | .98 | |
Less distributions from: Net investment income | | | (.68 | ) | | | (.78 | ) | | | (.55 | ) | | | (.69 | ) | | | (.72 | ) | | | (.57 | ) |
| Net realized gains | | | — | | | | — | | | | — | | | | (.15 | ) | | | — | | | | (.11 | ) |
| Total distributions | | | (.68 | ) | | | (.78 | ) | | | (.55 | ) | | | (.84 | ) | | | (.72 | ) | | | (.68 | ) |
| Net asset value, end of period | | $ | 11.62 | | | $ | 11.96 | | | $ | 11.61 | | | $ | 10.03 | | | $ | 11.70 | | | $ | 11.80 | |
| Total Return (%) | | | 2.83 | b** | | | 10.05 | b | | | 22.73 | b | | | (7.75 | )b | | | 5.43 | b | | | 8.98 | |
| Ratios to Average Net Assets and Supplemental Data | |
| Net assets, end of period ($ millions) | | | 73 | | | | 76 | | | | 74 | | | | 73 | | | | 100 | | | | 86 | |
| Ratio of expenses before expense reductions (%) | | | .94 | * | | | .95 | | | | .86 | | | | .89 | | | | .84 | | | | .85 | |
| Ratio of expenses after expense reductions (%) | | | .79 | * | | | .86 | | | | .80 | | | | .87 | | | | .83 | | | | .85 | |
| Ratio of net investment income (%) | | | 5.62 | * | | | 5.62 | | | | 5.96 | | | | 5.06 | | | | 5.50 | | | | 5.47 | |
| Portfolio turnover rate (%) | | | 97 | ** | | | 167 | | | | 370 | | | | 234 | | | | 147 | | | | 143 | |
a Based on average shares outstanding during the period. b Total return would have been lower had certain expenses not been reduced. * Annualized ** Not annualized | |
Notes to Financial Statements (Unaudited)
A. Organization and Significant Accounting Policies
DWS Strategic Income VIP (the "Fund") is a diversified series of DWS Variable Series II (the "Trust"), which is registered under the Investment Company Act of 1940, as amended (the "1940 Act"), as an open-end management investment company organized as a Massachusetts business trust.
The Fund's financial statements are prepared in accordance with accounting principles generally accepted in the United States of America which require the use of management estimates. Actual results could differ from those estimates. The policies described below are followed consistently by the Fund in the preparation of its financial statements.
Security Valuation. Investments are stated at value determined as of the close of regular trading on the New York Stock Exchange on each day the exchange is open for trading.
Various inputs are used in determining the value of the Fund's investments. These inputs are summarized in three broad levels. Level 1 includes quoted prices in active markets for identical securities. Level 2 includes other significant observable inputs (including quoted prices for similar securities, interest rates, prepayment speeds, and credit risk). Level 3 includes significant unobservable inputs (including the Fund's own assumptions in determining the fair value of investments). The inputs or methodology used for valuing securities are not necessarily an indication of the risk associated with investing in those securities.
Debt securities are valued by independent pricing services approved by the Fund's Board. If the pricing services are unable to provide valuations, securities are valued at the most recent bid quotation or evaluated price, as applicable, obtained from one or more broker-dealers. Such services may use various pricing techniques which take into account appropriate factors such as yield, quality, coupon rate, maturity, type of issue, trading characteristics and other data, as well as broker quotes. These securities are generally categorized as Level 2.
Equity securities are valued at the most recent sale price or official closing price reported on the exchange (US or foreign) or over-the-counter market on which they trade and are categorized as Level 1 securities. Securities for which no sales are reported are valued at the calculated mean between the most recent bid and asked quotations on the relevant market or, if a mean cannot be determined, at the most recent bid quotation.
Money market instruments purchased with an original or remaining maturity of sixty days or less, maturing at par, are valued at amortized cost, which approximates value, and are categorized as Level 2. Investments in open-end investment companies are valued at their net asset value each business day and are categorized as Level 1.
Futures contracts are generally valued at the settlement prices established each day on the exchange on which they are traded and are categorized as Level 1.
Forward currency contracts are valued at the prevailing forward exchange rate of the underlying currencies and are categorized as Level 2.
Swap contracts are valued daily based upon prices supplied by a Board approved pricing vendor, if available, and otherwise are valued at the price provided by the broker-dealer. Swap contracts are generally categorized as Level 2.
Exchange-traded options are valued at the last sale price or, in the absence of a sale, the mean between the closing bid and asked prices or at the most recent asked price (bid for purchased options) if no bid or asked price are available. Exchange-traded options are categorized as Level 1. Over-the-counter written or purchased options are valued based upon a price provided by the broker-dealer with which the option, was traded and are generally categorized as Level 3.
Securities and other assets for which market quotations are not readily available or for which the above valuation procedures are deemed not to reflect fair value are valued in a manner that is intended to reflect their fair value as determined in accordance with procedures approved by the Board and are generally categorized as Level 3. In accordance with the Fund's valuation procedures, factors used in determining value may include, but are not limited to, the type of the security; the size of the holding; the initial cost of the security; the existence of any contractual restrictions on the security's disposition; the price and extent of public trading in similar securities of the issuer or of comparable companies; quotations or evaluated prices from broker-dealers and/or pricing services; information obtained from the issuer, analysts, and/or the appropriate stock exchange (for exchange-traded securities); an analysis of the company's or issuer's financial statements; an evaluation of the forces that influence the issuer and the market(s) in which the security is purchased and sold and with respect to debt securities; the maturity, coupon, creditworthiness, currency denomination and the movement of the market in which the security is normally traded. The value determined under these procedures may differ from published values for the same securities.
Disclosure about the classification of fair value measurements is included in a table following the Fund's Investment Portfolio.
Foreign Currency Translations. The books and records of the Fund are maintained in US dollars. Investment securities and other assets and liabilities denominated in a foreign currency are translated into US dollars at the prevailing exchange rates at period end. Purchases and sales of investment securities, income and expenses are translated into US dollars at the prevailing exchange rates on the respective dates of the transactions.
Net realized and unrealized gains and losses on foreign currency transactions represent net gains and losses between trade and settlement dates on securities transactions, the acquisition and disposition of foreign currencies, and the difference between the amount of net investment income accrued and the US dollar amount actually received. That portion of both realized and unrealized gains and losses on investments that results from fluctuations in foreign currency exchange rates is not separately disclosed but is included with net realized and unrealized gain/appreciation and loss/depreciation on investments.
Securities Lending. The Fund lends securities to certain financial institutions. The Fund retains beneficial ownership of the securities it has loaned and continues to receive interest and dividends paid by the issuer of securities and to participate in any changes in their market value. The Fund requires the borrowers of the securities to maintain collateral with the Fund consisting of either cash or liquid, unencumbered assets having a value at least equal to the value of the securities loaned. When the collateral falls below specified amounts, the lending agent will use its best effort to obtain additional collateral on the next business day to meet required amounts under the security lending agreement. The Fund may invest the cash collateral into a joint trading account in an affiliated money market fund pursuant to Exemptive Orders issued by the SEC. The Fund receives compensation for lending its securities either in the form of fees or by earning interest on invested cash collateral net of borrower rebates and fees paid to a lending agent. Either the Fund or the borrower may terminate the loan. There may be risks of delay and costs in recovery of securities or even loss of rights in the collateral should the borrower of the securities fail financially. The Fund is also subject to all investment risks associated with the reinvestment of any cash collateral received, including, but not limited to, interest rate, credit and liquidity risk associated with such investments.
Loan Participations and Assignments. The Fund invests in Loan Participations and Assignments. Loan Participations and Assignments are portions of loans originated by banks and sold in pieces to investors. These US dollar-denominated fixed and floating rate loans ("Loans") in which the Fund invests, are arranged between the borrower and one or more financial institutions ("Lenders"). These Loans may take the form of Senior Loans, which are corporate obligations often issued in connection with recapitalizations, acquisitions, leveraged buy-outs and refinancings, and Sovereign Loans, which are debt instruments between a foreign sovereign entity and one or more financial institutions. The Fund invests in such Loans in the form of participations in Loans ("Participations") or assignments of all or a portion of Loans from third parties ("Assignments"). Participations typically result in the Fund having a contractual relationship only with the Lender, not with the borrower. The Fund has the right to receive payments of principal, interest and any fees to which it is entitled from the Lender selling the Participation and only upon receipt by the Lender of the payments from the borrower. In connection with purchasing Participations, the Fund generally has no right to enforce compliance by the borrower with the terms of the loan agreement relating to the Loan, or any rights of set-off against the borrower, and the Fund will not benefit directly from any collateral supporting the Loan in which it has purchased the Participation. As a result, the Fund assumes the credit risk of both the borrower and the Lender that is selling the Participation. Assignments typically result in the Fund having a direct contractual relationship with the borrower, and the Fund may enforce compliance by the borrower with the terms of the loan agreement. All Loan Participations and Assignments involve interest rate risk, liquidity risk and credit risk, including the potential default or insolvency of the borrower.
When-Issued/Delayed Delivery Securities. The Fund may purchase or sell securities with delivery or payment to occur at a later date beyond the normal settlement period. At the time the Fund enters into a commitment to purchase or sell a security, the transaction is recorded and the value of the transaction is reflected in the net asset value. The price of such security and the date when the security will be delivered and paid for are fixed at the time the transaction is negotiated. The value of the security may vary with market fluctuations. At the time the Fund enters into this type of transaction, it is required to segregate cash or other liquid assets at least equal to the amount of the commitment.
Certain risks may arise upon entering into when-issued or delayed delivery transactions from the potential inability of counterparties to meet the terms of their contracts or if the issuer does not issue the securities due to political, economic, or other factors. Additionally, losses may arise due to changes in the value of the underlying securities.
Federal Income Taxes. The Fund's policy is to comply with the requirements of the Internal Revenue Code, as amended, which are applicable to regulated investment companies and to distribute all of its taxable income to its shareholders.
Additionally, based on the Fund's understanding of the tax rules and rates related to income, gains and transactions for the foreign jurisdictions in which it invests, the Fund will provide for foreign taxes, and where appropriate, deferred foreign taxes.
At December 31, 2010, the Fund had a net tax basis capital loss carryforward of approximately $543,000, which may be applied against any realized net taxable capital gains of each succeeding year until fully utilized or until December 31, 2017, the expiration date, whichever occurs first.
On December 22, 2010, the Regulated Investment Company Modernization Act of 2010 (the "Act") was enacted. Under the Act, net capital losses may be carried forward indefinitely, and their character is retained as short-term and/or long-term losses. Previously, net capital losses were carried forward for eight years and treated as short-term losses. As a transition rule, the Act requires that post-enactment net capital losses be used before pre-enactment net capital losses. As a result of this ordering rule, pre-enactment capital loss carryforwards may expire unused, whereas under the previous rules these losses may have been utilized. This change is effective for fiscal years beginning after the date of enactment.
The Fund has reviewed the tax positions for the open tax years as of December 31, 2010 and has determined that no provision for income tax is required in the Fund's financial statements. The Fund's federal tax returns for the prior three fiscal years remain open subject to examination by the Internal Revenue Service.
Distribution of Income and Gains. Distributions of net investment income of the Fund, if any, are made annually. Net realized gains from investment transactions, in excess of available capital loss carryforwards, would be taxable to the Fund if not distributed and, therefore, will be distributed to shareholders at least annually. The Fund may also make additional distributions for tax purposes if necessary.
The timing and characterization of certain income and capital gains distributions are determined annually in accordance with federal tax regulations which may differ from accounting principles generally accepted in the United States of America. These differences primarily relate to investments in foreign denominated investments, forward currency contracts, futures contracts, swap contracts and certain securities sold at a loss. As a result, net investment income (loss) and net realized gain (loss) on investment transactions for a reporting period may differ significantly from distributions during such period. Accordingly, the Fund may periodically make reclassifications among certain of its capital accounts without impacting the net asset value of the Fund.
The tax character of current year distributions will be determined at the end of the current fiscal year.
Expenses. Expenses of the Trust arising in connection with a specific fund are allocated to that fund. Other Trust expenses which cannot be directly attributed to a fund are apportioned among the funds in the Trust.
Contingencies. In the normal course of business, the Fund may enter into contracts with service providers that contain general indemnification clauses. The Fund's maximum exposure under these arrangements is unknown, as this would involve future claims that may be made against the Fund that have not yet been made. However, based on experience, the Fund expects the risk of loss to be remote.
Other. Investment transactions are accounted for on a trade date plus one basis for daily net asset value calculations. However, for financial reporting purposes, investment transactions are reported on trade date. Interest income is recorded on the accrual basis. Dividend income is recorded on the ex-dividend date net of foreign withholding taxes. Realized gains and losses from investment transactions are recorded on an identified cost basis and may include proceeds from litigation. All discounts and premiums are accreted/amortized for both tax and financial reporting purposes for the Fund, with the exception of securities in default of principal.
B. Derivative Instruments
Interest Rate Swap Contracts. The value of the Fund's underlying bond investments is subject to interest rate risk. As interest rates increase, the value of the Fund's fixed rate bonds may fall. The longer the duration of the Fund's securities, the more sensitive the Fund will be to interest rate changes. For the six months ended June 30, 2011, the Fund entered into interest rate swap transactions to gain exposure to different parts of the yield curve while managing overall duration. The use of interest rate swaps is a highly specialized activity that involves investment techniques and risks different from those associated with ordinary portfolio security transactions. In an interest rate swap, the Fund agrees to pay to the other party to the interest rate swap (which is known as the "counterparty") a fixed rate payment in exchange for the counterparty agreeing to pay to the Fund a variable rate payment, or the Fund agrees to receive from the counterparty a fixed rate payment in exchange for the counterparty agreeing to receive from the Fund a variable rate payment. The payment obligations are based on the notional amount of the swap. Certain risks may arise when entering into swap transactions including counterparty default, liquidity or unfavorable changes in interest rates. In connection with these agreements, securities and or cash may be identified as collateral in accordance with the terms of the swap agreements to provide assets of value and recourse in the event of default. The maximum counterparty credit risk is the net present value of the cash flows to be received from or paid to the counterparty over the term of the interest rate swap contract, to the extent that this amount is beneficial to the Fund, in addition to any related collateral posted to the counterparty by the Fund. This risk may be partially reduced by a master netting arrangement between the Fund and the counterparty. The value of the swap is adjusted daily and the change in value, if any, is recorded as unrealized appreciation or depreciation in the Statement of Assets and Liabilities. An upfront payment, if any, made by the Fund is recorded as an asset in the Statement of Assets and Liabilities. An upfront payment, if any, received by the Fund is recorded as a liability in the Statement of Assets and Liabilities. Payments received or made at the end of the measurement period are recorded as realized gain or loss in the Statement of Operations.
A summary of the open interest rate swap contracts as of June 30, 2011 is included in a table following the Fund's Investment Portfolio. For the six months ended June 30, 2011, the investment in interest rate swap contracts had a total notional amount generally indicative of a range from approximately $2,540,000 to $4,790,000.
Credit Default Swap Contracts. A credit default swap is a contract between a buyer and a seller of protection against pre-defined credit events for the reference entity. For the six months ended June 30, 2011, the Fund sold credit default swap contracts to gain exposure to an underlying issuer's credit quality characteristics without directly investing in that issuer, or to hedge the risk of default on Fund securities. As a seller in the credit default swap contract, the Fund is required to pay the par (or other agreed-upon) value of the referenced entity to the counterparty with the occurrence of a credit event by a third party, such as a US or foreign corporate issuer, on the reference entity, which would likely result in a loss to the Fund. In return, the Fund receives from the counterparty a periodic stream of payments over the term of the contract provided that no credit event has occurred. If no credit event occurs, the Fund keeps the stream of payments with no payment obligations. The Fund may also buy credit default swap contracts in order to hedge against the risk of a credit event on debt securities, in which case the Fund functions as the counterparty referenced above. This involves the risk that the contract may expire worthless. It also involves counterparty risk that the seller may fail to satisfy its payment obligations to the Fund with the occurrence of a credit event. When the Fund sells a credit default swap contract it will cover its commitment. This may be achieved by, among other methods, maintaining cash or liquid assets equal to the aggregate notional value of the reference entities for all outstanding credit default swap contracts sold by the Fund.
The value of the credit default swap is adjusted daily and the change in value, if any, is recorded daily as unrealized appreciation or depreciation in the Statement of Assets and Liabilities. An upfront payment, if any, made by the Fund is recorded as an asset in the Statement of Assets and Liabilities. An upfront payment, if any, received by the Fund is recorded as a liability in the Statement of Assets and Liabilities. Under the terms of the credit default swap contracts, the Fund receives or makes quarterly payments based on a specified interest rate on a fixed notional amount. These payments are recorded as a realized gain or loss in the Statement of Operations. Payments received or made as a result of a credit event or termination of the contract are recognized, net of a proportional amount of the upfront payment, as realized gains or losses in the Statement of Operations.
A summary of the open credit default swap contracts as of June 30, 2011 is included in a table following the Fund's Investment Portfolio. For the six months ended June 30, 2011, the investment in credit default swap contracts sold had a total notional value generally indicative of a range from approximately $740,000 to $2,370,000.
Total Return Swap Contracts. Total return swaps involve commitments to pay interest in exchange for a market-linked return based on a notional amount. For the six months ended June 30, 2011, the Fund entered into total return swap transactions to enhance potential gain. To the extent the total return of the reference security or index underlying the total return swap exceeds or falls short of the offsetting interest rate obligation, the Fund will receive a payment or make a payment to the counterparty, respectively. Certain risks may arise when entering into swap transactions including counterparty default, liquidity or unfavorable changes in the value of underlying reference security or index. The value of the swap is adjusted daily and the change in value, if any, is recorded as unrealized appreciation or depreciation in the Statement of Assets and Liabilities. An upfront payment, if any, made by the Fund is recorded as an asset in the Statement of Assets and Liabilities. An upfront payment, if any, received by the Fund is recorded as a liability in the Statement of Assets and Liabilities. Payments received or made at the end of each measurement period are recorded as realized gain or loss in the Statement of Operations.
A summary of the open total return swap contracts as of June 30, 2011 is included in a table following the Fund's Investment Portfolio. For the six months ended June 30, 2011, the investment in total return swap contracts had a total notional amount generally indicative of a range from approximately $2,800,000 to $3,900,000.
Options. An option contract is a contract in which the writer (seller) of the option grants the buyer of the option, upon payment of a premium, the right to purchase from (call option), or sell to (put option), the writer a designated instrument at a specified price within a specified period of time. Certain options, including options on indices and interest rate options, will require cash settlement by the Fund if the option is exercised. Interest rate options are comprised of multiple European style options that have periodic exercise dates within the terms of the contract. For the six months ended June 30, 2011, the Fund entered into purchased option contracts on interest rates in order to hedge portfolio assets against potential adverse interest rate movements.
The liability representing the Fund's obligation under an exchange-traded written option or investment in a purchased option is valued at the last sale price or, in the absence of a sale, the mean between the closing bid and asked prices or at the most recent asked price (bid for purchased options) if no bid and asked price are available. Over-the-counter written or purchased options are valued using dealer-supplied quotations. Gain or loss is recognized when the option contract expires, exercised or is closed.
If the Fund writes a covered call option, the Fund foregoes, in exchange for the premium, the opportunity to profit during the option period from an increase in the market value of the underlying security above the exercise price. If the Fund writes a put option it accepts the risk of a decline in the value of the underlying security below the exercise price. Over-the-counter options have the risk of the potential inability of counterparties to meet the terms of their contracts. The Fund's maximum exposure to purchased options is limited to the premium initially paid. In addition, certain risks may arise upon entering into option contracts including the risk that an illiquid secondary market will limit the Fund's ability to close out an option contract prior to the expiration date and that a change in the value of the option contract may not correlate exactly with changes in the value of the securities or currencies hedged.
There are no open written option contracts as of June 30, 2011. A summary of the open purchased option contracts as of June 30, 2011 is included in the Fund's Investment Portfolio. For the six months ended June 30, 2011, the Fund's investment in purchased option contracts had a total value generally indicative of a range from $0 to approximately $13,000.
Futures Contracts. A futures contract is an agreement between a buyer or seller and an established futures exchange or its clearinghouse in which the buyer or seller agrees to take or make a delivery of a specific amount of a financial instrument at a specified price on a specific date (settlement date). For the six months ended June 30, 2011, the Fund entered into interest rate futures to gain exposure to different parts of the yield curve while managing overall duration. In addition, the Fund seeks to enhance returns by employing a global tactical asset allocation overlay strategy. The Fund enters into futures contracts on fixed-income securities, including on financial indices and security indices, as part of its global tactical asset allocation overlay strategy. For the six months ended June 30, 2011, as part of this strategy, the Fund used futures contracts to attempt to take advantage of short-term and medium-term inefficiencies within the global equity and bond markets.
Futures contracts are valued at the most recent settlement price. Upon entering into a futures contract, the Fund is required to deposit with a financial intermediary cash or securities ("initial margin") in an amount equal to a certain percentage of the face value indicated in the futures contract. Subsequent payments ("variation margin") are made or received by the Fund dependent upon the daily fluctuations in the value and are recorded for financial reporting purposes as unrealized gains or losses by the Fund. Gains or losses are realized when the contract expires or is closed. Since all futures contracts are exchange-traded, counterparty risk is minimized as the exchange's clearinghouse acts as the counterparty, and guarantees the futures against default.
Certain risks may arise upon entering into futures contracts, including the risk that an illiquid market will limit the Fund's ability to close out a futures contract prior to the settlement date and the risk that the futures contract is not well correlated with the security, index or currency to which it relates. Risk of loss may exceed amounts recognized in the Statement of Assets and Liabilities.
A summary of the open futures contracts as of June 30, 2011, is included in a table following the Fund's Investment Portfolio. For the six months ended June 30, 2011, the investment in futures contracts purchased had a total notional value generally indicative of a range from approximately $13,704,000 to $32,102,000, and the investment in futures contracts sold had a total notional value generally indicative of a range from approximately $10,173,000 to $21,385,000.
Forward Foreign Currency Exchange Contracts. A forward foreign currency exchange contract ("forward currency contract") is a commitment to purchase or sell a foreign currency at the settlement date at a negotiated rate. For the six months ended June 30, 2011, the Fund entered into forward currency contracts in order to hedge its exposure to changes in foreign currency exchange rates on its foreign currency denominated portfolio holdings and to facilitate transactions in foreign currency denominated securities. In addition, the Fund seeks to enhance returns by employing a global tactical asset allocation overlay strategy. For the six months ended June 30, 2011, as part of this strategy, the Fund used forward currency contracts to gain exposure to changes in the value of foreign currencies to attempt to take advantage of inefficiencies within the currency markets.
Forward currency contracts are valued at the prevailing forward exchange rate of the underlying currencies and unrealized gain (loss) is recorded daily. On the settlement date of the forward currency contract, the Fund records a realized gain or loss equal to the difference between the value of the contract at the time it was opened and the value of the contract at the time it was closed. Certain risks may arise upon entering into forward currency contracts from the potential inability of counterparties to meet the terms of their contracts. The maximum counterparty credit risk to the Fund is measured by the unrealized gain on appreciated contracts. Additionally, when utilizing forward currency contracts to hedge, the Fund gives up the opportunity to profit from favorable exchange rate movements during the term of the contract.
A summary of the open forward currency contracts as of June 30, 2011, is included in a table following the Fund's Investment Portfolio. For the six months ended June 30, 2011, the investment in forward currency contracts short vs. US dollars had a total contract value generally indicative of a range from approximately $13,330,000 to $14,346,000, and the investment in forward currency contracts long vs. US dollars had a total contract value generally indicative of a range from approximately $7,465,000 to $11,548,000.
The following tables summarize the value of the Fund's derivative instruments held as of June 30, 2011 and the related location in the accompanying Statement of Assets and Liabilities, presented by primary underlying risk exposure:
| Asset Derivatives | | Purchased Options | | | Forward Contracts | | | Swap Contracts | | | Futures Contracts | | | Total | |
| Interest Rate Contracts (a) (b) | | $ | 13,483 | | | $ | — | | | $ | 73,672 | | | $ | 65,921 | | | $ | 153,076 | |
| Credit Contracts (b) | | | — | | | | — | | | | 28,934 | | | | — | | | | 28,934 | |
| Foreign Exchange Contracts (c) | | | — | | | | 127,717 | | | | — | | | | — | | | | 127,717 | |
| | | $ | 13,483 | | | $ | 127,717 | | | $ | 102,606 | | | $ | 65,921 | | | $ | 309,727 | |
Each of the above derivatives is located in the following Statement of Assets and Liabilities accounts:
(a) Includes cumulative appreciation of futures contracts as disclosed in the Investment Portfolio. Unsettled variation margin is disclosed separately within the Statement of Assets and Liabilities.
(b) Investments in securities, at value (includes purchased options) and unrealized appreciation on swap contracts
(c) Unrealized appreciation on forward foreign currency exchange contracts
| Liability Derivatives | | Forward Contracts | | | Swap Contracts | | | Futures Contracts | | | Total | |
| Interest Rate Contracts (a) (b) | | $ | — | | | $ | (83,208 | ) | | $ | (25,175 | ) | | $ | (108,383 | ) |
| Credit Contracts (b) | | | — | | | | (3,788 | ) | | | — | | | | (3,788 | ) |
| Foreign Exchange Contracts (c) | | | (149,870 | ) | | | — | | | | — | | | | (149,870 | ) |
| | | $ | (149,870 | ) | | $ | (86,996 | ) | | $ | (25,175 | ) | | $ | (262,041 | ) |
Each of the above derivatives is located in the following Statement of Assets and Liabilities accounts:
(a) Includes cumulative depreciation of futures contracts as disclosed in the Investment Portfolio. Unsettled variation margin is disclosed separately within the Statement of Assets and Liabilities.
(b) Unrealized depreciation on swap contracts
(c) Unrealized depreciation on forward foreign currency exchange contracts
Additionally, the amount of unrealized and realized gains and losses on derivative instruments recognized in Fund earnings during the six months ended June 30, 2011 and the related location in the accompanying Statement of Operations is summarized in the following tables by primary underlying risk exposure:
| Realized Gain (Loss) | | Purchased Options | | | Written Options | | | Forward Contracts | | | Swap Contracts | | | Futures Contracts | | | Total | |
| Equity Contracts (a) | | $ | — | | | $ | — | | | $ | — | | | $ | — | | | $ | 28,637 | | | $ | 28,637 | |
| Interest Rate Contracts (a) | | | (53,970 | ) | | | (9,135 | ) | | | — | | | | (111,648 | ) | | | 98,707 | | | | (76,046 | ) |
| Credit Contracts (a) | | | — | | | | — | | | | — | | | | 1,421 | | | | — | | | | 1,421 | |
| Foreign Exchange Contracts (b) | | | — | | | | — | | | | (517,128 | ) | | | — | | | | — | | | | (517,128 | ) |
| | | $ | (53,970 | ) | | $ | (9,135 | ) | | $ | (517,128 | ) | | $ | (110,227 | ) | | $ | 127,344 | | | $ | (563,116 | ) |
Each of the above derivatives is located in the following Statement of Operations accounts:
(a) Net realized gain (loss) from investments (includes purchased options), written options, swap contracts and futures, respectively
(b) Net realized gain (loss) from foreign currency (Statement of Operations includes both forward currency contracts and foreign currency transactions)
| Change in Net Unrealized Appreciation (Depreciation) | | Purchased Options | | | Written Options | | | Forward Contracts | | | Swap Contracts | | | Futures Contracts | | | Total | |
| Equity Contracts (a) | | $ | — | | | $ | — | | | $ | — | | | $ | — | | | $ | (31,298 | ) | | $ | (31,298 | ) |
| Interest Rate Contracts (a) | | | 53,993 | | | | 4,423 | | | | — | | | | 242,486 | | | | 167,344 | | | | 468,246 | |
| Credit contracts (a) | | | — | | | | — | | | | — | | | | 27,858 | | | | — | | | | 27,858 | |
| Foreign Exchange Contracts (b) | | | — | | | | — | | | | (18,822 | ) | | | — | | | | — | | | | (18,822 | ) |
| | | $ | 53,993 | | | $ | 4,423 | | | $ | (18,822 | ) | | $ | 270,344 | | | $ | 136,046 | | | $ | 445,984 | |
Each of the above derivatives is located in the following Statement of Operations accounts:
(a) Change in net unrealized appreciation (depreciation) on investments (includes purchased options), written options, swap contracts and futures, respectively
(b) Change in net unrealized appreciation (depreciation) on foreign currency (Statement of Operations includes both forward currency contracts and foreign currency transactions)
C. Purchases and Sales of Securities
During the six months ended June 30, 2011, purchases and sales of investment transactions (excluding short-term investments and US Treasury obligations) aggregated $61,616,899 and $67,254,088, respectively. Purchases and sales of US Treasury obligations aggregated $5,461,107 and $8,433,177, respectively.
For the six months ended June 30, 2011, transactions for written options on interest rate swaps were as follows:
| | | Contract Amount | | | Premiums | |
| Outstanding, beginning of period | | | 29,000,000 | | | $ | 30,740 | |
| Options written | | | 29,000,000 | | | | 30,740 | |
| Options closed | | | (58,000,000 | ) | | | (61,480 | ) |
| Outstanding, end of period | | | — | | | $ | — | |
D. Related Parties
Management Agreement. Under the Investment Management Agreement with Deutsche Investment Management Americas Inc. ("DIMA" or the "Advisor"), an indirect, wholly owned subsidiary of Deutsche Bank AG, the Advisor directs the investments of the Fund in accordance with its investment objectives, policies and restrictions. The Advisor determines the securities, instruments and other contracts relating to investments to be purchased, sold or entered into by the Fund or delegates such responsibility to the Fund's subadvisor.
QS Investors, LLC ("QS Investors") serves as subadvisor to the Fund. As subadvisor to the Fund, QS Investors manages the assets attributable only to the Fund's global tactical asset allocation overlay strategy. QS Investors is paid by the Advisor for the services QS Investors provides to the Fund.
Pursuant to the Investment Management Agreement with the Advisor, the Fund pays a monthly management fee based on the Fund's average daily net assets, computed and accrued daily and payable monthly, at the following annual rates:
| $0-$250 million | | | .550 | % |
| next $750 million | | | .520 | % |
| next $1.5 billion | | | .500 | % |
| next $2.5 billion | | | .480 | % |
| next $2.5 billion | | | .450 | % |
| next $2.5 billion | | | .430 | % |
| next $2.5 billion | | | .410 | % |
| over $12.5 billion | | | .390 | % |
For the period from January 1, 2011 through September 30, 2011, the Advisor has contractually agreed to waive its fee and/or reimburse certain operating expenses to the extent necessary to maintain the operating expenses (excluding certain expenses such as extraordinary expenses, taxes, brokerage and interest expense) at 0.78%.
Accordingly, for the six months ended June 30, 2011, the Advisor waived a portion of its management fee pursuant to the Investment Management Agreement aggregating $56,473, and the amount charged aggregated $145,624, which was equivalent to an annualized effective rate of 0.40% of the Fund's average daily net assets.
Administration Fee. Pursuant to an Administrative Services Agreement, DIMA provides most administrative services to the Fund. For all services provided under the Administrative Services Agreement, the Fund pays DIMA an annual fee ("Administration Fee") of 0.10% of the Fund's average daily net assets, computed and accrued daily and payable monthly. For the six months ended June 30, 2011, the Administration Fee was $36,745, of which $6,008 is unpaid.
Service Provider Fees. DWS Investments Service Company ("DISC"), an affiliate of the Advisor, is the transfer agent, dividend-paying agent and shareholder service agent for the Fund. Pursuant to a sub-transfer agency agreement between DISC and DST Systems, Inc. ("DST"), DISC has delegated certain transfer agent, dividend-paying agent and shareholder service agent functions to DST. DISC compensates DST out of the shareholder servicing fee it receives from the Fund. For the six months ended June 30, 2011, the amounts charged to the Fund by DISC aggregated $54, all of which was waived.
Typesetting and Filing Service Fees. Under an agreement with DIMA, DIMA is compensated for providing typesetting and certain regulatory filing services to the Fund. For the six months ended June 30, 2011, the amount charged to the Fund by DIMA included in the Statement of Operations under "reports to shareholders" aggregated $5,513, of which $1,982 is unpaid.
Trustees' Fees and Expenses. The Fund paid each Trustee not affiliated with the Advisor retainer fees plus specified amounts for various committee services and for the Board Chairperson.
Affiliated Cash Management Vehicle. The Fund may invest uninvested cash balances in Central Cash Management Fund, which is managed by the Advisor. The Fund indirectly bears its proportionate share of the expenses of Central Cash Management Fund. Central Cash Management Fund does not pay the Advisor an investment management fee. Central Cash Management Fund seeks a high level of current income consistent with liquidity and the preservation of capital.
E. Investing in High-Yield Securities
The Fund's performance could be hurt if a security declines in credit quality or goes into default, or if an issuer does not make timely payments of interest or principal. Because the issuers of high-yield debt securities or junk bonds (debt securities rated below the fourth-highest category) may be in uncertain financial health, the prices of their debt securities can be more vulnerable to bad economic news, or even the expectation of bad news, than investment-grade debt securities. Because the Fund may invest in securities not paying current interest or in securities already in default, these risks may be more pronounced.
F. Investing in Emerging Markets
Investing in emerging markets may involve special risks and considerations not typically associated with investing in developed markets. These risks include revaluation of currencies, high rates of inflation or deflation, repatriation restrictions on income and capital, and future adverse political, social and economic developments. Moreover, securities issued in these markets may be less liquid, subject to government ownership controls or delayed settlements, and may have prices that are more volatile or less easily assessed than those of comparable securities of issuers in developed markets.
G. Ownership of the Fund
At June 30, 2011, two Participating Insurance Companies were owners of record of 10% or more of the total outstanding Class A shares of the Fund, each owning 59% and 39%.
H. Line of Credit
The Fund and other affiliated funds (the "Participants") share in a $450 million revolving credit facility provided by a syndication of banks. The Fund may borrow for temporary or emergency purposes, including the meeting of redemption requests that otherwise might require the untimely disposition of securities. The Participants are charged an annual commitment fee which is allocated based on net assets, among each of the Participants. Interest is calculated at a rate per annum equal to the sum of the Federal Funds Rate plus 1.25 percent plus if LIBOR exceeds the Federal Funds Rate the amount of such excess. The Fund may borrow up to a maximum of 33 percent of its net assets under the agreement. The Fund had no outstanding loans at June 30, 2011.
The Trust's policies and procedures for voting proxies for portfolio securities and information about how the Trust voted proxies related to its portfolio securities during the 12-month period ended June 30 are available on our Web site — www.dws-investments.com (click on "proxy voting" at the bottom of the page) — or on the SEC's Web site — www.sec.gov. To obtain a written copy of the Trust's policies and procedures without charge, upon request, call us toll free at (800) 728-3337.
Summary of Management Fee Evaluation by Independent Fee Consultant
October 3, 2010
Pursuant to an Order entered into by Deutsche Investment Management Americas and affiliates (collectively, "DeAM") with the Attorney General of New York, I, Thomas H. Mack, have been appointed the Independent Fee Consultant for the DWS Funds (formerly the DWS Scudder Funds). My duties include preparing an annual written evaluation of the management fees DeAM charges the Funds, considering among other factors the management fees charged by other mutual fund companies for like services, management fees DeAM charges other clients for like services, DeAM's costs of supplying services under the management agreements and related profit margins, possible economies of scale if a Fund grows larger, and the nature and quality of DeAM's services, including fund performance. This report summarizes my evaluation for 2010, including my qualifications, the evaluation process for each of the DWS Funds, consideration of certain complex-level factors, and my conclusions. I served in substantially the same capacity in 2007, 2008, and 2009.
Qualifications
For more than 35 years I have served in various professional capacities within the investment management business. I have held investment analysis and advisory positions, including securities analyst, portfolio strategist and director of investment policy with a large investment firm. I have also performed business management functions, including business development, financial management and marketing research and analysis.
Since 1991, I have been an independent consultant within the asset management industry. I have provided services to over 125 client organizations, including investment managers, mutual fund boards, product distributors and related organizations. Over the past ten years I have completed a number of assignments for mutual fund boards, specifically including assisting boards with management contract renewal.
I hold a Master of Business Administration degree, with highest honors, from Harvard University and Master of Science and Bachelor of Science (highest honors) degrees from the University of California at Berkeley. I am an independent director and audit committee financial expert for two closed-end mutual funds and have served in various leadership and financial oversight capacities with non-profit organizations.
Evaluation of Fees for each DWS Fund
My work focused primarily on evaluating, fund-by-fund, the fees charged to each of the 118 publicly offered Fund portfolios in the DWS Fund family. For each Fund, I considered each of the key factors mentioned above, as well as any other relevant information. In doing so I worked closely with the Funds' Independent Directors in their annual contract renewal process, as well as in their approval of contracts for several new funds (documented separately).
In evaluating each Fund's fees, I reviewed comprehensive materials provided by or on behalf of DeAM, including expense information prepared by Lipper Analytical, comparative performance information, profitability data, manager histories, and other materials. I also accessed certain additional information from the Lipper and Morningstar databases and drew on my industry knowledge and experience.
To facilitate evaluating this considerable body of information, I prepared for each Fund a document summarizing the key data elements in each area as well as additional analytics discussed below. This made it possible to consider each key data element in the context of the others.
In the course of contract renewal, DeAM agreed to implement a number of fee and expense adjustments requested by the Independent Directors which will favorably impact future fees and expenses, and my evaluation includes the effects of these changes.
Fees and Expenses Compared with Other Funds
The competitive fee and expense evaluation for each fund focused on two primary comparisons:
The Fund's contractual management fee (the advisory fee plus the administration fee where applicable) compared with those of a group of typically 12-15 funds in the same Lipper investment category (e.g. Large Capitalization Growth) having similar distribution arrangements and being of similar size.
The Fund's total expenses compared with a broader universe of funds from the same Lipper investment category and having similar distribution arrangements.
These two comparisons provide a view of not only the level of the fee compared with funds of similar scale but also the total expense the Fund bears for all the services it receives, in comparison with the investment choices available in the Fund's investment category and distribution channel. The principal figure-of-merit used in these comparisons was the subject Fund's percentile ranking against peers.
DeAM's Fees for Similar Services to Others
DeAM provided management fee schedules for all of its US domiciled fund and non-fund investment management accounts in any of the investment categories where there is a DWS Fund. These similar products included the other DWS Funds, non-fund pooled accounts, institutional accounts and sub-advisory accounts. Using this information, I calculated for each Fund the fee that would be charged to each similar product, at the subject Fund's asset level.
Evaluating information regarding non-fund products is difficult because there are varying levels of services required for different types of accounts, with mutual funds generally requiring considerably more regulatory and administrative types of service as well as having more frequent cash flows than other types of accounts. Also, while mutual fund fees for similar fund products can be expected to be similar, there will be some differences due to different pricing conditions in different distribution channels (e.g. retail funds versus those used in variable insurance products), differences in underlying investment processes and other factors.
Costs and Profit Margins
DeAM provided a detailed profitability analysis for each Fund. After making some adjustments so that the presentation would be more comparable to the available industry figures, I reviewed profit margins from investment management alone, from investment management plus other fund services (excluding distribution) provided to the Funds by DeAM (principally shareholder services), and DeAM profits from all sources, including distribution. A later section comments on overall profitability.
Economies of Scale
Economies of scale — an expected decline in management cost per dollar of fund assets as fund assets grow — are very rarely quantified and documented because of inherent difficulties in collecting and analyzing relevant data. However, in virtually every investment category that I reviewed, larger funds tend to have lower fees and lower total expenses than smaller funds. To see how each DWS Fund compares with this industry observation, I reviewed:
The trend in Fund assets over the last five years and the accompanying trend in total expenses. This shows if the Fund has grown and, if so, whether total expense (management fees as well as other expenses) have declined as a percent of assets.
Whether the Fund has break-points in its management fee schedule, the extent of the fee reduction built into the schedule and the asset levels where the breaks take effect, and in the case of a sub-advised Fund how the Fund's break-points compare with those of the sub-advisory fee schedule.
How the Fund's contractual fee schedule compares with trends in the industry data. To accomplish this, I constructed a chart showing how actual latest-fiscal-year contractual fees of the Fund and of other similar funds relate to average fund assets, with the subject Fund's contractual fee schedule superimposed.
Quality of Service — Performance
The quality-of-service evaluation focused on investment performance, which is the principal result of the investment management service. Each Fund's performance was reviewed over the past 1, 3, 5 and 10 years, as applicable, and compared with that of other funds in the same investment category and with a suitable market index.
In addition, I calculated and reviewed risk-adjusted returns relative to an index of similar mutual funds' returns and a suitable market index. The risk-adjusted returns analysis provides a way of determining the extent to which the Fund's return comparisons are mainly the product of investment value-added (or lack thereof) or alternatively taking considerably more or less risk than is typical in its investment category.
I also received and considered the history of portfolio manager changes for each Fund, as this provided an important context for evaluating the performance results.
Complex-Level Considerations
While this evaluation was conducted mainly at the individual fund level, there are some issues relating to the reasonableness of fees that can alternatively be considered across the whole fund complex:
I reviewed DeAM's profitability analysis for all DWS Funds, with a view toward determining if the allocation procedures used were reasonable and how profit levels compared with public data for other investment managers.
I considered whether DeAM and affiliates receive any significant ancillary or "fall-out" benefits that should be considered in interpreting the direct profitability results. These would be situations where serving as the investment manager of the Funds is beneficial to another part of the Deutsche Bank organization.
I considered how aggregated DWS Fund expenses had varied over the years, by asset class and in the context of trends in asset levels.
I reviewed the structure of the DeAM organization, trends in staffing levels, and information on compensation of investment management and other professionals compared with industry data.
Findings
Based on the process and analysis discussed above, which included reviewing a wide range of information from management and external data sources and considering among other factors the fees DeAM charges other clients, the fees charged by other fund managers, DeAM's costs and profits associated with managing the Funds, economies of scale, possible fall-out benefits, and the nature and quality of services provided, in my opinion the management fees charged the DWS Funds are reasonable.
Thomas H. Mack
DWS Investments Distributors, Inc.
222 South Riverside Plaza
Chicago, IL 60606
(800) 621-1148
VS2SI-3 (R-023302-1 8/11)
Pursuant to the requirements of the Securities Exchange Act of 1934 and the Investment Company Act of 1940, the registrant has duly caused this report to be signed on its behalf by the undersigned, thereunto duly authorized.
Pursuant to the requirements of the Securities Exchange Act of 1934 and the Investment Company Act of 1940, this report has been signed below by the following persons on behalf of the registrant and in the capacities and on the dates indicated.