UNITED STATES
SECURITIES AND EXCHANGE COMMISSION
WASHINGTON, D. C. 20549
FORM N-CSRS
Investment Company Act file number: 811-05002
DWS Variable Series II
(Exact Name of Registrant as Specified in Charter)
345 Park Avenue
New York, NY 10154-0004
(Address of Principal Executive Offices) (Zip Code)
Registrant’s Telephone Number, including Area Code: (212) 250-3220
Paul Schubert
60 Wall Street
New York, NY 10005
(Name and Address of Agent for Service)
| Date of fiscal year end: | 12/31 |
| | |
| Date of reporting period: | 6/30/2013 |
| ITEM 1. | REPORT TO STOCKHOLDERS |
| | |
JUNE 30, 2013
SEMIANNUAL REPORT
DWS VARIABLE SERIES II
DWS Alternative Asset Allocation VIP
Contents
7 Statement of Assets and Liabilities 7 Statement of Operations 8 Statement of Changes in Net Assets 12 Notes to Financial Statements 16 Information About Your Fund's Expenses 18 Summary of Management Fee Evaluation by Independent Fee Consultant |
This report must be preceded or accompanied by a prospectus. To obtain an additional prospectus or summary prospectus, if available, call (800) 728-3337 or your financial representative. We advise you to consider the Fund's objectives, risks, charges and expenses carefully before investing. The summary prospectus and prospectus contain this and other important information about the Fund. Please read the prospectus carefully before you invest.
Although allocation among different asset categories generally limits risk, Fund management may favor an asset category that underperforms other assets or markets as a whole. The Fund expects to invest in underlying funds that emphasize alternatives or non-traditional asset categories or investment strategies, and as a result, it is subject to the risk factors of those underlying funds. Some of those risks include stock market risk, credit and interest rate risk, volatility in commodity prices and high-yield debt securities, short sales risk and the political, general economic, liquidity and currency risks of foreign investments, which may be particularly significant for emerging markets. Because Exchange Traded Funds (ETFs) trade on a securities exchange, their shares may trade at a premium or discount to their net asset value. ETFs also incur fees and expenses so they may not fully match the performance of the indexes they are designed to track. Short sales — which involve selling borrowed securities in anticipation of a price decline, then returning an equal number of the securities at some point in the future — could magnify losses and increase volatility. The Fund may use derivatives, including as part of its currency and interest-rate strategies. Investing in derivatives entails special risks relating to liquidity, leverage and credit that may reduce returns and/or increase volatility. The success of the Fund's currency and interest-rate strategies are dependent, in part, on the effectiveness and implementation of portfolio management's proprietary models. As part of these strategies, the Fund's exposure to foreign currencies could cause lower returns or even losses because foreign currency rates may fluctuate significantly over short periods of time for a number of reasons. The risk of loss is heightened during periods of rapid rises in interest rates. In addition, the notional amount of the Fund's aggregate currency and interest-rate exposure resulting from these strategies may significantly exceed the net assets of the Fund. See the prospectus for additional risks and specific details regarding the Fund's risk profile.
DWS Investments is part of the Deutsche Asset & Wealth Management division of Deutsche Bank AG.
NOT FDIC/NCUA INSURED NO BANK GUARANTEE MAY LOSE VALUE NOT A DEPOSIT
NOT INSURED BY ANY FEDERAL GOVERNMENT AGENCY
Performance Summary June 30, 2013 (Unaudited)
Fund performance shown is historical, assumes reinvestment of all dividend and capital gain distributions and does not guarantee future results. Investment return and principal value fluctuate with changing market conditions so that, when redeemed, shares may be worth more or less than their original cost. Current performance may be lower or higher than the performance data quoted. Please contact your participating insurance company for the Fund's most recent month-end performance. Performance doesn't reflect charges and fees ("contract charges") associated with the separate account that invests in the Fund or any variable life insurance policy or variable annuity contract for which the Fund is an investment option. These charges and fees will reduce returns. While all share classes have the same underlying portfolio, their performance will differ.
The gross expense ratios of the Fund, as stated in the fee table of the prospectus dated May 1, 2013 are 1.91% and 2.16% for Class A and Class B shares, respectively, and may differ from the expense ratios disclosed in the Financial Highlights tables in this report. These expense ratios include net expenses of the underlying funds in which the Fund invests.
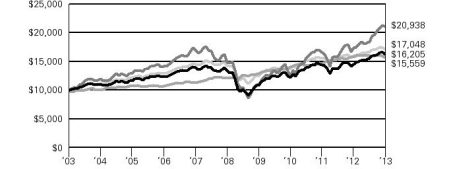
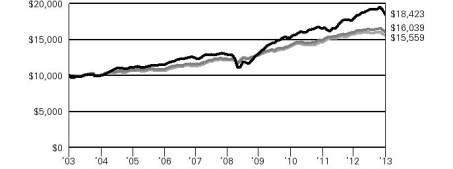
| Growth of an Assumed $10,000 Investment in DWS Alternative Asset Allocation VIP from 2/2/09 to 6/30/13 |
 | The Morgan Stanley Capital International (MSCI) World Index is a free float-adjusted market capitalization weighted index that is designed to measure the equity market performance of developed markets. The index consists of 24 developed market country indices. The index is calculated using closing local market prices and translates into U.S. dollars using the London close foreign exchange rates. The Barclays U.S. Aggregate Bond Index is an unmanaged index representing domestic taxable investment-grade bonds, with index components for government and corporate securities, mortgage pass-through securities, and asset-backed securities with an average maturity of one year or more. The Blended Index is calculated using the performance of two unmanaged indices, representative of stocks (the MSCI World Index (70%)) and bonds (the Barclays U.S. Aggregate Bond Index (30%)). These results are summed to produce the aggregate benchmark. Index returns do not reflect any fees or expenses and it is not possible to invest directly into an index. |
 | |
| | |
| Comparative Results | |
| DWS Alternative Asset Allocation VIP | | 6-Month‡ | | | 1-Year | | | 3-Year | | | Life of Fund* | |
| Class A | Growth of $10,000 | | $ | 9,800 | | | $ | 10,343 | | | $ | 11,789 | | | $ | 14,835 | |
| Average annual total return | | | -2.00 | % | | | 3.43 | % | | | 5.64 | % | | | 9.36 | % |
| MSCI World Index | Growth of $10,000 | | $ | 10,843 | | | $ | 11,858 | | | $ | 14,705 | | | $ | 18,889 | |
| Average annual total return | | | 8.43 | % | | | 18.58 | % | | | 13.72 | % | | | 15.49 | % |
| Barclays U.S. Aggregate Bond Index | Growth of $10,000 | | $ | 9,756 | | | $ | 9,931 | | | $ | 11,090 | | | $ | 12,484 | |
| Average annual total return | | | -2.44 | % | | | -0.69 | % | | | 3.51 | % | | | 5.15 | % |
| Blended Index | Growth of $10,000 | | $ | 10,512 | | | $ | 11,262 | | | $ | 13,649 | | | $ | 16,715 | |
| Average annual total return | | | 5.12 | % | | | 12.62 | % | | | 10.92 | % | | | 12.33 | % |
The growth of $10,000 is cumulative.
* The Fund commenced offering Class A shares on February 2, 2009. The performance shown for each index is for the time period of January 31, 2009 through June 30, 2013, which is based on the performance period of the life of the Fund.
‡ Total returns shown for periods less than one year are not annualized.
| Comparative Results | |
| DWS Alternative Asset Allocation VIP | | 6-Month‡ | | | 1-Year | | | 3-Year | | | Life of Class** | |
| Class B | Growth of $10,000 | | $ | 9,796 | | | $ | 10,317 | | | $ | 11,698 | | | $ | 13,504 | |
| Average annual total return | | | -2.04 | % | | | 3.17 | % | | | 5.37 | % | | | 7.58 | % |
| MSCI World Index | Growth of $10,000 | | $ | 10,843 | | | $ | 11,858 | | | $ | 14,705 | | | $ | 16,132 | |
| Average annual total return | | | 8.43 | % | | | 18.58 | % | | | 13.72 | % | | | 12.43 | % |
| Barclays U.S. Aggregate Bond Index | Growth of $10,000 | | $ | 9,756 | | | $ | 9,931 | | | $ | 11,090 | | | $ | 12,212 | |
| Average annual total return | | | -2.44 | % | | | -0.69 | % | | | 3.51 | % | | | 5.02 | % |
| Blended Index | Growth of $10,000 | | $ | 10,512 | | | $ | 11,262 | | | $ | 13,649 | | | $ | 15,265 | |
| Average annual total return | | | 5.12 | % | | | 12.62 | % | | | 10.92 | % | | | 10.89 | % |
The growth of $10,000 is cumulative.
** The Fund commenced offering Class B shares on May 18, 2009. The performance shown for each index is for the time period of May 31, 2009 through June 30, 2013, which is based on the performance period of the life of Class B.
‡ Total returns shown for periods less than one year are not annualized.
Portfolio Summary (Unaudited) Asset Allocation* (As a % of Investment Portfolio excluding Cash Equivalents) | 6/30/13 | 12/31/12 |
| |
| Commodities | 18% | 19% |
| DWS Enhanced Commodity Strategy Fund | 14% | 13% |
| DWS Gold & Precious Metals Fund | — | 1% |
| Market Vectors Agribusiness Fund | 4% | 4% |
| iShares S&P Global Timber & Forestry Index Fund | — | 1% |
| Real Return | 32% | 32% |
| DWS Global Inflation Fund | 11% | 12% |
| DWS RREEF Global Infrastructure Fund | 12% | 11% |
| DWS RREEF Global Real Estate Securities Fund | 9% | 9% |
| Hedge Strategy | 15% | 15% |
| DWS Disciplined Market Neutral Fund | 15% | 15% |
| Currency | 14% | 14% |
| DWS Enhanced Emerging Markets Fixed Income Fund | 8% | 8% |
| WisdomTree Emerging Markets Local Debt Fund | 5% | 4% |
| PowerShares DB G10 Currency Harvest Fund | 1% | — |
| SPDR Barclays International Treasury Bond Fund | — | 2% |
| Opportunistic | 21% | 20% |
| DWS Floating Rate Fund | 13% | 13% |
| iShares S&P U.S. Preferred Stock Index Fund | 4% | 4% |
| SPDR Barclays Capital Convertible Securities | 3% | 3% |
| iShares S&P International Preferred Stock Index Fund | 1% | — |
| | 100% | 100% |
* Investment strategies will fall into the following categories: Commodities, Real-Return, Hedge Strategy, Currency and Opportunistic. Commodities investments seek to provide exposure to hard assets. Real-Retun investments seek to provide a measure of inflation protection. Hedge Strategy investments seek to generate returns independent of the broader markets. Currency investments seek to offer exposure to foreign investments, many of which are not denominated in U.S. dollars. Opportunistic investments seek to offer exposure to categories generally not included in investors' allocations.
Portfolio holdings and characteristics are subject to change.
For more complete details about the Fund's investment portfolio, see page 6.
Following the Fund's fiscal first and third quarter-end, a complete portfolio holdings listing is filed with the SEC on Form N-Q. The form will be available on the SEC's Web site at www.sec.gov, and it also may be reviewed and copied at the SEC's Public Reference Room in Washington, D.C. Information on the operation of the SEC's Public Reference Room may be obtained by calling (800) SEC-0330. The Fund's portfolio holdings are also posted on www.dws-investments.com from time to time. Please see the Fund's current prospectus for more information.
Effective July 12, 2013, QS Investors no longer serves as subadvisor to the fund and day-to-day portfolio management of the fund transitioned to Deutsche Investment Management Americas Inc.
The new portfolio management team for the fund is as follows:
Pankaj Bhatnagar, PhD
Benjamin Pace
Darwei Kung
Portfolio Managers, Deutsche Investment Management Americas Inc.
Investment Portfolio June 30, 2013 (Unaudited) | | | Shares | | | Value ($) | |
| | | | |
| Mutual Funds 80.7% | |
| DWS Disciplined Market Neutral Fund "Institutional"* (a) | | | 1,323,803 | | | | 13,026,220 | |
| DWS Enhanced Commodity Strategy Fund "Institutional" (a) | | | 3,761,000 | | | | 11,395,831 | |
| DWS Enhanced Emerging Markets Fixed Income Fund "Institutional" (a) | | | 673,880 | | | | 6,994,871 | |
| DWS Floating Rate Fund "Institutional" (a) | | | 1,101,335 | | | | 10,363,567 | |
| DWS Global Inflation Fund "Institutional" (a) | | | 960,642 | | | | 9,587,204 | |
| DWS RREEF Global Infrastructure Fund "Institutional" (a) | | | 820,690 | | | | 10,160,140 | |
| DWS RREEF Global Real Estate Securities Fund "Institutional" (a) | | | 881,108 | | | | 7,216,278 | |
Total Mutual Funds (Cost $68,264,423) | | | | 68,744,111 | |
| | |
| | | Shares | | | Value ($) | |
| | | | | | | | | |
| Exchange-Traded Funds 18.5% | |
| iShares S&P International Preferred Stock Index Fund | | | 33,465 | | | | 802,825 | |
| iShares S&P U.S. Preferred Stock Index Fund | | | 95,910 | | | | 3,767,345 | |
| Market Vectors Agribusiness Fund | | | 64,451 | | | | 3,299,247 | |
| PowerShares DB G10 Currency Harvest Fund* (b) | | | 32,264 | | | | 819,828 | |
| SPDR Barclays Capital Convertible Securities | | | 68,513 | | | | 2,924,135 | |
| WisdomTree Emerging Markets Local Debt Fund | | | 85,217 | | | | 4,093,825 | |
Total Exchange-Traded Funds (Cost $15,790,626) | | | | 15,707,205 | |
| | |
| Cash Equivalents 0.9% | |
| Central Cash Management Fund, 0.07% (a) (c) (Cost $781,678) | | | 781,678 | | | | 781,678 | |
| | | % of Net Assets | | | Value ($) | |
| | | | |
Total Investment Portfolio (Cost $84,836,727)† | | | 100.1 | | | | 85,232,994 | |
| Other Assets and Liabilities, Net | | | (0.1 | ) | | | (49,717 | ) |
| Net Assets | | | 100.0 | | | | 85,183,277 | |
* Non-income producing security.
† The cost for federal income tax purposes was $85,627,081. At June 30, 2013, net unrealized depreciation for all securities based on tax cost was $394,087. This consisted of aggregate gross unrealized appreciation for all securities in which there was an excess of value over tax cost of $3,395,721 and aggregate gross unrealized depreciation for all securities in which there was an excess of tax cost over value of $3,789,808.
(a) Affiliated fund managed by Deutsche Investment Management Americas Inc.
(b) Affiliated fund managed by DB Commodity Services LLC, a subsidiary of Deutsche Bank AG.
(c) The rate shown is the annualized seven-day yield at period end.
S&P: Standard & Poor's
SPDR: Standard & Poor's Depositary Receipt
Fair Value Measurements
Various inputs are used in determining the value of the Fund's investments. These inputs are summarized in three broad levels. Level 1 includes quoted prices in active markets for identical securities. Level 2 includes other significant observable inputs (including quoted prices for similar securities, interest rates, prepayment speeds, and credit risk). Level 3 includes significant unobservable inputs (including the Fund's own assumptions in determining the fair value of investments). The inputs or methodology used for valuing securities are not necessarily an indication of the risk associated with investing in those securities.
The following is a summary of the inputs used as of June 30, 2013 in valuing the Fund's investments. For information on the Fund's policy regarding the valuation of investments, please refer to the Security Valuation section of Note A in the accompanying Notes to Financial Statements.
| Assets | | Level 1 | | | Level 2 | | | Level 3 | | | Total | |
| | |
| Mutual Funds | | $ | 68,744,111 | | | $ | — | | | $ | — | | | $ | 68,744,111 | |
| Exchange-Traded Funds | | | 15,707,205 | | | | — | | | | — | | | | 15,707,205 | |
| Short-Term Investments | | | 781,678 | | | | — | | | | — | | | | 781,678 | |
| Total | | $ | 85,232,994 | | | $ | — | | | $ | — | | | $ | 85,232,994 | |
There have been no transfers between fair value measurement levels during the period ended June 30, 2013.
The accompanying notes are an integral part of the financial statements.
Statement of Assets and Liabilities | as of June 30, 2013 (Unaudited) | |
| Assets | |
Investments: Investments in affiliated Underlying Funds, at value (cost $69,908,174) | | $ | 70,345,617 | |
| Investments in non-affiliated Underlying Funds, at value (cost $14,928,553) | | | 14,887,377 | |
| Total investments in securities, at value (cost $84,836,727) | | | 85,232,994 | |
| Receivable for Fund shares sold | | | 15,594 | |
| Due from Advisor | | | 3,826 | |
| Other assets | | | 478 | |
| Total assets | | | 85,252,892 | |
| Liabilities | |
| Payable for Fund shares redeemed | | | 2,840 | |
| Accrued Trustees' fees | | | 557 | |
| Other accrued expenses and payables | | | 66,218 | |
| Total liabilities | | | 69,615 | |
| Net assets, at value | | $ | 85,183,277 | |
| Net Assets Consist of | |
| Undistributed net investment income | | | 568,567 | |
| Net unrealized appreciation (depreciation) on investments | | | 396,267 | |
| Accumulated net realized gain (loss) | | | (1,456,164 | ) |
| Paid-in capital | | | 85,674,607 | |
| Net assets, at value | | $ | 85,183,277 | |
Class A Net Asset Value, offering and redemption price per share ($11,040,405 ÷ 826,804 outstanding shares of beneficial interest, no par value, unlimited number of shares authorized) | | $ | 13.35 | |
Class B Net Asset Value, offering and redemption price per share ($74,142,872 ÷ 5,549,641 outstanding shares of beneficial interest, no par value, unlimited number of shares authorized) | | $ | 13.36 | |
The accompanying notes are an integral part of the financial statements.
Statement of Operations
| for the six months ended June 30, 2013 (Unaudited) | |
| Investment Income | |
Income: Income distributions from affiliated Underlying Funds | | $ | 591,603 | |
| Dividends | | | 199,210 | |
| Total income | | | 790,813 | |
Expenses: Management fee | | | 150,470 | |
| Administration fee | | | 39,941 | |
| Services to shareholders | | | 1,106 | |
| Record keeping fees (Class B) | | | 4,848 | |
| Distribution service fee (Class B) | | | 86,580 | |
| Custodian fee | | | 6,149 | |
| Audit and tax fees | | | 25,250 | |
| Legal fees | | | 10,077 | |
| Reports to shareholders | | | 14,205 | |
| Trustees' fees and expenses | | | 2,353 | |
| Other | | | 1,249 | |
| Total expenses before expense reductions | | | 342,228 | |
| Expense reductions | | | (155,795 | ) |
| Total expenses after expense reductions | | | 186,433 | |
| Net investment income (loss) | | | 604,380 | |
| Realized and Unrealized Gain (Loss) | |
Net realized gain (loss) from: Sale of affiliated Underlying Funds | | | (310,854 | ) |
| Sale of non-affiliated Underlying Funds | | | 79,648 | |
| Capital gain distributions from affiliated Underlying Funds | | | 11,205 | |
| | | | (220,001 | ) |
| Change in net unrealized appreciation (depreciation) on investments | | | (2,248,398 | ) |
| Net gain (loss) | | | (2,468,399 | ) |
| Net increase (decrease) in net assets resulting from operations | | $ | (1,864,019 | ) |
The accompanying notes are an integral part of the financial statements.
Statement of Changes in Net Assets | Increase (Decrease) in Net Assets | | Six Months Ended June 30, 2013 (Unaudited) | | | Year Ended December 31, 2012 | |
Operations: Net investment income | | $ | 604,380 | | | $ | 1,351,274 | |
| Net realized gain (loss) | | | (220,001 | ) | | | (417,287 | ) |
| Change in net unrealized appreciation (depreciation) | | | (2,248,398 | ) | | | 4,248,342 | |
| Net increase (decrease) in net assets resulting from operations | | | (1,864,019 | ) | | | 5,182,329 | |
Distributions to shareholders from: Net investment income: Class A | | | (218,625 | ) | | | (277,485 | ) |
| Class B | | | (1,281,892 | ) | | | (1,538,242 | ) |
Net realized gains: Class A | | | — | | | | (65,328 | ) |
| Class B | | | — | | | | (390,800 | ) |
| Total distributions | | | (1,500,517 | ) | | | (2,271,855 | ) |
Fund share transactions: Class A Proceeds from shares sold | | | 2,569,612 | | | | 3,873,528 | |
| Reinvestment of distributions | | | 218,625 | | | | 342,813 | |
| Payments for shares redeemed | | | (1,297,333 | ) | | | (1,854,054 | ) |
| Net increase (decrease) in net assets from Class A share transactions | | | 1,490,904 | | | | 2,362,287 | |
Class B Proceeds from shares sold | | | 18,289,425 | | | | 21,887,200 | |
| Reinvestment of distributions | | | 1,281,892 | | | | 1,929,042 | |
| Payments for shares redeemed | | | (4,532,797 | ) | | | (5,211,663 | ) |
| Net increase (decrease) in net assets from Class B share transactions | | | 15,038,520 | | | | 18,604,579 | |
| Increase (decrease) in net assets | | | 13,164,888 | | | | 23,877,340 | |
| Net assets at beginning of period | | | 72,018,389 | | | | 48,141,049 | |
| Net assets at end of period (including undistributed net investment income of $568,567 and $1,464,704, respectively) | | $ | 85,183,277 | | | $ | 72,018,389 | |
| Other Information | |
Class A Shares outstanding at beginning of period | | | 720,220 | | | | 545,891 | |
| Shares sold | | | 185,198 | | | | 284,613 | |
| Shares issued to shareholders in reinvestment of distributions | | | 15,638 | | | | 25,795 | |
| Shares redeemed | | | (94,252 | ) | | | (136,079 | ) |
| Net increase (decrease) in Class A shares | | | 106,584 | | | | 174,329 | |
| Shares outstanding at end of period | | | 826,804 | | | | 720,220 | |
Class B Shares outstanding at beginning of period | | | 4,466,071 | | | | 3,093,124 | |
| Shares sold | | | 1,320,438 | | | | 1,611,987 | |
| Shares issued to shareholders in reinvestment of distributions | | | 91,630 | | | | 145,041 | |
| Shares redeemed | | | (328,498 | ) | | | (384,081 | ) |
| Net increase (decrease) in Class B shares | | | 1,083,570 | | | | 1,372,947 | |
| Shares outstanding at end of period | | | 5,549,641 | | | | 4,466,071 | |
The accompanying notes are an integral part of the financial statements.
| | | | | | Years Ended December 31, | | | | |
| Class A | | Six Months Ended 6/30/13 (Unaudited) | | | 2012 | | | 2011 | | | 2010 | | | Period Ended 12/31/09a | |
| Selected Per Share Data | |
| Net asset value, beginning of period | | $ | 13.90 | | | $ | 13.24 | | | $ | 13.85 | | | $ | 12.63 | | | $ | 10.00 | |
Income (loss) from investment operations: Net investment incomeb | | | .12 | | | | .33 | | | | .64 | | | | .46 | | | | .57 | |
| Net realized and unrealized gain (loss) | | | (.39 | ) | | | .93 | | | | (1.02 | ) | | | 1.09 | | | | 2.06 | |
| Total from investment operations | | | (.27 | ) | | | 1.26 | | | | (.38 | ) | | | 1.55 | | | | 2.63 | |
Less distributions from: Net investment income | | | (.28 | ) | | | (.49 | ) | | | (.19 | ) | | | (.18 | ) | | | — | |
| Net realized gains | | | — | | | | (.11 | ) | | | (.04 | ) | | | (.15 | ) | | | — | |
| Total distributions | | | (.28 | ) | | | (.60 | ) | | | (.23 | ) | | | (.33 | ) | | | — | |
| Net asset value, end of period | | $ | 13.35 | | | $ | 13.90 | | | $ | 13.24 | | | $ | 13.85 | | | $ | 12.63 | |
Total Return (%)c,d | | | (2.00 | )** | | | 9.72 | | | | (2.87 | ) | | | 12.46 | | | | 26.30 | ** |
| Ratios to Average Net Assets and Supplemental Data | |
| Net assets, end of period ($ millions) | | | 11 | | | | 10 | | | | 7 | | | | 5 | | | | 1 | |
Ratio of expenses before expense reductions (%)e | | | .63 | * | | | .63 | | | | .61 | | | | .94 | | | | 11.67 | * |
Ratio of expenses after expense reductions (%)e | | | .25 | * | | | .30 | | | | .30 | | | | .21 | | | | .21 | * |
| Ratio of net investment income (%) | | | 1.74 | * | | | 2.46 | | | | 4.72 | | | | 3.51 | | | | 5.39 | * |
| Portfolio turnover rate (%) | | | 9 | ** | | | 22 | | | | 39 | | | | 6 | | | | 155 | ** |
a For the period from February 2, 2009 (commencement of operations of Class A shares) to December 31, 2009. b Based on average shares outstanding during the period. c Total return would have been lower had certain expenses not been reduced. d Total return would have been lower if the Advisor had not reduced some Underlying Funds' expenses. e The Fund invests in other Funds and indirectly bears its proportionate share of fees and expenses incurred by the Underlying Funds in which the Fund is invested. This ratio does not include these indirect fees and expenses. * Annualized ** Not annualized | |
| | | | | | Years Ended December 31, | | | | |
| Class B | | Six Months Ended 6/30/13 (Unaudited) | | | 2012 | | | 2011 | | | 2010 | | | Period Ended 12/31/09a | |
| Selected Per Share Data | |
| Net asset value, beginning of period | | $ | 13.88 | | | $ | 13.23 | | | $ | 13.84 | | | $ | 12.61 | | | $ | 10.87 | |
Income (loss) from investment operations: Net investment incomeb | | | .10 | | | | .30 | | | | .61 | | | | .42 | | | | .35 | |
| Net realized and unrealized gain (loss) | | | (.37 | ) | | | .91 | | | | (1.03 | ) | | | 1.09 | | | | 1.39 | |
| Total from investment operations | | | (.27 | ) | | | 1.21 | | | | (.42 | ) | | | 1.51 | | | | 1.74 | |
Less distributions from: Net investment income | | | (.25 | ) | | | (.45 | ) | | | (.15 | ) | | | (.13 | ) | | | — | |
| Net realized gains | | | — | | | | (.11 | ) | | | (.04 | ) | | | (.15 | ) | | | — | |
| Total distributions | | | (.25 | ) | | | (.56 | ) | | | (.19 | ) | | | (.28 | ) | | | — | |
| Net asset value, end of period | | $ | 13.36 | | | $ | 13.88 | | | $ | 13.23 | | | $ | 13.84 | | | $ | 12.61 | |
Total Return (%)c,d | | | (2.04 | )** | | | 9.36 | | | | (3.12 | ) | | | 12.15 | | | | 16.01 | ** |
| Ratios to Average Net Assets and Supplemental Data | |
| Net assets, end of period ($ millions) | | | 74 | | | | 62 | | | | 41 | | | | 23 | | | | 3 | |
Ratio of expenses before expense reductions (%)e | | | .89 | * | | | .88 | | | | .86 | | | | 1.19 | | | | 5.37 | * |
Ratio of expenses after expense reductions (%)e | | | .50 | * | | | .55 | | | | .55 | | | | .46 | | | | .61 | * |
| Ratio of net investment income (%) | | | 1.48 | * | | | 2.25 | | | | 4.47 | | | | 3.26 | | | | 4.66 | * |
| Portfolio turnover rate (%) | | | 9 | ** | | | 22 | | | | 39 | | | | 6 | | | | 155 | ** |
a For the period from May 18, 2009 (commencement of operations of Class B shares) to December 31, 2009. b Based on average shares outstanding during the period. c Total return would have been lower had certain expenses not been reduced. d Total return would have been lower if the Advisor had not reduced Underlying Funds' expenses. e The Fund invests in other Funds and indirectly bears its proportionate share of fees and expenses incurred by the Underlying Funds in which the Fund is invested. This ratio does not include these indirect fees and expenses. * Annualized ** Not annualized | |
Notes to Financial Statements (Unaudited)
A. Organization and Significant Accounting Policies
DWS Alternative Asset Allocation VIP (the "Fund") is a diversified series of DWS Variable Series II (the "Trust"), which is registered under the Investment Company Act of 1940, as amended (the "1940 Act"), as an open-end management investment company organized as a Massachusetts business trust. The Fund mainly invests in other affiliated DWS funds (i.e. mutual funds, exchange-traded funds and other pooled investment vehicles managed by Deutsche Investment Management Americas Inc. or one of its affiliates, together the ("Underlying DWS Funds"), non-affiliated exchange-traded funds ("Non-affiliated ETFs") and derivative investments. Non-affiliated ETFs and Underlying DWS Funds are collectively referred to as "Underlying Funds". Each Underlying DWS Fund's accounting policies and investment holdings are outlined in the Underlying DWS Funds' financial statements and are available upon request.
Multiple Classes of Shares of Beneficial Interest. The Fund offers two classes of shares (Class A shares and Class B shares). Sales of Class B shares are subject to recordkeeping fees up to 0.15% and Rule 12b-1 fees under the 1940 Act equal to an annual rate of 0.25% of the average daily net assets of the Class B shares of the Fund. Class A shares are not subject to such fees.
Investment income, realized and unrealized gains and losses, and certain fund-level expenses and expense reductions, if any, are borne pro rata on the basis of relative net assets by the holders of all classes of shares except that each class bears certain expenses unique to that class (including the applicable Rule 12b-1 fee). Differences in class-level expenses may result in payment of different per share dividends by class. All shares have equal rights with respect to voting subject to class-specific arrangements.
The Fund's financial statements are prepared in accordance with accounting principles generally accepted in the United States of America which require the use of management estimates. Actual results could differ from those estimates. The policies described below are followed consistently by the Fund in the preparation of its financial statements.
Security Valuation. Investments are stated at value determined as of the close of regular trading on the New York Stock Exchange on each day the exchange is open for trading.
Various inputs are used in determining the value of the Fund's investments. These inputs are summarized in three broad levels. Level 1 includes quoted prices in active markets for identical securities. Level 2 includes other significant observable inputs (including quoted prices for similar securities, interest rates, prepayment speeds, and credit risk). Level 3 includes significant unobservable inputs (including the Fund's own assumptions in determining the fair value of investments). The inputs or methodology used for valuing securities are not necessarily an indication of the risk associated with investing in those securities.
Investments in mutual funds are valued at the net asset value per share of each class of the Underlying DWS Funds and are categorized as Level 1.
ETFs are valued at the most recent sale price or official closing price reported on the exchange (U.S. or foreign) or over-the-counter market on which they trade and are categorized as Level 1 securities. ETFs for which no sales are reported are valued at the calculated mean between the most recent bid and asked quotations on the relevant market or, if a mean cannot be determined, at the most recent bid quotation.
Disclosure about the classification of fair value measurements is included in a table following the Fund's Investment Portfolio.
Federal Income Taxes. The Fund's policy is to comply with the requirements of the Internal Revenue Code, as amended, which are applicable to regulated investment companies and to distribute all of its taxable income to its shareholders.
At December 31, 2012, the Fund had a net tax basis capital loss carryforward of approximately $446,000, which may be applied against realized net taxable capital gains indefinitely, including short-term losses ($68,000) and long-term losses ($378,000).
The Fund has reviewed the tax positions for the open tax years as of December 31, 2012 and has determined that no provision for income tax is required in the Fund's financial statements. The Fund's federal tax returns for the prior three fiscal years remain open subject to examination by the Internal Revenue Service.
Distribution of Income and Gains. Distributions from net investment income of the Fund, if any, are declared and distributed to shareholders annually. Net realized gains from investment transactions, in excess of available capital loss carryforwards, would be taxable to the Fund if not distributed and, therefore, will be distributed to shareholders at least annually. The Fund may also make additional distributions for tax purposes if necessary.
The timing and characterization of certain income and capital gain distributions are determined annually in accordance with federal tax regulations which may differ from accounting principles generally accepted in the United States of America. These differences primarily relate to certain securities sold at a loss. As a result, net investment income (loss) and net realized gain (loss) on investment transactions for a reporting period may differ significantly from distributions during such period. Accordingly, the Fund may periodically make reclassifications among certain of its capital accounts without impacting the net asset value of the Fund.
The tax character of current year distributions will be determined at the end of the current fiscal year.
Expenses. Expenses of the Trust arising in connection with a specific fund are allocated to that fund. Other Trust expenses which cannot be directly attributed to a fund are apportioned among the funds in the Trust based upon the relative net assets or other appropriate measures.
Contingencies. In the normal course of business, the Fund may enter into contracts with service providers that contain general indemnification clauses. The Fund's maximum exposure under these arrangements is unknown as this would involve future claims that may be made against the Fund that have not yet been made. However, based on experience, the Fund expects the risk of loss to be remote.
Other. Investment transactions are accounted for on a trade date plus one basis for daily net asset value calculations. However, for financial reporting purposes, investment transactions are reported on trade date. Interest income is recorded on the accrual basis. Dividend Income is recorded on the ex-dividend date. Distributions of income and capital gains from the Underlying Funds are recorded on the ex-dividend date. Realized gains and losses from investment transactions are recorded on an identified cost basis.
B. Purchases and Sales of Securities
During the six months ended June 30, 2013, purchases and sales of affiliated Underlying Funds (excluding money market funds) aggregated $17,904,356 and $4,977,045, respectively. Purchases and sales of non-affiliated Underlying Funds (excluding money market funds) aggregated $4,871,637 and $2,002,441, respectively.
C. Related Parties
Management Agreement. Under the Investment Management Agreement with Deutsche Investment Management Americas Inc. ("DIMA" or the "Advisor"), an indirect, wholly owned subsidiary of Deutsche Bank AG, the Advisor directs the investments of the Fund in accordance with its investment objectives, policies and restrictions. The Advisor determines the securities, instruments and other contracts relating to investments in Underlying Funds to be purchased, sold or entered into by the Fund or delegates such responsibility to the Fund's subadvisors.
QS Investors, LLC ("QS Investors") acted as an investment subadvisor to the Fund. As an investment subadvisor, QS Investors rendered strategic asset allocation services and managed the portion of assets allocated from time to time to the Fund's global tactical asset allocation overlay strategy. QS Investors was paid by the Advisor for the services QS Investors provided to the Fund. Effective July 12, 2013, QS Investors no longer acts as subadvisor to the Fund and day-to-day portfolio management of the Fund transitioned to DIMA.
RREEF America L.L.C. ("RREEF") acts as an investment subadvisor to the Fund. As an investment subadvisor to the Fund, RREEF provides investment management services to the portions of the Fund's portfolio allocated to direct investments in global real estate and global infrastructure securities. RREEF is paid by the Advisor for the services RREEF provides to the Fund. As of the date of this report, the Fund obtained its exposure to global real estate and global infrastructure securities indirectly through investments in other Underlying DWS Funds.
The Fund does not invest in the Underlying DWS Funds for the purpose of exercising management or control; however, investments within the set limits may represent 5% or more of an Underlying DWS Fund's outstanding shares. For the six months ended June 30, 2013, the Fund did not invest in more than 5% of any Underlying DWS Fund.
Pursuant to the Investment Management Agreement with the Advisor, the Fund pays a monthly management fee based on the Fund's average daily net assets, computed and accrued daily and payable monthly, at the following annual rates:
| On assets invested in other DWS Funds | .200% |
| On assets invested in all other assets not considered DWS Funds | 1.200% |
In addition, the Advisor will receive management fees from managing the Underlying DWS Funds in which the Fund invests.
For the period from January 1, 2013 through September 30, 2013, the Advisor has contractually agreed to waive its fee and/or reimburse certain operating expenses to the extent necessary to maintain the operating expenses (excluding certain expenses such as extraordinary expenses, taxes, brokerage, interest expense and indirect expenses of Underlying Funds) of each class as follows:
For the six months ended June 30, 2013, the Advisor agreed to waive 0.15% of the monthly management fee based on average daily net assets for the Fund.
Accordingly, for the six months ended June 30, 2013, the fee pursuant to the Investment Management Agreement aggregating $150,470, all of which was waived resulting in an annualized effective rate of 0.00% of the Fund's average daily net assets.
The Fund indirectly bears its proportionate share of fees and expenses incurred by the Underlying Funds in which it is invested.
Administration Fee. Pursuant to an Administrative Services Agreement, DIMA provides most administrative services to the Fund. For all services provided under the Administrative Services Agreement, the Fund pays DIMA an annual fee ("Administration Fee") of 0.10% of the Fund's average daily net assets, computed and accrued daily and payable monthly. For the six months ended June 30, 2013, the Administration Fee was $39,941, of which $168 was waived and $8,448 is unpaid.
Service Provider Fees. DWS Investments Service Company ("DISC"), an affiliate of the Advisor, is the transfer agent, dividend-paying agent and shareholder service agent for the Fund. Pursuant to a sub-transfer agency agreement between DISC and DST Systems, Inc. ("DST"), DISC has delegated certain transfer agent, dividend-paying agent and shareholder service agent functions to DST. DISC compensates DST out of the shareholder servicing fee it receives from the Fund. For the six months ended June 30, 2013, the amounts charged to the Fund by DISC were as follows:
| Services to Shareholders | | Total Aggregated | | | Waived | |
| Class A | | $ | 39 | | | $ | 39 | |
| Class B | | | 73 | | | | 73 | |
| | | $ | 112 | | | $ | 112 | |
In addition, for the six months ended June 30, 2013, the Advisor reimbursed $4,848 of non-affiliated recordkeeping fees.
Distribution Service Agreement. Under the Fund's Class B 12b-1 plans, DWS Investments Distributors, Inc. ("DIDI") received a fee ("Distribution Service Fee") of 0.25% of average daily net assets of Class B shares. For the six months ended June 30, 2013, the Distribution Service Fee aggregated $86,580, of which $197 was waived and $15,079 is unpaid.
Typesetting and Filing Service Fees. Under an agreement with DIMA, DIMA is compensated for providing typesetting and certain regulatory filing services to the Fund. For the six months ended June 30, 2013, the amount charged to the Fund by DIMA included in the Statement of Operations under "reports to shareholders" aggregated $8,718, of which $7,105 is unpaid.
Trustees' Fees and Expenses. The Fund paid retainer fees to each Trustee not affiliated with the Advisor, plus specified amounts to the Board Chairperson and Vice Chairperson and to each committee Chairperson.
Affiliated Cash Management Vehicles. The Fund may invest uninvested cash balances in Central Cash Management Fund and DWS Variable NAV Money Fund, affiliated money market funds which are managed by the Advisor. Each affiliated money market fund seeks to provide a high level of current income consistent with liquidity and the preservation of capital. Each affiliated money market fund is managed in accordance with Rule 2a-7 under the Investment Company Act of 1940, which governs the quality, maturity, diversity and liquidity of instruments in which a money market fund may invest. Central Cash Management Fund seeks to maintain a stable net asset value, and DWS Variable NAV Money Fund maintains a floating net asset value. The Fund indirectly bears its proportionate share of the expenses of each affiliated money market fund in which it invests. Central Cash Management Fund does not pay the Advisor an investment management fee. To the extent that DWS Variable NAV Money Fund pays an investment management fee to the Advisor, the Advisor will waive an amount of the investment management fee payable to the Advisor by the Fund equal to the amount of the investment management fee payable on the Fund's assets invested in DWS Variable NAV Money Fund.
D. Ownership of the Fund
At June 30, 2013, one Participating Insurance Company was the owner of record of 10% or more of the total outstanding Class A shares of the Fund, owning 99%. Two Participating Insurance Companies were the owner of record of 10% or more of the total outstanding Class B shares of the Fund, owning 68% and 23%, respectively.
E. Transactions with Affiliates
The Fund mainly invest in Underlying DWS Funds and Non-affiliated ETFs. The Underlying DWS Funds in which the Fund invests are considered to be affiliated investments. A summary of the Fund's transactions with affiliated Underlying DWS Funds during the six months ended June 30, 2013 is as follows:
| Affiliate | | Value ($) at 12/31/2012 | | | Purchases Cost ($) | | | Sales Cost ($) | | | Realized Gain/ (Loss) ($) | | | Income Distributions ($) | | | Capital Gain Distributions ($) | | | Value ($) at 6/30/2013 | |
| DWS Disciplined Market Neutral Fund | | | 10,861,175 | | | | 2,690,000 | | | | 830,000 | | | | 2,418 | | | | — | | | | — | | | | 13,026,220 | |
| DWS Enhanced Commodity Strategy Fund | | | 9,764,605 | | | | 2,891,117 | | | | 295,000 | | | | (127,589 | ) | | | 81,117 | | | | — | | | | 11,395,831 | |
| DWS Enhanced Emerging Markets Fixed Income Fund | | | 5,788,784 | | | | 2,015,821 | | | | 185,000 | | | | (8,692 | ) | | | 130,821 | | | | — | | | | 6,994,871 | |
| DWS Floating Rate Fund | | | 8,973,006 | | | | 2,222,377 | | | | 820,000 | | | | (4,426 | ) | | | 232,377 | | | | — | | | | 10,363,567 | |
| DWS Global Inflation Fund | | | 8,483,420 | | | | 2,502,396 | | | | 455,000 | | | | (30,956 | ) | | | 32,396 | | | | — | | | | 9,587,204 | |
| DWS Gold & Precious Metals Fund | | | 693,385 | | | | 120,000 | | | | 687,045 | | | | (150,316 | ) | | | — | | | | — | | | | — | |
| DWS RREEF Global Infrastructure Fund | | | 7,644,550 | | | | 2,936,998 | | | | 815,000 | | | | 4,386 | | | | 95,793 | | | | 11,205 | | | | 10,160,140 | |
| DWS RREEF Global Real Estate Securities Fund | | | 6,354,589 | | | | 1,663,574 | | | | 890,000 | | | | 4,321 | | | | 18,574 | | | | — | | | | 7,216,278 | |
| PowerShares DB G10 Currency Harvest Fund | | | — | | | | 862,073 | | | | — | | | | — | | | | — | | | | — | | | | 819,828 | |
| Central Cash Management Fund | | | 772,008 | | | | 16,619,880 | | | | 16,610,210 | | | | — | | | | 525 | | | | — | | | | 781,678 | |
| Total | | | 59,335,522 | | | | 34,524,236 | | | | 21,587,255 | | | | (310,854 | ) | | | 591,603 | | | | 11,205 | | | | 70,345,617 | |
Information About Your Fund's Expenses (Unaudited)
As an investor of the Fund, you incur two types of costs: ongoing expenses and transaction costs. Ongoing expenses include management fees, distribution and service (12b-1) fees and other Fund expenses. Examples of transaction costs include contract charges and account maintenance fees, which are not shown in this section. The following tables are intended to help you understand your ongoing expenses (in dollars) of investing in the Fund and to help you compare these expenses with the ongoing expenses of investing in other mutual funds. In addition to the ongoing expenses which the Fund bears directly, the Fund's shareholders indirectly bear the expense of the Underlying Funds in which the Fund invests. These expenses are not included in the Fund's annualized expense ratios used to calculate the expense estimate in the tables. In the most recent six-month period, the Fund limited the ongoing expenses the Fund bears directly; had it not done so, expenses would have been higher. The examples in the table are based on an investment of $1,000 invested at the beginning of the six-month period and held for the entire period (January 1, 2013 to June 30, 2013).
The tables illustrate your Fund's expenses in two ways:
•Actual Fund Return. This helps you estimate the actual dollar amount of ongoing expenses (but not transaction costs) paid on a $1,000 investment in the Fund using the Fund's actual return during the period. To estimate the expenses you paid over the period, simply divide your account value by $1,000 (for example, an $8,600 account value divided by $1,000 = 8.6), then multiply the result by the number in the "Expenses Paid per $1,000" line under the share class you hold.
• Hypothetical 5% Fund Return. This helps you to compare your Fund's ongoing expenses (but not transaction costs) with those of other mutual funds using the Fund's actual expense ratio and a hypothetical rate of return of 5% per year before expenses. Examples using a 5% hypothetical Fund return may be found in the shareholder reports of other mutual funds. The hypothetical account values and expenses may not be used to estimate the actual ending account balance or expenses you paid for the period.
Please note that the expenses shown in these tables are meant to highlight your ongoing expenses only and do not reflect any transaction costs. The "Expenses Paid per $1,000" line of the tables is useful in comparing ongoing expenses only and will not help you determine the relative total expense of owning different funds. If these transaction costs had been included, your costs would have been higher.
Expenses and Value of a $1,000 Investment for the six months ended June 30, 2013 | |
| Actual Fund Return | | Class A | | | Class B | |
| Beginning Account Value 1/1/13 | | $ | 1,000.00 | | | $ | 1,000.00 | |
| Ending Account Value 6/30/13 | | $ | 980.00 | | | $ | 979.60 | |
| Expenses Paid per $1,000* | | $ | 1.23 | | | $ | 2.45 | |
| Hypothetical 5% Fund Return | | Class A | | | Class B | |
| Beginning Account Value 1/1/13 | | $ | 1,000.00 | | | $ | 1,000.00 | |
| Ending Account Value 6/30/13 | | $ | 1,023.55 | | | $ | 1,022.32 | |
| Expenses Paid per $1,000* | | $ | 1.25 | | | $ | 2.51 | |
* Expenses are equal to the Fund's annualized expense ratio for each share class, multiplied by the average account value over the period, multiplied by 181 (the number of days in the most recent six-month period), then divided by 365.
| Annualized Expense Ratios** | Class A | Class B |
| DWS Variable Series II — DWS Alternative Asset Allocation VIP | .25% | .50% |
** The Fund invests in other funds and indirectly bears its proportionate share of fees and expenses incurred by the Underlying Funds in which the Fund is invested. These ratios do not include these indirect fees and expenses.
For more information, please refer to the Fund's prospectus.
These tables do not reflect charges and fees ("contract charges") associated with the separate account that invests in the Fund or any variable life insurance policy or variable annuity contract for which the Fund is an investment option.
For an analysis of the fees associated with an investment in the Fund or similar funds, please refer to http://apps.finra.org/fundanalyzer/1/fa.aspx.
The Trust's policies and procedures for voting proxies for portfolio securities and information about how the Trust voted proxies related to its portfolio securities during the 12-month period ended June 30 are available on our Web site — www.dws-investments.com (click on "proxy voting" at the bottom of the page) — or on the SEC's Web site — www.sec.gov. To obtain a written copy of the Trust's policies and procedures without charge, upon request, call us toll free at (800) 728-3337.
Summary of Management Fee Evaluation by Independent Fee Consultant
September 17, 2012
Pursuant to an Order entered into by Deutsche Investment Management Americas and affiliates (collectively, "DeAM") with the Attorney General of New York, I, Thomas H. Mack, have been appointed the Independent Fee Consultant for the DWS Funds (formerly the DWS Scudder Funds). My duties include preparing an annual written evaluation of the management fees DeAM charges the Funds, considering among other factors the management fees charged by other mutual fund companies for like services, management fees DeAM charges other clients for like services, DeAM's costs of supplying services under the management agreements and related profit margins, possible economies of scale if a Fund grows larger, and the nature and quality of DeAM's services, including fund performance. This report summarizes my evaluation for 2012, including my qualifications, the evaluation process for each of the DWS Funds, consideration of certain complex-level factors, and my conclusions. I served in substantially the same capacity in 2007, 2008, 2009, 2010 and 2011.
Qualifications
For more than 35 years I have served in various professional capacities within the investment management business. I have held investment analysis and advisory positions, including securities analyst, portfolio strategist and director of investment policy with a large investment firm. I have also performed business management functions, including business development, financial management and marketing research and analysis.
Since 1991, I have been an independent consultant within the asset management industry. I have provided services to over 125 client organizations, including investment managers, mutual fund boards, product distributors and related organizations. Over the past ten years I have completed a number of assignments for mutual fund boards, specifically including assisting boards with management contract renewal.
I hold a Master of Business Administration degree, with highest honors, from Harvard University and Master of Science and Bachelor of Science (highest honors) degrees from the University of California at Berkeley. I am an independent director and audit committee financial expert for two closed-end mutual funds and have served in various leadership and financial oversight capacities with non-profit organizations.
Evaluation of Fees for each DWS Fund
My work focused primarily on evaluating, fund-by-fund, the fees charged to each of the 103 mutual fund portfolios in the DWS Fund family. For each Fund, I considered each of the key factors mentioned above, as well as any other relevant information. In doing so I worked closely with the Funds' Independent Directors in their annual contract renewal process, as well as in their approval of contracts for several new funds (documented separately).
In evaluating each Fund's fees, I reviewed comprehensive materials provided by or on behalf of DeAM, including expense information prepared by Lipper Analytical, comparative performance information, profitability data, manager histories, and other materials. I also accessed certain additional information from the Lipper and Morningstar databases and drew on my industry knowledge and experience.
To facilitate evaluating this considerable body of information, I prepared for each Fund a document summarizing the key data elements in each area as well as additional analytics discussed below. This made it possible to consider each key data element in the context of the others.
In the course of contract renewal, DeAM agreed to implement a number of fee and expense adjustments requested by the Independent Directors which will favorably impact future fees and expenses, and my evaluation includes the effects of these changes.
Fees and Expenses Compared with Other Funds
The competitive fee and expense evaluation for each fund focused on two primary comparisons:
The Fund's contractual management fee (the advisory fee plus the administration fee where applicable) compared with those of a group of typically 12-15 funds in the same Lipper investment category (e.g. Large Capitalization Growth) having similar distribution arrangements and being of similar size.
The Fund's total expenses compared with a broader universe of funds from the same Lipper investment category and having similar distribution arrangements.
These two comparisons provide a view of not only the level of the fee compared with funds of similar scale but also the total expense the Fund bears for all the services it receives, in comparison with the investment choices available in the Fund's investment category and distribution channel. The principal figure-of-merit used in these comparisons was the subject Fund's percentile ranking against peers.
DeAM's Fees for Similar Services to Others
DeAM provided management fee schedules for all of its US domiciled fund and non-fund investment management accounts in any of the investment categories where there is a DWS Fund. These similar products included the other DWS Funds, non-fund pooled accounts, institutional accounts and sub-advisory accounts. Using this information, I calculated for each Fund the fee that would be charged to each similar product, at the subject Fund's asset level.
Evaluating information regarding non-fund products is difficult because there are varying levels of services required for different types of accounts, with mutual funds generally requiring considerably more regulatory and administrative types of service as well as having more frequent cash flows than other types of accounts. Also, while mutual fund fees for similar fund products can be expected to be similar, there will be some differences due to different pricing conditions in different distribution channels (e.g. retail funds versus those used in variable insurance products), differences in underlying investment processes and other factors.
Costs and Profit Margins
DeAM provided a detailed profitability analysis for each Fund. After making some adjustments so that the presentation would be more comparable to the available industry figures, I reviewed profit margins from investment management alone, from investment management plus other fund services (excluding distribution) provided to the Funds by DeAM (principally shareholder services), and DeAM profits from all sources, including distribution. A later section comments on overall profitability.
Economies of Scale
Economies of scale — an expected decline in management cost per dollar of fund assets as fund assets grow — are very rarely quantified and documented because of inherent difficulties in collecting and analyzing relevant data. However, in virtually every investment category that I reviewed, larger funds tend to have lower fees and lower total expenses than smaller funds. To see how each DWS Fund compares with this industry observation, I reviewed:
The trend in Fund assets over the last five years and the accompanying trend in total expenses. This shows if the Fund has grown and, if so, whether total expense (management fees as well as other expenses) have declined as a percent of assets.
Whether the Fund has break-points in its management fee schedule, the extent of the fee reduction built into the schedule and the asset levels where the breaks take effect, and in the case of a sub-advised Fund how the Fund's break-points compare with those of the sub-advisory fee schedule.
How the Fund's contractual fee schedule compares with trends in the industry data. To accomplish this, I constructed a chart showing how actual latest-fiscal-year contractual fees of the Fund and of other similar funds relate to average fund assets, with the subject Fund's contractual fee schedule superimposed.
Quality of Service — Performance
The quality-of-service evaluation focused on investment performance, which is the principal result of the investment management service. Each Fund's performance was reviewed over the past 1, 3, 5 and 10 years, as applicable, and compared with that of other funds in the same investment category and with a suitable market index.
In addition, I calculated and reviewed risk-adjusted returns relative to an index of similar mutual funds' returns and a suitable market index. The risk-adjusted returns analysis provides a way of determining the extent to which the Fund's return comparisons are mainly the product of investment value-added (or lack thereof) or alternatively taking considerably more or less risk than is typical in its investment category.
I also received and considered the history of portfolio manager changes for each Fund, as this provided an important context for evaluating the performance results.
Complex-Level Considerations
While this evaluation was conducted mainly at the individual fund level, there are some issues relating to the reasonableness of fees that can alternatively be considered across the whole fund complex:
I reviewed DeAM's profitability analysis for all DWS Funds, with a view toward determining if the allocation procedures used were reasonable and how profit levels compared with public data for other investment managers.
I considered whether DeAM and affiliates receive any significant ancillary or "fallout" benefits that should be considered in interpreting the direct profitability results. These would be situations where serving as the investment manager of the Funds is beneficial to another part of the Deutsche Bank organization.
I considered how aggregated DWS Fund expenses had varied over the years, by asset class and in the context of trends in asset levels.
I considered how aggregated DWS Fund performance measures relative to appropriate peers had varied by asset class and over time.
I reviewed the structure of the DeAM organization, trends in staffing levels, and information on compensation of investment management and other professionals compared with industry data.
Findings
Based on the process and analysis discussed above, which included reviewing a wide range of information from management and external data sources and considering among other factors the fees DeAM charges other clients, the fees charged by other fund managers, DeAM's costs and profits associated with managing the Funds, economies of scale, possible fall-out benefits, and the nature and quality of services provided, in my opinion the management fees charged the DWS Funds are reasonable.
Thomas H. Mack
President, Thomas H. Mack & Co., Inc.
DWS Investments Distributors, Inc.
222 South Riverside Plaza
Chicago, IL 60606
(800) 621-1148
VS2AAA-3 (R-028379-2 8/13)
JUNE 30, 2013
SEMIANNUAL REPORT
DWS VARIABLE SERIES II
DWS Diversified International Equity VIP
(On July 12, 2013, DWS Diversified International Equity VIP
was renamed DWS Global Equity VIP)
Contents
15 Statement of Assets and Liabilities 16 Statement of Operations 17 Statement of Changes in Net Assets 20 Notes to Financial Statements 25 Information About Your Fund's Expenses 27 Summary of Management Fee Evaluation by Independent Fee Consultant |
This report must be preceded or accompanied by a prospectus. To obtain an additional prospectus or summary prospectus, if available, call (800) 728-3337 or your financial representative. We advise you to consider the Fund's objectives, risks, charges and expenses carefully before investing. The summary prospectus and prospectus contain this and other important information about the Fund. Please read the prospectus carefully before you invest.
Investing in derivatives entails special risks relating to liquidity, leverage and credit that may reduce returns and/or increase volatility. Investing in foreign securities, particularly those of emerging markets, presents certain risks, such as currency fluctuations, political and economic changes, and market risks. The Fund may lend securities to approved institutions. Stocks may decline in value. See the prospectus for details.
DWS Investments is part of the Deutsche Asset & Wealth Management division of Deutsche Bank AG.
NOT FDIC/NCUA INSURED NO BANK GUARANTEE MAY LOSE VALUE NOT A DEPOSIT
NOT INSURED BY ANY FEDERAL GOVERNMENT AGENCY
Performance Summary June 30, 2013 (Unaudited)
Fund performance shown is historical, assumes reinvestment of all dividend and capital gain distributions and does not guarantee future results. Investment return and principal value fluctuate with changing market conditions so that, when redeemed, shares may be worth more or less than their original cost. Current performance may be lower or higher than the performance data quoted. Please contact your participating insurance company for the Fund's most recent month-end performance. Performance doesn't reflect charges and fees ("contract charges") associated with the separate account that invests in the Fund or any variable life insurance policy or variable annuity contract for which the Fund is an investment option. These charges and fees will reduce returns.
The gross expense ratio of the Fund, as stated in the fee table of the prospectus dated May 1, 2013 is 1.06% for Class A shares and may differ from the expense ratio disclosed in the Financial Highlights table in this report.
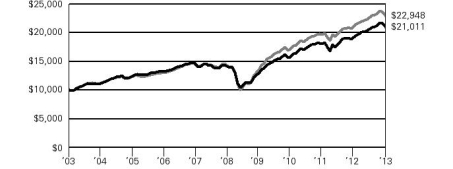
| Growth of an Assumed $10,000 Investment in DWS Diversified International Equity VIP |
| The MSCI AC World Index is a free float-adjusted market capitalization weighted index that is designed to measure the equity market performance of developed and emerging markets. The index consists of 45 country indices comprising 24 developed and 21 emerging market country indices. On July 12, 2013 the MSCI AC World Index replaced the MSCI EAFE Index as the fund's benchmark index because the Advisor believes that it more accurately reflects the fund's investment strategy. The MSCI EAFE Index is an unmanaged index that tracks international stock performance in the 22 developed markets of Europe, Australasia and the Far East. Returns reflect reinvestment of dividends net of withholding taxes. The index is calculated using closing local market prices and translates into U.S. dollars using the London close foreign exchange rates. Index returns do not reflect any fees or expenses and it is not possible to invest directly into an index. |
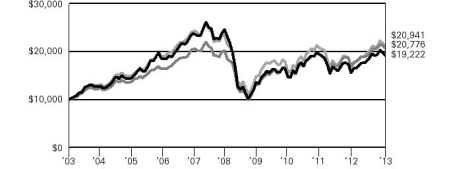 | |
| Yearly periods ended June 30 | |
| Comparative Results | |
| DWS Diversified International Equity VIP | | 6-Month‡ | | | 1-Year | | | 3-Year | | | 5-Year | | | 10-Year | |
| Class A | Growth of $10,000 | | $ | 10,245 | | | $ | 11,684 | | | $ | 13,161 | | | $ | 8,262 | | | $ | 19,222 | |
| Average annual total return | | | 2.45 | % | | | 16.84 | % | | | 9.59 | % | | | -3.75 | % | | | 6.75 | % |
| MSCI AC World Index | Growth of $10,000 | | $ | 10,605 | | | $ | 11,657 | | | $ | 14,186 | | | $ | 11,205 | | | $ | 20,776 | |
| Average annual total return | | | 6.05 | % | | | 16.57 | % | | | 12.36 | % | | | 2.30 | % | | | 7.59 | % |
| MSCI EAFE Index | Growth of $10,000 | | $ | 10,410 | | | $ | 11,862 | | | $ | 13,325 | | | $ | 9,688 | | | $ | 20,941 | |
| Average annual total return | | | 4.10 | % | | | 18.62 | % | | | 10.04 | % | | | -0.63 | % | | | 7.67 | % |
The growth of $10,000 is cumulative.
‡ Total returns shown for periods less than one year are not annualized.
Portfolio Summary (Unaudited) Asset Allocation (As a % of Investment Portfolio excluding Securities Lending Collateral) | 6/30/13 | 12/31/12 |
| | | |
| Common Stocks | 91% | 88% |
| Exchange-Traded Funds | 8% | 10% |
| Cash Equivalents | 1% | 2% |
| Preferred Stocks | 0% | 0% |
| | 100% | 100% |
Sector Diversification (As a % of Common and Preferred Stocks) | 6/30/13 | 12/31/12 |
| | | |
| Telecommunication Services | 15% | 15% |
| Financials | 12% | 13% |
| Health Care | 12% | 12% |
| Consumer Staples | 12% | 12% |
| Materials | 9% | 9% |
| Utilities | 9% | 8% |
| Industrials | 9% | 8% |
| Information Technology | 8% | 12% |
| Consumer Discretionary | 8% | 7% |
| Energy | 6% | 4% |
| | 100% | 100% |
Geographical Diversification
(As a % of Investment Portfolio excluding Cash Equivalents and Securities Lending Collateral) | 6/30/13 | 12/31/12 |
| | | |
| Continental Europe | 43% | 54% |
| Japan | 19% | 12% |
| Emerging Markets | 9% | 10% |
| Australia | 9% | 4% |
| Asia (excluding Japan) | 8% | 6% |
| Canada | 6% | 7% |
| United Kingdom | 6% | 7% |
| | 100% | 100% |
Portfolio holdings and characteristics are subject to change.
For more complete details about the Fund's investment portfolio, see page 5.
Following the Fund's fiscal first and third quarter-end, a complete portfolio holdings listing is filed with the SEC on Form N-Q. The form will be available on the SEC's Web site at www.sec.gov, and it also may be reviewed and copied at the SEC's Public Reference Room in Washington, D.C. Information on the operation of the SEC's Public Reference Room may be obtained by calling (800) SEC-0330. The Fund's portfolio holdings are also posted on www.dws-investments.com from time to time. Please see the Fund's current prospectus for more information.
Effective July 12, 2013, QS Investors no longer serves as subadvisor to the fund and day-to-day portfolio management of the fund transitioned to Deutsche Investment Management Americas Inc.
The new portfolio management team for the fund is as follows:
Nils E. Ernst, PhD
Martin Berberich, CFA
Sebastian P. Werner, PhD
Portfolio Managers, Deutsche Investment Management Americas Inc.
Investment Portfolio June 30, 2013 (Unaudited) | | | Shares | | | Value ($) | |
| | | | |
| Common Stocks 89.7% | |
| Australia 8.5% | |
| AGL Energy Ltd. | | | 26,092 | | | | 344,212 | |
| ALS Ltd. | | | 6,039 | | | | 52,452 | |
| Amcor Ltd. | | | 5,214 | | | | 48,167 | |
| APA Group | | | 41,176 | | | | 224,685 | |
| Asciano Ltd. | | | 18,887 | | | | 86,234 | |
| Aurizon Holdings Ltd. | | | 33,963 | | | | 128,585 | |
| Australia & New Zealand Banking Group Ltd. | | | 4,297 | | | | 111,532 | |
| BHP Billiton Ltd. | | | 9,023 | | | | 260,000 | |
| Brambles Ltd. | | | 23,983 | | | | 204,106 | |
| Caltex Australia Ltd. | | | 1,905 | | | | 31,291 | |
| Coca-Cola Amatil Ltd. | | | 4,702 | | | | 54,449 | |
| Cochlear Ltd. | | | 1,084 | | | | 60,831 | |
| Commonwealth Bank of Australia | | | 2,423 | | | | 152,301 | |
| Crown Ltd. | | | 18,867 | | | | 207,140 | |
| CSL Ltd. | | | 8,443 | | | | 475,491 | |
| Echo Entertainment Group Ltd. | | | 38,367 | | | | 107,139 | |
| Flight Centre Ltd. | | | 2,840 | | | | 101,427 | |
| Harvey Norman Holdings Ltd. | | | 27,391 | | | | 63,431 | |
| Leighton Holdings Ltd. | | | 3,250 | | | | 45,479 | |
| National Australia Bank Ltd. | | | 3,728 | | | | 100,431 | |
| Newcrest Mining Ltd. | | | 1,231 | | | | 11,056 | |
| Origin Energy Ltd. | | | 10,739 | | | | 122,893 | |
| QBE Insurance Group Ltd. | | | 2,452 | | | | 33,841 | |
| Ramsay Health Care Ltd. | | | 2,434 | | | | 79,539 | |
| Rio Tinto Ltd. | | | 1,738 | | | | 82,551 | |
| Santos Ltd. | | | 10,058 | | | | 114,908 | |
| Seek Ltd. | | | 5,723 | | | | 47,201 | |
| Sonic Healthcare Ltd. | | | 6,672 | | | | 90,371 | |
| SP AusNet | | | 77,545 | | | | 82,964 | |
| TABCORP Holdings Ltd. | | | 40,735 | | | | 113,053 | |
| Tatts Group Ltd. | | | 68,369 | | | | 197,610 | |
| Telstra Corp., Ltd. | | | 151,878 | | | | 661,205 | |
| Toll Holdings Ltd. | | | 15,282 | | | | 73,975 | |
| Transurban Group | | | 21,758 | | | | 134,217 | |
| Treasury Wine Estates Ltd. | | | 5,945 | | | | 31,559 | |
| Wesfarmers Ltd. | | | 7,527 | | | | 271,483 | |
| Westfield Group (REIT) (Units) | | | 2,462 | | | | 25,682 | |
| Westpac Banking Corp. | | | 4,868 | | | | 127,441 | |
| Woodside Petroleum Ltd. | | | 6,007 | | | | 191,187 | |
| Woolworths Ltd. | | | 9,063 | | | | 270,904 | |
| WorleyParsons Ltd. | | | 2,453 | | | | 43,374 | |
| (Cost $5,120,196) | | | | 5,666,397 | |
| Austria 0.5% | |
| Erste Group Bank AG | | | 6,505 | | | | 173,199 | |
| Immofinanz AG* | | | 21,199 | | | | 79,160 | |
| Raiffeisen Bank International AG | | | 1,218 | | | | 35,489 | |
| Vienna Insurance Group AG Wiener Versicherung Gruppe | | | 1,323 | | | | 61,260 | |
| (Cost $278,022) | | | | 349,108 | |
| Belgium 1.5% | |
| Ageas | | | 3,963 | | | | 138,503 | |
| Anheuser-Busch InBev NV | | | 3,560 | | | | 315,826 | |
| Delhaize Group | | | 593 | | | | 36,450 | |
| Groupe Bruxelles Lambert SA | | | 1,509 | | | | 113,949 | |
| KBC Groep NV | | | 3,926 | | | | 145,212 | |
| | | Shares | | | Value ($) | |
| | | | | | | | | |
| Solvay SA | | | 1,060 | | | | 138,670 | |
| Umicore SA | | | 2,235 | | | | 92,843 | |
| (Cost $558,526) | | | | 981,453 | |
| Bermuda 0.2% | |
| Seadrill Ltd. (Cost $58,313) | | | 3,256 | | | | 131,333 | |
| Canada 5.8% | |
| Agrium, Inc. | | | 400 | | | | 34,679 | |
| Alimentation Couche-Tard, Inc. "B" | | | 1,500 | | | | 88,999 | |
| Atco Ltd. "I" | | | 1,800 | | | | 74,263 | |
| Bank of Montreal | | | 800 | | | | 46,401 | |
| Bank of Nova Scotia | | | 1,100 | | | | 58,802 | |
| Barrick Gold Corp. | | | 3,500 | | | | 55,244 | |
| BCE, Inc. | | | 3,000 | | | | 123,001 | |
| Bell Aliant, Inc. | | | 1,400 | | | | 37,619 | |
| Bombardier, Inc. "B" | | | 6,500 | | | | 28,925 | |
| Brookfield Asset Management, Inc. "A" | | | 1,000 | | | | 35,942 | |
| Canadian Imperial Bank of Commerce | | | 500 | | | | 35,485 | |
| Canadian National Railway Co. | | | 1,300 | | | | 126,576 | |
| Canadian Natural Resources Ltd. | | | 1,400 | | | | 39,469 | |
| Canadian Pacific Railway Ltd. | | | 500 | | | | 60,630 | |
| Canadian Tire Corp., Ltd. "A" | | | 500 | | | | 37,644 | |
| Canadian Utilities Ltd. "A" | | | 3,000 | | | | 105,287 | |
| Cenovus Energy, Inc. | | | 2,000 | | | | 57,050 | |
| CGI Group, Inc. "A"* | | | 4,900 | | | | 143,501 | |
| Empire Co., Ltd. "A" | | | 500 | | | | 38,233 | |
| Enbridge, Inc. | | | 1,400 | | | | 58,851 | |
| First Quantum Minerals Ltd. | | | 2,300 | | | | 34,116 | |
| Fortis, Inc. | | | 4,600 | | | | 140,795 | |
| George Weston Ltd. | | | 700 | | | | 55,730 | |
| Gildan Activewear, Inc. | | | 800 | | | | 32,443 | |
| Goldcorp, Inc. | | | 2,900 | | | | 72,024 | |
| Loblaw Companies Ltd. | | | 1,000 | | | | 45,212 | |
| Magna International, Inc. "A" | | | 1,106 | | | | 78,725 | |
| Manulife Financial Corp. | | | 2,600 | | | | 41,607 | |
| Metro, Inc. "A" | | | 900 | | | | 60,314 | |
| National Bank of Canada | | | 400 | | | | 28,540 | |
| Open Text Corp. | | | 1,600 | | | | 109,385 | |
| Potash Corp. of Saskatchewan, Inc. | | | 2,800 | | | | 106,814 | |
| Research In Motion Ltd.* | | | 10,800 | | | | 113,781 | |
| Rogers Communications, Inc. "B" | | | 4,100 | | | | 160,616 | |
| Royal Bank of Canada | | | 1,300 | | | | 75,748 | |
| Saputo, Inc. | | | 1,300 | | | | 59,753 | |
| Shaw Communications, Inc. "B" | | | 2,400 | | | | 57,598 | |
| Shoppers Drug Mart Corp. | | | 2,000 | | | | 92,270 | |
| Silver Wheaton Corp. | | | 1,100 | | | | 21,557 | |
| SNC-Lavalin Group, Inc. | | | 600 | | | | 25,347 | |
| Sun Life Financial, Inc. | | | 1,000 | | | | 29,619 | |
| Suncor Energy, Inc. | | | 2,020 | | | | 59,542 | |
| Teck Resources Ltd. "B" | | | 1,200 | | | | 25,638 | |
| Telus Corp. | | | 2,300 | | | | 67,139 | |
| Thomson Reuters Corp. (a) | | | 800 | | | | 26,106 | |
| Thomson Reuters Corp. (a) | | | 1,158 | | | | 37,716 | |
| Tim Hortons, Inc. | | | 1,000 | | | | 54,084 | |
| Toronto-Dominion Bank | | | 900 | | | | 72,286 | |
| TransAlta Corp. | | | 6,800 | | | | 93,171 | |
| TransCanada Corp. | | | 1,400 | | | | 60,276 | |
| Valeant Pharmaceuticals International, Inc.* | | | 7,400 | | | | 638,045 | |
| | | Shares | | | Value ($) | |
| | | | | | | | | |
| Yamana Gold, Inc. | | | 1,100 | | | | 10,491 | |
| (Cost $2,833,489) | | | | 3,873,089 | |
| Denmark 2.7% | |
| A P Moller-Maersk AS "A" | | | 7 | | | | 47,150 | |
| A P Moller-Maersk AS "B" | | | 18 | | | | 128,757 | |
| Carlsberg AS "B" | | | 4,293 | | | | 383,177 | |
| Coloplast AS "B" | | | 1,265 | | | | 70,803 | |
| Danske Bank AS* | | | 16,394 | | | | 279,094 | |
| DSV AS | | | 2,622 | | | | 63,737 | |
| Novo Nordisk AS "B" | | | 4,250 | | | | 661,672 | |
| Novozymes AS "B" | | | 2,348 | | | | 75,107 | |
| Tryg AS | | | 621 | | | | 51,081 | |
| William Demant Holding AS* | | | 291 | | | | 24,061 | |
| (Cost $1,394,141) | | | | 1,784,639 | |
| Finland 2.1% | |
| Kone Oyj "B" | | | 1,396 | | | | 110,663 | |
| Metso Corp. | | | 1,104 | | | | 37,407 | |
| Nokia Oyj* | | | 110,035 | | | | 409,863 | |
| Pohjola Bank PLC "A" | | | 3,258 | | | | 47,924 | |
| Sampo Oyj "A" | | | 8,693 | | | | 337,359 | |
| Stora Enso Oyj "R" | | | 23,027 | | | | 153,443 | |
| UPM-Kymmene Oyj | | | 20,179 | | | | 196,809 | |
| Wartsila Oyj | | | 1,559 | | | | 67,539 | |
| (Cost $868,260) | | | | 1,361,007 | |
| France 5.4% | |
| Air Liquide SA | | | 2,121 | | | | 260,929 | |
| Arkema | | | 421 | | | | 38,440 | |
| AtoS | | | 697 | | | | 51,731 | |
| AXA SA | | | 4,348 | | | | 85,431 | |
| BNP Paribas SA | | | 2,000 | | | | 109,274 | |
| Cap Gemini | | | 2,014 | | | | 97,914 | |
| Carrefour SA | | | 1,290 | | | | 35,243 | |
| Cie de St-Gobain | | | 755 | | | | 30,390 | |
| Cie Generale des Etablissements Michelin | | | 539 | | | | 47,953 | |
| DANONE SA | | | 1,275 | | | | 95,626 | |
| Dassault Systemes SA | | | 830 | | | | 101,533 | |
| Electricite de France | | | 2,181 | | | | 50,608 | |
| Essilor International SA | | | 1,351 | | | | 143,654 | |
| European Aeronautic Defence & Space Co. | | | 971 | | | | 51,633 | |
| France Telecom SA | | | 16,498 | | | | 155,364 | |
| GDF Suez | | | 12,916 | | | | 251,840 | |
| Iliad SA | | | 261 | | | | 56,312 | |
| L'Oreal SA | | | 574 | | | | 93,850 | |
| Lafarge SA | | | 1,520 | | | | 92,973 | |
| LVMH Moet Hennessy Louis Vuitton SA | | | 420 | | | | 67,635 | |
| Pernod-Ricard SA | | | 585 | | | | 64,840 | |
| Renault SA | | | 494 | | | | 33,001 | |
| Sanofi | | | 7,030 | | | | 724,491 | |
| Schneider Electric SA | | | 894 | | | | 64,453 | |
| Societe Generale | | | 1,549 | | | | 52,745 | |
| Suez Environnement Co. | | | 1,869 | | | | 24,064 | |
| Technip SA | | | 427 | | | | 43,157 | |
| Total SA | | | 6,625 | | | | 323,064 | |
| Unibail-Rodamco SE (REIT) | | | 265 | | | | 61,446 | |
| Veolia Environnement | | | 4,218 | | | | 47,784 | |
| Vinci SA | | | 944 | | | | 47,095 | |
| Vivendi | | | 10,503 | | | | 197,937 | |
| (Cost $3,045,629) | | | | 3,602,410 | |
| | | Shares | | | Value ($) | |
| | | | | | | | | |
| Germany 3.6% | |
| Adidas AG | | | 324 | | | | 35,019 | |
| Allianz SE (Registered) | | | 1,642 | | | | 239,798 | |
| BASF SE | | | 1,618 | | | | 144,509 | |
| Bayer AG (Registered) | | | 1,611 | | | | 171,743 | |
| Bayerische Motoren Werke (BMW) AG | | | 448 | | | | 39,140 | |
| Beiersdorf AG | | | 803 | | | | 70,017 | |
| Commerzbank AG* | | | 1,761 | | | | 15,348 | |
| Continental AG | | | 107 | | | | 14,257 | |
| Daimler AG (Registered) | | | 1,209 | | | | 73,074 | |
| Deutsche Boerse AG | | | 688 | | | | 45,292 | |
| Deutsche Post AG (Registered) | | | 2,615 | | | | 64,985 | |
| Deutsche Telekom AG (Registered) | | | 31,631 | | | | 368,931 | |
| E.ON AG | | | 14,726 | | | | 241,631 | |
| Fresenius Medical Care AG & Co. KGaA | | | 504 | | | | 35,707 | |
| Fresenius SE & Co. KGaA | | | 342 | | | | 42,154 | |
| GEA Group AG | | | 565 | | | | 19,980 | |
| Henkel AG & Co. KGaA | | | 790 | | | | 61,917 | |
| Infineon Technologies AG | | | 4,778 | | | | 39,976 | |
| Linde AG | | | 332 | | | | 61,820 | |
| Merck KGaA | | | 83 | | | | 12,623 | |
| Metro AG | | | 1,019 | | | | 32,216 | |
| Muenchener Rueckversicherungs-Gesellschaft AG (Registered) | | | 388 | | | | 71,247 | |
| RWE AG | | | 3,136 | | | | 100,064 | |
| SAP AG | | | 2,934 | | | | 214,845 | |
| Siemens AG (Registered) | | | 1,778 | | | | 179,654 | |
| (Cost $1,771,234) | | | | 2,395,947 | |
| Hong Kong 3.0% | |
| AIA Group Ltd. | | | 23,000 | | | | 96,659 | |
| Cathay Pacific Airways Ltd. | | | 15,000 | | | | 26,188 | |
| Cheung Kong (Holdings) Ltd. | | | 5,000 | | | | 67,574 | |
| Cheung Kong Infrastructure Holdings Ltd. | | | 14,000 | | | | 93,451 | |
| CLP Holdings Ltd. | | | 35,000 | | | | 282,589 | |
| Galaxy Entertainment Group Ltd.* | | | 12,000 | | | | 57,909 | |
| Hang Lung Properties Ltd. | | | 5,000 | | | | 17,359 | |
| Hang Seng Bank Ltd. | | | 2,200 | | | | 32,398 | |
| Hong Kong & China Gas Co., Ltd. | | | 121,394 | | | | 295,830 | |
| Hong Kong Exchanges & Clearing Ltd. | | | 3,500 | | | | 52,442 | |
| Hutchison Whampoa Ltd. | | | 31,000 | | �� | | 323,980 | |
| Li & Fung Ltd. | | | 36,000 | | | | 49,000 | |
| MTR Corp., Ltd. | | | 17,500 | | | | 64,066 | |
| Noble Group Ltd. | | | 51,363 | | | | 39,304 | |
| NWS Holdings Ltd. | | | 30,000 | | | | 45,638 | |
| Orient Overseas International Ltd. | | | 5,000 | | | | 32,027 | |
| Power Assets Holdings Ltd. | | | 28,500 | | | | 245,443 | |
| SJM Holdings Ltd. | | | 12,000 | | | | 28,907 | |
| Sun Hung Kai Properties Ltd. | | | 5,000 | | | | 64,285 | |
| Swire Pacific Ltd. "A" | | | 2,000 | | | | 23,953 | |
| Wharf Holdings Ltd. | | | 3,000 | | | | 24,978 | |
| (Cost $1,549,024) | | | | 1,963,980 | |
| Ireland 1.2% | |
| CRH PLC (a) | | | 20,956 | | | | 424,688 | |
| CRH PLC (a) | | | 12,486 | | | | 252,696 | |
| Experian PLC | | | 1,159 | | | | 20,102 | |
| Shire PLC | | | 2,843 | | | | 90,189 | |
| (Cost $634,166) | | | | 787,675 | |
| | | Shares | | | Value ($) | |
| | | | | | | | | |
| Italy 3.0% | |
| Assicurazioni Generali SpA | | | 6,464 | | | | 112,801 | |
| Atlantia SpA | | | 5,462 | | | | 88,722 | |
| Enel Green Power SpA | | | 16,188 | | | | 33,582 | |
| Enel SpA (b) | | | 58,620 | | | | 183,760 | |
| Eni SpA | | | 12,656 | | | | 260,013 | |
| Fiat Industrial SpA | | | 11,866 | | | | 132,183 | |
| Fiat SpA* | | | 19,601 | | | | 135,846 | |
| Finmeccanica SpA* | | | 3,437 | | | | 17,121 | |
| Intesa Sanpaolo | | | 70,157 | | | | 112,260 | |
| Luxottica Group SpA | | | 3,208 | | | | 161,502 | |
| Pirelli & C. SpA | | | 5,969 | | | | 68,803 | |
| Prysmian SpA | | | 3,776 | | | | 70,206 | |
| Saipem SpA | | | 1,195 | | | | 19,335 | |
| Snam SpA | | | 16,191 | | | | 73,724 | |
| Telecom Italia SpA | | | 369,240 | | | | 256,458 | |
| Telecom Italia SpA (RSP) | | | 230,121 | | | | 127,160 | |
| Terna — Rete Elettrica Nationale SpA | | | 14,939 | | | | 62,070 | |
| UniCredit SpA | | | 21,088 | | | | 98,611 | |
| (Cost $1,957,857) | | | | 2,014,157 | |
| Japan 18.8% | |
| AEON Co., Ltd. | | | 5,200 | | | | 68,270 | |
| Ajinomoto Co., Inc. | | | 6,000 | | | | 88,089 | |
| Alfresa Holdings Corp. | | | 500 | | | | 26,771 | |
| Asahi Group Holdings Ltd. | | | 3,400 | | | | 84,542 | |
| Asahi Kasei Corp. | | | 15,000 | | | | 99,226 | |
| Astellas Pharma, Inc. | | | 4,800 | | | | 261,394 | |
| Bridgestone Corp. | | | 2,000 | | | | 68,170 | |
| Canon, Inc. | | | 5,100 | | | | 167,503 | |
| Central Japan Railway Co. | | | 300 | | | | 36,789 | |
| Chubu Electric Power Co., Inc. | | | 13,200 | | | | 187,141 | |
| Chugai Pharmaceutical Co., Ltd. | | | 2,300 | | | | 47,683 | |
| Chugoku Electric Power Co., Inc. | | | 6,300 | | | | 99,204 | |
| Cosmo Oil Co., Ltd.* | | | 28,000 | | | | 51,667 | |
| Dai-ichi Life Insurance Co., Ltd. | | | 16 | | | | 23,158 | |
| Daiichi Sankyo Co., Ltd. | | | 5,800 | | | | 96,852 | |
| Dainippon Sumitomo Pharma Co., Ltd. | | | 1,800 | | | | 23,796 | |
| Daiwa House Industry Co., Ltd. | | | 2,000 | | | | 37,331 | |
| Daiwa Securities Group, Inc. | | | 3,000 | | | | 25,202 | |
| Denso Corp. | | | 800 | | | | 37,521 | |
| East Japan Railway Co. | | | 1,300 | | | | 101,069 | |
| Eisai Co., Ltd. | | | 2,100 | | | | 85,653 | |
| Electric Power Development Co., Ltd. | | | 2,900 | | | | 90,501 | |
| FANUC Corp. | | | 600 | | | | 87,004 | |
| Fast Retailing Co., Ltd. | | | 100 | | | | 33,732 | |
| Fuji Heavy Industries Ltd. | | | 2,000 | | | | 49,316 | |
| FUJIFILM Holdings Corp. | | | 1,200 | | | | 26,441 | |
| Fujitsu Ltd. | | | 11,000 | | | | 45,478 | |
| Hisamitsu Pharmaceutical Co., Inc. | | | 700 | | | | 35,660 | |
| Hitachi Ltd. | | | 22,000 | | | | 141,322 | |
| Hokkaido Electric Power Co., Inc.* | | | 4,400 | | | | 59,736 | |
| Hokuriku Electric Power Co. | | | 2,800 | | | | 44,074 | |
| Honda Motor Co., Ltd. | | | 4,600 | | | | 170,938 | |
| HOYA Corp. | | | 1,400 | | | | 28,726 | |
| Idemitsu Kosan Co., Ltd. | | | 1,200 | | | | 92,323 | |
| INPEX Corp. | | | 84 | | | | 351,168 | |
| ITOCHU Corp. | | | 5,800 | | | | 66,969 | |
| Japan Petroleum Exploration Co., Ltd. | | | 1,600 | | | | 64,938 | |
| | | Shares | | | Value ($) | |
| | | | | | | | | |
| Japan Tobacco, Inc. | | | 10,600 | | | | 374,641 | |
| JFE Holdings, Inc. | | | 3,900 | | | | 85,620 | |
| JSR Corp. | | | 2,900 | | | | 58,663 | |
| JX Holdings, Inc. | | | 87,920 | | | | 426,438 | |
| Kansai Electric Power Co., Inc.* | | | 15,900 | | | | 218,359 | |
| Kao Corp. | | | 4,500 | | | | 153,141 | |
| KDDI Corp. | | | 6,800 | | | | 353,813 | |
| Keyence Corp. | | | 310 | | | | 98,937 | |
| Kikkoman Corp. | | | 2,000 | | | | 33,276 | |
| Kirin Holdings Co., Ltd. | | | 10,000 | | | | 157,056 | |
| Kobe Steel Ltd.* | | | 23,000 | | | | 28,528 | |
| Komatsu Ltd. | | | 3,300 | | | | 76,306 | |
| Kubota Corp. | | | 4,000 | | | | 58,071 | |
| Kuraray Co., Ltd. | | | 5,600 | | | | 78,607 | |
| Kyocera Corp. | | | 900 | | | | 91,615 | |
| Kyowa Hakko Kirin Co., Ltd. | | | 3,000 | | | | 33,942 | |
| Kyushu Electric Power Co., Inc.* | | | 9,500 | | | | 143,309 | |
| Lawson, Inc. | | | 500 | | | | 38,165 | |
| Marubeni Corp. | | | 9,000 | | | | 60,171 | |
| MEIJI Holdings Co., Ltd. | | | 500 | | | | 24,024 | |
| Miraca Holdings, Inc. | | | 500 | | | | 23,036 | |
| Mitsubishi Chemical Holdings Corp. | | | 6,500 | | | | 30,544 | |
| Mitsubishi Corp. | | | 5,200 | | | | 89,088 | |
| Mitsubishi Electric Corp. | | | 7,000 | | | | 65,579 | |
| Mitsubishi Estate Co., Ltd. | | | 3,000 | | | | 79,899 | |
| Mitsubishi Heavy Industries Ltd. | | | 10,000 | | | | 55,563 | |
| Mitsubishi Materials Corp. | | | 11,000 | | | | 38,712 | |
| Mitsubishi Tanabe Pharma Corp. | | | 2,200 | | | | 28,564 | |
| Mitsubishi UFJ Financial Group, Inc. | | | 30,600 | | | | 189,887 | |
| Mitsui & Co., Ltd. | | | 6,600 | | | | 82,925 | |
| Mitsui Fudosan Co., Ltd. | | | 2,000 | | | | 58,834 | |
| Mizuho Financial Group, Inc. | | | 51,100 | | | | 106,358 | |
| MS&AD Insurance Group Holdings, Inc. | | | 1,300 | | | | 33,062 | |
| Murata Manufacturing Co., Ltd. | | | 1,000 | | | | 76,133 | |
| Nintendo Co., Ltd. | | | 500 | | | | 58,989 | |
| Nippon Meat Packers, Inc. | | | 2,000 | | | | 30,594 | |
| Nippon Steel & Sumitomo Metal | | | 57,000 | | | | 154,046 | |
| Nippon Telegraph & Telephone Corp. | | | 5,409 | | | | 282,305 | |
| Nissan Motor Co., Ltd. | | | 7,500 | | | | 76,011 | |
| Nisshin Seifun Group, Inc. | | | 3,000 | | | | 35,938 | |
| Nissin Foods Holdings Co., Ltd. | | | 700 | | | | 28,339 | |
| Nitto Denko Corp. | | | 1,600 | | | | 102,937 | |
| Nomura Holdings, Inc. | | | 8,800 | | | | 65,211 | |
| NTT DoCoMo, Inc. | | | 187 | | | | 290,569 | |
| Olympus Corp.* | | | 1,900 | | | | 57,768 | |
| OMRON Corp. | | | 1,600 | | | | 47,744 | |
| Ono Pharmaceutical Co., Ltd. | | | 700 | | | | 47,503 | |
| ORIX Corp. | | | 2,000 | | | | 27,331 | |
| Osaka Gas Co., Ltd. | | | 48,000 | | | | 203,163 | |
| Otsuka Holdings KK | | | 4,600 | | | | 151,903 | |
| Panasonic Corp.* | | | 3,100 | | | | 24,915 | |
| Resona Holdings, Inc. | | | 6,900 | | | | 33,607 | |
| Ricoh Co., Ltd. | | | 4,000 | | | | 47,599 | |
| Santen Pharmaceutical Co., Ltd. | | | 700 | | | | 30,195 | |
| Seven & I Holdings Co., Ltd. | | | 7,700 | | | | 281,479 | |
| Shikoku Electric Power Co., Inc.* | | | 4,200 | | | | 76,069 | |
| Shin-Etsu Chemical Co., Ltd. | | | 3,300 | | | | 218,965 | |
| Shionogi & Co., Ltd. | | | 3,900 | | | | 81,406 | |
| Shiseido Co., Ltd. | | | 3,500 | | | | 52,063 | |
| Showa Shell Sekiyu KK | | | 9,000 | | | | 74,055 | |
| SMC Corp. | | | 300 | | | | 60,419 | |
| | | Shares | | | Value ($) | |
| | | | | | | | | |
| SOFTBANK Corp. | | | 12,100 | | | | 706,500 | |
| Sony Corp. | | | 1,300 | | | | 27,506 | |
| Sumitomo Chemical Co., Ltd. | | | 6,000 | | | | 18,878 | |
| Sumitomo Corp. | | | 5,100 | | | | 63,616 | |
| Sumitomo Metal Mining Co., Ltd. | | | 5,000 | | | | 55,765 | |
| Sumitomo Mitsui Financial Group, Inc. | | | 3,200 | | | | 146,828 | |
| Sumitomo Mitsui Trust Holdings, Inc. | | | 7,410 | | | | 34,597 | |
| Sumitomo Realty & Development Co., Ltd. | | | 1,000 | | | | 39,883 | |
| Suzuken Co., Ltd. | | | 900 | | | | 30,310 | |
| Sysmex Corp. | | | 1,000 | | | | 65,444 | |
| Takeda Pharmaceutical Co., Ltd. | | | 8,300 | | | | 375,620 | |
| Terumo Corp. | | | 1,400 | | | | 69,670 | |
| Toho Gas Co., Ltd. | | | 7,000 | | | | 36,209 | |
| Tohoku Electric Power Co., Inc.* | | | 10,000 | | | | 125,255 | |
| Tokio Marine Holdings, Inc. | | | 1,400 | | | | 44,400 | |
| Tokyo Electric Power Co., Inc.* | | | 31,100 | | | | 160,649 | |
| Tokyo Electron Ltd. | | | 1,000 | | | | 50,622 | |
| Tokyo Gas Co., Ltd. | | | 57,000 | | | | 315,469 | |
| TonenGeneral Sekiyu KK | | | 15,000 | | | | 145,351 | |
| Toray Industries, Inc. | | | 15,000 | | | | 97,108 | |
| Toshiba Corp. | | | 21,000 | | | | 101,015 | |
| Toyo Suisan Kaisha Ltd. | | | 1,000 | | | | 33,330 | |
| Toyota Motor Corp. | | | 6,000 | | | | 362,288 | |
| Unicharm Corp. | | | 900 | | | | 50,911 | |
| Yahoo Japan Corp. | | | 90 | | | | 44,473 | |
| Yakult Honsha Co., Ltd. | | | 700 | | | | 29,010 | |
| (Cost $10,768,602) | | | | 12,528,053 | |
| Luxembourg 0.5% | |
| ArcelorMittal | | | 7,780 | | | | 86,723 | |
| Millicom International Cellular SA (SDR) | | | 2,289 | | | | 165,034 | |
| Tenaris SA | | | 1,718 | | | | 34,567 | |
| (Cost $296,693) | | | | 286,324 | |
| Macau 0.1% | |
| Sands China Ltd. | | | 11,200 | | | | 52,599 | |
| Wynn Macau Ltd. | | | 9,200 | | | | 24,775 | |
| (Cost $29,914) | | | | 77,374 | |
| Netherlands 5.1% | |
| AEGON NV | | | 13,027 | | | | 86,967 | |
| Akzo Nobel NV | | | 2,534 | | | | 142,338 | |
| ASML Holding NV | | | 6,883 | | | | 539,999 | |
| Corio NV (REIT) | | | 729 | | | | 28,905 | |
| DE Master Blenders 1753 NV* | | | 1,545 | | | | 24,735 | |
| Gemalto NV | | | 1,607 | | | | 145,502 | |
| Heineken Holding NV | | | 499 | | | | 27,952 | |
| Heineken NV | | | 780 | | | | 49,587 | |
| ING Groep NV (CVA)* | | | 27,123 | | | | 247,842 | |
| Koninklijke (Royal) KPN NV | | | 223,027 | | | | 461,262 | |
| Koninklijke Ahold NV | | | 4,171 | | | | 61,965 | |
| Koninklijke DSM NV | | | 1,774 | | | | 115,417 | |
| Koninklijke Philips NV | | | 5,110 | | | | 139,189 | |
| Koninklijke Vopak NV | | | 374 | | | | 22,052 | |
| Randstad Holding NV | | | 918 | | | | 37,485 | |
| Reed Elsevier NV | | | 15,755 | | | | 261,326 | |
| Royal Dutch Shell PLC "A" | | | 3,196 | | | | 101,988 | |
| Royal Dutch Shell PLC "B" | | | 2,331 | | | | 77,088 | |
| Unilever NV (CVA) | | | 4,999 | | | | 196,095 | |
| Wolters Kluwer NV | | | 7,591 | | | | 160,084 | |
| | | Shares | | | Value ($) | |
| | | | | | | | | |
| Ziggo NV | | | 11,865 | | | | 473,661 | |
| (Cost $2,716,360) | | | | 3,401,439 | |
| Norway 2.0% | |
| DnB ASA | | | 20,390 | | | | 294,569 | |
| Gjensidige Forsikring ASA | | | 5,213 | | | | 76,568 | |
| Norsk Hydro ASA | | | 39,308 | | | | 156,558 | |
| Statoil ASA | | | 8,217 | | | | 169,397 | |
| Telenor ASA | | | 17,773 | | | | 352,324 | |
| Yara International ASA | | | 7,548 | | | | 300,972 | |
| (Cost $880,800) | | | | 1,350,388 | |
| Singapore 4.1% | |
| CapitaLand Ltd. | | | 20,000 | | | | 48,310 | |
| ComfortDelGro Corp., Ltd. | | | 29,000 | | | | 41,730 | |
| DBS Group Holdings Ltd. | | | 8,000 | | | | 97,385 | |
| Genting Singapore PLC | | | 175,000 | | | | 181,500 | |
| Global Logistic Properties Ltd. | | | 17,000 | | | | 36,674 | |
| Golden Agri-Resources Ltd. | | | 381,000 | | | | 167,372 | |
| Hutchison Port Holdings Trust (Units) | | | 63,000 | | | | 46,302 | |
| Jardine Cycle & Carriage Ltd. | | | 3,000 | | | | 100,607 | |
| Keppel Corp., Ltd. | | | 15,400 | | | | 125,925 | |
| Olam International Ltd. (b) | | | 76,000 | | | | 98,162 | |
| Oversea-Chinese Banking Corp., Ltd. | | | 14,000 | | | | 109,923 | |
| SembCorp Industries Ltd. | | | 16,000 | | | | 62,178 | |
| SembCorp Marine Ltd. | | | 8,000 | | | | 27,117 | |
| Singapore Airlines Ltd. | | | 6,000 | | | | 47,998 | |
| Singapore Exchange Ltd. | | | 7,000 | | | | 38,651 | |
| Singapore Press Holdings Ltd. | | | 54,000 | | | | 177,261 | |
| Singapore Technologies Engineering Ltd. | | | 15,000 | | | | 49,343 | |
| Singapore Telecommunications Ltd. | | | 127,000 | | | | 376,100 | |
| Singapore Telecommunications Ltd. | | | 150,000 | | | | 443,682 | |
| StarHub Ltd. | | | 25,000 | | | | 82,439 | |
| United Overseas Bank Ltd. | | | 7,000 | | | | 109,191 | |
| Wilmar International Ltd. | | | 94,000 | | | | 232,594 | |
| (Cost $2,172,351) | | | | 2,700,444 | |
| Spain 3.7% | |
| Abertis Infraestructuras SA | | | 7,238 | | | | 125,713 | |
| ACS, Actividades de Construccion y Servicios SA | | | 2,511 | | | | 66,205 | |
| Amadeus IT Holding SA "A" | | | 12,463 | | | | 398,122 | |
| Banco Bilbao Vizcaya Argentaria SA | | | 12,973 | | | | 108,029 | |
| Banco Santander SA | | | 26,579 | | | | 168,269 | |
| Enagas SA | | | 2,258 | | | | 55,777 | |
| Ferrovial SA | | | 7,677 | | | | 122,648 | |
| Gas Natural SDG SA | | | 3,160 | | | | 63,449 | |
| Iberdrola SA | | | 38,478 | | | | 201,948 | |
| Inditex SA | | | 2,822 | | | | 348,101 | |
| Red Electrica Corporacion SA | | | 963 | | | | 52,819 | |
| Repsol SA | | | 17,632 | | | | 371,703 | |
| Telefonica SA* | | | 27,672 | | | | 356,059 | |
| Zardoya Otis SA | | | 3,050 | | | | 43,083 | |
| (Cost $1,933,844) | | | | 2,481,925 | |
| Sweden 5.4% | |
| Assa Abloy AB "B" | | | 1,207 | | | | 47,053 | |
| Atlas Copco AB "A" | | | 2,084 | | | | 50,050 | |
| Electrolux AB "B" | | | 1,087 | | | | 27,487 | |
| Elekta AB "B" | | | 12,323 | | | | 187,420 | |
| | | Shares | | | Value ($) | |
| | | | | | | | | |
| Getinge AB "B" | | | 6,438 | | | | 195,173 | |
| Hennes & Mauritz AB "B" | | | 5,804 | | | | 190,047 | |
| Hexagon AB "B" | | | 5,262 | | | | 140,337 | |
| Husqvarna AB "B" | | | 4,852 | | | | 25,528 | |
| Investor AB "B" | | | 3,056 | | | | 81,771 | |
| Nordea Bank AB | | | 10,270 | | | | 114,241 | |
| Sandvik AB | | | 3,095 | | | | 36,855 | |
| Skandinaviska Enskilda Banken AB "A" | | | 4,035 | | | | 38,389 | |
| Skanska AB "B" | | | 1,724 | | | | 28,488 | |
| SKF AB "B" | | | 1,279 | | | | 29,807 | |
| Svenska Cellulosa AB "B" | | | 22,492 | | | | 563,133 | |
| Svenska Handelsbanken AB "A" | | | 1,999 | | | | 79,930 | |
| Swedbank AB "A" | | | 2,795 | | | | 63,790 | |
| Swedish Match AB | | | 8,091 | | | | 286,043 | |
| Tele2 AB "B" | | | 12,231 | | | | 143,107 | |
| Telefonaktiebolaget LM Ericsson "B" | | | 62,244 | | | | 705,681 | |
| TeliaSonera AB | | | 81,015 | | | | 526,388 | |
| Volvo AB "B" | | | 2,677 | | | | 35,680 | |
| (Cost $3,070,182) | | | | 3,596,398 | |
| Switzerland 5.9% | |
| ABB Ltd. (Registered)* | | | 6,008 | | | | 129,706 | |
| Adecco SA (Registered)* | | | 407 | | | | 23,103 | |
| Aryzta AG* | | | 598 | | | | 33,532 | |
| Compagnie Financiere Richemont SA "A" | | | 1,918 | | | | 168,250 | |
| Credit Suisse Group AG (Registered) | | | 3,051 | | | | 80,890 | |
| Geberit AG (Registered) | | | 147 | | | | 36,394 | |
| Givaudan SA (Registered)* | | | 42 | | | | 54,235 | |
| Glencore Xstrata PLC | | | 25,800 | | | | 107,327 | |
| Holcim Ltd. (Registered)* | | | 980 | | | | 68,387 | |
| Nestle SA (Registered) | | | 12,515 | | | | 818,562 | |
| Novartis AG (Registered) | | | 5,844 | | | | 414,161 | |
| Roche Holding AG (Genusschein) | | | 1,812 | | | | 448,985 | |
| SGS SA (Registered) | | | 29 | | | | 62,152 | |
| Sika AG (Bearer) | | | 9 | | | | 23,237 | |
| STMicroelectronics NV | | | 8,506 | | | | 76,068 | |
| Swatch Group AG (Bearer) | | | 87 | | | | 47,668 | |
| Swiss Re AG.* | | | 723 | | | | 53,557 | |
| Swisscom AG (Registered) | | | 2,001 | | | | 874,439 | |
| Syngenta AG (Registered) | | | 395 | | | | 154,045 | |
| UBS AG (Registered)* | | | 5,885 | | | | 99,976 | |
| Wolseley PLC | | | 878 | | | | 40,636 | |
| Zurich Insurance Group AG* | | | 398 | | | | 103,145 | |
| (Cost $2,158,091) | | | | 3,918,455 | |
| United Kingdom 6.2% | |
| Anglo American PLC | | | 4,058 | | | | 78,415 | |
| ARM Holdings PLC | | | 22,472 | | | | 271,907 | |
| AstraZeneca PLC | | | 5,312 | | | | 251,279 | |
| BAE Systems PLC | | | 8,559 | | | | 50,025 | |
| Barclays PLC | | | 8,467 | | | | 36,296 | |
| BG Group PLC | | | 3,267 | | | | 55,758 | |
| BHP Billiton PLC | | | 5,678 | | | | 145,836 | |
| BP PLC | | | 14,756 | | | | 102,365 | |
| British American Tobacco PLC | | | 1,714 | | | | 88,020 | |
| British Sky Broadcasting Group PLC | | | 1,048 | | | | 12,646 | |
| BT Group PLC | | | 34,124 | | | | 159,688 | |
| Capita PLC | | | 1,652 | | | | 24,340 | |
| | | Shares | | | Value ($) | |
| | | | | | | | | |
| Centrica PLC | | | 18,856 | | | | 103,484 | |
| Diageo PLC | | | 2,700 | | | | 77,445 | |
| GlaxoSmithKline PLC | | | 20,289 | | | | 507,566 | |
| HSBC Holdings PLC | | | 12,924 | | | | 133,933 | |
| Imperial Tobacco Group PLC | | | 836 | | | | 29,047 | |
| Inmarsat PLC | | | 3,673 | | | | 37,695 | |
| International Consolidated Airlines Group SA* | | | 16,625 | | | | 66,425 | |
| Kingfisher PLC | | | 2,564 | | | | 13,422 | |
| Lloyds Banking Group PLC* | | | 35,330 | | | | 34,060 | |
| National Grid PLC | | | 14,501 | | | | 164,028 | |
| Pearson PLC | | | 2,051 | | | | 36,417 | |
| Prudential PLC | | | 3,097 | | | | 50,914 | |
| Reckitt Benckiser Group PLC | | | 814 | | | | 57,704 | |
| Reed Elsevier PLC | | | 2,666 | | | | 30,379 | |
| Rio Tinto PLC | | | 3,426 | | | | 140,420 | |
| Rolls-Royce Holdings PLC* | | | 5,596 | | | | 96,824 | |
| SABMiller PLC | | | 790 | | | | 38,014 | |
| Severn Trent PLC | | | 719 | | | | 18,132 | |
| Smith & Nephew PLC | | | 4,043 | | | | 45,058 | |
| Smiths Group PLC | | | 1,710 | | | | 34,119 | |
| SSE PLC | | | 3,756 | | | | 86,713 | |
| Standard Chartered PLC | | | 1,687 | | | | 36,422 | |
| Subsea 7 SA* | | | 3,151 | | | | 55,136 | |
| Tesco PLC | | | 10,251 | | | | 51,514 | |
| The Sage Group PLC | | | 24,217 | | | | 125,597 | |
| Unilever PLC | | | 1,529 | | | | 62,095 | |
| United Utilities Group PLC | | | 2,852 | | | | 29,623 | |
| Vodafone Group PLC | | | 230,436 | | | | 661,286 | |
| WPP PLC | | | 2,440 | | | | 41,686 | |
| (Cost $2,823,925) | | | | 4,141,733 | |
| United States 0.4% | |
| Catamaran Corp.* (Cost $259,598) | | | 5,300 | | | | 257,970 | |
Total Common Stocks (Cost $47,179,217) | | | | 59,651,698 | |
| | |
| Preferred Stocks 0.2% | |
| Germany | |
| Henkel AG & Co. KGaA | | | 1,058 | | | | 99,279 | |
| Volkswagen AG | | | 123 | | | | 24,832 | |
Total Preferred Stocks (Cost $37,424) | | | | 124,111 | |
| | |
| Exchange-Traded Funds 8.4% | |
| Emerging Markets | |
| iShares MSCI Emerging Markets Index Fund (b) | | | 73,000 | | | | 2,815,610 | |
| Vanguard FTSE Emerging Markets Fund | | | 71,400 | | | | 2,768,892 | |
Total Exchange-Traded Funds (Cost $4,637,577) | | | | 5,584,502 | |
| | |
| Securities Lending Collateral 4.6% | |
| Daily Assets Fund Institutional, 0.10% (c) (d) (Cost $3,080,040) | | | 3,080,040 | | | | 3,080,040 | |
| | |
| Cash Equivalents 0.4% | |
| Central Cash Management Fund, 0.07% (c) (Cost $276,960) | | | 276,960 | | | | 276,960 | |
| | | % of Net Assets | | | Value ($) | |
| | | | |
Total Investment Portfolio (Cost $55,211,218)† | | | 103.3 | | | | 68,717,311 | |
| Other Assets and Liabilities, Net | | | (3.3 | ) | | | (2,172,093 | ) |
| Net Assets | | | 100.0 | | | | 66,545,218 | |
* Non-income producing security.
† The cost for federal income tax purposes was $55,497,976. At June 30, 2013, net unrealized appreciation for all securities based on tax cost was $13,219,335. This consisted of aggregate gross unrealized appreciation for all securities in which there was an excess of value over tax cost of $15,795,680 and aggregate gross unrealized depreciation for all securities in which there was an excess of tax cost over value of $2,576,345.
(a) Securities with the same description are the same corporate entity but trade on different stock exchanges.
(b) All or a portion of these securities were on loan (see Notes to Financial Statements). The value of securities loaned at June 30, 2013 amounted to $3,013,676, which is 4.5% of net assets.
(c) Affiliated fund managed by Deutsche Investment Management Americas Inc. The rate shown is the annualized seven-day yield at period end.
(d) Represents collateral held in connection with securities lending. Income earned by the Fund is net of borrower rebates.
CVA: Certificaten Van Aandelen (Certificate of Stock)
FTSE: Financial Times and the London Stock Exchange
MSCI: Morgan Stanley Capital International
REIT: Real Estate Investment Trust
RSP: Risparmio (Convertible Savings Shares)
SDR: Swedish Depositary Receipt
At June 30, 2013, open futures contracts purchased were as follows:
| Futures | Currency | Expiration Date | | Contracts | | | Notional Value ($) | | | Unrealized Appreciation/ (Depreciation) ($) | |
| Euro Stoxx 50 Index | EUR | 9/20/2013 | | | 18 | | | | 608,703 | | | | (22,000 | ) |
| FTSE 100 Index | GBP | 9/20/2013 | | | 1 | | | | 93,713 | | | | (2,512 | ) |
| Nikkei 225 Index | USD | 9/12/2013 | | | 4 | | | | 276,800 | | | | 3,784 | |
| SPI 200 Index | AUD | 9/19/2013 | | | 2 | | | | 218,074 | | | | (2,200 | ) |
| Total net unrealized depreciation | | | | (22,928 | ) |
| Currency Abbreviations |
AUD Australian Dollar EUR Euro GBP British Pound USD United States Dollar |
For information on the Fund's policy and additional disclosures regarding futures contracts, please refer to Note B in the accompanying Notes to Financial Statements.
Fair Value Measurements
Various inputs are used in determining the value of the Fund's investments. These inputs are summarized in three broad levels. Level 1 includes quoted prices in active markets for identical securities. Level 2 includes other significant observable inputs (including quoted prices for similar securities, interest rates, prepayment speeds, and credit risk). Level 3 includes significant unobservable inputs (including the Fund's own assumptions in determining the fair value of investments). The inputs or methodology used for valuing securities are not necessarily an indication of the risk associated with investing in those securities.
The following is a summary of the inputs used as of June 30, 2013 in valuing the Fund's investments. For information on the Fund's policy regarding the valuation of investments, please refer to the Security Valuation section of Note A in the accompanying Notes to Financial Statements.
| Assets | | Level 1 | | | Level 2 | | | Level 3 | | | Total | |
| | |
| Common Stocks and Preferred Stocks (e) | |
| Australia | | $ | — | | | $ | 5,666,397 | | | $ | — | | | $ | 5,666,397 | |
| Austria | | | — | | | | 349,108 | | | | — | | | | 349,108 | |
| Belgium | | | — | | | | 981,453 | | | | — | | | | 981,453 | |
| Bermuda | | | — | | | | 131,333 | | | | — | | | | 131,333 | |
| Canada | | | 3,873,089 | | | | — | | | | — | | | | 3,873,089 | |
| Denmark | | | — | | | | 1,784,639 | | | | — | | | | 1,784,639 | |
| Finland | | | — | | | | 1,361,007 | | | | — | | | | 1,361,007 | |
| France | | | — | | | | 3,602,410 | | | | — | | | | 3,602,410 | |
| Germany | | | — | | | | 2,520,058 | | | | — | | | | 2,520,058 | |
| Hong Kong | | | — | | | | 1,963,980 | | | | — | | | | 1,963,980 | |
| Ireland | | | | | | | 787,675 | | | | — | | | | 787,675 | |
| Italy | | | — | | | | 2,014,157 | | | | — | | | | 2,014,157 | |
| Japan | | | — | | | | 12,528,053 | | | | — | | | | 12,528,053 | |
| Luxembourg | | | — | | | | 286,324 | | | | — | | | | 286,324 | |
| Macau | | | — | | | | 77,374 | | | | — | | | | 77,374 | |
| Netherlands | | | — | | | | 3,401,439 | | | | — | | | | 3,401,439 | |
| Norway | | | — | | | | 1,350,388 | | | | — | | | | 1,350,388 | |
| Singapore | | | — | | | | 2,700,444 | | | | — | | | | 2,700,444 | |
| Spain | | | — | | | | 2,481,925 | | | | — | | | | 2,481,925 | |
| Sweden | | | — | | | | 3,596,398 | | | | — | | | | 3,596,398 | |
| Switzerland | | | — | | | | 3,918,455 | | | | — | | | | 3,918,455 | |
| United Kingdom | | | — | | | | 4,141,733 | | | | — | | | | 4,141,733 | |
| United States | | | 257,970 | | | | — | | | | — | | | | 257,970 | |
| Exchange-Traded Funds | | | 5,584,502 | | | | — | | | | — | | | | 5,584,502 | |
| Short-Term Investments (e) | | | 3,357,000 | | | | — | | | | — | | | | 3,357,000 | |
Derivatives (f) Futures Contracts | | | 3,784 | | | | — | | | | — | | | | 3,784 | |
| Total | | $ | 13,076,345 | | | $ | 55,644,750 | | | $ | — | | | $ | 68,721,095 | |
| Liabilities | |
Derivatives (f) Futures Contracts | | $ | (26,712 | ) | | $ | — | | | $ | — | | | $ | (26,712 | ) |
| Total | | $ | (26,712 | ) | | $ | — | | | $ | — | | | $ | (26,712 | ) |
There have been no transfers between fair value measurement levels during the period ended June 30, 2013.
(e) See Investment Portfolio for additional detailed categorizations.
(f) Derivatives include unrealized appreciation (depreciation) on open futures contracts.
The accompanying notes are an integral part of the financial statements.
Statement of Assets and Liabilities | as of June 30, 2013 (Unaudited) | |
| Assets | |
Investments: Investments in non-affiliated securities, at value (cost $51,854,218) — including $3,013,676 of securities loaned | | $ | 65,360,311 | |
| Investment in Daily Assets Fund Institutional (cost $3,080,040)* | | | 3,080,040 | |
| Investment in Central Cash Management Fund (cost $276,960) | | | 276,960 | |
| Total investments in securities, at value (cost $55,211,218) | | | 68,717,311 | |
| Foreign currency, at value (cost $725,372) | | | 708,545 | |
| Deposits with broker for futures contracts | | | 144,547 | |
| Receivable for investments sold | | | 9,785 | |
| Receivable for Fund shares sold | | | 401 | |
| Dividends receivable | | | 131,550 | |
| Interest receivable | | | 4,104 | |
| Foreign taxes recoverable | | | 63,956 | |
| Other assets | | | 432 | |
| Total assets | | | 69,780,631 | |
| Liabilities | |
| Payable upon return of securities loaned | | | 3,080,040 | |
| Payable for Fund shares redeemed | | | 27,328 | |
| Payable for variation margin on futures contracts | | | 22,928 | |
| Accrued management fee | | | 33,360 | |
| Accrued Trustees' fees | | | 228 | |
| Other accrued expenses and payables | | | 71,529 | |
| Total liabilities | | | 3,235,413 | |
| Net assets, at value | | $ | 66,545,218 | |
| Net Assets Consist of | |
| Undistributed net investment income | | | 980,681 | |
Net unrealized appreciation (depreciation) on: Investments | | | 13,506,093 | |
| Futures | | | (22,928 | ) |
| Foreign currency | | | (21,353 | ) |
| Accumulated net realized gain (loss) | | | (62,254,077 | ) |
| Paid-in capital | | | 114,356,802 | |
| Net assets, at value | | $ | 66,545,218 | |
Class A Net Asset Value, offering and redemption price per share ($66,545,218 ÷ 8,359,079 outstanding shares of beneficial interest, no par value, unlimited number of shares authorized) | | $ | 7.96 | |
* Represents collateral on securities loaned.
The accompanying notes are an integral part of the financial statements.
Statement of Operations
| for the six months ended June 30, 2013 (Unaudited) | |
| Investment Income | |
Income: Dividends (net of foreign taxes withheld of $156,353) | | $ | 1,408,018 | |
| Interest | | | 290 | |
| Income distributions — Central Cash Management Fund | | | 430 | |
| Securities lending income, including income from Daily Assets Fund Institutional, net of borrower rebates | | | 56,743 | |
| Total income | | | 1,465,481 | |
Expenses: Management fee | | | 222,173 | |
| Administration fee | | | 34,180 | |
| Services to shareholders | | | 569 | |
| Custodian fee | | | 18,685 | |
| Legal fees | | | 8,272 | |
| Audit and tax fees | | | 28,930 | |
| Reports to shareholders | | | 14,353 | |
| Trustees' fees and expenses | | | 2,250 | |
| Other | | | 15,172 | |
| Total expenses before expense reductions | | | 344,584 | |
| Expense reductions | | | (5,951 | ) |
| Total expenses after expense reductions | | | 338,633 | |
| Net investment income | | | 1,126,848 | |
| Realized and Unrealized Gain (Loss) | |
Net realized gain (loss) from: Investments | | | 2,347,497 | |
| Futures | | | 78,186 | |
| Foreign currency | | | 1,032 | |
| | | | 2,426,715 | |
Change in net unrealized appreciation (depreciation) on: Investments | | | (1,863,820 | ) |
| Futures | | | (27,008 | ) |
| Foreign currency | | | (21,381 | ) |
| | | | (1,912,209 | ) |
| Net gain (loss) | | | 514,506 | |
| Net increase (decrease) in net assets resulting from operations | | $ | 1,641,354 | |
The accompanying notes are an integral part of the financial statements.
Statement of Changes in Net Assets | Increase (Decrease) in Net Assets | | Six Months Ended June 30, 2013 (Unaudited) | | | Year Ended December 31, 2012 | |
Operations: Net investment income | | $ | 1,126,848 | | | $ | 1,605,589 | |
| Net realized gain (loss) | | | 2,426,715 | | | | 337,693 | |
| Change in net unrealized appreciation (depreciation) | | | (1,912,209 | ) | | | 8,562,569 | |
| Net increase (decrease) in net assets resulting from operations | | | 1,641,354 | | | | 10,505,851 | |
Distributions to shareholders from: Net investment income: Class A | | | (1,676,904 | ) | | | (1,885,705 | ) |
| Total distributions | | | (1,676,904 | ) | | | (1,885,705 | ) |
Fund share transactions: Class A Proceeds from shares sold | | | 2,211,362 | | | | 2,442,886 | |
| Reinvestment of distributions | | | 1,676,904 | | | | 1,885,705 | |
| Payments for shares redeemed | | | (4,294,300 | ) | | | (10,767,707 | ) |
| Net increase (decrease) in net assets from Class A share transactions | | | (406,034 | ) | | | (6,439,116 | ) |
| Increase (decrease) in net assets | | | (441,584 | ) | | | 2,181,030 | |
| Net assets at beginning of period | | | 66,986,802 | | | | 64,805,772 | |
| Net assets at end of period (including undistributed net investment income of $980,681 and $1,530,737, respectively) | | $ | 66,545,218 | | | $ | 66,986,802 | |
| Other Information | |
Class A Shares outstanding at beginning of period | | | 8,411,945 | | | | 9,288,789 | |
| Shares sold | | | 267,221 | | | | 334,743 | |
| Shares issued to shareholders in reinvestment of distributions | | | 202,769 | | | | 258,316 | |
| Shares redeemed | | | (522,856 | ) | | | (1,469,903 | ) |
| Net increase (decrease) in Class A shares | | | (52,866 | ) | | | (876,844 | ) |
| Shares outstanding at end of period | | | 8,359,079 | | | | 8,411,945 | |
The accompanying notes are an integral part of the financial statements.
| | | | | | Years Ended December 31, | |
| Class A | | Six Months Ended 6/30/13 (Unaudited) | | | 2012 | | | 2011 | | | 2010 | | | 2009 | | | 2008 | |
| Selected Per Share Data | |
| Net asset value, beginning of period | | $ | 7.96 | | | $ | 6.98 | | | $ | 8.08 | | | $ | 7.45 | | | $ | 6.22 | | | $ | 16.76 | |
Income (loss) from investment operations: Net investment incomea | | | .13 | | | | .18 | | | | .19 | | | | .14 | | | | .12 | | | | .33 | c |
| Net realized and unrealized gain (loss) | | | .07 | | | | 1.01 | | | | (1.14 | ) | | | .66 | | | | 1.51 | | | | (6.67 | ) |
| Total from investment operations | | | .20 | | | | 1.19 | | | | (.95 | ) | | | .80 | | | | 1.63 | | | | (6.34 | ) |
Less distributions from: Net investment income | | | (.20 | ) | | | (.21 | ) | | | (.15 | ) | | | (.17 | ) | | | (.40 | ) | | | (.13 | ) |
| Net realized gains | | | — | | | | — | | | | — | | | | — | | | | — | | | | (4.07 | ) |
| Total distributions | | | (.20 | ) | | | (.21 | ) | | | (.15 | ) | | | (.17 | ) | | | (.40 | ) | | | (4.20 | ) |
| Net asset value, end of period | | $ | 7.96 | | | $ | 7.96 | | | $ | 6.98 | | | $ | 8.08 | | | $ | 7.45 | | | $ | 6.22 | |
| Total Return (%) | | | 2.45 | b** | | | 17.34 | | | | (12.07 | ) | | | 10.93 | | | | 29.36 | | | | (48.81 | )b,d |
| Ratios to Average Net Assets and Supplemental Data | |
| Net assets, end of period ($ millions) | | | 67 | | | | 67 | | | | 65 | | | | 83 | | | | 86 | | | | 91 | |
| Ratio of expenses before expense reductions (%) | | | 1.01 | * | | | 1.02 | | | | 1.03 | | | | .99 | | | | .94 | | | | 1.02 | |
| Ratio of expenses after expense reductions (%) | | | .99 | * | | | 1.02 | | | | 1.03 | | | | .99 | | | | .94 | | | | 1.01 | |
| Ratio of net investment income (%) | | | 3.30 | * | | | 2.46 | | | | 2.44 | | | | 1.90 | | | | 1.89 | | | | 3.04 | c |
| Portfolio turnover rate (%) | | | 22 | ** | | | 18 | | | | 26 | | | | 14 | | | | 139 | | | | 132 | |
a Based on average shares outstanding during the period. b Total return would have been lower had certain expenses not been reimbursed. c Net investment income per share and ratio of net investment income include non-recurring dividend income amounting to $0.16 per share and 1.49% of average daily net assets, respectively. d Includes a reimbursement from the Advisor to reimburse the effect of losses incurred as the result of certain operation errors during the period. Excluding this reimbursement, total return would have been 0.14% lower. * Annualized ** Not annualized | |
Notes to Financial Statements (Unaudited)
A. Organization and Significant Accounting Policies
DWS Diversified International Equity VIP (the "Fund") is a diversified series of DWS Variable Series II (the "Trust"), which is registered under the Investment Company Act of 1940, as amended (the "1940 Act"), as an open-end management investment company organized as a Massachusetts business trust. On July 12, 2013, the Fund was renamed DWS Global Equity VIP.
The Fund's financial statements are prepared in accordance with accounting principles generally accepted in the United States of America which require the use of management estimates. Actual results could differ from those estimates. The policies described below are followed consistently by the Fund in the preparation of its financial statements.
Security Valuation. Investments are stated at value determined as of the close of regular trading on the New York Stock Exchange on each day the exchange is open for trading.
Various inputs are used in determining the value of the Fund's investments. These inputs are summarized in three broad levels. Level 1 includes quoted prices in active markets for identical securities. Level 2 includes other significant observable inputs (including quoted prices for similar securities, interest rates, prepayment speeds, and credit risk). Level 3 includes significant unobservable inputs (including the Fund's own assumptions in determining the fair value of investments). The inputs or methodology used for valuing securities are not necessarily an indication of the risk associated with investing in those securities.
Equity securities and exchange-traded funds ("ETFs") are valued at the most recent sale price or official closing price reported on the exchange (U.S. or foreign) or over-the-counter market on which they trade and are categorized as Level 1 securities. Securities or ETFs for which no sales are reported are valued at the calculated mean between the most recent bid and asked quotations on the relevant market or, if a mean cannot be determined, at the most recent bid quotation. For certain international equity securities, in order to adjust for events which may occur between the close of the foreign exchanges and the close of the New York Stock Exchange, a fair valuation model may be used. This fair valuation model takes into account comparisons to the valuation of American Depository Receipts (ADRs), exchange-traded funds, futures contracts and certain indices and these securities are categorized as Level 2.
Futures contracts are generally valued at the settlement prices established each day on the exchange on which they are traded and are categorized as Level 1.
Investments in open-end investment companies are valued at their net asset value each business day and are categorized as Level 1.
Securities and other assets for which market quotations are not readily available or for which the above valuation procedures are deemed not to reflect fair value are valued in a manner that is intended to reflect their fair value as determined in accordance with procedures approved by the Board and are generally categorized as Level 3. In accordance with the Fund's valuation procedures, factors used in determining value may include, but are not limited to, the type of the security; the size of the holding; the initial cost of the security; the existence of any contractual restrictions on the security's disposition; the price and extent of public trading in similar securities of the issuer or of comparable companies; quotations or evaluated prices from broker-dealers and/or pricing services; information obtained from the issuer, analysts, and/or the appropriate stock exchange (for exchange-traded securities); an analysis of the company's or issuer's financial statements; an evaluation of the forces that influence the issuer and the market(s) in which the security is purchased and sold and with respect to debt securities; the maturity, coupon, creditworthiness, currency denomination and the movement of the market in which the security is normally traded. The value determined under these procedures may differ from published values for the same securities.
Disclosure about the classification of fair value measurements is included in a table following the Fund's Investment Portfolio.
Securities Lending. Deutsche Bank AG, as lending agent, lends securities of the Fund to certain financial institutions under the terms of the Security Lending Agreement. The Fund retains the benefits of owning the securities it has loaned and continues to receive interest and dividends generated by the securities and to participate in any changes in their market value. The Fund requires the borrowers of the securities to maintain collateral with the Fund consisting of either cash or liquid, unencumbered assets having a value at least equal to the value of the securities loaned. When the collateral falls below specified amounts, the lending agent will use its best effort to obtain additional collateral on the next business day to meet required amounts under the security lending agreement. The Fund may invest the cash collateral into a joint trading account in an affiliated money market fund pursuant to Exemptive Orders issued by the SEC. The Fund receives compensation for lending its securities either in the form of fees or by earning interest on invested cash collateral net of borrower rebates and fees paid to a lending agent. Either the Fund or the borrower may terminate the loan. There may be risks of delay and costs in recovery of securities or even loss of rights in the collateral should the borrower of the securities fail financially. If the Fund is not able to recover securities lent, the Fund may sell the collateral and purchase a replacement investment in the market, incurring the risk that the value of the replacement security is greater than the value of the collateral. The Fund is also subject to all investment risks associated with the reinvestment of any cash collateral received, including, but not limited to, interest rate, credit and liquidity risk associated with such investments.
As of June 30, 2013, the Fund had securities on loan with a gross value of $3,013,676. The value of the related collateral, $3,080,040, exceeded the value of the securities loaned at period end.
Foreign Currency Translations. The books and records of the Fund are maintained in U.S. dollars. Investment securities and other assets and liabilities denominated in a foreign currency are translated into U.S. dollars at the prevailing exchange rates at period end. Purchases and sales of investment securities, income and expenses are translated into U.S. dollars at the prevailing exchange rates on the respective dates of the transactions.
Net realized and unrealized gains and losses on foreign currency transactions represent net gains and losses between trade and settlement dates on securities transactions, the acquisition and disposition of foreign currencies, and the difference between the amount of net investment income accrued and the U.S. dollar amount actually received. That portion of both realized and unrealized gains and losses on investments that results from fluctuations in foreign currency exchange rates is not separately disclosed but is included with net realized and unrealized gain/appreciation and loss/depreciation on investments.
Taxes. The Fund's policy is to comply with the requirements of the Internal Revenue Code, as amended, which are applicable to regulated investment companies, and to distribute all of its taxable income to its shareholders.
Additionally, the Fund may be subject to taxes imposed by the governments of countries in which it invests and are generally based on income and/or capital gains earned or repatriated. Estimated tax liabilities on certain foreign securities are recorded on an accrual basis and are reflected as components of interest income or net change in unrealized gain/loss on investments. Tax liabilities realized as a result of security sales are reflected as a component of net realized gain/loss on investments.
Under the Regulated Investment Company Modernization Act of 2010, net capital losses incurred post-enactment may be carried forward indefinitely, and their character is retained as short-term and/or long-term. Previously, net capital losses were carried forward for eight years and treated as short-term losses. As a transition rule, the Act requires that post-enactment net capital losses be used before pre-enactment net capital losses.
At December 31, 2012, the Fund had a net tax basis capital loss carryforward of approximately $64,369,000 of pre-enactment losses, which may be applied against any realized net taxable capital gains of each succeeding year until fully utilized or until December 31, 2016 ($25,205,000) and December 31, 2017 ($39,164,000), the respective expiration dates, whichever occurs first.
In addition, from November 1, 2012 through December 31, 2012, the Fund elects to defer qualified late year losses of approximately $108,000 of net long-term realized capital losses and treat them as arising in the fiscal year ending December 31, 2013.
The Fund has reviewed the tax positions for the open tax years as of December 31, 2012 and has determined that no provision for income tax is required in the Fund's financial statements. The Fund's federal tax returns for the prior three fiscal years remain open subject to examination by the Internal Revenue Service.
Distribution of Income and Gains. Distributions from net investment income of the Fund, if any, are declared and distributed to shareholders annually. Net realized gains from investment transactions, in excess of available capital loss carryforwards, would be taxable to the Fund if not distributed and, therefore, will be distributed to shareholders at least annually. The Fund may also make additional distributions for tax purposes if necessary.
The timing and characterization of certain income and capital gain distributions are determined annually in accordance with federal tax regulations which may differ from accounting principles generally accepted in the United States of America. These differences primarily relate to investments in foreign denominated investments, investments in futures contracts, income received from passive foreign investment companies and and certain securities sold at a loss. As a result, net investment income (loss) and net realized gain (loss) on investment transactions for a reporting period may differ significantly from distributions during such period. Accordingly, the Fund may periodically make reclassifications among certain of its capital accounts without impacting the net asset value of the Fund.
The tax character of current year distributions will be determined at the end of the current fiscal year.
Expenses. Expenses of the Trust arising in connection with a specific fund are allocated to that fund. Other Trust expenses which cannot be directly attributed to a fund are apportioned among the funds in the Trust based upon the relative net assets or other appropriate measures.
Contingencies. In the normal course of business, the Fund may enter into contracts with service providers that contain general indemnification clauses. The Fund's maximum exposure under these arrangements is unknown as this would involve future claims that may be made against the Fund that have not yet been made. However, based on experience, the Fund expects the risk of loss to be remote.
Other. Investment transactions are accounted for on a trade date plus one basis for daily net asset value calculations. However, for financial reporting purposes, investment transactions are reported on trade date. Interest income is recorded on the accrual basis. Dividend income is recorded on the ex-dividend date net of foreign withholding taxes. Certain dividends from foreign securities may be recorded subsequent to the ex-dividend date as soon as the Fund is informed of such dividends. Realized gains and losses from investment transactions are recorded on an identified cost basis and may include proceeds from litigation.
B. Derivative Instruments
Futures Contracts. A futures contract is an agreement between a buyer or seller and an established futures exchange or its clearinghouse in which the buyer or seller agrees to take or make a delivery of a specific amount of a financial instrument at a specified price on a specific date (settlement date). For the six months ended June 30, 2013, the Fund entered into futures contracts as a means of gaining exposure to a particular asset class or to keep cash on hand to meet shareholder redemptions or other needs while maintaining exposure to the market.
Upon entering into a futures contract, the Fund is required to deposit with a financial intermediary cash or securities ("initial margin") in an amount equal to a certain percentage of the face value indicated in the futures contract. Subsequent payments ("variation margin") are made or received by the Fund dependent upon the daily fluctuations in the value and are recorded for financial reporting purposes as unrealized gains or losses by the Fund. Gains or losses are realized when the contract expires or is closed. Since all futures contracts are exchange-traded, counterparty risk is minimized as the exchange's clearinghouse acts as the counterparty, and guarantees the futures against default.
Certain risks may arise upon entering into futures contracts, including the risk that an illiquid market will limit the Fund's ability to close out a futures contract prior to the settlement date and the risk that the futures contract is not well correlated with the security, index or currency to which it relates. Risk of loss may exceed amounts disclosed in the Statement of Assets and Liabilities.
A summary of the open futures contracts as of June 30, 2013 is included in a table following the Fund's Investment Portfolio. For the six months ended June 30, 2013, the investment in futures contracts purchased had a total notional value generally indicative of a range from approximately $1,197,000 to $1,699,000.
The following table summarizes the value of the Fund's derivative instruments held as of June 30, 2013 and the related location in the accompanying Statement of Assets and Liabilities, presented by primary underlying risk exposure:
| Asset Derivative | | Futures Contracts | |
| Equity Contracts (a) | | $ | 3,784 | |
The above derivative is located in the following Statement of Assets and Liabilities account:
(a) Includes cumulative appreciation of futures contracts as disclosed in the Investment Portfolio. Unsettled variation margin is disclosed separately within the Statement of Assets and Liabilities.
| Liability Derivative | | Futures Contracts | |
| Equity Contracts (a) | | $ | (26,712 | ) |
The above derivative is located in the following Statement of Assets and Liabilities account:
(a) Includes cumulative depreciation of futures contracts as disclosed in the Investment Portfolio. Unsettled variation margin is disclosed separately within the Statement of Assets and Liabilities.
Additionally, the amount of unrealized and realized gains and losses on derivative instruments recognized in Fund earnings during the six months ended June 30, 2013 and the related location in the accompanying Statement of Operations is summarized in the following tables by primary underlying risk exposure:
| Realized Gain (Loss) | | Futures Contracts | |
| Equity Contracts (a) | | $ | 78,186 | |
The above derivative is located in the following Statement of Operations account:
(a) Net realized gain (loss) from futures
| Change in Net Unrealized Appreciation (Depreciation) | | Futures Contracts | |
| Equity Contracts (a) | | $ | (27,008 | ) |
The above derivative is located in the following Statement of Operations account:
(a) Change in net unrealized appreciation (depreciation) on futures
C. Purchases and Sales of Securities
During the six months ended June 30, 2013, purchases and sales of investment transactions (excluding short-term investments) aggregated $14,864,235 and $15,793,563, respectively.
D. Related Parties
Management Agreement. Under the Investment Management Agreement with Deutsche Investment Management Americas Inc. ("DIMA" or the "Advisor"), an indirect, wholly owned subsidiary of Deutsche Bank AG, the Advisor directs the investments of the Fund in accordance with its investment objectives, policies and restrictions. The Advisor determines the securities, instruments and other contracts relating to investments to be purchased, sold or entered into by the Fund or delegates such responsibility to the Fund's subadvisor.
QS Investors, LLC ("QS Investors") acted as an investment subadvisor to the Fund. As an investment subadvisor, QS Investors rendered strategic asset allocation services and managed the portion of assets allocated from time to time to the Fund's global tactical asset allocation overlay strategy. QS Investors was paid by the Advisor for the services QS Investors provided to the Fund. Effective July 12, 2013, QS Investors no longer acts as subadvisor to the Fund and day-to-day portfolio management of the Fund transitioned to DIMA.
Pursuant to the Investment Management Agreement with the Advisor, the Fund pays a monthly management fee based on the Fund's average daily net assets, computed and accrued daily and payable monthly, at the following annual rates:
| First $1.5 billion | | | .650 | % |
| Next $1.75 billion | | | .635 | % |
| Next $1.75 billion | | | .620 | % |
| Over $5 billion | | | .605 | % |
For the period from January 1, 2013 through September 30, 2013, the Advisor has contractually agreed to waive its fees and/or reimburse certain operating expenses to the extent necessary to maintain the operating expenses (excluding certain expenses such as extraordinary expenses, taxes, brokerage and interest expense) of Class A shares at 0.99%.
Accordingly, for the six months ended June 30, 2013, the Advisor waived a portion of its management fee pursuant to the Investment Management Agreement aggregating $5,895, and the amount charged aggregated $216,278, which was equivalent to an annualized effective rate of 0.63% of the Fund's average daily net assets.
Administration Fee. Pursuant to an Administrative Services Agreement, DIMA provides most administrative services to the Fund. For all services provided under the Administrative Services Agreement, the Fund pays DIMA an annual fee ("Administration Fee") of 0.10% of the Fund's average daily net assets, computed and accrued daily and payable monthly. For the six months ended June 30, 2013, the Administration Fee was $34,180, of which $5,586 is unpaid.
Service Provider Fees. DWS Investments Service Company ("DISC"), an affiliate of the Advisor, is the transfer agent, dividend-paying agent and shareholder service agent for the Fund. Pursuant to a sub-transfer agency agreement between DISC and DST Systems, Inc. ("DST"), DISC has delegated certain transfer agent, dividend-paying agent and shareholder service agent functions to DST. DISC compensates DST out of the shareholder servicing fee it receives from the Fund. For the six months ended June 30, 2013, the amounts charged to the Fund by DISC aggregated $56, all of which was waived.
Typesetting and Filing Service Fees. Under an agreement with DIMA, DIMA is compensated for providing typesetting and certain regulatory filing services to the Fund. For the six months ended June 30, 2013, the amount charged to the Fund by DIMA included in the Statement of Operations under "reports to shareholders" aggregated $6,697, of which $6,267 is unpaid.
Trustees' Fees and Expenses. The Fund paid retainer fees to each Trustee not affiliated with the Advisor, plus specified amounts to the Board Chairperson and Vice Chairperson and to each committee Chairperson.
Affiliated Cash Management Vehicles. The Fund may invest uninvested cash balances in Central Cash Management Fund and DWS Variable NAV Money Fund, affiliated money market funds which are managed by the Advisor. Each affiliated money market fund seeks to provide a high level of current income consistent with liquidity and the preservation of capital. Each affiliated money market fund is managed in accordance with Rule 2a-7 under the Investment Company Act of 1940, which governs the quality, maturity, diversity and liquidity of instruments in which a money market fund may invest. Central Cash Management Fund seeks to maintain a stable net asset value, and DWS Variable NAV Money Fund maintains a floating net asset value. The Fund indirectly bears its proportionate share of the expenses of each affiliated money market fund in which it invests. Central Cash Management Fund does not pay the Advisor an investment management fee. To the extent that DWS Variable NAV Money Fund pays an investment management fee to the Advisor, the Advisor will waive an amount of the investment management fee payable to the Advisor by the Fund equal to the amount of the investment management fee payable on the Fund's assets invested in DWS Variable NAV Money Fund.
Securities Lending Fees. Effective February 7, 2013, Deutsche Bank AG serves as lending agent for the Fund. For the period from February 7, 2013 through June 30, 2013, the Fund incurred lending agent fees to Deutsche Bank AG in the amount of $6,119.
E. Investing in Emerging Markets
Investing in emerging markets may involve special risks and considerations not typically associated with investing in developed markets. These risks include revaluation of currencies, high rates of inflation or deflation, repatriation restrictions on income and capital, and future adverse political, social and economic developments. Moreover, securities issued in these markets may be less liquid, subject to government ownership controls or delayed settlements, and may have prices that are more volatile or less easily assessed than those of comparable securities of issuers in developed markets.
F. Ownership of the Fund
At June 30, 2013, three Participating Insurance Companies were owners of record of 10% or more of the total outstanding Class A shares of the Fund, each owning 47%, 28% and 24%.
G. Line of Credit
The Fund and other affiliated funds (the "Participants") share in a $375 million revolving credit facility provided by a syndication of banks. The Fund may borrow for temporary or emergency purposes, including the meeting of redemption requests that otherwise might require the untimely disposition of securities. The Participants are charged an annual commitment fee which is allocated based on net assets, among each of the Participants. Interest is calculated at a rate per annum equal to the sum of the Federal Funds Rate plus 1.25 percent plus if LIBOR exceeds the Federal Funds Rate the amount of such excess. The Fund may borrow up to a maximum of 33 percent of its net assets under the agreement. The Fund had no outstanding loans at June 30, 2013.
H. Changes to Fund Name, Portfolio Management Team and Investment Strategies
On July 12, 2013, DWS Diversified International Equity VIP changed its name to DWS Global Equity VIP, and QS Investors, LLC no longer acts as subadvisor to the Fund. In addition, effective at that time, the Fund's portfolio management team changed and certain changes were made to the Fund's investment strategies and portfolio management process. More details regarding these changes are set forth in the Fund's prospectus dated July 12, 2013.
Information About Your Fund's Expenses (Unaudited)
As an investor of the Fund, you incur two types of costs: ongoing expenses and transaction costs. Ongoing expenses include management fees and other Fund expenses. Examples of transaction costs include contract charges and account maintenance fees, which are not shown in this section. The following tables are intended to help you understand your ongoing expenses (in dollars) of investing in the Fund and to help you compare these expenses with the ongoing expenses of investing in other mutual funds. In the most recent six-month period, the Fund limited these expenses, had it not done so, expenses would have ben higher, The example in the table is based on an investment of $1,000 invested at the beginning of the six-month period and held for the entire period (January 1, 2013 to June 30, 2013).
The tables illustrate your Fund's expenses in two ways:
•Actual Fund Return. This helps you estimate the actual dollar amount of ongoing expenses (but not transaction costs) paid on a $1,000 investment in the Fund using the Fund's actual return during the period. To estimate the expenses you paid over the period, simply divide your account value by $1,000 (for example, an $8,600 account value divided by $1,000 = 8.6), then multiply the result by the number in the "Expenses Paid per $1,000" line under the share class you hold.
• Hypothetical 5% Fund Return. This helps you to compare your Fund's ongoing expenses (but not transaction costs) with those of other mutual funds using the Fund's actual expense ratio and a hypothetical rate of return of 5% per year before expenses. Examples using a 5% hypothetical Fund return may be found in the shareholder reports of other mutual funds. The hypothetical account values and expenses may not be used to estimate the actual ending account balance or expenses you paid for the period.
Please note that the expenses shown in these tables are meant to highlight your ongoing expenses only and do not reflect any transaction costs. The "Expenses Paid per $1,000" line of the tables is useful in comparing ongoing expenses only and will not help you determine the relative total expense of owning different funds. If these transaction costs had been included, your costs would have been higher.
Expenses and Value of a $1,000 Investment for the six months ended June 30, 2013 | |
| Actual Fund Return | | Class A | |
| Beginning Account Value 1/1/13 | | $ | 1,000.00 | |
| Ending Account Value 6/30/13 | | $ | 1,024.50 | |
| Expenses Paid per $1,000* | | $ | 4.97 | |
| Hypothetical 5% Fund Return | | Class A | |
| Beginning Account Value 1/1/13 | | $ | 1,000.00 | |
| Ending Account Value 6/30/13 | | $ | 1,019.89 | |
| Expenses Paid per $1,000* | | $ | 4.96 | |
* Expenses are equal to the Fund's annualized expense ratio, multiplied by the average account value over the period, multiplied by 181 (the number of days in the most recent six-month period), then divided by 365.
| Annualized Expense Ratio | Class A | |
| DWS Variable Series II — DWS Diversified International Equity VIP | .99% | |
For more information, please refer to the Fund's prospectus.
These tables do not reflect charges and fees ("contract charges") associated with the separate account that invests in the Fund or any variable life insurance policy or variable annuity contract for which the Fund is an investment option.
For an analysis of the fees associated with an investment in the Fund or similar funds, please refer to http://apps.finra.org/fundanalyzer/1/fa.aspx.
The Trust's policies and procedures for voting proxies for portfolio securities and information about how the Trust voted proxies related to its portfolio securities during the 12-month period ended June 30 are available on our Web site — www.dws-investments.com (click on "proxy voting" at the bottom of the page) — or on the SEC's Web site — www.sec.gov. To obtain a written copy of the Trust's policies and procedures without charge, upon request, call us toll free at (800) 728-3337.
Summary of Management Fee Evaluation by Independent Fee Consultant
September 17, 2012
Pursuant to an Order entered into by Deutsche Investment Management Americas and affiliates (collectively, "DeAM") with the Attorney General of New York, I, Thomas H. Mack, have been appointed the Independent Fee Consultant for the DWS Funds (formerly the DWS Scudder Funds). My duties include preparing an annual written evaluation of the management fees DeAM charges the Funds, considering among other factors the management fees charged by other mutual fund companies for like services, management fees DeAM charges other clients for like services, DeAM's costs of supplying services under the management agreements and related profit margins, possible economies of scale if a Fund grows larger, and the nature and quality of DeAM's services, including fund performance. This report summarizes my evaluation for 2012, including my qualifications, the evaluation process for each of the DWS Funds, consideration of certain complex-level factors, and my conclusions. I served in substantially the same capacity in 2007, 2008, 2009, 2010 and 2011.
Qualifications
For more than 35 years I have served in various professional capacities within the investment management business. I have held investment analysis and advisory positions, including securities analyst, portfolio strategist and director of investment policy with a large investment firm. I have also performed business management functions, including business development, financial management and marketing research and analysis.
Since 1991, I have been an independent consultant within the asset management industry. I have provided services to over 125 client organizations, including investment managers, mutual fund boards, product distributors and related organizations. Over the past ten years I have completed a number of assignments for mutual fund boards, specifically including assisting boards with management contract renewal.
I hold a Master of Business Administration degree, with highest honors, from Harvard University and Master of Science and Bachelor of Science (highest honors) degrees from the University of California at Berkeley. I am an independent director and audit committee financial expert for two closed-end mutual funds and have served in various leadership and financial oversight capacities with non-profit organizations.
Evaluation of Fees for each DWS Fund
My work focused primarily on evaluating, fund-by-fund, the fees charged to each of the 103 mutual fund portfolios in the DWS Fund family. For each Fund, I considered each of the key factors mentioned above, as well as any other relevant information. In doing so I worked closely with the Funds' Independent Directors in their annual contract renewal process, as well as in their approval of contracts for several new funds (documented separately).
In evaluating each Fund's fees, I reviewed comprehensive materials provided by or on behalf of DeAM, including expense information prepared by Lipper Analytical, comparative performance information, profitability data, manager histories, and other materials. I also accessed certain additional information from the Lipper and Morningstar databases and drew on my industry knowledge and experience.
To facilitate evaluating this considerable body of information, I prepared for each Fund a document summarizing the key data elements in each area as well as additional analytics discussed below. This made it possible to consider each key data element in the context of the others.
In the course of contract renewal, DeAM agreed to implement a number of fee and expense adjustments requested by the Independent Directors which will favorably impact future fees and expenses, and my evaluation includes the effects of these changes.
Fees and Expenses Compared with Other Funds
The competitive fee and expense evaluation for each fund focused on two primary comparisons:
The Fund's contractual management fee (the advisory fee plus the administration fee where applicable) compared with those of a group of typically 12-15 funds in the same Lipper investment category (e.g. Large Capitalization Growth) having similar distribution arrangements and being of similar size.
The Fund's total expenses compared with a broader universe of funds from the same Lipper investment category and having similar distribution arrangements.
These two comparisons provide a view of not only the level of the fee compared with funds of similar scale but also the total expense the Fund bears for all the services it receives, in comparison with the investment choices available in the Fund's investment category and distribution channel. The principal figure-of-merit used in these comparisons was the subject Fund's percentile ranking against peers.
DeAM's Fees for Similar Services to Others
DeAM provided management fee schedules for all of its US domiciled fund and non-fund investment management accounts in any of the investment categories where there is a DWS Fund. These similar products included the other DWS Funds, non-fund pooled accounts, institutional accounts and sub-advisory accounts. Using this information, I calculated for each Fund the fee that would be charged to each similar product, at the subject Fund's asset level.
Evaluating information regarding non-fund products is difficult because there are varying levels of services required for different types of accounts, with mutual funds generally requiring considerably more regulatory and administrative types of service as well as having more frequent cash flows than other types of accounts. Also, while mutual fund fees for similar fund products can be expected to be similar, there will be some differences due to different pricing conditions in different distribution channels (e.g. retail funds versus those used in variable insurance products), differences in underlying investment processes and other factors.
Costs and Profit Margins
DeAM provided a detailed profitability analysis for each Fund. After making some adjustments so that the presentation would be more comparable to the available industry figures, I reviewed profit margins from investment management alone, from investment management plus other fund services (excluding distribution) provided to the Funds by DeAM (principally shareholder services), and DeAM profits from all sources, including distribution. A later section comments on overall profitability.
Economies of Scale
Economies of scale — an expected decline in management cost per dollar of fund assets as fund assets grow — are very rarely quantified and documented because of inherent difficulties in collecting and analyzing relevant data. However, in virtually every investment category that I reviewed, larger funds tend to have lower fees and lower total expenses than smaller funds. To see how each DWS Fund compares with this industry observation, I reviewed:
The trend in Fund assets over the last five years and the accompanying trend in total expenses. This shows if the Fund has grown and, if so, whether total expense (management fees as well as other expenses) have declined as a percent of assets.
Whether the Fund has break-points in its management fee schedule, the extent of the fee reduction built into the schedule and the asset levels where the breaks take effect, and in the case of a sub-advised Fund how the Fund's break-points compare with those of the sub-advisory fee schedule.
How the Fund's contractual fee schedule compares with trends in the industry data. To accomplish this, I constructed a chart showing how actual latest-fiscal-year contractual fees of the Fund and of other similar funds relate to average fund assets, with the subject Fund's contractual fee schedule superimposed.
Quality of Service — Performance
The quality-of-service evaluation focused on investment performance, which is the principal result of the investment management service. Each Fund's performance was reviewed over the past 1, 3, 5 and 10 years, as applicable, and compared with that of other funds in the same investment category and with a suitable market index.
In addition, I calculated and reviewed risk-adjusted returns relative to an index of similar mutual funds' returns and a suitable market index. The risk-adjusted returns analysis provides a way of determining the extent to which the Fund's return comparisons are mainly the product of investment value-added (or lack thereof) or alternatively taking considerably more or less risk than is typical in its investment category.
I also received and considered the history of portfolio manager changes for each Fund, as this provided an important context for evaluating the performance results.
Complex-Level Considerations
While this evaluation was conducted mainly at the individual fund level, there are some issues relating to the reasonableness of fees that can alternatively be considered across the whole fund complex:
I reviewed DeAM's profitability analysis for all DWS Funds, with a view toward determining if the allocation procedures used were reasonable and how profit levels compared with public data for other investment managers.
I considered whether DeAM and affiliates receive any significant ancillary or "fallout" benefits that should be considered in interpreting the direct profitability results. These would be situations where serving as the investment manager of the Funds is beneficial to another part of the Deutsche Bank organization.
I considered how aggregated DWS Fund expenses had varied over the years, by asset class and in the context of trends in asset levels.
I considered how aggregated DWS Fund performance measures relative to appropriate peers had varied by asset class and over time.
I reviewed the structure of the DeAM organization, trends in staffing levels, and information on compensation of investment management and other professionals compared with industry data.
Findings
Based on the process and analysis discussed above, which included reviewing a wide range of information from management and external data sources and considering among other factors the fees DeAM charges other clients, the fees charged by other fund managers, DeAM's costs and profits associated with managing the Funds, economies of scale, possible fall-out benefits, and the nature and quality of services provided, in my opinion the management fees charged the DWS Funds are reasonable.
Thomas H. Mack
President, Thomas H. Mack & Co., Inc.
DWS Investments Distributors, Inc.
222 South Riverside Plaza
Chicago, IL 60606
(800) 621-1148
VS2DIE-3 (R-028380-2 8/13)

JUNE 30, 2013
SEMIANNUAL REPORT
DWS VARIABLE SERIES II
DWS Global Growth VIP
(formerly DWS Global Thematic VIP)
Contents
13 Statement of Assets and Liabilities 14 Statement of Operations 15 Statement of Changes in Net Assets 18 Notes to Financial Statements 23 Information About Your Fund's Expenses 25 Summary of Management Fee Evaluation by Independent Fee Consultant |
This report must be preceded or accompanied by a prospectus. To obtain an additional prospectus or summary prospectus, if available, call (800) 728-3337 or your financial representative. We advise you to consider the Fund's objectives, risks, charges and expenses carefully before investing. The summary prospectus and prospectus contain this and other important information about the Fund. Please read the prospectus carefully before you invest.
Investing in derivatives entails special risks relating to liquidity, leverage and credit that may reduce returns and/or increase volatility. Investing in foreign securities, particularly those of emerging markets, presents certain risks, such as currency fluctuations, political and economic changes, and market risks. The fund may lend securities to approved institutions. Smaller company stocks tend to be more volatile than medium-sized or large company stocks. Stocks may decline in value. See the prospectus for details.
DWS Investments is part of the Deutsche Asset & Wealth Management division of Deutsche Bank AG.
NOT FDIC/NCUA INSURED NO BANK GUARANTEE MAY LOSE VALUE NOT A DEPOSIT
NOT INSURED BY ANY FEDERAL GOVERNMENT AGENCY
Performance Summary June 30, 2013 (Unaudited)
Fund performance shown is historical, assumes reinvestment of all dividend and capital gain distributions and does not guarantee future results. Investment return and principal value fluctuate with changing market conditions so that, when redeemed, shares may be worth more or less than their original cost. Current performance may be lower or higher than the performance data quoted. Please contact your participating insurance company for the Fund's most recent month-end performance. Performance doesn't reflect charges and fees ("contract charges") associated with the separate account that invests in the Fund or any variable life insurance policy or variable annuity contract for which the Fund is an investment option. These charges and fees will reduce returns. While all share classes have the same underlying portfolio, their performance will differ.
The gross expense ratios of the Fund, as stated in the fee table of the prospectus dated May 1, 2013 are 1.42% and 1.76% for Class A and Class B shares, respectively, and may differ from the expense ratios disclosed in the Financial Highlights tables in this report.
Effective May 1, 2013, the Fund's investment strategies changed and the Fund seeks to achieve its objective by allocating its assets among a global growth sleeve and a small cap growth sleeve. The Fund's past performance may have been different if the Fund had been managed using the current investment strategies.
| Growth of an Assumed $10,000 Investment in DWS Global Growth VIP |
| The Morgan Stanley Capital International (MSCI) World Index is a free float-adjusted market capitalization weighted index that is designed to measure the equity market performance of developed markets. The index consists of 24 developed market country indices. The index is calculated using closing local market prices and translates into U.S. dollars using the London close foreign exchange rates. Index returns do not reflect any fees or expenses and it is not possible to invest directly into an index. |
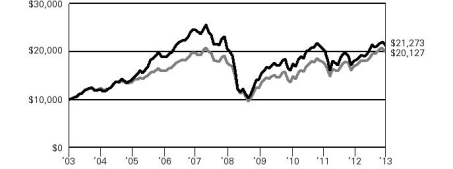 | |
| Yearly periods ended June 30 | |
| Comparative Results | |
| DWS Global Growth VIP | | 6-Month‡ | | | 1-Year | | | 3-Year | | | 5-Year | | | 10-Year | |
| Class A | Growth of $10,000 | | $ | 10,464 | | | $ | 11,805 | | | $ | 13,234 | | | $ | 10,318 | | | $ | 21,273 | |
| Average annual total return | | | 4.64 | % | | | 18.05 | % | | | 9.79 | % | | | 0.63 | % | | | 7.84 | % |
| MSCI World Index | Growth of $10,000 | | $ | 10,843 | | | $ | 11,858 | | | $ | 14,705 | | | $ | 11,425 | | | $ | 20,127 | |
| Average annual total return | | | 8.43 | % | | | 18.58 | % | | | 13.72 | % | | | 2.70 | % | | | 7.25 | % |
| DWS Global Growth VIP | | 6-Month‡ | | | 1-Year | | | 3-Year | | | 5-Year | | | 10-Year | |
| Class B | Growth of $10,000 | | $ | 10,448 | | | $ | 11,772 | | | $ | 13,102 | | | $ | 10,138 | | | $ | 20,519 | |
| Average annual total return | | | 4.48 | % | | | 17.72 | % | | | 9.42 | % | | | 0.28 | % | | | 7.45 | % |
| MSCI World Index | Growth of $10,000 | | $ | 10,843 | | | $ | 11,858 | | | $ | 14,705 | | | $ | 11,425 | | | $ | 20,127 | |
| Average annual total return | | | 8.43 | % | | | 18.58 | % | | | 13.72 | % | | | 2.70 | % | | | 7.25 | % |
The growth of $10,000 is cumulative.
‡ Total returns shown for periods less than one year are not annualized.
Portfolio Summary (Unaudited) Asset Allocation (As a % of Investment Portfolio excluding Securities Lending Collateral) | 6/30/13 | 12/31/12 |
| | | |
| Common Stocks | 97% | 97% |
| Cash Equivalents | 2% | 1% |
| Participatory Notes | 1% | 0% |
| Preferred Stock | — | 2% |
| | 100% | 100% |
Sector Diversification
(As a % of Investment Portfolio excluding Cash Equivalents and Securities Lending Collateral) | 6/30/13 | 12/31/12 |
| | | |
| Industrials | 20% | 13% |
| Financials | 14% | 14% |
| Information Technology | 14% | 15% |
| Consumer Staples | 13% | 8% |
| Health Care | 13% | 12% |
| Consumer Discretionary | 12% | 10% |
| Energy | 9% | 8% |
| Materials | 4% | 13% |
| Telecommunication Services | 1% | 4% |
| Utilities | — | 3% |
| | 100% | 100% |
Geographical Diversification
(As a % of Investment Portfolio excluding Cash Equivalents and Securities Lending Collateral) | 6/30/13 | 12/31/12 |
| | | |
| United States | 48% | 37% |
| Continental Europe | 26% | 31% |
| Asia (excluding Japan) | 9% | 10% |
| United Kingdom | 7% | 2% |
| Canada | 5% | 6% |
| Latin America | 2% | 6% |
| Japan | 2% | 3% |
| Nigeria | 1% | 0% |
| Africa | — | 2% |
| Middle East | — | 2% |
| Bermuda | — | 1% |
| | 100% | 100% |
Portfolio holdings and characteristics are subject to change.
For more complete details about the Fund's investment portfolio, see page 7.
Following the Fund's fiscal first and third quarter-end, a complete portfolio holdings listing is filed with the SEC on Form N-Q. The form will be available on the SEC's Web site at www.sec.gov, and it also may be reviewed and copied at the SEC's Public Reference Room in Washington, D.C. Information on the operation of the SEC's Public Reference Room may be obtained by calling (800) SEC-0330. The Fund's portfolio holdings are also posted on www.dws-investments.com from time to time. Please see the Fund's current prospectus for more information.
Joseph Axtell, CFA
Lead Portfolio Manager
Rafaelina M. Lee
Reid Galas, CFA
Nils E. Ernst, PhD
Martin Berberich, CFA
Sebastian P. Werner, PhD
Portfolio Managers
Investment Portfolio June 30, 2013 (Unaudited) | | | Shares | | | Value ($) | |
| | | | |
| Common Stocks 96.8% | |
| Austria 0.0% | |
| ams AG (Cost $17,728) | | | 194 | | | | 14,322 | |
| Belgium 1.0% | |
| Anheuser-Busch InBev NV (Cost $523,675) | | | 5,500 | | | | 487,934 | |
| Bermuda 0.2% | |
| Lazard Ltd. "A" (a) (Cost $81,931) | | | 3,434 | | | | 110,403 | |
| Canada 4.2% | |
| Brookfield Asset Management, Inc. "A" | | | 23,000 | | | | 826,662 | |
| Canadian Pacific Railway Ltd. | | | 6,400 | | | | 776,069 | |
| Goldcorp, Inc. | | | 13,000 | | | | 321,490 | |
| SunOpta, Inc.* | | | 13,881 | | | | 105,357 | |
| (Cost $2,271,988) | | | | 2,029,578 | |
| China 0.2% | |
| Minth Group Ltd. (Cost $130,583) | | | 74,438 | | | | 116,926 | |
| Cyprus 0.2% | |
| Prosafe SE (Cost $100,805) | | | 10,632 | | | | 93,141 | |
| Denmark 0.2% | |
| GN Store Nord A/S (Cost $109,509) | | | 5,936 | | | | 112,070 | |
| Finland 0.6% | |
| Stora Enso Oyj "R" (Cost $283,996) | | | 40,000 | | | | 266,545 | |
| France 3.9% | |
| Edenred | | | 14,000 | | | | 428,243 | |
| Etablissements Maurel et Prom (a) | | | 14,000 | | | | 208,007 | |
| JC Decaux SA | | | 3,606 | | | | 98,290 | |
| LVMH Moet Hennessy Louis Vuitton SA | | | 2,300 | | | | 370,383 | |
| Pernod-Ricard SA (a) | | | 7,000 | | | | 775,867 | |
| (Cost $2,010,094) | | | | 1,880,790 | |
| Germany 4.8% | |
| BASF SE | | | 5,250 | | | | 468,894 | |
| Fresenius Medical Care AG & Co. KGaA | | | 12,000 | | | | 850,168 | |
| Gerresheimer AG | | | 1,472 | | | | 85,066 | |
| SAP AG | | | 5,100 | | | | 373,452 | |
| Stada Arzneimittel AG | | | 9,300 | | | | 399,374 | |
| United Internet AG (Registered) | | | 5,251 | | | | 147,995 | |
| (Cost $2,332,992) | | | | 2,324,949 | |
| Hong Kong 0.7% | |
| K Wah International Holdings Ltd. | | | 259,956 | | | | 118,324 | |
| REXLot Holdings Ltd. | | | 1,480,479 | | | | 96,947 | |
| Techtronic Industries Co. | | | 43,264 | | | | 103,240 | |
| (Cost $368,087) | | | | 318,511 | |
| India 1.4% | |
| ICICI Bank Ltd. (ADR) (a) (Cost $805,229) | | | 17,500 | | | | 669,375 | |
| Indonesia 2.4% | |
| PT Arwana Citramulia Tbk | | | 246,103 | | | | 79,177 | |
| PT Ciputra Property Tbk | | | 648,933 | | | | 77,181 | |
| | | Shares | | | Value ($) | |
| | | | | | | | | |
| PT Gudang Garam Tbk | | | 85,000 | | | | 432,070 | |
| PT Indofood CBP Sukses Makmur Tbk | | | 450,000 | | | | 551,940 | |
| (Cost $1,149,198) | | | | 1,140,368 | |
| Ireland 2.8% | |
| C&C Group PLC | | | 17,419 | | | | 94,445 | |
| Experian PLC | | | 27,000 | | | | 468,303 | |
| Paddy Power PLC | | | 1,652 | | | | 141,751 | |
| Ryanair Holdings PLC (ADR) (a) | | | 2,934 | | | | 151,189 | |
| Shire PLC | | | 15,000 | | | | 475,845 | |
| (Cost $1,307,994) | | | | 1,331,533 | |
| Italy 0.8% | |
| Prysmian SpA | | | 4,974 | | | | 92,481 | |
| Unipol Gruppo Finanziario SpA | | | 90,000 | | | | 294,567 | |
| (Cost $418,136) | | | | 387,048 | |
| Japan 1.8% | |
| Ai Holdings Corp. | | | 6,065 | | | | 53,451 | |
| Avex Group Holdings, Inc. | | | 3,864 | | | | 121,755 | |
| Hajime Construction Co., Ltd. | | | 2,215 | | | | 123,293 | |
| Kusuri No Aoki Co., Ltd. | | | 1,548 | | | | 102,082 | |
| MISUMI Group, Inc. | | | 2,378 | | | | 65,020 | |
| Nippon Seiki Co., Ltd. | | | 9,059 | | | | 117,017 | |
| OSG Corp. | | | 1,078 | | | | 16,185 | |
| Sumikin Bussan Corp. | | | 3,535 | | | | 9,695 | |
| United Arrows Ltd. | | | 3,891 | | | | 163,015 | |
| Universal Entertainment Corp. | | | 5,155 | | | | 91,215 | |
| (Cost $934,020) | | | | 862,728 | |
| Korea 1.1% | |
| Hyundai Motor Co. (Cost $506,661) | | | 2,600 | | | | 510,804 | |
| Luxembourg 0.6% | |
| Millicom International Cellular SA (SDR) (Cost $359,124) | | | 4,300 | | | | 310,024 | |
| Malaysia 1.3% | |
| CIMB Group Holdings Bhd. | | | 4,900 | | | | 12,692 | |
| Hartalega Holdings Bhd. | | | 67,619 | | | | 136,739 | |
| IHH Healthcare Bhd.* | | | 350,000 | | | | 437,524 | |
| Tune Ins Holdings Bhd.* | | | 86,331 | | | | 50,432 | |
| (Cost $665,517) | | | | 637,387 | |
| Mexico 2.0% | |
| Fomento Economico Mexicano SAB de CV (ADR) (a) | | | 7,000 | | | | 722,330 | |
| Grupo Aeroportuario del Sureste SAB de CV (ADR) (a) | | | 2,000 | | | | 222,480 | |
| (Cost $1,042,663) | | | | 944,810 | |
| Netherlands 2.0% | |
| ASML Holding NV | | | 7,000 | | | | 549,178 | |
| Brunel International NV | | | 2,130 | | | | 89,675 | |
| Chicago Bridge & Iron Co. NV (c) | | | 1,989 | | | | 118,664 | |
| Koninklijke Vopak NV | | | 1,654 | | | | 97,522 | |
| SBM Offshore NV* | | | 7,554 | | | | 126,450 | |
| (Cost $945,174) | | | | 981,489 | |
| Norway 0.5% | |
| DNO International ASA* (Cost $240,816) | | | 135,000 | | | | 246,315 | |
| | | Shares | | | Value ($) | |
| | | | | | | | | |
| Panama 0.2% | |
| Banco Latinoamericano de Comercio Exterior SA "E" (Cost $95,542) | | | 4,262 | | | | 95,426 | |
| Philippines 1.3% | |
| Alliance Global Group, Inc.* | | | 196,669 | | | | 105,209 | |
| GT Capital Holdings, Inc. | | | 5,556 | | | | 101,810 | |
| House of Investments, Inc. | | | 67,997 | | | | 11,792 | |
| Metropolitan Bank & Trust | | | 155,000 | | | | 395,626 | |
| (Cost $734,863) | | | | 614,437 | |
| Russia 0.9% | |
| Sberbank of Russia (ADR) (b) | | | 22,119 | | | | 253,926 | |
| Sberbank of Russia (ADR) (b) | | | 17,881 | | | | 203,875 | |
| (Cost $504,773) | | | | 457,801 | |
| Singapore 0.5% | |
| ARA Asset Management Ltd. | | | 37,216 | | | | 50,914 | |
| Lian Beng Group Ltd. | | | 275,053 | | | | 112,478 | |
| Yongnam Holdings Ltd. | | | 317,588 | | | | 86,191 | |
| (Cost $252,135) | | | | 249,583 | |
| Spain 0.3% | |
| Mapfre SA (Cost $185,754) | | | 50,000 | | | | 161,749 | |
| Sweden 4.8% | |
| Meda AB "A" | | | 31,000 | | | | 349,275 | |
| Svenska Cellulosa AB "B" | | | 20,000 | | | | 500,741 | |
| Swedish Match AB | | | 18,000 | | | | 636,358 | |
| Telefonaktiebolaget LM Ericsson "B" | | | 40,000 | | | | 453,493 | |
| Volvo AB "B" | | | 30,000 | | | | 399,847 | |
| (Cost $2,311,632) | | | | 2,339,714 | |
| Switzerland 2.4% | |
| Dufry AG (Registered)* | | | 712 | | | | 86,149 | |
| Nestle SA (Registered) | | | 8,000 | | | | 523,251 | |
| OC Oerlikon Corp. AG (Registered)* | | | 4,566 | | | | 53,871 | |
| Pentair Ltd. (Registered) (c) | | | 9,000 | | | | 519,210 | |
| (Cost $1,192,863) | | | | 1,182,481 | |
| Thailand 0.1% | |
| Malee Sampran Factory PCL (Foreign Registered) (Cost $72,605) | | | 33,400 | | | | 36,615 | |
| Turkey 0.6% | |
| Emlak Konut Gayrimenkul Yatirim Ortakligi AS (REIT) | | | 100,000 | | | | 140,774 | |
| Turkiye Halk Bankasi AS | | | 20,000 | | | | 169,056 | |
| (Cost $407,986) | | | | 309,830 | |
| United Kingdom 6.1% | |
| Aveva Group PLC | | | 15,000 | | | | 515,643 | |
| Babcock International Group PLC | | | 8,656 | | | | 145,741 | |
| BP PLC | | | 100,000 | | | | 693,717 | |
| Burberry Group PLC | | | 3,645 | | | | 75,194 | |
| Crest Nicholson Holdings PLC* | | | 11,257 | | | | 54,758 | |
| Domino's Pizza Group PLC | | | 9,879 | | | | 101,032 | |
| Essentra PLC | | | 7,700 | | | | 81,978 | |
| Hargreaves Lansdown PLC | | | 6,942 | | | | 93,368 | |
| HellermannTyton Group PLC* | | | 24,491 | | | | 96,430 | |
| IG Group Holdings PLC | | | 11,488 | | | | 101,644 | |
| Intertek Group PLC | | | 15,000 | | | | 668,393 | |
| | | Shares | | | Value ($) | |
| | | | | | | | | |
| John Wood Group PLC | | | 8,030 | | | | 99,209 | |
| Rotork PLC | | | 2,366 | | | | 95,718 | |
| Spirax-Sarco Engineering PLC | | | 2,643 | | | | 107,480 | |
| (Cost $3,087,664) | | | | 2,930,305 | |
| United States 46.9% | |
| Advance Auto Parts, Inc. | | | 992 | | | | 80,521 | |
| AECOM Technology Corp.* | | | 2,707 | | | | 86,056 | |
| Affiliated Managers Group, Inc.* | | | 706 | | | | 115,742 | |
| Agilent Technologies, Inc. | | | 5,000 | | | | 213,800 | |
| Allergan, Inc. | | | 6,000 | | | | 505,440 | |
| Alliance Data Systems Corp.* (a) | | | 5,000 | | | | 905,150 | |
| Altra Holdings, Inc. | | | 2,110 | | | | 57,772 | |
| Amphenol Corp. "A" | | | 10,000 | | | | 779,400 | |
| Applied Industrial Technologies, Inc. | | | 1,766 | | | | 85,351 | |
| BE Aerospace, Inc.* | | | 1,915 | | | | 120,798 | |
| Beam, Inc. | | | 11,500 | | | | 725,765 | |
| Blount International, Inc.* | | | 4,376 | | | | 51,724 | |
| BorgWarner, Inc.* | | | 1,365 | | | | 117,595 | |
| Bristol-Myers Squibb Co. | | | 7,500 | | | | 335,175 | |
| Cardtronics, Inc.* | | | 2,805 | | | | 77,418 | |
| Catamaran Corp.* | | | 1,985 | | | | 96,709 | |
| CBRE Group, Inc. "A"* | | | 25,000 | | | | 584,000 | |
| Cerner Corp.* (a) | | | 4,200 | | | | 403,578 | |
| Colfax Corp.* | | | 10,000 | | | | 521,100 | |
| Danaher Corp. (a) | | | 10,000 | | | | 633,000 | |
| Deckers Outdoor Corp.* (a) | | | 1,165 | | | | 58,844 | |
| DFC Global Corp.* | | | 7,526 | | | | 103,934 | |
| DIRECTV* | | | 7,500 | | | | 462,150 | |
| Dresser-Rand Group, Inc.* | | | 1,695 | | | | 101,666 | |
| Dril-Quip, Inc.* | | | 944 | | | | 85,234 | |
| eBay, Inc.* | | | 3,800 | | | | 196,536 | |
| Edwards Lifesciences Corp.* (a) | | | 4,500 | | | | 302,400 | |
| Encore Capital Group, Inc.* | | | 2,721 | | | | 90,092 | |
| ExamWorks Group, Inc.* | | | 3,459 | | | | 73,435 | |
| Exelis, Inc. | | | 9,000 | | | | 124,110 | |
| Exxon Mobil Corp. | | | 4,200 | | | | 379,470 | |
| FMC Technologies, Inc.* | | | 9,000 | | | | 501,120 | |
| General Electric Co. | | | 20,000 | | | | 463,800 | |
| Google, Inc. "A"* | | | 550 | | | | 484,203 | |
| Green Mountain Coffee Roasters, Inc.* | | | 1,642 | | | | 123,248 | |
| Hain Celestial Group, Inc.* | | | 1,352 | | | | 87,839 | |
| HeartWare International, Inc.* (a) | | | 1,125 | | | | 106,999 | |
| Hi-Tech Pharmacal Co., Inc. | | | 3,675 | | | | 122,010 | |
| Jack in the Box, Inc.* | | | 1,435 | | | | 56,381 | |
| Jarden Corp.* | | | 2,548 | | | | 111,475 | |
| JPMorgan Chase & Co. | | | 16,000 | | | | 844,640 | |
| L Brands, Inc. | | | 12,000 | | | | 591,000 | |
| Las Vegas Sands Corp. | | | 10,000 | | | | 529,300 | |
| Leucadia National Corp. | | | 3,994 | | | | 104,723 | |
| Manitowoc Co., Inc. (a) | | | 6,058 | | | | 108,499 | |
| MasterCard, Inc. "A" (a) | | | 1,450 | | | | 833,025 | |
| McDonald's Corp. | | | 6,000 | | | | 594,000 | |
| MICROS Systems, Inc.* | | | 1,693 | | | | 73,053 | |
| Microsoft Corp. | | | 16,000 | | | | 552,480 | |
| Middleby Corp.* | | | 688 | | | | 117,022 | |
| Monster Beverage Corp.* (a) | | | 7,000 | | | | 425,390 | |
| National Oilwell Varco, Inc. | | | 6,000 | | | | 413,400 | |
| Noble Energy, Inc. (a) | | | 8,500 | | | | 510,340 | |
| Oasis Petroleum, Inc.* | | | 1,932 | | | | 75,097 | |
| Ocwen Financial Corp.* | | | 3,047 | | | | 125,597 | |
| Oil States International, Inc.* | | | 661 | | | | 61,235 | |
| | | Shares | | | Value ($) | |
| | | | | | | | | |
| Onyx Pharmaceuticals, Inc.* (a) | | | 2,200 | | | | 191,004 | |
| Pacira Pharmaceuticals, Inc.* | | | 5,771 | | | | 167,359 | |
| Pall Corp. (a) | | | 7,500 | | | | 498,225 | |
| Pfizer, Inc. | | | 19,000 | | | | 532,190 | |
| Polaris Industries, Inc. (a) | | | 1,213 | | | | 115,235 | |
| Praxair, Inc. | | | 7,000 | | | | 806,120 | |
| Precision Castparts Corp. | | | 2,700 | | | | 610,227 | |
| PTC, Inc.* | | | 2,159 | | | | 52,960 | |
| Roadrunner Transportation Systems, Inc.* | | | 3,488 | | | | 97,106 | |
| Rosetta Resources, Inc.* | | | 981 | | | | 41,712 | |
| Schlumberger Ltd. | | | 10,000 | | | | 716,600 | |
| Sears Hometown & Outlet Stores, Inc.* | | | 2,142 | | | | 93,648 | |
| Signature Bank* | | | 809 | | | | 67,163 | |
| Stericycle, Inc.* | | | 530 | | | | 58,528 | |
| Tenneco, Inc.* | | | 2,070 | | | | 93,730 | |
| The Bancorp., Inc.* | | | 2,216 | | | | 33,218 | |
| Thermon Group Holdings, Inc.* | | | 4,649 | | | | 94,840 | |
| Thoratec Corp.* | | | 2,807 | | | | 87,887 | |
| TIBCO Software, Inc.* | | | 3,368 | | | | 72,075 | |
| TiVo, Inc.* | | | 3,929 | | | | 43,415 | |
| Tractor Supply Co. (a) | | | 2,600 | | | | 305,786 | |
| Tristate Capital Holdings, Inc.* | | | 4,299 | | | | 59,111 | |
| United Rentals, Inc.* | | | 1,923 | | | | 95,977 | |
| United Technologies Corp. | | | 7,000 | | | | 650,580 | |
| Urban Outfitters, Inc.* | | | 2,157 | | | | 86,755 | |
| WABCO Holdings, Inc.* | | | 1,514 | | | | 113,081 | |
| Waddell & Reed Financial, Inc. "A" (a) | | | 2,494 | | | | 108,489 | |
| | | Shares | | | Value ($) | |
| | | | | | | | | |
| Western Digital Corp. | | | 2,924 | | | | 181,551 | |
| Zions Bancorp. (a) | | | 4,255 | | | | 122,885 | |
| (Cost $22,295,020) | | | | 22,687,298 | |
Total Common Stocks (Cost $47,746,757) | | | | 46,842,289 | |
| | |
| Participatory Note 1.0% | |
| Nigeria | |
| Zenith Bank PLC (issuer Merrill Lynch International), Expiration Date 8/21/2015* (Cost $533,000) | | | 4,100,000 | | | | 499,478 | |
| | |
| Securities Lending Collateral 16.9% | |
| Daily Assets Fund Institutional, 0.10% (d) (e) (Cost $8,186,461) | | | 8,186,461 | | | | 8,186,461 | |
| | |
| Cash Equivalents 1.9% | |
| Central Cash Management Fund, 0.07% (d) (Cost $905,378) | | | 905,378 | | | | 905,378 | |
| | | % of Net Assets | | | Value ($) | |
| | | | |
Total Investment Portfolio (Cost $57,371,596)† | | | 116.6 | | | | 56,433,606 | |
| Other Assets and Liabilities, Net | | | (16.6 | ) | | | (8,026,509 | ) |
| Net Assets | | | 100.0 | | | | 48,407,097 | |
* Non-income producing security.
† The cost for federal income tax purposes was $57,977,545. At June 30, 2013, net unrealized depreciation for all securities based on tax cost was $1,543,939. This consisted of aggregate gross unrealized appreciation for all securities in which there was an excess of value over tax cost of $1,489,386 and aggregate gross unrealized depreciation for all securities in which there was an excess of tax cost over value of $3,033,325.
(a) All or a portion of these securities were on loan (see Notes to Financial Statements). The value of securities loaned at June 30, 2013 amounted to $8,026,573, which is 16.6% of net assets.
(b) Securities with the same description are the same corporate entity but trade on different stock exchanges.
(c) Listed on the New York Stock Exchange.
(d) Affiliated fund managed by Deutsche Investment Management Americas Inc. The rate shown is the annualized seven-day yield at period end.
(e) Represents collateral held in connection with securities lending. Income earned by the Fund is net of borrower rebates.
ADR: American Depositary Receipt
REIT: Real Estate Investment Trust
SDR: Swedish Depositary Receipt
Fair Value Measurements
Various inputs are used in determining the value of the Fund's investments. These inputs are summarized in three broad levels. Level 1 includes quoted prices in active markets for identical securities. Level 2 includes other significant observable inputs (including quoted prices for similar securities, interest rates, prepayment speeds, and credit risk). Level 3 includes significant unobservable inputs (including the Fund's own assumptions in determining the fair value of investments). The inputs or methodology used for valuing securities are not necessarily an indication of the risk associated with investing in those securities.
The following is a summary of the inputs used as of June 30, 2013 in valuing the Fund's investments. For information on the Fund's policy regarding the valuation of investments, please refer to the Security Valuation section of Note A in the accompanying Notes to Financial Statements.
| Assets | | Level 1 | | | Level 2 | | | Level 3 | | | Total | |
| | |
| Common Stocks (f) | |
| Austria | | $ | — | | | $ | 14,322 | | | $ | — | | | $ | 14,322 | |
| Belgium | | | — | | | | 487,934 | | | | — | | | | 487,934 | |
| Bermuda | | | 110,403 | | | | — | | | | — | | | | 110,403 | |
| Canada | | | 2,029,578 | | | | — | | | | — | | | | 2,029,578 | |
| China | | | — | | | | 116,926 | | | | — | | | | 116,926 | |
| Cyprus | | | — | | | | 93,141 | | | | — | | | | 93,141 | |
| Denmark | | | — | | | | 112,070 | | | | — | | | | 112,070 | |
| Finland | | | — | | | | 266,545 | | | | — | | | | 266,545 | |
| France | | | — | | | | 1,880,790 | | | | — | | | | 1,880,790 | |
| Germany | | | — | | | | 2,324,949 | | | | — | | | | 2,324,949 | |
| Hong Kong | | | — | | | | 318,511 | | | | — | | | | 318,511 | |
| India | | | 669,375 | | | | — | | | | — | | | | 669,375 | |
| Indonesia | | | — | | | | 1,140,368 | | | | — | | | | 1,140,368 | |
| Ireland | | | 151,189 | | | | 1,180,344 | | | | — | | | | 1,331,533 | |
| Italy | | | — | | | | 387,048 | | | | — | | | | 387,048 | |
| Japan | | | — | | | | 862,728 | | | | — | | | | 862,728 | |
| Korea | | | — | | | | 510,804 | | | | — | | | | 510,804 | |
| Luxembourg | | | — | | | | 310,024 | | | | — | | | | 310,024 | |
| Malaysia | | | — | | | | 637,387 | | | | — | | | | 637,387 | |
| Mexico | | | 944,810 | | | | — | | | | — | | | | 944,810 | |
| Netherlands | | | 118,664 | | | | 862,825 | | | | — | | | | 981,489 | |
| Norway | | | — | | | | 246,315 | | | | — | | | | 246,315 | |
| Panama | | | 95,426 | | | | — | | | | — | | | | 95,426 | |
| Philippines | | | — | | | | 614,437 | | | | — | | | | 614,437 | |
| Russia | | | 253,926 | | | | 203,875 | | | | — | | | | 457,801 | |
| Singapore | | | — | | | | 249,583 | | | | — | | | | 249,583 | |
| Spain | | | — | | | | 161,749 | | | | — | | | | 161,749 | |
| Sweden | | | — | | | | 2,339,714 | | | | — | | | | 2,339,714 | |
| Switzerland | | | 519,210 | | | | 663,271 | | | | — | | | | 1,182,481 | |
| Thailand | | | — | | | | 36,615 | | | | — | | | | 36,615 | |
| Turkey | | | — | | | | 309,830 | | | | — | | | | 309,830 | |
| United Kingdom | | | — | | | | 2,930,305 | | | | — | | | | 2,930,305 | |
| United States | | | 22,687,298 | | | | — | | | | — | | | | 22,687,298 | |
| Participatory Note (f) | | | — | | | | 499,478 | | | | — | | | | 499,478 | |
| Short-Term Investments (f) | | | 9,091,839 | | | | — | | | | — | | | | 9,091,839 | |
| Total | | $ | 36,671,718 | | | $ | 19,761,888 | | | $ | — | | | $ | 56,433,606 | |
There have been no transfers between fair value measurement levels during the period ended June 30, 2013.
(f) See Investment Portfolio for additional detailed categorizations.
The accompanying notes are an integral part of the financial statements.
Statement of Assets and Liabilities | as of June 30, 2013 (Unaudited) | |
| Assets | |
Investments: Investments in non-affiliated securities, at value (cost $48,279,757) — including $8,026,573 of securities loaned | | | 47,341,767 | |
| Investment in Daily Assets Fund Institutional (cost $8,186,461)* | | | 8,186,461 | |
| Investment in Central Cash Management Fund (cost $905,378) | | | 905,378 | |
| Total investments in securities, at value (cost $57,371,596) | | | 56,433,606 | |
| Cash | | | 5,720 | |
| Foreign currency, at value (cost $178,413) | | | 175,299 | |
| Receivable for investments sold | | | 62,420 | |
| Receivable for Fund shares sold | | | 1,819 | |
| Dividends receivable | | | 41,984 | |
| Interest receivable | | | 1,370 | |
| Foreign taxes recoverable | | | 25,378 | |
| Other assets | | | 451 | |
| Total assets | | | 56,748,047 | |
| Liabilities | |
| Payable upon return of securities loaned | | | 8,186,461 | |
| Payable for investments purchased | | | 2,899 | |
| Payable for Fund shares redeemed | | | 52,262 | |
| Accrued management fee | | | 13,389 | |
| Accrued Trustees' fees | | | 579 | |
| Other accrued expenses and payables | | | 85,360 | |
| Total liabilities | | | 8,340,950 | |
| Net assets, at value | | | 48,407,097 | |
| Net Assets Consist of | |
| Undistributed net investment income | | | 412,328 | |
Net unrealized appreciation (depreciation) on: Investments | | | (937,990 | ) |
| Foreign currency | | | (4,090 | ) |
| Accumulated net realized gain (loss) | | | (44,888,564 | ) |
| Paid-in capital | | | 93,825,413 | |
| Net assets, at value | | | 48,407,097 | |
Class A Net Asset Value, offering and redemption price per share ($45,778,415 ÷ 4,798,176 outstanding shares of beneficial interest, no par value, unlimited number of shares authorized) | | $ | 9.54 | |
Class B Net Asset Value, offering and redemption price per share ($2,628,682 ÷ 274,767 outstanding shares of beneficial interest, no par value, unlimited number of shares authorized) | | $ | 9.57 | |
* Represents collateral on securities loaned.
The accompanying notes are an integral part of the financial statements.
Statement of Operations
| for the six months ended June 30, 2013 (Unaudited) | |
| Investment Income | |
Income: Dividends (net of foreign taxes withheld of $51,898) | | $ | 662,048 | |
| Income distributions — Central Cash Management Fund | | | 362 | |
| Securities lending income, including income from Daily Assets Fund Institutional, net of borrower rebates | | | 19,126 | |
| Total income | | | 681,536 | |
Expenses: Management fee | | | 246,644 | |
| Administration fee | | | 26,956 | |
| Services to shareholders | | | 733 | |
| Record keeping fees (Class B) | | | 1,377 | |
| Distribution service fee (Class B) | | | 3,551 | |
| Custodian fee | | | 44,252 | |
| Audit and tax fees | | | 31,343 | |
| Legal fees | | | 6,725 | |
| Reports to shareholders | | | 13,183 | |
| Trustees' fees and expenses | | | 2,293 | |
| Other | | | 16,606 | |
| Total expenses before expense reductions | | | 393,663 | |
| Expense reductions | | | (144,941 | ) |
| Total expenses after expense reductions | | | 248,722 | |
| Net investment income (loss) | | | 432,814 | |
| Realized and Unrealized Gain (Loss) | |
Net realized gain (loss) from: Investments | | | 8,414,285 | |
| Foreign currency | | | (18,387 | ) |
| | | | 8,395,898 | |
Change in net unrealized appreciation (depreciation) on: Investments | | | (6,058,400 | ) |
| Foreign currency | | | (3,673 | ) |
| | | | (6,062,073 | ) |
| Net gain (loss) | | | 2,333,825 | |
| Net increase (decrease) in net assets resulting from operations | | $ | 2,766,639 | |
The accompanying notes are an integral part of the financial statements.
Statement of Changes in Net Assets | Increase (Decrease) in Net Assets | | Six Months Ended June 30, 2013 (Unaudited) | | | Year Ended December 31, 2012 | |
Operations: Net investment income (loss) | | $ | 432,814 | | | $ | 758,059 | |
| Net realized gain (loss) | | | 8,395,898 | | | | 97,908 | |
| Change in net unrealized appreciation (depreciation) | | | (6,062,073 | ) | | | 8,394,806 | |
| Net increase (decrease) in net assets resulting from operations | | | 2,766,639 | | | | 9,250,773 | |
Distributions to shareholders from: Net investment income: Class A | | | (689,482 | ) | | | (741,039 | ) |
| Class B | | | (27,740 | ) | | | (31,068 | ) |
| Total distributions | | | (717,222 | ) | | | (772,107 | ) |
Fund share transactions: Class A Proceeds from shares sold | | | 1,790,554 | | | | 7,619,915 | |
| Reinvestment of distributions | | | 689,482 | | | | 741,039 | |
| Payments for shares redeemed | | | (12,210,394 | ) | | | (12,066,736 | ) |
| Net increase (decrease) in net assets from Class A share transactions | | | (9,730,358 | ) | | | (3,705,782 | ) |
Class B Proceeds from shares sold | | | 27,930 | | | | 80,402 | |
| Reinvestment of distributions | | | 27,740 | | | | 31,068 | |
| Payments for shares redeemed | | | (406,537 | ) | | | (823,480 | ) |
| Net increase (decrease) in net assets from Class B share transactions | | | (350,867 | ) | | | (712,010 | ) |
| Increase (decrease) in net assets | | | (8,031,808 | ) | | | 4,060,874 | |
| Net assets at beginning of period | | | 56,438,905 | | | | 52,378,031 | |
Net assets at end of period (including undistributed net investment income of $412,328 and $696,736, respectively) | | $ | 48,407,097 | | | $ | 56,438,905 | |
| Other Information | |
Class A Shares outstanding at beginning of period | | | 5,793,732 | | | | 6,234,878 | |
| Shares sold | | | 186,147 | | | | 882,663 | |
| Shares issued to shareholders in reinvestment of distributions | | | 71,746 | | | | 85,967 | |
| Shares redeemed | | | (1,253,449 | ) | | | (1,409,776 | ) |
| Net increase (decrease) in Class A shares | | | (995,556 | ) | | | (441,146 | ) |
| Shares outstanding at end of period | | | 4,798,176 | | | | 5,793,732 | |
Class B Shares outstanding at beginning of period | | | 311,300 | | | | 393,322 | |
| Shares sold | | | 2,930 | | | | 9,525 | |
| Shares issued to shareholders in reinvestment of distributions | | | 2,878 | | | | 3,592 | |
| Shares redeemed | | | (42,341 | ) | | | (95,139 | ) |
| Net increase (decrease) in Class B shares | | | (36,533 | ) | | | (82,022 | ) |
| Shares outstanding at end of period | | | 274,767 | | | | 311,300 | |
The accompanying notes are an integral part of the financial statements.
| | | | | | Years Ended December 31, | |
| Class A | | Six Months Ended 6/30/13 (Unaudited) | | | 2012 | | | 2011 | | | 2010 | | | 2009 | | | 2008 | |
| Selected Per Share Data | |
| Net asset value, beginning of period | | $ | 9.24 | | | $ | 7.90 | | | $ | 9.28 | | | $ | 8.24 | | | $ | 5.84 | | | $ | 15.66 | |
Income (loss) from investment operations: Net investment incomea | | | .08 | | | | .12 | | | | .11 | | | | .06 | | | | .08 | | | | .11 | |
| Net realized and unrealized gain (loss) | | | .35 | | | | 1.34 | | | | (1.43 | ) | | | 1.06 | | | | 2.42 | | | | (5.83 | ) |
| Total from investment operations | | | .43 | | | | 1.46 | | | | (1.32 | ) | | | 1.12 | | | | 2.50 | | | | (5.72 | ) |
Less distributions from: Net investment income | | | (.13 | ) | | | (.12 | ) | | | (.06 | ) | | | (.08 | ) | | | (.10 | ) | | | (.19 | ) |
| Net realized gains | | | — | | | | — | | | | — | | | | — | | | | — | | | | (3.91 | ) |
| Total distributions | | | (.13 | ) | | | (.12 | ) | | | (.06 | ) | | | (.08 | ) | | | (.10 | ) | | | (4.10 | ) |
| Net asset value, end of period | | $ | 9.54 | | | $ | 9.24 | | | $ | 7.90 | | | $ | 9.28 | | | $ | 8.24 | | | $ | 5.84 | |
Total Return (%)b | | | 4.64 | ** | | | 18.60 | | | | (14.39 | ) | | | 13.65 | | | | 43.82 | | | | (47.75 | ) |
| Ratios to Average Net Assets and Supplemental Data | |
| Net assets, end of period ($ millions) | | | 46 | | | | 54 | | | | 49 | | | | 68 | | | | 66 | | | | 59 | |
| Ratio of expenses before expense reductions (%) | | | 1.44 | * | | | 1.42 | | | | 1.37 | | | | 1.41 | | | | 1.38 | | | | 1.47 | |
| Ratio of expenses after expense reductions (%) | | | .90 | * | | | .99 | | | | 1.03 | | | | 1.05 | | | | 1.04 | | | | 1.09 | |
| Ratio of net investment income (%) | | | 1.62 | * | | | 1.40 | | | | 1.24 | | | | .77 | | | | 1.23 | | | | 1.09 | |
| Portfolio turnover rate (%) | | | 138 | ** | | | 107 | | | | 127 | | | | 165 | | | | 190 | | | | 229 | |
a Based on average shares outstanding during the period. b Total return would have been lower had certain expenses not been reduced. * Annualized ** Not annualized | |
| | | | | | Years Ended December 31, | |
| Class B | | Six Months Ended 6/30/13 (Unaudited) | | | 2012 | | | 2011 | | | 2010 | | | 2009 | | | 2008 | |
| Selected Per Share Data | |
| Net asset value, beginning of period | | $ | 9.25 | | | $ | 7.91 | | | $ | 9.29 | | | $ | 8.25 | | | $ | 5.85 | | | $ | 15.66 | |
Income (loss) from investment operations: Net investment incomea | | | .06 | | | | .09 | | | | .08 | | | | .04 | | | | .06 | | | | .07 | |
| Net realized and unrealized gain (loss) | | | .36 | | | | 1.34 | | | | (1.44 | ) | | | 1.05 | | | | 2.42 | | | | (5.83 | ) |
| Total from investment operations | | | .42 | | | | 1.43 | | | | (1.36 | ) | | | 1.09 | | | | 2.48 | | | | (5.76 | ) |
Less distributions from: Net investment income | | | (.10 | ) | | | (.09 | ) | | | (.02 | ) | | | (.05 | ) | | | (.08 | ) | | | (.14 | ) |
| Net realized gains | | | — | | | | — | | | | — | | | | — | | | | — | | | | (3.91 | ) |
| Total distributions | | | (.10 | ) | | | (.09 | ) | | | (.02 | ) | | | (.05 | ) | | | (.08 | ) | | | (4.05 | ) |
| Net asset value, end of period | | $ | 9.57 | | | $ | 9.25 | | | $ | 7.91 | | | $ | 9.29 | | | $ | 8.25 | | | $ | 5.85 | |
Total Return (%)b | | | 4.48 | ** | | | 18.16 | | | | (14.67 | ) | | | 13.24 | | | | 43.23 | | | | (47.87 | ) |
| Ratios to Average Net Assets and Supplemental Data | |
| Net assets, end of period ($ millions) | | | 3 | | | | 3 | | | | 3 | | | | 5 | | | | 5 | | | | 4 | |
| Ratio of expenses before expense reductions (%) | | | 1.79 | * | | | 1.76 | | | | 1.72 | | | | 1.76 | | | | 1.73 | | | | 1.82 | |
| Ratio of expenses after expense reductions (%) | | | 1.25 | * | | | 1.34 | | | | 1.38 | | | | 1.40 | | | | 1.39 | | | | 1.45 | |
| Ratio of net investment income (%) | | | 1.30 | * | | | 1.04 | | | | .88 | | | | .42 | | | | .88 | | | | .73 | |
| Portfolio turnover rate (%) | | | 138 | ** | | | 107 | | | | 127 | | | | 165 | | | | 190 | | | | 229 | |
a Based on average shares outstanding during the period. b Total return would have been lower had certain expenses not been reduced. * Annualized ** Not annualized | |
Notes to Financial Statements (Unaudited)
A. Organization and Significant Accounting Policies
DWS Global Growth VIP (formerly DWS Global Thematic VIP) (the "Fund") is a diversified series of DWS Variable Series II (the "Trust"), which is registered under the Investment Company Act of 1940, as amended (the "1940 Act"), as an open-end management investment company organized as a Massachusetts business trust.
Multiple Classes of Shares of Beneficial Interest. The Fund offers two classes of shares (Class A shares and Class B shares). Sales of Class B shares are subject to recordkeeping fees up to 0.15% and Rule 12b-1 fees under the 1940 Act equal to an annual rate of 0.25% of the average daily net assets for Class B shares of the Fund. Class A shares are not subject to such fees.
Investment income, realized and unrealized gains and losses, and certain fund-level expenses and expense reductions, if any, are borne pro rata on the basis of relative net assets by the holders of all classes of shares except that each class bears certain expenses unique to that class (including the applicable Rule 12b-1 fee and recordkeeping fees). Differences in class-level expenses may result in payment of different per share dividends by class. All shares have equal rights with respect to voting subject to class-specific arrangements.
The Fund's financial statements are prepared in accordance with accounting principles generally accepted in the United States of America which require the use of management estimates. Actual results could differ from those estimates. The policies described below are followed consistently by the Fund in the preparation of its financial statements.
Security Valuation. Investments are stated at value determined as of the close of regular trading on the New York Stock Exchange on each day the exchange is open for trading.
Various inputs are used in determining the value of the Fund's investments. These inputs are summarized in three broad levels. Level 1 includes quoted prices in active markets for identical securities. Level 2 includes other significant observable inputs (including quoted prices for similar securities, interest rates, prepayment speeds, and credit risk). Level 3 includes significant unobservable inputs (including the Fund's own assumptions in determining the fair value of investments). The inputs or methodology used for valuing securities are not necessarily an indication of the risk associated with investing in those securities.
Equity securities are valued at the most recent sale price or official closing price reported on the exchange (U.S. or foreign) or over-the-counter market on which they trade and are categorized as Level 1 securities. Securities for which no sales are reported are valued at the calculated mean between the most recent bid and asked quotations on the relevant market or, if a mean cannot be determined, at the most recent bid quotation. For certain international equity securities, in order to adjust for events which may occur between the close of the foreign exchanges and the close of the New York Stock Exchange, a fair valuation model may be used. This fair valuation model takes into account comparisons to the valuation of American Depository Receipts (ADRs), exchange-traded funds, futures contracts and certain indices and these securities are categorized as Level 2.
Investments in open-end investment companies are valued at their net asset value each business day and are categorized as Level 1.
Securities and other assets for which market quotations are not readily available or for which the above valuation procedures are deemed not to reflect fair value are valued in a manner that is intended to reflect their fair value as determined in accordance with procedures approved by the Board and are generally categorized as Level 3. In accordance with the Fund's valuation procedures, factors used in determining value may include, but are not limited to, the type of the security; the size of the holding; the initial cost of the security; the existence of any contractual restrictions on the security's disposition; the price and extent of public trading in similar securities of the issuer or of comparable companies; quotations or evaluated prices from broker-dealers and/or pricing services; information obtained from the issuer, analysts, and/or the appropriate stock exchange (for exchange-traded securities); an analysis of the company's or issuer's financial statements; an evaluation of the forces that influence the issuer and the market(s) in which the security is purchased and sold and with respect to debt securities; the maturity, coupon, creditworthiness, currency denomination and the movement of the market in which the security is normally traded. The value determined under these procedures may differ from published values for the same securities.
Disclosure about the classification of fair value measurements is included in a table following the Fund's Investment Portfolio.
Foreign Currency Translations. The books and records of the Fund are maintained in U.S. dollars. Investment securities and other assets and liabilities denominated in a foreign currency are translated into U.S. dollars at the prevailing exchange rates at period end. Purchases and sales of investment securities, income and expenses are translated into U.S. dollars at the prevailing exchange rates on the respective dates of the transactions.
Net realized and unrealized gains and losses on foreign currency transactions represent net gains and losses between trade and settlement dates on securities transactions, the acquisition and disposition of foreign currencies, and the difference between the amount of net investment income accrued and the U.S. dollar amount actually received. That portion of both realized and unrealized gains and losses on investments that results from fluctuations in foreign currency exchange rates is not separately disclosed but is included with net realized and unrealized gain/appreciation and loss/depreciation on investments.
Securities Lending. Brown Brothers Harriman & Co., as lending agent, lends securities of the Fund to certain financial institutions under the terms of the Security Lending Agreement. The Fund retains the benefits of owning the securities it has loaned and continues to receive interest and dividends generated by the securities and to participate in any changes in their market value. The Fund requires the borrowers of the securities to maintain collateral with the Fund consisting of either cash or liquid, unencumbered assets having a value at least equal to the value of the securities loaned. When the collateral falls below specified amounts, the lending agent will use its best effort to obtain additional collateral on the next business day to meet required amounts under the security lending agreement. The Fund may invest the cash collateral into a joint trading account in an affiliated money market fund pursuant to Exemptive Orders issued by the SEC. The Fund receives compensation for lending its securities either in the form of fees or by earning interest on invested cash collateral net of borrower rebates and fees paid to a lending agent. Either the Fund or the borrower may terminate the loan. There may be risks of delay and costs in recovery of securities or even loss of rights in the collateral should the borrower of the securities fail financially. If the Fund is not able to recover securities lent, the Fund may sell the collateral and purchase a replacement investment in the market, incurring the risk that the value of the replacement security is greater than the value of the collateral. The Fund is also subject to all investment risks associated with the reinvestment of any cash collateral received, including, but not limited to, interest rate, credit and liquidity risk associated with such investments.
As of June 30, 2013, the Fund had securities on loan with a gross value of $8,026,573. The value of the related collateral, $8,186,461, exceeded the value of the securities loaned at period end.
Participatory Notes. The Fund invests in Participatory Notes (P-Notes). P-Notes are promissory notes designed to offer a return linked to the performance of a particular underlying equity security or market. P-Notes are issued by banks or broker-dealers and allow the Fund to gain exposure to local shares in foreign markets. Investments in P-Notes involve the same risks associated with a direct investment in the underlying foreign companies or foreign markets that they seek to replicate. Although each participation note is structured with a defined maturity date, early redemption may be possible. Risks associated with participation notes include the possible failure of a counterparty to perform in accordance with the terms of the agreement and potential delays or an inability to redeem before maturity under certain market conditions.
Taxes. The Fund's policy is to comply with the requirements of the Internal Revenue Code, as amended, which are applicable to regulated investment companies and to distribute all of its taxable income to its shareholders.
Additionally, the Fund may be subject to taxes imposed by the governments of countries in which it invests and are generally based on income and/or capital gains earned or repatriated. Estimated tax liabilities on certain foreign securities are recorded on an accrual basis and are reflected as components of interest income or net change in unrealized gain/loss on investments. Tax liabilities realized as a result of security sales are reflected as a component of net realized gain/loss on investments.
Under the Regulated Investment Company Modernization Act of 2010, net capital losses incurred post-enactment may be carried forward indefinitely, and their character is retained as short-term and/or long-term. Previously, net capital losses were carried forward for eight years and treated as short-term. As a transition rule, the Act requires that post-enactment net capital losses be used before pre-enactment net capital losses.
At December 31, 2012, the Fund had a net tax basis capital loss carryforward of approximately $52,710,000, including $51,528,000 of pre-enactment losses, which may be applied against any realized net taxable capital gains of each succeeding year until fully utilized or until December 31, 2016 ($33,717,000) and December 31, 2017 ($17,811,000), the respective expiration dates, whichever occurs first; and approximately $1,182,000 of post-enactment losses, which may be applied against realized net taxable capital gains indefinitely, including short-term losses ($775,000) and long-term losses ($407,000).
The Fund has reviewed the tax positions for the open tax years as of December 31, 2012 and has determined that no provision for income tax is required in the Fund's financial statements. The Fund's federal tax returns for the prior three fiscal years remain open subject to examination by the Internal Revenue Service.
Distribution of Income and Gains. Distributions from net investment income of the Fund, if any, are declared and distributed to shareholders annually. Net realized gains from investment transactions, in excess of available capital loss carryforwards, would be taxable to the Fund if not distributed and, therefore, will be distributed to shareholders at least annually. The Fund may also make additional distributions for tax purposes if necessary.
The timing and characterization of certain income and capital gain distributions are determined annually in accordance with federal tax regulations which may differ from accounting principles generally accepted in the United States of America. These differences primarily relate to investments in foreign denominated investments, income received from Passive Foreign Investment Companies and certain securities sold at a loss. As a result, net investment income (loss) and net realized gain (loss) on investment transactions for a reporting period may differ significantly from distributions during such period. Accordingly, the Fund may periodically make reclassifications among certain of its capital accounts without impacting the net asset value of the Fund.
The tax character of current year distributions will be determined at the end of the current fiscal year.
Expenses. Expenses of the Trust arising in connection with a specific fund are allocated to that fund. Other Trust expenses which cannot be directly attributed to a fund are apportioned among the funds in the Trust based upon the relative net assets or other appropriate measures.
Contingencies. In the normal course of business, the Fund may enter into contracts with service providers that contain general indemnification clauses. The Fund's maximum exposure under these arrangements is unknown as this would involve future claims that may be made against the Fund that have not yet been made. However, based on experience, the Fund expects the risk of loss to be remote.
Other. Investment transactions are accounted for on a trade date plus one basis for daily net asset value calculations. However, for financial reporting purposes, investment transactions are reported on trade date. Interest income is recorded on the accrual basis. Dividend income is recorded on the ex-dividend date net of foreign withholding taxes. Certain dividends from foreign securities may be recorded subsequent to the ex-dividend date as soon as the Fund is informed of such dividends. Realized gains and losses from investment transactions are recorded on an identified cost basis and may include proceeds from litigation.
B. Purchases and Sales of Securities
During the six months ended June 30, 2013, purchases and sales of investment transactions (excluding short-term investments) aggregated $73,674,739 and $84,656,183, respectively.
C. Related Parties
Management Agreement. Under the Investment Management Agreement with Deutsche Investment Management Americas Inc. ("DIMA" or the "Advisor"), an indirect, wholly owned subsidiary of Deutsche Bank AG, the Advisor directs the investments of the Fund in accordance with its investment objectives, policies and restrictions. The Advisor determines the securities, instruments and other contracts relating to investments to be purchased, sold or entered into by the Fund or delegates such responsibility to the Fund's subadvisor.
Global Thematic Partners, LLC ("GTP") served as subadvisor to the Fund through April 30, 2013. GTP or the "Subadvisor" was paid by the Advisor for the service GTP provided to the Fund. Effective as of the close of business on April 30, 2013, the sub-advisory agreement with GTP was terminated and day-to-day portfolio management of the Fund transitioned to DIMA. At that time, the Fund's name changed from "DWS Global Thematic VIP" to "DWS Global Growth VIP."
Pursuant to the Investment Management Agreement with the Advisor, the Fund pays a monthly management fee based on the Fund's average daily net assets, computed and accrued daily and payable monthly, at the following annual rates:
| First $250 million | | | .915 | % |
| Next $500 million | | | .865 | % |
| Next $750 million | | | .815 | % |
| Next $1.5 billion | | | .765 | % |
| Over $3 billion | | | .715 | % |
For the period from January 1, 2013 through September 30, 2013, the Advisor has contractually agreed to waive its fee and/or reimburse certain operating expenses to the extent necessary to maintain the operating expenses (excluding certain expenses such as extraordinary expenses, taxes, brokerage and interest expense) of each class as follows:
Accordingly, for the six months ended June 30, 2013, the Advisor waived a portion of its management fee pursuant to the Investment Management Agreement aggregating $144,800, and the amount charged aggregated $101,844, which was equivalent to an annualized effective rate of 0.38% of the Fund's average daily net assets.
Administration Fee. Pursuant to an Administrative Services Agreement, DIMA provides most administrative services to the Fund. For all services provided under the Administrative Services Agreement, the Fund pays DIMA an annual fee ("Administration Fee") of 0.10% of the Fund's average daily net assets, computed and accrued daily and payable monthly. For the six months ended June 30, 2013, the Administration Fee was $26,956, of which $4,083 is unpaid.
Service Provider Fees. DWS Investments Service Company ("DISC"), an affiliate of the Advisor, is the transfer agent, dividend-paying agent and shareholder service agent for the Fund. Pursuant to a sub-transfer agency agreement between DISC and DST Systems, Inc. ("DST"), DISC has delegated certain transfer agent, dividend-paying agent and shareholder service agent functions to DST. DISC compensates DST out of the shareholder servicing fee it receives from the Fund. For the six months ended June 30, 2013, the amounts charged to the Fund by DISC were as follows:
| Services to Shareholders | | Total Aggregated | | | Waived | |
| Class A | | $ | 130 | | | $ | 130 | |
| Class B | | | 30 | | | | 11 | |
| | | $ | 160 | | | $ | 141 | |
Distribution Service Agreement. Under the Fund's Class B 12b-1 plans, DWS Investments Distributors, Inc. ("DIDI") received a fee ("Distribution Service Fee") of 0.25% of average daily net assets of Class B shares. For the six months ended June 30, 2013, the Distribution Service Fee aggregated $3,551, of which $571 is unpaid.
Typesetting and Filing Service Fees. Under an agreement with DIMA, DIMA is compensated for providing typesetting and certain regulatory filing services to the Fund. For the six months ended June 30, 2013, the amount charged to the Fund by DIMA included in the Statement of Operations under "reports to shareholders" aggregated $7,662, of which $6,833 is unpaid.
Trustees' Fees and Expenses. The Fund paid retainer fees to each Trustee not affiliated with the Advisor, plus specified amounts to the Board Chairperson and Vice Chairperson and to each committee Chairperson.
Affiliated Cash Management Vehicles. The Fund may invest uninvested cash balances in Central Cash Management Fund and DWS Variable NAV Money Fund, affiliated money market funds which are managed by the Advisor. Each affiliated money market fund seeks to provide a high level of current income consistent with liquidity and the preservation of capital. Each affiliated money market fund is managed in accordance with Rule 2a-7 under the Investment Company Act of 1940, which governs the quality, maturity, diversity and liquidity of instruments in which a money market fund may invest. Central Cash Management Fund seeks to maintain a stable net asset value, and DWS Variable NAV Money Fund maintains a floating net asset value. The Fund indirectly bears its proportionate share of the expenses of each affiliated money market fund in which it invests. Central Cash Management Fund does not pay the Advisor an investment management fee. To the extent that DWS Variable NAV Money Fund pays an investment management fee to the Advisor, the Advisor will waive an amount of the investment management fee payable to the Advisor by the Fund equal to the amount of the investment management fee payable on the Fund's assets invested in DWS Variable NAV Money Fund.
D. Investing in Emerging Markets
Investing in emerging markets may involve special risks and considerations not typically associated with investing in developed markets. These risks include revaluation of currencies, high rates of inflation or deflation, repatriation restrictions on income and capital, and future adverse political, social and economic developments. Moreover, securities issued in these markets may be less liquid, subject to government ownership controls or delayed settlements, and may have prices that are more volatile or less easily assessed than those of comparable securities of issuers in developed markets.
E. Ownership of the Fund
At June 30, 2013, two Participating Insurance Companies were owners of record of 10% or more of the total outstanding Class A shares of the Fund, each owning 71% and 24%. One Participating Insurance Company was the owner of record of 10% or more of the total outstanding Class B shares of the Fund, owning 96%.
F. Line of Credit
The Fund and other affiliated funds (the "Participants") share in a $375 million revolving credit facility provided by a syndication of banks. The Fund may borrow for temporary or emergency purposes, including the meeting of redemption requests that otherwise might require the untimely disposition of securities. The Participants are charged an annual commitment fee which is allocated based on net assets, among each of the Participants. Interest is calculated at a rate per annum equal to the sum of the Federal Funds Rate plus 1.25 percent plus if LIBOR exceeds the Federal Funds Rate the amount of such excess. The Fund may borrow up to a maximum of 33 percent of its net assets under the agreement. The Fund had no outstanding loans at June 30, 2013.
G. Changes to Fund Name and Investment Strategy
Effective May 1, 2013, DWS Global Thematic VIP changed its name to DWS Global Growth VIP and the sub-advisory agreement with Global Thematic Partners, LLC was terminated and the day-to-day management of the Fund was transitioned to Deutsche Investment Management Americas Inc. Effective that same day, the Fund's investment strategy changed and the Fund seeks to achieve its objective by allocating its assets among a global growth sleeve and a small cap growth sleeve. For a description of the Fund's investment strategy, please see the Fund's current prospectus dated May 1, 2013.
Information About Your Fund's Expenses (Unaudited)
As an investor of the Fund, you incur two types of costs: ongoing expenses and transaction costs. Ongoing expenses include management fees, distribution and service (12b-1) fees and other Fund expenses. Examples of transaction costs include contract charges, redemption fees and account maintenance fees, which are not shown in this section. The following tables are intended to help you understand your ongoing expenses (in dollars) of investing in the Fund and to help you compare these expenses with the ongoing expenses of investing in other mutual funds. In the most recent six-month period, the Fund limited these expenses; had it not done so, expenses would have been higher. The example in the table is based on an investment of $1,000 invested at the beginning of the six-month period and held for the entire period (January 1, 2013 to June 30, 2013).
The tables illustrate your Fund's expenses in two ways:
•Actual Fund Return. This helps you estimate the actual dollar amount of ongoing expenses (but not transaction costs) paid on a $1,000 investment in the Fund using the Fund's actual return during the period. To estimate the expenses you paid over the period, simply divide your account value by $1,000 (for example, an $8,600 account value divided by $1,000 = 8.6), then multiply the result by the number in the "Expenses Paid per $1,000" line under the share class you hold.
• Hypothetical 5% Fund Return. This helps you to compare your Fund's ongoing expenses (but not transaction costs) with those of other mutual funds using the Fund's actual expense ratio and a hypothetical rate of return of 5% per year before expenses. Examples using a 5% hypothetical Fund return may be found in the shareholder reports of other mutual funds. The hypothetical account values and expenses may not be used to estimate the actual ending account balance or expenses you paid for the period.
Please note that the expenses shown in these tables are meant to highlight your ongoing expenses only and do not reflect any transaction costs. The "Expenses Paid per $1,000" line of the tables is useful in comparing ongoing expenses only and will not help you determine the relative total expense of owning different funds. If these transaction costs had been included, your costs would have been higher.
Expenses and Value of a $1,000 Investment for the six months ended June 30, 2013 | |
| Actual Fund Return | | Class A | | | Class B | |
| Beginning Account Value 1/1/13 | | $ | 1,000.00 | | | $ | 1,000.00 | |
| Ending Account Value 6/30/13 | | $ | 1,046.40 | | | $ | 1,044.80 | |
| Expenses Paid per $1,000* | | $ | 4.57 | | | $ | 6.34 | |
| Hypothetical 5% Fund Return | | Class A | | | Class B | |
| Beginning Account Value 1/1/13 | | $ | 1,000.00 | | | $ | 1,000.00 | |
| Ending Account Value 6/30/13 | | $ | 1,020.33 | | | $ | 1,018.60 | |
| Expenses Paid per $1,000* | | $ | 4.51 | | | $ | 6.26 | |
* Expenses are equal to the Fund's annualized expense ratio for each share class, multiplied by the average account value over the period, multiplied by 181 (the number of days in the most recent six-month period), then divided by 365.
| Annualized Expense Ratios | Class A | | Class B | |
| DWS Variable Series II — DWS Global Growth VIP | .90% | | 1.25% | |
For more information, please refer to the Fund's prospectus.
These tables do not reflect charges and fees ("contract charges") associated with the separate account that invests in the Fund or any variable life insurance policy or variable annuity contract for which the Fund is an investment option.
For an analysis of the fees associated with an investment in the Fund or similar funds, please refer to http://apps.finra.org/fundanalyzer/1/fa.aspx.
The Trust's policies and procedures for voting proxies for portfolio securities and information about how the Trust voted proxies related to its portfolio securities during the 12-month period ended June 30 are available on our Web site — www.dws-investments.com (click on "proxy voting" at the bottom of the page) — or on the SEC's Web site — www.sec.gov. To obtain a written copy of the Trust's policies and procedures without charge, upon request, call us toll free at (800) 728-3337.
Summary of Management Fee Evaluation by Independent Fee Consultant
September 17, 2012
Pursuant to an Order entered into by Deutsche Investment Management Americas and affiliates (collectively, "DeAM") with the Attorney General of New York, I, Thomas H. Mack, have been appointed the Independent Fee Consultant for the DWS Funds (formerly the DWS Scudder Funds). My duties include preparing an annual written evaluation of the management fees DeAM charges the Funds, considering among other factors the management fees charged by other mutual fund companies for like services, management fees DeAM charges other clients for like services, DeAM's costs of supplying services under the management agreements and related profit margins, possible economies of scale if a Fund grows larger, and the nature and quality of DeAM's services, including fund performance. This report summarizes my evaluation for 2012, including my qualifications, the evaluation process for each of the DWS Funds, consideration of certain complex-level factors, and my conclusions. I served in substantially the same capacity in 2007, 2008, 2009, 2010 and 2011.
Qualifications
For more than 35 years I have served in various professional capacities within the investment management business. I have held investment analysis and advisory positions, including securities analyst, portfolio strategist and director of investment policy with a large investment firm. I have also performed business management functions, including business development, financial management and marketing research and analysis.
Since 1991, I have been an independent consultant within the asset management industry. I have provided services to over 125 client organizations, including investment managers, mutual fund boards, product distributors and related organizations. Over the past ten years I have completed a number of assignments for mutual fund boards, specifically including assisting boards with management contract renewal.
I hold a Master of Business Administration degree, with highest honors, from Harvard University and Master of Science and Bachelor of Science (highest honors) degrees from the University of California at Berkeley. I am an independent director and audit committee financial expert for two closed-end mutual funds and have served in various leadership and financial oversight capacities with non-profit organizations.
Evaluation of Fees for each DWS Fund
My work focused primarily on evaluating, fund-by-fund, the fees charged to each of the 103 mutual fund portfolios in the DWS Fund family. For each Fund, I considered each of the key factors mentioned above, as well as any other relevant information. In doing so I worked closely with the Funds' Independent Directors in their annual contract renewal process, as well as in their approval of contracts for several new funds (documented separately).
In evaluating each Fund's fees, I reviewed comprehensive materials provided by or on behalf of DeAM, including expense information prepared by Lipper Analytical, comparative performance information, profitability data, manager histories, and other materials. I also accessed certain additional information from the Lipper and Morningstar databases and drew on my industry knowledge and experience.
To facilitate evaluating this considerable body of information, I prepared for each Fund a document summarizing the key data elements in each area as well as additional analytics discussed below. This made it possible to consider each key data element in the context of the others.
In the course of contract renewal, DeAM agreed to implement a number of fee and expense adjustments requested by the Independent Directors which will favorably impact future fees and expenses, and my evaluation includes the effects of these changes.
Fees and Expenses Compared with Other Funds
The competitive fee and expense evaluation for each fund focused on two primary comparisons:
The Fund's contractual management fee (the advisory fee plus the administration fee where applicable) compared with those of a group of typically 12-15 funds in the same Lipper investment category (e.g. Large Capitalization Growth) having similar distribution arrangements and being of similar size.
The Fund's total expenses compared with a broader universe of funds from the same Lipper investment category and having similar distribution arrangements.
These two comparisons provide a view of not only the level of the fee compared with funds of similar scale but also the total expense the Fund bears for all the services it receives, in comparison with the investment choices available in the Fund's investment category and distribution channel. The principal figure-of-merit used in these comparisons was the subject Fund's percentile ranking against peers.
DeAM's Fees for Similar Services to Others
DeAM provided management fee schedules for all of its US domiciled fund and non-fund investment management accounts in any of the investment categories where there is a DWS Fund. These similar products included the other DWS Funds, non-fund pooled accounts, institutional accounts and sub-advisory accounts. Using this information, I calculated for each Fund the fee that would be charged to each similar product, at the subject Fund's asset level.
Evaluating information regarding non-fund products is difficult because there are varying levels of services required for different types of accounts, with mutual funds generally requiring considerably more regulatory and administrative types of service as well as having more frequent cash flows than other types of accounts. Also, while mutual fund fees for similar fund products can be expected to be similar, there will be some differences due to different pricing conditions in different distribution channels (e.g. retail funds versus those used in variable insurance products), differences in underlying investment processes and other factors.
Costs and Profit Margins
DeAM provided a detailed profitability analysis for each Fund. After making some adjustments so that the presentation would be more comparable to the available industry figures, I reviewed profit margins from investment management alone, from investment management plus other fund services (excluding distribution) provided to the Funds by DeAM (principally shareholder services), and DeAM profits from all sources, including distribution. A later section comments on overall profitability.
Economies of Scale
Economies of scale — an expected decline in management cost per dollar of fund assets as fund assets grow — are very rarely quantified and documented because of inherent difficulties in collecting and analyzing relevant data. However, in virtually every investment category that I reviewed, larger funds tend to have lower fees and lower total expenses than smaller funds. To see how each DWS Fund compares with this industry observation, I reviewed:
The trend in Fund assets over the last five years and the accompanying trend in total expenses. This shows if the Fund has grown and, if so, whether total expense (management fees as well as other expenses) have declined as a percent of assets.
Whether the Fund has break-points in its management fee schedule, the extent of the fee reduction built into the schedule and the asset levels where the breaks take effect, and in the case of a sub-advised Fund how the Fund's break-points compare with those of the sub-advisory fee schedule.
How the Fund's contractual fee schedule compares with trends in the industry data. To accomplish this, I constructed a chart showing how actual latest-fiscal-year contractual fees of the Fund and of other similar funds relate to average fund assets, with the subject Fund's contractual fee schedule superimposed.
Quality of Service — Performance
The quality-of-service evaluation focused on investment performance, which is the principal result of the investment management service. Each Fund's performance was reviewed over the past 1, 3, 5 and 10 years, as applicable, and compared with that of other funds in the same investment category and with a suitable market index.
In addition, I calculated and reviewed risk-adjusted returns relative to an index of similar mutual funds' returns and a suitable market index. The risk-adjusted returns analysis provides a way of determining the extent to which the Fund's return comparisons are mainly the product of investment value-added (or lack thereof) or alternatively taking considerably more or less risk than is typical in its investment category.
I also received and considered the history of portfolio manager changes for each Fund, as this provided an important context for evaluating the performance results.
Complex-Level Considerations
While this evaluation was conducted mainly at the individual fund level, there are some issues relating to the reasonableness of fees that can alternatively be considered across the whole fund complex:
I reviewed DeAM's profitability analysis for all DWS Funds, with a view toward determining if the allocation procedures used were reasonable and how profit levels compared with public data for other investment managers.
I considered whether DeAM and affiliates receive any significant ancillary or "fallout" benefits that should be considered in interpreting the direct profitability results. These would be situations where serving as the investment manager of the Funds is beneficial to another part of the Deutsche Bank organization.
I considered how aggregated DWS Fund expenses had varied over the years, by asset class and in the context of trends in asset levels.
I considered how aggregated DWS Fund performance measures relative to appropriate peers had varied by asset class and over time.
I reviewed the structure of the DeAM organization, trends in staffing levels, and information on compensation of investment management and other professionals compared with industry data.
Findings
Based on the process and analysis discussed above, which included reviewing a wide range of information from management and external data sources and considering among other factors the fees DeAM charges other clients, the fees charged by other fund managers, DeAM's costs and profits associated with managing the Funds, economies of scale, possible fall-out benefits, and the nature and quality of services provided, in my opinion the management fees charged the DWS Funds are reasonable.
Thomas H. Mack
President, Thomas H. Mack & Co., Inc.
Notes
DWS Investments Distributors, Inc.
222 South Riverside Plaza
Chicago, IL 60606
(800) 621-1148
VS2GG-3 (R-028383-2 8/13)
JUNE 30, 2013
SEMIANNUAL REPORT
DWS VARIABLE SERIES II
DWS Global Income Builder VIP
Contents
22 Statement of Assets and Liabilities 23 Statement of Operations 24 Statement of Changes in Net Assets 26 Notes to Financial Statements 34 Information About Your Fund's Expenses 36 Summary of Management Fee Evaluation by Independent Fee Consultant |
This report must be preceded or accompanied by a prospectus. To obtain an additional prospectus or summary prospectus, if available, call (800) 728-3337 or your financial representative. We advise you to consider the Fund's objectives, risks, charges and expenses carefully before investing. The summary prospectus and prospectus contain this and other important information about the Fund. Please read the prospectus carefully before you invest.
Although allocation among different asset categories generally limits risk, Fund management may favor an asset category that underperforms other assets or markets as a whole. Bond investments are subject to interest-rate and credit risks. When interest rates rise, bond prices generally fall. Credit risk refers to the ability of an issuer to make timely payments of principal and interest. Investing in derivatives entails special risks relating to liquidity, leverage and credit that may reduce returns and/or increase volatility. Dividends are not guaranteed. If the dividend-paying stocks held by the Fund reduce or stop paying dividends, the Fund's ability to generate income may be adversely affected. Because Exchange Traded Funds (ETFs) trade on a securities exchange, their shares may trade at a premium or discount to their net asset value. ETFs also incur fees and expenses so they may not fully match the performance of the indexes they are designed to track. Investing in foreign securities, particularly those of emerging markets, presents certain risks, such as currency fluctuations, political and economic changes, and market risks. The Fund may lend securities to approved institutions. Stocks may decline in value. See the prospectus for details.
DWS Investments is part of the Deutsche Asset & Wealth Management division of Deutsche Bank AG.
NOT FDIC/NCUA INSURED NO BANK GUARANTEE MAY LOSE VALUE NOT A DEPOSIT
NOT INSURED BY ANY FEDERAL GOVERNMENT AGENCY
Performance Summary June 30, 2013 (Unaudited)
Fund performance shown is historical, assumes reinvestment of all dividend and capital gain distributions and does not guarantee future results. Investment return and principal value fluctuate with changing market conditions so that, when redeemed, shares may be worth more or less than their original cost. Current performance may be lower or higher than the performance data quoted. Please contact your participating insurance company for the Fund's most recent month-end performance. Performance doesn't reflect charges and fees ("contract charges") associated with the separate account that invests in the Fund or any variable life insurance policy or variable annuity contract for which the Fund is an investment option. These charges and fees will reduce returns.
The gross expense ratio of the Fund, as stated in the fee table of the prospectus dated May 1, 2013 is 0.60% for Class A shares and may differ from the expense ratio disclosed in the Financial Highlights table in this report.
| Growth of an Assumed $10,000 Investment in DWS Global Income Builder VIP |
 | The Russell 1000® Index is an unmanaged index that measures the performance of the 1,000 largest companies in the Russell 3000® Index, which represents approximately 92% of the total market capitalization of the Russell 3000® Index. The Barclays U.S. Aggregate Bond Index is an unmanaged index representing domestic taxable investment-grade bonds, with index components for government and corporate securities, mortgage pass-through securities, and asset-backed securities with an average maturity of one year or more. The S&P® Target Risk Moderate Index is designed to measure the performance of S&P's proprietary moderate target risk allocation model. The S&P® Target Risk Moderate Index seeks to provide significant exposure to fixed income, while also allocating a smaller portion of exposure to equities in order to seek current income, some capital preservation, and an opportunity for moderate to low capital appreciation. Index returns do not reflect any fees or expenses and it is not possible to invest directly into an index. |
| |
| Yearly periods ended June 30 | |
| Comparative Results | |
| DWS Global Income Builder VIP | | 6-Month‡ | | | 1-Year | | | 3-Year | | | 5-Year | | | 10-Year | |
| Class A | Growth of $10,000 | | $ | 10,484 | | | $ | 11,186 | | | $ | 13,381 | | | $ | 12,194 | | | $ | 16,205 | |
| Average annual total return | | | 4.84 | % | | | 11.86 | % | | | 10.19 | % | | | 4.05 | % | | | 4.95 | % |
Russell 1000® Index | Growth of $10,000 | | $ | 11,391 | | | $ | 12,124 | | | $ | 16,695 | | | $ | 14,104 | | | $ | 20,938 | |
| Average annual total return | | | 13.91 | % | | | 21.24 | % | | | 18.63 | % | | | 7.12 | % | | | 7.67 | % |
| Barclays U.S. Aggregate Bond Index | Growth of $10,000 | | $ | 9,756 | | | $ | 9,931 | | | $ | 11,090 | | | $ | 12,878 | | | $ | 15,559 | |
| Average annual total return | | | -2.44 | % | | | -0.69 | % | | | 3.51 | % | | | 5.19 | % | | | 4.52 | % |
S&P® Target Risk Moderate Index | Growth of $10,000 | | $ | 10,249 | | | $ | 10,718 | | | $ | 12,526 | | | $ | 11,990 | | | $ | 17,048 | |
| Average annual total return | | | 2.49 | % | | | 7.18 | % | | | 7.80 | % | | | 3.70 | % | | | 5.48 | % |
The growth of $10,000 is cumulative.
‡ Total returns shown for periods less than one year are not annualized.
Portfolio Summary (Unaudited) Asset Allocation (As a % of Investment Portfolio excluding Securities Lending Collateral) | 6/30/13 | 12/31/12 |
| | | |
| Equity | 57% | 55% |
| Common Stocks | 57% | 55% |
| | | |
| Fixed Income | 37% | 44% |
| Corporate Bonds | 24% | 28% |
| Government & Agency Obligations | 5% | 6% |
| Mortgage-Backed Securities Pass-Throughs | 4% | 3% |
| Collateralized Mortgage Obligations | 2% | 2% |
| Commercial Mortgage-Backed Securities | 1% | 1% |
| Loan Participations and Assignments | 1% | 3% |
| Asset-Backed | 0% | 1% |
| | | |
| Cash Equivalents | 6% | 1% |
| | 100% | 100% |
Sector Diversification (As a % of Equities, Corporate Bonds, Loan Participations and Assignments, Preferred Securities, Preferred Stocks, Convertible Bonds and Other Investments) | 6/30/13 | 12/31/12 |
| | | |
| Consumer Staples | 17% | 13% |
| Financials | 14% | 19% |
| Health Care | 13% | 11% |
| Consumer Discretionary | 12% | 8% |
| Information Technology | 10% | 8% |
| Energy | 9% | 13% |
| Telecommunication Services | 8% | 7% |
| Materials | 7% | 8% |
| Utilities | 6% | 7% |
| Industrials | 4% | 6% |
| | 100% | 100% |
Portfolio holdings and characteristics are subject to change.
For more complete details about the Fund's investment portfolio, see page 5.
Following the Fund's fiscal first and third quarter-end, a complete portfolio holdings listing is filed with the SEC on Form N-Q. The form will be available on the SEC's Web site at www.sec.gov, and it also may be reviewed and copied at the SEC's Public Reference Room in Washington, D.C. Information on the operation of the SEC's Public Reference Room may be obtained by calling (800) SEC-0330. The Fund's portfolio holdings are also posted on www.dws-investments.com from time to time. Please see the Fund's current prospectus for more information.
Owen Fitzpatrick, CFA, Managing Director
William Chepolis, CFA, Managing Director
Philip G. Condon, Managing Director
Gary Russell, CFA, Managing Director
John D. Ryan, Director
Darwei Kung, Director
Louis Cucciniello, Managing Director
Portfolio Managers
Investment Portfolio June 30, 2013 (Unaudited) | | | Shares | | | Value ($) | |
| | | | |
| Common Stocks 58.5% | |
| Consumer Discretionary 4.9% | |
| Distributors 0.6% | |
| Genuine Parts Co. | | | 20,971 | | | | 1,637,206 | |
| Hotels, Restaurants & Leisure 0.0% | |
| Trump Entertainment Resorts, Inc.* | | | 2 | | | | 0 | |
| Media 2.8% | |
| Pearson PLC | | | 146,342 | | | | 2,598,407 | |
| Vertis Holdings, Inc.* | | | 111 | | | | 0 | |
| Wolters Kluwer NV | | | 213,753 | | | | 4,507,773 | |
| | | | | | | | 7,106,180 | |
| Specialty Retail 0.8% | |
| Staples, Inc. (a) | | | 127,563 | | | | 2,023,149 | |
| Textiles, Apparel & Luxury Goods 0.7% | |
| VF Corp. | | | 9,370 | | | | 1,808,972 | |
| Consumer Staples 12.6% | |
| Beverages 3.1% | |
| PepsiCo, Inc. | | | 96,586 | | | | 7,899,769 | |
| Food Products 2.0% | |
| Nestle SA (Registered) | | | 38,522 | | | | 2,519,586 | |
| Unilever NV (CVA) | | | 70,398 | | | | 2,761,491 | |
| | | | | | | | 5,281,077 | |
| Household Products 3.9% | |
| Procter & Gamble Co. | | | 131,022 | | | | 10,087,384 | |
| Tobacco 3.6% | |
| Altria Group, Inc. | | | 22,297 | | | | 780,172 | |
| British American Tobacco PLC | | | 75,001 | | | | 3,851,556 | |
| Imperial Tobacco Group PLC | | | 133,518 | | | | 4,639,105 | |
| | | | | | | | 9,270,833 | |
| Energy 5.1% | |
| Energy Equipment & Services 1.2% | |
| Transocean Ltd. | | | 49,591 | | | | 2,377,888 | |
| WorleyParsons Ltd. | | | 41,890 | | | | 740,695 | |
| | | | | | | | 3,118,583 | |
| Oil, Gas & Consumable Fuels 3.9% | |
| Canadian Natural Resources Ltd. (b) | | | 148,747 | | | | 4,193,543 | |
| Canadian Natural Resources Ltd. (b) | | | 19,470 | | | | 550,222 | |
| ConocoPhillips | | | 36,670 | | | | 2,218,535 | |
| Enbridge, Inc. (a) | | | 37,678 | | | | 1,583,859 | |
| TransCanada Corp. (a) | | | 35,400 | | | | 1,524,115 | |
| | | | | | | | 10,070,274 | |
| Financials 6.4% | |
| Commercial Banks 1.7% | |
| Bank of Nova Scotia (a) | | | 42,153 | | | | 2,253,344 | |
| Toronto-Dominion Bank (a) | | | 26,057 | | | | 2,092,835 | |
| | | | | | | | 4,346,179 | |
| Insurance 4.7% | |
| PartnerRe Ltd. | | | 64,143 | | | | 5,808,790 | |
| Powszechny Zaklad Ubezpieczen SA | | | 19,922 | | | | 2,454,784 | |
| Sampo Oyj "A" | | | 97,659 | | | | 3,789,963 | |
| | | | | | | | 12,053,537 | |
| | | Shares | | | Value ($) | |
| | | | �� | | | | | |
| Health Care 9.1% | |
| Health Care Equipment & Supplies 1.3% | |
| Stryker Corp. | | | 53,814 | | | | 3,480,689 | |
| Health Care Providers & Services 2.0% | |
| Rhoen-Klinikum AG (a) | | | 217,864 | | | | 5,025,158 | |
| Pharmaceuticals 5.8% | |
| Novartis AG (Registered) | | | 70,713 | | | | 5,011,388 | |
| Roche Holding AG (Genusschein) | | | 22,895 | | | | 5,673,023 | |
| Sanofi | | | 40,368 | | | | 4,160,208 | |
| | | | | | | | 14,844,619 | |
| Industrials 3.9% | |
| Aerospace & Defense 0.8% | |
| BAE Systems PLC | | | 333,558 | | | | 1,949,569 | |
| Air Freight & Logistics 0.7% | |
| Singapore Post Ltd. | | | 1,691,000 | | | | 1,731,169 | |
| Building Products 0.0% | |
| Congoleum Corp.* | | | 3,800 | | | | 0 | |
| Industrial Conglomerates 2.4% | |
| Koninklijke Philips NV | | | 132,940 | | | | 3,621,084 | |
| Smiths Group PLC | | | 132,457 | | | | 2,642,884 | |
| | | | | | | | 6,263,968 | |
| Information Technology 6.5% | |
| Computers & Peripherals 2.1% | |
| Diebold, Inc. | | | 73,183 | | | | 2,465,535 | |
| Wincor Nixdorf AG | | | 53,134 | | | | 2,873,238 | |
| | | | | | | | 5,338,773 | |
| IT Services 0.8% | |
| Automatic Data Processing, Inc. | | | 29,631 | | | | 2,040,391 | |
| Semiconductors & Semiconductor Equipment 0.2% | |
| Intel Corp. (a) | | | 16,106 | | | | 390,087 | |
| Software 3.4% | |
| Microsoft Corp. | | | 255,967 | | | | 8,838,540 | |
| Materials 4.1% | |
| Chemicals 1.5% | |
| Air Liquide SA | | | 20,107 | | | | 2,473,600 | |
| Air Products & Chemicals, Inc. (a) | | | 16,448 | | | | 1,506,143 | |
| | | | | | | | 3,979,743 | |
| Construction Materials 0.0% | |
| Wolverine Tube, Inc.* | | | 366 | | | | 6,632 | |
| Containers & Packaging 1.6% | |
| Sealed Air Corp. | | | 104,279 | | | | 2,497,482 | |
| Sonoco Products Co. | | | 44,783 | | | | 1,548,148 | |
| | | | | | | | 4,045,630 | |
| Metals & Mining 1.0% | |
| Franco-Nevada Corp. (a) | | | 69,992 | | | | 2,505,657 | |
| Telecommunication Services 1.9% | |
| Diversified Telecommunication Services 0.1% | |
| Belgacom SA | | | 16,948 | | | | 378,734 | |
| Wireless Telecommunication Services 1.8% | |
| NTT DoCoMo, Inc. | | | 1,761 | | | | 2,736,321 | |
| Vodafone Group PLC | | | 647,520 | | | | 1,858,199 | |
| | | | | | | | 4,594,520 | |
| | | Shares | | | Value ($) | |
| | | | | | | | | |
| Utilities 4.0% | |
| Gas Utilities 2.9% | |
| UGI Corp. | | | 191,311 | | | | 7,482,173 | |
| Multi-Utilities 1.1% | |
| National Grid PLC | | | 245,568 | | | | 2,777,739 | |
Total Common Stocks (Cost $130,104,883) | | | | 150,376,934 | |
| | |
| Preferred Stock 0.0% | |
| Financials | |
| Ally Financial, Inc. 144A, 7.0% (Cost $71,281) | | | 75 | | | | 71,290 | |
| | |
| Warrants 0.0% | |
| Consumer Discretionary 0.0% | |
| Reader's Digest Association, Inc., Expiration Date 2/19/2014* | | | 80 | | | | 0 | |
| Materials 0.0% | |
| GEO Specialty Chemicals, Inc., Expiration Date 3/31/2015* | | | 19,324 | | | | 11,345 | |
| Hercules Trust II, Expiration Date 3/31/2029* | | | 170 | | | | 2,249 | |
| | | | | | | | 13,594 | |
Total Warrants (Cost $30,283) | | | | 13,594 | |
| | | Principal Amount ($)(c) | | | Value ($) | |
| | | | |
| Corporate Bonds 25.0% | |
| Consumer Discretionary 3.5% | |
| AMC Entertainment, Inc., 8.75%, 6/1/2019 | | | | 405,000 | | | | 433,350 | |
| AmeriGas Finance LLC: | |
| 6.75%, 5/20/2020 | | | | 10,000 | | | | 10,350 | |
| 7.0%, 5/20/2022 | | | | 10,000 | | | | 10,225 | |
| APX Group, Inc., 144A, 6.375%, 12/1/2019 | | | | 50,000 | | | | 47,500 | |
| Asbury Automotive Group, Inc.: | |
| 7.625%, 3/15/2017 | | | | 35,000 | | | | 36,007 | |
| 144A, 8.375%, 11/15/2020 | | | | 15,000 | | | | 16,613 | |
| Ashtead Capital, Inc., 144A, 6.5%, 7/15/2022 | | | | 80,000 | | | | 83,400 | |
| Ashton Woods U.S.A. LLC, 144A, 6.875%, 2/15/2021 | | | | 80,000 | | | | 80,800 | |
| Avis Budget Car Rental LLC: | |
| 144A, 5.5%, 4/1/2023 | | | | 50,000 | | | | 48,250 | |
| 8.25%, 1/15/2019 | | | | 15,000 | | | | 16,313 | |
| BC Mountain LLC, 144A, 7.0%, 2/1/2021 | | | | 50,000 | | | | 51,000 | |
| Block Communications, Inc., 144A, 7.25%, 2/1/2020 | | | | 20,000 | | | | 21,000 | |
| Boyd Gaming Corp., 9.0%, 7/1/2020 (a) | | | | 40,000 | | | | 40,550 | |
| British Sky Broadcasting Group PLC, 144A, 3.125%, 11/26/2022 | | | | 90,000 | | | | 84,160 | |
| Caesar's Entertainment Operating Co., Inc., 8.5%, 2/15/2020 | | | | 610,000 | | | | 574,925 | |
| Caesar's Operating Escrow LLC, 144A, 9.0%, 2/15/2020 | | | | 65,000 | | | | 61,912 | |
| | | Principal Amount ($)(c) | | | Value ($) | |
| | | | | | | | | |
| CCO Holdings LLC: | |
| 6.5%, 4/30/2021 | | | | 420,000 | | | | 437,850 | |
| 6.625%, 1/31/2022 | | | | 705,000 | | | | 734,962 | |
| 7.375%, 6/1/2020 | | | | 10,000 | | | | 10,875 | |
| CDR DB Sub, Inc., 144A, 7.75%, 10/15/2020 | | | | 55,000 | | | | 55,137 | |
| Cequel Communications Holdings I LLC: | | |
| 144A, 5.125%, 12/15/2021 | | | | 65,000 | | | | 61,100 | |
| 144A, 6.375%, 9/15/2020 | | | | 285,000 | | | | 289,987 | |
| Clear Channel Communications, Inc., 144A, 11.25%, 3/1/2021 | | | | 70,000 | | | | 72,975 | |
| Clear Channel Worldwide Holdings, Inc.: | | |
| Series A, 144A, 6.5%, 11/15/2022 | | | | 65,000 | | | | 66,625 | |
| Series B, 144A, 6.5%, 11/15/2022 | | | | 90,000 | | | | 92,700 | |
| Series A, 7.625%, 3/15/2020 | | | | 10,000 | | | | 10,300 | |
| Series B, 7.625%, 3/15/2020 | | | | 255,000 | | | | 263,925 | |
| Cogeco Cable, Inc., 144A, 4.875%, 5/1/2020 | | | | 5,000 | | | | 4,863 | |
| Columbus International, Inc., 144A, 11.5%, 11/20/2014 | | | | 100,000 | | | | 107,750 | |
| Cox Communications, Inc., 144A, 3.25%, 12/15/2022 | | | | 80,000 | | | | 75,266 | |
| Cumulus Media Holdings, Inc., 7.75%, 5/1/2019 | | | | 50,000 | | | | 48,875 | |
| Delphi Corp., 5.0%, 2/15/2023 | | | | 70,000 | | | | 71,925 | |
| DISH DBS Corp., 7.875%, 9/1/2019 | | | | 270,000 | | | | 302,400 | |
| Fontainebleau Las Vegas Holdings LLC, 144A, 11.0%, 6/15/2015* | | | | 25,000 | | | | 0 | |
| Griffey Intermediate, Inc., 144A, 7.0%, 10/15/2020 | | | | 95,000 | | | | 91,675 | |
| Harron Communications LP, 144A, 9.125%, 4/1/2020 | | | | 45,000 | | | | 48,600 | |
| Hertz Corp.: | |
| 144A, 4.25%, 4/1/2018 | | | | 45,000 | | | | 43,875 | |
| 6.75%, 4/15/2019 | | | | 280,000 | | | | 296,100 | |
| Hot Topic, Inc., 144A, 9.25%, 6/15/2021 | | | | 40,000 | | | | 40,500 | |
| Jo-Ann Stores Holdings, Inc., 144A, 9.75%, 10/15/2019 (PIK) | | | | 120,000 | | | | 123,300 | |
| Libbey Glass, Inc., 6.875%, 5/15/2020 | | | | 27,000 | | | | 28,249 | |
| LKQ Corp., 144A, 4.75%, 5/15/2023 | | | | 80,000 | | | | 76,400 | |
| MDC Partners, Inc., 144A, 6.75%, 4/1/2020 | | | | 40,000 | | | | 39,900 | |
| Mediacom Broadband LLC, 6.375%, 4/1/2023 | | | | 35,000 | | | | 34,825 | |
| Mediacom LLC, 9.125%, 8/15/2019 | | | | 580,000 | | | | 623,500 | |
| MGM Resorts International: | |
| 6.625%, 12/15/2021 | | | | 150,000 | | | | 154,687 | |
| 6.75%, 10/1/2020 (a) | | | | 40,000 | | | | 41,400 | |
| 8.625%, 2/1/2019 | | | | 400,000 | | | | 452,000 | |
| National CineMedia LLC, 6.0%, 4/15/2022 | | | | 10,000 | | | | 10,263 | |
| Petco Holdings, Inc., 144A, 8.5%, 10/15/2017 (PIK) | | | | 30,000 | | | | 30,600 | |
| | | Principal Amount ($)(c) | | | Value ($) | |
| | | | | | | | | |
| Quebecor Media, Inc., 5.75%, 1/15/2023 | | | | 50,000 | | | | 48,750 | |
| Rent-A-Center, Inc., 144A, 4.75%, 5/1/2021 | | | | 40,000 | | | | 37,900 | |
| SACI Falabella, 144A, 3.75%, 4/30/2023 | | | | 200,000 | | | | 183,000 | |
| Schaeffler Finance BV, 144A, 7.75%, 2/15/2017 | | | | 845,000 | | | | 933,725 | |
| Seminole Hard Rock Entertainment, Inc., 144A, 5.875%, 5/15/2021 | | | | 35,000 | | | | 33,950 | |
| Serta Simmons Holdings LLC, 144A, 8.125%, 10/1/2020 | | | | 55,000 | | | | 55,962 | |
| SIWF Merger Sub, Inc., 144A, 6.25%, 6/1/2021 | | | | 85,000 | | | | 83,300 | |
| Starz LLC, 5.0%, 9/15/2019 | | | | 40,000 | | | | 39,700 | |
| Taylor Morrison Communities, Inc., 144A, 5.25%, 4/15/2021 | | | | 65,000 | | | | 61,750 | |
| Travelport LLC, 144A, 6.4%**, 3/1/2016 | | | | 11,536 | | | | 10,786 | |
| Unitymedia Hessen GmbH & Co., KG: | | |
| 144A, 5.5%, 1/15/2023 | | | | 200,000 | | | | 189,000 | |
| 144A, 7.5%, 3/15/2019 | EUR | | | 400,000 | | | | 552,811 | |
| Unitymedia KabelBW GmbH, 144A, 9.625%, 12/1/2019 | EUR | | | 110,000 | | | | 157,500 | |
| Univision Communications, Inc., 144A, 6.875%, 5/15/2019 | | | | 25,000 | | | | 26,250 | |
| Viking Cruises Ltd., 144A, 8.5%, 10/15/2022 | | | | 50,000 | | | | 54,750 | |
| | | | | 8,928,878 | |
| Consumer Staples 1.6% | |
| B&G Foods, Inc., 4.625%, 6/1/2021 | | | | 70,000 | | | | 66,850 | |
| Chiquita Brands International, Inc., 144A, 7.875%, 2/1/2021 | | | | 45,000 | | | | 47,138 | |
| ConAgra Foods, Inc., 3.25%, 9/15/2022 | | | | 235,000 | | | | 224,186 | |
| Constellation Brands, Inc.: | |
| 3.75%, 5/1/2021 | | | | 65,000 | | | | 60,856 | |
| 6.0%, 5/1/2022 | | | | 5,000 | | | | 5,363 | |
| Controladora Mabe SA de CV, 144A, 7.875%, 10/28/2019 | | | | 100,000 | | | | 107,000 | |
| Del Monte Corp., 7.625%, 2/15/2019 | | | | 95,000 | | | | 97,612 | |
| Hawk Acquisition Sub, Inc., 144A, 4.25%, 10/15/2020 | | | | 465,000 | | | | 444,656 | |
| JBS U.S.A. LLC, 144A, 8.25%, 2/1/2020 | | | | 370,000 | | | | 387,575 | |
| MHP SA, 144A, 8.25%, 4/2/2020 | | | | 200,000 | | | | 178,165 | |
| Minerva Luxembourg SA, 144A, 12.25%, 2/10/2022 | | | | 250,000 | | | | 298,750 | |
| Mriya Agro Holding PLC, 144A, 9.45%, 4/19/2018 | | | | 200,000 | | | | 178,000 | |
| Pilgrim's Pride Corp., 7.875%, 12/15/2018 | | | | 430,000 | | | | 457,950 | |
| Reynolds Group Issuer, Inc.: | |
| 5.75%, 10/15/2020 | | | | 95,000 | | | | 95,712 | |
| 7.125%, 4/15/2019 | | | | 1,015,000 | | | | 1,072,094 | |
| Smithfield Foods, Inc., 6.625%, 8/15/2022 | | | | 145,000 | | | | 155,875 | |
| Sun Products Corp., 144A, 7.75%, 3/15/2021 | | | | 90,000 | | | | 89,325 | |
| | | Principal Amount ($)(c) | | | Value ($) | |
| | | | | | | | | |
| Tops Holding Corp., 144A, 8.875%, 12/15/2017 | | | | 25,000 | | | | 27,063 | |
| | | | | 3,994,170 | |
| Energy 2.6% | |
| Access Midstream Partners LP: | |
| 4.875%, 5/15/2023 | | | | 60,000 | | | | 55,650 | |
| 6.125%, 7/15/2022 | | | | 15,000 | | | | 15,188 | |
| Afren PLC, 144A, 10.25%, 4/8/2019 | | | | 200,000 | | | | 223,500 | |
| Berry Petroleum Co.: | |
| 6.375%, 9/15/2022 | | | | 50,000 | | | | 49,812 | |
| 6.75%, 11/1/2020 | | | | 50,000 | | | | 51,750 | |
| BreitBurn Energy Partners LP, 7.875%, 4/15/2022 | | | | 50,000 | | | | 51,000 | |
| Chaparral Energy, Inc., 7.625%, 11/15/2022 | | | | 85,000 | | | | 86,700 | |
| Chesapeake Energy Corp., 5.75%, 3/15/2023 | | | | 25,000 | | | | 25,313 | |
| Continental Resources, Inc.: | |
| 144A, 4.5%, 4/15/2023 | | | | 15,000 | | | | 14,588 | |
| 5.0%, 9/15/2022 | | | | 40,000 | | | | 40,700 | |
| Crosstex Energy LP, 7.125%, 6/1/2022 | | | | 25,000 | | | | 25,250 | |
| DCP Midstream LLC, 144A, 9.75%, 3/15/2019 | | | | 200,000 | | | | 257,926 | |
| Denbury Resources, Inc., 4.625%, 7/15/2023 | | | | 125,000 | | | | 115,312 | |
| Eagle Rock Energy Partners LP, 8.375%, 6/1/2019 | | | | 90,000 | | | | 91,575 | |
| EDC Finance Ltd., 144A, 4.875%, 4/17/2020 | | | | 200,000 | | | | 183,000 | |
| Enterprise Products Operating LLC, 6.125%, 10/15/2039 | | | | 230,000 | | | | 255,778 | |
| EP Energy LLC: | |
| 6.875%, 5/1/2019 | | | | 15,000 | | | | 16,050 | |
| 7.75%, 9/1/2022 | | | | 80,000 | | | | 85,600 | |
| EPE Holdings LLC, 144A, 8.125%, 12/15/2017 (PIK) (a) | | | 114,717 | | | | 117,011 | |
| EV Energy Partners LP, 8.0%, 4/15/2019 | | | | 35,000 | | | | 35,350 | |
| FMC Technologies, Inc., 3.45%, 10/1/2022 | | | | 200,000 | | | | 191,587 | |
| Halcon Resources Corp.: | |
| 8.875%, 5/15/2021 | | | | 135,000 | | | | 130,950 | |
| 9.75%, 7/15/2020 | | | | 65,000 | | | | 64,837 | |
| Holly Energy Partners LP, 6.5%, 3/1/2020 | | | | 10,000 | | | | 10,075 | |
| KazMunayGas National Co. JSC, 144A, 5.75%, 4/30/2043 | | | | 200,000 | | | | 177,000 | |
| Kodiak Oil & Gas Corp., 144A, 5.5%, 1/15/2021 (a) | | | | 60,000 | | | | 58,500 | |
| Linn Energy LLC: | |
| 144A, 6.25%, 11/1/2019 | | | | 540,000 | | | | 514,350 | |
| 6.5%, 5/15/2019 | | | | 25,000 | | | | 24,438 | |
| Lukoil International Finance BV, 144A, 7.25%, 11/5/2019 | | | | 250,000 | | | | 280,375 | |
| MEG Energy Corp., 144A, 6.375%, 1/30/2023 | | | | 230,000 | | | | 223,100 | |
| Memorial Production Partners LP, 144A, 7.625%, 5/1/2021 | | | | 95,000 | | | | 93,575 | |
| Midstates Petroleum Co., Inc.: | |
| 144A, 9.25%, 6/1/2021 | | | | 135,000 | | | | 126,900 | |
| 144A, 10.75%, 10/1/2020 | | | | 55,000 | | | | 55,275 | |
| | | Principal Amount ($)(c) | | | Value ($) | |
| | | | | | | | | |
| Murray Energy Corp., 144A, 8.625%, 6/15/2021 | | | | 15,000 | | | | 15,000 | |
| Northern Oil & Gas, Inc., 8.0%, 6/1/2020 | | | | 140,000 | | | | 141,400 | |
| Oasis Petroleum, Inc.: | |
| 6.5%, 11/1/2021 | | | | 225,000 | | | | 230,625 | |
| 6.875%, 1/15/2023 | | | | 35,000 | | | | 36,050 | |
| 7.25%, 2/1/2019 | | | | 60,000 | | | | 62,550 | |
| Odebrecht Drilling Norbe VIII/IX Ltd., 144A, 6.35%, 6/30/2021 | | | | 95,000 | | | | 95,950 | |
| Offshore Group Investment Ltd.: | |
| 144A, 7.125%, 4/1/2023 | | | | 100,000 | | | | 98,250 | |
| 7.5%, 11/1/2019 (a) | | | | 140,000 | | | | 145,950 | |
| ONEOK Partners LP, 6.15%, 10/1/2016 | | | | 201,000 | | | | 229,151 | |
| Pacific Drilling SA, 144A, 5.375%, 6/1/2020 | | | | 70,000 | | | | 65,450 | |
| Pacific Rubiales Energy Corp., 144A, 5.125%, 3/28/2023 | | | | 200,000 | | | | 189,000 | |
| Petroleos de Venezuela SA, 144A, 8.5%, 11/2/2017 | | | | 250,000 | | | | 229,062 | |
| Plains Exploration & Production Co., 6.75%, 2/1/2022 | | | | 15,000 | | | | 15,897 | |
| Range Resources Corp., 5.0%, 3/15/2023 | | | | 25,000 | | | | 24,438 | |
| Regency Energy Partners LP, 144A, 4.5%, 11/1/2023 | | | | 25,000 | | | | 22,625 | |
| Reliance Holdings U.S.A., Inc., 144A, 5.4%, 2/14/2022 | | | | 250,000 | | | | 253,972 | |
| Sabine Pass Liquefaction LLC, 144A, 5.625%, 2/1/2021 | | | | 175,000 | | | | 169,750 | |
| SandRidge Energy, Inc., 7.5%, 3/15/2021 | | | | 190,000 | | | | 181,450 | |
| SESI LLC, 7.125%, 12/15/2021 | | | | 30,000 | | | | 32,400 | |
| Talos Production LLC, 144A, 9.75%, 2/15/2018 | | | | 95,000 | | | | 90,250 | |
| Tesoro Corp., 5.375%, 10/1/2022 | | | | 35,000 | | | | 35,437 | |
| Transocean, Inc., 3.8%, 10/15/2022 | | | | 370,000 | | | | 352,444 | |
| Transportadora de Gas Internacional SA ESP, 144A, 5.7%, 3/20/2022 | | | | 200,000 | | | | 206,500 | |
| | | | | 6,671,616 | |
| Financials 4.8% | |
| Ally Financial, Inc.: | |
| 5.5%, 2/15/2017 | | | | 15,000 | | | | 15,672 | |
| 6.25%, 12/1/2017 | | | | 560,000 | | | | 599,071 | |
| American International Group, Inc., 4.875%, 6/1/2022 | | | | 200,000 | | | | 213,185 | |
| American Tower Corp., (REIT), 3.5%, 1/31/2023 | | | | 90,000 | | | | 82,411 | |
| Banco de Credito del Peru, 144A, 4.25%, 4/1/2023 | | | | 200,000 | | | | 184,500 | |
| Banco Santander Brasil SA: | |
| 144A, 4.625%, 2/13/2017 | | | | 250,000 | | | | 253,750 | |
| 144A, 8.0%, 3/18/2016 | BRL | | | 300,000 | | | | 123,692 | |
| Bank of America Corp., 3.3%, 1/11/2023 | | | | 105,000 | | | | 99,240 | |
| | | Principal Amount ($)(c) | | | Value ($) | |
| | | | | | | | | |
| Barclays Bank PLC, 7.625%, 11/21/2022 (a) | | | | 250,000 | | | | 245,312 | |
| BBVA Bancomer SA, 144A, 6.5%, 3/10/2021 | | | | 200,000 | | | | 210,000 | |
| BNP Paribas SA, 3.25%, 3/3/2023 | | | | 450,000 | | | | 413,663 | |
| CIT Group, Inc.: | |
| 4.25%, 8/15/2017 | | | | 495,000 | | | | 497,475 | |
| 5.0%, 5/15/2017 | | | | 935,000 | | | | 954,869 | |
| 5.25%, 3/15/2018 | | | | 10,000 | | | | 10,275 | |
| CNH Capital LLC, 144A, 3.625%, 4/15/2018 | | | | 100,000 | | | | 95,250 | |
| Cooperatieve Centrale Raiffeisen-Boerenleenbank BA, 3.95%, 11/9/2022 | | | | 260,000 | | | | 248,631 | |
| Development Bank of Kazakhstan JSC, Series 3, 6.5%, 6/3/2020 | | | | 500,000 | | | | 525,000 | |
| E*TRADE Financial Corp.: | |
| 6.375%, 11/15/2019 | | | | 140,000 | | | | 142,100 | |
| 6.75%, 6/1/2016 | | | | 745,000 | | | | 765,487 | |
| Ford Motor Credit Co., LLC: | |
| 3.0%, 6/12/2017 | | | | 200,000 | | | | 200,422 | |
| 5.875%, 8/2/2021 | | | | 260,000 | | | | 283,465 | |
| General Motors Financial Co., Inc., 144A, 3.25%, 5/15/2018 (a) | | | | 25,000 | | | | 24,313 | |
| Glencore Funding LLC, 144A, 4.125%, 5/30/2023 | | | | 100,000 | | | | 89,188 | |
| Hartford Financial Services Group, Inc.: | | |
| 4.3%, 4/15/2043 (a) | | | | 410,000 | | | | 355,116 | |
| 6.0%, 1/15/2019 | | | | 117,000 | | | | 131,894 | |
| Host Hotels & Resorts LP, Series D, (REIT), 3.75%, 10/15/2023 | | | | 110,000 | | | | 100,886 | |
| ING Bank NV, 144A, 2.0%, 9/25/2015 | | | | 375,000 | | | | 378,180 | |
| International Lease Finance Corp.: | | |
| 3.875%, 4/15/2018 | | | | 100,000 | | | | 94,000 | |
| 4.625%, 4/15/2021 | | | | 90,000 | | | | 82,800 | |
| 6.25%, 5/15/2019 | | | | 410,000 | | | | 421,275 | |
| 8.625%, 1/15/2022 | | | | 10,000 | | | | 11,500 | |
| 8.75%, 3/15/2017 | | | | 40,000 | | | | 44,550 | |
| Intesa Sanpaolo SpA, 3.875%, 1/16/2018 | | | | 200,000 | | | | 192,042 | |
| Jefferies Group LLC, 5.125%, 1/20/2023 (a) | | | | 60,000 | | | | 59,537 | |
| Loews Corp., 2.625%, 5/15/2023 | | | | 65,000 | | | | 59,123 | |
| Macquarie Bank Ltd., 144A, 3.45%, 7/27/2015 | | | | 130,000 | | | | 134,722 | |
| Morgan Stanley: | |
| 3.75%, 2/25/2023 | | | | 125,000 | | | | 119,535 | |
| 4.1%, 5/22/2023 | | | | 85,000 | | | | 78,533 | |
| MPT Operating Partnership LP, (REIT), 6.375%, 2/15/2022 | | | | 10,000 | | | | 10,500 | |
| Neuberger Berman Group LLC: | |
| 144A, 5.625%, 3/15/2020 | | | | 10,000 | | | | 10,350 | |
| 144A, 5.875%, 3/15/2022 | | | | 550,000 | | | | 561,000 | |
| Nordea Bank AB, 144A, 4.25%, 9/21/2022 | | | | 375,000 | | | | 369,966 | |
| OPB Finance Trust, Series C, 2.9%, 5/24/2023 | CAD | | | 330,000 | | | | 298,434 | |
| | | Principal Amount ($)(c) | | | Value ($) | |
| | | | | | | | | |
| PNC Bank NA, 6.875%, 4/1/2018 | | | | 300,000 | | | | 359,808 | |
| Principal Financial Group, Inc., 3.3%, 9/15/2022 | | | | 305,000 | | | | 296,286 | |
| RCI Banque SA, 144A, 3.5%, 4/3/2018 | | | | 100,000 | | | | 99,508 | |
| Royal Bank of Scotland Group PLC, 6.1%, 6/10/2023 (a) | | | | 100,000 | | | | 94,871 | |
| Santander U.S. Debt SA, 144A, 2.991%, 10/7/2013 | | | | 500,000 | | | | 502,851 | |
| Skandinaviska Enskilda Banken AB, 144A, 1.375%, 5/29/2018 | | | | 552,000 | | | | 531,742 | |
| SLM Corp., 5.5%, 1/25/2023 (a) | | | | 125,000 | | | | 119,026 | |
| The Goldman Sachs Group, Inc., 3.625%, 1/22/2023 (a) | | | | 165,000 | | | | 157,868 | |
| Turkiye Is Bankasi, 144A, 6.0%, 10/24/2022 | | | | 250,000 | | | | 244,375 | |
| Turkiye Vakiflar Bankasi Tao, 144A, 3.75%, 4/15/2018 | | | | 250,000 | | | | 235,000 | |
| Ventas Realty LP, (REIT), 2.7%, 4/1/2020 | | | | 90,000 | | | | 85,099 | |
| | | | | 12,517,348 | |
| Health Care 1.3% | |
| Agilent Technologies, Inc., 3.2%, 10/1/2022 | | | | 200,000 | | | | 185,407 | |
| Aviv Healthcare Properties LP, 7.75%, 2/15/2019 | | | | 10,000 | | | | 10,675 | |
| Biomet, Inc.: | |
| 6.5%, 8/1/2020 | | | | 85,000 | | | | 87,603 | |
| 6.5%, 10/1/2020 (a) | | | | 25,000 | | | | 24,938 | |
| Community Health Systems, Inc.: | | |
| 5.125%, 8/15/2018 | | | | 290,000 | | | | 294,350 | |
| 7.125%, 7/15/2020 | | | | 170,000 | | | | 175,100 | |
| Fresenius Medical Care U.S. Finance II, Inc.: | | |
| 144A, 5.625%, 7/31/2019 | | | | 10,000 | | | | 10,400 | |
| 144A, 5.875%, 1/31/2022 | | | | 15,000 | | | | 15,788 | |
| Fresenius Medical Care U.S. Finance, Inc., 144A, 6.5%, 9/15/2018 | | | | 10,000 | | | | 10,875 | |
| HCA, Inc.: | |
| 6.5%, 2/15/2020 | | | | 880,000 | | | | 952,050 | |
| 7.5%, 2/15/2022 | | | | 725,000 | | | | 802,937 | |
| Hologic, Inc., 6.25%, 8/1/2020 | | | | 40,000 | | | | 41,475 | |
| IMS Health, Inc., 144A, 6.0%, 11/1/2020 | | | | 60,000 | | | | 61,050 | |
| Laboratory Corp. of America Holdings, 3.75%, 8/23/2022 | | | | 140,000 | | | | 133,733 | |
| Mallinckrodt International Finance SA, 144A, 4.75%, 4/15/2023 | | | | 110,000 | | | | 104,787 | |
| Physio-Control International, Inc., 144A, 9.875%, 1/15/2019 | | | | 15,000 | | | | 16,500 | |
| Sky Growth Acquisition Corp., 144A, 7.375%, 10/15/2020 | | | | 40,000 | | | | 41,000 | |
| Tenet Healthcare Corp.: | |
| 144A, 4.375%, 10/1/2021 | | | | 110,000 | | | | 100,925 | |
| 144A, 4.5%, 4/1/2021 | | | | 10,000 | | | | 9,325 | |
| 6.25%, 11/1/2018 | | | | 230,000 | | | | 242,075 | |
| | | Principal Amount ($)(c) | | | Value ($) | |
| | | | | | | | | |
| Zoetis, Inc., 144A, 3.25%, 2/1/2023 | | | | 45,000 | | | | 42,755 | |
| | | | | 3,363,748 | |
| Industrials 1.9% | |
| Accuride Corp., 9.5%, 8/1/2018 | | | | 10,000 | | | | 10,175 | |
| Aeropuertos Dominicanos Siglo XXI SA, 144A, 9.25%, 11/13/2019 | | | | 250,000 | | | | 250,625 | |
| Air Lease Corp., 4.75%, 3/1/2020 | | | | 75,000 | | | | 72,375 | |
| Alphabet Holding Co., Inc., 7.75%, 11/1/2017 (PIK) | | | | 50,000 | | | | 51,250 | |
| BE Aerospace, Inc., 6.875%, 10/1/2020 | | | | 185,000 | | | | 199,800 | |
| Belden, Inc., 144A, 5.5%, 9/1/2022 | | | | 85,000 | | | | 83,512 | |
| Bombardier, Inc., 144A, 5.75%, 3/15/2022 | | | | 628,000 | | | | 623,290 | |
| Clean Harbors, Inc., 5.125%, 6/1/2021 | | | | 65,000 | | | | 65,487 | |
| DigitalGlobe, Inc., 144A, 5.25%, 2/1/2021 | | | | 35,000 | | | | 33,600 | |
| Ferreycorp SAA, 144A, 4.875%, 4/26/2020 | | | | 200,000 | | | | 188,000 | |
| FTI Consulting, Inc., 144A, 6.0%, 11/15/2022 | | | | 50,000 | | | | 50,625 | |
| Garda World Security Corp., 144A, 9.75%, 3/15/2017 | | | | 5,000 | | | | 5,204 | |
| GenCorp, Inc., 144A, 7.125%, 3/15/2021 | | | | 185,000 | | | | 191,475 | |
| Grupo KUO SAB De CV, 144A, 6.25%, 12/4/2022 | | | | 200,000 | | | | 204,750 | |
| Huntington Ingalls Industries, Inc., 6.875%, 3/15/2018 | | | | 560,000 | | | | 598,500 | |
| Ingersoll-Rand Global Holding Co., Ltd., 144A, 2.875%, 1/15/2019 | | | | 20,000 | | | | 19,730 | |
| Iron Mountain, Inc., 5.75%, 8/15/2024 | | | | 60,000 | | | | 56,250 | |
| JSC Georgian Railway, 144A, 7.75%, 7/11/2022 | | | | 250,000 | | | | 270,175 | |
| Kenan Advantage Group, Inc., 144A, 8.375%, 12/15/2018 | | | | 100,000 | | | | 104,000 | |
| Meritor, Inc., 6.75%, 6/15/2021 | | | | 55,000 | | | | 52,525 | |
| Navios Maritime Holdings, Inc., 8.875%, 11/1/2017 | | | | 60,000 | | | | 62,100 | |
| Navios South American Logistics, Inc., 144A, 9.25%, 4/15/2019 | | | | 15,000 | | | | 16,088 | |
| Nortek, Inc., 8.5%, 4/15/2021 | | | | 155,000 | | | | 165,850 | |
| Odebrecht Finance Ltd., 144A, 7.125%, 6/26/2042 | | | | 250,000 | | | | 242,500 | |
| Owens Corning, Inc., 4.2%, 12/15/2022 | | | | 60,000 | | | | 58,139 | |
| Ply Gem Industries, Inc., 9.375%, 4/15/2017 | | | | 24,000 | | | | 25,380 | |
| Titan International, Inc., 144A, 7.875%, 10/1/2017 | | | | 35,000 | | | | 36,750 | |
| Total System Services, Inc., 3.75%, 6/1/2023 | | | | 80,000 | | | | 74,281 | |
| TransDigm, Inc.: | |
| 144A, 7.5%, 7/15/2021 (d) | | | | 100,000 | | | | 102,250 | |
| 7.75%, 12/15/2018 | | | | 80,000 | | | | 84,200 | |
| Transnet SOC Ltd., 144A, 4.0%, 7/26/2022 | | | | 500,000 | | | | 437,200 | |
| U.S. Airways Group, Inc., 6.125%, 6/1/2018 | | | | 70,000 | | | | 66,150 | |
| | | Principal Amount ($)(c) | | | Value ($) | |
| | | | | | | | | |
| United Rentals North America, Inc.: | |
| 6.125%, 6/15/2023 | | | | 10,000 | | | | 9,950 | |
| 7.375%, 5/15/2020 | | | | 25,000 | | | | 26,687 | |
| 7.625%, 4/15/2022 | | | | 270,000 | | | | 292,275 | |
| Watco Companies LLC, 144A, 6.375%, 4/1/2023 | | | | 40,000 | | | | 39,800 | |
| | | | | 4,870,948 | |
| Information Technology 1.5% | |
| Alliance Data Systems Corp., 144A, 5.25%, 12/1/2017 | | | | 60,000 | | | | 61,800 | |
| CDW LLC, 8.5%, 4/1/2019 | | | | 610,000 | | | | 655,750 | |
| CyrusOne LP, 144A, 6.375%, 11/15/2022 | | | | 25,000 | | | | 25,625 | |
| EarthLink, Inc., 144A, 7.375%, 6/1/2020 | | | | 70,000 | | | | 67,200 | |
| Equinix, Inc.: | |
| 4.875%, 4/1/2020 | | | | 60,000 | | | | 58,800 | |
| 5.375%, 4/1/2023 | | | | 175,000 | | | | 171,500 | |
| 7.0%, 7/15/2021 | | | | 470,000 | | | | 509,950 | |
| First Data Corp.: | |
| 144A, 6.75%, 11/1/2020 | | | | 365,000 | | | | 371,387 | |
| 144A, 7.375%, 6/15/2019 | | | | 725,000 | | | | 744,937 | |
| Fiserv, Inc., 3.5%, 10/1/2022 | | | | 250,000 | | | | 237,281 | |
| Freescale Semiconductor, Inc., 144A, 9.25%, 4/15/2018 | | | | 305,000 | | | | 328,638 | |
| Hewlett-Packard Co., 3.3%, 12/9/2016 | | | | 200,000 | | | | 207,610 | |
| Hughes Satellite Systems Corp.: | |
| 6.5%, 6/15/2019 | | | | 60,000 | | | | 63,600 | |
| 7.625%, 6/15/2021 | | | | 190,000 | | | | 201,875 | |
| IAC/InterActiveCorp., 144A, 4.75%, 12/15/2022 | | | | 50,000 | | | | 47,250 | |
| | | | | 3,753,203 | |
| Materials 2.3% | |
| Anglo American Capital PLC, 144A, 4.125%, 9/27/2022 | | | | 500,000 | | | | 472,238 | |
| Axiall Corp., 144A, 4.875%, 5/15/2023 | | | | 15,000 | | | | 14,250 | |
| Barrick Gold Corp., 144A, 2.5%, 5/1/2018 | | | | 50,000 | | | | 44,869 | |
| Bluescope Steel Ltd., 144A, 7.125%, 5/1/2018 | | | | 40,000 | | | | 40,600 | |
| BOE Intermediate Holding Corp., 144A, 9.0%, 11/1/2017 (PIK) | | | | 80,000 | | | | 76,800 | |
| BOE Merger Corp., 144A, 9.5%, 11/1/2017 (PIK) | | | | 100,000 | | | | 102,000 | |
| Cemex SAB de CV, 144A, 9.0%, 1/11/2018 | | | | 200,000 | | | | 210,000 | |
| Cia Minera Milpo SAA, 144A, 4.625%, 3/28/2023 | | | | 200,000 | | | | 182,500 | |
| Eagle Spinco, Inc., 144A, 4.625%, 2/15/2021 | | | | 30,000 | | | | 28,800 | |
| FMG Resources (August 2006) Pty Ltd.: | | |
| 144A, 6.0%, 4/1/2017 (a) | | | | 195,000 | | | | 189,637 | |
| 144A, 6.375%, 2/1/2016 (a) | | | | 250,000 | | | | 249,687 | |
| 144A, 6.875%, 4/1/2022 (a) | | | | 290,000 | | | | 281,300 | |
| FQM Akubra, Inc.: | |
| 144A, 7.5%, 6/1/2021 | | | | 145,000 | | | | 138,837 | |
| 144A, 8.75%, 6/1/2020 | | | | 85,000 | | | | 86,913 | |
| Freeport-McMoRan Copper & Gold, Inc., 3.55%, 3/1/2022 | | | 220,000 | | | | 199,839 | |
| | | Principal Amount ($)(c) | | | Value ($) | |
| | | | | | | | | |
| GTL Trade Finance, Inc., 144A, 7.25%, 10/20/2017 | | | | 200,000 | | | | 216,000 | |
| Hexion U.S. Finance Corp.: | |
| 6.625%, 4/15/2020 | | | | 280,000 | | | | 279,300 | |
| 8.875%, 2/1/2018 | | | | 155,000 | | | | 158,100 | |
| Huntsman International LLC: | |
| 4.875%, 11/15/2020 (a) | | | | 55,000 | | | | 54,313 | |
| 8.625%, 3/15/2021 (a) | | | | 250,000 | | | | 274,375 | |
| IAMGOLD Corp., 144A, 6.75%, 10/1/2020 | | | | 75,000 | | | | 63,375 | |
| Kaiser Aluminum Corp., 8.25%, 6/1/2020 | | | | 40,000 | | | | 44,300 | |
| Metalloinvest Finance Ltd., 144A, 6.5%, 7/21/2016 | | | | 200,000 | | | | 206,000 | |
| Novelis, Inc., 8.75%, 12/15/2020 | | | | 955,000 | | | | 1,024,237 | |
| Polymer Group, Inc., 7.75%, 2/1/2019 | | | | 255,000 | | | | 265,200 | |
| PolyOne Corp., 144A, 5.25%, 3/15/2023 | | | | 145,000 | | | | 142,825 | |
| Polyus Gold International Ltd., 144A, 5.625%, 4/29/2020 | | | | 200,000 | | | | 194,000 | |
| Samarco Mineracao SA, 144A, 4.125%, 11/1/2022 | | | | 200,000 | | | | 179,000 | |
| Sealed Air Corp.: | |
| 144A, 5.25%, 4/1/2023 | | | | 15,000 | | | | 14,588 | |
| 144A, 8.125%, 9/15/2019 | | | | 10,000 | | | | 11,150 | |
| 144A, 8.375%, 9/15/2021 | | | | 10,000 | | | | 11,300 | |
| Tronox Finance LLC, 144A, 6.375%, 8/15/2020 | | | | 55,000 | | | | 51,838 | |
| Turkiye Sise ve Cam Fabrikalari AS, 144A, 4.25%, 5/9/2020 | | | | 200,000 | | | | 182,000 | |
| Votorantim Overseas IV, 144A, 7.75%, 6/24/2020 | | | | 250,000 | | | | 279,375 | |
| | | | | 5,969,546 | |
| Telecommunication Services 4.5% | |
| America Movil SAB de CV, Series 12, 6.45%, 12/5/2022 | MXN | | | 2,000,000 | | | | 149,481 | |
| CC Holdings GS V LLC, 3.849%, 4/15/2023 | | | | 120,000 | | | | 113,155 | |
| CenturyLink, Inc., Series V, 5.625%, 4/1/2020 | | | | 25,000 | | | | 25,250 | |
| Cincinnati Bell, Inc.: | |
| 8.25%, 10/15/2017 | | | | 100,000 | | | | 104,250 | |
| 8.375%, 10/15/2020 | | | | 695,000 | | | | 714,112 | |
| 8.75%, 3/15/2018 (a) | | | | 350,000 | | | | 350,437 | |
| Cricket Communications, Inc., 7.75%, 10/15/2020 (a) | | | | 685,000 | | | | 657,600 | |
| Digicel Group Ltd.: | |
| 144A, 8.25%, 9/30/2020 | | | | 200,000 | | | | 207,000 | |
| 144A, 10.5%, 4/15/2018 | | | | 200,000 | | | | 212,000 | |
| Digicel Ltd., 144A, 8.25%, 9/1/2017 | | | | 850,000 | | | | 884,000 | |
| ERC Ireland Preferred Equity Ltd., 144A, 7.69%**, 2/15/2017 (PIK)* | EUR | | | 120,439 | | | | 0 | |
| Frontier Communications Corp.: | | |
| 7.125%, 1/15/2023 (a) | | | | 390,000 | | | | 388,050 | |
| 8.5%, 4/15/2020 (a) | | | | 810,000 | | | | 893,025 | |
| Intelsat Jackson Holdings SA: | |
| 144A, 5.5%, 8/1/2023 | | | | 175,000 | | | | 164,500 | |
| 144A, 6.625%, 12/15/2022 | | | | 70,000 | | | | 67,900 | |
| | | Principal Amount ($)(c) | | | Value ($) | |
| | | | | | | | | |
| 7.25%, 10/15/2020 | | | | 690,000 | | | | 724,500 | |
| 7.5%, 4/1/2021 | | | | 305,000 | | | | 320,250 | |
| Intelsat Luxembourg SA: | |
| 144A, 7.75%, 6/1/2021 | | | | 165,000 | | | | 166,650 | |
| 144A, 8.125%, 6/1/2023 | | | | 25,000 | | | | 25,813 | |
| Level 3 Communications, Inc., 8.875%, 6/1/2019 (a) | | | | 205,000 | | | | 213,200 | |
| Level 3 Financing, Inc.: | |
| 7.0%, 6/1/2020 | | | | 185,000 | | | | 184,538 | |
| 8.625%, 7/15/2020 | | | | 450,000 | | | | 479,250 | |
| MetroPCS Wireless, Inc.: | |
| 6.625%, 11/15/2020 | | | | 655,000 | | | | 679,562 | |
| 144A, 6.625%, 4/1/2023 | | | | 70,000 | | | | 71,225 | |
| Millicom International Cellular SA, 144A, 4.75%, 5/22/2020 | | | | 200,000 | | | | 190,052 | |
| SBA Communications Corp., 144A, 5.625%, 10/1/2019 | | | | 50,000 | | | | 49,500 | |
| Sprint Nextel Corp.: | |
| 6.0%, 12/1/2016 | | | | 820,000 | | | | 865,100 | |
| 6.0%, 11/15/2022 | | | | 85,000 | | | | 83,300 | |
| 8.375%, 8/15/2017 | | | | 210,000 | | | | 235,725 | |
| 9.125%, 3/1/2017 | | | | 15,000 | | | | 17,250 | |
| Telefonica Emisiones SAU, 4.57%, 4/27/2023 | | | | 195,000 | | | | 186,673 | |
| Telemar Norte Leste SA, 144A, 5.5%, 10/23/2020 | | | �� | 200,000 | | | | 186,000 | |
| tw telecom holdings, Inc., 5.375%, 10/1/2022 | | | | 75,000 | | | | 74,438 | |
| UPCB Finance III Ltd., 144A, 6.625%, 7/1/2020 | | | | 370,000 | | | | 382,950 | |
| Wind Acquisition Finance SA, 144A, 6.5%, 4/30/2020 | | | | 50,000 | | | | 49,625 | |
| Windstream Corp.: | |
| 6.375%, 8/1/2023 | | | | 60,000 | | | | 56,100 | |
| 7.0%, 3/15/2019 | | | | 25,000 | | | | 25,063 | |
| 7.5%, 6/1/2022 | | | | 40,000 | | | | 40,800 | |
| 7.5%, 4/1/2023 | | | | 20,000 | | | | 20,300 | |
| 7.75%, 10/15/2020 (a) | | | | 1,100,000 | | | | 1,138,500 | |
| 7.75%, 10/1/2021 | | | | 80,000 | | | | 82,800 | |
| 7.875%, 11/1/2017 | | | | 130,000 | | | | 142,675 | |
| | | | | 11,622,599 | |
| Utilities 1.0% | |
| AES Corp.: | |
| 4.875%, 5/15/2023 (a) | | | | 25,000 | | | | 23,313 | |
| 8.0%, 10/15/2017 | | | | 45,000 | | | | 50,625 | |
| 8.0%, 6/1/2020 | | | | 30,000 | | | | 34,200 | |
| American Electric Power Co., Inc., Series F, 2.95%, 12/15/2022 | | | | 200,000 | | | | 186,179 | |
| Calpine Corp.: | |
| 144A, 7.5%, 2/15/2021 | | | | 761,000 | | | | 812,368 | |
| 144A, 7.875%, 7/31/2020 | | | | 40,000 | | | | 43,400 | |
| DTE Energy Co., 7.625%, 5/15/2014 | | | | 81,000 | | | | 85,803 | |
| Dubai Electricity & Water Authority, 144A, 8.5%, 4/22/2015 | | | | 250,000 | | | | 271,250 | |
| Electricite de France SA, 144A, 5.25%, 1/29/2049 | | | | 100,000 | | | | 95,600 | |
| Energy Future Intermediate Holding Co., LLC, 11.0%, 10/1/2021 | | | | 141,000 | | | | 151,223 | |
| | | Principal Amount ($)(c) | | | Value ($) | |
| | | | | | | | | |
| Instituto Costarricense de Electricidad, 144A, 6.95%, 11/10/2021 | | | | 200,000 | | | | 210,500 | |
| Mexico Generadora de Energia S de RL, 144A, 5.5%, 12/6/2032 | | | | 250,000 | | | | 235,000 | |
| Oncor Electric Delivery Co., LLC, 4.1%, 6/1/2022 | | | | 120,000 | | | | 123,813 | |
| PPL Energy Supply LLC, 4.6%, 12/15/2021 | | | | 250,000 | | | | 254,406 | |
| | | | | 2,577,680 | |
Total Corporate Bonds (Cost $65,131,330) | | | | 64,269,736 | |
| | |
| Asset-Backed 0.3% | |
| Credit Card Receivables 0.2% | |
| Citibank Omni Master Trust, "A14", Series 2009-A14A, 144A, 2.943%**, 8/15/2018 | | | 550,000 | | | | 564,829 | |
| Miscellaneous 0.1% | |
| ARES CLO Ltd., "D", Series 2012-3A, 144A, 4.958%**, 1/17/2024 | | | 250,000 | | | | 249,611 | |
Total Asset-Backed (Cost $819,418) | | | | 814,440 | |
| | |
| Mortgage-Backed Securities Pass-Throughs 3.7% | |
| Federal Home Loan Mortgage Corp., 6.0%, 3/1/2038 | | | 14,449 | | | | 15,668 | |
| Federal National Mortgage Association: | | | | | | | | |
| 3.5%, 1/1/2042 (d) | | | | 1,000,000 | | | | 1,015,625 | |
| 4.5%, 9/1/2035 | | | | 29,376 | | | | 31,110 | |
| 6.0%, 1/1/2024 | | | | 40,303 | | | | 44,452 | |
| 6.5%, with various maturities from 5/1/2017 until 1/1/2038 | | | 11,749 | | | | 12,746 | |
| 8.0%, 9/1/2015 | | | | 15,335 | | | | 16,062 | |
| Government National Mortgage Association: | | | | | | | | |
| 3.0%, 10/1/2042 (d) | | | | 3,000,000 | | | | 2,968,125 | |
| 4.0%, with various maturities from 7/1/2040 until 3/1/2041 (d) | | | 5,000,000 | | | | 5,250,703 | |
| 5.5%, 9/20/2040 | | | | 216,232 | | | | 236,765 | |
Total Mortgage-Backed Securities Pass-Throughs (Cost $9,660,686) | | | | 9,591,256 | |
| | |
| Commercial Mortgage-Backed Securities 0.9% | |
| Banc of America Large Loan, Inc., "HLTN", Series 2010-HLTN, 144A, 2.493%**, 11/15/2015 | | | 446,860 | | | | 447,207 | |
| Bear Stearns Commercial Mortgage Securities, Inc., "A4", Series 2007- PW16, 5.905%**, 6/11/2040 | | | 66,000 | | | | 74,553 | |
| Del Coronado Trust, "M", Series 2013-HDMZ, 144A, 5.193%**, 3/15/2018 | | | 120,000 | | | | 120,624 | |
| JPMorgan Chase Commercial Mortgage Securities Corp.: | |
| "C", Series 2012-HSBC, 144A, 4.021%, 7/5/2032 | | | | 380,000 | | | | 367,850 | |
| "A4", Series 2007-C1, 5.716%, 2/15/2051 | | | | 225,000 | | | | 251,270 | |
| | | Principal Amount ($)(c) | | | Value ($) | |
| | | | | | | | | |
| LB-UBS Commercial Mortgage Trust, "A4", Series 2007-C6, 5.858%, 7/15/2040 | | | 260,000 | | | | 287,930 | |
| WF-RBS Commercial Mortgage Trust, "A5", Series 2013-C14, 3.337%, 6/15/2046 | | | 750,000 | | | | 715,028 | |
Total Commercial Mortgage-Backed Securities (Cost $2,316,593) | | | | 2,264,462 | |
| | |
| Collateralized Mortgage Obligations 2.0% | |
| Federal Home Loan Mortgage Corp.: | | |
| "HI", Series 3979, Interest Only, 3.0%, 12/15/2026 | | | | 803,189 | | | | 70,084 | |
| "IK", Series 4048, Interest Only, 3.0%, 5/15/2027 | | | | 856,832 | | | | 109,315 | |
| "ZB", Series 4183, 3.0%, 3/15/2043 | | | | 1,007,519 | | | | 870,319 | |
| "P", Series 3808, 4.0%, 11/15/2038 | | | | 1,000,000 | | | | 1,044,211 | |
| "LI", Series 3720, Interest Only, 4.5%, 9/15/2025 | | | | 1,689,757 | | | | 283,512 | |
| "PI", Series 3843, Interest Only, 4.5%, 5/15/2038 | | | | 809,775 | | | | 98,819 | |
| "H", Series 2278, 6.5%, 1/15/2031 | | | | 146 | | | | 162 | |
| Federal National Mortgage Association: | | |
| "WO", Series 2013-27, Principal Only, Zero Coupon, 12/25/2042 | | | | 220,000 | | | | 103,625 | |
| "I", Series 2003-84, Interest Only, 6.0%, 9/25/2033 | | | | 319,783 | | | | 85,497 | |
| "PI", Series 2006-20, Interest Only, 6.487%***, 11/25/2030 | | | | 511,611 | | | | 92,642 | |
| Government National Mortgage Association: | | |
| "QI", Series 2011-112, Interest Only, 4.0%, 5/16/2026 | | | | 1,061,575 | | | | 97,144 | |
| "NI", Series 2011-80, Interest Only, 4.5%, 5/16/2038 | | | | 1,574,772 | | | | 135,600 | |
| "GP", Series 2010-67, 4.5%, 3/20/2039 | | | | 250,000 | | | | 271,399 | |
| "BI", Series 2010-30, Interest Only, 4.5%, 7/20/2039 | | | | 167,167 | | | | 42,921 | |
| "ND", Series 2010-130, 4.5%, 8/16/2039 | | | | 600,000 | | | | 651,209 | |
| "MI", Series 2009-76, Interest Only, 5.0%, 3/20/2035 | | | | 278,777 | | | | 9,705 | |
| "IQ", Series 2011-18, Interest Only, 5.5%, 1/16/2039 | | | | 494,554 | | | | 44,979 | |
| "IV", Series 2009-69, Interest Only, 5.5%, 8/20/2039 | | | | 851,868 | | | | 138,764 | |
| "IN", Series 2009-69, Interest Only, 5.5%, 8/20/2039 | | | | 862,441 | | | | 138,380 | |
| "IJ", Series 2009-75, Interest Only, 6.0%, 8/16/2039 | | | | 626,990 | | | | 115,665 | |
| "AI", Series 2007-38, Interest Only, 6.268%***, 6/16/2037 | | | | 144,427 | | | | 19,582 | |
| | | Principal Amount ($)(c) | | | Value ($) | |
| | | | | | | | | |
| Residential Funding Mortgage Securities I, Inc., "M1", Series 2003-S17, 5.5%, 9/25/2033 | | | | 609,922 | | | | 586,103 | |
Total Collateralized Mortgage Obligations (Cost $4,825,649) | | | | 5,009,637 | |
| | |
| Government & Agency Obligations 5.2% | |
| Other Government Related (e) 1.2% | |
| European Investment Bank: | |
| 144A, 4.6%, 1/30/2037 | CAD | | | 1,000,000 | | | | 972,625 | |
| 6.0%, 8/6/2020 | AUD | | | 500,000 | | | | 485,883 | |
| KFW, 1.875%, 6/13/2018 | CAD | | | 835,000 | | | | 777,057 | |
| Queensland Treasury Corp., Series 23, 4.25%, 7/21/2023 | AUD | | | 1,060,000 | | | | 926,860 | |
| | | | | 3,162,425 | |
| Sovereign Bonds 1.0% | |
| Government of Japan, Series 144, 1.5%, 3/20/2033 | JPY | | | 90,000,000 | | | | 878,456 | |
| Government of Ukraine, 144A, 6.58%, 11/21/2016 | | | | 500,000 | | | | 463,750 | |
| Republic of Belarus, REG S, 8.75%, 8/3/2015 | | | | 100,000 | | | | 100,250 | |
| Republic of Croatia, REG S, 144A, 6.25%, 4/27/2017 | | | | 250,000 | | | | 262,103 | |
| Republic of Turkey, 3.25%, 3/23/2023 | | | | 250,000 | | | | 218,125 | |
| Russian Federation: | |
| Series 6204, 7.5%, 3/15/2018 | RUB | | | 2,900,000 | | | | 91,023 | |
| Series 6207, 8.15%, 2/3/2027 | RUB | | | 8,700,000 | | | | 271,939 | |
| United Mexican States: | |
| Series M, 7.75%, 5/29/2031 | MXN | | | 2,280,000 | | | | 194,462 | |
| Series M 20, 8.5%, 5/31/2029 | MXN | | | 1,140,000 | | | | 104,870 | |
| | | | | 2,584,978 | |
| U.S. Government Sponsored Agencies 0.7% | |
| Federal Home Loan Mortgage Corp., 2.375%, 1/13/2022 | | | | 305,000 | | | | 295,154 | |
| Federal National Mortgage Association: | | |
| 0.875%, 5/21/2018 | | | | 550,000 | | | | 532,578 | |
| 3.0%, 11/15/2027 | | | | 1,000,000 | | | | 915,788 | |
| | | | | 1,743,520 | |
| U.S. Treasury Obligations 2.3% | |
| U.S. Treasury Bills: | |
| 0.1%****, 9/5/2013 (f) | | | | 801,000 | | | | 800,970 | |
| U.S. Treasury Note, 0.75%, 6/15/2014 | | | | 5,000,000 | | | | 5,026,365 | |
| | | | | 5,827,335 | |
Total Government & Agency Obligations (Cost $13,937,207) | | | | 13,318,258 | |
| | |
| Loan Participations and Assignments 0.8% | |
| Senior Loan** 0.0% | |
| Chesapeake Energy Corp., Term Loan, 5.75%, 12/1/2017 | | | | 95,000 | | | | 96,366 | |
| | | Principal Amount ($)(c) | | | Value ($) | |
| | | | | | | | | |
| Sovereign Loans 0.8% | |
| Bank of Moscow, 144A, 6.699%, 3/11/2015 | | | 250,000 | | | | 263,112 | |
| Gazprom Neft OAO, 144A, 4.375%, 9/19/2022 | | | 250,000 | | | | 228,963 | |
| Gazprom OAO, 144A, 9.25%, 4/23/2019 | | | 100,000 | | | | 120,500 | |
| National JSC Naftogaz of Ukraine, 9.5%, 9/30/2014 | | | 250,000 | | | | 249,375 | |
| RZD Capital PLC, 5.739%, 4/3/2017 | | | 250,000 | | | | 265,000 | |
| TMK OAO, 144A, 6.75%, 4/3/2020 | | | 200,000 | | | | 185,500 | |
| Uralkali OJSC, 144A, 3.723%, 4/30/2018 (a) | | | 200,000 | | | | 192,250 | |
| Vimpel Communications, 144A, 9.125%, 4/30/2018 | | | 200,000 | | | | 229,500 | |
| VTB Bank OJSC, 144A, 6.0%, 4/12/2017 | | | 250,000 | | | | 260,000 | |
Total Loan Participations and Assignments (Cost $2,134,514) | | | | 2,090,566 | |
| | |
| Municipal Bonds and Notes 0.2% | |
| Kentucky, Asset/Liability Commission, General Fund Revenue, 3.165%, 4/1/2018 (Cost $413,253) | | | 413,253 | | | | 429,213 | |
| | |
| Convertible Bond 0.1% | |
| Materials | |
| GEO Specialty Chemicals, Inc., 7.5%, 3/31/2015 (PIK) (Cost $205,565) | | | 209,283 | | | | 324,138 | |
| | |
| Preferred Securities 0.1% | |
| Financials 0.1% | |
| Farm Credit Bank of Texas, Series 1, 7.561%, 12/15/2013 (g) | | | 218,000 | | | | 218,000 | |
| Materials 0.0% | |
| Hercules, Inc., 6.5%, 6/30/2029 | | | 40,000 | | | | 34,800 | |
Total Preferred Securities (Cost $239,295) | | | | 252,800 | |
| | | Units | | | Value ($) | |
| | | | |
| Other Investments 0.0% | |
| Consumer Discretionary | |
| AOT Bedding Super Holdings LLC* (h) (Cost $2,000) | | | 5 | | | | 17,388 | |
| | | Contracts | | | Value ($) | |
| | | | |
| Call Options Purchased 0.1% | |
| Options on Exchange-Traded Futures Contracts 0.0% | |
| 10 Year U.S. Treasury Note Future Expiration Date 8/23/2013, Strike Price $132.5 | | | 38 | | | | 1,781 | |
| | | Contract Amount | | | Value ($) | |
| | | | |
| Options on Interest Rate Swap Contracts 0.1% | |
Pay Fixed Rate — 3.583% - Receive Floating — LIBOR Swap Expiration Date 5/11/2026, Option Expiration Date 5/9/20161 | | | 2,300,000 | | | | 145,475 | |
Total Call Options Purchased (Cost $127,429) | | | | 147,256 | |
| | | Shares | | | Value ($) | |
| | | | |
| Securities Lending Collateral 9.1% | |
| Daily Assets Fund Institutional, 0.10% (i) (j) (Cost $23,372,464) | | | 23,372,464 | | | | 23,372,464 | |
| | |
| Cash Equivalents 6.6% | |
| Central Cash Management Fund, 0.07% (i) (Cost $17,095,777) | | | 17,095,777 | | | | 17,095,777 | |
| | | % of Net Assets | | | Value ($) | |
| | | | |
Total Investment Portfolio (Cost $270,487,627)† | | | 112.6 | | | | 289,459,209 | |
| Other Assets and Liabilities, Net | | | (12.6 | ) | | | (32,282,568 | ) |
| Net Assets | | | 100.0 | | | | 257,176,641 | |
The following table represents bonds that are in default:
| Security | | Coupon | | Maturity Date | Principal Amount | | | Cost ($) | | | Value ($) | |
| ERC Ireland Preferred Equity Ltd.* | | | 7.69 | % | 2/15/2017 | EUR | | | 120,439 | | | | 165,016 | | | | 0 | |
| Fontainebleau Las Vegas Holdings LLC* | | | 11.0 | % | 6/15/2015 | USD | | | 25,000 | | | | 25,000 | | | | 0 | |
| | | | | | | | | | | | | | 190,016 | | | | 0 | |
* Non-income producing security.
** Floating rate securities' yields vary with a designated market index or market rate, such as the coupon-equivalent of the U.S. Treasury Bill rate. These securities are shown at their current rate as of June 30, 2013.
*** These securities are shown at their current rate as of June 30, 2013.
****Annualized yield at time of purchase; not a coupon rate.
† The cost for federal income tax purposes was $271,050,745. At June 30, 2013, net unrealized appreciation for all securities based on tax cost was $18,408,464. This consisted of aggregate gross unrealized appreciation for all securities in which there was an excess of value over tax cost of $24,688,967 and aggregate gross unrealized depreciation for all securities in which there was an excess of tax cost over value of $6,280,503.
(a) All or a portion of these securities were on loan (see Notes to Financial Statements). The value of securities loaned at June 30, 2013 amounted to $22,576,516, which is 8.8% of net assets.
(b) Securities with the same description are the same corporate entity but trade on different stock exchanges.
(c) Principal amount stated in U.S. dollars unless otherwise noted.
(d) When-issued or delayed delivery security included.
(e) Government-backed debt issued by financial companies or government sponsored enterprises.
(f) At June 30, 2013, this security has been pledged, in whole or in part, to cover initial margin requirements for open futures contracts.
(g) Date shown is call date; not a maturity date for the perpetual preferred securities.
(h) The Fund may purchase securities that are subject to legal or contractual restrictions on resale ("restricted securities"). Restricted securities are securities which have not been registered with the Securities and Exchange Commission under the Securities Act of 1933. The Fund may be unable to sell a restricted security and it may be more difficult to determine a market value for a restricted security. Moreover, if adverse market conditions were to develop during the period between the Fund's decision to sell a restricted security and the point at which the Fund is permitted or able to sell such security, the Fund might obtain a price less favorable than the price that prevailed when it decided to sell. This investment practice, therefore, could have the effect of increasing the level of illiquidity of the Fund. The future value of these securities is uncertain and there may be changes in the estimated value of these securities.
| Schedule of Restricted Securities | Acquisition Date | | Cost ($) | | | Value ($) | | | Value as % of Net Assets | |
| AOT Bedding Super Holdings LLC* | June 2010 | | | 2,000 | | | | 17,388 | | | | 0.01 | |
(i) Affiliated fund managed by Deutsche Investment Management Americas Inc. The rate shown is the annualized seven-day yield at period end.
(j) Represents collateral held in connection with securities lending. Income earned by the Fund is net of borrower rebates.
144A: Security exempt from registration under Rule 144A of the Securities Act of 1933. These securities may be resold in transactions exempt from registration, normally to qualified institutional buyers.
CLO: Collateralized Loan Obligation
CVA: Certificaten Van Aandelen (Certificate of Stock)
Interest Only: Interest Only (IO) bonds represent the "interest only" portion of payments on a pool of underlying mortgages or mortgage-backed securities. IO securities are subject to prepayment risk of the pool of underlying mortgages.
PIK: Denotes that all or a portion of the income is paid in-kind in the form of additional principal.
Principal Only: Principal Only (PO) bonds represent the "principal only" portion of payments on a pool of underlying mortgages or mortgage-backed securities.
REG S: Securities sold under Regulation S may not be offered, sold or delivered within the United States or to, or for the account or benefit of, U.S. persons, except pursuant to an exemption from, or in a transaction not subject to, the registration requirements of the Securities Act of 1933.
REIT: Real Estate Investment Trust
Included in the portfolio are investments in mortgage- or asset-backed securities which are interests in separate pools of mortgages or assets. Effective maturities of these investments may be shorter than stated maturities due to prepayments. Some separate investments in the Federal National Mortgage Association and Government National Mortgage Association issues which have similar coupon rates have been aggregated for presentation purposes in this investment portfolio.
At June 30, 2013, open futures contracts purchased were as follows:
| Futures | Currency | Expiration Date | | Contracts | | | Notional Value ($) | | | Unrealized Depreciation ($) | |
| 10 Year Canadian Government Bond | CAD | 9/19/2013 | | | 5 | | | | 624,750 | | | | (25,222 | ) |
| 10 Year U.S. Treasury Note | USD | 9/19/2013 | | | 28 | | | | 3,543,750 | | | | (23,207 | ) |
| 5 Year U.S. Treasury Note | USD | 9/30/2013 | | | 4 | | | | 484,188 | | | | (7,978 | ) |
| Federal Republic of Germany Euro-Bund | EUR | 9/6/2013 | | | 5 | | | | 921,047 | | | | (18,167 | ) |
| Ultra Long U.S. Treasury Bond | USD | 9/19/2013 | | | 4 | | | | 543,375 | | | | (23,508 | ) |
| Total unrealized depreciation | | | | (98,082 | ) |
At June 30, 2013, open futures contracts sold were as follows:
| Futures | Currency | Expiration Date | | Contracts | | | Notional Value ($) | | | Unrealized Appreciation/ (Depreciation) ($) | |
| 10 Year U.S. Treasury Note | USD | 9/19/2013 | | | 460 | | | | 58,218,750 | | | | 2,164,258 | |
| Ultra Long U.S. Treasury Bond | USD | 9/19/2013 | | | 5 | | | | 736,563 | | | | (12,288 | ) |
| Total net unrealized appreciation | | | | 2,151,970 | |
At June 30, 2013, open written options contracts were as follows:
| Options on Exchange-Traded Futures Contracts | | Contracts | | Expiration Date | | Strike Price ($) | | | Premiums Received ($) | | | Value ($) (k) | |
Put Options 10 Year U.S. Treasury Note Future | | | 48 | | 8/23/2013 | | | 130.0 | | | | 40,756 | | | | (174,000 | ) |
(k) Unrealized depreciation on written options on exchange-traded futures contracts at June 30, 2013 was $133,244.
| Options on Interest Rate Swap Contracts | Swap Effective/ Expiration Date | | Contract Amount | | Option Expiration Date | | Premiums Received ($) | | | Value ($) (l) | |
Call Options Receive Fixed — 4.083% - Pay Floating — LIBOR | 5/11/2016 5/11/2026 | | | 2,300,000 | 1 | 5/9/2016 | | | 78,200 | | | | (103,264 | ) |
| Receive Fixed — 5.132% - Pay Floating — LIBOR | 3/17/2016 3/17/2026 | | | 2,100,000 | 2 | 3/15/2016 | | | 15,172 | | | | (39,311 | ) |
| Receive Fixed — 4.064% - Pay Floating — LIBOR | 5/13/2014 5/13/2044 | | | 2,100,000 | 2 | 5/19/2014 | | | 15,488 | | | | (58,129 | ) |
| Receive Fixed — 5.132% - Pay Floating — LIBOR | 3/17/2016 3/17/2026 | | | 2,100,000 | 3 | 3/15/2016 | | | 24,780 | | | | (39,311 | ) |
| Total Call Options | | | 133,640 | | | | (240,015 | ) |
Put Options Pay Fixed — 1.132% - Receive Floating — LIBOR | 3/17/2016 3/17/2026 | | | 2,100,000 | 2 | 3/15/2016 | | | 15,172 | | | | (1,861 | ) |
| Pay Fixed — 2.385% - Receive Floating — LIBOR | 3/31/2014 3/31/2044 | | | 2,100,000 | 4 | 3/27/2014 | | | 28,665 | | | | (6,701 | ) |
| Pay Fixed — 2.423% - Receive Floating — LIBOR | 3/20/2014 3/20/2044 | | | 2,100,000 | 5 | 3/18/2014 | | | 30,240 | | | | (7,613 | ) |
| Pay Fixed — 1.132% - Receive Floating — LIBOR | 3/17/2016 3/17/2026 | | | 2,100,000 | 3 | 3/15/2016 | | | 5,355 | | | | (1,861 | ) |
| Pay Fixed — 2.064% - Receive Floating — LIBOR | 3/20/2014 3/20/2044 | | | 2,100,000 | 2 | 5/9/2014 | | | 15,488 | | | | (2,330 | ) |
| Total Put Options | | | 94,920 | | | | (20,366 | ) |
| Total | | | 228,560 | | | | (260,381 | ) |
(l) Unrealized depreciation on written options on interest rate swap contracts at June 30, 2013 was $31,821.
As of June 30, 2013, open credit default swap contracts sold were as follows:
Effective/ Expiration Date | | Notional Amount ($) (m) | | | Fixed Cash Flows Received | | Underlying Debt Obligation/ Quality Rating (n) | | Value ($) | | | Upfront Payments Paid/ (Received) ($) | | | Unrealized Appreciation ($) | |
9/20/2012 12/20/2017 | | | 125,000 | 6 | | | 5.0 | % | General Motors Corp., 3.3%, 12/20/2017, BB+ | | | 15,546 | | | | 8,311 | | | | 7,235 | |
(m) The maximum potential amount of future undiscounted payments that the Fund could be required to make under a credit default swap contract would be the notional amount of the contract. These potential amounts would be partially offset by any recovery values of the referenced debt obligation or net amounts received from the settlement of buy protection credit default swap contracts entered into by the Fund for the same referenced debt obligation, if any.
(n) The quality ratings represent the higher of Moody's Investors Service, Inc. ("Moody's") or Standard & Poor's Corporation ("S&P") credit ratings.
At June 30, 2013, open interest rate swap contracts sold were as follows:
Effective/ Expiration Date | | Notional Amount ($) | | Cash Flows Paid by the Fund | Cash Flows Received by the Fund | | Value ($) | | | Upfront Payments Paid/ (Received) ($) | | | Unrealized Appreciation (Depreciation) ($) | |
6/3/2013 6/3/2025 | | | 2,100,000 | 2 | Floating — LIBOR | Fixed — 3.0% | | | 19,515 | | | | — | | | | 19,515 | |
5/1/2014 5/1/2024 | | | 3,500,000 | 4 | Fixed — 2.156% | Floating — LIBOR | | | 272,477 | | | | (593 | ) | | | 273,070 | |
5/1/2014 5/1/2044 | | | 500,000 | 4 | Floating — LIBOR | Fixed — 2.922% | | | (61,676 | ) | | | 829 | | | | (62,505 | ) |
| Total net unrealized appreciation | | | | 230,080 | |
Counterparties:
1 Bank of America
2 Nomura International PLC
3 BNP Paribas
4 Barclays Bank PLC
5 JPMorgan Chase Securities, Inc.
6 UBS AG
LIBOR: London Interbank Offered Rate
As of June 30, 2013, the Fund had the following open forward foreign currency exchange contracts:
| Contracts to Deliver | | In Exchange For | | Settlement Date | | Unrealized Appreciation ($) | | Counterparty |
| NOK | | | 9,197,292 | | EUR | | | 1,200,000 | | 7/5/2013 | | | 48,033 | | Citigroup, Inc. |
| USD | | | 8,149 | | NOK | | | 49,678 | | 7/5/2013 | | | 28 | | Citigroup, Inc. |
| GBP | | | 800,000 | | USD | | | 1,221,125 | | 7/5/2013 | | | 4,390 | | JPMorgan Chase Securities, Inc. |
| AUD | | | 500,000 | | USD | | | 520,922 | | 7/5/2013 | | | 63,747 | | Nomura International PLC |
| AUD | | | 550,000 | | USD | | | 566,751 | | 7/9/2013 | | | 64,008 | | Nomura International PLC |
| JPY | | | 80,000,000 | | USD | | | 823,216 | | 7/10/2013 | | | 16,577 | | Nomura International PLC |
| EUR | | | 600,000 | | USD | | | 794,742 | | 7/11/2013 | | | 13,724 | | JPMorgan Chase Securities, Inc. |
| GBP | | | 500,000 | | USD | | | 777,548 | | 7/11/2013 | | | 17,120 | | BNP Paribas |
| SGD | | | 1,600,000 | | USD | | | 1,286,036 | | 7/11/2013 | | | 23,685 | | JPMorgan Chase Securities, Inc. |
| EUR | | | 600,000 | | USD | | | 796,109 | | 7/11/2013 | | | 15,091 | | Barclays Bank PLC |
| AUD | | | 1,300,000 | | NZD | | | 1,551,472 | | 7/12/2013 | | | 13,410 | | Citigroup, Inc. |
| CZK | | | 15,000,000 | | USD | | | 770,100 | | 7/12/2013 | | | 19,534 | | Bank Of America N.A. |
| CZK | | | 14,900,000 | | USD | | | 771,395 | | 7/12/2013 | | | 25,833 | | BNP Paribas |
| USD | | | 776,601 | | ZAR | | | 7,700,000 | | 7/15/2013 | | | 880 | | Barclays Bank PLC |
| NZD | | | 1,000,000 | | USD | | | 796,967 | | 7/15/2013 | | | 22,739 | | Citigroup, Inc. |
| JPY | | | 50,000,000 | | USD | | | 504,293 | | 7/16/2013 | | | 133 | | Nomura International PLC |
| JPY | | | 50,000,000 | | USD | | | 511,589 | | 7/16/2013 | | | 7,429 | | Bank Of America N.A. |
| EUR | | | 800,000 | | USD | | | 1,065,849 | | 7/17/2013 | | | 24,467 | | Nomura International PLC |
| GBP | | | 700,000 | | USD | | | 1,097,029 | | 7/17/2013 | | | 32,472 | | JPMorgan Chase Securities, Inc. |
| USD | | | 5,749 | | EUR | | | 4,418 | | 7/19/2013 | | | 2 | | Citigroup, Inc. |
| EUR | | | 549,550 | | USD | | | 732,800 | | 7/19/2013 | | | 17,430 | | Citigroup, Inc. |
| JPY | | | 70,000,000 | | USD | | | 710,345 | | 7/24/2013 | | | 4,500 | | Barclays Bank PLC |
| USD | | | 505,861 | | ZAR | | | 5,200,000 | | 7/25/2013 | | | 18,429 | | Barclays Bank PLC |
| USD | | | 728,583 | | AUD | | | 800,000 | | 7/26/2013 | | | 1,768 | | JPMorgan Chase Securities, Inc. |
| CAD | | | 800,000 | | USD | | | 760,541 | | 7/26/2013 | | | 299 | | Nomura International PLC |
| AUD | | | 800,000 | | USD | | | 739,142 | | 7/26/2013 | | | 8,791 | | BNP Paribas |
| CAD | | | 1,000,000 | | USD | | | 978,926 | | 7/31/2013 | | | 28,735 | | JPMorgan Chase Securities, Inc. |
| AUD | | | 1,071,800 | | USD | | | 1,040,724 | | 7/31/2013 | | | 62,595 | | JPMorgan Chase Securities, Inc. |
| CAD | | | 659,544 | | USD | | | 639,001 | | 7/31/2013 | | | 12,309 | | Nomura International PLC |
| JPY | | | 30,000,000 | | USD | | | 307,148 | | 8/1/2013 | | | 4,634 | | Nomura International PLC |
| USD | | | 1,007,112 | | JPY | | | 100,000,000 | | 8/2/2013 | | | 1,271 | | JPMorgan Chase Securities, Inc. |
| Total unrealized appreciation | | | | | 574,063 | |
| Contracts to Deliver | | In Exchange For | | Settlement Date | | Unrealized Depreciation ($) | | Counterparty |
| USD | | | 808,526 | | JPY | | | 80,000,000 | | 7/5/2013 | | | (1,903 | ) | Nomura International PLC |
| USD | | | 1,245,708 | | GBP | | | 800,000 | | 7/5/2013 | | | (28,973 | ) | BNP Paribas |
| JPY | | | 80,000,000 | | USD | | | 798,495 | | 7/5/2013 | | | (8,128 | ) | Nomura International PLC |
| USD | | | 523,125 | | AUD | | | 500,000 | | 7/5/2013 | | | (65,951 | ) | Barclays Bank PLC |
| EUR | | | 1,200,000 | | NOK | | | 9,147,614 | | 7/5/2013 | | | (56,210 | ) | UBS AG |
| USD | | | 827,605 | | JPY | | | 80,000,000 | | 7/10/2013 | | | (20,967 | ) | Barclays Bank PLC |
| USD | | | 777,720 | | GBP | | | 500,000 | | 7/11/2013 | | | (17,292 | ) | Barclays Bank PLC |
| USD | | | 1,272,644 | | SGD | | | 1,600,000 | | 7/11/2013 | | | (10,294 | ) | Nomura International PLC |
| USD | | | 1,597,224 | | EUR | | | 1,200,000 | | 7/11/2013 | | | (35,189 | ) | Barclays Bank PLC |
| NZD | | | 963,602 | | AUD | | | 800,000 | | 7/12/2013 | | | (15,105 | ) | Nomura International PLC |
| NZD | | | 597,794 | | AUD | | | 500,000 | | 7/12/2013 | | | (5,989 | ) | BNP Paribas |
| USD | | | 1,559,639 | | CZK | | | 29,900,000 | | 7/12/2013 | | | (63,510 | ) | Barclays Bank PLC |
| USD | | | 7,688 | | NZD | | | 9,923 | | 7/12/2013 | | | (3 | ) | Barclays Bank PLC |
| USD | | | 510,204 | | INR | | | 30,000,000 | | 7/15/2013 | | | (6,539 | ) | Citigroup, Inc. |
| USD | | | 804,435 | | NZD | | | 1,000,000 | | 7/15/2013 | | | (30,207 | ) | JPMorgan Chase Securities, Inc. |
| ZAR | | | 7,700,000 | | USD | | | 767,969 | | 7/15/2013 | | | (9,512 | ) | UBS AG |
| INR | | | 30,000,000 | | USD | | | 492,773 | | 7/15/2013 | | | (10,892 | ) | Citigroup, Inc. |
| USD | | | 1,008,657 | | JPY | | | 100,000,000 | | 7/16/2013 | | | (337 | ) | Nomura International PLC |
| USD | | | 1,100,750 | | GBP | | | 700,000 | | 7/17/2013 | | | (36,194 | ) | UBS AG |
| USD | | | 1,057,846 | | EUR | | | 800,000 | | 7/17/2013 | | | (16,464 | ) | Nomura International PLC |
| USD | | | 769,742 | | ZAR | | | 7,600,000 | | 7/19/2013 | | | (2,803 | ) | JPMorgan Chase Securities, Inc. |
| ZAR | | | 7,600,000 | | USD | | | 761,403 | | 7/19/2013 | | | (5,535 | ) | JPMorgan Chase Securities, Inc. |
| NOK | | | 4,763,579 | | EUR | | | 600,000 | | 7/24/2013 | | | (2,568 | ) | BNP Paribas |
| USD | | | 716,336 | | JPY | | | 70,000,000 | | 7/24/2013 | | | (10,491 | ) | Nomura International PLC |
| ZAR | | | 5,200,000 | | USD | | | 513,782 | | 7/25/2013 | | | (10,508 | ) | Citigroup, Inc. |
| TWD | | | 22,700,000 | | USD | | | 755,156 | | 7/29/2013 | | | (2,397 | ) | JPMorgan Chase Securities, Inc. |
| JPY | | | 90,431,642 | | USD | | | 910,486 | | 7/31/2013 | | | (1,405 | ) | Nomura International PLC |
| USD | | | 777,205 | | ZAR | | | 7,700,000 | | 8/1/2013 | | | (1,641 | ) | Citigroup, Inc. |
| ZAR | | | 7,700,000 | | USD | | | 769,915 | | 8/1/2013 | | | (5,649 | ) | Citigroup, Inc. |
| USD | | | 302,877 | | JPY | | | 30,000,000 | | 8/1/2013 | | | (363 | ) | UBS AG |
| USD | | | 1,732,788 | | MXN | | | 22,400,000 | | 8/19/2013 | | | (11,396 | ) | JPMorgan Chase Securities, Inc. |
| Total unrealized depreciation | | | | | (494,415 | ) |
| Currency Abbreviations |
AUD Australian Dollar BRL Brazilian Real CAD Canadian Dollar CZK Czech Koruna EUR Euro GBP British Pound INR Indian Rupee JPY Japanese Yen MXN Mexican Peso NOK Norwegian Krone NZD New Zealand Dollar RUB Russian Ruble SGD Singapore Dollar TWD Taiwan Dollar USD United States Dollar ZAR South African Rand |
For information on the Fund's policy and additional disclosures regarding options purchased, futures contracts, credit default swap contracts, forward foreign currency exchange contracts and written options contracts, please refer to Note B in the accompanying Notes to Financial Statements.
Fair Value Measurements
Various inputs are used in determining the value of the Fund's investments. These inputs are summarized in three broad levels. Level 1 includes quoted prices in active markets for identical securities. Level 2 includes other significant observable inputs (including quoted prices for similar securities, interest rates, prepayment speeds, and credit risk). Level 3 includes significant unobservable inputs (including the Fund's own assumptions in determining the fair value of investments). The inputs or methodology used for valuing securities are not necessarily an indication of the risk associated with investing in those securities.
The following is a summary of the inputs used as of June 30, 2013 in valuing the Fund's investments. For information on the Fund's policy regarding the valuation of investments, please refer to the Security Valuation section of Note A in the accompanying Notes to Financial Statements. | Assets | | Level 1 | | | Level 2 | | | Level 3 | | | Total | |
| | |
| Common Stocks and/or Other Equity Investments (o) | |
| Consumer Discretionary | | $ | 5,469,327 | | | $ | 7,106,180 | | | $ | 0 | | | $ | 12,575,507 | |
| Consumer Staples | | | 18,767,325 | | | | 13,771,738 | | | | — | | | | 32,539,063 | |
| Energy | | | 12,448,162 | | | | 740,695 | | | | — | | | | 13,188,857 | |
| Financials | | | 10,154,969 | | | | 6,316,037 | | | | — | | | | 16,471,006 | |
| Health Care | | | 3,480,689 | | | | 19,869,777 | | | | — | | | | 23,350,466 | |
| Industrials | | | — | | | | 9,944,706 | | | | 0 | | | | 9,944,706 | |
| Information Technology | | | 13,734,553 | | | | 2,873,238 | | | | — | | | | 16,607,791 | |
| Materials | | | 8,057,430 | | | | 2,473,600 | | | | 6,632 | | | | 10,537,662 | |
| Telecommunication Services | | | — | | | | 4,973,254 | | | | — | | | | 4,973,254 | |
| Utilities | | | 7,482,173 | | | | 2,777,739 | | | | — | | | | 10,259,912 | |
| Warrants (o) | | | — | | | | — | | | | 13,594 | | | | 13,594 | |
| Fixed Income Investments (o) | |
| Corporate Bonds | | | — | | | | 64,269,736 | | | | 0 | | | | 64,269,736 | |
| Asset Backed | | | — | | | | 814,440 | | | | — | | | | 814,440 | |
| Mortgage-Backed Securities Pass-Throughs | | | — | | | | 9,591,256 | | | | — | | | | 9,591,256 | |
| Commercial Mortgage-Backed Securities | | | — | | | | 2,264,462 | | | | — | | | | 2,264,462 | |
| Collateralized Mortgage Obligations | | | — | | | | 5,009,637 | | | | — | | | | 5,009,637 | |
| Government & Agency Obligations | | | — | | | | 13,318,258 | | | | — | | | | 13,318,258 | |
| Loan Participations and Assignments | | | — | | | | 2,090,566 | | | | — | | | | 2,090,566 | |
| Municipal Bonds and Notes | | | — | | | | 429,213 | | | | — | | | | 429,213 | |
| Convertible Bonds | | | — | | | | — | | | | 324,138 | | | | 324,138 | |
| Preferred Securities | | | — | | | | 252,800 | | | | — | | | | 252,800 | |
| Other Investments | | | — | | | | — | | | | 17,388 | | | | 17,388 | |
| Short-Term Investments (o) | | | 40,468,241 | | | | — | | | | — | | | | 40,468,241 | |
| Derivatives (p) | |
| Futures Contracts | | | 2,164,258 | | | | — | | | | — | | | | 2,164,258 | |
| Purchased Options | | | 1,781 | | | | 145,475 | | | | — | | | | 147,256 | |
| Credit Default Swap Contracts | | | — | | | | 7,235 | | | | — | | | | 7,235 | |
| Interest Rate Swap Contracts | | | — | | | | 292,585 | | | | — | | | | 292,585 | |
| Forward Foreign Currency Exchange Contracts | | | — | | | | 574,063 | | | | — | | | | 574,063 | |
| Total | | $ | 122,228,908 | | | $ | 169,906,690 | | | $ | 361,752 | | | $ | 292,497,350 | |
| Liabilities | |
| Derivatives (p) | |
| Futures Contracts | | $ | (110,370 | ) | | $ | — | | | $ | — | | | $ | (110,370 | ) |
| Written Options | | | (174,000 | ) | | | (260,381 | ) | | | — | | | | (434,381 | ) |
| Interest Rate Swap Contracts | | | — | | | | (62,505 | ) | | | — | | | | (62,505 | ) |
| Forward Foreign Currency Exchange Contracts | | | — | | | | (494,415 | ) | | | — | | | | (494,415 | ) |
| Total | | $ | (284,370 | ) | | $ | (817,301 | ) | | $ | — | | | $ | (1,101,671 | ) |
During the period ended June 30, 2013, the amount of transfers between Level 2 and Level 3 was $16. Investments were transferred from Level 2 to Level 3 because of the lack of observable market data due to a decrease in market activity.
Transfers between price levels are recognized at the beginning of the reporting period.
(o) See Investment Portfolio for additional detailed categorizations.
(p) Derivatives include value of options purchased, unrealized appreciation (depreciation) on open futures contracts, credit default swap contracts, interest rate swap contracts and forward foreign currency exchange contracts, and written options, at value.
The accompanying notes are an integral part of the financial statements.
Statement of Assets and Liabilities | as of June 30, 2013 (Unaudited) | |
| Assets | |
Investments: Investments in non-affiliated securities, at value (cost $230,019,386) — including $22,576,516 of securities loaned | | $ | 248,990,968 | |
| Investment in Daily Assets Fund Institutional (cost $23,372,464)* | | | 23,372,464 | |
| Investment in Central Cash Management Fund (cost $17,095,777) | | | 17,095,777 | |
| Total investments in securities, at value (cost $270,487,627) | | | 289,459,209 | |
| Cash | | | 49,996 | |
| Foreign currency, at value (cost $268,008) | | | 263,138 | |
| Receivable for investments sold | | | 133,057 | |
| Receivable for investments sold — when-issued/ delayed delivery securities | | | 3,863,487 | |
| Receivable for Fund shares sold | | | 2,010 | |
| Dividends receivable | | | 330,434 | |
| Interest receivable | | | 1,221,001 | |
| Receivable for variation margin on futures contracts | | | 36,553 | |
| Unrealized appreciation on swap contracts | | | 299,820 | |
| Unrealized appreciation on forward foreign currency exchange contracts | | | 574,063 | |
| Upfront payments paid on swap contracts | | | 9,140 | |
| Foreign taxes recoverable | | | 96,353 | |
| Other assets | | | 2,238 | |
| Total assets | | | 296,340,499 | |
| Liabilities | |
| Payable upon return of securities loaned | | | 23,372,464 | |
| Payable for investments purchased | | | 962,375 | |
| Payable for investments purchased — when-issued/delayed delivery securities | | | 13,495,007 | |
| Payable for Fund shares redeemed | | | 135,550 | |
| Options written, at value (premium received $269,316) | | | 434,381 | |
| Unrealized depreciation on swap contracts | | | 62,505 | |
| Unrealized depreciation on forward foreign currency exchange contracts | | | 494,415 | |
| Upfront payments received on swap contracts | | | 593 | |
| Accrued management fee | | | 79,105 | |
| Accrued Trustees' fees | | | 619 | |
| Other accrued expenses and payables | | | 126,844 | |
| Total liabilities | | | 39,163,858 | |
| Net assets, at value | | $ | 257,176,641 | |
| Net Assets Consist of | |
| Undistributed net investment income | | | 4,767,730 | |
Net unrealized appreciation (depreciation) on: Investments | | | 18,971,582 | |
| Swap contracts | | | 237,315 | |
| Futures | | | 2,053,888 | |
| Foreign currency | | | 65,926 | |
| Written options | | | (165,065 | ) |
| Accumulated net realized gain (loss) | | | (6,030,595 | ) |
| Paid-in capital | | | 237,275,860 | |
| Net assets, at value | | $ | 257,176,641 | |
Class A Net Asset Value, offering and redemption price per share ($257,176,641 ÷ 10,480,859 outstanding shares of beneficial interest, no par value, unlimited number of shares authorized) | | $ | 24.54 | |
* Represents collateral on securities loaned.
The accompanying notes are an integral part of the financial statements.
| for the six months ended June 30, 2013 (Unaudited) | |
| Investment Income | |
Income: Dividends (net of foreign taxes withheld of $261,725) | | $ | 3,090,760 | |
| Interest | | | 2,426,188 | |
| Income distributions — Central Cash Management Fund | | | 2,696 | |
| Securities lending income, including income from Daily Assets Fund Institutional, net of borrower rebates | | | 115,397 | |
| Total income | | | 5,635,041 | |
Expenses: Management fee | | | 484,558 | |
| Administration fee | | | 131,468 | |
| Services to shareholders | | | 956 | |
| Custodian fee | | | 34,877 | |
| Professional fees | | | 43,944 | |
| Reports to shareholders | | | 32,581 | |
| Trustees' fees and expenses | | | 6,261 | |
| Other | | | 29,473 | |
| Total expenses | | | 764,118 | |
| Net investment income | | | 4,870,923 | |
| Realized and Unrealized Gain (Loss) | |
Net realized gain (loss) from: Investments | | | 258,289 | |
| Swap contracts | | | 86,358 | |
| Futures | | | (456,915 | ) |
| Written options | | | 90,646 | |
| Foreign currency | | | (326,274 | ) |
| | | | (347,896 | ) |
Change in net unrealized appreciation (depreciation) on: Investments | | | 5,983,143 | |
| Swap contracts | | | 209,806 | |
| Futures | | | 2,076,162 | |
| Written options | | | (272,306 | ) |
| Foreign currency | | | 90,171 | |
| | | | 8,086,976 | |
| Net gain (loss) | | | 7,739,080 | |
| Net increase (decrease) in net assets resulting from operations | | $ | 12,610,003 | |
The accompanying notes are an integral part of the financial statements.
Statement of Changes in Net Assets | Increase (Decrease) in Net Assets | | Six Months Ended June 30, 2013 (Unaudited) | | | Year Ended December 31, 2012 | |
Operations: Net investment income (loss) | | $ | 4,870,923 | | | $ | 6,577,137 | |
| Net realized gain (loss) | | | (347,896 | ) | | | 37,219,792 | |
| Change in net unrealized appreciation (depreciation) | | | 8,086,976 | | | | (11,355,694 | ) |
| Net increase (decrease) in net assets resulting from operations | | | 12,610,003 | | | | 32,441,235 | |
Distributions to shareholders from: Net investment income: Class A | | | (5,498,634 | ) | | | (4,191,340 | ) |
| Total distributions | | | (5,498,634 | ) | | | (4,191,340 | ) |
Fund share transactions: Class A Proceeds from shares sold | | | 4,735,892 | | | | 5,666,347 | |
| Shares issued to shareholders in reinvestment of distributions | | | 5,498,634 | | | | 4,191,340 | |
| Payments for shares redeemed | | | (20,567,513 | ) | | | (41,768,743 | ) |
| Net increase (decrease) in net assets from Class A share transactions | | | (10,332,987 | ) | | | (31,911,056 | ) |
| Increase (decrease) in net assets | | | (3,221,618 | ) | | | (3,661,161 | ) |
| Net assets at beginning of period | | | 260,398,259 | | | | 264,059,420 | |
| Net assets at end of period (including undistributed net investment income of $4,767,730 and $5,395,441, respectively) | | $ | 257,176,641 | | | $ | 260,398,259 | |
| Other Information | |
Class A Shares outstanding at beginning of period | | | 10,896,924 | | | | 12,288,136 | |
| Shares sold | | | 190,593 | | | | 246,623 | |
| Shares issued to shareholders in reinvestment of distributions | | | 220,917 | | | | 186,116 | |
| Shares redeemed | | | (827,575 | ) | | | (1,823,951 | ) |
| Net increase (decrease) in Class A shares | | | (416,065 | ) | | | (1,391,212 | ) |
| Shares outstanding at end of period | | | 10,480,859 | | | | 10,896,924 | |
The accompanying notes are an integral part of the financial statements.
| | | | | | Years Ended December 31, | |
| Class A | | Six Months Ended 6/30/13 (Unaudited) | | | 2012 | | | 2011 | | | 2010 | | | 2009 | | | 2008 | |
| Selected Per Share Data | |
| Net asset value, beginning of period | | $ | 23.90 | | | $ | 21.49 | | | $ | 22.13 | | | $ | 20.52 | | | $ | 17.35 | | | $ | 24.81 | |
Income (loss) from investment operations: Net investment incomea | | | .46 | | | | .57 | | | | .46 | | | | .39 | | | | .44 | | | | .61 | |
| Net realized and unrealized gain (loss) | | | .70 | | | | 2.20 | | | | (.75 | ) | | | 1.88 | | | | 3.43 | | | | (7.20 | ) |
| Total from investment operations | | | 1.16 | | | | 2.77 | | | | (.29 | ) | | | 2.27 | | | | 3.87 | | | | (6.59 | ) |
Less distributions from: Net investment income | | | (.52 | ) | | | (.36 | ) | | | (.35 | ) | | | (.66 | ) | | | (.70 | ) | | | (.87 | ) |
| Net asset value, end of period | | $ | 24.54 | | | $ | 23.90 | | | $ | 21.49 | | | $ | 22.13 | | | $ | 20.52 | | | $ | 17.35 | |
| Total Return (%) | | | 4.84 | ** | | | 12.98 | | | | (1.42 | ) | | | 11.22 | | | | 23.43 | | | | (27.33 | )b |
| Ratios to Average Net Assets and Supplemental Data | |
| Net assets, end of period ($ millions) | | | 257 | | | | 260 | | | | 264 | | | | 308 | | | | 319 | | | | 307 | |
| Ratio of expenses before expense reductions (%) | | | .58 | * | | | .59 | | | | .58 | | | | .65 | | | | .60 | | | | .64 | |
| Ratio of expenses after expense reductions (%) | | | .58 | * | | | .59 | | | | .58 | | | | .65 | | | | .60 | | | | .62 | |
| Ratio of net investment income (%) | | | 3.71 | * | | | 2.48 | | | | 2.09 | | | | 1.89 | | | | 2.40 | | | | 2.83 | |
| Portfolio turnover rate (%) | | | 50 | ** | | | 188 | | | | 109 | | | | 203 | | | | 207 | | | | 263 | |
a Based on average shares outstanding during the period. b Total return would have been lower had certain expenses not been reduced. * Annualized ** Not annualized | |
Notes to Financial Statements (Unaudited)
A. Organization and Significant Accounting Policies
DWS Global Income Builder VIP (the "Fund") is a diversified series of DWS Variable Series II (the "Trust"), which is registered under the Investment Company Act of 1940, as amended (the "1940 Act"), as an open-end management investment company organized as a Massachusetts business trust.
The Fund's financial statements are prepared in accordance with accounting principles generally accepted in the United States of America which require the use of management estimates. Actual results could differ from those estimates. The policies described below are followed consistently by the Fund in the preparation of its financial statements.
Security Valuation. Investments are stated at value determined as of the close of regular trading on the New York Stock Exchange on each day the exchange is open for trading.
Various inputs are used in determining the value of the Fund's investments. These inputs are summarized in three broad levels. Level 1 includes quoted prices in active markets for identical securities. Level 2 includes other significant observable inputs (including quoted prices for similar securities, interest rates, prepayment speeds, and credit risk). Level 3 includes significant unobservable inputs (including the Fund's own assumptions in determining the fair value of investments). The inputs or methodology used for valuing securities are not necessarily an indication of the risk associated with investing in those securities.
Equity securities are valued at the most recent sale price or official closing price reported on the exchange (U.S. or foreign) or over-the-counter market on which they trade and are categorized as Level 1 securities. Securities for which no sales are reported are valued at the calculated mean between the most recent bid and asked quotations on the relevant market or, if a mean cannot be determined, at the most recent bid quotation. For certain international equity securities, in order to adjust for events which may occur between the close of the foreign exchanges and the close of the New York Stock Exchange, a fair valuation model may be used. This fair valuation model takes into account comparisons to the valuation of American Depository Receipts (ADRs), exchange-traded funds, futures contracts and certain indices and these securities are categorized as Level 2.
Debt securities and loan participations and assignments are valued at prices supplied by independent pricing services approved by the Fund's Board. If the pricing services are unable to provide valuations, securities are valued at the most recent bid quotation or evaluated price, as applicable, obtained from one or more broker-dealers. Such services may use various pricing techniques which take into account appropriate factors such as yield, quality, coupon rate, maturity, type of issue, trading characteristics and other data, as well as broker quotes. These securities are generally categorized as Level 2.
Money market instruments purchased with an original or remaining maturity of sixty days or less, maturing at par, are valued at amortized cost, which approximates value, and are categorized as Level 2. Investments in open-end investment companies are valued at their net asset value each business day and are categorized as Level 1.
Futures contracts are generally valued at the settlement prices established each day on the exchange on which they are traded and are categorized as Level 1.
Forward currency contracts are valued at the prevailing forward exchange rate of the underlying currencies and are categorized as Level 2.
Swap contracts are valued daily based upon prices supplied by a Board approved pricing vendor, if available, and otherwise are valued at the price provided by the broker-dealer. Swap contracts are generally categorized as Level 2.
Exchange-traded options are valued at the last sale price or, in the absence of a sale, the mean between the closing bid and asked prices or at the most recent asked price (bid for purchased options) if no bid or asked price are available. Exchange-traded options are categorized as Level 1. Over-the-counter written or purchased options are valued at prices supplied by a Board approved pricing vendor, if available, and otherwise are valued at the price provided by the broker-dealer with which the option was traded. Over-the-counter written or purchased options are generally categorized as Level 2.
Securities and other assets for which market quotations are not readily available or for which the above valuation procedures are deemed not to reflect fair value are valued in a manner that is intended to reflect their fair value as determined in accordance with procedures approved by the Board and are generally categorized as Level 3. In accordance with the Fund's valuation procedures, factors used in determining value may include, but are not limited to, the type of the security; the size of the holding; the initial cost of the security; the existence of any contractual restrictions on the security's disposition; the price and extent of public trading in similar securities of the issuer or of comparable companies; quotations or evaluated prices from broker-dealers and/or pricing services; information obtained from the issuer, analysts, and/or the appropriate stock exchange (for exchange-traded securities); an analysis of the company's or issuer's financial statements; an evaluation of the forces that influence the issuer and the market(s) in which the security is purchased and sold and with respect to debt securities; the maturity, coupon, creditworthiness, currency denomination and the movement of the market in which the security is normally traded. The value determined under these procedures may differ from published values for the same securities.
Disclosure about the classification of fair value measurements is included in a table following the Fund's Investment Portfolio.
Foreign Currency Translations. The books and records of the Fund are maintained in U.S. dollars. Investment securities and other assets and liabilities denominated in a foreign currency are translated into U.S. dollars at the prevailing exchange rates at period end. Purchases and sales of investment securities, income and expenses are translated into U.S. dollars at the prevailing exchange rates on the respective dates of the transactions.
Net realized and unrealized gains and losses on foreign currency transactions represent net gains and losses between trade and settlement dates on securities transactions, the acquisition and disposition of foreign currencies, and the difference between the amount of net investment income accrued and the U.S. dollar amount actually received. That portion of both realized and unrealized gains and losses on investments that results from fluctuations in foreign currency exchange rates is not separately disclosed but is included with net realized and unrealized gain/appreciation and loss/depreciation on investments.
Securities Lending. Deutsche Bank AG, as lending agent, lends securities of the Fund to certain financial institutions under the terms of the Security Lending Agreement. The Fund retains the benefits of owning the securities it has loaned and continues to receive interest and dividends generated by the securities and to participate in any changes in their market value. The Fund requires the borrowers of the securities to maintain collateral with the Fund consisting of either cash or liquid, unencumbered assets having a value at least equal to the value of the securities loaned. When the collateral falls below specified amounts, the lending agent will use its best effort to obtain additional collateral on the next business day to meet required amounts under the security lending agreement. The Fund may invest the cash collateral into a joint trading account in an affiliated money market fund pursuant to Exemptive Orders issued by the SEC. The Fund receives compensation for lending its securities either in the form of fees or by earning interest on invested cash collateral net of borrower rebates and fees paid to a lending agent. Either the Fund or the borrower may terminate the loan. There may be risks of delay and costs in recovery of securities or even loss of rights in the collateral should the borrower of the securities fail financially. If the Fund is not able to recover securities lent, the Fund may sell the collateral and purchase a replacement investment in the market, incurring the risk that the value of the replacement security is greater than the value of the collateral. The Fund is also subject to all investment risks associated with the reinvestment of any cash collateral received, including, but not limited to, interest rate, credit and liquidity risk associated with such investments.
As of June 30, 2013, the Fund had securities on loan with a gross value of $22,576,516. The value of the related collateral, $23,372,464, exceeded the value of the securities loaned at period end.
Loan Participations and Assignments. Loan participations and assignments are portions of loans originated by banks and sold in pieces to investors. These fixed and floating rate loans ("Loans") in which the Fund invests are arranged between the borrower and one or more financial institutions ("Lenders"). These Loans may take the form of Senior Loans, which are corporate obligations often issued in connection with recapitalizations, acquisitions, leveraged buy-outs and refinancings, and Sovereign Loans, which are debt instruments between a foreign sovereign entity and one or more financial institutions. The Fund invests in such Loans in the form of participations in Loans ("Participations") or assignments of all or a portion of Loans from third parties ("Assignments"). Participations typically result in the Fund having a contractual relationship only with the Lender, not with the borrower. The Fund has the right to receive payments of principal, interest and any fees to which it is entitled from the Lender selling the Participation and only upon receipt by the Lender of the payments from the borrower. In connection with purchasing Participations, the Fund generally has no right to enforce compliance by the borrower with the terms of the loan agreement relating to the Loan, or any rights of set-off against the borrower, and the Fund will not benefit directly from any collateral supporting the Loan in which it has purchased the Participation. As a result, the Fund assumes the credit risk of both the borrower and the Lender that is selling the Participation. Assignments typically result in the Fund having a direct contractual relationship with the borrower, and the Fund may enforce compliance by the borrower with the terms of the loan agreement. Loans held by the Fund are generally in the form of Assignments but the Fund may also invest in Participants. All Loan Participations and Assignments involve interest rate risk, liquidity risk and credit risk, including the potential default or insolvency of the borrower.
When-Issued/Delayed Delivery Securities. The Fund may purchase or sell securities with delivery or payment to occur at a later date beyond the normal settlement period. At the time the Fund enters into a commitment to purchase or sell a security, the transaction is recorded and the value of the transaction is reflected in the net asset value. The price of such security and the date when the security will be delivered and paid for are fixed at the time the transaction is negotiated. The value of the security may vary with market fluctuations. At the time the Fund enters into a purchase transaction it is required to segregate cash or other liquid assets at least equal to the amount of the commitment.
Certain risks may arise upon entering into when-issued or delayed delivery transactions from the potential inability of counterparties to meet the terms of their contracts or if the issuer does not issue the securities due to political, economic, or other factors. Additionally, losses may arise due to changes in the value of the underlying securities.
Taxes. The Fund's policy is to comply with the requirements of the Internal Revenue Code, as amended, which are applicable to regulated investment companies and to distribute all of its taxable income to its shareholders.
Additionally, the Fund may be subject to taxes imposed by the governments of countries in which it invests and are generally based on income and/or capital gains earned or repatriated. Estimated tax liabilities on certain foreign securities are recorded on an accrual basis and are reflected as components of interest income or net change in unrealized gain/loss on investments. Tax liabilities realized as a result of security sales are reflected as a component of net realized gain/loss on investments.
Under the Regulated Investment Company Modernization Act of 2010, net capital losses incurred post-enactment may be carried forward indefinitely, and their character is retained as short-term and/or long-term. Previously, net capital losses were carried forward for eight years and treated as short-term losses. As a transition rule, the Act requires that post-enactment net capital losses be used before pre-enactment net capital losses.
At December 31, 2012, the Fund had a net tax basis capital loss carryforward of approximately $5,132,000 of pre-enactment losses, which may be applied against any realized net taxable capital gains of each succeeding year until fully utilized or until December 31, 2017, the expiration date, whichever occurs first.
The Fund has reviewed the tax positions for the open tax years as of December 31, 2012 and has determined that no provision for income tax is required in the Fund's financial statements. The Fund's federal tax returns for the prior three fiscal years remain open subject to examination by the Internal Revenue Service.
Distribution of Income and Gains. Distributions from net investment income of the Fund, if any, are declared and distributed to shareholders annually. Net realized gains from investment transactions, in excess of available capital loss carryforwards, would be taxable to the Fund if not distributed and, therefore, will be distributed to shareholders at least annually. The Fund may also make additional distributions for tax purposes if necessary.
The timing and characterization of certain income and capital gain distributions are determined annually in accordance with federal tax regulations which may differ from accounting principles generally accepted in the United States of America. These differences primarily relate to investments in foreign denominated investments, forward currency contracts, futures contracts, swap contracts and certain securities sold at a loss. As a result, net investment income (loss) and net realized gain (loss) on investment transactions for a reporting period may differ significantly from distributions during such period. Accordingly, the Fund may periodically make reclassifications among certain of its capital accounts without impacting the net asset value of the Fund.
The tax character of current year distributions will be determined at the end of the current fiscal year.
Expenses. Expenses of the Trust arising in connection with a specific fund are allocated to that fund. Other Trust expenses which cannot be directly attributed to a fund are apportioned among the funds in the Trust based upon the relative net assets or other appropriate measures.
Contingencies. In the normal course of business, the Fund may enter into contracts with service providers that contain general indemnification clauses. The Fund's maximum exposure under these arrangements is unknown as this would involve future claims that may be made against the Fund that have not yet been made. However, based on experience, the Fund expects the risk of loss to be remote.
Other. Investment transactions are accounted for on a trade date plus one basis for daily net asset value calculations. However, for financial reporting purposes, investment transactions are reported on trade date. Interest income is recorded on the accrual basis. Dividend income is recorded on the ex-dividend date net of foreign withholding taxes. Certain dividends from foreign securities may be recorded subsequent to the ex-dividend date as soon as the Fund is informed of such dividends. Realized gains and losses from investment transactions are recorded on an identified cost basis and may include proceeds from litigation. All discounts and premiums are accreted/amortized for both tax and financial reporting purposes, with the exception of securities in default of principal.
B. Derivative Instruments
Interest Rate Swap Contracts. For the six months ended June 30, 2013, the Fund entered into interest rate swap transactions to gain exposure to different parts of the yield curve while managing overall duration. The use of interest rate swaps is a highly specialized activity that involves investment techniques and risks different from those associated with ordinary portfolio security transactions. In an interest rate swap, the Fund agrees to pay to the other party to the interest rate swap (which is known as the "counterparty") a fixed rate payment in exchange for the counterparty agreeing to pay to the Fund a variable rate payment, or the Fund agrees to receive from the counterparty a fixed rate payment in exchange for the counterparty agreeing to receive from the Fund a variable rate payment. In addition, both the Fund and counterparty may agree to exchange variable rate payments based on different indices. The payment obligations are based on the notional amount of the swap. Certain risks may arise when entering into swap transactions including counterparty default, liquidity or unfavorable changes in interest rates. In connection with these agreements, securities and or cash may be identified as collateral in accordance with the terms of the swap agreements to provide assets of value and recourse in the event of default. The maximum counterparty credit risk is the net present value of the cash flows to be received from or paid to the counterparty over the term of the interest rate swap contract, to the extent that this amount is beneficial to the Fund, in addition to any related collateral posted to the counterparty by the Fund. This risk may be partially reduced by a master netting arrangement between the Fund and the counterparty. The value of the swap is adjusted daily and the change in value, if any, is recorded as unrealized appreciation or depreciation in the Statement of Assets and Liabilities. An upfront payment, if any, made by the Fund is recorded as an asset in the Statement of Assets and Liabilities. An upfront payment, if any, received by the Fund is recorded as a liability in the Statement of Assets and Liabilities. Payments received or made at the end of the measurement period are recorded as realized gain or loss in the Statement of Operations.
A summary of the open interest rate swap contracts as of June 30, 2013 is included in a table following the Fund's Investment Portfolio. For the six months ended June 30, 2013, the investment in interest rate swap contracts had a total notional amount generally indicative of a range from $6,100,000 to $22,800,000.
Credit Default Swap Contracts. A credit default swap is a contract between a buyer and a seller of protection against pre-defined credit events for the reference entity. The Fund may enter into credit default swap contracts to gain exposure to an underlying issuer's credit quality characteristics without directly investing in that issuer or to hedge against the risk of a credit event on debt securities. As a seller in the credit default swap contract, the Fund is required to pay the par (or other agreed-upon) value of the referenced entity to the counterparty with the occurrence of a credit event by a third party, such as a U.S. or foreign corporate issuer, on the reference entity, which would likely result in a loss to the Fund. In return, the Fund receives from the counterparty a periodic stream of payments over the term of the contract provided that no credit event has occurred. If no credit event occurs, the Fund keeps the stream of payments with no payment obligations. This involves the risk that the contract may expire worthless. It also involves counterparty risk that the seller may fail to satisfy its payment obligations to the Fund with the occurrence of a credit event. When the Fund sells a credit default swap contract it will cover its commitment. This may be achieved by, among other methods, maintaining cash or liquid assets equal to the aggregate notional value of the reference entities for all outstanding credit default swap contracts sold by the Fund. For the six months ended June 30, 2013, the Fund entered into credit default swap contracts to gain exposure to the underlying issuer's credit quality characteristics.
The value of the credit default swap is adjusted daily and the change in value, if any, is recorded daily as unrealized appreciation or depreciation in the Statement of Assets and Liabilities. An upfront payment, if any, made by the Fund is recorded as an asset in the Statement of Assets and Liabilities. An upfront payment, if any, received by the Fund is recorded as a liability in the Statement of Assets and Liabilities. Under the terms of the credit default swap contracts, the Fund receives or makes quarterly payments based on a specified interest rate on a fixed notional amount. These payments are recorded as a realized gain or loss in the Statement of Operations. Payments received or made as a result of a credit event or termination of the contract are recognized, net of a proportional amount of the upfront payment, as realized gains or losses in the Statement of Operations.
A summary of the open credit default swap contracts as of June 30, 2013 is included in a table following the Fund's Investment Portfolio. For the six months ended June 30, 2013, the investment in credit default swap contracts sold had a total notional value generally indicative of a range from $125,000 to $1,925,000.
Futures Contracts. A futures contract is an agreement between a buyer or seller and an established futures exchange or its clearinghouse in which the buyer or seller agrees to take or make a delivery of a specific amount of a financial instrument at a specified price on a specific date (settlement date). For the six months ended June 30, 2013, the Fund entered into interest rate futures to gain exposure to different parts of the yield curve while managing overall duration. The Fund also entered into interest rate futures contracts for non-hedging purposes to seek to enhance potential gains.
Upon entering into a futures contract, the Fund is required to deposit with a financial intermediary cash or securities ("initial margin") in an amount equal to a certain percentage of the face value indicated in the futures contract. Subsequent payments ("variation margin") are made or received by the Fund dependent upon the daily fluctuations in the value and are recorded for financial reporting purposes as unrealized gains or losses by the Fund. Gains or losses are realized when the contract expires or is closed. Since all futures contracts are exchange-traded, counterparty risk is minimized as the exchange's clearinghouse acts as the counterparty, and guarantees the futures against default.
Certain risks may arise upon entering into futures contracts, including the risk that an illiquid market will limit the Fund's ability to close out a futures contract prior to the settlement date and the risk that the futures contract is not well correlated with the security, index or currency to which it relates. Risk of loss may exceed amounts disclosed in the Statement of Assets and Liabilities.
A summary of the open futures contracts as of June 30, 2013 is included in a table following the Fund's Investment Portfolio. For the six months ended June 30, 2013, the investment in futures contracts purchased had a total notional value generally indicative of a range from approximately $1,012,000 to $6,117,000, and the investment in futures contracts sold had a total notional value generally indicative of a range from approximately $4,480,000 to $58,955,000.
Options. An option contract is a contract in which the writer (seller) of the option grants the buyer of the option, upon payment of a premium, the right to purchase from (call option), or sell to (put option), the writer a designated instrument at a specified price within a specified period of time. Certain options, including options on indices and interest rate options, will require cash settlement by the Fund if exercised. For the six months ended June 30, 2013, the Fund entered into options on interest rate futures and on interest rate swaps in order to hedge against potential adverse interest rate movements of portfolio assets.
If the Fund writes a covered call option, the Fund foregoes, in exchange for the premium, the opportunity to profit during the option period from an increase in the market value of the underlying security above the exercise price. If the Fund writes a put option it accepts the risk of a decline in the value of the underlying security below the exercise price. Over-the-counter options have the risk of the potential inability of counterparties to meet the terms of their contracts. For exchange traded contracts, the counterparty risk is minimized as the exchange's clearinghouse acts as the counterparty, and guarantees the futures against default. The Fund's maximum exposure to purchased options is limited to the premium initially paid. In addition, certain risks may arise upon entering into option contracts including the risk that an illiquid secondary market will limit the Fund's ability to close out an option contract prior to the expiration date and that a change in the value of the option contract may not correlate exactly with changes in the value of the securities or currencies hedged.
A summary of the open purchased option contracts as of June 30, 2013 is included in the Fund's Investment Portfolio. A summary of open written option contracts is included in a table following the Fund's Investment Portfolio. For the six months ended June 30, 2013, the investment in written option contracts had a total value generally indicative of a range from approximately $74,000 to $434,000, and purchased option contracts had a total value generally indicative of a range from approximately $83,000 to $147,000.
Forward Foreign Currency Exchange Contracts. A forward foreign currency exchange contract ("forward currency contract") is a commitment to purchase or sell a foreign currency at the settlement date at a negotiated rate. For the six months ended June 30, 2013, the Fund entered into forward currency contracts in order to hedge its exposure to changes in foreign currency exchange rates on its foreign currency denominated portfolio holdings, to facilitate transactions in foreign currency denominated securities and to enhance total returns.
Forward currency contracts are valued at the prevailing forward exchange rate of the underlying currencies and unrealized gain (loss) is recorded daily. On the settlement date of the forward currency contract, the Fund records a realized gain or loss equal to the difference between the value of the contract at the time it was opened and the value of the contract at the time it was closed. Certain risks may arise upon entering into forward currency contracts from the potential inability of counterparties to meet the terms of their contracts. The maximum counterparty credit risk to the Fund is measured by the unrealized gain on appreciated contracts. Additionally, when utilizing forward currency contracts to hedge, the Fund gives up the opportunity to profit from favorable exchange rate movements during the term of the contract.
A summary of the open forward currency contracts as of June 30, 2013 is included in a table following the Fund's Investment Portfolio. For the six months ended June 30, 2013, the investment in forward currency contracts short vs. U.S. dollars had a total contract value generally indicative of a range from approximately $6,931,000 to $23,982,000, and the investment in forward currency contracts long vs. U.S. dollars had a total contract value generally indicative of a range from approximately $3,551,000 to $20,433,000. The investment in forward currency contracts long vs. other foreign currencies sold had a total contract value generally indicative of a range from $0 to approximately $6,419,000.
The following tables summarize the value of the Fund's derivative instruments held as of June 30, 2013 and the related location in the accompanying Statement of Assets and Liabilities, presented by primary underlying risk exposure:
| Asset Derivatives | | Purchased Options | | | Forward Contracts | | | Swap Contracts | | | Futures Contracts | | | Total | |
| Interest Rate Contracts (a) (b) | | $ | 147,256 | | | $ | — | | | $ | 292,585 | | | $ | 2,164,258 | | | $ | 2,604,099 | |
| Credit Contracts (a) | | | — | | | | — | | | | 7,235 | | | | — | | | | 7,235 | |
| Foreign Exchange Contracts (c) | | | — | | | | 574,063 | | | | — | | | | — | | | | 574,063 | |
| | | $ | 147,256 | | | $ | 574,063 | | | $ | 299,820 | | | $ | 2,164,258 | | | $ | 3,185,397 | |
Each of the above derivatives is located in the following Statement of Assets and Liabilities accounts:
(a) Investment in securities, at value (includes purchased options) and unrealized appreciation on swap contracts
(b) Includes cumulative appreciation of futures contracts as disclosed in the Investment Portfolio. Unsettled variation margin is disclosed separately within the Statement of Assets and Liabilities.
(c) Unrealized appreciation on forward foreign currency exchange contracts
| Liability Derivatives | | Written Options | | | Forward Contracts | | | Swap Contracts | | | Futures Contracts | | | Total | |
| Interest Rate Contracts (a) (b) | | $ | (434,381 | ) | | $ | — | | | $ | (62,505 | ) | | $ | (110,370 | ) | | $ | (607,256 | ) |
| Foreign Exchange Contracts (c) | | | — | | | | (494,415 | ) | | | — | | | | — | | | | (494,415 | ) |
| | | $ | (434,381 | ) | | $ | (494,415 | ) | | $ | (62,505 | ) | | $ | (110,370 | ) | | $ | (1,101,671 | ) |
Each of the above derivatives is located in the following Statement of Assets and Liabilities accounts:
(a) Options written, at value and unrealized depreciation on swap contracts
(b) Includes cumulative depreciation of futures contracts as disclosed in the Investment Portfolio. Unsettled variation margin is disclosed separately within the Statement of Assets and Liabilities.
(c) Unrealized depreciation on forward foreign currency exchange contracts
Additionally, the amount of unrealized and realized gains and losses on derivative instruments recognized in Fund earnings during the six months ended June 30, 2013 and the related location in the accompanying Statement of Operations is summarized in the following tables by primary underlying risk exposure:
| Realized Gain (Loss) | | Purchased Options | | | Written Options | | | Forward Contracts | | | Swap Contracts | | | Futures Contracts | | | Total | |
| Interest Rate Contracts (a) | | $ | (37,156 | ) | | $ | 90,646 | | | $ | — | | | $ | 12,033 | | | $ | (456,915 | ) | | $ | (391,392 | ) |
| Credit Contracts (a) | | | — | | | | — | | | | — | | | | 74,325 | | | | — | | | | 74,325 | |
| Foreign Exchange Contracts (b) | | | — | | | | — | | | | (276,007 | ) | | | — | | | | — | | | | (276,007 | ) |
| | | $ | (37,156 | ) | | $ | 90,646 | | | $ | (276,007 | ) | | $ | 86,358 | | | $ | (456,915 | ) | | $ | (593,074 | ) |
Each of the above derivatives is located in the following Statement of Operations accounts:
(a) Net realized gain (loss) from investments (includes purchased options), written options, swap contracts and futures, respectively
(b) Net realized gain (loss) from foreign currency (Statement of Operations includes both forward currency contracts and foreign currency transactions)
| Change in Net Unrealized Appreciation (Depreciation) | | Purchased Options | | | Written Options | | | Forward Contracts | | | Swap Contracts | | | Futures Contracts | | | Total | |
| Interest Rate Contracts (a) | | $ | 57,291 | | | $ | (272,306 | ) | | $ | — | | | $ | 267,097 | | | $ | 2,076,162 | | | $ | 2,128,244 | |
| Credit Contracts (a) | | | — | | | | — | | | | — | | | | (57,291 | ) | | | — | | | | (57,291 | ) |
| Foreign Exchange Contracts (b) | | | — | | | | — | | | | 103,401 | | | | — | | | | — | | | | 103,401 | |
| | | $ | 57,291 | | | $ | (272,306 | ) | | $ | 103,401 | | | $ | 209,806 | | | $ | 2,076,162 | | | $ | 2,174,354 | |
Each of the above derivatives is located in the following Statement of Operations accounts:
(a) Change in net unrealized appreciation (depreciation) on investments (includes purchased options), written options, swap contracts and futures, respectively
(b) Change in net unrealized appreciation (depreciation) on foreign currency (Statement of Operations includes both forward currency contracts and foreign currency transactions)
As of June 30, 2013, the Fund has transactions subject to enforceable master netting agreements. A reconciliation of the gross amounts on the Statement of Assets and Liabilities to the net amounts by derivative type, including any collateral exposure, is included in the following tables:
| Counterparty | | Gross Amounts of Assets Presented in the Statement of Assets and Liabilities (a) | | | Financial Instruments and Derivatives Available for Offset | | | Collateral Received | | | Net Amount of Derivative Assets | |
| Bank of America | | $ | 172,438 | | | $ | (103,264 | ) | | $ | — | | | $ | 69,174 | |
| Barclays Bank PLC | | | 311,970 | | | | (272,118 | ) | | | — | | | | 39,852 | |
| BNP Paribas | | | 51,744 | | | | (51,744 | ) | | | — | | | | — | |
| Citigroup, Inc. | | | 101,642 | | | | (35,229 | ) | | | — | | | | 66,413 | |
| JPMorgan Chase Securities, Inc. | | | 168,640 | | | | (59,951 | ) | | | — | | | | 108,689 | |
| Nomura International PLC | | | 205,689 | | | | (165,758 | ) | | | — | | | | 39,931 | |
| UBS AG | | | 7,235 | | | | (7,235 | ) | | | — | | | | — | |
| Exchange Traded Futures and Options (b) | | | 2,166,039 | | | | — | | | | — | | | | 2,166,039 | |
| | | $ | 3,185,397 | | | $ | (695,299 | ) | | $ | — | | | $ | 2,490,098 | |
| Counterparty | | Gross Amounts of Liabilities Presented in the Statement of Assets and Liabilities (a) | | | Financial Instruments and Derivatives Available for Offset | | | Collateral Pledged | | | Net Amount of Derivative Liabilities | |
| Bank of America | | $ | 103,264 | | | $ | (103,264 | ) | | $ | — | | | $ | — | |
| Barclays Bank PLC | | | 272,118 | | | | (272,118 | ) | | | — | | | | — | |
| BNP Paribas | | | 78,702 | | | | (51,744 | ) | | | — | | | | 26,958 | |
| Citigroup, Inc. | | | 35,229 | | | | (35,229 | ) | | | — | | | | — | |
| JPMorgan Chase Securities, Inc. | | | 59,951 | | | | (59,951 | ) | | | — | | | | — | |
| Nomura International PLC | | | 165,758 | | | | (165,758 | ) | | | — | | | | — | |
| UBS AG | | | 102,279 | | | | (7,235 | ) | | | — | | | | 95,044 | |
| Exchange Traded Futures and Options (b) | | | 284,370 | | | | — | | | | — | | | | 284,370 | |
| | | $ | 1,101,671 | | | $ | (695,299 | ) | | $ | — | | | $ | 406,372 | |
(a) Forward foreign currency exchange contracts, swap contracts and over-the-counter purchased options and written options are netted.
(b) Includes financial instruments (purchased options or futures) which are not subject to a master netting arrangement, or another similar arrangement.
C. Purchases and Sales of Securities
During the six months ended June 30, 2013, purchases and sales of investment transactions (excluding short-term investments and U.S. Treasury obligations) aggregated $131,448,445 and $146,787,952, respectively. Purchases and sales of U.S. Treasury obligations aggregated $0 and $5,000,691, respectively.
For the six months ended June 30, 2013, transactions for written options on interest rate swap contracts and futures contracts were as follows:
| | | Contract Amount | | | Premium | |
| Outstanding, beginning of period | | | 8,200,020 | | | $ | 181,719 | |
| Options written | | | 16,800,048 | | | | 191,116 | |
| Options closed | | | (5,900,000 | ) | | | (95,750 | ) |
| Options expired | | | (20 | ) | | | (7,769 | ) |
| Outstanding, end of period | | | 19,100,048 | | | $ | 269,316 | |
D. Related Parties
Management Agreement. Under the Investment Management Agreement with Deutsche Investment Management Americas Inc. ("DIMA" or the "Advisor"), an indirect, wholly owned subsidiary of Deutsche Bank AG, the Advisor directs the investments of the Fund in accordance with its investment objectives, policies and restrictions. The Advisor determines the securities, instruments and other contracts relating to investments to be purchased, sold or entered into by the Fund.
Under the Investment Management Agreement, the Fund pays a monthly management fee based on the Fund's average daily net assets, computed and accrued daily and payable monthly, at the following annual rates:
| First $250 million | | | .370 | % |
| Next $750 million | | | .345 | % |
| Over $1 billion | | | .310 | % |
Accordingly, for the six months ended June 30, 2013, the fee pursuant to the Investment Management Agreement was equivalent to an annualized effective rate of 0.37% of the Fund's average daily net assets.
For the period from January 1, 2013 through September 30, 2013, the Advisor has contractually agreed to waive its fees and/or reimburse certain operating expenses to the extent necessary to maintain the operating expenses (excluding certain expenses such as extraordinary expenses, taxes, brokerage and interest expense) of Class A shares at 0.68%.
Administration Fee. Pursuant to an Administrative Services Agreement, DIMA provides most administrative services to the Fund. For all services provided under the Administrative Services Agreement, the Fund pays DIMA an annual fee ("Administration Fee") of 0.10% of the Fund's average daily net assets, computed and accrued daily and payable monthly. For the six months ended June 30, 2013, the Administration Fee was $131,468, of which $21,440 is unpaid.
Service Provider Fees. DWS Investments Service Company ("DISC"), an affiliate of the Advisor, is the transfer agent, dividend-paying agent and shareholder service agent for the Fund. Pursuant to a sub-transfer agency agreement between DISC and DST Systems, Inc. ("DST"), DISC has delegated certain transfer agent, dividend-paying agent and shareholder service agent functions to DST. DISC compensates DST out of the shareholder servicing fee it receives from the Fund. For the six months ended June 30, 2013, the amounts charged to the Fund by DISC aggregated $196, of which $64 is unpaid.
Typesetting and Filing Service Fees. Under an agreement with DIMA, DIMA is compensated for providing typesetting and certain regulatory filing services to the Fund. For the six months ended June 30, 2013, the amount charged to the Fund by DIMA included in the Statement of Operations under "reports to shareholders" aggregated $8,175, of which $7,204 is unpaid.
Trustees' Fees and Expenses. The Fund paid retainer fees to each Trustee not affiliated with the Advisor, plus specified amounts to the Board Chairperson and Vice Chairperson and to each committee Chairperson.
Affiliated Cash Management Vehicles. The Fund may invest uninvested cash balances in Central Cash Management Fund and DWS Variable NAV Money Fund, affiliated money market funds which are managed by the Advisor. Each affiliated money market fund seeks to provide a high level of current income consistent with liquidity and the preservation of capital. Each affiliated money market fund is managed in accordance with Rule 2a-7 under the Investment Company Act of 1940, which governs the quality, maturity, diversity and liquidity of instruments in which a money market fund may invest. Central Cash Management Fund seeks to maintain a stable net asset value, and DWS Variable NAV Money Fund maintains a floating net asset value. The Fund indirectly bears its proportionate share of the expenses of each affiliated money market fund in which it invests. Central Cash Management Fund does not pay the Advisor an investment management fee. To the extent that DWS Variable NAV Money Fund pays an investment management fee to the Advisor, the Advisor will waive an amount of the investment management fee payable to the Advisor by the Fund equal to the amount of the investment management fee payable on the Fund's assets invested in DWS Variable NAV Money Fund.
Securities Lending Agent Fees. Deutsche Bank AG serves as securities lending agent for the Fund. For the six months ended June 30, 2013, the Fund incurred securities lending agent fees to Deutsche Bank AG in the amount of $12,811.
E. Ownership of the Fund
At June 30, 2013, three Participating Insurance Companies were owners of record of 10% or more of the total outstanding shares of the Fund, each owning 44%, 21% and 16%.
F. Line of Credit
The Fund and other affiliated funds (the "Participants") share in a $375 million revolving credit facility provided by a syndication of banks. The Fund may borrow for temporary or emergency purposes, including the meeting of redemption requests that otherwise might require the untimely disposition of securities. The Participants are charged an annual commitment fee which is allocated based on net assets, among each of the Participants. Interest is calculated at a rate per annum equal to the sum of the Federal Funds Rate plus 1.25 percent plus if LIBOR exceeds the Federal Funds Rate the amount of such excess. The Fund may borrow up to a maximum of 33 percent of its net assets under the agreement. The Fund had no outstanding loans at June 30, 2013.
Information About Your Fund's Expenses (Unaudited)
As an investor of the Fund, you incur two types of costs: ongoing expenses and transaction costs. Ongoing expenses include management fees and other Fund expenses. Examples of transaction costs include contract charges, redemption fees and account maintenance fees, which are not shown in this section. The following tables are intended to help you understand your ongoing expenses (in dollars) of investing in the Fund and to help you compare these expenses with the ongoing expenses of investing in other mutual funds. The example in the table is based on an investment of $1,000 invested at the beginning of the six-month period and held for the entire period (January 1, 2013 to June 30, 2013).
The tables illustrate your Fund's expenses in two ways:
•Actual Fund Return. This helps you estimate the actual dollar amount of ongoing expenses (but not transaction costs) paid on a $1,000 investment in the Fund using the Fund's actual return during the period. To estimate the expenses you paid over the period, simply divide your account value by $1,000 (for example, an $8,600 account value divided by $1,000 = 8.6), then multiply the result by the number in the "Expenses Paid per $1,000" line under the share class you hold.
• Hypothetical 5% Fund Return. This helps you to compare your Fund's ongoing expenses (but not transaction costs) with those of other mutual funds using the Fund's actual expense ratio and a hypothetical rate of return of 5% per year before expenses. Examples using a 5% hypothetical Fund return may be found in the shareholder reports of other mutual funds. The hypothetical account values and expenses may not be used to estimate the actual ending account balance or expenses you paid for the period.
Please note that the expenses shown in these tables are meant to highlight your ongoing expenses only and do not reflect any transaction costs. The "Expenses Paid per $1,000" line of the tables is useful in comparing ongoing expenses only and will not help you determine the relative total expense of owning different funds. If these transaction costs had been included, your costs would have been higher.
Expenses and Value of a $1,000 Investment for the six months ended June 30, 2013 | |
| Actual Fund Return | | Class A | |
| Beginning Account Value 1/1/13 | | $ | 1,000.00 | |
| Ending Account Value 6/30/13 | | $ | 1,048.40 | |
| Expenses Paid per $1,000* | | $ | 2.95 | |
| Hypothetical 5% Fund Return | | Class A | |
| Beginning Account Value 1/1/13 | | $ | 1,000.00 | |
| Ending Account Value 6/30/13 | | $ | 1,021.92 | |
| Expenses Paid per $1,000* | | $ | 2.91 | |
* Expenses are equal to the Fund's annualized expense ratio, multiplied by the average account value over the period, multiplied by 181 (the number of days in the most recent six-month period), then divided by 365.
| Annualized Expense Ratio | Class A | |
| DWS Variable Series II — DWS Global Income Builder VIP | .58% | |
For more information, please refer to the Fund's prospectus.
These tables do not reflect charges and fees ("contract charges") associated with the separate account that invests in the Fund or any variable life insurance policy or variable annuity contract for which the Fund is an investment option.
For an analysis of the fees associated with an investment in the Fund or similar funds, please refer to http://apps.finra.org/fundanalyzer/1/fa.aspx.
The Trust's policies and procedures for voting proxies for portfolio securities and information about how the Trust voted proxies related to its portfolio securities during the 12-month period ended June 30 are available on our Web site — www.dws-investments.com (click on "proxy voting" at the bottom of the page) — or on the SEC's Web site — www.sec.gov. To obtain a written copy of the Trust's policies and procedures without charge, upon request, call us toll free at (800) 728-3337.
Summary of Management Fee Evaluation by Independent Fee Consultant
September 17, 2012
Pursuant to an Order entered into by Deutsche Investment Management Americas and affiliates (collectively, "DeAM") with the Attorney General of New York, I, Thomas H. Mack, have been appointed the Independent Fee Consultant for the DWS Funds (formerly the DWS Scudder Funds). My duties include preparing an annual written evaluation of the management fees DeAM charges the Funds, considering among other factors the management fees charged by other mutual fund companies for like services, management fees DeAM charges other clients for like services, DeAM's costs of supplying services under the management agreements and related profit margins, possible economies of scale if a Fund grows larger, and the nature and quality of DeAM's services, including fund performance. This report summarizes my evaluation for 2012, including my qualifications, the evaluation process for each of the DWS Funds, consideration of certain complex-level factors, and my conclusions. I served in substantially the same capacity in 2007, 2008, 2009, 2010 and 2011.
Qualifications
For more than 35 years I have served in various professional capacities within the investment management business. I have held investment analysis and advisory positions, including securities analyst, portfolio strategist and director of investment policy with a large investment firm. I have also performed business management functions, including business development, financial management and marketing research and analysis.
Since 1991, I have been an independent consultant within the asset management industry. I have provided services to over 125 client organizations, including investment managers, mutual fund boards, product distributors and related organizations. Over the past ten years I have completed a number of assignments for mutual fund boards, specifically including assisting boards with management contract renewal.
I hold a Master of Business Administration degree, with highest honors, from Harvard University and Master of Science and Bachelor of Science (highest honors) degrees from the University of California at Berkeley. I am an independent director and audit committee financial expert for two closed-end mutual funds and have served in various leadership and financial oversight capacities with non-profit organizations.
Evaluation of Fees for each DWS Fund
My work focused primarily on evaluating, fund-by-fund, the fees charged to each of the 103 mutual fund portfolios in the DWS Fund family. For each Fund, I considered each of the key factors mentioned above, as well as any other relevant information. In doing so I worked closely with the Funds' Independent Directors in their annual contract renewal process, as well as in their approval of contracts for several new funds (documented separately).
In evaluating each Fund's fees, I reviewed comprehensive materials provided by or on behalf of DeAM, including expense information prepared by Lipper Analytical, comparative performance information, profitability data, manager histories, and other materials. I also accessed certain additional information from the Lipper and Morningstar databases and drew on my industry knowledge and experience.
To facilitate evaluating this considerable body of information, I prepared for each Fund a document summarizing the key data elements in each area as well as additional analytics discussed below. This made it possible to consider each key data element in the context of the others.
In the course of contract renewal, DeAM agreed to implement a number of fee and expense adjustments requested by the Independent Directors which will favorably impact future fees and expenses, and my evaluation includes the effects of these changes.
Fees and Expenses Compared with Other Funds
The competitive fee and expense evaluation for each fund focused on two primary comparisons:
The Fund's contractual management fee (the advisory fee plus the administration fee where applicable) compared with those of a group of typically 12-15 funds in the same Lipper investment category (e.g. Large Capitalization Growth) having similar distribution arrangements and being of similar size.
The Fund's total expenses compared with a broader universe of funds from the same Lipper investment category and having similar distribution arrangements.
These two comparisons provide a view of not only the level of the fee compared with funds of similar scale but also the total expense the Fund bears for all the services it receives, in comparison with the investment choices available in the Fund's investment category and distribution channel. The principal figure-of-merit used in these comparisons was the subject Fund's percentile ranking against peers.
DeAM's Fees for Similar Services to Others
DeAM provided management fee schedules for all of its US domiciled fund and non-fund investment management accounts in any of the investment categories where there is a DWS Fund. These similar products included the other DWS Funds, non-fund pooled accounts, institutional accounts and sub-advisory accounts. Using this information, I calculated for each Fund the fee that would be charged to each similar product, at the subject Fund's asset level.
Evaluating information regarding non-fund products is difficult because there are varying levels of services required for different types of accounts, with mutual funds generally requiring considerably more regulatory and administrative types of service as well as having more frequent cash flows than other types of accounts. Also, while mutual fund fees for similar fund products can be expected to be similar, there will be some differences due to different pricing conditions in different distribution channels (e.g. retail funds versus those used in variable insurance products), differences in underlying investment processes and other factors.
Costs and Profit Margins
DeAM provided a detailed profitability analysis for each Fund. After making some adjustments so that the presentation would be more comparable to the available industry figures, I reviewed profit margins from investment management alone, from investment management plus other fund services (excluding distribution) provided to the Funds by DeAM (principally shareholder services), and DeAM profits from all sources, including distribution. A later section comments on overall profitability.
Economies of Scale
Economies of scale — an expected decline in management cost per dollar of fund assets as fund assets grow — are very rarely quantified and documented because of inherent difficulties in collecting and analyzing relevant data. However, in virtually every investment category that I reviewed, larger funds tend to have lower fees and lower total expenses than smaller funds. To see how each DWS Fund compares with this industry observation, I reviewed:
The trend in Fund assets over the last five years and the accompanying trend in total expenses. This shows if the Fund has grown and, if so, whether total expense (management fees as well as other expenses) have declined as a percent of assets.
Whether the Fund has break-points in its management fee schedule, the extent of the fee reduction built into the schedule and the asset levels where the breaks take effect, and in the case of a sub-advised Fund how the Fund's break-points compare with those of the sub-advisory fee schedule.
How the Fund's contractual fee schedule compares with trends in the industry data. To accomplish this, I constructed a chart showing how actual latest-fiscal-year contractual fees of the Fund and of other similar funds relate to average fund assets, with the subject Fund's contractual fee schedule superimposed.
Quality of Service — Performance
The quality-of-service evaluation focused on investment performance, which is the principal result of the investment management service. Each Fund's performance was reviewed over the past 1, 3, 5 and 10 years, as applicable, and compared with that of other funds in the same investment category and with a suitable market index.
In addition, I calculated and reviewed risk-adjusted returns relative to an index of similar mutual funds' returns and a suitable market index. The risk-adjusted returns analysis provides a way of determining the extent to which the Fund's return comparisons are mainly the product of investment value-added (or lack thereof) or alternatively taking considerably more or less risk than is typical in its investment category.
I also received and considered the history of portfolio manager changes for each Fund, as this provided an important context for evaluating the performance results.
Complex-Level Considerations
While this evaluation was conducted mainly at the individual fund level, there are some issues relating to the reasonableness of fees that can alternatively be considered across the whole fund complex:
I reviewed DeAM's profitability analysis for all DWS Funds, with a view toward determining if the allocation procedures used were reasonable and how profit levels compared with public data for other investment managers.
I considered whether DeAM and affiliates receive any significant ancillary or "fallout" benefits that should be considered in interpreting the direct profitability results. These would be situations where serving as the investment manager of the Funds is beneficial to another part of the Deutsche Bank organization.
I considered how aggregated DWS Fund expenses had varied over the years, by asset class and in the context of trends in asset levels.
I considered how aggregated DWS Fund performance measures relative to appropriate peers had varied by asset class and over time.
I reviewed the structure of the DeAM organization, trends in staffing levels, and information on compensation of investment management and other professionals compared with industry data.
Findings
Based on the process and analysis discussed above, which included reviewing a wide range of information from management and external data sources and considering among other factors the fees DeAM charges other clients, the fees charged by other fund managers, DeAM's costs and profits associated with managing the Funds, economies of scale, possible fall-out benefits, and the nature and quality of services provided, in my opinion the management fees charged the DWS Funds are reasonable.
Thomas H. Mack
President, Thomas H. Mack & Co., Inc.
DWS Investments Distributors, Inc.
222 South Riverside Plaza
Chicago, IL 60606
(800) 621-1148
VS2GIB-3 (R-028382-2 8/13)
JUNE 30, 2013
SEMIANNUAL REPORT
DWS VARIABLE SERIES II
DWS Government & Agency Securities VIP
Contents
9 Statement of Assets and Liabilities 10 Statement of Operations 11 Statement of Changes in Net Assets 15 Notes to Financial Statements 22 Information About Your Fund's Expenses 24 Summary of Management Fee Evaluation by Independent Fee Consultant |
This report must be preceded or accompanied by a prospectus. To obtain an additional prospectus or summary prospectus, if available, call (800) 728-3337 or your financial representative. We advise you to consider the Fund's objectives, risks, charges and expenses carefully before investing. The summary prospectus and prospectus contain this and other important information about the Fund. Please read the prospectus carefully before you invest.
Bond investments are subject to interest-rate and credit risks. When interest rates rise, bond prices generally fall. Credit risk refers to the ability of an issuer to make timely payments of principal and interest. Investing in derivatives entails special risks relating to liquidity, leverage and credit that may reduce returns and/or increase volatility. The Fund may lend securities to approved institutions. The "full faith and credit" guarantee of the U.S. government applies to the timely repayment of interest, and does not eliminate market risk. Because of the rising U.S. government debt burden, it is possible that the U.S. government may not be able to meet its financial obligations or that securities issued by the U.S. government may experience credit downgrades. See the prospectus for details.
DWS Investments is part of the Deutsche Asset & Wealth Management division of Deutsche Bank AG.
NOT FDIC/NCUA INSURED NO BANK GUARANTEE MAY LOSE VALUE NOT A DEPOSIT
NOT INSURED BY ANY FEDERAL GOVERNMENT AGENCY
Performance Summary June 30, 2013 (Unaudited)
Fund performance shown is historical, assumes reinvestment of all dividend and capital gain distributions and does not guarantee future results. Investment return and principal value fluctuate with changing market conditions so that, when redeemed, shares may be worth more or less than their original cost. Current performance may be lower or higher than the performance data quoted. Please contact your participating insurance company for the Fund's most recent month-end performance. Performance doesn't reflect charges and fees ("contract charges") associated with the separate account that invests in the Fund or any variable life insurance policy or variable annuity contract for which the Fund is an investment option. These charges and fees will reduce returns. While all share classes have the same underlying portfolio, their performance will differ.
The gross expense ratios of the Fund, as stated in the fee table of the prospectus dated May 1, 2013 are 0.68% and 1.03% for Class A and Class B shares, respectively, and may differ from the expense ratios disclosed in the Financial Highlights tables in this report.
| Growth of an Assumed $10,000 Investment in DWS Government & Agency Securities VIP |
 | The Barclays GNMA Index is an unmanaged, market-value-weighted measure of all fixed-rate securities backed by mortgage pools of the Government National Mortgage Association. Index returns do not reflect any fees or expenses and it is not possible to invest directly into an index. |
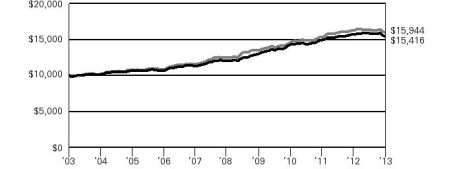 | |
| Yearly periods ended June 30 | |
| Comparative Results | |
| DWS Government & Agency Securities VIP | | 6-Month‡ | | | 1-Year | | | 3-Year | | | 5-Year | | | 10-Year | |
| Class A | Growth of $10,000 | | $ | 9,713 | | | $ | 9,844 | | | $ | 10,759 | | | $ | 12,781 | | | $ | 15,416 | |
| Average annual total return | | | -2.87 | % | | | -1.56 | % | | | 2.47 | % | | | 5.03 | % | | | 4.42 | % |
| Barclays GNMA Index | Growth of $10,000 | | $ | 9,732 | | | $ | 9,808 | | | $ | 10,899 | | | $ | 12,805 | | | $ | 15,944 | |
| Average annual total return | | | -2.68 | % | | | -1.92 | % | | | 2.91 | % | | | 5.07 | % | | | 4.78 | % |
| DWS Government & Agency Securities VIP | | 6-Month‡ | | | 1-Year | | | 3-Year | | | 5-Year | | | 10-Year | |
| Class B | Growth of $10,000 | | $ | 9,709 | | | $ | 9,817 | | | $ | 10,653 | | | $ | 12,574 | | | $ | 14,867 | |
| Average annual total return | | | -2.91 | % | | | -1.83 | % | | | 2.13 | % | | | 4.69 | % | | | 4.05 | % |
| Barclays GNMA Index | Growth of $10,000 | | $ | 9,732 | | | $ | 9,808 | | | $ | 10,899 | | | $ | 12,805 | | | $ | 15,944 | |
| Average annual total return | | | -2.68 | % | | | -1.92 | % | | | 2.91 | % | | | 5.07 | % | | | 4.78 | % |
The growth of $10,000 is cumulative.
‡ Total returns shown for periods less than one year are not annualized.
Portfolio Summary (Unaudited) Asset Allocation (As a % of Investment Portfolio) | 6/30/13 | 12/31/12 |
| | | |
| Mortgage-Backed Securities Pass-Throughs | 79% | 67% |
| Collateralized Mortgage Obligations | 12% | 15% |
| Government & Agency Obligations | 8% | 17% |
| Options Purchased | 1% | 0% |
| Cash Equivalents | 0% | 1% |
| | 100% | 100% |
| Coupons* | 6/30/13 | 12/31/12 |
| | | |
| Less than 4.5% | 50% | 35% |
| 4.5%-5.49% | 27% | 37% |
| 5.5%-6.49% | 20% | 24% |
| 6.5%-7.49% | 3% | 3% |
| 7.5% and Greater | 0% | 1% |
| | 100% | 100% |
| Interest Rate Sensitivity | 6/30/13 | 12/31/12 |
| | | |
| Effective Maturity | 10.0 years | 7.0 years |
| Effective Duration | 6.0 years | 5.5 years |
* Excludes Cash Equivalents, U.S. Treasury Bills and Options Purchased.
Effective maturity is the weighted average of the maturity date of bonds held by the Fund taking into consideration any available maturity shortening features.
Effective duration is an approximate measure of the Fund's sensitivity to interest rate changes taking into consideration any maturity shortening features.
Portfolio holdings and characteristics are subject to change.
For more complete details about the Fund's investment portfolio, see page 5.
Following the Fund's fiscal first and third quarter-end, a complete portfolio holdings listing is filed with the SEC on Form N-Q. The form will be available on the SEC's Web site at www.sec.gov, and it also may be reviewed and copied at the SEC's Public Reference Room in Washington, D.C. Information on the operation of the SEC's Public Reference Room may be obtained by calling (800) SEC-0330. The Fund's portfolio holdings are also posted on www.dws-investments.com from time to time. Please see the Fund's current prospectus for more information.
William Chepolis, CFA
Portfolio Manager
Investment Portfolio June 30, 2013 (Unaudited) | | | Principal Amount ($) | | | Value ($) | |
| | | | |
| Mortgage-Backed Securities Pass-Throughs 94.6% | |
| Federal Home Loan Mortgage Corp.: | |
| 3.0%, 9/1/2042 (a) | | | 5,000,000 | | | | 4,873,440 | |
| 3.5%, 1/1/2042 (a) | | | 11,000,000 | | | | 11,145,234 | |
| Federal National Mortgage Association: | | | | | | | | |
| 3.0%, 10/1/2042 (a) | | | 5,000,000 | | | | 4,889,062 | |
| 3.5%, 1/1/2042 (a) | | | 14,000,000 | | | | 14,218,750 | |
| Government National Mortgage Association: | | | | | | | | |
| 3.0%, 10/1/2042 (a) | | | 1,000,000 | | | | 989,375 | |
| 3.5%, with various maturities from 12/1/2041 until 3/20/2043 (a) | | | 2,622,665 | | | | 2,721,003 | |
| 4.0%, with various maturities from 2/15/2040 until 6/20/2043 (a) | | | 10,580,354 | | | | 11,182,720 | |
| 4.5%, with various maturities from 6/20/2033 until 2/20/2043 (a) | | | 8,235,554 | | | | 8,876,355 | |
| 4.55%, 1/15/2041 | | | 494,500 | | | | 527,187 | |
| 4.625%, 5/15/2041 | | | 197,654 | | | | 213,408 | |
| 5.0%, with various maturities from 11/20/2032 until 4/15/2042 | | | 18,168,209 | | | | 19,710,203 | |
| 5.5%, with various maturities from 10/15/2032 until 7/20/2040 | | | 12,001,010 | | | | 13,202,631 | |
| 6.0%, with various maturities from 7/15/2014 until 5/15/2040 | | | 10,247,463 | | | | 11,352,488 | |
| 6.5%, with various maturities from 4/15/2031 until 2/15/2039 | | | 2,095,001 | | | | 2,356,125 | |
| 7.0%, with various maturities from 2/20/2027 until 11/15/2038 | | | 329,136 | | | | 375,657 | |
| 7.5%, 10/20/2031 | | | 8,019 | | | | 9,440 | |
Total Mortgage-Backed Securities Pass-Throughs (Cost $107,246,189) | | | | 106,643,078 | |
| | |
| Collateralized Mortgage Obligations 14.6% | |
| Federal Home Loan Mortgage Corp.: | |
| "OA", Series 3179, Principal Only, Zero Coupon, 7/15/2036 | | | 340,042 | | | | 305,184 | |
| "KO", Series 4180, Principal Only, Zero Coupon, 1/15/2043 | | | 1,533,311 | | | | 1,008,089 | |
| "KB", Series 4144, 2.5%, 12/15/2042 | | | 214,837 | | | | 173,400 | |
| "YI", Series 3936, Interest Only, 3.0%, 6/15/2025 | | | 136,503 | | | | 7,391 | |
| "AI", Series 4016, Interest Only, 3.0%, 9/15/2025 | | | 1,458,503 | | | | 105,029 | |
| "WI", Series 3939, Interest Only, 3.0%, 10/15/2025 | | | 543,611 | | | | 28,892 | |
| "EI", Series 3953, Interest Only, 3.0%, 11/15/2025 | | | 750,393 | | | | 54,374 | |
| "IO", Series 3974, Interest Only, 3.0%, 12/15/2025 | | | 232,891 | | | | 21,916 | |
| "DI", Series 4010, Interest Only, 3.0%, 2/15/2027 | | | 191,990 | | | | 17,202 | |
| "IP", Series 4046, Interest Only, 3.0%, 5/15/2027 | | | 503,694 | | | | 71,657 | |
| | | Principal Amount ($) | | | Value ($) | |
| | | | | | | | | |
| "IK", Series 4048, Interest Only, 3.0%, 5/15/2027 | | | 1,713,665 | | | | 218,630 | |
| "IA", Series 3800, Interest Only, 3.5%, 12/15/2022 | | | 540,207 | | | | 6,535 | |
| "IK", Series 3754, Interest Only, 3.5%, 6/15/2025 | | | 1,224,152 | | | | 97,051 | |
| "DZ", Series 4199, 3.5%, 5/15/2043 | | | 234,538 | | | | 208,441 | |
| "NI", Series 3657, Interest Only, 4.5%, 8/15/2027 | | | 615,648 | | | | 27,245 | |
| "22", Series 243, Interest Only, 4.741%*, 6/15/2021 | | | 825,348 | | | | 58,419 | |
| "PI", Series 2535, Interest Only, 6.0%, 9/15/2032 | | | 286,521 | | | | 15,864 | |
| "MI", Series 3871, Interest Only, 6.0%, 4/15/2040 | | | 205,555 | | | | 34,107 | |
| "SJ", Series 3501, Interest Only, 6.258%*, 1/15/2039 | | | 2,028,989 | | | | 347,243 | |
| "A", Series 172, Interest Only, 6.5%, 1/1/2024 | | | 26,319 | | | | 3,902 | |
| "DS", Series 3199, Interest Only, 6.958%*, 8/15/2036 | | | 2,442,483 | | | | 425,927 | |
| "S", Series 2416, Interest Only, 7.908%*, 2/15/2032 | | | 345,798 | | | | 72,450 | |
| "ST", Series 2411, Interest Only, 8.558%*, 6/15/2021 | | | 1,125,622 | | | | 129,427 | |
| "KS", Series 2064, Interest Only, 9.9%*, 5/15/2022 | | | 348,903 | | | | 71,199 | |
| Federal National Mortgage Association: | | | | | | | | |
| "DI", Series 2011-136, Interest Only, 3.0%, 1/25/2026 | | | 223,498 | | | | 20,208 | |
| "LZ", Series 2013-45, 3.0%, 5/25/2043 | | | 1,005,006 | | | | 811,958 | |
| "HI", Series 2010-123, Interest Only, 3.5%, 3/25/2024 | | | 457,114 | | | | 32,569 | |
| "KI", Series 2011-72, Interest Only, 3.5%, 3/25/2025 | | | 1,419,144 | | | | 73,467 | |
| ''IO", Series 2012-146, Interest Only, 3.5%, 1/25/2043 | | | 2,207,108 | | | | 528,664 | |
| "KZ", Series 2013-66, 3.5%, 7/25/2043 | | | 908,534 | | | | 859,700 | |
| "25", Series 351, Interest Only, 4.5%, 5/1/2019 | | | 215,330 | | | | 18,639 | |
| "HI", Series 2009-77, Interest Only, 4.5%, 9/25/2027 | | | 263,097 | | | | 7,059 | |
| "IN", Series 2003-49, Interest Only, 4.75%, 3/25/2018 | | | 1,401,231 | | | | 72,057 | |
| "21", Series 334, Interest Only, 5.0%, 3/1/2018 | | | 100,703 | | | | 7,512 | |
| "20", Series 334, Interest Only, 5.0%, 3/1/2018 | | | 148,214 | | | | 11,061 | |
| ''23", Series 339, Interest Only, 5.0%, 7/1/2018 | | | 219,880 | | | | 15,115 | |
| "26", Series 381, Interest Only, 5.0%, 12/25/2020 | | | 69,690 | | | | 5,563 | |
| "ZA", Series 2008-24, 5.0%, 4/25/2038 | | | 682,227 | | | | 747,445 | |
| "30", Series 381, Interest Only, 5.5%, 11/25/2019 | | | 381,093 | | | | 35,941 | |
| "PI", Series 2009-14, Interest Only, 5.5%, 3/25/2024 | | | 660,391 | | | | 87,972 | |
| "PJ", Series 2004-46, Interest Only, 5.807%*, 3/25/2034 | | | 453,805 | | | | 58,996 | |
| "WI", Series 2011-59, Interest Only, 6.0%, 5/25/2040 | | | 460,860 | | | | 52,168 | |
| | | Principal Amount ($) | | | Value ($) | |
| | | | | | | | | |
| "PI", Series 2007-75, Interest Only, 6.347%*, 8/25/2037 | | | 1,438,973 | | | | 283,983 | |
| "101", Series 383, Interest Only, 6.5%, 9/1/2022 | | | 1,296,744 | | | | 190,978 | |
| "SJ", Series 2007-36, Interest Only, 6.577%*, 4/25/2037 | | | 281,582 | | | | 37,164 | |
| "SA", Series 2005-42, Interest Only, 6.607%*, 5/25/2035 | | | 493,658 | | | | 61,106 | |
| "KI", Series 2005-65, Interest Only, 6.807%*, 8/25/2035 | | | 121,156 | | | | 22,462 | |
| "ES", Series 2003-17, Interest Only, 6.857%*, 9/25/2022 | | | 974,389 | | | | 26,281 | |
| "SA", Series G92-57, IOette, 82.85%*, 10/25/2022 | | | 41,972 | | | | 76,657 | |
| Government National Mortgage Association: | | | | | | | | |
| "IE", Series 2011-128, Interest Only, 3.5%, 9/20/2026 | | | 1,102,919 | | | | 115,243 | |
| "JY", Series 2010-20, 4.0%, 12/20/2033 | | | 1,974,028 | | | | 2,077,098 | |
| "LI", Series 2009-104, Interest Only, 4.5%, 12/16/2018 | | | 274,397 | | | | 18,675 | |
| "NI", Series 2010-44, Interest Only, 4.5%, 10/20/2037 | | | 683,685 | | | | 74,480 | |
| "CI", Series 2010-87, Interest Only, 4.5%, 11/20/2038 | | | 1,251,588 | | | | 479,433 | |
| "MI", Series 2010-169, Interest Only, 4.5%, 8/20/2040 | | | 891,712 | | | | 167,668 | |
| "AI", Series 2012-15, Interest Only, 4.5%, 9/20/2040 | | | 664,667 | | | | 174,493 | |
| "VB", Series 2010-26, 5.0%, 1/20/2024 | | | 600,000 | | | | 676,208 | |
| "GZ", Series 2005-24, 5.0%, 3/20/2035 | | | 505,614 | | | | 564,973 | |
| "MI", Series 2009-76, Interest Only, 5.0%, 3/20/2035 | | | 696,943 | | | | 24,263 | |
| "ZA", Series 2005-75, 5.0%, 10/16/2035 | | | 568,808 | | | | 637,979 | |
| "MZ", Series 2009-98, 5.0%, 10/16/2039 | | | 1,020,644 | | | | 1,180,091 | |
| "Z", Series 2009-112, 5.0%, 11/20/2039 | | | 1,195,775 | | | | 1,327,063 | |
| "AI", Series 2008-51, Interest Only, 5.5%, 5/16/2023 | | | 551,349 | | | | 48,934 | |
| "AI", Series 2008-46, Interest Only, 5.5%, 5/16/2023 | | | 285,245 | | | | 26,923 | |
| "GI", Series 2003-19, Interest Only, 5.5%, 3/16/2033 | | | 960,597 | | | | 178,117 | |
| "IB", Series 2010-130, Interest Only, 5.5%, 2/20/2038 | | | 309,091 | | | | 52,549 | |
| "BS", Series 2011-93, Interest Only, 5.908%*, 7/16/2041 | | | 1,436,576 | | | | 228,231 | |
| "DI", Series 2009-10, Interest Only, 6.0%, 4/16/2038 | | | 381,255 | | | | 70,273 | |
| "SA", Series 2012-84, Interest Only, 6.108%*, 12/20/2038 | | | 1,590,504 | | | | 276,949 | |
| "QA", Series 2007-57, Interest Only, 6.308%*, 10/20/2037 | | | 403,976 | | | | 53,145 | |
| "IP", Series 2009-118, Interest Only, 6.5%, 12/16/2039 | | | 123,334 | | | | 24,867 | |
| "SA", Series 2006-69, Interest Only, 6.608%*, 12/20/2036 | | | 774,088 | | | | 127,227 | |
| "IC", Series 1997-4, Interest Only, 7.5%, 3/16/2027 | | | 649,269 | | | | 160,216 | |
| "SK", Series 2003-11, Interest Only, 7.508%*, 2/16/2033 | | | 567,941 | | | | 117,459 | |
Total Collateralized Mortgage Obligations (Cost $15,511,042) | | | | 16,536,856 | |
| | |
| | | Principal Amount ($) | | | Value ($) | |
| | | | | | | | | |
| Government & Agency Obligations 9.5% | |
| U.S. Treasury Obligations | |
| U.S. Treasury Bill, 0.1%**, 9/5/2013 (b) | | | 1,045,000 | | | | 1,044,961 | |
| U.S. Treasury Bond, 2.875%, 5/15/2043 | | | 4,500,000 | | | | 3,982,500 | |
| U.S. Treasury Notes: | |
| 0.75%, 6/15/2014 (c) | | | 1,000,000 | | | | 1,005,273 | |
| 1.75%, 5/15/2023 | | | 5,000,000 | | | | 4,682,810 | |
Total Government & Agency Obligations (Cost $10,643,238) | | | | 10,715,544 | |
| | | Contracts | | | Value ($) | |
| | | | |
| Call Options Purchased 0.7% | |
| Options on Exchange-Traded Futures Contracts 0.0% | |
| 10 Year U.S. Treasury Note Future, Expiration Date 8/23/2013, Strike Price $132.5 | | | 126 | | | | 5,906 | |
| | | Contract Amount | | | Value ($) | |
| | | | |
| Options on Interest Rate Swap Contracts 0.7% | |
Pay Fixed Rate — 3.583% - Receive Floating — LIBOR, Swap Expiration Date 5/11/2026, Option Expiration Date 5/9/20161 | | | 2,700,000 | | | | 170,776 | |
Pay Fixed Rate — 3.635% - Receive Floating — LIBOR, Swap Expiration Date 4/27/2026, Option Expiration Date 4/25/20162 | | | 2,600,000 | | | | 157,126 | |
Pay Fixed Rate — 3.72% - Receive Floating — LIBOR, Swap Expiration Date 4/22/2026, Option Expiration Date 4/20/20163 | | | 2,600,000 | | | | 147,568 | |
Pay Fixed Rate — 4.32% - Receive Floating — LIBOR, Swap Expiration Date 2/3/2027, Option Expiration Date 2/1/20174 | | | 6,000,000 | | | | 286,825 | |
| | | | | | | | 762,295 | |
Total Call Options Purchased (Cost $699,978) | | | | 768,201 | |
| | |
| Put Options Purchased 0.1% | |
| Options on Interest Rate Swap Contracts | |
Receive Fixed Rate — 2.32% - Pay Floating — LIBOR, Swap Expiration Date 2/3/2027, Option Expiration Date 2/1/20174 (Cost $203,883) | | | 6,000,000 | | | | 73,596 | |
| | | Shares | | | Value ($) | |
| | | | |
| Cash Equivalents 0.2% | |
| Central Cash Management Fund, 0.07% (d) (Cost $248,923) | | | 248,923 | | | | 248,923 | |
| | | % of Net Assets | | | Value ($) | |
| | | | |
Total Investment Portfolio (Cost $134,553,253)† | | | 119.7 | | | | 134,986,198 | |
| Other Assets and Liabilities, Net | | | (19.7 | ) | | | (22,250,746 | ) |
| Net Assets | | | 100.0 | | | | 112,735,452 | |
* These securities are shown at their current rate as of June 30, 2013.
** Annualized yield at time of purchase; not a coupon rate.
† The cost for federal income tax purposes was $134,553,275. At June 30, 2013, net unrealized appreciation for all securities based on tax cost was $432,923. This consisted of aggregate gross unrealized appreciation for all securities in which there was an excess of value over tax cost of $4,345,125 and aggregate gross unrealized depreciation for all securities in which there was an excess of tax cost over value of $3,912,202.
(a) When-issued or delayed delivery securities included.
(b) At June 30, 2013, this security has been pledged, in whole or in part, to cover initial margin requirements for open futures contracts.
(c) At June 30, 2013, this security has been pledged, in whole or in part, as collateral for open swap contracts.
(d) Affiliated fund managed by Deutsche Investment Management Americas Inc. The rate shown is the annualized seven-day yield at period end.
Interest Only: Interest Only (IO) bonds represent the "interest only" portion of payments on a pool of underlying mortgages or mortgage-backed securities. IO securities are subject to prepayment risk of the pool of underlying mortgages.
IOettes: These securities represent the right to receive interest payments on an underlying pool of mortgages with similar features as those associated with IO securities. Unlike IO's, a nominal amount of principal is assigned to an IOette which is small in relation to the interest flow that constitutes almost all of the IOette cash flow. The effective yield of this security is lower than the stated interest rate.
Principal Only: Principal Only (PO) bonds represent the "principal only" portion of payments on a pool of underlying mortgages or mortgage-backed securities.
Included in the portfolio are investments in mortgage- or asset-backed securities which are interests in separate pools of mortgages or assets. Effective maturities of these investments may be shorter than stated maturities due to prepayments. Some separate investments in the Government National Mortgage Association issues which have similar coupon rates have been aggregated for presentation purposes in this investment portfolio.
At June 30, 2013, open futures contracts bought were as follows:
| Futures | Currency | Expiration Date | | Contracts | | | Notional Value ($) | | | Unrealized Depreciation ($) | |
| Ultra Long U.S. Treasury Bond | USD | 9/19/2013 | | | 18 | | | | 2,651,625 | | | | (159,173 | ) |
At June 30, 2013, open futures contracts sold were as follows:
| Futures | Currency | Expiration Date | | Contracts | | | Notional Value ($) | | | Unrealized Appreciation ($) | |
| 10 Year U.S. Treasury Note | USD | 9/19/2013 | | | 110 | | | | 13,921,875 | | | | 189,212 | |
| Currency Abbreviation |
| USD United States Dollar |
At June 30, 2013, open written options contracts were as follows:
| Options on Exchange-Traded Futures Contracts | | Contracts | | Expiration Date | | Strike Price ($) | | | Premiums Received ($) | | | Value ($) (e) | |
Put Options 10 Year U.S. Treasury Note Future | | | 101 | | 8/23/2013 | | | 130.0 | | | | 86,502 | | | | (366,125 | ) |
(e) Unrealized depreciation on written options on exchange-traded futures contracts at June 30, 2013 was $279,623.
| Options on Interest Rate Swap Contracts | Swap Effective/ Expiration Date | | Contract Amount | | Option Expiration Date | | Premiums Received ($) | | | Value ($) (f) | |
Call Options Receive Fixed — 3.32% - Pay Floating — LIBOR | 2/3/2017 2/3/2027 | | | 3,000,000 | 4 | 2/1/2017 | | | 216,990 | | | | (262,048 | ) |
| Receive Fixed — 4.083% - Pay Floating — LIBOR | 5/11/2016 5/11/2026 | | | 2,700,000 | 1 | 5/9/2016 | | | 91,800 | | | | (121,222 | ) |
| Receive Fixed — 4.135% - Pay Floating — LIBOR | 4/27/2016 4/27/2026 | | | 2,600,000 | 2 | 4/25/2016 | | | 96,200 | | | | (110,846 | ) |
| Receive Fixed — 4.22% - Pay Floating — LIBOR | 4/22/2016 4/22/2026 | | | 2,600,000 | 3 | 4/20/2016 | | | 92,690 | | | | (103,777 | ) |
| Receive Fixed — 5.132% - Pay Floating — LIBOR | 3/17/2016 3/17/2026 | | | 2,400,000 | 3 | 3/15/2016 | | | 17,340 | | | | (44,927 | ) |
| Receive Fixed — 4.064% - Pay Floating — LIBOR | 5/13/2014 5/13/2044 | | | 2,400,000 | 3 | 5/19/2014 | | | 17,700 | | | | (66,434 | ) |
| Receive Fixed — 5.132% - Pay Floating — LIBOR | 3/17/2016 3/17/2026 | | | 2,400,000 | 4 | 3/15/2016 | | | 28,321 | | | | (44,927 | ) |
| Total Call Options | | | 561,041 | | | | (754,181 | ) |
Put Options Pay Fixed — 1.132% - Receive Floating — LIBOR | 3/17/2016 3/17/2026 | | | 2,400,000 | 3 | 3/15/2016 | | | 17,340 | | | | (2,127 | ) |
| Pay Fixed — 2.385% - Receive Floating — LIBOR | 3/31/2014 3/31/2044 | | | 2,400,000 | 5 | 3/27/2014 | | | 32,760 | | | | (7,658 | ) |
| Pay Fixed — 2.423% - Receive Floating — LIBOR | 3/20/2014 3/20/2044 | | | 2,400,000 | 6 | 3/18/2014 | | | 34,560 | | | | (8,700 | ) |
| Pay Fixed — 3.32% - Receive Floating — LIBOR | 2/3/2017 2/3/2027 | | | 3,000,000 | 4 | 2/1/2017 | | | 216,990 | | | | (104,378 | ) |
| Pay Fixed — 1.132% Receive Floating -- LIBOR | 3/17/2016 3/17/2026 | | | 2,400,000 | 4 | 3/15/2016 | | | 6,120 | | | | (2,127 | ) |
| Pay Fixed — 2.064% Receive Floating -- LIBOR | 5/13/2014 5/13/2044 | | | 2,400,000 | 3 | 5/9/2014 | | | 17,700 | | | | (2,663 | ) |
| Total Put Options | | | 325,470 | | | | (127,653 | ) |
| Total | | | 886,511 | | | | (881,834 | ) |
(f) Unrealized appreciation on written options on interest rate swap contracts at June 30, 2013 was $4,677.
At June 30, 2013, open interest rate swap contracts were as follows:
| Effective/ Expiration Date | | Notional Amount ($) | | Cash Flows Paid by the Fund | Cash Flows Received by the Fund | | Value ($) | | | Upfront Payments Paid/ (Received) ($) | | | Unrealized Appreciation ($) | |
4/23/2014 4/23/2016 | | | 20,000,000 | 3 | Fixed — 0.921% | Floating — LIBOR | | | 10,416 | | | | 10,416 | | | | — | |
4/23/2014 4/23/2019 | | | 5,000,000 | 3 | Fixed — 2.077% | Floating — LIBOR | | | 4,286 | | | | 4,286 | | | | — | |
4/23/2014 4/23/2024 | | | 2,000,000 | 2 | Fixed — 3.024% | Floating — LIBOR | | | (877 | ) | | | (877 | ) | | | — | |
6/3/2013 6/3/2025 | | | 2,300,000 | 3 | Floating — LIBOR | Fixed — 3.0% | | | 21,864 | | | | — | | | | 21,864 | |
4/23/2014 4/23/2034 | | | 3,000,000 | 2 | Fixed — 3.532% | Floating — LIBOR | | | (2,267 | ) | | | (2,267 | ) | | | — | |
| Total unrealized appreciation | | | | 21,864 | |
Counterparty:
1 Bank of America
2 Citigroup, Inc.
3 Nomura International PLC
4 BNP Paribas
5 Barclays Bank PLC
6 JPMorgan Chase Securities, Inc.
LIBOR: London Interbank Offered Rate
For information on the Fund's policy and additional disclosures regarding futures contracts, purchased and written options contracts, interest rate swap contracts, please refer to the Derivatives section of Note B in the accompanying Notes to Financial Statements.
Fair Value Measurements
Various inputs are used in determining the value of the Fund's investments. These inputs are summarized in three broad levels. Level 1 includes quoted prices in active markets for identical securities. Level 2 includes other significant observable inputs (including quoted prices for similar securities, interest rates, prepayment speeds, and credit risk). Level 3 includes significant unobservable inputs (including the Fund's own assumptions in determining the fair value of investments). The inputs or methodology used for valuing securities are not necessarily an indication of the risk associated with investing in those securities.
The following is a summary of the inputs used as of June 30, 2013 in valuing the Fund's investments. For information on the Fund's policy regarding the valuation of investments, please refer to the Security Valuation section of Note A in the accompanying Notes to Financial Statements.
| Assets | | Level 1 | | | Level 2 | | | Level 3 | | | Total | |
| | |
| Fixed-Income Investments (g) | |
| Mortgage-Backed Securities Pass-Throughs | | $ | — | | | $ | 106,643,078 | | | $ | — | | | $ | 106,643,078 | |
| Collateralized Mortgage Obligations | | | — | | | | 16,536,856 | | | | — | | | | 16,536,856 | |
| Government & Agency Obligations | | | — | | | | 10,715,544 | | | | — | | | | 10,715,544 | |
| Short-Term Investments | | | 248,923 | | | | — | | | | — | | | | 248,923 | |
| Derivatives (h) | |
| Purchased Options | | | 5,906 | | | | 835,891 | | | | — | | | | 841,797 | |
| Futures Contracts | | | 189,212 | | | | — | | | | — | | | | 189,212 | |
| Interest Rate Swap Contracts | | | — | | | | 21,864 | | | | — | | | | 21,864 | |
| Total | | $ | 444,041 | | | $ | 134,753,233 | | | $ | — | | | $ | 135,197,274 | |
| Liabilities | |
Derivatives (h) | |
| Written Options | | $ | (366,125 | ) | | $ | (881,834 | ) | | $ | — | | | $ | (1,247,959 | ) |
| Futures Contracts | | | (159,173 | ) | | | — | | | | — | | | | (159,173 | ) |
| Total | | $ | (525,298 | ) | | $ | (881,834 | ) | | $ | — | | | $ | (1,407,132 | ) |
There have been no transfers between fair value measurement levels during the period ended June 30, 2013.
(g) See Investment Portfolio for additional detailed categorizations.
(h) Derivatives include value of purchased options, unrealized appreciation (depreciation) on open futures contracts, and interest rate swap contracts and written options, at value.
The accompanying notes are an integral part of the financial statements.
Statement of Assets and Liabilities | as of June 30, 2013 (Unaudited) | |
| Assets | |
Investments Investments in non-affiliated securities, at value (cost $134,304,330) | | $ | 134,737,275 | |
| Investment in Central Cash Management Fund (cost $248,923) | | | 248,923 | |
| Total investments in securities, at value (cost $134,553,253) | | | 134,986,198 | |
| Receivable for investments sold | | | 6,522,176 | |
| Receivable for investments sold — when-issued/delayed delivery securities | | | 56,608,951 | |
| Receivable for Fund shares sold | | | 824 | |
| Interest receivable | | | 548,834 | |
| Receivable for variation margin on futures contracts | | | 12,251 | |
| Net receivable for pending swap contracts | | | 832,944 | |
| Unrealized appreciation on swap contracts | | | 21,864 | |
| Upfront payments paid on swap contracts | | | 14,702 | |
| Other assets | | | 1,502 | |
| Total assets | | | 199,550,246 | |
| Liabilities | |
| Cash overdraft | | | 7,265 | |
| Payable for investments purchased | | | 11,192,029 | |
| Payable for investments purchased — when-issued/delayed delivery securities | | | 74,186,990 | |
| Payable for Fund shares redeemed | | | 65,953 | |
| Options written, at value (premium received $973,013) | | | 1,247,959 | |
| Upfront payments received on swap contracts | | | 3,144 | |
| Accrued management fee | | | 37,503 | |
| Accrued Trustees' fees | | | 1,068 | |
| Other accrued expenses and payables | | | 72,883 | |
| Total liabilities | | | 86,814,794 | |
| Net assets, at value | | $ | 112,735,452 | |
| Net Assets Consist of | |
| Undistributed net investment income | | | 1,032,660 | |
| Investments | | | 432,945 | |
| Swap contracts | | | 21,864 | |
| Futures | | | 30,039 | |
| Written options | | | (274,946 | ) |
| Accumulated net realized gain (loss) | | | 1,373,172 | |
| Paid-in capital | | | 110,119,718 | |
| Net assets, at value | | $ | 112,735,452 | |
Class A Net Asset Value, offering and redemption price per share ($108,262,913 ÷ 9,426,458 outstanding shares of beneficial interest, no par value, unlimited number of shares authorized) | | $ | 11.49 | |
Class B Net Asset Value, offering and redemption price per share ($4,472,539 ÷ 389,307 outstanding shares of beneficial interest, no par value, unlimited number of shares authorized) | | $ | 11.49 | |
The accompanying notes are an integral part of the financial statements.
Statement of Operations
| for the six months ended June 30, 2013 (Unaudited) | |
| Investment Income | |
Income: Interest | | $ | 1,455,176 | |
| Income distributions — Central Cash Management Fund | | | 2,652 | |
| Total income | | | 1,457,828 | |
Expenses: Management fee | | | 267,190 | |
| Administration fee | | | 59,376 | |
| Services to shareholders | | | 805 | |
| Distribution service fees (Class B) | | | 6,064 | |
| Record keeping fees (Class B) | | | 2,401 | |
| Custodian fee | | | 19,585 | |
| Audit and tax fees | | | 32,037 | |
| Legal fees | | | 4,373 | |
| Reports to shareholders | | | 16,199 | |
| Trustees' fees and expenses | | | 3,169 | |
| Other | | | 10,356 | |
| Total expenses before expense reductions | | | 421,555 | |
| Expense reductions | | | (18,657 | ) |
| Total expenses after expense reductions | | | 402,898 | |
| Net investment income | | | 1,054,930 | |
| Realized and Unrealized Gain (Loss) | |
Net realized gain (loss) from: Investments | | | 920,427 | |
| Swap contracts | | | 388,507 | |
| Futures | | | (44,434 | ) |
| Written options | | | 177,921 | |
| | | | 1,442,421 | |
Change in net unrealized appreciation (depreciation) on: Investments | | | (5,507,996 | ) |
| Swap contracts | | | 364,779 | |
| Securities sold short | | | (129,707 | ) |
| Futures | | | 51,877 | |
| Written options | | | (601,208 | ) |
| | | | (5,822,255 | ) |
| Net gain (loss) | | | (4,379,834 | ) |
| Net increase (decrease) in net assets resulting from operations | | $ | (3,324,904 | ) |
The accompanying notes are an integral part of the financial statements.
Statement of Changes in Net Assets | Increase (Decrease) in Net Assets | | Six Months Ended June 30, 2013 (Unaudited) | | | Year Ended December 31, 2012 | |
Operations: Net investment income | | $ | 1,054,930 | | | $ | 3,586,409 | |
| Net realized gain (loss) | | | 1,442,421 | | | | 4,527,418 | |
| Change in net unrealized appreciation (depreciation) | | | (5,822,255 | ) | | | (4,180,279 | ) |
| Net increase (decrease) in net assets resulting from operations | | | (3,324,904 | ) | | | 3,933,548 | |
Distributions to shareholders from: Net investment income: Class A | | | (3,325,537 | ) | | | (5,435,920 | ) |
| Class B | | | (119,146 | ) | | | (209,154 | ) |
Net realized gain: Class A | | | (4,523,083 | ) | | | (2,952,755 | ) |
| Class B | | | (185,024 | ) | | | (124,749 | ) |
| Total distributions | | | (8,152,790 | ) | | | (8,722,578 | ) |
Fund share transactions: Class A Proceeds from shares sold | | | 6,248,690 | | | | 18,065,811 | |
| Reinvestment of distributions | | | 7,848,620 | | | | 8,388,675 | |
| Payments for shares redeemed | | | (15,460,992 | ) | | | (47,401,824 | ) |
| Net increase (decrease) in net assets from Class A share transactions | | | (1,363,682 | ) | | | (20,947,338 | ) |
Class B Proceeds from shares sold | | | 270,866 | | | | 919,743 | |
| Reinvestment of distributions | | | 304,170 | | | | 333,903 | |
| Payments for shares redeemed | | | (1,093,925 | ) | | | (2,329,903 | ) |
| Net increase (decrease) in net assets from Class B share transactions | | | (518,889 | ) | | | (1,076,257 | ) |
| Increase (decrease) in net assets | | | (13,360,265 | ) | | | (26,812,625 | ) |
| Net assets at beginning of period | | | 126,095,717 | | | | 152,908,342 | |
| Net assets at end of period (including undistributed net investment income of $1,032,660 and $3,422,413, respectively) | | $ | 112,735,452 | | | $ | 126,095,717 | |
| Other Information | |
Class A Shares outstanding at beginning of period | | | 9,511,241 | | | | 11,145,622 | |
| Shares sold | | | 514,981 | | | | 1,389,466 | |
| Shares issued to shareholders in reinvestment of distributions | | | 660,658 | | | | 672,169 | |
| Shares redeemed | | | (1,260,422 | ) | | | (3,696,016 | ) |
| Net increase (decrease) in Class A shares | | | (84,783 | ) | | | (1,634,381 | ) |
| Shares outstanding at end of period | | | 9,426,458 | | | | 9,511,241 | |
Class B Shares outstanding at beginning of period | | | 428,962 | | | | 511,071 | |
| Shares sold | | | 22,785 | | | | 72,277 | |
| Shares issued to shareholders in reinvestment of distributions | | | 25,582 | | | | 26,755 | |
| Shares redeemed | | | (88,022 | ) | | | (181,141 | ) |
| Net increase (decrease) in Class B shares | | | (39,655 | ) | | | (82,109 | ) |
| Shares outstanding at end of period | | | 389,307 | | | | 428,962 | |
The accompanying notes are an integral part of the financial statements.
| | | | | | Years Ended December 31, | |
| Class A | | Six Months Ended 6/30/13 (Unaudited) | | | 2012 | | | 2011 | | | 2010 | | | 2009 | | | 2008 | |
| Selected Per Share Data | |
| Net asset value, beginning of period | | $ | 12.69 | | | $ | 13.12 | | | $ | 12.98 | | | $ | 12.78 | | | $ | 12.40 | | | $ | 12.38 | |
Income (loss) from investment operations: Net investment incomea | | | .11 | | | | .34 | | | | .48 | | | | .50 | | | | .52 | | | | .56 | |
| Net realized and unrealized gain (loss) | | | (.44 | ) | | | .03 | | | | .45 | | | | .32 | | | | .45 | | | | .04 | |
| Total from investment operations | | | (.33 | ) | | | .37 | | | | .93 | | | | .82 | | | | .97 | | | | .60 | |
Less distributions from: Net investment income | | | (.37 | ) | | | (.52 | ) | | | (.57 | ) | | | (.62 | ) | | | (.59 | ) | | | (.58 | ) |
| Net realized gains | | | (.50 | ) | | | (.28 | ) | | | (.22 | ) | | | — | | | | — | | | | — | |
| Total distributions | | | (.87 | ) | | | (.80 | ) | | | (.79 | ) | | | (.62 | ) | | | (.59 | ) | | | (.58 | ) |
| Net asset value, end of period | | $ | 11.49 | | | $ | 12.69 | | | $ | 13.12 | | | $ | 12.98 | | | $ | 12.78 | | | $ | 12.40 | |
| Total Return (%) | | | (2.87 | )b** | | | 2.93 | b | | | 7.46 | | | | 6.61 | | | | 8.08 | | | | 4.93 | b |
| Ratios to Average Net Assets and Supplemental Data | |
| Net assets, end of period ($ millions) | | | 108 | | | | 121 | | | | 146 | | | | 157 | | | | 169 | | | | 211 | |
| Ratio of expenses before expense reductions (%) | | | .70 | * | | | .68 | | | | .67 | | | | .64 | | | | .58 | | | | .66 | |
| Ratio of expenses after expense reductions (%) | | | .67 | * | | | .66 | | | | .67 | | | | .64 | | | | .58 | | | | .65 | |
| Ratio of net investment income (%) | | | 1.79 | * | | | 2.65 | | | | 3.68 | | | | 3.86 | | | | 4.16 | | | | 4.58 | |
| Portfolio turnover rate (%) | | | 315 | ** | | | 796 | | | | 673 | | | | 423 | | | | 390 | | | | 543 | |
a Based on average shares outstanding during the period. b Total return would have been lower had certain expenses not been reduced. * Annualized ** Not annualized | |
| | | | | | Years Ended December 31, | |
| Class B | | Six Months Ended 6/30/13 (Unaudited) | | | 2012 | | | 2011 | | | 2010 | | | 2009 | | | 2008 | |
| Selected Per Share Data | |
| Net asset value, beginning of period | | $ | 12.67 | | | $ | 13.10 | | | $ | 12.95 | | | $ | 12.75 | | | $ | 12.37 | | | $ | 12.35 | |
Income (loss) from investment operations: Net investment incomea | | | .09 | | | | .29 | | | | .43 | | | | .46 | | | | .48 | | | | .52 | |
| Net realized and unrealized gain (loss) | | | (.45 | ) | | | .03 | | | | .46 | | | | .31 | | | | .45 | | | | .03 | |
| Total from investment operations | | | (.36 | ) | | | .32 | | | | .89 | | | | .77 | | | | .93 | | | | .55 | |
Less distributions from: Net investment income | | | (.32 | ) | | | (.47 | ) | | | (.52 | ) | | | (.57 | ) | | | (.55 | ) | | | (.53 | ) |
| Net realized gains | | | (.50 | ) | | | (.28 | ) | | | (.22 | ) | | | — | | | | — | | | | — | |
| Total distributions | | | (.82 | ) | | | (.75 | ) | | | (.74 | ) | | | (.57 | ) | | | (.55 | ) | | | (.53 | ) |
| Net asset value, end of period | | $ | 11.49 | | | $ | 12.67 | | | $ | 13.10 | | | $ | 12.95 | | | $ | 12.75 | | | $ | 12.37 | |
| Total Return (%) | | | (2.91 | )b** | | | 2.48 | b | | | 7.15 | | | | 6.24 | | | | 7.70 | | | | 4.60 | b |
| Ratios to Average Net Assets and Supplemental Data | |
| Net assets, end of period ($ millions) | | | 4 | | | | 5 | | | | 7 | | | | 6 | | | | 7 | | | | 8 | |
| Ratio of expenses before expense reductions (%) | | | 1.05 | * | | | 1.03 | | | | 1.01 | | | | .99 | | | | .92 | | | | 1.00 | |
| Ratio of expenses after expense reductions (%) | | | .99 | * | | | 1.01 | | | | 1.01 | | | | .99 | | | | .92 | | | | 1.00 | |
| Ratio of net investment income (%) | | | 1.45 | * | | | 2.29 | | | | 3.34 | | | | 3.51 | | | | 3.81 | | | | 4.24 | |
| Portfolio turnover rate (%) | | | 315 | ** | | | 796 | | | | 673 | | | | 423 | | | | 390 | | | | 543 | |
a Based on average shares outstanding during the period. b Total return would have been lower had certain expenses not been reduced. * Annualized ** Not annualized | |
Notes to Financial Statements (Unaudited)
A. Organization and Significant Accounting Policies
DWS Government & Agency Securities VIP (the "Fund") is a diversified series of DWS Variable Series II (the "Trust"), which is registered under the Investment Company Act of 1940, as amended (the "1940 Act"), as an open-end management investment company organized as a Massachusetts business trust.
Multiple Classes of Shares of Beneficial Interest. The Fund offers two classes of shares (Class A shares and Class B shares). Sales of Class B shares are subject to recordkeeping fees up to 0.15% and Rule 12b-1 fees under the 1940 Act equal to an annual rate of 0.25% of the average daily net assets of the Class B shares of the Fund. Class A shares are not subject to such fees.
Investment income, realized and unrealized gains and losses, and certain fund-level expenses and expense reductions, if any, are borne pro rata on the basis of relative net assets by the holders of all classes of shares except that each class bears certain expenses unique to that class (including the applicable Rule 12b-1 fee and recordkeeping fees). Differences in class-level expenses may result in payment of different per share dividends by class. All shares have equal rights with respect to voting subject to class-specific arrangements.
The Fund's financial statements are prepared in accordance with accounting principles generally accepted in the United States of America which require the use of management estimates. Actual results could differ from those estimates. The policies described below are followed consistently by the Fund in the preparation of its financial statements.
Security Valuation. Investments are stated at value determined as of the close of regular trading on the New York Stock Exchange on each day the exchange is open for trading.
Various inputs are used in determining the value of the Fund's investments. These inputs are summarized in three broad levels. Level 1 includes quoted prices in active markets for identical securities. Level 2 includes other significant observable inputs (including quoted prices for similar securities, interest rates, prepayment speeds, and credit risk). Level 3 includes significant unobservable inputs (including the Fund's own assumptions in determining the fair value of investments). The inputs or methodology used for valuing securities are not necessarily an indication of the risk associated with investing in those securities.
Debt securities are valued at prices supplied by independent pricing services approved by the Fund's Board. If the pricing services are unable to provide valuations, securities are valued at the most recent bid quotation or evaluated price, as applicable, obtained from one or more broker-dealers. Such services may use various pricing techniques which take into account appropriate factors such as yield, quality, coupon rate, maturity, type of issue, trading characteristics and other data, as well as broker quotes. These securities are generally categorized as Level 2.
Money market instruments purchased with an original or remaining maturity of sixty days or less, maturing at par, are valued at amortized cost, which approximates value, and are categorized as Level 2. Investments in open-end investment companies are valued at their net asset value each business day and are categorized as Level 1.
Futures contracts are generally valued at the settlement prices established each day on the exchange on which they are traded and are categorized as Level 1.
Swap contracts are valued daily based upon prices supplied by a Board approved pricing vendor, if available, and otherwise are valued at the price provided by the broker-dealer. Swap contracts are generally categorized as Level 2.
Exchange-traded options are valued at the last sale price or, in the absence of a sale, the mean between the closing bid and asked prices or at the most recent asked price (bid for purchased options) if no bid or asked price are available. Exchange-traded options are categorized as Level 1. Over-the-counter written or purchased options are valued at prices supplied by a Board approved pricing vendor, if available, and otherwise are valued at the price provided by the broker-dealer with which the option was traded. Over-the-counter written or purchased options are generally categorized as Level 2.
Securities and other assets for which market quotations are not readily available or for which the above valuation procedures are deemed not to reflect fair value are valued in a manner that is intended to reflect their fair value as determined in accordance with procedures approved by the Board and are generally categorized as Level 3. In accordance with the Fund's valuation procedures, factors used in determining value may include, but are not limited to, the type of the security; the size of the holding; the initial cost of the security; the existence of any contractual restrictions on the security's disposition; the price and extent of public trading in similar securities of the issuer or of comparable companies; quotations or evaluated prices from broker-dealers and/or pricing services; information obtained from the issuer, analysts, and/or the appropriate stock exchange (for exchange-traded securities); an analysis of the company's or issuer's financial statements; an evaluation of the forces that influence the issuer and the market(s) in which the security is purchased and sold and with respect to debt securities; the maturity, coupon, creditworthiness, currency denomination and the movement of the market in which the security is normally traded. The value determined under these procedures may differ from published values for the same securities.
Disclosure about the classification of fair value measurements is included in a table following the Fund's Investment Portfolio.
Securities Lending. Deutsche Bank AG, as lending agent, lends securities of the Fund to certain financial institutions under the terms of the Security Lending Agreement. The Fund retains the benefits of owning the securities it has loaned and continues to receive interest and dividends generated by the securities and to participate in any changes in their market value. The Fund requires the borrowers of the securities to maintain collateral with the Fund consisting of either cash or liquid, unencumbered assets having a value at least equal to the value of the securities loaned. When the collateral falls below specified amounts, the lending agent will use its best effort to obtain additional collateral on the next business day to meet required amounts under the security lending agreement. The Fund may invest the cash collateral into a joint trading account in an affiliated money market fund pursuant to Exemptive Orders issued by the SEC. The Fund receives compensation for lending its securities either in the form of fees or by earning interest on invested cash collateral net of borrower rebates and fees paid to a lending agent. Either the Fund or the borrower may terminate the loan. There may be risks of delay and costs in recovery of securities or even loss of rights in the collateral should the borrower of the securities fail financially. If the Fund is not able to recover securities lent, the Fund may sell the collateral and purchase a replacement investment in the market, incurring the risk that the value of the replacement security is greater than the value of the collateral. The Fund is also subject to all investment risks associated with the reinvestment of any cash collateral received, including, but not limited to, interest rate, credit and liquidity risk associated with such investments. The Fund had no securities on loan during the six months ended June 30, 2013.
Mortgage Dollar Rolls. The Fund may enter into mortgage dollar rolls in which the Fund sells to a bank or broker/dealer (the "counterparty") mortgage-backed securities for delivery in the current month and simultaneously contracts to repurchase similar, but not identical, securities on a fixed date. The counterparty receives all principal and interest payments, including prepayments, made on the security while it is the holder. The Fund receives compensation as consideration for entering into the commitment to repurchase. The compensation is paid in the form of a lower price for the security upon its repurchase, or alternatively, a fee. Mortgage dollar rolls may be renewed with a new sale and repurchase price and a cash settlement made at each renewal without physical delivery of the securities subject to the contract.
Certain risks may arise upon entering into mortgage dollar rolls from the potential inability of counterparties to meet the terms of their commitments. Additionally, the value of such securities may change adversely before the Fund is able to repurchase them. There can be no assurance that the Fund's use of the cash that it receives from a mortgage dollar roll will provide a return that exceeds its costs.
When-Issued/Delayed Delivery Securities. The Fund may purchase or sell securities with delivery or payment to occur at a later date beyond the normal settlement period. At the time the Fund enters into a commitment to purchase or sell a security, the transaction is recorded and the value of the transaction is reflected in the net asset value. The price of such security and the date when the security will be delivered and paid for are fixed at the time the transaction is negotiated. The value of the security may vary with market fluctuations. At the time the Fund enters into a purchase transaction it is required to segregate cash or other liquid assets at least equal to the amount of the commitment.
Certain risks may arise upon entering into when-issued or delayed delivery transactions from the potential inability of counterparties to meet the terms of their contracts or if the issuer does not issue the securities due to political, economic, or other factors. Additionally, losses may arise due to changes in the value of the underlying securities.
Federal Income Taxes. The Fund's policy is to comply with the requirements of the Internal Revenue Code, as amended, which are applicable to regulated investment companies and to distribute all of its taxable income to its shareholders.
The Fund has reviewed the tax positions for the open tax years as of December 31, 2012 and has determined that no provision for income tax is required in the Fund's financial statements. The Fund's federal tax returns for the prior three fiscal years remain open subject to examination by the Internal Revenue Service.
Distribution of Income and Gains. Distributions from net investment income of the Fund, if any, are declared and distributed to shareholders annually. Net realized gains from investment transactions, in excess of available capital loss carryforwards, would be taxable to the Fund if not distributed and, therefore, will be distributed to shareholders at least annually. The Fund may also make additional distributions for tax purposes if necessary.
The timing and characterization of certain income and capital gain distributions are determined annually in accordance with federal tax regulations which may differ from accounting principles generally accepted in the United States of America. These differences primarily relate to investments in futures contracts, investments in swap contracts and certain securities sold at a loss. As a result, net investment income (loss) and net realized gain (loss) on investment transactions for a reporting period may differ significantly from distributions during such period. Accordingly, the Fund may periodically make reclassifications among certain of its capital accounts without impacting the net asset value of the Fund.
The tax character of current year distributions will be determined at the end of the current fiscal year.
Expenses. Expenses of the Trust arising in connection with a specific fund are allocated to that fund. Other Trust expenses which cannot be directly attributed to a fund are apportioned among the funds in the Trust based upon the relative net assets or other appropriate measures.
Contingencies. In the normal course of business, the Fund may enter into contracts with service providers that contain general indemnification clauses. The Fund's maximum exposure under these arrangements is unknown as this would involve future claims that may be made against the Fund that have not yet been made. However, based on experience, the Fund expects the risk of loss to be remote.
Other. Investment transactions are accounted for on a trade date plus one basis for daily net asset value calculations. However, for financial reporting purposes, investment transactions are reported on trade date. Interest income is recorded on the accrual basis. Realized gains and losses from investment transactions are recorded on an identified cost basis and may include proceeds from litigation. All discounts and premiums are accreted/amortized for both tax and financial reporting purposes for the Fund.
B. Derivative Instruments
Interest Rate Swap Contracts. For the six months ended June 30, 2013, the Fund entered into interest rate swap transactions to gain exposure to different parts of the yield curve while managing overall duration. The use of interest rate swaps is a highly specialized activity that involves investment techniques and risks different from those associated with ordinary portfolio security transactions. In an interest rate swap, the Fund agrees to pay to the other party to the interest rate swap (which is known as the "counterparty") a fixed rate payment in exchange for the counterparty agreeing to pay to the Fund a variable rate payment, or the Fund agrees to receive from the counterparty a fixed rate payment in exchange for the counterparty agreeing to receive from the Fund a variable rate payment. In addition, both the Fund and counterparty may agree to exchange variable rate payments based on different indices. The payment obligations are based on the notional amount of the swap. Certain risks may arise when entering into swap transactions including counterparty default, liquidity or unfavorable changes in interest rates. In connection with these agreements, securities and or cash may be identified as collateral in accordance with the terms of the swap agreements to provide assets of value and recourse in the event of default. The maximum counterparty credit risk is the net present value of the cash flows to be received from or paid to the counterparty over the term of the interest rate swap contract, to the extent that this amount is beneficial to the Fund, in addition to any related collateral posted to the counterparty by the Fund. This risk may be partially reduced by a master netting arrangement between the Fund and the counterparty. The value of the swap is adjusted daily and the change in value, if any, is recorded as unrealized appreciation or depreciation in the Statement of Assets and Liabilities. An upfront payment, if any, made by the Fund is recorded as an asset in the Statement of Assets and Liabilities. An upfront payment, if any, received by the Fund is recorded as a liability in the Statement of Assets and Liabilities. Payments received or made at the end of the measurement period are recorded as realized gain or loss in the Statement of Operations.
For the six months ended June 30, 2013, the investment in interest rate swap contracts had a total notional amount generally indicative of a range from $32,300,000 to $40,700,000.
Options. An option contract is a contract in which the writer (seller) of the option grants the buyer of the option, upon payment of a premium, the right to purchase from (call option), or sell to (put option), the writer a designated instrument at a specified price within a specified period of time. Certain options, including options on indices and interest rate options, will require cash settlement by the Fund if exercised. For the six months ended June 30, 2013, the Fund entered into options on interest rate futures and on interest rate swap contracts in order to hedge against potential adverse interest rate movements of portfolio assets.
If the Fund writes a covered call option, the Fund foregoes, in exchange for the premium, the opportunity to profit during the option period from an increase in the market value of the underlying security above the exercise price. If the Fund writes a put option it accepts the risk of a decline in the value of the underlying security below the exercise price. Over-the-counter options have the risk of the potential inability of counterparties to meet the terms of their contracts. For exchange-traded contracts, the counterparty risk is minimized as the exchange's clearinghouse acts as the counterparty, and guarantees the futures against default. The Fund's maximum exposure to purchased options is limited to the premium initially paid. In addition, certain risks may arise upon entering into option contracts, including the risk that an illiquid secondary market will limit the Fund's ability to close out an option contract prior to the expiration date and that a change in the value of the option contract may not correlate exactly with changes in the value of the securities or currencies hedged.
A summary of the open purchased option contracts as of June 30, 2013 is included in the Fund's Investment Portfolio. A summary of open written option contracts is included in a table following the Fund's Investment Portfolio. For the six months ended June 30, 2013, the investment in written option contracts had a total value generally indicative of a range from approximately $590,000 to $1,248,000, and purchased option contracts had a total value generally indicative of a range from approximately $575,000 to $842,000.
Futures Contracts. A futures contract is an agreement between a buyer or seller and an established futures exchange or its clearinghouse in which the buyer or seller agrees to take or make a delivery of a specific amount of a financial instrument at a specified price on a specific date (settlement date). For the six months ended June 30, 2013, the Fund entered into interest rate futures to gain exposure to different parts of the yield curve while managing overall duration.
Upon entering into a futures contract, the Fund is required to deposit with a financial intermediary cash or securities ("initial margin") in an amount equal to a certain percentage of the face value indicated in the futures contract. Subsequent payments ("variation margin") are made or received by the Fund dependent upon the daily fluctuations in the value and are recorded for financial reporting purposes as unrealized gains or losses by the Fund. Gains or losses are realized when the contract expires or is closed. Since all futures contracts are exchange-traded, counterparty risk is minimized as the exchange's clearinghouse acts as the counterparty, and guarantees the futures against default.
Certain risks may arise upon entering into futures contracts, including the risk that an illiquid market will limit the Fund's ability to close out a futures contract prior to the settlement date and the risk that the futures contract is not well correlated with the security, index or currency to which it relates. Risk of loss may exceed amounts disclosed in the Statement of Assets and Liabilities.
A summary of the open futures contracts as of June 30, 2013, is included in a table following the Fund's Investment Portfolio. For the period ended June 30, 2013, the investment in futures contracts purchased had a total notional value generally indicative of a range from approximately $2,652,000 to $7,555,000, and the investment in futures contracts sold had a total notional value generally indicative of a range from approximately $3,722,000 to $13,922,000.
The following tables summarize the value of the Fund's derivative instruments held as of June 30, 2013 and the related location in the accompanying Statement of Assets and Liabilities, presented by primary underlying risk exposure:
| Asset Derivatives | | Purchased Options | | | Swap Contracts | | | Futures Contracts | | | Total | |
| Interest Rate Contracts (a) (b) | | $ | 841,797 | | | $ | 21,864 | | | $ | 189,212 | | | $ | 1,052,873 | |
Each of the above derivatives is located in the following Statement of Assets and Liabilities accounts:
(a) Investments in securities, at value (includes purchased options) and unrealized appreciation on swap contracts
(b) Includes cumulative appreciation of futures contracts as disclosed in the Investment Portfolio. Unsettled variation margin is disclosed separately within the Statement of Assets and Liabilities.
| Liability Derivatives | | Written Options | | | Futures Contracts | | | Total | |
| Interest Rate Contracts (a) (b) | | $ | (1,247,959 | ) | | $ | (159,173 | ) | | $ | (1,407,132 | ) |
Each of the above derivatives is located in the following Statement of Assets and Liabilities accounts:
(a) Options written, at value
(b) Includes cumulative depreciation of futures contracts as disclosed in the Investment Portfolio. Unsettled variation margin is disclosed separately within the Statement of Assets and Liabilities.
Additionally, the amount of unrealized and realized gains and losses on derivative instruments recognized in Fund earnings during the six months ended June 30, 2013 and the related location in the accompanying Statement of Operations is summarized in the following tables by primary underlying risk exposure:
| Realized Gain (Loss) | | Purchased Options | | | Written Options | | | Swap Contracts | | | Futures Contracts | | | Total | |
| Interest Rate Contracts (a) | | $ | 981 | | | $ | 177,921 | | | $ | 388,507 | | | $ | (44,434 | ) | | $ | 522,975 | |
Each of the above derivatives is located in the following Statement of Operations accounts:
(a) Net realized gain (loss) from investments (includes purchased options), written options, swap contracts and futures, respectively
| Change in Net Unrealized Appreciation (Depreciation) | | Purchased Options | | | Written Options | | | Swap Contracts | | | Futures Contracts | | | Total | |
| Interest Rate Contracts (a) | | $ | 230,992 | | | $ | (601,208 | ) | | $ | 364,779 | | | $ | 51,877 | | | $ | 46,440 | |
Each of the above derivatives is located in the following Statement of Operations accounts:
(a) Change in net unrealized appreciation (depreciation) from investments (includes purchased options), written options, swap contracts and futures, respectively
As of June 30, 2013, the Fund has transactions subject to enforceable master netting agreements. A reconciliation of the gross amounts on the Statement of Assets and Liabilities to the net amounts by derivative type, including any collateral exposure, is included in the following tables:
| Counterparty | | Gross Amounts of Assets Presented in the Statement of Assets and Liabilities (a) | | | Financial Instruments and Derivatives Available for Offset | | | Non-Cash Collateral Received | | | Collateral Received | | | Net Amount of Derivative Assets | |
| Bank of America | | $ | 170,776 | | | $ | (121,222 | ) | | $ | — | | | $ | — | | | $ | 49,554 | |
| BNP Paribas | | | 360,421 | | | | (360,421 | ) | | | — | | | | — | | | | — | |
| Citigroup, Inc. | | | 157,126 | | | | (110,846 | ) | | | — | | | | — | | | | 46,280 | |
| Nomura International PLC | | | 169,432 | | | | (169,432 | ) | | | — | | | | — | | | | — | |
| Exchange Traded Options and Futures (b) | | | 195,118 | | | | — | | | | — | | | | — | | | | 195,118 | |
| | | $ | 1,052,873 | | | $ | (761,921 | ) | | $ | — | | | $ | — | | | $ | 290,952 | |
| Counterparty | | Gross Amounts of Liabilities Presented in the Statement of Assets and Liabilities (a) | | | Financial Instruments and Derivatives Available for Offset | | | Non-Cash Collateral Pledged (c) | | | Collateral Pledged | | | Net Amount of Derivative Liabilities | |
| Bank of America | | $ | 121,222 | | | $ | (121,222 | ) | | $ | — | | | $ | — | | | $ | — | |
| Barclays Bank PLC | | | 7,658 | | | | — | | | | — | | | | — | | | | 7,658 | |
| BNP Paribas | | | 413,480 | | | | (360,421 | ) | | | — | | | | — | | | | 53,059 | |
| Citigroup, Inc. | | | 110,846 | | | | (110,846 | ) | | | — | | | | — | | | | — | |
| JPMorgan Chase Securities, Inc. | | | 8,700 | | | | — | | | | — | | | | — | | | | 8,700 | |
| Nomura International PLC | | | 219,928 | | | | (169,432 | ) | | | (20,105 | ) | | | — | | | | 30,391 | |
| Exchange Traded Options and Futures (b) | | | 525,298 | | | | — | | | | — | | | | — | | | | 525,298 | |
| | | $ | 1,407,132 | | | $ | (761,921 | ) | | $ | (20,105 | ) | | $ | — | | | $ | 625,106 | |
(a) Swap contracts, over-the-counter purchased and written options are netted.
(b) Includes financial instruments (purchased options or futures) which are not subject to a master netting arrangement, or another similar arrangement.
(c) The actual collateral received and/or pledged may be more than the amount shown.
C. Purchases and Sales of Securities
During the six months ended June 30, 2013, purchases and sales of investment securities (excluding short-term investments and U.S. Treasury securities) aggregated $448,972,090 and $461,297,759, respectively. Purchases and sales of U.S. Treasury securities aggregated $12,972,831 and $12,356,770, respectively.
For the six months ended June 30, 2013, transactions for written options on futures and interest rate swap contracts were as follows:
| | | Contracts/ Contract Amount | | | Premiums | |
| Outstanding, beginning of period | | | 25,600,030 | | | $ | 916,248 | |
| Options written | | | 19,200,101 | | | | 258,343 | |
| Options closed | | | (11,700,000 | ) | | | (189,925 | ) |
| Options expired | | | (30 | ) | | | (11,653 | ) |
| Outstanding, end of period | | | 33,100,101 | | | $ | 973,013 | |
D. Related Parties
Management Agreement. Under the Investment Management Agreement with Deutsche Investment Management Americas Inc. ("DIMA" or the "Advisor"), an indirect, wholly owned subsidiary of Deutsche Bank AG, the Advisor directs the investments of the Fund in accordance with its investment objectives, policies and restrictions. The Advisor determines the securities, instruments and other contracts relating to investments to be purchased, sold or entered into by the Fund.
Pursuant to the Investment Management Agreement with the Advisor, the Fund pays a monthly management fee based on the Fund's average daily net assets, computed and accrued daily and payable monthly, at the following annual rates:
| First $250 million | | | .450 | % |
| Next $750 million | | | .430 | % |
| Next $1.5 billion | | | .410 | % |
| Next $2.5 billion | | | .400 | % |
| Next $2.5 billion | | | .380 | % |
| Next $2.5 billion | | | .360 | % |
| Next $2.5 billion | | | .340 | % |
| Over $12.5 billion | | | .320 | % |
For the period from January 1, 2013 through April 30, 2013, the Advisor had contractually agreed to waive its fees and/or reimburse certain operating expenses to the extent necessary to maintain the operating expenses (excluding certain expenses such as extraordinary expenses, taxes, brokerage and interest expense) of Class A at 0.66%.
For the period from May 1, 2013 through April 30, 2014, the Advisor has contractually agreed to waive its fees and/or reimburse certain operating expenses to the extent necessary to maintain the operating expenses (excluding certain expenses such as extraordinary expenses, taxes, brokerage and interest expense) of Class A at 0.67%.
For the period from January 1, 2013 through April 30, 2014, the Advisor has contractually agreed to waive its fees and/or reimburse certain operating expenses to the extent necessary to maintain the operating expenses (excluding certain expenses such as extraordinary expenses, taxes, brokerage and interest expense) of Class B at 0.99%.
Accordingly, for the six months ended June 30, 2013, the Advisor waived a portion of its management fee pursuant to the Investment Management Agreement aggregating $17,966, and the amount charged aggregated $249,224, which was equivalent to an annualized effective rate of 0.42% of the Fund's average daily net assets.
Administration Fee. Pursuant to an Administrative Services Agreement, DIMA provides most administrative services to the Fund. For all services provided under the Administrative Services Agreement, the Fund pays DIMA an annual fee ("Administration Fee") of 0.10% of the Fund's average daily net assets, computed and accrued daily and payable monthly. For the six months ended June 30, 2013, the Administration Fee was $59,376, of which $9,285 is unpaid.
Service Provider Fees. DWS Investments Service Company ("DISC"), an affiliate of the Advisor, is the transfer agent, dividend-paying agent and shareholder service agent for the Fund. Pursuant to a sub-transfer agency agreement between DISC and DST Systems, Inc. ("DST"), DISC has delegated certain transfer agent, dividend-paying agent and shareholder service agent functions to DST. DISC compensates DST out of the shareholder servicing fee it receives from the Fund. For the six months ended June 30, 2013, the amounts charged to the Fund by DISC were as follows:
| | | Total Aggregated | | | Amount Waived | |
| Class A | | $ | 136 | | | $ | 136 | |
| Class B | | | 35 | | | | 35 | |
| | | $ | 171 | | | $ | 171 | |
In addition, for the six months ended June 30, 2013, the Advisor reimbursed $520 of recordkeeping fees for Class B shares.
Distribution Service Agreement. Under the Fund's Class B 12b-1 plans, DWS Investments Distributors, Inc. ("DIDI") received a fee ("Distribution Service Fee") of 0.25% of average daily net assets of Class B shares. For the six months ended June 30, 2013, the Distribution Service Fee aggregated $6,064, of which $979 is unpaid.
Typesetting and Filing Service Fees. Under an agreement with DIMA, DIMA is compensated for providing typesetting and certain regulatory filing services to the Fund. For the six months ended June 30, 2013, the amount charged to the Fund by DIMA included in the Statement of Operations under "reports to shareholders" aggregated $7,964, of which $7,836 is unpaid.
Trustees' Fees and Expenses. The Fund paid retainer fees to each Trustee not affiliated with the Advisor, plus specified amounts to the Board Chairperson and Vice Chairperson and to each committee Chairperson.
Affiliated Cash Management Vehicles. The Fund may invest uninvested cash balances in Central Cash Management Fund and DWS Variable NAV Money Fund, affiliated money market funds which are managed by the Advisor. Each affiliated money market fund seeks to provide a high level of current income consistent with liquidity and the preservation of capital. Each affiliated money market fund is managed in accordance with Rule 2a-7 under the Investment Company Act of 1940, which governs the quality, maturity, diversity and liquidity of instruments in which a money market fund may invest. Central Cash Management Fund seeks to maintain a stable net asset value, and DWS Variable NAV Money Fund maintains a floating net asset value. The Fund indirectly bears its proportionate share of the expenses of each affiliated money market fund in which it invests. Central Cash Management Fund does not pay the Advisor an investment management fee. To the extent that DWS Variable NAV Money Fund pays an investment management fee to the Advisor, the Advisor will waive an amount of the investment management fee payable to the Advisor by the Fund equal to the amount of the investment management fee payable on the Fund's assets invested in DWS Variable NAV Money Fund.
E. Ownership of the Fund
At June 30, 2013, three Participating Insurance Companies were owners of record of 10% or more of the total outstanding Class A shares of the Fund, each owning 41%, 33% and 18%. One Participating Insurance Company was the owner of record of 10% or more of the total outstanding Class B shares of the Fund, owning 94%.
F. Line of Credit
The Fund and other affiliated funds (the "Participants") share in a $375 million revolving credit facility provided by a syndication of banks. The Fund may borrow for temporary or emergency purposes, including the meeting of redemption requests that otherwise might require the untimely disposition of securities. The Participants are charged an annual commitment fee which is allocated based on net assets, among each of the Participants. Interest is calculated at a rate per annum equal to the sum of the Federal Funds Rate plus 1.25 percent plus if LIBOR exceeds the Federal Funds Rate the amount of such excess. The Fund may borrow up to a maximum of 33 percent of its net assets under the agreement. The Fund had no outstanding loans at June 30, 2013.
Information About Your Fund's Expenses (Unaudited)
As an investor of the Fund, you incur two types of costs: ongoing expenses and transaction costs. Ongoing expenses include management fees, distribution and service (12b-1) fees and other Fund expenses. Examples of transaction costs include contract charges, redemption fees and account maintenance fees, which are not shown in this section. The following tables are intended to help you understand your ongoing expenses (in dollars) of investing in the Fund and to help you compare these expenses with the ongoing expenses of investing in other mutual funds. In the most recent six-month period, the Fund limited these expenses; had it not done so, expenses would have been higher. The example in the table is based on an investment of $1,000 invested at the beginning of the six-month period and held for the entire period (January 1, 2013 to June 30, 2013).
The tables illustrate your Fund's expenses in two ways:
•Actual Fund Return. This helps you estimate the actual dollar amount of ongoing expenses (but not transaction costs) paid on a $1,000 investment in the Fund using the Fund's actual return during the period. To estimate the expenses you paid over the period, simply divide your account value by $1,000 (for example, an $8,600 account value divided by $1,000 = 8.6), then multiply the result by the number in the "Expenses Paid per $1,000" line under the share class you hold.
• Hypothetical 5% Fund Return. This helps you to compare your Fund's ongoing expenses (but not transaction costs) with those of other mutual funds using the Fund's actual expense ratio and a hypothetical rate of return of 5% per year before expenses. Examples using a 5% hypothetical Fund return may be found in the shareholder reports of other mutual funds. The hypothetical account values and expenses may not be used to estimate the actual ending account balance or expenses you paid for the period.
Please note that the expenses shown in these tables are meant to highlight your ongoing expenses only and do not reflect any transaction costs. The "Expenses Paid per $1,000" line of the tables is useful in comparing ongoing expenses only and will not help you determine the relative total expense of owning different funds. If these transaction costs had been included, your costs would have been higher.
Expenses and Value of a $1,000 Investment for the six months ended June 30, 2013 | |
| Actual Fund Return | | Class A | | | Class B | |
| Beginning Account Value 1/1/13 | | $ | 1,000.00 | | | $ | 1,000.00 | |
| Ending Account Value 6/30/13 | | $ | 971.30 | | | $ | 970.90 | |
| Expenses Paid per $1,000* | | $ | 3.27 | | | $ | 4.84 | |
| Hypothetical 5% Fund Return | | Class A | | | Class B | |
| Beginning Account Value 1/1/13 | | $ | 1,000.00 | | | $ | 1,000.00 | |
| Ending Account Value 6/30/13 | | $ | 1,021.47 | | | $ | 1,019.89 | |
| Expenses Paid per $1,000* | | $ | 3.36 | | | $ | 4.96 | |
* Expenses are equal to the Fund's annualized expense ratio for each share class, multiplied by the average account value over the period, multiplied by 181 (the number of days in the most recent six-month period), then divided by 365.
| Annualized Expense Ratios | Class A | | Class B | |
| DWS Variable Series II — DWS Government & Agency Securities VIP | .67% | | .99% | |
For more information, please refer to the Fund's prospectus.
These tables do not reflect charges and fees ("contract charges") associated with the separate account that invests in the Fund or any variable life insurance policy or variable annuity contract for which the Fund is an investment option.
For an analysis of the fees associated with an investment in the Fund or similar funds, please refer to http://apps.finra.org/fundanalyzer/1/fa.aspx.
The Trust's policies and procedures for voting proxies for portfolio securities and information about how the Trust voted proxies related to its portfolio securities during the 12-month period ended June 30 are available on our Web site — www.dws-investments.com (click on "proxy voting" at the bottom of the page) — or on the SEC's Web site — www.sec.gov. To obtain a written copy of the Trust's policies and procedures without charge, upon request, call us toll free at (800) 728-3337.
Summary of Management Fee Evaluation by Independent Fee Consultant
September 17, 2012
Pursuant to an Order entered into by Deutsche Investment Management Americas and affiliates (collectively, "DeAM") with the Attorney General of New York, I, Thomas H. Mack, have been appointed the Independent Fee Consultant for the DWS Funds (formerly the DWS Scudder Funds). My duties include preparing an annual written evaluation of the management fees DeAM charges the Funds, considering among other factors the management fees charged by other mutual fund companies for like services, management fees DeAM charges other clients for like services, DeAM's costs of supplying services under the management agreements and related profit margins, possible economies of scale if a Fund grows larger, and the nature and quality of DeAM's services, including fund performance. This report summarizes my evaluation for 2012, including my qualifications, the evaluation process for each of the DWS Funds, consideration of certain complex-level factors, and my conclusions. I served in substantially the same capacity in 2007, 2008, 2009, 2010 and 2011.
Qualifications
For more than 35 years I have served in various professional capacities within the investment management business. I have held investment analysis and advisory positions, including securities analyst, portfolio strategist and director of investment policy with a large investment firm. I have also performed business management functions, including business development, financial management and marketing research and analysis.
Since 1991, I have been an independent consultant within the asset management industry. I have provided services to over 125 client organizations, including investment managers, mutual fund boards, product distributors and related organizations. Over the past ten years I have completed a number of assignments for mutual fund boards, specifically including assisting boards with management contract renewal.
I hold a Master of Business Administration degree, with highest honors, from Harvard University and Master of Science and Bachelor of Science (highest honors) degrees from the University of California at Berkeley. I am an independent director and audit committee financial expert for two closed-end mutual funds and have served in various leadership and financial oversight capacities with non-profit organizations.
Evaluation of Fees for each DWS Fund
My work focused primarily on evaluating, fund-by-fund, the fees charged to each of the 103 mutual fund portfolios in the DWS Fund family. For each Fund, I considered each of the key factors mentioned above, as well as any other relevant information. In doing so I worked closely with the Funds' Independent Directors in their annual contract renewal process, as well as in their approval of contracts for several new funds (documented separately).
In evaluating each Fund's fees, I reviewed comprehensive materials provided by or on behalf of DeAM, including expense information prepared by Lipper Analytical, comparative performance information, profitability data, manager histories, and other materials. I also accessed certain additional information from the Lipper and Morningstar databases and drew on my industry knowledge and experience.
To facilitate evaluating this considerable body of information, I prepared for each Fund a document summarizing the key data elements in each area as well as additional analytics discussed below. This made it possible to consider each key data element in the context of the others.
In the course of contract renewal, DeAM agreed to implement a number of fee and expense adjustments requested by the Independent Directors which will favorably impact future fees and expenses, and my evaluation includes the effects of these changes.
Fees and Expenses Compared with Other Funds
The competitive fee and expense evaluation for each fund focused on two primary comparisons:
The Fund's contractual management fee (the advisory fee plus the administration fee where applicable) compared with those of a group of typically 12-15 funds in the same Lipper investment category (e.g. Large Capitalization Growth) having similar distribution arrangements and being of similar size.
The Fund's total expenses compared with a broader universe of funds from the same Lipper investment category and having similar distribution arrangements.
These two comparisons provide a view of not only the level of the fee compared with funds of similar scale but also the total expense the Fund bears for all the services it receives, in comparison with the investment choices available in the Fund's investment category and distribution channel. The principal figure-of-merit used in these comparisons was the subject Fund's percentile ranking against peers.
DeAM's Fees for Similar Services to Others
DeAM provided management fee schedules for all of its US domiciled fund and non-fund investment management accounts in any of the investment categories where there is a DWS Fund. These similar products included the other DWS Funds, non-fund pooled accounts, institutional accounts and sub-advisory accounts. Using this information, I calculated for each Fund the fee that would be charged to each similar product, at the subject Fund's asset level.
Evaluating information regarding non-fund products is difficult because there are varying levels of services required for different types of accounts, with mutual funds generally requiring considerably more regulatory and administrative types of service as well as having more frequent cash flows than other types of accounts. Also, while mutual fund fees for similar fund products can be expected to be similar, there will be some differences due to different pricing conditions in different distribution channels (e.g. retail funds versus those used in variable insurance products), differences in underlying investment processes and other factors.
Costs and Profit Margins
DeAM provided a detailed profitability analysis for each Fund. After making some adjustments so that the presentation would be more comparable to the available industry figures, I reviewed profit margins from investment management alone, from investment management plus other fund services (excluding distribution) provided to the Funds by DeAM (principally shareholder services), and DeAM profits from all sources, including distribution. A later section comments on overall profitability.
Economies of Scale
Economies of scale — an expected decline in management cost per dollar of fund assets as fund assets grow — are very rarely quantified and documented because of inherent difficulties in collecting and analyzing relevant data. However, in virtually every investment category that I reviewed, larger funds tend to have lower fees and lower total expenses than smaller funds. To see how each DWS Fund compares with this industry observation, I reviewed:
The trend in Fund assets over the last five years and the accompanying trend in total expenses. This shows if the Fund has grown and, if so, whether total expense (management fees as well as other expenses) have declined as a percent of assets.
Whether the Fund has break-points in its management fee schedule, the extent of the fee reduction built into the schedule and the asset levels where the breaks take effect, and in the case of a sub-advised Fund how the Fund's break-points compare with those of the sub-advisory fee schedule.
How the Fund's contractual fee schedule compares with trends in the industry data. To accomplish this, I constructed a chart showing how actual latest-fiscal-year contractual fees of the Fund and of other similar funds relate to average fund assets, with the subject Fund's contractual fee schedule superimposed.
Quality of Service — Performance
The quality-of-service evaluation focused on investment performance, which is the principal result of the investment management service. Each Fund's performance was reviewed over the past 1, 3, 5 and 10 years, as applicable, and compared with that of other funds in the same investment category and with a suitable market index.
In addition, I calculated and reviewed risk-adjusted returns relative to an index of similar mutual funds' returns and a suitable market index. The risk-adjusted returns analysis provides a way of determining the extent to which the Fund's return comparisons are mainly the product of investment value-added (or lack thereof) or alternatively taking considerably more or less risk than is typical in its investment category.
I also received and considered the history of portfolio manager changes for each Fund, as this provided an important context for evaluating the performance results.
Complex-Level Considerations
While this evaluation was conducted mainly at the individual fund level, there are some issues relating to the reasonableness of fees that can alternatively be considered across the whole fund complex:
I reviewed DeAM's profitability analysis for all DWS Funds, with a view toward determining if the allocation procedures used were reasonable and how profit levels compared with public data for other investment managers.
I considered whether DeAM and affiliates receive any significant ancillary or "fallout" benefits that should be considered in interpreting the direct profitability results. These would be situations where serving as the investment manager of the Funds is beneficial to another part of the Deutsche Bank organization.
I considered how aggregated DWS Fund expenses had varied over the years, by asset class and in the context of trends in asset levels.
I considered how aggregated DWS Fund performance measures relative to appropriate peers had varied by asset class and over time.
I reviewed the structure of the DeAM organization, trends in staffing levels, and information on compensation of investment management and other professionals compared with industry data.
Findings
Based on the process and analysis discussed above, which included reviewing a wide range of information from management and external data sources and considering among other factors the fees DeAM charges other clients, the fees charged by other fund managers, DeAM's costs and profits associated with managing the Funds, economies of scale, possible fall-out benefits, and the nature and quality of services provided, in my opinion the management fees charged the DWS Funds are reasonable.
Thomas H. Mack
President, Thomas H. Mack & Co., Inc.
DWS Investments Distributors, Inc.
222 South Riverside Plaza
Chicago, IL 60606
(800) 621-1148
VS2GAS-3 (R-028384-2 8/13)
JUNE 30, 2013
SEMIANNUAL REPORT
DWS VARIABLE SERIES II
DWS High Income VIP
Contents
17 Statement of Assets and Liabilities 18 Statement of Operations 19 Statement of Changes in Net Assets 21 Notes to Financial Statements 28 Information About Your Fund's Expenses 30 Summary of Management Fee Evaluation by Independent Fee Consultant |
This report must be preceded or accompanied by a prospectus. To obtain an additional prospectus or summary prospectus, if available, call (800) 728-3337 or your financial representative. We advise you to consider the Fund's objectives, risks, charges and expenses carefully before investing. The summary prospectus and prospectus contain this and other important information about the Fund. Please read the prospectus carefully before you invest.
Bond investments are subject to interest-rate and credit risks. When interest rates rise, bond prices generally fall. Credit risk refers to the ability of an issuer to make timely payments of principal and interest. Investments in lower-quality ("junk bonds") and non-rated securities present greater risk of loss than investments in higher-quality securities. Investing in derivatives entails special risks relating to liquidity, leverage and credit that may reduce returns and/or increase volatility. The Fund may lend securities to approved institutions. See the prospectus for details.
DWS Investments is part of the Deutsche Asset & Wealth Management division of Deutsche Bank AG.
NOT FDIC/NCUA INSURED NO BANK GUARANTEE MAY LOSE VALUE NOT A DEPOSIT
NOT INSURED BY ANY FEDERAL GOVERNMENT AGENCY
Performance Summary June 30, 2013 (Unaudited)
Fund performance shown is historical, assumes reinvestment of all dividend and capital gain distributions and does not guarantee future results. Investment return and principal value fluctuate with changing market conditions so that, when redeemed, shares may be worth more or less than their original cost. Current performance may be lower or higher than the performance data quoted. Please contact your participating insurance company for the Fund's most recent month-end performance. Performance doesn't reflect charges and fees ("contract charges") associated with the separate account that invests in the Fund or any variable life insurance policy or variable annuity contract for which the Fund is an investment option. These charges and fees will reduce returns. While all share classes have the same underlying portfolio, their performance will differ.
The gross expense ratios of the Fund, as stated in the fee table of the prospectus dated May 1, 2013 are 0.72% and 0.99% for Class A and Class B shares, respectively, and may differ from the expense ratios disclosed in the Financial Highlights tables in this report.
| Growth of an Assumed $10,000 Investment in DWS High Income VIP |
| The Credit Suisse High Yield Index tracks the performance of the global high-yield debt market. Index returns do not reflect any fees or expenses and it is not possible to invest directly into an index. |
| |
| Yearly periods ended June 30 | |
| Comparative Results | |
| DWS High Income VIP | | 6-Month‡ | | | 1-Year | | | 3-Year | | | 5-Year | | | 10-Year | |
| Class A | Growth of $10,000 | | $ | 10,187 | | | $ | 10,962 | | | $ | 13,355 | | | $ | 14,956 | | | $ | 21,011 | |
| Average annual total return | | | 1.87 | % | | | 9.62 | % | | | 10.12 | % | | | 8.38 | % | | | 7.71 | % |
| Credit Suisse High Yield Index | Growth of $10,000 | | $ | 10,152 | | | $ | 10,918 | | | $ | 13,423 | | | $ | 16,185 | | | $ | 22,948 | |
| Average annual total return | | | 1.52 | % | | | 9.18 | % | | | 10.31 | % | | | 10.11 | % | | | 8.66 | % |
| DWS High Income VIP | | 6-Month‡ | | | 1-Year | | | 3-Year | | | 5-Year | | | 10-Year | |
| Class B | Growth of $10,000 | | $ | 10,175 | | | $ | 10,945 | | | $ | 13,275 | | | $ | 14,795 | | | $ | 20,369 | |
| Average annual total return | | | 1.75 | % | | | 9.45 | % | | | 9.90 | % | | | 8.15 | % | | | 7.37 | % |
| Credit Suisse High Yield Index | Growth of $10,000 | | $ | 10,152 | | | $ | 10,918 | | | $ | 13,423 | | | $ | 16,185 | | | $ | 22,948 | |
| Average annual total return | | | 1.52 | % | | | 9.18 | % | | | 10.31 | % | | | 10.11 | % | | | 8.66 | % |
The growth of $10,000 is cumulative.
‡ Total returns shown for periods less than one year are not annualized.
Portfolio Summary (Unaudited) Asset Allocation (As a % of Investment Portfolio excluding Securities Lending Collateral) | 6/30/13 | 12/31/12 |
| | | |
| Corporate Bonds | 92% | 86% |
| Cash Equivalents | 4% | 11% |
| Convertible Bonds | 2% | 1% |
| Preferred Security | 1% | 1% |
| Preferred Stocks | 1% | 1% |
| | 100% | 100% |
Sector Diversification (As a % of Investment Portfolio excluding Cash Equivalents and Securities Lending Collateral) | 6/30/13 | 12/31/12 |
| | | |
| Consumer Discretionary | 19% | 23% |
| Financials | 16% | 16% |
| Telecommunication Services | 16% | 14% |
| Energy | 13% | 12% |
| Industrials | 10% | 9% |
| Materials | 10% | 10% |
| Information Technology | 5% | 5% |
| Health Care | 5% | 5% |
| Consumer Staples | 4% | 3% |
| Utilities | 2% | 3% |
| | 100% | 100% |
Quality (As a % of Investment Portfolio excluding Cash Equivalents and Securities Lending Collateral) | 6/30/13 | 12/31/12 |
| | | |
| BBB | 2% | 2% |
| BB | 32% | 29% |
| B | 51% | 57% |
| CCC | 13% | 10% |
| CC | — | 1% |
| Not Rated | 2% | 1% |
| | 100% | 100% |
The quality ratings represent the higher of Moody's Investors Service, Inc. ("Moody's") or Standard & Poor's Corporation ("S&P") credit ratings. The ratings of Moody's and S&P represent their opinions as to the quality of the securities they rate. Credit quality measures a bond issuer's ability to repay interest and principal in a timely manner. Ratings are relative and subjective and are not absolute standards of quality. Credit quality does not remove market risk and is subject to change.
Portfolio holdings and characteristics are subject to change.
For more complete details about the Fund's investment portfolio, see page 5.
Following the Fund's fiscal first and third quarter-end, a complete portfolio holdings listing is filed with the SEC on Form N-Q. The form will be available on the SEC's Web site at www.sec.gov, and it also may be reviewed and copied at the SEC's Public Reference Room in Washington, D.C. Information on the operation of the SEC's Public Reference Room may be obtained by calling (800) SEC-0330. The Fund's portfolio holdings are also posted on www.dws-investments.com from time to time. Please see the Fund's current prospectus for more information.
Gary Russell, CFA
Portfolio Manager
Investment Portfolio June 30, 2013 (Unaudited) | | | Principal Amount ($)(a) | | | Value ($) | |
| | | | |
| Corporate Bonds 89.6% | |
| Consumer Discretionary 18.5% | |
| AMC Entertainment, Inc., 8.75%, 6/1/2019 | | | | 170,000 | | | | 181,900 | |
| AMC Networks, Inc., 7.75%, 7/15/2021 | | | | 80,000 | | | | 87,400 | |
| AmeriGas Finance LLC: | |
| 6.75%, 5/20/2020 | | | | 110,000 | | | | 113,850 | |
| 7.0%, 5/20/2022 | | | | 110,000 | | | | 112,475 | |
| APX Group, Inc., 144A, 6.375%, 12/1/2019 | | | | 205,000 | | | | 194,750 | |
| Asbury Automotive Group, Inc.: | |
| 8.375%, 11/15/2020 | | | | 460,000 | | | | 509,450 | |
| 144A, 8.375%, 11/15/2020 | | | | 45,000 | | | | 49,838 | |
| Ashtead Capital, Inc., 144A, 6.5%, 7/15/2022 | | | | 330,000 | | | | 344,025 | |
| Ashton Woods U.S.A. LLC, 144A, 6.875%, 2/15/2021 | | | | 350,000 | | | | 353,500 | |
| Avis Budget Car Rental LLC: | |
| 144A, 5.5%, 4/1/2023 | | | | 205,000 | | | | 197,825 | |
| 8.25%, 1/15/2019 | | | | 535,000 | | | | 581,812 | |
| BC Mountain LLC, 144A, 7.0%, 2/1/2021 | | | | 210,000 | | | | 214,200 | |
| Block Communications, Inc., 144A, 7.25%, 2/1/2020 | | | | 375,000 | | | | 393,750 | |
| Boyd Gaming Corp., 9.0%, 7/1/2020 (b) | | | | 155,000 | | | | 157,131 | |
| Cablevision Systems Corp., 8.0%, 4/15/2020 | | | | 65,000 | | | | 70,850 | |
| Caesar's Entertainment Operating Co., Inc., 8.5%, 2/15/2020 | | | | 760,000 | | | | 716,300 | |
| Caesar's Operating Escrow LLC, 144A, 9.0%, 2/15/2020 | | | | 245,000 | | | | 233,363 | |
| Carlson Wagonlit BV, 144A, 6.875%, 6/15/2019 | | | | 215,000 | | | | 217,150 | |
| CCO Holdings LLC: | |
| 6.5%, 4/30/2021 | | | | 655,000 | | | | 682,837 | |
| 6.625%, 1/31/2022 | | | | 450,000 | | | | 469,125 | |
| 7.0%, 1/15/2019 | | | | 120,000 | | | | 127,200 | |
| 7.375%, 6/1/2020 | | | | 50,000 | | | | 54,375 | |
| 8.125%, 4/30/2020 | | | | 150,000 | | | | 163,875 | |
| CDR DB Sub, Inc., 144A, 7.75%, 10/15/2020 | | | | 230,000 | | | | 230,575 | |
| Cequel Communications Holdings I LLC: | | |
| 144A, 5.125%, 12/15/2021 | | | | 245,000 | | | | 230,300 | |
| 144A, 6.375%, 9/15/2020 | | | | 1,215,000 | | | | 1,236,262 | |
| Chester Downs & Marina LLC, 144A, 9.25%, 2/1/2020 (b) | | | | 145,000 | | | | 139,925 | |
| Clear Channel Communications, Inc., 144A, 11.25%, 3/1/2021 | | | | 280,000 | | | | 291,900 | |
| Clear Channel Worldwide Holdings, Inc.: | | |
| Series A, 144A, 6.5%, 11/15/2022 | | | | 250,000 | | | | 256,250 | |
| Series B, 144A, 6.5%, 11/15/2022 | | | | 365,000 | | | | 375,950 | |
| Series A, 7.625%, 3/15/2020 | | | | 110,000 | | | | 113,300 | |
| Series B, 7.625%, 3/15/2020 | | | | 1,115,000 | | | | 1,154,025 | |
| | | Principal Amount ($)(a) | | | Value ($) | |
| | | | | | | | | |
| Cogeco Cable, Inc., 144A, 4.875%, 5/1/2020 | | | | 20,000 | | | | 19,450 | |
| CSC Holdings LLC, 6.75%, 11/15/2021 | | | | 900,000 | | | | 969,750 | |
| Cumulus Media Holdings, Inc., 7.75%, 5/1/2019 (b) | | | | 375,000 | | | | 366,562 | |
| DISH DBS Corp.: | |
| 6.75%, 6/1/2021 | | | | 50,000 | | | | 53,125 | |
| 7.875%, 9/1/2019 | | | | 270,000 | | | | 302,400 | |
| Fontainebleau Las Vegas Holdings LLC, 144A, 11.0%, 6/15/2015* | | | | 490,000 | | | | 0 | |
| Griffey Intermediate, Inc., 144A, 7.0%, 10/15/2020 (b) | | | | 405,000 | | | | 390,825 | |
| Harron Communications LP, 144A, 9.125%, 4/1/2020 | | | | 395,000 | | | | 426,600 | |
| Hertz Corp., 6.75%, 4/15/2019 | | | | 305,000 | | | | 322,538 | |
| Hot Topic, Inc., 144A, 9.25%, 6/15/2021 | | | | 140,000 | | | | 141,750 | |
| Jo-Ann Stores Holdings, Inc., 144A, 9.75%, 10/15/2019 (PIK) | | | | 475,000 | | | | 488,062 | |
| Lear Corp., 8.125%, 3/15/2020 | | | | 184,000 | | | | 201,480 | |
| Libbey Glass, Inc., 6.875%, 5/15/2020 | | | | 117,000 | | | | 122,411 | |
| Lions Gate Entertainment, Inc., 144A, 10.25%, 11/1/2016 | | | | 540,000 | | | | 578,475 | |
| LKQ Corp., 144A, 4.75%, 5/15/2023 | | | | 290,000 | | | | 276,950 | |
| MDC Partners, Inc., 144A, 6.75%, 4/1/2020 | | | | 155,000 | | | | 154,613 | |
| Mediacom Broadband LLC, 6.375%, 4/1/2023 | | | | 425,000 | | | | 422,875 | |
| Mediacom LLC, 7.25%, 2/15/2022 | | | | 110,000 | | | | 115,775 | |
| MGM Resorts International: | |
| 6.625%, 12/15/2021 (b) | | | | 590,000 | | | | 608,437 | |
| 6.75%, 10/1/2020 (b) | | | | 170,000 | | | | 175,950 | |
| 7.625%, 1/15/2017 | | | | 560,000 | | | | 611,800 | |
| 8.625%, 2/1/2019 | | | | 840,000 | | | | 949,200 | |
| 10.0%, 11/1/2016 | | | | 225,000 | | | | 263,813 | |
| National CineMedia LLC, 6.0%, 4/15/2022 | | | | 200,000 | | | | 205,250 | |
| Norcraft Companies LP, 10.5%, 12/15/2015 | | | | 1,260,000 | | | | 1,307,250 | |
| Palace Entertainment Holdings LLC, 144A, 8.875%, 4/15/2017 | | | | 435,000 | | | | 448,050 | |
| Petco Animal Supplies, Inc., 144A, 9.25%, 12/1/2018 | | | | 315,000 | | | | 339,412 | |
| Petco Holdings, Inc., 144A, 8.5%, 10/15/2017 (PIK) | | | | 115,000 | | | | 117,300 | |
| Quebecor Media, Inc., 5.75%, 1/15/2023 | | | | 205,000 | | | | 199,875 | |
| Rent-A-Center, Inc., 144A, 4.75%, 5/1/2021 | | | | 145,000 | | | | 137,388 | |
| Schaeffler Finance BV: | |
| 144A, 4.75%, 5/15/2021 | | | | 260,000 | | | | 247,000 | |
| 144A, 7.75%, 2/15/2017 | | | | 420,000 | | | | 464,100 | |
| Seminole Hard Rock Entertainment, Inc., 144A, 5.875%, 5/15/2021 | | | | 125,000 | | | | 121,250 | |
| | | Principal Amount ($)(a) | | | Value ($) | |
| | | | | | | | | |
| Seminole Indian Tribe of Florida: | |
| 144A, 7.75%, 10/1/2017 | | | | 200,000 | | | | 212,500 | |
| 144A, 7.804%, 10/1/2020 | | | | 380,000 | | | | 400,900 | |
| Serta Simmons Holdings LLC, 144A, 8.125%, 10/1/2020 (b) | | | | 230,000 | | | | 234,025 | |
| SIWF Merger Sub, Inc., 144A, 6.25%, 6/1/2021 | | | | 295,000 | | | | 289,100 | |
| Starz LLC, 5.0%, 9/15/2019 | | | | 175,000 | | | | 173,688 | |
| Taylor Morrison Communities, Inc., 144A, 5.25%, 4/15/2021 (b) | | | | 250,000 | | | | 237,500 | |
| Travelport LLC: | |
| 144A, 6.4%**, 3/1/2016 | | | | 224,966 | | | | 210,343 | |
| 144A, 13.875%, 3/1/2016 (PIK) | | | | 50,625 | | | | 51,764 | |
| UCI International, Inc., 8.625%, 2/15/2019 | | | | 310,000 | | | | 316,200 | |
| Unitymedia Hessen GmbH & Co., KG: | | |
| 144A, 5.5%, 1/15/2023 | | | | 945,000 | | | | 893,025 | |
| 144A, 7.5%, 3/15/2019 | | | | 435,000 | | | | 457,837 | |
| Unitymedia KabelBW GmbH, 144A, 9.625%, 12/1/2019 | EUR | | | 550,000 | | | | 787,498 | |
| Univision Communications, Inc.: | | |
| 144A, 6.875%, 5/15/2019 | | | | 60,000 | | | | 63,000 | |
| 144A, 7.875%, 11/1/2020 | | | | 140,000 | | | | 151,550 | |
| Viking Cruises Ltd., 144A, 8.5%, 10/15/2022 | | | | 205,000 | | | | 224,475 | |
| Visant Corp., 10.0%, 10/1/2017 (b) | | | | 460,000 | | | | 424,350 | |
| Visteon Corp., 6.75%, 4/15/2019 | | | | 171,000 | | | | 179,978 | |
| Yonkers Racing Corp., 144A, 11.375%, 7/15/2016 | | | | 335,000 | | | | 353,844 | |
| | | | | 27,466,761 | |
| Consumer Staples 6.1% | |
| B&G Foods, Inc., 4.625%, 6/1/2021 | | | | 245,000 | | | | 233,975 | |
| Chiquita Brands International, Inc., 144A, 7.875%, 2/1/2021 | | | | 200,000 | | | | 209,500 | |
| Del Monte Corp., 7.625%, 2/15/2019 | | | | 410,000 | | | | 421,275 | |
| FAGE Dairy Industry SA, 144A, 9.875%, 2/1/2020 | | | | 810,000 | | | | 872,775 | |
| Hawk Acquisition Sub, Inc., 144A, 4.25%, 10/15/2020 | | | | 1,890,000 | | | | 1,807,312 | |
| JBS U.S.A. LLC, 144A, 8.25%, 2/1/2020 | | | | 160,000 | | | | 167,600 | |
| NBTY, Inc., 9.0%, 10/1/2018 | | | | 190,000 | | | | 206,625 | |
| Pilgrim's Pride Corp., 7.875%, 12/15/2018 | | | | 290,000 | | | | 308,850 | |
| Reynolds Group Issuer, Inc.: | |
| 5.75%, 10/15/2020 | | | | 405,000 | | | | 408,038 | |
| 6.875%, 2/15/2021 | | | | 540,000 | | | | 567,000 | |
| 7.125%, 4/15/2019 | | | | 415,000 | | | | 438,344 | |
| 8.25%, 2/15/2021 (b) | | | | 225,000 | | | | 222,750 | |
| 8.5%, 5/15/2018 (b) | | | | 455,000 | | | | 468,650 | |
| 9.875%, 8/15/2019 | | | | 125,000 | | | | 133,750 | |
| Smithfield Foods, Inc.: | |
| 6.625%, 8/15/2022 | | | | 385,000 | | | | 413,875 | |
| 7.75%, 7/1/2017 | | | | 1,180,000 | | | | 1,300,950 | |
| Sun Products Corp., 144A, 7.75%, 3/15/2021 | | | | 360,000 | | | | 357,300 | |
| | | Principal Amount ($)(a) | | | Value ($) | |
| | | | | | | | | |
| Tops Holding Corp., 144A, 8.875%, 12/15/2017 | | | | 100,000 | | | | 108,250 | |
| U.S. Foods, Inc., 8.5%, 6/30/2019 | | | | 400,000 | | | | 418,000 | |
| | | | | 9,064,819 | |
| Energy 12.7% | |
| Access Midstream Partners LP: | |
| 4.875%, 5/15/2023 | | | | 270,000 | | | | 250,425 | |
| 6.125%, 7/15/2022 | | | | 325,000 | | | | 329,062 | |
| Antero Resources Finance Corp.: | |
| 7.25%, 8/1/2019 | | | | 285,000 | | | | 297,113 | |
| 9.375%, 12/1/2017 | | | | 390,000 | | | | 413,400 | |
| Berry Petroleum Co.: | |
| 6.375%, 9/15/2022 | | | | 205,000 | | | | 204,231 | |
| 6.75%, 11/1/2020 | | | | 540,000 | | | | 558,900 | |
| BreitBurn Energy Partners LP: | |
| 7.875%, 4/15/2022 | | | | 205,000 | | | | 209,100 | |
| 8.625%, 10/15/2020 | | | | 225,000 | | | | 238,500 | |
| Chaparral Energy, Inc., 7.625%, 11/15/2022 | | | | 370,000 | | | | 377,400 | |
| Chesapeake Energy Corp., 5.75%, 3/15/2023 | | | | 100,000 | | | | 101,250 | |
| Chesapeake Oilfield Operating LLC, 144A, 6.625%, 11/15/2019 | | | | 150,000 | | | | 148,500 | |
| Continental Resources, Inc.: | |
| 144A, 4.5%, 4/15/2023 | | | | 60,000 | | | | 58,350 | |
| 5.0%, 9/15/2022 | | | | 180,000 | | | | 183,150 | |
| Crestwood Midstream Partners LP, 7.75%, 4/1/2019 | | | | 325,000 | | | | 334,750 | |
| Crosstex Energy LP, 7.125%, 6/1/2022 (b) | | | | 105,000 | | | | 106,050 | |
| Denbury Resources, Inc., 4.625%, 7/15/2023 | | | | 530,000 | | | | 488,925 | |
| Dresser-Rand Group, Inc., 6.5%, 5/1/2021 | | | | 420,000 | | | | 445,200 | |
| Eagle Rock Energy Partners LP, 8.375%, 6/1/2019 | | | | 410,000 | | | | 417,175 | |
| EP Energy LLC: | |
| 6.875%, 5/1/2019 | | | | 330,000 | | | | 353,100 | |
| 7.75%, 9/1/2022 (b) | | | | 175,000 | | | | 187,250 | |
| 9.375%, 5/1/2020 | | | | 150,000 | | | | 169,500 | |
| EPE Holdings LLC, 144A, 8.125%, 12/15/2017 (PIK) (b) | | | | 495,374 | | | | 505,281 | |
| EV Energy Partners LP, 8.0%, 4/15/2019 | | | | 835,000 | | | | 843,350 | |
| Frontier Oil Corp., 6.875%, 11/15/2018 | | | | 315,000 | | | | 337,837 | |
| Global Geophysical Services, Inc., 10.5%, 5/1/2017 | | | | 540,000 | | | | 469,800 | |
| Halcon Resources Corp.: | |
| 8.875%, 5/15/2021 | | | | 585,000 | | | | 567,450 | |
| 9.75%, 7/15/2020 | | | | 280,000 | | | | 279,300 | |
| Holly Energy Partners LP: | |
| 6.5%, 3/1/2020 | | | | 105,000 | | | | 105,788 | |
| 8.25%, 3/15/2018 | | | | 330,000 | | | | 348,975 | |
| Kodiak Oil & Gas Corp., 144A, 5.5%, 1/15/2021 (b) | | | | 265,000 | | | | 258,375 | |
| Linn Energy LLC: | |
| 144A, 6.25%, 11/1/2019 | | | | 595,000 | | | | 566,737 | |
| 6.5%, 5/15/2019 | | | | 115,000 | | | | 112,413 | |
| MEG Energy Corp.: | |
| 144A, 6.375%, 1/30/2023 | | | | 780,000 | | | | 756,600 | |
| 144A, 6.5%, 3/15/2021 | | | | 235,000 | | | | 232,944 | |
| | | Principal Amount ($)(a) | | | Value ($) | |
| | | | | | | | | |
| Memorial Production Partners LP, 144A, 7.625%, 5/1/2021 | | | | 355,000 | | | | 349,675 | |
| Midstates Petroleum Co., Inc.: | |
| 144A, 9.25%, 6/1/2021 | | | | 485,000 | | | | 455,900 | |
| 144A, 10.75%, 10/1/2020 | | | | 230,000 | | | | 231,150 | |
| Murray Energy Corp., 144A, 8.625%, 6/15/2021 | | | | 50,000 | | | | 50,000 | |
| Northern Oil & Gas, Inc., 8.0%, 6/1/2020 | | | | 595,000 | | | | 600,950 | |
| Oasis Petroleum, Inc.: | |
| 6.5%, 11/1/2021 | | | | 175,000 | | | | 179,375 | |
| 6.875%, 1/15/2023 | | | | 130,000 | | | | 133,900 | |
| 7.25%, 2/1/2019 | | | | 665,000 | | | | 693,262 | |
| Offshore Group Investment Ltd.: | | |
| 144A, 7.125%, 4/1/2023 | | | | 410,000 | | | | 402,825 | |
| 7.5%, 11/1/2019 (b) | | | | 580,000 | | | | 604,650 | |
| Pacific Drilling SA, 144A, 5.375%, 6/1/2020 | | | | 245,000 | | | | 229,075 | |
| Range Resources Corp., 5.0%, 3/15/2023 | | | | 105,000 | | | | 102,638 | |
| Regency Energy Partners LP, 144A, 4.5%, 11/1/2023 | | | | 95,000 | | | | 85,975 | |
| Sabine Pass Liquefaction LLC: | |
| 144A, 5.625%, 2/1/2021 | | | | 690,000 | | | | 669,300 | |
| 144A, 5.625%, 4/15/2023 | | | | 155,000 | | | | 146,475 | |
| SandRidge Energy, Inc., 7.5%, 3/15/2021 | | | | 515,000 | | | | 491,825 | |
| SESI LLC, 6.375%, 5/1/2019 | | | | 235,000 | | | | 242,638 | |
| Swift Energy Co., 7.875%, 3/1/2022 | | | | 290,000 | | | | 288,550 | |
| Talos Production LLC, 144A, 9.75%, 2/15/2018 | | | | 410,000 | | | | 389,500 | |
| Tesoro Corp., 5.375%, 10/1/2022 | | | | 150,000 | | | | 151,875 | |
| Venoco, Inc., 8.875%, 2/15/2019 | | | | 590,000 | | | | 575,250 | |
| WPX Energy, Inc., 5.25%, 1/15/2017 | | | | 510,000 | | | | 522,750 | |
| | | | | 18,853,719 | |
| Financials 4.4% | |
| AerCap Aviation Solutions BV, 6.375%, 5/30/2017 | | | | 470,000 | | | | 493,500 | |
| Ally Financial, Inc.: | |
| 5.5%, 2/15/2017 | | | | 385,000 | | | | 402,252 | |
| 8.0%, 3/15/2020 (b) | | | | 340,000 | | | | 394,825 | |
| CIT Group, Inc., 5.25%, 3/15/2018 | | | | 540,000 | | | | 554,850 | |
| E*TRADE Financial Corp.: | |
| 6.375%, 11/15/2019 | | | | 585,000 | | | | 593,775 | |
| 6.75%, 6/1/2016 | | | | 710,000 | | | | 729,525 | |
| Hellas Telecommunications Finance SCA, 144A, 8.21%**, 7/15/2015 (PIK)* | EUR | | | 322,107 | | | | 0 | |
| International Lease Finance Corp.: | | |
| 3.875%, 4/15/2018 | | | | 385,000 | | | | 361,900 | |
| 4.625%, 4/15/2021 | | | | 360,000 | | | | 331,200 | |
| 6.25%, 5/15/2019 | | | | 320,000 | | | | 328,800 | |
| 8.625%, 1/15/2022 (b) | | | | 310,000 | | | | 356,500 | |
| 8.75%, 3/15/2017 | | | | 245,000 | | | | 272,869 | |
| MPT Operating Partnership LP: | | |
| (REIT), 6.375%, 2/15/2022 | | | | 185,000 | | | | 194,250 | |
| (REIT), 6.875%, 5/1/2021 | | | | 295,000 | | | | 312,700 | |
| | | Principal Amount ($)(a) | | | Value ($) | |
| | | | | | | | | |
| National Money Mart Co., 10.375%, 12/15/2016 | | | | 790,000 | | | | 837,400 | |
| Neuberger Berman Group LLC: | | |
| 144A, 5.625%, 3/15/2020 | | | | 160,000 | | | | 165,600 | |
| 144A, 5.875%, 3/15/2022 | | | | 265,000 | | | | 270,300 | |
| | | | | 6,600,246 | |
| Health Care 5.0% | |
| Aviv Healthcare Properties LP, 7.75%, 2/15/2019 | | | | 500,000 | | | | 533,750 | |
| Biomet, Inc.: | |
| 6.5%, 8/1/2020 | | | | 355,000 | | | | 365,872 | |
| 6.5%, 10/1/2020 (b) | | | | 100,000 | | | | 99,750 | |
| Community Health Systems, Inc.: | | |
| 5.125%, 8/15/2018 | | | | 1,155,000 | | | | 1,172,325 | |
| 7.125%, 7/15/2020 | | | | 635,000 | | | | 654,050 | |
| Fresenius Medical Care U.S. Finance II, Inc.: | | |
| 144A, 5.625%, 7/31/2019 | | | | 220,000 | | | | 228,800 | |
| 144A, 5.875%, 1/31/2022 | | | | 195,000 | | | | 205,237 | |
| Fresenius U.S. Finance II, Inc., 144A, 9.0%, 7/15/2015 | | | | 420,000 | | | | 464,100 | |
| HCA, Inc.: | |
| 5.875%, 3/15/2022 | | | | 275,000 | | | | 282,219 | |
| 6.5%, 2/15/2020 | | | | 890,000 | | | | 962,869 | |
| 7.5%, 2/15/2022 | | | | 605,000 | | | | 670,037 | |
| Hologic, Inc., 6.25%, 8/1/2020 | | | | 200,000 | | | | 207,375 | |
| IMS Health, Inc., 144A, 6.0%, 11/1/2020 | | | | 250,000 | | | | 254,375 | |
| Physio-Control International, Inc., 144A, 9.875%, 1/15/2019 | | | | 315,000 | | | | 346,500 | |
| Sky Growth Acquisition Corp., 144A, 7.375%, 10/15/2020 | | | | 175,000 | | | | 179,375 | |
| STHI Holding Corp., 144A, 8.0%, 3/15/2018 | | | | 345,000 | | | | 372,600 | |
| Tenet Healthcare Corp.: | |
| 144A, 4.375%, 10/1/2021 | | | | 390,000 | | | | 357,825 | |
| 144A, 4.5%, 4/1/2021 | | | | 55,000 | | | | 51,288 | |
| | | | | 7,408,347 | |
| Industrials 10.2% | |
| Abengoa Finance SAU, 144A, 8.875%, 11/1/2017 | | | | 190,000 | | | | 176,700 | |
| Accuride Corp., 9.5%, 8/1/2018 | | | | 345,000 | | | | 351,037 | |
| Aguila 3 SA, 144A, 7.875%, 1/31/2018 | | | | 480,000 | | | | 494,400 | |
| Air Lease Corp.: | |
| 4.75%, 3/1/2020 (b) | | | | 315,000 | | | | 303,975 | |
| 6.125%, 4/1/2017 (b) | | | | 445,000 | | | | 460,575 | |
| Alphabet Holding Co., Inc., 7.75%, 11/1/2017 (PIK) | | | | 205,000 | | | | 210,125 | |
| Armored Autogroup, Inc., 9.25%, 11/1/2018 | | | | 610,000 | | | | 559,675 | |
| AWAS Aviation Capital Ltd., 144A, 7.0%, 10/17/2016 | | | | 391,400 | | | | 407,056 | |
| BakerCorp International, Inc., 8.25%, 6/1/2019 | | | | 335,000 | | | | 328,300 | |
| BE Aerospace, Inc., 6.875%, 10/1/2020 | | | | 180,000 | | | | 194,400 | |
| Belden, Inc., 144A, 5.5%, 9/1/2022 | | | | 355,000 | | | | 348,787 | |
| | | Principal Amount ($)(a) | | | Value ($) | |
| | | | | | | | | |
| Bombardier, Inc.: | |
| 144A, 5.75%, 3/15/2022 | | | | 430,000 | | | | 426,775 | |
| 144A, 6.125%, 1/15/2023 | | | | 315,000 | | | | 312,638 | |
| Casella Waste Systems, Inc., 7.75%, 2/15/2019 | | | | 415,000 | | | | 394,250 | |
| Clean Harbors, Inc., 5.125%, 6/1/2021 | | | | 240,000 | | | | 241,800 | |
| DigitalGlobe, Inc., 144A, 5.25%, 2/1/2021 | | | | 160,000 | | | | 153,600 | |
| Ducommun, Inc., 9.75%, 7/15/2018 | | | | 305,000 | | | | 333,212 | |
| DynCorp International, Inc., 10.375%, 7/1/2017 | | | | 490,000 | | | | 492,450 | |
| Florida East Coast Railway Corp., 8.125%, 2/1/2017 | | | | 225,000 | | | | 237,938 | |
| FTI Consulting, Inc., 144A, 6.0%, 11/15/2022 | | | | 205,000 | | | | 207,563 | |
| Garda World Security Corp., 144A, 9.75%, 3/15/2017 | | | | 400,000 | | | | 422,582 | |
| GenCorp, Inc., 144A, 7.125%, 3/15/2021 | | | | 790,000 | | | | 817,650 | |
| Huntington Ingalls Industries, Inc.: | | |
| 6.875%, 3/15/2018 | | | | 280,000 | | | | 299,250 | |
| 7.125%, 3/15/2021 (b) | | | | 60,000 | | | | 64,500 | |
| Interline Brands, Inc., 7.5%, 11/15/2018 | | | | 295,000 | | | | 309,750 | |
| Iron Mountain, Inc., 5.75%, 8/15/2024 | | | | 245,000 | | | | 229,688 | |
| Kenan Advantage Group, Inc., 144A, 8.375%, 12/15/2018 | | | | 410,000 | | | | 426,400 | |
| Meritor, Inc., 6.75%, 6/15/2021 | | | | 195,000 | | | | 186,225 | |
| Navios Maritime Holdings, Inc.: | |
| 8.125%, 2/15/2019 | | | | 410,000 | | | | 388,475 | |
| 8.875%, 11/1/2017 | | | | 210,000 | | | | 217,350 | |
| Navios South American Logistics, Inc.: | | |
| 9.25%, 4/15/2019 | | | | 295,000 | | | | 316,387 | |
| 144A, 9.25%, 4/15/2019 | | | | 55,000 | | | | 58,988 | |
| Nortek, Inc., 8.5%, 4/15/2021 | | | | 440,000 | | | | 470,800 | |
| Ply Gem Industries, Inc., 9.375%, 4/15/2017 | | | | 102,000 | | | | 107,865 | |
| Rexel SA, 144A, 5.25%, 6/15/2020 | | | | 275,000 | | | | 274,313 | |
| Sitel LLC, 11.5%, 4/1/2018 | | | | 565,000 | | | | 420,925 | |
| Spirit AeroSystems, Inc.: | |
| 6.75%, 12/15/2020 | | | | 205,000 | | | | 213,200 | |
| 7.5%, 10/1/2017 | | | | 215,000 | | | | 224,675 | |
| Titan International, Inc., 7.875%, 10/1/2017 | | | | 295,000 | | | | 309,750 | |
| TransDigm, Inc., 144A, 7.5%, 7/15/2021 (c) | | | | 320,000 | | | | 327,200 | |
| U.S. Airways Group, Inc., 6.125%, 6/1/2018 (b) | | | | 240,000 | | | | 226,800 | |
| United Rentals North America, Inc.: | | |
| 5.75%, 7/15/2018 | | | | 365,000 | | | | 383,250 | |
| 6.125%, 6/15/2023 | | | | 25,000 | | | | 24,875 | |
| 7.375%, 5/15/2020 | | | | 595,000 | | | | 635,162 | |
| 7.625%, 4/15/2022 | | | | 595,000 | | | | 644,087 | |
| Watco Companies LLC, 144A, 6.375%, 4/1/2023 | | | | 155,000 | | | | 154,225 | |
| Welltec AS, 144A, 8.0%, 2/1/2019 | | | | 400,000 | | | | 416,000 | |
| | | | | 15,205,628 | |
| | | Principal Amount ($)(a) | | | Value ($) | |
| | | | | | | | | |
| Information Technology 4.7% | |
| Alliance Data Systems Corp., 144A, 5.25%, 12/1/2017 | | | | 255,000 | | | | 262,650 | |
| CDW LLC, 8.5%, 4/1/2019 | | | | 1,180,000 | | | | 1,268,500 | |
| CyrusOne LP, 144A, 6.375%, 11/15/2022 | | | | 105,000 | | | | 107,625 | |
| eAccess Ltd., 144A, 8.25%, 4/1/2018 | | | | 335,000 | | | | 366,825 | |
| EarthLink, Inc., 144A, 7.375%, 6/1/2020 | | | | 245,000 | | | | 235,200 | |
| Equinix, Inc.: | |
| 4.875%, 4/1/2020 | | | | 275,000 | | | | 269,500 | |
| 5.375%, 4/1/2023 | | | | 725,000 | | | | 710,500 | |
| 7.0%, 7/15/2021 | | | | 215,000 | | | | 233,275 | |
| First Data Corp.: | |
| 144A, 6.75%, 11/1/2020 | | | | 940,000 | | | | 956,450 | |
| 144A, 7.375%, 6/15/2019 | | | | 250,000 | | | | 256,875 | |
| 144A, 8.875%, 8/15/2020 | | | | 495,000 | | | | 539,550 | |
| 144A, 10.625%, 6/15/2021 | | | | 420,000 | | | | 414,750 | |
| Freescale Semiconductor, Inc., 144A, 9.25%, 4/15/2018 | | | | 630,000 | | | | 678,825 | |
| Hughes Satellite Systems Corp.: | |
| 6.5%, 6/15/2019 | | | | 225,000 | | | | 238,500 | |
| 7.625%, 6/15/2021 | | | | 230,000 | | | | 244,375 | |
| IAC/InterActiveCorp., 144A, 4.75%, 12/15/2022 | | | | 215,000 | | | | 203,175 | |
| | | | | 6,986,575 | |
| Materials 8.4% | |
| APERAM: | |
| 144A, 7.375%, 4/1/2016 | | | | 215,000 | | | | 208,550 | |
| 144A, 7.75%, 4/1/2018 | | | | 260,000 | | | | 247,000 | |
| Axiall Corp., 144A, 4.875%, 5/15/2023 | | | | 65,000 | | | | 61,750 | |
| Berry Plastics Corp.: | |
| 9.5%, 5/15/2018 | | | | 390,000 | | | | 424,125 | |
| 9.75%, 1/15/2021 | | | | 460,000 | | | | 519,800 | |
| Bluescope Steel Ltd., 144A, 7.125%, 5/1/2018 | | | | 150,000 | | | | 152,250 | |
| BOE Intermediate Holding Corp., 144A, 9.0%, 11/1/2017 (PIK) | | | | 290,000 | | | | 278,400 | |
| BOE Merger Corp., 144A, 9.5%, 11/1/2017 (PIK) | | | | 410,000 | | | | 418,200 | |
| Clearwater Paper Corp., 7.125%, 11/1/2018 | | | | 390,000 | | | | 417,300 | |
| Crown Americas LLC, 6.25%, 2/1/2021 | | | | 50,000 | | | | 53,000 | |
| Eagle Spinco, Inc., 144A, 4.625%, 2/15/2021 | | | | 130,000 | | | | 124,800 | |
| Essar Steel Algoma, Inc.: | |
| 144A, 9.375%, 3/15/2015 | | | | 1,290,000 | | | | 1,225,500 | |
| 144A, 9.875%, 6/15/2015 | | | | 195,000 | | | | 150,150 | |
| Exopack Holding Corp., 10.0%, 6/1/2018 | | | | 230,000 | | | | 232,875 | |
| FMG Resources (August 2006) Pty Ltd.: | | |
| 144A, 6.0%, 4/1/2017 (b) | | | | 315,000 | | | | 306,337 | |
| 144A, 6.875%, 4/1/2022 (b) | | | | 65,000 | | | | 63,050 | |
| 144A, 7.0%, 11/1/2015 (b) | | | | 360,000 | | | | 363,600 | |
| 144A, 8.25%, 11/1/2019 (b) | | | | 270,000 | | | | 278,100 | |
| FQM Akubra, Inc.: | |
| 144A, 7.5%, 6/1/2021 | | | | 610,000 | | | | 584,075 | |
| 144A, 8.75%, 6/1/2020 | | | | 360,000 | | | | 368,100 | |
| | | Principal Amount ($)(a) | | | Value ($) | |
| | | | | | | | | |
| Hexion U.S. Finance Corp.: | |
| 6.625%, 4/15/2020 | | | | 95,000 | | | | 94,763 | |
| 8.875%, 2/1/2018 | | | | 530,000 | | | | 540,600 | |
| Huntsman International LLC: | |
| 4.875%, 11/15/2020 (b) | | | | 230,000 | | | | 227,125 | |
| 8.625%, 3/15/2020 | | | | 330,000 | | | | 358,875 | |
| 8.625%, 3/15/2021 (b) | | | | 335,000 | | | | 367,662 | |
| IAMGOLD Corp., 144A, 6.75%, 10/1/2020 | | | | 310,000 | | | | 261,950 | |
| Kaiser Aluminum Corp., 8.25%, 6/1/2020 | | | | 260,000 | | | | 287,950 | |
| Novelis, Inc., 8.375%, 12/15/2017 | | | | 85,000 | | | | 90,100 | |
| Packaging Dynamics Corp., 144A, 8.75%, 2/1/2016 | | | | 535,000 | | | | 540,350 | |
| Perstorp Holding AB, 144A, 8.75%, 5/15/2017 | | | | 200,000 | | | | 200,000 | |
| Polymer Group, Inc., 7.75%, 2/1/2019 | | | | 300,000 | | | | 312,000 | |
| PolyOne Corp., 144A, 5.25%, 3/15/2023 | | | | 590,000 | | | | 581,150 | |
| Rain CII Carbon LLC: | |
| 144A, 8.0%, 12/1/2018 | | | | 270,000 | | | | 276,750 | |
| 144A, 8.25%, 1/15/2021 | | | | 200,000 | | | | 200,000 | |
| Sealed Air Corp.: | |
| 144A, 5.25%, 4/1/2023 | | | | 50,000 | | | | 48,625 | |
| 144A, 8.125%, 9/15/2019 | | | | 150,000 | | | | 167,250 | |
| 144A, 8.375%, 9/15/2021 | | | | 150,000 | | | | 169,500 | |
| Tronox Finance LLC, 144A, 6.375%, 8/15/2020 (b) | | | | 255,000 | | | | 240,338 | |
| Viskase Companies, Inc., 144A, 9.875%, 1/15/2018 | | | | 940,000 | | | | 994,050 | |
| | | | | 12,436,000 | |
| Telecommunication Services 17.4% | |
| Altice Financing SA, 144A, 7.875%, 12/15/2019 (b) | | | | 235,000 | | | | 245,575 | |
| Altice Finco SA, 144A, 9.875%, 12/15/2020 | | | | 235,000 | | | | 251,450 | |
| CenturyLink, Inc., Series V, 5.625%, 4/1/2020 (b) | | | | 105,000 | | | | 106,050 | |
| Cincinnati Bell, Inc.: | |
| 8.25%, 10/15/2017 | | | | 1,020,000 | | | | 1,063,350 | |
| 8.375%, 10/15/2020 | | | | 1,030,000 | | | | 1,058,325 | |
| 8.75%, 3/15/2018 (b) | | | | 350,000 | | | | 350,437 | |
| CPI International, Inc., 8.0%, 2/15/2018 | | | | 260,000 | | | | 267,800 | |
| Cricket Communications, Inc., 7.75%, 10/15/2020 (b) | | | | 1,595,000 | | | | 1,531,200 | |
| Digicel Group Ltd.: | |
| 144A, 8.25%, 9/30/2020 | | | | 790,000 | | | | 817,650 | |
| 144A, 10.5%, 4/15/2018 | | | | 495,000 | | | | 524,700 | |
| Digicel Ltd.: | |
| 144A, 7.0%, 2/15/2020 | | | | 200,000 | | | | 202,000 | |
| 144A, 8.25%, 9/1/2017 | | | | 1,090,000 | | | | 1,133,600 | |
| ERC Ireland Preferred Equity Ltd., 144A, 7.69%**, 2/15/2017 (PIK)* | EUR | | | 709,137 | | | | 0 | |
| Frontier Communications Corp.: | | |
| 7.125%, 1/15/2023 | | | | 1,370,000 | | | | 1,363,150 | |
| 7.625%, 4/15/2024 | | | | 110,000 | | | | 110,275 | |
| 8.25%, 4/15/2017 | | | | 348,000 | | | | 391,500 | |
| 8.5%, 4/15/2020 | | | | 490,000 | | | | 540,225 | |
| 8.75%, 4/15/2022 | | | | 560,000 | | | | 610,400 | |
| | | Principal Amount ($)(a) | | | Value ($) | |
| | | | | | | | | |
| Intelsat Jackson Holdings SA: | |
| 144A, 5.5%, 8/1/2023 | | | | 625,000 | | | | 587,500 | |
| 144A, 6.625%, 12/15/2022 | | | | 245,000 | | | | 237,650 | |
| 7.25%, 10/15/2020 | | | | 1,230,000 | | | | 1,291,500 | |
| 7.5%, 4/1/2021 | | | | 1,150,000 | | | | 1,207,500 | |
| 8.5%, 11/1/2019 | | | | 580,000 | | | | 624,950 | |
| Intelsat Luxembourg SA: | |
| 144A, 7.75%, 6/1/2021 | | | | 670,000 | | | | 676,700 | |
| 144A, 8.125%, 6/1/2023 | | | | 105,000 | | | | 108,413 | |
| Level 3 Communications, Inc., 8.875%, 6/1/2019 (b) | | | | 55,000 | | | | 57,200 | |
| Level 3 Financing, Inc.: | |
| 7.0%, 6/1/2020 | | | | 750,000 | | | | 748,125 | |
| 8.125%, 7/1/2019 | | | | 670,000 | | | | 703,500 | |
| 8.625%, 7/15/2020 | | | | 510,000 | | | | 543,150 | |
| MetroPCS Wireless, Inc.: | |
| 6.625%, 11/15/2020 | | | | 705,000 | | | | 731,437 | |
| 144A, 6.625%, 4/1/2023 | | | | 245,000 | | | | 249,287 | |
| 7.875%, 9/1/2018 (b) | | | | 420,000 | | | | 447,300 | |
| Millicom International Cellular SA, 144A, 4.75%, 5/22/2020 | | | | 720,000 | | | | 684,187 | |
| NII Capital Corp., 7.625%, 4/1/2021 | | | | 305,000 | | | | 237,138 | |
| Pacnet Ltd., 144A, 9.25%, 11/9/2015 | | | | 434,000 | | | | 434,000 | |
| SBA Communications Corp., 144A, 5.625%, 10/1/2019 | | | | 200,000 | | | | 198,000 | |
| Sprint Nextel Corp.: | |
| 6.0%, 11/15/2022 (b) | | | | 365,000 | | | | 357,700 | |
| 9.125%, 3/1/2017 | | | | 310,000 | | | | 356,500 | |
| Syniverse Holdings, Inc., 9.125%, 1/15/2019 | | | | 130,000 | | | | 138,775 | |
| Telenet Finance V Luxembourg SCA: | | |
| 144A, 6.25%, 8/15/2022 | EUR | | | 235,000 | | | | 307,417 | |
| 144A, 6.75%, 8/15/2024 | EUR | | | 235,000 | | | | 309,834 | |
| tw telecom holdings, Inc., 5.375%, 10/1/2022 | | | | 280,000 | | | | 277,900 | |
| UPCB Finance III Ltd., 144A, 6.625%, 7/1/2020 | | | | 185,000 | | | | 191,475 | |
| UPCB Finance V Ltd., 144A, 7.25%, 11/15/2021 | | | | 230,000 | | | | 243,225 | |
| UPCB Finance VI Ltd., 144A, 6.875%, 1/15/2022 | | | | 300,000 | | | | 310,500 | |
| Wind Acquisition Finance SA: | |
| 144A, 6.5%, 4/30/2020 | | | | 195,000 | | | | 193,538 | |
| 144A, 7.25%, 2/15/2018 | | | | 410,000 | | | | 413,075 | |
| Windstream Corp.: | |
| 6.375%, 8/1/2023 (b) | | | | 265,000 | | | | 247,775 | |
| 7.0%, 3/15/2019 | | | | 430,000 | | | | 431,075 | |
| 7.5%, 6/1/2022 | | | | 170,000 | | | | 173,400 | |
| 7.5%, 4/1/2023 | | | | 420,000 | | | | 426,300 | |
| 7.75%, 10/15/2020 (b) | | | | 180,000 | | | | 186,300 | |
| 7.75%, 10/1/2021 | | | | 310,000 | | | | 320,850 | |
| 7.875%, 11/1/2017 | | | | 495,000 | | | | 543,262 | |
| 8.125%, 9/1/2018 | | | | 180,000 | | | | 191,700 | |
| | | | | 25,955,825 | |
| Utilities 2.2% | |
| AES Corp.: | |
| 4.875%, 5/15/2023 (b) | | | | 95,000 | | | | 88,588 | |
| 8.0%, 10/15/2017 | | | | 415,000 | | | | 466,875 | |
| 8.0%, 6/1/2020 | | | | 525,000 | | | | 598,500 | |
| | | Principal Amount ($)(a) | | | Value ($) | |
| | | | | | | | | |
| Calpine Corp.: | |
| 144A, 7.5%, 2/15/2021 | | | | 436,000 | | | | 465,430 | |
| 144A, 7.875%, 7/31/2020 | | | | 481,000 | | | | 521,885 | |
| Energy Future Holdings Corp., Series Q, 6.5%, 11/15/2024 | | | | 550,000 | | | | 376,750 | |
| Energy Future Intermediate Holding Co., LLC: | | |
| 10.0%, 12/1/2020 | | | | 125,000 | | | | 136,875 | |
| 11.0%, 10/1/2021 | | | | 451,000 | | | | 483,697 | |
| NRG Energy, Inc., 7.625%, 1/15/2018 | | | | 200,000 | | | | 214,000 | |
| | | | | 3,352,600 | |
Total Corporate Bonds (Cost $132,567,397) | | | | 133,330,520 | |
| | |
| Loan Participations and Assignments 0.2% | |
| Senior Loans** | |
| Alliance Mortgage Cycle Loan, Term Loan A, 9.5%, 6/15/2010* | | | 700,000 | | | | 0 | |
| Buffets, Inc., Letter of Credit, First Lien, LIBOR plus 9.25%, 4/22/2015* | | | 73,851 | | | | 34,525 | |
| WP Prism, Inc., Term Loan, 6.25%, 5/31/2018 | | | 230,000 | | | | 230,766 | |
Total Loan Participations and Assignments (Cost $1,004,047) | | | | 265,291 | |
| | |
| Convertible Bonds 1.8% | |
| Consumer Discretionary 0.5% | |
| Group 1 Automotive, Inc., 3.0%, 3/15/2020 | | | | 375,000 | | | | 679,219 | |
| Materials 1.3% | |
| GEO Specialty Chemicals, Inc., 144A, 7.5%, 3/31/2015 (PIK) | | | 1,297,793 | | | | 2,010,022 | |
Total Convertible Bonds (Cost $1,652,175) | | | | 2,689,241 | |
| | |
| Preferred Security 0.7% | |
| Materials | |
| Hercules, Inc., 6.5%, 6/30/2029 (Cost $756,443) | | | 1,135,000 | | | | 987,450 | |
| | | Units | | | Value ($) | |
| | | | |
| Other Investments 0.2% | |
| Consumer Discretionary | |
| AOT Bedding Super Holdings LLC* (d) (Cost $31,000) | | | 92 | | | | 319,939 | |
| | | Shares | | | Value ($) | |
| | | | |
| Common Stocks 0.1% | |
| Consumer Discretionary 0.0% | |
| Buffets Restaurants Holdings, Inc.* | | | 661 | | | | 4,131 | |
| Trump Entertainment Resorts, Inc.* | | | 45 | | | | 0 | |
| Vertis Holdings, Inc.* | | | 676 | | | | 0 | |
| | | | | | | | 4,131 | |
| Industrials 0.0% | |
| Congoleum Corp.* | | | 24,000 | | | | 0 | |
| Materials 0.1% | |
| GEO Specialty Chemicals, Inc.* | | | 24,225 | | | | 14,404 | |
| GEO Specialty Chemicals, Inc. 144A* | | | 2,206 | | | | 1,312 | |
| Wolverine Tube, Inc.* | | | 7,045 | | | | 127,656 | |
| | | | | | | | 143,372 | |
Total Common Stocks (Cost $480,469) | | | | 147,503 | |
| | |
| Preferred Stock 0.6% | |
| Financials | |
| Ally Financial, Inc. 144A, 7.0% (Cost $841,212) | | | 915 | | | | 869,736 | |
| | |
| Warrants 0.1% | |
| Consumer Discretionary 0.0% | |
| Reader's Digest Association, Inc., Expiration Date 2/19/2014* | | | 1,115 | | | | 0 | |
| Materials 0.1% | |
| GEO Specialty Chemicals, Inc., Expiration Date 3/31/2015* | | | 119,802 | | | | 70,336 | |
| Hercules Trust II, Expiration Date 3/31/2029* | | | 1,100 | | | | 14,554 | |
| | | | | | | | 84,890 | |
Total Warrants (Cost $244,286) | | | | 84,890 | |
| | |
| Securities Lending Collateral 7.7% | |
| Daily Assets Fund Institutional, 0.10% (e) (f) (Cost $11,538,751) | | | 11,538,751 | | | | 11,538,751 | |
| | |
| Cash Equivalents 3.6% | |
| Central Cash Management Fund, 0.07% (e) (Cost $5,364,651) | | | 5,364,651 | | | | 5,364,651 | |
| | | % of Net Assets | | | Value ($) | |
| | | | |
Total Investment Portfolio (Cost $154,480,431)† | | | 104.6 | | | | 155,597,972 | |
| Other Assets and Liabilities, Net | | | (4.6 | ) | | | (6,776,228 | ) |
| Net Assets | | | 100.0 | | | | 148,821,744 | |
The following table represents bonds and senior loans that are in default:
| Securities | | Coupon | | Maturity Date | Principal Amount | | | Cost ($) | | | Value ($) | |
| Alliance Mortgage Cycle Loan* | | | 9.5 | % | 6/15/2010 | USD | | | 700,000 | | | | 700,000 | | | | 0 | |
| Buffets, Inc.* | | LIBOR plus 9.25% | | 4/22/2015 | USD | | | 73,851 | | | | 72,410 | | | | 34,525 | |
| ERC Ireland Preferred Equity Ltd.* | | | 7.69 | % | 2/15/2017 | EUR | | | 709,137 | | | | 965,174 | | | | 0 | |
| Fontainebleau Las Vegas Holdings LLC* | | | 11.0 | % | 6/15/2015 | USD | | | 490,000 | | | | 490,000 | | | | 0 | |
| Hellas Telecommunications Finance SCA* | | | 8.21 | % | 7/15/2015 | EUR | | | 322,107 | | | | 92,199 | | | | 0 | |
| | | | | | | | | | | | | | 2,319,783 | | | | 34,525 | |
* Non-income producing security.
** Floating rate securities' yields vary with a designated market index or market rate, such as the coupon-equivalent of the U.S. Treasury Bill rate. These securities are shown at their current rate as of June 30, 2013.
† The cost for federal income tax purposes was $154,480,431. At June 30, 2013, net unrealized appreciation for all securities based on tax cost was $1,117,541. This consisted of aggregate gross unrealized appreciation for all securities in which there was an excess of value over tax cost of $6,013,629 and aggregate gross unrealized depreciation for all securities in which there was an excess of tax cost over value of $4,896,088.
(a) Principal amount stated in U.S. dollars unless otherwise noted.
(b) All or a portion of these securities were on loan (see Notes to Financial Statements). The value of securities loaned at June 30, 2013 amounted to $10,946,630, which is 7.4% of net assets.
(c) When-issued security.
(d) The Fund may purchase securities that are subject to legal or contractual restrictions on resale ("restricted securities"). Restricted securities are securities which have not been registered with the Securities and Exchange Commission under the Securities Act of 1933. The Fund may be unable to sell a restricted security and it may be more difficult to determine a market value for a restricted security. Moreover, if adverse market conditions were to develop during the period between the Fund's decision to sell a restricted security and the point at which the Fund is permitted or able to sell such security, the Fund might obtain a price less favorable than the price that prevailed when it decided to sell. This investment practice, therefore, could have the effect of increasing the level of illiquidity of the Fund. The future value of these securities is uncertain and there may be changes in the estimated value of these securities.
| Schedule of Restricted Securities | Acquisition Date | | Cost ($) | | | Value ($) | | | Value as % of Net Assets | |
| AOT Bedding Super Holdings LLC* | June 2010 | | | 31,000 | | | | 319,939 | | | | 0.21 | |
(e) Affiliated fund managed by Deutsche Investment Management Americas Inc. The rate shown is the annualized seven-day yield at period end.
(f) Represents collateral held in connection with securities lending. Income earned by the Fund is net of borrower rebates.
144A: Security exempt from registration under Rule 144A of the Securities Act of 1933. These securities may be resold in transactions exempt from registration, normally to qualified institutional buyers.
LIBOR: London Interbank Offered Rate
PIK: Denotes that all or a portion of the income is paid in-kind in the form of additional principal.
REIT: Real Estate Investment Trust
At June 30, 2013, open credit default swap contracts sold were as follows:
Effective/ Expiration Date | | Notional Amount ($) (g) | | | Fixed Cash Flows Received | | Underlying Debt Obligation/ Quality Rating (h) | | Value ($) | | | Upfront Payments Paid/ (Received) ($) | | | Unrealized Appreciation/ (Depreciation) ($) | |
12/20/2011 3/20/2017 | | | 370,000 | 1 | | | 5.0 | % | CIT Group, Inc., 5.5%, 2/15/2019, BB- | | | 46,152 | | | | 11,605 | | | | 34,547 | |
6/21/2010 9/20/2013 | | | 380,000 | 2 | | | 5.0 | % | Ford Motor Co., 6.5%, 8/1/2018, BBB- | | | 4,906 | | | | 4,658 | | | | 248 | |
6/21/2010 9/20/2013 | | | 1,230,000 | 3 | | | 5.0 | % | Ford Motor Co., 6.5%, 8/1/2018, BBB- | | | 15,878 | | | | (37,769 | ) | | | 53,647 | |
6/21/2010 9/20/2015 | | | 560,000 | 4 | | | 5.0 | % | Ford Motor Co., 6.5%, 8/1/2018, BBB- | | | 53,638 | | | | (9,983 | ) | | | 63,621 | |
6/21/2010 9/20/2015 | | | 175,000 | 5 | | | 5.0 | % | Ford Motor Co., 6.5%, 8/1/2018, BBB- | | | 16,761 | | | | (16,625 | ) | | | 33,386 | |
6/21/2010 9/20/2015 | | | 320,000 | 1 | | | 5.0 | % | Ford Motor Co., 6.5%, 8/1/2018, BBB- | | | 30,651 | | | | (27,749 | ) | | | 58,400 | |
6/21/2010 9/20/2015 | | | 100,000 | 3 | | | 5.0 | % | Ford Motor Co., 6.5%, 8/1/2018, BBB- | | | 9,578 | | | | (6,896 | ) | | | 16,474 | |
6/20/2011 9/20/2016 | | | 575,000 | 4 | | | 5.0 | % | Ford Motor Co., 6.5%, 8/1/2018, BBB- | | | 72,201 | | | | 34,268 | | | | 37,933 | |
3/21/2011 6/20/2016 | | | 1,085,000 | 6 | | | 5.0 | % | Ford Motor Credit Co., LLC, 5.0%, 5/15/2018, BBB- | | | 131,278 | | | | 77,305 | | | | 53,973 | |
6/20/2011 9/20/2016 | | | 440,000 | 6 | | | 5.0 | % | Forest Oil Corp., 7.25%, 6/15/2019, B | | | (4,828 | ) | | | 10,570 | | | | (15,398 | ) |
9/20/2011 12/20/2016 | | | 250,000 | 6 | | | 5.0 | % | Forest Oil Corp., 7.25%, 6/15/2019, B | | | (5,438 | ) | | | (3,390 | ) | | | (2,048 | ) |
9/20/2011 12/20/2016 | | | 165,000 | 3 | | | 5.0 | % | Forest Oil Corp., 7.25%, 6/15/2019, B | | | (3,589 | ) | | | (2,238 | ) | | | (1,351 | ) |
9/20/2012 12/20/2017 | | | 485,000 | 7 | | | 5.0 | % | General Motors Corp., 3.3%, 12/20/2017, BB+ | | | 60,315 | | | | 32,246 | | | | 28,069 | |
6/20/2011 9/20/2015 | | | 1,145,000 | 3 | | | 5.0 | % | HCA, Inc., 6.375%, 1/15/2015, B- | | | 99,058 | | | | 32,403 | | | | 66,655 | |
3/21/2011 6/20/2016 | | | 610,000 | 5 | | | 5.0 | % | HCA, Inc., 6.375%, 1/15/2015, B- | | | 59,237 | | | | 13,570 | | | | 45,667 | |
| Total net unrealized appreciation | | | | 473,823 | |
(g) The maximum potential amount of future undiscounted payments that the Fund could be required to make under a credit default swap contract would be the notional amount of the contract. These potential amounts would be partially offset by any recovery values of the referenced debt obligation or net amounts received from the settlement of buy protection credit default swap contracts entered into by the Fund for the same referenced debt obligation, if any.
(h) The quality ratings represent the higher of Moody's Investors Service, Inc. ("Moody's") or Standard & Poor's Corporation ("S&P") credit ratings and are unaudited.
Counterparties:
1 Credit Suisse
2 Citigroup, Inc.
3 The Goldman Sachs & Co.
4 Bank of America
5 JPMorgan Chase Securities, Inc.
6 Barclays Bank PLC
7 UBS AG
At June 30, 2013, the Fund had the following open forward foreign currency exchange contracts:
| Contracts to Deliver | | In Exchange For | | Settlement Date | | Unrealized Appreciation ($) | | Counterparty |
| EUR | | | 1,090,440 | | USD | | | 1,453,915 | | 7/19/2013 | | | 34,434 | | Citigroup, Inc. |
| Currency Abbreviations |
EUR Euro USD United States Dollar |
For information on the Fund's policy and additional disclosures regarding credit default swap contracts and forward foreign currency exchange contracts, please refer to Note B in the accompanying Notes to Financial Statements.
Fair Value Measurements
Various inputs are used in determining the value of the Fund's investments. These inputs are summarized in three broad levels. Level 1 includes quoted prices in active markets for identical securities. Level 2 includes other significant observable inputs (including quoted prices for similar securities, interest rates, prepayment speeds, and credit risk). Level 3 includes significant unobservable inputs (including the Fund's own assumptions in determining the fair value of investments). The inputs or methodology used for valuing securities are not necessarily an indication of the risk associated with investing in those securities.
The following is a summary of the inputs used as of June 30, 2013 in valuing the Fund's investments. For information on the Fund's policy regarding the valuation of investments, please refer to the Security Valuation section of Note A in the accompanying Notes to Financial Statements.
| Assets | | Level 1 | | | Level 2 | | | Level 3 | | | Total | |
| | |
Fixed Income Investments (i) | |
| Corporate Bonds | | $ | — | | | $ | 133,330,520 | | | $ | 0 | | | $ | 133,330,520 | |
| Loan Participations and Assignments | | | — | | | | 265,291 | | | | 0 | | | | 265,291 | |
| Convertible Bonds | | | — | | | | 679,219 | | | | 2,010,022 | | | | 2,689,241 | |
| Preferred Security | | | — | | | | 987,450 | | | | — | | | | 987,450 | |
| Other Investments | | | — | | | | — | | | | 319,939 | | | | 319,939 | |
| Common Stocks (i) | | | — | | | | 4,131 | | | | 143,372 | | | | 147,503 | |
| Preferred Stock | | | — | | | | 869,736 | | | | — | | | | 869,736 | |
| Warrants (i) | | | — | | | | — | | | | 84,890 | | | | 84,890 | |
| Short-Term Investments (i) | | | 16,903,402 | | | | — | | | | — | | | | 16,903,402 | |
| Derivatives (j) | |
| Credit Default Swap Contracts | | | — | | | | 492,620 | | | | — | | | | 492,620 | |
| Forward Foreign Currency Exchange Contracts | | | — | | | | 34,434 | | | | — | | | | 34,434 | |
| Total | | $ | 16,903,402 | | | $ | 136,663,401 | | | $ | 2,558,223 | | | $ | 156,125,026 | |
| Liabilities | |
| Derivatives (j) | |
| Credit Default Swap Contracts | | $ | — | | | $ | (18,797 | ) | | $ | — | | | $ | (18,797 | ) |
| Total | | $ | — | | | $ | (18,797 | ) | | $ | — | | | $ | (18,797 | ) |
During the period ended June 30, 2013, the amount of transfers between Level 2 and Level 3 was $306. Investments were transferred from Level 2 to Level 3 because of the lack of observable market data due to a decrease in market activity.
Transfers between price levels are recognized at the beginning of the reporting period.
(i) See Investment Portfolio for additional detailed categorizations.
(j) Derivatives include unrealized appreciation (depreciation) on credit default swap contracts and forward foreign currency exchange contracts.
Level 3 Reconciliation
The following is a reconciliation of the Fund's Level 3 investments for which significant unobservable inputs were used in determining value:
| | | Corporate Bonds | | | Loan Participations and Assignments | | | Convertible Bonds | | | Other Investments | | | Common Stocks | | | Warrants | | | Total | |
| Balance as of December 31, 2012 | | $ | 155,602 | | | $ | 0 | | | $ | 1,538,014 | | | $ | 107,806 | | | $ | 139,682 | | | $ | 63,227 | | | $ | 2,004,331 | |
| Realized gains (loss) | | | 6,235 | | | | — | | | | — | | | | — | | | | — | | | | — | | | | 6,235 | |
| Change in unrealized appreciation (depreciation) | | | (4,853 | ) | | | 0 | | | | 466,539 | | | | 212,133 | | | | 3,690 | | | | 21,663 | | | | 699,172 | |
| Amortization of premium/accretion of discount | | | 1,650 | | | | — | | | | 5,469 | | | | — | | | | — | | | | — | | | | 7,119 | |
| Purchases | | | 4,768 | | | | — | | | | — | | | | — | | | | — | | | | — | | | | 4,768 | |
| (Sales) | | | (163,708 | ) | | | — | | | | — | | | | — | | | | — | | | | — | | | | (163,708 | ) |
| Transfers into Level 3 | | | 306 | | | | — | | | | — | | | | — | | | | — | | | | — | | | | 306 | |
| Transfers (out) of Level 3 | | | — | | | | — | | | | — | | | | — | | | | — | | | | — | | | | — | |
| Balance as of June 30, 2013 | | $ | 0 | | | $ | 0 | | | $ | 2,010,022 | | | $ | 319,939 | | | $ | 143,372 | | | $ | 84,890 | | | $ | 2,558,223 | |
| Net change in unrealized appreciation (depreciation) from investments still held as of June 30, 2013 | | $ | (4,853 | ) | | $ | 0 | | | $ | 466,539 | | | $ | 212,133 | | | $ | 3,690 | | | $ | 21,663 | | | $ | 699,172 | |
| Quantitative Disclosure About Significant Unobservable Inputs | |
| Asset Class | | Fair Value at 6/30/13 | | Valuation Technique(s) | Unobservable Input | | Range (Weighted Average) | |
| Other Investments | |
| Consumer Discretionary | | $ | 319,939 | | Acquisition Value | Acquisition Value | | 3,477.60 per share | |
| Discount for Lack of Marketability | | | 20 | % |
| Common Stocks | |
| Consumer Discretionary | | $ | 0 | | Asset Valuation | Book Value of Equity | | | 0 | |
| | | $ | 0 | | Asset Valuation | Book Value of Equity | | | 0 | |
| Industrials | | $ | 0 | | Asset Valuation | Book Value of Equity | | | 0 | |
| Materials | | $ | 143,372 | | Market Approach | EV/EBITDA Multiple | | | 5.65-6.55 | (6.48) |
| Discount for Lack of Marketability | | | 25-45 | % |
| Warrants | |
| Consumer Discretionary | | $ | 0 | | Asset Valuation | Book Value of Equity | | | 0 | |
| Materials | | $ | 14,554 | | Black Scholes Option Pricing Model | Implied Volatility | | | 35 | % |
| Discount for Lack of Marketability | | | 20 | % |
| | $ | 70,336 | | Market Approach | EV/EBITDA Multiple | | | 5.65 | |
| Discount for Lack of Marketability | | | 45 | % |
| Loan Participations & Assignments | |
| Senior Loans | | $ | 0 | | Market Approach | Evaluated by Management | | | 0 | |
| Corporate Bonds | |
| Consumer Discretionary | | $ | 0 | | Asset Valuation | Book Value of Equity | | | 0 | |
| Financials | | $ | 0 | | Asset Valuation | Book Value of Equity | | | 0 | |
| Convertible Bonds | |
| | | $ | 2,010,022 | | Convertible Bond Methodology | EV/EBITDA Multiple | | | 5.65 | |
| Discount to Public Comparable | | | 20 | % |
| Discount for Lack of Marketability | | | 25 | % |
Qualitative Disclosure About Unobservable Inputs
Significant unobservable inputs developed by the Pricing Committee and used in the fair value measurement of the Fund's equity investments include enterprise value (EV) to earnings before interest, taxes, depreciation and amortization (EBITDA) ratio with a discount for lack of marketability. A significant change in the EV to EBITDA ratio may result in a significant change in the fair value measurement, while a significant change in the discount for lack of marketability is unlikely to result in a materially higher or lower fair value measurement.
Significant unobservable inputs developed by the Pricing Committee and used in the fair value measurement of the Fund's fixed income investments include the convertible bond valuation methodology. A significant change in the value of the underlying private equity could have a material change on the fair value measurement of the convertible bond, while a significant change in the discount for lack of marketability is unlikely to result in a materially higher or lower fair value measurement.
The accompanying notes are an integral part of the financial statements.
Statement of Assets and Liabilities | as of June 30, 2013 (Unaudited) | |
| Assets | |
Investments: Investments in non-affiliated securities, at value (cost $137,577,029) — including $10,946,630 of securities loaned | | $ | 138,694,570 | |
| Investment in Daily Assets Fund Institutional (cost $11,538,751)* | | | 11,538,751 | |
| Investment in Central Cash Management Fund (cost $5,364,651) | | | 5,364,651 | |
| Total investments in securities, at value (cost $154,480,431) | | | 155,597,972 | |
| Foreign currency, at value (cost $9) | | | 9 | |
| Deposit from broker on swap contracts | | | 140,000 | |
| Receivable for investments sold | | | 2,340,545 | |
| Receivable for Fund shares sold | | | 2,448 | |
| Interest receivable | | | 2,574,424 | |
| Unrealized appreciation on swap contracts | | | 492,620 | |
| Unrealized appreciation on forward foreign currency exchange contracts | | | 34,434 | |
| Upfront payments paid on swap contracts | | | 216,625 | |
| Due from Advisor | | | 100 | |
| Other assets | | | 1,113 | |
| Total assets | | | 161,400,290 | |
| Liabilities | |
| Cash overdraft | | | 157,171 | |
| Payable upon return of securities loaned | | | 11,538,751 | |
| Payable for investments purchased — when-issued/delayed delivery security | | | 320,000 | |
| Payable for Fund shares redeemed | | | 145,381 | |
| Payable upon return of deposit for swap contracts | | | 140,000 | |
| Unrealized depreciation on swap contracts | | | 18,797 | |
| Upfront payments received on swap contracts | | | 104,650 | |
| Accrued management fee | | | 63,185 | |
| Accrued Trustees' fees | | | 856 | |
| Other accrued expenses and payables | | | 89,755 | |
| Total liabilities | | | 12,578,546 | |
| Net assets, at value | | $ | 148,821,744 | |
| Net Assets Consist of | |
| Undistributed net investment income | | | 4,450,264 | |
Net unrealized appreciation (depreciation) on: Investments | | | 1,117,541 | |
| Swap contracts | | | 473,823 | |
| Foreign currency | | | 34,300 | |
| Accumulated net realized gain (loss) | | | (41,246,261 | ) |
| Paid-in capital | | | 183,992,077 | |
| Net assets, at value | | $ | 148,821,744 | |
Class A Net Asset Value, offering and redemption price per share ($148,734,774 ÷ 22,629,085 outstanding shares of beneficial interest, no par value, unlimited number of shares authorized) | | $ | 6.57 | |
Class B Net Asset Value, offering and redemption price per share ($86,970 ÷ 13,144 outstanding shares of beneficial interest, no par value, unlimited number of shares authorized) | | $ | 6.62 | |
* Represents collateral on securities loaned.
The accompanying notes are an integral part of the financial statements.
| for the six months ended June 30, 2013 (Unaudited) | |
| Investment Income | |
| Interest | | $ | 5,706,401 | |
| Dividends | | | 30,188 | |
| Income distributions — Central Cash Management Fund | | | 6,557 | |
| Securities lending income, including income from Daily Assets Fund Institutional, net of borrower rebates | | | 19,159 | |
| Total income | | | 5,762,305 | |
Expenses: Management fee | | | 433,284 | |
| Administration fee | | | 86,657 | |
| Distribution service fee (Class B) | | | 119 | |
| Recordkeeping fees (Class B) | | | 2 | |
| Services to shareholders | | | 1,111 | |
| Custodian fee | | | 14,542 | |
| Audit and tax fees | | | 36,140 | |
| Legal fees | | | 7,625 | |
| Reports to shareholders | | | 19,850 | |
| Trustees' fees and expenses | | | 4,435 | |
| Other | | | 23,455 | |
| Total expenses before expense reductions | | | 627,220 | |
| Expense reductions | | | (1,150 | ) |
| Total expenses after expense reductions | | | 626,070 | |
| Net investment income (loss) | | | 5,136,235 | |
| Realized and Unrealized Gain (Loss) | |
Net realized gain (loss) from: Investments | | | 2,160,665 | |
| Swap contracts | | | 923,458 | |
| Foreign currency | | | 15,692 | |
| | | | 3,099,815 | |
Change in net unrealized appreciation (depreciation) on: Investments | | | (4,393,943 | ) |
| Swap contracts | | | (61,674 | ) |
| Foreign currency | | | 20,989 | |
| | | | (4,434,628 | ) |
| Net gain (loss) | | | (1,334,813 | ) |
| Net increase (decrease) in net assets resulting from operations | | $ | 3,801,422 | |
The accompanying notes are an integral part of the financial statements.
Statement of Changes in Net Assets | Increase (Decrease) in Net Assets | | Six Months Ended June 30, 2013 (Unaudited) | | | Year Ended December 31, 2012 | |
Operations: Net investment income | | $ | 5,136,235 | | | $ | 11,527,855 | |
| Net realized gain (loss) | | | 3,099,815 | | | | 1,543,250 | |
| Change in net unrealized appreciation (depreciation) | | | (4,434,628 | ) | | | 10,498,123 | |
| Net increase (decrease) in net assets resulting from operations | | | 3,801,422 | | | | 23,569,228 | |
Distributions to shareholders from: Net investment income: Class A | | | (12,380,542 | ) | | | (13,517,771 | ) |
| Class B | | | (6,491 | ) | | | (7,507 | ) |
| Total distributions | | | (12,387,033 | ) | | | (13,525,278 | ) |
Fund share transactions: Class A Proceeds from shares sold | | | 4,194,515 | | | | 49,009,407 | |
| Reinvestment of distributions | | | 12,380,542 | | | | 13,517,771 | |
| Payments for shares redeemed | | | (37,570,438 | ) | | | (63,694,430 | ) |
| Net increase (decrease) in net assets from Class A share transactions | | | (20,995,381 | ) | | | (1,167,252 | ) |
Class B Proceeds from shares sold | | | 46,462 | | | | 8,301 | |
| Reinvestment of distributions | | | 6,491 | | | | 7,507 | |
| Payments for shares redeemed | | | (52,815 | ) | | | (13,053 | ) |
| Net increase (decrease) in net assets from Class B share transactions | | | 138 | | | | 2,755 | |
| Increase (decrease) in net assets | | | (29,580,854 | ) | | | 8,879,453 | |
| Net assets at beginning of period | | | 178,402,598 | | | | 169,523,145 | |
| Net assets at end of period (including undistributed net investment income of $4,450,264 and $11,701,062, respectively) | | $ | 148,821,744 | | | $ | 178,402,598 | |
| Other Information | |
Class A Shares outstanding at beginning of period | | | 25,717,511 | | | | 25,818,935 | |
| Shares sold | | | 600,530 | | | | 7,431,954 | |
| Shares issued to shareholders in reinvestment of distributions | | | 1,834,154 | | | | 2,118,773 | |
| Shares redeemed | | | (5,523,110 | ) | | | (9,652,151 | ) |
| Net increase (decrease) in Class A shares | | | (3,088,426 | ) | | | (101,424 | ) |
| Shares outstanding at end of period | | | 22,629,085 | | | | 25,717,511 | |
Class B Shares outstanding at beginning of period | | | 13,214 | | | | 12,847 | |
| Shares sold | | | 6,708 | | | | 1,197 | |
| Shares issued to shareholders in reinvestment of distributions | | | 955 | | | | 1,168 | |
| Shares redeemed | | | (7,733 | ) | | | (1,998 | ) |
| Net increase (decrease) in Class B shares | | | (70 | ) | | | 367 | |
| Shares outstanding at end of period | | | 13,144 | | | | 13,214 | |
The accompanying notes are an integral part of the financial statements.
| | | | | | Years Ended December 31, | |
| Class A | | Six Months Ended 6/30/13 (Unaudited) | | | 2012 | | | 2011 | | | 2010 | | | 2009 | | | 2008 | |
| Selected Per Share Data | |
| Net asset value, beginning of period | | $ | 6.93 | | | $ | 6.56 | | | $ | 6.90 | | | $ | 6.55 | | | $ | 5.30 | | | $ | 7.81 | |
Income (loss) from investment operations: Net investment incomea | | | .20 | | | | .45 | | | | .51 | | | | .52 | | | | .51 | | | | .57 | |
| Net realized and unrealized gain (loss) | | | (.06 | ) | | | .48 | | | | (.24 | ) | | | .36 | | | | 1.40 | | | | (2.29 | ) |
| Total from investment operations | | | .14 | | | | .93 | | | | .27 | | | | .88 | | | | 1.91 | | | | (1.72 | ) |
Less distributions from: Net investment income | | | (.50 | ) | | | (.56 | ) | | | (.61 | ) | | | (.53 | ) | | | (.66 | ) | | | (.79 | ) |
| Net asset value, end of period | | $ | 6.57 | | | $ | 6.93 | | | $ | 6.56 | | | $ | 6.90 | | | $ | 6.55 | | | $ | 5.30 | |
| Total Return (%) | | | 1.87 | b** | | | 14.91 | | | | 3.84 | | | | 14.00 | | | | 39.99 | | | | (23.94 | )b |
| Ratios to Average Net Assets and Supplemental Data | |
| Net assets, end of period ($ millions) | | | 149 | | | | 178 | | | | 169 | | | | 195 | | | | 197 | | | | 154 | |
| Ratio of expenses before expense reductions (%) | | | .72 | * | | | .72 | | | | .72 | | | | .72 | | | | .67 | | | | .80 | |
| Ratio of expenses after expense reductions (%) | | | .72 | * | | | .72 | | | | .72 | | | | .72 | | | | .67 | | | | .79 | |
| Ratio of net investment income (%) | | | 5.93 | * | | | 6.68 | | | | 7.59 | | | | 7.90 | | | | 8.81 | | | | 8.42 | |
| Portfolio turnover rate (%) | | | 29 | ** | | | 58 | | | | 59 | | | | 93 | | | | 66 | | | | 38 | |
a Based on average shares outstanding during the period. b Total return would have been lower had certain expenses not been reduced. * Annualized ** Not annualized | |
| | | | | | Years Ended December 31, | |
| Class B | | Six Months Ended 6/30/13 (Unaudited) | | | 2012 | | | 2011 | | | 2010 | | | 2009 | | | 2008 | |
| Selected Per Share Data | |
| Net asset value, beginning of period | | $ | 6.97 | | | $ | 6.59 | | | $ | 6.93 | | | $ | 6.58 | | | $ | 5.31 | | | $ | 7.81 | |
Income (loss) from investment operations: Net investment incomea | | | .20 | | | | .43 | | | | .49 | | | | .50 | | | | .49 | | | | .53 | |
| Net realized and unrealized gain (loss) | | | (.06 | ) | | | .49 | | | | (.24 | ) | | | .36 | | | | 1.42 | | | | (2.27 | ) |
| Total from investment operations | | | .14 | | | | .92 | | | | .25 | | | | .86 | | | | 1.91 | | | | (1.74 | ) |
Less distributions from: Net investment income | | | (.49 | ) | | | (.54 | ) | | | (.59 | ) | | | (.51 | ) | | | (.64 | ) | | | (.76 | ) |
| Net asset value, end of period | | $ | 6.62 | | | $ | 6.97 | | | $ | 6.59 | | | $ | 6.93 | | | $ | 6.58 | | | $ | 5.31 | |
| Total Return (%) | | | 1.75 | b** | | | 14.70 | b | | | 3.57 | | | | 13.64 | | | | 39.64 | | | | (24.13 | )b |
| Ratios to Average Net Assets and Supplemental Data | |
| Net assets, end of period ($ millions) | | | .1 | | | | .1 | | | | .1 | | | | .1 | | | | .2 | | | | .1 | |
| Ratio of expenses before expense reductions (%) | | | 1.00 | * | | | .99 | | | | .99 | | | | .99 | | | | .94 | | | | 1.25 | |
| Ratio of expenses after expense reductions (%) | | | .97 | * | | | .99 | | | | .99 | | | | .99 | | | | .94 | | | | 1.23 | |
| Ratio of net investment income (%) | | | 5.67 | * | | | 6.42 | | | | 7.33 | | | | 7.63 | | | | 8.54 | | | | 7.98 | |
| Portfolio turnover rate (%) | | | 29 | ** | | | 58 | | | | 59 | | | | 93 | | | | 66 | | | | 38 | |
a Based on average shares outstanding during the period. b Total return would have been lower had certain expenses not been reduced. * Annualized ** Not annualized | |
Notes to Financial Statements (Unaudited)
A. Organization and Significant Accounting Policies
DWS High Income VIP (the "Fund") is a diversified series of DWS Variable Series II (the "Trust"), which is registered under the Investment Company Act of 1940, as amended (the "1940 Act"), as an open-end management investment company organized as a Massachusetts business trust.
Multiple Classes of Shares of Beneficial Interest. The Fund offers two classes of shares (Class A shares and Class B shares). Sales of Class B shares are subject to Rule 12b-1 fees under the 1940 Act equal to an annual rate of 0.25% of the average daily net assets of the Class B shares of the Fund. Class A shares are not subject to such fees.
Investment income, realized and unrealized gains and losses, and certain fund-level expenses and expense reductions, if any, are borne pro rata on the basis of relative net assets by the holders of all classes of shares except that each class bears certain expenses unique to that class (including the applicable Rule 12b-1 fee and recordkeeping fees). Differences in class-level expenses may result in payment of different per share dividends by class. All shares have equal rights with respect to voting subject to class-specific arrangements.
The Fund's financial statements are prepared in accordance with accounting principles generally accepted in the United States of America which require the use of management estimates. Actual results could differ from those estimates. The policies described below are followed consistently by the Fund in the preparation of its financial statements.
Security Valuation. Investments are stated at value determined as of the close of regular trading on the New York Stock Exchange on each day the exchange is open for trading.
Various inputs are used in determining the value of the Fund's investments. These inputs are summarized in three broad levels. Level 1 includes quoted prices in active markets for identical securities. Level 2 includes other significant observable inputs (including quoted prices for similar securities, interest rates, prepayment speeds, and credit risk). Level 3 includes significant unobservable inputs (including the Fund's own assumptions in determining the fair value of investments). The inputs or methodology used for valuing securities are not necessarily an indication of the risk associated with investing in those securities.
Debt securities and loan participations and assignments are valued at prices supplied by independent pricing services approved by the Fund's Board. If the pricing services are unable to provide valuations, securities are valued at the most recent bid quotation or evaluated price, as applicable, obtained from one or more broker-dealers. Such services may use various pricing techniques which take into account appropriate factors such as yield, quality, coupon rate, maturity, type of issue, trading characteristics and other data, as well as broker quotes. These securities are generally categorized as Level 2.
Equity securities are valued at the most recent sale price or official closing price reported on the exchange (U.S. or foreign) or over-the-counter market on which they trade and are categorized as Level 1 securities. Securities for which no sales are reported are valued at the calculated mean between the most recent bid and asked quotations on the relevant market or, if a mean cannot be determined, at the most recent bid quotation.
Investments in open-end investment companies are valued at their net asset value each business day and are categorized as Level 1.
Forward currency contracts are valued at the prevailing forward exchange rate of the underlying currencies and are categorized as Level 2.
Swap contracts are valued daily based upon prices supplied by a Board approved pricing vendor, if available, and otherwise are valued at the price provided by the broker-dealer. Swap contracts are generally categorized as Level 2.
Securities and other assets for which market quotations are not readily available or for which the above valuation procedures are deemed not to reflect fair value are valued in a manner that is intended to reflect their fair value as determined in accordance with procedures approved by the Board and are generally categorized as Level 3. In accordance with the Fund's valuation procedures, factors used in determining value may include, but are not limited to, the type of the security; the size of the holding; the initial cost of the security; the existence of any contractual restrictions on the security's disposition; the price and extent of public trading in similar securities of the issuer or of comparable companies; quotations or evaluated prices from broker-dealers and/or pricing services; information obtained from the issuer, analysts, and/or the appropriate stock exchange (for exchange-traded securities); an analysis of the company's or issuer's financial statements; an evaluation of the forces that influence the issuer and the market(s) in which the security is purchased and sold and with respect to debt securities; the maturity, coupon, creditworthiness, currency denomination and the movement of the market in which the security is normally traded. The value determined under these procedures may differ from published values for the same securities.
Disclosure about the classification of fair value measurements is included in a table following the Fund's Investment Portfolio.
Foreign Currency Translations. The books and records of the Fund are maintained in U.S. dollars. Investment securities and other assets and liabilities denominated in a foreign currency are translated into U.S. dollars at the prevailing exchange rates at period end. Purchases and sales of investment securities, income and expenses are translated into U.S. dollars at the prevailing exchange rates on the respective dates of the transactions.
Net realized and unrealized gains and losses on foreign currency transactions represent net gains and losses between trade and settlement dates on securities transactions, the acquisition and disposition of foreign currencies, and the difference between the amount of net investment income accrued and the U.S. dollar amount actually received. That portion of both realized and unrealized gains and losses on investments that results from fluctuations in foreign currency exchange rates is not separately disclosed but is included with net realized and unrealized gain/appreciation and loss/depreciation on investments.
Securities Lending. Deutsche Bank AG, as lending agent, lends securities of the Fund to certain financial institutions under the terms of the Security Lending Agreement. The Fund retains the benefits of owning the securities it has loaned and continues to receive interest and dividends generated by the securities and to participate in any changes in their market value. The Fund requires the borrowers of the securities to maintain collateral with the Fund consisting of either cash or liquid, unencumbered assets having a value at least equal to the value of the securities loaned. When the collateral falls below specified amounts, the lending agent will use its best effort to obtain additional collateral on the next business day to meet required amounts under the security lending agreement. The Fund may invest the cash collateral into a joint trading account in an affiliated money market fund pursuant to Exemptive Orders issued by the SEC. The Fund receives compensation for lending its securities either in the form of fees or by earning interest on invested cash collateral net of borrower rebates and fees paid to a lending agent. Either the Fund or the borrower may terminate the loan. There may be risks of delay and costs in recovery of securities or even loss of rights in the collateral should the borrower of the securities fail financially. If the Fund is not able to recover securities lent, the Fund may sell the collateral and purchase a replacement investment in the market, incurring the risk that the value of the replacement security is greater than the value of the collateral. The Fund is also subject to all investment risks associated with the reinvestment of any cash collateral received, including, but not limited to, interest rate, credit and liquidity risk associated with such investments.
As of June 30, 2013, the Fund had securities on loan with a gross value of $10,946,630. The value of the related collateral, $11,538,751, exceeded the value of the securities loaned at period end.
Loan Participations and Assignments. Senior loans are portions of loans originated by banks and sold in pieces to investors. These U.S. dollar-denominated fixed and floating rate loans ("Loans") in which the Fund invests are arranged through private negotiations between the borrower and one or more financial institutions ("Lenders"). The Fund invests in such Loans in the form of participations in Loans ("Participations") or assignments of all or a portion of loans from third parties ("Assignments"). Participations typically result in the Fund having a contractual relationship only with the Lender, not with the borrower. The Fund has the right to receive payments of principal, interest and any fees to which it is entitled from the Lender selling the Participation and only upon receipt by the Lender of the payments from the borrower. In connection with purchasing Participations, the Fund generally has no right to enforce compliance by the borrower with the terms of the loan agreement relating to the Loan, nor any rights of set-off against the borrower, and the Fund will not benefit directly from any collateral supporting the Loan in which it has purchased the Participation. As a result, the Fund assumes the credit risk of both the borrower and the Lender that is selling the Participation. Assignments typically result in the Fund having a direct contractual relationship with the borrower, and the Fund may enforce compliance by the borrower with the terms of the loan agreement. Senior loans held by the Fund are generally in the form of Assignments, but the Fund may also invest in Participations. All senior loans involve interest rate risk, liquidity risk and credit risk, including the potential default or insolvency of the borrower.
When-Issued/Delayed Delivery Securities. The Fund may purchase securities with delivery or payment to occur at a later date beyond the normal settlement period. At the time the Fund enters into a commitment to purchase a security, the transaction is recorded and the value of the transaction is reflected in the net asset value. The price of such security and the date when the security will be delivered and paid for are fixed at the time the transaction is negotiated. The value of the security may vary with market fluctuations. At the time the Fund enters into a purchase transaction it is required to segregate cash or other liquid assets at least equal to the amount of the commitment.
Certain risks may arise upon entering into when-issued or delayed delivery transaction from the potential inability of counterparties to meet the terms of their contracts or if the issuer does not issue the securities due to political, economic, or other factors. Additionally, losses may arise due to changes in the value of the underlying securities.
Taxes. The Fund's policy is to comply with the requirements of the Internal Revenue Code, as amended, which are applicable to regulated investment companies and to distribute all of its taxable income to its shareholders.
Under the Regulated Investment Company Modernization Act of 2010, net capital losses incurred post-enactment may be carried forward indefinitely, and their character is retained as short-term and/or long-term. Previously, net capital losses were carried forward for eight years and treated as short-term losses. As a transition rule, the Act requires that post-enactment net capital losses be used before pre-enactment net capital losses.
At December 31, 2012, the Fund had a net tax basis capital loss carryforward of approximately $44,347,000, including $39,235,000 of pre-enactment losses, which may be applied against any realized net taxable capital gains of each succeeding year until fully utilized or until December 31, 2014 ($3,844,000), December 31, 2015 ($858,000), December 31, 2016 ($17,301,000) and December 31, 2017 ($17,232,000), the respective expiration dates, whichever occurs first; and approximately $5,112,000 of post-enactment long-term losses, which may be applied against realized net taxable capital gains indefinitely.
The Fund has reviewed the tax positions for the open tax years as of December 31, 2012 and has determined that no provision for income tax is required in the Fund's financial statements. The Fund's federal tax returns for the prior three fiscal years remain open subject to examination by the Internal Revenue Service.
Distribution of Income and Gains. Distributions from net investment income of the Fund, if any, are declared and distributed to shareholders annually. Net realized gains from investment transactions, in excess of available capital loss carryforwards, would be taxable to the Fund if not distributed and, therefore, will be distributed to shareholders at least annually. The Fund may also make additional distributions for tax purposes if necessary.
The timing and characterization of certain income and capital gain distributions are determined annually in accordance with federal tax regulations which may differ from accounting principles generally accepted in the United States of America. These differences primarily relate to investments in foreign denominated investments, investments in forward currency contracts, investments in swap contracts and certain securities sold at a loss. As a result, net investment income (loss) and net realized gain (loss) on investment transactions for a reporting period may differ significantly from distributions during such period. Accordingly, the Fund may periodically make reclassifications among certain of its capital accounts without impacting the net asset value of the Fund.
The tax character of current year distributions will be determined at the end of the current fiscal year.
Expenses. Expenses of the Trust arising in connection with a specific fund are allocated to that fund. Other Trust expenses which cannot be directly attributed to a fund are apportioned among the funds in the Trust based upon the relative net assets or other appropriate measures.
Contingencies. In the normal course of business, the Fund may enter into contracts with service providers that contain general indemnification clauses. The Fund's maximum exposure under these arrangements is unknown as this would involve future claims that may be made against the Fund that have not yet been made. However, based on experience, the Fund expects the risk of loss to be remote.
Other. Investment transactions are accounted for on a trade date plus one basis for daily net asset value calculations. However, for financial reporting purposes, investment transactions are reported on trade date. Interest income is recorded on the accrual basis. Dividend income is recorded on ex-dividend date. Realized gains and losses from investment transactions are recorded on an identified cost basis and may include proceeds from litigation. All discounts and premiums are accreted/amortized for both tax and financial reporting purposes for the Fund, with the exception of securities in default of principal.
B. Derivative Instruments
Credit Default Swap Contracts. A credit default swap is a contract between a buyer and a seller of protection against pre-defined credit events for the reference entity. The Fund may enter into credit default swap contracts to gain exposure to an underlying issuer's credit quality characteristics without directly investing in that issuer or to hedge against the risk of a credit event on debt securities. As a seller in the credit default swap contract, the Fund is required to pay the par (or other agreed-upon) value of the referenced entity to the counterparty with the occurrence of a credit event by a third party, such as a U.S. or foreign corporate issuer, on the reference entity, which would likely result in a loss to the Fund. In return, the Fund receives from the counterparty a periodic stream of payments over the term of the contract provided that no credit event has occurred. If no credit event occurs, the Fund keeps the stream of payments with no payment obligations. This involves the risk that the contract may expire worthless. It also involves counterparty risk that the seller may fail to satisfy its payment obligations to the Fund with the occurrence of a credit event. When the Fund sells a credit default swap contract it will cover its commitment. This is achieved by, among other methods, maintaining cash or liquid assets equal to the aggregate notional value of the reference entities for all outstanding credit default swap contracts sold by the Fund. For the six months ended June 30, 2013, the Fund entered into credit default swap contracts to gain exposure to the underlying issuer's credit quality characteristics.
The value of the credit default swap is adjusted daily and the change in value, if any, is recorded daily as unrealized appreciation or depreciation in the Statement of Assets and Liabilities. An upfront payment, if any, made by the Fund is recorded as an asset in the Statement of Assets and Liabilities. An upfront payment, if any, received by the Fund is recorded as a liability in the Statement of Assets and Liabilities. Under the terms of the credit default swap contracts, the Fund receives or makes quarterly payments based on a specified interest rate on a fixed notional amount. These payments are recorded as a realized gain or loss in the Statement of Operations. Payments received or made as a result of a credit event or termination of the contract are recognized, net of a proportional amount of the upfront payment, as realized gains or losses in the Statement of Operations.
A summary of the open credit default swap contracts as of June 30, 2013 is included in a table following the Fund's Investment Portfolio. For the six months ended June 30, 2013, the Fund's investment in credit default swap contracts sold had a total notional value generally indicative of a range from $7,890,000 to $20,890,000.
Forward Foreign Currency Exchange Contracts. A forward foreign currency exchange contract ("forward currency contract") is a commitment to purchase or sell a foreign currency at the settlement date at a negotiated rate. For the six months ended June 30, 2013, the Fund entered into forward currency contracts in order to hedge its exposure to changes in foreign currency exchange rates on its foreign currency denominated portfolio holdings and to facilitate transactions in foreign currency denominated securities.
Forward currency contracts are valued at the prevailing forward exchange rate of the underlying currencies and unrealized gain (loss) is recorded daily. On the settlement date of the forward currency contract, the Fund records a realized gain or loss equal to the difference between the value of the contract at the time it was opened and the value of the contract at the time it was closed. Certain risks may arise upon entering into forward currency contracts from the potential inability of counterparties to meet the terms of their contracts. The maximum counterparty credit risk to the Fund is measured by the unrealized gain on appreciated contracts. Additionally, when utilizing forward currency contracts to hedge, the Fund gives up the opportunity to profit from favorable exchange rate movements during the term of the contract.
A summary of the open forward currency contracts as of June 30, 2013 is included in a table following the Fund's Investment Portfolio. For the six months ended June 30, 2013, the Fund's investment in forward currency contracts short vs. U.S. dollars had a total contract value generally indicative of a range from approximately $1,454,000 to $3,344,000, and the investment in forward currency contracts long vs. U.S. dollars had a total contract value generally indicative of a range from $0 to approximately $2,000.
The following tables summarize the value of the Fund's derivative instruments held as of June 30, 2013 and the related location in the accompanying Statement of Assets and Liabilities, presented by primary underlying risk exposure:
| Asset Derivative | | Forward Contracts | | | Swap
Contracts | | | Total | |
| Credit Contracts (a) | | $ | — | | | $ | 492,620 | | | $ | 492,620 | |
| Foreign Exchange Contracts (b) | | | 34,434 | | | | — | | | | 34,434 | |
| | | $ | 34,434 | | | $ | 492,620 | | | $ | 527,054 | |
Each of the above derivatives is located in the following Statement of Assets and Liabilities accounts:
(a) Unrealized appreciation on swap contracts
(b) Unrealized appreciation on forward foreign currency exchange contracts
| Liability Derivative | | Swap
Contracts | |
| Credit Contracts (a) | | $ | (18,797 | ) |
The above derivative is located in the following Statement of Assets and Liabilities account:
(a) Unrealized depreciation on swap contracts
Additionally, the amount of unrealized and realized gains and losses on derivative instruments recognized in Fund earnings during the six months ended June 30, 2013 and the related location in the accompanying Statement of Operations is summarized in the following tables by primary underlying risk exposure:
| Realized Gain (Loss) | | Forward Contracts | | | Swap
Contracts | | | Total | |
| Credit Contracts (a) | | $ | — | | | $ | 923,458 | | | $ | 923,458 | |
| Foreign Exchange Contracts (b) | | | 18,560 | | | | — | | | | 18,560 | |
| | | $ | 18,560 | | | $ | 923,458 | | | $ | 942,018 | |
Each of the above derivatives is located in the following Statement of Operations accounts:
(a) Net realized gain (loss) from swap contracts
(b) Net realized gain (loss) from foreign currency (Statement of Operations includes both forward currency contracts and foreign currency transactions)
| Change in Net Unrealized Appreciation (Depreciation) | | Forward Contracts | | | Swap
Contracts | | | Total | |
| Credit Contracts (a) | | $ | — | | | $ | (61,674 | ) | | $ | (61,674 | ) |
| Foreign Exchange Contracts (b) | | | 21,848 | | | | — | | | | 21,848 | |
| | | $ | 21,848 | | | $ | (61,674 | ) | | $ | (39,826 | ) |
Each of the above derivatives is located in the following Statement of Operations accounts:
(a) Change in net unrealized appreciation (depreciation) on swap contracts
(b) Change in net unrealized appreciation (depreciation) on foreign currency (Statement of Operations includes both forward currency contracts and foreign currency transactions)
As of June 30, 2013, the Fund has transactions subject to enforceable master netting agreements. A reconciliation of the gross amounts on the Statement of Assets and Liabilities to the net amounts by derivative type, including any collateral exposure, is included in the following tables:
| Counterparty | | Gross Amounts of Assets Presented in the Statement of Assets and Liabilities (a) | | | Financial Instruments and Derivatives Available for Offset | | | Collateral Received (b) | | | Net Amount of Derivative Assets | |
| Bank of America | | $ | 101,554 | | | $ | — | | | $ | — | | | $ | 101,554 | |
| Barclays Bank PLC | | | 53,973 | | | | (17,446 | ) | | | — | | | | 36,527 | |
| Citigroup, Inc. | | | 34,682 | | | | — | | | | — | | | | 34,682 | |
| Credit Suisse | | | 92,947 | | | | — | | | | — | | | | 92,947 | |
| The Goldman Sachs & Co. | | | 136,776 | | | | (1,351 | ) | | | — | | | | 135,425 | |
| JPMorgan Chase Securities, Inc. | | | 79,053 | | | | — | | | | (79,053 | ) | | | — | |
| UBS AG | | | 28,069 | | | | — | | | | — | | | | 28,069 | |
| | | $ | 527,054 | | | $ | (18,797 | ) | | $ | (79,053 | ) | | $ | 429,204 | |
| Counterpartyb | | Gross Amounts of Liabilities Presented in the Statement of Assets and Liabilities (a) | | | Financial Instruments and Derivatives Available for Offset | | | Collateral Pledged | | | Net Amount of Derivative Liabilities | |
| Barclays Bank PLC | | $ | 17,446 | | | $ | (17,446 | ) | | $ | — | | | $ | — | |
| The Goldman Sachs & Co. | | | 1,351 | | | | (1,351 | ) | | | — | | | | — | |
| | | $ | 18,797 | | | $ | (18,797 | ) | | $ | — | | | $ | — | |
(a) Swap contracts and forward foreign currency exchange contracts are netted.
(b) The actual collateral received and/or pledged may be more than the amounts shown.
C. Purchases and Sales of Securities
During the six months ended June 30, 2013, purchases and sales of investment securities (excluding short-term investments and U.S. Treasury securities) aggregated $45,935,040 and $61,881,044, respectively.
D. Related Parties
Management Agreement. Under the Investment Management Agreement with Deutsche Investment Management Americas Inc. ("DIMA" or the "Advisor"), an indirect, wholly owned subsidiary of Deutsche Bank AG, the Advisor directs the investments of the Fund in accordance with its investment objectives, policies and restrictions. The Advisor determines the securities, instruments and other contracts relating to investments to be purchased, sold or entered into by the Fund.
Pursuant to the Investment Management Agreement with the Advisor, the Fund pays a monthly management fee based on the Fund's average daily net assets, computed and accrued daily and payable monthly, at the following annual rates:
| First $250 million | | | .500 | % |
| Next $750 million | | | .470 | % |
| Next $1.5 billion | | | .450 | % |
| Next $2.5 billion | | | .430 | % |
| Next $2.5 billion | | | .400 | % |
| Next $2.5 billion | | | .380 | % |
| Next $2.5 billion | | | .360 | % |
| Over $12.5 billion | | | .340 | % |
For the period from January 1, 2013 through September 30, 2013, the Advisor has contractually agreed to waive all or a portion of its fees and/or reimburse certain operating expenses of the Fund to the extent necessary to maintain the operating expenses (excluding certain expenses such as extraordinary expenses, taxes, brokerage and interest) of each class as follows:
Accordingly, for the six months ended June 30, 2013, the Advisor waived a portion of its management fee pursuant to the Investment Management Agreement aggregating $1,003, and the amount charged aggregated $432,281, which was equivalent to an annualized effective rate of 0.50% of the Fund's average daily net assets.
Administration Fee. Pursuant to an Administrative Services Agreement, DIMA provides most administrative services to the Fund. For all services provided under the Administrative Services Agreement, the Fund pays DIMA an annual fee ("Administration Fee") of 0.10% of the Fund's average daily net assets, computed and accrued daily and payable monthly. For the six months ended June 30, 2013, the Administration Fee was $86,657, of which $12,838 is unpaid.
Service Provider Fees. DWS Investments Service Company ("DISC"), an affiliate of the Advisor, is the transfer agent, dividend-paying agent and shareholder service agent for the Fund. Pursuant to a sub-transfer agency agreement between DISC and DST Systems, Inc. ("DST"), DISC has delegated certain transfer agent, dividend-paying agent and shareholder service agent functions to DST. DISC compensates DST out of the shareholder servicing fee it receives from the Fund. For the six months ended June 30, 2013, the amounts charged to the Fund by DISC were as follows:
| Services to Shareholders | | Total Aggregated | | | Waived | |
| Class A | | $ | 134 | | | $ | 134 | |
| Class B | | | 11 | | | | 11 | |
| | | $ | 145 | | | $ | 145 | |
In addition, for the six months ended June 30, 2013, the Advisor reimbursed $2 of non-affiliated recordkeeping fees for Class B shares.
Distribution Service Agreement. Under the Fund's Class B 12b-1 plans, DWS Investments Distributors, Inc. ("DIDI") received a fee ("Distribution Service Fee") of 0.25% of average daily net assets of Class B shares. For the six months ended June 30, 2013, the Distribution Service Fee aggregated $119, of which $18 is unpaid.
Typesetting and Filing Service Fees. Under an agreement with DIMA, DIMA is compensated for providing typesetting and certain regulatory filing services to the Fund. For the six months ended June 30, 2013, the amount charged to the Fund by DIMA included in the Statement of Operations under "reports to shareholders" aggregated $9,050, of which $8,517 is unpaid.
Trustees' Fees and Expenses. The Fund paid retainer fees to each Trustee not affiliated with the Advisor, plus specified amounts to the Board Chairperson and Vice Chairperson and to each committee Chairperson.
Affiliated Cash Management Vehicles. The Fund may invest uninvested cash balances in Central Cash Management Fund and DWS Variable NAV Money Fund, affiliated money market funds which are managed by the Advisor. Each affiliated money market fund seeks to provide a high level of current income consistent with liquidity and the preservation of capital. Each affiliated money market fund is managed in accordance with Rule 2a-7 under the Investment Company Act of 1940, which governs the quality, maturity, diversity and liquidity of instruments in which a money market fund may invest. Central Cash Management Fund seeks to maintain a stable net asset value, and DWS Variable NAV Money Fund maintains a floating net asset value. The Fund indirectly bears its proportionate share of the expenses of each affiliated money market fund in which it invests. Central Cash Management Fund does not pay the Advisor an investment management fee. To the extent that DWS Variable NAV Money Fund pays an investment management fee to the Advisor, the Advisor will waive an amount of the investment management fee payable to the Advisor by the Fund equal to the amount of the investment management fee payable on the Fund's assets invested in DWS Variable NAV Money Fund.
Security Lending Fees. Deutsche Bank AG serves as lending agent for the Fund. For the six months ended June 30, 2013, the Fund incurred lending agent fees to Deutsche Bank AG for the amount of $2,129.
E. Investing in High-Yield Securities
The Fund's performance could be hurt if a security declines in credit quality or goes into default, or if an issuer does not make timely payments of interest or principal. Because the issuers of high-yield debt securities or junk bonds (debt securities rated below the fourth-highest category) may be in uncertain financial health, the risk of loss from default by the issuer is significantly greater. Prices and yields of high-yield securities will fluctuate over time and, during periods of economic uncertainty, volatility of high-yield securities may adversely affect a fund's net asset value. Because the Fund may invest in securities not paying current interest or in securities already in default, these risks may be more pronounced.
F. Ownership of the Fund
At June 30, 2013, three Participating Insurance Companies were owners of record of 10% or more of the total outstanding Class A shares of the Fund, each owning 30%, 30% and 30%. One Participating Insurance Company was the owner of record of 10% or more of the total outstanding Class B shares of the Fund, owning 100%.
G. Line of Credit
The Fund and other affiliated funds (the "Participants") share in a $375 million revolving credit facility provided by a syndication of banks. The Fund may borrow for temporary or emergency purposes, including the meeting of redemption requests that otherwise might require the untimely disposition of securities. The Participants are charged an annual commitment fee which is allocated based on net assets, among each of the Participants. Interest is calculated at a rate per annum equal to the sum of the Federal Funds Rate plus 1.25 percent plus if LIBOR exceeds the Federal Funds Rate the amount of such excess. The Fund may borrow up to a maximum of 33 percent of its net assets under the agreement. The Fund had no outstanding loans at June 30, 2013.
Information About Your Fund's Expenses (Unaudited)
As an investor of the Fund, you incur two types of costs: ongoing expenses and transaction costs. Ongoing expenses include management fees, distribution and service (12b-1) fees and other Fund expenses. Examples of transaction costs include contract charges, redemption fees and account maintenance fees, which are not shown in this section. The following tables are intended to help you understand your ongoing expenses (in dollars) of investing in the Fund and to help you compare these expenses with the ongoing expenses of investing in other mutual funds. In the most recent six-month period, the Fund limited these expenses; had it not done so, expenses would have been higher. The example in the table is based on an investment of $1,000 invested at the beginning of the six-month period and held for the entire period (January 1, 2013 to June 30, 2013).
The tables illustrate your Fund's expenses in two ways:
•Actual Fund Return. This helps you estimate the actual dollar amount of ongoing expenses (but not transaction costs) paid on a $1,000 investment in the Fund using the Fund's actual return during the period. To estimate the expenses you paid over the period, simply divide your account value by $1,000 (for example, an $8,600 account value divided by $1,000 = 8.6), then multiply the result by the number in the "Expenses Paid per $1,000" line under the share class you hold.
• Hypothetical 5% Fund Return. This helps you to compare your Fund's ongoing expenses (but not transaction costs) with those of other mutual funds using the Fund's actual expense ratio and a hypothetical rate of return of 5% per year before expenses. Examples using a 5% hypothetical Fund return may be found in the shareholder reports of other mutual funds. The hypothetical account values and expenses may not be used to estimate the actual ending account balance or expenses you paid for the period.
Please note that the expenses shown in these tables are meant to highlight your ongoing expenses only and do not reflect any transaction costs. The "Expenses Paid per $1,000" line of the tables is useful in comparing ongoing expenses only and will not help you determine the relative total expense of owning different funds. If these transaction costs had been included, your costs would have been higher.
Expenses and Value of a $1,000 Investment for the six months ended June 30, 2013 | |
| Actual Fund Return | | Class A | | | Class B | |
| Beginning Account Value 1/1/13 | | $ | 1,000.00 | | | $ | 1,000.00 | |
| Ending Account Value 6/30/13 | | $ | 1,018.70 | | | $ | 1,017.50 | |
| Expenses Paid per $1,000* | | $ | 3.60 | | | $ | 4.85 | |
| Hypothetical 5% Fund Return | | Class A | | | Class B | |
| Beginning Account Value 1/1/13 | | $ | 1,000.00 | | | $ | 1,000.00 | |
| Ending Account Value 6/30/13 | | $ | 1,021.22 | | | $ | 1,019.98 | |
| Expenses Paid per $1,000* | | $ | 3.61 | | | $ | 4.86 | |
* Expenses are equal to the Fund's annualized expense ratio for each share class, multiplied by the average account value over the period, multiplied by 181 (the number of days in the most recent six-month period), then divided by 365.
| Annualized Expense Ratios | Class A | | Class B | |
| DWS Variable Series II — DWS High Income VIP | .72% | | .97% | |
For more information, please refer to the Fund's prospectus.
These tables do not reflect charges and fees ("contract charges") associated with the separate account that invests in the Fund or any variable life insurance policy or variable annuity contract for which the Fund is an investment option.
For an analysis of the fees associated with an investment in the Fund or similar funds, please refer to http://apps.finra.org/fundanalyzer/1/fa.aspx.
The Trust's policies and procedures for voting proxies for portfolio securities and information about how the Trust voted proxies related to its portfolio securities during the 12-month period ended June 30 are available on our Web site — www.dws-investments.com (click on "proxy voting" at the bottom of the page) — or on the SEC's Web site — www.sec.gov. To obtain a written copy of the Trust's policies and procedures without charge, upon request, call us toll free at (800) 728-3337.
Summary of Management Fee Evaluation by Independent Fee Consultant
September 17, 2012
Pursuant to an Order entered into by Deutsche Investment Management Americas and affiliates (collectively, "DeAM") with the Attorney General of New York, I, Thomas H. Mack, have been appointed the Independent Fee Consultant for the DWS Funds (formerly the DWS Scudder Funds). My duties include preparing an annual written evaluation of the management fees DeAM charges the Funds, considering among other factors the management fees charged by other mutual fund companies for like services, management fees DeAM charges other clients for like services, DeAM's costs of supplying services under the management agreements and related profit margins, possible economies of scale if a Fund grows larger, and the nature and quality of DeAM's services, including fund performance. This report summarizes my evaluation for 2012, including my qualifications, the evaluation process for each of the DWS Funds, consideration of certain complex-level factors, and my conclusions. I served in substantially the same capacity in 2007, 2008, 2009, 2010 and 2011.
Qualifications
For more than 35 years I have served in various professional capacities within the investment management business. I have held investment analysis and advisory positions, including securities analyst, portfolio strategist and director of investment policy with a large investment firm. I have also performed business management functions, including business development, financial management and marketing research and analysis.
Since 1991, I have been an independent consultant within the asset management industry. I have provided services to over 125 client organizations, including investment managers, mutual fund boards, product distributors and related organizations. Over the past ten years I have completed a number of assignments for mutual fund boards, specifically including assisting boards with management contract renewal.
I hold a Master of Business Administration degree, with highest honors, from Harvard University and Master of Science and Bachelor of Science (highest honors) degrees from the University of California at Berkeley. I am an independent director and audit committee financial expert for two closed-end mutual funds and have served in various leadership and financial oversight capacities with non-profit organizations.
Evaluation of Fees for each DWS Fund
My work focused primarily on evaluating, fund-by-fund, the fees charged to each of the 103 mutual fund portfolios in the DWS Fund family. For each Fund, I considered each of the key factors mentioned above, as well as any other relevant information. In doing so I worked closely with the Funds' Independent Directors in their annual contract renewal process, as well as in their approval of contracts for several new funds (documented separately).
In evaluating each Fund's fees, I reviewed comprehensive materials provided by or on behalf of DeAM, including expense information prepared by Lipper Analytical, comparative performance information, profitability data, manager histories, and other materials. I also accessed certain additional information from the Lipper and Morningstar databases and drew on my industry knowledge and experience.
To facilitate evaluating this considerable body of information, I prepared for each Fund a document summarizing the key data elements in each area as well as additional analytics discussed below. This made it possible to consider each key data element in the context of the others.
In the course of contract renewal, DeAM agreed to implement a number of fee and expense adjustments requested by the Independent Directors which will favorably impact future fees and expenses, and my evaluation includes the effects of these changes.
Fees and Expenses Compared with Other Funds
The competitive fee and expense evaluation for each fund focused on two primary comparisons:
The Fund's contractual management fee (the advisory fee plus the administration fee where applicable) compared with those of a group of typically 12-15 funds in the same Lipper investment category (e.g. Large Capitalization Growth) having similar distribution arrangements and being of similar size.
The Fund's total expenses compared with a broader universe of funds from the same Lipper investment category and having similar distribution arrangements.
These two comparisons provide a view of not only the level of the fee compared with funds of similar scale but also the total expense the Fund bears for all the services it receives, in comparison with the investment choices available in the Fund's investment category and distribution channel. The principal figure-of-merit used in these comparisons was the subject Fund's percentile ranking against peers.
DeAM's Fees for Similar Services to Others
DeAM provided management fee schedules for all of its US domiciled fund and non-fund investment management accounts in any of the investment categories where there is a DWS Fund. These similar products included the other DWS Funds, non-fund pooled accounts, institutional accounts and sub-advisory accounts. Using this information, I calculated for each Fund the fee that would be charged to each similar product, at the subject Fund's asset level.
Evaluating information regarding non-fund products is difficult because there are varying levels of services required for different types of accounts, with mutual funds generally requiring considerably more regulatory and administrative types of service as well as having more frequent cash flows than other types of accounts. Also, while mutual fund fees for similar fund products can be expected to be similar, there will be some differences due to different pricing conditions in different distribution channels (e.g. retail funds versus those used in variable insurance products), differences in underlying investment processes and other factors.
Costs and Profit Margins
DeAM provided a detailed profitability analysis for each Fund. After making some adjustments so that the presentation would be more comparable to the available industry figures, I reviewed profit margins from investment management alone, from investment management plus other fund services (excluding distribution) provided to the Funds by DeAM (principally shareholder services), and DeAM profits from all sources, including distribution. A later section comments on overall profitability.
Economies of Scale
Economies of scale — an expected decline in management cost per dollar of fund assets as fund assets grow — are very rarely quantified and documented because of inherent difficulties in collecting and analyzing relevant data. However, in virtually every investment category that I reviewed, larger funds tend to have lower fees and lower total expenses than smaller funds. To see how each DWS Fund compares with this industry observation, I reviewed:
The trend in Fund assets over the last five years and the accompanying trend in total expenses. This shows if the Fund has grown and, if so, whether total expense (management fees as well as other expenses) have declined as a percent of assets.
Whether the Fund has break-points in its management fee schedule, the extent of the fee reduction built into the schedule and the asset levels where the breaks take effect, and in the case of a sub-advised Fund how the Fund's break-points compare with those of the sub-advisory fee schedule.
How the Fund's contractual fee schedule compares with trends in the industry data. To accomplish this, I constructed a chart showing how actual latest-fiscal-year contractual fees of the Fund and of other similar funds relate to average fund assets, with the subject Fund's contractual fee schedule superimposed.
Quality of Service — Performance
The quality-of-service evaluation focused on investment performance, which is the principal result of the investment management service. Each Fund's performance was reviewed over the past 1, 3, 5 and 10 years, as applicable, and compared with that of other funds in the same investment category and with a suitable market index.
In addition, I calculated and reviewed risk-adjusted returns relative to an index of similar mutual funds' returns and a suitable market index. The risk-adjusted returns analysis provides a way of determining the extent to which the Fund's return comparisons are mainly the product of investment value-added (or lack thereof) or alternatively taking considerably more or less risk than is typical in its investment category.
I also received and considered the history of portfolio manager changes for each Fund, as this provided an important context for evaluating the performance results.
Complex-Level Considerations
While this evaluation was conducted mainly at the individual fund level, there are some issues relating to the reasonableness of fees that can alternatively be considered across the whole fund complex:
I reviewed DeAM's profitability analysis for all DWS Funds, with a view toward determining if the allocation procedures used were reasonable and how profit levels compared with public data for other investment managers.
I considered whether DeAM and affiliates receive any significant ancillary or "fallout" benefits that should be considered in interpreting the direct profitability results. These would be situations where serving as the investment manager of the Funds is beneficial to another part of the Deutsche Bank organization.
I considered how aggregated DWS Fund expenses had varied over the years, by asset class and in the context of trends in asset levels.
I considered how aggregated DWS Fund performance measures relative to appropriate peers had varied by asset class and over time.
I reviewed the structure of the DeAM organization, trends in staffing levels, and information on compensation of investment management and other professionals compared with industry data.
Findings
Based on the process and analysis discussed above, which included reviewing a wide range of information from management and external data sources and considering among other factors the fees DeAM charges other clients, the fees charged by other fund managers, DeAM's costs and profits associated with managing the Funds, economies of scale, possible fall-out benefits, and the nature and quality of services provided, in my opinion the management fees charged the DWS Funds are reasonable.
Thomas H. Mack
President, Thomas H. Mack & Co., Inc.
DWS Investments Distributors, Inc.
222 South Riverside Plaza
Chicago, IL 60606
(800) 621-1148
VS2HI-3 (R-028385-2 8/13)
JUNE 30, 2013
SEMIANNUAL REPORT
DWS VARIABLE SERIES II
DWS Large Cap Value VIP
Contents
12 Statement of Assets and Liabilities 13 Statement of Operations 14 Statement of Changes in Net Assets 17 Notes to Financial Statements 21 Information About Your Fund's Expenses 23 Summary of Management Fee Evaluation by Independent Fee Consultant |
This report must be preceded or accompanied by a prospectus. To obtain an additional prospectus or summary prospectus, if available, call (800) 728-3337 or your financial representative. We advise you to consider the Fund's objectives, risks, charges and expenses carefully before investing. The summary prospectus and prospectus contain this and other important information about the Fund. Please read the prospectus carefully before you invest.
Investing in derivatives entails special risks relating to liquidity, leverage and credit that may reduce returns and/or increase volatility. The Fund may lend securities to approved institutions. Stocks may decline in value. See the prospectus for details.
DWS Investments is part of the Deutsche Asset & Wealth Management division of Deutsche Bank AG.
NOT FDIC/NCUA INSURED NO BANK GUARANTEE MAY LOSE VALUE NOT A DEPOSIT
NOT INSURED BY ANY FEDERAL GOVERNMENT AGENCY
Performance Summary June 30, 2013 (Unaudited)
Fund performance shown is historical, assumes reinvestment of all dividend and capital gain distributions and does not guarantee future results. Investment return and principal value fluctuate with changing market conditions so that, when redeemed, shares may be worth more or less than their original cost. Current performance may be lower or higher than the performance data quoted. Please contact your participating insurance company for the Fund's most recent month-end performance. Performance doesn't reflect charges and fees ("contract charges") associated with the separate account that invests in the Fund or any variable life insurance policy or variable annuity contract for which the Fund is an investment option. These charges and fees will reduce returns. While all share classes have the same underlying portfolio, their performance will differ.
The gross expense ratios of the Fund, as stated in the fee table of the prospectus dated May 1, 2013 are 0.78% and 1.09% for Class A and Class B shares, respectively, and may differ from the expense ratios disclosed in the Financial Highlights tables in this report.
| Growth of an Assumed $10,000 Investment in DWS Large Cap Value VIP |
| The Russell 1000® Value Index is an unmanaged index that consists of those stocks in the Russell 1000® Index with less-than-average growth orientation. The Russell 1000® Index is an unmanaged price-only index of the 1,000 largest capitalized companies that are domiciled in the U.S. and whose common stocks are traded. Index returns do not reflect any fees or expenses and it is not possible to invest directly into an index. |
| |
| Yearly periods ended June 30 | |
| Comparative Results | |
| DWS Large Cap Value VIP | | 6-Month‡ | | | 1-Year | | | 3-Year | | | 5-Year | | | 10-Year | |
| Class A | Growth of $10,000 | | $ | 11,450 | | | $ | 12,030 | | | $ | 15,003 | | | $ | 11,484 | | | $ | 19,185 | |
| Average annual total return | | | 14.50 | % | | | 20.30 | % | | | 14.48 | % | | | 2.81 | % | | | 6.73 | % |
Russell 1000® Value Index | Growth of $10,000 | | $ | 11,590 | | | $ | 12,532 | | | $ | 16,645 | | | $ | 13,811 | | | $ | 21,173 | |
| Average annual total return | | | 15.90 | % | | | 25.32 | % | | | 18.51 | % | | | 6.67 | % | | | 7.79 | % |
| DWS Large Cap Value VIP | | 6-Month‡ | | | 1-Year | | | 3-Year | | | 5-Year | | | 10-Year | |
| Class B | Growth of $10,000 | | $ | 11,429 | | | $ | 11,987 | | | $ | 14,867 | | | $ | 11,306 | | | $ | 18,536 | |
| Average annual total return | | | 14.29 | % | | | 19.87 | % | | | 14.13 | % | | | 2.49 | % | | | 6.37 | % |
Russell 1000® Value Index | Growth of $10,000 | | $ | 11,590 | | | $ | 12,532 | | | $ | 16,645 | | | $ | 13,811 | | | $ | 21,173 | |
| Average annual total return | | | 15.90 | % | | | 25.32 | % | | | 18.51 | % | | | 6.67 | % | | | 7.79 | % |
The growth of $10,000 is cumulative.
‡ Total returns shown for periods less than one year are not annualized.
Portfolio Summary (Unaudited) Asset Allocation (As a % of Investment Portfolio excluding Securities Lending Collateral) | 6/30/13 | 12/31/12 |
| | | |
| Common Stocks | 99% | 98% |
| Cash Equivalents | 1% | 1% |
| Exchange-Traded Fund | — | 1% |
| | 100% | 100% |
Sector Diversification (As a % of Common Stocks) | 6/30/13 | 12/31/12 |
| | | |
| Financials | 24% | 24% |
| Health Care | 15% | 14% |
| Energy | 13% | 17% |
| Consumer Staples | 11% | 8% |
| Information Technology | 10% | 6% |
| Consumer Discretionary | 8% | 9% |
| Industrials | 7% | 10% |
| Utilities | 6% | 4% |
| Materials | 3% | 5% |
| Telecommunication Services | 3% | 3% |
| | 100% | 100% |
Portfolio holdings and characteristics are subject to change.
For more complete details about the Fund's investment portfolio, see page 7.
Following the Fund's fiscal first and third quarter-end, a complete portfolio holdings listing is filed with the SEC on Form N-Q. The form will be available on the SEC's Web site at www.sec.gov, and it also may be reviewed and copied at the SEC's Public Reference Room in Washington, D.C. Information on the operation of the SEC's Public Reference Room may be obtained by calling (800) SEC-0330. The Fund's portfolio holdings are also posted on www.dws-investments.com from time to time. Please see the Fund's current prospectus for more information.
Thomas Schuessler, PhD
Lead Portfolio Manager
Peter Steffen, CFA
Oliver Pfeil, PhD
Portfolio Managers
Investment Portfolio June 30, 2013 (Unaudited) | | | Shares | | | Value ($) | |
| | | | |
| Common Stocks 99.3% | |
| Consumer Discretionary 8.1% | |
| Automobiles 1.5% | |
| Ford Motor Co. | | | 400,000 | | | | 6,188,000 | |
| Diversified Consumer Services 0.8% | |
| DeVry, Inc. (a) | | | 55,000 | | | | 1,706,100 | |
| H&R Block, Inc. | | | 55,000 | | | | 1,526,250 | |
| | | | | | | | 3,232,350 | |
| Hotels, Restaurants & Leisure 0.4% | |
| Carnival Corp. | | | 50,000 | | | | 1,714,500 | |
| Household Durables 0.3% | |
| Jarden Corp.* | | | 30,000 | | | | 1,312,500 | |
| Internet & Catalog Retail 0.2% | |
| Expedia, Inc. | | | 10,000 | | | | 601,500 | |
| Leisure Equipment & Products 0.4% | |
| Hasbro, Inc. (a) | | | 40,000 | | | | 1,793,200 | |
| Media 3.7% | |
| Comcast Corp. "A" | | | 135,000 | | | | 5,653,800 | |
| Meredith Corp. (a) | | | 30,000 | | | | 1,431,000 | |
| News Corp. "A" | | | 60,000 | | | | 1,956,000 | |
| Time Warner, Inc. | | | 40,000 | | | | 2,312,800 | |
| Walt Disney Co. (a) | | | 40,000 | | | | 2,526,000 | |
| Washington Post Co. "B" (a) | | | 2,500 | | | | 1,209,425 | |
| | | | | | | | 15,089,025 | |
| Specialty Retail 0.8% | |
| Lowe's Companies, Inc. | | | 40,000 | | | | 1,636,000 | |
| Staples, Inc. (a) | | | 90,000 | | | | 1,427,400 | |
| | | | | | | | 3,063,400 | |
| Consumer Staples 10.5% | |
| Beverages 1.7% | |
| Beam, Inc. | | | 25,000 | | | | 1,577,750 | |
| PepsiCo, Inc. | | | 65,000 | | | | 5,316,350 | |
| | | | | | | | 6,894,100 | |
| Food & Staples Retailing 3.2% | |
| CVS Caremark Corp. | | | 77,500 | | | | 4,431,450 | |
| Sysco Corp. (a) | | | 45,000 | | | | 1,537,200 | |
| Wal-Mart Stores, Inc. | | | 62,500 | | | | 4,655,625 | |
| Walgreen Co. | | | 50,000 | | | | 2,210,000 | |
| | | | | | | | 12,834,275 | |
| Food Products 1.5% | |
| Ingredion, Inc. | | | 30,000 | | | | 1,968,600 | |
| Kellogg Co. (a) | | | 67,500 | | | | 4,335,525 | |
| | | | | | | | 6,304,125 | |
| Household Products 2.1% | |
| Procter & Gamble Co. | | | 112,500 | | | | 8,661,375 | |
| Tobacco 2.0% | |
| Altria Group, Inc. | | | 120,000 | | | | 4,198,800 | |
| Philip Morris International, Inc. | | | 27,500 | | | | 2,382,050 | |
| Universal Corp. (a) | | | 25,000 | | | | 1,446,250 | |
| | | | | | | | 8,027,100 | |
| Energy 12.9% | |
| Energy Equipment & Services 1.5% | |
| Halliburton Co. | | | 80,000 | | | | 3,337,600 | |
| Helmerich & Payne, Inc. (a) | | | 40,000 | | | | 2,498,000 | |
| | | | | | | | 5,835,600 | |
| | | Shares | | | Value ($) | |
| | | | | | | | | |
| Oil, Gas & Consumable Fuels 11.4% | |
| Anadarko Petroleum Corp. | | | 25,000 | | | | 2,148,250 | |
| Apache Corp. | | | 40,000 | | | | 3,353,200 | |
| Chevron Corp. | | | 95,000 | | | | 11,242,300 | |
| ConocoPhillips | | | 45,000 | | | | 2,722,500 | |
| Exxon Mobil Corp. | | | 157,500 | | | | 14,230,125 | |
| Marathon Oil Corp. | | | 65,000 | | | | 2,247,700 | |
| Occidental Petroleum Corp. | | | 55,000 | | | | 4,907,650 | |
| Phillips 66 | | | 40,000 | | | | 2,356,400 | |
| Suncor Energy, Inc. | | | 65,000 | | | | 1,916,850 | |
| Valero Energy Corp. | | | 35,000 | | | | 1,216,950 | |
| | | | | | | | 46,341,925 | |
| Financials 23.3% | |
| Capital Markets 3.4% | |
| Ameriprise Financial, Inc. | | | 40,000 | | | | 3,235,200 | |
| Bank of New York Mellon Corp. | | | 70,000 | | | | 1,963,500 | |
| BlackRock, Inc. | | | 7,000 | | | | 1,797,950 | |
| Oaktree Capital Group LLC | | | 30,000 | | | | 1,576,500 | |
| The Goldman Sachs Group, Inc. | | | 33,000 | | | | 4,991,250 | |
| | | | | | | | 13,564,400 | |
| Commercial Banks 4.8% | |
| BankUnited, Inc. | | | 50,000 | | | | 1,300,500 | |
| Huntington Bancshares, Inc. | | | 150,000 | | | | 1,182,000 | |
| PNC Financial Services Group, Inc. | | | 100,000 | | | | 7,292,000 | |
| U.S. Bancorp. | | | 90,000 | | | | 3,253,500 | |
| Wells Fargo & Co. | | | 160,000 | | | | 6,603,200 | |
| | | | | | | | 19,631,200 | |
| Consumer Finance 1.3% | |
| Capital One Financial Corp. | | | 85,000 | | | | 5,338,850 | |
| Diversified Financial Services 5.9% | |
| Bank of America Corp. | | | 475,000 | | | | 6,108,500 | |
| Citigroup, Inc. | | | 90,000 | | | | 4,317,300 | |
| JPMorgan Chase & Co. | | | 200,000 | | | | 10,558,000 | |
| The NASDAQ OMX Group, Inc. | | | 95,000 | | | | 3,115,050 | |
| | | | | | | | 24,098,850 | |
| Insurance 7.3% | |
| ACE Ltd. | | | 20,000 | | | | 1,789,600 | |
| Alleghany Corp.* | | | 5,000 | | | | 1,916,550 | |
| Allstate Corp. | | | 40,000 | | | | 1,924,800 | |
| Aon PLC | | | 25,000 | | | | 1,608,750 | |
| Chubb Corp. | | | 25,000 | | | | 2,116,250 | |
| CNA Financial Corp. | | | 40,000 | | | | 1,304,800 | |
| Fidelity National Financial, Inc. "A" | | | 125,000 | | | | 2,976,250 | |
| HCC Insurance Holdings, Inc. | | | 40,000 | | | | 1,724,400 | |
| Lincoln National Corp. | | | 65,000 | | | | 2,370,550 | |
| MetLife, Inc. | | | 85,000 | | | | 3,889,600 | |
| PartnerRe Ltd. | | | 25,000 | | | | 2,264,000 | |
| Principal Financial Group, Inc. (a) | | | 40,000 | | | | 1,498,000 | |
| Prudential Financial, Inc. | | | 32,500 | | | | 2,373,475 | |
| Validus Holdings Ltd. | | | 50,000 | | | | 1,806,000 | |
| | | | | | | | 29,563,025 | |
| Thrifts & Mortgage Finance 0.6% | |
| Home Loan Servicing Solutions Ltd. | | | 50,000 | | | | 1,198,500 | |
| New York Community Bancorp., Inc. (a) | | | 85,000 | | | | 1,190,000 | |
| | | | | | | | 2,388,500 | |
| Health Care 15.2% | |
| Biotechnology 0.3% | |
| Amgen, Inc. | | | 12,500 | | | | 1,233,250 | |
| | | Shares | | | Value ($) | |
| | | | | | | | | |
| Health Care Equipment & Supplies 2.6% | |
| Baxter International, Inc. | | | 25,000 | | | | 1,731,750 | |
| Becton, Dickinson & Co. | | | 15,000 | | | | 1,482,450 | |
| C.R. Bard, Inc. (a) | | | 15,000 | | | | 1,630,200 | |
| Medtronic, Inc. | | | 70,000 | | | | 3,602,900 | |
| St. Jude Medical, Inc. | | | 50,000 | | | | 2,281,500 | |
| | | | | | | | 10,728,800 | |
| Health Care Providers & Services 3.3% | |
| Aetna, Inc. | | | 40,000 | | | | 2,541,600 | |
| HCA Holdings, Inc. | | | 40,000 | | | | 1,442,400 | |
| McKesson Corp. | | | 20,000 | | | | 2,290,000 | |
| Owens & Minor, Inc. (a) | | | 35,000 | | | | 1,184,050 | |
| Select Medical Holdings Corp. | | | 140,000 | | | | 1,148,000 | |
| UnitedHealth Group, Inc. | | | 40,000 | | | | 2,619,200 | |
| WellPoint, Inc. | | | 25,000 | | | | 2,046,000 | |
| | | | | | | | 13,271,250 | |
| Life Sciences Tools & Services 0.4% | |
| Agilent Technologies, Inc. | | | 35,000 | | | | 1,496,600 | |
| Pharmaceuticals 8.6% | |
| Bristol-Myers Squibb Co. | | | 50,000 | | | | 2,234,500 | |
| Eli Lilly & Co. | | | 37,500 | | | | 1,842,000 | |
| Forest Laboratories, Inc.* | | | 25,000 | | | | 1,025,000 | |
| Hospira, Inc.* (a) | | | 30,000 | | | | 1,149,300 | |
| Johnson & Johnson | | | 97,500 | | | | 8,371,350 | |
| Merck & Co., Inc. (a) | | | 185,000 | | | | 8,593,250 | |
| Pfizer, Inc. | | | 360,000 | | | | 10,083,600 | |
| Teva Pharmaceutical Industries Ltd. (ADR) | | | 40,000 | | | | 1,568,000 | |
| | | | | | | | 34,867,000 | |
| Industrials 7.2% | |
| Aerospace & Defense 2.7% | |
| Exelis, Inc. | | | 100,000 | | | | 1,379,000 | |
| Northrop Grumman Corp. | | | 25,000 | | | | 2,070,000 | |
| Raytheon Co. | | | 82,500 | | | | 5,454,900 | |
| United Technologies Corp. | | | 20,000 | | | | 1,858,800 | |
| | | | | | | | 10,762,700 | |
| Commercial Services & Supplies 0.6% | |
| ABM Industries, Inc. | | | 15,000 | | | | 367,650 | |
| Republic Services, Inc. | | | 65,000 | | | | 2,206,100 | |
| | | | | | | | 2,573,750 | |
| Industrial Conglomerates 3.1% | |
| Danaher Corp. | | | 25,000 | | | | 1,582,500 | |
| General Electric Co. | | | 470,000 | | | | 10,899,300 | |
| | | | | | | | 12,481,800 | |
| Machinery 0.3% | |
| AGCO Corp. | | | 27,000 | | | | 1,355,130 | |
| Road & Rail 0.5% | |
| Norfolk Southern Corp. (a) | | | 25,000 | | | | 1,816,250 | |
| Information Technology 10.1% | |
| Communications Equipment 1.7% | |
| Brocade Communications Systems, Inc.* | | | 125,000 | | | | 720,000 | |
| Cisco Systems, Inc. | | | 250,000 | | | | 6,077,500 | |
| | | | | | | | 6,797,500 | |
| Computers & Peripherals 2.1% | |
| Apple, Inc. | | | 3,000 | | | | 1,188,240 | |
| EMC Corp. | | | 75,000 | | | | 1,771,500 | |
| Hewlett-Packard Co. | | | 75,000 | | | | 1,860,000 | |
| SanDisk Corp.* | | | 25,000 | | | | 1,527,500 | |
| Western Digital Corp. | | | 35,000 | | | | 2,173,150 | |
| | | | | | | | 8,520,390 | |
| | | Shares | | | Value ($) | |
| | | | | | | | | |
| Electronic Equipment, Instruments & Components 0.3% | |
| Corning, Inc. | | | 100,000 | | | | 1,423,000 | |
| Internet Software & Services 0.3% | |
| IAC/InterActiveCorp. | | | 25,000 | | | | 1,189,000 | |
| IT Services 1.3% | |
| Booz Allen Hamilton Holding Corp. (a) | | | 65,000 | | | | 1,129,700 | |
| International Business Machines Corp. | | | 15,000 | | | | 2,866,650 | |
| Total System Services, Inc. | | | 50,000 | | | | 1,224,000 | |
| | | | | | | | 5,220,350 | |
| Office Electronics 0.3% | |
| Xerox Corp. | | | 125,000 | | | | 1,133,750 | |
| Semiconductors & Semiconductor Equipment 1.8% | |
| Broadcom Corp. "A" | | | 35,000 | | | | 1,181,600 | |
| Intel Corp. (a) | | | 110,000 | | | | 2,664,200 | |
| Marvell Technology Group Ltd. | | | 125,000 | | | | 1,463,750 | |
| NVIDIA Corp. (a) | | | 80,000 | | | | 1,122,400 | |
| Texas Instruments, Inc. | | | 25,000 | | | | 871,750 | |
| | | | | | | | 7,303,700 | |
| Software 2.3% | |
| CA, Inc. | | | 50,000 | | | | 1,431,500 | |
| Microsoft Corp. | | | 145,000 | | | | 5,006,850 | |
| Oracle Corp. | | | 90,000 | | | | 2,764,800 | |
| | | | | | | | 9,203,150 | |
| Materials 3.1% | |
| Chemicals 1.5% | |
| CF Industries Holdings, Inc. | | | 7,500 | | | | 1,286,250 | |
| LyondellBasell Industries NV "A" | | | 30,000 | | | | 1,987,800 | |
| Praxair, Inc. | | | 12,000 | | | | 1,381,920 | |
| The Mosaic Co. | | | 28,000 | | | | 1,506,680 | |
| | | | | | | | 6,162,650 | |
| Containers & Packaging 0.5% | |
| Sonoco Products Co. | | | 60,000 | | | | 2,074,200 | |
| Metals & Mining 0.4% | |
| Constellium NV "A"* | | | 90,000 | | | | 1,453,500 | |
| Paper & Forest Products 0.7% | |
| International Paper Co. | | | 35,000 | | | | 1,550,850 | |
| Schweitzer-Mauduit International, Inc. | | | 30,000 | | | | 1,496,400 | |
| | | | | | | | 3,047,250 | |
| Telecommunication Services 2.9% | |
| Diversified Telecommunication Services | |
| AT&T, Inc. | | | 260,000 | | | | 9,204,000 | |
| CenturyLink, Inc. (a) | | | 75,000 | | | | 2,651,250 | |
| | | | | | | | 11,855,250 | |
| Utilities 6.0% | |
| Electric Utilities 3.9% | |
| American Electric Power Co., Inc. | | | 50,000 | | | | 2,239,000 | |
| Duke Energy Corp. | | | 35,000 | | | | 2,362,500 | |
| Exelon Corp. | | | 45,000 | | | | 1,389,600 | |
| FirstEnergy Corp. | | | 55,000 | | | | 2,053,700 | |
| NextEra Energy, Inc. | | | 27,000 | | | | 2,199,960 | |
| Pinnacle West Capital Corp. | | | 30,000 | | | | 1,664,100 | |
| PPL Corp. | | | 50,000 | | | | 1,513,000 | |
| Southern Co. | | | 55,000 | | | | 2,427,150 | |
| | | | | | | | 15,849,010 | |
| Gas Utilities 0.5% | |
| UGI Corp. | | | 50,000 | | | | 1,955,500 | |
| | | Shares | | | Value ($) | |
| | | | | | | | | |
| Independent Power Producers & Energy Traders 0.3% | |
| AES Corp. | | | 90,000 | | | | 1,079,100 | |
| Multi-Utilities 1.3% | |
| Dominion Resources, Inc. | | | 37,500 | | | | 2,130,750 | |
| Public Service Enterprise Group, Inc. | | | 50,000 | | | | 1,633,000 | |
| Wisconsin Energy Corp. | | | 40,000 | | | | 1,639,600 | |
| | | | | | | | 5,403,350 | |
Total Common Stocks (Cost $323,631,673) | | | | 402,734,980 | |
| | |
| | | Shares | | | Value ($) | |
| | | | | | | | | |
| Securities Lending Collateral 8.7% | |
| Daily Assets Fund Institutional, 0.10% (b) (c) (Cost $35,355,055) | | | 35,355,055 | | | | 35,355,055 | |
| | |
| Cash Equivalents 0.7% | |
| Central Cash Management Fund, 0.07% (b) (Cost $2,570,663) | | | 2,570,663 | | | | 2,570,663 | |
| | | % of Net Assets | | | Value ($) | |
| | | | |
Total Investment Portfolio (Cost $361,557,391)† | | | 108.7 | | | | 440,660,698 | |
| Other Assets and Liabilities, Net | | | (8.7 | ) | | | (35,118,317 | ) |
| Net Assets | | | 100.0 | | | | 405,542,381 | |
* Non-income producing security.
† The cost for federal income tax purposes was $363,571,412. At June 30, 2013, net unrealized appreciation for all securities based on tax cost was $77,089,286. This consisted of aggregate gross unrealized appreciation for all securities in which there was an excess of value over tax cost of $82,694,268 and aggregate gross unrealized depreciation for all securities in which there was an excess of tax cost over value of $5,604,982.
(a) All or a portion of these securities were on loan (see Notes to Financial Statements). The value of securities loaned at June 30, 2013 amounted to $34,506,197, which is 8.5% of net assets.
(b) Affiliated fund managed by Deutsche Investment Management Americas Inc. The rate shown is the annualized seven-day yield at period end.
(c) Represents collateral held in connection with securities lending. Income earned by the Fund is net of borrower rebates.
ADR: American Depositary Receipt
Fair Value Measurements
Various inputs are used in determining the value of the Fund's investments. These inputs are summarized in three broad levels. Level 1 includes quoted prices in active markets for identical securities. Level 2 includes other significant observable inputs (including quoted prices for similar securities, interest rates, prepayment speeds, and credit risk). Level 3 includes significant unobservable inputs (including the Fund's own assumptions in determining the fair value of investments). The inputs or methodology used for valuing securities are not necessarily an indication of the risk associated with investing in those securities.
The following is a summary of the inputs used as of June 30, 2013 in valuing the Fund's investments. For information on the Fund's policy regarding the valuation of investments, please refer to the Security Valuation section of Note A in the accompanying Notes to Financial Statements.
| Assets | | Level 1 | | | Level 2 | | | Level 3 | | | Total | |
| | |
| Common Stocks (d) | | $ | 402,734,980 | | | $ | — | | | $ | — | | | $ | 402,734,980 | |
| Short-Term Investments (d) | | | 37,925,718 | | | | — | | | | — | | | | 37,925,718 | |
| Total | | $ | 440,660,698 | | | $ | — | | | $ | — | | | $ | 440,660,698 | |
There have been no transfers between fair value measurement levels during the period ended June 30, 2013.
(d) See Investment Portfolio for additional detailed categorizations.
The accompanying notes are an integral part of the financial statements.
Statement of Assets and Liabilities | as of June 30, 2013 (Unaudited) | |
| Assets | |
Investments: Investments in non-affiliated securities, at value (cost $323,631,673) — including $34,506,197 of securities loaned | | $ | 402,734,980 | |
| Investment in Daily Assets Fund Institutional (cost $35,355,055)* | | | 35,355,055 | |
| Investment in Central Cash Management Fund (cost $2,570,663) | | | 2,570,663 | |
| Total investments in securities, at value (cost $361,557,391) | | | 440,660,698 | |
| Cash | | | 10,000 | |
| Foreign currency , at value (cost $29,619) | | | 29,797 | |
| Receivable for investments sold | | | 1,062,554 | |
| Receivable for Fund shares sold | | | 546 | |
| Dividends receivable | | | 515,483 | |
| Interest receivable | | | 4,298 | |
| Foreign taxes recoverable | | | 2,107 | |
| Other assets | | | 2,074 | |
| Total assets | | | 442,287,557 | |
| Liabilities | |
| Payable upon return of securities loaned | | | 35,355,055 | |
| Payable for investments purchased | | | 768,095 | |
| Payable for Fund shares redeemed | | | 324,092 | |
| Accrued management fee | | | 203,389 | |
| Accrued Trustees' fees | | | 247 | |
| Other accrued expenses and payables | | | 94,298 | |
| Total liabilities | | | 36,745,176 | |
| Net assets, at value | | $ | 405,542,381 | |
| Net Assets Consist of | |
| Undistributed net investment income | | | 3,486,800 | |
Net unrealized appreciation (depreciation) on: Investments | | | 79,103,307 | |
| Foreign currency | | | 178 | |
| Accumulated net realized gain (loss) | | | (114,214,555 | ) |
| Paid-in capital | | | 437,166,651 | |
| Net assets, at value | | $ | 405,542,381 | |
Class A Net Asset Value, offering and redemption price per share ($401,567,620 ÷ 28,752,548 outstanding shares of beneficial interest, no par value, unlimited number of shares authorized) | | $ | 13.97 | |
Class B Net Asset Value, offering and redemption price per share ($3,974,761 ÷ 283,857 outstanding shares of beneficial interest, no par value, unlimited number of shares authorized) | | $ | 14.00 | |
* Represents collateral on securities loaned.
The accompanying notes are an integral part of the financial statements.
Statement of Operations
| for the six months ended June 30, 2013 (Unaudited) | |
| Investment Income | |
Income: Dividends (net of foreign taxes withheld of $19,466) | | $ | 5,149,960 | |
| Income distributions — Central Cash Management Fund | | | 1,042 | |
| Securities lending income, including income from Daily Assets Fund Institutional, net of borrower rebates | | | 13,497 | |
| Total income | | | 5,164,499 | |
Expenses: Management fee | | | 1,283,802 | |
| Administration fee | | | 200,449 | |
| Services to shareholders | | | 2,842 | |
| Record keeping fees (Class B) | | | 1,041 | |
| Distribution and service fee (Class B) | | | 4,820 | |
| Custodian fee | | | 8,343 | |
| Professional fees | | | 34,298 | |
| Reports to shareholders | | | 21,815 | |
| Trustees' fees and expenses | | | 8,053 | |
| Other | | | 7,285 | |
| Total expenses before expense reductions | | | 1,572,748 | |
| Expense reductions | | | (63,098 | ) |
| Total expenses after expense reductions | | | 1,509,650 | |
| Net investment income | | $ | 3,654,849 | |
| Realized and Unrealized Gain (Loss) | |
Net realized gain (loss) from: Investments | | | 26,852,945 | |
| Foreign currency | | | (89 | ) |
| | | | 26,852,856 | |
Change in net unrealized appreciation (depreciation) on: Investments | | | 23,538,146 | |
| Foreign currency | | | (1,842 | ) |
| | | | 23,536,304 | |
| Net gain (loss) | | | 50,389,160 | |
| Net increase (decrease) in net assets resulting from operations | | | 54,044,009 | |
The accompanying notes are an integral part of the financial statements.
Statement of Changes in Net Assets | Increase (Decrease) in Net Assets | | Six Months Ended June 30, 2013 (Unaudited) | | | Year Ended December 31, 2012 | |
Operations: Net investment income | | $ | 3,654,849 | | | $ | 8,087,256 | |
| Net realized gain (loss) | | | 26,852,856 | | | | 9,766,336 | |
| Change in net unrealized appreciation (depreciation) | | | 23,536,304 | | | | 19,604,246 | |
| Net increase (decrease) in net assets resulting from operations | | | 54,044,009 | | | | 37,457,838 | |
Distributions to shareholders from: Net investment income: Class A | | | (8,048,782 | ) | | | (7,645,527 | ) |
| Class B | | | (66,664 | ) | | | (54,663 | ) |
| Total distributions | | | (8,115,446 | ) | | | (7,700,190 | ) |
Fund share transactions: Class A Proceeds from shares sold | | | 3,005,689 | | | | 10,324,918 | |
| Reinvestment of distributions | | | 8,048,782 | | | | 7,645,527 | |
| Payments for shares redeemed | | | (31,927,774 | ) | | | (66,665,475 | ) |
| Net increase (decrease) in net assets from Class A share transactions | | | (20,873,303 | ) | | | (48,695,030 | ) |
Class B Proceeds from shares sold | | | 198,574 | | | | 728,624 | |
| Reinvestment of distributions | | | 66,664 | | | | 54,663 | |
| Payments for shares redeemed | | | (307,946 | ) | | | (918,486 | ) |
| Net increase (decrease) in net assets from Class B share transactions | | | (42,708 | ) | | | (135,199 | ) |
| Increase (decrease) in net assets | | | 25,012,552 | | | | (19,072,581 | ) |
| Net assets at beginning of period | | | 380,529,829 | | | | 399,602,410 | |
| Net assets at end of period (including undistributed net investment income of $3,486,800 and $7,947,397, respectively) | | $ | 405,542,381 | | | $ | 380,529,829 | |
| Other Information | |
Class A Shares outstanding at beginning of period | | | 30,284,545 | | | | 34,282,579 | |
| Shares sold | | | 220,502 | | | | 851,162 | |
| Shares issued to shareholders in reinvestment of distributions | | | 590,519 | | | | 631,340 | |
| Shares redeemed | | | (2,343,018 | ) | | | (5,480,536 | ) |
| Net increase (decrease) in Class A shares | | | (1,531,997 | ) | | | (3,998,034 | ) |
| Shares outstanding at end of period | | | 28,752,548 | | | | 30,284,545 | |
Class B Shares outstanding at beginning of period | | | 286,965 | | | | 298,416 | |
| Shares sold | | | 14,349 | | | | 59,337 | |
| Shares issued to shareholders in reinvestment of distributions | | | 4,877 | | | | 4,499 | |
| Shares redeemed | | | (22,334 | ) | | | (75,287 | ) |
| Net increase (decrease) in Class B shares | | | (3,108 | ) | | | (11,451 | ) |
| Shares outstanding at end of period | | | 283,857 | | | | 286,965 | |
The accompanying notes are an integral part of the financial statements.
| | | | | | Years Ended December 31, | |
| Class A | | Six Months Ended 6/30/13 (Unaudited) | | | 2012 | | | 2011 | | | 2010 | | | 2009 | | | 2008 | |
| Selected Per Share Data | |
| Net asset value, beginning of period | | $ | 12.45 | | | $ | 11.56 | | | $ | 11.80 | | | $ | 10.86 | | | $ | 8.92 | | | $ | 19.21 | |
Income (loss) from investment operations: Net investment income (loss)a | | | .12 | | | | .25 | | | | .25 | | | | .23 | | | | .21 | | | | .21 | |
| Net realized and unrealized gain (loss) | | | 1.68 | | | | .87 | | | | (.24 | ) | | | .93 | | | | 1.97 | | | | (5.68 | ) |
| Total from investment operations | | | 1.80 | | | | 1.12 | | | | .01 | | | | 1.16 | | | | 2.18 | | | | (5.47 | ) |
Less distributions from: Net investment income | | | (.28 | ) | | | (.23 | ) | | | (.25 | ) | | | (.22 | ) | | | (.24 | ) | | | (.34 | ) |
| Net realized gains | | | — | | | | — | | | | — | | | | — | | | | — | | | | (4.48 | ) |
| Total distributions | | | (.28 | ) | | | (.23 | ) | | | (.25 | ) | | | (.22 | ) | | | (.24 | ) | | | (4.82 | ) |
| Net asset value, end of period | | $ | 13.97 | | | $ | 12.45 | | | $ | 11.56 | | | $ | 11.80 | | | $ | 10.86 | | | $ | 8.92 | |
| Total Return (%) | | | 14.50 | b** | | | 9.79 | b | | | (.07 | ) | | | 10.77 | | | | 25.37 | | | | (36.40 | )b |
| Ratios to Average Net Assets and Supplemental Data | |
| Net assets, end of period ($ millions) | | | 402 | | | | 377 | | | | 396 | | | | 206 | | | | 214 | | | | 118 | |
| Ratio of expenses before expense reductions (%) | | | .78 | * | | | .78 | | | | .79 | | | | .82 | | | | .76 | | | | .87 | |
| Ratio of expenses after expense reductions (%) | | | .75 | * | | | .77 | | | | .79 | | | | .82 | | | | .76 | | | | .86 | |
| Ratio of net investment income (loss) (%) | | | 1.83 | * | | | 2.04 | | | | 2.15 | | | | 2.13 | | | | 2.22 | | | | 1.59 | |
| Portfolio turnover rate (%) | | | 41 | ** | | | 63 | | | | 28 | | | | 32 | | | | 76 | | | | 97 | |
a Based on average shares outstanding during the period. b Total return would have been lower had certain expenses not been reduced. * Annualized ** Not annualized | |
| | | | | | Years Ended December 31, | |
| Class B | | Six Months Ended 6/30/13 (Unaudited) | | | 2012 | | | 2011 | | | 2010 | | | 2009 | | | 2008 | |
| Selected Per Share Data | |
| Net asset value, beginning of period | | $ | 12.46 | | | $ | 11.57 | | | $ | 11.81 | | | $ | 10.86 | | | $ | 8.92 | | | $ | 19.20 | |
Income (loss) from investment operations: Net investment income (loss)a | | | .10 | | | | .21 | | | | .22 | | | | .20 | | | | .19 | | | | .12 | |
| Net realized and unrealized gain (loss) | | | 1.68 | | | | .88 | | | | (.25 | ) | | | .93 | | | | 1.96 | | | | (5.64 | ) |
| Total from investment operations | | | 1.78 | | | | 1.09 | | | | (.03 | ) | | | 1.13 | | | | 2.15 | | | | (5.52 | ) |
Less distributions from: Net investment income | | | (.24 | ) | | | (.20 | ) | | | (.21 | ) | | | (.18 | ) | | | (.21 | ) | | | (.28 | ) |
| Net realized gains | | | — | | | | — | | | | — | | | | — | | | | — | | | | (4.48 | ) |
| Total distributions | | | (.24 | ) | | | (.20 | ) | | | (.21 | ) | | | (.18 | ) | | | (.21 | ) | | | (4.76 | ) |
| Net asset value, end of period | | $ | 14.00 | | | $ | 12.46 | | | $ | 11.57 | | | $ | 11.81 | | | $ | 10.86 | | | $ | 8.92 | |
| Total Return (%) | | | 14.29 | b** | | | 9.44 | b | | | (.36 | ) | | | 10.53 | | | | 24.86 | | | | (36.64 | )b |
| Ratios to Average Net Assets and Supplemental Data | |
| Net assets, end of period ($ millions) | | | 4 | | | | 4 | | | | 3 | | | | 1 | | | | 1 | | | | .29 | |
| Ratio of expenses before expense reductions (%) | | | 1.09 | * | | | 1.09 | | | | 1.10 | | | | 1.11 | | | | 1.06 | | | | 1.28 | |
| Ratio of expenses after expense reductions (%) | | | 1.05 | * | | | 1.08 | | | | 1.10 | | | | 1.11 | | | | 1.06 | | | | 1.26 | |
| Ratio of net investment income (loss) (%) | | | 1.53 | * | | | 1.73 | | | | 1.84 | | | | 1.84 | | | | 1.92 | | | | 1.20 | |
| Portfolio turnover rate (%) | | | 41 | ** | | | 63 | | | | 28 | | | | 32 | | | | 76 | | | | 97 | |
a Based on average shares outstanding during the period. b Total return would have been lower had certain expenses not been reduced. * Annualized ** Not annualized | |
Notes to Financial Statements (Unaudited)
A. Organization and Significant Accounting Policies
DWS Large Cap Value VIP (the "Fund") is a diversified series of DWS Variable Series II (the "Trust"), which is registered under the Investment Company Act of 1940, as amended (the "1940 Act"), as an open-end management investment company organized as a Massachusetts business trust.
Multiple Classes of Shares of Beneficial Interest. The Fund offers two classes of shares (Class A shares and Class B shares). Sales of Class B shares are subject to recordkeeping fees up to 0.15% and Rule 12b-1 fees under the 1940 Act equal to an annual rate of 0.25% of the average daily net assets of the Class B shares of the Fund. Class A shares are not subject to such fees.
Investment income, realized and unrealized gains and losses, and certain fund-level expenses and expense reductions, if any, are borne pro rata on the basis of relative net assets by the holders of all classes of shares except that each class bears certain expenses unique to that class (including the applicable Rule 12b-1 fee and recordkeeping fees). Differences in class-level expenses may result in payment of different per share dividends by class. All shares have equal rights with respect to voting subject to class-specific arrangements.
The Fund's financial statements are prepared in accordance with accounting principles generally accepted in the United States of America which require the use of management estimates. Actual results could differ from those estimates. The policies described below are followed consistently by the Fund in the preparation of its financial statements.
Security Valuation. Investments are stated at value determined as of the close of regular trading on the New York Stock Exchange on each day the exchange is open for trading.
Various inputs are used in determining the value of the Fund's investments. These inputs are summarized in three broad levels. Level 1 includes quoted prices in active markets for identical securities. Level 2 includes other significant observable inputs (including quoted prices for similar securities, interest rates, prepayment speeds, and credit risk). Level 3 includes significant unobservable inputs (including the Fund's own assumptions in determining the fair value of investments). The inputs or methodology used for valuing securities are not necessarily an indication of the risk associated with investing in those securities.
Equity securities and exchange traded funds ("ETFs") are valued at the most recent sale price or official closing price reported on the exchange (U.S. or foreign) or over-the-counter market on which they trade and are categorized as Level 1 securities. Securities for which no sales are reported are valued at the calculated mean between the most recent bid and asked quotations on the relevant market or, if a mean cannot be determined, at the most recent bid quotation.
Investments in open-end investment companies are valued at their net asset value each business day and are categorized as Level 1.
Securities and other assets for which market quotations are not readily available or for which the above valuation procedures are deemed not to reflect fair value are valued in a manner that is intended to reflect their fair value as determined in accordance with procedures approved by the Board and are generally categorized as Level 3. In accordance with the Fund's valuation procedures, factors used in determining value may include, but are not limited to, the type of the security; the size of the holding; the initial cost of the security; the existence of any contractual restrictions on the security's disposition; the price and extent of public trading in similar securities of the issuer or of comparable companies; quotations or evaluated prices from broker-dealers and/or pricing services; information obtained from the issuer, analysts, and/or the appropriate stock exchange (for exchange-traded securities); an analysis of the company's or issuer's financial statements; an evaluation of the forces that influence the issuer and the market(s) in which the security is purchased and sold and with respect to debt securities; the maturity, coupon, creditworthiness, currency denomination and the movement of the market in which the security is normally traded. The value determined under these procedures may differ from published values for the same securities.
Disclosure about the classification of fair value measurements is included in a table following the Fund's Investment Portfolio.
Foreign Currency Translations. The books and records of the Fund are maintained in U.S. dollars. Investment securities and other assets and liabilities denominated in a foreign currency are translated into U.S. dollars at the prevailing exchange rates at period end. Purchases and sales of investment securities, income and expenses are translated into U.S. dollars at the prevailing exchange rates on the respective dates of the transactions.
Net realized and unrealized gains and losses on foreign currency transactions represent net gains and losses between trade and settlement dates on securities transactions, the acquisition and disposition of foreign currencies, and the difference between the amount of net investment income accrued and the U.S. dollar amount actually received. That portion of both realized and unrealized gains and losses on investments that results from fluctuations in foreign currency exchange rates is not separately disclosed but is included with net realized and unrealized gain/appreciation and loss/depreciation on investments.
Securities Lending. Deutsche Bank AG, as lending agent, lends securities of the Fund to certain financial institutions under the terms of the Security Lending Agreement. The Fund retains the benefits of owning securities it has loaned and continues to receive interest and dividends generated by the securities and to participate in any changes in their market value. The Fund requires the borrowers of the securities to maintain collateral with the Fund consisting of either cash or liquid, unencumbered assets having a value at least equal to the value of the securities loaned. When the collateral falls below specified amounts, the lending agent will use its best effort to obtain additional collateral on the next business day to meet required amounts under the security lending agreement. The Fund may invest the cash collateral into a joint trading account in an affiliated money market fund pursuant to Exemptive Orders issued by the SEC. The Fund receives compensation for lending its securities either in the form of fees or by earning interest on invested cash collateral net of borrower rebates and fees paid to a lending agent. Either the Fund or the borrower may terminate the loan. There may be risks of delay and costs in recovery of securities or even loss of rights in the collateral should the borrower of the securities fail financially. If the Fund is not able to recover securities lent, the Fund may sell the collateral and purchase a replacement investment in the market, incurring the risk that the value of the replacement security is greater than the value of the collateral. The Fund is also subject to all investment risks associated with the reinvestment of any cash collateral received, including, but not limited to, interest rate, credit and liquidity risk associated with such investments.
As of June 30, 2013, the Fund had securities on loan with a gross value of $34,506,197. The value of the related collateral, $35,355,055, exceeded the value of the securities loaned at period end.
Federal Income Taxes. The Fund's policy is to comply with the requirements of the Internal Revenue Code, as amended, which are applicable to regulated investment companies and to distribute all of its taxable income to its shareholders.
Under the Regulated Investment Company Modernization Act of 2010, net capital losses incurred post-enactment may be carried forward indefinitely, and their character is retained as short-term and/or long-term. Previously, net capital losses were carried forward for eight years and treated as short-term losses. As a transition rule, the Act requires that post-enactment net capital losses be used before pre-enactment net capital losses.
At December 31, 2012, the Fund had a net tax basis capital loss carryforward of approximately $137,753,000 of pre-enactment losses, including approximately $116,135,000 inherited from its merger with an affiliated fund in previous years, which may be applied against any realized net taxable capital gains of each succeeding year until fully utilized or until December 31, 2015 ($8,454,000), December 31, 2016 ($120,989,000) and December 31, 2017 ($8,310,000), the respective expiration dates, whichever occurs first, and which may be subject to certain limitations under Section 382-384 of Internal Revenue Code.
In addition, from November 1, 2012 through December 31, 2012, the Fund elects to defer qualified late year losses of approximately $1,300,000 of net short-term realized capital losses and treat them as arising in the fiscal year ending December 31, 2013.
The Fund has reviewed the tax positions for the open tax years as of December 31, 2012 and has determined that no provision for income tax is required in the Fund's financial statements. The Fund's federal tax returns for the prior three fiscal years remain open subject to examination by the Internal Revenue Service.
Distribution of Income and Gains. Distributions from net investment income of the Fund, if any, is declared and distributed to shareholders annually. Net realized gains from investment transactions, in excess of available capital loss carryforwards, would be taxable to the Fund if not distributed and, therefore, will be distributed to shareholders at least annually. The Fund may also make additional distributions for tax purposes if necessary.
The timing and characterization of certain income and capital gain distributions are determined annually in accordance with federal tax regulations which may differ from accounting principles generally accepted in the United States of America. These differences primarily relate to certain securities sold at a loss. As a result, net investment income (loss) and net realized gain (loss) on investment transactions for a reporting period may differ significantly from distributions during such period. Accordingly, the Fund may periodically make reclassifications among certain of its capital accounts without impacting the net asset value of the Fund.
The tax character of current year distributions will be determined at the end of the current fiscal year.
Expenses. Expenses of the Trust arising in connection with a specific fund are allocated to that fund. Other Trust expenses which cannot be directly attributed to a fund are apportioned among the funds in the Trust based upon the relative net assets or other appropriate measures.
Contingencies. In the normal course of business, the Fund may enter into contracts with service providers that contain general indemnification clauses. The Fund's maximum exposure under these arrangements is unknown as this would involve future claims that may be made against the Fund that have not yet been made. However, based on experience, the Fund expects the risk of loss to be remote.
Other. Investment transactions are accounted for on a trade date plus one basis for daily net asset value calculations. However, for financial reporting purposes, investment transactions are reported on trade date. Interest income is recorded on the accrual basis. Dividend income is recorded on the ex-dividend date net of foreign withholding taxes. Realized gains and losses from investment transactions are recorded on an identified cost basis and may include proceeds from litigation.
B. Purchases and Sales of Securities
During the six months ended June 30, 2013, purchases and sales of investment transactions (excluding short-term investments) aggregated $162,617,990 and $185,879,810, respectively.
C. Related Parties
Management Agreement. Under the Investment Management Agreement with Deutsche Investment Management Americas Inc. ("DIMA" or the "Advisor"), an indirect, wholly owned subsidiary of Deutsche Bank AG, the Advisor directs the investments of the Fund in accordance with its investment objectives, policies and restrictions. The Advisor determines the securities, instruments and other contracts relating to investments to be purchased, sold or entered into by the Fund.
Under the Investment Management Agreement with the Advisor, the Fund pays a monthly management fee based on the Fund's average daily net assets, computed and accrued daily and payable monthly, at the following annual rates:
| First $250 million | | | .650 | % |
| Next $750 million | | | .625 | % |
| Next $1.5 billion | | | .600 | % |
| Next $2.5 billion | | | .575 | % |
| Next $2.5 billion | | | .550 | % |
| Next $2.5 billion | | | .525 | % |
| Next $2.5 billion | | | .500 | % |
| Over $12.5 billion | | | .475 | % |
For the period from January 1, 2013 through September 30, 2013, the Advisor has contractually agreed to waive all or a portion of its fees and/or reimburse certain operating expenses of the Fund to the extent necessary to maintain the operating expenses (excluding certain expenses such as extraordinary expenses, taxes, brokerage and interest) of each class as follows:
Accordingly, for the six months ended June 30, 2013, the Advisor waived a portion of its management fee pursuant to the Investment Management Agreement aggregating $62,734, and the amount charged aggregated $1,221,068, which was equivalent to an annualized effective rate of 0.61% of the Fund's average daily net assets.
Administration Fee. Pursuant to an Administrative Services Agreement, DIMA provides most administrative services to the Fund. For all services provided under the Administrative Services Agreement, the Fund pays DIMA an annual fee ("Administration Fee") of 0.10% of the Fund's average daily net assets, computed and accrued daily and payable monthly. For the six months ended June 30, 2013, the Administration Fee was $200,449, of which $33,616 is unpaid.
Service Provider Fees. DWS Investments Service Company ("DISC"), an affiliate of the Advisor, is the transfer agent, dividend-paying agent and shareholder service agent for the Fund. Pursuant to a sub-transfer agency agreement between DISC and DST Systems, Inc. ("DST"), DISC has delegated certain transfer agent, dividend-paying agent and shareholder service agent functions to DST. DISC compensates DST out of the shareholder servicing fee it receives from the Fund. For the six months ended June 30, 2013, the amounts charged to the Fund by DISC were as follows:
| Services to Shareholders | | Total Aggregated | | | Waived | |
| Class A | | $ | 184 | | | $ | 184 | |
| Class B | | | 94 | | | | 94 | |
| | | $ | 278 | | | $ | 278 | |
In addition, for the six months ended June 30, 2013, the Advisor reimbursed the Fund $86 of record keeping fees for Class B shares.
Distribution Service Agreement. Under the Fund's Class B 12b-1 plans, DWS Investments Distributors, Inc. ("DIDI") received a fee ("Distribution Service Fee") of 0.25% of average daily net assets of Class B shares. For the six months ended June 30, 2013, the Distribution Service Fee aggregated $4,820, of which $822 is unpaid.
Typesetting and Filing Service Fees. Under an agreement with DIMA, DIMA is compensated for providing typesetting and certain regulatory filing services to the Fund. For the six months ended June 30, 2013, the amount charged to the Fund by DIMA included in the Statement of Operations under "reports to shareholders" aggregated $7,421, of which $7,253 is unpaid.
Trustees' Fees and Expenses. The Fund paid retainer fees to each Trustee not affiliated with the Advisor, plus specified amounts to the Board Chairperson and Vice Chairperson and to each committee Chairperson.
Affiliated Cash Management Vehicles. The Fund may invest uninvested cash balances in Central Cash Management Fund and DWS Variable NAV Money Fund, affiliated money market funds which are managed by the Advisor. Each affiliated money market fund seeks to provide a high level of current income consistent with liquidity and the preservation of capital. Each affiliated money market fund is managed in accordance with Rule 2a-7 under the Investment Company Act of 1940, which governs the quality, maturity, diversity and liquidity of instruments in which a money market fund may invest. Central Cash Management Fund seeks to maintain a stable net asset value, and DWS Variable NAV Money Fund maintains a floating net asset value. The Fund indirectly bears its proportionate share of the expenses of each affiliated money market fund in which it invests. Central Cash Management Fund does not pay the Advisor an investment management fee. To the extent that DWS Variable NAV Money Fund pays an investment management fee to the Advisor, the Advisor will waive an amount of the investment management fee payable to the Advisor by the Fund equal to the amount of the investment management fee payable on the Fund's assets invested in DWS Variable NAV Money Fund.
Securities Lending Agent Fees. Deutsche Bank AG serves as securities lending agent for the Fund. For the six months ended June 30, 2013, the Fund incurred securities lending agent fees to Deutsche Bank AG in the amount of $1,500.
D. Ownership of the Fund
At June 30, 2013, two Participating Insurance Companies were owners of record of 10% or more of the total outstanding Class A shares of the Fund, each owning 55% and 27%. Two Participating Insurance Companies were owners of record of 10% or more of the total outstanding Class B shares of the Fund, each owning 63% and 10%.
E. Line of Credit
The Fund and other affiliated funds (the "Participants") share in a $375 million revolving credit facility provided by a syndication of banks. The Fund may borrow for temporary or emergency purposes, including the meeting of redemption requests that otherwise might require the untimely disposition of securities. The Participants are charged an annual commitment fee which is allocated based on net assets, among each of the Participants. Interest is calculated at a rate per annum equal to the sum of the Federal Funds Rate plus 1.25 percent plus if LIBOR exceeds the Federal Funds Rate the amount of such excess. The Fund may borrow up to a maximum of 33 percent of its net assets under the agreement. The Fund had no outstanding loans at June 30, 2013.
Information About Your Fund's Expenses (Unaudited)
As an investor of the Fund, you incur two types of costs: ongoing expenses and transaction costs. Ongoing expenses include management fees, distribution and service (12b-1) fees and other Fund expenses. Examples of transaction costs include contract charges and account maintenance fees, which are not shown in this section. The following tables are intended to help you understand your ongoing expenses (in dollars) of investing in the Fund and to help you compare these expenses with the ongoing expenses of investing in other mutual funds. In the most recent six-month period, the Fund limited these expenses; had it not done so, expenses would have been higher. The example in the table is based on an investment of $1,000 invested at the beginning of the six-month period and held for the entire period (January 1, 2013 to June 30, 2013).
The tables illustrate your Fund's expenses in two ways:
•Actual Fund Return. This helps you estimate the actual dollar amount of ongoing expenses (but not transaction costs) paid on a $1,000 investment in the Fund using the Fund's actual return during the period. To estimate the expenses you paid over the period, simply divide your account value by $1,000 (for example, an $8,600 account value divided by $1,000 = 8.6), then multiply the result by the number in the "Expenses Paid per $1,000" line under the share class you hold.
• Hypothetical 5% Fund Return. This helps you to compare your Fund's ongoing expenses (but not transaction costs) with those of other mutual funds using the Fund's actual expense ratio and a hypothetical rate of return of 5% per year before expenses. Examples using a 5% hypothetical Fund return may be found in the shareholder reports of other mutual funds. The hypothetical account values and expenses may not be used to estimate the actual ending account balance or expenses you paid for the period.
Please note that the expenses shown in these tables are meant to highlight your ongoing expenses only and do not reflect any transaction costs. The "Expenses Paid per $1,000" line of the tables is useful in comparing ongoing expenses only and will not help you determine the relative total expense of owning different funds. If these transaction costs had been included, your costs would have been higher.
Expenses and Value of a $1,000 Investment for the six months ended June 30, 2013 | |
| Actual Fund Return | | Class A | | | Class B | |
| Beginning Account Value 1/1/13 | | $ | 1,000.00 | | | $ | 1,000.00 | |
| Ending Account Value 6/30/13 | | $ | 1,145.00 | | | $ | 1,142.90 | |
| Expenses Paid per $1,000* | | $ | 3.99 | | | $ | 5.58 | |
| Hypothetical 5% Fund Return | | Class A | | | Class B | |
| Beginning Account Value 1/1/13 | | $ | 1,000.00 | | | $ | 1,000.00 | |
| Ending Account Value 6/30/13 | | $ | 1,021.08 | | | $ | 1,019.59 | |
| Expenses Paid per $1,000* | | $ | 3.76 | | | $ | 5.26 | |
* Expenses are equal to the Fund's annualized expense ratio for each share class, multiplied by the average account value over the period, multiplied by 181 (the number of days in the most recent six-month period), then divided by 365.
| Annualized Expense Ratios | Class A | | Class B | |
| DWS Variable Series II — DWS Large Cap Value VIP | .75% | | 1.05% | |
For more information, please refer to the Fund's prospectus.
These tables do not reflect charges and fees ("contract charges") associated with the separate account that invests in the Fund or any variable life insurance policy or variable annuity contract for which the Fund is an investment option.
For an analysis of the fees associated with an investment in the Fund or similar funds, please refer to http://apps.finra.org/fundanalyzer/1/fa.aspx.
The Trust's policies and procedures for voting proxies for portfolio securities and information about how the Trust voted proxies related to its portfolio securities during the 12-month period ended June 30 are available on our Web site — www.dws-investments.com (click on "proxy voting" at the bottom of the page) — or on the SEC's Web site — www.sec.gov. To obtain a written copy of the Trust's policies and procedures without charge, upon request, call us toll free at (800) 728-3337.
Summary of Management Fee Evaluation by Independent Fee Consultant
September 17, 2012
Pursuant to an Order entered into by Deutsche Investment Management Americas and affiliates (collectively, "DeAM") with the Attorney General of New York, I, Thomas H. Mack, have been appointed the Independent Fee Consultant for the DWS Funds (formerly the DWS Scudder Funds). My duties include preparing an annual written evaluation of the management fees DeAM charges the Funds, considering among other factors the management fees charged by other mutual fund companies for like services, management fees DeAM charges other clients for like services, DeAM's costs of supplying services under the management agreements and related profit margins, possible economies of scale if a Fund grows larger, and the nature and quality of DeAM's services, including fund performance. This report summarizes my evaluation for 2012, including my qualifications, the evaluation process for each of the DWS Funds, consideration of certain complex-level factors, and my conclusions. I served in substantially the same capacity in 2007, 2008, 2009, 2010 and 2011.
Qualifications
For more than 35 years I have served in various professional capacities within the investment management business. I have held investment analysis and advisory positions, including securities analyst, portfolio strategist and director of investment policy with a large investment firm. I have also performed business management functions, including business development, financial management and marketing research and analysis.
Since 1991, I have been an independent consultant within the asset management industry. I have provided services to over 125 client organizations, including investment managers, mutual fund boards, product distributors and related organizations. Over the past ten years I have completed a number of assignments for mutual fund boards, specifically including assisting boards with management contract renewal.
I hold a Master of Business Administration degree, with highest honors, from Harvard University and Master of Science and Bachelor of Science (highest honors) degrees from the University of California at Berkeley. I am an independent director and audit committee financial expert for two closed-end mutual funds and have served in various leadership and financial oversight capacities with non-profit organizations.
Evaluation of Fees for each DWS Fund
My work focused primarily on evaluating, fund-by-fund, the fees charged to each of the 103 mutual fund portfolios in the DWS Fund family. For each Fund, I considered each of the key factors mentioned above, as well as any other relevant information. In doing so I worked closely with the Funds' Independent Directors in their annual contract renewal process, as well as in their approval of contracts for several new funds (documented separately).
In evaluating each Fund's fees, I reviewed comprehensive materials provided by or on behalf of DeAM, including expense information prepared by Lipper Analytical, comparative performance information, profitability data, manager histories, and other materials. I also accessed certain additional information from the Lipper and Morningstar databases and drew on my industry knowledge and experience.
To facilitate evaluating this considerable body of information, I prepared for each Fund a document summarizing the key data elements in each area as well as additional analytics discussed below. This made it possible to consider each key data element in the context of the others.
In the course of contract renewal, DeAM agreed to implement a number of fee and expense adjustments requested by the Independent Directors which will favorably impact future fees and expenses, and my evaluation includes the effects of these changes.
Fees and Expenses Compared with Other Funds
The competitive fee and expense evaluation for each fund focused on two primary comparisons:
The Fund's contractual management fee (the advisory fee plus the administration fee where applicable) compared with those of a group of typically 12-15 funds in the same Lipper investment category (e.g. Large Capitalization Growth) having similar distribution arrangements and being of similar size.
The Fund's total expenses compared with a broader universe of funds from the same Lipper investment category and having similar distribution arrangements.
These two comparisons provide a view of not only the level of the fee compared with funds of similar scale but also the total expense the Fund bears for all the services it receives, in comparison with the investment choices available in the Fund's investment category and distribution channel. The principal figure-of-merit used in these comparisons was the subject Fund's percentile ranking against peers.
DeAM's Fees for Similar Services to Others
DeAM provided management fee schedules for all of its US domiciled fund and non-fund investment management accounts in any of the investment categories where there is a DWS Fund. These similar products included the other DWS Funds, non-fund pooled accounts, institutional accounts and sub-advisory accounts. Using this information, I calculated for each Fund the fee that would be charged to each similar product, at the subject Fund's asset level.
Evaluating information regarding non-fund products is difficult because there are varying levels of services required for different types of accounts, with mutual funds generally requiring considerably more regulatory and administrative types of service as well as having more frequent cash flows than other types of accounts. Also, while mutual fund fees for similar fund products can be expected to be similar, there will be some differences due to different pricing conditions in different distribution channels (e.g. retail funds versus those used in variable insurance products), differences in underlying investment processes and other factors.
Costs and Profit Margins
DeAM provided a detailed profitability analysis for each Fund. After making some adjustments so that the presentation would be more comparable to the available industry figures, I reviewed profit margins from investment management alone, from investment management plus other fund services (excluding distribution) provided to the Funds by DeAM (principally shareholder services), and DeAM profits from all sources, including distribution. A later section comments on overall profitability.
Economies of Scale
Economies of scale — an expected decline in management cost per dollar of fund assets as fund assets grow — are very rarely quantified and documented because of inherent difficulties in collecting and analyzing relevant data. However, in virtually every investment category that I reviewed, larger funds tend to have lower fees and lower total expenses than smaller funds. To see how each DWS Fund compares with this industry observation, I reviewed:
The trend in Fund assets over the last five years and the accompanying trend in total expenses. This shows if the Fund has grown and, if so, whether total expense (management fees as well as other expenses) have declined as a percent of assets.
Whether the Fund has break-points in its management fee schedule, the extent of the fee reduction built into the schedule and the asset levels where the breaks take effect, and in the case of a sub-advised Fund how the Fund's break-points compare with those of the sub-advisory fee schedule.
How the Fund's contractual fee schedule compares with trends in the industry data. To accomplish this, I constructed a chart showing how actual latest-fiscal-year contractual fees of the Fund and of other similar funds relate to average fund assets, with the subject Fund's contractual fee schedule superimposed.
Quality of Service — Performance
The quality-of-service evaluation focused on investment performance, which is the principal result of the investment management service. Each Fund's performance was reviewed over the past 1, 3, 5 and 10 years, as applicable, and compared with that of other funds in the same investment category and with a suitable market index.
In addition, I calculated and reviewed risk-adjusted returns relative to an index of similar mutual funds' returns and a suitable market index. The risk-adjusted returns analysis provides a way of determining the extent to which the Fund's return comparisons are mainly the product of investment value-added (or lack thereof) or alternatively taking considerably more or less risk than is typical in its investment category.
I also received and considered the history of portfolio manager changes for each Fund, as this provided an important context for evaluating the performance results.
Complex-Level Considerations
While this evaluation was conducted mainly at the individual fund level, there are some issues relating to the reasonableness of fees that can alternatively be considered across the whole fund complex:
I reviewed DeAM's profitability analysis for all DWS Funds, with a view toward determining if the allocation procedures used were reasonable and how profit levels compared with public data for other investment managers.
I considered whether DeAM and affiliates receive any significant ancillary or "fallout" benefits that should be considered in interpreting the direct profitability results. These would be situations where serving as the investment manager of the Funds is beneficial to another part of the Deutsche Bank organization.
I considered how aggregated DWS Fund expenses had varied over the years, by asset class and in the context of trends in asset levels.
I considered how aggregated DWS Fund performance measures relative to appropriate peers had varied by asset class and over time.
I reviewed the structure of the DeAM organization, trends in staffing levels, and information on compensation of investment management and other professionals compared with industry data.
Findings
Based on the process and analysis discussed above, which included reviewing a wide range of information from management and external data sources and considering among other factors the fees DeAM charges other clients, the fees charged by other fund managers, DeAM's costs and profits associated with managing the Funds, economies of scale, possible fall-out benefits, and the nature and quality of services provided, in my opinion the management fees charged the DWS Funds are reasonable.
Thomas H. Mack
President, Thomas H. Mack & Co., Inc.
Notes
DWS Investments Distributors, Inc.
222 South Riverside Plaza
Chicago, IL 60606
(800) 621-1148
VS2LCV-3 (R-028386-2 8/13)
JUNE 30, 2013
SEMIANNUAL REPORT
DWS VARIABLE SERIES II
DWS Money Market VIP
Contents
9 Statement of Assets and Liabilities 10 Statement of Operations 11 Statement of Changes in Net Assets 14 Notes to Financial Statements 16 Information About Your Fund's Expenses 18 Summary of Management Fee Evaluation by Independent Fee Consultant |
This report must be preceded or accompanied by a prospectus. To obtain an additional prospectus or summary prospectus, if available, call (800) 728-3337 or your financial representative. We advise you to consider the Fund's objectives, risks, charges and expenses carefully before investing. The summary prospectus and prospectus contain this and other important information about the Fund. Please read the prospectus carefully before you invest.
An investment in this Fund is not insured or guaranteed by the Federal Deposit Insurance Corporation (FDIC) or by any other government agency. Although the Fund seeks to preserve the value of your investment at $1.00 per share, it is possible to lose money by investing in the Fund. The share price of money market funds can fall below the $1.00 share price. You should not rely on or expect the Advisor to enter into support agreements or take other actions to maintain the Fund's $1.00 share price. The credit quality of the Fund's holdings can change rapidly in certain markets, and the default of a single holding could have an adverse impact on the Fund's share price. The Fund's share price can also be negatively affected during periods of high redemption pressures and/or illiquid markets. The actions of a few large investors in the Fund may have a significant adverse effect on the share price of the Fund. See the prospectus for specific details regarding the Fund's risk profile.
DWS Investments is part of the Deutsche Asset & Wealth Management division of Deutsche Bank AG.
NOT FDIC/NCUA INSURED NO BANK GUARANTEE MAY LOSE VALUE NOT A DEPOSIT
NOT INSURED BY ANY FEDERAL GOVERNMENT AGENCY
Performance Summary June 30, 2013 (Unaudited)
DWS Money Market VIP
All performance shown is historical, assumes reinvestment of all dividend and capital gain distributions and does not guarantee future results. Investment return and principal value fluctuate with changing market conditions so that, when redeemed, shares may be worth more or less than their original cost. Current performance may be lower or higher than the performance data quoted. Please contact your participating insurance company for the Fund's most recent month-end performance. Performance doesn't reflect charges and fees ("contract charges") associated with the separate account that invests in the Fund or any variable life insurance policy or variable annuity contract for which the Fund is an investment option. These charges and fees will reduce returns. The yield quotation more closely reflects the current earnings of the Fund than the total return quotation.
An investment in this Fund is not insured or guaranteed by the Federal Deposit Insurance Corporation (FDIC) or by any other government agency. Although the Fund seeks to preserve the value of your investment at $1.00 per share, it is possible to lose money by investing in the Fund. The share price of money market funds can fall below the $1.00 share price.
| | 7-day current yield |
| June 30, 2013 | 0.01%* |
| December 31, 2012 | 0.01%* |
* The investment advisor has agreed to waive fees/reimburse expenses. This wavier may be changed or terminated at any time without notice.
Yields are historical, will fluctuate and do not guarantee future performance. The 7-day current yield refers to the income paid by the Fund over a 7-day period expressed as an annual percentage rate of the Fund's shares outstanding.
Portfolio Summary (Unaudited) Asset Allocation (As a % of Investment Portfolio) | 6/30/13 | 12/31/12 |
| | | |
| Commercial Paper | 37% | 38% |
| Repurchase Agreements | 21% | 23% |
| Certificates of Deposit and Bank Notes | 15% | 12% |
| Government & Agency Obligations | 12% | 10% |
| Short-Term Notes | 9% | 13% |
| Time Deposit | 4% | 2% |
| Municipal Bonds and Notes | 2% | 2% |
| | 100% | 100% |
| Weighted Average Maturity* | 6/30/13 | 12/31/12 |
| | | |
| DWS Variable Series II — DWS Money Market VIP | 46 days | 48 days |
| First Tier Retail Money Fund Average | 44 days | 43 days |
* The Fund is compared to its respective iMoneyNet Category: First Tier Retail Money Fund Average — Category includes a widely recognized composite of money market funds that invest in only first tier (highest rating) securities. Portfolio Holdings of First Tier funds include U.S. Treasury, U.S. Other, Repos, Time Deposits, Domestic Bank Obligations, Foreign Bank Obligations, First Tier Commercial Paper, Floating Rate Notes and Asset Backed Commercial Paper.
Weighted average maturity, also known as effective maturity, is the weighted average of the maturity date of bonds held by the Fund taking into consideration any available maturity shortening features.
Portfolio holdings and characteristics are subject to change.
For more complete details about the Fund's investment portfolio, see page 5.
Following the Fund's fiscal first and third quarter-end, a complete portfolio holdings listing is filed with the SEC on Form N-Q. In addition, each month, information about the Fund and its portfolio holdings is filed with the SEC on Form N-MFP. The SEC delays the public availability of the information filed on Form N-MFP for 60 days after the end of the reporting period included in the filing. These forms will be available on the SEC's Web site at www.sec.gov, and they may also be reviewed and copied at the SEC's Public Reference Room in Washington, D.C. Information on the operation of the SEC's Public Reference Room may be obtained by calling (800) SEC-0330. The Fund's portfolio holdings are also posted on www.dws-investments.com from time to time. Please see the Fund's current prospectus for more information.
Investment Portfolio June 30, 2013 (Unaudited) | | | Principal Amount ($) | | | Value ($) | |
| | | | |
| Certificates of Deposit and Bank Notes 15.3% | |
| Banco del Estado de Chile, 0.27%, 11/14/2013 | | | 500,000 | | | | 500,000 | |
| Bank of Nova Scotia, 0.27%, 12/11/2013 | | | 800,000 | | | | 800,072 | |
| Caisse d'Amortissement de la Dette Sociale, 1.375%, 7/29/2013 | | | 500,000 | | | | 500,436 | |
| China Construction Bank Corp., 0.39%, 8/28/2013 | | | 1,200,000 | | | | 1,200,000 | |
| Credit Suisse: | |
| 0.24%, 8/30/2013 | | | 1,000,000 | | | | 1,000,000 | |
| 0.25%, 8/8/2013 | | | 2,000,000 | | | | 2,000,000 | |
| DNB Bank ASA: | |
| 0.19%, 10/3/2013 | | | 2,000,000 | | | | 2,000,000 | |
| 0.225%, 7/3/2013 | | | 1,000,000 | | | | 1,000,000 | |
| 0.23%, 11/20/2013 | | | 2,000,000 | | | | 2,000,000 | |
| DZ Bank AG: | |
| 0.19%, 10/1/2013 | | | 2,000,000 | | | | 2,000,000 | |
| 0.21%, 8/2/2013 | | | 1,000,000 | | | | 1,000,000 | |
| 0.21%, 8/12/2013 | | | 1,000,000 | | | | 1,000,000 | |
| Industrial & Commercial Bank of China: | | | | | | | | |
| 0.4%, 8/28/2013 | | | 1,500,000 | | | | 1,500,000 | |
| 0.4%, 9/6/2013 | | | 1,000,000 | | | | 1,000,000 | |
| International Business Machines Corp., 1.25%, 5/12/2014 | | | 500,000 | | | | 504,211 | |
| Kreditanstalt Fuer Wiederaufbau, 0.22%, 4/11/2014 | | | 1,000,000 | | | | 999,711 | |
| Mitsubishi UFJ Trust & Banking Corp., 0.22%, 7/22/2013 | | | 1,000,000 | | | | 1,000,000 | |
| Mizuho Corporate Bank Ltd.: | |
| 0.23%, 9/9/2013 | | | 1,000,000 | | | | 1,000,000 | |
| 0.24%, 8/9/2013 | | | 1,000,000 | | | | 1,000,000 | |
| Nordea Bank Finland PLC, 0.25%, 9/9/2013 | | | 1,000,000 | | | | 1,000,000 | |
| Norinchukin Bank: | |
| 0.14%, 7/11/2013 | | | 1,000,000 | | | | 1,000,000 | |
| 0.24%, 8/9/2013 | | | 1,000,000 | | | | 1,000,000 | |
| Rabobank Nederland NV: | |
| 0.27%, 9/9/2013 | | | 1,000,000 | | | | 1,000,000 | |
| 0.405%, 1/8/2014 | | | 1,000,000 | | | | 1,000,713 | |
| Sumitomo Mitsui Banking Corp., 0.24%, 8/23/2013 | | | 1,000,000 | | | | 1,000,000 | |
| Svenska Handelsbanken AB: | |
| 0.225%, 7/12/2013 | | | 1,000,000 | | | | 1,000,001 | |
| 0.255%, 9/26/2013 | | | 1,000,000 | | | | 1,000,012 | |
| 0.28%, 7/23/2013 | | | 1,000,000 | | | | 1,000,003 | |
Total Certificates of Deposit and Bank Notes (Cost $31,005,159) | | | | 31,005,159 | |
| | |
| Commercial Paper 37.0% | |
| Issued at Discount** 33.7% | |
| ASB Finance Ltd., 0.25%, 12/17/2013 | | | 1,500,000 | | | | 1,498,240 | |
| Bedford Row Funding Corp.: | |
| 144A, 0.32%, 7/15/2013 | | | 400,000 | | | | 399,950 | |
| 144A, 0.39%, 10/21/2013 | | | 400,000 | | | | 399,515 | |
| 144A, 0.42%, 1/3/2014 | | | 400,000 | | | | 399,132 | |
| Caisse Centrale Desjardins du Quebec: | |
| 0.15%, 7/22/2013 | | | 2,000,000 | | | | 1,999,825 | |
| 0.205%, 8/19/2013 | | | 1,000,000 | | | | 999,721 | |
| | | Principal Amount ($) | | | Value ($) | |
| | | | | | | | | |
| Caisse d'Amortissement de la Dette Sociale, 0.27%, 8/6/2013 | | | 1,000,000 | | | | 999,730 | |
| Caisse des Depots et Consignations: | |
| 144A, 0.22%, 9/5/2013 | | | 1,000,000 | | | | 999,597 | |
| 144A, 0.255%, 12/13/2013 | | | 1,200,000 | | | | 1,198,597 | |
| 144A, 0.26%, 9/27/2013 | | | 900,000 | | | | 899,428 | |
| 144A, 0.275%, 10/9/2013 | | | 500,000 | | | | 499,618 | |
| Collateralized Commercial Paper Co., LLC, 0.24%, 8/6/2013 | | | 1,500,000 | | | | 1,499,640 | |
| Collateralized Commercial Paper II Co., LLC: | | | | | | | | |
| 144A, 0.225%, 9/16/2013 | | | 800,000 | | | | 799,615 | |
| 144A, 0.225%, 9/17/2013 | | | 1,000,000 | | | | 999,512 | |
| 144A, 0.25%, 7/9/2013 | | | 1,000,000 | | | | 999,944 | |
| DBS Bank Ltd.: | |
| 144A, 0.25%, 9/12/2013 | | | 800,000 | | | | 799,594 | |
| 144A, 0.26%, 10/4/2013 | | | 500,000 | | | | 499,657 | |
| Erste Abwicklungsanstalt: | |
| 0.2%, 10/30/2013 | | | 1,000,000 | | | | 999,328 | |
| 0.24%, 8/1/2013 | | | 1,000,000 | | | | 999,793 | |
| 0.39%, 7/22/2013 | | | 1,000,000 | | | | 999,772 | |
| 0.425%, 7/8/2013 | | | 1,000,000 | | | | 999,917 | |
| 0.43%, 7/19/2013 | | | 1,000,000 | | | | 999,785 | |
| 0.43%, 8/13/2013 | | | 800,000 | | | | 799,589 | |
| Exxon Mobil Corp., 0.09%, 7/29/2013 | | | 1,500,000 | | | | 1,499,895 | |
| Kells Funding LLC: | |
| 144A, 0.25%, 9/17/2013 | | | 1,000,000 | | | | 999,458 | |
| 144A, 0.25%, 9/20/2013 | | | 1,000,000 | | | | 999,437 | |
| 144A, 0.25%, 10/3/2013 | | | 500,000 | | | | 499,674 | |
| 144A, 0.26%, 8/15/2013 | | | 1,000,000 | | | | 999,675 | |
| 144A, 0.26%, 8/27/2013 | | | 500,000 | | | | 499,794 | |
| LMA Americas LLC, 144A, 0.2%, 7/29/2013 | | | 2,000,000 | | | | 1,999,689 | |
| Matchpoint Master Trust, 0.19%, 8/16/2013 | | | 1,500,000 | | | | 1,499,636 | |
| Nederlandse Waterschapsbank NV, 0.2%, 10/7/2013 | | | 2,000,000 | | | | 1,998,911 | |
| Nissan Motor Acceptance Corp., 0.3%, 7/26/2013 | | | 500,000 | | | | 499,896 | |
| Nordea North America, Inc.: | |
| 0.24%, 11/8/2013 | | | 800,000 | | | | 799,307 | |
| 0.26%, 8/26/2013 | | | 500,000 | | | | 499,798 | |
| 0.275%, 7/16/2013 | | | 1,000,000 | | | | 999,885 | |
| Oversea-Chinese Banking Corp., Ltd., 0.17%, 8/1/2013 | | | 4,000,000 | | | | 3,999,414 | |
| Regency Markets No. 1 LLC: | |
| 144A, 0.16%, 7/11/2013 | | | 1,500,000 | | | | 1,499,933 | |
| 144A, 0.17%, 7/15/2013 | | | 2,000,000 | | | | 1,999,868 | |
| 144A, 0.17%, 7/16/2013 | | | 1,500,000 | | | | 1,499,894 | |
| Scaldis Capital LLC, 0.199%, 8/12/2013 | | | 3,000,000 | | | | 2,999,300 | |
| Sinopec Century Bright Capital Investment Ltd., 0.27%, 7/11/2013 | | | 700,000 | | | | 699,948 | |
| Skandinaviska Enskilda Banken AB: | |
| 0.15%, 7/9/2013 | | | 2,350,000 | | | | 2,349,922 | |
| 0.22%, 7/2/2013 | | | 1,000,000 | | | | 999,994 | |
| 0.235%, 10/3/2013 | | | 1,500,000 | | | | 1,499,080 | |
| Standard Chartered Bank, 0.27%, 7/11/2013 | | | 2,000,000 | | | | 1,999,850 | |
| Starbird Funding Corp., 144A, 0.08%, 7/1/2013 | | | 4,235,000 | | | | 4,235,000 | |
| | | Principal Amount ($) | | | Value ($) | |
| | | | | | | | | |
| Svenska Handelsbanken AB, 0.21%, 11/7/2013 | | | 1,000,000 | | | | 999,248 | |
| UOB Funding LLC, 0.25%, 8/26/2013 | | | 500,000 | | | | 499,806 | |
| Victory Receivables Corp.: | |
| 144A, 0.17%, 7/18/2013 | | | 2,500,000 | | | | 2,499,799 | |
| 144A, 0.19%, 7/11/2013 | | | 2,500,000 | | | | 2,499,868 | |
| 144A, 0.2%, 7/16/2013 | | | 1,000,000 | | | | 999,917 | |
| Working Capital Management Co., 144A, 0.2%, 8/16/2013 | | | 1,500,000 | | | | 1,499,617 | |
| | | | | 68,265,012 | |
| Issued at Par 3.3% | |
| ASB Finance Ltd., 144A, 0.403%*, 9/4/2013 | | | 1,000,000 | | | | 1,000,000 | |
| Atlantic Asset Securitization LLC: | |
| 144A, 0.243%*, 9/4/2013 | | | 1,000,000 | | | | 999,984 | |
| 144A, 0.254%*, 10/4/2013 | | | 500,000 | | | | 500,000 | |
| Australia & New Zealand Banking Group Ltd., 144A, 0.31%*, 12/6/2013 | | | 1,000,000 | | | | 1,000,000 | |
| BNZ International Funding Ltd., 144A, 0.356%*, 10/23/2013 | | | 500,000 | | | | 500,000 | |
| Kells Funding LLC, 144A, 0.252%*, 11/12/2013 | | | 1,000,000 | | | | 1,000,000 | |
| Westpac Banking Corp.: | |
| 144A, 0.283%*, 9/3/2013 | | | 1,000,000 | | | | 1,000,000 | |
| 144A, 0.31%*, 11/29/2013 | | | 750,000 | | | | 750,000 | |
| | | | | 6,749,984 | |
Total Commercial Paper (Cost $75,014,996) | | | | 75,014,996 | |
| | |
| Short-Term Notes* 9.3% | |
| Australia & New Zealand Banking Group Ltd., 144A, 0.338%, 5/12/2014 | | | 800,000 | | | | 800,000 | |
| Bank of Nova Scotia: | |
| 0.21%, 8/9/2013 | | | 1,000,000 | | | | 1,000,000 | |
| 0.26%, 1/10/2014 | | | 1,000,000 | | | | 1,000,000 | |
| 0.412%, 6/24/2019 | | | 1,000,000 | | | | 1,000,000 | |
| Canadian Imperial Bank of Commerce, 0.29%, 5/16/2014 | | | 1,800,000 | | | | 1,800,000 | |
| China Construction Bank Corp., 0.422%, 10/20/2014 | | | 2,000,000 | | | | 2,000,000 | |
| Commonwealth Bank of Australia, 144A, 0.25%, 6/11/2014 | | | 1,000,000 | | | | 1,000,000 | |
| JPMorgan Chase Bank NA, Series 2, 0.355%, 4/22/2019 | | | 1,000,000 | | | | 1,000,000 | |
| Kommunalbanken AS, 144A, 0.16%, 2/26/2014 | | | 1,500,000 | | | | 1,500,000 | |
| National Australia Bank Ltd., 0.272%, 8/13/2013 | | | 1,000,000 | | | | 1,000,000 | |
| Rabobank Nederland NV: | |
| 0.31%, 5/8/2014 | | | 500,000 | | | | 500,000 | |
| 0.345%, 1/27/2014 | | | 1,500,000 | | | | 1,500,000 | |
| Royal Bank of Canada, 0.31%, 2/28/2014 | | | 1,000,000 | | | | 1,000,000 | |
| Svensk Exportkredit AB, 144A, 0.18%, 6/17/2014 | | | 2,000,000 | | | | 2,000,000 | |
| Westpac Banking Corp.: | |
| 0.282%, 5/9/2014 | | | 750,000 | | | | 750,000 | |
| 0.31%, 11/15/2013 | | | 1,000,000 | | | | 1,000,000 | |
Total Short-Term Notes (Cost $18,850,000) | | | | 18,850,000 | |
| | |
| | | Principal Amount ($) | | | Value ($) | |
| | | | | | | | | |
| Time Deposit 3.9% | |
| State Street Bank & Trust Co., 0.01%, 7/1/2013 (Cost $8,000,000) | | | 8,000,000 | | | | 8,000,000 | |
| | |
| Government & Agency Obligations 12.1% | |
| Other Government Related (a) 1.5% | |
| European Investment Bank, 3.0%, 4/8/2014 | | | 500,000 | | | | 510,489 | |
| International Bank for Reconstruction & Development, 0.118%**, 8/23/2013 | | | 2,500,000 | | | | 2,499,558 | |
| | | | | 3,010,047 | |
| U.S. Government Sponsored Agencies 8.0% | |
| Federal Farm Credit Bank, 0.22%*, 10/29/2014 | | | 500,000 | | | | 500,102 | |
| Federal Home Loan Bank: | |
| 0.125%, 3/27/2014 | | | 750,000 | | | | 749,685 | |
| 0.15%*, 11/8/2013 | | | 500,000 | | | | 499,929 | |
| 0.18%, 3/7/2014 | | | 500,000 | | | | 499,983 | |
| 0.5%, 8/28/2013 | | | 1,000,000 | | | | 1,000,473 | |
| Federal Home Loan Mortgage Corp.: | | | | | | | | |
| 0.1%**, 12/17/2013 | | | 1,000,000 | | | | 999,531 | |
| 0.1%**, 12/20/2013 | | | 2,000,000 | | | | 1,999,045 | |
| 0.109%**, 11/19/2013 | | | 750,000 | | | | 749,677 | |
| 0.11%**, 1/22/2014 | | | 1,500,000 | | | | 1,499,060 | |
| 0.118%**, 8/26/2013 | | | 1,200,000 | | | | 1,199,776 | |
| 0.138%**, 8/13/2013 | | | 500,000 | | | | 499,916 | |
| Federal National Mortgage Association: | | | | | | | | |
| 0.133%**, 7/19/2013 | | | 2,000,000 | | | | 1,999,860 | |
| 0.148%**, 9/3/2013 | | | 2,500,000 | | | | 2,499,333 | |
| 0.148%**, 9/16/2013 | | | 1,500,000 | | | | 1,499,519 | |
| | | | | 16,195,889 | |
| U.S. Treasury Obligations 2.6% | |
| U.S. Treasury Bill, 0.177%**, 10/17/2013 | | | 1,975,000 | | | | 1,973,948 | |
| U.S. Treasury Notes: | |
| 0.5%, 10/15/2013 | | | 1,200,000 | | | | 1,201,099 | |
| 0.5%, 11/15/2013 | | | 500,000 | | | | 500,650 | |
| 2.25%, 5/31/2014 | | | 600,000 | | | | 611,468 | |
| 4.0%, 2/15/2014 | | | 1,000,000 | | | | 1,023,924 | |
| | | | | 5,311,089 | |
Total Government & Agency Obligations (Cost $24,517,025) | | | | 24,517,025 | |
| | |
| Municipal Bonds and Notes 1.5% | |
| Texas, JPMorgan Chase Putters/Drivers Trust, Various States, Series 4264, 144A, 0.07%***, 8/30/2013, LIQ: JPMorgan Chase Bank NA | | | 2,000,000 | | | | 2,000,000 | |
| Texas, State Transportation Revenue, 2.5%, 8/30/2013 | | | 1,000,000 | | | | 1,003,738 | |
Total Municipal Bonds and Notes (Cost $3,003,738) | | | | 3,003,738 | |
| | |
| | | Principal Amount ($) | | | Value ($) | |
| | | | | | | | | |
| Repurchase Agreements 20.9% | |
| Barclays Capital, 0.1%, dated 6/28/2013, to be repurchased at $10,000,083 on 7/1/2013 (b) | | | 10,000,000 | | | | 10,000,000 | |
| JPMorgan Securities, Inc., 0.13%, dated 6/28/2013, to be repurchased at $9,000,098 on 7/1/2013 (c) | | | 9,000,000 | | | | 9,000,000 | |
| JPMorgan Securities, Inc., 0.4%, dated 3/18/2013, to be repurchased at $2,510,139 on 3/18/2014 (d) | | | 2,500,000 | | | | 2,500,000 | |
| Merrill Lynch & Co., Inc., 0.17%, dated 3/1/2013, to be repurchased at $2,001,757 on 9/3/2013 (e) | | | 2,000,000 | | | | 2,000,000 | |
| Merrill Lynch & Co., Inc., 0.08%, dated 6/28/2013, to be repurchased at $6,000,093 on 7/5/2013 (f) | | | 6,000,000 | | | | 6,000,000 | |
| | | Principal Amount ($) | | | Value ($) | |
| | | | | | | | | |
| Merrill Lynch & Co., Inc., 0.1%, dated 6/28/2013, to be repurchased at $10,488,401 on 7/1/2013 (g) | | | 10,488,314 | | | | 10,488,314 | |
| The Toronto-Dominion Bank, 0.06%, dated 6/26/2013, to be repurchased at $1,000,012 on 7/3/2013 (h) | | | 1,000,000 | | | | 1,000,000 | |
| The Toronto-Dominion Bank, 0.1%, dated 6/28/2013, to be repurchased at $1,500,013 on 7/1/2013 (i) | | | 1,500,000 | | | | 1,500,000 | |
Total Repurchase Agreements (Cost $42,488,314) | | | | 42,488,314 | |
| | | % of Net Assets | | | Value ($) | |
| | | | |
Total Investment Portfolio (Cost $202,879,232)† | | | 100.0 | | | | 202,879,232 | |
| Other Assets and Liabilities, Net | | | 0.0 | | | | 10,639 | |
| Net Assets | | | 100.0 | | | | 202,889,871 | |
* Floating rate securities' yields vary with a designated market index or market rate, such as the coupon-equivalent of the U.S. Treasury Bill rate. These securities are shown at their current rate as of June 30, 2013.
** Annualized yield at time of purchase; not a coupon rate.
*** Variable rate demand notes are securities whose interest rates are reset periodically at market levels. These securities are payable on demand and are shown at their current rates as of June 30, 2013.
† The cost for federal income tax purposes was $202,879,232.
(a) Government-backed debt issued by financial companies or government sponsored enterprises.
(b) Collateralized by $10,294,600 U.S. Treasury Note, 0.25%, maturing on 4/15/2016 with a value of $10,200,049.
(c) Collateralized by $73,490,451 Federal National Mortgage Association — Interest Only, with the various coupon rates from 3.0-6.5%, with various maturity dates of 8/25/2026-4/25/2039 with a value of $9,180,416.
(d) Collateralized by $4,185,000 College Loan Corp. Trust, maturing on 3/1/2042 with a value of $2,603,006.
(e) Collateralized by $2,040,100 U.S. Treasury Bill, maturing on 7/5/2013 with a value of $2,040,092.
(f) Collateralized by $6,120,100 U.S. Treasury Bill, maturing on 7/5/2013 with a value of $6,120,076.
(g) Collateralized by $10,734,100 U.S. Treasury Note, 0.25%, maturing on 9/15/2015 with a value of $10,698,155.
(h) Collateralized by:
| Principal Amount ($) | | Security | | Rate (%) | | Maturity Date | | Collateral Value ($) | |
| | 62,000 | | Federal National Mortgage Association | | | 1.25 | | 1/30/2017 | | | 62,739 | |
| | 845,335 | | U.S. Treasury Note | | | 4.625 | | 11/15/2016 | | | 957,261 | |
| Total Collateral Value | | | | | | | | | | 1,020,000 | |
(i) Collateralized by:
| Principal Amount ($) | | Security | | Rate (%) | | Maturity Date | | Collateral Value ($) | |
| | 6,583 | | Bank of Nova Scotia | | | 2.15 | | 8/3/2016 | | | 6,855 | |
| | 17,365 | | Cigna Corp. | | | 5.375 | | 2/15/2042 | | | 18,503 | |
| | 7,568 | | General Electric Capital Corp. | | | 0.475 | | 5/11/2016 | | | 7,512 | |
| | 2,901 | | JPMorgan Chase & Co. | | | 1.625 | | 5/15/2018 | | | 2,783 | |
| | 11,307 | | Pepsi Bottling Group, Inc. | | | 7.0 | | 3/1/2029 | | | 14,692 | |
| | 1,236,011 | | Roche Holdings, Inc. | | | 6.0 | | 3/1/2019 | | | 1,499,912 | |
| | 1,245 | | Verizon Communications, Inc. | | | 6.25 | | 4/1/2037 | | | 1,430 | |
| | 1,857 | | Wyeth LLC | | | 5.5 | | 2/1/2014 | | | 1,954 | |
| Total Collateral Value | | | | | | | | | | 1,553,641 | |
144A: Security exempt from registration under Rule 144A of the Securities Act of 1933. These securities may be resold in transactions exempt from registration, normally to qualified institutional buyers.
Interest Only: Interest Only (IO) bonds represent the "interest only" portion of payments on a pool of underlying mortgages or mortgage-backed securities. IO securities are subject to prepayment risk of the pool of underlying mortgages.
LIQ: Liquidity Facility
Fair Value Measurements
Various inputs are used in determining the value of the Fund's investments. These inputs are summarized in three broad levels. Level 1 includes quoted prices in active markets for identical securities. Level 2 includes other significant observable inputs (including quoted prices for similar securities, interest rates, prepayment speeds, and credit risk). Level 3 includes significant unobservable inputs (including the Fund's own assumptions in determining the fair value of investments). The inputs or methodology used for valuing securities are not necessarily an indication of the risk associated with investing in those securities. Securities held by the Fund are reflected as Level 2 because the securities are valued at amortized cost (which approximates fair value) and, accordingly, the inputs used to determine value are not quoted prices in an active market.
The following is a summary of the inputs used as of June 30, 2013 in valuing the Fund's investments. For information on the Fund's policy regarding the valuation of investments, please refer to the Security Valuation section of Note A in the accompanying Notes to Financial Statements.
| Assets | | Level 1 | | | Level 2 | | | Level 3 | | | Total | |
| | |
| Investments in Securities (j) | | $ | — | | | $ | 160,390,918 | | | $ | — | | | $ | 160,390,918 | |
| Repurchase Agreements | | | — | | | | 42,488,314 | | | | — | | | | 42,488,314 | |
| Total | | $ | — | | | $ | 202,879,232 | | | $ | — | | | $ | 202,879,232 | |
There have been no transfers between fair value measurement levels during the period ended June 30, 2013.
(j) See Investment Portfolio for additional detailed categorizations.
The accompanying notes are an integral part of the financial statements.
Statement of Assets and Liabilities | as of June 30, 2013 (Unaudited) | |
| Assets | |
| Investments in non-affiliated securities, valued at amortized cost | | $ | 160,390,918 | |
| Repurchase agreements, valued at amortized cost | | | 42,488,314 | |
| Total investments, valued at amortized cost | | | 202,879,232 | |
| Cash | | | 51 | |
| Receivable for Fund shares sold | | | 142,016 | |
| Interest receivable | | | 77,615 | |
| Due from Advisor | | | 4,901 | |
| Other assets | | | 1,176 | |
| Total assets | | | 203,104,991 | |
| Liabilities | |
| Payable for Fund shares redeemed | | | 143,020 | |
| Distributions payable | | | 720 | |
| Accrued Trustees' fees | | | 1,713 | |
| Other accrued expenses and payables | | | 69,667 | |
| Total liabilities | | | 215,120 | |
| Net assets, at value | | $ | 202,889,871 | |
| Net Assets Consist of | |
| Undistributed net investment income | | | 246 | |
| Accumulated net realized gain (loss) | | | 202 | |
| Paid-in capital | | | 202,889,423 | |
| Net assets, at value | | $ | 202,889,871 | |
Class A Net Asset Value, offering and redemption price per share ($202,889,871 ÷ 202,973,139 outstanding shares of beneficial interest, no par value, unlimited number of shares authorized) | | $ | 1.00 | |
The accompanying notes are an integral part of the financial statements.
Statement of Operations
| for the six months ended June 30, 2013 (Unaudited) | |
| Investment Income | |
Income: Interest | | $ | 38,571 | |
| Income distributions — Central Cash Management Fund | | | 180,695 | |
| Total income | | | 219,266 | |
Expenses: Management fee | | | 266,048 | |
| Administration fee | | | 93,350 | |
| Services to shareholders | | | 1,175 | |
| Custodian fee | | | 12,095 | |
| Professional fees | | | 25,218 | |
| Reports to shareholders | | | 38,559 | |
| Trustees' fee and expenses | | | 3,863 | |
| Other | | | 4,580 | |
| Total expenses before expense reductions | | | 444,888 | |
| Expense reductions | | | (235,002 | ) |
| Total expenses after expense reductions | | | 209,886 | |
| Net investment income | | | 9,380 | |
| Net realized gain (loss) | | | 202 | |
| Net increase (decrease) in net assets resulting from operations | | $ | 9,582 | |
The accompanying notes are an integral part of the financial statements.
Statement of Changes in Net Assets | Increase (Decrease) in Net Assets | | Six Months Ended June 30, 2013 (Unaudited) | | | Year Ended December 31, 2012 | |
Operations: Net investment income | | $ | 9,380 | | | $ | 20,513 | |
| Net realized gain (loss) | | | 202 | | | | 863 | |
| Net increase (decrease) in net assets resulting from operations | | | 9,582 | | | | 21,376 | |
Distributions to shareholders from: Net investment income Class A | | | (9,338 | ) | | | (20,513 | ) |
| Total distributions | | | (9,338 | ) | | | (20,513 | ) |
Fund share transactions: Class A Proceeds from shares sold | | | 51,714,331 | | | | 76,110,395 | |
| Reinvestment of distributions | | | 9,415 | | | | 20,711 | |
| Cost of shares redeemed | | | (44,977,923 | ) | | | (96,940,382 | ) |
| Net increase (decrease) in net assets from Class A share transactions | | | 6,745,823 | | | | (20,809,276 | ) |
| Increase (decrease) in net assets | | | 6,746,067 | | | | (20,808,413 | ) |
| Net assets at beginning of period | | | 196,143,804 | | | | 216,952,217 | |
| Net assets at end of period (including undistributed net investment income of $246 and $204, respectively) | | $ | 202,889,871 | | | $ | 196,143,804 | |
| Other Information | |
Class A Shares outstanding at beginning of period | | | 196,227,316 | | | | 217,036,592 | |
| Shares sold | | | 51,714,331 | | | | 76,110,395 | |
| Shares issued to shareholders in reinvestment of distributions | | | 9,415 | | | | 20,711 | |
| Shares redeemed | | | (44,977,923 | ) | | | (96,940,382 | ) |
| Net increase (decrease) in Class A shares | | | 6,745,823 | | | | (20,809,276 | ) |
| Shares outstanding at end of period | | | 202,973,139 | | | | 196,227,316 | |
The accompanying notes are an integral part of the financial statements.
| | | | | | Years Ended December 31, | |
| Class A | | Six Months Ended 6/30/13 (Unaudited) | | | 2012 | | | 2011 | | | 2010 | | | 2009 | | | 2008 | |
| Selected Per Share Data | |
| Net asset value, beginning of period | | $ | 1.000 | | | $ | 1.000 | | | $ | 1.000 | | | $ | 1.000 | | | $ | 1.000 | | | $ | 1.000 | |
Income from investment operations: Net investment income | | | .000 | *** | | | .000 | *** | | | .000 | *** | | | .000 | *** | | | .003 | | | | .026 | |
| Net realized gain (loss) | | | .000 | *** | | | .000 | *** | | | .000 | *** | | | .000 | *** | | | .000 | *** | | | .000 | *** |
| Total from investment operations | | | .000 | *** | | | .000 | *** | | | .000 | *** | | | .000 | *** | | | .003 | | | | .026 | |
Less distributions from: Net investment income | | | (.000 | )*** | | | (.000 | )*** | | | (.000 | )*** | | | (.000 | )*** | | | (.003 | ) | | | (.026 | ) |
| Net asset value, end of period | | $ | 1.000 | | | $ | 1.000 | | | $ | 1.000 | | | $ | 1.000 | | | $ | 1.000 | | | $ | 1.000 | |
| Total Return (%) | | | .00 | a,b** | | | .01 | a | | | .01 | a | | | .01 | a | | | .34 | | | | 2.64 | a |
| Ratios to Average Net Assets and Supplemental Data | |
| Net assets, end of period ($ millions) | | | 203 | | | | 196 | | | | 217 | | | | 220 | | | | 270 | | | | 398 | |
| Ratio of expenses before expense reductions (%) | | | .48 | * | | | .45 | | | | .51 | | | | .46 | | | | .43 | | | | .52 | |
| Ratio of expenses after expense reductions (%) | | | .22 | * | | | .31 | | | | .25 | | | | .34 | | | | .43 | | | | .50 | |
| Ratio of net investment income (%) | | | .01 | * | | | .01 | | | | .01 | | | | .01 | | | | .37 | | | | 2.56 | |
a Total return would have been lower had certain expenses not been reduced. b Amount is less than .005%. * Annualized ** Not annualized *** Amount is less than $.0005. | |
Notes to Financial Statements (Unaudited)
A. Organization and Significant Accounting Policies
DWS Money Market VIP (the "Fund") is a diversified series of DWS Variable Series II (the "Trust"), which is registered under the Investment Company Act of 1940, as amended (the "1940 Act"), as an open-end management investment company organized as a Massachusetts business trust.
The Fund's financial statements are prepared in accordance with accounting principles generally accepted in the United States of America which require the use of management estimates. Actual results could differ from those estimates. The policies described below are followed consistently by the Fund in the preparation of its financial statements.
Security Valuation. Various inputs are used in determining the value of the Fund's investments. These inputs are summarized in three broad levels. Level 1 includes quoted prices in active markets for identical securities. Level 2 includes other significant observable inputs (including quoted prices for similar securities, interest rates, prepayment speeds, and credit risk). Level 3 includes significant unobservable inputs (including the Fund's own assumptions in determining the fair value of investments). The inputs or methodology used for valuing securities are not necessarily an indication of the risk associated with investing in those securities.
The Fund values all securities utilizing the amortized cost method permitted in accordance with Rule 2a-7 under the 1940 Act and certain conditions therein. Under this method, which does not take into account unrealized capital gains or losses on securities, an instrument is initially valued at its cost and thereafter assumes a constant accretion/amortization rate to maturity of any discount or premium. Securities held by the Fund are reflected as Level 2 because the securities are valued at amortized cost (which approximates fair value) and, accordingly, the inputs used to determine value are not quoted prices in an active market.
Disclosure about the classification of fair value measurements is included in a table following the Fund's Investment Portfolio.
Repurchase Agreements. The Fund may enter into repurchase agreements, under the terms of a Master Repurchase Agreement, with certain banks and broker/dealers whereby the Fund, through its custodian or a sub-custodian bank, receives delivery of the underlying securities, the amount of which at the time of purchase and each subsequent business day is required to be maintained at such a level that the value is equal to at least the principal amount of the repurchase price plus accrued interest. The custodian bank or another designated sub-custodian holds the collateral in a separate account until the agreement matures. If the value of the securities falls below the principal amount of the repurchase agreement plus accrued interest, the financial institution deposits additional collateral by the following business day. If the financial institution either fails to deposit the required additional collateral or fails to repurchase the securities as agreed, the Fund has the right to sell the securities and recover any resulting loss from the financial institution. If the financial institution enters into bankruptcy, the Fund's claim on the collateral may be subject to legal proceedings.
As of June 30, 2013, the Fund had investments in repurchase agreements with a gross value of $42,488,314. The value of the related collateral exceeded the value of the repurchase agreements at period end. The detail of the related collateral is included in the footnotes following the Fund's Investment Portfolio.
Federal Income Taxes. The Fund's policy is to comply with the requirements of the Internal Revenue Code, as amended, which are applicable to regulated investment companies and to distribute all of its taxable income to its shareholders.
The Fund has reviewed the tax positions for the open tax years as of December 31, 2012 and has determined that no provision for income tax is required in the Fund's financial statements. The Fund's federal tax returns for the prior three fiscal years remain open subject to examination by the Internal Revenue Service.
Distribution of Income and Gains. Net investment income of the Fund is declared as a daily dividend and is distributed to shareholders monthly. The Fund may take into account capital gains and losses in its daily dividend declarations. The Fund may also make additional distributions for tax purposes if necessary.
Permanent book and tax differences relating to shareholder distributions will result in reclassifications to paid-in capital. Temporary book and tax differences will reverse in a subsequent period. There were no significant book to tax differences for the Fund.
The tax character of current year distributions will be determined at the end of the current fiscal year.
Expenses. Expenses of the Trust arising in connection with a specific fund are allocated to that fund. Other Trust expenses which cannot be directly attributed to a fund are apportioned among the funds in the Trust based upon the relative net assets or other appropriate measures.
Contingencies. In the normal course of business, the Fund may enter into contracts with service providers that contain general indemnification clauses. The Fund's maximum exposure under these arrangements is unknown as this would involve future claims that may be made against the Fund that have not yet been made. However, based on experience, the Fund expects the risk of loss to be remote.
Other. Investment transactions are accounted for on a trade date. Interest income is recorded on the accrual basis. Realized gains and losses from investment transactions are recorded on an identified cost basis. All discounts and premiums are accreted/amortized for both tax and financial reporting purposes.
B. Related Parties
Management Agreement. Under the Investment Management Agreement with Deutsche Investment Management Americas Inc. ("DIMA" or the "Advisor"), an indirect, wholly owned subsidiary of Deutsche Bank AG, the Advisor directs the investments of the Fund in accordance with its investment objectives, policies and restrictions. The Advisor determines the securities, instruments and other contracts relating to investments to be purchased, sold or entered into by the Fund.
Pursuant to the Investment Management Agreement with the Advisor, the Fund pays a monthly management fee based on the Fund's average daily net assets, computed and accrued daily and payable monthly, at the following annual rates:
| First $500 million | | | .285 | % |
| Next $500 million | | | .270 | % |
| Next $1.0 billion | | | .255 | % |
| Over $2.0 billion | | | .240 | % |
For the period from January 1, 2013 through September 30, 2013, the Advisor has contractually agreed to waive its fee and/or reimburse certain operating expenses to the extent necessary to maintain the operating expenses (excluding certain expenses such as extraordinary expenses, taxes, brokerage and interest expense) at 0.51%.
In addition, the Advisor has agreed to voluntarily waive additional expenses for the Fund. The waiver may be changed or terminated at any time without notice. Under this arrangement, the Advisor waived certain expenses of the Fund.
Accordingly, for the six months ended June 30, 2013, the Advisor waived a portion of its management fee pursuant to the Investment Management Agreement aggregating $234,710, and the amount charged aggregated $31,338, which was equivalent to an annualized effective rate of 0.03% of the Fund's average daily net assets.
Administration Fee. Pursuant to an Administrative Services Agreement, DIMA provides most administrative services to the Fund. For all services provided under the Administrative Services Agreement, the Fund pays DIMA an annual fee ("Administration Fee") of 0.10% of the Fund's average daily net assets, computed and accrued daily and payable monthly. For the six months ended June 30, 2013, the Administration Fee was $93,350, of which $16,366 is unpaid.
Service Provider Fees. DWS Investments Service Company ("DISC"), an affiliate of the Advisor, is the transfer agent, dividend-paying agent and shareholder service agent for the Fund. Pursuant to a sub-transfer agency agreement between DISC and DST Systems, Inc. ("DST"), DISC has delegated certain transfer agent, dividend-paying agent and shareholder service agent functions to DST. DISC compensates DST out of the shareholder servicing fee it receives from the Fund. For the six months ended June 30, 2013, the amounts charged to the Fund by DISC aggregated $292, all of which was waived.
Typesetting and Filing Service Fees. Under an agreement with DIMA, DIMA is compensated for providing typesetting and certain regulatory filing services to the Fund. For the six months ended June 30, 2013, the amount charged to the Fund by DIMA included in the Statement of Operations under "reports to shareholders" aggregated $5,732, of which $5,638 is unpaid.
Trustees' Fees and Expenses. The Fund paid retainer fees to each Trustee not affiliated with the Advisor, plus specified amounts to the Board Chairperson and Vice Chairperson and to each committee Chairperson.
C. Ownership of the Fund
At June 30, 2013, four Participating Insurance Companies were owners of record of 10% or more of the total outstanding Class A shares of the Fund, each owning 37%, 21%, 11% and 10%.
D. Line of Credit
The Fund and other affiliated funds (the "Participants") share in a $375 million revolving credit facility provided by a syndication of banks. The Fund may borrow for temporary or emergency purposes, including the meeting of redemption requests that otherwise might require the untimely disposition of securities. The Participants are charged an annual commitment fee which is allocated based on net assets, among each of the Participants. Interest is calculated at a rate per annum equal to the sum of the Federal Funds Rate, plus 1.25 percent plus if LIBOR exceeds the Federal Funds Rate, the amount of such excess. The Fund may borrow up to a maximum of 33 percent of its net assets under the agreement: The Fund had no outstanding loans at June 30, 2013.
Information About Your Fund's Expenses (Unaudited)
As an investor of the Fund, you incur two types of costs: ongoing expenses and transaction costs. Ongoing expenses include management fees and other Fund expenses. Examples of transaction costs include contract charges and account maintenance fees, which are not shown in this section. The following tables are intended to help you understand your ongoing expenses (in dollars) of investing in the Fund and to help you compare these expenses with the ongoing expenses of investing in other mutual funds. In the most recent six-month period the Fund limited these expenses; had it not done so, expenses would have been higher. The example in the table is based on an investment of $1,000 invested at the beginning of the six-month period and held for the entire period (January 1, 2013 to June 30, 2013).
The tables illustrate your Fund's expenses in two ways:
•Actual Fund Return. This helps you estimate the actual dollar amount of ongoing expenses (but not transaction costs) paid on a $1,000 investment in the Fund using the Fund's actual return during the period. To estimate the expenses you paid over the period, simply divide your account value by $1,000 (for example, an $8,600 account value divided by $1,000 = 8.6), then multiply the result by the number in the "Expenses Paid per $1,000" line under the share class you hold.
• Hypothetical 5% Fund Return. This helps you to compare your Fund's ongoing expenses (but not transaction costs) with those of other mutual funds using the Fund's actual expense ratio and a hypothetical rate of return of 5% per year before expenses. Examples using a 5% hypothetical Fund return may be found in the shareholder reports of other mutual funds. The hypothetical account values and expenses may not be used to estimate the actual ending account balance or expenses you paid for the period.
Please note that the expenses shown in these tables are meant to highlight your ongoing expenses only and do not reflect any transaction costs. The "Expenses Paid per $1,000" line of the tables is useful in comparing ongoing expenses only and will not help you determine the relative total expense of owning different funds. If these transaction costs had been included, your costs would have been higher.
Expenses and Value of a $1,000 Investment for the six months ended June 30, 2013 | |
| Actual Fund Return | | Class A | |
| Beginning Account Value 1/1/13 | | $ | 1,000.00 | |
| Ending Account Value 6/30/13 | | $ | 1,000.05 | |
| Expenses Paid per $1,000* | | $ | 1.09 | |
| Hypothetical 5% Fund Return | | Class A | |
| Beginning Account Value 1/1/13 | | $ | 1,000.00 | |
| Ending Account Value 6/30/13 | | $ | 1,023.70 | |
| Expenses Paid per $1,000* | | $ | 1.10 | |
* Expenses are equal to the Fund's annualized expense ratio, multiplied by the average account value over the period, multiplied by 181 (the number of days in the most recent six-month period), then divided by 365.
| Annualized Expense Ratio | Class A | |
| DWS Variable Series II — DWS Money Market VIP | .22% | |
For more information, please refer to the Fund's prospectus.
These tables do not reflect charges and fees ("contract charges") associated with the separate account that invests in the Fund or any variable life insurance policy or variable annuity contract for which the Fund is an investment option.
For an analysis of the fees associated with an investment in the Fund or similar funds, please refer to http://apps.finra.org/fundanalyzer/1/fa.aspx.
Proxy Voting
The Trust's policies and procedures for voting proxies for portfolio securities and information about how the Trust voted proxies related to its portfolio securities during the 12-month period ended June 30 are available on our Web site — www.dws-investments.com (click on "proxy voting" at the bottom of the page) — or on the SEC's Web site — www.sec.gov. To obtain a written copy of the Trust's policies and procedures without charge, upon request, call us toll free at (800) 728-3337.
Money Market Fund Reform
In June 2013, the SEC proposed money market fund reform intended to address perceived systemic risks associated with money market funds and to improve transparency for money market fund investors. The Financial Stability Oversight Council (FSOC), a board of U.S. regulators established by the Dodd-Frank Act, had also previously proposed similar recommendations for money market fund reform. If one or more of the SEC or FSOC proposals for money market fund reform were to be adopted in the future, such regulatory action may affect the fund's operations and/or return potential.
Summary of Management Fee Evaluation by Independent Fee Consultant
September 17, 2012
Pursuant to an Order entered into by Deutsche Investment Management Americas and affiliates (collectively, "DeAM") with the Attorney General of New York, I, Thomas H. Mack, have been appointed the Independent Fee Consultant for the DWS Funds (formerly the DWS Scudder Funds). My duties include preparing an annual written evaluation of the management fees DeAM charges the Funds, considering among other factors the management fees charged by other mutual fund companies for like services, management fees DeAM charges other clients for like services, DeAM's costs of supplying services under the management agreements and related profit margins, possible economies of scale if a Fund grows larger, and the nature and quality of DeAM's services, including fund performance. This report summarizes my evaluation for 2012, including my qualifications, the evaluation process for each of the DWS Funds, consideration of certain complex-level factors, and my conclusions. I served in substantially the same capacity in 2007, 2008, 2009, 2010 and 2011.
Qualifications
For more than 35 years I have served in various professional capacities within the investment management business. I have held investment analysis and advisory positions, including securities analyst, portfolio strategist and director of investment policy with a large investment firm. I have also performed business management functions, including business development, financial management and marketing research and analysis.
Since 1991, I have been an independent consultant within the asset management industry. I have provided services to over 125 client organizations, including investment managers, mutual fund boards, product distributors and related organizations. Over the past ten years I have completed a number of assignments for mutual fund boards, specifically including assisting boards with management contract renewal.
I hold a Master of Business Administration degree, with highest honors, from Harvard University and Master of Science and Bachelor of Science (highest honors) degrees from the University of California at Berkeley. I am an independent director and audit committee financial expert for two closed-end mutual funds and have served in various leadership and financial oversight capacities with non-profit organizations.
Evaluation of Fees for each DWS Fund
My work focused primarily on evaluating, fund-by-fund, the fees charged to each of the 103 mutual fund portfolios in the DWS Fund family. For each Fund, I considered each of the key factors mentioned above, as well as any other relevant information. In doing so I worked closely with the Funds' Independent Directors in their annual contract renewal process, as well as in their approval of contracts for several new funds (documented separately).
In evaluating each Fund's fees, I reviewed comprehensive materials provided by or on behalf of DeAM, including expense information prepared by Lipper Analytical, comparative performance information, profitability data, manager histories, and other materials. I also accessed certain additional information from the Lipper and Morningstar databases and drew on my industry knowledge and experience.
To facilitate evaluating this considerable body of information, I prepared for each Fund a document summarizing the key data elements in each area as well as additional analytics discussed below. This made it possible to consider each key data element in the context of the others.
In the course of contract renewal, DeAM agreed to implement a number of fee and expense adjustments requested by the Independent Directors which will favorably impact future fees and expenses, and my evaluation includes the effects of these changes.
Fees and Expenses Compared with Other Funds
The competitive fee and expense evaluation for each fund focused on two primary comparisons:
The Fund's contractual management fee (the advisory fee plus the administration fee where applicable) compared with those of a group of typically 12-15 funds in the same Lipper investment category (e.g. Large Capitalization Growth) having similar distribution arrangements and being of similar size.
The Fund's total expenses compared with a broader universe of funds from the same Lipper investment category and having similar distribution arrangements.
These two comparisons provide a view of not only the level of the fee compared with funds of similar scale but also the total expense the Fund bears for all the services it receives, in comparison with the investment choices available in the Fund's investment category and distribution channel. The principal figure-of-merit used in these comparisons was the subject Fund's percentile ranking against peers.
DeAM's Fees for Similar Services to Others
DeAM provided management fee schedules for all of its US domiciled fund and non-fund investment management accounts in any of the investment categories where there is a DWS Fund. These similar products included the other DWS Funds, non-fund pooled accounts, institutional accounts and sub-advisory accounts. Using this information, I calculated for each Fund the fee that would be charged to each similar product, at the subject Fund's asset level.
Evaluating information regarding non-fund products is difficult because there are varying levels of services required for different types of accounts, with mutual funds generally requiring considerably more regulatory and administrative types of service as well as having more frequent cash flows than other types of accounts. Also, while mutual fund fees for similar fund products can be expected to be similar, there will be some differences due to different pricing conditions in different distribution channels (e.g. retail funds versus those used in variable insurance products), differences in underlying investment processes and other factors.
Costs and Profit Margins
DeAM provided a detailed profitability analysis for each Fund. After making some adjustments so that the presentation would be more comparable to the available industry figures, I reviewed profit margins from investment management alone, from investment management plus other fund services (excluding distribution) provided to the Funds by DeAM (principally shareholder services), and DeAM profits from all sources, including distribution. A later section comments on overall profitability.
Economies of Scale
Economies of scale — an expected decline in management cost per dollar of fund assets as fund assets grow — are very rarely quantified and documented because of inherent difficulties in collecting and analyzing relevant data. However, in virtually every investment category that I reviewed, larger funds tend to have lower fees and lower total expenses than smaller funds. To see how each DWS Fund compares with this industry observation, I reviewed:
The trend in Fund assets over the last five years and the accompanying trend in total expenses. This shows if the Fund has grown and, if so, whether total expense (management fees as well as other expenses) have declined as a percent of assets.
Whether the Fund has break-points in its management fee schedule, the extent of the fee reduction built into the schedule and the asset levels where the breaks take effect, and in the case of a sub-advised Fund how the Fund's break-points compare with those of the sub-advisory fee schedule.
How the Fund's contractual fee schedule compares with trends in the industry data. To accomplish this, I constructed a chart showing how actual latest-fiscal-year contractual fees of the Fund and of other similar funds relate to average fund assets, with the subject Fund's contractual fee schedule superimposed.
Quality of Service — Performance
The quality-of-service evaluation focused on investment performance, which is the principal result of the investment management service. Each Fund's performance was reviewed over the past 1, 3, 5 and 10 years, as applicable, and compared with that of other funds in the same investment category and with a suitable market index.
In addition, I calculated and reviewed risk-adjusted returns relative to an index of similar mutual funds' returns and a suitable market index. The risk-adjusted returns analysis provides a way of determining the extent to which the Fund's return comparisons are mainly the product of investment value-added (or lack thereof) or alternatively taking considerably more or less risk than is typical in its investment category.
I also received and considered the history of portfolio manager changes for each Fund, as this provided an important context for evaluating the performance results.
Complex-Level Considerations
While this evaluation was conducted mainly at the individual fund level, there are some issues relating to the reasonableness of fees that can alternatively be considered across the whole fund complex:
I reviewed DeAM's profitability analysis for all DWS Funds, with a view toward determining if the allocation procedures used were reasonable and how profit levels compared with public data for other investment managers.
I considered whether DeAM and affiliates receive any significant ancillary or "fallout" benefits that should be considered in interpreting the direct profitability results. These would be situations where serving as the investment manager of the Funds is beneficial to another part of the Deutsche Bank organization.
I considered how aggregated DWS Fund expenses had varied over the years, by asset class and in the context of trends in asset levels.
I considered how aggregated DWS Fund performance measures relative to appropriate peers had varied by asset class and over time.
I reviewed the structure of the DeAM organization, trends in staffing levels, and information on compensation of investment management and other professionals compared with industry data.
Findings
Based on the process and analysis discussed above, which included reviewing a wide range of information from management and external data sources and considering among other factors the fees DeAM charges other clients, the fees charged by other fund managers, DeAM's costs and profits associated with managing the Funds, economies of scale, possible fall-out benefits, and the nature and quality of services provided, in my opinion the management fees charged the DWS Funds are reasonable.
Thomas H. Mack
President, Thomas H. Mack & Co., Inc.
DWS Investments Distributors, Inc.
222 South Riverside Plaza
Chicago, IL 60606
(800) 621-1148
VS2MM-3 (R-028387-2 8/13)
JUNE 30, 2013
SEMIANNUAL REPORT
DWS VARIABLE SERIES II
DWS Small Mid Cap Growth VIP
Contents
9 Statement of Assets and Liabilities 10 Statement of Operations 10 Statement of Changes in Net Assets 13 Notes to Financial Statements 16 Information About Your Fund's Expenses 18 Summary of Management Fee Evaluation by Independent Fee Consultant |
This report must be preceded or accompanied by a prospectus. To obtain an additional prospectus or summary prospectus, if available, call (800) 728-3337 or your financial representative. We advise you to consider the Fund's objectives, risks, charges and expenses carefully before investing. The summary prospectus and prospectus contain this and other important information about the Fund. Please read the prospectus carefully before you invest.
Investing in derivatives entails special risks relating to liquidity, leverage and credit that may reduce returns and/or increase volatility. Smaller and medium company stocks tend to be more volatile than large company stocks. The Fund may lend securities to approved institutions. Stocks may decline in value. See the prospectus for details.
DWS Investments is part of the Deutsche Asset & Wealth Management division of Deutsche Bank AG.
NOT FDIC/NCUA INSURED NO BANK GUARANTEE MAY LOSE VALUE NOT A DEPOSIT
NOT INSURED BY ANY FEDERAL GOVERNMENT AGENCY
Performance Summary June 30, 2013 (Unaudited)
Fund performance shown is historical, assumes reinvestment of all dividend and capital gain distributions and does not guarantee future results. Investment return and principal value fluctuate with changing market conditions so that, when redeemed, shares may be worth more or less than their original cost. Current performance may be lower or higher than the performance data quoted. Please contact your participating insurance company for the Fund's most recent month-end performance. Performance doesn't reflect charges and fees ("contract charges") associated with the separate account that invests in the Fund or any variable life insurance policy or variable annuity contract for which the Fund is an investment option. These charges and fees will reduce returns.
The gross expense ratio of the Fund, as stated in the fee table of the prospectus dated May 1, 2013 is 0.74% for Class A shares and may differ from the expense ratio disclosed in the Financial Highlights table in this report.
| Growth of an Assumed $10,000 Investment in DWS Small Mid Cap Growth VIP |
| The Russell 2500™ Growth Index is an unmanaged index that measures the performance of the small- to mid-cap growth segment of the U.S. equity universe. It includes those Russell 2500 companies with higher price-to-book ratios and higher forecasted growth values. Index returns do not reflect any fees or expenses and it is not possible to invest directly into an index. |
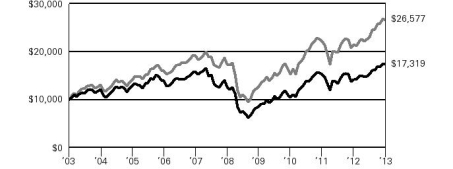 | |
| Yearly periods ended June 30 | |
| Comparative Results | |
| DWS Small Mid Cap Growth VIP | | 6-Month‡ | | | 1-Year | | | 3-Year | | | 5-Year | | | 10-Year | |
| Class A | Growth of $10,000 | | $ | 11,368 | | | $ | 12,190 | | | $ | 16,652 | | | $ | 13,688 | | | $ | 17,319 | |
| Average annual total return | | | 13.68 | % | | | 21.90 | % | | | 18.53 | % | | | 6.48 | % | | | 5.65 | % |
| Russell 2500 Growth Index | Growth of $10,000 | | $ | 11,582 | | | $ | 12,403 | | | $ | 17,376 | | | $ | 15,343 | | | $ | 26,577 | |
| Average annual total return | | | 15.82 | % | | | 24.03 | % | | | 20.22 | % | | | 8.94 | % | | | 10.27 | % |
The growth of $10,000 is cumulative.
‡ Total returns shown for periods less than one year are not annualized.
Portfolio Summary (Unaudited) Asset Allocation (As a % of Investment Portfolio excluding Securities Lending Collateral) | 6/30/13 | 12/31/12 |
| | | |
| Common Stocks | 96% | 96% |
| Cash Equivalents | 4% | 4% |
| Exchange-Traded Fund | 0% | 0% |
| | 100% | 100% |
Sector Diversification (As a % of Common Stocks) | 6/30/13 | 12/31/12 |
| | | |
| Information Technology | 20% | 16% |
| Consumer Discretionary | 19% | 17% |
| Health Care | 16% | 16% |
| Industrials | 15% | 20% |
| Financials | 10% | 8% |
| Energy | 7% | 9% |
| Consumer Staples | 6% | 6% |
| Materials | 5% | 7% |
| Telecommunication Services | 2% | 1% |
| | 100% | 100% |
Portfolio holdings and characteristics are subject to change.
For more complete details about the Fund's investment portfolio, see page 5.
Following the Fund's fiscal first and third quarter-end, a complete portfolio holdings listing is filed with the SEC on Form N-Q. The form will be available on the SEC's Web site at www.sec.gov, and it also may be reviewed and copied at the SEC's Public Reference Room in Washington, D.C. Information on the operation of the SEC's Public Reference Room may be obtained by calling (800) SEC-0330. The Fund's portfolio holdings are also posted on www.dws-investments.com from time to time. Please see the Fund's current prospectus for more information.
Joseph Axtell, CFA
Rafaelina M. Lee
Portfolio Managers
Investment Portfolio June 30, 2013 (Unaudited) | | | Shares | | | Value ($) | |
| | | | |
| Common Stocks 97.1% | |
| Consumer Discretionary 18.9% | |
| Auto Components 1.6% | |
| BorgWarner, Inc.* | | | 15,012 | | | | 1,293,284 | |
| Tenneco, Inc.* | | | 25,873 | | | | 1,171,529 | |
| | | | | | | | 2,464,813 | |
| Diversified Consumer Services 0.9% | |
| Coinstar, Inc.* | | | 23,337 | | | | 1,369,182 | |
| Hotels, Restaurants & Leisure 3.2% | |
| Jack in the Box, Inc.* | | | 31,768 | | | | 1,248,164 | |
| Life Time Fitness, Inc.* | | | 23,107 | | | | 1,157,892 | |
| Panera Bread Co. "A"* (a) | | | 13,704 | | | | 2,548,122 | |
| | | | | | | | 4,954,178 | |
| Household Durables 1.4% | |
| Jarden Corp.* | | | 51,061 | | | | 2,233,919 | |
| Leisure Equipment & Products 1.3% | |
| Polaris Industries, Inc. (a) | | | 20,841 | | | | 1,979,895 | |
| Media 0.9% | |
| Cinemark Holdings, Inc. | | | 53,417 | | | | 1,491,403 | |
| Specialty Retail 6.2% | |
| Advance Auto Parts, Inc. | | | 12,251 | | | | 994,414 | |
| Ascena Retail Group, Inc.* (a) | | | 74,289 | | | | 1,296,343 | |
| Children's Place Retail Stores, Inc.* (a) | | | 24,575 | | | | 1,346,710 | |
| DSW, Inc. "A" (a) | | | 21,104 | | | | 1,550,511 | |
| PetSmart, Inc. | | | 23,945 | | | | 1,604,075 | |
| Ulta Salon, Cosmetics & Fragrance, Inc.* | | | 21,695 | | | | 2,172,971 | |
| Urban Outfitters, Inc.* | | | 19,478 | | | | 783,405 | |
| | | | | | | | 9,748,429 | |
| Textiles, Apparel & Luxury Goods 3.4% | |
| Carter's, Inc. | | | 23,581 | | | | 1,746,644 | |
| Deckers Outdoor Corp.* (a) | | | 18,170 | | | | 917,767 | |
| Hanesbrands, Inc. (a) | | | 53,635 | | | | 2,757,912 | |
| | | | | | | | 5,422,323 | |
| Consumer Staples 5.7% | |
| Food & Staples Retailing 2.5% | |
| Susser Holdings Corp.* (a) | | | 22,378 | | | | 1,071,459 | |
| The Fresh Market, Inc.* (a) | | | 27,690 | | | | 1,376,747 | |
| United Natural Foods, Inc.* | | | 28,141 | | | | 1,519,332 | |
| | | | | | | | 3,967,538 | |
| Food Products 1.9% | |
| Green Mountain Coffee Roasters, Inc.* (a) | | | 20,131 | | | | 1,511,033 | |
| Hain Celestial Group, Inc.* (a) | | | 21,652 | | | | 1,406,730 | |
| | | | | | | | 2,917,763 | |
| Household Products 1.3% | |
| Church & Dwight Co., Inc. | | | 32,931 | | | | 2,032,172 | |
| Energy 6.9% | |
| Energy Equipment & Services 4.3% | |
| Core Laboratories NV (a) | | | 8,260 | | | | 1,252,711 | |
| Dresser-Rand Group, Inc.* | | | 20,519 | | | | 1,230,730 | |
| Dril-Quip, Inc.* | | | 19,106 | | | | 1,725,081 | |
| Helix Energy Solutions Group, Inc.* (a) | | | 53,537 | | | | 1,233,492 | |
| | | Shares | | | Value ($) | |
| | | | | | | | | |
| Hornbeck Offshore Services, Inc.* | | | 25,262 | | | | 1,351,517 | |
| | | | | | | | 6,793,531 | |
| Oil, Gas & Consumable Fuels 2.6% | |
| Oasis Petroleum, Inc.* (a) | | | 37,951 | | | | 1,475,156 | |
| Rosetta Resources, Inc.* | | | 40,369 | | | | 1,716,490 | |
| Western Refining, Inc. (a) | | | 27,919 | | | | 783,686 | |
| | | | | | | | 3,975,332 | |
| Financials 9.8% | |
| Capital Markets 3.1% | |
| Affiliated Managers Group, Inc.* | | | 13,701 | | | | 2,246,142 | |
| Financial Engines, Inc. (a) | | | 27,685 | | | | 1,262,159 | |
| Lazard Ltd. "A" | | | 39,209 | | | | 1,260,570 | |
| | | | | | | | 4,768,871 | |
| Commercial Banks 1.1% | |
| Signature Bank* | | | 21,457 | | | | 1,781,360 | |
| Consumer Finance 2.5% | |
| DFC Global Corp.* | | | 66,316 | | | | 915,824 | |
| Encore Capital Group, Inc.* (a) | | | 21,325 | | | | 706,071 | |
| Portfolio Recovery Associates, Inc.* | | | 15,086 | | | | 2,317,662 | |
| | | | | | | | 3,939,557 | |
| Insurance 1.0% | |
| W.R. Berkley Corp. | | | 38,390 | | | | 1,568,615 | |
| Real Estate Management & Development 1.0% | |
| CBRE Group, Inc. "A"* | | | 69,709 | | | | 1,628,402 | |
| Thrifts & Mortgage Finance 1.1% | |
| Ocwen Financial Corp.* | | | 42,627 | | | | 1,757,085 | |
| Health Care 15.6% | |
| Biotechnology 3.0% | |
| Alkermes PLC* | | | 41,983 | | | | 1,204,072 | |
| Cubist Pharmaceuticals, Inc.* (a) | | | 11,462 | | | | 553,615 | |
| Momenta Pharmaceuticals, Inc.* | | | 89,708 | | | | 1,351,002 | |
| Onyx Pharmaceuticals, Inc.* | | | 11,050 | | | | 959,361 | |
| Pharmacyclics, Inc.* (a) | | | 7,344 | | | | 583,628 | |
| | | | | | | | 4,651,678 | |
| Health Care Equipment & Supplies 3.8% | |
| Analogic Corp. | | | 24,018 | | | | 1,749,231 | |
| ArthroCare Corp.* | | | 45,404 | | | | 1,567,800 | |
| HeartWare International, Inc.* | | | 15,421 | | | | 1,466,692 | |
| Thoratec Corp.* | | | 40,313 | | | | 1,262,200 | |
| | | | | | | | 6,045,923 | |
| Health Care Providers & Services 4.8% | |
| Catamaran Corp.* | | | 44,552 | | | | 2,170,573 | |
| Centene Corp.* | | | 30,543 | | | | 1,602,286 | |
| ExamWorks Group, Inc.* (a) | | | 83,953 | | | | 1,782,322 | |
| Humana, Inc. | | | 12,817 | | | | 1,081,498 | |
| Team Health Holdings, Inc.* | | | 22,207 | | | | 912,042 | |
| | | | | | | | 7,548,721 | |
| Health Care Technology 0.6% | |
| athenahealth, Inc.* | | | 10,776 | | | | 912,943 | |
| Pharmaceuticals 3.4% | |
| Endocyte, Inc.* (a) | | | 63,325 | | | | 831,457 | |
| Hi-Tech Pharmacal Co., Inc. | | | 61,884 | | | | 2,054,549 | |
| Pacira Pharmaceuticals, Inc.* | | | 82,132 | | | | 2,381,828 | |
| | | | | | | | 5,267,834 | |
| | | Shares | | | Value ($) | |
| | | | | | | | | |
| Industrials 14.2% | |
| Aerospace & Defense 1.3% | |
| BE Aerospace, Inc.* | | | 31,790 | | | | 2,005,313 | |
| Commercial Services & Supplies 1.6% | |
| Interface, Inc. (a) | | | 85,441 | | | | 1,449,934 | |
| Team, Inc.* | | | 26,970 | | | | 1,020,814 | |
| | | | | | | | 2,470,748 | |
| Electrical Equipment 1.7% | |
| General Cable Corp. | | | 26,743 | | | | 822,347 | |
| Thermon Group Holdings, Inc.* (a) | | | 90,116 | | | | 1,838,367 | |
| | | | | | | | 2,660,714 | |
| Machinery 6.1% | |
| Altra Holdings, Inc. | | | 41,817 | | | | 1,144,949 | |
| Chart Industries, Inc.* (a) | | | 26,289 | | | | 2,473,532 | |
| Joy Global, Inc. (a) | | | 13,333 | | | | 647,051 | |
| Manitowoc Co., Inc. (a) | | | 101,534 | | | | 1,818,474 | |
| Valmont Industries, Inc. | | | 10,848 | | | | 1,552,240 | |
| WABCO Holdings, Inc.* | | | 27,333 | | | | 2,041,502 | |
| | | | | | | | 9,677,748 | |
| Road & Rail 1.7% | |
| Kansas City Southern | | | 13,669 | | | | 1,448,367 | |
| Swift Transportation Co.* (a) | | | 71,409 | | | | 1,181,105 | |
| | | | | | | | 2,629,472 | |
| Trading Companies & Distributors 1.8% | |
| Applied Industrial Technologies, Inc. | | | 22,306 | | | | 1,078,049 | |
| United Rentals, Inc.* (a) | | | 34,025 | | | | 1,698,188 | |
| | | | | | | | 2,776,237 | |
| Information Technology 19.6% | |
| Communications Equipment 1.4% | |
| Finisar Corp.* (a) | | | 44,604 | | | | 756,038 | |
| Harris Corp. | | | 28,302 | | | | 1,393,873 | |
| | | | | | | | 2,149,911 | |
| Computers & Peripherals 1.5% | |
| Western Digital Corp. | | | 36,849 | | | | 2,287,954 | |
| Electronic Equipment, Instruments & Components 1.6% | |
| Cognex Corp. | | | 25,109 | | | | 1,135,429 | |
| IPG Photonics Corp. (a) | | | 22,001 | | | | 1,336,121 | |
| | | | | | | | 2,471,550 | |
| Internet Software & Services 1.6% | |
| CoStar Group, Inc.* | | | 14,057 | | | | 1,814,337 | |
| IAC/InterActiveCorp. | | | 16,460 | | | | 782,838 | |
| | | | | | | | 2,597,175 | |
| IT Services 3.1% | |
| Cardtronics, Inc.* | | | 58,941 | | | | 1,626,772 | |
| MAXIMUS, Inc. | | | 22,557 | | | | 1,680,045 | |
| VeriFone Systems, Inc.* | | | 48,151 | | | | 809,418 | |
| Virtusa Corp.* | | | 35,720 | | | | 791,555 | |
| | | | | | | | 4,907,790 | |
| Semiconductors & Semiconductor Equipment 1.4% | |
| ON Semiconductor Corp.* | | | 124,369 | | | | 1,004,901 | |
| RF Micro Devices, Inc.* | | | 219,656 | | | | 1,175,160 | |
| | | | | | | | 2,180,061 | |
| | | Shares | | | Value ($) | |
| | | | | | | | | |
| Software 9.0% | |
| Aspen Technology, Inc.* | | | 40,853 | | | | 1,176,158 | |
| Bottomline Technologies de, Inc.* | | | 43,025 | | | | 1,088,102 | |
| Cadence Design Systems, Inc.* (a) | | | 112,322 | | | | 1,626,423 | |
| Concur Technologies, Inc.* (a) | | | 17,465 | | | | 1,421,302 | |
| MICROS Systems, Inc.* (a) | | | 37,721 | | | | 1,627,661 | |
| NQ Mobile, Inc. (ADR)* (a) | | | 83,404 | | | | 673,904 | |
| PTC, Inc.* | | | 61,647 | | | | 1,512,201 | |
| QLIK Technologies, Inc.* (a) | | | 39,524 | | | | 1,117,343 | |
| Red Hat, Inc.* | | | 17,245 | | | | 824,656 | |
| Tyler Technologies, Inc.* | | | 19,916 | | | | 1,365,242 | |
| Ultimate Software Group, Inc.* (a) | | | 14,651 | | | | 1,718,416 | |
| | | | | | | | 14,151,408 | |
| Materials 4.6% | |
| Chemicals 1.6% | |
| CF Industries Holdings, Inc. | | | 5,001 | | | | 857,671 | |
| Westlake Chemical Corp. (a) | | | 16,277 | | | | 1,569,266 | |
| | | | | | | | 2,426,937 | |
| Construction Materials 0.9% | |
| Eagle Materials, Inc. | | | 21,321 | | | | 1,412,943 | |
| Containers & Packaging 1.0% | |
| Crown Holdings, Inc.* | | | 39,212 | | | | 1,612,790 | |
| Metals & Mining 0.6% | |
| Detour Gold Corp.* | | | 10,930 | | | | 85,740 | |
| Haynes International, Inc. | | | 17,250 | | | | 825,757 | |
| | | | | | | | 911,497 | |
| Paper & Forest Products 0.5% | |
| Schweitzer-Mauduit International, Inc. | | | 15,963 | | | | 796,234 | |
| Telecommunication Services 1.8% | |
| Diversified Telecommunication Services 0.8% | |
| inContact, Inc.* | | | 149,084 | | | | 1,225,471 | |
| Wireless Telecommunication Services 1.0% | |
| SBA Communications Corp. "A"* | | | 22,341 | | | | 1,655,915 | |
Total Common Stocks (Cost $115,462,857) | | | | 152,229,335 | |
| | |
| Exchange-Traded Fund 0.5% | |
| SPDR S&P Biotech (a) (Cost $728,338) | | | 7,865 | | | | 820,005 | |
| | |
| Securities Lending Collateral 27.9% | |
| Daily Assets Fund Institutional, 0.10% (b) (c) (Cost $43,757,303) | | | 43,757,303 | | | | 43,757,303 | |
| | |
| Cash Equivalents 3.6% | |
| Central Cash Management Fund, 0.07% (b) (Cost $5,669,837) | | | 5,669,837 | | | | 5,669,837 | |
| | | % of Net Assets | | | Value ($) | |
| | | | |
Total Investment Portfolio (Cost $165,618,335)† | | | 129.1 | | | | 202,476,480 | |
| Other Assets and Liabilities, Net | | | (29.1 | ) | | | (45,588,258 | ) |
| Net Assets | | | 100.0 | | | | 156,888,222 | |
* Non-income producing security.
† The cost for federal income tax purposes was $166,070,744. At June 30, 2013, net unrealized appreciation for all securities based on tax cost was $36,405,736. This consisted of aggregate gross unrealized appreciation for all securities in which there was an excess of value over tax cost of $40,191,101 and aggregate gross unrealized depreciation for all securities in which there was an excess of tax cost over value of $3,785,365.
(a) All or a portion of these securities were on loan (see Notes to Financial Statements). The value of securities loaned at June 30, 2013 amounted to $42,616,651, which is 27.2% of net assets.
(b) Affiliated fund managed by Deutsche Investment Management Americas Inc. The rate shown is the annualized seven-day yield at period end.
(c) Represents collateral held in connection with securities lending. Income earned by the Fund is net of borrower rebates.
ADR: American Depositary Receipt
S&P: Standard & Poor's
SPDR: Standard & Poor's Depositary Receipt
Fair Value Measurements
Various inputs are used in determining the value of the Fund's investments. These inputs are summarized in three broad levels. Level 1 includes quoted prices in active markets for identical securities. Level 2 includes other significant observable inputs (including quoted prices for similar securities, interest rates, prepayment speeds, and credit risk). Level 3 includes significant unobservable inputs (including the Fund's own assumptions in determining the fair value of investments). The inputs or methodology used for valuing securities are not necessarily an indication of the risk associated with investing in those securities.
The following is a summary of the inputs used as of June 30, 2013 in valuing the Fund's investments. For information on the Fund's policy regarding the valuation of investments, please refer to the Security Valuation section of Note A in the accompanying Notes to Financial Statements.
| Assets | | Level 1 | | | Level 2 | | | Level 3 | | | Total | |
| | |
| Common Stocks (d) | | $ | 152,229,335 | | | $ | — | | | $ | — | | | $ | 152,229,335 | |
| Exchange-Traded Fund | | | 820,005 | | | | — | | | | — | | | | 820,005 | |
| Short-Term Investments (d) | | | 49,427,140 | | | | — | | | | — | | | | 49,427,140 | |
| Total | | $ | 202,476,480 | | | $ | — | | | $ | — | | | $ | 202,476,480 | |
There have been no transfers between fair value measurement levels during the six months ended June 30, 2013.
(d) See Investment Portfolio for additional detailed categorizations.
The accompanying notes are an integral part of the financial statements.
Statement of Assets and Liabilities | as of June 30, 2013 (Unaudited) | |
| Assets | |
Investments: Investments in non-affiliated securities, at value (cost $116,191,195) — including $42,616,651 of securities loaned | | $ | 153,049,340 | |
| Investment in Daily Assets Fund Institutional (cost $43,757,303)* | | | 43,757,303 | |
| Investment in Central Cash Management Fund (cost $5,669,837) | | | 5,669,837 | |
| Total investments in securities, at value (cost $165,618,335) | | | 202,476,480 | |
| Cash | | | 10,000 | |
| Foreign currency, at value (cost $275) | | | 269 | |
| Receivable for investments sold | | | 1,523,251 | |
| Receivable for Fund shares sold | | | 8,080 | |
| Dividends receivable | | | 32,582 | |
| Interest receivable | | | 12,223 | |
| Other assets | | | 1,072 | |
| Total assets | | | 204,063,957 | |
| Liabilities | |
| Payable upon return of securities loaned | | | 43,757,303 | |
| Payable for investments purchased | | | 3,177,740 | |
| Payable for Fund shares redeemed | | | 95,910 | |
| Accrued management fee | | | 71,460 | |
| Accrued Trustees' fees | | | 1,637 | |
| Other accrued expenses and payables | | | 71,685 | |
| Total liabilities | | | 47,175,735 | |
| Net assets, at value | | $ | 156,888,222 | |
| Net Assets Consist of | |
| Distributions in excess of net investment income | | | (247,905 | ) |
Net unrealized appreciation (depreciation) on: Investments | | | 36,858,145 | |
| Foreign currency | | | (104 | ) |
| Accumulated net realized gain (loss) | | | (23,273,717 | ) |
| Paid-in capital | | | 143,551,803 | |
| Net assets, at value | | $ | 156,888,222 | |
Class A Net Asset Value, offering and redemption price per share ($156,888,222 ÷ 9,124,867 outstanding shares of beneficial interest, no par value, unlimited number of shares authorized) | | $ | 17.19 | |
* Represents collateral on securities loaned.
The accompanying notes are an integral part of the financial statements.
Statement of Operations
| for the six months ended June 30, 2013 (Unaudited) | |
| Investment Income | |
Income: Dividends (net of foreign taxes withheld of $956) | | $ | 270,257 | |
| Income distributions — Central Cash Management Fund | | | 2,519 | |
| Securities lending income, including income from Daily Assets Fund Institutional, net of borrower rebates | | | 99,596 | |
| Total income | | | 372,372 | |
Expenses: Management fee | | | 422,788 | |
| Administration fee | | | 76,870 | |
| Services to shareholders | | | 1,595 | |
| Custodian fee | | | 5,369 | |
| Audit and tax fees | | | 29,634 | |
| Legal fees | | | 81 | |
| Trustees' fees and expenses | | | 3,679 | |
| Total expenses | | | 540,016 | |
| Net investment income (loss) | | | (167,644 | ) |
| Realized and Unrealized Gain (Loss) | |
Net realized gain (loss) from: Investments | | | 7,988,146 | |
Change in net unrealized appreciation (depreciation) on: Investments | | | 11,733,135 | |
| Foreign currency | | | (113 | ) |
| | | | 11,733,022 | |
| Net gain (loss) | | | 19,721,168 | |
| Net increase (decrease) in net assets resulting from operations | | $ | 19,553,524 | |
The accompanying notes are an integral part of the financial statements.
Statement of Changes in Net Assets | Increase (Decrease) in Net Assets | | Six Months Ended June 30, 2013 (Unaudited) | | | Year Ended December 31, 2012 | |
Operations: Net investment income (loss) | | $ | (167,644 | ) | | $ | 160,586 | |
| Net realized gain (loss) | | | 7,988,146 | | | | 3,935,183 | |
| Change in net unrealized appreciation (depreciation) | | | 11,733,022 | | | | 16,236,973 | |
| Net increase (decrease) in net assets resulting from operations | | | 19,553,524 | | | | 20,332,742 | |
Distributions to shareholders from: Net investment income: Class A | | | (194,886 | ) | | | — | |
| Total distributions | | | (194,886 | ) | | | — | |
Fund share transactions: Class A Proceeds from shares sold | | | 2,230,667 | | | | 4,543,991 | |
| Reinvestment of distributions | | | 194,886 | | | | — | |
| Cost of shares redeemed | | | (10,355,054 | ) | | | (26,306,762 | ) |
| Net increase (decrease) in net assets from Class A share transactions | | | (7,929,501 | ) | | | (21,762,771 | ) |
| Increase (decrease) in net assets | | | 11,429,137 | | | | (1,430,029 | ) |
| Net assets at beginning of period | | | 145,459,085 | | | | 146,889,114 | |
| Net assets at end of period (including distributions in excess of net investment income and undistributed net investment income of $247,905 and $114,625, respectively) | | $ | 156,888,222 | | | $ | 145,459,085 | |
| Other Information | |
Class A Shares outstanding at beginning of period | | | 9,604,576 | | | | 11,094,343 | |
| Shares sold | | | 136,395 | | | | 306,987 | |
| Shares issued to shareholders in reinvestment of distributions | | | 11,761 | | | | — | |
| Shares redeemed | | | (627,865 | ) | | | (1,796,754 | ) |
| Net increase (decrease) in Class A shares | | | (479,709 | ) | | | (1,489,767 | ) |
| Shares outstanding at end of period | | | 9,124,867 | | | | 9,604,576 | |
The accompanying notes are an integral part of the financial statements.
| | | | | | Years Ended December 31, | |
| Class A | | Six Months Ended 6/30/13 (Unaudited) | | | 2012 | | | 2011 | | | 2010 | | | 2009 | | | 2008 | |
| Selected Per Share Data | |
| Net asset value, beginning of period | | $ | 15.14 | | | $ | 13.24 | | | $ | 13.85 | | | $ | 10.70 | | | $ | 7.61 | | | $ | 15.07 | |
Income (loss) from investment operations: Net investment income (loss)a | | | (.02 | ) | | | .02 | | | | (.03 | ) | | | (.01 | ) | | | (.02 | ) | | | (.01 | ) |
| Net realized and unrealized gain (loss) | | | 2.09 | | | | 1.88 | | | | (.50 | ) | | | 3.16 | | | | 3.11 | | | | (7.45 | ) |
| Total from investment operations | | | 2.07 | | | | 1.90 | | | | (.53 | ) | | | 3.15 | | | | 3.09 | | | | (7.46 | ) |
Less distributions from: Net investment income | | | (.02 | ) | | | — | | | | (.08 | ) | | | — | | | | — | | | | — | |
| Net asset value, end of period | | $ | 17.19 | | | $ | 15.14 | | | $ | 13.24 | | | $ | 13.85 | | | $ | 10.70 | | | $ | 7.61 | |
| Total Return (%) | | | 13.68 | ** | | | 14.35 | | | | (3.91 | ) | | | 29.44 | | | | 40.60 | | | | (49.50 | )b |
| Ratios to Average Net Assets and Supplemental Data | |
| Net assets, end of period ($ millions) | | | 157 | | | | 145 | | | | 147 | | | | 88 | | | | 80 | | | | 69 | |
| Ratio of expenses before expense reductions (%) | | | .72 | * | | | .74 | | | | .73 | | | | .78 | | | | .77 | | | | .88 | |
| Ratio of expenses after expense reductions (%) | | | .72 | * | | | .74 | | | | .73 | | | | .78 | | | | .77 | | | | .85 | |
| Ratio of net investment income (loss) (%) | | | (.24 | )* | | | .11 | | | | (.23 | ) | | | (.12 | ) | | | (.22 | ) | | | (.04 | ) |
| Portfolio turnover rate (%) | | | 29 | ** | | | 57 | | | | 84 | | | | 64 | | | | 93 | | | | 67 | |
a Based on average shares outstanding during the period. b Total return would have been lower had certain expenses not been reduced. * Annualized ** Not annualized | |
Notes to Financial Statements (Unaudited)
A. Organization and Significant Accounting Policies
DWS Small Mid Cap Growth VIP (the "Fund") is a diversified series of DWS Variable Series II (the "Trust"), which is registered under the Investment Company Act of 1940, as amended (the "1940 Act"), as an open-end management investment company organized as a Massachusetts business trust.
The Fund's financial statements are prepared in accordance with accounting principles generally accepted in the United States of America which require the use of management estimates. Actual results could differ from those estimates. The policies described below are followed consistently by the Fund in the preparation of its financial statements.
Security Valuation. Investments are stated at value determined as of the close of regular trading on the New York Stock Exchange on each day the exchange is open for trading.
Various inputs are used in determining the value of the Fund's investments. These inputs are summarized in three broad levels. Level 1 includes quoted prices in active markets for identical securities. Level 2 includes other significant observable inputs (including quoted prices for similar securities, interest rates, prepayment speeds, and credit risk). Level 3 includes significant unobservable inputs (including the Fund's own assumptions in determining the fair value of investments). The inputs or methodology used for valuing securities are not necessarily an indication of the risk associated with investing in those securities.
Equity securities and exchange-traded funds ("ETFs") are valued at the most recent sale price or official closing price reported on the exchange (U.S. or foreign) or over-the-counter market on which they trade and are categorized as Level 1 securities. Securities or ETFs for which no sales are reported are valued at the calculated mean between the most recent bid and asked quotations on the relevant market or, if a mean cannot be determined, at the most recent bid quotation.
Investments in open-end investment companies are valued at their net asset value each business day and are categorized as Level 1.
Securities and other assets for which market quotations are not readily available or for which the above valuation procedures are deemed not to reflect fair value are valued in a manner that is intended to reflect their fair value as determined in accordance with procedures approved by the Board and are generally categorized as Level 3. In accordance with the Fund's valuation procedures, factors used in determining value may include, but are not limited to, the type of the security; the size of the holding; the initial cost of the security; the existence of any contractual restrictions on the security's disposition; the price and extent of public trading in similar securities of the issuer or of comparable companies; quotations or evaluated prices from broker-dealers and/or pricing services; information obtained from the issuer, analysts, and/or the appropriate stock exchange (for exchange-traded securities); an analysis of the company's or issuer's financial statements; an evaluation of the forces that influence the issuer and the market(s) in which the security is purchased and sold and with respect to debt securities; the maturity, coupon, creditworthiness, currency denomination and the movement of the market in which the security is normally traded. The value determined under these procedures may differ from published values for the same securities.
Disclosure about the classification of fair value measurements is included in a table following the Fund's Investment Portfolio.
Securities Lending. Deutsche Bank AG, as lending agent, lends securities of the Fund to certain financial institutions under the terms of the Security Lending Agreement. The Fund retains the benefits of owning the securities it has loaned and continues to receive interest and dividends generated by the securities and to participate in any changes in their market value. The Fund requires the borrowers of the securities to maintain collateral with the Fund consisting of either cash or liquid, unencumbered assets having a value at least equal to the value of the securities loaned. When the collateral falls below specified amounts, the lending agent will use its best effort to obtain additional collateral on the next business day to meet required amounts under the security lending agreement. The Fund may invest the cash collateral into a joint trading account in an affiliated money market fund pursuant to Exemptive Orders issued by the SEC. The Fund receives compensation for lending its securities either in the form of fees or by earning interest on invested cash collateral net of borrower rebates and fees paid to a lending agent. Either the Fund or the borrower may terminate the loan. There may be risks of delay and costs in recovery of securities or even loss of rights in the collateral should the borrower of the securities fail financially. If the Fund is not able to recover securities lent, the Fund may sell the collateral and purchase a replacement investment in the market, incurring the risk that the value of the replacement security is greater than the value of the collateral. The Fund is also subject to all investment risks associated with the reinvestment of any cash collateral received, including, but not limited to, interest rate, credit and liquidity risk associated with such investments.
As of June 30, 2013, the Fund had securities on loan with a gross value of $42,616,651. The value of the related collateral, $43,757,303, exceeded the value of the securities loaned at period end.
Federal Income Taxes. The Fund's policy is to comply with the requirements of the Internal Revenue Code, as amended, which are applicable to regulated investment companies, and to distribute all of its taxable income to its shareholders.
Under the Regulated Investment Company Modernization Act of 2010, net capital losses incurred post-enactment may be carried forward indefinitely, and their character is retained as short-term and/or long-term. Previously, net capital losses were carried forward for eight years and treated as short-term losses. As a transition rule, the Act requires that post-enactment net capital losses be used before pre-enactment net capital losses.
At December 31, 2012, the Fund had a net tax basis capital loss carryforward of approximately $30,593,000, including $29,395,000 of pre-enactment losses, including approximately $5,435,000 inherited from its mergers with affiliated funds in previous years, which may be applied against any realized net taxable capital gains of each succeeding year until fully utilized or until December 31, 2016 ($5,435,000) and December 31, 2017 ($23,960,000), the respective expiration dates, whichever occurs first, and which may be subject to certain limitations under Section 382-384 of Internal Revenue Code; and approximately $1,198,000 of post-enactment short-term losses, which may be applied against realized net taxable capital gains indefinitely.
The Fund has reviewed the tax positions for the open tax years as of December 31, 2012 and has determined that no provision for income tax is required in the Fund's financial statements. The Fund's federal tax returns for the prior three fiscal years remain open subject to examination by the Internal Revenue Service.
Distribution of Income and Gains. Distributions from net investment income of the Fund, if any, are declared and distributed to shareholders annually. Net realized gains from investment transactions, in excess of available capital loss carryforwards, would be taxable to the Fund if not distributed and, therefore, will be distributed to shareholders at least annually. The Fund may also make additional distributions for tax purposes if necessary.
The timing and characterization of certain income and capital gain distributions are determined annually in accordance with federal tax regulations which may differ from accounting principles generally accepted in the United States of America. These differences primarily relate to net operating losses and certain securities sold at a loss. As a result, net investment income (loss) and net realized gain (loss) on investment transactions for a reporting period may differ significantly from distributions during such period. Accordingly, the Fund may periodically make reclassifications among certain of its capital accounts without impacting the net asset value of the Fund.
The tax character of current year distributions will be determined at the end of the current fiscal year.
Expenses. Expenses of the Trust arising in connection with a specific fund are allocated to that fund. Other Trust expenses which cannot be directly attributed to a fund are apportioned among the funds in the Trust based upon the relative net assets or other appropriate measures.
Contingencies. In the normal course of business, the Fund may enter into contracts with service providers that contain general indemnification clauses. The Fund's maximum exposure under these arrangements is unknown as this would involve future claims that may be made against the Fund that have not yet been made. However, based on experience, the Fund expects the risk of loss to be remote.
Other. Investment transactions are accounted for on a trade date plus one basis for daily net asset value calculations. However, for financial reporting purposes, investment transactions are reported on trade date. Interest income is recorded on the accrual basis. Dividend income is recorded on the ex-dividend date net of foreign withholding taxes. Realized gains and losses from investment transactions are recorded on an identified cost basis and may include proceeds from litigation.
B. Purchases and Sales of Securities
During the six months ended June 30, 2013, purchases and sales of investment transactions (excluding short-term investments) aggregated $43,602,723 and $50,366,198, respectively.
C. Related Parties
Management Agreement. Under the Investment Management Agreement with Deutsche Investment Management Americas Inc. ("DIMA" or the "Advisor"), an indirect, wholly owned subsidiary of Deutsche Bank AG, the Advisor directs the investments of the Fund in accordance with its investment objectives, policies and restrictions. The Advisor determines the securities, instruments and other contracts relating to investments to be purchased, sold or entered into by the Fund.
Pursuant to the Investment Management Agreement with the Advisor, the Fund pays a monthly management fee based on the Fund's average daily net assets, computed and accrued daily and payable monthly, at the following annual rates:
| First $250 million | | | .550 | % |
| Next $750 million | | | .525 | % |
| Over $1 billion | | | .500 | % |
Accordingly, for the six months ended June 30, 2013, the fee pursuant to the Investment Management Agreement was equivalent to an annualized effective rate of 0.55% of the Fund's average daily net assets.
Administration Fee. Pursuant to an Administrative Services Agreement, DIMA provides most administrative services to the Fund. For all services provided under the Administrative Services Agreement, the Fund pays DIMA an annual fee ("Administration Fee") of 0.10% of the Fund's average daily net assets, computed and accrued daily and payable monthly. For the six months ended June 30, 2013, the Administration Fee was $76,870, of which $12,993 is unpaid.
Service Provider Fees. DWS Investments Service Company ("DISC"), an affiliate of the Advisor, is the transfer agent, dividend-paying agent and shareholder service agent for the Fund. Pursuant to a sub-transfer agency agreement between DISC and DST Systems, Inc. ("DST"), DISC has delegated certain transfer agent, dividend-paying agent and shareholder service agent functions to DST. DISC compensates DST out of the shareholder servicing fee it receives from the Fund. For the six months ended June 30, 2013, the amounts charged to the Fund by DISC aggregated $174, of which $57 is unpaid.
Typesetting and Filing Service Fees. Under an agreement with DIMA, DIMA is compensated for providing typesetting and certain regulatory filing services to the Fund. For the six months ended June 30, 2013, the amount charged to the Fund by DIMA included in the Statement of Operations under "reports to shareholders" aggregated $6,726, of which $6,470 is unpaid.
Trustees' Fees and Expenses. The Fund paid retainer fees to each Trustee not affiliated with the Advisor, plus specified amounts to the Board Chairperson and Vice Chairperson and to each committee Chairperson.
Affiliated Cash Management Vehicles. The Fund may invest uninvested cash balances in Central Cash Management Fund and DWS Variable NAV Money Fund, affiliated money market funds which are managed by the Advisor. Each affiliated money market fund seeks to provide a high level of current income consistent with liquidity and the preservation of capital. Each affiliated money market fund is managed in accordance with Rule 2a-7 under the Investment Company Act of 1940, which governs the quality, maturity, diversity and liquidity of instruments in which a money market fund may invest. Central Cash Management Fund seeks to maintain a stable net asset value, and DWS Variable NAV Money Fund maintains a floating net asset value. The Fund indirectly bears its proportionate share of the expenses of each affiliated money market fund in which it invests. Central Cash Management Fund does not pay the Advisor an investment management fee. To the extent that DWS Variable NAV Money Fund pays an investment management fee to the Advisor, the Advisor will waive an amount of the investment management fee payable to the Advisor by the Fund equal to the amount of the investment management fee payable on the Fund's assets invested in DWS Variable NAV Money Fund.
Securities Lending Agent Fees. Deutsche Bank AG serves as securities lending agent for the Fund. For the six months ended June 30, 2013, the Fund incurred securities lending agent fees to Deutsche Bank AG in the amount of $11,066.
D. Ownership of the Fund
At June 30, 2013, three Participating Insurance Companies were owners of record of 10% or more of the total outstanding Class A shares of the Fund, each owning 55%, 22% and 15%.
E. Line of Credit
The Fund and other affiliated funds (the "Participants") share in a $375 million revolving credit facility provided by a syndication of banks. The Fund may borrow for temporary or emergency purposes, including the meeting of redemption requests that otherwise might require the untimely disposition of securities. The Participants are charged an annual commitment fee which is allocated based on net assets, among each of the Participants. Interest is calculated at a rate per annum equal to the sum of the Federal Funds Rate plus 1.25 percent plus if LIBOR exceeds the Federal Funds Rate the amount of such excess. The Fund may borrow up to a maximum of 33 percent of its net assets under the agreement. The Fund had no outstanding loans at June 30, 2013.
Information About Your Fund's Expenses (Unaudited)
As an investor of the Fund, you incur two types of costs: ongoing expenses and transaction costs. Ongoing expenses include management fees and other Fund expenses. Examples of transaction costs include contract charges and account maintenance fees, which are not shown in this section. The following tables are intended to help you understand your ongoing expenses (in dollars) of investing in the Fund and to help you compare these expenses with the ongoing expenses of investing in other mutual funds. The example in the table is based on an investment of $1,000 invested at the beginning of the six-month period and held for the entire period (January 1, 2013 to June 30, 2013).
The tables illustrate your Fund's expenses in two ways:
•Actual Fund Return. This helps you estimate the actual dollar amount of ongoing expenses (but not transaction costs) paid on a $1,000 investment in the Fund using the Fund's actual return during the period. To estimate the expenses you paid over the period, simply divide your account value by $1,000 (for example, an $8,600 account value divided by $1,000 = 8.6), then multiply the result by the number in the "Expenses Paid per $1,000" line under the share class you hold.
• Hypothetical 5% Fund Return. This helps you to compare your Fund's ongoing expenses (but not transaction costs) with those of other mutual funds using the Fund's actual expense ratio and a hypothetical rate of return of 5% per year before expenses. Examples using a 5% hypothetical Fund return may be found in the shareholder reports of other mutual funds. The hypothetical account values and expenses may not be used to estimate the actual ending account balance or expenses you paid for the period.
Please note that the expenses shown in these tables are meant to highlight your ongoing expenses only and do not reflect any transaction costs. The "Expenses Paid per $1,000" line of the tables is useful in comparing ongoing expenses only and will not help you determine the relative total expense of owning different funds. If these transaction costs had been included, your costs would have been higher.
Expenses and Value of a $1,000 Investment for the six months ended June 30, 2013 | |
| Actual Fund Return | | Class A | |
| Beginning Account Value 1/1/13 | | $ | 1,000.00 | |
| Ending Account Value 6/30/13 | | $ | 1,136.80 | |
| Expenses Paid per $1,000* | | $ | 3.81 | |
| Hypothetical 5% Fund Return | | Class A | |
| Beginning Account Value 1/1/13 | | $ | 1,000.00 | |
| Ending Account Value 6/30/13 | | $ | 1,021.22 | |
| Expenses Paid per $1,000* | | $ | 3.61 | |
* Expenses are equal to the Fund's annualized expense ratio, multiplied by the average account value over the period, multiplied by 181 (the number of days in the most recent six-month period), then divided by 365.
| Annualized Expense Ratio | Class A | |
| DWS Variable Series II — DWS Small Mid Cap Growth VIP | .72% | |
For more information, please refer to the Fund's prospectus.
These tables do not reflect charges and fees ("contract charges") associated with the separate account that invests in the Fund or any variable life insurance policy or variable annuity contract for which the Fund is an investment option.
For an analysis of the fees associated with an investment in the Fund or similar funds, please refer to http://apps.finra.org/fundanalyzer/1/fa.aspx.
The Trust's policies and procedures for voting proxies for portfolio securities and information about how the Trust voted proxies related to its portfolio securities during the 12-month period ended June 30 are available on our Web site — www.dws-investments.com (click on "proxy voting" at the bottom of the page) — or on the SEC's Web site — www.sec.gov. To obtain a written copy of the Trust's policies and procedures without charge, upon request, call us toll free at (800) 728-3337.
Summary of Management Fee Evaluation by Independent Fee Consultant
September 17, 2012
Pursuant to an Order entered into by Deutsche Investment Management Americas and affiliates (collectively, "DeAM") with the Attorney General of New York, I, Thomas H. Mack, have been appointed the Independent Fee Consultant for the DWS Funds (formerly the DWS Scudder Funds). My duties include preparing an annual written evaluation of the management fees DeAM charges the Funds, considering among other factors the management fees charged by other mutual fund companies for like services, management fees DeAM charges other clients for like services, DeAM's costs of supplying services under the management agreements and related profit margins, possible economies of scale if a Fund grows larger, and the nature and quality of DeAM's services, including fund performance. This report summarizes my evaluation for 2012, including my qualifications, the evaluation process for each of the DWS Funds, consideration of certain complex-level factors, and my conclusions. I served in substantially the same capacity in 2007, 2008, 2009, 2010 and 2011.
Qualifications
For more than 35 years I have served in various professional capacities within the investment management business. I have held investment analysis and advisory positions, including securities analyst, portfolio strategist and director of investment policy with a large investment firm. I have also performed business management functions, including business development, financial management and marketing research and analysis.
Since 1991, I have been an independent consultant within the asset management industry. I have provided services to over 125 client organizations, including investment managers, mutual fund boards, product distributors and related organizations. Over the past ten years I have completed a number of assignments for mutual fund boards, specifically including assisting boards with management contract renewal.
I hold a Master of Business Administration degree, with highest honors, from Harvard University and Master of Science and Bachelor of Science (highest honors) degrees from the University of California at Berkeley. I am an independent director and audit committee financial expert for two closed-end mutual funds and have served in various leadership and financial oversight capacities with non-profit organizations.
Evaluation of Fees for each DWS Fund
My work focused primarily on evaluating, fund-by-fund, the fees charged to each of the 103 mutual fund portfolios in the DWS Fund family. For each Fund, I considered each of the key factors mentioned above, as well as any other relevant information. In doing so I worked closely with the Funds' Independent Directors in their annual contract renewal process, as well as in their approval of contracts for several new funds (documented separately).
In evaluating each Fund's fees, I reviewed comprehensive materials provided by or on behalf of DeAM, including expense information prepared by Lipper Analytical, comparative performance information, profitability data, manager histories, and other materials. I also accessed certain additional information from the Lipper and Morningstar databases and drew on my industry knowledge and experience.
To facilitate evaluating this considerable body of information, I prepared for each Fund a document summarizing the key data elements in each area as well as additional analytics discussed below. This made it possible to consider each key data element in the context of the others.
In the course of contract renewal, DeAM agreed to implement a number of fee and expense adjustments requested by the Independent Directors which will favorably impact future fees and expenses, and my evaluation includes the effects of these changes.
Fees and Expenses Compared with Other Funds
The competitive fee and expense evaluation for each fund focused on two primary comparisons:
The Fund's contractual management fee (the advisory fee plus the administration fee where applicable) compared with those of a group of typically 12-15 funds in the same Lipper investment category (e.g. Large Capitalization Growth) having similar distribution arrangements and being of similar size.
The Fund's total expenses compared with a broader universe of funds from the same Lipper investment category and having similar distribution arrangements.
These two comparisons provide a view of not only the level of the fee compared with funds of similar scale but also the total expense the Fund bears for all the services it receives, in comparison with the investment choices available in the Fund's investment category and distribution channel. The principal figure-of-merit used in these comparisons was the subject Fund's percentile ranking against peers.
DeAM's Fees for Similar Services to Others
DeAM provided management fee schedules for all of its US domiciled fund and non-fund investment management accounts in any of the investment categories where there is a DWS Fund. These similar products included the other DWS Funds, non-fund pooled accounts, institutional accounts and sub-advisory accounts. Using this information, I calculated for each Fund the fee that would be charged to each similar product, at the subject Fund's asset level.
Evaluating information regarding non-fund products is difficult because there are varying levels of services required for different types of accounts, with mutual funds generally requiring considerably more regulatory and administrative types of service as well as having more frequent cash flows than other types of accounts. Also, while mutual fund fees for similar fund products can be expected to be similar, there will be some differences due to different pricing conditions in different distribution channels (e.g. retail funds versus those used in variable insurance products), differences in underlying investment processes and other factors.
Costs and Profit Margins
DeAM provided a detailed profitability analysis for each Fund. After making some adjustments so that the presentation would be more comparable to the available industry figures, I reviewed profit margins from investment management alone, from investment management plus other fund services (excluding distribution) provided to the Funds by DeAM (principally shareholder services), and DeAM profits from all sources, including distribution. A later section comments on overall profitability.
Economies of Scale
Economies of scale — an expected decline in management cost per dollar of fund assets as fund assets grow — are very rarely quantified and documented because of inherent difficulties in collecting and analyzing relevant data. However, in virtually every investment category that I reviewed, larger funds tend to have lower fees and lower total expenses than smaller funds. To see how each DWS Fund compares with this industry observation, I reviewed:
The trend in Fund assets over the last five years and the accompanying trend in total expenses. This shows if the Fund has grown and, if so, whether total expense (management fees as well as other expenses) have declined as a percent of assets.
Whether the Fund has break-points in its management fee schedule, the extent of the fee reduction built into the schedule and the asset levels where the breaks take effect, and in the case of a sub-advised Fund how the Fund's break-points compare with those of the sub-advisory fee schedule.
How the Fund's contractual fee schedule compares with trends in the industry data. To accomplish this, I constructed a chart showing how actual latest-fiscal-year contractual fees of the Fund and of other similar funds relate to average fund assets, with the subject Fund's contractual fee schedule superimposed.
Quality of Service — Performance
The quality-of-service evaluation focused on investment performance, which is the principal result of the investment management service. Each Fund's performance was reviewed over the past 1, 3, 5 and 10 years, as applicable, and compared with that of other funds in the same investment category and with a suitable market index.
In addition, I calculated and reviewed risk-adjusted returns relative to an index of similar mutual funds' returns and a suitable market index. The risk-adjusted returns analysis provides a way of determining the extent to which the Fund's return comparisons are mainly the product of investment value-added (or lack thereof) or alternatively taking considerably more or less risk than is typical in its investment category.
I also received and considered the history of portfolio manager changes for each Fund, as this provided an important context for evaluating the performance results.
Complex-Level Considerations
While this evaluation was conducted mainly at the individual fund level, there are some issues relating to the reasonableness of fees that can alternatively be considered across the whole fund complex:
I reviewed DeAM's profitability analysis for all DWS Funds, with a view toward determining if the allocation procedures used were reasonable and how profit levels compared with public data for other investment managers.
I considered whether DeAM and affiliates receive any significant ancillary or "fallout" benefits that should be considered in interpreting the direct profitability results. These would be situations where serving as the investment manager of the Funds is beneficial to another part of the Deutsche Bank organization.
I considered how aggregated DWS Fund expenses had varied over the years, by asset class and in the context of trends in asset levels.
I considered how aggregated DWS Fund performance measures relative to appropriate peers had varied by asset class and over time.
I reviewed the structure of the DeAM organization, trends in staffing levels, and information on compensation of investment management and other professionals compared with industry data.
Findings
Based on the process and analysis discussed above, which included reviewing a wide range of information from management and external data sources and considering among other factors the fees DeAM charges other clients, the fees charged by other fund managers, DeAM's costs and profits associated with managing the Funds, economies of scale, possible fall-out benefits, and the nature and quality of services provided, in my opinion the management fees charged the DWS Funds are reasonable.
Thomas H. Mack
President, Thomas H. Mack & Co., Inc.
DWS Investments Distributors, Inc.
222 South Riverside Plaza
Chicago, IL 60606
(800) 621-1148
VS2SMCG-3 (R-028388-2 8/13)
JUNE 30, 2013
SEMIANNUAL REPORT
DWS VARIABLE SERIES II
DWS Small Mid Cap Value VIP
(formerly DWS Dreman Small Mid Cap Value VIP)
Contents
8 Statement of Assets and Liabilities 9 Statement of Operations 9 Statement of Changes in Net Assets 13 Notes to Financial Statements 17 Information About Your Fund's Expenses 19 Summary of Management Fee Evaluation by Independent Fee Consultant |
This report must be preceded or accompanied by a prospectus. To obtain an additional prospectus or summary prospectus, if available, call (800) 728-3337 or your financial representative. We advise you to consider the Fund's objectives, risks, charges and expenses carefully before investing. The summary prospectus and prospectus contain this and other important information about the Fund. Please read the prospectus carefully before you invest.
Any fund that focuses in a particular segment of the market will generally be more volatile than a fund that invests more broadly. Smaller and medium company stocks tend to be more volatile than large company stocks. The fund may lend securities to approved institutions. Stocks may decline in value. See the prospectus for details.
DWS Investments is part of the Deutsche Asset & Wealth Management division of Deutsche Bank AG.
NOT FDIC/NCUA INSURED NO BANK GUARANTEE MAY LOSE VALUE NOT A DEPOSIT
NOT INSURED BY ANY FEDERAL GOVERNMENT AGENCY
Performance Summary June 30, 2013 (Unaudited)
Fund performance shown is historical, assumes reinvestment of all dividend and capital gain distributions and does not guarantee future results. Investment return and principal value fluctuate with changing market conditions so that, when redeemed, shares may be worth more or less than their original cost. Current performance may be lower or higher than the performance data quoted. Please contact your participating insurance company for the Fund's most recent month-end performance. Performance doesn't reflect charges and fees ("contract charges") associated with the separate account that invests in the Fund or any variable life insurance policy or variable annuity contract for which the Fund is an investment option. These charges and fees will reduce returns. While all share classes have the same underlying portfolio, their performance will differ.
The gross expense ratios of the Fund, as stated in the fee table of the prospectus dated May 1, 2013 are 0.82% and 1.16% for Class A and Class B shares, respectively, and may differ from the expense ratios disclosed in the Financial Highlights tables in this report.
| Growth of an Assumed $10,000 Investment in DWS Small Mid Cap Value VIP |
| The Russell 2500™ Value Index is an unmanaged Index of those securities in the Russell 3000® Index with lower price-to-book ratios and lower forecasted growth values. Index returns do not reflect any fees or expenses and it is not possible to invest directly into an index. |
| |
| Yearly periods ended June 30 | |
| Comparative Results | |
| DWS Small Mid Cap Value VIP | | 6-Month‡ | | | 1-Year | | | 3-Year | | | 5-Year | | | 10-Year | |
| Class A | Growth of $10,000 | | $ | 11,449 | | | $ | 12,432 | | | $ | 15,658 | | | $ | 14,365 | | | $ | 28,764 | |
| Average annual total return | | | 14.49 | % | | | 24.32 | % | | | 16.12 | % | | | 7.51 | % | | | 11.14 | % |
| Russell 2500 Value Index | Growth of $10,000 | | $ | 11,510 | | | $ | 12,688 | | | $ | 16,816 | | | $ | 15,686 | | | $ | 26,326 | |
| Average annual total return | | | 15.10 | % | | | 26.88 | % | | | 18.92 | % | | | 9.42 | % | | | 10.16 | % |
| DWS Small Mid Cap Value VIP | | 6-Month‡ | | | 1-Year | | | 3-Year | | | 5-Year | | | 10-Year | |
| Class B | Growth of $10,000 | | $ | 11,426 | | | $ | 12,385 | | | $ | 15,502 | | | $ | 14,125 | | | $ | 27,762 | |
| Average annual total return | | | 14.26 | % | | | 23.85 | % | | | 15.73 | % | | | 7.15 | % | | | 10.75 | % |
| Russell 2500 Value Index | Growth of $10,000 | | $ | 11,510 | | | $ | 12,688 | | | $ | 16,816 | | | $ | 15,686 | | | $ | 26,326 | |
| Average annual total return | | | 15.10 | % | | | 26.88 | % | | | 18.92 | % | | | 9.42 | % | | | 10.16 | % |
The growth of $10,000 is cumulative.
‡ Total returns shown for periods less than one year are not annualized.
Portfolio Summary (Unaudited) Asset Allocation (As a % of Investment Portfolio excluding Securities Lending Collateral) | 6/30/13 | 12/31/12 |
| | | |
| Common Stocks | 100% | 98% |
| Cash Equivalents | — | 2% |
| | 100% | 100% |
Sector Diversification (As a % of Common Stocks) | 6/30/13 | 12/31/12 |
| | | |
| Financials | 29% | 27% |
| Industrials | 19% | 22% |
| Information Technology | 17% | 17% |
| Consumer Discretionary | 10% | 8% |
| Energy | 6% | 5% |
| Health Care | 6% | 7% |
| Materials | 6% | 7% |
| Utilities | 4% | 4% |
| Consumer Staples | 3% | 3% |
| | 100% | 100% |
Portfolio holdings and characteristics are subject to change.
For more complete details about the Fund's investment portfolio, see page 5.
Following the Fund's fiscal first and third quarter-end, a complete portfolio holdings listing is filed with the SEC on Form N-Q. The form will be available on the SEC's Web site at www.sec.gov, and it also may be reviewed and copied at the SEC's Public Reference Room in Washington, D.C. Information on the operation of the SEC's Public Reference Room may be obtained by calling (800) SEC-0330. The Fund's portfolio holdings are also posted on www.dws-investments.com from time to time. Please see the Fund's current prospectus for more information.
Effective on or about September 3, 2013, Dreman Value Management, L.L.C. will no longer serve as subadvisor to the Fund and day-to-day portfolio management of the Fund will transition to Deutsche Investment Management Americas Inc.
Effective on or about September 3, 2013, the new portfolio manager for the Fund will be as follows:
Richard Glass, CFA
Portfolio Manager, Deutsche Investment Management Americas Inc.
Investment Portfolio June 30, 2013 (Unaudited) | | | Shares | | | Value ($) | |
| | | | |
| Common Stocks 98.8% | |
| Consumer Discretionary 10.0% | |
| Auto Components 1.7% | |
| Cooper Tire & Rubber Co. | | | 121,100 | | | | 4,016,887 | |
| Hotels, Restaurants & Leisure 1.5% | |
| Brinker International, Inc. (a) | | | 88,730 | | | | 3,498,624 | |
| Media 2.7% | |
| Meredith Corp. (a) | | | 81,675 | | | | 3,895,898 | |
| Valassis Communications, Inc. (a) | | | 103,300 | | | | 2,540,147 | |
| | | | | | | | 6,436,045 | |
| Specialty Retail 1.2% | |
| Rent-A-Center, Inc. (a) | | | 79,275 | | | | 2,976,776 | |
| Textiles, Apparel & Luxury Goods 2.9% | |
| Hanesbrands, Inc. | | | 67,525 | | | | 3,472,135 | |
| The Jones Group, Inc. (a) | | | 243,565 | | | | 3,349,019 | |
| | | | | | | | 6,821,154 | |
| Consumer Staples 2.7% | |
| Food Products 1.4% | |
| Tyson Foods, Inc. "A" (a) | | | 125,450 | | | | 3,221,556 | |
| Household Products 1.3% | |
| Energizer Holdings, Inc. | | | 31,575 | | | | 3,173,603 | |
| Energy 6.0% | |
| Energy Equipment & Services 4.9% | |
| Atwood Oceanics, Inc.* (a) | | | 54,765 | | | | 2,850,518 | |
| Nabors Industries Ltd. | | | 188,100 | | | | 2,879,811 | |
| Oil States International, Inc.* | | | 38,675 | | | | 3,582,852 | |
| Superior Energy Services, Inc.* | | | 89,775 | | | | 2,328,764 | |
| | | | | | | | 11,641,945 | |
| Oil, Gas & Consumable Fuels 1.1% | |
| Rosetta Resources, Inc.* (a) | | | 60,450 | | | | 2,570,334 | |
| Financials 28.3% | |
| Capital Markets 1.6% | |
| Raymond James Financial, Inc. (a) | | | 86,950 | | | | 3,737,111 | |
| Commercial Banks 12.6% | |
| Associated Banc-Corp. (a) | | | 211,550 | | | | 3,289,603 | |
| Bank of Hawaii Corp. (a) | | | 60,550 | | | | 3,046,876 | |
| BOK Financial Corp. | | | 48,930 | | | | 3,133,967 | |
| East West Bancorp., Inc. | | | 127,125 | | | | 3,495,937 | |
| FirstMerit Corp. (a) | | | 192,200 | | | | 3,849,766 | |
| Fulton Financial Corp. (a) | | | 276,925 | | | | 3,179,099 | |
| Old National Bancorp. | | | 216,082 | | | | 2,988,414 | |
| Webster Financial Corp. | | | 130,000 | | | | 3,338,400 | |
| Zions Bancorp. (a) | | | 121,800 | | | | 3,517,584 | |
| | | | | | | | 29,839,646 | |
| Insurance 8.4% | |
| Allied World Assurance Co. Holdings AG | | | 33,250 | | | | 3,042,708 | |
| Argo Group International Holdings Ltd. | | | 81,904 | | | | 3,471,923 | |
| Axis Capital Holdings Ltd. | | | 66,250 | | | | 3,032,925 | |
| Everest Re Group Ltd. | | | 24,775 | | | | 3,177,641 | |
| Hartford Financial Services Group, Inc. (a) | | | 121,025 | | | | 3,742,093 | |
| Unum Group (a) | | | 121,000 | | | | 3,553,770 | |
| | | | | | | | 20,021,060 | |
| | | Shares | | | Value ($) | |
| | | | | | | | | |
| Real Estate Investment Trusts 5.7% | |
| CBL & Associates Properties, Inc. (REIT) (a) | | | 128,225 | | | | 2,746,579 | |
| EPR Properties (REIT) (a) | | | 68,700 | | | | 3,453,549 | |
| Hospitality Properties Trust (REIT) (a) | | | 140,925 | | | | 3,703,509 | |
| Weingarten Realty Investors (REIT) (a) | | | 119,075 | | | | 3,663,938 | |
| | | | | | | | 13,567,575 | |
| Health Care 6.9% | |
| Biotechnology 1.4% | |
| United Therapeutics Corp.* (a) | | | 51,675 | | | | 3,401,248 | |
| Health Care Equipment & Supplies 1.3% | |
| Teleflex, Inc. (a) | | | 38,925 | | | | 3,016,298 | |
| Health Care Providers & Services 2.8% | |
| LifePoint Hospitals, Inc.* (a) | | | 67,675 | | | | 3,305,247 | |
| Owens & Minor, Inc. (a) | | | 98,725 | | | | 3,339,867 | |
| | | | | | | | 6,645,114 | |
| Life Sciences Tools & Services 1.4% | |
| Charles River Laboratories International, Inc.* | | | 81,750 | | | | 3,354,203 | |
| Industrials 17.8% | |
| Aerospace & Defense 1.5% | |
| Alliant Techsystems, Inc. (a) | | | 43,425 | | | | 3,575,180 | |
| Commercial Services & Supplies 1.1% | |
| The Brink's Co. | | | 97,450 | | | | 2,485,950 | |
| Construction & Engineering 3.1% | |
| Tutor Perini Corp.* (a) | | | 205,100 | | | | 3,710,259 | |
| URS Corp. | | | 78,550 | | | | 3,709,131 | |
| | | | | | | | 7,419,390 | |
| Electrical Equipment 1.2% | |
| General Cable Corp. (a) | | | 94,962 | | | | 2,920,081 | |
| Machinery 8.6% | |
| Crane Co. | | | 55,925 | | | | 3,351,026 | |
| Harsco Corp. | | | 132,100 | | | | 3,063,399 | |
| Joy Global, Inc. (a) | | | 47,050 | | | | 2,283,336 | |
| Oshkosh Corp.* | | | 86,175 | | | | 3,272,065 | |
| SPX Corp. | | | 40,400 | | | | 2,907,992 | |
| Titan International, Inc. (a) | | | 132,725 | | | | 2,239,071 | |
| Trinity Industries, Inc. (a) | | | 84,125 | | | | 3,233,765 | |
| | | | | | | | 20,350,654 | |
| Road & Rail 1.2% | |
| AMERCO (a) | | | 17,800 | | | | 2,881,820 | |
| Trading Companies & Distributors 1.1% | |
| Textainer Group Holdings Ltd. (a) | | | 69,575 | | | | 2,674,463 | |
| Information Technology 16.5% | |
| Communications Equipment 1.0% | |
| ARRIS Group, Inc.* (a) | | | 169,475 | | | | 2,431,966 | |
| Computers & Peripherals 1.5% | |
| NCR Corp.* | | | 109,175 | | | | 3,601,683 | |
| Electronic Equipment, Instruments & Components 2.5% | |
| Arrow Electronics, Inc.* | | | 72,640 | | | | 2,894,704 | |
| Jabil Circuit, Inc. (a) | | | 144,050 | | | | 2,935,739 | |
| | | | | | | | 5,830,443 | |
| | | Shares | | | Value ($) | |
| | | | | | | | | |
| IT Services 3.8% | |
| Amdocs Ltd. (a) | | | 84,050 | | | | 3,117,414 | |
| DST Systems, Inc. (a) | | | 44,675 | | | | 2,918,618 | |
| ManTech International Corp. "A" (a) | | | 116,450 | | | | 3,041,674 | |
| | | | | | | | 9,077,706 | |
| Semiconductors & Semiconductor Equipment 5.1% | |
| KLA-Tencor Corp. | | | 54,900 | | | | 3,059,577 | |
| Microsemi Corp.* | | | 131,700 | | | | 2,996,175 | |
| PMC-Sierra, Inc.* | | | 434,725 | | | | 2,760,504 | |
| Teradyne, Inc.* (a) | | | 184,150 | | | | 3,235,516 | |
| | | | | | | | 12,051,772 | |
| Software 2.6% | |
| BMC Software, Inc.* | | | 66,675 | | | | 3,009,710 | |
| Synopsys, Inc.* | | | 86,350 | | | | 3,087,012 | |
| | | | | | | | 6,096,722 | |
| Materials 6.6% | |
| Chemicals 1.0% | |
| Huntsman Corp. | | | 145,293 | | | | 2,406,052 | |
| Containers & Packaging 2.6% | |
| Owens-Illinois, Inc.* | | | 104,575 | | | | 2,906,139 | |
| Rock-Tenn Co. "A" | | | 33,275 | | | | 3,323,507 | |
| | | | | | | | 6,229,646 | |
| | | Shares | | | Value ($) | |
| | | | | | | | | |
| Metals & Mining 1.9% | |
| Coeur Mining, Inc.* | | | 111,750 | | | | 1,486,275 | |
| Reliance Steel & Aluminum Co. (a) | | | 43,725 | | | | 2,866,611 | |
| | | | | | | | 4,352,886 | |
| Paper & Forest Products 1.1% | |
| Domtar Corp. | | | 39,225 | | | | 2,608,463 | |
| Utilities 4.0% | |
| Electric Utilities 1.5% | |
| Portland General Electric Co. (a) | | | 117,975 | | | | 3,608,855 | |
| Gas Utilities 1.2% | |
| AGL Resources, Inc. (a) | | | 66,400 | | | | 2,845,904 | |
| Multi-Utilities 1.3% | |
| Ameren Corp. | | | 84,750 | | | | 2,918,790 | |
Total Common Stocks (Cost $172,761,142) | | | | 234,307,605 | |
| | |
| Securities Lending Collateral 40.4% | |
| Daily Assets Fund Institutional, 0.10% (b) (c) (Cost $95,749,252) | | | 95,749,252 | | | | 95,749,252 | |
| | | % of Net Assets | | | Value ($) | |
| | | | |
Total Investment Portfolio (Cost $268,510,394)† | | | 139.1 | | | | 330,056,857 | |
| Other Assets and Liabilities, Net (a) | | | (39.1 | ) | | | (92,870,584 | ) |
| Net Assets | | | 100.0 | | | | 237,186,273 | |
* Non-income producing security.
† The cost for federal income tax purposes was $268,057,985. At June 30, 2013, net unrealized appreciation for all securities based on tax cost was $61,998,872. This consisted of aggregate gross unrealized appreciation for all securities in which there was an excess of value over tax cost of $68,419,788 and aggregate gross unrealized depreciation for all securities in which there was an excess of tax cost over value of $6,420,916.
(a) All or a portion of these securities were on loan. In addition, included in other assets and liabilities, net are pending sales, that are also on loan (see Notes to Financial Statements). The value of securities loaned at June 30, 2013 amounted to $93,258,469, which is 39.3% of net assets.
(b) Affiliated fund managed by Deutsche Investment Management Americas Inc. The rate shown is the annualized seven-day yield at period end.
(c) Represents collateral held in connection with securities lending. Income earned by the Fund is net of borrower rebates.
REIT: Real Estate Investment Trust
Fair Value Measurements
Various inputs are used in determining the value of the Fund's investments. These inputs are summarized in three broad levels. Level 1 includes quoted prices in active markets for identical securities. Level 2 includes other significant observable inputs (including quoted prices for similar securities, interest rates, prepayment speeds, and credit risk). Level 3 includes significant unobservable inputs (including the Fund's own assumptions in determining the fair value of investments). The inputs or methodology used for valuing securities are not necessarily an indication of the risk associated with investing in those securities.
The following is a summary of the inputs used as of June 30, 2013 in valuing the Fund's investments. For information on the Fund's policy regarding the valuation of investments, please refer to the Security Valuation section of Note A in the accompanying Notes to Financial Statements.
| Assets | | Level 1 | | | Level 2 | | | Level 3 | | | Total | |
| | |
| Common Stocks (d) | | $ | 234,307,605 | | | $ | — | | | $ | — | | | $ | 234,307,605 | |
| Short-Term Investments | | | 95,749,252 | | | | — | | | | — | | | | 95,749,252 | |
| Total | | $ | 330,056,857 | | | $ | — | | | $ | — | | | $ | 330,056,857 | |
There have been no transfers between fair value measurement levels during the period ended June 30, 2013.
(d) See Investment Portfolio for additional detailed categorizations.
The accompanying notes are an integral part of the financial statements.
Statement of Assets and Liabilities | as of June 30, 2013 (Unaudited) | |
| Assets | |
Investments: Investments in non-affiliated securities, at value (cost $172,761,142) — including $93,258,469 of securities loaned | | $ | 234,307,605 | |
| Investment in Daily Assets Fund Institutional (cost $95,749,252)* | | | 95,749,252 | |
| Total investments in securities, at value (cost $268,510,394) | | | 330,056,857 | |
| Cash | | | 3,834 | |
| Receivable for investments sold | | | 4,460,680 | |
| Receivable for Fund shares sold | | | 249,054 | |
| Dividends receivable | | | 265,820 | |
| Interest receivable | | | 5,313 | |
| Foreign taxes recoverable | | | 3,390 | |
| Other assets | | | 1,459 | |
| Total assets | | | 335,046,407 | |
| Liabilities | |
| Payable upon return of securities loaned | | | 95,749,252 | |
| Line of credit loan payable | | | 1,300,000 | |
| Payable for Fund shares redeemed | | | 588,204 | |
| Accrued management fee | | | 128,512 | |
| Acrued Trustees' fees | | | 344 | |
| Other accrued expenses and payables | | | 93,822 | |
| Total liabilities | | | 97,860,134 | |
| Net assets, at value | | $ | 237,186,273 | |
| Net Assets Consist of: | |
| Undistributed net investment income | | | 1,122,767 | |
| Net unrealized appreciation (depreciation) on investments | | | 61,546,463 | |
| Accumulated net realized gain (loss) | | | (64,619,925 | ) |
| Paid-in capital | | | 239,136,968 | |
| Net assets, at value | | $ | 237,186,273 | |
Class A Net Asset Value, offering and redemption price per share ($219,653,653 ÷ 15,185,620 outstanding shares of beneficial interest, no par value, unlimited number of shares authorized) | | $ | 14.46 | |
Class B Net Asset Value, offering and redemption price per share ($17,532,620 ÷ 1,210,887 outstanding shares of beneficial interest, no par value, unlimited number of shares authorized) | | $ | 14.48 | |
* Represents collateral on securities loaned.
The accompanying notes are an integral part of the financial statements.
Statement of Operations
| for the six months ended June 30, 2013 (Unaudited) | |
| Investment Income | |
Income: Dividends (net of foreign taxes withheld of $2,543) | | $ | 2,118,833 | |
| Income distributions — Central Cash Management Fund | | | 2,220 | |
| Securities lending income, including income from Daily Assets Fund Institutional, net of borrower rebates | | | 54,210 | |
| Total income | | | 2,175,263 | |
Expenses: Management fee | | | 792,855 | |
| Administration fee | | | 121,989 | |
| Services to shareholders | | | 3,934 | |
| Record keeping fees (Class B) | | | 9,284 | |
| Distribution service fee (Class B) | | | 22,317 | |
| Custodian fee | | | 4,644 | |
| Professional fees | | | 31,341 | |
| Reports to shareholders | | | 29,202 | |
| Trustees' fees and expenses | | | 4,524 | |
| Other | | | 5,806 | |
| Total expenses | | | 1,025,896 | |
| Net investment income (loss) | | | 1,149,367 | |
| Realized and Unrealized Gain (Loss) | |
| Net realized gain (loss) from investments | | | 7,154,712 | |
| Change in net unrealized appreciation (depreciation) on investments | | | 24,853,202 | |
| Net gain (loss) | | | 32,007,914 | |
| Net increase (decrease) in net assets resulting from operations | | $ | 33,157,281 | |
The accompanying notes are an integral part of the financial statements.
Statement of Changes in Net Assets | Increase (Decrease) in Net Assets | | Six Months Ended June 30, 2013 (Unaudited) | | | Year Ended December 31, 2012 | |
Operations: Net investment income (loss) | | $ | 1,149,367 | | | $ | 2,773,636 | |
| Net realized gain (loss) | | | 7,154,712 | | | | 13,712,216 | |
| Change in net unrealized appreciation (depreciation) | | | 24,853,202 | | | | 14,140,156 | |
| Net increase (decrease) in net assets resulting from operations | | | 33,157,281 | | | | 30,626,008 | |
Distributions to shareholders from: Net investment income: Class A | | | (2,660,096 | ) | | | (2,544,018 | ) |
| Class B | | | (150,280 | ) | | | (170,068 | ) |
| Total distributions | | | (2,810,376 | ) | | | (2,714,086 | ) |
Fund share transactions: Class A Proceeds from shares sold | | | 9,677,108 | | | | 15,242,621 | |
| Reinvestment of distributions | | | 2,660,096 | | | | 2,544,018 | |
| Payments for shares redeemed | | | (39,620,859 | ) | | | (40,361,547 | ) |
| Net increase (decrease) in net assets from Class A share transactions | | | (27,283,655 | ) | | | (22,574,908 | ) |
Class B Proceeds from shares sold | | | 1,982,177 | | | | 2,417,600 | |
| Reinvestment of distributions | | | 150,280 | | | | 170,068 | |
| Payments for shares redeemed | | | (3,691,219 | ) | | | (8,165,016 | ) |
| Net increase (decrease) in net assets from Class B share transactions | | | (1,558,762 | ) | | | (5,577,348 | ) |
| Increase (decrease) in net assets | | | 1,504,488 | | | | (240,334 | ) |
| Net assets at beginning of period | | | 235,681,785 | | | | 235,922,119 | |
| Net assets at end of period (including undistributed net investment income of $1,122,767 and $2,783,776, respectively) | | $ | 237,186,273 | | | $ | 235,681,785 | |
| Other Information | |
Class A Shares outstanding at beginning of period | | | 17,113,875 | | | | 18,969,648 | |
| Shares sold | | | 686,539 | | | | 1,248,625 | |
| Shares issued to shareholders in reinvestment of distributions | | | 190,143 | | | | 207,168 | |
| Shares redeemed | | | (2,804,937 | ) | | | (3,311,566 | ) |
| Net increase (decrease) in Class A shares | | | (1,928,255 | ) | | | (1,855,773 | ) |
| Shares outstanding at end of period | | | 15,185,620 | | | | 17,113,875 | |
Class B Shares outstanding at beginning of period | | | 1,321,925 | | | | 1,796,701 | |
| Shares sold | | | 139,409 | | | | 195,502 | |
| Shares issued to shareholders in reinvestment of distributions | | | 10,719 | | | | 13,827 | |
| Shares redeemed | | | (261,166 | ) | | | (684,105 | ) |
| Net increase (decrease) in Class B shares | | | (111,038 | ) | | | (474,776 | ) |
| Shares outstanding at end of period | | | 1,210,887 | | | | 1,321,925 | |
The accompanying notes are an integral part of the financial statements.
| | | | | | Years Ended December 31, | |
| Class A | | Six Months Ended 6/30/13 (Unaudited) | | | 2012 | | | 2011 | | | 2010 | | | 2009 | | | 2008 | |
| Selected Per Share Data | |
| Net asset value, beginning of period | | $ | 12.78 | | | $ | 11.36 | | | $ | 12.21 | | | $ | 10.04 | | | $ | 7.93 | | | $ | 20.12 | |
Income (loss) from investment operations: Net investment incomea | | | .07 | | | | .14 | | | | .13 | | | | .12 | | | | .16 | | | | .13 | |
| Net realized and unrealized gain (loss) | | | 1.78 | | | | 1.42 | | | | (.85 | ) | | | 2.19 | | | | 2.11 | | | | (4.92 | ) |
| Total from investment operations | | | 1.85 | | | | 1.56 | | | | (.72 | ) | | | 2.31 | | | | 2.27 | | | | (4.79 | ) |
Less distributions from: Net investment income | | | (.17 | ) | | | (.14 | ) | | | (.13 | ) | | | (.14 | ) | | | (.16 | ) | | | (.29 | ) |
| Net realized gains | | | — | | | | — | | | | — | | | | — | | | | — | | | | (7.11 | ) |
| Total distributions | | | (.17 | ) | | | (.14 | ) | | | (.13 | ) | | | (.14 | ) | | | (.16 | ) | | | (7.40 | ) |
| Net asset value, end of period | | $ | 14.46 | | | $ | 12.78 | | | $ | 11.36 | | | $ | 12.21 | | | $ | 10.04 | | | $ | 7.93 | |
| Total Return (%) | | | 14.49 | ** | | | 13.77 | | | | (6.08 | ) | | | 23.07 | | | | 29.70 | | | | (33.42 | )b |
| Ratios to Average Net Assets and Supplemental Data | |
| Net assets, end of period ($ millions) | | | 220 | | | | 219 | | | | 216 | | | | 247 | | | | 235 | | | | 223 | |
| Ratio of expenses before expense reductions (%) | | | .81 | * | | | .82 | | | | .81 | | | | .82 | | | | .79 | | | | .83 | |
| Ratio of expenses after expense reductions (%) | | | .81 | * | | | .82 | | | | .81 | | | | .82 | | | | .79 | | | | .82 | |
| Ratio of net investment income (%) | | | .97 | * | | | 1.18 | | | | 1.08 | | | | 1.14 | | | | 1.92 | | | | 1.13 | |
| Portfolio turnover rate (%) | | | 14 | ** | | | 11 | | | | 36 | | | | 38 | | | | 72 | | | | 49 | |
a Based on average shares outstanding during the period. b Total return would have been lower had certain expenses not been reduced. * Annualized ** Not annualized | |
| | | | | | Years Ended December 31, | |
| Class B | | Six Months Ended 6/30/13 (Unaudited) | | | 2012 | | | 2011 | | | 2010 | | | 2009 | | | 2008 | |
| Selected Per Share Data | |
| Net asset value, beginning of period | | $ | 12.78 | | | $ | 11.36 | | | $ | 12.20 | | | $ | 10.03 | | | $ | 7.92 | | | $ | 20.08 | |
Income (loss) from investment operations: Net investment incomea | | | .04 | | | | .10 | | | | .09 | | | | .08 | | | | .13 | | | | .09 | |
| Net realized and unrealized gain (loss) | | | 1.78 | | | | 1.42 | | | | (.85 | ) | | | 2.19 | | | | 2.12 | | | | (4.92 | ) |
| Total from investment operations | | | 1.82 | | | | 1.52 | | | | (.76 | ) | | | 2.27 | | | | 2.25 | | | | (4.83 | ) |
Less distributions from: Net investment income | | | (.12 | ) | | | (.10 | ) | | | (.08 | ) | | | (.10 | ) | | | (.14 | ) | | | (.22 | ) |
| Net realized gains | | | — | | | | — | | | | — | | | | — | | | | — | | | | (7.11 | ) |
| Total distributions | | | (.12 | ) | | | (.10 | ) | | | (.08 | ) | | | (.10 | ) | | | (.14 | ) | | | (7.33 | ) |
| Net asset value, end of period | | $ | 14.48 | | | $ | 12.78 | | | $ | 11.36 | | | $ | 12.20 | | | $ | 10.03 | | | $ | 7.92 | |
| Total Return (%) | | | 14.26 | ** | | | 13.38 | | | | (6.33 | ) | | | 22.66 | | | | 29.28 | | | | (33.67 | )b |
| Ratios to Average Net Assets and Supplemental Data | |
| Net assets, end of period ($ millions) | | | 18 | | | | 17 | | | | 20 | | | | 26 | | | | 23 | | | | 24 | |
| Ratio of expenses before expense reductions (%) | | | 1.17 | * | | | 1.16 | | | | 1.15 | | | | 1.17 | | | | 1.14 | | | | 1.18 | |
| Ratio of expenses after expense reductions (%) | | | 1.17 | * | | | 1.16 | | | | 1.15 | | | | 1.17 | | | | 1.14 | | | | 1.17 | |
| Ratio of net investment income (%) | | | .62 | * | | | .81 | | | | .74 | | | | .79 | | | | 1.57 | | | | .78 | |
| Portfolio turnover rate (%) | | | 14 | ** | | | 11 | | | | 36 | | | | 38 | | | | 72 | | | | 49 | |
a Based on average shares outstanding during the period. b Total return would have been lower had certain expenses not been reduced. * Annualized ** Not annualized | |
Notes to Financial Statements (Unaudited)
A. Organization and Significant Accounting Policies
DWS Small Mid Cap Value VIP (formerly DWS Dreman Small Mid Cap Value VIP) (the "Fund") is a diversified series of DWS Variable Series II (the "Trust"), which is registered under the Investment Company Act of 1940, as amended (the "1940 Act"), as an open-end management investment company organized as a Massachusetts business trust.
Multiple Classes of Shares of Beneficial Interest. The Fund offers two classes of shares (Class A shares and Class B shares). Sales of Class B shares are subject to recordkeeping fees up to 0.15% and Rule 12b-1 fees under the 1940 Act equal to an annual rate of 0.25% of the average daily net assets of the Class B shares of the Fund. Class A shares are not subject to such fees.
Investment income, realized and unrealized gains and losses, and certain fund-level expenses and expense reductions, if any, are borne pro rata on the basis of relative net assets by the holders of all classes of shares except that each class bears certain expenses unique to that class (including the applicable Rule 12b-1 fee and recordkeeping fees). Differences in class-level expenses may result in payment of different per share dividends by class. All shares have equal rights with respect to voting subject to class-specific arrangements.
The Fund's financial statements are prepared in accordance with accounting principles generally accepted in the United States of America which require the use of management estimates. Actual results could differ from those estimates. The policies described below are followed consistently by the Fund in the preparation of its financial statements.
Security Valuation. Investments are stated at value determined as of the close of regular trading on the New York Stock Exchange on each day the exchange is open for trading.
Various inputs are used in determining the value of the Fund's investments. These inputs are summarized in three broad levels. Level 1 includes quoted prices in active markets for identical securities. Level 2 includes other significant observable inputs (including quoted prices for similar securities, interest rates, prepayment speeds, and credit risk). Level 3 includes significant unobservable inputs (including the Fund's own assumptions in determining the fair value of investments). The inputs or methodology used for valuing securities are not necessarily an indication of the risk associated with investing in those securities.
Equity securities are valued at the most recent sale price or official closing price reported on the exchange (U.S. or foreign) or over-the-counter market on which they trade and are categorized as Level 1 securities. Securities for which no sales are reported are valued at the calculated mean between the most recent bid and asked quotations on the relevant market or, if a mean cannot be determined, at the most recent bid quotation.
Investments in open-end investment companies are valued at their net asset value each business day and are categorized as Level 1.
Securities and other assets for which market quotations are not readily available or for which the above valuation procedures are deemed not to reflect fair value are valued in a manner that is intended to reflect their fair value as determined in accordance with procedures approved by the Board and are generally categorized as Level 3. In accordance with the Fund's valuation procedures, factors used in determining value may include, but are not limited to, the type of the security; the size of the holding; the initial cost of the security; the existence of any contractual restrictions on the security's disposition; the price and extent of public trading in similar securities of the issuer or of comparable companies; quotations or evaluated prices from broker-dealers and/or pricing services; information obtained from the issuer, analysts, and/or the appropriate stock exchange (for exchange-traded securities); an analysis of the company's or issuer's financial statements; an evaluation of the forces that influence the issuer and the market(s) in which the security is purchased and sold and with respect to debt securities; the maturity, coupon, creditworthiness, currency denomination and the movement of the market in which the security is normally traded. The value determined under these procedures may differ from published values for the same securities.
Disclosure about the classification of fair value measurements is included in a table following the Fund's Investment Portfolio.
Foreign Currency Translations. The books and records of the Fund are maintained in U.S. dollars. Investment securities and other assets and liabilities denominated in a foreign currency are translated into U.S. dollars at the prevailing exchange rates at period end. Purchases and sales of investment securities, income and expenses are translated into U.S. dollars at the prevailing exchange rates on the respective dates of the transactions.
Net realized and unrealized gains and losses on foreign currency transactions represent net gains and losses between trade and settlement dates on securities transactions, the acquisition and disposition of foreign currencies, and the difference between the amount of net investment income accrued and the U.S. dollar amount actually received. That portion of both realized and unrealized gains and losses on investments that results from fluctuations in foreign currency exchange rates is not separately disclosed but is included with net realized and unrealized gain/appreciation and loss/depreciation on investments.
Securities Lending. Brown Brothers Harriman & Co., as lending agent, lends securities of the Fund to certain financial institutions under the terms of the Security Lending Agreement. The Fund retains the benefits of owning the securities it has loaned and continues to receive interest and dividends generated by the securities and to participate in any changes in their market value. The Fund requires the borrowers of the securities to maintain collateral with the Fund consisting of either cash or liquid, unencumbered assets having a value at least equal to the value of the securities loaned. When the collateral falls below specified amounts, the lending agent will use its best effort to obtain additional collateral on the next business day to meet required amounts under the security lending agreement. The Fund may invest the cash collateral into a joint trading account in an affiliated money market fund pursuant to Exemptive Orders issued by the SEC. The Fund receives compensation for lending its securities either in the form of fees or by earning interest on invested cash collateral net of borrower rebates and fees paid to a lending agent. Either the Fund or the borrower may terminate the loan. There may be risks of delay and costs in recovery of securities or even loss of rights in the collateral should the borrower of the securities fail financially. If the Fund is not able to recover securities lent, the Fund may sell the collateral and purchase a replacement investment in the market, incurring the risk that the value of the replacement security is greater than the value of the collateral. The Fund is also subject to all investment risks associated with the reinvestment of any cash collateral received, including, but not limited to, interest rate, credit and liquidity risk associated with such investments.
As of June 30, 2013, the Fund had securities on loan with a gross value of $93,258,469. The value of the related collateral, $95,749,252, exceeded the value of the securities loaned at period end.
Taxes. The Fund's policy is to comply with the requirements of the Internal Revenue Code, as amended, which are applicable to regulated investment companies and to distribute all of its taxable income to its shareholders.
Under the Regulated Investment Company Modernization Act of 2010, net capital losses incurred post-enactment may be carried forward indefinitely, and their character is retained as short-term and/or long-term. Previously, net capital losses were carried forward for eight years and treated as short-term losses. As a transition rule, the Act requires that post-enactment net capital losses be used before pre-enactment net capital losses.
At December 31, 2012, the Fund had a net tax basis capital loss carryforward of approximately $71,435,000 of pre-enactment losses, which may be applied against any realized net taxable capital gains of each succeeding year until fully utilized or until December 31, 2017, the expiration date, whichever occurs first.
The Fund has reviewed the tax positions for the open tax years as of December 31, 2012 and has determined that no provision for income tax is required in the Fund's financial statements. The Fund's federal tax returns for the prior three fiscal years remain open subject to examination by the Internal Revenue Service.
Distribution of Income and Gains. Distributions from net investment income of the Fund, if any, is declared and distributed to shareholders annually. Net realized gains from investment transactions, in excess of available capital loss carryforwards, would be taxable to the Fund if not distributed and, therefore, will be distributed to shareholders at least annually. The Fund may also make additional distributions for tax purposes if necessary.
The timing and characterization of certain income and capital gain distributions are determined annually in accordance with federal tax regulations which may differ from accounting principles generally accepted in the United States of America. These differences primarily relate to income received from Real Estate Investment Trusts and certain securities sold at a loss. As a result, net investment income (loss) and net realized gain (loss) on investment transactions for a reporting period may differ significantly from distributions during such period. Accordingly, the Fund may periodically make reclassifications among certain of its capital accounts without impacting the net asset value of the Fund.
The tax character of current year distributions will be determined at the end of the current fiscal year.
Expenses. Expenses of the Trust arising in connection with a specific fund are allocated to that fund. Other Trust expenses which cannot be directly attributed to a fund are apportioned among the funds in the Trust based upon the relative net assets or other appropriate measures.
Contingencies. In the normal course of business, the Fund may enter into contracts with service providers that contain general indemnification clauses. The Fund's maximum exposure under these arrangements is unknown as this would involve future claims that may be made against the Fund that have not yet been made. However, based on experience, the Fund expects the risk of loss to be remote.
Real Estate Investment Trusts. The Fund periodically recharacterizes distributions received from a Real Estate Investment Trust ("REIT") investment based on information provided by the REIT into the following categories: ordinary income, long-term and short-term capital gains, and return of capital. If information is not available timely from a REIT, the recharacterization will be estimated for financial reporting purposes and a recharacterization will be made to the accounting records in the following year when such information becomes available. Distributions received from REITs in excess of income are recorded as either a reduction of cost of investments or realized gains. The Fund distinguishes between dividends received on a tax basis and a financial reporting basis and only distributions in excess of tax basis earnings and profits are reported in the financial statements as a return of capital.
Other. Investment transactions are accounted for on a trade date plus one basis for daily net asset value calculations. However, for financial reporting purposes, investment transactions are reported on trade date. Interest income is recorded on the accrual basis. Dividend income is recorded on the ex-dividend date net of foreign withholding taxes. Realized gains and losses from investment transactions are recorded on an identified cost basis and may include proceeds from litigation.
B. Purchases and Sales of Securities
During the six months ended June 30, 2013, purchases and sales of investment transactions (excluding short-term investments) aggregated $32,845,558 and $61,881,619, respectively.
C. Related Parties
Management Agreement. Under the Investment Management Agreement with Deutsche Investment Management Americas Inc. ("DIMA" or the "Advisor"), an indirect, wholly owned subsidiary of Deutsche Bank AG, the Advisor directs the investments of the Fund in accordance with its investment objectives, policies and restrictions. The Advisor determines the securities, instruments and other contracts relating to investments to be purchased, sold or entered into by the Fund or delegates such responsibility to the Fund's subadvisor.
Dreman Value Management, L.L.C. ("DVM") serves as subadvisor. As a subadvisor to the Fund, DVM makes investment decisions and buys and sells securities for the Fund. DVM is paid by the Advisor for the services DVM provides to the Fund.
Pursuant to the Investment Management Agreement with the Advisor, the Fund pays a monthly management fee based on the Fund's average daily net assets, computed and accrued daily and payable monthly, at the following annual rates:
| First $250 million | | | .650 | % |
| Next $750 million | | | .620 | % |
| Next $1.5 billion | | | .600 | % |
| Next $2.5 billion | | | .580 | % |
| Next $2.5 billion | | | .550 | % |
| Next $2.5 billion | | | .540 | % |
| Next $2.5 billion | | | .530 | % |
| Over $12.5 billion | | | .520 | % |
Accordingly, for the six months ended June 30, 2013, the fee pursuant to the Investment Management Agreement was equivalent to an annualized effective rate of 0.65% of the Fund's average daily net assets.
For the period from January 1, 2013 through September 30, 2013, the Advisor has contractually agreed to waive its fee and/or reimburse certain operating expenses to the extent necessary to maintain the operating expenses (excluding certain expenses such as extraordinary expenses, taxes, brokerage and interest expense) of each class as follows:
Administration Fee. Pursuant to an Administrative Services Agreement, DIMA provides most administrative services to the Fund. For all services provided under the Administrative Services Agreement, the Fund pays DIMA an annual fee ("Administration Fee") of 0.10% of the Fund's average daily net assets, computed and accrued daily and payable monthly. For the six months ended June 30, 2013, the Administration Fee was $121,989, of which $19,771 is unpaid.
Service Provider Fees. DWS Investments Service Company ("DISC"), an affiliate of the Advisor, is the transfer agent, dividend-paying agent and shareholder service agent for the Fund. Pursuant to a sub-transfer agency agreement between DISC and DST Systems, Inc. ("DST"), DISC has delegated certain transfer agent, dividend-paying agent and shareholder service agent functions to DST. DISC compensates DST out of the shareholder servicing fee it receives from the Fund. For the six months ended June 30, 2013, the amounts charged to the Fund by DISC were as follows:
| Service to Shareholders | | Total Aggregated | | | Unpaid at June 30, 2013 | |
| Class A | | $ | 277 | | | $ | 89 | |
| Class B | | | 247 | | | | 72 | |
| | | $ | 524 | | | $ | 161 | |
Distribution Service Agreement. Under the Fund's Class B 12b-1 plans, DWS Investments Distributors, Inc. ("DIDI") received a fee ("Distribution Service Fee") of 0.25% of average daily net assets of Class B shares. For the six months ended June 30, 2013, the Distribution Service Fee aggregated $22,317, of which $3,688 is unpaid.
Typesetting and Filing Service Fees. Under an agreement with DIMA, DIMA is compensated for providing typesetting and certain regulatory filing services to the Fund. For the six months ended June 30, 2013, the amount charged to the Fund by DIMA included in the Statement of Operations under "reports to shareholders" aggregated $7,754, all of which is unpaid.
Trustees' Fees and Expenses. The Fund paid retainer fees to each Trustee not affiliated with the Advisor, plus specified amounts to the Board Chairperson and Vice Chairperson and to each committee Chairperson.
Affiliated Cash Management Vehicles. The Fund may invest uninvested cash balances in Central Cash Management Fund and DWS Variable NAV Money Fund, affiliated money market funds which are managed by the Advisor. Each affiliated money market fund seeks to provide a high level of current income consistent with liquidity and the preservation of capital. Each affiliated money market fund is managed in accordance with Rule 2a-7 under the Investment Company Act of 1940, which governs the quality, maturity, diversity and liquidity of instruments in which a money market fund may invest. Central Cash Management Fund seeks to maintain a stable net asset value, and DWS Variable NAV Money Fund maintains a floating net asset value. The Fund indirectly bears its proportionate share of the expenses of each affiliated money market fund in which it invests. Central Cash Management Fund does not pay the Advisor an investment management fee. To the extent that DWS Variable NAV Money Fund pays an investment management fee to the Advisor, the Advisor will waive an amount of the investment management fee payable to the Advisor by the Fund equal to the amount of the investment management fee payable on the Fund's assets invested in DWS Variable NAV Money Fund.
D. Ownership of the Fund
At June 30, 2013, three Participating Insurance Companies were owners of record of 10% or more of the total outstanding Class A shares of the Fund, each owning 55%, 22% and 15%. Three participating Insurance Companies were owners of record of 10% or more of the total outstanding Class B shares of the Fund, each owning 46%, 13% and 10%.
E. Line of Credit
The Fund and other affiliated funds (the "Participants") share in a $375 million revolving credit facility provided by a syndication of banks. The Fund may borrow for temporary or emergency purposes, including the meeting of redemption requests that otherwise might require the untimely disposition of securities. The Participants are charged an annual commitment fee which is allocated based on net assets, among each of the Participants. Interest is calculated at a rate per annum equal to the sum of the Federal Funds Rate plus 1.25 percent plus if LIBOR exceeds the Federal Funds Rate the amount of such excess. The Fund may borrow up to a maximum of 33 percent of its net assets under the agreement.
At June 30, 2013, the Fund had a $1,300,000 outstanding loan. Interest expense incurred on the borrowing was $918 for the six months ended June 30, 2013. The average dollar amount of the borrowings was $878,846, the weighted average interest rate on these borrowings was 1.45% and the Fund had a loan outstanding for twenty-six days throughout the period.
F. Subsequent Event
Effective on or about September 3, 2013, Dreman Value Management, L.L.C. will no longer serve as the subadvisor to the Fund and day-to-day portfolio management of the Fund will transition to Deutsche Investment Management Americas Inc. Materials regarding this change is set forth in a supplement to the Fund's prospectus dated August 2, 2013.
Information About Your Fund's Expenses (Unaudited)
As an investor of the Fund, you incur two types of costs: ongoing expenses and transaction costs. Ongoing expenses include management fees, distribution and service (12b-1) fees and other Fund expenses. Examples of transaction costs include contract charges and account maintenance fees, which are not shown in this section. The following tables are intended to help you understand your ongoing expenses (in dollars) of investing in the Fund and to help you compare these expenses with the ongoing expenses of investing in other mutual funds. The example in the table is based on an investment of $1,000 invested at the beginning of the six-month period and held for the entire period (January 1, 2013 to June 30, 2013).
The tables illustrate your Fund's expenses in two ways:
•Actual Fund Return. This helps you estimate the actual dollar amount of ongoing expenses (but not transaction costs) paid on a $1,000 investment in the Fund using the Fund's actual return during the period. To estimate the expenses you paid over the period, simply divide your account value by $1,000 (for example, an $8,600 account value divided by $1,000 = 8.6), then multiply the result by the number in the "Expenses Paid per $1,000" line under the share class you hold.
• Hypothetical 5% Fund Return. This helps you to compare your Fund's ongoing expenses (but not transaction costs) with those of other mutual funds using the Fund's actual expense ratio and a hypothetical rate of return of 5% per year before expenses. Examples using a 5% hypothetical Fund return may be found in the shareholder reports of other mutual funds. The hypothetical account values and expenses may not be used to estimate the actual ending account balance or expenses you paid for the period.
Please note that the expenses shown in these tables are meant to highlight your ongoing expenses only and do not reflect any transaction costs. The "Expenses Paid per $1,000" line of the tables is useful in comparing ongoing expenses only and will not help you determine the relative total expense of owning different funds. If these transaction costs had been included, your costs would have been higher.
Expenses and Value of a $1,000 Investment for the six months ended June 30, 2013 | |
| Actual Fund Return | | Class A | | | Class B | |
| Beginning Account Value 1/1/13 | | $ | 1,000.00 | | | $ | 1,000.00 | |
| Ending Account Value 6/30/13 | | $ | 1,144.90 | | | $ | 1,142.60 | |
| Expenses Paid per $1,000* | | $ | 4.31 | | | $ | 6.22 | |
| Hypothetical 5% Fund Return | | Class A | | | Class B | |
| Beginning Account Value 1/1/13 | | $ | 1,000.00 | | | $ | 1,000.00 | |
| Ending Account Value 6/30/13 | | $ | 1,020.78 | | | $ | 1,018.99 | |
| Expenses Paid per $1,000* | | $ | 4.06 | | | $ | 5.86 | |
* Expenses are equal to the Fund's annualized expense ratio for each share class, multiplied by the average account value over the period, multiplied by 181 (the number of days in the most recent six-month period), then divided by 365.
| Annualized Expense Ratios | Class A | | Class B | |
| DWS Variable Series II — DWS Small Mid Cap Value VIP | .81% | | 1.17% | |
For more information, please refer to the Fund's prospectus.
These tables do not reflect charges and fees ("contract charges") associated with the separate account that invests in the Fund or any variable life insurance policy or variable annuity contract for which the Fund is an investment option.
For an analysis of the fees associated with an investment in the Fund or similar funds, please refer to http://apps.finra.org/fundanalyzer/1/fa.aspx.
The Trust's policies and procedures for voting proxies for portfolio securities and information about how the Trust voted proxies related to its portfolio securities during the 12-month period ended June 30 are available on our Web site — www.dws-investments.com (click on "proxy voting" at the bottom of the page) — or on the SEC's Web site — www.sec.gov. To obtain a written copy of the Trust's policies and procedures without charge, upon request, call us toll free at (800) 728-3337.
Summary of Management Fee Evaluation by Independent Fee Consultant
September 17, 2012
Pursuant to an Order entered into by Deutsche Investment Management Americas and affiliates (collectively, "DeAM") with the Attorney General of New York, I, Thomas H. Mack, have been appointed the Independent Fee Consultant for the DWS Funds (formerly the DWS Scudder Funds). My duties include preparing an annual written evaluation of the management fees DeAM charges the Funds, considering among other factors the management fees charged by other mutual fund companies for like services, management fees DeAM charges other clients for like services, DeAM's costs of supplying services under the management agreements and related profit margins, possible economies of scale if a Fund grows larger, and the nature and quality of DeAM's services, including fund performance. This report summarizes my evaluation for 2012, including my qualifications, the evaluation process for each of the DWS Funds, consideration of certain complex-level factors, and my conclusions. I served in substantially the same capacity in 2007, 2008, 2009, 2010 and 2011.
Qualifications
For more than 35 years I have served in various professional capacities within the investment management business. I have held investment analysis and advisory positions, including securities analyst, portfolio strategist and director of investment policy with a large investment firm. I have also performed business management functions, including business development, financial management and marketing research and analysis.
Since 1991, I have been an independent consultant within the asset management industry. I have provided services to over 125 client organizations, including investment managers, mutual fund boards, product distributors and related organizations. Over the past ten years I have completed a number of assignments for mutual fund boards, specifically including assisting boards with management contract renewal.
I hold a Master of Business Administration degree, with highest honors, from Harvard University and Master of Science and Bachelor of Science (highest honors) degrees from the University of California at Berkeley. I am an independent director and audit committee financial expert for two closed-end mutual funds and have served in various leadership and financial oversight capacities with non-profit organizations.
Evaluation of Fees for each DWS Fund
My work focused primarily on evaluating, fund-by-fund, the fees charged to each of the 103 mutual fund portfolios in the DWS Fund family. For each Fund, I considered each of the key factors mentioned above, as well as any other relevant information. In doing so I worked closely with the Funds' Independent Directors in their annual contract renewal process, as well as in their approval of contracts for several new funds (documented separately).
In evaluating each Fund's fees, I reviewed comprehensive materials provided by or on behalf of DeAM, including expense information prepared by Lipper Analytical, comparative performance information, profitability data, manager histories, and other materials. I also accessed certain additional information from the Lipper and Morningstar databases and drew on my industry knowledge and experience.
To facilitate evaluating this considerable body of information, I prepared for each Fund a document summarizing the key data elements in each area as well as additional analytics discussed below. This made it possible to consider each key data element in the context of the others.
In the course of contract renewal, DeAM agreed to implement a number of fee and expense adjustments requested by the Independent Directors which will favorably impact future fees and expenses, and my evaluation includes the effects of these changes.
Fees and Expenses Compared with Other Funds
The competitive fee and expense evaluation for each fund focused on two primary comparisons:
The Fund's contractual management fee (the advisory fee plus the administration fee where applicable) compared with those of a group of typically 12-15 funds in the same Lipper investment category (e.g. Large Capitalization Growth) having similar distribution arrangements and being of similar size.
The Fund's total expenses compared with a broader universe of funds from the same Lipper investment category and having similar distribution arrangements.
These two comparisons provide a view of not only the level of the fee compared with funds of similar scale but also the total expense the Fund bears for all the services it receives, in comparison with the investment choices available in the Fund's investment category and distribution channel. The principal figure-of-merit used in these comparisons was the subject Fund's percentile ranking against peers.
DeAM's Fees for Similar Services to Others
DeAM provided management fee schedules for all of its US domiciled fund and non-fund investment management accounts in any of the investment categories where there is a DWS Fund. These similar products included the other DWS Funds, non-fund pooled accounts, institutional accounts and sub-advisory accounts. Using this information, I calculated for each Fund the fee that would be charged to each similar product, at the subject Fund's asset level.
Evaluating information regarding non-fund products is difficult because there are varying levels of services required for different types of accounts, with mutual funds generally requiring considerably more regulatory and administrative types of service as well as having more frequent cash flows than other types of accounts. Also, while mutual fund fees for similar fund products can be expected to be similar, there will be some differences due to different pricing conditions in different distribution channels (e.g. retail funds versus those used in variable insurance products), differences in underlying investment processes and other factors.
Costs and Profit Margins
DeAM provided a detailed profitability analysis for each Fund. After making some adjustments so that the presentation would be more comparable to the available industry figures, I reviewed profit margins from investment management alone, from investment management plus other fund services (excluding distribution) provided to the Funds by DeAM (principally shareholder services), and DeAM profits from all sources, including distribution. A later section comments on overall profitability.
Economies of Scale
Economies of scale — an expected decline in management cost per dollar of fund assets as fund assets grow — are very rarely quantified and documented because of inherent difficulties in collecting and analyzing relevant data. However, in virtually every investment category that I reviewed, larger funds tend to have lower fees and lower total expenses than smaller funds. To see how each DWS Fund compares with this industry observation, I reviewed:
The trend in Fund assets over the last five years and the accompanying trend in total expenses. This shows if the Fund has grown and, if so, whether total expense (management fees as well as other expenses) have declined as a percent of assets.
Whether the Fund has break-points in its management fee schedule, the extent of the fee reduction built into the schedule and the asset levels where the breaks take effect, and in the case of a sub-advised Fund how the Fund's break-points compare with those of the sub-advisory fee schedule.
How the Fund's contractual fee schedule compares with trends in the industry data. To accomplish this, I constructed a chart showing how actual latest-fiscal-year contractual fees of the Fund and of other similar funds relate to average fund assets, with the subject Fund's contractual fee schedule superimposed.
Quality of Service — Performance
The quality-of-service evaluation focused on investment performance, which is the principal result of the investment management service. Each Fund's performance was reviewed over the past 1, 3, 5 and 10 years, as applicable, and compared with that of other funds in the same investment category and with a suitable market index.
In addition, I calculated and reviewed risk-adjusted returns relative to an index of similar mutual funds' returns and a suitable market index. The risk-adjusted returns analysis provides a way of determining the extent to which the Fund's return comparisons are mainly the product of investment value-added (or lack thereof) or alternatively taking considerably more or less risk than is typical in its investment category.
I also received and considered the history of portfolio manager changes for each Fund, as this provided an important context for evaluating the performance results.
Complex-Level Considerations
While this evaluation was conducted mainly at the individual fund level, there are some issues relating to the reasonableness of fees that can alternatively be considered across the whole fund complex:
I reviewed DeAM's profitability analysis for all DWS Funds, with a view toward determining if the allocation procedures used were reasonable and how profit levels compared with public data for other investment managers.
I considered whether DeAM and affiliates receive any significant ancillary or "fallout" benefits that should be considered in interpreting the direct profitability results. These would be situations where serving as the investment manager of the Funds is beneficial to another part of the Deutsche Bank organization.
I considered how aggregated DWS Fund expenses had varied over the years, by asset class and in the context of trends in asset levels.
I considered how aggregated DWS Fund performance measures relative to appropriate peers had varied by asset class and over time.
I reviewed the structure of the DeAM organization, trends in staffing levels, and information on compensation of investment management and other professionals compared with industry data.
Findings
Based on the process and analysis discussed above, which included reviewing a wide range of information from management and external data sources and considering among other factors the fees DeAM charges other clients, the fees charged by other fund managers, DeAM's costs and profits associated with managing the Funds, economies of scale, possible fall-out benefits, and the nature and quality of services provided, in my opinion the management fees charged the DWS Funds are reasonable.
Thomas H. Mack
President, Thomas H. Mack & Co., Inc.
DWS Investments Distributors, Inc.
222 South Riverside Plaza
Chicago, IL 60606
(800) 621-1148
VS2SMCV-3 (R-028381-2 8/13)
JUNE 30, 2013
SEMIANNUAL REPORT
DWS VARIABLE SERIES II
DWS Unconstrained Income VIP
Contents
25 Statement of Assets and Liabilities 26 Statement of Operations 27 Statement of Changes in Net Assets 29 Notes to Financial Statements 38 Information About Your Fund's Expenses 40 Summary of Management Fee Evaluation by Independent Fee Consultant |
This report must be preceded or accompanied by a prospectus. To obtain an additional prospectus or summary prospectus, if available, call (800) 728-3337 or your financial representative. We advise you to consider the Fund's objectives, risks, charges and expenses carefully before investing. The summary prospectus and prospectus contain this and other important information about the Fund. Please read the prospectus carefully before you invest.
Bond investments are subject to interest-rate and credit risks. When interest rates rise, bond prices generally fall. Credit risk refers to the ability of an issuer to make timely payments of principal and interest. Investments in lower-quality ("junk bonds") and non-rated securities present greater risk of loss than investments in higherquality securities. Investing in derivatives entails special risks relating to liquidity, leverage and credit that may reduce returns and/or increase volatility. Investing in foreign securities, particularly those of emerging markets, presents certain risks, such as currency fluctuations, political and economic changes, and market risks. The Fund may lend securities to approved institutions. See the prospectus for details.
DWS Investments is part of the Deutsche Asset & Wealth Management division of Deutsche Bank AG.
NOT FDIC/NCUA INSURED NO BANK GUARANTEE MAY LOSE VALUE NOT A DEPOSIT
NOT INSURED BY ANY FEDERAL GOVERNMENT AGENCY
Performance Summary June 30, 2013 (Unaudited)
Fund performance shown is historical, assumes reinvestment of all dividend and capital gain distributions and does not guarantee future results. Investment return and principal value fluctuate with changing market conditions so that, when redeemed, shares may be worth more or less than their original cost. Current performance may be lower or higher than the performance data quoted. Please contact your participating insurance company for the Fund's most recent month-end performance. Performance doesn't reflect charges and fees ("contract charges") associated with the separate account that invests in the Fund or any variable life insurance policy or variable annuity contract for which the Fund is an investment option. These charges and fees will reduce returns.
The gross expense ratio of the Fund, as stated in the fee table of the prospectus dated May 1, 2013 is 0.99% for Class A shares and may differ from the expense ratio disclosed in the Financial Highlights table in this report.
| Growth of an Assumed $10,000 Investment in DWS Unconstrained Income VIP |
| The Barclays U.S. Universal Index represents the union of the U.S. Aggregate Index, the U.S. High-Yield Corporate Index, the 144A Index, the Eurodollar Index, the Emerging Markets Index and the non-ERISA portion of the CMBS Index. On May 1, 2013, the Barclays U.S. Universal Index replaced the Barclays U.S. Aggregate Bond Index as the fund's primary benchmark index because the Advisor believes that it more accurately reflects the fund's investment strategy. The Barclays U.S. Aggregate Bond Index is an unmanaged index representing domestic taxable investment-grade bonds, with index components for government and corporate securities, mortgage pass-through securities, and asset-backed securities with an average maturity of one year or more. Index returns do not reflect any fees or expenses and it is not possible to invest directly into an index. |
| |
| Yearly periods ended June 30 | |
| Comparative Results | |
| DWS Unconstrained Income VIP | | 6-Month‡ | | | 1-Year | | | 3-Year | | | 5-Year | | | 10-Year | |
| Class A | Growth of $10,000 | | $ | 9,612 | | | $ | 10,290 | | | $ | 12,040 | | | $ | 14,237 | | | $ | 18,423 | |
| Average annual total return | | | -3.88 | % | | | 2.90 | % | | | 6.38 | % | | | 7.32 | % | | | 6.30 | % |
| Barclays U.S. Universal Index | Growth of $10,000 | | $ | 9,770 | | | $ | 10,024 | | | $ | 11,276 | | | $ | 13,086 | | | $ | 16,039 | |
| Average annual total return | | | -2.30 | % | | | 0.24 | % | | | 4.09 | % | | | 5.53 | % | | | 4.84 | % |
| Barclays U.S. Aggregate Bond Index | Growth of $10,000 | | $ | 9,756 | | | $ | 9,931 | | | $ | 11,090 | | | $ | 12,878 | | | $ | 15,559 | |
| Average annual total return | | | -2.44 | % | | | -0.69 | % | | | 3.51 | % | | | 5.19 | % | | | 4.52 | % |
The growth of $10,000 is cumulative.
‡ Total returns shown for periods less than one year are not annualized.
Portfolio Summary (Unaudited) Asset Allocation (As a % of Investment Portfolio excluding Securities Lending Collateral) | 6/30/13 | 12/31/12 |
| | | |
| Corporate Bonds | 52% | 56% |
| Government & Agency Obligations | 16% | 15% |
| Cash Equivalents | 8% | 6% |
| Mortgage-Backed Securities Pass-Throughs | 7% | 6% |
| Loan Participations and Assignments | 7% | 8% |
| Commercial Mortgage-Backed Securities | 3% | 3% |
| Collateralized Mortgage Obligations | 3% | 4% |
| Municipal Bonds and Notes | 1% | 1% |
| Exchange-Traded Fund | 1% | 0% |
| Asset-Backed | 1% | 1% |
| Options Purchased | 1% | 0% |
| | 100% | 100% |
Quality (Excludes Cash Equivalents and Securities Lending Collateral) | 6/30/13 | 12/31/12 |
| | | |
| AAA | 23% | 21% |
| AA | 4% | 2% |
| A | 4% | 7% |
| BBB | 20% | 23% |
| BB | 18% | 18% |
| B | 21% | 24% |
| CCC | 3% | 2% |
| Not Rated | 7% | 3% |
| | 100% | 100% |
| Interest Rate Sensitivity | 6/30/13 | 12/31/12 |
| | | |
| Effective Maturity | 6.5 years | 7.4 years |
| Effective Duration | 5.2 years | 5.2 years |
The quality ratings represent the higher of Moody's Investors Service, Inc. ("Moody's") or Standard & Poor's Corporation ("S&P") credit ratings. The ratings of Moody's and S&P represent their opinions as to the quality of the securities they rate. Credit quality measures a bond issuer's ability to repay interest and principal in a timely manner. Ratings are relative and subjective and are not absolute standards of quality. Credit quality does not remove market risk and is subject to change.
Effective maturity is the weighted average of the maturity date of bonds held by the Fund taking into consideration any available maturity shortening features.
Effective duration is an approximate measure of the Fund's sensitivity to interest rate changes taking into consideration any maturity shortening features.
Portfolio holdings and characteristics are subject to change.
For more complete details about the Fund's investment portfolio, see page 7.
Following the Fund's fiscal first and third quarter-end, a complete portfolio holdings listing is filed with the SEC on Form N-Q. The form will be available on the SEC's Web site at www.sec.gov, and it also may be reviewed and copied at the SEC's Public Reference Room in Washington, D.C. Information on the operation of the SEC's Public Reference Room may be obtained by calling (800) SEC-0330. The Fund's portfolio holdings are also posted on www.dws-investments.com from time to time. Please see the Fund's current prospectus for more information.
Gary Russell, CFA
William Chepolis, CFA
John D. Ryan
Philip G. Condon
Darwei Kung
Portfolio Managers, Deutsche Investment Management Americas Inc.
Investment Portfolio June 30, 2013 (Unaudited) | | | Principal Amount ($)(a) | | | Value ($) | |
| | | | |
| Corporate Bonds 55.9% | |
| Consumer Discretionary 6.6% | |
| AMC Networks, Inc., 7.75%, 7/15/2021 | | | | 15,000 | | | | 16,388 | |
| AmeriGas Finance LLC: | |
| 6.75%, 5/20/2020 | | | | 20,000 | | | | 20,700 | |
| 7.0%, 5/20/2022 | | | | 20,000 | | | | 20,450 | |
| Asbury Automotive Group, Inc.: | |
| 8.375%, 11/15/2020 | | | | 80,000 | | | | 88,600 | |
| 144A, 8.375%, 11/15/2020 | | | | 5,000 | | | | 5,538 | |
| Ashtead Capital, Inc., 144A, 6.5%, 7/15/2022 | | | | 45,000 | | | | 46,912 | |
| Ashton Woods U.S.A. LLC, 144A, 6.875%, 2/15/2021 | | | | 50,000 | | | | 50,500 | |
| Avis Budget Car Rental LLC: | |
| 144A, 5.5%, 4/1/2023 | | | | 30,000 | | | | 28,950 | |
| 8.25%, 1/15/2019 | | | | 95,000 | | | | 103,312 | |
| BC Mountain LLC, 144A, 7.0%, 2/1/2021 | | | | 30,000 | | | | 30,600 | |
| Block Communications, Inc., 144A, 7.25%, 2/1/2020 | | | | 65,000 | | | | 68,250 | |
| Boyd Gaming Corp., 9.0%, 7/1/2020 (b) | | | | 25,000 | | | | 25,344 | |
| Bresnan Broadband Holdings LLC, 144A, 8.0%, 12/15/2018 | | | | 95,000 | | | | 103,550 | |
| British Sky Broadcasting Group PLC, 144A, 3.125%, 11/26/2022 | | | | 90,000 | | | | 84,160 | |
| Cablevision Systems Corp., 8.0%, 4/15/2020 | | | | 10,000 | | | | 10,900 | |
| Caesar's Entertainment Operating Co., Inc., 8.5%, 2/15/2020 | | | | 120,000 | | | | 113,100 | |
| CCO Holdings LLC: | |
| 6.5%, 4/30/2021 | | | | 120,000 | | | | 125,100 | |
| 6.625%, 1/31/2022 | | | | 70,000 | | | | 72,975 | |
| 7.0%, 1/15/2019 | | | | 20,000 | | | | 21,200 | |
| 7.25%, 10/30/2017 | | | | 90,000 | | | | 95,512 | |
| 7.375%, 6/1/2020 | | | | 10,000 | | | | 10,875 | |
| 8.125%, 4/30/2020 | | | | 25,000 | | | | 27,313 | |
| CDR DB Sub, Inc., 144A, 7.75%, 10/15/2020 | | | | 35,000 | | | | 35,088 | |
| Cequel Communications Holdings I LLC: | | |
| 144A, 5.125%, 12/15/2021 | | | | 35,000 | | | | 32,900 | |
| 144A, 6.375%, 9/15/2020 | | | | 160,000 | | | | 162,800 | |
| Chester Downs & Marina LLC, 144A, 9.25%, 2/1/2020 | | | | 25,000 | | | | 24,125 | |
| Clear Channel Communications, Inc., 144A, 11.25%, 3/1/2021 | | | | 40,000 | | | | 41,700 | |
| Clear Channel Worldwide Holdings, Inc.: | | |
| Series A, 144A, 6.5%, 11/15/2022 | | | | 15,000 | | | | 15,375 | |
| Series A, 7.625%, 3/15/2020 | | | | 20,000 | | | | 20,600 | |
| Series B, 7.625%, 3/15/2020 | | | | 185,000 | | | | 191,475 | |
| Cogeco Cable, Inc., 144A, 4.875%, 5/1/2020 | | | | 5,000 | | | | 4,863 | |
| Columbus International, Inc., 144A, 11.5%, 11/20/2014 | | | | 100,000 | | | | 107,750 | |
| | | Principal Amount ($)(a) | | | Value ($) | |
| | | | | | | | | |
| Cox Communications, Inc., 144A, 3.25%, 12/15/2022 | | | | 60,000 | | | | 56,450 | |
| Crown Media Holdings, Inc., 10.5%, 7/15/2019 | | | | 55,000 | | | | 61,050 | |
| Cumulus Media Holdings, Inc., 7.75%, 5/1/2019 | | | | 65,000 | | | | 63,537 | |
| Delphi Corp., 5.0%, 2/15/2023 | | | | 40,000 | | | | 41,100 | |
| DISH DBS Corp.: | |
| 6.625%, 10/1/2014 | | | | 65,000 | | | | 67,762 | |
| 6.75%, 6/1/2021 | | | | 10,000 | | | | 10,625 | |
| 7.125%, 2/1/2016 | | | | 155,000 | | | | 167,787 | |
| Fontainebleau Las Vegas Holdings LLC, 144A, 11.0%, 6/15/2015* | | | | 65,000 | | | | 0 | |
| Griffey Intermediate, Inc., 144A, 7.0%, 10/15/2020 | | | | 65,000 | | | | 62,725 | |
| Harron Communications LP, 144A, 9.125%, 4/1/2020 | | | | 60,000 | | | | 64,800 | |
| Hertz Corp.: | |
| 144A, 4.25%, 4/1/2018 | | | | 25,000 | | | | 24,375 | |
| 6.75%, 4/15/2019 | | | | 50,000 | | | | 52,875 | |
| 7.5%, 10/15/2018 | | | | 155,000 | | | | 166,237 | |
| Hot Topic, Inc., 144A, 9.25%, 6/15/2021 | | | | 20,000 | | | | 20,250 | |
| Jo-Ann Stores Holdings, Inc., 144A, 9.75%, 10/15/2019 (PIK) | | | | 70,000 | | | | 71,925 | |
| L Brands, Inc., 7.0%, 5/1/2020 | | | | 20,000 | | | | 22,200 | |
| Lear Corp., 8.125%, 3/15/2020 | | | | 32,000 | | | | 35,040 | |
| Libbey Glass, Inc., 6.875%, 5/15/2020 | | | | 18,000 | | | | 18,833 | |
| Lions Gate Entertainment, Inc., 144A, 10.25%, 11/1/2016 | | | | 95,000 | | | | 101,769 | |
| LKQ Corp., 144A, 4.75%, 5/15/2023 | | | | 40,000 | | | | 38,200 | |
| Mattel, Inc., 5.45%, 11/1/2041 | | | | 141,400 | | | | 145,564 | |
| MDC Partners, Inc., 144A, 6.75%, 4/1/2020 | | | | 20,000 | | | | 19,950 | |
| Mediacom Broadband LLC, 6.375%, 4/1/2023 | | | | 65,000 | | | | 64,675 | |
| Mediacom LLC: | |
| 7.25%, 2/15/2022 | | | | 20,000 | | | | 21,050 | |
| 9.125%, 8/15/2019 | | | | 30,000 | | | | 32,250 | |
| MGM Resorts International: | |
| 6.75%, 10/1/2020 (b) | | | | 25,000 | | | | 25,875 | |
| 7.625%, 1/15/2017 | | | | 100,000 | | | | 109,250 | |
| 8.625%, 2/1/2019 | | | | 140,000 | | | | 158,200 | |
| National CineMedia LLC: | |
| 6.0%, 4/15/2022 | | | | 35,000 | | | | 35,919 | |
| 7.875%, 7/15/2021 | | | | 45,000 | | | | 48,825 | |
| Palace Entertainment Holdings LLC, 144A, 8.875%, 4/15/2017 | | | | 75,000 | | | | 77,250 | |
| Petco Holdings, Inc., 144A, 8.5%, 10/15/2017 (PIK) | | | | 20,000 | | | | 20,400 | |
| Quebecor Media, Inc., 5.75%, 1/15/2023 | | | | 30,000 | | | | 29,250 | |
| Regal Entertainment Group, 9.125%, 8/15/2018 | | | | 21,000 | | | | 23,100 | |
| Rent-A-Center, Inc., 144A, 4.75%, 5/1/2021 | | | | 20,000 | | | | 18,950 | |
| | | Principal Amount ($)(a) | | | Value ($) | |
| | | | | | | | | |
| Sabre Holdings Corp., 8.35%, 3/15/2016 | | | | 55,000 | | | | 58,850 | |
| SACI Falabella, 144A, 3.75%, 4/30/2023 | | | | 200,000 | | | | 183,000 | |
| Seminole Hard Rock Entertainment, Inc., 144A, 5.875%, 5/15/2021 | | | | 15,000 | | | | 14,550 | |
| Seminole Indian Tribe of Florida: | | |
| 144A, 7.75%, 10/1/2017 | | | | 40,000 | | | | 42,500 | |
| 144A, 7.804%, 10/1/2020 | | | | 70,000 | | | | 73,850 | |
| Serta Simmons Holdings LLC, 144A, 8.125%, 10/1/2020 | | | | 35,000 | | | | 35,612 | |
| Sirius XM Radio, Inc., 144A, 8.75%, 4/1/2015 | | | | 155,000 | | | | 170,500 | |
| SIWF Merger Sub, Inc., 144A, 6.25%, 6/1/2021 | | | | 35,000 | | | | 34,300 | |
| Starz LLC, 5.0%, 9/15/2019 | | | | 25,000 | | | | 24,813 | |
| Taylor Morrison Communities, Inc., 144A, 5.25%, 4/15/2021 | | | | 40,000 | | | | 38,000 | |
| Travelport LLC, 144A, 13.875%, 3/1/2016 (PIK) | | | | 6,750 | | | | 6,902 | |
| UCI International, Inc., 8.625%, 2/15/2019 | | | | 20,000 | | | | 20,400 | |
| Univision Communications, Inc.: | | |
| 144A, 6.875%, 5/15/2019 | | | | 10,000 | | | | 10,500 | |
| 144A, 7.875%, 11/1/2020 | | | | 25,000 | | | | 27,063 | |
| UPC Holding BV, 144A, 8.375%, 8/15/2020 | EUR | | | 50,000 | | | | 69,280 | |
| Viking Cruises Ltd., 144A, 8.5%, 10/15/2022 | | | | 30,000 | | | | 32,850 | |
| Visteon Corp., 6.75%, 4/15/2019 | | | | 28,000 | | | | 29,470 | |
| Yonkers Racing Corp., 144A, 11.375%, 7/15/2016 | | | | 60,000 | | | | 63,375 | |
| | | | | 4,720,768 | |
| Consumer Staples 3.5% | |
| Agrokor DD, 144A, 8.875%, 2/1/2020 | | | | 250,000 | | | | 263,500 | |
| Ajecorp BV, 144A, 6.5%, 5/14/2022 | | | | 150,000 | | | | 152,700 | |
| Alicorp SA, 144A, 3.875%, 3/20/2023 | | | | 250,000 | | | | 231,250 | |
| Alliance One International, Inc., 10.0%, 7/15/2016 | | | | 25,000 | | | | 25,563 | |
| Altria Group, Inc., 9.95%, 11/10/2038 | | | | 145,000 | | | | 214,602 | |
| B&G Foods, Inc., 4.625%, 6/1/2021 | | | | 35,000 | | | | 33,425 | |
| Chiquita Brands International, Inc., 144A, 7.875%, 2/1/2021 | | | | 25,000 | | | | 26,188 | |
| ConAgra Foods, Inc., 3.25%, 9/15/2022 | | | | 45,000 | | | | 42,929 | |
| Constellation Brands, Inc.: | |
| 3.75%, 5/1/2021 | | | | 35,000 | | | | 32,769 | |
| 6.0%, 5/1/2022 | | | | 15,000 | | | | 16,088 | |
| Controladora Mabe SA de CV, 144A, 7.875%, 10/28/2019 | | | | 100,000 | | | | 107,000 | |
| Del Monte Corp., 7.625%, 2/15/2019 | | | | 80,000 | | | | 82,200 | |
| Delhaize Group SA, 4.125%, 4/10/2019 | | | | 140,000 | | | | 144,214 | |
| FAGE Dairy Industry SA, 144A, 9.875%, 2/1/2020 | | | | 85,000 | | | | 91,587 | |
| | | Principal Amount ($)(a) | | | Value ($) | |
| | | | | | | | | |
| JBS U.S.A. LLC, 144A, 8.25%, 2/1/2020 | | | | 25,000 | | | | 26,188 | |
| MHP SA, 144A, 8.25%, 4/2/2020 | | | | 200,000 | | | | 178,165 | |
| Mriya Agro Holding PLC, 144A, 9.45%, 4/19/2018 | | | | 200,000 | | | | 178,000 | |
| NBTY, Inc., 9.0%, 10/1/2018 | | | | 25,000 | | | | 27,187 | |
| Pilgrim's Pride Corp., 7.875%, 12/15/2018 | | | | 45,000 | | | | 47,925 | |
| Reynolds Group Issuer, Inc.: | |
| 5.75%, 10/15/2020 | | | | 65,000 | | | | 65,487 | |
| 6.875%, 2/15/2021 | | | | 100,000 | | | | 105,000 | |
| 7.125%, 4/15/2019 | | | | 100,000 | | | | 105,625 | |
| Smithfield Foods, Inc.: | |
| 6.625%, 8/15/2022 | | | | 60,000 | | | | 64,500 | |
| 7.75%, 7/1/2017 | | | | 140,000 | | | | 154,350 | |
| Sun Products Corp., 144A, 7.75%, 3/15/2021 | | | | 50,000 | | | | 49,625 | |
| | | | | 2,466,067 | |
| Energy 7.5% | |
| Access Midstream Partners LP, 6.125%, 7/15/2022 | | | | 55,000 | | | | 55,688 | |
| Afren PLC, 144A, 10.25%, 4/8/2019 | | | | 200,000 | | | | 223,500 | |
| Antero Resources Finance Corp.: | | |
| 7.25%, 8/1/2019 | | | | 50,000 | | | | 52,125 | |
| 9.375%, 12/1/2017 | | | | 30,000 | | | | 31,800 | |
| Arch Coal, Inc., 7.0%, 6/15/2019 (b) | | | | 20,000 | | | | 16,650 | |
| Berry Petroleum Co.: | |
| 6.375%, 9/15/2022 | | | | 30,000 | | | | 29,888 | |
| 6.75%, 11/1/2020 | | | | 120,000 | | | | 124,200 | |
| BreitBurn Energy Partners LP: | |
| 7.875%, 4/15/2022 | | | | 30,000 | | | | 30,600 | |
| 8.625%, 10/15/2020 | | | | 35,000 | | | | 37,100 | |
| Chaparral Energy, Inc., 7.625%, 11/15/2022 | | | | 20,000 | | | | 20,400 | |
| Chesapeake Energy Corp., 5.75%, 3/15/2023 | | | | 15,000 | | | | 15,188 | |
| Chesapeake Oilfield Operating LLC, 144A, 6.625%, 11/15/2019 | | | | 25,000 | | | | 24,750 | |
| CITGO Petroleum Corp., 144A, 11.5%, 7/1/2017 | | | | 105,000 | | | | 116,550 | |
| Continental Resources, Inc.: | |
| 144A, 4.5%, 4/15/2023 | | | | 10,000 | | | | 9,725 | |
| 5.0%, 9/15/2022 | | | | 30,000 | | | | 30,525 | |
| 7.125%, 4/1/2021 | | | | 30,000 | | | | 33,000 | |
| Crestwood Midstream Partners LP, 7.75%, 4/1/2019 | | | | 65,000 | | | | 66,950 | |
| Crosstex Energy LP: | |
| 7.125%, 6/1/2022 | | | | 15,000 | | | | 15,150 | |
| 8.875%, 2/15/2018 | | | | 55,000 | | | | 58,300 | |
| DCP Midstream Operating LP, 3.875%, 3/15/2023 | | | | 100,000 | | | | 93,788 | |
| Denbury Resources, Inc., 4.625%, 7/15/2023 | | | | 75,000 | | | | 69,187 | |
| Dresser-Rand Group, Inc., 6.5%, 5/1/2021 | | | | 75,000 | | | | 79,500 | |
| Eagle Rock Energy Partners LP, 8.375%, 6/1/2019 | | | | 75,000 | | | | 76,312 | |
| EDC Finance Ltd., 144A, 4.875%, 4/17/2020 | | | | 200,000 | | | | 183,000 | |
| El Paso LLC, 7.25%, 6/1/2018 | | | | 55,000 | | | | 60,925 | |
| | | Principal Amount ($)(a) | | | Value ($) | |
| | | | | | | | | |
| Enterprise Products Operating LLC, 3.35%, 3/15/2023 | | | | 65,000 | | | | 62,550 | |
| EP Energy LLC: | |
| 6.875%, 5/1/2019 | | | | 60,000 | | | | 64,200 | |
| 7.75%, 9/1/2022 | | | | 25,000 | | | | 26,750 | |
| 9.375%, 5/1/2020 | | | | 25,000 | | | | 28,250 | |
| EPE Holdings LLC, 144A, 8.125%, 12/15/2017 (PIK) (b) | | | | 57,358 | | | | 58,505 | |
| EV Energy Partners LP, 8.0%, 4/15/2019 | | | | 140,000 | | | | 141,400 | |
| FMC Technologies, Inc., 3.45%, 10/1/2022 | | | | 40,000 | | | | 38,317 | |
| Frontier Oil Corp., 6.875%, 11/15/2018 | | | | 55,000 | | | | 58,987 | |
| Global Geophysical Services, Inc., 10.5%, 5/1/2017 | | | | 90,000 | | | | 78,300 | |
| Halcon Resources Corp.: | |
| 8.875%, 5/15/2021 | | | | 85,000 | | | | 82,450 | |
| 9.75%, 7/15/2020 | | | | 50,000 | | | | 49,875 | |
| Holly Energy Partners LP: | |
| 6.5%, 3/1/2020 | | | | 20,000 | | | | 20,150 | |
| 8.25%, 3/15/2018 | | | | 55,000 | | | | 58,163 | |
| KazMunayGas National Co. JSC, 144A, 5.75%, 4/30/2043 | | | | 200,000 | | | | 177,000 | |
| Kinder Morgan Energy Partners LP, 5.8%, 3/1/2021 | | | | 194,000 | | | | 219,869 | |
| Kodiak Oil & Gas Corp., 144A, 5.5%, 1/15/2021 | | | | 40,000 | | | | 39,000 | |
| Linn Energy LLC: | |
| 144A, 6.25%, 11/1/2019 | | | | 110,000 | | | | 104,775 | |
| 6.5%, 5/15/2019 | | | | 15,000 | | | | 14,663 | |
| MEG Energy Corp.: | |
| 144A, 6.375%, 1/30/2023 | | | | 100,000 | | | | 97,000 | |
| 144A, 6.5%, 3/15/2021 | | | | 40,000 | | | | 39,650 | |
| Memorial Production Partners LP, 144A, 7.625%, 5/1/2021 | | | | 60,000 | | | | 59,100 | |
| Midstates Petroleum Co., Inc.: | |
| 144A, 9.25%, 6/1/2021 | | | | 70,000 | | | | 65,800 | |
| 144A, 10.75%, 10/1/2020 | | | | 35,000 | | | | 35,175 | |
| Murray Energy Corp., 144A, 8.625%, 6/15/2021 | | | | 5,000 | | | | 5,000 | |
| Northern Oil & Gas, Inc., 8.0%, 6/1/2020 | | | | 90,000 | | | | 90,900 | |
| Oasis Petroleum, Inc.: | |
| 6.5%, 11/1/2021 | | | | 25,000 | | | | 25,625 | |
| 6.875%, 1/15/2023 | | | | 25,000 | | | | 25,750 | |
| 7.25%, 2/1/2019 | | | | 40,000 | | | | 41,700 | |
| Odebrecht Drilling Norbe VIII/IX Ltd., 144A, 6.35%, 6/30/2021 | | | | 190,000 | | | | 191,900 | |
| Offshore Group Investment Ltd., 144A, 7.125%, 4/1/2023 | | | | 60,000 | | | | 58,950 | |
| Pacific Drilling SA, 144A, 5.375%, 6/1/2020 | | | | 35,000 | | | | 32,725 | |
| Pacific Rubiales Energy Corp., 144A, 5.125%, 3/28/2023 | | | | 200,000 | | | | 189,000 | |
| Petroleos de Venezuela SA, 144A, 8.5%, 11/2/2017 | | | | 300,000 | | | | 274,875 | |
| Plains Exploration & Production Co., 6.75%, 2/1/2022 | | | | 30,000 | | | | 31,793 | |
| | | Principal Amount ($)(a) | | | Value ($) | |
| | | | | | | | | |
| Range Resources Corp., 5.0%, 3/15/2023 | | | | 15,000 | | | | 14,663 | |
| Regency Energy Partners LP, 144A, 4.5%, 11/1/2023 | | | | 15,000 | | | | 13,575 | |
| Reliance Holdings U.S.A., Inc., 144A, 5.4%, 2/14/2022 | | | | 250,000 | | | | 253,972 | |
| Sabine Pass Liquefaction LLC, 144A, 5.625%, 2/1/2021 | | | | 105,000 | | | | 101,850 | |
| SandRidge Energy, Inc., 7.5%, 3/15/2021 | | | | 75,000 | | | | 71,625 | |
| SESI LLC: | |
| 6.375%, 5/1/2019 | | | | 40,000 | | | | 41,300 | |
| 7.125%, 12/15/2021 | | | | 115,000 | | | | 124,200 | |
| Swift Energy Co., 7.875%, 3/1/2022 | | | | 55,000 | | | | 54,725 | |
| Talos Production LLC, 144A, 9.75%, 2/15/2018 | | | | 60,000 | | | | 57,000 | |
| Tesoro Corp.: | |
| 4.25%, 10/1/2017 | | | | 35,000 | | | | 35,875 | |
| 5.375%, 10/1/2022 | | | | 25,000 | | | | 25,313 | |
| Transocean, Inc., 3.8%, 10/15/2022 | | | | 75,000 | | | | 71,441 | |
| Transportadora de Gas Internacional SA ESP, 144A, 5.7%, 3/20/2022 | | | | 200,000 | | | | 206,500 | |
| Venoco, Inc., 8.875%, 2/15/2019 | | | | 105,000 | | | | 102,375 | |
| WPX Energy, Inc., 5.25%, 1/15/2017 | | | | 40,000 | | | | 41,000 | |
| | | | | 5,358,362 | |
| Financials 11.6% | |
| Ally Financial, Inc.: | |
| 5.5%, 2/15/2017 | | | | 60,000 | | | | 62,689 | |
| 6.25%, 12/1/2017 | | | | 95,000 | | | | 101,628 | |
| 8.0%, 3/15/2020 (b) | | | | 115,000 | | | | 133,544 | |
| 8.3%, 2/12/2015 | | | | 135,000 | | | | 145,462 | |
| American International Group, Inc., 3.8%, 3/22/2017 | | | | 60,000 | | | | 62,899 | |
| American Tower Corp., (REIT), 3.5%, 1/31/2023 | | | | 60,000 | | | | 54,940 | |
| Banco de Credito del Peru, 144A, 4.25%, 4/1/2023 | | | | 200,000 | | | | 184,500 | |
| Banco Santander Brasil SA: | |
| 144A, 4.625%, 2/13/2017 | | | | 250,000 | | | | 253,750 | |
| 144A, 8.0%, 3/18/2016 | BRL | | | 400,000 | | | | 164,923 | |
| Bank of America Corp., 3.3%, 1/11/2023 | | | | 160,000 | | | | 151,224 | |
| Bank of Ireland Mortgage Bank, Series 6, 4.0%, 7/5/2013 | EUR | | | 750,000 | | | | 976,335 | |
| Barclays Bank PLC, 7.625%, 11/21/2022 | | | | 400,000 | | | | 392,500 | |
| BBVA Bancomer SA, 144A, 6.75%, 9/30/2022 | | | | 200,000 | | | | 216,000 | |
| BNP Paribas SA, 3.25%, 3/3/2023 | | | | 115,000 | | | | 105,714 | |
| Case New Holland, Inc., 7.75%, 9/1/2013 | | | | 45,000 | | | | 45,281 | |
| CIT Group, Inc.: | |
| 5.0%, 5/15/2017 | | | | 80,000 | | | | 81,700 | |
| 5.25%, 3/15/2018 | | | | 90,000 | | | | 92,475 | |
| CNH Capital LLC, 144A, 3.625%, 4/15/2018 | | | | 60,000 | | | | 57,150 | |
| | | Principal Amount ($)(a) | | | Value ($) | |
| | | | | | | | | |
| Development Bank of Kazakhstan JSC, Series 3, 6.5%, 6/3/2020 | | | | 500,000 | | | | 525,000 | |
| E*TRADE Financial Corp., 6.75%, 6/1/2016 | | | | 130,000 | | | | 133,575 | |
| Ford Motor Credit Co., LLC, 3.984%, 6/15/2016 | | | | 145,000 | | | | 151,906 | |
| General Electric Capital Corp., 5.3%, 2/11/2021 | | | | 75,000 | | | | 82,273 | |
| General Motors Financial Co., Inc., 144A, 3.25%, 5/15/2018 (b) | | | | 15,000 | | | | 14,587 | |
| Glencore Funding LLC, 144A, 4.125%, 5/30/2023 | | | | 200,000 | | | | 178,377 | |
| Hartford Financial Services Group, Inc.: | | |
| 4.3%, 4/15/2043 | | | | 85,000 | | | | 73,622 | |
| 6.0%, 1/15/2019 | | | | 117,000 | | | | 131,894 | |
| HCP, Inc., (REIT), 5.375%, 2/1/2021 | | | | 143,000 | | | | 155,118 | |
| Hellas Telecommunications Finance SCA, 144A, 8.21%**, 7/15/2015 (PIK)* | EUR | | | 109,187 | | | | 0 | |
| Host Hotels & Resorts LP, Series D, (REIT), 3.75%, 10/15/2023 | | | | 75,000 | | | | 68,786 | |
| ING Bank NV, 144A, 2.0%, 9/25/2015 | | | | 200,000 | | | | 201,696 | |
| International Lease Finance Corp.: | | |
| 3.875%, 4/15/2018 | | | | 65,000 | | | | 61,100 | |
| 4.625%, 4/15/2021 | | | | 50,000 | | | | 46,000 | |
| 5.75%, 5/15/2016 | | | | 20,000 | | | | 20,553 | |
| 6.25%, 5/15/2019 | | | | 50,000 | | | | 51,375 | |
| 8.625%, 9/15/2015 | | | | 40,000 | | | | 43,800 | |
| 8.625%, 1/15/2022 | | | | 45,000 | | | | 51,750 | |
| 8.75%, 3/15/2017 | | | | 120,000 | | | | 133,650 | |
| Intesa Sanpaolo SpA, 3.875%, 1/16/2018 | | | | 240,000 | | | | 230,451 | |
| Jefferies Group LLC, 5.125%, 1/20/2023 | | | | 60,000 | | | | 59,537 | |
| Loews Corp., 2.625%, 5/15/2023 | | | | 65,000 | | | | 59,123 | |
| Macquarie Bank Ltd., 144A, 3.45%, 7/27/2015 | | | | 105,000 | | | | 108,814 | |
| Morgan Stanley: | |
| 3.75%, 2/25/2023 | | | | 85,000 | | | | 81,284 | |
| 4.1%, 5/22/2023 | | | | 85,000 | | | | 78,533 | |
| MPT Operating Partnership LP: | | |
| (REIT), 6.375%, 2/15/2022 | | | | 30,000 | | | | 31,500 | |
| (REIT), 6.875%, 5/1/2021 | | | | 50,000 | | | | 53,000 | |
| Neuberger Berman Group LLC: | | |
| 144A, 5.625%, 3/15/2020 | | | | 25,000 | | | | 25,875 | |
| 144A, 5.875%, 3/15/2022 | | | | 45,000 | | | | 45,900 | |
| OPB Finance Trust, Series C, 2.9%, 5/24/2023 | CAD | | | 238,000 | | | | 215,234 | |
| Principal Financial Group, Inc., 3.3%, 9/15/2022 | | | | 150,000 | | | | 145,714 | |
| RCI Banque SA, 144A, 3.5%, 4/3/2018 | | | | 200,000 | | | | 199,017 | |
| Royal Bank of Scotland Group PLC, 6.1%, 6/10/2023 | | | | 100,000 | | | | 94,871 | |
| Santander US Debt SAU, 144A, 3.724%, 1/20/2015 | | | | 45,000 | | | | 45,421 | |
| | | Principal Amount ($)(a) | | | Value ($) | |
| | | | | | | | | |
| Skandinaviska Enskilda Banken AB, 144A, 1.375%, 5/29/2018 | | | | 396,000 | | | | 381,467 | |
| SLM Corp., 5.5%, 1/25/2023 | | | | 125,000 | | | | 119,025 | |
| The Goldman Sachs Group, Inc.: | | |
| 3.625%, 1/22/2023 | | | | 55,000 | | | | 52,623 | |
| 5.75%, 1/24/2022 | | | | 160,000 | | | | 176,482 | |
| Turkiye Is Bankasi, 144A, 6.0%, 10/24/2022 | | | | 250,000 | | | | 244,375 | |
| Turkiye Vakiflar Bankasi Tao, 144A, 3.75%, 4/15/2018 | | | | 250,000 | | | | 235,000 | |
| Ventas Realty LP, (REIT), 2.7%, 4/1/2020 | | | | 130,000 | | | | 122,920 | |
| | | | | 8,213,942 | |
| Health Care 2.9% | |
| Agilent Technologies, Inc., 3.2%, 10/1/2022 | | | | 40,000 | | | | 37,081 | |
| Aviv Healthcare Properties LP, 7.75%, 2/15/2019 | | | | 85,000 | | | | 90,738 | |
| Biomet, Inc.: | |
| 6.5%, 8/1/2020 | | | | 55,000 | | | | 56,684 | |
| 6.5%, 10/1/2020 (b) | | | | 15,000 | | | | 14,963 | |
| Community Health Systems, Inc.: | | |
| 5.125%, 8/15/2018 | | | | 185,000 | | | | 187,775 | |
| 7.125%, 7/15/2020 | | | | 60,000 | | | | 61,800 | |
| Fresenius Medical Care U.S. Finance II, Inc.: | | |
| 144A, 5.625%, 7/31/2019 | | | | 35,000 | | | | 36,400 | |
| 144A, 5.875%, 1/31/2022 | | | | 30,000 | | | | 31,575 | |
| Fresenius Medical Care U.S. Finance, Inc., 144A, 6.5%, 9/15/2018 | | | | 20,000 | | | | 21,750 | |
| HCA, Inc.: | |
| 5.875%, 3/15/2022 | | | | 40,000 | | | | 41,050 | |
| 6.5%, 2/15/2020 | | | | 210,000 | | | | 227,194 | |
| 7.5%, 2/15/2022 | | | | 155,000 | | | | 171,662 | |
| 7.875%, 2/15/2020 | | | | 365,000 | | | | 393,059 | |
| 8.5%, 4/15/2019 | | | | 45,000 | | | | 48,291 | |
| Hologic, Inc., 6.25%, 8/1/2020 | | | | 30,000 | | | | 31,106 | |
| Laboratory Corp. of America Holdings, 3.75%, 8/23/2022 | | | | 35,000 | | | | 33,433 | |
| Mallinckrodt International Finance SA, 144A, 4.75%, 4/15/2023 | | | | 75,000 | | | | 71,445 | |
| Physio-Control International, Inc., 144A, 9.875%, 1/15/2019 | | | | 50,000 | | | | 55,000 | |
| Sky Growth Acquisition Corp., 144A, 7.375%, 10/15/2020 | | | | 30,000 | | | | 30,750 | |
| STHI Holding Corp., 144A, 8.0%, 3/15/2018 | | | | 60,000 | | | | 64,800 | |
| Tenet Healthcare Corp.: | |
| 144A, 4.375%, 10/1/2021 | | | | 55,000 | | | | 50,463 | |
| 144A, 4.5%, 4/1/2021 | | | | 10,000 | | | | 9,325 | |
| 6.25%, 11/1/2018 | | | | 80,000 | | | | 84,200 | |
| VPII Escrow Corp., 144A, 6.75%, 8/15/2018 (c) | | | | 70,000 | | | | 71,750 | |
| Warner Chilcott Co., LLC, 7.75%, 9/15/2018 | | | | 75,000 | | | | 81,000 | |
| Zoetis, Inc., 144A, 3.25%, 2/1/2023 | | | | 30,000 | | | | 28,504 | |
| | | | | 2,031,798 | |
| | | Principal Amount ($)(a) | | | Value ($) | |
| | | | | | | | | |
| Industrials 5.6% | |
| Accuride Corp., 9.5%, 8/1/2018 | | | | 65,000 | | | | 66,138 | |
| Aeropuertos Dominicanos Siglo XXI SA, 144A, 9.25%, 11/13/2019 | | | | 250,000 | | | | 250,625 | |
| Air Lease Corp.: | |
| 4.75%, 3/1/2020 | | | | 45,000 | | | | 43,425 | |
| 6.125%, 4/1/2017 (b) | | | | 75,000 | | | | 77,625 | |
| Alphabet Holding Co., Inc., 7.75%, 11/1/2017 (PIK) | | | | 30,000 | | | | 30,750 | |
| Armored Autogroup, Inc., 9.25%, 11/1/2018 | | | | 105,000 | | | | 96,337 | |
| BE Aerospace, Inc., 6.875%, 10/1/2020 | | | | 25,000 | | | | 27,000 | |
| Belden, Inc., 144A, 5.5%, 9/1/2022 | | | | 55,000 | | | | 54,038 | |
| Bombardier, Inc.: | |
| 144A, 5.75%, 3/15/2022 | | | | 55,000 | | | | 54,588 | |
| 144A, 6.125%, 1/15/2023 | | | | 45,000 | | | | 44,663 | |
| 144A, 7.75%, 3/15/2020 | | | | 45,000 | | | | 49,950 | |
| Casella Waste Systems, Inc., 7.75%, 2/15/2019 | | | | 110,000 | | | | 104,500 | |
| DigitalGlobe, Inc., 144A, 5.25%, 2/1/2021 | | | | 25,000 | | | | 24,000 | |
| Ducommun, Inc., 9.75%, 7/15/2018 | | | | 65,000 | | | | 71,012 | |
| DynCorp International, Inc., 10.375%, 7/1/2017 | | | | 85,000 | | | | 85,425 | |
| Ferreycorp SAA, 144A, 4.875%, 4/26/2020 | | | | 200,000 | | | | 188,000 | |
| Florida East Coast Railway Corp., 8.125%, 2/1/2017 | | | | 40,000 | | | | 42,300 | |
| FTI Consulting, Inc., 6.75%, 10/1/2020 | | | | 145,000 | | | | 152,612 | |
| Garda World Security Corp., 144A, 9.75%, 3/15/2017 | | | | 65,000 | | | | 68,654 | |
| GenCorp, Inc., 144A, 7.125%, 3/15/2021 | | | | 115,000 | | | | 119,025 | |
| Georgian Railway JSC, 144A, 7.75%, 7/11/2022 | | | | 200,000 | | | | 216,140 | |
| Grupo KUO SAB De CV, 144A, 6.25%, 12/4/2022 | | | | 200,000 | | | | 204,750 | |
| Huntington Ingalls Industries, Inc.: | | |
| 6.875%, 3/15/2018 | | | | 50,000 | | | | 53,438 | |
| 7.125%, 3/15/2021 | | | | 10,000 | | | | 10,750 | |
| Ingersoll-Rand Global Holding Co., Ltd., 144A, 2.875%, 1/15/2019 | | | | 20,000 | | | | 19,730 | |
| Interline Brands, Inc., 7.5%, 11/15/2018 | | | | 50,000 | | | | 52,500 | |
| Iron Mountain, Inc., 5.75%, 8/15/2024 | | | | 40,000 | | | | 37,500 | |
| Masco Corp., 7.125%, 3/15/2020 | | | | 145,000 | | | | 161,675 | |
| Meritor, Inc.: | |
| 6.75%, 6/15/2021 | | | | 25,000 | | | | 23,875 | |
| 10.625%, 3/15/2018 | | | | 60,000 | | | | 64,950 | |
| Navios Maritime Holdings, Inc.: | |
| 8.125%, 2/15/2019 | | | | 75,000 | | | | 71,062 | |
| 8.875%, 11/1/2017 | | | | 35,000 | | | | 36,225 | |
| Navios South American Logistics, Inc., 144A, 9.25%, 4/15/2019 | | | | 10,000 | | | | 10,725 | |
| Nortek, Inc., 8.5%, 4/15/2021 | | | | 75,000 | | | | 80,250 | |
| Odebrecht Finance Ltd., 144A, 7.125%, 6/26/2042 | | | | 250,000 | | | | 242,500 | |
| | | Principal Amount ($)(a) | | | Value ($) | |
| | | | | | | | | |
| Owens Corning, Inc.: | |
| 4.2%, 12/15/2022 | | | | 30,000 | | | | 29,070 | |
| 9.0%, 6/15/2019 | | | | 29,000 | | | | 35,604 | |
| Ply Gem Industries, Inc., 9.375%, 4/15/2017 | | | | 15,000 | | | | 15,863 | |
| Sitel LLC, 11.5%, 4/1/2018 | | | | 95,000 | | | | 70,775 | |
| Spirit AeroSystems, Inc., 6.75%, 12/15/2020 | | | | 75,000 | | | | 78,000 | |
| Titan International, Inc.: | |
| 7.875%, 10/1/2017 | | | | 90,000 | | | | 94,500 | |
| 144A, 7.875%, 10/1/2017 | | | | 20,000 | | | | 21,000 | |
| Total System Services, Inc., 3.75%, 6/1/2023 | | | | 70,000 | | | | 64,995 | |
| TransDigm, Inc.: | |
| 144A, 7.5%, 7/15/2021 (c) | | | | 50,000 | | | | 51,125 | |
| 7.75%, 12/15/2018 | | | | 65,000 | | | | 68,412 | |
| Transnet SOC Ltd., 144A, 4.0%, 7/26/2022 | | | | 200,000 | | | | 174,880 | |
| U.S. Airways Group, Inc., 6.125%, 6/1/2018 | | | | 35,000 | | | | 33,075 | |
| United Rentals North America, Inc.: | | |
| 5.75%, 7/15/2018 | | | | 60,000 | | | | 63,000 | |
| 7.375%, 5/15/2020 | | | | 95,000 | | | | 101,412 | |
| 7.625%, 4/15/2022 | | | | 95,000 | | | | 102,837 | |
| Watco Companies LLC, 144A, 6.375%, 4/1/2023 | | | | 25,000 | | | | 24,875 | |
| | | | | 3,966,160 | |
| Information Technology 1.4% | |
| CDW LLC, 8.5%, 4/1/2019 | | | | 45,000 | | | | 48,375 | |
| eAccess Ltd., 144A, 8.25%, 4/1/2018 | | | | 60,000 | | | | 65,700 | |
| EarthLink, Inc., 144A, 7.375%, 6/1/2020 | | | | 30,000 | | | | 28,800 | |
| Equinix, Inc.: | |
| 4.875%, 4/1/2020 | | | | 40,000 | | | | 39,200 | |
| 5.375%, 4/1/2023 | | | | 105,000 | | | | 102,900 | |
| 7.0%, 7/15/2021 | | | | 40,000 | | | | 43,400 | |
| First Data Corp.: | |
| 144A, 6.75%, 11/1/2020 | | | | 110,000 | | | | 111,925 | |
| 144A, 7.375%, 6/15/2019 | | | | 45,000 | | | | 46,237 | |
| 144A, 8.875%, 8/15/2020 | | | | 85,000 | | | | 92,650 | |
| 144A, 10.625%, 6/15/2021 | | | | 60,000 | | | | 59,250 | |
| Fiserv, Inc., 3.5%, 10/1/2022 | | | | 95,000 | | | | 90,167 | |
| Freescale Semiconductor, Inc., 144A, 9.25%, 4/15/2018 | | | | 120,000 | | | | 129,300 | |
| Hughes Satellite Systems Corp.: | |
| 6.5%, 6/15/2019 | | | | 40,000 | | | | 42,400 | |
| 7.625%, 6/15/2021 | | | | 40,000 | | | | 42,500 | |
| IAC/InterActiveCorp., 144A, 4.75%, 12/15/2022 | | | | 25,000 | | | | 23,625 | |
| Jabil Circuit, Inc., 7.75%, 7/15/2016 (b) | | | | 30,000 | | | | 33,975 | |
| | | | | 1,000,404 | |
| Materials 6.7% | |
| Anglo American Capital PLC, 144A, 4.125%, 9/27/2022 | | | | 250,000 | | | | 236,119 | |
| Ashland, Inc., 144A, 3.875%, 4/15/2018 | | | | 20,000 | | | | 19,800 | |
| Axiall Corp., 144A, 4.875%, 5/15/2023 | | | | 10,000 | | | | 9,500 | |
| Ball Corp., 7.375%, 9/1/2019 | | | | 25,000 | | | | 27,000 | |
| Barrick Gold Corp., 144A, 2.5%, 5/1/2018 | | | | 40,000 | | | | 35,895 | |
| | | Principal Amount ($)(a) | | | Value ($) | |
| | | | | | | | | |
| Bluescope Steel Ltd., 144A, 7.125%, 5/1/2018 | | | | 25,000 | | | | 25,375 | |
| BOE Intermediate Holding Corp., 144A, 9.0%, 11/1/2017 (PIK) | | | | 40,000 | | | | 38,400 | |
| Braskem America Finance Co., 144A, 7.125%, 7/22/2041 | | | | 200,000 | | | | 189,250 | |
| Cemex SAB de CV, 144A, 9.0%, 1/11/2018 | | | | 200,000 | | | | 210,000 | |
| Cia Minera Milpo SAA, 144A, 4.625%, 3/28/2023 | | | | 200,000 | | | | 182,500 | |
| Clearwater Paper Corp., 7.125%, 11/1/2018 | | | | 65,000 | | | | 69,550 | |
| Crown Americas LLC, 6.25%, 2/1/2021 | | | | 10,000 | | | | 10,600 | |
| Eagle Spinco, Inc., 144A, 4.625%, 2/15/2021 | | | | 20,000 | | | | 19,200 | |
| Essar Steel Algoma, Inc.: | |
| 144A, 9.375%, 3/15/2015 | | | | 220,000 | | | | 209,000 | |
| 144A, 9.875%, 6/15/2015 | | | | 35,000 | | | | 26,950 | |
| Exopack Holding Corp., 10.0%, 6/1/2018 | | | | 40,000 | | | | 40,500 | |
| FMG Resources (August 2006) Pty Ltd.: | | |
| 144A, 6.0%, 4/1/2017 (b) | | | | 55,000 | | | | 53,487 | |
| 144A, 6.875%, 4/1/2022 | | | | 15,000 | | | | 14,550 | |
| 144A, 7.0%, 11/1/2015 | | | | 65,000 | | | | 65,650 | |
| 144A, 8.25%, 11/1/2019 (b) | | | | 45,000 | | | | 46,350 | |
| FQM Akubra, Inc.: | |
| 144A, 7.5%, 6/1/2021 | | | | 80,000 | | | | 76,600 | |
| 144A, 8.75%, 6/1/2020 | | | | 45,000 | | | | 46,013 | |
| Greif, Inc., 7.75%, 8/1/2019 | | | | 195,000 | | | | 223,275 | |
| GTL Trade Finance, Inc., 144A, 7.25%, 10/20/2017 | | | | 200,000 | | | | 216,000 | |
| Hexion U.S. Finance Corp.: | |
| 6.625%, 4/15/2020 | | | | 15,000 | | | | 14,963 | |
| 8.875%, 2/1/2018 | | | | 95,000 | | | | 96,900 | |
| Huntsman International LLC: | |
| 8.625%, 3/15/2020 | | | | 60,000 | | | | 65,250 | |
| 8.625%, 3/15/2021 | | | | 25,000 | | | | 27,438 | |
| IAMGOLD Corp., 144A, 6.75%, 10/1/2020 | | | | 40,000 | | | | 33,800 | |
| International Paper Co., 7.95%, 6/15/2018 | | | | 145,000 | | | | 177,541 | |
| Kaiser Aluminum Corp., 8.25%, 6/1/2020 | | | | 40,000 | | | | 44,300 | |
| KGHM International Ltd., 144A, 7.75%, 6/15/2019 | | | | 115,000 | | | | 116,725 | |
| LyondellBasell Industries NV, 6.0%, 11/15/2021 | | | | 15,000 | | | | 16,856 | |
| Metalloinvest Finance Ltd., 144A, 6.5%, 7/21/2016 | | | | 200,000 | | | | 206,000 | |
| Novelis, Inc.: | |
| 8.375%, 12/15/2017 | | | | 160,000 | | | | 169,600 | |
| 8.75%, 12/15/2020 | | | | 215,000 | | | | 230,587 | |
| Owens-Brockway Glass Container, Inc., 7.375%, 5/15/2016 | | | | 30,000 | | | | 33,450 | |
| Packaging Dynamics Corp., 144A, 8.75%, 2/1/2016 | | | | 90,000 | | | | 90,900 | |
| Polymer Group, Inc., 7.75%, 2/1/2019 | | | | 55,000 | | | | 57,200 | |
| PolyOne Corp., 144A, 5.25%, 3/15/2023 | | | | 85,000 | | | | 83,725 | |
| | | Principal Amount ($)(a) | | | Value ($) | |
| | | | | | | | | |
| Polyus Gold International Ltd., 144A, 5.625%, 4/29/2020 | | | | 200,000 | | | | 194,000 | |
| Rain CII Carbon LLC, 144A, 8.0%, 12/1/2018 | | | | 45,000 | | | | 46,125 | |
| Samarco Mineracao SA, 144A, 4.125%, 11/1/2022 | | | | 200,000 | | | | 179,000 | |
| Sealed Air Corp.: | |
| 144A, 5.25%, 4/1/2023 | | | | 10,000 | | | | 9,725 | |
| 144A, 8.125%, 9/15/2019 | | | | 30,000 | | | | 33,450 | |
| 144A, 8.375%, 9/15/2021 | | | | 30,000 | | | | 33,900 | |
| Tronox Finance LLC, 144A, 6.375%, 8/15/2020 | | | | 40,000 | | | | 37,700 | |
| Turkiye Sise ve Cam Fabrikalari AS, 144A, 4.25%, 5/9/2020 (b) | | | | 300,000 | | | | 273,000 | |
| Viskase Companies, Inc., 144A, 9.875%, 1/15/2018 | | | | 145,000 | | | | 153,337 | |
| Votorantim Overseas IV, 144A, 7.75%, 6/24/2020 | | | | 250,000 | | | | 279,375 | |
| | | | | 4,796,411 | |
| Telecommunication Services 7.4% | |
| America Movil SAB de CV, Series 12, 6.45%, 12/5/2022 | MXN | | | 2,000,000 | | | | 149,481 | |
| CC Holdings GS V LLC, 3.849%, 4/15/2023 | | | | 70,000 | | | | 66,007 | |
| CenturyLink, Inc., Series V, 5.625%, 4/1/2020 | | | | 15,000 | | | | 15,150 | |
| Cincinnati Bell, Inc.: | |
| 8.25%, 10/15/2017 | | | | 55,000 | | | | 57,338 | |
| 8.375%, 10/15/2020 | | | | 180,000 | | | | 184,950 | |
| 8.75%, 3/15/2018 (b) | | | | 170,000 | | | | 170,212 | |
| Colombia Telecomunicaciones SA ESP, 144A, 5.375%, 9/27/2022 | | | | 200,000 | | | | 189,000 | |
| CPI International, Inc., 8.0%, 2/15/2018 | | | | 45,000 | | | | 46,350 | |
| Cricket Communications, Inc., 7.75%, 10/15/2020 (b) | | | | 280,000 | | | | 268,800 | |
| Deutsche Telekom International Finance BV, 144A, 4.875%, 3/6/2042 | | | | 200,000 | | | | 195,098 | |
| Digicel Group Ltd., 144A, 10.5%, 4/15/2018 | | | | 100,000 | | | | 106,000 | |
| Digicel Ltd., 144A, 8.25%, 9/1/2017 | | | | 400,000 | | | | 416,000 | |
| ERC Ireland Preferred Equity Ltd., 144A, 7.69%**, 2/15/2017 (PIK)* | EUR | | | 88,319 | | | | 0 | |
| Frontier Communications Corp.: | | |
| 7.125%, 1/15/2023 (b) | | | | 200,000 | | | | 199,000 | |
| 7.625%, 4/15/2024 | | | | 15,000 | | | | 15,038 | |
| 8.25%, 4/15/2017 | | | | 62,000 | | | | 69,750 | |
| 8.5%, 4/15/2020 | | | | 90,000 | | | | 99,225 | |
| 8.75%, 4/15/2022 | | | | 10,000 | | | | 10,900 | |
| Intelsat Jackson Holdings SA: | |
| 144A, 5.5%, 8/1/2023 | | | | 85,000 | | | | 79,900 | |
| 144A, 6.625%, 12/15/2022 | | | | 35,000 | | | | 33,950 | |
| 7.25%, 10/15/2020 | | | | 195,000 | | | | 204,750 | |
| 7.5%, 4/1/2021 | | | | 195,000 | | | | 204,750 | |
| 8.5%, 11/1/2019 | | | | 100,000 | | | | 107,750 | |
| Intelsat Luxembourg SA: | |
| 144A, 7.75%, 6/1/2021 | | | | 95,000 | | | | 95,950 | |
| 144A, 8.125%, 6/1/2023 | | | | 10,000 | | | | 10,325 | |
| | | Principal Amount ($)(a) | | | Value ($) | |
| | | | | | | | | |
| Level 3 Communications, Inc., 8.875%, 6/1/2019 | | | | 10,000 | | | | 10,400 | |
| Level 3 Financing, Inc.: | |
| 7.0%, 6/1/2020 | | | | 75,000 | | | | 74,812 | |
| 8.125%, 7/1/2019 | | | | 75,000 | | | | 78,750 | |
| 8.625%, 7/15/2020 | | | | 50,000 | | | | 53,250 | |
| MetroPCS Wireless, Inc.: | |
| 6.625%, 11/15/2020 | | | | 65,000 | | | | 67,437 | |
| 144A, 6.625%, 4/1/2023 | | | | 35,000 | | | | 35,613 | |
| 7.875%, 9/1/2018 | | | | 75,000 | | | | 79,875 | |
| Millicom International Cellular SA, 144A, 4.75%, 5/22/2020 | | | | 200,000 | | | | 190,052 | |
| NII Capital Corp., 7.625%, 4/1/2021 | | | | 50,000 | | | | 38,875 | |
| SBA Communications Corp., 144A, 5.625%, 10/1/2019 | | | | 30,000 | | | | 29,700 | |
| SBA Telecommunications, Inc., 8.25%, 8/15/2019 | | | | 16,000 | | | | 17,320 | |
| Sprint Nextel Corp.: | |
| 6.0%, 12/1/2016 | | | | 320,000 | | | | 337,600 | |
| 6.0%, 11/15/2022 | | | | 50,000 | | | | 49,000 | |
| 8.375%, 8/15/2017 | | | | 55,000 | | | | 61,737 | |
| 9.125%, 3/1/2017 | | | | 50,000 | | | | 57,500 | |
| Syniverse Holdings, Inc., 9.125%, 1/15/2019 | | | | 25,000 | | | | 26,688 | |
| Telefonica Emisiones SAU, 4.57%, 4/27/2023 | | | | 170,000 | | | | 162,741 | |
| Telemar Norte Leste SA, 144A, 5.5%, 10/23/2020 | | | | 200,000 | | | | 186,000 | |
| Telemovil Finance Co., Ltd., 144A, 8.0%, 10/1/2017 | | | | 100,000 | | | | 105,750 | |
| tw telecom holdings, Inc., 5.375%, 10/1/2022 | | | | 35,000 | | | | 34,738 | |
| Wind Acquisition Finance SA, 144A, 6.5%, 4/30/2020 | | | | 30,000 | | | | 29,775 | |
| Windstream Corp.: | |
| 6.375%, 8/1/2023 | | | | 40,000 | | | | 37,400 | |
| 7.0%, 3/15/2019 | | | | 60,000 | | | | 60,150 | |
| 7.5%, 6/1/2022 | | | | 25,000 | | | | 25,500 | |
| 7.5%, 4/1/2023 | | | | 75,000 | | | | 76,125 | |
| 7.75%, 10/15/2020 (b) | | | | 35,000 | | | | 36,225 | |
| 7.875%, 11/1/2017 | | | | 205,000 | | | | 224,987 | |
| 8.125%, 9/1/2018 | | | | 70,000 | | | | 74,550 | |
| | | | | 5,258,224 | |
| Utilities 2.7% | |
| AES Corp.: | |
| 4.875%, 5/15/2023 (b) | | | | 15,000 | | | | 13,987 | |
| 8.0%, 10/15/2017 | | | | 10,000 | | | | 11,250 | |
| 8.0%, 6/1/2020 | | | | 175,000 | | | | 199,500 | |
| American Electric Power Co., Inc., Series F, 2.95%, 12/15/2022 | | | | 140,000 | | | | 130,325 | |
| Calpine Corp.: | |
| 144A, 7.5%, 2/15/2021 | | | | 72,000 | | | | 76,860 | |
| 144A, 7.875%, 7/31/2020 | | | | 79,000 | | | | 85,715 | |
| Electricite de France SA, 144A, 5.25%, 1/29/2049 | | | | 100,000 | | | | 95,600 | |
| Energy Future Holdings Corp., Series Q, 6.5%, 11/15/2024 | | | | 100,000 | | | | 68,500 | |
| Instituto Costarricense de Electricidad, 144A, 6.95%, 11/10/2021 | | | | 200,000 | | | | 210,500 | |
| IPALCO Enterprises, Inc., 5.0%, 5/1/2018 | | | | 145,000 | | | | 149,350 | |
| | | Principal Amount ($)(a) | | | Value ($) | |
| | | | | | | | | |
| Mexico Generadora de Energia S de rl, 144A, 5.5%, 12/6/2032 | | | | 200,000 | | | | 188,000 | |
| NRG Energy, Inc., 7.625%, 1/15/2018 | | | | 35,000 | | | | 37,450 | |
| Oncor Electric Delivery Co., LLC, 4.1%, 6/1/2022 | | | | 160,000 | | | | 165,084 | |
| PPL Energy Supply LLC, 4.6%, 12/15/2021 | | | | 200,000 | | | | 203,525 | |
| Toledo Edison Co., 7.25%, 5/1/2020 | | | | 203,000 | | | | 251,270 | |
| | | | | 1,886,916 | |
Total Corporate Bonds (Cost $39,931,725) | | | | 39,699,052 | |
| | |
| Mortgage-Backed Securities Pass-Throughs 7.3% | |
| Federal National Mortgage Association, 3.5%, 1/1/2042 (c) | | | 1,000,000 | | | | 1,015,625 | |
| Government National Mortgage Association: | |
| 3.0%, 10/1/2042 (c) | | | | 1,000,000 | | | | 989,375 | |
| 4.0%, 3/1/2041 (c) | | | | 3,000,000 | | | | 3,152,109 | |
Total Mortgage-Backed Securities Pass-Throughs (Cost $5,412,617) | | | | 5,157,109 | |
| | |
| Asset-Backed 0.9% | |
| Home Equity Loans 0.5% | |
| CIT Group Home Equity Loan Trust, "AF6", Series 2002-1, 6.2%, 2/25/2030 | | | 64,977 | | | | 64,783 | |
| Citifinancial Mortgage Securities, Inc., "AFS", Series 2003-4, 5.326%, 10/25/2033 | | | 190,000 | | | | 198,407 | |
| Countrywide Home Equity Loan Trust, "2A", Series 2006-I, 0.333%**, 1/15/2037 | | | 134,403 | | | | 117,697 | |
| | | | | 380,887 | |
| Miscellaneous 0.4% | |
| ARES CLO Ltd., "D", Series 2012-3A, 144A, 4.958%, 1/17/2024 | | | 250,000 | | | | 249,611 | |
Total Asset-Backed (Cost $578,591) | | | | 630,498 | |
| | |
| Commercial Mortgage-Backed Securities 3.6% | |
| Banc of America Large Loan, Inc., "HLTN", Series 2010-HLTN, 144A, 2.493%**, 11/15/2015 | | | 536,232 | | | | 536,648 | |
| Commercial Mortgage Trust, "AM", Series 2007-GG11, 5.867%, 12/10/2049 | | | 290,000 | | | | 310,666 | |
| Del Coronado Trust, "M", Series 2013-HDMZ, 144A, 5.193%**, 3/15/2018 | | | 80,000 | | | | 80,416 | |
| JPMorgan Chase Commercial Mortgage Securities Corp.: | | | | | | | | |
| "C", Series 2012-HSBC, 144A, 4.021%, 7/5/2032 | | | | 150,000 | | | | 145,204 | |
| "A4", Series 2006-LDP7, 6.056%**, 4/15/2045 | | | | 140,000 | | | | 154,678 | |
| LB-UBS Commercial Mortgage Trust, "A3", Series 2006-C7, 5.347%, 11/15/2038 | | | 440,000 | | | | 486,614 | |
| | | Principal Amount ($)(a) | | | Value ($) | |
| | | | | | | | | |
| Wachovia Bank Commercial Mortgage Trust, "A4", Series 2005-C22, 5.465%**, 12/15/2044 | | | 140,000 | | | | 151,509 | |
| WF-RBS Commercial Mortgage Trust, "A5", Series 2013-C14, 3.337%, 6/15/2046 | | | 750,000 | | | | 715,028 | |
Total Commercial Mortgage-Backed Securities (Cost $2,527,509) | | | | 2,580,763 | |
| | |
| Collateralized Mortgage Obligations 3.5% | |
| Banc of America Mortgage Securities, "2A2", Series 2004-A, 2.958%**, 2/25/2034 | | | | 122,947 | | | | 120,392 | |
| Bear Stearns Adjustable Rate Mortgage Trust, "2A1", Series 2005-11, 3.335%**, 12/25/2035 | | | | 165,625 | | | | 163,856 | |
| Countrywide Home Loans, "2A5", Series 2004-13, 5.75%, 8/25/2034 | | | | 118,025 | | | | 119,792 | |
| Federal Home Loan Mortgage Corp.: | |
| "AI", Series 4016, Interest Only, 3.0%, 9/15/2025 | | | | 1,458,503 | | | | 105,029 | |
| "JI", Series 3558, Interest Only, 4.5%, 12/15/2023 | | | | 80,296 | | | | 3,869 | |
| "PI", Series 3843, Interest Only, 4.5%, 5/15/2038 | | | | 513,223 | | | | 62,630 | |
| "HI", Series 2934, Interest Only, 5.0%, 2/15/2020 | | | | 159,677 | | | | 16,674 | |
| "WI", Series 3010, Interest Only, 5.0%, 7/15/2020 | | | | 262,391 | | | | 28,610 | |
| "JS", Series 3572, Interest Only, 6.608%***, 9/15/2039 | | | | 887,444 | | | | 137,524 | |
| Federal National Mortgage Association: | | |
| "BI", Series 2010-13, Interest Only, 5.0%, 12/25/2038 | | | | 147,624 | | | | 12,223 | |
| "SK", Series 2011-78, Interest Only, 5.807%***, 8/25/2041 | | | | 1,866,319 | | | | 231,204 | |
| "PI", Series 2006-20, Interest Only, 6.487%***, 11/25/2030 | | | | 511,611 | | | | 92,642 | |
| "SI", Series 2007-23, Interest Only, 6.577%***, 3/25/2037 | | | | 380,087 | | | | 67,217 | |
| "JS", Series 2004-59, Interest Only, 6.907%***, 4/25/2023 | | | | 45,220 | | | | 457 | |
| Government National Mortgage Association: | | |
| "GP", Series 2010-67, 4.5%, 3/20/2039 | | | | 250,000 | | | | 271,399 | |
| "MI", Series 2009-76, Interest Only, 5.0%, 3/20/2035 | | | | 278,777 | | | | 9,705 | |
| "ID", Series 2003-79, Interest Only, 5.5%, 12/20/2031 | | | | 8,753 | | | | 37 | |
| "IV", Series 2009-69, Interest Only, 5.5%, 8/20/2039 | | | | 567,912 | | | | 92,510 | |
| "IN", Series 2009-69, Interest Only, 5.5%, 8/20/2039 | | | | 574,961 | | | | 92,253 | |
| | | Principal Amount ($)(a) | | | Value ($) | |
| | | | | | | | | |
| "IJ", Series 2009-75, Interest Only, 6.0%, 8/16/2039 | | | | 525,104 | | | | 96,869 | |
| "AI", Series 2007-38, Interest Only, 6.268%***, 6/16/2037 | | | | 144,427 | | | | 19,582 | |
| JPMorgan Mortgage Trust, "2A1", Series 2006-A2, 2.725%**, 4/25/2036 | | | | 351,134 | | | | 305,683 | |
| Merrill Lynch Mortgage Investors Trust, "2A", Series 2003-A6, 3.132%**, 10/25/2033 | | | 96,360 | | | | 97,044 | |
| Morgan Stanley Mortgage Loan Trust, "5A5", Series 2005-4, 5.5%, 8/25/2035 | | | 38,862 | | | | 38,712 | |
| Washington Mutual Mortgage Pass-Through Certificates Trust, "1A1", Series 2005-AR12, 2.444%**, 10/25/2035 | | | 5,722 | | | | 5,725 | |
| Wells Fargo Mortgage-Backed Securities Trust: | | | | | | | | |
| "2A3",Series 2004-EE, 2.624%**, 12/25/2034 | | | | 149,972 | | | | 147,498 | |
| "B1", Series 2004-1, 5.5%, 2/25/2034 | | | | 173,123 | | | | 172,785 | |
Total Collateralized Mortgage Obligations (Cost $2,556,368) | | | | 2,511,921 | |
| | |
| Government & Agency Obligations 16.8% | |
| Other Government Related (d) 4.3% | |
| European Investment Bank: | |
| 144A, 4.6%, 1/30/2037 | CAD | | | 1,000,000 | | | | 972,625 | |
| 6.0%, 8/6/2020 | AUD | | | 500,000 | | | | 485,883 | |
| KFW, 1.875%, 6/13/2018 | CAD | | | 605,000 | | | | 563,017 | |
| Queensland Treasury Corp., Series 23, 4.25%, 7/21/2023 | AUD | | | 1,180,000 | | | | 1,031,788 | |
| | | | | 3,053,313 | |
| Sovereign Bonds 4.4% | |
| Federative Republic of Brazil, 12.5%, 1/5/2016 | BRL | | | 250,000 | | | | 119,322 | |
| Government of Canada, 0.75%, 5/1/2014 | CAD | | | 1,400,000 | | | | 1,327,105 | |
| Government of Japan, Series 144, 1.5%, 3/20/2033 | JPY | | | 66,000,000 | | | | 644,201 | |
| Government of Ukraine, 144A, 6.58%, 11/21/2016 | | | | 250,000 | | | | 231,875 | |
| Republic of Argentina-Inflation Linked Bond, 5.83%, 12/31/2033 | ARS | | | 375 | | | | 87 | |
| Republic of Belarus, REG S, 8.75%, 8/3/2015 | | | | 145,000 | | | | 145,363 | |
| Russian Federation: | |
| Series 6204, 7.5%, 3/15/2018 | RUB | | | 2,000,000 | | | | 62,775 | |
| Series 6207, 8.15%, 2/3/2027 | RUB | | | 6,000,000 | | | | 187,544 | |
| Slovenia Government International Bond, 144A, 4.75%, 5/10/2018 | | | | 200,000 | | | | 190,000 | |
| United Mexican States: | |
| Series M, 7.75%, 5/29/2031 | MXN | | | 1,640,000 | | | | 139,876 | |
| Series M 20, 8.5%, 5/31/2029 | MXN | | | 820,000 | | | | 75,433 | |
| | | | | 3,123,581 | |
| | | Principal Amount ($)(a) | | | Value ($) | |
| | | | | | | | | |
| U.S. Government Sponsored Agencies 0.8% | |
| Federal Home Loan Mortgage Corp., 2.375%, 1/13/2022 | | | 220,000 | | | | 212,898 | |
| Federal National Mortgage Association, 0.875%, 5/21/2018 | | | 390,000 | | | | 377,646 | |
| | | | | 590,544 | |
| U.S. Treasury Obligations 7.3% | |
| U.S. Treasury Bills, 0.1%****, 9/5/2013 (e) | | | | 463,000 | | | | 462,983 | |
| U.S. Treasury Bonds: | |
| 3.0%, 5/15/2042 | | | | 600,000 | | | | 546,937 | |
| 4.75%, 2/15/2037 | | | | 400,000 | | | | 493,500 | |
| U.S. Treasury Notes: | |
| 0.75%, 6/15/2014 | | | | 500,000 | | | | 502,637 | |
| 1.5%, 7/31/2016 | | | | 2,625,000 | | | | 2,687,549 | |
| 1.625%, 11/15/2022 | | | | 400,000 | | | | 373,406 | |
| 1.75%, 5/15/2023 | | | | 98,000 | | | | 91,783 | |
| | | | | 5,158,795 | |
Total Government & Agency Obligations (Cost $12,700,997) | | | | 11,926,233 | |
| | |
| Loan Participations and Assignments 7.0% | |
| Senior Loans** 4.3% | |
| Buffalo Gulf Coast Terminals LLC, Term Loan, 5.25%, 10/31/2017 | | | 74,438 | | | | 75,554 | |
| Buffets, Inc., Letter of Credit, First Lien, LIBOR plus 9.25%, 4/22/2015* | | | 9,378 | | | | 4,384 | |
| Burger King Corp., Term Loan B, 3.75%, 9/27/2019 | | | 69,475 | | | | 70,008 | |
| Calpine Corp., Term Loan B1, 4.0%, 4/2/2018 | | | 194,503 | | | | 194,555 | |
| Charter Communications Operating LLC, Term Loan E, 3.0%, 4/10/2020 | | | 195,000 | | | | 193,050 | |
| Chesapeake Energy Corp., Term Loan, 5.75%, 12/1/2017 | | | 75,000 | | | | 76,078 | |
| Crown Castle International Corp., Term Loan, 3.25%, 1/31/2019 | | | 49,499 | | | | 49,257 | |
| Cumulus Media Holdings, Inc., Second Lien Term Loan, 7.5%, 9/16/2019 | | | 50,000 | | | | 51,187 | |
| Goodyear Tire & Rubber Co., Second Lien Term Loan, 4.75%, 4/30/2019 | | | 220,000 | | | | 221,042 | |
| HJ Heinz Co., Term Loan B2, 3.5%, 6/5/2020 | | | 250,000 | | | | 250,270 | |
| Kabel Deutschland GmbH, Term Loan F1, 3.25%, 2/1/2019 | | | 385,000 | | | | 384,673 | |
| MacDermid, Inc., First Lien Term Loan, 4.0%, 6/7/2020 | | | 55,000 | | | | 54,794 | |
| MEG Energy Corp., Term Loan, 3.75%, 3/31/2020 | | | 259,671 | | | | 259,866 | |
| NRG Energy, Inc., Term Loan B, 2.75%, 7/2/2018 | | | 119,095 | | | | 118,140 | |
| Par Pharmaceutical Companies, Inc., Term Loan B, 4.25%, 9/30/2019 | | | 119,102 | | | | 118,521 | |
| Pilot Travel Centers LLC: | |
| Term Loan B, 3.75%, 3/30/2018 | | | 90,284 | | | | 89,127 | |
| Term Loan B2, 4.25%, 8/7/2019 | | | 337,450 | | | | 333,760 | |
| Tomkins LLC, First Lien Term Loan, 5.0%, 11/9/2018 | | | 64,675 | | | | 65,160 | |
| | | Principal Amount ($)(a) | | | Value ($) | |
| | | | | | | | | |
| Samson Investment Co., Second Lien Term Loan, 6.0%, 9/25/2018 | | | 175,000 | | | | 175,000 | |
| Tallgrass Operations LLC, Term Loan, 5.25%, 11/13/2018 | | | 110,261 | | | | 111,019 | |
| Travelport LLC, Second Lien Term Loan, 9.5%, 1/29/2016 | | | 5,040 | | | | 5,179 | |
| Univision Communications, Inc., Term Loan, 4.5%, 3/2/2020 | | | 59,809 | | | | 59,361 | |
| Warner Chilcott Co., LLC, Term Loan B2, 4.25%, 3/15/2018 | | | 3,845 | | | | 3,855 | |
| Warner Chilcott Corp.: | |
| Incremental Term Loan B1, 4.25%, 3/15/2018 | | | 12,447 | | | | 12,477 | |
| Term Loan B1, 4.25%, 3/15/2018 | | | 28,594 | | | | 28,662 | |
| WC Luxco S.a.r.l., Term Loan B3, 4.25%, 3/15/2018 | | | 22,532 | | | | 22,586 | |
| WP Prism, Inc., Term Loan, 6.25%, 5/31/2018 | | | 35,000 | | | | 35,117 | |
| | | | | 3,062,682 | |
| Sovereign Loans 2.7% | |
| Bank of Moscow, 144A, 6.699%, 3/11/2015 | | | 250,000 | | | | 263,112 | |
| Gazprom Neft OAO, 144A, 4.375%, 9/19/2022 | | | 250,000 | | | | 228,963 | |
| Gazprom OAO, 144A, 9.25%, 4/23/2019 | | | 100,000 | | | | 120,500 | |
| National JSC Naftogaz of Ukraine, 9.5%, 9/30/2014 | | | 250,000 | | | | 249,375 | |
| RZD Capital PLC, 5.739%, 4/3/2017 | | | 250,000 | | | | 265,000 | |
| TMK OAO, 144A, 6.75%, 4/3/2020 | | | 200,000 | | | | 185,500 | |
| Uralkali OJSC, 144A, 3.723%, 4/30/2018 (b) | | | 200,000 | | | | 192,250 | |
| Vimpel Communications, 144A, 9.125%, 4/30/2018 | | | 200,000 | | | | 227,500 | |
| VTB Bank OJSC, 144A, 6.0%, 4/12/2017 | | | 200,000 | | | | 208,000 | |
| | | | | 1,940,200 | |
Total Loan Participations and Assignments (Cost $5,052,744) | | | | 5,002,882 | |
| | |
| Municipal Bonds and Notes 1.3% | |
| Chicago, IL, Airport Revenue, O'Hare International Airport, Series B, 6.0%, 1/1/2041 | | | 145,000 | | | | 163,089 | |
| Massachusetts, State School Building Authority, Sales Tax Revenue, Qualified School Construction Bond, Series A, 4.885%, 7/15/2028 | | | 300,000 | | | | 317,751 | |
| Orlando & Orange County, FL, Expressway Authority Revenue, Series C, 5.0%, 7/1/2040 | | | 145,000 | | | | 150,375 | |
| Port Authority of New York & New Jersey, 4.926%, 10/1/2051 | | | 260,000 | | | | 260,606 | |
Total Municipal Bonds and Notes (Cost $851,179) | | | | 891,821 | |
| | |
| Convertible Bonds 0.4% | |
| Consumer Discretionary 0.2% | |
| Group 1 Automotive, Inc., 3.0%, 3/15/2020 | | | 65,000 | | | | 117,731 | |
| | | Principal Amount ($)(a) | | | Value ($) | |
| | | | | | | | | |
| Materials 0.2% | |
| GEO Specialty Chemicals, Inc., 144A, 7.5%, 3/31/2015 | | | 120,175 | | | | 186,127 | |
Total Convertible Bonds (Cost $183,237) | | | | 303,858 | |
| | |
| Preferred Security 0.1% | |
| Materials | |
| Hercules, Inc., 6.5%, 6/30/2029 (Cost $58,834) | | | 95,000 | | | | 82,650 | |
| | | Units | | | Value ($) | |
| | | | |
| Other Investments 0.1% | |
| Consumer Discretionary | |
| AOT Bedding Super Holdings LLC* (f) (Cost $4,000) | | | 10 | | | | 34,776 | |
| | | Shares | | | Value ($) | |
| | | | |
| Common Stocks 0.0% | |
| Consumer Discretionary 0.0% | |
| Buffets Restaurants Holdings, Inc.* | | | 84 | | | | 525 | |
| Trump Entertainment Resorts, Inc.* | | | 6 | | | | 0 | |
| Vertis Holdings, Inc.* | | | 63 | | | | 0 | |
| | | | | | | | 525 | |
| Industrials 0.0% | |
| Congoleum Corp.* | | | 2,500 | | | | 0 | |
| Materials 0.0% | |
| GEO Specialty Chemicals, Inc.* | | | 2,058 | | | | 1,224 | |
| Wolverine Tube, Inc.* | | | 778 | | | | 14,097 | |
| | | | | | | | 15,321 | |
Total Common Stocks (Cost $40,747) | | | | 15,846 | |
| | |
| Preferred Stock 0.1% | |
| Financials | |
| Ally Financial, Inc., 144A, 7.0% (Cost $56,382) | | | 60 | | | | 57,032 | |
| | |
| Warrants 0.0% | |
| Consumer Discretionary 0.0% | |
| Reader's Digest Association, Inc., Expiration Date 2/19/2014* | | | 159 | | | | 0 | |
| Materials 0.0% | |
| GEO Specialty Chemicals, Inc., Expiration Date 3/31/2015* | | | 11,138 | | | | 6,539 | |
| Hercules Trust II, Expiration Date 3/31/2029* | | | 85 | | | | 1,125 | |
| | | | | | | | 7,664 | |
Total Warrants (Cost $17,432) | | | | 7,664 | |
| | |
| | | Shares | | | Value ($) | |
| | | | | | | | | |
| Exchange-Traded Fund 1.0% | |
| SPDR Barclays Capital Convertible Securities (Cost $759,882) | | | 17,300 | | | | 738,364 | |
| | | Contracts | | | Value ($) | |
| | | | |
| Call Options Purchased 0.6% | |
| Options on Exchange-Traded Futures Contracts 0.0% | |
| 10 Year U.S. Treasury Note Future, Expiration Date 8/23/2013, Strike Price $132.5 | | | 100 | | | | 4,687 | |
| | | Contract Amount | | | Value ($) | |
| | | | |
| Options on Interest Rate Swap Contracts 0.6% | |
Pay Fixed Rate — 3.583% - Receive Floating — LIBOR, Swap Expiration Date 5/11/2026, Option Expiration Date 5/9/20161 | | | 1,400,000 | | | | 88,550 | |
Pay Fixed Rate — 3.635% - Receive Floating — LIBOR, Swap Expiration Date 4/27/2026, Option Expiration Date 4/25/20162 | | | 1,300,000 | | | | 78,563 | |
Pay Fixed Rate — 3.72% - Receive Floating — LIBOR, Swap Expiration Date 4/22/2026, Option Expiration Date 4/20/20163 | | | 1,300,000 | | | | 73,784 | |
Pay Fixed Rate — 4.19% - Receive Floating — LIBOR, Swap Expiration Date 2/3/2027, Option Expiration Date 2/1/20174 | | | 1,500,000 | | | | 77,864 | |
Pay Fixed Rate — 4.32% - Receive Floating — LIBOR, Swap Expiration Date 2/3/2027, Option Expiration Date 2/1/20175 | | | 1,400,000 | | | | 66,926 | |
| | | | | | | | 385,687 | |
Total Call Options Purchased (Cost $362,335) | | | | 390,374 | |
| | |
| Put Options Purchased 0.0% | |
| Options on Interest Rate Swap Contracts | |
Receive Fixed Rate — 2.19% - Pay Floating — LIBOR, Swap Expiration Date 2/3/2027, Option Expiration Date 2/1/20174 | | | 1,500,000 | | | | 15,577 | |
Receive Fixed Rate — 2.32% - Pay Floating — LIBOR, Swap Expiration Date 2/3/2027, Option Expiration Date 2/1/20175 | | | 1,400,000 | | | | 17,172 | |
Total Put Options Purchased (Cost $98,573) | | | | 32,749 | |
| | | Shares | | | Value ($) | |
| | | | |
| Securities Lending Collateral 2.4% | |
| Daily Assets Fund Institutional, 0.10% (g) (h) (Cost $1,669,599) | | | 1,669,599 | | | | 1,669,599 | |
| | |
| | | Shares | | | Value ($) | |
| | | | | | | | | |
| Cash Equivalents 9.1% | |
| Central Cash Management Fund, 0.07% (g) (Cost $6,422,777) | | | 6,422,777 | | | | 6,422,777 | |
| | | % of Net Assets | | | Value ($) | |
| | | | |
Total Investment Portfolio (Cost $79,285,528)† | | | 110.1 | | | | 78,155,968 | |
| Other Assets and Liabilities, Net (b) | | | (10.1 | ) | | | (7,158,430 | ) |
| Net Assets | | | 100.0 | | | | 70,997,538 | |
The following table represents bonds and senior loans that are in default:
| Securities | | Coupon | | Maturity Date | Principal Amount | | | Cost ($) | | | Value ($) | |
| Buffets, Inc.* | | LIBOR plus 9.25% | | 4/22/2015 | USD | | | 9,378 | | | | 9,121 | | | | 4,384 | |
| ERC Ireland Preferred Equity Ltd.* | | | 7.69 | % | 2/15/2017 | EUR | | | 88,319 | | | | 120,275 | | | | 0 | |
| Fontainebleau Las Vegas Holdings LLC* | | | 11.0 | % | 6/15/2015 | USD | | | 65,000 | | | | 65,000 | | | | 0 | |
| Hellas Telecommunications Finance SCA* | | | 8.21 | % | 7/15/2015 | EUR | | | 109,187 | | | | 32,169 | | | | 0 | |
| | | | | | | | | | | | | | 226,565 | | | | 4,384 | |
* Non-income producing security.
** Floating rate securities' yields vary with a designated market index or market rate, such as the coupon-equivalent of the U.S. Treasury Bill rate. These securities are shown at their current rate as of June 30, 2013.
*** These securities are shown at their current rate as of June 30, 2013.
****Annualized yield at time of purchase; not a coupon rate.
† The cost for federal income tax purposes was $79,285,568. At June 30, 2013, net unrealized depreciation for all securities based on tax cost was $1,129,600. This consisted of aggregate gross unrealized appreciation for all securities in which there was an excess of value over tax cost of $1,867,153 and aggregate gross unrealized depreciation for all securities in which there was an excess of tax cost over value of $2,996,753.
(a) Principal amount stated in U.S. dollars unless otherwise noted.
(b) All or a portion of these securities were on loan amounting to $1,469,520. In addition, included in other assets and liabilities, net is a pending sale, amounting to $111,394, that is also on loan (see Notes to Financial Statements). The value of all securities loaned at June 30, 2013 amounted to $1,580,914, which is 2.2% of net assets.
(c) When-issued or delayed delivery security included.
(d) Government-backed debt issued by financial companies or government-sponsored enterprises.
(e) At June 30, 2013, this security has been pledged, in whole or in part, to cover initial margin requirements for open futures contracts.
(f) The Fund may purchase securities that are subject to legal or contractual restrictions on resale ("restricted securities"). Restricted securities are securities which have not been registered with the Securities and Exchange Commission under the Securities Act of 1933. The Fund may be unable to sell a restricted security and it may be more difficult to determine a market value for a restricted security. Moreover, if adverse market conditions were to develop during the period between the Fund's decision to sell a restricted security and the point at which the Fund is permitted or able to sell such security, the Fund might obtain a price less favorable than the price that prevailed when it decided to sell. This investment practice, therefore, could have the effect of increasing the level of illiquidity of the Fund. The future value of these securities is uncertain and there may be changes in the estimated value of these securities.
| Schedule of Restricted Securities | Acquisition Date | | Cost ($) | | | Value ($) | | | Value as % of Net Assets | |
| AOT Bedding Super Holdings LLC* | June 2010 | | | 4,000 | | | | 34,776 | | | | .05 | |
(g) Affiliated fund managed by Deutsche Investment Management Americas Inc. The rate shown is the annualized seven-day yield at period end.
(h) Represents collateral held in connection with securities lending. Income earned by the Fund is net of borrower rebates.
144A: Security exempt from registration under Rule 144A of the Securities Act of 1933. These securities may be resold in transactions exempt from registration, normally to qualified institutional buyers.
CLO: Collateralized Loan Obligation
Interest Only: Interest Only (IO) bonds represent the "interest only" portion of payments on a pool of underlying mortgages or mortgage-backed securities. IO securities are subject to prepayment risk of the pool of underlying mortgages.
LIBOR: London Interbank Offered Rate
PIK: Denotes that all or a portion of the income is paid in-kind in the form of additional principal.
REG S: Securities sold under Regulation S may not be offered, sold or delivered within the United States or to, or for the account or benefit of, U.S. persons, except pursuant to an exemption from, or in a transaction not subject to, the registration requirements of the Securities Act of 1933.
REIT: Real Estate Investment Trust
SPDR: Standard & Poor's Depositary Receipt
The Fund can invest in certain Senior Loan agreements that include the obligation to make additional loans in certain circumstances. The Fund reserves against such contingent obligations by segregating cash, liquid securities and liquid Senior Loans. At June 30, 2013, the Fund had an unfunded loan commitment of $50,000, which could be extended at the option of the borrower, pursuant to the following loan agreement:
| Borrower | | Unfunded Loan Commitment ($) | | | Value ($) | | | Unrealized Appreciation/ (Depreciation) ($) | |
| Tallgrass Operations LLC, Term Delay Draw, 11/13/2017 | | | 50,000 | | | | 50,000 | | | | — | |
At June 30, 2013, open futures contracts purchased were as follows:
| Futures | Currency | Expiration Date | | Contracts | | | Notional Value ($) | | | Unrealized Appreciation/ (Depreciation) ($) | |
| 10 Year Canadian Government Bond | CAD | 9/19/2013 | | | 15 | | | | 1,874,251 | | | | (75,535 | ) |
| 10 Year U.S. Treasury Note | USD | 9/19/2013 | | | 9 | | | | 1,139,063 | | | | 6,932 | |
| Federal Republic of Germany Euro-Bund | EUR | 9/6/2013 | | | 10 | | | | 1,842,094 | | | | (36,334 | ) |
| Total net unrealized depreciation | | | | (104,937 | ) |
At June 30, 2013, open futures contracts sold were as follows:
| Futures | Currency | Expiration Date | | Contracts | | | Notional Value ($) | | | Unrealized Appreciation/ (Depreciation) ($) | |
| 10 Year U.S. Treasury Note | USD | 9/19/2013 | | | 1 | | | | 126,563 | | | | 3,392 | |
| 5 Year U.S. Treasury Note | USD | 9/30/2013 | | | 20 | | | | 2,420,938 | | | | 39,959 | |
| Ultra Long U.S. Treasury Bond | USD | 9/19/2013 | | | 3 | | | | 441,938 | | | | (7,373 | ) |
| Total net unrealized appreciation | | | | 35,978 | |
At June 30, 2013, open written options contracts were as follows:
| Options on Exchange-Traded Futures Contracts | | Contracts | | Expiration Date | | Strike Price ($) | | | Premiums Received ($) | | | Value ($) (i) | |
Put Options 10 Year U.S. Treasury Note Future | | | 60 | | 8/23/2013 | | | 130.0 | | | | 50,475 | | | | (217,500 | ) |
(i) Unrealized depreciation on written options on exchange-traded futures contracts at June 30, 2013 was $167,025.
| Options on Interest Rate Swap Contracts | Swap Effective/ Expiration Date | | Contract Amount | | Option Expiration Date | | Premiums Received ($) | | | Value ($) (j) | |
Call Options Receive Fixed — 3.19% - Pay Floating — LIBOR | 2/3/2017 2/3/2027 | | | 700,000 | 4 | 2/1/2017 | | | 50,400 | | | | (65,697 | ) |
| Receive Fixed — 3.32% - Pay Floating — LIBOR | 2/3/2017 2/3/2027 | | | 700,000 | 5 | 2/1/2017 | | | 50,631 | | | | (61,145 | ) |
| Receive Fixed — 4.083% - Pay Floating — LIBOR | 5/11/2016 5/11/2026 | | | 1,400,000 | 1 | 5/9/2016 | | | 47,600 | | | | (62,856 | ) |
| Receive Fixed — 4.135% - Pay Floating — LIBOR | 4/27/2016 4/27/2026 | | | 1,300,000 | 2 | 4/25/2016 | | | 48,100 | | | | (55,423 | ) |
| Receive Fixed — 4.22% - Pay Floating — LIBOR | 4/22/2016 4/22/2026 | | | 1,300,000 | 3 | 4/20/2016 | | | 46,345 | | | | (51,889 | ) |
| Total Call Options | | | 243,076 | | | | (297,010 | ) |
Put Options Pay Fixed — 3.19% - Receive Floating — LIBOR | 2/3/2017 2/3/2027 | | | 700,000 | 4 | 2/1/2017 | | | 50,400 | | | | (21,655 | ) |
| Pay Fixed — 3.32% - Receive Floating — LIBOR | 2/3/2017 2/3/2027 | | | 700,000 | 5 | 2/1/2017 | | | 50,631 | | | | (24,354 | ) |
| Total Put Options | | | 101,031 | | | | (46,009 | ) |
| Total | | | 344,107 | | | | (343,019 | ) |
(j) Unrealized appreciation on written options on interest rate swap contracts at June 30, 2013 was $1,088.
At June 30, 2013, open credit default swap contracts sold were as follows:
Effective/ Expiration Date | | Notional Amount ($) (k) | | | Fixed Cash Flows Received | | Underlying Debt Obligation/Quality Rating (l) | | Value ($) | | | Upfront Payments Paid/ (Received) ($) | | | Unrealized Appreciation ($) | |
6/21/2010 9/20/2013 | | | 70,000 | 2 | | | 5.0 | % | Ford Motor Co., 6.5%, 8/1/2018, BBB- | | | 904 | | | | 858 | | | | 46 | |
6/21/2010 9/20/2015 | | | 90,000 | 1 | | | 5.0 | % | Ford Motor Co., 6.5%, 8/1/2018, BBB- | | | 8,621 | | | | (1,604 | ) | | | 10,225 | |
3/21/2011 6/20/2016 | | | 120,000 | 4 | | | 5.0 | % | HCA, Inc., 6.375%, 1/15/2015, B- | | | 11,653 | | | | 2,670 | | | | 8,983 | |
12/20/2011 3/20/2017 | | | 60,000 | 6 | | | 5.0 | % | CIT Group, Inc., 5.5%, 2/15/2019, BB- | | | 7,484 | | | | 1,882 | | | | 5,602 | |
9/20/2012 12/20/2017 | | | 75,000 | 7 | | | 5.0 | % | General Motors Corp., 3.3%, 12/20/2017, BB+ | | | 9,327 | | | | 4,986 | | | | 4,341 | |
| Total unrealized appreciation | | | | 29,197 | |
(k) The maximum potential amount of future undiscounted payments that the Fund could be required to make under a credit default swap contract would be the notional amount of the contract. These potential amounts would be partially offset by any recovery values of the referenced debt obligation or net amounts received from the settlement of buy protection credit default swap contracts entered into by the Fund for the same referenced debt obligation, if any.
(l) The quality ratings represent the higher of Moody's Investors Service, Inc. ("Moody's") or Standard & Poor's Corporation ("S&P") credit ratings and are unaudited.
At June 30, 2013, open interest rate swap contracts were as follows:
| Effective/ Expiration Date | | Notional Amount ($) | | Cash Flows Paid by the Fund | Cash Flows Received by the Fund | | Value ($) | | | Upfront Payments Paid/ (Received) ($) | | | Unrealized Appreciation/ (Depreciation) ($) | |
7/16/2013 7/16/2014 | | | 1,800,000 | 3 | Floating — LIBOR | Fixed — 0.515% | | | 2,672 | | | | (49 | ) | | | 2,721 | |
4/13/2012 4/13/2016 | | | 1,500,000 | 5 | Floating — LIBOR | Fixed — 1.22% | | | 23,138 | | | | — | | | | 23,138 | |
7/16/2013 7/16/2018 | | | 800,000 | 3 | Floating — LIBOR | Fixed — 1.148% | | | (16,921 | ) | | | (149 | ) | | | (16,772 | ) |
7/16/2013 7/16/2043 | | | 400,000 | 3 | Fixed — 2.424% | Floating — LIBOR | | | 78,489 | | | | (264 | ) | | | 78,753 | |
| Total net unrealized appreciation | | | | 87,840 | |
Counterparties:
1 Bank of America
2 Citigroup, Inc.
3 Nomura International PLC
4 JPMorgan Chase Securities, Inc.
5 BNP Paribas
6 Credit Suisse
7 UBS AG
At June 30, 2013, the Fund had the following open forward foreign currency exchange contracts:
| Contracts to Deliver | | In Exchange For | | Settlement Date | | Unrealized Appreciation ($) | | Counterparty |
| USD | | | 6,112 | | NOK | | | 37,258 | | 7/5/2013 | | | 21 | | Citigroup, Inc. |
| AUD | | | 400,000 | | USD | | | 416,737 | | 7/5/2013 | | | 50,998 | | Nomura International PLC |
| NOK | �� | | 6,897,969 | | EUR | | | 900,000 | | 7/5/2013 | | | 36,024 | | Citigroup, Inc. |
| GBP | | | 600,000 | | USD | | | 915,844 | | 7/5/2013 | | | 3,292 | | JPMorgan Chase Securities, Inc. |
| AUD | | | 550,000 | | USD | | | 566,751 | | 7/9/2013 | | | 64,008 | | Nomura International PLC |
| CAD | | | 1,500,000 | | USD | | | 1,464,325 | | 7/9/2013 | | | 38,298 | | JPMorgan Chase Securities, Inc. |
| JPY | | | 50,000,000 | | USD | | | 514,510 | | 7/10/2013 | | | 10,361 | | Nomura International PLC |
| EUR | | | 400,000 | | USD | | | 529,828 | | 7/11/2013 | | | 9,150 | | JPMorgan Chase Securities, Inc. |
| GBP | | | 400,000 | | USD | | | 622,038 | | 7/11/2013 | | | 13,696 | | BNP Paribas |
| SGD | | | 1,200,000 | | USD | | | 964,406 | | 7/11/2013 | | | 17,643 | | JPMorgan Chase Securities, Inc. |
| EUR | | | 400,000 | | USD | | | 530,739 | | 7/11/2013 | | | 10,061 | | Barclays Bank PLC |
| AUD | | | 1,000,000 | | NZD | | | 1,193,440 | | 7/12/2013 | | | 10,315 | | Citigroup, Inc. |
| CZK | | | 10,700,000 | | USD | | | 549,338 | | 7/12/2013 | | | 13,934 | | Bank of America |
| CZK | | | 10,600,000 | | USD | | | 548,778 | | 7/12/2013 | | | 18,378 | | BNP Paribas |
| USD | | | 554,715 | | ZAR | | | 5,500,000 | | 7/15/2013 | | | 629 | | Barclays Bank PLC |
| NZD | | | 700,000 | | USD | | | 557,877 | | 7/15/2013 | | | 15,917 | | Citigroup, Inc. |
| JPY | | | 40,000,000 | | USD | | | 409,271 | | 7/16/2013 | | | 5,943 | | Bank of America |
| JPY | | | 40,000,000 | | USD | | | 403,434 | | 7/16/2013 | | | 106 | | Nomura International PLC |
| EUR | | | 500,000 | | USD | | | 666,156 | | 7/17/2013 | | | 15,292 | | Nomura International PLC |
| GBP | | | 500,000 | | USD | | | 783,592 | | 7/17/2013 | | | 23,195 | | JPMorgan Chase Securities, Inc. |
| EUR | | | 53,420 | | USD | | | 71,213 | | 7/19/2013 | | | 1,673 | | Citigroup, Inc. |
| JPY | | | 50,000,000 | | USD | | | 507,389 | | 7/24/2013 | | | 3,214 | | Barclays Bank PLC |
| USD | | | 359,940 | | ZAR | | | 3,700,000 | | 7/25/2013 | | | 13,113 | | Barclays Bank PLC |
| USD | | | 546,437 | | AUD | | | 600,000 | | 7/26/2013 | | | 1,326 | | JPMorgan Chase Securities, Inc. |
| CAD | | | 600,000 | | USD | | | 570,406 | | 7/26/2013 | | | 224 | | Nomura International PLC |
| AUD | | | 600,000 | | USD | | | 554,356 | | 7/26/2013 | | | 6,593 | | BNP Paribas |
| AUD | | | 800,000 | | USD | | | 797,233 | | 7/31/2013 | | | 67,150 | | BNP Paribas |
| AUD | | | 384,230 | | USD | | | 373,090 | | 7/31/2013 | | | 22,440 | | JPMorgan Chase Securities, Inc. |
| CAD | | | 474,672 | | USD | | | 459,888 | | 7/31/2013 | | | 8,859 | | Nomura International PLC |
| CAD | | | 700,000 | | USD | | | 685,248 | | 7/31/2013 | | | 20,114 | | JPMorgan Chase Securities, Inc. |
| JPY | | | 20,000,000 | | USD | | | 204,765 | | 8/1/2013 | | | 3,089 | | Nomura International PLC |
| USD | | | 704,979 | | JPY | | | 70,000,000 | | 8/2/2013 | | | 890 | | JPMorgan Chase Securities, Inc. |
| Total unrealized appreciation | | | | | 505,946 | |
| Contracts to Deliver | | In Exchange For | | Settlement Date | | Unrealized Depreciation ($) | | Counterparty |
| USD | | | 418,500 | | AUD | | | 400,000 | | 7/5/2013 | | | (52,761 | ) | Barclays Bank PLC |
| EUR | | | 900,000 | | NOK | | | 6,860,711 | | 7/5/2013 | | | (42,158 | ) | UBS AG |
| USD | | | 606,394 | | JPY | | | 60,000,000 | | 7/5/2013 | | | (1,427 | ) | Nomura International PLC |
| USD | | | 934,281 | | GBP | | | 600,000 | | 7/5/2013 | | | (21,730 | ) | BNP Paribas |
| JPY | | | 60,000,000 | | USD | | | 598,871 | | 7/5/2013 | | | (6,096 | ) | Nomura International PLC |
| EUR | | | 750,000 | | USD | | | 975,089 | | 7/9/2013 | | | (1,176 | ) | Nomura International PLC |
| USD | | | 517,253 | | JPY | | | 50,000,000 | | 7/10/2013 | | | (13,104 | ) | Barclays Bank PLC |
| USD | | | 622,176 | | GBP | | | 400,000 | | 7/11/2013 | | | (13,833 | ) | Barclays Bank PLC |
| USD | | | 954,483 | | SGD | | | 1,200,000 | | 7/11/2013 | | | (7,720 | ) | Nomura International PLC |
| USD | | | 1,064,816 | | EUR | | | 800,000 | | 7/11/2013 | | | (23,459 | ) | Barclays Bank PLC |
| USD | | | 5,807 | | NZD | | | 7,496 | | 7/12/2013 | | | (2 | ) | Barclays Bank PLC |
| NZD | | | 722,701 | | AUD | | | 600,000 | | 7/12/2013 | | | (11,329 | ) | Nomura International PLC |
| NZD | | | 478,235 | | AUD | | | 400,000 | | 7/12/2013 | | | (4,791 | ) | BNP Paribas |
| USD | | | 1,111,047 | | CZK | | | 21,300,000 | | 7/12/2013 | | | (45,243 | ) | Barclays Bank PLC |
| USD | | | 365,646 | | INR | | | 21,500,000 | | 7/15/2013 | | | (4,686 | ) | Citigroup, Inc. |
| USD | | | 563,105 | | NZD | | | 700,000 | | 7/15/2013 | | | (21,145 | ) | JPMorgan Chase Securities, Inc. |
| ZAR | | | 5,500,000 | | USD | | | 548,549 | | 7/15/2013 | | | (6,794 | ) | UBS AG |
| INR | | | 21,500,000 | | USD | | | 353,154 | | 7/15/2013 | | | (7,806 | ) | Citigroup, Inc. |
| USD | | | 806,926 | | JPY | | | 80,000,000 | | 7/16/2013 | | | (269 | ) | Nomura International PLC |
| USD | | | 786,250 | | GBP | | | 500,000 | | 7/17/2013 | | | (25,853 | ) | UBS AG |
| USD | | | 661,154 | | EUR | | | 500,000 | | 7/17/2013 | | | (10,290 | ) | Nomura International PLC |
| USD | | | 546,922 | | ZAR | | | 5,400,000 | | 7/19/2013 | | | (1,992 | ) | JPMorgan Chase Securities, Inc. |
| ZAR | | | 5,400,000 | | USD | | | 540,997 | | 7/19/2013 | | | (3,933 | ) | JPMorgan Chase Securities, Inc. |
| NOK | | | 3,175,719 | | EUR | | | 400,000 | | 7/24/2013 | | | (1,712 | ) | BNP Paribas |
| USD | | | 511,669 | | JPY | | | 50,000,000 | | 7/24/2013 | | | (7,494 | ) | Nomura International PLC |
| ZAR | | | 3,700,000 | | USD | | | 365,576 | | 7/25/2013 | | | (7,477 | ) | Citigroup, Inc. |
| TWD | | | 16,000,000 | | USD | | | 532,269 | | 7/29/2013 | | | (1,689 | ) | JPMorgan Chase Securities, Inc. |
| JPY | | | 66,316,538 | | USD | | | 667,690 | | 7/31/2013 | | | (1,031 | ) | Nomura International PLC |
| USD | | | 555,146 | | ZAR | | | 5,500,000 | | 8/1/2013 | | | (1,172 | ) | Citigroup, Inc. |
| USD | | | 201,918 | | JPY | | | 20,000,000 | | 8/1/2013 | | | (242 | ) | UBS AG |
| ZAR | | | 5,500,000 | | USD | | | 549,940 | | 8/1/2013 | | | (4,035 | ) | Citigroup, Inc. |
| USD | | | 1,272,516 | | MXN | | | 16,450,000 | | 8/19/2013 | | | (8,368 | ) | JPMorgan Chase Securities, Inc. |
| Total unrealized depreciation | | | | | (360,817 | ) |
| Currency Abbreviations |
ARS Argentine Peso AUD Australian Dollar BRL Brazilian Real CAD Canadian Dollar CZK Czech Koruna EUR Euro GBP British Pound INR Indian Rupee JPY Japanese Yen MXN Mexican Peso NOK Norwegian Krone NZD New Zealand Dollar RUB Russian Ruble SGD Singapore Dollar TWD Taiwan Dollar USD United States Dollar ZAR South African Rand |
For information on the Fund's policy and additional disclosures regarding options purchased, futures contracts, credit default swap contracts, interest rate swap contracts, forward foreign currency exchange contracts and written option contracts, please refer to Note B in the accompanying Notes to Financial Statements.
Fair Value Measurements
Various inputs are used in determining the value of the Fund's investments. These inputs are summarized in three broad levels. Level 1 includes quoted prices in active markets for identical securities. Level 2 includes other significant observable inputs (including quoted prices for similar securities, interest rates, prepayment speeds, and credit risk). Level 3 includes significant unobservable inputs (including the Fund's own assumptions in determining the fair value of investments). The inputs or methodology used for valuing securities are not necessarily an indication of the risk associated with investing in those securities.
The following is a summary of the inputs used as of June 30, 2013 in valuing the Fund's investments. For information on the Fund's policy regarding the valuation of investments, please refer to the Security Valuation section of Note A in the accompanying Notes to Financial Statements.
| Assets | | Level 1 | | | Level 2 | | | Level 3 | | | Total | |
| | |
| Fixed Income Investments (m) | |
| Corporate Bonds | | $ | — | | | $ | 39,699,052 | | | $ | 0 | | | $ | 39,699,052 | |
| Mortgage-Backed Securities Pass-Throughs | | | — | | | | 5,157,109 | | | | — | | | | 5,157,109 | |
| Asset-Backed | | | — | | | | 630,498 | | | | — | | | | 630,498 | |
| Commercial Mortgage-Backed Securities | | | — | | | | 2,580,763 | | | | — | | | | 2,580,763 | |
| Collateralized Mortgage Obligations | | | — | | | | 2,511,921 | | | | — | | | | 2,511,921 | |
| Government & Agency Obligations | | | — | | | | 11,926,233 | | | | — | | | | 11,926,233 | |
| Loan Participations and Assignments | | | — | | | | 5,002,882 | | | | — | | | | 5,002,882 | |
| Municipal Bonds and Notes | | | — | | | | 891,821 | | | | — | | | | 891,821 | |
| Convertible Bonds | | | — | | | | 117,731 | | | | 186,127 | | | | 303,858 | |
| Preferred Security | | | — | | | | 82,650 | | | | — | | | | 82,650 | |
| Other Investments | | | — | | | | — | | | | 34,776 | | | | 34,776 | |
| Common Stocks (m) | | | — | | | | 525 | | | | 15,321 | | | | 15,846 | |
| Preferred Stock | | | — | | | | 57,032 | | | | — | | | | 57,032 | |
| Warrants (m) | | | — | | | | — | | | | 7,664 | | | | 7,664 | |
| Exchange-Traded Fund | | | 738,364 | | | | — | | | | — | | | | 738,364 | |
| Short-Term Investments (m) | | | 8,092,376 | | | | — | | | | — | | | | 8,092,376 | |
Derivatives (n) Purchased Options | | | 4,687 | | | | 418,436 | | | | — | | | | 423,123 | |
| Futures Contracts | | | 50,283 | | | | — | | | | — | | | | 50,283 | |
| Credit Default Swap Contracts | | | — | | | | 29,197 | | | | — | | | | 29,197 | |
| Interest Rate Swap Contracts | | | — | | | | 104,612 | | | | — | | | | 104,612 | |
| Forward Foreign Currency Exchange Contracts | | | — | | | | 505,946 | | | | — | | | | 505,946 | |
| Total | | $ | 8,885,710 | | | $ | 69,716,408 | | | $ | 243,888 | | | $ | 78,846,006 | |
| Liabilities | |
Derivatives (n) Written Options | | $ | (217,500 | ) | | $ | (343,019 | ) | | $ | — | | | $ | (560,519 | ) |
| Futures Contracts | | | (119,242 | ) | | | — | | | | — | | | | (119,242 | ) |
| Interest Rate Swap Contracts | | | — | | | | (16,772 | ) | | | — | | | | (16,772 | ) |
| Forward Foreign Currency Exchange Contracts | | | — | | | | (360,817 | ) | | | — | | | | (360,817 | ) |
| Total | | $ | (336,742 | ) | | $ | (720,608 | ) | | $ | — | | | $ | (1,057,350 | ) |
During the period ended June 30, 2013, the amount of transfers between Level 2 and Level 3 was $41. Investments were transferred from Level 2 to Level 3 because of the lack of observable market data due to a decrease in market activity.
Transfers between price levels are recognized at the beginning of the reporting period.
(m) See Investment Portfolio for additional detailed categorizations.
(n) Derivatives include value of options purchased, written options, at value, and unrealized appreciation (depreciation) on futures contracts, credit default swap contracts, interest rate swap contracts and forward foreign currency exchange contracts.
The accompanying notes are an integral part of the financial statements.
Statement of Assets and Liabilities | as of June 30, 2013 (Unaudited) | |
| Assets | |
Investments: Investments in non-affiliated securities, at value (cost $71,193,152) — including $1,469,520 of securities loaned | | $ | 70,063,592 | |
| Investment in Daily Assets Fund Institutional (cost $1,669,599)* | | | 1,669,599 | |
| Investment in Central Cash Management Fund (cost $6,422,777) | | | 6,422,777 | |
| Total investments in securities, at value (cost $79,285,528) | | | 78,155,968 | |
| Cash | | | 27,691 | |
| Foreign currency, at value (cost $809,270) | | | 807,321 | |
| Receivable for investments sold | | | 233,081 | |
| Receivable for investments sold — when-issued/delayed delivery securitites | | | 6,963,862 | |
| Receivable for Fund shares sold | | | 6,734 | |
| Interest receivable | | | 891,597 | |
| Receivable for variation margin on futures contracts | | | 13,707 | |
| Unrealized appreciation on swap contracts | | | 133,809 | |
| Unrealized appreciation on forward foreign currency exchange contracts | | | 505,946 | |
| Upfront payments paid on swap contracts | | | 10,396 | |
| Other assets | | | 853 | |
| Total assets | | $ | 87,750,965 | |
| Liabilities | |
| Payable upon return of securities loaned | | | 1,669,599 | |
| Payable for investments purchased | | | 1,502,444 | |
| Payable for investments purchased — when-issued/delayed delivery securities | | | 12,506,590 | |
| Payable for Fund shares redeemed | | | 39,940 | |
| Options written, at value (premiums received $394,582) | | | 560,519 | |
| Unrealized depreciation on swap contracts | | | 16,772 | |
| Unrealized depreciation on forward foreign currency exchange contracts | | | 360,817 | |
| Upfront payments received on swap contracts | | | 2,066 | |
| Accrued management fee | | | 19,213 | |
| Accrued Trustees' fees | | | 26 | |
| Other accrued expenses and payables | | | 75,441 | |
| Total liabilities | | | 16,753,427 | |
| Net assets, at value | | $ | 70,997,538 | |
| Net Assets Consist of | |
| Undistributed net investment income | | | 1,395,283 | |
Net unrealized appreciation (depreciation) on: Investments | | | (1,129,560 | ) |
| Swap contracts | | | 117,037 | |
| Futures | | | (68,959 | ) |
| Foreign currency | | | 150,285 | |
| Written options | | | (165,937 | ) |
| Accumulated net realized gain (loss) | | | (146,603 | ) |
| Paid-in-capital | | | 70,845,992 | |
| Net assets, at value | | $ | 70,997,538 | |
Class A Net Asset Value, offering and redemption price per share ($70,997,538 ÷ 6,339,378 outstanding shares of beneficial interest, no par value, unlimited number of shares authorized) | | $ | 11.20 | |
* Represents collateral on securities loaned.
The accompanying notes are an integral part of the financial statements.
| for the six months ended June 30, 2013 (Unaudited) | |
| Investment Income | |
Income: Interest (net of foreign taxes withheld of $282) | | $ | 1,761,886 | |
| Dividends | | | 4,262 | |
| Income distributions — Central Cash Management Fund | | | 3,355 | |
| Securities lending income, including income from Daily Assets Fund Institutional, net of borrower rebates | | | 2,359 | |
| Total income | | | 1,771,862 | |
Expenses: Management fee | | | 202,215 | |
| Administration fee | | | 36,766 | |
| Services to shareholders | | | 435 | |
| Custodian fee | | | 39,684 | |
| Audit and tax fees | | | 32,640 | |
| Legal fees | | | 5,489 | |
| Reports to shareholders | | | 14,512 | |
| Trustees' fees and expenses | | | 2,202 | |
| Other | | | 28,121 | |
| Total expenses before expense reductions | | | 362,064 | |
| Expense reductions | | | (93,210 | ) |
| Total expenses after expense reductions | | | 268,854 | |
| Net investment income (loss) | | | 1,503,008 | |
| Realized and Unrealized Gain (Loss) | |
Net realized gain (loss) from: Investments | | | 340,287 | |
| Swap contracts | | | 94,770 | |
| Futures | | | (431,068 | ) |
| Written options | | | 66,626 | |
| Foreign currency | | | (165,640 | ) |
| | | | (95,025 | ) |
Change in net unrealized appreciation (depreciation) on: Investments | | | (4,018,924 | ) |
| Swap contracts | | | (39,202 | ) |
| Unfunded loan commitment | | | (118 | ) |
| Futures | | | (36,998 | ) |
| Written options | | | (306,116 | ) |
| Foreign currency | | | 145,058 | |
| | | | (4,256,300 | ) |
| Net gain (loss) | | | (4,351,325 | ) |
| Net increase (decrease) in net assets resulting from operations | | $ | (2,848,317 | ) |
The accompanying notes are an integral part of the financial statements.
Statement of Changes in Net Assets | Increase (Decrease) in Net Assets | | Six Months Ended June 30, 2013 (Unaudited) | | | Year Ended December 31, 2012 | |
Operations: Net investment income | | $ | 1,503,008 | | | $ | 3,374,357 | |
| Net realized gain (loss) | | | (95,025 | ) | | | 2,896,387 | |
| Change in net unrealized appreciation (depreciation) | | | (4,256,300 | ) | | | 2,483,404 | |
| Net increase (decrease) in net assets resulting from operations | | | (2,848,317 | ) | | | 8,754,148 | |
Distributions to shareholders from: Net investment income: Class A | | | (3,703,120 | ) | | | (4,311,037 | ) |
Net realized gains: Class A | | | (2,113,421 | ) | | | (143,246 | ) |
| Total distributions | | | (5,816,541 | ) | | | (4,454,283 | ) |
Fund share transactions: Class A Proceeds from shares sold | | | 7,166,035 | | | | 8,860,430 | |
| Reinvestment of distributions | | | 5,816,541 | | | | 4,454,283 | |
| Payments for shares redeemed | | | (6,820,159 | ) | | | (13,217,365 | ) |
| Net increase (decrease) in net assets from Class A share transactions | | | 6,162,417 | | | | 97,348 | |
| Increase (decrease) in net assets | | | (2,502,441 | ) | | | 4,397,213 | |
| Net assets at beginning of period | | | 73,499,979 | | | | 69,102,766 | |
| Net assets at end of period (including undistributed net investment income of $1,395,283 and $3,595,395, respectively) | | $ | 70,997,538 | | | $ | 73,499,979 | |
| Other Information | |
Class A Shares outstanding at beginning of period | | | 5,832,490 | | | | 5,808,640 | |
| Shares sold | | | 573,094 | | | | 731,149 | |
| Shares issued to shareholders in reinvestment of distributions | | | 491,677 | | | | 381,360 | |
| Shares redeemed | | | (557,883 | ) | | | (1,088,659 | ) |
| Net increase (decrease) in Class A shares | | | 506,888 | | | | 23,850 | |
| Shares outstanding at end of period | | | 6,339,378 | | | | 5,832,490 | |
The accompanying notes are an integral part of the financial statements.
| | | | | | Years Ended December 31, | |
| Class A | | Six Months Ended 6/30/13 (Unaudited) | | | 2012 | | | 2011 | | | 2010 | | | 2009 | | | 2008 | |
| Selected Per Share Data | |
| Net asset value, beginning of period | | $ | 12.60 | | | $ | 11.90 | | | $ | 11.96 | | | $ | 11.61 | | | $ | 10.03 | | | $ | 11.70 | |
Income (loss) from investment operations: Net investment incomea | | | .25 | | | | .57 | | | | .63 | | | | .66 | | | | .63 | | | | .55 | |
| Net realized and unrealized gain (loss) | | | (.68 | ) | | | .92 | | | | (.01 | ) | | | .47 | | | | 1.50 | | | | (1.38 | ) |
| Total from investment operations | | | (.43 | ) | | | 1.49 | | | | .62 | | | | 1.13 | | | | 2.13 | | | | (.83 | ) |
Less distributions from: Net investment income | | | (.62 | ) | | | (.76 | ) | | | (.68 | ) | | | (.78 | ) | | | (.55 | ) | | | (.69 | ) |
| Net realized gains | | | (.35 | ) | | | (.03 | ) | | | — | | | | — | | | | — | | | | (.15 | ) |
| Total distributions | | | (.97 | ) | | | (.79 | ) | | | (.68 | ) | | | (.78 | ) | | | (.55 | ) | | | (.84 | ) |
| Net asset value, end of period | | $ | 11.20 | | | $ | 12.60 | | | $ | 11.90 | | | $ | 11.96 | | | $ | 11.61 | | | $ | 10.03 | |
Total Return (%)b | | | (3.88 | )** | | | 13.08 | | | | 5.31 | | | | 10.05 | | | | 22.73 | | | | (7.75 | ) |
| Ratios to Average Net Assets and Supplemental Data | |
| Net assets, end of period ($ millions) | | | 71 | | | | 73 | | | | 69 | | | | 76 | | | | 74 | | | | 73 | |
| Ratio of expenses before expense reductions (%) | | | .98 | * | | | .99 | | | | .99 | | | | .95 | | | | .86 | | | | .89 | |
| Ratio of expenses after expense reductions (%) | | | .73 | * | | | .77 | | | | .79 | | | | .86 | | | | .80 | | | | .87 | |
| Ratio of net investment income (%) | | | 4.09 | * | | | 4.72 | | | | 5.38 | | | | 5.62 | | | | 5.96 | | | | 5.06 | |
| Portfolio turnover rate (%) | | | 82 | ** | | | 164 | | | | 144 | | | | 167 | | | | 370 | | | | 234 | |
a Based on average shares outstanding during the period. b Total return would have been lower had certain expenses not been reduced. * Annualized ** Not annualized | |
Notes to Financial Statements (Unaudited)
A. Organization and Significant Accounting Policies
DWS Unconstrained Income VIP (the "Fund") is a diversified series of DWS Variable Series II (the "Trust"), which is registered under the Investment Company Act of 1940, as amended (the "1940 Act"), as an open-end management investment company organized as a Massachusetts business trust.
The Fund's financial statements are prepared in accordance with accounting principles generally accepted in the United States of America which require the use of management estimates. Actual results could differ from those estimates. The policies described below are followed consistently by the Fund in the preparation of its financial statements.
Security Valuation. Investments are stated at value determined as of the close of regular trading on the New York Stock Exchange on each day the exchange is open for trading.
Various inputs are used in determining the value of the Fund's investments. These inputs are summarized in three broad levels. Level 1 includes quoted prices in active markets for identical securities. Level 2 includes other significant observable inputs (including quoted prices for similar securities, interest rates, prepayment speeds, and credit risk). Level 3 includes significant unobservable inputs (including the Fund's own assumptions in determining the fair value of investments). The inputs or methodology used for valuing securities are not necessarily an indication of the risk associated with investing in those securities.
Debt securities and loan participations and assignments are valued at prices supplied by independent pricing services approved by the Fund's Board. If the pricing services are unable to provide valuations, debt securities are valued at the most recent bid quotation or evaluated price and loan participations and assignments are valued at the mean of the most recent bid and ask quotations, as applicable, obtained from one or more broker-dealers. Such services may use various pricing techniques which take into account appropriate factors such as yield, quality, coupon rate, maturity, type of issue, trading characteristics and other data, as well as broker quotes. These securities are generally categorized as Level 2.
Equity securities and exchange-traded funds ("ETFs") are valued at the most recent sale price or official closing price reported on the exchange (U.S. or foreign) or over-the-counter market on which they trade and are categorized as Level 1 securities. Securities or ETFs for which no sales are reported are valued at the calculated mean between the most recent bid and asked quotations on the relevant market or, if a mean cannot be determined, at the most recent bid quotation.
Money market instruments purchased with an original or remaining maturity of sixty days or less, maturing at par, are valued at amortized cost, which approximates value, and are categorized as Level 2. Investments in open-end investment companies are valued at their net asset value each business day and are categorized as Level 1.
Futures contracts are generally valued at the settlement prices established each day on the exchange on which they are traded and are categorized as Level 1.
Forward currency contracts are valued at the prevailing forward exchange rate of the underlying currencies and are categorized as Level 2.
Swap contracts are valued daily based upon prices supplied by a Board approved pricing vendor, if available, and otherwise are valued at the price provided by the broker-dealer. Swap contracts are generally categorized as Level 2.
Exchange-traded options are valued at the last sale price or, in the absence of a sale, the mean between the closing bid and asked prices or at the most recent asked price (bid for purchased options) if no bid or asked price are available. Exchange-traded options are categorized as Level 1. Over-the-counter written or purchased options are valued at prices supplied by a Board approved pricing vendor, if available, and otherwise are valued at the price provided by the broker-dealer with which the option was traded. Over-the-counter written or purchased options are generally categorized as Level 2.
Securities and other assets for which market quotations are not readily available or for which the above valuation procedures are deemed not to reflect fair value are valued in a manner that is intended to reflect their fair value as determined in accordance with procedures approved by the Board and are generally categorized as Level 3. In accordance with the Fund's valuation procedures, factors used in determining value may include, but are not limited to, the type of the security; the size of the holding; the initial cost of the security; the existence of any contractual restrictions on the security's disposition; the price and extent of public trading in similar securities of the issuer or of comparable companies; quotations or evaluated prices from broker-dealers and/or pricing services; information obtained from the issuer, analysts, and/or the appropriate stock exchange (for exchange-traded securities); an analysis of the company's or issuer's financial statements; an evaluation of the forces that influence the issuer and the market(s) in which the security is purchased and sold and with respect to debt securities; the maturity, coupon, creditworthiness, currency denomination and the movement of the market in which the security is normally traded. The value determined under these procedures may differ from published values for the same securities.
Disclosure about the classification of fair value measurements is included in a table following the Fund's Investment Portfolio.
Foreign Currency Translations. The books and records of the Fund are maintained in U.S. dollars. Investment securities and other assets and liabilities denominated in a foreign currency are translated into U.S. dollars at the prevailing exchange rates at period end. Purchases and sales of investment securities, income and expenses are translated into U.S. dollars at the prevailing exchange rates on the respective dates of the transactions.
Net realized and unrealized gains and losses on foreign currency transactions represent net gains and losses between trade and settlement dates on securities transactions, the acquisition and disposition of foreign currencies, and the difference between the amount of net investment income accrued and the U.S. dollar amount actually received. That portion of both realized and unrealized gains and losses on investments that results from fluctuations in foreign currency exchange rates is not separately disclosed but is included with net realized and unrealized gain/appreciation and loss/depreciation on investments.
Securities Lending. Deutsche Bank AG, as lending agent, lends securities of the Fund to certain financial institutions under the terms of the Security Lending Agreement. The Fund retains the benefits of owning the securities it has loaned and continues to receive interest and dividends generated by the securities and to participate in any changes in their market value. The Fund requires the borrowers of the securities to maintain collateral with the Fund consisting of either cash or liquid, unencumbered assets having a value at least equal to the value of the securities loaned. When the collateral falls below specified amounts, the lending agent will use its best effort to obtain additional collateral on the next business day to meet required amounts under the security lending agreement. The Fund may invest the cash collateral into a joint trading account in an affiliated money market fund pursuant to Exemptive Orders issued by the SEC. The Fund receives compensation for lending its securities either in the form of fees or by earning interest on invested cash collateral net of borrower rebates and fees paid to a lending agent. Either the Fund or the borrower may terminate the loan. There may be risks of delay and costs in recovery of securities or even loss of rights in the collateral should the borrower of the securities fail financially. If the Fund is not able to recover securities lent, the Fund may sell the collateral and purchase a replacement investment in the market, incurring the risk that the value of the replacement security is greater than the value of the collateral. The Fund is also subject to all investment risks associated with the reinvestment of any cash collateral received, including, but not limited to, interest rate, credit and liquidity risk associated with such investments.
As of June 30, 2013, the Fund had securities on loan with a gross value of $1,580,914. The value of the related collateral, $1,669,599, exceeded the value of the securities loaned at period end.
Loan Participations and Assignments. Loan participations and assignments are portions of loans originated by banks and sold in pieces to investors. These U.S. dollar-denominated fixed and floating rate loans ("Loans") in which the Fund invests, are arranged between the borrower and one or more financial institutions ("Lenders"). These Loans may take the form of Senior Loans, which are corporate obligations often issued in connection with recapitalizations, acquisitions, leveraged buy-outs and refinancings, and Sovereign Loans, which are debt instruments between a foreign sovereign entity and one or more financial institutions. The Fund invests in such Loans in the form of participations in Loans ("Participations") or assignments of all or a portion of Loans from third parties ("Assignments"). Participations typically result in the Fund having a contractual relationship only with the Lender, not with the borrower. The Fund has the right to receive payments of principal, interest and any fees to which it is entitled from the Lender selling the Participation and only upon receipt by the Lender of the payments from the borrower. In connection with purchasing Participations, the Fund generally has no right to enforce compliance by the borrower with the terms of the loan agreement relating to the Loan, or any rights of set-off against the borrower, and the Fund will not benefit directly from any collateral supporting the Loan in which it has purchased the Participation. As a result, the Fund assumes the credit risk of both the borrower and the Lender that is selling the Participation. Assignments typically result in the Fund having a direct contractual relationship with the borrower, and the Fund may enforce compliance by the borrower with the terms of the loan agreement. Loans held by the Fund are generally in the form of Assignments, but the Fund may also invest in Participations. All Loan Participations and Assignments involve interest rate risk, liquidity risk and credit risk, including the potential default or insolvency of the borrower.
When-Issued/Delayed Delivery Securities. The Fund may purchase or sell securities with delivery or payment to occur at a later date beyond the normal settlement period. At the time the Fund enters into a commitment to purchase or sell a security, the transaction is recorded and the value of the transaction is reflected in the net asset value. The price of such security and the date when the security will be delivered and paid for are fixed at the time the transaction is negotiated. The value of the security may vary with market fluctuations. At the time the Fund enters into this type of transaction, it is required to segregate cash or other liquid assets at least equal to the amount of the commitment.
Certain risks may arise upon entering into when-issued or delayed delivery transactions from the potential inability of counterparties to meet the terms of their contracts or if the issuer does not issue the securities due to political, economic, or other factors. Additionally, losses may arise due to changes in the value of the underlying securities.
Taxes. The Fund's policy is to comply with the requirements of the Internal Revenue Code, as amended, which are applicable to regulated investment companies and to distribute all of its taxable income to its shareholders.
Additionally, the Fund may be subject to taxes imposed by the governments of countries in which it invests and are generally based on income and/or capital gains earned or repatriated. Estimated tax liabilities on certain foreign securities are recorded on an accrual basis and are reflected as components of interest income or net change in unrealized gain/loss on investments. Tax liabilities realized as a result of security sales are reflected as a component of net realized gain/loss on investments.
The Fund has reviewed the tax positions for the open tax years as of December 31, 2012 and has determined that no provision for income tax is required in the Fund's financial statements. The Fund's federal tax returns for the prior three fiscal years remain open subject to examination by the Internal Revenue Service.
Distribution of Income and Gains. Distributions from net investment income of the Fund, if any, are declared and distributed to shareholders annually. Net realized gains from investment transactions, in excess of available capital loss carryforwards, would be taxable to the Fund if not distributed and, therefore, will be distributed to shareholders at least annually. The Fund may also make additional distributions for tax purposes if necessary.
The timing and characterization of certain income and capital gain distributions are determined annually in accordance with federal tax regulations which may differ from accounting principles generally accepted in the United States of America. These differences primarily relate to investments in foreign denominated investments, forward currency contracts, futures contracts, swap contracts and certain securities sold at a loss. As a result, net investment income (loss) and net realized gain (loss) on investment transactions for a reporting period may differ significantly from distributions during such period. Accordingly, the Fund may periodically make reclassifications among certain of its capital accounts without impacting the net asset value of the Fund.
The tax character of current year distributions will be determined at the end of the current fiscal year.
Expenses. Expenses of the Trust arising in connection with a specific fund are allocated to that fund. Other Trust expenses which cannot be directly attributed to a fund are apportioned among the funds in the Trust based upon the relative net assets or other appropriate measures.
Contingencies. In the normal course of business, the Fund may enter into contracts with service providers that contain general indemnification clauses. The Fund's maximum exposure under these arrangements is unknown, as this would involve future claims that may be made against the Fund that have not yet been made. However, based on experience, the Fund expects the risk of loss to be remote.
Other. Investment transactions are accounted for on a trade date plus one basis for daily net asset value calculations. However, for financial reporting purposes, investment transactions are reported on trade date. Interest income is recorded on the accrual basis. Dividend income is recorded on the ex-dividend date net of foreign withholding taxes. Realized gains and losses from investment transactions are recorded on an identified cost basis and may include proceeds from litigation. All discounts and premiums are accreted/amortized for both tax and financial reporting purposes for the Fund, with the exception of securities in default of principal.
B. Derivative Instruments
Interest Rate Swap Contracts. For the six months ended June 30, 2013, the Fund entered into interest rate swap transactions to gain exposure to different parts of the yield curve while managing overall duration. The value of the Fund's underlying bond investments is subject to interest rate risk. As interest rates increase, the value of the Fund's fixed rate bonds may fall. The longer the duration of the Fund's securities, the more sensitive the Fund will be to interest rate changes. To help mitigate this interest rate risk, the Fund invests in interest rate swap contracts to reduce the duration of the Investment Portfolio. The use of interest rate swaps is a highly specialized activity that involves investment techniques and risks different from those associated with ordinary portfolio security transactions. In an interest rate swap, the Fund agrees to pay to the other party to the interest rate swap (which is known as the "counterparty") a fixed rate payment in exchange for the counterparty agreeing to pay to the Fund a variable rate payment, or the Fund agrees to receive from the counterparty a fixed rate payment in exchange for the counterparty agreeing to receive from the Fund a variable rate payment. In addition, both the Fund and counterparty may agree to exchange variable rate payments based on different indices. The payment obligations are based on the notional amount of the swap. Certain risks may arise when entering into swap transactions including counterparty default, liquidity or unfavorable changes in interest rates. In connection with these agreements, securities and or cash may be identified as collateral in accordance with the terms of the swap agreements to provide assets of value and recourse in the event of default. The maximum counterparty credit risk is the net present value of the cash flows to be received from or paid to the counterparty over the term of the interest rate swap contract, to the extent that this amount is beneficial to the Fund, in addition to any related collateral posted to the counterparty by the Fund. This risk may be partially reduced by a master netting arrangement between the Fund and the counterparty. The value of the swap is adjusted daily and the change in value, if any, is recorded as unrealized appreciation or depreciation in the Statement of Assets and Liabilities. An upfront payment, if any, made by the Fund is recorded as an asset in the Statement of Assets and Liabilities. An upfront payment, if any, received by the Fund is recorded as a liability in the Statement of Assets and Liabilities. Payments received or made at the end of the measurement period are recorded as realized gain or loss in the Statement of Operations.
A summary of the open interest rate swap contracts as of June 30, 2013 is included in a table following the Fund's Investment Portfolio. For the six months ended June 30, 2013, the investment in interest rate swap contracts had a total notional amount of $4,500,000.
Credit Default Swap Contracts. A credit default swap is a contract between a buyer and a seller of protection against pre-defined credit events for the reference entity. The Fund may enter into credit default swap contracts to gain exposure to an underlying issuer's credit quality characteristics without directly investing in that issuer or to hedge against the risk of a credit event on debt securities. As a seller in the credit default swap contract, the Fund is required to pay the par (or other agreed-upon) value of the referenced entity to the counterparty with the occurrence of a credit event by a third party, such as a U.S. or foreign corporate issuer, on the reference entity, which would likely result in a loss to the Fund. In return, the Fund receives from the counterparty a periodic stream of payments over the term of the contract provided that no credit event has occurred. If no credit event occurs, the Fund keeps the stream of payments with no payment obligations. The Fund may also buy credit default swap contracts, in which case the Fund functions as the counterparty referenced above. This involves the risk that the contract may expire worthless. It also involves counterparty risk that the seller may fail to satisfy its payment obligations to the Fund with the occurrence of a credit event. When the Fund sells a credit default swap contract it will cover its commitment. This may be achieved by, among other methods, maintaining cash or liquid assets equal to the aggregate notional value of the reference entities for all outstanding credit default swap contracts sold by the Fund. For the six months ended June 30, 2013, the Fund entered into credit default swap contracts to gain exposure to the underlying issuer's credit quality characteristics.
The value of the credit default swap is adjusted daily and the change in value, if any, is recorded daily as unrealized appreciation or depreciation in the Statement of Assets and Liabilities. An upfront payment, if any, made by the Fund is recorded as an asset in the Statement of Assets and Liabilities. An upfront payment, if any, received by the Fund is recorded as a liability in the Statement of Assets and Liabilities. Under the terms of the credit default swap contracts, the Fund receives or makes quarterly payments based on a specified interest rate on a fixed notional amount. These payments are recorded as a realized gain or loss in the Statement of Operations. Payments received or made as a result of a credit event or termination of the contract are recognized, net of a proportional amount of the upfront payment, as realized gains or losses in the Statement of Operations.
A summary of the open credit default swap contracts as of June 30, 2013 is included in a table following the Fund's Investment Portfolio. For the six months ended June 30, 2013, the investment in credit default swap contracts sold had a total notional value generally indicative of a range from $415,000 to $2,195,000.
Options. An option contract is a contract in which the writer (seller) of the option grants the buyer of the option, upon payment of a premium, the right to purchase from (call option), or sell to (put option), the writer a designated instrument at a specified price within a specified period of time. Certain options, including options on indices, will require cash settlement by the Fund if the option is exercised. For the six months ended June 30, 2013, the Fund entered into options on interest rate futures and on interest rates swaps in order to hedge against potential adverse interest rate movements of portfolio assets.
If the Fund writes a covered call option, the Fund foregoes, in exchange for the premium, the opportunity to profit during the option period from an increase in the market value of the underlying security above the exercise price. If the Fund writes a put option it accepts the risk of a decline in the value of the underlying security below the exercise price. Over-the-counter options have the risk of the potential inability of counterparties to meet the terms of their contracts. The Fund's maximum exposure to purchased options is limited to the premium initially paid. In addition, certain risks may arise upon entering into option contracts including the risk that an illiquid secondary market will limit the Fund's ability to close out an option contract prior to the expiration date and that a change in the value of the option contract may not correlate exactly with changes in the value of the securities.
A summary of the open purchased option contracts as of June 30, 2013 is included in the Fund's Investment Portfolio. A summary of open written option contracts is included in a table following the Fund's Investment Portfolio. For the six months ended June 30, 2013, the investment in written option contracts had a total value generally indicative of a range from approximately $260,000 to $561,000, and purchased option contracts had a total value generally indicative of a range from approximately $284,000 to $423,000.
Futures Contracts. A futures contract is an agreement between a buyer or seller and an established futures exchange or its clearinghouse in which the buyer or seller agrees to take or make a delivery of a specific amount of a financial instrument at a specified price on a specific date (settlement date). For the six months ended June 30, 2013, the Fund entered into interest rate futures to gain exposure to different parts of the yield curve while managing overall duration and for non-hedging purposes to seek to enhance potential gains. In addition, the Fund seeks to enhance returns by employing a global tactical asset allocation overlay strategy. The Fund enters into futures contracts on global bonds, including indices, as part of its global tactical asset allocation overlay strategy. For the six months ended June 30, 2013, as part of this strategy, the Fund used futures contracts to attempt to take advantage of inefficiencies within the global bond markets.
Upon entering into a futures contract, the Fund is required to deposit with a financial intermediary cash or securities ("initial margin") in an amount equal to a certain percentage of the face value indicated in the futures contract. Subsequent payments ("variation margin") are made or received by the Fund dependent upon the daily fluctuations in the value and are recorded for financial reporting purposes as unrealized gains or losses by the Fund. Gains or losses are realized when the contract expires or is closed. Since all futures contracts are exchange-traded, counterparty risk is minimized as the exchange's clearinghouse acts as the counterparty, and guarantees the futures against default.
Certain risks may arise upon entering into futures contracts, including the risk that an illiquid market will limit the Fund's ability to close out a futures contract prior to the settlement date and the risk that the futures contract is not well correlated with the security, index or currency to which it relates. Risk of loss may exceed amounts disclosed in the Statement of Assets and Liabilities.
A summary of the open futures contracts as of June 30, 2013 is included in a table following the Fund's Investment Portfolio. For the six months ended June 30, 2013, the investment in futures contracts purchased had a total notional value generally indicative of a range from approximately $4,855,000 to $7,631,000, and the investment in futures contracts sold had a total notional value generally indicative of a range from approximately $2,488,000 to $28,086,000.
Forward Foreign Currency Exchange Contracts. A forward foreign currency exchange contract ("forward currency contract") is a commitment to purchase or sell a foreign currency at the settlement date at a negotiated rate. For the six months ended June 30, 2013, the Fund entered into forward currency contracts in order to hedge against anticipated currency market changes and for non-hedging purposes to seek to enhance potential gains. In addition, the Fund seeks to enhance returns by employing a global tactical asset allocation overlay strategy. For the six months ended June 30, 2013, as part of this strategy, the Fund used forward currency contracts to gain exposure to changes in the value of foreign currencies to attempt to take advantage of inefficiencies within the currency markets.
Forward currency contracts are valued at the prevailing forward exchange rate of the underlying currencies and unrealized gain (loss) is recorded daily. On the settlement date of the forward currency contract, the Fund records a realized gain or loss equal to the difference between the value of the contract at the time it was opened and the value of the contract at the time it was closed. Certain risks may arise upon entering into forward currency contracts from the potential inability of counterparties to meet the terms of their contracts. The maximum counterparty credit risk to the Fund is measured by the unrealized gain on appreciated contracts. Additionally, when utilizing forward currency contracts to hedge, the Fund gives up the opportunity to profit from favorable exchange rate movements during the term of the contract.
A summary of the open forward currency contracts as of June 30, 2013 is included in a table following the Fund's Investment Portfolio. For the six months ended June 30, 2013, the investment in forward currency contracts short vs. U.S. dollars had a total contract value generally indicative of a range from approximately $6,896,000 to $19,799,000, and the investment in forward currency contracts long vs. U.S. dollars had a total contract value generally indicative of a range from approximately $2,431,000 to $14,678,000. The investment in forward currency contracts long vs. other foreign currencies sold had a total contract value generally indicative of a range from $0 to approximately $4,795,000.
The following tables summarize the value of the Fund's derivative instruments held as of June 30, 2013 and the related location in the accompanying Statement of Assets and Liabilities, presented by primary underlying risk exposure:
| Asset Derivatives | | Purchased Options | | | Forward Contracts | | | Swap Contracts | | | Futures Contracts | | | Total | |
| Interest Rate Contracts (a) (b) | | $ | 423,123 | | | $ | — | | | $ | 104,612 | | | $ | 50,283 | | | $ | 578,018 | |
| Credit Contracts (b) | | | — | | | | — | | | | 29,197 | | | | — | | | | 29,197 | |
| Foreign Exchange Contracts (c) | | | — | | | | 505,946 | | | | — | | | | — | | | | 505,946 | |
| | | $ | 423,123 | | | $ | 505,946 | | | $ | 133,809 | | | $ | 50,283 | | | $ | 1,113,161 | |
Each of the above derivatives is located in the following Statement of Assets and Liabilities accounts:
(a) Includes cumulative appreciation of futures contracts as disclosed in the Investment Portfolio. Unsettled variation margin is disclosed separately within the Statement of Assets and Liabilities.
(b) Investments in securities, at value (includes purchased options) and unrealized appreciation on swap contracts, respectively
(c) Unrealized appreciation on forward foreign currency exchange contracts
| Liability Derivatives | | Written Options | | | Forward Contracts | | | Swap Contracts | | | Futures Contracts | | | Total | |
| Interest Rate Contracts (a) (b) | | $ | (560,519 | ) | | $ | — | | | $ | (16,772 | ) | | $ | (119,242 | ) | | $ | (696,533 | ) |
| Foreign Exchange Contracts (c) | | | — | | | | (360,817 | ) | | | — | | | | — | | | | (360,817 | ) |
| | | $ | (560,519 | ) | | $ | (360,817 | ) | | $ | (16,772 | ) | | $ | (119,242 | ) | | $ | (1,057,350 | ) |
Each of the above derivatives is located in the following Statement of Assets and Liabilities accounts:
(a) Includes cumulative depreciation of futures contracts as disclosed in the Investment Portfolio. Unsettled variation margin is disclosed separately within the Statement of Assets and Liabilities.
(b) Options written, at value and unrealized depreciation on swap contracts, respectively
(c) Unrealized depreciation on forward foreign currency exchange contracts
Additionally, the amount of unrealized and realized gains and losses on derivative instruments recognized in Fund earnings during the six months ended June 30, 2013 and the related location in the accompanying Statement of Operations is summarized in the following tables by primary underlying risk exposure:
| Realized Gain (Loss) | | Purchased Options | | | Written Options | | | Forward Contracts | | | Swap Contracts | | | Futures Contracts | | | Total | |
| Interest Rate Contracts (a) | | $ | (37,156 | ) | | $ | 66,626 | | | $ | — | | | $ | 6,704 | | | $ | (431,068 | ) | | $ | (394,894 | ) |
| Credit Contracts (a) | | | — | | | | — | | | | — | | | | 88,066 | | | | — | | | | 88,066 | |
| Foreign Exchange Contracts (b) | | | — | | | | — | | | | (153,136 | ) | | | — | | | | — | | | | (153,136 | ) |
| | | $ | (37,156 | ) | | $ | 66,626 | | | $ | (153,136 | ) | | $ | 94,770 | | | $ | (431,068 | ) | | $ | (459,964 | ) |
Each of the above derivatives is located in the following Statement of Operations accounts:
(a) Net realized gain (loss) from investments (includes purchased options), written options, swap contracts and futures, respectively
(b) Net realized gain (loss) from foreign currency (Statement of Operations includes both forward currency contracts and foreign currency transactions)
| Change in Net Unrealized Appreciation (Depreciation) | | Purchased Options | | | Written Options | | | Forward Contracts | | | Swap Contracts | | | Futures Contracts | | | Total | |
| Interest Rate Contracts (a) | | $ | 110,267 | | | $ | (306,116 | ) | | $ | — | | | $ | 8,353 | | | $ | (36,998 | ) | | $ | (224,494 | ) |
| Credit Contracts (a) | | | — | | | | — | | | | — | | | | (47,555 | ) | | | — | | | | (47,555 | ) |
| Foreign Exchange Contracts (b) | | | — | | | | — | | | | 151,789 | | | | — | | | | — | | | | 151,789 | |
| | | $ | 110,267 | | | $ | (306,116 | ) | | $ | 151,789 | | | $ | (39,202 | ) | | $ | (36,998 | ) | | $ | (120,260 | ) |
Each of the above derivatives is located in the following Statement of Operations accounts:
(a) Change in net unrealized appreciation (depreciation) on investments (includes purchased options), written options, swap contracts and futures, respectively
(b) Change in net unrealized appreciation (depreciation) on foreign currency (Statement of Operations includes both forward currency contracts and foreign currency transactions)
As of June 30, 2013, the Fund has transactions subject to enforceable master netting agreements. A reconciliation of the gross amounts on the Statement of Assets and Liabilities to the net amounts by derivative type, including any collateral exposure, is included in the following tables:
| Counterparty | | Gross Amounts of Assets Presented in the Statement of Assets and Liabilities (a) | | | Financial Instruments and Derivatives Available for Offset | | | Collateral Received | | | Net Amount of Derivative Assets | |
| Bank of America | | $ | 118,652 | | | $ | (62,856 | ) | | $ | — | | | $ | 55,796 | |
| Barclays Bank PLC | | | 50,155 | | | | (50,155 | ) | | | — | | | | — | |
| BNP Paribas | | | 189,915 | | | | (113,732 | ) | | | — | | | | 76,183 | |
| Citigroup, Inc. | | | 142,559 | | | | (80,599 | ) | | | — | | | | 61,960 | |
| Credit Suisse | | | 5,602 | | | | — | | | | — | | | | 5,602 | |
| JPMorgan Chase Securities, Inc. | | | 238,772 | | | | (124,479 | ) | | | — | | | | 114,293 | |
| Nomura International PLC | | | 308,195 | | | | (115,493 | ) | | | — | | | | 192,702 | |
| UBS AG | | | 4,341 | | | | (4,341 | ) | | | — | | | | — | |
| Exchange Traded Options and Futures (b) | | | 54,970 | | | | — | | | | — | | | | 54,970 | |
| | | $ | 1,113,161 | | | $ | (551,655 | ) | | $ | — | | | $ | 561,506 | |
| Counterparty | | Gross Amounts of Liabilities Presented in the Statement of Assets and Liabilities (a) | | | Financial Instruments and Derivatives Available for Offset | | | Collateral Pledged | | | Net Amount of Derivative Liabilities | |
| Bank of America | | $ | 62,856 | | | $ | (62,856 | ) | | $ | — | | | $ | — | |
| Barclays Bank PLC | | | 148,402 | | | | (50,155 | ) | | | — | | | | 98,247 | |
| BNP Paribas | | | 113,732 | | | | (113,732 | ) | | | — | | | | — | |
| Citigroup, Inc. | | | 80,599 | | | | (80,599 | ) | | | — | | | | — | |
| JPMorgan Chase Securities, Inc. | | | 124,479 | | | | (124,479 | ) | | | — | | | | — | |
| Nomura International PLC | | | 115,493 | | | | (115,493 | ) | | | — | | | | — | |
| UBS AG | | | 75,047 | | | | (4,341 | ) | | | — | | | | 70,706 | |
| Exchange Traded Options and Futures (b) | | | 336,742 | | | | — | | | | — | | | | 336,742 | |
| | | $ | 1,057,350 | | | $ | (551,655 | ) | | $ | — | | | $ | 505,695 | |
(a) Forward foreign currency exchange contracts, swap contracts and over-the-counter purchased options and written options are netted.
(b) Includes financial instruments (purchased options or futures) which are not subject to a master netting arrangement, or another similar arrangement.
C. Purchases and Sales of Securities
During the six months ended June 30, 2013, purchases and sales of investment transactions (excluding short-term investments and U.S. Treasury obligations) aggregated $58,424,909 and $62,422,869, respectively. Purchases and sales of U.S. Treasury obligations aggregated $95,841 and $1,807,074, respectively.
For the six months ended June 30, 2013, transactions for written options on futures contracts and interest rate swap contracts were as follows:
| | | Contracts/ Contract Amount | | | Premiums | |
| Outstanding, beginning of period | | | 10,800,020 | | | $ | 416,526 | |
| Options written | | | 60 | | | | 50,475 | |
| Options closed | | | (4,000,000 | ) | | | (64,650 | ) |
| Options expired | | | (20 | ) | | | (7,769 | ) |
| Outstanding, end of period | | | 6,800,060 | | | $ | 394,582 | |
D. Related Parties
Management Agreement. Under the Investment Management Agreement with Deutsche Investment Management Americas Inc. ("DIMA" or the "Advisor"), an indirect, wholly owned subsidiary of Deutsche Bank AG, the Advisor directs the investments of the Fund in accordance with its investment objectives, policies and restrictions. The Advisor determines the securities, instruments and other contracts relating to investments to be purchased, sold or entered into by the Fund or delegates such responsibility to the Fund's subadvisor.
QS Investors, LLC ("QS Investors") acted as an investment subadvisor to the Fund and managed the portion of assets allocated to the Fund's global tactical asset allocation ("GTAA") overlay strategy. QS Investors was paid by the Advisor for the services QS Investors provided to the Fund. Effective May 31, 2013, QS Investors no longer serves as subadvisor to the Fund.
Pursuant to the Investment Management Agreement with the Advisor, the Fund pays a monthly management fee based on the Fund's average daily net assets, computed and accrued daily and payable monthly, at the following annual rates:
| First $250 million | | | .550 | % |
| Next $750 million | | | .520 | % |
| Next $1.5 billion | | | .500 | % |
| Next $2.5 billion | | | .480 | % |
| Next $2.5 billion | | | .450 | % |
| Next $2.5 billion | | | .430 | % |
| Next $2.5 billion | | | .410 | % |
| Over $12.5 billion | | | .390 | % |
For the period from January 1, 2013 through September 30, 2013, the Advisor has contractually agreed to waive its fee and/or reimburse certain operating expenses to the extent necessary to maintain the operating expenses (excluding certain expenses such as extraordinary expenses, taxes, brokerage and interest expense) at 0.73%.
Accordingly, for the six months ended June 30, 2013, the Advisor waived a portion of its management fee pursuant to the Investment Management Agreement aggregating $93,137, and the amount charged aggregated $109,078, which was equivalent to an annualized effective rate of 0.30% of the Fund's average daily net assets.
Administration Fee. Pursuant to an Administrative Services Agreement, DIMA provides most administrative services to the Fund. For all services provided under the Administrative Services Agreement, the Fund pays DIMA an annual fee ("Administration Fee") of 0.10% of the Fund's average daily net assets, computed and accrued daily and payable monthly. For the six months ended June 30, 2013, the Administration Fee was $36,766, of which $5,965 is unpaid.
Service Provider Fees. DWS Investments Service Company ("DISC"), an affiliate of the Advisor, is the transfer agent, dividend-paying agent and shareholder service agent for the Fund. Pursuant to a sub-transfer agency agreement between DISC and DST Systems, Inc. ("DST"), DISC has delegated certain transfer agent, dividend-paying agent and shareholder service agent functions to DST. DISC compensates DST out of the shareholder servicing fee it receives from the Fund. For the six months ended June 30, 2013, the amounts charged to the Fund by DISC aggregated $73, all of which was waived.
Typesetting and Filing Service Fees. Under an agreement with DIMA, DIMA is compensated for providing typesetting and certain regulatory filing services to the Fund. For the six months ended June 30, 2013, the amount charged to the Fund by DIMA included in the Statement of Operations under "reports to shareholders" aggregated $9,927, of which $9,390 is unpaid.
Trustees' Fees and Expenses. The Fund paid retainer fees to each Trustee not affiliated with the Advisor, plus specified amounts to the Board Chairperson and Vice Chairperson and to each committee Chairperson.
Affiliated Cash Management Vehicles. The Fund may invest uninvested cash balances in Central Cash Management Fund and DWS Variable NAV Money Fund, affiliated money market funds which are managed by the Advisor. Each affiliated money market fund seeks to provide a high level of current income consistent with liquidity and the preservation of capital. Each affiliated money market fund is managed in accordance with Rule 2a-7 under the Investment Company Act of 1940, which governs the quality, maturity, diversity and liquidity of instruments in which a money market fund may invest. Central Cash Management Fund seeks to maintain a stable net asset value, and DWS Variable NAV Money Fund maintains a floating net asset value. The Fund indirectly bears its proportionate share of the expenses of each affiliated money market fund in which it invests. Central Cash Management Fund does not pay the Advisor an investment management fee. To the extent that DWS Variable NAV Money Fund pays an investment management fee to the Advisor, the Advisor will waive an amount of the investment management fee payable to the Advisor by the Fund equal to the amount of the investment management fee payable on the Fund's assets invested in DWS Variable NAV Money Fund.
Security Lending Fees. Deutsche Bank AG serves as securities lending agent for the Fund. For the six months ended June 30, 2013, the Fund incurred securities lending agent fees to Deutsche Bank AG in the amount of $262.
E. Investing in High-Yield Securities
The Fund's performance could be hurt if a security declines in credit quality or goes into default, or if an issuer does not make timely payments of interest or principal. Because the issuers of high-yield debt securities or junk bonds (debt securities rated below the fourth-highest category) may be in uncertain financial health, the risk of loss from default by the issuer is significantly greater. Prices and yields of high-yield securities will fluctuate over time and, during periods of economic uncertainty, volatility of high-yield securities may adversely affect a fund's net asset value. Because the Fund may invest in securities not paying current interest or in securities already in default, these risks may be more pronounced.
F. Investing in Emerging Markets
Investing in emerging markets may involve special risks and considerations not typically associated with investing in developed markets. These risks include revaluation of currencies, high rates of inflation or deflation, repatriation restrictions on income and capital, and future adverse political, social and economic developments. Moreover, securities issued in these markets may be less liquid, subject to government ownership controls or delayed settlements, and may have prices that are more volatile or less easily assessed than those of comparable securities of issuers in developed markets.
G. Ownership of the Fund
At June 30, 2013, two Participating Insurance Companies were owners of record of 10% or more of the total outstanding Class A shares of the Fund, each owning 67% and 31%.
H. Line of Credit
The Fund and other affiliated funds (the "Participants") share in a $375 million revolving credit facility provided by a syndication of banks. The Fund may borrow for temporary or emergency purposes, including the meeting of redemption requests that otherwise might require the untimely disposition of securities. The Participants are charged an annual commitment fee which is allocated based on net assets, among each of the Participants. Interest is calculated at a rate per annum equal to the sum of the Federal Funds Rate plus 1.25 percent plus if LIBOR exceeds the Federal Funds Rate the amount of such excess. The Fund may borrow up to a maximum of 33 percent of its net assets under the agreement. The Fund had no outstanding loans at June 30, 2013.
Information About Your Fund's Expenses (Unaudited)
As an investor of the Fund, you incur two types of costs: ongoing expenses and transaction costs. Ongoing expenses include management fees and other Fund expenses. Examples of transaction costs include contract charges and account maintenance fees, which are not shown in this section. The following tables are intended to help you understand your ongoing expenses (in dollars) of investing in the Fund and to help you compare these expenses with the ongoing expenses of investing in other mutual funds. In the most recent six-month period, the Fund limited these expenses; had it not done so, expenses would have been higher. The example in the table is based on an investment of $1,000 invested at the beginning of the six-month period and held for the entire period (January 1, 2013 to June 30, 2013).
The tables illustrate your Fund's expenses in two ways:
•Actual Fund Return. This helps you estimate the actual dollar amount of ongoing expenses (but not transaction costs) paid on a $1,000 investment in the Fund using the Fund's actual return during the period. To estimate the expenses you paid over the period, simply divide your account value by $1,000 (for example, an $8,600 account value divided by $1,000 = 8.6), then multiply the result by the number in the "Expenses Paid per $1,000" line under the share class you hold.
• Hypothetical 5% Fund Return. This helps you to compare your Fund's ongoing expenses (but not transaction costs) with those of other mutual funds using the Fund's actual expense ratio and a hypothetical rate of return of 5% per year before expenses. Examples using a 5% hypothetical Fund return may be found in the shareholder reports of other mutual funds. The hypothetical account values and expenses may not be used to estimate the actual ending account balance or expenses you paid for the period.
Please note that the expenses shown in these tables are meant to highlight your ongoing expenses only and do not reflect any transaction costs. The "Expenses Paid per $1,000" line of the tables is useful in comparing ongoing expenses only and will not help you determine the relative total expense of owning different funds. If these transaction costs had been included, your costs would have been higher.
Expenses and Value of a $1,000 Investment for the six months ended June 30, 2013 | |
| Actual Fund Return | | Class A | |
| Beginning Account Value 1/1/13 | | $ | 1,000.00 | |
| Ending Account Value 6/30/13 | | $ | 961.20 | |
| Expenses Paid per $1,000* | | $ | 3.55 | |
| Hypothetical 5% Fund Return | | Class A | |
| Beginning Account Value 1/1/13 | | $ | 1,000.00 | |
| Ending Account Value 6/30/13 | | $ | 1,021.17 | |
| Expenses Paid per $1,000* | | $ | 3.66 | |
* Expenses are equal to the Fund's annualized expense ratio, multiplied by the average account value over the period, multiplied by 181 (the number of days in the most recent six-month period), then divided by 365.
| Annualized Expense Ratio | Class A | |
| DWS Variable Series II — DWS Unconstrained Income VIP | .73% | |
For more information, please refer to the Fund's prospectus.
These tables do not reflect charges and fees ("contract charges") associated with the separate account that invests in the Fund or any variable life insurance policy or variable annuity contract for which the Fund is an investment option.
For an analysis of the fees associated with an investment in the Fund or similar funds, please refer to http://apps.finra.org/fundanalyzer/1/fa.aspx.
The Trust's policies and procedures for voting proxies for portfolio securities and information about how the Trust voted proxies related to its portfolio securities during the 12-month period ended June 30 are available on our Web site — www.dws-investments.com (click on "proxy voting" at the bottom of the page) — or on the SEC's Web site — www.sec.gov. To obtain a written copy of the Trust's policies and procedures without charge, upon request, call us toll free at (800) 728-3337.
Summary of Management Fee Evaluation by Independent Fee Consultant
September 17, 2012
Pursuant to an Order entered into by Deutsche Investment Management Americas and affiliates (collectively, "DeAM") with the Attorney General of New York, I, Thomas H. Mack, have been appointed the Independent Fee Consultant for the DWS Funds (formerly the DWS Scudder Funds). My duties include preparing an annual written evaluation of the management fees DeAM charges the Funds, considering among other factors the management fees charged by other mutual fund companies for like services, management fees DeAM charges other clients for like services, DeAM's costs of supplying services under the management agreements and related profit margins, possible economies of scale if a Fund grows larger, and the nature and quality of DeAM's services, including fund performance. This report summarizes my evaluation for 2012, including my qualifications, the evaluation process for each of the DWS Funds, consideration of certain complex-level factors, and my conclusions. I served in substantially the same capacity in 2007, 2008, 2009, 2010 and 2011.
Qualifications
For more than 35 years I have served in various professional capacities within the investment management business. I have held investment analysis and advisory positions, including securities analyst, portfolio strategist and director of investment policy with a large investment firm. I have also performed business management functions, including business development, financial management and marketing research and analysis.
Since 1991, I have been an independent consultant within the asset management industry. I have provided services to over 125 client organizations, including investment managers, mutual fund boards, product distributors and related organizations. Over the past ten years I have completed a number of assignments for mutual fund boards, specifically including assisting boards with management contract renewal.
I hold a Master of Business Administration degree, with highest honors, from Harvard University and Master of Science and Bachelor of Science (highest honors) degrees from the University of California at Berkeley. I am an independent director and audit committee financial expert for two closed-end mutual funds and have served in various leadership and financial oversight capacities with non-profit organizations.
Evaluation of Fees for each DWS Fund
My work focused primarily on evaluating, fund-by-fund, the fees charged to each of the 103 mutual fund portfolios in the DWS Fund family. For each Fund, I considered each of the key factors mentioned above, as well as any other relevant information. In doing so I worked closely with the Funds' Independent Directors in their annual contract renewal process, as well as in their approval of contracts for several new funds (documented separately).
In evaluating each Fund's fees, I reviewed comprehensive materials provided by or on behalf of DeAM, including expense information prepared by Lipper Analytical, comparative performance information, profitability data, manager histories, and other materials. I also accessed certain additional information from the Lipper and Morningstar databases and drew on my industry knowledge and experience.
To facilitate evaluating this considerable body of information, I prepared for each Fund a document summarizing the key data elements in each area as well as additional analytics discussed below. This made it possible to consider each key data element in the context of the others.
In the course of contract renewal, DeAM agreed to implement a number of fee and expense adjustments requested by the Independent Directors which will favorably impact future fees and expenses, and my evaluation includes the effects of these changes.
Fees and Expenses Compared with Other Funds
The competitive fee and expense evaluation for each fund focused on two primary comparisons:
The Fund's contractual management fee (the advisory fee plus the administration fee where applicable) compared with those of a group of typically 12-15 funds in the same Lipper investment category (e.g. Large Capitalization Growth) having similar distribution arrangements and being of similar size.
The Fund's total expenses compared with a broader universe of funds from the same Lipper investment category and having similar distribution arrangements.
These two comparisons provide a view of not only the level of the fee compared with funds of similar scale but also the total expense the Fund bears for all the services it receives, in comparison with the investment choices available in the Fund's investment category and distribution channel. The principal figure-of-merit used in these comparisons was the subject Fund's percentile ranking against peers.
DeAM's Fees for Similar Services to Others
DeAM provided management fee schedules for all of its US domiciled fund and non-fund investment management accounts in any of the investment categories where there is a DWS Fund. These similar products included the other DWS Funds, non-fund pooled accounts, institutional accounts and sub-advisory accounts. Using this information, I calculated for each Fund the fee that would be charged to each similar product, at the subject Fund's asset level.
Evaluating information regarding non-fund products is difficult because there are varying levels of services required for different types of accounts, with mutual funds generally requiring considerably more regulatory and administrative types of service as well as having more frequent cash flows than other types of accounts. Also, while mutual fund fees for similar fund products can be expected to be similar, there will be some differences due to different pricing conditions in different distribution channels (e.g. retail funds versus those used in variable insurance products), differences in underlying investment processes and other factors.
Costs and Profit Margins
DeAM provided a detailed profitability analysis for each Fund. After making some adjustments so that the presentation would be more comparable to the available industry figures, I reviewed profit margins from investment management alone, from investment management plus other fund services (excluding distribution) provided to the Funds by DeAM (principally shareholder services), and DeAM profits from all sources, including distribution. A later section comments on overall profitability.
Economies of Scale
Economies of scale — an expected decline in management cost per dollar of fund assets as fund assets grow — are very rarely quantified and documented because of inherent difficulties in collecting and analyzing relevant data. However, in virtually every investment category that I reviewed, larger funds tend to have lower fees and lower total expenses than smaller funds. To see how each DWS Fund compares with this industry observation, I reviewed:
The trend in Fund assets over the last five years and the accompanying trend in total expenses. This shows if the Fund has grown and, if so, whether total expense (management fees as well as other expenses) have declined as a percent of assets.
Whether the Fund has break-points in its management fee schedule, the extent of the fee reduction built into the schedule and the asset levels where the breaks take effect, and in the case of a sub-advised Fund how the Fund's break-points compare with those of the sub-advisory fee schedule.
How the Fund's contractual fee schedule compares with trends in the industry data. To accomplish this, I constructed a chart showing how actual latest-fiscal-year contractual fees of the Fund and of other similar funds relate to average fund assets, with the subject Fund's contractual fee schedule superimposed.
Quality of Service — Performance
The quality-of-service evaluation focused on investment performance, which is the principal result of the investment management service. Each Fund's performance was reviewed over the past 1, 3, 5 and 10 years, as applicable, and compared with that of other funds in the same investment category and with a suitable market index.
In addition, I calculated and reviewed risk-adjusted returns relative to an index of similar mutual funds' returns and a suitable market index. The risk-adjusted returns analysis provides a way of determining the extent to which the Fund's return comparisons are mainly the product of investment value-added (or lack thereof) or alternatively taking considerably more or less risk than is typical in its investment category.
I also received and considered the history of portfolio manager changes for each Fund, as this provided an important context for evaluating the performance results.
Complex-Level Considerations
While this evaluation was conducted mainly at the individual fund level, there are some issues relating to the reasonableness of fees that can alternatively be considered across the whole fund complex:
I reviewed DeAM's profitability analysis for all DWS Funds, with a view toward determining if the allocation procedures used were reasonable and how profit levels compared with public data for other investment managers.
I considered whether DeAM and affiliates receive any significant ancillary or "fallout" benefits that should be considered in interpreting the direct profitability results. These would be situations where serving as the investment manager of the Funds is beneficial to another part of the Deutsche Bank organization.
I considered how aggregated DWS Fund expenses had varied over the years, by asset class and in the context of trends in asset levels.
I considered how aggregated DWS Fund performance measures relative to appropriate peers had varied by asset class and over time.
I reviewed the structure of the DeAM organization, trends in staffing levels, and information on compensation of investment management and other professionals compared with industry data.
Findings
Based on the process and analysis discussed above, which included reviewing a wide range of information from management and external data sources and considering among other factors the fees DeAM charges other clients, the fees charged by other fund managers, DeAM's costs and profits associated with managing the Funds, economies of scale, possible fall-out benefits, and the nature and quality of services provided, in my opinion the management fees charged the DWS Funds are reasonable.
Thomas H. Mack
President, Thomas H. Mack & Co., Inc.
Notes
DWS Investments Distributors, Inc.
222 South Riverside Plaza
Chicago, IL 60606
(800) 621-1148
VS2UI-3 (R-028389-2 8/13)
| | |
| ITEM 2. | CODE OF ETHICS |
| | |
| | Not applicable. |
| | |
| ITEM 3. | AUDIT COMMITTEE FINANCIAL EXPERT |
| | |
| | Not applicable |
| | |
| ITEM 4. | PRINCIPAL ACCOUNTANT FEES AND SERVICES |
| | |
| | Not applicable |
| | |
| ITEM 5. | AUDIT COMMITTEE OF LISTED REGISTRANTS |
| | |
| | Not applicable |
| | |
| ITEM 6. | SCHEDULE OF INVESTMENTS |
| | |
| | Not applicable |
| | |
| ITEM 7. | DISCLOSURE OF PROXY VOTING POLICIES AND PROCEDURES FOR CLOSED-END MANAGEMENT INVESTMENT COMPANIES |
| | |
| | Not applicable |
| | |
| ITEM 8. | PORTFOLIO MANAGERS OF CLOSED-END MANAGEMENT INVESTMENT COMPANIES |
| | |
| | Not applicable |
| | |
| ITEM 9. | PURCHASES OF EQUITY SECURITIES BY CLOSED-END MANAGEMENT INVESTMENT COMPANY AND AFFILIATED PURCHASERS |
| | |
| | Not applicable |
| | |
| ITEM 10. | SUBMISSION OF MATTERS TO A VOTE OF SECURITY HOLDERS |
| | |
| | There were no material changes to the procedures by which shareholders may recommend nominees to the Fund’s Board. The primary function of the Nominating and Governance Committee is to identify and recommend individuals for membership on the Board and oversee the administration of the Board Governance Guidelines. Shareholders may recommend candidates for Board positions by forwarding their correspondence by U.S. mail or courier service to Kenneth C. Froewiss, Independent Chairman, DWS Mutual Funds, P.O. Box 78, Short Hills, NJ 07078. |
| | |
| ITEM 11. | CONTROLS AND PROCEDURES |
| | |
| | (a) | The Chief Executive and Financial Officers concluded that the Registrant’s Disclosure Controls and Procedures are effective based on the evaluation of the Disclosure Controls and Procedures as of a date within 90 days of the filing date of this report. |
| | |
| | (b) | There have been no changes in the registrant’s internal control over financial reporting that occurred during the second fiscal quarter of the period covered by this report that has materially affected, or is reasonably likely to materially affect, the registrant’s internal controls over financial reporting. |
| | |
| ITEM 12. | EXHIBITS |
| | |
| | (a)(1) | Certification pursuant to Rule 30a-2(a) under the Investment Company Act of 1940 (17 CFR 270.30a-2(a)) is filed and attached hereto as Exhibit 99.CERT. |
| | |
| | (b) | Certification pursuant to Rule 30a-2(b) under the Investment Company Act of 1940 (17 CFR 270.30a-2(b)) is furnished and attached hereto as Exhibit 99.906CERT. |
Form N-CSRS Item F
SIGNATURES
Pursuant to the requirements of the Securities Exchange Act of 1934 and the Investment Company Act of 1940, the registrant has duly caused this report to be signed on its behalf by the undersigned, thereunto duly authorized.
| Registrant: | DWS Variable Series II |
| | |
| | |
| By: | /s/W. Douglas Beck W. Douglas Beck President |
| | |
| Date: | August 19, 2013 |
Pursuant to the requirements of the Securities Exchange Act of 1934 and the Investment Company Act of 1940, this report has been signed below by the following persons on behalf of the registrant and in the capacities and on the dates indicated.
| By: | /s/W. Douglas Beck W. Douglas Beck President |
| | |
| Date: | August 19, 2013 |
| | |
| | |
| | |
| By: | /s/Paul Schubert Paul Schubert Chief Financial Officer and Treasurer |
| | |
| Date: | August 19, 2013 |