UNITED STATES
SECURITIES AND EXCHANGE COMMISSION
Washington, D.C. 20549
FORM N-CSR
CERTIFIED SHAREHOLDER REPORT OF REGISTERED
MANAGEMENT INVESTMENT COMPANIES
Investment Company Act file number 811-05010
THE HUNTINGTON FUNDS
(Exact name of registrant as specified in charter)
2960 North Meridian Street, Suite 300
Attn: Huntington Funds Officer
Indianapolis, IN 46208
(Address of principal executive offices) (Zip code)
Dave Carson
The Huntington National Bank
41 South High Street
Columbus, OH 43287
(Name and address of agent for service)
Copies to:
David C. Mahaffey, Esq.
Sullivan & Worcester
1666 K Street, N.W.
Washington, DC 20006
Registrant’s telephone number, including area code: 1-800-253-0412
Date of fiscal year end: December 31
Date of reporting period: December 31, 2012
Item 1. Reports to Stockholders.

A Message from the
Chief Investment Officer and
Annual Shareholder Report
DECEMBER 31, 2012
CLASS A SHARES
TRUST SHARES
Letter from the Chief Investment Officer
Dear Shareholders:
Despite a raft of economic, political, earnings, international and market concerns during 2012, virtually all the equity markets produced attractive returns for the year. Buoyed by yet another announced Federal Reserve System bond buying program, investors were encouraged by the flood of liquidity provided to the economic system. Small and middle capitalized companies led the performance derby with returns of 16.33% and 17.88% as represented by the Standard & Poor’s Small Cap 600 Index (“S&P 600”)1 and the Standard & Poor’s Mid Cap 400 Index (“S&P 400”)2, respectively. The large caps, as represented by the Dow Jones Industrial Average3 and the Standard & Poor’s 500 Index (“S&P 500”)4, were also up 10.24% and 16.00%, respectively. Even the international markets provided investors with a strong rebound from the dismal double digit declines that occurred during 2011.
The most significant investment event during 2012 was certainly the Presidential election in November. Virtually all investment strategies were based upon who would win the White House. With diametrically opposed views on taxes and economic stimulus, the two candidates were closely deadlocked up until the day of the election. Huntington Asset Advisors, Inc. (“Huntington”) developed two separate strategies based upon the eventual outcome. We believed that certain sectors would perform differently under the policies of the two candidates. Upon confirmation of the election, we moved quickly in all of our Huntington Funds to implement our predetermined strategy. This included reducing betas and emphasizing investments in certain industries that would be favored under the Obama administration. Expectations regarding the tax policies associated with capital gains and dividends that had been espoused by President Obama ultimately were muted in the fiscal cliff negotiations. These tax policies will carry positive momentum for investors into 2013 and beyond.
One of the longer term strategies that Huntington employed during the year was to emphasize the agribusiness sector. With back to back strong years in farm income and dramatically growing international demand for food, our analysts looked into a variety of avenues to uncover opportunities. The traditional approach would be to invest in farm equipment, fertilizers and seed companies. We looked deeper into the periphery of agribusiness, which includes investments in rural retail establishments, irrigation and flow control devices, transportation equipment and catalogue companies that cater to outdoor life. We firmly believe that this strategy has longer term positive investment implications that can be implemented irrespective of Federal Reserve policy, economic issues and regulatory initiatives.
Looking into 2013 there are two major pieces of legislation that we believe will start to have significant impacts on the economy and the markets. With the drafting of Dodd-Frank regulations and the institution of the new healthcare laws, there will be new costs and regulations impacting critical aspects of the economy. Just as the passage of Sarbanes Oxley created ripples in the markets ten years ago, the impact of the banking and healthcare bills will need to be sorted out by investors.
One accompaniment of the Dodd-Frank legislation will most likely be an increase in merger and acquisition activities, as smaller financial firms seek to cover costs by adding economies of scale. This would be consistent with the experience of Sarbanes-Oxley as many firms merged, went private or sold out. In the year following the passage of Sarbanes-Oxley there were fewer publically traded companies than the year before, as many firms merged with significant premiums to previous valuations. This could be an interesting opportunity for 2013 strategies in our equity funds if past is prologue.
In 2102, we were especially proud of three of our equity fund that were recognized by Morningstar for their outstanding performance relative to their peers. The Huntington Situs Fund received a Five-Star Overall Morningstar RatingTM in the Mid-Cap Blend category. Both The Huntington International Equity Fund and the Huntington Dividend Capture Fund received a Four-Star Overall Morningstar RatingTM in the Foreign Large Blend and Large Value categories, respectively.
Letter from the Chief Investment Officer
Letter from the Chief Investment Officer (Continued)
As always, Huntington seeks to control risk while providing opportunities to add value for our Huntington Funds’ shareholders. We conduct our efforts with the highest level of attention to the disciplines that we have employed for several decades. We appreciate your confidence and your continued support. We look forward to helping you achieve your long-term financial goals, with a full range of Huntington Funds designed to meet both your individual needs and the economic challenges throughout the upcoming year.
Sincerely,

B. Randolph Bateman
Chief Investment Officer
Huntington Asset Advisors, Inc.
| (1) | The S&P 600 is a capitalization-weighted index which generally represents all major industries in the small cap range of the U.S. stock market. The index is unmanaged and, unlike the Fund, is not affected by cashflows. It is not possible to invest directly in an Index. |
| (2) | The S&P 400 is a capitalization-weighted index of common stocks representing the mid-range sector of the U.S. stock market. The index is unmanaged and, unlike the Fund, is not affected by cashflows. It is not possible to invest directly in an Index. |
| (3) | The Dow Jones Industrial Average is a price-weighted average of 30 significant stocks traded on the New York Stock Exchange and Nasdaq. |
| (4) | The S&P 500 is a capitalization-weighted index comprised of 500 stocks and is designed to measure performance of the broad domestic economy through changes in the aggregate market value of 500 stocks representing all major industries. The index is unmanaged and, unlike the Fund, is not affected by cashflows. It is not possible to invest directly in an Index. |
For each fund with at least a three-year history, Morningstar calculates a Morningstar Rating™ based on a Morningstar Risk-Adjusted Return measure that accounts for variation in a fund’s monthly performance (including the effects of sales charges, loads, and redemption fees), placing more emphasis on downward variations and rewarding consistent performance. The top 10% of funds in each category receive 5 stars, the next 22.5% receive 4 stars, the next 35% receive 3 stars, the next 22.5% receive 2 stars and the bottom 10% receive 1 star. (Each share classis counted as a fraction of one fund within this scale and rated separately, which may cause slight variations in the distribution percentages.) The Overall Morningstar Rating for a fund is derived from a weighted-average of the performance figures associated with its three-, five- and ten-year if applicable) Morningstar Rating metrics. Ratings are for the Trust class; other classes may have different performance characteristics. For the Overall, 3-, 5- and 10-year periods ended 12/31/2012, the Situs Fund received 5, 5, 4 and 5 stars and was rated among 352, 352, 309 and 195 funds, respectively. For the Overall, 3-, 5- and 10-year periods ended 12/31/2012, the International Equity Fund received 4, 3, 4 and 4 stars and was rated among 713, 713,589 and 325 funds, respectively. For the Overall, 3-, 5- and 10-year periods ended 12/31/2012,the Dividend Capture Fund received 4, 4, 4 and 3 stars and was rated among 1051,1051,930 and 591 funds, respectively. ©2012 Morningstar, Inc.
©2012 Morningstar, Inc. All Rights Reserved. The information contained herein: (1) is proprietary to Morningstar and/or its content providers; (2) may not be copied or distributed; and (3) is not warranted to be accurate, complete or timely. Neither Morningstar nor its content providers are responsible for any damages or losses arising from any use of this information. Past performance is no guarantee of future results.
This commentary may include statements that constitute “forward looking statements” under the U.S. securities laws. Forward-looking statements include, among other things, projections, estimates, and information about possible or future results related to the Portfolio, market or regulatory developments. The views expressed above are not guarantees of future performance or economic results and involve certain risks, uncertainties and assumptions that could cause actual outcomes and results to differ materially from the views expressed herein. The views expressed above are those of the Advisor as of December 31, 2012 and are subject to change at any time based upon economic, market, or other conditions and the Advisor undertakes no obligation to update the views expressed herein. Any discussions of specific securities should not be considered a recommendation to buy or sell those securities. The views expressed above (including any forward-looking statement) may not be relied upon as investment advice or as an indication of the Fund’s trading intent. Information about the Fund’s holdings, asset allocation or country diversification is historical and is not an indication of future Fund composition, which may vary.
The performance of any index mentioned in this commentary has not been adjusted for ongoing management, distribution and operating expenses, and sales charges applicable to mutual fund investments. In addition, the returns do not reflect additional fees charged by separate accounts or variable insurance contracts that an investor in the Fund may pay. If these additional fees were reflected, performance would have been lower.
Letter from the Chief Investment Officer
Annual Shareholder Report
MONEY MARKET FUNDS
Huntington Tax Free Money Market Fund
Huntington Money Market Fund
Huntington Ohio Municipal Money Market Fund
Huntington U.S. Treasury Money Market Fund
EQUITY FUNDS
Huntington Disciplined Equity Fund
Huntington Dividend Capture Fund
Huntington Global Select Markets Fund
Huntington Growth Fund
Huntington Income Equity Fund
Huntington International Equity Fund
Huntington Mid Corp America Fund
Huntington Real Strategies Fund
Huntington Rotating Markets Fund
Huntington Situs Fund
INCOME FUNDS
Huntington Fixed Income Securities Fund
Huntington Intermediate Government Income Fund
Huntington Mortgage Securities Fund
Huntington Ohio Tax-Free Fund
Huntington Short/Intermediate Fixed Income Securities Fund
ASSET ALLOCATION FUNDS
Huntington Balanced Allocation Fund
Huntington Conservative Allocation Fund
Huntington Growth Allocation Fund
| | |
Disciplined Equity Fund | | As of 12/31/12 |
Management’s Discussion of Fund Performance
Portfolio Manager: Peter Sorrentino, CFA
Vice President
Huntington Asset Advisors, Inc.
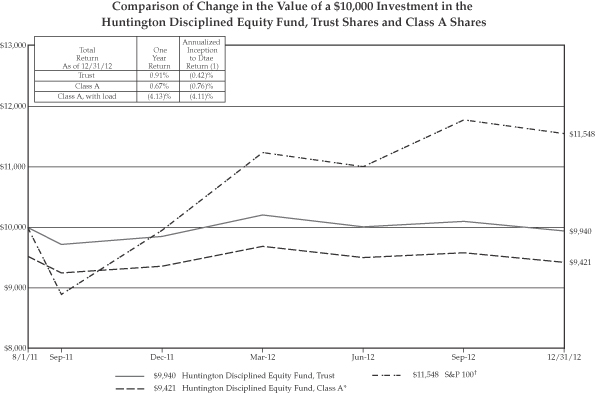
For the fiscal year ended December 31, 2012, the Huntington Disciplined Equity Fund’s Trust Shares and Class A Shares produced total returns (not including the deduction of applicable sales charges) of 0.91% and 0.67%, respectively, based upon net asset value. The Fund underperformed the Standard & Poor’s 100 Index (“S&P 100”)1, which returned 16.05% for the same period.
The Fund’s positive performance during the year was driven largely by strength in the financial sector. Two of the Fund’s top performing holdings were JPMorgan Chase & Co. (2.1%)* and Bank of America Corp. (1.2%)*, which delivered 36% and 110% returns for the year, respectively. Rounding out the Fund’s top contributors were Comcast Corp. (1.3%)* and Home Depot, Inc. (1.4%)* in the consumer sector. The overall top performer for the Fund was its holding of Apple, Inc. (5.8%)*. The price advance for shares of Apple, Inc., from $405 to a close of $533, generated 1.96% in incremental return for the Fund in 2012.
Despite positive equity returns for 2012, the Fund underperformed due to the cost of maintaining its protective risk hedges. In spite of the strong advance for the broad market, the options and futures markets in 2012 exhibited a pronounced negative skew. Investors displayed a strong distain for market volatility throughout the year, making the cost of mitigating downside price risk expensive. It was this expense that consumed the majority of the Fund’s income and price appreciation.
| * | Percentage of holdings based on Fund’s net assets as of 12/31/2012. The composition of the Fund’s holdings is subject to change. |
| (1) | The S&P 100 measures the performance of large cap companies in the United States, and is comprised of 100 major blue chip companies across multiple industry groups. The index is unmanaged and, unlike the Fund, is not affected by cashflows. It is not possible to invest directly in an Index. |
This commentary may include statements that constitute “forward looking statements” under the U.S. securities laws. Forward-looking statements include, among other things, projections, estimates, and information about possible or future results related to the Portfolio, market or regulatory developments. The views expressed above are not guarantees of future performance or economic results and involve certain risks, uncertainties and assumptions that could cause actual outcomes and results to differ materially from the views expressed herein. The views expressed above are those of the Advisor as of December 31, 2012 and are subject to change at any time based upon economic, market, or other conditions and the Advisor undertakes no obligation to update the views expressed herein. Any discussions of specific securities should not be considered a recommendation to buy or sell those securities. The views expressed above (including any forward-looking statement) may not be relied upon as investment advice or as an indication of the Fund’s trading intent. Information about the Fund’s holdings, asset allocation or country diversification is historical and is not an indication of future Fund composition, which may vary.
The performance of any index mentioned in this commentary has not been adjusted for ongoing management, distribution and operating expenses, and sales charges applicable to mutual fund investments. In addition, the returns do not reflect additional fees charged by separate accounts or variable insurance contracts that an investor in the Fund may pay. If these additional fees were reflected, performance would have been lower.
Annual Shareholder Report
1
Disciplined Equity Fund (Continued)
Performance data quoted represents past performance which is no guarantee of future results. Investment return and principal value will fluctuate so that an investor’s shares, when redeemed, may be worth more or less than their original cost. Mutual fund performance changes over time and current performance may be lower or higher than what is stated. For current to the most recent month end performance, visit www.huntingtonfunds.com or call 1-800-253-0412. For after-tax returns call 1-800-253-0412. Returns shown do not reflect the deduction of taxes that a shareholder would pay on Fund distributions or the redemption of Fund Shares. Mutual funds are not obligations of or guaranteed by any bank and are not federally insured. Total returns, at load, include the maximum 4.75% sales charge for the Class A Shares.
| | | | |
| Class | | Expense Ratios | |
A | | | 1.45% | |
Trust | | | 1.20% | |
The above expense ratios are from the Funds’ prospectus dated May 1, 2012. Additional information pertaining to the Fund’s expense ratio as of December 31, 2012 can be found in the financial highlights.
The Fund’s performance assumes the reinvestment of all dividends and distributions on securities. The S&P 100 has been adjusted to reflect reinvestment of dividends on securities in the index.
The Fund intends to write (sell) covered call options which may limit the Fund’s gain, if any, on the underlying securities, and the Fund continues to bear the risk of a decline in the value of the underlying stock until the option expires or is closed out. The Fund intends to write (sell) call options and purchase put options and/or enter into put option spreads. Option spreads present risk during periods of high market volatility. The Fund may also write (sell) put options on individual stocks deemed attractive for purchase at prices at or above the exercise price of the put options written. If a counterparty is unable to honor its commitments, the value of Fund shares may decline and/or the Fund could experience delays in the return of collateral or other assets held by the counterparty. No Fund is a complete investment program and you may lose money investing in the Fund.
Because the fund invests in a limited number of holdings, an increase or decrease in the value of a single security may have a greater impact on the fund’s net asset value and total return.
Funds whose investments are concentrated in a specific industry or sector may be subject to a higher degree of market risk than funds whose investments are diversified. In addition, the Fund may be subject to specific risks of the information technology sector, such as obsolescence.
The funds are distributed by Unified Financial Securities, Inc. (Member FINRA), a wholly owned subsidiary of Huntington Bancshares, Inc. and an affiliate of Huntington Asset Advisors, Inc., the advisor to the Huntington Funds.
| * | Represents a hypothetical investment of $10,000 in the Fund after deducting the maximum sales load of 4.75% ($10,000 investment minus $475 sales load = $9,525). |
| (1) | The Fund commenced operations for all share classes on August 1, 2011. |
| † | The S&P 100 is not adjusted to reflect sales charges, expenses, or other fees that the Securities and Exchange Commission requires to be reflected in the Fund’s performance. The index is unmanaged and, unlike the Fund, is not affected by cashflows. It is not possible to invest directly in an index. |
Annual Shareholder Report
2
| | |
Dividend Capture Fund | | As of 12/31/12 |
Management’s Discussion of Fund Performance
Portfolio Manager:
Kirk Mentzer, MBA, Director of Research
Huntington Asset Advisors, Inc.
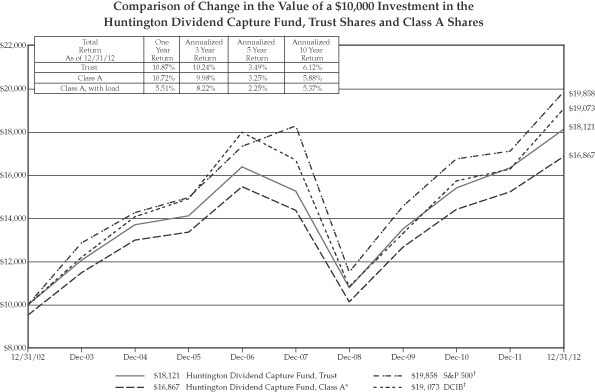
For the fiscal year ended December 31, 2012, the Huntington Dividend Capture Fund’s Trust Shares and Class A Shares produced total returns (not including the deduction of applicable sales charges) of 10.87% and 10.72%, respectively, based on net asset value. The Huntington Dividend Capture Fund’s Trust Shares’ performance fell below the total return of 16.00% for the Fund’s benchmark, the Standard & Poor’s 500 Index (“S&P 500”)1, and the total return of 16.45% for the Dividend Capture Indices Blend (“DCIB”)2 for the same period. The Huntington Dividend Capture Fund’s Class A class shares underperformed the benchmark for the same period.
The Fund is managed using our top-down style and portfolio construction techniques, which are aimed at producing a high level of stable income while managing volatility by investing in three distinct asset classes: common stocks, REITs, and preferred stocks.
| ¢ | | Value-style common stocks: Despite slowing economic and profit growth, U.S. equity markets produced a +16.00% total return for 2012. Sector performance favored financials, consumer discretion and healthcare sectors over utilities, energy and staples. Investors had less preference for the high quality, low volatility, dividend-paying stocks that the Fund was focused on for the period. As a result, the common stocks in the Fund underperformed the overall market. The Fund’s common stock total return for 2012 was +13.76% compared to the S&P 500 Value Index of +17.62%. |
| (1) | The S&P 500 is a capitalization-weighted index comprised of 500 stocks and is designed to measure performance of the broad domestic economy through changes in the aggregate market value of 500 stocks representing all major industries. The index is unmanaged and, unlike the Fund, is not affected by cashflows. It is not possible to invest directly in an Index. |
| (2) | The DCIB is a custom, blended index comprised of the following three indices with their noted respective weightings: S&P 500 Value Index (40%), Merrill Lynch Fixed Rate Preferred Index (40%) and NAREIT Index (20%). This custom, blended index and its respective weightings are reflective of the Fund’s sector diversification. Indices are unmanaged and, unlike the Fund, are not affected by cashflows. It is not possible to invest directly in an Index. |
Annual Shareholder Report
3
Dividend Capture Fund (Continued)
| ¢ | | Real Estate Investment Trusts (REITs)**: REITs were the best performing asset class for the Fund in 2012. The Fund’s REIT holdings produced a total return of +21.96% which compared favorably to the benchmark NAREIT Index total return of +19.56%. |
| ¢ | | Preferred Stock***: Preferred stocks generally lagged the equity market, but outperformed corporate bonds with a +13.52% total return for 2012. Investors’ search for yield drove prices higher as credit spreads compressed. Performance for the preferred stocks landed between corporate bonds and common stock. |
Trading activity was responsible for -4.13% of the performance relative to the benchmark while portfolio structure had a impact of -5.30%. Portfolio structure can be explained by adding security characteristics: -8.02%, sector allocation: -1.84% and security selection: 4.57%.
The three holdings that had the largest positive contribution to the Fund’s performance were Waddell & Reed Financial, Inc. (0.7%)*, GAP, Inc. (sold) and Sunoco Logistic Partners LP (0.7%)*. These three holdings added 1.53% to the Fund’s return. The three holdings that had the largest negative contribution to the Fund’s performance were Freeport-McMoRan Copper & Gold, Inc. (0.7%)*, Total SA (sold) and Exelon Corp. (sold). These three holdings subtracted 0.65% from the Fund’s return.
| * | Percentage of holdings based on Fund’s net assets as of 12/31/2012. The composition of the Fund’s holdings is subject to change. |
| ** | REIT returns represented by the NAREIT Index. |
| *** | Preferred stock returns represented by BofA, Merrill Lynch US Fixed Rate Preferred Stock Index. |
This commentary may include statements that constitute “forward looking statements” under the U.S. securities laws. Forward-looking statements include, among other things, projections, estimates, and information about possible or future results related to the Portfolio, market or regulatory developments. The views expressed above are not guarantees of future performance or economic results and involve certain risks, uncertainties and assumptions that could cause actual outcomes and results to differ materially from the views expressed herein. The views expressed above are those of the Advisor as of December 31, 2012 and are subject to change at any time based upon economic, market, or other conditions and the Advisor undertakes no obligation to update the views expressed herein. Any discussions of specific securities should not be considered a recommendation to buy or sell those securities. The views expressed above (including any forward-looking statement) may not be relied upon as investment advice or as an indication of the Fund’s trading intent. Information about the Fund’s holdings, asset allocation or country diversification is historical and is not an indication of future Fund composition, which may vary.
The performance of any index mentioned in this commentary has not been adjusted for ongoing management, distribution and operating expenses, and sales charges applicable to mutual fund investments. In addition, the returns do not reflect additional fees charged by separate accounts or variable insurance contracts that an investor in the Fund may pay. If these additional fees were reflected, performance would have been lower.
Annual Shareholder Report
4
Dividend Capture Fund (Continued)
Performance data quoted represents past performance which is no guarantee of future results. Investment return and principal value will fluctuate so that an investor’s shares, when redeemed, may be worth more or less than their original cost. Mutual fund performance changes over time and current performance may be lower or higher than what is stated. For current to the most recent month end performance, visit www.huntingtonfunds.com or call 1-800-253-0412. For after-tax returns call 1-800-253-0412. Returns shown do not reflect the deduction of taxes that a shareholder would pay on Fund distributions or the redemption of Fund Shares. Mutual funds are not obligations of or guaranteed by any bank and are not federally insured. Total returns, at load, include the maximum 4.75% sales charge for the Class A Shares.
| | | | |
| Class | | Expense Ratios | |
A | | | 1.15% | |
Trust | | | 0.90% | |
The above expense ratios are from the Funds’ prospectus dated September 27, 2012. Additional information pertaining to the Fund’s expense ratio as of December 31, 2012 can be found in the financial highlights.
The Fund’s performance assumes the reinvestment of all dividends and distributions on securities. The S&P 500 and DCIB have been adjusted to reflect reinvestment of dividends on securities in the indices.
Investments in real estate investment trusts (“REITs”) and real-estate related securities involves special risks associated with an investment in real estate, such as limited liquidity and interest rate risks and may be more volatile than other securities. In addition, the value of REITs and other real estate-related investments is sensitive to changes in real estate values, extended vacancies of properties and other environmental and economic factors.
There are no guarantees that dividend paying stocks will continue to pay dividends. In addition, dividend paying stocks may not experience the same capital appreciation potential as nondividend paying stocks.
The funds are distributed by Unified Financial Securities, Inc. (Member FINRA), a wholly owned subsidiary of Huntington Bancshares, Inc. and an affiliate of Huntington Asset Advisors, Inc., the advisor to the Huntington Funds.
| * | Represents a hypothetical investment of $10,000 in the Fund after deducting the maximum sales load of 4.75% ($10,000 investment minus $475 sales load = $9,525). |
| † | The S&P 500 and DCIB are not adjusted to reflect sales charges, expenses, or other fees that the Securities and Exchange Commission requires to be reflected in the Fund’s performance. The indices are unmanaged and, unlike the Fund, are not affected by cashflows. It is not possible to invest directly in an index. |
Annual Shareholder Report
5
| | |
Global Select Markets Fund | | As of 12/31/12 |
Management’s Discussion of Fund Performance
Portfolio Manager:
Paul W. Attwood, CFA
Vice President
Huntington Asset Advisors, Inc.
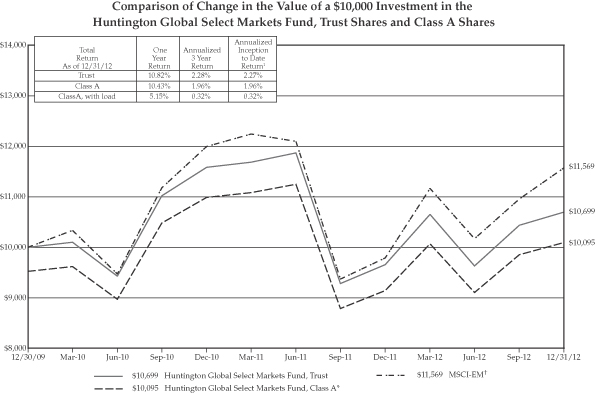
For the fiscal year ended December 31, 2012, the Huntington Global Select Markets Fund produced total returns (not including the deduction of applicable sales charges) of 10.82% and 10.43% for its Trust and Class A Shares respectively, based on net asset value. The Fund underperformed the total return of 18.22% for the Morgan Stanley Capital International (“MSCI”) Emerging Markets Index (“MSCI-EM”)1, the Fund’s benchmark index, for the same period.
Some of the best performers in the Index were countries that have in the recent past had significant challenges, both politically and economically. The top performing country was Turkey, up 61%, followed by Egypt, which rallied 44%. These are areas of the globe that the Fund has typically shied away from. We are searching for countries that provide long-term reward relative to the risk assumed. The countries that helped boost the Index in 2012 do not typically fit these parameters. One of the countries we believed would offer significant returns, on a secular basis, was Brazil. Brazil was one of the worst performers in the Index (-4%) and had a dramatic effect on overall relative performance. Concerns over global growth and more specifically, commodity demand from China, kept buyers away from Brazilian equities. Global trade, at this point, appears to be bottoming and we believe this should bode well for a rebound in the more industrialized sectors of their economy.
In addition to an underperforming equity market, the Brazilian Real was one of the weaker emerging markets currencies, falling by 9% against the U.S. Dollar. Indonesia’s Rupiah fell over 7% on concerns that the government was not progressing fast enough on domestic development in the country. Some of the stronger currencies were in the European region, specifically Eastern Europe, where an alternative to holding Euro in the form of Polish Zloty (+11%) appealed to investors. The South Korean Won was one of Asia’s star performers, up over 8%. This was largely due to a substantial interest rate differential between the Won and most of the developed world.
Annual Shareholder Report
6
Global Select Markets Fund (Continued)
With regards to sector performance, investors were “barbelling” strategies to reduce overall risk while still holding equities in sectors that would participate in growth driven rallies. This is evident in the top performing areas. Investments typically considered beneficiaries of an improving economy, technology (+26%) and financials (+22%) rallied along with areas considered to be defensive in nature, health care (+32%) and consumer staples (+23%). Energy (+2%) and utilities (+2%) were the weakest areas. This is symbolic of the constant barrage of headlines that were released throughout the year, first giving investors hope for sustained economic recovery followed by concerns over fiscal and political issues.
Our strategy of investing in the most attractive countries globally where there are enormous opportunities for substantial long-term returns cost us in terms of relative performance in 2012. As previously mentioned, the areas that we have concerns about over the long run managed to appreciate substantially. We believe that countries with superior monetary, fiscal and political discipline will reward patient investors. The Huntington Global Select Markets Fund will continue to focus on these core areas with the goal of providing superior risk-adjusted returns in the future.
| ¿ | | The composition of the Fund’s holdings is subject to change. |
| (1) | The MSCI-EM is a market-capitalization weighted equity index comprising 21 of the 48 countries in the MSCI universe. Each MSCI country index is created separately, then aggregated, without change, into MSCI indices. The index is unmanaged and, unlike the Fund, is not affected by cashflows. It is not possible to invest directly in an Index. |
This commentary may include statements that constitute “forward looking statements” under the U.S. securities laws. Forward-looking statements include, among other things, projections, estimates, and information about possible or future results related to the Portfolio, market or regulatory developments. The views expressed above are not guarantees of future performance or economic results and involve certain risks, uncertainties and assumptions that could cause actual outcomes and results to differ materially from the views expressed herein. The views expressed above are those of the Advisor as of December 31, 2012 and are subject to change at any time based upon economic, market, or other conditions and the Advisor undertakes no obligation to update the views expressed herein. Any discussions of specific securities should not be considered a recommendation to buy or sell those securities. The views expressed above (including any forward-looking statement) may not be relied upon as investment advice or as an indication of the Fund’s trading intent. Information about the Fund’s holdings, asset allocation or country diversification is historical and is not an indication of future Fund composition, which may vary.
The performance of any index mentioned in this commentary has not been adjusted for ongoing management, distribution and operating expenses, and sales charges applicable to mutual fund investments. In addition, the returns do not reflect additional fees charged by separate accounts or variable insurance contracts that an investor in the Fund may pay. If these additional fees were reflected, performance would have been lower.
Annual Shareholder Report
7
Global Select Markets Fund (Continued)
Performance data quoted represents past performance which is no guarantee of future results. Investment return and principal value will fluctuate so that an investor’s shares, when redeemed, may be worth more or less than their original cost. Mutual fund performance changes over time and current performance may be lower or higher than what is stated. For current to the most recent month end performance, visit www.huntingtonfunds.com or call 1-800-253-0412. For after-tax returns call 1-800-253-0412. Returns shown do not reflect the deduction of taxes that a shareholder would pay on Fund distributions or the redemption of Fund Shares. Mutual funds are not obligations of or guaranteed by any bank and are not federally insured. Total returns, at load, include the maximum 4.75% sales charge for the Class A Shares.
| | | | |
| Class | | Expense Ratios | |
A | | | 2.17% | |
Trust | | | 1.92% | |
The above expense ratios are from the Funds’ prospectus dated May 1, 2012. Additional information pertaining to the Fund’s expense ratio as of December 31, 2012 can be found in the financial highlights.
The Fund’s performance assumes the reinvestment of all dividends and distributions on securities. The MSCI-EM has been adjusted to reflect reinvestment of dividends on securities in the index.
International investing involves special risks including currency risk, increased volatility of foreign securities, political risks, and differences in auditing and other financial standards. The Fund is subject to the risks associated with its investments in emerging market securities, which tend to be more volatile and less liquid than securities traded in developed countries.
The funds are distributed by Unified Financial Securities, Inc. (Member FINRA), a wholly owned subsidiary of Huntington Bancshares, Inc. and an affiliate of Huntington Asset Advisors, Inc., the advisor to the Huntington Funds.
| * | Represents a hypothetical investment of $10,000 in the Fund after deducting the maximum sales load of 4.75% ($10,000 investment minus $475 sales load = $9,525). |
| (1) | The Fund commenced operations for all share classes on December 30, 2009. |
| † | The MSCI-EM is not adjusted to reflect sales charges, expenses, or other fees that the Securities and Exchange Commission requires to be reflected in the Fund’s performance. The index is unmanaged and, unlike the Fund, is not affected by cashflows. It is not possible to invest directly in an index. |
Annual Shareholder Report
8
| | |
Growth Fund | | As of 12/31/12 |
Management’s Discussion of Fund Performance
Portfolio Manager:
Herb Chen, MBA
Senior Vice President
Huntington Asset Advisors, Inc.
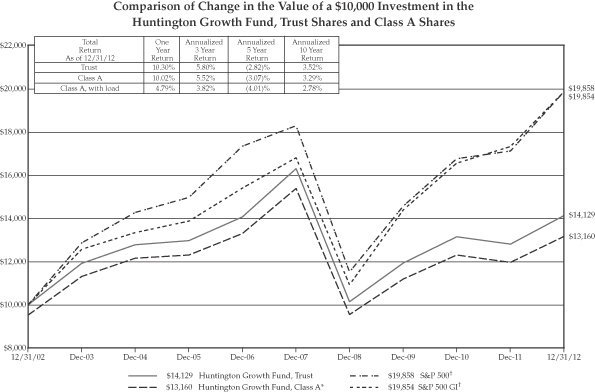
For the fiscal year ended December 31, 2012, the Huntington Growth Fund’s Trust Shares and Class A Shares produced total returns (not including the deduction of applicable sales charges) of 10.30% and 10.02%, respectively, based on net asset value. This performance was less than the total return of 14.60% for the Fund’s benchmark, the Standard & Poor’s 500 Growth Index (“S&P 500 GI”)1, for the same period. The Standard & Poor’s 500 Index (“S&P 500”)2 returned 16.00% for the same period.
The Fund is designed to provide investors with a portfolio of medium-to-large sized companies with potential for above-average growth potential. A top-down investment strategy is followed, using qualitative, quantitative, and technical analysis to evaluate the potential growth of companies in each industry. The stock selection process is also based on relative price to earnings growth methodology.
Portfolio structure had a negative 1.35% impact of the performance relative to the benchmark. Portfolio structure can be explained by a positive 0.52% impact from security selection, and a negative 1.03% and 0.83% impact from sector allocation and security characteristics, respectively. In addition, trading activity had a negative impact of 2.96%.
The three holdings that had the largest positive contribution to the Fund’s performance were Apple, Inc. (5.2%)*, Rackspace Hosting, Inc. (2.3%)* and Whole Foods Market, Inc. (3.0%)*. These three holdings added 3.91% to the Fund’s return. The three holdings that had the largest negative contribution to the Fund’s performance were Cirrus Logic, Inc. (sold), CARBO Ceramics, Inc. (sold) and Express Scripts Holding Co. (sold). These three holdings subtracted 1.56% from the Fund’s return.
| * | Percentage of holdings based on Fund’s net assets as of 12/31/2012. The composition of the Fund’s holdings is subject to change. |
| (1) | The S&P 500 GI is a capitalization-weighted index comprised of stocks in the S&P 500 having the highest price to book ratios. The index consists of approximately half of the S&P 500 on a market capitalization basis. The index is unmanaged and, unlike the Fund, is not affected by cashflows. It is not possible to invest directly in an Index. |
| (2) | The S&P 500 is a capitalization-weighted index comprised of 500 stocks and designed to measure performance of the broad domestic economy through changes in the aggregate market value of 500 stocks representing all major industries. The index is unmanaged and, unlike the Fund, is not affected by cashflows. It is not possible to invest directly in an Index. |
This commentary may include statements that constitute “forward looking statements” under the U.S. securities laws. Forward-looking statements include, among other things, projections, estimates, and information about possible or future results related to the Portfolio, market or regulatory developments. The views expressed above are not guarantees of future performance or economic results and involve certain risks, uncertainties and assumptions that could cause actual outcomes and results to differ materially from the views expressed herein. The views expressed above are those of the Advisor as of December 31, 2012 and are subject to change at any time based upon economic, market, or other conditions and the Advisor undertakes no obligation to update the views expressed herein. Any discussions of specific securities should not be considered a recommendation to buy or sell those securities. The views expressed above (including any forward-looking statement) may not be relied upon as investment advice or as an indication of the Fund’s trading intent. Information about the Fund’s holdings, asset allocation or country diversification is historical and is not an indication of future Fund composition, which may vary.
The performance of any index mentioned in this commentary has not been adjusted for ongoing management, distribution and operating expenses, and sales charges applicable to mutual fund investments. In addition, the returns do not reflect additional fees charged by separate accounts or variable insurance contracts that an investor in the Fund may pay. If these additional fees were reflected, performance would have been lower.
Annual Shareholder Report
9
Growth Fund (Continued)
Performance data quoted represents past performance which is no guarantee of future results. Investment return and principal value will fluctuate so that an investor’s shares, when redeemed, may be worth more or less than their original cost. Mutual fund performance changes over time and current performance may be lower or higher than what is stated. For current to the most recent month end performance, visit www.huntingtonfunds.com or call 1-800-253-0412. For after-tax returns call 1-800-253-0412. Returns shown do not reflect the deduction of taxes that a shareholder would pay on Fund distributions or the redemption of Fund Shares. Mutual funds are not obligations of or guaranteed by any bank and are not federally insured. Total returns, at load, include the maximum 4.75% sales charge for the Class A Shares.
| | | | |
| Class | | Expense Ratios | |
A | | | 1.44% | |
Trust | | | 1.19% | |
The above expense ratios are from the Funds’ prospectus dated May 1, 2012. Additional information pertaining to the Fund’s expense ratio as of December 31, 2012 can be found in the financial highlights.
The Fund’s performance assumes the reinvestment of all dividends and distributions on securities. The S&P 500 and S&P 500 GI have been adjusted to reflect reinvestment of dividends on securities in the indices.
Funds whose investments are concentrated in a specific industry or sector may be subject to a higher degree of market risk than funds whose investments are diversified. In addition, the Fund may be subject to specific risks of the information technology sector, such as obsolescence.
The funds are distributed by Unified Financial Securities, Inc. (Member FINRA), a wholly owned subsidiary of Huntington Bancshares, Inc. and an affiliate of Huntington Asset Advisors, Inc., the advisor to the Huntington Funds.
| * | Represents a hypothetical investment of $10,000 in the Fund after deducting the maximum sales load of 4.75% ($10,000 investment minus $475 sales load = $9,525). |
| † | The S&P 500 and S&P 500 GI are not adjusted to reflect sales charges, expenses, or other fees that the Securities and Exchange Commission requires to be reflected in the Fund’s performance. The indices are unmanaged and, unlike the Fund, are not affected by cashflows. It is not possible to invest directly in an index. |
Annual Shareholder Report
10
| | |
Income Equity Fund | | As of 12/31/12 |
Management’s Discussion of Fund Performance
Portfolio Manager:
Craig J. Hardy, CFA, MBA
Senior Vice President
Huntington Asset Advisors, Inc.
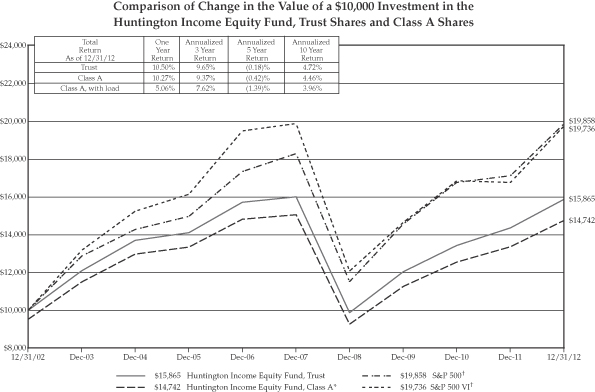
For the fiscal year ended December 31, 2012, the total returns (not including the deduction of applicable sales charges) for the Huntington Income Equity Fund were 10.50% and 10.27% for Trust Shares and Class A Shares, respectively, based on net asset value. These returns compare with a total return of 17.68% for the Standard & Poor’s 500 Value Index (“S&P 500 VI”)1, the Fund’s benchmark, for the same period. The Standard & Poor’s 500 Index (“S&P 500”)2 returned 16.00% for the same period.
During the fiscal year, the Fund was positioned relatively conservatively, with an emphasis on stocks with above average dividend yields, reasonable dividend growth prospects and value orientation. Constructing the Fund with those characteristics meant that the Fund’s largest sector exposure during the fiscal year was in the financials sector, followed by the energy sector. This combination of characteristics produced returns for the Fund that were lower than the return of the S&P 500 VI and the S&P 500 for the reporting period.
The sectors that contributed most positively to the performance of the Fund during the year were financials, health care and consumer staples. Although the financial sector provided the highest total return for the Fund, the performance of the Fund’s financial stocks trailed that of the benchmark’s financial stocks, thus contributing largely to the relative underperformance of the Fund. The sectors that most negatively impacted the Fund’s performance during the reporting period were telecommunications and utilities. During a year of rather strong stock market returns, these sectors did not enjoy the higher level of growth that characterized the broader market, although they did provide a healthy stream of income for the Fund. The stocks that contributed most positively to the performance of the Fund during the year were Seagate Technology (sold), Time Warner Cable, Inc. (1.2%)* and LyondellBasell Industries N.V. (1.3%)*. The stocks that most negatively impacted the Fund’s performance during the year were Best Buy Co., Inc. (sold), Windstream Corp. (1.2%)* and Banco Santander S.A. (sold). In general, the sale of covered calls as a hedging technique added to the performance of the Fund.
| * | Percentage of holdings based on Fund’s net assets as of 12/31/2012. The composition of the Fund’s holdings is subject to change. |
| (1) | The S&P 500 VI is a capitalization-weighted index comprised of the stocks in the S&P 500 having the lowest price to book ratios and consists of approximately half of the S&P 500 on a market capitalization basis. The S&P multifactor methodology is used to score constituents, which are weighted according to market cap and classified as value. The index has a relatively low turnover. The index is unmanaged and, unlike the Fund, is not affected by cashflows. It is not possible to invest directly in an Index. |
| (2) | The S&P 500 is a capitalization-weighted index comprised of 500 stocks and designed to measure performance of the broad domestic economy through changes in the aggregate market value of 500 stocks representing all major industries. The index is unmanaged and, unlike the Fund, is not affected by cashflows. It is not possible to invest directly in an Index. |
This commentary may include statements that constitute “forward looking statements” under the U.S. securities laws. Forward-looking statements include, among other things, projections, estimates, and information about possible or future results related to the Portfolio, market or regulatory developments. The views expressed above are not guarantees of future performance or economic results and involve certain risks, uncertainties and assumptions that could cause actual outcomes and results to differ materially from the views expressed herein. The views expressed above are those of the Advisor as of December 31, 2012 and are subject to change at any time based upon economic, market, or other conditions and the Advisor undertakes no obligation to update the views expressed herein. Any discussions of specific securities should not be considered a recommendation to buy or sell those securities. The views expressed above (including any forward-looking statement) may not be relied upon as investment advice or as an indication of the Fund’s trading intent. Information about the Fund’s holdings, asset allocation or country diversification is historical and is not an indication of future Fund composition, which may vary.
The performance of any index mentioned in this commentary has not been adjusted for ongoing management, distribution and operating expenses, and sales charges applicable to mutual fund investments. In addition, the returns do not reflect additional fees charged by separate accounts or variable insurance contracts that an investor in the Fund may pay. If these additional fees were reflected, performance would have been lower.
Annual Shareholder Report
11
Income Equity Fund (Continued)
Performance data quoted represents past performance which is no guarantee of future results. Investment return and principal value will fluctuate so that an investor’s shares, when redeemed, may be worth more or less than their original cost. Mutual fund performance changes over time and current performance may be lower or higher than what is stated. For current to the most recent month end performance, visit www.huntingtonfunds.com or call 1-800-253-0412. For after-tax returns call 1-800-253-0412. Returns shown do not reflect the deduction of taxes that a shareholder would pay on Fund distributions or the redemption of Fund Shares. Mutual funds are not obligations of or guaranteed by any bank and are not federally insured. Total returns, at load, include the maximum 4.75% sales charge for the Class A Shares.
| | | | |
| Class | | Expense Ratios | |
A | | | 1.45% | |
Trust | | | 1.20% | |
The above expense ratios are from the Funds’ prospectus dated May 1, 2012. Additional information pertaining to the Fund’s expense ratio as of December 31, 2012 can be found in the financial highlights.
The Fund’s performance assumes the reinvestment of all dividends and distributions on securities. The S&P 500 and the S&P 500 VI have been adjusted to reflect reinvestment of dividends on securities in the indices.
There are no guarantees that dividend paying stocks will continue to pay dividends. In addition, dividend paying stocks may not experience the same capital appreciation potential as non-dividend paying stocks.
The funds are distributed by Unified Financial Securities, Inc. (Member FINRA), a wholly owned subsidiary of Huntington Bancshares, Inc. and an affiliate of Huntington Asset Advisors, Inc., the advisor to the Huntington Funds.
| * | Represents a hypothetical investment of $10,000 in the Fund after deducting the maximum sales load of 4.75% ($10,000 investment minus $475 sales load = $9,525). |
| † | The S&P 500 and the S&P 500 VI are not adjusted to reflect sales charges, expenses, or other fees that the Securities and Exchange Commission requires to be reflected in the Fund’s performance. The indices are unmanaged and, unlike the Fund, are not affected by cashflows. It is not possible to invest directly in an index. |
Annual Shareholder Report
12
| | |
International Equity Fund | | As of 12/31/12 |
Management’s Discussion of Fund Performance
Portfolio Manager:
Paul W. Attwood, CFA
Vice President
Huntington Asset Advisors, Inc.
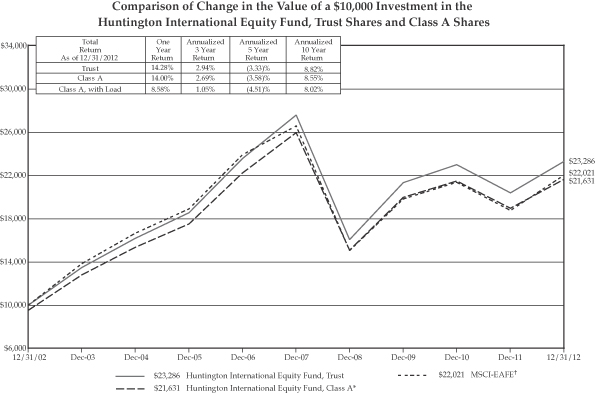
For the fiscal year ended December 31, 2012, the Huntington International Equity Fund produced total returns (not including the deduction of applicable sales charges) of 14.28% and 14.00% for Trust Shares and Class A Shares, respectively, based on net asset value. This underperformed the total return of 17.32% for the Morgan Stanley Capital International (“MSCI”) Europe, Australasia and Far East Index (“MSCI-EAFE”)1, the Fund’s benchmark index, for the same period.
Surprisingly, the top 3 performing countries in the Index were all European: Belgium (+36%), Denmark (+30%) and Germany (+27%). With the almost daily headlines coming out of Europe with regards to the collapse of sovereign debt prices, it is surprising that these markets were able to weather the storm and produce phenomenal returns for the year. On the flipside, as is to be expected, three of the bottom four performers were also European: Greece (-1%), Portugal (-1%) and Spain (-3%). Considering the potentially disastrous outcome from a collapse in both the Euro currency and the related Government debt, the equity markets were able to look through the morass to what appears to be a brighter future.
Concerns over foreign banks holding toxic debt whose quality could be considered questionable, did not prevent equity investors from buying financials and making them the number one performing sector in the MSCI-EAFE with a 28% gain. Consumer discretionary appreciated 22%. Names like Barclays, AXA and BNP Paribas were some of the highest contributors to performance. Michelin in the Consumer discretionary space added substantially to relative performance. Energy and telecommunications were the weakest areas, down 4% and 6% respectively. Vodaphone in the telecommunication space was disappointing after lower sales in troubled parts of Europe had a larger than expected impact on earnings.
European currencies across the board rallied against the dollar in 2012. The Euro managed a gain of 2%. One of the stronger regional currencies was the Norwegian Krone up over 7%. The major story at the end of last year in the currency market was the weakness in the Japanese Yen, which was down over 11% for the year. The newly elected government in Japan appears committed to boosting inflation and jump starting the economy. A devaluing of the Yen should help exporters specifically as we enter 2013.
| (1) | The MSCI-EAFE is a market-capitalization weighted equity index comprising 20 of the 48 countries in the MSCI universe and representing the developed world outside of North America. Each MSCI country index is created separately, then aggregated, without change, into MSCI indices. The index is unmanaged and, unlike the Fund, is not affected by cashflows. It is not possible to invest directly in an Index. |
Annual Shareholder Report
13
International Equity Fund (Continued)
The Fund’s return increment to the MSCI-EAFE was influenced by three main factors: its allocation to sectors and currency, along with exposure to economic factors such as global interest rates. The most beneficial impact to relative performance came from the selection of particular securities. Overall, sector weightings did not contribute to positive relative performance for the year. The portfolio had a positive impact from its weighting in stocks in the materials sector, which were strong contributors to index performance. This was partially offset by an above-index weighting in stocks in the industrial and information technology sectors, which did not add value.
The best contributors to overall return were stocks with less economic growth exposure and generous dividends, including BCE, Inc. (sold) based in Canada, Pearson PLC (1.6%)* and Vodafone Group PLC (1.6%)* based in the United Kingdom, ACE Ltd. (1.6%)*, a Swiss based insurance provider, and Sanofi-Aventis (2.1%)* based in France. Stocks that detracted from relative performance included two banks, Barclays (2.7%)* based in the United Kingdom and BNP Paribas (2.3%)* based in France. Komatsu Ltd. (sold), a Japanese heavy equipment maker, and the Swedish truck builder Volvo AB (1.6%) were also relatively negative. The currency exposure of the portfolio was additive to relative performance, mainly due to an underweight in the Euro, along with less than benchmark exposure to the UK pound and the Australian dollar.
Security selection had the most positive impact on relative performance. The stocks selected for the portfolio and their weightings were generally beneficial to the Fund.
| * | Percentage of holdings based on Fund’s net assets as of 12/31/2012. The composition of the Fund’s holdings is subject to change. |
This commentary may include statements that constitute “forward looking statements” under the U.S. securities laws. Forward-looking statements include, among other things, projections, estimates, and information about possible or future results related to the Portfolio, market or regulatory developments. The views expressed above are not guarantees of future performance or economic results and involve certain risks, uncertainties and assumptions that could cause actual outcomes and results to differ materially from the views expressed herein. The views expressed above are those of the Advisor as of December 31, 2012 and are subject to change at any time based upon economic, market, or other conditions and the Advisor undertakes no obligation to update the views expressed herein. Any discussions of specific securities should not be considered a recommendation to buy or sell those securities. The views expressed above (including any forward-looking statement) may not be relied upon as investment advice or as an indication of the Fund’s trading intent. Information about the Fund’s holdings, asset allocation or country diversification is historical and is not an indication of future Fund composition, which may vary.
The performance of any index mentioned in this commentary has not been adjusted for ongoing management, distribution and operating expenses, and sales charges applicable to mutual fund investments. In addition, the returns do not reflect additional fees charged by separate accounts or variable insurance contracts that an investor in the Fund may pay. If these additional fees were reflected, performance would have been lower.
Annual Shareholder Report
14
International Equity Fund (Continued)
Performance data quoted represents past performance which is no guarantee of future results. Investment return and principal value will fluctuate so that an investor’s shares, when redeemed, may be worth more or less than their original cost. Mutual fund performance changes over time and current performance may be lower or higher than what is stated. For current to the most recent month end performance, visit www.huntingtonfunds.com or call 1-800-253-0412. For after-tax returns call 1-800-253-0412. Returns shown do not reflect the deduction of taxes that a shareholder would pay on Fund distributions or the redemption of Fund Shares. Mutual funds are not obligations of or guaranteed by any bank and are not federally insured. Total returns, at load, include the maximum 4.75% sales charge for the Class A Shares.
| | | | |
| Class | | Expense Ratios | |
A | | | 1.86% | |
Trust | | | 1.61% | |
The above expense ratios are from the Funds’ prospectus dated May 1, 2012. Additional information pertaining to the Fund’s expense ratio as of December 31, 2012 can be found in the financial highlights.
The Fund’s performance assumes the reinvestment of all dividends and distributions. The MSCI-EAFE has been adjusted to reflect reinvestment of dividends on securities in the index.
International investing involves special risks including currency risk, increased volatility of foreign securities, political risks, and differences in auditing and other financial standards. Prices of emerging markets securities can be significantly more volatile than the prices of securities in developed countries and currency risk and political risks are accentuated in emerging markets.
The funds are distributed by Unified Financial Securities, Inc. (Member FINRA), a wholly owned subsidiary of Huntington Bancshares, Inc. and an affiliate of Huntington Asset Advisors, Inc., the advisor to the Huntington Funds.
| * | Represents a hypothetical investment of $10,000 in the Fund after deducting the maximum sales load of 4.75% ($10,000 investment minus $475 sales load = $9,525). |
| † | The MSCI-EAFE is not adjusted to reflect sales charges, expenses, or other fees that the Securities and Exchange Commission requires to be reflected in the Fund’s performance. The index is unmanaged and, unlike the Fund, is not affected by cashflows. It is not possible to invest directly in an index. |
Annual Shareholder Report
15
| | |
Mid Corp America Fund | | As of 12/31/12 |
Management’s Discussion of Fund Performance
Portfolio Manager:
Christopher M. Rowane, CFA, MBA
Senior Vice President
Huntington Asset Advisors, Inc.
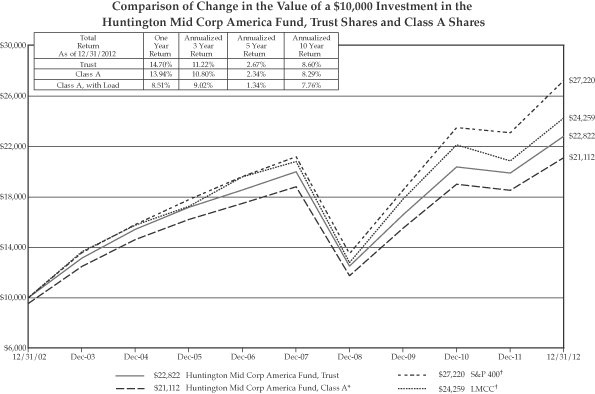
For the fiscal year ended December 31, 2012, the Huntington Mid Corp America Fund’s Trust Shares and Class A Shares produced total returns (not including the deduction of applicable sales charges) of 14.70% and 13.94%, respectively, based upon net asset value. In the same period, the Fund’s benchmark, the Standard & Poor’s MidCap 400 Index (“S&P 400”)1, produced a total return of 17.88%. The Lipper Mid Cap Core Average (“LMCC”)2 returned 15.59% for the same time period.
The three holdings that had the largest positive contribution to the Fund’s performance were Timken Co. (1.9%)*, Mylan, Inc. (2.5%)* and Albemarle Corp. (1.6%)*. These three holdings added 0.94% to the Fund’s return. The three holdings that had the largest negative contribution to the Fund’s performance were Teradata Corp. (2.3%)*, Citrix Systems, Inc. (2.0%)* and ITT Educational Services Inc. (0.2%)*. These three holdings subtracted 1.00% from the Fund’s return.
The Fund’s sector strategy benefited from allocations in healthcare, consumer staples and energy. The Fund’s underweight in the consumer discretionary sector, as well as the security selections in that sector, hampered the performance.
The equity market produced strong returns, especially in the mid-cap space, despite numerous levels of uncertainty from the U.S. Presidential election, European recession and Middle East conflicts. Mid-caps are primarily focused companies that operate and distribute on the domestic economy, which benefited from quantitative easing from the Federal Reserve.
| * | Percentage of holdings based on Fund’s net assets as of 12/31/2012. The composition of the Fund’s holdings is subject to change. |
| (1) | The S&P 400 is a capitalization weighted index comprised of common stocks representing all major industries in the mid-cap range of the U.S. stock market. The index is unmanaged and, unlike the Fund, is not affected by cashflows. It is not possible to invest directly in an Index. |
| (2) | LMCC figures represent the average of the total returns reported by all of the mutual funds designated by the Lipper, Inc. as falling in the category indicated. They do not reflect sales charges. |
This commentary may include statements that constitute “forward looking statements” under the U.S. securities laws. Forward-looking statements include, among other things, projections, estimates, and information about possible or future results related to the Portfolio, market or regulatory developments. The views expressed above are not guarantees of future performance or economic results and involve certain risks, uncertainties and assumptions that could cause actual outcomes and results to differ materially from the views expressed herein. The views expressed above are those of the Advisor as of December 31, 2012 and are subject to change at any time based upon economic, market, or other conditions and the Advisor undertakes no obligation to update the views expressed herein. Any discussions of specific securities should not be considered a recommendation to buy or sell those securities. The views expressed above (including any forward-looking statement) may not be relied upon as investment advice or as an indication of the Fund’s trading intent. Information about the Fund’s holdings, asset allocation or country diversification is historical and is not an indication of future Fund composition, which may vary.
The performance of any index mentioned in this commentary has not been adjusted for ongoing management, distribution and operating expenses, and sales charges applicable to mutual fund investments. In addition, the returns do not reflect additional fees charged by separate accounts or variable insurance contracts that an investor in the Fund may pay. If these additional fees were reflected, performance would have been lower.
Annual Shareholder Report
16
Mid Corp America Fund (Continued)
Performance data quoted represents past performance which is no guarantee of future results. Investment return and principal value will fluctuate so that an investor’s shares, when redeemed, may be worth more or less than their original cost. Mutual fund performance changes over time and current performance may be lower or higher than what is stated. For current to the most recent month end performance, visit www.huntingtonfunds.com or call 1-800-253-0412. For after-tax returns call 1-800-253-0412. Returns shown do not reflect the deduction of taxes that a shareholder would pay on Fund distributions or the redemption of Fund Shares. Mutual funds are not obligations of or guaranteed by any bank and are not federally insured. Total returns, at load, include the maximum 4.75% sales charge for the Class A Shares.
| | | | |
| Class | | Expense Ratios | |
A | | | 1.58% | |
Trust | | | 1.33% | |
The above expense ratios are from the Funds’ prospectus dated May 1, 2012. Additional information pertaining to the Fund’s expense ratio as of December 31, 2012 can be found in the financial highlights.
The Fund’s performance assumes the reinvestment of all dividends and distributions. The S&P 400 and LMCC have been adjusted to reflect reinvestment of dividends on securities in the indices and average.
Mid-cap investing involves greater risk not associated with investing in more established companies, such as greater price volatility, business risk, less liquidity and increased competitive threat.
The funds are distributed by Unified Financial Securities, Inc. (Member FINRA), a wholly owned subsidiary of Huntington Bancshares, Inc. and an affiliate of Huntington Asset Advisors, Inc., the advisor to the Huntington Funds.
| * | Represents a hypothetical investment of $10,000 in the Fund after deducting the maximum sales load of 4.75% ($10,000 investment minus $475 sales load = $9,525). |
| † | The S&P 400 is not adjusted to reflect sales charges, expenses, or other fees that the Securities and Exchange Commission (SEC) requires to be reflected in the Fund’s performance. The index is unmanaged and, unlike the Fund, is not affected by cashflows. It is not possible to invest directly in an index. The LMCC represents the average of the total returns reported by all of the mutual funds designated by Lipper, Inc. as falling in the category indicated, and is not adjusted to reflect any sales charges. However, these total returns are reported net of expenses or other fees that the SEC requires to be reflected in a Fund’s performance. |
Annual Shareholder Report
17
| | |
Real Strategies Fund | | As of 12/31/12 |
Management’s Discussion of Fund Performance
Portfolio Manager:
Peter Sorrentino, CFA
Vice President
Huntington Asset Advisors, Inc.
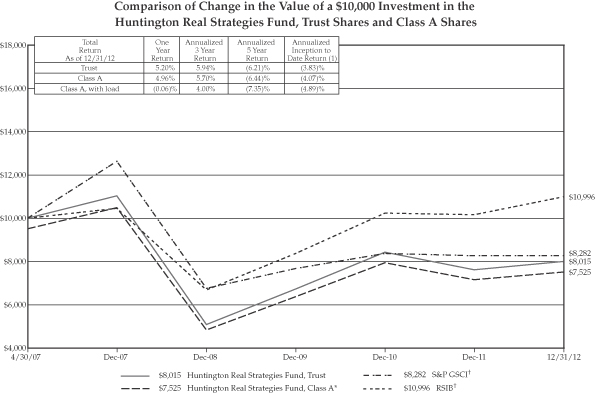
For the fiscal year ended December 31, 2012, the Huntington Real Strategies Fund produced total returns (not including the deduction of applicable sales charges) of 5.20% and 4.96% for Trust Shares and Class A Shares, respectively, based upon net asset value. The Fund outperformed its benchmark, the S&P GSCI® Index (“S&P CSCI”)1, which had a total return of 0.08% for the same period. The Fund underperformed the Real Strategies Indices Blend (“RSIB”)2, which returned 8.14% for the same period.
The Fund’s performance during the year was driven by a wide range of agricultural holdings. Three of the Fund’s top performing holdings were Agrium, Inc. (1.1%)* in the fertilizer arena, along with Valmont Industries, Inc. (1.4%)* and Lindsay Corp. (1.2%)* both manufacturers of irrigation systems. Rounding out the Fund’s top five contributors were Dean Foods Co. (sold) and Rayonier, Inc. (1.6%)*, both closely related to the agricultural industry. These investments represent the deliberate shift in emphasis of the portfolio from the areas of energy and industrial minerals to food related opportunities.
| * | Percentage of holdings based on Fund’s net assets as of 12/31/2012. The composition of the Fund’s holdings is subject to change. |
| (1) | The S&P GSCI® Index measures general price movements and inflation in the world economy. The Index is calculated primarily on a world production-weighted basis and is comprised of the principal physical commodities that are the subject of active, liquid futures markets. The Fund’s investment adviser elected to change the benchmark index from the S&P 500 to the S&P GSCI® Index because the S&P GSCI® Index is more reflective of the securities in which the Fund invests. The indices are unmanaged and, unlike the Fund, are not affected by cashflows. It is not |
| (2) | The Real Strategies Indices Blend is a custom blended index comprised of the following two indices with their noted respective weightings; Reuters/Jefferies CRB Total Return Index (50%) and NAREIT Index (50%). The Reuters/Jefferies CRB Total Return Index is a commodity index, a basket of exchange-traded futures contracts representing long-only positions in underlying commodities. Indices typically include a variety of commodity sectors to provide investors broader exposure to commodities as an asset class and free the investor from the mechanics of future trading (e.g., contract rolling and physical delivery). The index return does not reflect the deduction of expenses, which have been deducted from the Fund’s returns. The Index return assumes reinvestment of all distributions and does not reflect the deduction of taxes and fees. Individuals cannot invest directly in the Index, however, an individual can invest in exchange traded funds or other investment vehicles that attempt to track the performance of benchmark Index. The NAREIT represents returns for the National Association of Real Estate Investment Trust Equity Index. The indices are unmanaged and, unlike the Fund, are not affected by cashflows. |
Annual Shareholder Report
18
Real Strategies Fund (Continued)
After an extended period of higher prices fueled global capacity additions, the Fund witnessed the price impact of those new volumes coming to market. This was particularly evident in 2012 for the prices in the energy and industrial metals markets. Coal producers were among those hit hard as evidenced by the performance of the Fund’s holdings in Natural Resource Partners, down 31.6% and Adaro Energy, down 9.7%. The decline in energy prices impacted many of the Fund’s foreign holdings as the U.S. Dollar was stronger relative to resource exporters such as Canada, Brazil and Indonesia. The negative currency impact hurt the Fund’s holding in Canadian Natural Resources Ltd. (0.9%)*, Canadian Oil Sands Ltd. (1.0%)*, Cameco Corp. (0.6%)*, Vale SA (0.6%)* and BHP Billiton Ltd. (0.6%)*.
Following over a decade of strong price advances, gold and silver turned in modest returns for 2012. The Fund’s silver holdings gained just 7.8% followed by the gold positions gain of 7.3%. These modest returns were still far better than the fate of the gold mining stocks as evidenced by the 22.6% decline for shares of Barrick Gold Corp.
These returns bear out the shift in asset emphasis towards food and away from energy and metals.
| * | Percentage of holdings based on Fund’s net assets as of 12/31/2012. The composition of the Fund’s holdings is subject to change. |
| (1) | The S&P GSCI® Index measures general price movements and inflation in the world economy. The Index is calculated primarily on a world production-weighted basis and is comprised of the principal physical commodities that are the subject of active, liquid futures markets. The Fund’s investment adviser elected to change the benchmark index from the S&P 500 to the S&P GSCI® Index because the S&P GSCI® Index is more reflective of the securities in which the Fund invests. The indices are unmanaged and, unlike the Fund, are not affected by cashflows. It is not |
| (2) | The Real Strategies Indices Blend is a custom blended index comprised of the following two indices with their noted respective weightings; Reuters/Jefferies CRB Total Return Index (50%) and NAREIT Index (50%). The Reuters/Jefferies CRB Total Return Index is a commodity index, a basket of exchange-traded futures contracts representing long-only positions in underlying commodities. Indices typically include a variety of commodity sectors to provide investors broader exposure to commodities as an asset class and free the investor from the mechanics of future trading (e.g., contract rolling and physical delivery). The index return does not reflect the deduction of expenses, which have been deducted from the Fund’s returns. The Index return assumes reinvestment of all distributions and does not reflect the deduction of taxes and fees. Individuals cannot invest directly in the Index, however, an individual can invest in exchange traded funds or other investment vehicles that attempt to track the performance of benchmark Index. The NAREIT represents returns for the National Association of Real Estate Investment Trust Equity Index. The indices are unmanaged and, unlike the Fund, are not affected by cashflows. |
This commentary may include statements that constitute “forward looking statements” under the U.S. securities laws. Forward-looking statements include, among other things, projections, estimates, and information about possible or future results related to the Portfolio, market or regulatory developments. The views expressed above are not guarantees of future performance or economic results and involve certain risks, uncertainties and assumptions that could cause actual outcomes and results to differ materially from the views expressed herein. The views expressed above are those of the Advisor as of December 31, 2012 and are subject to change at any time based upon economic, market, or other conditions and the Advisor undertakes no obligation to update the views expressed herein. Any discussions of specific securities should not be considered a recommendation to buy or sell those securities. The views expressed above (including any forward-looking statement) may not be relied upon as investment advice or as an indication of the Fund’s trading intent. Information about the Fund’s holdings, asset allocation or country diversification is historical and is not an indication of future Fund composition, which may vary.
The performance of any index mentioned in this commentary has not been adjusted for ongoing management, distribution and operating expenses, and sales charges applicable to mutual fund investments. In addition, the returns do not reflect additional fees charged by separate accounts or variable insurance contracts that an investor in the Fund may pay. If these additional fees were reflected, performance would have been lower.
Annual Shareholder Report
19
Real Strategies Fund (Continued)
Performance data quoted represents past performance which is no guarantee of future results. Investment return and principal value will fluctuate so that an investor’s shares, when redeemed, may be worth more or less than their original cost. Mutual fund performance changes over time and current performance may be lower or higher than what is stated. For current to the most recent month end performance, visit www.huntingtonfunds.com or call 1-800-253-0412. For after-tax returns call 1-800-253-0412. Returns shown do not reflect the deduction of taxes that a shareholder would pay on Fund distributions or the redemption of Fund Shares. Mutual funds are not obligations of or guaranteed by any bank and are not federally insured. Total returns, at load, include the maximum 4.75% sales charge for the Class A Shares.
| | | | |
| Class | | Expense Ratios | |
A | | | 1.68% | |
Trust | | | 1.43% | |
The above expense ratios are from the Funds’ prospectus dated May 1, 2012. Additional information pertaining to the Fund’s expense ratio as of December 31, 2012 can be found in the financial highlights.
The Fund’s performance assumes the reinvestment of all dividends and distributions. The S&P GSCI and RSIB have been adjusted to reflect reinvestment of dividends on securities in the indices.
Investments in real estate investment trusts (“REITs”) and real-estate related securities involve special risks associated with an investment in real estate, such as limited liquidity and interest rate risks and may be more volatile than other securities. In addition, the value of REITs and other real estate-related investments is sensitive to changes in real estate values, extended vacancies of properties and other environmental and economic factors.
Commodities-related investments are subject to the same risks as direct investments in commodities and prices may rise and fall in response to many factors such as economic, political and regulatory developments.
Funds whose investments are concentrated in a specific industry or sector may be subject to a higher degree of market risk than funds whose investments are diversified.
The funds are distributed by Unified Financial Securities, Inc. (Member FINRA), a wholly owned subsidiary of Huntington Bancshares, Inc. and an affiliate of Huntington Asset Advisors, Inc., the advisor to the Huntington Funds.
| * | Represents a hypothetical investment of $10,000 in the Fund after deducting the maximum sales load of 4.75% ($10,000 investment minus $475 sales load = $9,525). |
| (1) | The Fund commenced operations for all Share classes on May 2, 2007. |
| † | The S&P GSCI and RSIB are not adjusted to reflect sales charges, expenses, or other fees that the Securities and Exchange Commission requires to be reflected in the Fund’s performance. The indices are unmanaged and, unlike the Fund, are not affected by cashflows. It is not possible to invest directly in an index. |
Annual Shareholder Report
20
| | |
Rotating Markets Fund | | As of 12/31/12 |
Management’s Discussion of Fund Performance
Portfolio Manager:
Paul Koscik, JD
Vice President
Huntington Asset Advisors, Inc.
For the fiscal year ended December 31, 2012, the Huntington Rotating Markets Fund’s Trust Shares and Class A Shares produced total returns (not including the deduction of applicable sales charges) of 6.40% and 6.07%, respectively, based upon net asset value. In the same period, the Fund’s benchmark, the Standard & Poor’s 500 Index (“S&P 500”)1, produced a total return of 16.00%.
The Rotating Markets Fund began 2012 emulating the Dow Jones Industrial Average. By the end of March, the index began to underperform the S&P 500 Index. Based on circumstances at that time, it was determined that the best index to emulate was the NASDAQ-100 Index. The reasoning behind the decision was that mid-caps, small-caps, and international indices were underperforming the S&P 500. The only major index outperforming the S&P 500 was the NASDAQ-100 Index. Initially, the rotation was beneficial, however, the NASDAQ-100 began to underperform the S&P 500 in September. The underperformance accelerated as leading stocks such as Apple, Microsoft, Oracle, Intel, and Cisco sold off sharply on fears of a weakening economy. For the last half of the year, the Fund’s Trust Shares returned only 1.8%.
Although 2012 was a difficult year for the Fund, a long-term perspective is very important. In 2013, we intend to continue to follow our strategy of focusing on cyclical macroeconomic trends to identify the areas that have the potential to offer the best combination of risk/return potential over the next 12 months and rotate to a different market segment should we decide that it the best course of action for the Fund.
| ¿ | | The composition of the Fund’s holdings is subject to change. |
| (1) | The S&P 500 is a capitalization-weighted index comprised of 500 stocks and is designed to measure performance of the broad domestic economy through changes in the aggregate market value of 500 stocks representing all major industries. The index is unmanaged and, unlike the Fund, is not affected by cashflows. It is not possible to invest directly in an Index. |
This commentary may include statements that constitute “forward looking statements” under the U.S. securities laws. Forward-looking statements include, among other things, projections, estimates, and information about possible or future results related to the Portfolio, market or regulatory developments. The views expressed above are not guarantees of future performance or economic results and involve certain risks, uncertainties and assumptions that could cause actual outcomes and results to differ materially from the views expressed herein. The views expressed above are those of the Advisor as of December 31, 2012 and are subject to change at any time based upon economic, market, or other conditions and the Advisor undertakes no obligation to update the views expressed herein. Any discussions of specific securities should not be considered a recommendation to buy or sell those securities. The views expressed above (including any forward-looking statement) may not be relied upon as investment advice or as an indication of the Fund’s trading intent. Information about the Fund’s holdings, asset allocation or country diversification is historical and is not an indication of future Fund composition, which may vary.
The performance of any index mentioned in this commentary has not been adjusted for ongoing management, distribution and operating expenses, and sales charges applicable to mutual fund investments. In addition, the returns do not reflect additional fees charged by separate accounts or variable insurance contracts that an investor in the Fund may pay. If these additional fees were reflected, performance would have been lower.
Annual Shareholder Report
21
Rotating Markets Fund (Continued)
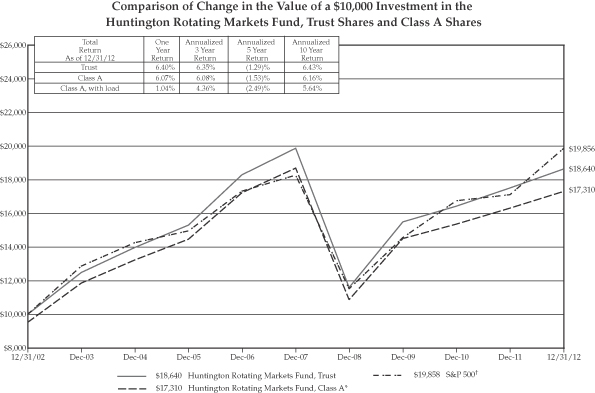
Performance data quoted represents past performance which is no guarantee of future results. Investment return and principal value will fluctuate so that an investor’s shares, when redeemed, may be worth more or less than their original cost. Mutual fund performance changes over time and current performance may be lower or higher than what is stated. For current to the most recent month end performance, visit www.huntingtonfunds.com or call 1-800-253-0412. For after-tax returns call 1-800-253-0412. Returns shown do not reflect the deduction of taxes that a shareholder would pay on Fund distributions or the redemption of Fund Shares. Mutual funds are not obligations of or guaranteed by any bank and are not federally insured. Total returns, at load, include the maximum 4.75% sales charge for the Class A Shares.
| | | | |
| Class | | Expense Ratios | |
A | | | 1.47% | |
Trust | | | 1.22% | |
The above expense ratios are from the Funds’ prospectus dated May 1, 2012. Additional information pertaining to the Fund’s expense ratio as of December 31, 2012 can be found in the financial highlights.
The Fund’s performance assumes the reinvestment of all dividends and distributions. The S&P 500 has been adjusted to reflect reinvestment of dividends on securities in the index.
International investing involves special risks including currency risk, increased volatility of foreign securities, political risks, and differences in auditing and other financial standards. Prices of emerging markets securities can be significantly more volatile than the prices of securities in developed countries and currency risk and political risks are accentuated in emerging markets.
Small company stocks may be less liquid and subject to greater price volatility than large capitalization stocks.
Funds whose investments are concentrated in a specific industry or sector may be subject to a higher degree of market risk than funds whose investments are diversified. In addition, the Fund may be subject to specific risks of the information technology sector, such as obsolescence.
The funds are distributed by Unified Financial Securities, Inc. (Member FINRA), a wholly owned subsidiary of Huntington Bancshares, Inc. and an affiliate of Huntington Asset Advisors, Inc., the advisor to the Huntington Funds.
| * | Represents a hypothetical investment of $10,000 in the Fund after deducting the maximum sales load of 4.75% ($10,000 investment minus $475 sales load = $9,525). |
| † | The S&P 500 is not adjusted to reflect sales charges, expenses, or other fees that the Securities and Exchange Commission requires to be reflected in the Fund’s performance. The index is unmanaged and, unlike the Fund, is not affected by cashflows. It is not possible to invest directly in an index. |
Annual Shareholder Report
22
| | |
Situs Fund | | As of 12/31/12 |
Management’s Discussion of Fund Performance
Portfolio Manager:
B. Randolph Bateman, CFA
Chief Investment Officer
Huntington Asset Advisors, Inc.
For the fiscal year ended December 31, 2012, the Huntington Situs Fund’s Trust Shares and Class A Shares produced total returns (not including the deduction of applicable sales charges) of 24.11% and 23.82%, respectively, based upon net asset value. The Fund significantly out performed its benchmark, the Standard and Poor’s SmallCap 600 Index (“S&P 600”)1, which rose 16.33% for the same period. The Standard and Poor’s MidCap 400 Index (“S&P 400”)2 gained 17.88% for the same period. At year end, the Fund received a Five-Star Overall Morningstar RatingTM in the Mid-Cap Blend category. An attribution evaluation that Huntington Asset Advisors, Inc. conducts on all Huntington Funds indicates that the Fund’s performance was primarily created by security selection, but also shows significant contribution from sector emphasis or avoidance as well.
The management contribution of performance over the benchmark for the Fund was 3.63%. That contribution was attributed to portfolio structure, of which 1.88% was sector allocation and 8.58% was individual stock selection. Since security selection was the primary contributor to overperformance, the larger holdings seemed to be the major drivers of performance. Geoscience Technologies Corp. added 4.36%, Cabela’s, Inc. contributed 2.21%, Flowserve Corp. rose 1.35% and a takeover, Asia Pacific Brewers Ltd. added 1.3% to the superior performance over the benchmark.
Despite significant uncertainty in the markets due to the economy, the Presidential election, tax uncertainty and international turmoil, investors still found value in the equity markets, which virtually all performed well. Going into 2013, we believe the markets will react to political efforts to reduce and control the budget deficit. The tax questions have been cleared a bit, but the freezing of fiscal activities could be of investor concern. In reflection of the passage of the Sarbanes- Oxley law earlier this century, the sweeping Healthcare Reform laws and the Dodd Frank regulations could create a spate of merger and acquisition activities. We are looking at ways to take advantage of the potential for smaller cap stocks to seek merger partners, to go private or otherwise seek to develop economies of scale. This scenario could uncover significant value in companies that the Situs Fund holds.
| ¿ | | The composition of the Fund’s holdings is subject to change. |
| (1) | The S&P 600 is a capitalization-weighted index representing all major industries in the small-cap range of the U.S. stock market. The index is unmanaged and, unlike the Fund, is not affected by cashflows. It is not possible to invest directly in an Index. |
| (2) | The S&P 400 is a capitalization-weighted index comprised of common stocks representing all major industries in the mid-range of the U.S. stock market. The index is unmanaged and, unlike the Fund, is not affected by cashflows. It is not possible to invest directly in an Index. |
This commentary may include statements that constitute “forward looking statements” under the U.S. securities laws. Forward-looking statements include, among other things, projections, estimates, and information about possible or future results related to the Portfolio, market or regulatory developments. The views expressed above are not guarantees of future performance or economic results and involve certain risks, uncertainties and assumptions that could cause actual outcomes and results to differ materially from the views expressed herein. The views expressed above are those of the Advisor as of December 31, 2012 and are subject to change at any time based upon economic, market, or other conditions and the Advisor undertakes no obligation to update the views expressed herein. Any discussions of specific securities should not be considered a recommendation to buy or sell those securities. The views expressed above (including any forward-looking statement) may not be relied upon as investment advice or as an indication of the Fund’s trading intent. Information about the Fund’s holdings, asset allocation or country diversification is historical and is not an indication of future Fund composition, which may vary.
The performance of any index mentioned in this commentary has not been adjusted for ongoing management, distribution and operating expenses, and sales charges applicable to mutual fund investments. In addition, the returns do not reflect additional fees charged by separate accounts or variable insurance contracts that an investor in the Fund may pay. If these additional fees were reflected, performance would have been lower.
Annual Shareholder Report
23
Situs Fund (Continued)
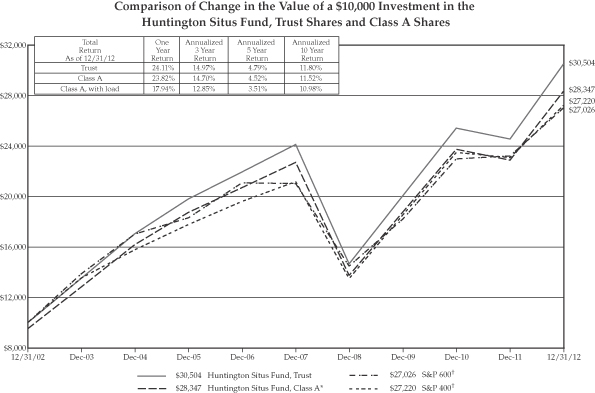
Performance data quoted represents past performance which is no guarantee of future results. Investment return and principal value will fluctuate so that an investor’s shares, when redeemed, may be worth more or less than their original cost. Mutual fund performance changes over time and current performance may be lower or higher than what is stated. For current to the most recent month end performance, visit www.huntingtonfunds.com or call 1-800-253-0412. For after-tax returns call 1-800-253-0412. Returns shown do not reflect the deduction of taxes that a shareholder would pay on Fund distributions or the redemption of Fund Shares. Mutual funds are not obligations of or guaranteed by any bank and are not federally insured. Total returns, at load, include the maximum 4.75% sales charge for the Class A Shares.
| | | | |
| Class | | Expense Ratios | |
A | | | 1.59% | |
Trust | | | 1.34% | |
The above expense ratios are from the Funds’ prospectus dated May 1, 2012. Additional information pertaining to the Fund’s expense ratio as of December 31, 2012 can be found in the financial highlights.
The Fund’s performance assumes the reinvestment of all dividends and distributions. The S&P 600 and S&P 400 have been adjusted to reflect reinvestment of dividends on securities in the indices.
International investing involves special risks including currency risk, increased volatility of foreign securities, political risks, and differences in auditing and other financial standards.
Small company stocks may be less liquid and subject to greater price volatility than large capitalization stocks.
Funds whose investments are concentrated in a specific industry or sector may be subject to a higher degree of market risk than funds whose investments are diversified. In addition, the Fund may be subject to specific risks of the information technology sector, such as obsolescence.
The funds are distributed by Unified Financial Securities, Inc. (Member FINRA), a wholly owned subsidiary of Huntington Bancshares, Inc. and an affiliate of Huntington Asset Advisors, Inc., the advisor to the Huntington Funds.
| * | Represents a hypothetical investment of $10,000 in the Fund after deducting the maximum sales load of 4.75% ($10,000 investment minus $475 sales load = $9,525). |
| † | The S&P 600 and S&P 400 are not adjusted to reflect sales charges, expenses, or other fees that the Securities and Exchange Commission requires to be reflected in the Fund’s performance. The indices are unmanaged and, unlike the Fund, are not affected by cashflows. It is not possible to invest directly in an index. |
Annual Shareholder Report
24
| | |
Fixed Income Securities Fund | | As of 12/31/12 |
Management’s Discussion of Fund Performance
Portfolio Manager:
Kirk Mentzer, MBA
Senior Vice President and Director of Research
Huntington Asset Advisors, Inc.
For the fiscal year ended December 31, 2012, the Huntington Fixed Income Securities Fund’s Trust Shares and Class A Shares produced total returns (not including the deduction of applicable sales charges) of 3.98% and 3.74%, respectively, based on net asset value. The Fund underperformed the Fund’s benchmark, the Barclays Government/Credit Bond Index (“BGCBI”)1, which had a total return of 4.82% for the same period.
Treasury yields rose slightly in the fourth quarter as central bank actions heavily influenced markets. Corporate bonds were the best performing sector with a +1.3% incremental return over Treasury securities as investors’ search for yield drove prices higher. In terms of sub-sector performance, first place honors go to the banking industry, followed closely by insurance. Lagging groups included the technology and consumer areas.
Positive contributors to the Fund’s performance included an asset allocation overweight of corporate bonds. However, corporate bond selection was too conservative as higher quality issues lagged throughout the year and resulted in the overall underperformance of the Fund.
| ¿ | | The composition of the Fund’s holdings is subject to change. |
| (1) | The BGCBI comprises bonds that are investment grade rated Baa or higher by Moody’s or BBB or higher by Standard & Poor’s, if unrated by Moody’s. Issues must have at least one year to maturity. The index is unmanaged and, unlike the Fund, is not affected by cashflows. It is not possible to invest directly in an Index. |
This commentary may include statements that constitute “forward looking statements” under the U.S. securities laws. Forward-looking statements include, among other things, projections, estimates, and information about possible or future results related to the Portfolio, market or regulatory developments. The views expressed above are not guarantees of future performance or economic results and involve certain risks, uncertainties and assumptions that could cause actual outcomes and results to differ materially from the views expressed herein. The views expressed above are those of the Advisor as of December 31, 2012 and are subject to change at any time based upon economic, market, or other conditions and the Advisor undertakes no obligation to update the views expressed herein. Any discussions of specific securities should not be considered a recommendation to buy or sell those securities. The views expressed above (including any forward-looking statement) may not be relied upon as investment advice or as an indication of the Fund’s trading intent. Information about the Fund’s holdings, asset allocation or country diversification is historical and is not an indication of future Fund composition, which may vary.
The performance of any index mentioned in this commentary has not been adjusted for ongoing management, distribution and operating expenses, and sales charges applicable to mutual fund investments. In addition, the returns do not reflect additional fees charged by separate accounts or variable insurance contracts that an investor in the Fund may pay. If these additional fees were reflected, performance would have been lower.
Annual Shareholder Report
25
Fixed Income Securities Fund (Continued)
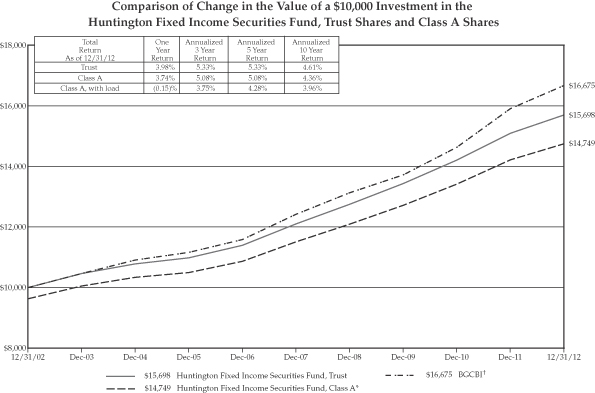
Performance data quoted represents past performance which is no guarantee of future results. Investment return and principal value will fluctuate so that an investor’s shares, when redeemed, may be worth more or less than their original cost. Mutual fund performance changes over time and current performance may be lower or higher than what is stated. For current to the most recent month end performance, visit www.huntingtonfunds.com or call 1-800-253-0412. For after-tax returns call 1-800-253-0412. Returns shown do not reflect the deduction of taxes that a shareholder would pay on Fund distributions or the redemption of Fund Shares. Mutual funds are not obligations of or guaranteed by any bank and are not federally insured. Total returns, at load, include the maximum 3.75% sales charge for the Class A Shares.
| | | | |
| Class | | Expense Ratios | |
A | | | 1.30% | |
Trust | | | 1.05% | |
The above expense ratios are from the Funds’ prospectus dated May 1, 2012. Additional information pertaining to the Fund’s expense ratio as of December 31, 2012 can be found in the financial highlights.
The Fund’s performance assumes the reinvestment of all dividends and distributions. The BGCBI has been adjusted to reflect reinvestment of dividends on securities in the index.
The funds are distributed by Unified Financial Securities, Inc. (Member FINRA), a wholly owned subsidiary of Huntington Bancshares, Inc. and an affiliate of Huntington Asset Advisors, Inc., the advisor to the Huntington Funds.
| * | Represents a hypothetical investment of $10,000 in the Fund after deducting the maximum sales load of 3.75% ($10,000 investment minus $375 sales load = $9,625). |
| † | The BGCBI is not adjusted to reflect sales charges, expenses, or other fees that the Securities and Exchange Commission requires to be reflected in the Fund’s performance. The index is unmanaged and, unlike the Fund, is not affected by cashflows. It is not possible to invest directly in an index. |
Annual Shareholder Report
26
| | |
Intermediate Government Income Fund | | As of 12/31/12 |
Management’s Discussion of Fund Performance
Portfolio Manager:
William G. Doughty; MBA
Vice President
Huntington Asset Advisors, Inc.
For the fiscal year ended December 31, 2012, the Huntington Intermediate Government Income Fund produced total returns (not including the deduction of applicable sales charges) of 1.68% and 1.53% for Trust and Class A Shares, respectively, based on net asset value. This compared with the return of the Barclays Intermediate Government/Credit Index (“BIGC”)1, the Fund’s benchmark, return of 3.89%, the Merrill Lynch U.S. Treasuries/Agencies 1-10 Years Index’s (“G5A0 1-10”)2 return of 1.87% and the Lipper Short-Intermediate Government Funds Average3 of 1.69% for the same period.
During 2012, the Barclays U.S. Aggregate Bond Index 4, which represents a broad bond market index, showed a return of 4.22%. Sector performance favored corporate bonds by a wide margin. The Fund’s underperformance against its benchmark index, the BIGC, was due to the asset mix of the portfolio. The Fund’s mandate does not include owning corporate bonds, which were the best asset class during the year. The risk off trade was due to the slowing economy in the U.S. and the problems in Europe as accounts were reaching for yield. The mortgage portion of the portfolio did benefit the Fund, as mortgage securities had a good relative performance in 2012, despite the pre-payment risk with lower interest rates.
| ¿ | | The composition of the Fund’s holdings is subject to change. |
| | Bond prices are sensitive to changes in interest rates and a rise in interest rates can cause a decline in their prices. |
| (1) | The BIGC is a market value weighted performance benchmark for government and corporate fixed-rate debt issues with maturities between one and ten years. The index is unmanaged and, unlike the Fund, is not affected by cashflows. It is not possible to invest directly in an Index. |
| (2) | The MLTA 1-10 tracks the current 10-year Treasury securities. This index is produced by Merrill Lynch, Pierce, Fenner & Smith, Inc. The index is unmanaged and, unlike the Fund, is not affected by cashflows. It is not possible to invest directly in an Index. |
| (3) | Lipper figures represent the average of the total returns reported by all of the mutual funds designated by Lipper Inc. as falling into the category indicated. They do not reflect sales charges. |
| (4) | The Barclay’s U.S. Aggregate Bond Index is composed of securities from the Barclay’s Government/Corporate Bond Index, Mortgage Securities Index and the Asset Based Securities Index. Total return comprises price appreciation/depreciation and income as a percentage of the original investment. Indices are rebalanced monthly by market capitalization. The index is unmanaged and, unlike the Fund, is not affected by cashflows. It is not possible to invest directly in an Index. |
This commentary may include statements that constitute “forward looking statements” under the U.S. securities laws. Forward-looking statements include, among other things, projections, estimates, and information about possible or future results related to the Portfolio, market or regulatory developments. The views expressed above are not guarantees of future performance or economic results and involve certain risks, uncertainties and assumptions that could cause actual outcomes and results to differ materially from the views expressed herein. The views expressed above are those of the Advisor as of December 31, 2012 and are subject to change at any time based upon economic, market, or other conditions and the Advisor undertakes no obligation to update the views expressed herein. Any discussions of specific securities should not be considered a recommendation to buy or sell those securities. The views expressed above (including any forward-looking statement) may not be relied upon as investment advice or as an indication of the Fund’s trading intent. Information about the Fund’s holdings, asset allocation or country diversification is historical and is not an indication of future Fund composition, which may vary.
The performance of any index mentioned in this commentary has not been adjusted for ongoing management, distribution and operating expenses, and sales charges applicable to mutual fund investments. In addition, the returns do not reflect additional fees charged by separate accounts or variable insurance contracts that an investor in the Fund may pay. If these additional fees were reflected, performance would have been lower.
Annual Shareholder Report
27
Intermediate Government Income Fund (Continued)
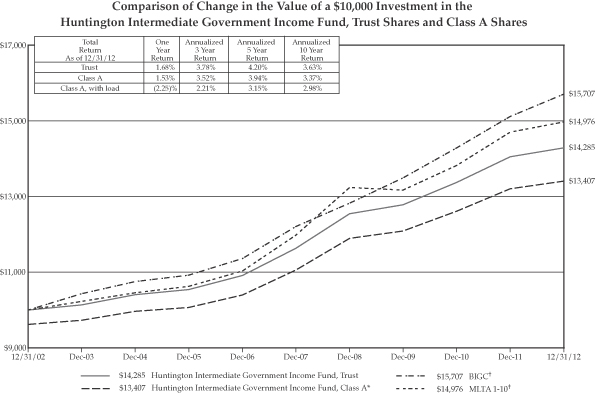
Performance data quoted represents past performance which is no guarantee of future results. Investment return and principal value will fluctuate so that an investor’s shares, when redeemed, may be worth more or less than their original cost. Mutual fund performance changes over time and current performance may be lower or higher than what is stated. For current to the most recent month end performance, visit www.huntingtonfunds.com or call 1-800-253-0412. For after-tax returns call 1-800-253-0412. Returns shown do not reflect the deduction of taxes that a shareholder would pay on Fund distributions or the redemption of Fund Shares. Mutual funds are not obligations of or guaranteed by any bank and are not federally insured. Total returns, at load, include the maximum 3.75% sales charge for the Class A Shares.
| | | | |
| Class | | Expense Ratios | |
A | | | 1.33% | |
Trust | | | 1.08% | |
The above expense ratios are from the Funds’ prospectus dated May 1, 2012. Additional information pertaining to the Fund’s expense ratio as of December 31, 2012 can be found in the financial highlights.
The Fund’s performance assumes the reinvestment of all dividends and distributions. The BIGC and MLTA 1-10 have been adjusted to reflect reinvestment of dividends on securities in the indices.
The value of some mortgage-backed securities may be particularly sensitive to changes in prevailing interest rates, and although the securities are generally supported by some form of government or private insurance, there is no assurance that private guarantors or insurers will meet their obligations.
The funds are distributed by Unified Financial Securities, Inc. (Member FINRA), a wholly owned subsidiary of Huntington Bancshares, Inc. and an affiliate of Huntington Asset Advisors, Inc., the advisor to the Huntington Funds.
| * | Represents a hypothetical investment of $10,000 in the Fund after deducting the maximum sales load of 3.75% ($10,000 investment minus $375 sales load = $9,625). |
| † | The BIGC and MLTA 1-10 are not adjusted to reflect sales charges, expenses, or other fees that the Securities and Exchange Commission requires to be reflected in the Fund’s performance. The indices are unmanaged and, unlike the Fund, are not affected by cashflows. It is not possible to invest directly in an index. |
Annual Shareholder Report
28
| | |
Mortgage Securities Fund | | As of 12/31/12 |
Management’s Discussion of Fund Performance
Co-Portfolio Managers:
William G. Doughty, MBA
Vice President
Gustave J. Seasongood
Vice President
Huntington Asset Advisors, Inc.
For the fiscal year ended December 31, 2012, the Huntington Mortgage Securities Fund produced returns (not including the deduction of applicable sales charges) of 2.95% and 2.68% for the Fund’s Trust and Class A Shares, respectively, based on net asset value. This compared to the total return of 2.59% for the Fund’s benchmark, the Barclays Mortgage Backed Securities Index (“BMBSI”)1, and the Lipper U.S. Mortgage Funds Average2 return of 4.32% for the same period.
During 2012, the mortgage market outperformed Treasuries. The mortgage market had a return of 2.59%, as measured by the BMBSI for the year, compared to a return of 2.16% for Treasuries. The Agency position had no impact on the Fund’s performance. The relative under performance of the Fund was due to its more defensive nature and the concern of pre-payment risk due to lower interest rates, as well as faster prepayments. The 12% exposure to the REIT (Real Estate Investment Trust) market helped the Fund’s return. As measured by the NAREIT Index (“NAREIT”)3, REITs produced a return of 19.67%.
| ¿ | | The composition of the Fund’s holdings is subject to change. |
| | Bond prices are sensitive to changes in interest rates, and a rise in interest rates can cause a decline in their prices. |
| (1) | The BMBSI is composed of all fixed securities mortgage pools by the Government National Mortgage Association (GNMA), Federal National Mortgage Association and the Federal Home Loan Mortgage Corporation, including GNMA Graduated Payment Mortgages. The index is unmanaged and, unlike the Fund, is not affected by cashflows. It is not possible to invest directly in an Index. |
| (2) | Lipper figures represent the average of the total returns reported by all of the mutual funds designated by Lipper Inc. as falling into the category indicated. They do not reflect sales charges |
| (3) | The NAREIT Index represents returns for the FTSE National Association of Real Estate Investment Trust All Equity REITs Index. The index is unmanaged and, unlike the Fund, is not affected by cashflows. It is not possible to invest directly in an Index. |
This commentary may include statements that constitute “forward looking statements” under the U.S. securities laws. Forward-looking statements include, among other things, projections, estimates, and information about possible or future results related to the Portfolio, market or regulatory developments. The views expressed above are not guarantees of future performance or economic results and involve certain risks, uncertainties and assumptions that could cause actual outcomes and results to differ materially from the views expressed herein. The views expressed above are those of the Advisor as of December 31, 2012 and are subject to change at any time based upon economic, market, or other conditions and the Advisor undertakes no obligation to update the views expressed herein. Any discussions of specific securities should not be considered a recommendation to buy or sell those securities. The views expressed above (including any forward-looking statement) may not be relied upon as investment advice or as an indication of the Fund’s trading intent. Information about the Fund’s holdings, asset allocation or country diversification is historical and is not an indication of future Fund composition, which may vary.
The performance of any index mentioned in this commentary has not been adjusted for ongoing management, distribution and operating expenses, and sales charges applicable to mutual fund investments. In addition, the returns do not reflect additional fees charged by separate accounts or variable insurance contracts that an investor in the Fund may pay. If these additional fees were reflected, performance would have been lower.
Annual Shareholder Report
29
Mortgage Securities Fund (Continued)
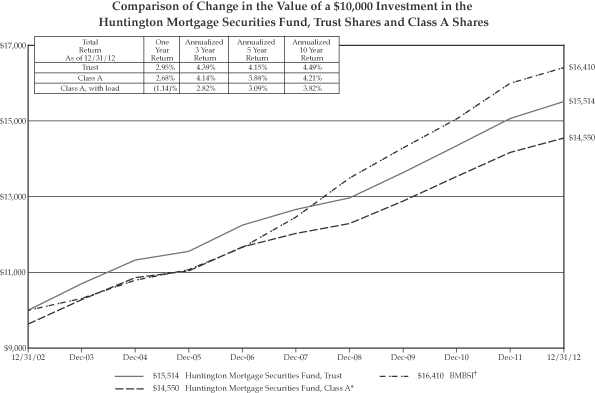
Performance data quoted represents past performance which is no guarantee of future results. Investment return and principal value will fluctuate so that an investor’s shares, when redeemed, may be worth more or less than their original cost. Mutual fund performance changes over time and current performance may be lower or higher than what is stated. For current to the most recent month end performance, visit www.huntingtonfunds.com or call 1-800-253-0412. For after-tax returns call 1-800-253-0412. Returns shown do not reflect the deduction of taxes that a shareholder would pay on Fund distributions or the redemption of Fund Shares. Mutual funds are not obligations of or guaranteed by any bank and are not federally insured. Total returns, at load, include the maximum 3.75% sales charge for the Class A Shares.
| | | | |
| Class | | Expense Ratios | |
A | | | 1.37% | |
Trust | | | 1.12% | |
The above expense ratios are from the Funds’ prospectus dated May 1, 2012. Additional information pertaining to the Fund’s expense ratio as of December 31, 2012 can be found in the financial highlights.
The Fund’s performance assumes the reinvestment of all dividends and distributions. The BMBSI has been adjusted to reflect reinvestment of dividends on securities in the index.
The value of some mortgage-backed securities may be particularly sensitive to changes in prevailing interest rates, and although the securities are generally supported by some form of government or private insurance, there is no assurance that private guarantors or insurers will meet their obligations.
Investments in real estate investment trusts (“REITs”) involve special risks associated with an investment in real estate such as limited liquidity and interest rate risk. In addition, the value of REITs and other real estate-related investments is sensitive to changes in real estate values, extended vacancies of properties and other environmental and economic factors.
The funds are distributed by Unified Financial Securities, Inc. (Member FINRA), a wholly owned subsidiary of Huntington Bancshares, Inc. and an affiliate of Huntington Asset Advisors, Inc., the advisor to the Huntington Funds.
| * | Represents a hypothetical investment of $10,000 in the Fund after deducting the maximum sales load of 3.75% ($10,000 investment minus $375 sales load = $9,625). |
| † | The BMBSI is not adjusted to reflect sales charges, expenses, or other fees that the Securities and Exchange Commission requires to be reflected in the Fund’s performance. The index is unmanaged and, unlike the Fund, is not affected by cashflows. It is not possible to invest directly in an index. |
Annual Shareholder Report
30
| | |
Ohio Tax-Free Fund | | As of 12/31/12 |
Management’s Discussion of Fund Performance
Portfolio Manager:
Kathy Stylarek
Vice President
Huntington Asset Advisors, Inc.
For the fiscal year ended December 31, 2012, the Huntington Ohio Tax-Free Fund’s Trust Shares and Class A Shares produced total returns (not including the deduction of applicable sales charges) of 3.90% and 3.65%, respectively, based on net asset value. The Fund’s benchmark, the Barclays 7-Year Municipal Bond Index (“B7MB”)1, returned 4.20% for the same period. The Lipper Ohio Municipal Debt Funds Average2, the Fund’s peer group, had a total return of 7.49% for the same period.
The Fund was positioned more defensively than its benchmark with a shorter duration, which resulted in a lower but consistent relative performance for the year. The Fund underperformed its Lipper peer group, but was positively impacted by the strong performance of municipals in the intermediate range of the curve. The lower quality, longer maturities performed well throughout the year although our focus was on the Short and Intermediate Ohio quality names. Municipal bonds began the year with the ratio of municipals to Treasuries paying 96% to 164% of what Treasury yields were paying3. By the end of the year, the yield ratio of municipals to Treasuries rose to the 110%-157% levels.
The number of new deals declined and supply was very constrained. This was the driving force that pushed rates lower throughout the year. Also, it should be mentioned that approximately 60% of the new deals that came to market were of the refunding type that did not give a significant boost to the inventory shortage. The Fund was again impacted this year from the Ohio December 1 call/maturity affect. We were able to get this liquidity put back to work but it took a few weeks due to the lack of outstanding inventory.
In general, the longer maturity and lower quality bond sector began the year strong and continued to drive the market all year. The Fund delivered predictable tax-free income (free of AMT impact) and offered some consistent gains. Our focus remained on higher quality general obligation and essential service bonds, which provided a consistent predicable performance.
We were also able to capitalize on some sectors that we usually do not participate in because bonds are priced with not enough yield. We took positions in some zero coupon bonds that offered good value against the current yield curve. The zero coupon bonds offered good yield and offset some of the net asset value reduction from the premium bond amortization within the Fund. The zero coupon bond sectors offered the stability and yield necessary to provide some above average yield without compromising quality. Our focus remained on the non-AMT bonds, which pay income that is tax-free.
| ¿ | | The composition of the Fund’s holdings is subject to change. |
| (1) | The B7MB is comprised of intermediate term, investment grade, tax-exempt bonds with maturities between 6 and 8 years. The index is unmanaged and, unlike the Fund, is not affected by cashflows. It is not possible to invest directly in an Index. |
| (2) | Lipper figures represent the average of the total returns reported by all of the mutual funds designated by Lipper Inc. as falling into the respective category indicated. They do not reflect sales charges. |
| (3) | Bond prices are sensitive to changes in interest rates, and a rise in interest rates can cause a decline in their prices. |
| | Income generated by this Fund may be subject to the federal alternative minimum tax. |
This commentary may include statements that constitute “forward looking statements” under the U.S. securities laws. Forward-looking statements include, among other things, projections, estimates, and information about possible or future results related to the Portfolio, market or regulatory developments. The views expressed above are not guarantees of future performance or economic results and involve certain risks, uncertainties and assumptions that could cause actual outcomes and results to differ materially from the views expressed herein. The views expressed above are those of the Advisor as of December 31, 2012 and are subject to change at any time based upon economic, market, or other conditions and the Advisor undertakes no obligation to update the views expressed herein. Any discussions of specific securities should not be considered a recommendation to buy or sell those securities. The views expressed above (including any forward-looking statement) may not be relied upon as investment advice or as an indication of the Fund’s trading intent. Information about the Fund’s holdings, asset allocation or country diversification is historical and is not an indication of future Fund composition, which may vary.
The performance of any index mentioned in this commentary has not been adjusted for ongoing management, distribution and operating expenses, and sales charges applicable to mutual fund investments. In addition, the returns do not reflect additional fees charged by separate accounts or variable insurance contracts that an investor in the Fund may pay. If these additional fees were reflected, performance would have been lower.
Annual Shareholder Report
31
Ohio Tax-Free Fund (Continued)
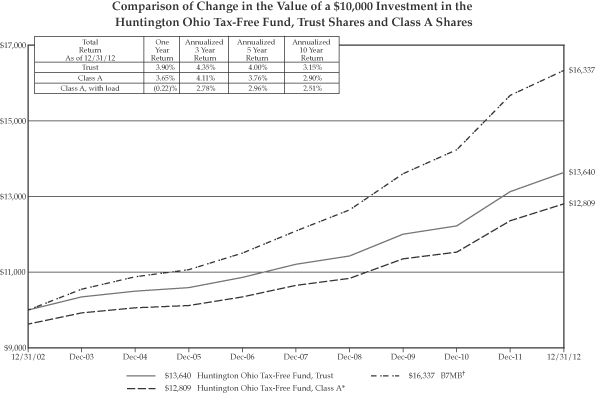
Performance data quoted represents past performance which is no guarantee of future results. Investment return and principal value will fluctuate so that an investor’s shares, when redeemed, may be worth more or less than their original cost. Mutual fund performance changes over time and current performance may be lower or higher than what is stated. For current to the most recent month end performance, visit www.huntingtonfunds.com or call 1-800-253-0412. For after-tax returns call 1-800-253-0412. Returns shown do not reflect the deduction of taxes that a shareholder would pay on Fund distributions or the redemption of Fund Shares. Mutual funds are not obligations of or guaranteed by any bank and are not federally insured. Total returns, at load, include the maximum 3.75% sales charge for the Class A Shares.
| | | | |
| Class | | Expense Ratios | |
A | | | 1.47% | |
Trust | | | 1.22% | |
The above expense ratios are from the Funds’ prospectus dated May 1, 2012. Additional information pertaining to the Fund’s expense ratio as of December 31, 2012 can be found in the financial highlights.
The Fund’s performance assumes the reinvestment of all dividends and distributions. The B7MB has been adjusted to reflect reinvestment of dividends on securities in the index.
The funds are distributed by Unified Financial Securities, Inc. (Member FINRA), a wholly owned subsidiary of Huntington Bancshares, Inc. and an affiliate of Huntington Asset Advisors, Inc., the advisor to the Huntington Funds.
| * | Represents a hypothetical investment of $10,000 in the Fund after deducting the maximum sales load of 3.75% ($10,000 investment minus $375 sales load = $9,625). |
| † | The B7MB is not adjusted to reflect sales charges, expenses, or other fees that the Securities and Exchange Commission requires to be reflected in the Fund’s performance. The index is unmanaged and, unlike the Fund, is not affected by cashflows. It is not possible to invest directly in an index. |
Annual Shareholder Report
32
| | |
Short/Intermediate Fixed Income Securities Fund | | As of 12/31/12 |
Management’s Discussion of Fund Performance
Portfolio Manager:
William G. Doughty, MBA
Vice President
Huntington Asset Advisors, Inc.
For the fiscal year ended December 31, 2012, the Huntington Short/Intermediate Fixed Income Securities Fund produced total returns (not including the deduction of applicable sales charges) of 1.79% and 1.48% for the Fund’s Trust and Class A Shares, respectively, based on net asset value. This compared with a return for the BofA Merrill Lynch 1-5 Year Corporate/Government Credit Index (“ML 1-5YGC”)1, the Fund’s benchmark index, of 2.47%, and the Lipper Short-Intermediate Investment Grade Debt Fund Average2 of 4.90% for the same period.
Overall, performance of the Fund for 2012 was lower than similar funds and the benchmark index due to the Fund’s shorter duration versus both the benchmark and Lipper. Treasuries had a return of 2.16% for the year3. Agencies had a return of 2.44% for the one year period ended December 31, 2012 while corporate bonds had a return of 10.37% for the same period. At fiscal year end, the Fund held 75% of its portfolio in corporate debt, 20% in federal agencies, and 5.0% in treasuries. Corporate bonds outperformed treasuries and agencies during the year and the Fund’s overweight to corporate bonds helped the Fund’s return. The two-year Treasury had a return of 0.28%, while the five-year Treasury had a return of 2.27%. The duration of the Fund was 2.35 years versus the benchmark’s duration of 2.69 years.
| ¿ | | The composition of the Fund’s holdings is subject to change. |
| (1) | The ML 1-5YGC trades short-term U.S. government securities and short-term domestic investment-grade corporate bonds with maturities between 1 and 4.99 years. The index is unmanaged and, unlike the Fund, is not affected by cashflows. It is not possible to invest directly in an Index. |
| (2) | Lipper figures represent the average of the total returns reported by all of the mutual funds designated by Lipper Inc. as falling into the category indicated. They do not reflect sales charges. |
| (3) | Bond prices are sensitive to changes in interest rates, and a rise in interest rates can cause a decline in their prices. |
This commentary may include statements that constitute “forward looking statements” under the U.S. securities laws. Forward-looking statements include, among other things, projections, estimates, and information about possible or future results related to the Portfolio, market or regulatory developments. The views expressed above are not guarantees of future performance or economic results and involve certain risks, uncertainties and assumptions that could cause actual outcomes and results to differ materially from the views expressed herein. The views expressed above are those of the Advisor as of December 31, 2012 and are subject to change at any time based upon economic, market, or other conditions and the Advisor undertakes no obligation to update the views expressed herein. Any discussions of specific securities should not be considered a recommendation to buy or sell those securities. The views expressed above (including any forward-looking statement) may not be relied upon as investment advice or as an indication of the Fund’s trading intent. Information about the Fund’s holdings, asset allocation or country diversification is historical and is not an indication of future Fund composition, which may vary.
The performance of any index mentioned in this commentary has not been adjusted for ongoing management, distribution and operating expenses, and sales charges applicable to mutual fund investments. In addition, the returns do not reflect additional fees charged by separate accounts or variable insurance contracts that an investor in the Fund may pay. If these additional fees were reflected, performance would have been lower.
Annual Shareholder Report
33
| | |
Short/Intermediate Fixed Income Securities Fund | | (Continued) |
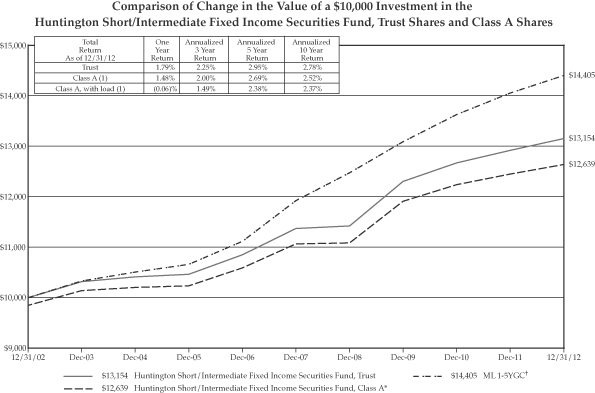
Performance data quoted represents past performance which is no guarantee of future results. Investment return and principal value will fluctuate so that an investor’s shares, when redeemed, may be worth more or less than their original cost. Mutual fund performance changes over time and current performance may be lower or higher than what is stated. For current to the most recent month end performance, visit www.huntingtonfunds.com or call 1-800-253-0412. For after-tax returns call 1-800-253-0412. Returns shown do not reflect the deduction of taxes that a shareholder would pay on Fund distributions or the redemption of Fund Shares. Mutual funds are not obligations of or guaranteed by any bank and are not federally insured. Total returns, at load, include the maximum 1.50% sales charge for the Class A Shares.
| | | | |
| Class | | Expense Ratios | |
A | | | 1.31% | |
Trust | | | 1.06% | |
The above expense ratios are from the Funds’ prospectus dated May 1, 2012. Additional information pertaining to the Fund’s expense ratio as of December 31, 2012 can be found in the financial highlights.
The Fund’s performance assumes the reinvestment of all dividends and distributions. The ML1-5YGC has been adjusted to reflect reinvestment of dividends on securities in the index.
The funds are distributed by Unified Financial Securities, Inc. (Member FINRA), a wholly owned subsidiary of Huntington Bancshares, Inc. and an affiliate of Huntington Asset Advisors, Inc., the advisor to the Huntington Funds.
| * | Represents a hypothetical investment of $10,000 in the Fund after deducting the maximum sales load of 1.50% ($10,000 investment minus $150 sales load = $9,850). |
| (1) | Class A Shares commenced operations on May 9, 2003. Prior to May 9, 2003, performance is based on the performance of Trust Shares adjusted for the Class A Shares 12b-1 fees and sales charge. |
| † | The ML 1-5YGC is not adjusted to reflect sales charges, expenses, or other fees that the Securities and Exchange Commission requires to be reflected in the Fund’s performance. The index is unmanaged and, unlike the Fund, is not affected by cashflows. It is not possible to invest directly in an index. |
Annual Shareholder Report
34
| | |
Balanced Allocation Fund | | As of 12/31/12 |
Management’s Discussion of Fund Performance
Manager:
Paula Jurcenko
Senior Vice President
Huntington Asset Advisors, Inc.
For the fiscal year ended December 31, 2012, the Huntington Balanced Allocation Fund Class A Shares produced a total return (not including the deduction of applicable sales charges) of 7.79% based on net asset value. This performance compares to the 16.00% total return of its benchmark, the Standard and Poor’s 500 Index (“S&P 500”)1 and the 11.29% total return for the Balanced Allocation Indices Blend (“BAIB”)2 for the same period.
Huntington Asset Advisors Inc. utilizes optimization software and both internal and external research to analyze the economy and the capital markets to determine the optimal allocation of asset classes to capitalize on current market conditions. Based on these models, the manager constructs the portfolio of the underlying Huntington Funds that comprise the Balanced Allocation Fund. During 2012, this resulted in four tactical allocation changes that were implemented in the Fund.
2012 saw many events that both bolstered and undermined the market’s confidence. Yet, despite continued economic uncertainty, a divisive political climate and election, the fiscal cliff, and the end of the Mayan Calendar – 2012 saw the S&P 500 rise 16%. A positive total year return did not negate the overall market volatility, however, with the S&P swinging as much as positively 15% and negatively 9% from its various highs and lows. It is because of these market gyrations that Huntington’s tactical re-allocations provided value. Of the four shifts, the first occurred in March when Huntington’s Investment Policy Committee (“IPC”) reduced exposure in small- and mid-cap securities to increase cash. This move was a defensive tactic as the market had seen a 30% upward run since its October 2011 lows. This move reduced the downside effect of any potential correctional forces. The second move occurred in May, as IPC reduced the total cash position from its previous tactical move and increased exposure in Large-Cap domestic equities. Following a 9% decline in the market since IPC’s previous decision, the S&P 500 was flirting with IPC’s near-term trading range. It seemed appropriate to add back equity exposure with Large-Cap names to take advantage of its lower boundary. The third move occurred in August, as IPC increased its total cash position to 5% with a pro-rata reduction in all equity subclasses. The market had risen almost 10% since the previous change and it was deemed appropriate to take some profits off the table. The fourth move occurred in October as the IPC reduced cash again, this time to 2%, and re-allocated towards developed international equity and real assets/commodities. Developed international had previously been underweighted for more than 2 years and this change took a step back towards a neutral allocation. The increase into real assets and commodities was in response to further quantitative easing by world banks pushing up the price of dollar-denominated currencies. Overall, we believe these tactical changes and the Fund’s current allocation will benefit shareholders going forward.
| (1) | The S&P 500 is a capitalization-weighted index comprised of 500 stocks and designed to measure performance of the broad domestic economy through changes in the aggregate market value of 500 stocks representing all major industries. The index is unmanaged and, unlike the Fund, is not affected by cashflows. It is not possible to invest directly in an Index. |
| (2) | The Balanced Allocation Indices Blended Benchmark is a custom blended index comprised of the following two indices with their noted respective weightings: Standard & Poor’s 500 Index (60%) and the Barclays U.S. Aggregate Bond Index (40%). The Barclays U.S. Aggregate Bond Index is comprised of securities from the Barclays Government/Corporate Bond Index, Mortgage Securities Index and the Asset Based Index. Total return comprises price appreciation/depreciation and income as a percentage of the original investment. Indices are rebalanced monthly by market capitalization. The index is unmanaged and, unlike the Fund, is not affected by cashflows. It is not possible to invest directly in an Index. The S&P 500 Index is an unmanaged index generally representing the performance of the broad domestic economy through changes in the aggregate market value of 500 stocks representing all major industries. Investments cannot be made in an index. |
Annual Shareholder Report
35
Balanced Allocation Fund (Continued)
At the end of 2012, the Balanced Allocation Fund had a 65% allocation to equity funds. Of particular importance to the Fund’s performance were the two best asset-weighted performing equity fund holdings in the portfolio, the
Huntington International Equity Fund (11.2%)* and the Huntington Situs Fund (5.3%)*. For the year ended December 31, 2012, the Huntington International Equity Fund’s Trust shares returned 14.28%, which underperformed the 17.32% return of its benchmark, the MSCI-EAFE Index, for the same period. The Huntington Situs Fund Trust shares returned 24.11%, which outperformed the 16.33% return of its benchmark, the S&P SmallCap 600 Index.
At the end of 2012, the Balanced Allocation Fund had a 33% allocation to fixed-income funds. Of particular importance to the Fund’s performance were the two best asset-weighted performing fixed-income fund holdings in the portfolio, the Huntington Short/Intermediate Fixed Income Fund (7.1%)* and the Huntington Intermediate Government Income Fund (7.1%)*. For the year ended December 31, 2012, the Huntington Short/Intermediate Fixed Income Fund Trust shares returned 1.79%, which underperformed the 2.47% return of its benchmark, the BofA Merrill Lynch 1-5 Year Corporate/Government Credit Index, for the same period. The Huntington Intermediate Government Income Fund’s Trust shares returned 1.68%, which underperformed the 3.89% return of its benchmark, the Barclays Intermediate Government/Credit Index for the same period.
| * | Percentage of holdings based on Fund’s net assets as of 12/31/2012. The composition of the Fund’s holdings is subject to change. |
This commentary may include statements that constitute “forward looking statements” under the U.S. securities laws. Forward-looking statements include, among other things, projections, estimates, and information about possible or future results related to the Portfolio, market or regulatory developments. The views expressed above are not guarantees of future performance or economic results and involve certain risks, uncertainties and assumptions that could cause actual outcomes and results to differ materially from the views expressed herein. The views expressed above are those of the Advisor as of December 31, 2012 and are subject to change at any time based upon economic, market, or other conditions and the Advisor undertakes no obligation to update the views expressed herein. Any discussions of specific securities should not be considered a recommendation to buy or sell those securities. The views expressed above (including any forward-looking statement) may not be relied upon as investment advice or as an indication of the Fund’s trading intent. Information about the Fund’s holdings, asset allocation or country diversification is historical and is not an indication of future Fund composition, which may vary.
The performance of any index mentioned in this commentary has not been adjusted for ongoing management, distribution and operating expenses, and sales charges applicable to mutual fund investments. In addition, the returns do not reflect additional fees charged by separate accounts or variable insurance contracts that an investor in the Fund may pay. If these additional fees were reflected, performance would have been lower.
Annual Shareholder Report
36
Balanced Allocation Fund (Continued)
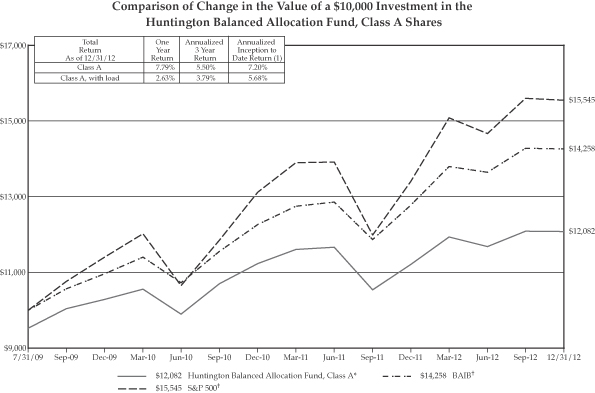
Performance data quoted represents past performance which is no guarantee of future results. Investment return and principal value will fluctuate so that an investor’s shares, when redeemed, may be worth more or less than their original cost. Mutual fund performance changes over time and current performance may be lower or higher than what is stated. For current to the most recent month end performance, visit www.huntingtonfunds.com or call 1-800-253-0412. For after-tax returns call 1-800-253-0412. Returns shown do not reflect the deduction of taxes that a shareholder would pay on Fund distributions or the redemption of Fund Shares. Mutual funds are not obligations of or guaranteed by any bank and are not federally insured. Total returns, at load, include the maximum 4.75% sales charge for the Class A Shares.
| | | | |
| Class | | Expense Ratio | |
A | | | 1.90% | |
The above expense ratio is from the Funds’ prospectus dated May 1, 2012. Additional information pertaining to the Fund’s expense ratio as of December 31, 2012 can be found in the financial highlights.
The Fund’s performance assumes the reinvestment of all dividends and distributions on securities. The S&P 500 and BAIB have been adjusted to reflect reinvestment of dividends on securities in the indices.
The risk of investing in the Huntington Asset Allocation Funds is a reflection of the risks of investing in the Underlying Funds in which each Asset Allocation Fund invests. Therefore, it is important that you carefully read the prospectus for each Underlying Fund. Diversification does not assure profit or protect against loss in a declining market. Asset Allocation Funds do not assure or guarantee better performance and cannot eliminate the risk of investment loss. Before investing, you should carefully read the risk disclosure for each of the Underlying Funds, which can be found in the current prospectus. Because the Funds invest in other Funds, the Funds are shareholders of those Underlying Funds and indirectly bear its proportionate share of the operating expenses, including management fees, of the Underlying Funds.
The funds are distributed by Unified Financial Securities, Inc. (Member FINRA), a wholly owned subsidiary of Huntington Bancshares, Inc. and an affiliate of Huntington Asset Advisors, Inc., the advisor to the Huntington Funds.
| * | Represents a hypothetical investment of $10,000 in the Fund after deducting the maximum sales load of 4.75% ($10,000 investment minus $475 sales load = $9,525). |
| (1) | The Fund commenced operations on July 31, 2009. |
| † | The S&P 500 and BAIB are not adjusted to reflect sales charges, expenses, or other fees that the Securities and Exchange Commission requires to be reflected in the Fund’s performance. The indices are unmanaged and, unlike the Fund, are not affected by cashflows. It is not possible to invest directly in an index. |
Annual Shareholder Report
37
| | |
Conservative Allocation Fund | | As of 12/31/12 |
Management’s Discussion of Fund Performance
Manager:
Paula Jurcenko
Senior Vice President
Huntington Asset Advisors, Inc.
For the fiscal year ended December 31, 2012, the Huntington Conservative Allocation Fund Class A Shares produced a total return (not including the deduction of applicable sales charges) of 4.43% based on net asset value. This performance compares to the 4.21% total return of its benchmark, the Barclay’s U.S. Aggregate Bond Index (“BUSAI”)1 and 6.57% total return for the Conservative Allocation Indices Blend (“CAIB”)2 for the same period.
Huntington Asset Advisors, Inc. utilizes optimization software and both internal and external research to analyze the economy and the capital markets to determine the optimal allocation of asset classes to capitalize on current market conditions. Based on these models, the manager constructs the portfolio of the underlying Huntington Funds that comprise the Conservative Allocation Fund. During 2012, this resulted in four tactical allocation changes that were implemented in the Fund.
2012 saw many events that both bolstered and undermined the market’s confidence. Yet, despite continued economic uncertainty, a divisive political climate and election, the fiscal cliff, and the end of the Mayan Calendar – 2012 saw the S&P 500 rise 16%. A positive total year return did not negate the overall market volatility, however, with the S&P swinging as much as positively 15% and negatively 9% from its various highs and lows. It is because of these market gyrations that Huntington’s tactical re-allocations provided value. Of the four shifts, the first occurred in March when Huntington’s Investment Policy Committee (IPC) reduced exposure in small- and mid-cap securities to increase cash. This move was a defensive tactic as the market had seen a 30% upward run since its October lows. This move reduced the downside effect of any potential correctional forces. The second move occurred in May, as IPC reduced the total cash position from its previous tactical move and increased exposure Large-Cap domestic equities. Following a 9% decline in the market since IPC’s previous decision, the S&P 500 was flirting with IPC’s near-term trading range. It seemed appropriate to add back equity exposure with Large-cap names to take advantage of its lower boundary. The third move occurred in August, as IPC increased its total cash position to 5%, with a pro-rata reduction in all equity subclasses. The market had risen almost 10% since the previous change and it was deemed appropriate to take some profits off the table. The fourth move occurred in October and reduced cash again, this time to 2%, and re-allocated towards developed international equity and real assets/commodities. Developed international had previously been underweighted for more than 2 years and this change took a step back towards a neutral allocation. The increase into real assets and commodities was in response to further quantitative easing by world banks pushing up the price of dollar-denominated currencies. Overall, we believe these tactical changes and the fund’s current allocation will benefit shareholders going forward.
| (1) | The Barclay’s U.S. Aggregate Bond Index is composed of securities from the Barclay’s Government/Corporate Bond Index, Mortgage Securities Index and the Asset Based Securities Index. Total return comprises price appreciation/depreciation and income as a percentage of the original investment. Indices are rebalanced monthly by market capitalization. The index is unmanaged and, unlike the Fund, is not affected by cashflows. It is not possible to invest directly in an Index. |
| (2) | The Conservative Allocation Indices Blended Benchmark is a custom blended index comprised of the following two indices with their noted respective weightings: Standard & Poor’s 500 Index (20%) and the Barclays U.S. Aggregate Bond Index (80%). The Barclays U.S. Aggregate Bond Index is comprised of securities from the Barclays Government/Corporate Bond Index, Mortgage Securities Index and the Asset Based Index. Total return comprises price appreciation/depreciation and income as a percentage of the original investment. Indices are rebalanced monthly by market capitalization. The index is unmanaged and, unlike the Fund, is not affected by cashflows. It is not possible to invest directly in an Index. The S&P 500 Index is an unmanaged index generally representing the performance of the broad domestic economy through changes in the aggregate market value of 500 stocks representing all major industries. Investments cannot be made in an index. |
Annual Shareholder Report
38
Conservative Allocation Fund (Continued)
At the end of 2012, the Conservative Allocation Fund had a 74% allocation to fixed-income funds. Of particular importance to the Fund’s performance were the two best asset-weighted performing fixed-income fund holdings in the portfolio, the Huntington Short/Intermediate Fixed Income Securities Fund (16.0%)* and the Huntington / Intermediate Government Income Fund (16.0%)*. For the year ended December 31, 2012, the Huntington Short/
Intermediate Fixed Income Securities Fund’s Trust shares returned 1.79%, which underperformed the 2.47% return of its benchmark, the BofA Merrill Lynch 1-5 Year Corporate/Government Credit Index, for the same period. The Huntington Intermediate Government Income Fund’s Trust shares returned 1.68%, which underperformed the 3.89% return of its benchmark, the Barclays Intermediate Government/Credit Index for the same period.
At the end of 2012, the Conservative Allocation Fund had a 25% allocation to equity funds. Of particular importance to the Fund’s performance were the two best asset-weighted performing equity fund holdings in the portfolio, the Huntington International Equity Fund (4.4% of the portfolio) and the Huntington Situs Fund (2.1% of the portfolio). For the year ended December 31, 2012, the Huntington International Equity Fund Trust shares returned 14.28%, which underperformed the 17.32% return of its benchmark, the MSCI-EAFE Index, for the same period. The Huntington Situs Fund’s Trust shares returned 24.11%, which outperformed the 16.33% return of its benchmark, the S&P SmallCap 600 Index for the same period.
| * | Percentage of holdings based on Fund’s net assets as of 12/31/2012. The composition of the Fund’s holdings is subject to change. |
This commentary may include statements that constitute “forward looking statements” under the U.S. securities laws. Forward-looking statements include, among other things, projections, estimates, and information about possible or future results related to the Portfolio, market or regulatory developments. The views expressed above are not guarantees of future performance or economic results and involve certain risks, uncertainties and assumptions that could cause actual outcomes and results to differ materially from the views expressed herein. The views expressed above are those of the Advisor as of December 31, 2012 and are subject to change at any time based upon economic, market, or other conditions and the Advisor undertakes no obligation to update the views expressed herein. Any discussions of specific securities should not be considered a recommendation to buy or sell those securities. The views expressed above (including any forward-looking statement) may not be relied upon as investment advice or as an indication of the Fund’s trading intent. Information about the Fund’s holdings, asset allocation or country diversification is historical and is not an indication of future Fund composition, which may vary.
The performance of any index mentioned in this commentary has not been adjusted for ongoing management, distribution and operating expenses, and sales charges applicable to mutual fund investments. In addition, the returns do not reflect additional fees charged by separate accounts or variable insurance contracts that an investor in the Fund may pay. If these additional fees were reflected, performance would have been lower.
Annual Shareholder Report
39
Conservative Allocation Fund (Continued)

Performance data quoted represents past performance which is no guarantee of future results. Investment return and principal value will fluctuate so that an investor’s shares, when redeemed, may be worth more or less than their original cost. Mutual fund performance changes over time and current performance may be lower or higher than what is stated. For current to the most recent month end performance, visit www.huntingtonfunds.com or call 1-800-253-0412. For after-tax returns call 1-800-253-0412. Returns shown do not reflect the deduction of taxes that a shareholder would pay on Fund distributions or the redemption of Fund Shares. Mutual funds are not obligations of or guaranteed by any bank and are not federally insured. Total returns, at load, include the maximum 4.75% sales charge for the Class A Shares.
| | | | |
| Class | | Expense Ratio | |
A | | | 1.90% | |
The above expense ratios is from the Funds’ prospectus dated May 1, 2012. Additional information pertaining to the Fund’s expense ratio as of December 31, 2012 can be found in the financial highlights.
The Fund’s performance assumes the reinvestment of all dividends and distributions on securities. The BUSAI and CAIB have been adjusted to reflect reinvestment of dividends on securities in the indices.
The risk of investing in the Huntington Asset Allocation Funds is a reflection of the risks of investing in the Underlying Funds in which each Asset Allocation Fund invests. Therefore, it is important that you carefully read the prospectus for each Underlying Fund. Diversification does not assure profit or protect against loss in a declining market. Asset Allocation Funds do not assure or guarantee better performance and cannot eliminate the risk of investment loss. Before investing, you should carefully read the risk disclosure for each of the Underlying Funds, which can be found in the current prospectus. Because the Funds invest in other Funds, the Funds are shareholders of those Underlying Funds and indirectly bear its proportionate share of the operating expenses, including management fees, of the Underlying Funds.
The funds are distributed by Unified Financial Securities, Inc. (Member FINRA), a wholly owned subsidiary of Huntington Bancshares, Inc. and an affiliate of Huntington Asset Advisors, Inc., the advisor to the Huntington Funds.
| * | Represents a hypothetical investment of $10,000 in the Fund after deducting the maximum sales load of 4.75% ($10,000 investment minus $475 sales load = $9,525). |
| (1) | The Fund commenced operations on July 31, 2009. |
| † | The BUSAI and CAIB are not adjusted to reflect sales charges, expenses, or other fees that the Securities and Exchange Commission requires to be reflected in the Fund’s performance. The indices are unmanaged and, unlike the Fund, are not affected by cashflows. It is not possible to invest directly in an index. |
Annual Shareholder Report
40
| | |
Growth Allocation Fund | | As of 12/31/12 |
Management’s Discussion of Fund Performance
Manager:
Paula Jurcenko
Senior Vice President
Huntington Asset Advisors, Inc.
For the fiscal year ended December 31, 2012, the Huntington Growth Allocation Fund Class A Shares produced a total return (not including the deduction of applicable sales charges) of 10.01% based on net asset value. This performance compares to the 16.00% total return of its benchmark, the Standard and Poor’s 500 Index (“S&P 500”)1 and the 13.65% total return for the Growth Allocation Indices Blend (“GAIB”)2 for the same period.
Huntington Asset Advisors, Inc. utilizes optimization software and both internal and external research to analyze the economy and the capital markets to determine the optimal allocation of asset classes to capitalize on current market conditions. Based on these models, the manager constructs the portfolio of the underlying Huntington Funds that comprise the Growth Allocation Fund. During 2012, this resulted in four tactical allocation changes that were implemented in the Fund.
2012 saw many events that both bolstered and undermined the market’s confidence. Yet, despite continued economic uncertainty, a divisive political climate and election, the fiscal cliff, and the end of the Mayan Calendar – 2012 saw the S&P 500 rise 16%. A positive total year return did not negate the overall market volatility, however, with the S&P swinging as much as positively 15% and negatively 9% from its various highs and lows. It is because of these market gyrations that Huntington’s tactical re-allocations provided value. Of the four shifts, the first occurred in March when Huntington’s Investment Policy Committee (IPC) reduced exposure in small- and mid-cap securities to increase cash. This move was a defensive tactic as the market had seen a 30% upward run since its October lows. This move reduced the downside effect of any potential correctional forces. The second move occurred in May, as IPC reduced the total cash position from its previous tactical move and increased exposure Large-Cap domestic equities. Following a 9% decline in the market since IPC’s previous decision, the S&P 500 was flirting with IPC’s near-term trading range. It seemed appropriate to add back equity exposure with Large-cap names to take advantage of its lower boundary. The third move occurred in August, as IPC increased its total cash position to 5%, with a pro-rata reduction in all equity subclasses. The market had risen almost 10% since the previous change and it was deemed appropriate to take some profits off the table. The fourth move occurred in October and reduced cash again, this time to 2%, and re-allocated towards developed international equity and real assets/commodities. Developed international had previously been underweighted for more than 2 years and this change took a step back towards a neutral allocation. The increase into real assets and commodities was in response to further quantitative easing by world banks pushing up the price of dollar-denominated currencies. Overall, we believe these tactical changes and the Fund’s current allocation will benefit shareholders going forward.
| (1) | The S&P 500 is a capitalization-weighted index comprised of 500 stocks and designed to measure performance of the broad domestic economy through changes in the aggregate market value of 500 stocks representing all major industries. The index is unmanaged and, unlike the Fund, is not affected by cashflows. It is not possible to invest directly in an Index. |
| (2) | The Growth Allocation Indices Blended Benchmark is a custom blended index comprised of the following two indices with their noted respective weightings: Standard & Poor’s 500 Index (80%) and the Barclays U.S. Aggregate Bond Index (20%). The Barclays U.S. Aggregate Bond Index is comprised of securities from the Barclays Government/Corporate Bond Index, Mortgage Securities Index and the Asset Based Index. Total return comprises price appreciation/depreciation and income as a percentage of the original investment. Indices are rebalanced monthly by market capitalization. The index is unmanaged and, unlike the Fund, is not affected by cashflows. It is not possible to invest directly in an Index. The S&P 500 Index is an unmanaged index generally representing the performance of the broad domestic economy through changes in the aggregate market value of 500 stocks representing all major industries. Investments cannot be made in an index. |
Annual Shareholder Report
41
Growth Allocation Fund (Continued)
At the end of 2012, the Growth Allocation Fund had a 86% allocation to equity funds. Of particular importance to the Fund’s performance were the two best asset-weighted performing equity fund holdings in the portfolio, the Huntington International Equity Fund (14.8%)* and the Huntington Situs Fund (7.0%)*. For the year ended December 31, 2012, the Huntington International Equity Fund’s Trust shares returned 14.28%, which underperformed the 17.32% return of its benchmark, the MSCI-EAFE Index, for the same period. The Huntington Situs Fund’s Trust shares returned 24.11%, which outperformed the 16.33% return of its benchmark, the S&P SmallCap 600 Index for the same period.
At the end of 2012, the Growth Allocation Fund had a 13% allocation to fixed-income funds. Of particular importance to the Fund’s performance were the two best asset-weighted performing fixed-income fund holdings in the portfolio, the Huntington Short/Intermediate Fixed Income Securities Fund (2.8%)* and the Huntington Intermediate Government Income Fund (2.8%)*. For the year ended December 31, 2012, the Huntington Short/Intermediate Fixed Income Securities Fund’s Trust shares returned 1.79%, which underperformed the 2.47% return of its benchmark, the BofA Merrill Lynch 1-5 Year Corporate/Government Credit Index, for the same period. The Huntington Intermediate Government Income Fund’s Trust shares returned 1.68%, which underperformed the 3.89% return of its benchmark, the Barclays Intermediate Government/Credit Index for the same period.
| * | Percentage of holdings based on Fund’s net assets as of 12/31/2012. The composition of the Fund’s holdings is subject to change. |
This commentary may include statements that constitute “forward looking statements” under the U.S. securities laws. Forward-looking statements include, among other things, projections, estimates, and information about possible or future results related to the Portfolio, market or regulatory developments. The views expressed above are not guarantees of future performance or economic results and involve certain risks, uncertainties and assumptions that could cause actual outcomes and results to differ materially from the views expressed herein. The views expressed above are those of the Advisor as of December 31, 2012 and are subject to change at any time based upon economic, market, or other conditions and the Advisor undertakes no obligation to update the views expressed herein. Any discussions of specific securities should not be considered a recommendation to buy or sell those securities. The views expressed above (including any forward-looking statement) may not be relied upon as investment advice or as an indication of the Fund’s trading intent. Information about the Fund’s holdings, asset allocation or country diversification is historical and is not an indication of future Fund composition, which may vary.
The performance of any index mentioned in this commentary has not been adjusted for ongoing management, distribution and operating expenses, and sales charges applicable to mutual fund investments. In addition, the returns do not reflect additional fees charged by separate accounts or variable insurance contracts that an investor in the Fund may pay. If these additional fees were reflected, performance would have been lower.
42
Growth Allocation Fund (Continued)
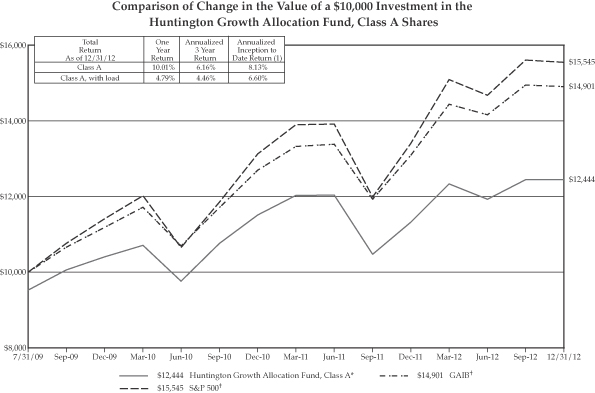
Performance data quoted represents past performance which is no guarantee of future results. Investment return and principal value will fluctuate so that an investor’s shares, when redeemed, may be worth more or less than their original cost. Mutual fund performance changes over time and current performance may be lower or higher than what is stated. For current to the most recent month end performance, visit www.huntingtonfunds.com or call 1-800-253-0412. For after-tax returns call 1-800-253-0412. Returns shown do not reflect the deduction of taxes that a shareholder would pay on Fund distributions or the redemption of Fund Shares. Mutual funds are not obligations of or guaranteed by any bank and are not federally insured. Total returns, at load, include the maximum 4.75% sales charge for the Class A Shares.
| | | | |
| Class | | Expense Ratio | |
A | | | 1.90% | |
The above expense ratios are from the Funds’ prospectus dated May 1, 2012. Additional information pertaining to the Fund’s expense ratio as of December 31, 2012 can be found in the financial highlights.
The Fund’s performance assumes the reinvestment of all dividends and distributions on securities. The S&P 500 and GAIB have been adjusted to reflect reinvestment of dividends on securities in the indices.
The risk of investing in the Huntington Asset Allocation Funds is a reflection of the risks of investing in the Underlying Funds in which each Asset Allocation Fund invests. Therefore, it is important that you carefully read the prospectus for each Underlying Fund. Diversification does not assure profit or protect against loss in a declining market. Asset Allocation Funds do not assure or guarantee better performance and cannot eliminate the risk of investment loss. Before investing, you should carefully read the risk disclosure for each of the Underlying Funds, which can be found in the current prospectus. Because the Funds invest in other Funds, the Funds are shareholders of those Underlying Funds and indirectly bear its proportionate share of the operating expenses, including management fees, of the Underlying Funds.
The funds are distributed by Unified Financial Securities, Inc. (Member FINRA), a wholly owned subsidiary of Huntington Bancshares, Inc. and an affiliate of Huntington Asset Advisors, Inc., the advisor to the Huntington Funds.
| * | Represents a hypothetical investment of $10,000 in the Fund after deducting the maximum sales load of 4.75% ($10,000 investment minus $475 sales load = $9,525). |
| (1) | The Fund commenced operations on July 31, 2009. |
| † | The S&P 500 and GAIB are not adjusted to reflect sales charges, expenses, or other fees that the Securities and Exchange Commission requires to be reflected in the Fund’s performance. The indices are unmanaged and, unlike the Fund, are not affected by cashflows. It is not possible to invest directly in an index. |
Annual Shareholder Report
43
| | |
| | |
| Huntington Tax-Free Money Market Fund | | December 31, 2012 |
| | |
| Portfolio of Investments Summary Table | | (unaudited) |
| | | | |
| Asset Allocation | | Percentage of
Market Value | |
Medical | | | 41.9% | |
Multifamily Housing | | | 23.9% | |
General Obligation | | | 16.5% | |
Higher Education | | | 6.5% | |
Cash | | | 4.8% | |
Development | | | 3.0% | |
School District | | | 2.7% | |
Water | | | 0.5% | |
Airport | | | 0.2% | |
Total | | | 100.0% | |
Portfolio holdings and allocations are subject to change. As of December 31, 2012, percentages in the table above are based on total investments. Such total investments may differ from the percentages set forth below in the Portfolio of Investments which are computed using the Fund’s total net assets.
Portfolio of Investments
| | | | | | | | | | |
Principal
Amount | | | | | Value | | | |
| | | | | | | | | | |
| Municipal Bonds — 95.6% | | | | | | |
| Colorado — 0.2% | | | | | | |
| $ | 145,000 | | | Douglas County, CO, School District No. Re-1 Douglas & Elbert Counties, G.O.,
2.000%, 12/15/13 | | $ | 147,206 | | | |
| Connecticut — 0.3% | | | | | | |
| | 200,000 | | | Woodbury, CT, G.O.,
2.000%, 8/15/13 | | | 201,981 | | | |
| Florida — 17.7% | | | | | | |
| | 1,365,000 | | | Broward County, FL, Housing Finance Authority Revenue, (Freddie Mac Ins.), 0.090%, 12/1/29 (a) | | | 1,365,000 | | | |
| | 300,000 | | | Florida State Housing Finance Corp., Various Refunding Housing Island Club Revenue, 0.090%, 7/1/31 (a) | | | 300,000 | | | |
| | 3,005,000 | | | Jacksonville, FL, Housing Finance Authority Revenue, (Fannie Mae Ins.), 0.090%, 7/15/33 (a) | | | 3,005,000 | | | |
| | 700,000 | | | North Broward, FL, Hospital District Revenue, (MBIA Ins. LOC - Wachovia Bank N.A.), 0.070%, 1/15/27 (a) | | | 700,000 | | | |
| | 700,000 | | | Palm Beach County, FL, Revenue, (LOC - Northern Trust Co.), 0.130%, 11/1/36 (a) | | | 700,000 | | | |
| | 200,000 | | | Palm Beach County, FL, Revenue, (LOC - Northern Trust Co.), 0.150%, 5/1/25 (a) | | | 200,000 | | | |
| | 2,625,000 | | | Pinellas County, FL, Health Facilities Authority Revenue, Series A-1, (AGM Ins.), 0.020%, 11/1/38 (a) | | | 2,625,000 | | | |
| | | | | | | | | | |
Principal
Amount | | | | | Value | | | |
| | | | | | | | | | |
| Municipal Bonds — (Continued) | | | | | | |
| Florida — (Continued) | | | | | | |
| $ | 3,100,000 | | | Sarasota County, FL, Public Hospital District Hospital Revenue, Sarasota Memorial Hospital, Series A, (LOC - Northern Trust Co.), 0.030%, 7/1/37 (a) | | $ | 3,100,000 | | | |
| | 1,100,000 | | | Volusia County, FL, Housing Finance Authority Refunding Revenue, (Fannie Mae Ins.), 0.090%, 1/15/32 (a) | | | 1,100,000 | | | |
| | | | | | | | 13,095,000 | | | |
| Georgia — 2.0% | | | | | | |
| | 1,500,000 | | | Cobb County, GA, Housing Authority Revenue, Tamarron Apartments, (Freddie Mac Ins.), 0.090%, 3/1/24 (a) | | | 1,500,000 | | | |
| Idaho — 1.6% | | | | | | |
| | 1,200,000 | | | Idaho State Housing & Finance Association Revenue, Series A, 0.080%, 1/1/38 (a) | | | 1,200,000 | | | |
| Indiana — 2.3% | | | | | | |
| | 1,200,000 | | | Indiana State Development Finance Authority Revenue, (LOC - JPMorgan Chase Bank), 0.070%, 11/1/35 (a) | | | 1,200,000 | | | |
| | 145,000 | | | Mooresville, IN, Public Library Leasing Corp. Revenue, 2.000%, 7/15/13 | | | 146,163 | | | |
| | 100,000 | | | Mooresville, IN, Public Library Leasing Corp. Revenue, 2.000%, 1/15/13 | | | 100,058 | | | |
| | 250,000 | | | South Bend, IN, Building Corp. Revenue, 3.000%, 2/1/13 | | | 250,535 | | | |
| | | | | | | | 1,696,756 | | | |
(See notes which are an integral part of the Financial Statements)
Annual Shareholder Report
44
| | |
| Huntington Tax-Free Money Market Fund | | (Continued) |
| | | | | | | | | | |
Principal
Amount | | | | | Value | | | |
| | | | | | | | | | |
| Municipal Bonds — (Continued) | | | | | | |
| Iowa — 2.5% | | | | | | |
| $ | 600,000 | | | Iowa State Finance Authority, Health Facilities Authority Revenue, Series B, 0.070%, 2/15/35 (a) | | $ | 600,000 | | | |
| | 900,000 | | | Iowa State Finance Authority, Health Facilities Authority Revenue, Series A, 0.070%, 2/15/35 (a) | | | 900,000 | | | |
| | 320,000 | | | Nevada, IA, Community School District, G.O., 2.000%, 6/1/13 | | | 322,116 | | | |
| | | | | | | | 1,822,116 | | | |
| Kentucky — 0.2% | | | | | | |
| | 150,000 | | | Jefferson County, KY, School District Finance Corp. Revenue, Series A, 3.500%, 7/1/13 | | | 152,235 | | | |
| Massachusetts — 0.2% | | | | | | |
| | 150,000 | | | Tisbury, MA, Muni Purpose Loan, G.O., 2.000%, 11/1/13 | | | 151,991 | | | |
| Michigan — 1.3% | | | | | | |
| | 155,000 | | | Howell Township, MI, Refunding Special Assessment, G.O., Series C, 3.000%, 5/1/13 | | | 156,148 | | | |
| | 130,000 | | | Howell Township, MI, Refunding Special Assessment, G.O., Series B, 2.000%, 5/1/13 | | | 130,512 | | | |
| | 665,000 | | | Howell Township, MI, Refunding Special Assessment, G.O., Series A, 3.000%, 5/1/13 | | | 669,804 | | | |
| | | | | | | | 956,464 | | | |
| Minnesota — 7.3% | | | | | | |
| | 400,000 | | | Burnsville, MN, Multifamily Revenue, 0.110%, 10/15/33 (a) | | | 400,000 | | | |
| | 1,995,000 | | | Minneapolis & St. Paul, MN, Housing & Redevelopment Authority, Health Care Revenue, Allina Health Systems, Series B-1, (LOC - JPMorgan Chase Bank), 0.060%, 11/15/35 (a) | | | 1,995,000 | | | |
| | 1,000,000 | | | Minneapolis, MN, Housing Development Revenue, 0.080%, 9/1/26 (a) | | | 1,000,000 | | | |
| | 2,000,000 | | | Richfield, MN, Housing Revenue, Woodlake Richfield Apartments Project, (LOC - Wells Fargo Bank N.A.), 0.050%, 10/1/53 (a) | | | 2,000,000 | | | |
| | | | | | | | 5,395,000 | | | |
| Missouri — 4.2% | | | | | | |
| | 2,000,000 | | | Missouri State Health & Educational Facilities Authority Revenue, St. Louis University, Series A-2, (LOC - Wells Fargo Bank N.A.), 0.030%, 10/1/35 (a) | | | 2,000,000 | | | |
| | 200,000 | | | Missouri State Health & Educational Facilities Authority Revenue, St. Louis University, Series A-1, (LOC - Wells Fargo Bank N.A.), 0.060%, 10/1/35 (a) | | | 200,000 | | | |
| | | | | | | | | | |
Principal
Amount | | | | | Value | | | |
| | | | | | | | | | |
| Municipal Bonds — (Continued) | | | | | | |
| Missouri — (Continued) | | | | | | |
| $ | 945,000 | | | Missouri State Health & Educational Facilities Authority Revenue, BJC Health System, Series B, (SPA - U.S. Bank N.A.), 0.040%, 5/15/38 (a) | | $ | 945,000 | | | |
| | | | | | | | 3,145,000 | | | |
| New York — 2.3% | | | | | | |
| | 380,000 | | | Lindenhurst, NY, G.O., 2.000%, 8/1/13 | | | 383,526 | | | |
| | 1,300,000 | | | New York State Housing Finance Agency Revenue, (Fannie Mae Ins.), 0.070%, 5/15/39 (a) | | | 1,300,000 | | | |
| | | | | | | | 1,683,526 | | | |
| North Carolina — 12.5% | | | | | | |
| | 1,990,000 | | | Cary, NC, Various Public Improvements, G.O., (SPA - JPMorgan Chase Bank), 0.080%, 6/1/27 (a) | | | 1,990,000 | | | |
| | 2,400,000 | | | Charlotte-Mecklenburg Hospital Authority, NC, Health Care System Revenue, Series H, (LOC - Wells Fargo Bank N.A.), 0.020%, 1/15/45 (a) | | | 2,400,000 | | | |
| | 4,000,000 | | | Charlotte-Mecklenburg Hospital Authority, NC, Health Care System Revenue, Series B, (LOC - U.S. Bank N.A.), 0.020%, 1/15/26 (a) | | | 4,000,000 | | | |
| | 400,000 | | | New Hanover County, NC, Hospital Revenue, Series B-1, (AGM Ins.), 0.160%, 10/1/26 (a) | | | 400,000 | | | |
| | 500,000 | | | New Hanover County, NC, Hospital Revenue, Series A-1, (AGM Ins. SPA - Wachovia Bank N.A.), 0.160%, 10/1/23 (a) | | | 500,000 | | | |
| | | | | | | | 9,290,000 | | | |
| North Dakota — 0.5% | | | | | | |
| | 385,000 | | | McKenzie County, ND, Public School District Building Authority Lease Revenue, 2.000%, 5/1/13 | | | 386,837 | | | |
| Ohio — 18.1% | | | | | | |
| | 200,000 | | | Butler County, OH, Port Authority Economic Development Facilities Lease Revenue, Great Miami Valley YMCA, (LOC - JPMorgan Chase Bank), 0.150%, 9/1/37 (a) | | | 200,000 | | | |
| | 625,000 | | | Butler County, OH, Capital Funding Revenue Bond, Series A, (LOC - U.S. Bank N.A.), 0.100%, 6/1/35 (a) | | | 625,000 | | | |
| | 165,000 | | | Chagrin Falls, OH, Exempted Village School District, G.O., Series B, 2.000%, 12/1/13 | | | 167,331 | | | |
| | 545,000 | | | Clark County, OH, Various Purposes, G.O., 1.000%, 5/30/13 | | | 546,234 | | | |
(See notes which are an integral part of the Financial Statements)
Annual Shareholder Report
45
| | |
| Huntington Tax-Free Money Market Fund | | (Continued) |
| | | | | | | | | | |
Principal
Amount | | | | | Value | | | |
| | | | | | | | | | |
| Municipal Bonds — (Continued) | | | | | | |
| Ohio — (Continued) | | | | | | |
| $ | 135,000 | | | Columbus, OH, Regional Airport Authority Revenue, Series A, (LOC - U.S. Bank N.A.), 0.080%, 3/1/34 (a) | | $ | 135,000 | | | |
| | 310,000 | | | Delaware, OH, G.O., 1.000%, 12/1/13 | | | 311,694 | | | |
| | 875,000 | | | Euclid, OH, Various Purposes, G.O., 1.250%, 6/13/13 | | | 876,938 | | | |
| | 145,000 | | | Fairview Park, OH, City School District, G.O., 1.000%, 12/1/13 | | | 145,657 | | | |
| | 755,000 | | | Franklin County, OH, Industrial Development Revenue, (SPA - JPMorgan Chase Bank), 0.150%, 11/1/14 (a) | | | 755,000 | | | |
| | 745,000 | | | Franklin County, OH, Hospital Revenue, U.S. Health Corp., Series A, (LOC -Citibank N.A.), 0.100%, 12/1/21 (a) | | | 745,000 | | | |
| | 75,000 | | | Franklin County, OH, Hospital Revenue, OhioHealth Corp., Series C, 4.000%, 5/15/13 | | | 75,951 | | | |
| | 1,000,000 | | | Hamilton, OH, Various Purposes, G.O., 1.125%, 10/3/13 | | | 1,003,929 | | | |
| | 310,000 | | | Harrison, OH, G.O., 2.750%, 10/24/13 | | | 314,354 | | | |
| | 400,000 | | | Lorain, OH, Port Authority Revenue, Land Reutilization Project, 2.500%, 11/6/13 | | | 405,722 | | | |
| | 430,000 | | | Maple Heights, OH, City School District, G.O., 1.250%, 4/11/13 | | | 430,761 | | | |
| | 2,000,000 | | | Montgomery County, OH, Revenue, Miami Valley Hospital, Series B, (SPA -Barclays Bank PLC), 0.030%, 11/15/39 (a) | | | 2,000,000 | | | |
| | 1,000,000 | | | Ohio State University, General Receipts Revenue, (SPA - Huntington National Bank), 0.070%, 12/1/27 (a) | | | 1,000,000 | | | |
| | 2,000,000 | | | Ohio State University, Infrastructure Improvements, G.O., Series B, 0.080%, 8/1/21 (a) | | | 2,000,000 | | | |
| | 1,000,000 | | | Pataskala, OH, Various Purposes, G.O., 1.500%, 3/28/13 | | | 1,002,344 | | | |
| | 355,000 | | | Springfield, OH, Various Purposes, G.O., 2.000%, 6/1/13 | | | 356,526 | | | |
| | 125,000 | | | Tecumseh, OH, Local School District, Various Purposes, G.O., 2.000%, 12/1/13 | | | 126,707 | | | |
| | 160,000 | | | Washington, OH, Local School District/Lucas County, COP, 4.000%, 9/1/13 | | | 163,168 | | | |
| | 40,000 | | | Youngstown, OH, City School District, G.O., 3.000%, 12/1/13 | | | 40,873 | | | |
| | | | | | | | 13,428,189 | | | |
| Oklahoma — 0.3% | | | | | | |
| | 200,000 | | | Oklahoma County, OK, G.O., Series A, 3.500%, 7/1/13 | | | 203,082 | | | |
| | | | | | | | | | |
Principal
Amount | | | | | Value | | | |
| | | | | | | | | | |
| Municipal Bonds — (Continued) | | | | | | |
| Pennsylvania — 0.6% | | | | | | |
| $ | 100,000 | | | Lancaster County, PA, G.O., Series A, 2.500%, 11/1/13 | | $ | 101,572 | | | |
| | 325,000 | | | Souderton, PA, Area School District, G.O., Series AA, 3.000%, 9/1/13 | | | 330,608 | | | |
| | | | | | | | 432,180 | | | |
| Tennessee — 2.2% | | | | | | |
| | 1,625,000 | | | Jackson, TN, Health Educational & Housing Facility Board Multifamily Revenue, (Fannie Mae Ins.), 0.090%, 5/15/31 (a) | | | 1,625,000 | | | |
| Texas — 4.7% | | | | | | |
| | 200,000 | | | Austin Housing Finance Corp., Housing Finance Corp. Multi-family Housing Revenue, Stassney Woods Apartments, Series A, (Fannie Mae Ins., LOC -JPMorgan Chase Bank), 0.090%, 10/15/32 (a) | | | 200,000 | | | |
| | 205,000 | | | Crandall, TX, Independent School District, G.O., Series B, 0.000%, 8/15/13 (b) | | | 204,145 | | | |
| | 1,300,000 | | | Harris County, TX, Cultural Education Facilities Finance Corp. Revenue, Series B-2, (LOC - JPMorgan Chase & Co.), 0.070%, 9/1/31 (a) | | | 1,300,000 | | | |
| | 700,000 | | | Harris County, TX, Cultural Education Facilities Finance Corp., Series B-1, 0.070%, 9/1/31 (a) | | | 700,000 | | | |
| | 1,110,000 | | | Travis County, TX, Housing Finance Corp., Multifamily Housing Revenue, Series A, (Fannie Mae Ins.), 0.090%, 2/15/34 (a) | | | 1,110,000 | | | |
| | | | | | | | 3,514,145 | | | |
| Virginia — 9.5% | | | | | | |
| | 850,000 | | | Arlington County, VA, Industrial Development Authority Revenue, Series A, (Fannie Mae Ins.), 0.100%, 3/1/35 (a) | | | 850,000 | | | |
| | 825,000 | | | Hampton, VA, Redevelopment & Housing Authority Multifamily Housing Revenue, Township Apartments Project, (Fannie Mae Ins.), 0.090%, 10/15/32 (a) | | | 825,000 | | | |
| | 4,080,000 | | | Roanoke, VA, Economic Development Authority, Hospital Revenue, Series A-1, 0.040%, 7/1/36 (a) | | | 4,080,000 | | | |
| | 1,275,000 | | | Roanoke, VA , Economic Development Authority, Hospital Revenue, Series A-2, 0.040%, 7/1/36 (a) | | | 1,275,000 | | | |
| | | | | | | | 7,030,000 | | | |
(See notes which are an integral part of the Financial Statements)
Annual Shareholder Report
46
| | |
| Huntington Tax-Free Money Market Fund | | (Continued) |
| | | | | | | | | | |
Principal
Amount
| | | | | Value | | | |
| Municipal Bonds — (Continued) | | | | | | |
| Washington — 4.0% | | | | | | |
| $ | 100,000 | | | Snohomish County, WA, School District No. 15 Edmonds, G.O., Series A, 5.000%, 12/1/13 | | $ | 104,198 | | | |
| | 1,165,000 | | | Washington Economic Development Finance Authority Revenue, Pioneer Human Services, 0.030%, 9/1/18 (a) | | | 1,165,000 | | | |
| | 1,665,000 | | | Washington State Housing Finance Commission, Nonprofit Revenue, 0.030%, 8/1/19 (a) | | | 1,665,000 | | | |
| | | | | | | | 2,934,198 | | | |
| Wisconsin — 1.1% | | | | | | |
| | 700,000 | | | Milwaukee, WI, Area Technical College District, G.O., Series 12-13C, 2.000%, 6/1/13 | | | 704,340 | | | |
| | 130,000 | | | Oshkosh, WI, Promisorry Notes, G.O., Series C, 2.000%, 12/1/13 | | | 131,898 | | | |
| | | | | | | | 836,238 | | | |
| Total Municipal Bonds (Cost $70,827,144) | | | 70,827,144 | | | |
| | | | | | | | | | |
Shares | | | | | Value | | | |
| Cash Equivalents — 4.8% | | | | | | |
| | 1,000,000 | | | FFI Institutional Tax-Exempt Fund, 0.010% (c) | | $ | 1,000,000 | | | |
| | 2,552,659 | | | Fidelity Institutional Tax-Exempt Money Market Portfolio, Class I, 0.010% (c) | | | 2,552,659 | | | |
| Total Cash Equivalents (Cost $3,552,659) | | | 3,552,659 | | | |
| Total Investments
(Cost $74,379,803) — 100.4% | | | 74,379,803 | | | |
| Liabilities in Excess of Other Assets — (0.4)% | | | (297,734) | | | |
| Net Assets — 100.0% | | $ | 74,082,069 | | | |
| (a) | Variable or Floating Rate Security. Rate disclosed is as of December 31, 2012. |
| (b) | Zero coupon capital appreciation bond. |
| (c) | Rate disclosed is the seven day yield as of December 31, 2012. |
AGM — Assured Guaranty Municipal Corp.
COP — Certificate of Participation
G.O. — General Obligation
LOC — Letter of Credit
MBIA — Municipal Bond Insurance Association
SPA — Standby Purchase Agreement
(See notes which are an integral part of the Financial Statements)
Annual Shareholder Report
47
| | |
| | |
| Huntington Money Market Fund | | December 31, 2012 |
| | |
| Portfolio of Investments Summary Table | | (unaudited) |
| | | | |
| Asset Allocation | | Percentage of
Market Value | |
U.S. Government Agencies | | | 28.7 | % |
Repurchase Agreements | | | 15.0 | % |
Commercial Papers | | | 14.2 | % |
Municipal Bonds | | | 12.9 | % |
Yankee Certificates of Deposit | | | 11.6 | % |
Cash | | | 10.1 | % |
Corporate Bonds | | | 7.5 | % |
Total | | | 100.0 | % |
Portfolio holdings and allocations are subject to change. As of December 31, 2012, percentages in the table above are based on total investments. Such total investments may differ from the percentages set forth below in the Portfolio of Investments which are computed using the Fund’s total net assets.
Portfolio of Investments
| | | | | | | | | | |
Principal
Amount | | | | | Value | | | |
| | | | | | | | | | |
| U.S. Government Agencies — 28.7% | | | | | | |
| Federal Farm Credit Bank — 10.1% | | | | | | |
| $ | 5,000,000 | | | 0.176%, 2/20/13 (a) | | $ | 5,000,202 | | | |
| | 10,000,000 | | | 0.216%, 3/6/13 (a) | | | 10,000,523 | | | |
| | 10,000,000 | | | 0.166%, 4/16/13 (a) | | | 10,000,285 | | | |
| | 10,000,000 | | | 0.190%, 6/20/13 (a) | | | 9,999,530 | | | |
| | | | | | | | 35,000,540 | | | |
| Federal Home Loan Bank — 18.6% | | | | | | |
| | 10,000,000 | | | 0.183%, 4/12/13 (a) | | | 9,999,761 | | | |
| | 10,000,000 | | | 0.165%, 4/18/13 (a) | | | 9,999,567 | | | |
| | 10,000,000 | | | 0.180%, 5/6/13 (a) | | | 9,999,652 | | | |
| | 5,000,000 | | | 0.240%, 5/21/13 | | | 5,001,111 | | | |
| | 10,000,000 | | | 0.200%, 6/18/13 (a) | | | 10,000,000 | | | |
| | 10,000,000 | | | 0.180%, 7/12/13 (a) | | | 9,999,465 | | | |
| | 9,400,000 | | | 0.128%, 9/18/13 (a) | | | 9,397,494 | | | |
| | | | | | | | 64,397,050 | | | |
| Total U.S. Government Agencies
(Cost $99,397,590) | | | 99,397,590 | | | |
| Repurchase Agreements — 15.0% | | | | | | |
| | 52,054,200 | | | TD Securities, 0.170%, dated 12/31/12, due 1/2/13, repurchase price $52,054,692 (collateralized by U.S. Treasury Notes, 0.750%, 12/31/17, market value $53,051,875) | | | 52,054,200 | | | |
| Total Repurchase Agreements (Cost $52,054,200) | | | 52,054,200 | | | |
| Commercial Papers — 14.2% | | | | | | |
| | 5,000,000 | | | Coca-Cola Co./The, 0.161%, 3/25/13 | | | 4,998,156 | | | |
| | 10,000,000 | | | Commonwealth Bank of Australia, 0.307%, 2/4/13 | | | 9,997,072 | | | |
| | 5,000,000 | | | Dell, Inc., 0.567%, 6/10/13 | | | 4,990,667 | | | |
| | 5,000,000 | | | Honeywell International, Inc., 0.160%, 2/28/13 | | | 4,998,711 | | | |
| | 5,000,000 | | | Medtronic, Inc., 0.181%, 4/11/13 | | | 4,997,500 | | | |
| | | | | | | | | | |
Principal
Amount | | | | | Value | | | |
| | | | | | | | | | |
| Commercial Papers — (Continued) | | | | | | |
| $ | 5,000,000 | | | National Australia Funding Delaware, Inc., 0.275%, 1/28/13 | | $ | 4,998,950 | | | |
| | 4,175,000 | | | Walt Disney Co./The, 0.140%, 3/8/13 | | | 4,173,928 | | | |
| | 10,000,000 | | | Westpac Banking Corp., 0.380%, 11/1/13 | | | 10,000,000 | | | |
| Total Commercial Papers (Cost $49,154,984) | | | 49,154,984 | | | |
| Municipal Bonds — 12.9% | | | | | | |
| Kentucky — 2.8% | | | | | | |
| | 9,600,000 | | | Carroll County, KY, Solid Waste Disposal Revenue, BPB Acquisition Project, (LOC - Bank of America N.A.), AMT, 0.110%, 5/1/31 (a) | | | 9,600,000 | | | |
| New York — 1.7% | | | | | | |
| | 6,000,000 | | | New York State Local Government Assistance Corp. Revenue, Series B, (SPA - JPMorgan Chase Bank), 0.090%, 4/1/21 (a) | | | 6,000,000 | | | |
| North Carolina — 4.0% | | | | | | |
| | 4,500,000 | | | Charlotte, NC, Special Obligation Revenue, Uptown Project, (SPA - Wachovia Bank N.A.), 0.190%, 6/1/21 (a) | | | 4,500,000 | | | |
| | 4,500,000 | | | North Carolina Capital Facilities Finance Agency Education Facilities Revenue, (LOC - Branch Banking & Trust), 0.100%, 10/1/34 (a) | | | 4,500,000 | | | |
| | 5,000,000 | | | Winston-Salem, NC, Water & Sewer Systems Revenue, Series B, (SPA - Branch Banking & Trust), 0.090%, 6/1/30 (a) | | | 5,000,000 | | | |
| | | | | | | | 14,000,000 | | | |
(See notes which are an integral part of the Financial Statements)
Annual Shareholder Report
48
| | |
| Huntington Money Market Fund | | (Continued) |
| | | | | | | | | | |
Principal
Amount | | | | | Value | | | |
| | | | | | | | | | |
| Municipal Bonds — (Continued) | | | | | | |
| Ohio — 2.9% | | | | | | |
| $ | 5,000,000 | | | Franklin County, OH, Hospital Revenue, OhioHealth Facilities, Series B, (SPA - Barclays Bank PLC), 0.080%, 11/15/41 (a) | | $ | 5,000,000 | | | |
| | 5,000,000 | | | Hamilton County, OH, Hospital Facilities Revenue,
0.110%, 5/15/37 (a) | | | 5,000,000 | | | |
| | | | | | | | 10,000,000 | | | |
| Texas — 1.5% | | | | | | |
| | 5,000,000 | | | Texas State Department of Housing & Community Affairs Multifamily Housing Revenue, (LOC - Citibank N.A.), AMT, 0.100%, 5/1/40 (a) | | | 5,000,000 | | | |
| Total Municipal Bonds (Cost $44,600,000) | | | 44,600,000 | | | |
| Yankee Certificates of Deposit — 11.5% | | | | | | |
| | 10,000,000 | | | Bank of Montreal/Chicago, 0.756%, 10/3/13 (a) | | | 10,035,692 | | | |
| | 10,000,000 | | | Bank of Nova Scotia/Houston, 0.259%, 2/15/13 (a) | | | 10,000,000 | | | |
| | 10,000,000 | | | Royal Bank of Canada/New York , 2.250%, 3/15/13 | | | 10,040,360 | | | |
| | 10,000,000 | | | Toronto Dominion Bank, 0.313%, 2/4/13 (a) | | | 10,000,000 | | | |
| Total Yankee Certificates of Deposit
(Cost $40,076,052) | | | 40,076,052 | | | |
| Corporate Bonds — 7.5% | | | | | | |
| Consumer Staples — 1.4% | | | | | | |
| | 5,000,000 | | | PepsiCo, Inc., 0.390%, 5/10/13 (a) | | | 5,002,829 | | | |
| Financials — 6.1% | | | | | | |
| | 3,161,000 | | | General Electric Capital Corp., MTN, 1.212%, 5/22/13 (a) | | | 3,173,178 | | | |
| | 1,400,000 | | | General Electric Capital Corp., MTN, 0.909%, 6/19/13 (a) | | | 1,404,470 | | | |
| | 5,095,000 | | | JPMorgan Chase & Co., MTN, 0.962%, 2/26/13 (a) | | | 5,099,983 | | | |
| | 5,000,000 | | | National Australia Bank Ltd., 0.831%, 1/8/13 (a) (b) | | | 5,000,672 | | | |
| | 6,330,000 | | | US Bancorp, Series MTN, 1.125%, 10/30/13 | | | 6,368,481 | | | |
| | | | | | | | 21,046,784 | | | |
| Total Corporate Bonds ( Cost $26,049,613) | | | 26,049,613 | | | |
| | | | | | | | | | |
Shares | | | | | Value | | | |
| Cash Equivalents — 10.1% | | | | | | |
| | 30,000,000 | | | Fidelity Institutional Money Market Portfolio, 0.180% (c) | | $ | 30,000,000 | | | |
| | 5,000,000 | | | Flex-Funds - The Money Market Fund -Institutional Class, 0.150% (c) | | | 5,000,000 | | | |
| Total Cash Equivalents (Cost $35,000,000) | | | 35,000,000 | | | |
| Total Investments
(Cost $346,332,439) — 99.9% | | | 346,332,439 | | | |
| Other Assets in Excess of Liabilities — 0.1% | | | 279,438 | | | |
| Net Assets — 100.0% | | $ | 346,611,877 | | | |
| (a) | Variable or Floating Rate Security. Rate disclosed is as of December 31, 2012. Date shown represents final maturity date. |
| (b) | Security exempt from registration under Rule 144A or Section 4(2) of the Securities Act of 1933. The security may be resold in transactions exempt from registration, normally to qualified institutional buyers. |
| (c) | Rate disclosed is the seven day yield as of December 31, 2012. |
| AMT | — Subject to alternative minimum tax |
LOC — Letter of Credit
MTN — Medium Term Note
SPA — Standby Purchase Agreement
(See notes which are an integral part of the Financial Statements)
Annual Shareholder Report
49
| | |
| | |
| Huntington Ohio Municipal Money Market Fund | | December 31, 2012 |
| | |
| Portfolio of Investments Summary Table | | (unaudited) |
| | | | |
| Asset Allocation | | Percentage of
Market Value | |
General Obligation | | | 41.7 | % |
Medical | | | 29.1 | % |
Higher Education | | | 16.7 | % |
Cash | | | 4.7 | % |
Pollution | | | 4.7 | % |
School District | | | 1.3 | % |
Development | | | 0.9 | % |
Airport | | | 0.6 | % |
Multifamily Housing | | | 0.3 | % |
Total | | | 100.0 | % |
Portfolio holdings and allocations are subject to change. As of December 31, 2012, percentages in the table above are based on total investments. Such total investments may differ from the percentages set forth below in the Portfolio of Investments which are computed using the Fund’s total net assets.
Portfolio of Investments
| | | | | | | | | | |
Principal
Amount | | | | | Value | | | |
| | | | | | | | | | |
| Municipal Bonds — 95.2% | | | | | | |
| Ohio — 95.2% | | | | | | |
| $ | 500,000 | | | Akron, OH, Health Benefit Claims, BAN, 1.375%, 3/14/13 | | $ | 500,710 | | | |
| | 3,615,000 | | | Allen County, OH, Hospital Facilities Revenue, Catholic Healthcare, Series B, (LOC - JPMorgan Chase Bank), 0.070%, 10/1/31 (a) | | | 3,615,000 | | | |
| | 1,135,000 | | | Butler County, OH, Capital Funding Revenue Bond, Series A, (LOC - U.S. Bank N.A.), 0.100%, 6/1/35 (a) | | | 1,135,000 | | | |
| | 550,000 | | | Cleveland, OH, Cuyahoga County Port Authority Educational Facilities Revenue, (LOC - JPMorgan Chase Bank), 0.070%, 4/1/38 (a) | | | 550,000 | | | |
| | 2,715,000 | | | Cleveland, OH, Cuyahoga County Port Authority Revenue, (LOC - JPMorgan Chase Bank), 0.110%, 1/1/37 (a) | | | 2,715,000 | | | |
| | 3,040,000 | | | Cleveland, OH, Cuyahoga County Port Authority Revenue, Carnegie/96th Research Building Project, (LOC - JPMorgan Chase Bank), 0.110%, 1/1/37 (a) | | | 3,040,000 | | | |
| | 200,000 | | | Cleveland, OH, Income Tax Revenue, Series A, 2.000%, 10/1/13 | | | 202,236 | | | |
| | 675,000 | | | Columbus & Franklin County Metropolitan Park District Revenue, 1.250%, 8/14/13 | | | 676,861 | | | |
| | 3,350,000 | | | Columbus, OH, Regional Airport Authority Capital Funding Revenue, (LOC - U.S. Bank N.A.), 0.080%, 7/1/35 (a) | | | 3,350,000 | | | |
| | 4,375,000 | | | Columbus, OH, G.O., Series 1, 0.090%, 12/1/26 (a) | | | 4,375,000 | | | |
| | | | | | | | | | |
Principal
Amount | | | | | Value | | | |
| | | | | | | | | | |
| Municipal Bonds — (Continued) | | | | | | |
| Ohio — (Continued) | | | | | | |
| $ | 860,000 | | | Columbus, OH, Regional Airport Authority Revenue, Series A, (LOC -U.S. Bank N.A.), 0.080%, 3/1/34 (a) | | $ | 860,000 | | | |
| | 370,000 | | | Columbus, OH, Regional Airport Authority Capital Funding Revenue, (LOC - U.S. Bank N.A.), 0.080%, 12/1/36 (a) | | | 370,000 | | | |
| | 5,030,000 | | | Cuyahoga County, OH, Revenue, Cleveland Clinic - Subseries B3, (SPA - Bank of America N.A.), 0.060%, 1/1/39 (a) | | | 5,030,000 | | | |
| | 5,100,000 | | | Cuyahoga County, OH, Revenue, Cleveland Clinic - Subseries B1, (SPA - JPMorgan Chase Bank), 0.030%, 1/1/39 (a) | | | 5,100,000 | | | |
| | 1,200,000 | | | Cuyahoga Falls, OH, Various Purposes, G.O., 1.000%, 12/5/13 | | | 1,206,634 | | | |
| | 400,000 | | | East Knox, OH, Local School District, G.O., 1.750%, 2/7/13 | | | 400,503 | | | |
| | 1,100,000 | | | Elyria, OH, G.O., 1.000%, 6/6/13 | | | 1,101,867 | | | |
| | 1,000,000 | | | Euclid, OH, Various Purposes, G.O., 1.250%, 6/13/13 | | | 1,002,215 | | | |
| | 145,000 | | | Fairbanks, OH, Local School District, G.O., 1.000%, 12/1/13 | | | 145,660 | | | |
| | 740,000 | | | Franklin County, OH, Industrial Development Revenue, (SPA - JPMorgan Chase Bank), 0.150%, 11/1/14 (a) | | | 740,000 | | | |
| | 655,000 | | | Franklin County, OH, Hospital Revenue, U.S. Health Corp., Series A, (LOC -Citibank N.A.), 0.100%, 12/1/21 (a) | | | 655,000 | | | |
| | 150,000 | | | Franklin County, OH, Nationwide Hospital, Series G, (SPA - JPMorgan Chase Bank), 0.090%, 5/1/29 (a) | | | 150,000 | | | |
(See notes which are an integral part of the Financial Statements)
Annual Shareholder Report
50
| | |
| Huntington Ohio Municipal Money Market Fund | | (Continued) |
| | | | | | | | | | |
Principal
Amount | | | | | Value | | | |
| | | | | | | | | | |
| Municipal Bonds — (Continued) | | | | | | |
| Ohio — (Continued) | | | | | | |
| $ | 5,000,000 | | | Franklin County, OH, OhioHealth Facilities, Series A, (SPA - Barclays Bank PLC), 0.080%, 11/15/41 (a) | | $ | 5,000,000 | | | |
| | 1,210,000 | | | Hamilton County, OH, Hospital Facilities Revenue, Children’s Hospital Medical Center, (LOC - JPMorgan Chase Bank), 0.100%, 5/15/28 (a) | | | 1,210,000 | | | |
| | 1,525,000 | | | Harrison, OH, Public Infrastructure Improvements, G.O., 1.650%, 10/24/13 | | | 1,534,809 | | | |
| | 5,600,000 | | | Kent State University, OH, General Receipts Revenue, (Various), Series B, (LOC - Bank of America N.A.), 0.110%, 5/1/32 (a) | | | 5,600,000 | | | |
| | 510,000 | | | Mahoning County, OH, G.O., 1.250%, 10/15/13 | | | 512,590 | | | |
| | 750,000 | | | Maple Heights, OH, City School District, G.O., 1.250%, 4/11/13 | | | 751,327 | | | |
| | 1,550,000 | | | Marysville, OH, Various Purposes, G.O., 1.000%, 8/28/13 | | | 1,554,539 | | | |
| | 115,000 | | | Middleburg Heights, OH, Hospital Revenue, 2.000%, 8/1/13 | | | 115,966 | | | |
| | 1,200,000 | | | Montgomery County, OH, Revenue, Various Catholic Health, Series B-1, (SPA - Bank of NY Mellon), 0.080%, 3/1/27 (a) | | | 1,200,000 | | | |
| | 3,030,000 | | | Montgomery County, OH, Revenue, Miami Valley Hospital, Series B, (SPA - Barclays Bank PLC), 0.030%, 11/15/39 (a) | | | 3,030,000 | | | |
| | 3,000,000 | | | Montgomery County, OH, Revenue, Miami Valley Hospital, Series B, (SPA - JPMorgan Chase Bank), 0.030%, 11/15/45 (a) | | | 3,000,000 | | | |
| | 4,000,000 | | | Montgomery County, OH, Revenue, Miami Valley Hospital, Series C, (SPA - JPMorgan Chase Bank), 0.020%, 11/15/45 (a) | | | 4,000,000 | | | |
| | 500,000 | | | Morrow County, OH, G.O., 1.500%, 1/17/13 | | | 500,217 | | | |
| | 470,000 | | | Obetz, OH, Various Purposes, G.O., 0.500%, 12/1/13 | | | 470,000 | | | |
| | 1,060,000 | | | Ohio Air Quality Development Authority Refunding Revenue, Series B, (LOC - UBS AG), 0.080%, 3/1/23 (a) | | | 1,060,000 | | | |
| | 5,100,000 | | | Ohio Air Quality Development Authority Refunding Revenue, Series B, (LOC - Bank of Nova Scotia), 0.050%, 2/1/26 (a) | | | 5,100,000 | | | |
| | 400,000 | | | Ohio Housing Finance Agency Multifamily Revenue, (Housing Chambrel at Montrose), Series F, (Fannie Mae Ins.), 0.100%, 11/15/32 (a) | | | 400,000 | | | |
| | | | | | | | | | |
Principal
Amount | | | | | Value | | | |
| | | | | | | | | | |
| Municipal Bonds — (Continued) | | | | | | |
| Ohio — (Continued) | | | | | | |
| $ | 4,150,000 | | | Ohio State, Infrastructure Improvements , G.O., Series B, 0.050%, 8/1/17 (a) | | $ | 4,150,000 | | | |
| | 4,740,000 | | | Ohio State, Infrastructure Improvements , G.O., Series D, 0.050%, 2/1/19 (a) | | | 4,740,000 | | | |
| | 2,000,000 | | | Ohio State, Infrastructure Improvements , G.O., Series A, 0.050%, 2/1/23 (a) | | | 2,000,000 | | | |
| | 420,000 | | | Ohio State, School Improvements, G.O., Series A, 0.080%, 3/15/25 (a) | | | 420,000 | | | |
| | 75,000 | | | Ohio State, G.O., Series A, 5.000%, 6/15/13 | | | 76,510 | | | |
| | 5,820,000 | | | Ohio State, G.O., Series B, 0.080%, 3/15/25 (a) | | | 5,820,000 | | | |
| | 7,570,000 | | | Ohio State, G.O., Series C, 0.070%, 6/15/26 (a) | | | 7,570,000 | | | |
| | 925,000 | | | Ohio State Higher Educational Facilities Revenue, Xavier University Project, (LOC - U.S. Bank N.A.), 0.090%, 5/1/15 (a) | | | 925,000 | | | |
| | 1,235,000 | | | Ohio State Higher Educational Facilities Revenue, Marietta College Project, (LOC - JPMorgan Chase Bank), 0.110%, 12/1/24 (a) | | | 1,235,000 | | | |
| | 100,000 | | | Ohio State Higher Educational Facilities Revenue, Case Western Reserve, Series A, 0.030%, 10/1/31 (a) | | | 100,000 | | | |
| | 240,000 | | | Ohio State Higher Educational Facilities Revenue, Case Western Reserve, Series A, 0.030%, 10/1/31 (a) | | | 240,000 | | | |
| | 480,000 | | | Ohio State Higher Educational Facilities Revenue, Marietta College Project, (LOC - JPMorgan Chase Bank), 0.100%, 12/1/32 (a) | | | 480,000 | | | |
| | 650,000 | | | Ohio State Higher Educational Facilities Revenue, Dominican University Project, (LOC - JPMorgan Chase Bank), 0.100%, 12/1/37 (a) | | | 650,000 | | | |
| | 500,000 | | | Ohio State Higher Educational Facilities Revenue, Case Western Reserve, Series B-1, (LOC - Bank of America N.A.), 0.020%, 12/1/44 (a) | | | 500,000 | | | |
| | 5,700,000 | | | Ohio State Higher Educational Facilities Revenue, Case Western Reserve, Series B-2, (LOC - Bank of America N.A.), 0.020%, 12/1/44 (a) | | | 5,700,000 | | | |
| | 4,665,000 | | | Ohio State University, Infrastructure Improvements , G.O., Series B, 0.080%, 8/1/21 (a) | | | 4,665,000 | | | |
| | 3,560,000 | | | Ohio State University, General Receipts Revenue, (SPA - Huntington National Bank), 0.070%, 12/1/27 (a) | | | 3,560,000 | | | |
| | 110,000 | | | Ohio State University, Revenue, Series B, 0.070%, 12/1/28 (a) | | | 110,000 | | | |
(See notes which are an integral part of the Financial Statements)
Annual Shareholder Report
51
| | |
| Huntington Ohio Municipal Money Market Fund | | (Continued) |
| | | | | | | | | | |
Principal
Amount | | | | | Value | | | |
| | | | | | | | | | |
| Municipal Bonds — (Continued) | | | | | | |
| Ohio — (Continued) | | | | | | |
| $ | 2,000,000 | | | Ohio State University, Revenue, Series B, 0.080%, 6/1/35 (a) | | $ | 2,000,000 | | | |
| | 400,000 | | | Ohio State Water Development Authority, Series B, 0.010%, 10/1/33 (a) | | | 400,000 | | | |
| | 1,000,000 | | | Pataskala, OH, Various Purposes, G.O., 1.250%, 11/21/13 | | | 1,007,512 | | | |
| | 110,000 | | | Sandy Valley, OH, Local School District, G.O., 2.000%, 12/1/13 | | | 111,604 | | | |
| | 1,500,000 | | | Tipp City, OH, Various Purposes, G.O., Series C, 1.000%, 11/28/13 | | | 1,508,116 | | | |
| | 5,000,000 | | | Union Township, Clermont County, OH, Various Purposes, G.O., 1.000%, 9/11/13 | | | 5,018,975 | | | |
| | 300,000 | | | Vermilion, OH, Local School District, COP, 2.000%, 12/1/13 | | | 304,099 | | | |
| | 250,000 | | | Wapakoneta, OH, City School District, G.O., 1.500%, 5/1/13 | | | 250,694 | | | |
| Total Municipal Bonds (Cost $125,503,644) | | | 125,503,644 | | | |
| | | | | | | | | | |
Shares | | | | | Value | | | |
| Cash Equivalents — 4.7% | | | | | | |
| | 2,000,000 | | | FFI Institutional Tax-Exempt Fund 0.010% (b) | | $ | 2,000,000 | | | |
| | 4,234,643 | | | Fidelity Institutional Tax-Exempt Money Market Portfolio, Class I 0.010% (b) | | | 4,234,643 | | | |
| Total Cash Equivalents (Cost $6,234,643) | | | 6,234,643 | | | |
| Total Investments
(Cost $131,738,287) — 99.9% | | | 131,738,287 | | | |
| Other Assets in Excess of Liabilities — 0.1% | | | 69,304 | | | |
| Net Assets — 100.0% | | $ | 131,807,591 | | | |
| (a) | Variable or Floating Rate Security. Rate disclosed is as of December 31, 2012. Data shown represents final maturity date. |
| (b) | Rate disclosed is the seven day yield as of December 31, 2012. |
BAN — Bond Anticipation Note
COP — Certificate of Participation
G.O. — General Obligation
LOC — Letter of Credit
SPA — Standby Purchase Agreement
(See notes which are an integral part of the Financial Statements)
Annual Shareholder Report
52
| | |
| | |
| Huntington U.S. Treasury Money Market Fund | | December 31, 2012 |
| | |
| Portfolio of Investments Summary Table | | (unaudited) |
| | | | |
| Asset Allocation | | Percentage of
Market Value | |
U.S. Treasury Obligations | | | 55.6% | |
Repurchase Agreements | | | 44.4% | |
Total | | | 100.0% | |
Portfolio holdings and allocations are subject to change. As of December 31, 2012, percentages in the table above are based on total investments. Such total investments may differ from the percentages set forth below in the Portfolio of Investments which are computed using the Fund’s total net assets.
Portfolio of Investments
| | | | | | | | | | |
Principal
Amount | | | | | Value | | | |
| | | | | | | | | | |
| U.S. Treasury Obligations — 55.6% | | | | | | |
| U.S. Treasury Bills — 38.4% | | | | | | |
| $ | 50,000,000 | | | 0.060%, 1/3/13 | | $ | 50,000,000 | | | |
| | 30,000,000 | | | 0.040%, 1/10/13 | | | 29,999,688 | | | |
| | 100,000,000 | | | 0.020%, 1/24/13 | | | 99,998,387 | | | |
| | 10,000,000 | | | 0.130%, 1/31/13 | | | 9,998,917 | | | |
| | 10,000,000 | | | 0.140%, 2/7/13 | | | 9,998,613 | | | |
| | 10,000,000 | | | 0.090%, 3/7/13 | | | 9,998,330 | | | |
| | 10,000,000 | | | 0.130%, 3/14/13 | | | 9,997,300 | | | |
| | 15,000,000 | | | 0.060%, 4/18/13 | | | 14,997,102 | | | |
| | 25,000,000 | | | 0.100%, 4/25/13 | | | 24,992,273 | | | |
| | 15,000,000 | | | 0.160%, 5/2/13 | | | 14,991,933 | | | |
| | 15,000,000 | | | 0.130%, 5/23/13 | | | 14,992,013 | | | |
| | 15,000,000 | | | 0.090%, 6/13/13 | | | 14,994,227 | | | |
| | 5,000,000 | | | 0.160%, 7/25/13 | | | 4,995,444 | | | |
| | 5,000,000 | | | 0.170%, 8/22/13 | | | 4,994,547 | | | |
| | 5,000,000 | | | 0.180%, 10/17/13 | | | 4,992,835 | | | |
| | 5,000,000 | | | 0.170%, 11/14/13 | | | 4,992,449 | | | |
| | | | | | | | 324,934,058 | | | |
| U.S. Treasury Notes — 15.4% | | | | | | |
| | 10,000,000 | | | 0.625%, 1/31/13 | | | 10,004,426 | | | |
| | 30,000,000 | | | 2.750%, 2/28/13 | | | 30,130,234 | | | |
| | 15,000,000 | | | 0.625%, 2/28/13 | | | 15,013,815 | | | |
| | 10,000,000 | | | 0.625%, 4/30/13 | | | 10,017,397 | | | |
| | 15,000,000 | | | 3.500%, 5/31/13 | | | 15,211,261 | | | |
| | 10,000,000 | | | 1.125%, 6/15/13 | | | 10,044,168 | | | |
| | 15,000,000 | | | 0.375%, 6/30/13 | | | 15,020,256 | | | |
| | 15,000,000 | | | 0.375%, 7/31/13 | | | 15,021,676 | | | |
| | 10,000,000 | | | 0.125%, 9/30/13 | | | 9,995,806 | | | |
| | | | | | | | 130,459,039 | | | |
| U.S. Treasury Strips — 1.8% | | | | | | |
| | 15,000,000 | | | 0.000%, 2/15/13 | | | 14,999,199 | | | |
| Total U.S. Treasury Obligations
(Cost $470,392,296) | | | 470,392,296 | | | |
| | | | | | | | | | |
Principal
Amount | | | | | Value | | | |
| | | | | | | | | | |
| Repurchase Agreements — 44.4% | | | | | | |
| $ | 70,000,000 | | | Bank of America, 0.06%, dated 12/26/12, due 1/2/13, repurchase price $70,000,817 (collateralized by U.S. Treasury Bills, 0.000%, 5/23/13, market value $71,403,883) | | $ | 70,000,000 | | | |
| | 70,000,000 | | | Goldman Sachs, 0.12%, dated 12/24/12, due 1/2/13, repurchase price $70,002,100 (collateralized by U.S. Treasury Bonds, 4.375%, 2/15/38, market value $71,468,381) | | | 70,000,000 | | | |
| | 20,000,000 | | | Goldman Sachs, 0.12%, dated 12/27/12, due 1/2/13, repurchase price $20,000,400 (collateralized by U.S. Treasury Bonds, 4.375%, 2/15/38, market value $20,242,603) | | | 20,000,000 | | | |
| | 50,000,000 | | | Morgan Stanley, 0.18%, dated 12/31/12, due 1/2/13, repurchase price $50,000,500 (collateralized by U.S. Treasury Notes, 0.125%, 12/31/13, market value $50,921,681) | | | 50,000,000 | | | |
| | 165,452,800 | | | TD Securities, 0.17%, dated 12/31/12, due 1/2/13, repurchase price $165,454,363 (collateralized by U.S. Treasury Notes, 0.750%, 12/31/17, market value $168,649,539) | | | 165,452,800 | | | |
| Total Repurchase Agreements (Cost $375,452,800) | | | 375,452,800 | | | |
| Total Investments
(Cost $845,845,096) — 100.0% | | | 845,845,096 | | | |
| Other Assets in Excess of Liabilities — 0.0% | | | 350,385 | | | |
| Net Assets — 100.0% | | $ | 846,195,481 | | | |
(See notes which are an integral part of the Financial Statements)
Annual Shareholder Report
53
| | |
| | |
| Huntington Disciplined Equity Fund | | December 31, 2012 |
| | |
| Portfolio of Investments Summary Table | | (unaudited) |
| | | | |
| Asset Allocation | | Percentage of
Market Value | |
Information Technology | | | 21.9% | |
Energy | | | 11.8% | |
Consumer Staples | | | 11.5% | |
Financials | | | 11.4% | |
Health Care | | | 11.2% | |
Industrials | | | 9.0% | |
Consumer Discretionary | | | 8.8% | |
Cash1 | | | 6.2% | |
Telecommunication Services | | | 3.7% | |
Materials | | | 1.9% | |
Options Purchased | | | 1.4% | |
Utilities | | | 0.7% | |
Real Estate Investment Trusts | | | 0.3% | |
Exchange-Traded Funds | | | 0.2% | |
Total | | | 100.0% | |
| 1 | Investments in an affiliated money market fund. |
Portfolio holdings and allocations are subject to change. As of December 31, 2012, percentages in the table above are based on total investments. Such total investments may differ from the percentages set forth below in the Portfolio of Investments which are computed using the Fund’s total net assets.
The Portfolio of Investments Summary Table and the Portfolio of Investments are broken down by sectors, and these sectors do not represent industry categories for purposes of identifying “industry concentration” as described in the Investment Company Act of 1940, as amended.
Portfolio of Investments
| | | | | | | | | | |
| Shares | | | | | Value | | | |
| | | | | | | | | | |
| Common Stocks — 93.5% | | | | | | |
| Consumer Discretionary — 8.9% | | | | | | |
| | 4,000 | | | Amazon.com, Inc. (a) * | | $ | 1,004,560 | | | |
| | 33,000 | | | Comcast Corp., Class A (a) | | | 1,233,540 | | | |
| | 42,000 | | | Ford Motor Co. | | | 543,900 | | | |
| | 21,000 | | | Home Depot, Inc./The (a) | | | 1,298,850 | | | |
| | 10,000 | | | Lowe’s Companies, Inc. | | | 355,200 | | | |
| | 11,000 | | | McDonald’s Corp. | | | 970,310 | | | |
| | 20,000 | | | News Corp. | | | 524,800 | | | |
| | 10,000 | | | NIKE, Inc. (a) | | | 516,000 | | | |
| | 8,000 | | | Starbucks Corp. | | | 428,960 | | | |
| | 7,000 | | | Target Corp. (a) | | | 414,190 | | | |
| | 21,700 | | | Walt Disney Co./The (a) | | | 1,080,443 | | | |
| | | | | | | | 8,370,753 | | | |
| Consumer Staples — 11.7% | | | | | | |
| | 22,000 | | | Altria Group, Inc. | | | 691,240 | | | |
| | 45,000 | | | Coca-Cola Co./The (a) | | | 1,631,250 | | | |
| | 2,500 | | | Colgate-Palmolive Co. | | | 261,350 | | | |
| | 5,700 | | | Costco Wholesale Corp. (a) | | | 562,989 | | | |
| | 10,500 | | | CVS Caremark Corp. (a) | | | 507,675 | | | |
| | 10,000 | | | H.J. Heinz Co. | | | 576,800 | | | |
| | 19,300 | | | Kraft Foods, Inc., Class A | | | 491,571 | | | |
| | 18,000 | | | PepsiCo, Inc. (a) | | | 1,231,740 | | | |
| | 18,000 | | | Philip Morris International, Inc. (a) | | | 1,505,520 | | | |
| | | | | | | | | | |
| Shares | | | | | Value | | | |
| | | | | | | | | | |
| Common Stocks — (Continued) | | | | | | |
| Consumer Staples — (Continued) | | | | | | |
| | 28,500 | | | Procter & Gamble Co. (a) | | $ | 1,934,865 | | | |
| | 10,000 | | | Walgreen Co. (a) | | | 370,100 | | | |
| | 18,000 | | | Wal-Mart Stores, Inc. (a) | | | 1,228,140 | | | |
| | | | | | | | 10,993,240 | | | |
| Energy — 12.0% | | | | | | |
| | 4,800 | | | Apache Corp. | | | 376,800 | | | |
| | 12,800 | | | Baker Hughes, Inc. | | | 522,752 | | | |
| | 20,000 | | | Chevron Corp. | | | 2,162,800 | | | |
| | 13,700 | | | ConocoPhillips (a) | | | 794,463 | | | |
| | 4,500 | | | Devon Energy Corp. | | | 234,180 | | | |
| | 50,100 | | | Exxon Mobil Corp. (a) | | | 4,336,155 | | | |
| | 12,000 | | | Halliburton Co. | | | 416,280 | | | |
| | 1,500 | | | National Oilwell Varco, Inc. | | | 102,525 | | | |
| | 12,500 | | | Occidental Petroleum Corp. | | | 957,625 | | | |
| | 6,850 | | | Phillips 66 | | | 363,735 | | | |
| | 14,500 | | | Schlumberger Ltd. (a) | | | 1,004,705 | | | |
| | | | | | | | 11,272,020 | | | |
| Financials — 11.6% | | | | | | |
| | 6,000 | | | Allstate Corp./The | | | 241,020 | | | |
| | 12,300 | | | American Express Co. | | | 707,004 | | | |
| | 97,000 | | | Bank of America Corp. (a) | | | 1,125,200 | | | |
| | 17,000 | | | Bank of New York Mellon Corp./The (a) | | | 436,900 | | | |
(See notes which are an integral part of the Financial Statements)
Annual Shareholder Report
54
| | |
| Huntington Disciplined Equity Fund | | (Continued) |
| | | | | | | | | | |
Shares | | | | | Value | | | |
| | | | | | | | | | |
| Common Stocks — (Continued) | | | | | | |
| Financials — (Continued) | | | | | | |
| | 6,500 | | | Berkshire Hathaway, Inc., Class B * | | $ | 583,050 | | | |
| | 6,700 | | | Chubb Corp./The (a) | | | 504,644 | | | |
| | 28,000 | | | Citigroup, Inc. (a) | | | 1,107,680 | | | |
| | 2,200 | | | Goldman Sachs Group, Inc./The | | | 280,632 | | | |
| | 45,500 | | | JPMorgan Chase & Co. (a) | | | 2,000,635 | | | |
| | 10,000 | | | MetLife, Inc. (a) | | | 329,400 | | | |
| | 30,000 | | | Morgan Stanley | | | 573,600 | | | |
| | 35,500 | | | U.S. Bancorp (a) | | | 1,133,870 | | | |
| | 54,000 | | | Wells Fargo & Co. (a) | | | 1,845,720 | | | |
| | | | | | | | 10,869,355 | | | |
| Health Care — 11.4% | | | | | | |
| | 16,200 | | | Abbott Laboratories | | | 1,061,100 | | | |
| | 11,000 | | | Amgen, Inc. (a) | | | 949,520 | | | |
| | 4,900 | | | Baxter International, Inc. | | | 326,634 | | | |
| | 23,200 | | | Bristol-Myers Squibb Co. | | | 756,088 | | | |
| | 10,000 | | | Eli Lilly & Co. (a) | | | 493,200 | | | |
| | 8,500 | | | Gilead Sciences, Inc. * | | | 624,325 | | | |
| | 29,500 | | | Johnson & Johnson (a) | | | 2,067,950 | | | |
| | 10,000 | | | Medtronic, Inc. | | | 410,200 | | | |
| | 32,000 | | | Merck & Co., Inc. (a) | | | 1,310,080 | | | |
| | 85,000 | | | Pfizer, Inc. (a) | | | 2,131,800 | | | |
| | 10,000 | | | UnitedHealth Group, Inc. | | | 542,400 | | | |
| | | | | | | | 10,673,297 | | | |
| Industrials — 9.1% | | | | | | |
| | 8,300 | | | 3M Co. (a) | | | 770,655 | | | |
| | 7,500 | | | Boeing Co./The | | | 565,200 | | | |
| | 7,500 | | | Caterpillar, Inc. | | | 671,850 | | | |
| | 10,000 | | | Emerson Electric Co. (a) | | | 529,600 | | | |
| | 2,500 | | | FedEx Corp. | | | 229,300 | | | |
| | 5,500 | | | General Dynamics Corp. | | | 380,985 | | | |
| | 110,000 | | | General Electric Co. (a) | | | 2,308,900 | | | |
| | 8,500 | | | Honeywell International, Inc. (a) | | | 539,495 | | | |
| | 2,000 | | | Lockheed Martin Corp. | | | 184,580 | | | |
| | 3,000 | | | Norfolk Southern Corp. | | | 185,520 | | | |
| | 5,000 | | | Union Pacific Corp. (a) | | | 628,600 | | | |
| | 10,000 | | | United Parcel Service, Inc., Class B | | | 737,300 | | | |
| | 10,000 | | | United Technologies Corp. | | | 820,100 | | | |
| | | | | | | | 8,552,085 | | | |
| Information Technology — 22.2% | | | | | | |
| | 5,000 | | | Accenture PLC, Class A | | | 332,500 | | | |
| | 10,300 | | | Apple, Inc. | | | 5,490,209 | | | |
| | 60,000 | | | Cisco Systems, Inc. (a) | | | 1,179,000 | | | |
| | 15,000 | | | Dell, Inc. | | | 151,950 | | | |
| | 13,000 | | | eBay, Inc. (a) * | | | 663,260 | | | |
| | 21,700 | | | EMC Corp. * | | | 549,010 | | | |
| | 3,000 | | | Google, Inc., Class A (a) * | | | 2,128,110 | | | |
| | 18,000 | | | Hewlett-Packard Co. | | | 256,500 | | | |
| | 50,000 | | | Intel Corp. | | | 1,031,500 | | | |
| | 12,200 | | | International Business Machines Corp. (a) | | | 2,336,910 | | | |
| | 1,000 | | | MasterCard, Inc., Class A (a) | | | 491,280 | | | |
| | 85,000 | | | Microsoft Corp. (a) | | | 2,272,050 | | | |
| | 43,000 | | | Oracle Corp. | | | 1,432,760 | | | |
| | | | | | | | | | |
Shares or
Contracts | | | | | Value | | | |
| | | | | | | | | | |
| Common Stocks — (Continued) | | | | | | |
| Information Technology — (Continued) | | | | | | |
| | 18,500 | | | QUALCOMM, Inc. | | $ | 1,147,370 | | | |
| | 10,000 | | | Texas Instruments, Inc. | | | 309,400 | | | |
| | 7,000 | | | Visa, Inc., Class A (a) | | | 1,061,060 | | | |
| | | | | | | | 20,832,869 | | | |
| Materials — 1.9% | | | | | | |
| | 10,000 | | | Dow Chemical Co./The (a) | | | 323,200 | | | |
| | 10,500 | | | Du Pont (E.I.) de Nemours & Co. | | | 472,185 | | | |
| | 10,500 | | | Freeport-McMoRan Copper & Gold, Inc. | | | 359,100 | | | |
| | 7,000 | | | Monsanto Co. (a) | | | 662,550 | | | |
| | | | | | | | 1,817,035 | | | |
| Real Estate Investment Trusts — 0.3% | | | | | | |
| | 2,000 | | | Simon Property Group, Inc. | | | 316,180 | | | |
| Telecommunication Services — 3.7% | | | | | | |
| | 76,000 | | | AT&T, Inc. | | | 2,561,960 | | | |
| | 22,000 | | | Verizon Communications, Inc. | | | 951,940 | | | |
| | | | | | | | 3,513,900 | | | |
| Utilities — 0.7% | | | | | | |
| | 7,000 | | | Exelon Corp. | | | 208,180 | | | |
| | 1,000 | | | NextEra Energy, Inc. | | | 69,190 | | | |
| | 9,000 | | | Southern Co./The | | | 385,290 | | | |
| | | | | | | | 662,660 | | | |
| Total Common Stocks (Cost $74,191,356) | | | 87,873,394 | | | |
| Exchange-Traded Funds — 0.2% | | | | | | |
| | 6,400 | | | Utilities Select Sector SPDR Fund | | | 223,680 | | | |
| Total Exchange-Traded Funds (Cost $196,570) | | | 223,680 | | | |
| Options Purchased — 1.5% (b) | | | | | | |
| | 300 | | | S&P 100 Index, Put @ 640,
Expiring February 2013 | | | 363,000 | | | |
| | 400 | | | S&P 100 Index, Put @ 640,
Expiring March 2013 | | | 670,000 | | | |
| | 250 | | | S&P 100 Index, Put @ 650,
Expiring January 2013 | | | 320,000 | | | |
| Total Options Purchased (Cost $1,838,154) | | | 1,353,000 | | | |
| Cash Equivalents — 6.3% | | | | | | |
| | 5,903,706 | | | Huntington U.S. Treasury Money Market Fund, Trust Shares, 0.050% (c) (d) | | | 5,903,706 | | | |
| Total Cash Equivalents (Cost $5,903,706) | | | 5,903,706 | | | |
| Total Investments
(Cost $82,129,786) — 101.5% | | | 95,353,780 | | | |
| Liabilities in Excess of Other Assets — (1.5)% | | | (1,366,893) | | | |
| Net Assets — 100.0% | | $ | 93,986,887 | | | |
| (a) | All or a portion of the security is held as collateral for written call options. |
| (b) | All or a portion of the security is held as collateral for written put options. |
| (c) | Investment in affiliate. |
| (d) | Rate disclosed is the seven day yield as of December 31, 2012. |
| * | Non-income producing security. |
(See notes which are an integral part of the Financial Statements)
Annual Shareholder Report
55
| | |
| | |
| Huntington Dividend Capture Fund | | December 31, 2012 |
| | |
| Portfolio of Investments Summary Table | | (unaudited) |
| | | | |
| Asset Allocation | | Percentage of
Market Value | |
Common Stocks | | | 71.8% | |
Preferred Stocks | | | 20.2% | |
Short-Term Securities Held as Collateral for Securities Lending | | | 4.8% | |
Cash1 | | | 1.7% | |
Exchange Traded Funds | | | 1.5% | |
Total | | | 100.0% | |
| 1 | Investments in an affiliated money market fund. |
Portfolio holdings and allocations are subject to change. As of December 31, 2012, percentages in the table above are based on total investments. Such total investments may differ from the percentages set forth below in the Portfolio of Investments which are computed using the Fund’s total net assets.
The Portfolio of Investments are broken down by sectors, and these sectors do not represent industry categories for purposes of identifying “industry concentration” as described in the Investment Company Act of 1940, as amended.
Portfolio of Investments
| | | | | | | | | | |
| Shares | | | | | Value | | | |
| | | | | | | | | | |
| Common Stocks — 75.3% | | | | | | |
| Consumer Discretionary — 3.1% | | | | | | |
| | 31,500 | | | Comcast Corp., Class A | | $ | 1,177,470 | | | |
| | 70,000 | | | D.R. Horton, Inc. (a) | | | 1,384,600 | | | |
| | 14,000 | | | Family Dollar Stores, Inc. | | | 887,740 | | | |
| | 39,000 | | | Genuine Parts Co. | | | 2,479,620 | | | |
| | | | | | | | 5,929,430 | | | |
| Consumer Staples — 6.1% | | | | | | |
| | 27,750 | | | Colgate-Palmolive Co. | | | 2,900,985 | | | |
| | 25,000 | | | General Mills, Inc. | | | 1,010,250 | | | |
| | 19,250 | | | H.J. Heinz Co. | | | 1,110,340 | | | |
| | 13,500 | | | Kimberly-Clark Corp. | | | 1,139,805 | | | |
| | 29,250 | | | Kroger Co./The | | | 761,085 | | | |
| | 18,750 | | | Philip Morris International, Inc. | | | 1,568,250 | | | |
| | 66,750 | | | Sysco Corp. | | | 2,113,305 | | | |
| | 15,750 | | | Wal-Mart Stores, Inc. | | | 1,074,623 | | | |
| | | | | | | | 11,678,643 | | | |
| Energy — 16.6% | | | | | | |
| | 81,750 | | | BP PLC ADR | | | 3,404,070 | | | |
| | 92,500 | | | Cenovus Energy, Inc. | | | 3,102,450 | | | |
| | 18,250 | | | Chevron Corp. | | | 1,973,555 | | | |
| | 41,500 | | | ConocoPhillips | | | 2,406,585 | | | |
| | 197,500 | | | Crosstex Energy LP | | | 2,871,650 | | | |
| | 105,000 | | | Enbridge Energy Partners LP (b) | | | 2,929,500 | | | |
| | 44,000 | | | Exxon Mobil Corp. | | | 3,808,200 | | | |
| | 37,000 | | | Linn Energy LLC | | | 1,303,880 | | | |
| | 43,500 | | | Magellan Midstream Partners LP | | | 1,878,765 | | | |
| | 55,750 | | | Marathon Oil Corp. | | | 1,709,295 | | | |
| | 20,000 | | | Plains All American Pipeline LP | | | 904,800 | | | |
| | 35,250 | | | Royal Dutch Shell PLC ADR | | | 2,430,487 | | | |
| | 42,000 | | | Spectra Energy Corp. | | | 1,149,960 | | | |
| | 25,500 | | | Sunoco Logistics Partners LP | | | 1,268,115 | | | |
| | 16,000 | | | Williams Partners LP (b) | | | 778,560 | | | |
| | | | | | | | 31,919,872 | | | |
| | | | | | | | | | |
| Shares | | | | | Value | | | |
| | | | | | | | | | |
| Common Stocks — (Continued) | | | | | | |
| Financials — 12.1% | | | | | | |
| | 40,500 | | | American Financial Group, Inc. | | $ | 1,600,560 | | | |
| | 46,500 | | | Bank of Montreal | | | 2,850,450 | | | |
| | 53,000 | | | Cullen/Frost Bankers, Inc. | | | 2,876,310 | | | |
| | 91,500 | | | Federated Investors, Inc., Class B (b) | | | 1,851,045 | | | |
| | 116,500 | | | Fulton Financial Corp. | | | 1,119,565 | | | |
| | 34,000 | | | JPMorgan Chase & Co. | | | 1,494,980 | | | |
| | 91,000 | | | Principal Financial Group, Inc. | | | 2,595,320 | | | |
| | 44,000 | | | Royal Bank of Canada (b) | | | 2,653,200 | | | |
| | 32,000 | | | U.S. Bancorp | | | 1,022,080 | | | |
| | 60,000 | | | Unum Group | | | 1,249,200 | | | |
| | 37,500 | | | Waddell & Reed Financial, Inc., Class A | | | 1,305,750 | | | |
| | 75,000 | | | Wells Fargo & Co. | | | 2,563,500 | �� | | |
| | | | | | | | 23,181,960 | | | |
| Health Care — 5.4% | | | | | | |
| | 44,000 | | | Abbott Laboratories | | | 2,882,000 | | | |
| | 48,000 | | | AstraZeneca PLC ADR | | | 2,268,960 | | | |
| | 22,750 | | | Becton, Dickinson & Co. | | | 1,778,823 | | | |
| | 57,000 | | | Cardinal Health, Inc. | | | 2,347,260 | | | |
| | 28,750 | | | Merck & Co., Inc. | | | 1,177,025 | | | |
| | | | | | | | 10,454,068 | | | |
| Industrials — 7.0% | | | | | | |
| | 28,750 | | | 3M Co. | | | 2,669,437 | | | |
| | 113,000 | | | CSX Corp. | | | 2,229,490 | | | |
| | 67,000 | | | Republic Services, Inc. | | | 1,965,110 | | | |
| | 40,000 | | | Rockwell Automation, Inc. | | | 3,359,600 | | | |
| | 19,000 | | | Rockwell Collins, Inc. | | | 1,105,230 | | | |
| | 63,000 | | | Waste Management, Inc. | | | 2,125,620 | | | |
| | | | | | | | 13,454,487 | | | |
| Information Technology — 5.4% | | | | | | |
| | 110,750 | | | Cisco Systems, Inc. | | | 2,176,237 | | | |
| | 10,000 | | | Harris Corp. | | | 489,600 | | | |
| | 136,500 | | | Intel Corp. (b) | | | 2,815,995 | | | |
(See notes which are an integral part of the Financial Statements)
Annual Shareholder Report
56
| | |
| Huntington Dividend Capture Fund | | (Continued) |
| | | | | | | | | | |
| Shares | | | | | Value | | | |
| | | | | | | | | | |
| Common Stocks — (Continued) | | | | | | |
| Information Technology — (Continued) | | | | | | |
| | 61,500 | | | Microsoft Corp. | | $ | 1,643,895 | | | |
| | 63,250 | | | Paychex, Inc. (b) | | | 1,969,605 | | | |
| | 64,000 | | | Total System Services, Inc. | | | 1,370,880 | | | |
| | | | | | | | 10,466,212 | | | |
| Materials — 2.3% | | | | | | |
| | 37,750 | | | Freeport-McMoRan Copper & Gold, Inc. | | | 1,291,050 | | | |
| | 27,500 | | | Sensient Technologies Corp. | | | 977,900 | | | |
| | 71,000 | | | Sonoco Products Co. | | | 2,110,830 | | | |
| | | | | | | | 4,379,780 | | | |
| Real Estate Investment Trusts — 11.5% | | | | | | |
| | 32,000 | | | EastGroup Properties, Inc. | | | 1,721,920 | | | |
| | 39,750 | | | EPR Properties (b) | | | 1,832,873 | | | |
| | 20,000 | | | HCP, Inc. | | | 903,600 | | | |
| | 56,000 | | | Highwoods Properties, Inc. | | | 1,873,200 | | | |
| | 30,000 | | | Home Properties, Inc. | | | 1,839,300 | | | |
| | 98,000 | | | Kimco Realty Corp. | | | 1,893,360 | | | |
| | 52,000 | | | Liberty Property Trust | | | 1,860,040 | | | |
| | 20,000 | | | LTC Properties, Inc. | | | 703,800 | | | |
| | 53,500 | | | Mack-Cali Realty Corp. | | | 1,396,885 | | | |
| | 29,250 | | | Mid-America Apartment Communities, Inc. | | | 1,893,938 | | | |
| | 21,500 | | | National Health Investors, Inc. | | | 1,215,395 | | | |
| | 18,500 | | | National Retail Properties, Inc. | | | 577,200 | | | |
| | 72,000 | | | Omega Healthcare Investors, Inc. | | | 1,717,200 | | | |
| | 22,000 | | | ProLogis, Inc. | | | 802,780 | | | |
| | 4,000 | | | Simon Property Group, Inc. | | | 632,360 | | | |
| | 19,000 | | | Ventas, Inc. | | | 1,229,680 | | | |
| | | | | | | | 22,093,531 | | | |
| Telecommunication Services — 2.5% | | | | | | |
| | 72,000 | | | AT&T, Inc. | | | 2,427,120 | | | |
| | 57,000 | | | Verizon Communications, Inc. | | | 2,466,390 | | | |
| | | | | | | | 4,893,510 | | | |
| Utilities — 3.3% | | | | | | |
| | 85,500 | | | CenterPoint Energy, Inc. | | | 1,645,875 | | | |
| | 100,000 | | | CMS Energy Corp. | | | 2,438,000 | | | |
| | 58,250 | | | PG&E Corp. | | | 2,340,485 | | | |
| | | | | | | | 6,424,360 | | | |
| Total Common Stocks (Cost $138,406,743) | | | 144,875,853 | | | |
| Preferred Stocks — 21.2% | | | | | | |
| Financials — 13.9% | | | | | | |
| | 45,000 | | | Allianz SE, 8.375% | | | 1,138,500 | | | |
| | 70,000 | | | American Financial Group, Inc., 7.000% | | | 1,878,100 | | | |
| | 80,000 | | | Ameriprise Financial, Inc., 7.750% | | | 2,197,600 | | | |
| | 45,000 | | | Axis Capital Holdings Ltd.,
Series C, 6.875% | | | 1,201,500 | | | |
| | 10,000 | | | BB&T Corp., 5.850% | | | 259,800 | | | |
| | 90,000 | | | Charles Schwab Corp./The,
Series B, 6.000% | | | 2,353,500 | | | |
| | 50,000 | | | Credit Suisse Guernsey, 7.900% (b) | | | 1,268,000 | | | |
| | 140,000 | | | JPMorgan Chase Capital XXIX, 6.700% | | | 3,577,000 | | | |
| | 80,000 | | | KKR Financial Holdings LLC, 8.375% | | | 2,226,400 | | | |
| | | | | | | | | | |
| Shares | | | | | Value | | | |
| Preferred Stocks — (Continued) | | | | | | |
| Financials — (Continued) | | | | | | |
| | 55,000 | | | M&T Capital Trust IV, 8.500% | | $ | 1,394,250 | | | |
| | 70,000 | | | PartnerRe Ltd., Series E, 7.250% | | | 1,892,100 | | | |
| | 65,000 | | | Prudential Financial, Inc., 9.000% (b) | | | 1,678,300 | | | |
| | 70,000 | | | Raymond James Financial, Inc., 6.900% | | | 1,908,900 | | | |
| | 100,000 | | | Wells Fargo & Co., Series J, 8.000% (b) | | | 2,935,000 | | | |
| | 35,000 | | | Wells Fargo Capital Trust XII, 7.875% | | | 886,550 | | | |
| | | | | | | | 26,795,500 | | | |
| Real Estate Investment Trusts — 2.9% | | | | | | |
| | 19,000 | | | Kimco Realty Corp., Series H, 6.900% | | | 505,970 | | | |
| | 40,000 | | | PS Business Parks, Inc., Series S, 6.450% | | | 1,054,800 | | | |
| | 40,000 | | | Realty Income Corp., Series F, 6.625% | | | 1,060,800 | | | |
| | 110,000 | | | Vornado Realty LP, 7.875% | | | 2,978,800 | | | |
| | | | | | | | 5,600,370 | | | |
| Telecommunication Services — 1.3% | | | | | | |
| | 90,000 | | | Qwest Corp., 7.500% | | | 2,427,300 | | | |
| Utilities — 3.1% | | | | | | |
| | 115,000 | | | Dominion Resources, Inc., Class A, 8.375% | | | 3,096,950 | | | |
| | 105,000 | | | NextEra Energy Capital Holdings, Inc., Series F, 8.750% | | | 2,804,550 | | | |
| | | | | | | | 5,901,500 | | | |
| Total Preferred Stocks (Cost $40,790,673) | | | 40,724,670 | | | |
| Exchange-Traded Funds — 1.6% | | | | | | |
| | 41,250 | | | iShares S&P 500 Value Index Fund (b) | | | 2,738,587 | | | |
| | 13,000 | | | Technology Select Sector SPDR Fund (b) | | | 376,350 | | | |
| Total Exchange-Traded Funds (Cost $2,338,263) | | | 3,114,937 | | | |
| Cash Equivalents — 1.8% | | | | | | |
| | 3,354,143 | | | Huntington U.S. Treasury Money Market Fund, Trust Shares, 0.050% (c) (d) | | | 3,354,143 | | | |
| Total Cash Equivalents (Cost $3,354,143) | | | 3,354,143 | | | |
| Short-Term Securities Held as Collateral for
Securities Lending — 5.0% | | | | | | |
| | 9,634,051 | | | Fidelity Institutional Money Market Portfolio, Institutional Class, 0.180% (d) | | | 9,634,051 | | | |
| Total Short-Term Securities Held as Collateral for
Securities Lending (Cost $9,634,051) | | | 9,634,051 | | | |
| Total Investments
(Cost $194,523,873) — 104.9% | | | 201,703,654 | | | |
| Liabilities in Excess of Other Assets — (4.9)% | | | (9,415,224) | | | |
| Net Assets — 100.0% | | $ | 192,288,430 | | | |
| (a) | All or a portion of the security is held as collateral for written call options. |
| (b) | All or a portion of the security was on loan as of December 31, 2012. The total value of securities on loan as of December 31, 2012 was $9,610,624. |
| (c) | Investment in affiliate. |
| (d) | Rate disclosed is the seven day yield as of December 31, 2012. |
| ADR | — American Depositary Receipt |
(See notes which are an integral part of the Financial Statements)
Annual Shareholder Report
57
| | |
| | |
| Huntington Global Select Markets Fund | | December 31, 2012 |
| | |
| Portfolio of Investments Summary Table | | (unaudited) |
| | | | |
Asset Allocation | | Percentage of
Market Value | |
Common Stocks | | | 83.1% | |
Exchange-Traded Funds | | | 8.0% | |
Short-Term Securities Held as Collateral for Securities Lending | | | 3.9% | |
Cash1 | | | 2.5% | |
Corporate Bonds | | | 2.1% | |
Foreign Government Bonds | | | 0.4% | |
Total | | | 100.0% | |
| 1 | Investments in an affiliated money market fund. |
Portfolio holdings and allocations are subject to change. As of December 31, 2012, percentages in the table above are based on total investments. Such total investments may differ from the percentages set forth below in the Portfolio of Investments which are computed using the Fund’s total net assets.
The Portfolio of Investments are broken down by sectors, and these sectors do not represent industry categories for purposes of identifying “industry concentration” as described in the Investment Company Act of 1940, as amended.
Portfolio of Investments
| | | | | | | | | | |
| Shares | | | | | Value + | | | |
| | | | | | | | | | |
| Common Stocks — 87.7% | | | | | | |
| Brazil — 10.6% | | | | | | |
| Consumer Discretionary — 2.6% | | | | | | |
| | 115,546 | | | Lojas Americanas SA | | $ | 1,032,093 | | | |
| Consumer Staples — 2.1% | | | | | | |
| | 19,000 | | | Companhia De Bebidas Das Americas ADR | | | 797,810 | | | |
| Financials — 4.4% | | | | | | |
| | 170,000 | | | BM&FBOVESPA SA | | | 1,159,787 | | | |
| | 35,000 | | | Itau Unibanco Holding SA ADR | | | 576,100 | | | |
| | | | | | | | 1,735,887 | | | |
| Health Care — 1.5% | | | | | | |
| | 108,000 | | | OdontoPrev SA | | | 564,709 | | | |
| | | | | | | | 4,130,499 | | | |
| Cayman Islands — 3.1% | | | | | | |
| Consumer Discretionary — 3.1% | | | | | | |
| | 440,000 | | | Wynn Macau Ltd. * | | | 1,211,708 | | | |
| China — 6.2% | | | | | | |
| Energy — 2.7% | | | | | | |
| | 500,000 | | | China Oilfield Services Ltd. | | | 1,048,461 | | | |
| Financials — 3.5% | | | | | | |
| | 900,000 | | | Bank of China Ltd. | | | 407,624 | | | |
| | 1,200,000 | | | China Construction Bank Corp. | | | 980,727 | | | |
| | | | | 1,388,351 | | | |
| | | | | 2,436,812 | | | |
| Hong Kong — 1.7% | | | | | | |
| Information Technology — 1.7% | | | | | | |
| | 390,000 | | | Digital China Holdings Ltd. | | | 674,470 | | | |
| | | | | | | | | | |
| Shares | | | | | Value + | | | |
| | | | | | | | | | |
| Common Stocks — (Continued) | | | | | | |
| India — 16.9% | | | | | | |
| Consumer Discretionary — 2.2% | | | | | | |
| | 50,000 | | | Mahindra & Mahindra Ltd. | | $ | 857,102 | | | |
| Consumer Staples — 1.5% | | | | | | |
| | 60,000 | | | Hindustan Unilever Ltd. | | | 576,948 | | | |
| Energy — 1.1% | | | | | | |
| | 150,000 | | | Petronet LNG Ltd. | | | 432,694 | | | |
| Financials — 3.7% | | | | | | |
| | 17,000 | | | ICICI Bank Ltd. ADR (a) | | | 741,370 | | | |
| | 160,000 | | | Rural Electrification Corp. Ltd. | | | 723,572 | | | |
| | | | | 1,464,942 | | | |
| Health Care — 5.9% | | | | | | |
| | 26,000 | | | Divi’s Laboratories Ltd. | | | 524,334 | | | |
| | 55,000 | | | Lupin Ltd. | | | 620,022 | | | |
| | 85,000 | | | Sun Pharmaceutical Industries Ltd. | | | 1,147,638 | | | |
| | | | | 2,291,994 | | | |
| Information Technology — 1.9% | | | | | | |
| | 32,000 | | | Tata Consultancy Services Ltd. | | | 735,941 | | | |
| Materials — 0.6% | | | | | | |
| | 105,000 | | | Hindalco Industries Ltd. | | | 253,369 | | | |
| | | | | 6,612,990 | | | |
| Indonesia — 7.4% | | | | | | |
| Health Care — 1.7% | | | | | | |
| | 6,000,000 | | | Kalbe Farma Tbk PT | | | 650,588 | | | |
| Industrials — 1.9% | | | | | | |
| | 360,151 | | | United Tractors Tbk PT | | | 730,978 | | | |
| Materials — 2.4% | | | | | | |
| | 3,200,000 | | | Holcim Indonesia Tbk PT | | | 951,077 | | | |
(See notes which are an integral part of the Financial Statements)
Annual Shareholder Report
58
| | |
| Huntington Global Select Markets Fund | | (Continued) |
| | | | | | | | | | |
Shares | | | | | Value + | | | |
| | | | | | | | | | |
| Common Stocks — (Continued) | | | | | | |
| Indonesia — (Continued) | | | | | | |
| Utilities — 1.4% | | | | | | |
| | 1,200,000 | | | Perusahaan Gas Negara PT | | $ | 565,372 | | | |
| | | | | 2,898,015 | | | |
| Mexico — 1.5% | | | | | | |
| Consumer Staples — 1.5% | | | | | | |
| | 6,000 | | | Fomento Economico Mexicano SAB de CV ADR | | | 604,200 | | | |
| Poland — 4.4% | | | | | | |
| Financials — 2.9% | | | | | | |
| | 3,200 | | | Bank Pekao SA (a) | | | 173,889 | | | |
| | 9,000 | | | Bre Bank SA (a) * | | | 950,460 | | | |
| | | | | 1,124,349 | | | |
| Utilities — 1.5% | | | | | | |
| | 100,000 | | | Polska Grupa Energetyczna SA (a) | | | 590,792 | | | |
| | | | | 1,715,141 | | | |
| Republic Of South Korea — 17.3% | | | | | | |
| Consumer Discretionary — 5.4% | | | | | | |
| | 83,000 | | | Dong Ah Tire & Rubber Co. Ltd. | | | 1,236,556 | | | |
| | 4,300 | | | Hyundai Motor Co. | | | 891,562 | | | |
| | | | | 2,128,118 | | | |
| Consumer Staples — 3.2% | | | | | | |
| | 2,000 | | | LG Household & Health Care Ltd. | | | 1,232,330 | | | |
| Financials — 4.0% | | | | | | |
| | 75,480 | | | Korean Reinsurance Co. | | | 818,062 | | | |
| | 20,000 | | | Shinhan Financial Group Co. Ltd. | | | 736,197 | | | |
| | | | | 1,554,259 | | | |
| Industrials — 1.6% | | | | | | |
| | 2,750 | | | Hyundai Heavy Industries Co. Ltd. | | | 629,318 | | | |
| Information Technology — 3.1% | | | | | | |
| | 850 | | | Samsung Electronics Co. Ltd. | | | 1,228,365 | | | |
| | | | | 6,772,390 | | | |
| Taiwan — 7.1% | | | | | | |
| Consumer Discretionary — 1.6% | | | | | | |
| | 170,000 | | | Eclat Textile Co. Ltd. | | | 626,164 | | | |
| Financials — 2.4% | | | | | | |
| | 782,687 | | | Fubon Financial Holding Co. Ltd. | | | 950,407 | | | |
| Materials — 3.1% | | | | | | |
| | 929,948 | | | Asia Cement Corp. | | | 1,200,704 | | | |
| | | | | 2,777,275 | | | |
| Turkey — 2.1% | | | | | | |
| Industrials — 2.1% | | | | | | |
| | 90,000 | | | Yazicilar Holding AS | | | 807,227 | | | |
| | | | | | | | | | |
Principal
Amount
or Shares | | | | | Value + | | | |
| | | | | | | | | | |
| Common Stocks — (Continued) | | | | | | |
| United States — 9.4% | | | | | | |
| Consumer Discretionary — 2.0% | | | | | | |
| | 12,000 | | | Yum! Brands, Inc. | | $ | 796,800 | | | |
| Energy — 2.7% | | | | | | |
| | 15,000 | | | Schlumberger Ltd. | | | 1,039,350 | | | |
| Information Technology — 3.8% | | | | | | |
| | 1,000 | | | Apple, Inc. | | | 533,030 | | | |
| | 5,000 | | | International Business Machines Corp. | | | 957,750 | | | |
| | | | | 1,490,780 | | | |
| Materials — 0.9% | | | | | | |
| | 10,000 | | | Freeport-McMoRan Copper & Gold, Inc. | | | 342,000 | | | |
| | | | | 3,668,930 | | | |
| Total Common Stocks (Cost $32,670,519) | | | 34,309,657 | | | |
| Exchange-Traded Funds — 8.4% | | | | | | |
| | 26,000 | | | iShares FTSE China 25 Index Fund | | | 1,052,480 | | | |
| | 15,000 | | | iShares MSCI Emerging Markets Index Fund | | | 665,250 | | | |
| | 50,000 | | | iShares MSCI Malaysia Index Fund | | | 756,500 | | | |
| | 60,000 | | | iShares MSCI Taiwan Index Fund | | | 817,200 | | | |
| Total Exchange-Traded Funds (Cost $3,063,629) | | | 3,291,430 | | | |
| Corporate Bonds — 2.2% | | | | | | |
| Australia — 1.8% | | | | | | |
| Financials — 1.8% | | | | | | |
| | 600,000 | | | Goldman Sachs Group, Inc./The, 7.750%, 11/23/16 (b) | | | 695,658 | | | |
| Multi-Nationals — 0.4% | | | | | | |
| | 350,000 | | | European Bank for Reconstruction & Development, Series E, MTN, 9.500%, 11/6/13 (c) | | | 175,691 | | | |
| Total Corporate Bonds (Cost $818,328) | | | 871,349 | | | |
| Foreign Government Bonds — 0.5% | | | | | | |
| Indonesia — 0.5% | | | | | | |
| | 1,700,000,000 | | | Indonesian Government, Series FR55, 7.375%, 9/15/16 (b) | | | 188,811 | | | |
| Total Foreign Government Bonds (Cost $202,006) | | | 188,811 | | | |
| Cash Equivalents — 2.7% | | | | | | |
| | 1,038,116 | | | Huntington U.S. Treasury Money Market Fund, Trust Shares, 0.050% (d) (e) | | | 1,038,116 | | | |
| Total Cash Equivalents (Cost $1,038,116) | | | 1,038,116 | | | |
(See notes which are an integral part of the Financial Statements)
Annual Shareholder Report
59
| | |
| Huntington Global Select Markets Fund | | (Continued) |
| | | | | | | | | | |
| Shares | | | | | Value + | | | |
| | | | | | | | | |
| Short-Term Securities Held as Collateral for
Securities Lending — 4.1% | | | | | | |
| | 1,593,389 | | | Fidelity Institutional Money Market Portfolio, Institutional Class, 0.180% (e) | | $ | 1,593,389 | | | |
| Total Short-Term Securities Held as Collateral for
Securities Lending (Cost $1,593,389) | | | 1,593,389 | | | |
| Total Investments
(Cost $39,385,987) — 105.6% | | | 41,292,752 | | | |
| Liabilities in Excess of Other Assets — (5.6)% | | | (2,180,967) | | | |
| Net Assets — 100.0% | | $ | 39,111,785 | | | |
| (a) | All or a portion of the security was on loan as of December 31, 2012. The total value of securities on loan as of December 31, 2012 was $1,530,738. |
| (b) | Foreign-denominated security. Principal amount is reported in applicable country’s currency. |
| (c) | Foreign-denominated security. Principal amount is reported in Indonesian Rupiah. |
| (d) | Investment in affiliate. |
| (e) | Rate disclosed is the seven day yield as of December 31, 2012. |
| * | Non-income producing security. |
| + | All securities, except those traded on United States (including ADRs) and Canadian exchanges, Cash Equivalents or Short-Term Securities were fair valued at December 31, 2012. |
| ADR | — American Depositary Receipt |
(See notes which are an integral part of the Financial Statements)
Annual Shareholder Report
60
| | |
| | |
| Huntington Growth Fund | | December 31, 2012 |
| | |
| Portfolio of Investments Summary Table | | (unaudited) |
| | | | |
| Asset Allocation | | Percentage of
Market Value | |
Information Technology | | | 33.9% | |
Health Care | | | 16.1% | |
Consumer Discretionary | | | 12.9% | |
Consumer Staples | | | 11.2% | |
Industrials | | | 6.1% | |
Energy | | | 5.4% | |
Materials | | | 4.5% | |
Financials | | | 4.5% | |
Real Estate Investment Trusts | | | 2.5% | |
Cash1 | | | 1.2% | |
Short-Term Securities Held as Collateral for Securities Lending | | | 1.0% | |
Telecommunication Services | | | 0.5% | |
Utilities | | | 0.2% | |
Total | | | 100.0% | |
| 1 | Investments in an affiliated money market fund. |
Portfolio holdings and allocations are subject to change. As of December 31, 2012, percentages in the table above are based on total investments. Such total investments may differ from the percentages set forth below in the Portfolio of Investments which are computed using the Fund’s total net assets.
The Portfolio of Investments Summary Table and the Portfolio of Investments are broken down by sectors, and these sectors do not represent industry categories for purposes of identifying “industry concentration” as described in the Investment Company Act of 1940, as amended.
Portfolio of Investments
| | | | | | | | | | |
| Shares | | | | | Value | | | |
| | | | | | | | | | |
| Common Stocks — 96.7% | | | | | | |
| Consumer Discretionary — 12.8% | | | | | | |
| | 39,170 | | | Comcast Corp., Class A | | $ | 1,464,175 | | | |
| | 69,410 | | | D.R. Horton, Inc. | | | 1,372,930 | | | |
| | 30,720 | | | Home Depot, Inc./The | | | 1,900,032 | | | |
| | 26,540 | | | Jarden Corp. * | | | 1,372,118 | | | |
| | 25,370 | | | Lululemon Athletica, Inc. * | | | 1,933,955 | | | |
| | 75,870 | | | Pulte Group, Inc. * | | | 1,377,799 | | | |
| | 15,270 | | | Tractor Supply Co. | | | 1,349,257 | | | |
| | 28,240 | | | Under Armour, Inc., Class A (a) * | | | 1,370,487 | | | |
| | 11,860 | | | VF Corp. | | | 1,790,504 | | | |
| | 25,700 | | | Viacom, Inc., Class B | | | 1,355,418 | | | |
| | 38,990 | | | Walt Disney Co./The | | | 1,941,312 | | | |
| | | | | | | | 17,227,987 | | | |
| Consumer Staples — 11.0% | | | | | | |
| | 50,250 | | | Church & Dwight Co., Inc. | | | 2,691,892 | | | |
| | 27,520 | | | Costco Wholesale Corp. | | | 2,718,150 | | | |
| | 55,690 | | | CVS Caremark Corp. | | | 2,692,611 | | | |
| | 39,530 | | | Wal-Mart Stores, Inc. | | | 2,697,132 | | | |
| | 45,020 | | | Whole Foods Market, Inc. | | | 4,111,677 | | | |
| | | | | | | | 14,911,462 | | | |
| Energy — 5.3% | | | | | | |
| | 25,130 | | | EOG Resources, Inc. | | | 3,035,453 | | | |
| | 32,780 | | | Marathon Petroleum Corp. | | | 2,065,140 | | | |
| | 60,520 | | | Valero Energy Corp. | | | 2,064,942 | | | |
| | | | | | | | 7,165,535 | | | |
| | | | | | | | | | |
| Shares | | | | | Value | | | |
| | | | | | | | | | |
| Common Stocks — (Continued) | | | | | | |
| Financials — 4.5% | | | | | | |
| | 15,080 | | | Berkshire Hathaway, Inc., Class B * | | $ | 1,352,676 | | | |
| | 8,240 | | | Chubb Corp./The | | | 620,637 | | | |
| | 5,550 | | | Goldman Sachs Group, Inc./The | | | 707,958 | | | |
| | 30,880 | | | JPMorgan Chase & Co. | | | 1,357,794 | | | |
| | 19,700 | | | MetLife, Inc. | | | 648,918 | | | |
| | 12,750 | | | Prudential Financial, Inc. | | | 679,958 | | | |
| | 19,690 | | | Wells Fargo & Co. | | | 673,004 | | | |
| | | | | | | | 6,040,945 | | | |
| Health Care — 15.9% | | | | | | |
| | 48,130 | | | Abbott Laboratories | | | 3,152,515 | | | |
| | 58,670 | | | Baxter International, Inc. | | | 3,910,942 | | | |
| | 51,480 | | | Gilead Sciences, Inc. * | | | 3,781,206 | | | |
| | 18,390 | | | Johnson & Johnson | | | 1,289,139 | | | |
| | 21,650 | | | Novo-Nordisk A/S ADR | | | 3,533,496 | | | |
| | 103,300 | | | Pfizer, Inc. | | | 2,590,764 | | | |
| | 36,780 | | | Stryker Corp. | | | 2,016,280 | | | |
| | 14,610 | | | Watson Pharmaceutical, Inc. * | | | 1,256,460 | | | |
| | | | | | | | 21,530,802 | | | |
| Industrials — 6.0% | | | | | | |
| | 7,360 | | | Caterpillar, Inc. | | | 659,309 | | | |
| | 12,620 | | | Cummins, Inc. | | | 1,367,377 | | | |
| | 29,740 | | | Deere & Co. | | | 2,570,131 | | | |
| | 25,270 | | | Illinois Tool Works, Inc. | | | 1,536,669 | | | |
(See notes which are an integral part of the Financial Statements)
Annual Shareholder Report
61
| | |
| Huntington Growth Fund | | (Continued) |
| | | | | | | | | | |
| Shares | | | | | Value | | | |
| | | | | | | | | | |
| Common Stocks — (Continued) | | | | | | |
| Industrials — (Continued) | | | | | | |
| | 9,850 | | | W.W. Grainger, Inc. | | $ | 1,993,344 | | | |
| | | | | | | | 8,126,830 | | | |
| Information Technology — 33.5% | | | | | | |
| | 37,940 | | | Accenture PLC, Class A | | | 2,523,010 | | | |
| | 13,080 | | | Apple, Inc. | | | 6,972,032 | | | |
| | 81,600 | | | Broadcom Corp., Class A | | | 2,709,936 | | | |
| | 207,310 | | | Cisco Systems, Inc. | | | 4,073,641 | | | |
| | 19,860 | | | CommVault Systems, Inc. * | | | 1,384,441 | | | |
| | 87,530 | | | eBay, Inc. * | | | 4,465,781 | | | |
| | 57,580 | | | EMC Corp. * | | | 1,456,774 | | | |
| | 5,580 | | | Google, Inc., Class A * | | | 3,958,285 | | | |
| | 16,070 | | | NeuStar, Inc., Class A * | | | 673,815 | | | |
| | 111,380 | | | Oracle Corp. | | | 3,711,182 | | | |
| | 55,680 | | | QUALCOMM, Inc. | | | 3,453,274 | | | |
| | 42,660 | | | Rackspace Hosting, Inc. * | | | 3,168,358 | | | |
| | 158,730 | | | Taiwan Semiconductor Manufacturing Co. Ltd. ADR | | | 2,723,807 | | | |
| | 22,790 | | | Trimble Navigation Ltd. * | | | 1,362,386 | | | |
| | 17,470 | | | Visa, Inc., Class A | | | 2,648,103 | | | |
| | | | | | | | 45,284,825 | | | |
| Materials — 4.5% | | | | | | |
| | 30,150 | | | Ball Corp. | | | 1,349,212 | | | |
| | 11,680 | | | Eagle Materials, Inc. | | | 683,280 | | | |
| | 7,140 | | | Monsanto Co. | | | 675,801 | | | |
| | 13,010 | | | Nucor Corp. | | | 561,772 | | | |
| | 12,550 | | | Praxair, Inc. | | | 1,373,597 | | | |
| | 9,280 | | | Sherwin-Williams Co./The | | | 1,427,450 | | | |
| | | | | | | | 6,071,112 | | | |
| Real Estate Investment Trusts — 2.4% | | | | | | |
| | 8,340 | | | American Tower Corp. | | | 644,432 | | | |
| | 14,140 | | | HCP, Inc. | | | 638,845 | | | |
| | 10,640 | | | Health Care REIT, Inc. | | | 652,126 | | | |
| | 8,560 | | | Simon Property Group, Inc. | | | 1,353,250 | | | |
| | | | | | | | 3,288,653 | | | |
| Telecommunication Services — 0.6% | | | | | | |
| | 19,160 | | | BT Group PLC ADR | | | 728,655 | | | |
| Utilities — 0.2% | | | | | | |
| | 3,810 | | | Sempra Energy | | | 270,281 | | | |
| Total Common Stocks (Cost $112,123,439) | | | 130,647,087 | | | |
| Cash Equivalents — 1.2% | | | | | | |
| | 1,621,894 | | | Huntington U.S. Treasury Money Market Fund, Trust Shares, 0.050% (b) (c) | | | 1,621,894 | | | |
| Total Cash Equivalents (Cost $1,621,894) | | | 1,621,894 | | | |
| | | | | | | | | | |
| Shares | | | | | Value | | | |
| Short-Term Securities Held as Collateral for
Securities Lending — 1.0% | | | | | | |
| | 1,390,967 | | | Fidelity Institutional Money Market Portfolio, Institutional Class, 0.180% (c) | | $ | 1,390,967 | | | |
| Total Short-Term Securities Held as Collateral for
Securities Lending (Cost $1,390,967) | | | 1,390,967 | | | |
| Total Investments
(Cost $115,136,300) — 98.9% | | | 133,659,948 | | | |
| Other Assets in Excess of Liabilities — 1.1% | | | 1,515,554 | | | |
| Net Assets — 100.0% | | $ | 135,175,502 | | | |
| (a) | All or a portion of the security was on loan as of December 31, 2012. The total value of securities on loan as of December 31, 2012 was $1,363,693. |
| (b) | Investment in affiliate. |
| (c) | Rate disclosed is the seven day yield as of December 31, 2012. |
| * | Non-income producing security. |
| ADR | — American Depositary Receipt |
(See notes which are an integral part of the Financial Statements)
Annual Shareholder Report
62
| | |
| | |
| Huntington Income Equity Fund | | December 31, 2012 |
| | |
| Portfolio of Investments Summary Table | | (unaudited) |
| | | | |
| Asset Allocation | | Percentage of
Market Value | |
Energy | | | 15.7% | |
Financials | | | 14.4% | |
Short-Term Securities Held as Collateral for Securities Lending | | | 9.9% | |
Industrials | | | 9.2% | |
Consumer Staples | | | 9.1% | |
Information Technology | | | 8.6% | |
Health Care | | | 8.2% | |
Consumer Discretionary | | | 6.1% | |
Real Estate Investment Trusts | | | 6.0% | |
Utilities | | | 5.0% | |
Materials | | | 3.5% | |
Telecommunication Services | | | 3.4% | |
Cash1 | | | 0.9% | |
Total | | | 100.0% | |
| 1 | Investments in an affiliated money market fund. |
Portfolio holdings and allocations are subject to change. As of December 31, 2012, percentages in the table above are based on total investments. Such total investments may differ from the percentages set forth below in the Portfolio of Investments which are computed using the Fund’s total net assets.
The Portfolio of Investments Summary Table and the Portfolio of Investments are broken down by sectors, and these sectors do not represent industry categories for purposes of identifying “industry concentration” as described in the Investment Company Act of 1940, as amended.
Portfolio of Investments
| | | | | | | | | | |
| Shares | | | | | Value | | | |
| | | | | | | | | | |
| Common Stocks — 98.8% | | | | | | |
| Consumer Discretionary — 6.7% | | | | | | |
| | 50,000 | | | Comcast Corp., Class A | | $ | 1,869,000 | | | |
| | 100,000 | | | Gannett Co., Inc. | | | 1,801,000 | | | |
| | 81,500 | | | Shaw Communications, Inc., Class B (a) | | | 1,872,870 | | | |
| | 71,000 | | | Thomson Reuters Corp. (a) | | | 2,063,260 | | | |
| | 17,300 | | | Time Warner Cable, Inc., Class A | | | 1,681,387 | | | |
| | | | | | | | 9,287,517 | | | |
| Consumer Staples — 10.1% | | | | | | |
| | 60,000 | | | Altria Group, Inc. | | | 1,885,200 | | | |
| | 58,000 | | | Campbell Soup Co. (a) | | | 2,023,620 | | | |
| | 68,000 | | | ConAgra Foods, Inc. | | | 2,006,000 | | | |
| | 49,200 | | | General Mills, Inc. | | | 1,988,172 | | | |
| | 23,100 | | | Kimberly-Clark Corp. | | | 1,950,333 | | | |
| | 65,000 | | | Sysco Corp. | | | 2,057,900 | | | |
| | 55,000 | | | Walgreen Co. | | | 2,035,550 | | | |
| | | | | | | | 13,946,775 | | | |
| Energy — 17.4% | | | | | | |
| | 39,300 | | | BP PLC ADR | | | 1,636,452 | | | |
| | 19,500 | | | Chevron Corp. | | | 2,108,730 | | | |
| | 18,900 | | | China Petroleum & Chemical Corp. ADR | | | 2,171,988 | | | |
| | 36,200 | | | ConocoPhillips | | | 2,099,238 | | | |
| | 37,000 | | | Eni SpA ADR (a) | | | 1,818,180 | | | |
| | 42,200 | | | Enterprise Products Partners LP | | | 2,113,376 | | | |
| | | | | | | | | | |
| Shares | | | | | Value | | | |
| | | | | | | | | | |
| Common Stocks — (Continued) | | | | | | |
| Energy — (Continued) | | | | | | |
| | 24,300 | | | Exxon Mobil Corp. | | $ | 2,103,165 | | | |
| | 69,000 | | | Marathon Oil Corp. | | | 2,115,540 | | | |
| | 33,900 | | | Marathon Petroleum Corp.ea | | | 2,135,700 | | | |
| | 27,200 | | | Royal Dutch Shell PLC ADR | | | 1,875,440 | | | |
| | 32,900 | | | Total SA ADR (a) | | | 1,711,129 | | | |
| | 61,500 | | | Valero Energy Corp. | | | 2,098,380 | | | |
| | | | | | | | 23,987,318 | | | |
| Financials — 15.9% | | | | | | |
| | 35,000 | | | Bank of Montreal | | | 2,145,500 | | | |
| | 32,200 | | | Bank of Nova Scotia (a) | | | 1,863,736 | | | |
| | 59,000 | | | BB&T Corp. | | | 1,717,490 | | | |
| | 25,400 | | | Canadian Imperial Bank of Commerce (a) | | | 2,047,494 | | | |
| | 38,200 | | | HSBC Holdings PLC ADR | | | 2,027,274 | | | |
| | 44,400 | | | JPMorgan Chase & Co. | | | 1,952,268 | | | |
| | 30,700 | | | Royal Bank of Canada | | | 1,851,210 | | | |
| | 124,000 | | | SLM Corp. | | | 2,124,120 | | | |
| | 28,900 | | | Travelers Cos., Inc./The | | | 2,075,598 | | | |
| | 64,000 | | | U.S. Bancorp | | | 2,044,160 | | | |
| | 61,000 | | | Wells Fargo & Co. | | | 2,084,980 | | | |
| | | | | | | | 21,933,830 | | | |
| Health Care — 9.1% | | | | | | |
| | 33,000 | | | Abbott Laboratories | | | 2,161,500 | | | |
| | 45,700 | | | AstraZeneca PLC ADR | | | 2,160,239 | | | |
(See notes which are an integral part of the Financial Statements)
Annual Shareholder Report
63
| | |
| Huntington Income Equity Fund | | (Continued) |
| | | | | | | | | | |
| Shares | | | | | Value | | | |
| | | | | | | | | | |
| Common Stocks — (Continued) | | | | | | |
| Health Care — (Continued) | | | | | | |
| | 40,700 | | | Eli Lilly & Co. | | $ | 2,007,324 | | | |
| | 47,200 | | | Merck & Co., Inc. | | | 1,932,368 | | | |
| | 81,000 | | | Pfizer, Inc. | | | 2,031,480 | | | |
| | 45,800 | | | Sanofi-Aventis ADR | | | 2,170,004 | | | |
| | | | | | | | 12,462,915 | | | |
| Industrials — 10.2% | | | | | | |
| | 22,500 | | | 3M Co. | | | 2,089,125 | | | |
| | 90,500 | | | CSX Corp. | | | 1,785,565 | | | |
| | 23,800 | | | Deere & Co. | | | 2,056,796 | | | |
| | 38,400 | | | Eaton Corp. PLC | | | 2,081,280 | | | |
| | 93,500 | | | General Electric Co. | | | 1,962,565 | | | |
| | 75,500 | | | Koninklijke (Royal) Philips Electronics NV | | | 2,003,770 | | | |
| | 60,500 | | | Waste Management, Inc. | | | 2,041,270 | | | |
| | | | | | | | 14,020,371 | | | |
| Information Technology — 9.5% | | | | | | |
| | 87,000 | | | CA, Inc. | | | 1,912,260 | | | |
| | 106,000 | | | Cisco Systems, Inc. | | | 2,082,900 | | | |
| | 41,700 | | | Harris Corp. | | | 2,041,632 | | | |
| | 120,000 | | | Hewlett-Packard Co. | | | 1,710,000 | | | |
| | 89,500 | | | Intel Corp. | | | 1,846,385 | | | |
| | 65,000 | | | Microsoft Corp. | | | 1,737,450 | | | |
| | 56,000 | | | Paychex, Inc. | | | 1,743,840 | | | |
| | | | | | | | 13,074,467 | | | |
| Materials — 3.9% | | | | | | |
| | 39,300 | | | Du Pont (E.I.) de Nemours & Co. | | | 1,767,321 | | | |
| | 44,700 | | | International Paper Co. | | | 1,780,848 | | | |
| | 31,600 | | | Lyondellbasell Industries N.V. | | | 1,804,044 | | | |
| | | | | | | | 5,352,213 | | | |
| Real Estate Investment Trusts — 6.6% | | | | | | |
| | 43,700 | | | HCP, Inc. | | | 1,974,366 | | | |
| | 28,200 | | | Health Care REIT, Inc. | | | 1,728,378 | | | |
| | 82,000 | | | Hospitality Properties Trust | | | 1,920,440 | | | |
| | 86,000 | | | Kimco Realty Corp. | | | 1,661,520 | | | |
| | 70,700 | | | Mack-Cali Realty Corp. | | | 1,845,977 | | | |
| | | | | | | | 9,130,681 | | | |
| Telecommunication Services — 3.8% | | | | | | |
| | 52,000 | | | AT&T, Inc. | | | 1,752,920 | | | |
| | 40,600 | | | Verizon Communications, Inc. | | | 1,756,762 | | | |
| | 199,000 | | | Windstream Corp. (a) | | | 1,647,720 | | | |
| | | | | | | | 5,157,402 | | | |
| Utilities — 5.6% | | | | | | |
| | 64,500 | | | Exelon Corp. | | | 1,918,230 | | | |
| | 47,400 | | | FirstEnergy Corp. | | | 1,979,424 | | | |
| | 47,500 | | | PG&E Corp. | | | 1,908,550 | | | |
| | 66,500 | | | PPL Corp. | | | 1,903,895 | | | |
| | | | | | | | 7,710,099 | | | |
| Total Common Stocks (Cost $123,301,159) | | | 136,063,588 | | | |
| | | | | | | | | | |
| Shares | | | | | Value | | | |
| Cash Equivalents — 1.0% | | | | | | |
| | 1,391,488 | | | Huntington U.S. Treasury Money Market Fund, Trust Shares, 0.050% (b) (c) | | $ | 1,391,488 | | | |
| Total Cash Equivalents (Cost $1,391,488) | | | 1,391,488 | | | |
| Short-Term Securities Held as Collateral for
Securities Lending — 10.9% | | | | | | |
| | 15,044,485 | | | Fidelity Institutional Money Market Portfolio, Institutional Class, 0.180% (c) | | | 15,044,485 | | | |
| Total Short-Term Securities Held as Collateral for
Securities Lending (Cost $15,044,485) | | | 15,044,485 | | | |
| Total Investments
(Cost $139,737,132) — 110.7% | | | 152,499,561 | | | |
| Liabilities in Excess of Other Assets — (10.7)% | | | (14,775,245) | | | |
| Net Assets — 100.0% | | $ | 137,724,316 | | | |
| (a) | All or a portion of the security was on loan as of December 31, 2012. The total value of securities on loan as of December 31, 2012 was $14,749,495. |
| (b) | Investment in affiliate. |
| (c) | Rate disclosed is the seven day yield as of December 31, 2012. |
| ADR | — American Depositary Receipt |
(See notes which are an integral part of the Financial Statements)
Annual Shareholder Report
64
| | |
| | |
| Huntington International Equity Fund | | December 31, 2012 |
| | |
| Portfolio of Investments Summary Table | | (unaudited) |
| | | | |
| Asset Allocation | | Percentage of
Market Value | |
United Kingdom | | | 22.1% | |
Japan | | | 15.6% | |
France | | | 12.1% | |
Germany | | | 7.5% | |
Singapore | | | 5.9% | |
Switzerland | | | 5.6% | |
Sweden | | | 5.4% | |
Cash1 | | | 3.6% | |
Exchange-Traded Funds | | | 3.5% | |
Mexico | | | 3.2% | |
Australia | | | 3.2% | |
Italy | | | 3.1% | |
Hong Kong | | | 2.0% | |
Spain | | | 1.6% | |
Israel | | | 1.4% | |
Canada | | | 1.3% | |
United States | | | 1.2% | |
Taiwan | | | 1.2% | |
Short-Term Securities Held as Collateral for Securities Lending | | | 0.5% | |
Total | | | 100.0% | |
| 1 | Investments in an affiliated money market fund. |
Portfolio holdings and allocations are subject to change. As of December 31, 2012, percentages in the table above are based on total investments. Such total investments may differ from the percentages set forth below in the Portfolio of Investments which are computed using the Fund’s total net assets.
The Portfolio of Investments are broken down by sectors, and these sectors do not represent industry categories for purposes of identifying “industry concentration” as described in the Investment Company Act of 1940, as amended.
Portfolio of Investments
| | | | | | | | | | |
| Shares | | | | | Value + | | | |
| | | | | | | | | | |
| Common Stocks — 92.8% | | | | | | |
| Australia — 3.3% | | | | | | |
| Industrials — 1.4% | | | | | | |
| | 153,000 | | | Orica Ltd. | | $ | 4,029,963 | | | |
| Materials — 1.9% | | | | | | |
| | 142,000 | | | BHP Billiton Ltd. | | | 5,550,796 | | | |
| | | | | | | | 9,580,759 | | | |
| Canada — 1.3% | | | | | | |
| Energy — 1.3% | | | | | | |
| | 116,000 | | | Cenovus Energy, Inc. | | | 3,890,640 | | | |
| France — 12.1% | | | | | | |
| Consumer Discretionary — 1.9% | | | | | | |
| | 59,000 | | | Cie Generale des Etablissements Michelin SCA | | | 5,651,483 | | | |
| Energy — 2.0% | | | | | | |
| | 115,541 | | | Total SA | | | 6,009,984 | | | |
| | | | | | | | | | |
| Shares | | | | | Value + | | | |
| | | | | | | | | | |
| Common Stocks — (Continued) | | | | | | |
| France — (Continued) | | | | | | |
| Financials — 4.6% | | | | | | |
| | 371,900 | | | AXA SA ADR | | $ | 6,776,018 | | | |
| | 117,011 | | | BNP Paribas | | | 6,659,280 | | | |
| | | | | | | | 13,435,298 | | | |
| Health Care — 2.1% | | | | | | |
| | 66,100 | | | Sanofi-Aventis | | | 6,266,222 | | | |
| Utilities — 1.5% | | | | | | |
| | 163,000 | | | GDF Suez | | | 3,356,071 | | | |
| | 46,172 | | | GDF Suez SA ADR | | | 971,459 | | | |
| | | | | | | | 4,327,530 | | | |
| | | | | | | | 35,690,517 | | | |
| Germany — 7.5% | | | | | | |
| Consumer Staples — 2.3% | | | | | | |
| | 82,500 | | | Henkel AG & Co. KGaA | | | 6,785,160 | | | |
(See notes which are an integral part of the Financial Statements)
Annual Shareholder Report
65
| | |
| Huntington International Equity Fund | | (Continued) |
| | | | | | | | | | |
| Shares | | | | | Value + | | | |
| | | | | | | | | | |
| Common Stocks — (Continued) | | | | | | |
| Germany — (Continued) | | | | | | |
| Energy — 1.4% | | | | | | |
| | 45,000 | | | BASF SE | | $ | 4,253,816 | | | |
| Industrials — 3.8% | | | | | | |
| | 179,000 | | | GEA Group AG | | | 5,818,426 | | | |
| | 48,700 | | | Siemens AG | | | 5,323,646 | | | |
| | | | | | | | 11,142,072 | | | |
| | | | | | | | 22,181,048 | | | |
| Hong Kong — 2.0% | | | | | | |
| Financials — 2.0% | | | | | | |
| | 754,000 | | | Wharf (Holdings) Ltd./The | | | 6,009,613 | | | |
| Israel — 1.4% | | | | | | |
| Health Care — 1.4% | | | | | | |
| | 111,000 | | | Teva Pharmaceutical Industries Ltd. ADR | | | 4,144,740 | | | |
| Italy — 3.1% | | | | | | |
| Energy — 3.1% | | | | | | |
| | 210,000 | | | Eni SpA | | | 5,142,810 | | | |
| | 102,000 | | | Saipem SpA | | | 3,971,917 | | | |
| | | | | | | | 9,114,727 | | | |
| Japan — 15.7% | | | | | | |
| Consumer Discretionary — 3.6% | | | | | | |
| | 174,000 | | | Honda Motor Co. Ltd. | | | 6,435,855 | | | |
| | 45,000 | | | Toyota Motor Corp. ADR | | | 4,196,250 | | | |
| | | | | | | | 10,632,105 | | | |
| Consumer Staples — 1.2% | | | | | | |
| | 66,644 | | | Unicharm Corp. | | | 3,458,736 | | | |
| Industrials — 5.1% | | | | | | |
| | 23,900 | | | FANUC Ltd. | | | 4,440,947 | | | |
| | 400,000 | | | KUBOTA Corp. | | | 4,593,127 | | | |
| | 128,000 | | | Makita Corp. | | | 5,938,618 | | | |
| | | | | | | | 14,972,692 | | | |
| Information Technology — 4.6% | | | | | | |
| | 203,000 | | | Hoya Corp. | | | 3,994,827 | | | |
| | 22,880 | | | KEYENCE Corp. | | | 6,337,142 | | | |
| | 57,000 | | | Murata Manufacturing Co. Ltd. | | | 3,358,246 | | | |
| | | | | | | | 13,690,215 | | | |
| Materials — 1.2% | | | | | | |
| | 260,000 | | | Kuraray Co. Ltd. | | | 3,404,060 | | | |
| | | | | | | | 46,157,808 | | | |
| Mexico — 3.2% | | | | | | |
| Consumer Staples — 2.1% | | | | | | |
| | 61,000 | | | Fomento Economico Mexicano SAB de CV ADR | | | 6,142,700 | | | |
| | | | | | | | | | |
| Shares | | | | | Value + | | | |
| | | | | | | | | | |
| Common Stocks — (Continued) | | | | | | |
| Mexico — (Continued) | | | | | | |
| Telecommunication Services — 1.1% | | | | | | |
| | 145,000 | | | America Movil SA de CV, Series L ADR (a) | | $ | 3,355,300 | | | |
| | | | | | | | 9,498,000 | | | |
| Singapore — 5.9% | | | | | | |
| Financials — 2.3% | | | | | | |
| | 542,000 | | | DBS Group Holdings Ltd. | | | 6,654,745 | | | |
| Industrials — 1.9% | | | | | | |
| | 617,877 | | | Keppel Corp Ltd. | | | 5,642,922 | | | |
| Telecommunication Services — 1.7% | | | | | | |
| | 1,883,930 | | | Singapore Telecommunications Ltd. | | | 5,126,901 | | | |
| | | | | | | | 17,424,568 | | | |
| Spain — 1.6% | | | | | | |
| Financials — 1.6% | | | | | | |
| | 500,000 | | | Banco Bilbao Vizcaya SA | | | 4,643,910 | | | |
| Sweden — 5.5% | | | | | | |
| Consumer Discretionary — 2.0% | | | | | | |
| | 172,200 | | | Hennes & Mauritz AB | | | 5,969,669 | | | |
| Industrials — 1.7% | | | | | | |
| | 349,000 | | | Volvo AB | | | 4,813,797 | | | |
| Materials — 1.8% | | | | | | |
| | 242,000 | | | Svenska Cellulosa AB (SCA) | | | 5,263,233 | | | |
| | | | | | | | 16,046,699 | | | |
| Switzerland — 5.6% | | | | | | |
| Financials — 1.6% | | | | | | |
| | 60,300 | | | ACE Ltd. | | | 4,811,940 | | | |
| Health Care — 2.0% | | | | | | |
| | 93,400 | | | Novartis AG | | | 5,896,195 | | | |
| Materials — 2.0% | | | | | | |
| | 71,100 | | | Syngenta AG ADR | | | 5,744,880 | | | |
| | | | | | | | 16,453,015 | | | |
| Taiwan — 1.2% | | | | | | |
| Information Technology — 1.2% | | | | | | |
| | 209,854 | | | Taiwan Semiconductor Manufacturing Co. Ltd. ADR | | | 3,601,095 | | | |
| United Kingdom — 22.2% | | | | | | |
| Consumer Discretionary — 3.0% | | | | | | |
| | 400,000 | | | Greene King PLC | | | 4,100,019 | | | |
| | 249,000 | | | Pearson PLC | | | 4,855,313 | | | |
| | | | | | | | 8,955,332 | | | |
| Consumer Staples — 3.8% | | | | | | |
| | 1,063,284 | | | Tesco PLC | | | 5,859,496 | | | |
| | 134,000 | | | Unilever PLC | | | 5,210,760 | | | |
| | | | | | | | 11,070,256 | | | |
(See notes which are an integral part of the Financial Statements)
Annual Shareholder Report
66
| | |
| Huntington International Equity Fund | | (Continued) |
| | | | | | | | | | |
| Shares | | | | | Value + | | | |
| Common Stocks — (Continued) | | | | | | |
| United Kingdom — (Continued) | | | | | | |
| Financials — 5.9% | | | | | | |
| | 1,858,000 | | | Barclays PLC | | $ | 8,074,303 | | | |
| | 81,000 | | | HSBC Holdings PLC ADR | | | 4,298,670 | | | |
| | 196,000 | | | Standard Chartered PLC | | | 5,074,433 | | | |
| | | | | | | | 17,447,406 | | | |
| Health Care — 2.6% | | | | | | |
| | 53,000 | | | AstraZeneca PLC ADR | | | 2,505,310 | | | |
| | 118,850 | | | GlaxoSmithKline PLC ADR | | | 5,166,410 | | | |
| | | | | | | | 7,671,720 | | | |
| Industrials — 2.1% | | | | | | |
| | 419,000 | | | Rolls-Royce Holdings PLC * | | | 6,012,253 | | | |
| Telecommunication Services — 3.0% | | | | | | |
| | 1,059,000 | | | BT Group PLC | | | 4,041,895 | | | |
| | 1,840,000 | | | Vodafone Group PLC | | | 4,633,598 | | | |
| | | | | | | | 8,675,493 | | | |
| Utilities — 1.8% | | | | | | |
| | 231,100 | | | SSE PLC | | | 5,378,460 | | | |
| | | | | | | | 65,210,920 | | | |
| United States — 1.2% | | | | | | |
| Energy — 1.2% | | | | | | |
| | 51,352 | | | Schlumberger Ltd. | | | 3,558,180 | | | |
| Total Common Stocks (Cost $230,300,710) | | | 273,206,239 | | | |
| Exchange-Traded Funds — 3.5% | | | | | | |
| | 212,000 | | | iShares MSCI Malaysia Index Fund | | | 3,207,560 | | | |
| | 66,900 | | | iShares MSCI South Korea Index Fund | | | 4,238,784 | | | |
| | 217,691 | | | iShares MSCI Taiwan Index Fund | | | 2,964,951 | | | |
| Total Exchange-Traded Funds (Cost $7,673,000) | | | 10,411,295 | | | |
| | | | | | | | | | |
| Shares | | | | | Value + | | | |
| Cash Equivalents — 3.7% | | | | | | |
| | 10,717,674 | | | Huntington U.S. Treasury Money Market Fund, Trust Shares, 0.050% (b) (c) | | $ | 10,717,674 | | | |
| Total Cash Equivalents (Cost $10,717,674) | | | 10,717,674 | | | |
| Short-Term Securities Held as Collateral for
Securities Lending — 0.5% | | | | | | |
| | 1,478,160 | | | Fidelity Institutional Money Market Portfolio, Institutional Class, 0.180% (c) | | | 1,478,160 | | | |
| Total Short-Term Securities Held as Collateral for
Securities Lending (Cost $1,478,160) | | | 1,478,160 | | | |
| Total Investments
(Cost $250,169,544) — 100.5% | | | 295,813,368 | | | |
| Liabilities in Excess of Other Assets — (0.5)% | | | (1,347,192) | | | |
| Net Assets — 100.0% | | $ | 294,466,176 | | | |
| (a) | All or a portion of the security was on loan as of December 31, 2012. The total value of securities on loan as of December 31, 2012 was $1,462,448. |
| (b) | Investment in affiliate. |
| (c) | Rate disclosed is the seven day yield as of December 31, 2012. |
| * | Non-income producing security. |
| + | All securities, except those traded on United States (including ADRs) and Canadian exchanges, Cash Equivalents or Short-Term Securities were fair valued at December 31, 2012. |
| ADR | — American Depositary Receipt |
(See notes which are an integral part of the Financial Statements)
Annual Shareholder Report
67
| | |
| | |
| Huntington Mid Corp America Fund | | December 31, 2012 |
| | |
| Portfolio of Investments Summary Table | | (unaudited) |
| | | | |
| Asset Allocation | | Percentage of
Market Value | |
Information Technology | | | 15.8% | |
Industrials | | | 15.2% | |
Health Care | | | 13.5% | |
Financials | | | 12.4% | |
Consumer Discretionary | | | 9.0% | |
Real Estate Investment Trusts | | | 6.6% | |
Materials | | | 6.4% | |
Energy | | | 6.1% | |
Short-Term Securities Held as Collateral for Securities Lending | | | 4.4% | |
Consumer Staples | | | 4.1% | |
Utilities | | | 3.6% | |
Cash1 | | | 2.5% | |
Telecommunication Services | | | 0.4% | |
Total | | | 100.0% | |
| 1 | Investments in an affiliated money market fund. |
Portfolio holdings and allocations are subject to change. As of December 31, 2012, percentages in the table above are based on total investments. Such total investments may differ from the percentages set forth below in the Portfolio of Investments which are computed using the Fund’s total net assets.
The Portfolio of Investments Summary Table and the Portfolio of Investments are broken down by sectors, and these sectors do not represent industry categories for purposes of identifying “industry concentration” as described in the Investment Company Act of 1940, as amended.
Portfolio of Investments
| | | | | | | | | | |
| Shares | | | | | Value | | | |
| | | | | | | | | | |
| Common Stocks — 97.4% | | | | | | |
| Consumer Discretionary — 9.5% | | | | | | |
| | 7,120 | | | Advance Auto Parts, Inc. | | $ | 515,132 | | | |
| | 10,930 | | | American Public Education, Inc. (a) * | | | 394,682 | | | |
| | 25,340 | | | Bob Evans Farms, Inc. | | | 1,018,668 | | | |
| | 36,500 | | | D.R. Horton, Inc. | | | 721,970 | | | |
| | 40,260 | | | Iconix Brand Group, Inc. * | | | 898,603 | | | |
| | 18,210 | | | ITT Educational Services, Inc. (a) * | | | 315,215 | | | |
| | 25,870 | | | Kohl’s Corp. | | | 1,111,893 | | | |
| | 43,640 | | | Nordstrom, Inc. | | | 2,334,740 | | | |
| | 24,650 | | | PetSmart, Inc. | | | 1,684,581 | | | |
| | 6,710 | | | Ralph Lauren Corp. | | | 1,005,963 | | | |
| | 31,050 | | | Ross Stores, Inc. | | | 1,681,358 | | | |
| | 18,000 | | | Vitamin Shoppe, Inc. * | | | 1,032,480 | | | |
| | | | | 12,715,285 | | | |
| Consumer Staples — 4.3% | | | | | | |
| | 27,380 | | | Church & Dwight Co., Inc. | | | 1,466,747 | | | |
| | 25,950 | | | Constellation Brands, Inc., Class A * | | | 918,371 | | | |
| | 45,900 | | | Dr. Pepper Snapple Group, Inc. (a) | | | 2,027,862 | | | |
| | 35,490 | | | Harris Teeter Supermarkets, Inc. | | | 1,368,494 | | | |
| | | | | 5,781,474 | | | |
| Energy — 6.4% | | | | | | |
| | 8,500 | | | Baker Hughes, Inc. | | | 347,140 | | | |
| | 32,320 | | | Helmerich & Payne, Inc. | | | 1,810,243 | | | |
| | 28,710 | | | Murphy Oil Corp. | | | 1,709,681 | | | |
| | 16,920 | | | Noble Energy, Inc. | | | 1,721,441 | | | |
| | | | | | | | | | |
| Shares | | | | | Value | | | |
| | | | | | | | | | |
| Common Stocks — (Continued) | | | | | | |
| Energy — (Continued) | | | | | | |
| | 33,810 | | | Oceaneering International, Inc. | | $ | 1,818,640 | | | |
| | 10,584 | | | Superior Energy Services, Inc. * | | | 219,300 | | | |
| | 11,250 | | | Unit Corp. * | | | 506,813 | | | |
| | 36,600 | | | Weatherford International Ltd. * | | | 409,554 | | | |
| | | | | 8,542,812 | | | |
| Financials — 13.0% | | | | | | |
| | 83,750 | | | Brown & Brown, Inc. | | | 2,132,275 | | | |
| | 27,390 | | | Community Bank System, Inc. | | | 749,390 | | | |
| | 27,170 | | | Cullen/Frost Bankers, Inc. | | | 1,474,516 | | | |
| | 50,670 | | | Discover Financial Services | | | 1,953,328 | | | |
| | 4,310 | | | Everest Re Group Ltd. | | | 473,885 | | | |
| | 147,440 | | | First Niagara Financial Group, Inc. | | | 1,169,199 | | | |
| | 21,800 | | | Invesco Ltd. | | | 568,762 | | | |
| | 9,800 | | | Jones Lang LaSalle, Inc. | | | 822,612 | | | |
| | 31,600 | | | Montpelier Re Holdings Ltd. | | | 722,376 | | | |
| | 45,400 | | | Principal Financial Group, Inc. | | | 1,294,808 | | | |
| | 33,810 | | | Prosperity Bancshares, Inc. | | | 1,420,020 | | | |
| | 11,120 | | | T. Rowe Price Group, Inc. | | | 724,246 | | | |
| | 45,885 | | | Torchmark Corp. | | | 2,370,878 | | | |
| | 75,243 | | | Unum Group | | | 1,566,559 | | | |
| | | | | 17,442,854 | | | |
| Health Care — 14.1% | | | | | | |
| | 56,750 | | | AmerisourceBergen Corp. | | | 2,450,465 | | | |
| | 39,930 | | | Cepheid, Inc. (a) * | | | 1,350,033 | | | |
(See notes which are an integral part of the Financial Statements)
Annual Shareholder Report
68
| | |
| Huntington Mid Corp America Fund | | (Continued) |
| | | | | | | | | | |
| Shares | | | | | Value | | | |
| | | | | | | | | | |
| Common Stocks — (Continued) | | | | | | |
| Health Care — (Continued) | | | | | | |
| | 14,230 | | | Computer Programs & Systems, Inc. | | $ | 716,338 | | | |
| | 62,020 | | | Life Technologies Corp. * | | | 3,043,942 | | | |
| | 120,170 | | | Mylan, Inc. * | | | 3,302,272 | | | |
| | 16,000 | | | Quest Diagnostics, Inc. | | | 932,320 | | | |
| | 54,330 | | | St. Jude Medical, Inc. | | | 1,963,486 | | | |
| | 28,496 | | | Thermo Fisher Scientific, Inc. | | | 1,817,475 | | | |
| | 38,830 | | | Watson Pharmaceutical, Inc. * | | | 3,339,380 | | | |
| | | | | 18,915,711 | | | |
| Industrials — 15.8% | | | | | | |
| | 10,200 | | | Alliant Techsystems, Inc. | | | 631,992 | | | |
| | 58,560 | | | Babcock & Wilcox Co./The | | | 1,534,272 | | | |
| | 22,400 | | | BorgWarner, Inc. * | | | 1,604,288 | | | |
| | 16,000 | | | Elbit Systems Ltd. | | | 640,800 | | | |
| | 3,320 | | | Flowserve Corp. | | | 487,376 | | | |
| | 64,270 | | | Jacobs Engineering Group, Inc. * | | | 2,735,974 | | | |
| | 53,400 | | | John Bean Technologies Corp. | | | 948,918 | | | |
| | 59,510 | | | Kennametal, Inc. | | | 2,380,400 | | | |
| | 23,400 | | | Parker Hannifin Corp. | | | 1,990,404 | | | |
| | 17,270 | | | Rockwell Automation, Inc. | | | 1,450,507 | | | |
| | 64,280 | | | Rollins, Inc. | | | 1,416,731 | | | |
| | 21,000 | | | Ryder System, Inc. | | | 1,048,530 | | | |
| | 11,490 | | | Stericycle, Inc. * | | | 1,071,672 | | | |
| | 54,740 | | | Timken Co. | | | 2,618,214 | | | |
| | 10,000 | | | UniFirst Corp. | | | 733,200 | | | |
| | | | | 21,293,278 | | | |
| Information Technology — 16.5% | | | | | | |
| | 11,000 | | | Amdocs Ltd. | | | 373,890 | | | |
| | 19,170 | | | BMC Software, Inc. * | | | 760,282 | | | |
| | 31,140 | | | Broadcom Corp., Class A | | | 1,034,159 | | | |
| | 40,580 | | | Citrix Systems, Inc. * | | | 2,668,135 | | | |
| | 53,400 | | | CTS Corp. | | | 567,642 | | | |
| | 32,866 | | | Fidelity National Information Services, Inc. | | | 1,144,065 | | | |
| | 14,100 | | | Fiserv, Inc. * | | | 1,114,323 | | | |
| | 10,250 | | | FleetCor Technologies, Inc. * | | | 549,913 | | | |
| | 71,510 | | | FLIR Systems, Inc. | | | 1,595,388 | | | |
| | 33,000 | | | Harris Corp. | | | 1,615,680 | | | |
| | 27,560 | | | j2 Global, Inc. (a) | | | 842,785 | | | |
| | 25,700 | | | Molex, Inc. | | | 702,381 | | | |
| | 30,800 | | | NCR Corp. * | | | 784,784 | | | |
| | 17,900 | | | NetApp, Inc. * | | | 600,545 | | | |
| | 49,600 | | | NVIDIA Corp. | | | 609,584 | | | |
| | 25,800 | | | Progress Software Corp. * | | | 541,542 | | | |
| | 26,800 | | | Seagate Technology PLC (a) | | | 816,864 | | | |
| | 53,600 | | | Synopsys, Inc. * | | | 1,706,624 | | | |
| | 20,600 | | | Syntel, Inc. | | | 1,103,954 | | | |
| | 50,280 | | | Teradata Corp. * | | | 3,111,829 | | | |
| | | | | 22,244,369 | | | |
| Materials — 6.7% | | | | | | |
| | 33,910 | | | Albemarle Corp. | | | 2,106,489 | | | |
| | 12,000 | | | Ball Corp. | | | 537,000 | | | |
| | 18,170 | | | Cia de Minas Buenaventura SA (a) | | | 653,212 | | | |
| | 54,000 | | | FMC Corp. | | | 3,160,080 | | | |
| | 12,280 | | | PPG Industries, Inc. | | | 1,662,098 | | | |
| | | | | | | | | | |
| Shares | | | | | Value | | | |
| | | | | | | | | | |
| Common Stocks — (Continued) | | | | | | |
| Materials — (Continued) | | | | | | |
| | 9,500 | | | Silver Wheaton Corp. | | $ | 342,760 | | | |
| | 20,000 | | | Sonoco Products Co. | | | 594,600 | | | |
| | | | | 9,056,239 | | | |
| Real Estate Investment Trusts — 6.9% | | | | | | |
| | 26,810 | | | EPR Properties (a) | | | 1,236,209 | | | |
| | 22,470 | | | Highwoods Properties, Inc. | | | 751,622 | | | |
| | 12,200 | | | Home Properties, Inc. | | | 747,982 | | | |
| | 12,210 | | | Liberty Property Trust | | | 436,752 | | | |
| | 21,510 | | | Mack-Cali Realty Corp. | | | 561,626 | | | |
| | 104,800 | | | Medical Properties Trust, Inc. | | | 1,253,408 | | | |
| | 13,360 | | | Mid-America Apartment Communities, Inc. | | | 865,060 | | | |
| | 16,690 | | | PS Business Parks, Inc. | | | 1,084,516 | | | |
| | 22,800 | | | Rayonier, Inc. | | | 1,181,724 | | | |
| | 18,260 | | | Sovran Self Storage, Inc. | | | 1,133,946 | | | |
| | | | | 9,252,845 | | | |
| Telecommunication Services — 0.4% | | | | | | |
| | 9,000 | | | TELUS Corp. | | | 586,260 | | | |
| Utilities — 3.8% | | | | | | |
| | 33,370 | | | Alliant Energy Corp. | | | 1,465,277 | | | |
| | 63,980 | | | CMS Energy Corp. | | | 1,559,832 | | | |
| | 6,980 | | | DTE Energy Co. | | | 419,149 | | | |
| | 33,700 | | | Portland General Electric Co. | | | 922,032 | | | |
| | 26,130 | | | Xcel Energy, Inc. | | | 697,932 | | | |
| | | | | 5,064,222 | | | |
| Total Common Stocks (Cost $86,769,852) | | | 130,895,349 | | | |
| Cash Equivalents — 2.6% | | | | | | |
| | 3,531,522 | | | Huntington U.S. Treasury Money Market Fund, Trust Shares, 0.050% (b) (c) | | | 3,531,522 | | | |
| Total Cash Equivalents (Cost $3,531,522) | | | 3,531,522 | | | |
| Short-Term Securities Held as Collateral for
Securities Lending — 4.6% | | | | | | |
| | 6,116,911 | | | Fidelity Institutional Money Market Portfolio, Institutional
Class, 0.180% (c) | | | 6,116,911 | | | |
| Total Short-Term Securities Held as Collateral for
Securities Lending (Cost $6,116,911) | | | 6,116,911 | | | |
| Total Investments
(Cost $96,418,285) — 104.6% | | | 140,543,782 | | | |
| Liabilities in Excess of Other Assets — (4.6)% | | | (6,167,822) | | | |
| Net Assets — 100.0% | | $ | 134,375,960 | | | |
| (a) | All or a portion of the security was on loan as of December 31, 2012. The total value of securities on loan as of December 31, 2012 was $6,074,742. |
| (b) | Investment in affiliate. |
| (c) | Rate disclosed is the seven day yield as of December 31, 2012. |
| * | Non-income producing security. |
(See notes which are an integral part of the Financial Statements)
Annual Shareholder Report
69
| | |
| | |
| Huntington Real Strategies Fund | | December 31, 2012 |
| | |
| Portfolio of Investments Summary Table | | (unaudited) |
| | | | |
| Asset Allocation | | Percentage of
Market Value | |
Energy | | | 23.9% | |
Materials | | | 17.9% | |
Short-Term Securities Held as Collateral for Securities Lending | | | 17.3% | |
Industrials | | | 12.4% | |
Real Estate Investment Trusts | | | 7.7% | |
Exchange-Traded Funds | | | 6.0% | |
Cash1 | | | 4.5% | |
Real Estate Investments | | | 3.9% | |
Consumer Staples | | | 3.6% | |
Closed-End Funds | | | 2.6% | |
Warrants | | | 0.2% | |
Options Purchased | | | 0.0% | |
Total | | | 100.0% | |
| 1 | Investments in an affiliated money market fund. |
Portfolio holdings and allocations are subject to change. As of December 31, 2012, percentages in the table above are based on total investments. Such total investments may differ from the percentages set forth below in the Portfolio of Investments which are computed using the Fund’s total net assets.
The Portfolio of Investments Summary Table and the Portfolio of Investments are broken down by sectors, and these sectors do not represent industry categories for purposes of identifying “industry concentration” as described in the Investment Company Act of 1940, as amended.
Portfolio of Investments
| | | | | | | | | | |
| Shares | | | | | Value | | | |
| | | | | | | | | | |
| Common Stocks — 79.1% | | | | | | |
| Consumer Staples — 4.3% | | | | | | |
| | 32,980 | | | Bunge Ltd. | | $ | 2,397,316 | | | |
| | 87,890 | | | Smithfield Foods, Inc. * | | | 1,895,787 | | | |
| | | | | | | | 4,293,103 | | | |
| Energy — 28.9% | | | | | | |
| | 193,500 | | | Adaro Energy Tbk PT ADR (a) | | | 1,606,050 | | | |
| | 61,900 | | | Cameco Corp. (a) | | | 1,220,668 | | | |
| | 60,500 | | | Canadian Natural Resources Ltd. | | | 1,746,635 | | | |
| | 91,000 | | | Canadian Oil Sands Ltd. (a) | | | 1,850,940 | | | |
| | 80,000 | | | Cheniere Energy, Inc. * | | | 1,502,400 | | | |
| | 101,110 | | | Chesapeake Energy Corp. (a) | | | 1,680,448 | | | |
| | 45,100 | | | Enterprise Products Partners LP | | | 2,258,608 | | | |
| | 36,636 | | | Kinder Morgan, Inc. | | | 1,294,350 | | | |
| | 51,800 | | | Linn Energy LLC | | | 1,825,432 | | | |
| | 29,100 | | | National Oilwell Varco, Inc. | | | 1,988,985 | | | |
| | 76,700 | | | Natural Resource Partners LP (a) | | | 1,422,018 | | | |
| | 41,100 | | | Sasol Ltd. ADR | | | 1,779,219 | | | |
| | 64,900 | | | Spectra Energy Corp. | | | 1,776,962 | | | |
| | 78,046 | | | Statoil ASA ADR (a) | | | 1,954,272 | | | |
| | 43,200 | | | Tenaris SA ADR (a) | | | 1,810,944 | | | |
| | 28,600 | | | Transocean Ltd. | | | 1,276,990 | | | |
| | 558,200 | | | Uranium Energy Corp. (a) * | | | 1,428,992 | | | |
| | | | | | | | 28,423,913 | | | |
| Industrials — 15.0% | | | | | | |
| | 45,100 | | | AGCO Corp. * | | | 2,215,312 | | | |
| | 22,200 | | | Caterpillar, Inc. | | | 1,988,676 | | | |
| | | | | | | | | | |
| Shares | | | | | Value | | | |
| | | | | | | | | | |
| Common Stocks — (Continued) | | | | | | |
| Industrials — (Continued) | | | | | | |
| | 58,000 | | | Chicago Bridge & Iron Co. NV | | $ | 2,688,300 | | | |
| | 34,050 | | | Deere & Co. | | | 2,942,601 | | | |
| | 28,200 | | | Lindsay Corp. | | | 2,259,384 | | | |
| | 19,400 | | | Valmont Industries, Inc. | | | 2,649,070 | | | |
| | | | | | | | 14,743,343 | | | |
| Materials — 21.6% | | | | | | |
| | 20,970 | | | Agrium, Inc. (a) | | | 2,095,113 | | | |
| | 59,700 | | | AngloGold Ashanti Ltd. ADR | | | 1,872,789 | | | |
| | 46,700 | | | Barrick Gold Corp. | | | 1,634,967 | | | |
| | 14,800 | | | BHP Billiton Ltd. ADR | | | 1,160,912 | | | |
| | 38,700 | | | Cliffs Natural Resources, Inc. (a) | | | 1,492,272 | | | |
| | 52,700 | | | Molycorp, Inc. (a) * | | | 497,488 | | | |
| | 33,360 | | | Potash Corporation of Saskatchewan, Inc. | | | 1,357,418 | | | |
| | 13,800 | | | Praxair, Inc. | | | 1,510,410 | | | |
| | 33,450 | | | Rio Tinto PLC ADR (a) | | | 1,943,110 | | | |
| | 107,000 | | | Stillwater Mining Co. * | | | 1,367,460 | | | |
| | 22,000 | | | Syngenta AG ADR | | | 1,777,600 | | | |
| | 8,200 | | | Terra Nitrogen Co. LP (a) | | | 1,755,538 | | | |
| | 57,200 | | | Vale SA ADR | | | 1,198,912 | | | |
| | 32,000 | | | Yara International ASA ADR | | | 1,591,680 | | | |
| | | | | | | | 21,255,669 | | | |
| Real Estate Investment Trusts — 9.3% | | | | | | |
| | 13,381 | | | AvalonBay Communities, Inc. | | | 1,814,330 | | | |
| | 131,200 | | | Duke Realty Corp. | | | 1,819,744 | | | |
(See notes which are an integral part of the Financial Statements)
Annual Shareholder Report
70
| | |
| Huntington Real Strategies Fund | | (Continued) |
| | | | | | | | | | |
Shares or
Contracts | | | | | Value | | | |
| | | | | | | | | | |
| Common Stocks — (Continued) | | | | | | |
| Real Estate Investment Trusts — (Continued) | | | | | | |
| | 59,820 | | | Rayonier, Inc. | | $ | 3,100,471 | | | |
| | 87,750 | | | Weyerhaeuser Co. | | | 2,441,205 | | | |
| | | | | | | | 9,175,750 | | | |
| Total Common Stocks (Cost $76,232,121) | | | 77,891,778 | | | |
| Exchange-Traded Funds — 7.3% | | | | | | |
| | 77,910 | | | iShares Silver Trust * | | | 2,286,658 | | | |
| | 84,200 | | | Market Vectors Junior Gold Miners Fund ETF | | | 1,667,160 | | | |
| | 36,300 | | | Market Vectors Oil Services ETF (a) | | | 1,404,084 | | | |
| | 63,500 | | | PowerShares DB Agriculture Fund * | | | 1,774,825 | | | |
| Total Exchange-Traded Funds (Cost $9,401,483) | | | 7,132,727 | | | |
| Real Estate Investments (b) (c) (d) — 4.7% | | | | | | |
| | | | Discount Retail Portfolio II DST (e) | | | 884,472 | | | |
| | | | Grocery & Pharmacy DST | | | 919,418 | | | |
| | | | New York Power DST (e) | | | 862,254 | | | |
| | | | Scotts Gahanna LLC (e) | | | 1,143,804 | | | |
| | | | | Winston-Salem DST | | | 859,037 | | | |
| Total Real Estate Investments (Cost $5,144,000) | | | 4,668,985 | | | |
| Closed-End Fund — 3.1% | | | | | | |
| | 145,891 | | | Central Fund of Canada Ltd., Class A (a) | | | 3,068,088 | | | |
| Total Closed-End Fund (Cost $2,159,636) | | | 3,068,088 | | | |
| Warrants — 0.2% | | | | | | |
| | 56,000 | | | Kinder Morgan, Inc., Expires 5/25/2017 | | | 211,680 | | | |
| Total Warrants (Cost $70,868) | | | 211,680 | | | |
| Options Purchased — 0.1% | | | | | | |
| | 100 | | | Market Vectors Gold Miners ETF, Call @ $42, Expiring January 2013 | | | 45,000 | | | |
| Total Options Purchased (Cost $54,300) | | | 45,000 | | | |
| | | | | | | | | | |
Shares | | | | | Value | | | |
| | | | | | | | | | |
| Cash Equivalents — 5.5% | | | | | | |
| | 5,395,632 | | | Huntington U.S. Treasury Money Market Fund, Trust Shares, 0.050% (e) (f) | | $ | 5,395,632 | | | |
| Total Cash Equivalents (Cost $5,395,632) | | | 5,395,632 | | | |
| Short-Term Securities Held as Collateral for
Securities Lending — 20.8% | | | | | | |
| | 20,507,976 | | | Fidelity Institutional Money Market Portfolio, Institutional Class, 0.180% (f) | | | 20,507,976 | | | |
| Total Short-Term Securities Held as Collateral for
Securities Lending (Cost $20,507,976) | | | 20,507,976 | | | |
| Total Investments
(Cost $118,966,016) — 120.8% | | | 118,921,866 | | | |
| Liabilities in Excess of Other Assets — (20.8)% | | | (20,457,020) | | | |
| Net Assets — 100.0% | | $ | 98,464,846 | | | |
| (a) | All or a portion of the security was on loan as of December 31, 2012. The total value of securities on loan as of December 31, 2012 was $20,583,002. |
| (c) | Security is currently being valued according to the fair value procedures approved by the Pricing Committee. |
| (d) | Investments do not offer shares. Fair value represents direct ownership of Real Estate. |
| (e) | Investment in affiliate. |
| (f) | Rate disclosed is the seven day yield as of December 31, 2012. |
| * | Non-income producing security. |
ADR — American Depositary Receipt
DST — Delaware Statutory Trust
ETF — Exchange-Traded Fund
(See notes which are an integral part of the Financial Statements)
Annual Shareholder Report
71
| | |
| | |
| Huntington Rotating Markets Fund | | December 31, 2012 |
| | |
| Portfolio of Investments Summary Table | | (unaudited) |
| | | | |
| Asset Allocation | | Percentage of
Market Value | |
Information Technology | | | 59.7% | |
Consumer Discretionary | | | 15.4% | |
Health Care | | | 11.3% | |
Short-Term Securities Held as Collateral for Securities Lending | | | 4.3% | |
Cash1 | | | 3.3% | |
Consumer Staples | | | 2.4% | |
Industrials | | | 1.8% | |
Telecommunication Services | | | 0.7% | |
Exchange-Traded Funds | | | 0.6% | |
Materials | | | 0.5% | |
Total | | | 100.0% | |
| 1 | Investments in an affiliated money market fund. |
Portfolio holdings and allocations are subject to change. As of December 31, 2012, percentages in the table above are based on total investments. Such total investments may differ from the percentages set forth below in the Portfolio of Investments which are computed using the Fund’s total net assets.
The Portfolio of Investments Summary Table and the Portfolio of Investments are broken down by sectors, and these sectors do not represent industry categories for purposes of identifying “industry concentration” as described in the Investment Company Act of 1940, as amended.
Portfolio of Investments
| | | | | | | | | | |
| Shares | | | | | Value | | | |
| | | | | | | | | | |
| Common Stocks — 95.9% | | | | | | |
| Consumer Discretionary — 16.1% | | | | | | |
| | 6,201 | | | Amazon.com, Inc. * | | $ | 1,557,319 | | | |
| | 1,736 | | | Apollo Group, Inc., Class A * | | | 36,317 | | | |
| | 3,274 | | | Bed Bath & Beyond, Inc. * | | | 183,049 | | | |
| | 27,874 | | | Comcast Corp., Class A | | | 1,041,930 | | | |
| | 9,304 | | | DIRECTV, Class A * | | | 466,689 | | | |
| | 3,168 | | | Dollar Tree, Inc. * | | | 128,494 | | | |
| | 1,645 | | | Expedia, Inc. | | | 101,085 | | | |
| | 841 | | | Fossil, Inc. * | | | 78,297 | | | |
| | 2,613 | | | Garmin Ltd. (a) | | | 106,663 | | | |
| | 7,579 | | | Liberty Interactive, Inc. * | | | 149,155 | | | |
| | 366 | | | Liberty Ventures Group, Series A * | | | 24,800 | | | |
| | 4,496 | | | Mattel, Inc. | | | 164,643 | | | |
| | 711 | | | Netflix, Inc. (a) * | | | 65,967 | | | |
| | 22,813 | | | News Corp., Class A | | | 582,644 | | | |
| | 1,705 | | | O’Reilly Automotive, Inc. * | | | 152,461 | | | |
| | 652 | | | Priceline.com, Inc. * | | | 405,022 | | | |
| | 3,064 | | | Ross Stores, Inc. | | | 165,916 | | | |
| | 571 | | | Sears Canada, Inc. (a) * | | | 5,793 | | | |
| | 1,386 | | | Sears Holdings Corp. (a) * | | | 57,325 | | | |
| | 49,127 | | | Sirius XM Radio, Inc. * | | | 141,977 | | | |
| | 9,360 | | | Staples, Inc. | | | 106,704 | | | |
| | 9,736 | | | Starbucks Corp. | | | 522,044 | | | |
| | 4,041 | | | Virgin Media, Inc. | | | 148,507 | | | |
| | 1,379 | | | Wynn Resorts Ltd. | | | 155,124 | | | |
| | | | | | | | 6,547,925 | | | |
| Consumer Staples — 2.5% | | | | | | |
| | 5,752 | | | Costco Wholesale Corp. | | | 568,125 | | | |
| | 2,478 | | | Green Mountain Coffee Roasters, Inc. (a) * | | | 102,490 | | | |
| | | | | | | | | | |
| Shares | | | | | Value | | | |
| | | | | | | | | | |
| Common Stocks — (Continued) | | | | | | |
| Consumer Staples — (Continued) | | | | | | |
| | 2,287 | | | Monster Beverage Corp. * | | $ | 120,937 | | | |
| | 2,426 | | | Whole Foods Market, Inc. | | | 221,567 | | | |
| | | | | | | | 1,013,119 | | | |
| Health Care — 11.8% | | | | | | |
| | 2,505 | | | Alexion Pharmaceuticals, Inc. * | | | 234,994 | | | |
| | 11,727 | | | Amgen, Inc. | | | 1,012,275 | | | |
| | 3,244 | | | Biogen Idec, Inc. * | | | 475,797 | | | |
| | 5,882 | | | Celgene Corp. * | | | 463,031 | | | |
| | 2,273 | | | Cerner Corp. * | | | 176,476 | | | |
| | 1,876 | | | DENTSPLY International, Inc. | | | 74,308 | | | |
| | 6,389 | | | Express Scripts Holding Co. * | | | 345,006 | | | |
| | 10,179 | | | Gilead Sciences, Inc. * | | | 747,647 | | | |
| | 1,211 | | | Henry Schein, Inc. * | | | 97,437 | | | |
| | 499 | | | Intuitive Surgical, Inc. * | | | 244,695 | | | |
| | 2,408 | | | Life Technologies Corp. * | | | 118,185 | | | |
| | 5,635 | | | Mylan, Inc. * | | | 154,850 | | | |
| | 1,263 | | | Perrigo Co. | | | 131,390 | | | |
| | 9,359 | | | Teva Pharmaceutical Industries Ltd. ADR | | | 349,465 | | | |
| | 2,795 | | | Vertex Pharmaceuticals, Inc. * | | | 117,222 | | | |
| | 3,447 | | | Warner Chilcott PLC, Class A | | | 41,502 | | | |
| | | | | | | | 4,784,280 | | | |
| Industrials — 1.9% | | | | | | |
| | 2,159 | | | CH Robinson Worldwide, Inc. | | | 136,492 | | | |
| | 2,817 | | | Expeditors International of Washington, Inc. | | | 111,412 | | | |
| | 3,969 | | | Fastenal Co. | | | 185,313 | | | |
(See notes which are an integral part of the Financial Statements)
Annual Shareholder Report
72
| | |
| Huntington Rotating Markets Fund | | (Continued) |
| | | | | | | | | | |
| Shares | | | | | Value | | | |
| | | | | | | | | | |
| Common Stocks — (Continued) | | | | | | |
| Industrials — (Continued) | | | | | | |
| | 4,734 | | | PACCAR, Inc. | | $ | 214,024 | | | |
| | 1,140 | | | Stericycle, Inc. * | | | 106,328 | | | |
| | | | | | | | 753,569 | | | |
| Information Technology — 62.3% | | | | | | |
| | 15,469 | | | Activision Blizzard, Inc. | | | 164,281 | | | |
| | 6,452 | | | Adobe Systems, Inc. * | | | 243,111 | | | |
| | 2,380 | | | Akamai Technologies, Inc. * | | | 97,366 | | | |
| | 4,246 | | | Altera Corp. | | | 146,232 | | | |
| | 12,377 | | | Apple, Inc. | | | 6,597,312 | | | |
| | 17,416 | | | Applied Materials, Inc. | | | 199,239 | | | |
| | 3,014 | | | Autodesk, Inc. * | | | 106,545 | | | |
| | 6,494 | | | Automatic Data Processing, Inc. | | | 370,223 | | | |
| | 3,257 | | | Avago Technologies Ltd. | | | 103,117 | | | |
| | 3,581 | | | Baidu, Inc. ADR * | | | 359,138 | | | |
| | 2,282 | | | BMC Software, Inc. * | | | 90,504 | | | |
| | 6,410 | | | Broadcom Corp., Class A | | | 212,876 | | | |
| | 6,537 | | | CA, Inc. | | | 143,683 | | | |
| | 2,786 | | | Check Point Software Technologies Ltd. * | | | 132,725 | | | |
| | 71,710 | | | Cisco Systems, Inc. | | | 1,409,101 | | | |
| | 2,485 | | | Citrix Systems, Inc. * | | | 163,389 | | | |
| | 4,075 | | | Cognizant Technology Solutions Corp., Class A * | | | 301,754 | | | |
| | 24,522 | | | Dell, Inc. | | | 248,408 | | | |
| | 17,126 | | | eBay, Inc. * | | | 873,768 | | | |
| | 1,069 | | | F5 Networks, Inc. * | | | 103,853 | | | |
| | 1,116 | | | First Solar, Inc. (a) * | | | 34,462 | | | |
| | 1,873 | | | Fiserv, Inc. * | | | 148,023 | | | |
| | 9,415 | | | Flextronics International Ltd. * | | | 58,467 | | | |
| | 3,456 | | | Google, Inc., Class A * | | | 2,451,583 | | | |
| | 67,767 | | | Intel Corp. (a) | | | 1,398,033 | | | |
| | 3,944 | | | Intuit, Inc. | | | 234,668 | | | |
| | 2,144 | | | KLA-Tencor Corp. | | | 102,397 | | | |
| | 1,568 | | | Lam Research Corp. * | | | 56,652 | | | |
| | 3,046 | | | Linear Technology Corp. | | | 104,478 | | | |
| | 8,199 | | | Marvell Technology Group Ltd. | | | 59,525 | | | |
| | 3,915 | | | Maxim Integrated Products, Inc. | | | 115,101 | | | |
| | 2,559 | | | Microchip Technology, Inc. | | | 83,398 | | | |
| | 13,005 | | | Micron Technology, Inc. * | | | 82,582 | | | |
| | 112,908 | | | Microsoft Corp. | | | 3,018,031 | | | |
| | 4,805 | | | NetApp, Inc. * | | | 161,208 | | | |
| | 4,082 | | | Nuance Communications, Inc. * | | | 91,110 | | | |
| | 8,237 | | | NVIDIA Corp. | | | 101,233 | | | |
| | 67,580 | | | Oracle Corp. | | | 2,251,766 | | | |
| | 4,819 | | | Paychex, Inc. | | | 150,064 | | | |
| | 22,331 | | | QUALCOMM, Inc. | | | 1,384,969 | | | |
| | | | | | | | | | |
| Shares | | | | | Value | | | |
| | | | | | | | | | |
| Common Stocks — (Continued) | | | | | | |
| Information Technology — (Continued) | | | | | | |
| | 6,806 | | | Research In Motion Ltd. * | | $ | 80,855 | | | |
| | 3,151 | | | SanDisk Corp. * | | | 137,257 | | | |
| | 6,151 | | | Seagate Technology PLC (a) | | | 187,482 | | | |
| | 9,814 | | | Symantec Corp. * | | | 184,601 | | | |
| | 2,086 | | | VeriSign, Inc. * | | | 80,978 | | | |
| | 3,499 | | | Xilinx, Inc. | | | 125,614 | | | |
| | 16,594 | | | Yahoo!, Inc. * | | | 330,221 | | | |
| | | | | | | | 25,281,383 | | | |
| Materials — 0.5% | | | | | | |
| | 792 | | | Randgold Resources Ltd. ADR | | | 78,606 | | | |
| | 1,609 | | | Sigma-Aldrich Corp. | | | 118,390 | | | |
| | | | | | | | 196,996 | | | |
| Telecommunication Services — 0.8% | | | | | | |
| | 12,499 | | | Vodafone Group PLC ADR | | | 314,850 | | | |
| Total Common Stocks (Cost $39,006,419) | | | 38,892,122 | | | |
| Exchange-Traded Funds — 0.7% | | | | | | |
| | 3,924 | | | Powershares QQQ Trust, Series 1 | | | 255,492 | | | |
| Total Exchange-Traded Funds (Cost $260,492) | | | 255,492 | | | |
| Cash Equivalents — 3.4% | | | | | | |
| | 1,385,688 | | | Huntington U.S. Treasury Money Market Fund, Trust Shares, 0.050% (b) (c) | | | 1,385,688 | | | |
| Total Cash Equivalents (Cost $1,385,688) | | | 1,385,688 | | | |
| Short-Term Securities Held as Collateral for
Securities Lending — 4.5% | | | | | | |
| | 1,839,691 | | | Fidelity Institutional Money Market Portfolio, Institutional Class, 0.180% (c) | | | 1,839,691 | | | |
| Total Short-Term Securities Held as Collateral for
Securities Lending (Cost $1,839,691) | | | 1,839,691 | | | |
| Total Investments
(Cost $42,492,290) — 104.5% | | | 42,372,993 | | | |
| Liabilities in Excess of Other Assets — (4.5)% | | | (1,820,527) | | | |
| Net Assets — 100.0% | | $ | 40,552,466 | | | |
| (a) | All or a portion of the security was on loan as of December 31, 2012. The total value of securities on loan as of December 31, 2012 was $1,840,533. |
| (b) | Investment in affiliate. |
| (c) | Rate disclosed is the seven day yield as of December 31, 2012. |
| * | Non-income producing security. |
| ADR | — American Depositary Receipt |
(See notes which are an integral part of the Financial Statements)
Annual Shareholder Report
73
| | |
| | |
| Huntington Situs Fund | | December 31, 2012 |
| | |
| Portfolio of Investments Summary Table | | (unaudited) |
| | | | |
| Asset Allocation | | Percentage of
Market Value | |
Information Technology | | | 19.3% | |
Industrials | | | 15.6% | |
Health Care | | | 11.0% | |
Consumer Discretionary | | | 10.7% | |
Short-Term Securities Held as Collateral for Securities Lending | | | 10.5% | |
Materials | | | 9.5% | |
Financials | | | 9.4% | |
Energy | | | 4.9% | |
Consumer Staples | | | 3.0% | |
Real Estate Investment Trusts | | | 2.2% | |
Utilities | | | 1.6% | |
Cash1 | | | 1.4% | |
Exchange-Traded Funds | | | 0.4% | |
Closed-End Funds | | | 0.3% | |
Telecommunication Services | | | 0.2% | |
Total | | | 100.0% | |
| 1 | Investments in an affiliated money market fund. |
Portfolio holdings and allocations are subject to change. As of December 31, 2012, percentages in the table above are based on total investments. Such total investments may differ from the percentages set forth below in the Portfolio of Investments which are computed using the Fund’s total net assets.
The Portfolio of Investments Summary Table and the Portfolio of Investments are broken down by sectors, and these sectors do not represent industry categories for purposes of identifying “industry concentration” as described in the Investment Company Act of 1940, as amended.
Portfolio of Investments
| | | | | | | | | | |
| Shares | | | | | Value + | | | |
| | | | | | | | | | |
| Common Stocks — 98.0% | | | | | | |
| Bermuda — 2.2% | | | | | | |
| Financials — 2.2% | | | | | | |
| | 110,000 | | | Arch Capital Group Ltd. * | | $ | 4,842,200 | | | |
| Brazil — 0.8% | | | | | | |
| Consumer Staples — 0.8% | | | | | | |
| | 38,200 | | | Cia Brasileira de Distribuicao Grupo Pao de Acucar ADR (a) | | | 1,695,698 | | | |
| Canada — 0.0% | | | | | | |
| Energy — 0.0% | | | | | | |
| | 35,000 | | | Denison Mines Corp. (a) * | | | 43,750 | | | |
| Chile — 0.6% | | | | | | |
| Materials — 0.6% | | | | | | |
| | 24,000 | | | Sociedad Quimica y Minera de Chile SA ADR | | | 1,383,360 | | | |
| Denmark — 0.7% | | | | | | |
| Health Care — 0.7% | | | | | | |
| | 52,500 | | | Novozymes A/S, Class B | | | 1,489,921 | | | |
| Germany — 0.5% | | | | | | |
| Health Care — 0.5% | | | | | | |
| | 35,500 | | | Stada Arzneimittel AG | | | 1,148,506 | | | |
| | | | | | | | | | |
| Shares | | | | | Value + | | | |
| | | | | | | | | | |
| Common Stocks — (Continued) | | | | | | |
| Hong Kong — 0.6% | | | | | | |
| Consumer Discretionary — 0.6% | | | | | | |
| | 162,500 | | | Television Broadcasts Ltd. | | $ | 1,221,893 | | | |
| Japan — 1.3% | | | | | | |
| Consumer Discretionary — 0.5% | | | | | | |
| | 31,400 | | | Honda Motor Co. Ltd. ADR | | | 1,159,916 | | | |
| Consumer Staples — 0.2% | | | | | | |
| | 38,300 | | | Shiseido Co. Ltd. | | | 539,936 | | | |
| Financials — 0.2% | | | | | | |
| | 70 | | | Japan Prime Realty Investment Corp. | | | 202,058 | | | |
| | 20 | | | Japan Real Estate Investment Corp. | | | 196,793 | | | |
| | | | | 398,851 | | | |
| Health Care — 0.4% | | | | | | |
| | 20,600 | | | Terumo Corp. | | | 816,987 | | | |
| | | | | 2,915,690 | | | |
| Mexico — 0.2% | | | | | | |
| Consumer Discretionary — 0.2% | | | | | | |
| | 27,400 | | | Desarrolladora Homex S.A.B. de C.V. ADR (a) * | | | 341,952 | | | |
(See notes which are an integral part of the Financial Statements)
Annual Shareholder Report
74
| | |
| Huntington Situs Fund | | (Continued) |
| | | | | | | | | | |
| Shares | | | | | Value + | | | |
| | | | | | | | | | |
| Common Stocks — (Continued) | | | | | | |
| Sweden — 0.3% | | | | | | |
| Consumer Discretionary — 0.3% | | | | | | |
| | 116,800 | | | Haldex AB | | $ | 604,686 | | | |
| Switzerland — 0.9% | | | | | | |
| Consumer Discretionary — 0.9% | | | | | | |
| | 50,000 | | | Garmin Ltd. (a) | | | 2,041,000 | | | |
| United Kingdom — 0.9% | | | | | | |
| Consumer Staples — 0.5% | | | | | | |
| | 16,000 | | | Reckitt Benckiser Group PLC | | | 1,016,074 | | | |
| Industrials — 0.4% | | | | | | |
| | 116,800 | | | Concentric AB | | | 1,008,033 | | | |
| | | | | 2,024,107 | | | |
| United States — 89.0% | | | | | | |
| Consumer Discretionary — 9.6% | | | | | | |
| | 186,100 | | | Cabela’s, Inc., Class A * | | | 7,769,675 | | | |
| | 13,500 | | | Columbia Sportswear Co. (a) | | | 720,360 | | | |
| | 7,050 | | | Fossil, Inc. * | | | 656,355 | | | |
| | 45,000 | | | Papa John’s International, Inc. * | | | 2,472,300 | | | |
| | 23,850 | | | Rent-A-Center, Inc. | | | 819,486 | | | |
| | 100,000 | | | Sturm Ruger & Co., Inc. (a) | | | 4,540,000 | | | |
| | 1,200 | | | Tempur-Pedic International, Inc. * | | | 37,788 | | | |
| | 5,000 | | | Tractor Supply Co. | | | 441,800 | | | |
| | 97,000 | | | Urban Outfitters, Inc. * | | | 3,817,920 | | | |
| | | | | 21,275,684 | | | |
| Consumer Staples — 1.9% | | | | | | |
| | 22,000 | | | Darling International, Inc. * | | | 352,880 | | | |
| | 90,000 | | | Fresh Del Monte Produce, Inc. | | | 2,371,500 | | | |
| | 30,000 | | | Sanderson Farms, Inc. | | | 1,426,500 | | | |
| | | | | 4,150,880 | | | |
| Energy — 5.5% | | | | | | |
| | 20,000 | | | Alliance Resource Partners LP (a) | | | 1,161,400 | | | |
| | 10,000 | | | Atwood Oceanics, Inc. * | | | 457,900 | | | |
| | 53,000 | | | CARBO Ceramics, Inc. (a) | | | 4,152,020 | | | |
| | 100,000 | | | Denbury Resources, Inc. * | | | 1,620,000 | | | |
| | 13,000 | | | Dril-Quip, Inc. * | | | 949,650 | | | |
| | 111,708 | | | Halcon Resources Corp. (a) * | | | 773,019 | | | |
| | 30,000 | | | Lufkin Industries, Inc. (a) | | | 1,743,900 | | | |
| | 15,000 | | | Oceaneering International, Inc. | | | 806,850 | | | |
| | 7,000 | | | SM Energy Co. | | | 365,470 | | | |
| | 6,000 | | | Swift Energy Co. * | | | 92,340 | | | |
| | | | | 12,122,549 | | | |
| Financials — 8.1% | | | | | | |
| | 89,300 | | | Cullen/Frost Bankers, Inc. | | | 4,846,311 | | | |
| | 20,000 | | | Evercore Partners, Inc. (a) | | | 603,800 | | | |
| | 30,000 | | | EZCORP, Inc., Class A * | | | 595,800 | | | |
| | 110,000 | | | International Bancshares Corp. | | | 1,985,500 | | | |
| | 165,000 | | | Raymond James Financial, Inc. | | | 6,357,450 | | | |
| | 75,383 | | | SCBT Financial Corp. | | | 3,028,889 | | | |
| | 13,800 | | | WSFS Financial Corp. | | | 583,050 | | | |
| | | | | 18,000,800 | | | |
| | | | | | | | | | |
| Shares | | | | | Value + | | | |
| | | | | | | | | | |
| Common Stocks — (Continued) | | | | | | |
| United States — (Continued) | | | | | | |
| Health Care — 10.8% | | | | | | |
| | 29,000 | | | AmSurg Corp. * | | $ | 870,290 | | | |
| | 40,000 | | | Arena Pharmaceuticals, Inc. (a) * | | | 360,800 | | | |
| | 15,000 | | | Bio-Rad Laboratories, Inc., Class A * | | | 1,575,750 | | | |
| | 73,000 | | | Cerner Corp. * | | | 5,667,720 | | | |
| | 20,000 | | | Codexis, Inc. (a) * | | | 44,200 | | | |
| | 50,000 | | | Edwards LifeSciences Corp. (b) * | | | 4,508,500 | | | |
| | 10,000 | | | Healthways, Inc. * | | | 107,000 | | | |
| | 30,000 | | | Merit Medical Systems, Inc. * | | | 417,000 | | | |
| | 80,000 | | | Myriad Genetics, Inc. * | | | 2,180,000 | | | |
| | 75,000 | | | Osiris Therapeutics, Inc. (a) * | | | 673,500 | | | |
| | 21,000 | | | PSS World Medical, Inc. * | | | 606,480 | | | |
| | 80,000 | | | Watson Pharmaceutical, Inc. * | | | 6,880,000 | | | |
| | | | | 23,891,240 | | | |
| Industrials — 17.1% | | | | | | |
| | 50,000 | | | BE Aerospace, Inc. * | | | 2,470,000 | | | |
| | 105,000 | | | EnPro Industries, Inc. * | | | 4,294,500 | | | |
| | 50,000 | | | Flowserve Corp. | | | 7,340,000 | | | |
| | 100,000 | | | Harsco Corp. | | | 2,350,000 | | | |
| | 20,000 | | | Lindsay Corp. | | | 1,602,400 | | | |
| | 10,000 | | | Mine Safety Appliances Co. | | | 427,100 | | | |
| | 120,000 | | | Quanta Services, Inc. * | | | 3,274,800 | | | |
| | 40,000 | | | Ryder System, Inc. | | | 1,997,200 | | | |
| | 50,000 | | | Taser International, Inc. * | | | 447,000 | | | |
| | 195,000 | | | Trinity Industries, Inc. | | | 6,984,900 | | | |
| | 70,000 | | | Universal Forest Products, Inc. (a) | | | 2,662,800 | | | |
| | 85,000 | | | Watts Water Technologies, Inc., Class A | | | 3,654,150 | | | |
| | 12,750 | | | Werner Enterprises, Inc. | | | 276,293 | | | |
| | | | | 37,781,143 | | | |
| Information Technology — 21.6% | | | | | | |
| | 15,000 | | | 3D Systems Corp. * | | | 800,250 | | | |
| | 66,900 | | | ACI Worldwide, Inc. * | | | 2,922,861 | | | |
| | 70,000 | | | Anixter International, Inc. * | | | 4,478,600 | | | |
| | 50,000 | | | Cardtronics, Inc. * | | | 1,187,000 | | | |
| | 80,000 | | | Diodes, Inc. * | | | 1,388,000 | | | |
| | 50,000 | | | Exlservice Holdings, Inc. * | | | 1,325,000 | | | |
| | 177,000 | | | Geospace Technologies Corp. * | | | 15,729,990 | | | |
| | 215,000 | | | Jabil Circuit, Inc. | | | 4,147,350 | | | |
| | 80,600 | | | Methode Electronics, Inc. | | | 808,418 | | | |
| | 100,000 | | | Red Hat, Inc. * | | | 5,296,000 | | | |
| | 45,000 | | | ScanSource, Inc. * | | | 1,429,650 | | | |
| | 115,000 | | | Trimble Navigation Ltd. * | | | 6,874,700 | | | |
| | 20,000 | | | TriQuint Semiconductor, Inc. * | | | 96,800 | | | |
| | 29,000 | | | Tyler Technologies, Inc. * | | | 1,404,760 | | | |
| | | | | 47,889,379 | | | |
| Materials — 10.0% | | | | | | |
| | 5,000 | | | Albemarle Corp. | | | 310,600 | | | |
| | 48,000 | | | Buckeye Technologies, Inc. | | | 1,378,080 | | | |
| | 53,400 | | | Eagle Materials, Inc. | | | 3,123,900 | | | |
| | 29,200 | | | Eastman Chemical Co. | | | 1,987,060 | | | |
| | 10,000 | | | Owens-Illinois, Inc. * | | | 212,700 | | | |
| | 65,000 | | | Quaker Chemical Corp. | | | 3,500,900 | | | |
| | 40,000 | | | Scotts Miracle-Gro Co., Class A (a) | | | 1,762,000 | | | |
| | 30,000 | | | Sensient Technologies Corp. | | | 1,066,800 | | | |
(See notes which are an integral part of the Financial Statements)
Annual Shareholder Report
75
| | |
| Huntington Situs Fund | | (Continued) |
| | | | | | | | | | |
| Shares | | | | | Value + | | | |
| | | | | | | | | | |
| Common Stocks — (Continued) | | | | | | |
| United States — (Continued) | | | | | | |
| Materials — (Continued) | | | | | | |
| | 17,000 | | | Terra Nitrogen Co. LP (a) | | $ | 3,639,530 | | | |
| | 55,000 | | | Texas Industries, Inc. (a) * | | | 2,805,550 | | | |
| | 50,000 | | | United States Lime & Minerals, Inc.* | | | 2,356,000 | | | |
| | | | | | | | 22,143,120 | | | |
| Real Estate Investment Trusts — 2.4% | | | | | | |
| | 31,500 | | | Camden Property Trust | | | 2,148,615 | | | |
| | 90,000 | | | Equity One, Inc. (a) | | | 1,890,900 | | | |
| | 50,000 | | | Weingarten Realty Investors | | | 1,338,500 | | | |
| | | | | | | | 5,378,015 | | | |
| Telecommunication Services — 0.2% | | | | | | |
| | 39,000 | | | General Communication, Inc.,
Class A * | | | 374,010 | | | |
| Utilities — 1.8% | | | | | | |
| | 15,000 | | | AGL Resources, Inc. | | | 599,550 | | | |
| | 39,900 | | | Hawaiian Electric Industries, Inc. | | | 1,003,086 | | | |
| | 13,100 | | | Northwest Natural Gas Co. | | | 579,020 | | | |
| | 60,000 | | | Portland General Electric Co. | | | 1,641,600 | | | |
| | 5,500 | | | UGI Corp. | | | 179,905 | | | |
| | | | | | | | 4,003,161 | | | |
| | | | | | | | 197,009,981 | | | |
| Total Common Stocks (Cost $132,797,830) | | | 216,762,744 | | | |
| Exchange-Traded Funds — 0.4% | | | | | | |
| | 25,000 | | | iShares FTSE China 25 Index Fund | | | 1,012,000 | | | |
| Total Exchange-Traded Funds (Cost $623,750) | | | 1,012,000 | | | |
| Closed-End Fund — 0.3% | | | | | | |
| | 30,000 | | | Central Fund of Canada Ltd., Class A (a) | | | 630,900 | | | |
| Total Closed-End Fund (Cost $419,116) | | | 630,900 | | | |
| | | | | | | | | | |
| Shares | | | | | Value + | | | |
| | | | | | | | | | |
| Cash Equivalents — 1.6% | | | | | | |
| | 3,588,928 | | | Huntington U.S. Treasury Money Market Fund, Trust Shares, 0.050% (c) (d) | | $ | 3,588,928 | | | |
| Total Cash Equivalents (Cost $3,588,928) | | | 3,588,928 | | | |
| Short-Term Securities Held as Collateral for
Securities Lending — 11.8% | | | | | | |
| | 25,978,626 | | | Fidelity Institutional Money Market Portfolio, Institutional Class, 0.180% (d) | | | 25,978,626 | | | |
| Total Short-Term Securities Held as Collateral for
Securities Lending (Cost $25,978,626) | | | 25,978,626 | | | |
| Total Investments
(Cost $163,408,250) — 112.1% | | | 247,973,198 | | | |
| Liabilities in Excess of Other Assets — (12.1)% | | | (26,731,376) | | | |
| Net Assets — 100.0% | | $ | 221,241,822 | | | |
| (a) | All or a portion of the security was on loan as of December 31, 2012. The total value of securities on loan as of December 31, 2012 was $25,938,935. |
| (b) | All or a portion of the security is held as collateral for written call options. |
| (c) | Investment in affiliate. |
| (d) | Rate disclosed is the seven day yield as of December 31, 2012. |
| * | Non-income producing security. |
| + | All securities, except those traded on United States (including ADRs) and Canadian exchanges, Cash Equivalents or Short-Term Securities were fair valued at December 31, 2012. |
ADR — American Depositary Receipt
(See notes which are an integral part of the Financial Statements)
Annual Shareholder Report
76
| | |
| | |
| Huntington Fixed Income Securities Fund | | December 31, 2012 |
| | |
| Portfolio of Investments Summary Table | | (unaudited) |
| | | | |
| Asset Allocation | | Percentage of
Market Value | |
Corporate Bonds | | | 73.5% | |
U.S. Treasury Obligations | | | 12.7% | |
U.S. Government Agencies | | | 9.9% | |
Cash1 | | | 1.7% | |
Preferred Stocks | | | 1.2% | |
U.S. Government Mortgage Backed Securities | | | 1.0% | |
Total | | | 100.0% | |
| 1 | Investments in an affiliated money market fund. |
Portfolio holdings and allocations are subject to change. As of December 31, 2012, percentages in the table above are based on total investments. Such total investments may differ from the percentages set forth below in the Portfolio of Investments which are computed using the Fund’s total net assets.
The Portfolio of Investments are broken down by sectors, and these sectors do not represent industry categories for purposes of identifying “industry concentration” as described in the Investment Company Act of 1940, as amended.
Portfolio of Investments
| | | | | | | | | | |
Principal
Amount | | | | | Value | | | |
| | | | | | | | | | |
| Corporate Bonds — 72.7% | | | | | | |
| Consumer Discretionary — 5.2% | | | | | | |
| $ | 5,000,000 | | | AutoZone, Inc., 5.750%, 1/15/15 | | $ | 5,471,415 | | | |
| | 2,000,000 | | | Comcast Corp., 6.500%, 1/15/17 | | | 2,412,086 | | | |
| | 2,000,000 | | | Mattel, Inc., 6.200%, 10/1/40 | | | 2,457,202 | | | |
| | 4,000,000 | | | Time Warner, Inc., 3.150%, 7/15/15 | | | 4,229,980 | | | |
| | 1,500,000 | | | Walt Disney Co./The, Series B, MTN, 6.200%, 6/20/14 | | | 1,627,527 | | | |
| | | | | | | | 16,198,210 | | | |
| Consumer Staples — 3.5% | | | | | | |
| | 3,000,000 | | | Kellogg Co., 4.250%, 3/6/13 | | | 3,019,896 | | | |
| | 2,000,000 | | | Kraft Foods, Inc., 6.000%, 2/11/13 | | | 2,010,948 | | | |
| | 2,000,000 | | | Kroger Co./The, 7.500%, 1/15/14 | | | 2,139,320 | | | |
| | 2,775,000 | | | Wal-Mart Stores, Inc., 6.200%, 4/15/38 | | | 3,770,809 | | | |
| | | | | | | | 10,940,973 | | | |
| Energy — 6.1% | | | | | | |
| | 1,290,000 | | | Apache Corp., 6.900%, 9/15/18 | | | 1,645,167 | | | |
| | 5,000,000 | | | Enterprise Products Operating LLC, Series L, 6.300%, 9/15/17 | | | 6,048,155 | | | |
| | 2,005,000 | | | EQT Corp., 8.125%, 6/1/19 | | | 2,481,843 | | | |
| | 2,000,000 | | | Halliburton Co., 6.150%, 9/15/19 | | | 2,518,534 | | | |
| | 2,335,000 | | | Marathon Oil Corp., 6.000%, 10/1/17 | | | 2,806,563 | | | |
| | 1,000,000 | | | Transocean, Inc., 7.375%, 4/15/18 | | | 1,189,826 | | | |
| | 2,000,000 | | | Williams Partners LP, 5.250%, 3/15/20 | | | 2,303,904 | | | |
| | | | | | | | 18,993,992 | | | |
| Financials — 22.7% | | | | | | |
| | 2,700,000 | | | American Express Co., 4.050%, 12/3/42 (a) (b) | | | 2,712,123 | | | |
| | 2,000,000 | | | American Express Credit Co., Series C, 7.300%, 8/20/13 | | | 2,085,916 | | | |
| | 5,000,000 | | | Bank of Montreal, MTN, 2.500%, 1/11/17 (a) (b) | | | 5,241,185 | | | |
| | | | | | | | | | |
Principal
Amount | | | | | Value | | | |
| | | | | | | | | | |
| Corporate Bonds — (Continued) | | | | | | |
| Financials — (Continued) | | | | | | |
| $ | 5,000,000 | | | Bank of Nova Scotia, 1.950%, 1/30/17 (a) (b) | | $ | 5,208,000 | | | |
| | 2,000,000 | | | Barrick International Bank Corp., 5.750%, 10/15/16 (a) (b) | | | 2,294,262 | | | |
| | 3,000,000 | | | BlackRock, Inc., 6.250%, 9/15/17 | | | 3,666,264 | | | |
| | 5,000,000 | | | Canadian Imperial Bank of Commerce, 2.600%, 7/2/15 (a) (b) | | | 5,254,000 | | | |
| | 3,000,000 | | | CME Group, Inc., 3.000%, 9/15/22 | | | 3,043,935 | | | |
| | 3,000,000 | | | Fifth Third Bancorp, 3.625%, 1/25/16 | | | 3,205,275 | | | |
| | 3,700,000 | | | General Electric Capital Corp., Series A, GMTN, 6.900%, 9/15/15 | | | 4,247,781 | | | |
| | 1,000,000 | | | Goldman Sachs Group, Inc./The, 5.250%, 10/15/13 | | | 1,035,012 | | | |
| | 3,000,000 | | | JPMorgan Chase & Co., 4.000%, 2/25/21 (c) | | | 3,008,079 | | | |
| | 1,000,000 | | | Lincoln National Corp., 4.750%, 2/15/14 | | | 1,041,974 | | | |
| | 4,000,000 | | | Manulife Financial Corp., 3.400%, 9/17/15 | | | 4,206,048 | | | |
| | 1,000,000 | | | MetLife, Inc., 5.000%, 11/24/13 | | | 1,040,651 | | | |
| | 1,000,000 | | | Morgan Stanley, 6.750%, 10/15/13 | | | 1,044,630 | | | |
| | 2,000,000 | | | Morgan Stanley, MTN, 5.000%, 5/17/23 (c) | | | 1,850,000 | | | |
| | 3,400,000 | | | National City Bank, 5.250%, 12/15/16 | | | 3,863,937 | | | |
| | 1,915,000 | | | Northern Trust Co., 6.500%, 8/15/18 | | | 2,371,076 | | | |
| | 2,050,000 | | | RenaissanceRe Holdings Ltd., 5.875%, 2/15/13 | | | 2,060,916 | | | |
| | 5,000,000 | | | Royal Bank of Canada, 3.125%, 4/14/15 (a) (b) | | | 5,289,000 | | | |
| | 3,000,000 | | | Toronto-Dominion Bank, 2.200%, 7/29/15 (a) (b) | | | 3,126,000 | | | |
| | 3,395,000 | | | Wachovia Corp., 5.625%, 10/15/16 | | | 3,892,466 | | | |
| | | | | | | | 70,788,530 | | | |
(See notes which are an integral part of the Financial Statements)
Annual Shareholder Report
77
| | |
| Huntington Fixed Income Securities Fund | | (Continued) |
| | | | | | | | | | |
Principal
Amount | | | | | Value | | | |
| | | | | | | | | | |
| Corporate Bonds — (Continued) | | | | | | |
| Health Care — 6.7% | | | | | | |
| $ | 2,000,000 | | | AstraZeneca PLC, 5.900%, 9/15/17 | | $ | 2,430,050 | | | |
| | 2,054,000 | | | Celgene Corp., 2.450%, 10/15/15 | | | 2,131,452 | | | |
| | 2,500,000 | | | Covidien International Finance SA, 1.875%, 6/15/13 | | | 2,516,900 | | | |
| | 1,000,000 | | | Covidien International Finance SA, 2.800%, 6/15/15 | | | 1,045,911 | | | |
| | 2,000,000 | | | Gilead Sciences, Inc., 4.500%, 4/1/21 | | | 2,285,708 | | | |
| | 3,705,000 | | | Laboratory Corp. of America Holdings, 4.625%, 11/15/20 | | | 4,125,077 | | | |
| | 1,000,000 | | | Pfizer, Inc., 5.350%, 3/15/15 | | | 1,101,306 | | | |
| | 5,000,000 | | | Thermo Fisher Scientific, Inc., 3.250%, 11/20/14 | | | 5,228,065 | | | |
| | | | | | | | 20,864,469 | | | |
| Industrials — 2.8% | | | | | | |
| | 1,368,000 | | | CSX Transportation, Inc., 9.750%, 6/15/20 | | | 1,932,554 | | | |
| | 1,665,000 | | | Emerson Electric Co., 5.125%, 12/1/16 | | | 1,916,287 | | | |
| | 2,000,000 | | | Union Pacific Corp., 5.650%, 5/1/17 | | | 2,346,858 | | | |
| | 2,000,000 | | | United Technologies Corp., 6.125%, 2/1/19 | | | 2,492,454 | | | |
| | | | | | | | 8,688,153 | | | |
| Information Technology — 6.5% | | | | | | |
| | 2,000,000 | | | CA, Inc., 6.125%, 12/1/14 | | | 2,179,510 | | | |
| | 4,000,000 | | | eBay, Inc., 4.000%, 7/15/42 | | | 3,895,696 | | | |
| | 2,000,000 | | | Hewlett-Packard Co., 5.500%, 3/1/18 | | | 2,163,132 | | | |
| | 2,000,000 | | | Intel Corp., 4.000%, 12/15/32 | | | 1,987,978 | | | |
| | 3,000,000 | | | International Business Machines Corp., 7.625%, 10/15/18 | | | 4,007,076 | | | |
| | 3,000,000 | | | Oracle Corp., 6.125%, 7/8/39 | | | 4,003,755 | | | |
| | 2,000,000 | | | Oracle Corp., 5.250%, 1/15/16 | | | 2,263,220 | | | |
| | | | | | | | 20,500,367 | | | |
| Materials — 3.8% | | | | | | |
| | 5,000,000 | | | Albemarle Corp., 5.100%, 2/1/15 | | | 5,372,045 | | | |
| | 3,000,000 | | | Freeport-McMoRan Copper & Gold, Inc., 3.550%, 3/1/22 | | | 2,975,328 | | | |
| | 3,300,000 | | | Potash Corporation of Saskatchewan, Inc., 5.250%, 5/15/14 | | | 3,503,795 | | | |
| | | | | | | | 11,851,168 | | | |
| Real Estate Investment Trusts — 5.0% | | | | | | |
| | 5,000,000 | | | ERP Operating LP, 5.200%, 4/1/13 | | | 5,052,280 | | | |
| | 2,640,000 | | | Health Care REIT, Inc., 4.950%, 1/15/21 | | | 2,887,452 | | | |
| | 1,000,000 | | | Kimco Realty Corp., 4.820%, 6/1/14 | | | 1,051,812 | | | |
| | 2,000,000 | | | Plum Creek Timberlands PLC, 4.700%, 3/15/21 | | | 2,223,014 | | | |
| | 2,000,000 | | | Senior Housing Properties Trust, 4.300%, 1/15/16 | | | 2,073,538 | | | |
| | 2,000,000 | | | Simon Property Group LP, 5.650%, 2/1/20 | | | 2,400,030 | | | |
| | | | | | | | 15,688,126 | | | |
| | | | | | | | | | |
Principal
Amount | | | | | Value | | | |
| | | | | | | | | | |
| Corporate Bonds — (Continued) | | | | | | |
| Telecommunication Services — 2.1% | | | | | | |
| $ | 2,000,000 | | | AT&T, Inc., 5.600%, 5/15/18 | | $ | 2,412,550 | | | |
| | 2,000,000 | | | Verizon Wireless, 7.375%, 11/15/13 | | | 2,113,934 | | | |
| | 2,000,000 | | | Vodafone Group PLC, 5.000%, 12/16/13 | | | 2,085,474 | | | |
| | | | | | | | 6,611,958 | | | |
| Utilities — 8.3% | | | | | | |
| | 1,000,000 | | | Consolidated Edison Co. of New York, Inc., Series 03-B, 3.850%, 6/15/13 | | | 1,014,316 | | | |
| | 2,000,000 | | | Constellation Energy Group, Inc., 4.550%, 6/15/15 | | | 2,158,698 | | | |
| | 3,000,000 | | | Dominion Resources, Inc.,
Series 07-A, 6.000%, 11/30/17 | | | 3,618,156 | | | |
| | 4,000,000 | | | Duke Energy Corp., 6.300%, 2/1/14 | | | 4,237,784 | | | |
| | 3,000,000 | | | Georgia Power Co., Series 10-C, 4.750%, 9/1/40 | | | 3,281,784 | | | |
| | 1,800,000 | | | Gulf Power Co., Series K, 4.900%, 10/1/14 | | | 1,881,058 | | | |
| | 2,310,000 | | | Metropolitan Edison, 4.875%, 4/1/14 | | | 2,420,365 | | | |
| | 3,000,000 | | | PSEG Power LLC, 2.500%, 4/15/13 | | | 3,017,313 | | | |
| | 4,000,000 | | | Questar Corp., 2.750%, 2/1/16 | | | 4,197,188 | | | |
| | | | | | | | 25,826,662 | | | |
| Total Corporate Bonds (Cost $214,342,279) | | | 226,952,608 | | | |
| U.S. Treasury Obligations — 12.6% | | | | | | |
| U.S. Treasury Bonds — 10.0% | | | | | | |
| | 1,500,000 | | | 9.125%, 5/15/18 | | | 2,159,062 | | | |
| | 2,000,000 | | | 8.750%, 8/15/20 | | | 3,096,250 | | | |
| | 6,000,000 | | | 7.125%, 2/15/23 | | | 9,046,872 | | | |
| | 4,000,000 | | | 7.625%, 2/15/25 | | | 6,450,000 | | | |
| | 4,000,000 | | | 6.750%, 8/15/26 | | | 6,180,000 | | | |
| | 3,000,000 | | | 5.250%, 11/15/28 | | | 4,144,686 | | | |
| | | | | | | | 31,076,870 | | | |
| U.S. Treasury Notes — 2.6% | | | | | | |
| | 4,000,000 | | | 0.875%, 4/30/17 | | | 4,049,064 | | | |
| | 4,000,000 | | | 3.000%, 5/15/42 | | | 4,075,000 | | | |
| | | | | | | | 8,124,064 | | | |
| Total U.S. Treasury Obligations (Cost $33,125,887) | | | 39,200,934 | | | |
| U.S. Government Agencies — 9.8% | | | | | | |
| Federal Farm Credit Bank — 0.7% | | | | | | |
| | 2,000,000 | | | 4.710%, 3/6/15 | | | 2,190,166 | | | |
| Federal Home Loan Bank — 5.0% | | | | | | |
| | 3,000,000 | | | 5.375%, 6/14/13 | | | 3,070,725 | | | |
| | 1,380,000 | | | 5.000%, 7/16/13 (d) | | | 1,415,245 | | | |
| | 5,000,000 | | | 4.750%, 9/11/15 | | | 5,584,640 | | | |
| | 5,000,000 | | | 3.500%, 12/9/16 | | | 5,539,880 | | | |
| | | | | | | | 15,610,490 | | | |
| Federal Home Loan Mortgage Corporation — 3.0% | | | | | | |
| | 5,000,000 | | | 5.000%, 1/30/14 | | | 5,258,730 | | | |
| | 4,000,000 | | | 0.500%, 10/9/15 | | | 4,006,208 | | | |
| | | | | | | | 9,264,938 | | | |
(See notes which are an integral part of the Financial Statements)
Annual Shareholder Report
78
| | |
| Huntington Fixed Income Securities Fund | | (Continued) |
| | | | | | | | | | |
Principal
Amount
or Shares | | | | | Value | | | |
| | | | | | | | | | |
| U.S. Government Agencies — (Continued) | | | | | | |
| Federal National Mortgage Association — 1.1% | | | | | | |
| $ | 3,000,000 | | | 4.065%, 2/15/18 | | $ | 3,479,898 | | | |
| Total U.S. Government Agencies
(Cost $28,804,860) | | | 30,545,492 | | | |
| Preferred Stocks — 1.2% | | | | | | |
| Financials — 0.7% | | | | | | |
| | 20,000 | | | American Financial Group, Inc., 7.000% | | | 536,600 | | | |
| | 10,000 | | | Credit Suisse Guernsey, 7.900% | | | 253,600 | | | |
| | 20,000 | | | M&T Capital Trust IV, 8.500% | | | 507,000 | | | |
| | 20,000 | | | Raymond James Financial, Inc., 6.900% | | | 545,400 | | | |
| | 20,000 | | | Wells Fargo Capital Trust XII, 7.875% | | | 506,600 | | | |
| | | | | | | | 2,349,200 | | | |
| Real Estate Investment Trusts — 0.2% | | | | | | |
| | 20,000 | | | Vornado Realty LP, 7.875% | | | 541,600 | | | |
| Utilities — 0.3% | | | | | | |
| | 30,000 | | | NextEra Energy Capital Holdings, Inc., Series F, 8.750% | | | 801,300 | | | |
| Total Preferred Stocks (Cost $3,766,910) | | | 3,692,100 | | | |
| U.S. Government Mortgage Backed
Agencies — 1.0% | | | | | | |
| Federal Home Loan Mortgage Corporation — 0.4% | | | | | | |
| $ | 554,252 | | | Pool # J05518, 5.500%, 9/1/22 | | | 591,936 | | | |
| | 582,573 | | | Pool # J08160, 5.000%, 12/1/22 | | | 625,686 | | | |
| | | | | | | | 1,217,622 | | | |
| Federal National Mortgage Association — 0.0% | | | | | | |
| | 20,418 | | | Pool # 599630, 6.500%, 8/1/16 | | | 21,845 | | | |
| | 97,743 | | | Pool # 254403, 6.000%, 8/1/17 | | | 105,131 | | | |
| | | | | | | | 126,976 | | | |
| | | | | | | | | | |
Principal
Amount
or Shares | | | | | Value | | | |
| | | | | | | | | | |
| U.S. Government Mortgage Backed
Agencies —(Continued) | | | | | | |
| Government National Mortgage
Association — 0.6% | | | | | | |
| $ | 885,943 | | | Pool # 683937, 6.000%, 2/15/23 | | $ | 977,237 | | | |
| | 695,258 | | | Pool # 689593, 6.000%, 7/15/23 | | | 766,117 | | | |
| | 71,049 | | | Pool # 345128, 6.500%, 1/15/24 | | | 80,803 | | | |
| | 25,038 | | | Pool # 372962, 7.000%, 3/15/24 | | | 29,386 | | | |
| | 13,333 | | | Pool # 373015, 8.000%, 6/15/24 | | | 13,556 | | | |
| | | | | | | | 1,867,099 | | | |
| Total U.S. Government Mortgage Backed Agencies
(Cost $3,002,369) | | | 3,211,697 | | | |
| Cash Equivalents — 1.7% | | | | | | |
| | 5,299,225 | | | Huntington U.S. Treasury Money Market Fund, Trust Shares 0.050% (e) (f) | | | 5,299,225 | | | |
| Total Cash Equivalents (Cost $5,299,225) | | | 5,299,225 | | | |
| Total Investments
(Cost $288,341,530) — 99.0% | | | 308,902,056 | | | |
| Other Assets in Excess of Liabilities — 1.0% | | | 3,044,307 | | | |
| Net Assets — 100.0% | | $ | 311,946,363 | | | |
| (b) | Security exempt from registration under Rule 144A or Section 4(2) of the Securities Act of 1933. The security may be resold in transactions exempt from registration, normally to qualified institutional buyers. |
| (c) | Variable or Floating Rate Security. Rate disclosed is as of December 31, 2012. |
| (d) | Step Bond: Coupon rate is set for an initial period and then increased to a higher coupon rate at a specified date. The rate shown is the rate in effect at December 31, 2012. |
| (e) | Investment in affiliate. |
| (f) | Rate disclosed is the seven day yield as of December 31, 2012. |
GMTN — Global Medium Term Note
MTN — Medium Term Note
(See notes which are an integral part of the Financial Statements)
Annual Shareholder Report
79
| | |
| | |
| Huntington Intermediate Government Income Fund | | December 31, 2012 |
| | |
| Portfolio of Investments Summary Table | | (unaudited) |
| | | | |
| Asset Allocation | | Percentage of
Market Value | |
U.S. Government Agencies | | | 46.6% | |
U.S. Government Mortgage Backed Securities | | | 26.4% | |
U.S. Treasury Obligations | | | 22.1% | |
Collateralized Mortgage Obligations | | | 2.7% | |
Cash1 | | | 2.2% | |
Total | | | 100.0% | |
| 1 | Investments in an affiliated money market fund. |
Portfolio holdings and allocations are subject to change. As of December 31, 2012, percentages in the table above are based on total investments. Such total investments may differ from the percentages set forth below in the Portfolio of Investments which are computed using the Fund’s total net assets.
Portfolio of Investments
| | | | | | | | | | |
Principal
Amount | | | | | Value | | | |
| | | | | | | | | | |
| U.S. Government Agencies — 46.4% | | | | | | |
| Federal Farm Credit Bank — 18.1% | | | | | | |
| $ | 1,000,000 | | | 4.500%, 12/15/15 | | $ | 1,119,462 | | | |
| | 2,000,000 | | | 4.875%, 12/16/15 | | | 2,257,344 | | | |
| | 1,000,000 | | | 3.750%, 1/29/16 | | | 1,100,907 | | | |
| | 1,000,000 | | | 5.270%, 9/1/16 | | | 1,171,079 | | | |
| | 2,000,000 | | | 5.050%, 3/8/17 | | | 2,345,020 | | | |
| | 1,000,000 | | | 5.550%, 8/1/17 | | | 1,209,201 | | | |
| | 2,500,000 | | | 3.150%, 1/12/18 | | | 2,772,417 | | | |
| | 1,000,000 | | | 4.250%, 4/16/18 | | | 1,170,334 | | | |
| | 2,000,000 | | | 5.050%, 8/1/18 | | | 2,443,144 | | | |
| | 2,000,000 | | | 2.800%, 10/28/20 | | | 2,189,348 | | | |
| | 1,000,000 | | | 5.375%, 11/10/20 | | | 1,284,613 | | | |
| | 3,000,000 | | | 1.880%, 10/5/22 | | | 2,983,068 | | | |
| | | | | | | | 22,045,937 | | | |
| Federal Home Loan Bank — 26.6% | | | | | | |
| | 1,000,000 | | | 3.750%, 6/14/13 | | | 1,015,993 | | | |
| | 1,000,000 | | | 4.375%, 9/13/13 | | | 1,029,215 | | | |
| | 830,000 | | | 4.750%, 12/12/14 | | | 900,138 | | | |
| | 2,500,000 | | | 2.875%, 6/12/15 | | | 2,653,228 | | | |
| | 2,000,000 | | | 4.750%, 9/11/15 | | | 2,233,856 | | | |
| | 2,000,000 | | | 1.900%, 12/29/15 | | | 2,088,562 | | | |
| | 1,000,000 | | | 4.875%, 3/11/16 | | | 1,139,980 | | | |
| | 3,000,000 | | | 1.000%, 6/21/17 | | | 3,034,221 | | | |
| | 2,000,000 | | | 3.125%, 12/8/17 | | | 2,222,518 | | | |
| | 1,500,000 | | | 4.250%, 3/9/18 | | | 1,753,203 | | | |
| | 3,000,000 | | | 4.125%, 12/13/19 | | | 3,555,153 | | | |
| | 1,000,000 | | | 4.125%, 3/13/20 | | | 1,187,471 | | | |
| | 2,000,000 | | | 3.000%, 3/18/20 | | | 2,209,726 | | | |
| | 3,500,000 | | | 3.375%, 6/12/20 | | | 3,973,963 | | | |
| | 2,000,000 | | | 3.625%, 6/11/21 | | | 2,299,708 | | | |
| | 1,000,000 | | | 2.125%, 6/10/22 | | | 1,023,115 | | | |
| | | | | | | | 32,320,050 | | | |
| Federal National Mortgage Association — 1.7% | | | | | | |
| | 2,000,000 | | | 1.375%, 11/15/16 | | | 2,060,380 | | | |
| Total U.S. Government Agencies
(Cost $51,423,008) | | | 56,426,367 | | | |
| | | | | | | | | | |
Principal
Amount | | | | | Value | | | |
| | | | | | | | | | |
| U.S. Government Mortgage Backed
Agencies — 26.3% | | | | | | |
| Federal Home Loan Mortgage
Corporation — 7.8% | | | | | | |
| $ | 17,977 | | | Pool # M81004, 5.000%, 1/1/13 | | $ | 18,051 | | | |
| | 88,296 | | | Pool # E01184, 6.000%, 8/1/17 | | | 96,048 | | | |
| | 287,243 | | | Pool # B10827, 4.500%, 11/1/18 | | | 306,167 | | | |
| | 573,541 | | | Pool # J02717, 5.500%, 11/1/20 | | | 622,572 | | | |
| | 270,823 | | | Pool # C90699, 5.000%, 8/1/23 | | | 291,422 | | | |
| | 242,852 | | | Pool # C91167, 5.000%, 4/1/28 | | | 261,507 | | | |
| | 1,910,542 | | | Pool # C91441, 3.000%, 4/1/32 | | | 2,006,757 | | | |
| | 2,868,979 | | | Pool # C91451, 3.000%, 5/1/32 | | | 3,013,460 | | | |
| | 147,598 | | | Pool # G08005, 5.500%, 8/1/34 | | | 160,416 | | | |
| | 225,191 | | | Pool # 1G0865, 2.825%, 7/1/35 (a) | | | 239,844 | | | |
| | 459,823 | | | Pool # 972190, 2.775%, 11/1/35 (a) | | | 489,571 | | | |
| | 291,650 | | | Pool # G03609, 5.500%, 10/1/37 | | | 315,063 | | | |
| | 1,556,993 | | | Pool # G06784, 3.500%, 10/1/41 | | | 1,656,985 | | | |
| | | | | | | | 9,477,863 | | | |
| Federal National Mortgage Association — 12.3% | | | | | | |
| | 83,340 | | | Pool # 647408, 5.000%, 10/1/17 | | | 90,569 | | | |
| | 387,904 | | | Pool # 357805, 5.000%, 6/1/20 | | | 420,702 | | | |
| | 420,992 | | | Pool # 889799, 5.500%, 2/1/23 | | | 456,094 | | | |
| | 145,923 | | | Pool # 254911, 5.000%, 10/1/23 | | | 160,350 | | | |
| | 358,487 | | | Pool # 255360, 5.000%, 8/1/24 | | | 393,932 | | | |
| | 358,353 | | | Pool # 255767, 5.500%, 6/1/25 | | | 392,496 | | | |
| | 432,074 | | | Pool # 255984, 4.500%, 11/1/25 | | | 473,770 | | | |
| | 373,497 | | | Pool # 256116, 6.000%, 2/1/26 | | | 408,908 | | | |
| | 296,119 | | | Pool # 256213, 6.000%, 4/1/26 | | | 324,194 | | | |
| | 294,310 | | | Pool # 257536, 5.000%, 1/1/29 | | | 318,994 | | | |
| | 503,745 | | | Pool # MA0115, 4.500%, 7/1/29 | | | 545,745 | | | |
| | 567,786 | | | Pool # MA0563, 4.000%, 11/1/30 | | | 611,220 | | | |
| | 1,110,027 | | | Pool # MA0667, 4.000%, 3/1/31 | | | 1,194,940 | | | |
| | 1,857,121 | | | Pool # MA0706, 4.500%, 4/1/31 | | | 2,018,926 | | | |
| | 705,342 | | | Pool # MA0804, 4.000%, 7/1/31 | | | 759,299 | | | |
| | 230,916 | | | Pool # 254594, 5.500%, 1/1/33 | | | 253,783 | | | |
| | 384,005 | | | Pool # 783793, 6.000%, 7/1/34 | | | 432,652 | | | |
| | 275,637 | | | Pool # 806715, 5.500%, 1/1/35 | | | 301,555 | | | |
| | 291,773 | | | Pool # 807963, 5.000%, 1/1/35 | | | 319,983 | | | |
| | 405,899 | | | Pool # 735224, 5.500%, 2/1/35 | | | 446,095 | | | |
(See notes which are an integral part of the Financial Statements)
Annual Shareholder Report
80
| | |
| Huntington Intermediate Government Income Fund | | (Continued) |
| | | | | | | | | | |
Principal
Amount | | | | | Value | | | |
| | | | | | | | | | |
| U.S. Government Mortgage Backed
Agencies — (Continued) | | | | | | |
| Federal National Mortgage
Association — (Continued) | | | | | | |
| $ | 377,323 | | | Pool # 868935, 5.500%, 5/1/36 | | $ | 410,444 | | | |
| | 161,168 | | | Pool # 907484, 6.000%, 1/1/37 | | | 176,449 | | | |
| | 714,366 | | | Pool # AD7906, 5.000%, 7/1/40 | | | 795,713 | | | |
| | 764,032 | | | Pool # AH6655, 4.000%, 2/1/41 | | | 819,851 | | | |
| | 1,421,445 | | | Pool # AJ5469, 3.500%, 11/1/41 | | | 1,516,674 | | | |
| | 869,414 | | | Pool # MA1044, 3.000%, 4/1/42 | | | 911,907 | | | |
| | | | | | | | 14,955,245 | | | |
| Government National Mortgage
Association — 6.2% | | | | | | |
| | 420,066 | | | Pool # 683552, 5.500%, 2/15/23 | | | 453,919 | | | |
| | 598,712 | | | Pool # 666057, 5.000%, 3/15/23 | | | 654,018 | | | |
| | 2,006,025 | | | Pool # 741854, 4.000%, 5/15/25 | | | 2,163,101 | | | |
| | 124,838 | | | Pool # 2699, 6.000%, 1/20/29 | | | 143,421 | | | |
| | 116,137 | | | Pool # 576456, 6.000%, 3/15/32 | | | 131,390 | | | |
| | 1,340,440 | | | Pool # 4113, 5.000%, 4/20/38 | | | 1,466,163 | | | |
| | 422,285 | | | Pool # 676974, 5.500%, 5/15/38 | | | 463,409 | | | |
| | 743,464 | | | Pool # 733602, 5.000%, 4/15/40 | | | 843,668 | | | |
| | 1,140,805 | | | Pool # 4978, 4.500%, 3/20/41 | | | 1,255,191 | | | |
| | | | | | | | 7,574,280 | | | |
| Total U.S. Government Mortgage Backed Agencies
(Cost $30,515,611) | | | 32,007,388 | | | |
| U.S. Treasury Obligations — 22.1% | | | | | | |
| U.S. Treasury Notes — 22.1% | | | | | | |
| | 2,000,000 | | | 4.250%, 11/15/14 | | | 2,148,516 | | | |
| | 3,000,000 | | | 2.125%, 11/30/14 | | | 3,106,407 | | | |
| | 1,500,000 | | | 0.250%, 2/15/15 | | | 1,499,297 | | | |
| | 2,000,000 | | | 4.500%, 2/15/16 | | | 2,254,218 | | | |
| | 2,000,000 | | | 5.125%, 5/15/16 | | | 2,312,500 | | | |
| | 2,000,000 | | | 1.000%, 8/31/16 | | | 2,038,124 | | | |
| | 3,000,000 | | | 1.375%, 11/30/18 | | | 3,079,686 | | | |
| | 2,000,000 | | | 1.250%, 1/31/19 | | | 2,036,250 | | | |
| | 2,000,000 | | | 2.625%, 11/15/20 | | | 2,195,000 | | | |
| | 2,000,000 | | | 2.125%, 8/15/21 | | | 2,102,500 | | | |
| | 2,000,000 | | | 2.000%, 11/15/21 | | | 2,075,782 | | | |
| | 2,000,000 | | | 1.625%, 11/15/22 | | | 1,978,124 | | | |
| Total U.S. Treasury Obligations
(Cost $25,415,381) | | | 26,826,404 | | | |
| | | | | | | | | | |
Principal
Amount
or Shares | | | | | Value | | | |
| | | | | | | | | | |
| Collateralized Mortgage Obligations — 2.7% | | | | | | |
| Federal Home Loan Bank — 0.9% | | | | | | |
| $ | 1,000,000 | | | Series Z2-2013, 4.375%, 2/13/15 | | $ | 1,080,011 | | | |
| Federal Home Loan Mortgage
Corporation — 0.7% | | | | | | |
| | 143,184 | | | Series 2555, 4.250%, 1/15/18 | | | 150,055 | | | |
| | 54,299 | | | Series 2571, 5.500%, 7/15/21 | | | 54,284 | | | |
| | 556,381 | | | Series 2802, 5.500%, 11/15/31 | | | 559,427 | | | |
| | 122,404 | | | Series 2976, 4.500%, 1/15/33 | | | 124,624 | | | |
| | | | | 888,390 | | | |
| Federal National Mortgage Association — 0.1% | | | | | | |
| | 70,349 | | | Series 2003-11, 5.500%, 8/25/32 | | | 71,737 | | | |
| | 66,981 | | | Series 2003-16, 4.000%, 2/25/33 | | | 70,910 | | | |
| | | | | 142,647 | | | |
| Government National Mortgage
Association — 1.0% | | | | | | |
| | 904,017 | | | Series 2003-100, 5.500%, 1/20/23 | | | 926,907 | | | |
| | 227,602 | | | Series 2005-55, 5.000%, 5/20/32 | | | 229,329 | | | |
| | | | | 1,156,236 | | | |
| Total Collateralized Mortgage Obligations
(Cost $3,138,576) | | | 3,267,284 | | | |
| Cash Equivalents — 2.2% | | | | | | |
| | 2,607,089 | | | Huntington U.S. Treasury Money Market Fund, Trust Shares
0.050% (b) (c) | | | 2,607,089 | | | |
| Total Cash Equivalents (Cost $2,607,089) | | | 2,607,089 | | | |
| Total Investments
(Cost $113,099,665) — 99.7% | | | 121,134,532 | | | |
| Other Assets in Excess of Liabilities — 0.3% | | | 384,132 | | | |
| Net Assets — 100.0% | | $ | 121,518,664 | | | |
| (a) | Variable or Floating Rate Security. Rate disclosed is as of December 31, 2012. |
| (b) | Investment in affiliate. |
| (c) | Rate disclosed is the seven day yield as of December 31, 2012. |
(See notes which are an integral part of the Financial Statements)
Annual Shareholder Report
81
| | |
| | |
| Huntington Mortgage Securities Fund | | December 31, 2012 |
| | |
| Portfolio of Investments Summary Table | | (unaudited) |
| | | | |
| Asset Allocation | | Percentage of
Market Value | |
U.S. Government Mortgage Backed Securities | | | 77.8% | |
Real Estate Investment Trusts | | | 11.5% | |
Cash1 | | | 5.0% | |
U.S. Government Agencies | | | 3.2% | |
Collateralized Mortgage Obligations | | | 1.6% | |
Short-Term Securities Held as Collateral for Securities Lending | | | 0.9% | |
Total | | | 100.0% | |
| 1 | Investments in an affiliated money market fund. |
Portfolio holdings and allocations are subject to change. As of December 31, 2012, percentages in the table above are based on total investments. Such total investments may differ from the percentages set forth below in the Portfolio of Investments which are computed using the Fund’s total net assets.
Portfolio of Investments
| | | | | | | | | | |
Principal
Amount | | | | | Value | | | |
| | | | | | | | | | |
| U.S. Government Mortgage Backed
Agencies — 78.3% | | | | | | |
| Federal Home Loan Mortgage
Corporation — 17.4% | | | | | | |
| $ | 122,738 | | | Pool # J03237, 5.500%, 8/1/16 | | $ | 131,179 | | | |
| | 287,243 | | | Pool # B10827, 4.500%, 11/1/18 | | | 306,257 | | | |
| | 228,932 | | | Pool # J10396, 4.000%, 7/1/19 | | | 244,140 | | | |
| | 135,157 | | | Pool # G12297, 6.000%, 7/1/21 | | | 148,613 | | | |
| | 805,107 | | | Pool # J18448, 3.000%, 4/1/22 | | | 848,146 | | | |
| | 430,557 | | | Pool # G12867, 4.500%, 8/1/22 | | | 459,730 | | | |
| | 224,562 | | | Pool # C90779, 5.000%, 1/1/24 | | | 241,712 | | | |
| | 229,312 | | | Pool # C90859, 5.500%, 10/1/24 | | | 250,229 | | | |
| | 231,913 | | | Pool # C90999, 5.500%, 11/1/26 | | | 251,908 | | | |
| | 242,852 | | | Pool # C91167, 5.000%, 4/1/28 | | | 261,583 | | | |
| | 329,286 | | | Pool # C91175, 5.000%, 5/1/28 | | | 354,684 | | | |
| | 1,583,775 | | | Pool # C91296, 5.000%, 4/1/30 | | | 1,704,733 | | | |
| | 1,910,542 | | | Pool # C91441, 3.000%, 4/1/32 | | | 2,007,354 | | | |
| | 1,912,652 | | | Pool # C91451, 3.000%, 5/1/32 | | | 2,009,571 | | | |
| | 205,344 | | | Pool # A15284, 5.500%, 10/1/33 | | | 223,465 | | | |
| | 295,196 | | | Pool # G08005, 5.500%, 8/1/34 | | | 320,877 | | | |
| | 225,236 | | | Pool # 1G0865, 2.825%, 7/1/35 (a) | | | 240,104 | | | |
| | 240,037 | | | Pool # A55565, 6.000%, 12/1/36 | | | 261,633 | | | |
| | 180,794 | | | Pool # G08168, 6.000%, 12/1/36 | | | 197,059 | | | |
| | 254,693 | | | Pool # G03498, 5.500%, 11/1/37 | | | 275,179 | | | |
| | 928,158 | | | Pool # A93936, 4.500%, 9/1/40 | | | 999,770 | | | |
| | 637,958 | | | Pool # A94008, 4.000%, 9/1/40 | | | 681,854 | | | |
| | 1,167,745 | | | Pool # G06784, 3.500%, 10/1/41 | | | 1,243,104 | | | |
| | | | | | | | 13,662,884 | | | |
| Federal National Mortgage Association — 54.1% | | | | | | |
| | 165,212 | | | Pool # 684488, 5.000%, 12/1/17 | | | 177,176 | | | |
| | 266,294 | | | Pool # 693256, 5.000%, 4/1/18 | | | 286,438 | | | |
| | 153,694 | | | Pool # 254720, 4.500%, 5/1/18 | | | 165,801 | | | |
| | 179,329 | | | Pool # 786729, 5.500%, 8/1/19 | | | 194,310 | | | |
| | 1,460,442 | | | Pool # MA0504, 3.500%, 8/1/20 | | | 1,550,153 | | | |
| | 1,302,185 | | | Pool # MA0654, 3.500%, 2/1/21 | | | 1,382,175 | | | |
| | 124,906 | | | Pool # 896597, 5.000%, 8/1/21 | | | 135,759 | | | |
| | 194,423 | | | Pool # 254831, 5.000%, 8/1/23 | | | 210,810 | | | |
| | | | | | | | | | |
Principal
Amount | | | | | Value | | | |
| | | | | | | | | | |
| U.S. Government Mortgage Backed
Agencies — (Continued) | | | | | | |
| Federal National Mortgage
Association — (Continued) | | | | | | |
| $ | 402,277 | | | Pool # 254908, 5.000%, 9/1/23 | | $ | 436,183 | | | |
| | 384,678 | | | Pool # 254911, 5.000%, 10/1/23 | | | 422,833 | | | |
| | 175,140 | | | Pool # 255320, 5.000%, 7/1/24 | | | 192,511 | | | |
| | 1,147,788 | | | Pool # 932438, 4.000%, 1/1/25 | | | 1,230,130 | | | |
| | 602,632 | | | Pool # 255711, 5.500%, 4/1/25 | | | 660,239 | | | |
| | 138,775 | | | Pool # 357771, 5.000%, 5/1/25 | | | 152,193 | | | |
| | 213,280 | | | Pool # 255834, 4.500%, 6/1/25 | | | 233,929 | | | |
| | 432,074 | | | Pool # 255984, 4.500%, 11/1/25 | | | 473,905 | | | |
| | 466,871 | | | Pool # 256116, 6.000%, 2/1/26 | | | 511,281 | | | |
| | 636,089 | | | Pool # 257163, 5.000%, 4/1/28 | | | 689,639 | | | |
| | 376,380 | | | Pool # 257238, 5.000%, 6/1/28 | | | 408,066 | | | |
| | 297,941 | | | Pool # 257281, 5.000%, 7/1/28 | | | 323,024 | | | |
| | 294,310 | | | Pool # 257536, 5.000%, 1/1/29 | | | 319,086 | | | |
| | 577,272 | | | Pool # MA0096, 4.500%, 6/1/29 | | | 625,584 | | | |
| | 805,991 | | | Pool # MA0115, 4.500%, 7/1/29 | | | 873,444 | | | |
| | 925,044 | | | Pool # MA0171, 4.500%, 9/1/29 | | | 1,002,461 | | | |
| | 567,786 | | | Pool # MA0563, 4.000%, 11/1/30 | | | 611,397 | | | |
| | 1,439,031 | | | Pool # MA0641, 4.000%, 2/1/31 | | | 1,549,561 | | | |
| | 1,110,027 | | | Pool # MA0667, 4.000%, 3/1/31 | | | 1,195,286 | | | |
| | 1,857,121 | | | Pool # MA0706, 4.500%, 4/1/31 | | | 2,019,507 | | | |
| | 3,301,912 | | | Pool # MA0776, 4.500%, 6/1/31 | | | 3,590,630 | | | |
| | 705,342 | | | Pool # MA0804, 4.000%, 7/1/31 | | | 759,519 | | | |
| | 1,697,334 | | | Pool # MA0976, 3.500%, 2/1/32 | | | 1,815,290 | | | |
| | 2,363,315 | | | Pool # MA1084, 3.500%, 6/1/32 | | | 2,527,552 | | | |
| | 434,666 | | | Pool # 729535, 5.500%, 7/1/33 | | | 477,778 | | | |
| | 291,279 | | | Pool # 786457, 5.355%, 7/1/34 (a) | | | 313,516 | | | |
| | 384,004 | | | Pool # 783793, 6.000%, 7/1/34 | | | 432,712 | | | |
| | 275,637 | | | Pool # 806715, 5.500%, 1/1/35 | | | 301,598 | | | |
| | 189,626 | | | Pool # 814261, 6.000%, 1/1/35 | | | 210,893 | | | |
| | 405,899 | | | Pool # 735224, 5.500%, 2/1/35 | | | 446,158 | | | |
| | 200,374 | | | Pool # 845573, 3.406%, 2/1/36 (a) | | | 215,610 | | | |
| | 228,815 | | | Pool # 745511, 5.000%, 4/1/36 | | | 247,899 | | | |
| | 392,764 | | | Pool # 745418, 5.500%, 4/1/36 | | | 429,266 | | | |
(See notes which are an integral part of the Financial Statements)
Annual Shareholder Report
82
| | |
| Huntington Mortgage Securities Fund | | (Continued) |
| | | | | | | | | | |
Principal
Amount
or shares | | | | | Value | | | |
| | | | | | | | | | |
| U.S. Government Mortgage Backed
Agencies — (Continued) | | | | | | |
| Federal National Mortgage
Association — (Continued) | | | | | | |
| $ | 147,857 | | | Pool # 888029, 6.000%, 12/1/36 | | $ | 161,899 | | | |
| | 161,168 | | | Pool # 907484, 6.000%, 1/1/37 | | | 176,474 | | | |
| | 714,366 | | | Pool # AD7906, 5.000%, 7/1/40 | | | 795,825 | | | |
| | 1,399,066 | | | Pool # AD7724, 5.000%, 7/1/40 | | | 1,519,252 | | | |
| | 2,825,046 | | | Pool # AE4310, 4.000%, 9/1/40 | | | 3,032,323 | | | |
| | 1,197,557 | | | Pool # AE0395, 4.500%, 10/1/40 | | | 1,303,379 | | | |
| | 1,120,575 | | | Pool # AE4628, 4.500%, 10/1/40 | | | 1,214,706 | | | |
| | 1,146,048 | | | Pool # AH6655, 4.000%, 2/1/41 | | | 1,230,135 | | | |
| | 1,421,445 | | | Pool # AJ5469, 3.500%, 11/1/41 | | | 1,517,118 | | | |
| | 1,658,542 | | | Pool # AB4106, 3.500%, 12/1/41 | | | 1,770,173 | | | |
| | | | | 42,522,586 | | | |
| Government National Mortgage
Association — 6.8% | | | | | | |
| | 210,817 | | | Pool # 683915, 5.000%, 1/15/23 | | | 229,080 | | | |
| | 344,122 | | | Pool # 691761, 5.000%, 7/15/23 | | | 375,964 | | | |
| | 1,719,450 | | | Pool # 741854, 4.000%, 5/15/25 | | | 1,854,624 | | | |
| | 712,282 | | | Pool # 4886, 4.500%, 12/20/25 | | | 776,514 | | | |
| | 734,309 | | | Pool # 3637, 5.500%, 11/20/34 | | | 816,875 | | | |
| | 422,285 | | | Pool # 676974, 5.500%, 5/15/38 | | | 463,476 | | | |
| | 743,464 | | | Pool # 733602, 5.000%, 4/15/40 | | | 843,784 | | | |
| | | | | 5,360,317 | | | |
| Total U.S. Government Mortgage Backed Agencies
(Cost $58,971,872) | | | 61,545,787 | | | |
| Common Stocks — 11.6% | | | | | | |
| Real Estate Investment Trusts — 11.6% | | | | | | |
| | 7,274 | | | Acadia Realty Trust | | | 182,432 | | | |
| | 5,900 | | | Alexandria Real Estate Equities, Inc. | | | 408,988 | | | |
| | 9,900 | | | American Campus Communities, Inc. | | | 456,687 | | | |
| | 800 | | | Associated Estates Realty Corp. | | | 12,896 | | | |
| | 1,800 | | | BioMed Realty Trust, Inc. | | | 34,794 | | | |
| | 4,100 | | | Boston Properties, Inc. | | | 433,821 | | | |
| | 300 | | | Brandywine Realty Trust | | | 3,657 | | | |
| | 800 | | | Brookfield Office Properties, Inc. | | | 13,608 | | | |
| | 900 | | | Camden Property Trust | | | 61,389 | | | |
| | 1,800 | | | Colonial Properties Trust | | | 38,466 | | | |
| | 900 | | | Coresite Realty Corp. | | | 24,894 | | | |
| | 900 | | | CubeSmart | | | 13,113 | | | |
| | 900 | | | DDR Corp. | | | 14,094 | | | |
| | 800 | | | DiamondRock Hospitality Co. | | | 7,200 | | | |
| | 5,700 | | | Digital Realty Trust, Inc. (b) | | | 386,973 | | | |
| | 12,600 | | | Douglas Emmett, Inc. | | | 293,580 | | | |
| | 15,300 | | | Duke Realty Corp. | | | 212,211 | | | |
| | 4,500 | | | DuPont Fabros Technology, Inc. | | | 108,720 | | | |
| | 8,100 | | | EastGroup Properties, Inc. | | | 435,861 | | | |
| | 5,900 | | | Equity Lifestyle Properties, Inc. | | | 397,011 | | | |
| | 5,400 | | | Equity Residential | | | 306,018 | | | |
| | 3,200 | | | Essex Property Trust, Inc. | | | 469,280 | | | |
| | 800 | | | Excel Trust, Inc. | | | 10,136 | | | |
| | 900 | | | Extra Space Storage, Inc. | | | 32,751 | | | |
| | 1,400 | | | Federal Realty Investment Trust | | | 145,628 | | | |
| | | | | | | | | | |
Principal
Amount
or shares | | | | | Value | | | |
| | | | | | | | | | |
| Common Stocks — (Continued) | | | | | | |
| Real Estate Investment Trusts — (Continued) | | | | | | |
| | 5,400 | | | HCP, Inc. | | $ | 243,972 | | | |
| | 1,300 | | | Health Care REIT, Inc. | | | 79,677 | | | |
| | 3,100 | | | Healthcare Realty Trust, Inc. | | | 74,431 | | | |
| | 7,200 | | | Home Properties, Inc. | | | 441,432 | | | |
| | 10,416 | | | Host Hotels & Resorts, Inc. | | | 163,219 | | | |
| | 7,800 | | | Kimco Realty Corp. | | | 150,696 | | | |
| | 4,500 | | | Kite Realty Group Trust | | | 25,155 | | | |
| | 8,000 | | | LaSalle Hotel Properties | | | 203,120 | | | |
| | 6,215 | | | Macerich Co./The | | | 362,335 | | | |
| | 8,600 | | | National Retail Properties, Inc. (b) | | | 268,320 | | | |
| | 2,300 | | | Pennsylvania Real Estate Investment Trust (b) | | | 40,572 | | | |
| | 1,800 | | | Post Properties, Inc. | | | 89,910 | | | |
| | 3,243 | | | ProLogis, Inc. | | | 118,337 | | | |
| | 1,800 | | | Public Storage, Inc. | | | 260,928 | | | |
| | 3,200 | | | Regency Centers Corp. | | | 150,784 | | | |
| | 2,700 | | | Retail Properties of America, Inc. | | | 32,319 | | | |
| | 800 | | | Sabra Health Care REIT, Inc. | | | 17,376 | | | |
| | 4,100 | | | Simon Property Group, Inc. | | | 648,169 | | | |
| | 203 | | | SL Green Realty Corp. | | | 15,560 | | | |
| | 900 | | | Sovran Self Storage, Inc. | | | 55,890 | | | |
| | 9,000 | | | Tanger Factory Outlet Centers, Inc. | | | 307,800 | | | |
| | 5,676 | | | UDR, Inc. | | | 134,975 | | | |
| | 6,200 | | | Ventas, Inc. | | | 401,264 | | | |
| | 1,336 | | | Vornado Realty Trust | | | 106,987 | | | |
| | 600 | | | Washington Real Estate Investment Trust | | | 15,690 | | | |
| | 6,800 | | | Weingarten Realty Investors | | | 182,036 | | | |
| | 1,800 | | | Westfield Group | | | 19,764 | | | |
| | 1,800 | | | Westfield Retail Trust | | | 5,652 | | | |
| Total Common Stocks (Cost $5,364,994) | | | 9,120,578 | | | |
| U.S. Government Agencies — 3.2% | | | | | | |
| Federal Farm Credit Bank — 3.2% | | | | | | |
| $ | 2,500,000 | | | 1.950%, 7/19/22 | | | 2,511,912 | | | |
| Total U.S. Government Agencies (Cost $2,512,167) | | | 2,511,912 | | | |
| Collateralized Mortgage Obligations — 1.7% | | | | | | |
| Federal Home Loan Bank — 0.3% | | | | | | |
| | 186,575 | | | Series Z2-2013, 4.800%, 2/25/13 | | | 187,583 | | | |
| Federal Home Loan Mortgage Corporation — 1.1% | | | | | | |
| | 218,650 | | | Series 3322, 5.250%, 4/15/17 | | | 227,363 | | | |
| | 240,044 | | | Series 2497, 5.000%, 9/15/17 | | | 256,147 | | | |
| | 120,996 | | | Series 2770, 4.000%, 1/15/18 | | | 122,478 | | | |
| | 145,758 | | | Series 2672, 5.500%, 8/15/31 | | | 146,599 | | | |
| | 122,404 | | | Series 2976, 4.500%, 1/15/33 | | | 124,688 | | | |
| | | | | 877,275 | | | |
| Federal National Mortgage Association — 0.3% | | | | | | |
| | 218,937 | | | Series 1999-13, 6.000%, 4/25/29 | | | 247,473 | | | |
| Total Collateralized Mortgage Obligations
(Cost $1,254,800) | | | 1,312,331 | | | |
(See notes which are an integral part of the Financial Statements)
Annual Shareholder Report
83
| | |
| Huntington Mortgage Securities Fund | | (Continued) |
| | | | | | | | | | |
| Shares | | | | | Value | | | |
| | | | | | | | | | |
| Cash Equivalents — 5.0% | | | | | | |
| | 3,940,040 | | | Huntington U.S. Treasury Money Market Fund, Trust Shares 0.050% (c) (d) | | $ | 3,940,040 | | | |
| Total Cash Equivalents (Cost $3,940,040) | | | 3,940,040 | | | |
| Short-Term Securities Held as Collateral for
Securities Lending — 0.9% | | | | | | |
| | 705,024 | | | Fidelity Institutional Money Market Portfolio, Institutional Class, 0.180% (d) | | | 705,024 | | | |
| Total Short-Term Securities Held
as Collateral for
Securities Lending (Cost $705,024) | | | 705,024 | | | |
| Total Investments
(Cost $72,748,897) — 100.7% | | | 79,135,672 | | | |
| Liabilities in Excess of Other Assets — (0.7)% | | | (516,773) | | | |
| Net Assets — 100.0% | | $ | 78,618,899 | | | |
| (a) | Variable or Floating Rate Security. Rate disclosed is as of December 31, 2012. |
| (b) | All or a portion of the security was on loan as of December 31, 2012. The total value of securities on loan as of December 31, 2012 was $692,745. |
| (c) | Investment in affiliate. |
| (d) | Rate disclosed is the seven day yield as of December 31, 2012. |
(See notes which are an integral part of the Financial Statements)
Annual Shareholder Report
84
| | |
| | |
| Huntington Ohio Tax-Free Fund | | December 31, 2012 |
| | |
| Portfolio of Investments Summary Table | | (unaudited) |
| | | | |
| Asset Allocation | | Percentage of
Market Value | |
School Districts | | | 37.9% | |
General Obligation | | | 31.6% | |
Higher Education | | | 13.8% | |
Water | | | 9.5% | |
Airport | | | 2.5% | |
Facilities | | | 2.0% | |
Single Family Housing | | | 1.9% | |
Transportation | | | 0.5% | |
Cash | | | 0.3% | |
Total | | | 100.0% | |
Portfolio holdings and allocations are subject to change. As of December 31, 2012, percentages in the table above are based on total investments. Such total investments may differ from the percentages set forth below in the Portfolio of Investments which are computed using the Fund’s total net assets.
Portfolio of Investments
| | | | | | | | | | |
Principal
Amount | | | | | Value | | | |
| | | | | | | | | | |
| Municipal Bonds — 99.8% | | | | | | |
| Ohio — 99.8% | | | | | | |
| $ | 405,000 | | | Akron, OH, Various Purposes, G.O.,
5.000%, 12/1/26 | | $ | 460,104 | | | |
| | 500,000 | | | Akron, OH, Income Tax Revenue, Series A, 5.000%, 12/1/23 | | | 607,480 | | | |
| | 225,000 | | | Akron, OH, G.O., (AMBAC Ins.),
5.000%, 12/1/24 | | | 249,500 | | | |
| | 100,000 | | | Akron, OH, Various Purposes, G.O., (AGM Ins.), 5.000%, 12/1/20 | | | 116,295 | | | |
| | 100,000 | | | Ashland, OH, Various Purposes, G.O., (National Reinsurance), 4.500%, 12/1/22 | | | 102,019 | | | |
| | 150,000 | | | Barberton, OH, City School District, G.O., (Student Credit Program),
5.000%, 12/1/22 | | | 173,040 | | | |
| | 300,000 | | | Bath, OH, Local School District, G.O., (AGM Ins.), 0.000%, 12/1/18 (a) | | | 263,004 | | | |
| | 335,000 | | | Big Walnut, OH, Local School District, G.O., 0.000%, 12/1/18 (a) | | | 303,825 | | | |
| | 320,000 | | | Bowling Green, OH, City School District, G.O., (AGM Ins.), 5.000%, 12/1/24 | | | 368,339 | | | |
| | 300,000 | | | Bowling Green, OH, City School District, School Facilities Construction and Improvement, G.O., (AGM Ins.), 5.000%, 12/1/23 | | | 345,732 | | | |
| | 560,000 | | | Brookfield, OH, Local School District, School Facilities Improvement, G.O., (AGM Ins. ), 5.000%, 1/15/22 | | | 630,582 | | | |
| | 400,000 | | | Butler County, OH, G.O., (AMBAC Ins.),
4.750%, 12/1/24 | | | 427,180 | | | |
| | 170,000 | | | Butler County, OH, G.O., (AMBAC Ins.),
4.750%, 12/1/20 | | | 181,852 | | | |
| | | | | | | | | | |
Principal
Amount | | | | | Value | | | |
| | | | | | | | | | |
| Municipal Bonds — (Continued) | | | | | | |
| Ohio — (Continued) | | | | | | |
| $ | 500,000 | | | Centerville, OH, G.O., (National Reinsurance), 5.000%, 12/1/20 | | $ | 516,925 | | | |
| | 500,000 | | | Cincinnati, OH, Water System Revenue, Series A, 5.000%, 12/1/22 | | | 624,610 | | | |
| | 300,000 | | | Cincinnati, OH, Various Purposes, G.O., Series C, 5.000%, 12/1/19 | | | 349,788 | | | |
| | 200,000 | | | Clark County, OH, Various Purposes, G.O., (XLCA Ins.), 5.000%, 12/1/18 | | | 237,590 | | | |
| | 500,000 | | | Cleveland, OH, Waterworks Revenue, Series P, 5.000%, 1/1/22 | | | 582,030 | | | |
| | 245,000 | | | Cleveland, OH, Waterworks Revenue, Series P, 5.000%, 1/1/26 | | | 283,154 | | | |
| | 250,000 | | | Cleveland, OH, Capital Improvement, Capital Improvement, G.O., Series A, (AGM Ins.), 5.000%, 12/1/21 | | | 294,800 | | | |
| | 500,000 | | | Cleveland, OH, Airport System Revenue, Series C, (AGM Ins.), 5.000%, 1/1/18 | | | 564,860 | | | |
| | 365,000 | | | Cleveland, OH, Airport System Revenue, Series C, (Assured Guaranty),
5.000%, 1/1/23 | | | 404,340 | | | |
| | 200,000 | | | Cleveland, OH, Public Facilities Improvement Revenue, 4.000%, 10/1/22 | | | 219,072 | | | |
| | 100,000 | | | Clyde-Green Springs, OH, Exempted School District, G.O., (AGM Ins., Student Credit Program),
4.375%, 12/1/25 | | | 107,904 | | | |
| | 150,000 | | | Clyde-Green Springs, OH, Exempted Village School District, School Facilities Construction and Improvement, G.O., (AGM Ins., Student Credit Program),
5.000%, 12/1/19 | | | 172,874 | | | |
(See notes which are an integral part of the Financial Statements)
Annual Shareholder Report
85
| | |
| Huntington Ohio Tax-Free Fund | | (Continued) |
| | | | | | | | | | |
Principal
Amount | | | | | Value | | | |
| | | | | | | | | | |
| Municipal Bonds — (Continued) | | | | | | |
| Ohio — (Continued) | | | | | | |
| $ | 410,000 | | | Coldwater, OH, Exempted Village School District, School Facilities Construction and Improvement, G.O., (Student Credit Program),
0.000%, 12/1/17 (a) | | $ | 371,485 | | | |
| | 100,000 | | | Columbus, OH, Regional Airport Authority Revenue, (AGM National Reinsurance), 5.000%, 1/1/21 | | | 111,944 | | | |
| | 505,000 | | | Columbus, OH, Various Purposes, G.O.,
5.000%, 7/1/23 | | | 636,376 | | | |
| | 250,000 | | | Columbus, OH, Regional Airport Authority Revenue, (MBIA Ins.),
5.000%, 1/1/20 | | | 281,297 | | | |
| | 55,000 | | | Columbus, OH , Sewer Revenue, Series A, 5.000%, 6/1/24 | | | 64,217 | | | |
| | 220,000 | | | Cuyahoga Community College District, General Receipts Revenue, Series D,
5.000%, 8/1/26 | | | 262,233 | | | |
| | 200,000 | | | Cuyahoga County, OH, Various Purposes, G.O., Series A,
5.000%, 12/1/21 | | | 242,990 | | | |
| | 220,000 | | | Dalton Local School District, School Improvement, G.O., (Student Credit Program), 5.000%, 8/1/24 | | | 259,734 | | | |
| | 490,000 | | | Dalton Local School District, School Improvement, G.O., (Student Credit Program), 5.000%, 8/1/25 | | | 575,897 | | | |
| | 360,000 | | | Fairfield Union, OH, Local School District, G.O., Series A, (AGM Ins.),
4.250%, 12/1/18 | | | 397,008 | | | |
| | 155,000 | | | Forest Hills, OH, Local School District, G.O., (AGM Ins.), 4.750%, 12/1/16 | | | 159,583 | | | |
| | 35,000 | | | Gallia, OH, Local School District, G.O., (AGM Ins.), 4.500%, 12/1/20 | | | 37,820 | | | |
| | 150,000 | | | Garfield Heights, OH , City School District, School Improvement, G.O., (Student Credit Program),
0.000%, 12/15/18 (a) | | | 132,320 | | | |
| | 500,000 | | | Geneva, OH, City School District, School Improvement, G.O., (Student Credit Program), 4.500%, 12/1/25 | | | 554,700 | | | |
| | 450,000 | | | Greene County, OH, Sewer Systems Revenue, (AMBAC Ins.),
5.000%, 12/1/18 | | | 503,671 | | | |
| | 275,000 | | | Greene County, OH, Water & Sewer Revenue, (AGM Ins.),
5.000%, 12/1/21 | | | 295,848 | | | |
| | 500,000 | | | Grove City, OH, South-Western City School District, School Facilities Construction and Improvement, G.O., (AGM Ins.), 4.750%, 12/1/22 | | | 564,705 | | | |
| | 1,000,000 | | | Grove City, OH, South-Western City School District, School Facilities Construction and Improvement, G.O., (Student Credit Program), 4.250%, 12/1/28 | | | 1,129,780 | | | |
| | | | | | | | | | |
Principal
Amount | | | | | Value | | | |
| | | | | | | | | | |
| Municipal Bonds — (Continued) | | | | | | |
| Ohio — (Continued) | | | | | | |
| $ | 170,000 | | | Hamilton County, OH, Stratford Heights Project, Student Housing Revenue, (AGM Ins.), 5.000%, 6/1/18 | | $ | 193,863 | | | |
| | 200,000 | | | Hamilton County, OH, Sewer Systems Revenue, Series A, (MBIA Ins.),
5.000%, 12/1/20 | | | 230,338 | | | |
| | 280,000 | | | Hamilton, OH, Various Purposes, G.O., (Assured Guaranty), 5.000%, 11/1/21 | | | 321,012 | | | |
| | 100,000 | | | Hamilton, OH, City School District, School Improvement, G.O., (AGM Ins.), 5.000%, 12/1/21 | | | 115,152 | | | |
| | 100,000 | | | Hilliard, OH, School District, G.O., (National Reinsurance), 5.000%, 12/1/23 | | | 110,949 | | | |
| | 500,000 | | | Hilliard, OH, Various Purposes, G.O.,
5.000%, 12/1/24 | | | 608,605 | | | |
| | 50,000 | | | Huber Heights, OH, City School District, School Improvement, G.O.,
5.000%, 12/1/20 | | | 60,422 | | | |
| | 200,000 | | | Huber Heights, OH, City School District, School Improvement, G.O.,
4.750%, 12/1/24 | | | 229,614 | | | |
| | 75,000 | | | Independence, OH, Rockside Road Improvement, G.O., (AMBAC Ins.),
5.000%, 12/1/20 | | | 83,326 | | | |
| | 500,000 | | | Independence, OH, Local School District, G.O., 0.000%, 12/1/18 (a) | | | 440,910 | | | |
| | 160,000 | | | Jackson, OH, Local School District, Stark and Summit Counties, G.O., (AGM Ins.), 5.000%, 12/1/18 | | | 170,411 | | | |
| | 420,000 | | | Joseph Badger, OH, Local School District, Various Purposes, G.O., (Student Credit Program),
0.000%, 12/1/18 (a) | | | 371,234 | | | |
| | 615,000 | | | Kent State University, OH, General Receipts Revenue, Series B, (Assured Guaranty), 5.000%, 5/1/23 | | | 713,775 | | | |
| | 50,000 | | | Kettering, OH, City School District, School Improvement, G.O., (AGM Ins.), 4.750%, 12/1/19 | | | 57,645 | | | |
| | 400,000 | | | Kettering, OH, City School District, G.O., (AGM Ins.), 4.750%, 12/1/22 | | | 455,064 | | | |
| | 250,000 | | | Kings Mills, OH, Local School District, School Improvement, G.O., (National Reinsurance), 5.000%, 12/1/19 | | | 292,415 | | | |
| | 100,000 | | | Lake, OH, Local School District, Stark County School Improvement, G.O., (AGM Ins.), 5.000%, 12/1/18 | | | 108,669 | | | |
| | 150,000 | | | Lakota, OH, Local School District, G.O., 4.000%, 12/1/24 | | | 171,378 | | | |
| | 490,000 | | | Lancaster, OH, City School District, School Facilities Construction and Improvement, G.O., (Student Credit Program), 4.000%, 10/1/21 | | | 562,299 | | | |
(See notes which are an integral part of the Financial Statements)
Annual Shareholder Report
86
| | |
| Huntington Ohio Tax-Free Fund | | (Continued) |
| | | | | | | | | | |
Principal
Amount | | | | | Value | | | |
| | | | | | | | | | |
| Municipal Bonds — (Continued) | | | | | | |
| Ohio — (Continued) | | | | | | |
| $ | 430,000 | | | Lebanon, OH, City School District, G.O., (AGM Ins.), 5.000%, 12/1/23 | | $ | 492,776 | | | |
| | 500,000 | | | Lorain, OH, City School District, School Improvement, G.O., (Student Credit Program), 4.000%, 12/1/21 | | | 572,875 | | | |
| | 250,000 | | | Marysville, OH, Exempted Village School District, G.O., (AGM Ins.),
5.000%, 12/1/23 | | | 275,107 | | | |
| | 50,000 | | | Marysville, OH, Exempted Village School District, G.O., (AGM Ins.),
5.000%, 12/1/24 | | | 54,917 | | | |
| | 200,000 | | | Mason, OH, Sewer Systems, G.O.,
5.000%, 12/1/26 | | | 244,894 | | | |
| | 300,000 | | | Mason, OH, Sewer Systems, G.O.,
4.500%, 12/1/22 | | | 363,915 | | | |
| | 100,000 | | | Mechanicsburg, OH, Exempt Village School District, G.O., (Student Credit Program), 0.000%, 12/1/18 (a) | | | 88,544 | | | |
| | 125,000 | | | Medina County, OH, Library District, G.O., 0.000%, 12/1/19 (a) | | | 106,441 | | | |
| | 50,000 | | | Miami University, OH, General Receipts Revenue, (AMBAC Ins.),
5.000%, 9/1/23 | | | 56,854 | | | |
| | 225,000 | | | Miamisburg, OH, City School District, School Facilities Construction and Improvement, G.O., 5.000%, 12/1/26 | | | 262,161 | | | |
| | 500,000 | | | Middletown, OH, G.O., (AGM Ins.),
5.000%, 12/1/21 | | | 592,290 | | | |
| | 200,000 | | | Middletown, OH, School Improvement, G.O., (AGM Ins.), 4.375%, 12/1/20 | | | 220,478 | | | |
| | 300,000 | | | Milford, OH, Exempt Village School District, G.O., 4.625%, 12/1/21 | | | 341,163 | | | |
| | 540,000 | | | Montgomery County, OH, Refunding & Improvement, G.O., (National Reinsurance), 5.000%, 12/1/21 | | | 583,508 | | | |
| | 200,000 | | | Mount Healthy, OH, City School District, School Improvement, G.O., (AGM Ins.), 5.250%, 12/1/19 | | | 237,902 | | | |
| | 270,000 | | | Mount Healthy, OH, City School District, School Improvement, G.O., (AGM Ins.), 5.000%, 12/1/31 | | | 300,761 | | | |
| | 250,000 | | | Mount Healthy, OH, City School District, School Improvement, G.O., (AGM Ins.), 5.000%, 12/1/25 | | | 283,457 | | | |
| | 50,000 | | | Mount Vernon, OH, City School District, G.O., (AGM Ins.), 5.000%, 12/1/17 | | | 53,693 | | | |
| | 300,000 | | | New Albany, OH, Plain Local School District, Various Purposes, G.O., 0.000%, 12/1/20 (a) | | | 254,913 | | | |
| | 300,000 | | | New Albany, OH, Plain Local School District, Various Purposes, G.O.,
4.000%, 12/1/22 | | | 346,680 | | | |
| | 50,000 | | | Nordonia Hills, OH , City School District, School Improvement, G.O., (National Reinsurance, FGIC Ins.), 4.500%, 12/1/20 | | | 53,933 | | | |
| | | | | | | | | | |
Principal
Amount | | | | | Value | | | |
| | | | | | | | | | |
| Municipal Bonds — (Continued) | | | | | | |
| Ohio — (Continued) | | | | | | |
| $ | 205,000 | | | Northmont, OH, City School District, School Improvement, G.O., Series A, (Student Credit Program), 4.000%, 11/1/24 | | $ | 228,179 | | | |
| | 100,000 | | | Northwest, OH, Local School District, Stark, Summit & Wayne Counties, G.O., (Student Credit Program), 0.000%, 12/1/20 (a) | | | 82,612 | | | |
| | 300,000 | | | Northwest, OH, Local School District, Stark, Summit & Wayne Counties, G.O., (Student Credit Program),
0.000%, 12/1/19 (a) | | | 256,683 | | | |
| | 200,000 | | | Ohio Capital Asset Financing Program Fractionalized Interests, G.O., Series B, 5.000%, 12/1/22 | | | 227,536 | | | |
| | 165,000 | | | Ohio Higher Educational Facility Commission, Revenue, Denison University Project, 5.000%, 11/1/20 | | | 176,685 | | | |
| | 350,000 | | | Ohio Higher Educational Facility Commission, Revenue, University of Dayton Project, (AMBAC Ins.),
5.000%, 12/1/25 | | | 397,183 | | | |
| | 115,000 | | | Ohio Housing Finance Agency, Single-Family Mortgage Revenue, Series 1,
2.650%, 5/1/17 | | | 115,936 | | | |
| | 305,000 | | | Ohio Housing Finance Agency, Single-Family Mortgage Revenue, Series 1,
3.250%, 5/1/20 | | | 310,014 | | | |
| | 400,000 | | | Ohio Housing Finance Agency, Single-Family Mortgage Revenue, Series 3,
2.550%, 11/1/17 | | | 419,092 | | | |
| | 100,000 | | | Ohio State, Infrastructure Improvement, G.O., Series A, 5.000%, 3/1/20 | | | 114,151 | | | |
| | 250,000 | | | Ohio State, G.O., Series D,
5.000%, 9/15/21 | | | 283,587 | | | |
| | 130,000 | | | Ohio State, Infrastructure Improvement, G.O., Series A, 5.000%, 9/1/23 | | | 149,009 | | | |
| | 600,000 | | | Ohio State, School Improvement, G.O., Series B, 5.000%, 9/15/24 | | | 728,874 | | | |
| | 525,000 | | | Ohio State, Parks & Recreation Revenue, G.O., Series A, 5.250%, 9/1/22 | | | 648,102 | | | |
| | 175,000 | | | Ohio State, G.O., Series A, 5.000%, 9/1/20 | | | 207,105 | | | |
| | 655,000 | | | Ohio State, G.O., Series A, 5.375%, 9/1/23 | | | 792,105 | | | |
| | 500,000 | | | Ohio State, G.O., Series A, 5.000%, 9/15/19 | | | 546,675 | | | |
| | 75,000 | | | Ohio State, G.O., Series A, 5.000%, 9/15/17 | | | 82,123 | | | |
| | 750,000 | | | Ohio State, G.O., Series A,
4.500%, 9/15/23 | | | 802,995 | | | |
| | 725,000 | | | Ohio State, Revitalization Project Revenue, Series A, (AMBAC Ins.), 5.000%, 4/1/21 | | | 807,664 | | | |
(See notes which are an integral part of the Financial Statements)
Annual Shareholder Report
87
| | |
| Huntington Ohio Tax-Free Fund | | (Continued) |
| | | | | | | | | | |
Principal
Amount | | | | | Value | | | |
| | | | | | | | | | |
| Municipal Bonds — (Continued) | | | | | | |
| Ohio — (Continued) | | | | | | |
| $ | 350,000 | | | Ohio State, G.O., Series D, 5.000%, 9/15/20 | | $ | 399,413 | | | |
| | 1,100,000 | | | Ohio State, G.O., Series A, 4.500%, 9/15/24 | | | 1,176,483 | | | |
| | 100,000 | | | Ohio State, School Improvement, G.O., Series A, 4.500%, 9/15/25 | | | 106,840 | | | |
| | 400,000 | | | Ohio State Building Authority, Administration Building Fund Revenue, Series A, 5.000%, 10/1/23 | | | 462,952 | | | |
| | 100,000 | | | Ohio State Building Authority, Administration Building Fund Revenue, Series A, 4.000%, 10/1/20 | | | 111,803 | | | |
| | 150,000 | | | Ohio State Building Authority, State Facilities Arts Building, Fund Project Revenue, Series A, 5.000%, 4/1/16 | | | 151,550 | | | |
| | 135,000 | | | Ohio State Building Authority, Administration Building Fund Revenue, Series A, 5.000%, 10/1/22 | | | 158,823 | | | |
| | 100,000 | | | Ohio State Cultural and Sports Capital Facilities Revenue, Series A, (AGM Ins.), 5.000%, 4/1/17 | | | 109,218 | | | |
| | 300,000 | | | Ohio State Major New Street Infrastructure Project Revenue, Series 2008-1, 5.500%, 6/15/20 | | | 361,146 | | | |
| | 240,000 | | | Ohio State Turnpike Commission Revenue, Series A, 5.000%, 2/15/21 | | | 284,424 | | | |
| | 90,000 | | | Ohio State University/The, Revenue, Series A, 5.000%, 12/1/27 | | | 106,183 | | | |
| | 135,000 | | | Ohio State University/The, Revenue, Series A, 5.000%, 12/1/28 | | | 159,192 | | | |
| | 145,000 | | | Ohio State University/The, Revenue, Series D, 5.000%, 12/1/22 | | | 182,584 | | | |
| | 255,000 | | | Ohio State University/The, Revenue, Series A, 5.000%, 12/1/26 | | | 301,010 | | | |
| | 500,000 | | | Ohio State University/The, Revenue, Series A, 5.000%, 6/1/25 | | | 639,400 | | | |
| | 30,000 | | | Ohio State University/The, Revenue, Series A, 5.000%, 6/1/25 | | | 32,698 | | | |
| | 340,000 | | | Ohio State University/The, Revenue, Series A, 4.250%, 12/1/24 | | | 384,856 | | | |
| | 500,000 | | | Ohio State Water Development Authority, State of Ohio Pollution Control Revenue, 5.000%, 12/1/23 | | | 606,025 | | | |
| | 500,000 | | | Ohio State Water Development Authority, Drinking Water Assistance Fund, Revenue, 5.000%, 12/1/22 | | | 588,585 | | | |
| | 100,000 | | | Ohio University, General Receipts Revenue, Series B, 5.000%, 12/1/23 | | | 111,782 | | | |
| | 700,000 | | | Olentangy, OH, Local School District, G.O., Series A, (AGM Ins.), 5.000%, 12/1/22 | | | 799,813 | | | |
| | 300,000 | | | Olentangy, OH, Local School District, G.O., Series A, (AGM Ins.), 5.000%, 12/1/21 | | | 337,527 | | | |
| | | | | | | | | | |
Principal
Amount | | | | | Value | | | |
| | | | | | | | | | |
| Municipal Bonds — (Continued) | | | | | | |
| Ohio — (Continued) | | | | | | |
| $ | 500,000 | | | Olentangy, OH, Local School District, G.O., Series A, (AGM Ins.), 5.000%, 12/1/18 | | $ | 567,030 | | | |
| | 100,000 | | | Reynoldsburg, OH, City School District, School Facilities Construction and Improvement, G.O., (Student Credit Program), 5.000%, 12/1/20 | | | 118,515 | | | |
| | 470,000 | | | River Valley, OH, Local School District, G.O., (AGM Ins., Student Credit Program), 5.250%, 11/1/23 | | | 595,471 | | | |
| | 300,000 | | | Sheffield Lake, OH, City School District, School Improvement, G.O., 5.000%, 12/1/25 | | | 345,255 | | | |
| | 125,000 | | | Sidney, OH, City School District, G.O., (National Reinsurance, FGIC Ins.),
4.750%, 12/1/20 | | | 141,368 | | | |
| | 780,000 | | | Southwest Licking, OH, Local School District, G.O., (AMBAC Ins.),
5.000%, 12/1/19 | | | 833,446 | | | |
| | 595,000 | | | Springfield, OH, City School District, School Improvement, G.O., (AGM Ins., Student Credit Program),
5.000%, 12/1/19 | | | 690,718 | | | |
| | 125,000 | | | Springfield, OH, City School District, School Improvement, G.O., (AGM Ins., Student Credit Program),
5.000%, 12/1/21 | | | 143,650 | | | |
| | 605,000 | | | State of Ohio, G.O., 5.000%, 5/1/24 | | | 752,287 | | | |
| | 405,000 | | | State of Ohio, G.O., 5.000%, 5/1/28 | | | 492,120 | | | |
| | 235,000 | | | Swanton, OH, Local School District, School Improvement, G.O., (FGIC Ins.), 4.900%, 12/1/15 | | | 235,642 | | | |
| | 235,000 | | | Sylvania, OH, City School District, School Improvement, G.O., 5.000%, 12/1/18 | | | 274,774 | | | |
| | 300,000 | | | Toledo, OH, Waterworks Revenue, (MBIA-RE FGIC Ins.), 5.000%, 11/15/22 | | | 333,072 | | | |
| | 700,000 | | | Toledo, OH, Waterworks Revenue, (MBIA Ins.), 5.000%, 11/15/19 | | | 780,325 | | | |
| | 225,000 | | | Toledo, OH, Sewer System Revenue, (AMBAC Ins.), 5.000%, 11/15/18 | | | 232,760 | | | |
| | 400,000 | | | Trotwood, OH, Trotwood-Madison City School District, School Improvement, G.O., (AGM Ins.), 4.250%, 12/1/18 | | | 437,928 | | | |
| | 50,000 | | | Trumbull County, OH, Various Purposes, G.O., (AGM Ins.), 5.000%, 12/1/28 | | | 56,415 | | | |
| | 75,000 | | | Trumbull County, OH, Various Purposes, G.O., Series B, (AGM Ins.),
5.000%, 12/1/20 | | | 87,980 | | | |
| | 235,000 | | | Twinsburg, OH , Local School District Refunding, G.O., (FGIC Ins.),
5.000%, 12/1/18 | | | 253,375 | | | |
(See notes which are an integral part of the Financial Statements)
Annual Shareholder Report
88
| | |
| Huntington Ohio Tax-Free Fund | | (Continued) |
| | | | | | | | | | |
Principal
Amount | | | | | Value | | | |
| | | | | | | | | | |
| Municipal Bonds — (Continued) | | | | | | |
| Ohio — (Continued) | | | | | | |
| $ | 500,000 | | | University of Akron, OH, General Receipts Revenue, Series B, (AGM Ins.), 5.250%, 1/1/24 | | $ | 570,955 | | | |
| | 350,000 | | | University of Akron, OH, General Receipts Revenue, Series A, (AGM Ins.), 5.000%, 1/1/21 | | | 399,822 | | | |
| | 300,000 | | | University of Cincinnati, OH, General Receipts Revenue, Series A, (AMBAC Ins.), 5.000%, 6/1/19 | | | 346,290 | | | |
| | 500,000 | | | University of Cincinnati, OH, General Receipts Revenue, Series A, (MBIA Ins.), 5.000%, 6/1/22 | | | 570,245 | | | |
| | 105,000 | | | University of Cincinnati, OH, General Receipts Revenue, Series F, 5.000%, 6/1/21 | | | 128,881 | | | |
| | 500,000 | | | University of Cincinnati, OH, General Receipts Revenue, Series A, (AMBAC Ins.), 5.000%, 6/1/17 | | | 548,855 | | | |
| | 300,000 | | | University of Cincinnati, OH, General Receipts Revenue, Series A, (AMBAC Ins.), 5.000%, 6/1/19 | | | 328,257 | | | |
| | 500,000 | | | University of Cincinnati, OH, General Receipts Revenue, Series A, (AGM Ins.),
5.000%, 6/1/20 | | | 559,875 | | | |
| | 400,000 | | | University of Toledo, OH, General Receipts Revenue, Series A, (AMBAC Ins.), 5.000%, 6/1/19 | | | 453,272 | | | |
| | 650,000 | | | Washington Court House, OH, School Improvements, G.O., (National Reinsurance, FGIC Ins.), 5.000%, 12/1/19 | | | 701,369 | | | |
| | 100,000 | | | Westerville, OH, Various Purposes, G.O., (AMBAC Ins.), 5.000%, 12/1/24 | | | 115,936 | | | |
| | 125,000 | | | Westerville, OH, G.O., (AMBAC Ins.), 5.000%, 12/1/23 | | | 145,434 | | | |
| | 300,000 | | | Wyoming, OH, School District, Refunding School Improvement, G.O., (AGM Ins.), 5.000%, 12/1/20 | | | 329,769 | | | |
| | 125,000 | | | Youngstown, OH, School District, G.O.,
5.000%, 12/1/23 | | | 136,020 | | | |
| Total Municipal Bonds (Cost $51,698,449) | | | 53,908,578 | | | |
| | | | | | | | | | |
Shares | | | | | Value | | | |
| | | | | | | | | | |
| Cash Equivalents — 0.3% | | | | | | |
| | 165,638 | | | Fidelity Institutional Tax-Exempt Money Market Portfolio, Class I, 0.010% (b) | | $ | 165,638 | | | |
| Total Cash Equivalents (Cost $165,638) | | | 165,638 | | | |
| Total Investments
(Cost $51,864,087) — 100.1% | | | 54,074,216 | | | |
| Liabilities in Excess of Other Assets — (0.1)% | | | (41,808) | | | |
| Net Assets — 100.0% | | $ | 54,032,408 | | | |
| (a) | Zero coupon capital appreciation bond. |
| (b) | Rate disclosed is the seven day yield as of December 31, 2012. |
AGM — Assured Guaranty Municipal Corp.
AMBAC — American Municipal Bond Assurance Corp.
FGIC — Financial Guaranty Insurance Co.
G.O. — General Obligation
MBIA — Municipal Bond Insurance Association
XLCA — XL Capital Assurance, Inc.
(See notes which are an integral part of the Financial Statements)
Annual Shareholder Report
89
| | |
| | |
| Huntington Short/Intermediate Fixed Income Securities Fund | | December 31, 2012 |
| | |
| Portfolio of Investments Summary Table | | (unaudited) |
| | | | |
| Asset Allocation | | Percentage of
Market Value | |
Corporate Bonds | | | 73.8% | |
U.S. Government Agencies | | | 19.7% | |
U.S. Treasury Obligations | | | 5.4% | |
Cash1 | | | 1.1% | |
Total | | | 100.0% | |
| 1 | Investments in an affiliated money market fund. |
Portfolio holdings and allocations are subject to change. As of December 31, 2012, percentages in the table above are based on total investments. Such total investments may differ from the percentages set forth below in the Portfolio of Investments which are computed using the Fund’s total net assets.
Portfolio of Investments
| | | | | | | | | | |
Principal
Amount | | | | | Value | | | |
| | | | | | | | | | |
| Corporate Bonds — 73.4% | | | | | | |
| Consumer Discretionary — 5.2% | | | | | | |
| $ | 1,000,000 | | | Home Depot, Inc./The,
5.250%, 12/16/13 | | $ | 1,046,261 | | | |
| | 1,000,000 | | | Johnson Controls, Inc.,
4.875%, 9/15/13 | | | 1,029,229 | | | |
| | 1,000,000 | | | McDonald’s Corp., MTN,
4.300%, 3/1/13 | | | 1,006,285 | | | |
| | 2,000,000 | | | TCM Sub LLC,
3.550%, 1/15/15 (a) | | | 2,089,964 | | | |
| | 2,000,000 | | | Time Warner, Inc.,
3.150%, 7/15/15 | | | 2,114,990 | | | |
| | 1,000,000 | | | Walt Disney Co./The,
4.500%, 12/15/13 | | | 1,038,826 | | | |
| | 2,000,000 | | | Wyndham Worldwide Corp.,
2.950%, 3/1/17 | | | 2,045,134 | | | |
| | | | | | | | 10,370,689 | | | |
| Consumer Staples — 6.5% | | | | | | |
| | 2,000,000 | | | Anheuser-Busch InBev Worldwide, Inc., 1.375%, 7/15/17 | | | 2,021,060 | | | |
| | 2,000,000 | | | Coca-Cola Enterprises, Inc.,
1.125%, 11/12/13 | | | 2,008,956 | | | |
| | 1,000,000 | | | CVS Caremark Corp.,
4.875%, 9/15/14 | | | 1,074,297 | | | |
| | 1,585,000 | | | General Mills, Inc., 5.250%, 8/15/13 | | | 1,631,179 | | | |
| | 1,000,000 | | | H.J. Heinz Co., 5.350%, 7/15/13 | | | 1,025,486 | | | |
| | 2,000,000 | | | Kellogg Co., 1. 750%, 5/17/17 | | | 2,032,476 | | | |
| | 2,000,000 | | | Kroger Co./The, 2.200%, 1/15/17 | | | 2,066,830 | | | |
| | 1,000,000 | | | Sysco Corp., 4.200%, 2/12/13 | | | 1,003,949 | | | |
| | | | | | | | 12,864,233 | | | |
| Energy — 5.5% | | | | | | |
| | 1,000,000 | | | Apache Corp., 6.000%, 9/15/13 | | | 1,038,007 | | | |
| | 267,000 | | | ConocoPhillips, 4. 750%, 2/1/14 | | | 279,089 | | | |
| | 2,000,000 | | | Kinder Morgan Energy Partners LP,
5.125%, 11/15/14 | | | 2,154,068 | | | |
| | 1,000,000 | | | Noble Corp., 5.875%, 6/1/13 | | | 1,020,808 | | | |
| | 2,000,000 | | | Phillips 66, 2.950%, 5/1/17 (a) | | | 2,119,674 | | | |
| | | | | | | | | | |
Principal
Amount | | | | | Value | | | |
| | | | | | | | | | |
| Corporate Bonds — (Continued) | | | | | | |
| Energy — (Continued) | | | | | | |
| $ | 2,000,000 | | | Schlumberger Norge AS,
1.950%, 9/14/16 (a) | | $ | 2,052,902 | | | |
| | 2,250,000 | | | Spectra Energy Capital LLC,
5.900%, 9/15/13 | | | 2,328,484 | | | |
| | | | | | | | 10,993,032 | | | |
| Financials — 17.4% | | | | | | |
| | 2,000,000 | | | American Express Credit Co., MTN,
2.750%, 9/15/15 | | | 2,096,764 | | | |
| | 2,000,000 | | | Bank of America Corp., MTN,
1.733%, 1/30/14 (b) | | | 2,016,702 | | | |
| | 2,000,000 | | | Bank of Montreal, MTN,
2.500%, 1/11/17 | | | 2,096,474 | | | |
| | 2,000,000 | | | Bank of New York Mellon Corp./The, MTN, 2.400%, 1/17/17 | | | 2,095,204 | | | |
| | 2,000,000 | | | Bank of Nova Scotia,
1.375%, 12/18/17 | | | 2,002,770 | | | |
| | 1,000,000 | | | Boeing Capital Corp.,
3.250%, 10/27/14 | | | 1,049,274 | | | |
| | 1,500,000 | | | Citigroup, Inc., 6.010%, 1/15/15 | | | 1,639,072 | | | |
| | 2,000,000 | | | Fifth Third Bancorp, 3.625%, 1/25/16 | | | 2,136,850 | | | |
| | 2,500,000 | | | General Electric Capital Corp., GMTN,
1.600%, 11/20/17 | | | 2,501,622 | | | |
| | 1,500,000 | | | Goldman Sachs Group, Inc./The,
5.500%, 11/15/14 | | | 1,617,207 | | | |
| | 2,000,000 | | | HSBC Bank PLC, 3.500%, 6/28/15 (a) | | | 2,121,402 | | | |
| | 1,000,000 | | | KeyBank NA, 5.091%, 3/26/15 | | | 1,088,773 | | | |
| | 2,000,000 | | | Manulife Financial Corp.,
3.400%, 9/17/15 | | | 2,103,024 | | | |
| | 2,000,000 | | | MetLife Global Funding I,
3.125%, 1/11/16 (a) | | | 2,120,000 | | | |
| | 2,000,000 | | | Prudential Financial, Inc., MTN,
3.875%, 1/14/15 | | | 2,116,078 | | | |
| | 2,000,000 | | | Royal Bank of Canada,
1.450%, 10/30/14 | | | 2,034,434 | | | |
| | 2,000,000 | | | US Bancorp, MTN, 2.200%, 11/15/16 | | | 2,083,816 | | | |
| | 1,500,000 | | | Wells Fargo & Co., GMTN,
3.750%, 10/1/14 | | | 1,581,567 | | | |
| | | | | | | | 34,501,033 | | | |
(See notes which are an integral part of the Financial Statements)
Annual Shareholder Report
90
| | |
| Huntington Short/Intermediate Fixed Income Securities Fund | | (Continued) |
| | | | | | | | | | |
Principal
Amount | | | | | Value | | | |
| | | | | | | | | | |
| Corporate Bonds — (Continued) | | | | | | |
| Health Care — 11.8% | | | | | | |
| $ | 2,014,000 | | | Cardinal Health, Inc.,
4.000%, 6/15/15 | | $ | 2,164,385 | | | |
| | 2,232,000 | | | Celgene Corp., 2.450%, 10/15/15 | | | 2,316,164 | | | |
| | 2,000,000 | | | Covidien International Finance SA,
2.800%, 6/15/15 | | | 2,091,822 | | | |
| | 2,000,000 | | | Express Scripts Holding Co.,
2.650%, 2/15/17 (a) | | | 2,078,778 | | | |
| | 2,000,000 | | | Howard Hughes Medical Institute,
3.450%, 9/1/14 | | | 2,100,850 | | | |
| | 2,000,000 | | | Laboratory Corp. of America Holdings, 2.200%, 8/23/17 | | | 2,052,886 | | | |
| | 1,000,000 | | | Medco Health Solutions, Inc.,
6.125%, 3/15/13 | | | 1,011,301 | | | |
| | 1,000,000 | | | Medtronic, Inc., 2.625%, 3/15/16 | | | 1,053,766 | | | |
| | 2,000,000 | | | Quest Diagnostics Inc.,
3.200%, 4/1/16 | | | 2,109,462 | | | |
| | 1,200,000 | | | St. Jude Medical, Inc.,
3.750%, 7/15/14 | | | 1,256,644 | | | |
| | 2,000,000 | | | Thermo Fisher Scientific, Inc.,
2.250%, 8/15/16 | | | 2,070,782 | | | |
| | 2,000,000 | | | WellPoint, Inc., 5.250%, 1/15/16 | | | 2,228,770 | | | |
| | 1,000,000 | | | Zimmer Holdings, Inc.,
1.400%, 11/30/14 | | | 1,007,521 | | | |
| | | | | | | | 23,543,131 | | | |
| Industrials — 7.3% | | | | | | |
| | 1,000,000 | | | 3M Co., MTN, 4.375%, 8/15/13 | | | 1,025,583 | | | |
| | 2,000,000 | | | Caterpillar, Inc., 1.500%, 6/26/17 | | | 2,025,570 | | | |
| | 2,000,000 | | | Danaher Corp., 2.300%, 6/23/16 | | | 2,091,444 | | | |
| | 2,000,000 | | | Eaton Corp., 4.900%, 5/15/13 | | | 2,032,400 | | | |
| | 1,000,000 | | | Ecolab, Inc., 3.000%, 12/8/16 | | | 1,062,714 | | | |
| | 2,000,000 | | | Harsco Corp., 2.700%, 10/15/15 | | | 2,030,560 | | | |
| | 1,500,000 | | | JB Hunt Transport Services, Inc.,
3.375%, 9/15/15 | | | 1,541,906 | | | |
| | 1,500,000 | | | Northrop Grumman Corp.,
3.700%, 8/1/14 | | | 1,569,245 | | | |
| | 1,000,000 | | | Shell International Finance BV,
4.000%, 3/21/14 | | | 1,044,008 | | | |
| | | | | | | | 14,423,430 | | | |
| Information Technology — 5.4% | | | | | | |
| | 1,000,000 | | | Broadcom Corp., 2.375%, 11/1/15 | | | 1,042,486 | | | |
| | 1,000,000 | | | Dell, Inc., 4.700%, 4/15/13 | | | 1,011,721 | | | |
| | 1,000,000 | | | Dell, Inc., 2.300%, 9/10/15 | | | 1,027,616 | | | |
| | 1,500,000 | | | Hewlett-Packard Co.,
3.300%, 12/9/16 | | | 1,526,834 | | | |
| | 2,000,000 | | | Oracle Corp., 1.200%, 10/15/17 | | | 2,005,936 | | | |
| | 2,000,000 | | | Symantec Corp., 2.750%, 9/15/15 | | | 2,068,522 | | | |
| | 2,000,000 | | | Texas Instruments, Inc.,
2.375%, 5/16/16 | | | 2,093,190 | | | |
| | | | | | | | 10,776,305 | | | |
| | | | | | | | | | |
Principal
Amount | | | | | Value | | | |
| | | | | | | | | | |
| Corporate Bonds — (Continued) | | | | | | |
| Materials — 6.7% | | | | | | |
| $ | 2,000,000 | | | Air Products & Chemicals, Inc.,
2.000%, 8/2/16 | | $ | 2,077,626 | | | |
| | 2,000,000 | | | Barrick Gold Corp., 2.900%, 5/30/16 | | | 2,098,402 | | | |
| | 2,000,000 | | | Eastman Chemical Co,
2.400%, 6/1/17 | | | 2,066,486 | | | |
| | 2,000,000 | | | Freeport-McMoRan Copper & Gold, Inc., 2.150%, 3/1/17 | | | 2,010,622 | | | |
| | 2,000,000 | | | PPG Industries, Inc., 5.750%, 3/15/13 | | | 2,020,722 | | | |
| | 2,000,000 | | | Sherwin-Williams Co./The,
3.125%, 12/15/14 | | | 2,093,326 | | | |
| | 1,000,000 | | | Xstrata PLC, 2.450%, 10/25/17 (a) | | | 1,009,694 | | | |
| | | | | | | | 13,376,878 | | | |
| Real Estate Investment Trusts — 1.6% | | | | | | |
| | 1,000,000 | | | HCP, Inc., 2.700%, 2/1/14 | | | 1,017,947 | | | |
| | 2,060,000 | | | Simon Property Group LP,
4.200%, 2/1/15 | | | 2,184,636 | | | |
| | | | | | | | 3,202,583 | | | |
| Telecommunication Services — 2.1% | | | | | | |
| | 2,000,000 | | | AT&T, Inc., 2.400%, 8/15/16 | | | 2,087,142 | | | |
| | 1,000,000 | | | Verizon Communications, Inc.,
1.950%, 3/28/14 | | | 1,018,080 | | | |
| | 1,000,000 | | | Verizon Wireless, 7.375%, 11/15/13 | | | 1,056,967 | | | |
| | | | | | | | 4,162,189 | | | |
| Utilities — 3.9% | | | | | | |
| | 1,500,000 | | | FPL Group Capital, Inc.,
5.350%, 6/15/13 | | | 1,530,809 | | | |
| | 2,000,000 | | | PSEG Power LLC, 2.500%, 4/15/13 | | | 2,011,542 | | | |
| | 1,800,000 | | | Questar Corp., 2.750%, 2/1/16 | | | 1,888,735 | | | |
| | 1,262,000 | | | Southern Co., 4.150%, 5/15/14 | | | 1,321,975 | | | |
| | 1,000,000 | | | Southern Co., 2.375%, 9/15/15 | | | 1,041,407 | | | |
| | | | | | | | 7,794,468 | | | |
| Total Corporate Bonds (Cost $142,733,179) | | | 146,007,971 | | | |
| U.S. Government Agencies — 19.6% | | | | | | |
| Federal Agricultural Mortgage
Corporation — 1.5% | | | | | | |
| | 3,000,000 | | | 3.250%, 6/25/14 | | | 3,125,295 | | | |
| Federal Home Loan Bank — 9.6% | | | | | | |
| | 1,000,000 | | | 4.375%, 9/13/13 | | | 1,029,215 | | | |
| | 1,500,000 | | | 1.000%, 9/13/13 | | | 1,508,567 | | | |
| | 6,000,000 | | | 1.375%, 5/28/14 | | | 6,102,594 | | | |
| | 2,000,000 | | | 3.250%, 9/12/14 | | | 2,100,556 | | | |
| | 2,000,000 | | | 1.375%, 9/12/14 | | | 2,037,208 | | | |
| | 2,000,000 | | | 4.750%, 11/14/14 | | | 2,165,758 | | | |
| | 2,000,000 | | | 1.750%, 9/11/15 | | | 2,073,336 | | | |
| | 2,000,000 | | | 1.900%, 12/29/15 | | | 2,088,562 | | | |
| | | | | | | | 19,105,796 | | | |
(See notes which are an integral part of the Financial Statements)
Annual Shareholder Report
91
| | |
| Huntington Short/Intermediate Fixed Income Securities Fund | | (Continued) |
| | | | | | | | | | |
Principal
Amount | | | | | Value | | | |
| | | | | | | | | | |
| U.S. Government Agencies — (Continued) | | | | | | |
| Federal Home Loan Mortgage
Corporation — 1.8% | | | | | | |
| $ | 2,000,000 | | | 2.175%, 2/19/14 | | $ | 2,044,604 | | | |
| | 1,500,000 | | | 0.450%, 11/24/15 | | | 1,502,169 | | | |
| | | | | | | | 3,546,773 | | | |
| Federal National Mortgage Association — 6.7% | | | | | | |
| | 3,000,000 | | | 1.250%, 2/27/14 | | | 3,040,011 | | | |
| | 4,000,000 | | | 1.500%, 9/8/14 | | | 4,072,472 | | | |
| | 3,000,000 | | | 1.300%, 11/17/14 | | | 3,056,739 | | | |
| | 3,000,000 | | | 1.625%, 10/26/15 | | | 3,103,533 | | | |
| | | | | | | | 13,272,755 | | | |
| Total U.S. Government Agencies
(Cost $38,227,688) | | | 39,050,619 | | | |
| U.S. Treasury Obligations — 5.4% | | | | | | |
| U.S. Treasury Notes — 5.4% | | | | | | |
| | 4,000,000 | | | 0.750%, 6/15/14 | | | 4,031,092 | | | |
| | 1,500,000 | | | 2.125%, 12/31/15 | | | 1,578,399 | | | |
| | 5,000,000 | | | 1.000%, 8/31/16 | | | 5,095,310 | | | |
| Total U.S. Treasury Obligations
(Cost $10,534,477) | | | 10,704,801 | | | |
| | | | | | | | | | |
Shares | | | | | Value | | | |
| | | | | | | | | | |
| Cash Equivalents — 1.1% | | | | | | |
| | 2,150,783 | | | Huntington U.S. Treasury Money Market Fund, Trust Shares 0.050% (c) (d) | | $ | 2,150,783 | | | |
| Total Cash Equivalents (Cost $2,150,783) | | | 2,150,783 | | | |
| Total Investments
(Cost $193,646,127) — 99.5% | | | 197,914,174 | | | |
| Other Assets in Excess of Liabilities — 0.5% | | | 1,013,730 | | | |
| Net Assets — 100.0% | | $ | 198,927,904 | | | |
| (a) | Security exempt from registration under Rule 144A or Section 4(2) of the Securities Act of 1933. The security may be resold in transactions exempt from registration, normally to qualified institutional buyers. |
| (b) | Variable or Floating Rate Security. Rate disclosed is as of December 31, 2012. |
| (c) | Investment in affiliate. |
| (d) | Rate disclosed is the seven day yield as of December 31, 2012. |
GMTN — Global Medium Term Note
MTN — Medium Term Note
MTN—Medium Term Note
(See notes which are an integral part of the Financial Statements)
Annual Shareholder Report
92
| | |
| | |
| Huntington Balanced Allocation Fund | | December 31, 2012 |
| | |
| Portfolio of Investments Summary Table | | (unaudited) |
| | | | |
| Asset Allocation | | Percentage of
Market Value | |
Equity Mutual Funds1 | | | 55.9% | |
Fixed Income Mutual Funds1 | | | 33.5% | |
Exchange-Traded Funds1 | | | 9.4% | |
Cash1 | | | 1.2% | |
Total | | | 100.0% | |
| 1 | Investments in affiliated funds. |
Portfolio holdings and allocations are subject to change. As of December 31, 2012, percentages in the table above are based on total investments. Such total investments may differ from the percentages set forth below in the Portfolio of Investments which are computed using the Fund’s total net assets.
Portfolio of Investments
| | | | | | | | | | |
| Shares | | | | | Value | | | |
| | | | | | | | | | |
| Mutual Funds — 89.4% (a) | | | | | | |
| | 109,187 | | | Huntington Disciplined Equity Fund, Trust Shares | | $ | 1,070,033 | | | |
| | 60,054 | | | Huntington Dividend Capture Fund, Trust Shares | | | 569,908 | | | |
| | 122,098 | | | Huntington Fixed Income Securities Fund, Trust Shares | | | 2,772,839 | | | |
| | 38,152 | | | Huntington Global Select Markets Fund, Trust Shares | | | 394,114 | | | |
| | 83,420 | | | Huntington Growth Fund, Trust Shares | | | 2,160,587 | | | |
| | 88,916 | | | Huntington Income Equity Fund, Trust Shares | | | 1,986,378 | | | |
| | 116,533 | | | Huntington Intermediate Government Income Fund, Trust Shares | | | 1,293,512 | | | |
| | 180,525 | | | Huntington International Equity Fund, Trust Shares | | | 2,047,158 | | | |
| | 70,836 | | | Huntington Mid Corp America Fund, Trust Shares | | | 970,450 | | | |
| | 80,141 | | | Huntington Mortgage Securities Fund, Trust Shares | | | 739,706 | | | |
| | 63,926 | | | Huntington Short/Intermediate Fixed Income Securities Fund, Trust Shares | | | 1,291,306 | | | |
| | 41,610 | | | Huntington Situs Fund, Trust Shares | | | 975,336 | | | |
| Total Mutual Funds (Cost $14,818,695) | | | 16,271,327 | | | |
| | | | | | | | | | |
| Shares | | | | | Value | | | |
| | | | | | | | | | |
| Exchange-Traded Funds — 9.4% | | | | | | |
| | 65,247 | | | Huntington US Equity Rotation Strategy ETF (a) | | $ | 1,709,472 | | | |
| Total Exchange-Traded Funds (Cost $1,722,191) | | | 1,709,472 | | | |
| Cash Equivalents — 1.3% | | | | | | |
| | 229,492 | | | Huntington U.S. Treasury Money Market Fund, Trust Shares, 0.050% (a) (b) | | | 229,492 | | | |
| Total Cash Equivalents (Cost $229,492) | | | 229,492 | | | |
| Total Investments
(Cost $16,770,378) — 100.1% | | | 18,210,291 | | | |
| Liabilities in Excess of Other Assets — (0.1)% | | | (18,416) | | | |
| Net Assets — 100.0% | | $ | 18,191,875 | | | |
| (a) | Investment in affiliate. |
| (b) | Rate disclosed is the seven day yield as of December 31, 2012. |
ETF — Exchange-Traded Fund
(See notes which are an integral part of the Financial Statements)
Annual Shareholder Report
93
| | |
| | |
| Huntington Conservative Allocation Fund | | December 31, 2012 |
| | |
| Portfolio of Investments Summary Table | | (unaudited) |
| | | | |
| Asset Allocation | | Percentage of
Market Value | |
Fixed Income Mutual Funds1 | | | 74.5% | |
Equity Mutual Funds1 | | | 21.6% | |
Exchange-Traded Funds1 | | | 3.6% | |
Cash1 | | | 0.3% | |
Total | | | 100.0% | |
| 1 | Investments in affiliated funds. |
Portfolio holdings and allocations are subject to change. As of December 31, 2012, percentages in the table above are based on total investments. Such total investments may differ from the percentages set forth below in the Portfolio of Investments which are computed using the Fund’s total net assets.
Portfolio of Investments
| | | | | | | | | | |
| Shares | | | | | Value | | | |
| | | | | | | | | | |
| Mutual Funds — 97.5% (a) | | | | | | |
| | 11,214 | | | Huntington Disciplined Equity Fund, Trust Shares | | $ | 109,900 | | | |
| | 6,169 | | | Huntington Dividend Capture Fund, Trust Shares | | | 58,540 | | | |
| | 72,138 | | | Huntington Fixed Income Securities Fund, Trust Shares | | | 1,638,243 | | | |
| | 3,919 | | | Huntington Global Select Markets Fund, Trust Shares | | | 40,486 | | | |
| | 8,568 | | | Huntington Growth Fund, Trust Shares | | | 221,908 | | | |
| | 9,133 | | | Huntington Income Equity Fund, Trust Shares | | | 204,022 | | | |
| | 68,849 | | | Huntington Intermediate Government Income Fund, Trust Shares | | | 764,224 | | | |
| | 18,548 | | | Huntington International Equity Fund, Trust Shares | | | 210,329 | | | |
| | 7,276 | | | Huntington Mid Corp America Fund, Trust Shares | | | 99,676 | | | |
| | 47,348 | | | Huntington Mortgage Securities Fund, Trust Shares | | | 437,018 | | | |
| | 37,768 | | | Huntington Short/Intermediate Fixed Income Securities Fund, Trust Shares | | | 762,913 | | | |
| | 4,274 | | | Huntington Situs Fund, Trust Shares | | | 100,194 | | | |
| Total Mutual Funds (Cost $4,335,549) | | | 4,647,453 | | | |
| | | | | | | | | | |
| Shares | | | | | Value | | | |
| | | | | | | | | | |
| Exchange-Traded Funds — 3.7% | | | | | | |
| | 6,702 | | | Huntington US Equity Rotation Strategy ETF (a) | | $ | 175,592 | | | |
| Total Exchange-Traded Funds (Cost $173,915) | | | 175,592 | | | |
| Cash Equivalents — 0.3% | | | | | | |
| | 15,912 | | | Huntington U.S. Treasury Money Market Fund, Trust Shares, 0.050% (a) (b) | | | 15,912 | | | |
| Total Cash Equivalents (Cost $15,912) | | | 15,912 | | | |
| Total Investments
(Cost $4,525,376) — 101.5% | | | 4,838,957 | | | |
| Liabilities in Excess of Other Assets — (1.5)% | | | (71,777) | | | |
| Net Assets — 100.0% | | $ | 4,767,180 | | | |
| (a) | Investment in affiliate. |
| (b) | Rate disclosed is the seven day yield as of December 31, 2012. |
| ETF — Exchange-Traded | Fund |
(See notes which are an integral part of the Financial Statements)
Annual Shareholder Report
94
| | |
| | |
| Huntington Growth Allocation Fund | | December 31, 2012 |
| | |
| Portfolio of Investments Summary Table | | (unaudited) |
| | | | |
| Asset Allocation | | Percentage of
Market Value | |
Equity Mutual Funds1 | | | 73.4% | |
Fixed Income Mutual Funds1 | | | 13.3% | |
Exchange-Traded Funds1 | | | 12.3% | |
Cash1 | | | 1.0% | |
Total | | | 100.0% | |
| 1 | Investments in affiliated funds. |
Portfolio holdings and allocations are subject to change. As of December 31, 2012, percentages in the table above are based on total investments. Such total investments may differ from the percentages set forth below in the Portfolio of Investments which are computed using the Fund’s total net assets.
Portfolio of Investments
| | | | | | | | | | |
| Shares | | | | | Value | | | |
| | | | | | | | | | |
| Mutual Funds — 86.6% (a) | | | | | | |
| | 103,853 | | | Huntington Disciplined Equity Fund, Trust Shares | | $ | 1,017,758 | | | |
| | 57,116 | | | Huntington Dividend Capture Fund, Trust Shares | | | 542,030 | | | |
| | 34,981 | | | Huntington Fixed Income Securities Fund, Trust Shares | | | 794,425 | | | |
| | 36,284 | | | Huntington Global Select Markets Fund, Trust Shares | | | 374,815 | | | |
| | 79,345 | | | Huntington Growth Fund, Trust Shares | | | 2,055,026 | | | |
| | 84,570 | | | Huntington Income Equity Fund, Trust Shares | | | 1,889,296 | | | |
| | 33,387 | | | Huntington Intermediate Government Income Fund, Trust Shares | | | 370,597 | | | |
| | 171,671 | | | Huntington International Equity Fund, Trust Shares | | | 1,946,752 | | | |
| | 67,374 | | | Huntington Mid Corp America Fund, Trust Shares | | | 923,021 | | | |
| | 22,961 | | | Huntington Mortgage Securities Fund, Trust Shares | | | 211,931 | | | |
| | 18,315 | | | Huntington Short/Intermediate Fixed Income Securities Fund, Trust Shares | | | 369,966 | | | |
| | 39,572 | | | Huntington Situs Fund, Trust Shares | | | 927,573 | | | |
| Total Mutual Funds (Cost $9,959,019) | | | 11,423,190 | | | |
| | | | | | | | | | |
| Shares | | | | | Value | | | |
| | | | | | | | | | |
| Exchange-Traded Funds — 12.3% | | | | | | |
| | 62,055 | | | Huntington US Equity Rotation Strategy ETF (a) | | $ | 1,625,841 | | | |
| Total Exchange-Traded Funds (Cost $1,624,551) | | | 1,625,841 | | | |
| Cash Equivalents — 1.0% | | | | | | |
| | 131,237 | | | Huntington U.S. Treasury Money Market Fund, Trust Shares, 0.050% (a) (b) | | | 131,237 | | | |
| Total Cash Equivalents (Cost $131,237) | | | 131,237 | | | |
| Total Investments
(Cost $11,714,807) — 99.9% | | | 13,180,268 | | | |
| Other Assets in Excess of Liabilities — 0.1% | | | 10,190 | | | |
| Net Assets — 100.0% | | $ | 13,190,458 | | | |
| (a) | Investment in affiliate. |
| (b) | Rate disclosed is the seven day yield as of December 31, 2012. |
| ETF — Exchange-Traded | Fund |
(See notes which are an integral part of the Financial Statements)
Annual Shareholder Report
95
Statements of Assets and Liabilities
December 31, 2012
| | | | | | | | | | | | | | | | |
| | | Huntington
Tax Free
Money Market
Fund | | | Huntington
Money Market
Fund | | | Huntington
Ohio Municipal
Money Market
Fund | | | Huntington
U.S. Treasury
Money Market
Fund | |
| Assets: | | | | | | | | | | | | | | | | |
Investments, at cost | | $ | 74,379,803 | | | $ | 346,332,439 | | | $ | 131,738,287 | | | $ | 845,845,096 | |
Investments, at value | | $ | 74,379,803 | | | $ | 294,278,239 | | | $ | 131,738,287 | | | $ | 470,392,296 | |
Investments in affiliated securities, at value | | | — | | | | — | | | | — | | | | — | |
Investments in repurchase agreements, at cost | | | — | | | | 52,054,200 | | | | — | | | | 375,452,800 | |
Total investments | | | 74,379,803 | | | | 346,332,439 | | | | 131,738,287 | | | | 845,845,096 | |
Cash | | | — | | | | 71 | | | | — | | | | 86 | |
Foreign currencies, at value (Cost $-, $-, $-, $-, $-, $-, $18, $-, $- and $980) | | | — | | | | — | | | | — | | | | — | |
Income receivable | | | 60,548 | | | | 167,621 | | | | 93,636 | | | | 433,628 | |
Receivable for investments sold | | | — | | | | — | | | | — | | | | — | |
Receivable for shares sold | | | — | | | | 223,455 | | | | — | | | | — | |
Receivable from advisor | | | 15,218 | | | | 52,603 | | | | 23,393 | | | | 82,075 | |
Tax reclaims receivable | | | — | | | | — | | | | — | | | | — | |
Prepaid expenses and other assets | | | 9,040 | | | | 19,895 | | | | 13,706 | | | | 16,395 | |
Total assets | | | 74,464,609 | | | | 346,796,084 | | | | 131,869,022 | | | | 846,377,280 | |
| Liabilities: | | | | | | | | | | | | | | | | |
Payable for return of collateral on loaned securities | | | — | | | | — | | | | — | | | | — | |
Payable to custodian | | | — | | | | — | | | | 26 | | | | — | |
Options written, at value (premium received $-, $-, $-, $-, $1,271,242, $40,579, $-, $-, $- and $-) | | | — | | | | — | | | | — | | | | — | |
Income distribution payable | | | 626 | | | | 2,341 | | | | 784 | | | | 22,009 | |
Payable for investments purchased | | | 349,802 | | | | — | | | | — | | | | — | |
Payable for shares redeemed | | | — | | | | — | | | | — | | | | — | |
Accrued expenses and other payables: | | | | | | | | | | | | | | | | |
Investment advisor fees | | | — | | | | — | | | | — | | | | — | |
Administration fees | | | 11,782 | | | | 57,537 | | | | 21,610 | | | | 92,282 | |
Custodian fees | | | 1,382 | | | | 6,709 | | | | 3,097 | | | | 6,927 | |
Financial administration fees | | | 1,556 | | | | 2,255 | | | | 1,559 | | | | 599 | |
Distribution services fee | | | — | | | | — | | | | — | | | | 4,016 | |
Shareholder services fee | | | — | | | | — | | | | — | | | | — | |
Transfer agent fees | | | 5,913 | | | | 19,804 | | | | 9,442 | | | | 10,294 | |
Professional fees | | | 8,124 | | | | 44,085 | | | | 16,896 | | | | 29,893 | |
Printing and postage | | | 2,038 | | | | 45,207 | | | | 5,557 | | | | 10,715 | |
Compliance service fees | | | 762 | | | | 4,060 | | | | 1,579 | | | | 2,978 | |
Other | | | 555 | | | | 2,209 | | | | 881 | | | | 2,086 | |
Total Liabilities | | | 382,540 | | | | 184,207 | | | | 61,431 | | | | 181,799 | |
Net Assets | | $ | 74,082,069 | | | $ | 346,611,877 | | | $ | 131,807,591 | | | $ | 846,195,481 | |
| | | | | | | | | | | | | | | | | |
| Net Assets consist of: | | | | | | | | | | | | | | | | |
Paid in capital | | $ | 74,212,917 | | | $ | 346,788,947 | | | $ | 132,102,119 | | | $ | 846,196,468 | |
Net unrealized appreciation of investments, options and translations of assets and liabilities in foreign currency | | | — | | | | — | | | | — | | | | — | |
Accumulated net realized gain (loss) on investments, options and foreign currency transactions | | | (131,697 | ) | | | (177,140 | ) | | | (294,657 | ) | | | (882 | ) |
Accumulated net investment income (loss) | | | 849 | | | | 70 | | | | 129 | | | | (105 | ) |
Net Assets | | $ | 74,082,069 | | | $ | 346,611,877 | | | $ | 131,807,591 | | | $ | 846,195,481 | |
| | | | | | | | | | | | | | | | | |
| Net Assets: | | | | | | | | | | | | | | | | |
Trust Shares | | $ | 57,317,090 | | | $ | 240,924,196 | | | $ | 58,279,492 | | | $ | 737,310,368 | |
Class A Shares | | $ | 16,764,979 | | | $ | 105,687,681 | | | $ | 73,528,099 | | | $ | 108,885,113 | |
| Shares Outstanding: (unlimited number of shares authorized, no par value): | | | | | | | | | | | | | | | | |
Trust Shares | | | 57,416,549 | | | | 241,527,410 | | | | 58,445,063 | | | | 737,284,695 | |
Class A Shares | | | 16,797,171 | | | | 105,708,583 | | | | 73,650,033 | | | | 108,914,208 | |
| Net Asset Value, Redemption Price and Offering Price Per Share: | | | | | | | | | | | | | | | | |
Trust Shares | | $ | 1.00 | | | $ | 1.00 | | | $ | 1.00 | | | $ | 1.00 | |
Class A Shares | | $ | 1.00 | | | $ | 1.00 | | | $ | 1.00 | | | $ | 1.00 | |
| Offering Price Per Share (100%/(100%-maximum sales charge) of net asset value adjusted to the nearest cent) per share: | | | | | | | | | | | | | | | | |
Class A Shares | | | — | | | | — | | | | — | | | | — | |
| Maximum Sales Charge: | | | | | | | | | | | | | | | | |
Class A Shares | | | — | | | | — | | | | — | | | | — | |
| | | | | | | | | | | | | | | | | |
(See notes which are an integral part of the Financial Statements)
Annual Shareholder Report
96
| | | | | | | | | | | | | | | | | | | | | | |
Huntington
Disciplined
Equity
Fund | | | Huntington
Dividend
Capture
Fund | | | Huntington
Global Select
Markets
Fund | | | Huntington
Growth
Fund | | | Huntington
Income Equity
Fund | | | Huntington
International
Equity
Fund | |
| | | | | | | | | | | | | | | | | | | | | | |
| $ | 82,129,786 | | | $ | 194,523,873 | | | $ | 39,385,987 | | | $ | 115,136,300 | | | $ | 139,737,132 | | | $ | 250,169,544 | |
| $ | 89,450,074 | | | $ | 198,349,511 | | | $ | 40,254,636 | | | $ | 132,038,054 | | | $ | 151,108,073 | | | $ | 285,095,694 | |
| | 5,903,706 | | | | 3,354,143 | | | | 1,038,116 | | | | 1,621,894 | | | | 1,391,488 | | | | 10,717,674 | |
| | — | | | | — | | | | — | | | | — | | | | — | | | | — | |
| | 95,353,780 | | | | 201,703,654 | | | | 41,292,752 | | | | 133,659,948 | | | | 152,499,561 | | | | 295,813,368 | |
| | — | | | | 17,337 | | | | — | | | | — | | | | — | | | | 21,742 | |
| — | | | | — | | | | 22 | | | | — | | | | — | | | | 968 | |
| | 102,894 | | | | 403,886 | | | | 28,700 | | | | 92,904 | | | | 407,360 | | | | 441,081 | |
| | — | | | | — | | | | — | | | | 28,764,909 | | | | — | | | | 51,750 | |
| | 44,972 | | | | 224,325 | | | | 11 | | | | 101,366 | | | | 161,793 | | | | 147,261 | |
| | — | | | | — | | | | — | | | | — | | | | — | | | | — | |
| | — | | | | — | | | | 21,859 | | | | — | | | | — | | | | 330,732 | |
| | 15,265 | | | | 13,899 | | | | 15,672 | | | | 15,380 | | | | 15,057 | | | | 16,443 | |
| | 95,516,911 | | | | 202,363,101 | | | | 41,359,016 | | | | 162,634,507 | | | | 153,083,771 | | | | 296,823,345 | |
| | | | | | | | | | | | | | | | | | | | | | |
| | — | | | | 9,634,051 | | | | 1,593,389 | | | | 1,390,967 | | | | 15,044,485 | | | | 1,478,160 | |
| | — | | | | — | | | | — | | | | — | | | | — | | | | — | |
| 1,169,878 | | | | 30,600 | | | | — | | | | — | | | | — | | | | — | |
| | — | | | | — | | | | — | | | | — | | | | — | | | | — | |
| | — | | | | — | | | | 573,094 | | | | 25,721,557 | | | | — | | | | — | |
| | 251,608 | | | | 243,990 | | | | 13,436 | | | | 186,263 | | | | 160,659 | | | | 445,430 | |
| | | | | | | | | | | | | | | | | | | | | | |
| | 45,108 | | | | 34,966 | | | | 30,393 | | | | 68,453 | | | | 68,318 | | | | 248,926 | |
| | 14,793 | | | | 29,611 | | | | 6,014 | | | | 20,787 | | | | 20,746 | | | | 45,354 | |
| | 2,196 | | | | 3,259 | | | | 5,469 | | | | 3,220 | | | | 2,693 | | | | 9,433 | |
| | 2,990 | | | | 2,092 | | | | 5,186 | | | | 1,473 | | | | 1,578 | | | | 4,359 | |
| | 1,655 | | | | 9,755 | | | | 86 | | | | 1,638 | | | | 1,273 | | | | 1,918 | |
| | 20,298 | | | | 40,629 | | | | 8,252 | | | | 28,522 | | | | 28,466 | | | | 62,232 | |
| | 7,915 | | | | 24,989 | | | | 5,594 | | | | 17,151 | | | | 14,320 | | | | 21,673 | |
| | 6,863 | | | | 14,748 | | | | 3,455 | | | | 10,089 | | | | 10,157 | | | | 22,479 | |
| | 5,487 | | | | 3,511 | | | | 1,133 | | | | 6,925 | | | | 4,881 | | | | 13,981 | |
| | 894 | | | | 1,862 | | | | 399 | | | | 1,295 | | | | 1,278 | | | | 2,843 | |
| | 339 | | | | 608 | | | | 1,331 | | | | 665 | | | | 601 | | | | 381 | |
| | 1,530,024 | | | | 10,074,671 | | | | 2,247,231 | | | | 27,459,005 | | | | 15,359,455 | | | | 2,357,169 | |
| $ | 93,986,887 | | | $ | 192,288,430 | | | $ | 39,111,785 | | | $ | 135,175,502 | | | $ | 137,724,316 | | | $ | 294,466,176 | |
| | | | | | | | | | | | | | | | | | | | | | | |
| | | | | | | | | | | | | | | | | | | | | | |
| $ | 91,060,998 | | | $ | 200,334,384 | | | $ | 39,185,683 | | | $ | 116,216,106 | | | $ | 136,470,866 | | | $ | 262,659,183 | |
| 13,325,358 | | | | 7,189,760 | | | | 1,905,173 | | | | 18,523,648 | | | | 12,762,500 | | | | 45,649,631 | |
| (10,399,935 | ) | | | (15,192,573 | ) | | | (1,871,907 | ) | | | 435,748 | | | | (11,596,841 | ) | | | (13,795,898 | ) |
| | 466 | | | | (43,141 | ) | | | (107,164 | ) | | | — | | | | 87,791 | | | | (46,740 | ) |
| $ | 93,986,887 | | | $ | 192,288,430 | | | $ | 39,111,785 | | | $ | 135,175,502 | | | $ | 137,724,316 | | | $ | 294,466,176 | |
| | | | | | | | | | | | | | | | | | | | | | | |
| | | | | | | | | | | | | | | | | | | | | | |
| $ | 86,382,200 | | | $ | 145,945,793 | | | $ | 38,695,736 | | | $ | 127,544,641 | | | $ | 131,708,050 | | | $ | 285,361,206 | |
| $ | 7,604,687 | | | $ | 46,342,637 | | | $ | 416,049 | | | $ | 7,630,861 | | | $ | 6,016,266 | | | $ | 9,104,970 | |
| | | | | | | | | | | | | | | | | | | | | | |
| | 8,816,677 | | | | 15,375,070 | | | | 3,745,787 | | | | 4,924,269 | | | | 5,894,797 | | | | 25,163,969 | |
| | 777,676 | | | | 4,885,375 | | | | 40,301 | | | | 304,390 | | | | 269,154 | | | | 808,691 | |
| | | | | | | | | | | | | | | | | | | | | | |
| $ | 9.80 | | | $ | 9.49 | | | $ | 10.33 | | | $ | 25.90 | | | $ | 22.34 | | | $ | 11.34 | |
| $ | 9.78 | | | $ | 9.49 | | | $ | 10.32 | | | $ | 25.07 | | | $ | 22.35 | | | $ | 11.26 | |
| | | | | | | | | | | | | | | | | | | | | | |
| $ | 10.27 | | | $ | 9.96 | | | $ | 10.83 | | | $ | 26.32 | | | $ | 23.46 | | | $ | 11.82 | |
| | | | | | | | | | | | | | | | | | | | | | |
| | 4.75 | % | | | 4.75 | % | | | 4.75 | % | | | 4.75 | % | | | 4.75 | % | | | 4.75 | % |
| | | | | | | | | | | | | | | | | | | | | | | |
Annual Shareholder Report
97
Statements of Assets and Liabilities (Continued)
December 31, 2012
| | | | | | | | | | | | | | | | |
| | | Huntington
Mid Corp
America
Fund | | | Huntington
Real
Strategies
Fund | | | Huntington
Rotating
Markets
Fund | | | Huntington
Situs
Fund | |
| Assets: | | | | | | | | | | | | | | | | |
Investments, at cost | | $ | 96,418,285 | | | $ | 118,966,016 | | | $ | 42,492,290 | | | $ | 163,408,250 | |
Investments, at value | | $ | 137,012,260 | | | $ | 112,382,430 | | | $ | 40,987,305 | | | $ | 244,384,270 | |
Investments in affiliated securities, at value | | | 3,531,522 | | | | 5,395,632 | | | | 1,385,688 | | | | 3,588,928 | |
Investments in controlled affiliated securities, at value | | | — | | | | 1,143,804 | | | | — | | | | — | |
Total investments | | | 140,543,782 | | | | 118,921,866 | | | | 42,372,993 | | | | 247,973,198 | |
Cash | | | — | | | | — | | | | 487 | | | | — | |
Foreign currencies, at value (Cost $-, $-, $-, $1, $-, $-, $-, $- and $-) | | | — | | | | — | | | | — | | | | 6 | |
Income receivable | | | 163,938 | | | | 138,068 | | | | 16,466 | | | | 123,842 | |
Receivable for investments sold | | | — | | | | — | | | | — | | | | — | |
Receivable for shares sold | | | 62,619 | | | | 106,135 | | | | 43,265 | | | | 695,712 | |
Tax reclaims receivable | | | — | | | | — | | | | — | | | | 25,797 | |
Prepaid expenses and other assets | | | 15,952 | | | | 10,233 | | | | 8,517 | | | | 22,363 | |
Total assets | | | 140,786,291 | | | | 119,176,302 | | | | 42,441,728 | | | | 248,840,918 | |
| Liabilities: | | | | | | | | | | | | | | | | |
Payable for return of collateral on loaned securities | | | 6,116,911 | | | | 20,507,976 | | | | 1,839,691 | | | | 25,978,626 | |
Options written, at value (premium received $-, $-, $-, $187,571, $-, $-, $-, $- and $-) | | | — | | | | — | | | | — | | | | 103,750 | |
Income distribution payable | | | — | | | | — | | | | — | | | | — | |
Payable for investments purchased | | | — | | | | 1,190 | | | | — | | | | 1,048,437 | |
Payable for shares redeemed | | | 106,407 | | | | 80,201 | | | | 3,276 | | | | 181,515 | |
Accrued expenses and other payables: | | | | | | | | | | | | | | | | |
Investment advisor fees | | | 87,454 | | | | 61,267 | | | | 16,827 | | | | 138,447 | |
Administration fees | | | 21,245 | | | | 14,884 | | | | 6,131 | | | | 33,633 | |
Custodian fees | | | 3,543 | | | | 2,007 | | | | 984 | | | | 4,667 | |
Financial administration fees | | | 2,277 | | | | 1,295 | | | | 1,274 | | | | 4,042 | |
Distribution services fee | | | 1,935 | | | | 456 | | | | 490 | | | | 5,939 | |
Shareholder services fee | | | 29,151 | | | | 20,423 | | | | 8,413 | | | | 46,149 | |
Transfer agent fees | | | 20,145 | | | | 8,761 | | | | 7,091 | | | | 24,010 | |
Professional fees | | | 10,444 | | | | 7,593 | | | | 2,913 | | | | 16,028 | |
Printing and postage | | | 8,829 | | | | 3,897 | | | | 1,606 | | | | 11,309 | |
Compliance service fees | | | 1,361 | | | | 962 | | | | 372 | | | | 2,021 | |
Other | | | 629 | | | | 544 | | | | 194 | | | | 523 | |
Total Liabilities | | | 6,410,331 | | | | 20,711,456 | | | | 1,889,262 | | | | 27,599,096 | |
Net Assets | | $ | 134,375,960 | | | $ | 98,464,846 | | | $ | 40,552,466 | | | $ | 221,241,822 | |
| | | | | | | | | | | | | | | | | |
| Net Assets consist of: | | | | | | | | | | | | | | | | |
Paid in capital | | $ | 88,817,734 | | | $ | 116,995,801 | | | $ | 40,737,136 | | | $ | 136,563,845 | |
Net unrealized appreciation (depreciation) of investments, options and translations of assets and liabilities in foreign currency | | | 44,125,497 | | | | (44,150 | ) | | | (119,297 | ) | | | 84,649,778 | |
Accumulated net realized gain (loss) on investments, options and foreign currency transactions | | | 1,217,332 | | | | (17,494,899 | ) | | | (76,219 | ) | | | (207,262 | ) |
Accumulated net investment income (loss) | | | 215,397 | | | | (991,906 | ) | | | 10,846 | | | | 235,461 | |
Net Assets | | $ | 134,375,960 | | | $ | 98,464,846 | | | $ | 40,552,466 | | | $ | 221,241,822 | |
| | | | | | | | | | | | | | | | | |
| Net Assets: | | | | | | | | | | | | | | | | |
Trust Shares | | $ | 125,258,304 | | | $ | 96,292,013 | | | $ | 38,262,618 | | | $ | 192,756,951 | |
Class A Shares | | $ | 9,117,656 | | | $ | 2,172,833 | | | $ | 2,289,848 | | | $ | 28,484,871 | |
| Shares Outstanding: (unlimited number of shares authorized, no par value): | | | | | | | | | | | | | | | | |
Trust Shares | | | 9,143,725 | | | | 12,972,713 | | | | 3,662,737 | | | | 8,222,435 | |
Class A Shares | | | 692,095 | | | | 292,511 | | | | 220,982 | | | | 1,247,157 | |
| Net Asset Value, Redemption Price and Offering Price Per Share: | | | | | | | | | | | | | | | | |
Trust Shares | | $ | 13.70 | | | $ | 7.42 | | | $ | 10.45 | | | $ | 23.44 | |
Class A Shares | | $ | 13.17 | | | $ | 7.43 | | | $ | 10.36 | | | $ | 22.84 | |
| Offering Price Per Share (100%/(100%-maximum sales charge) of net asset value adjusted to the nearest cent) per share: | | | | | | | | | | | | | | | | |
Class A Shares | | $ | 13.83 | | | $ | 7.80 | | | $ | 10.88 | | | $ | 23.98 | |
| Maximum Sales Charge: | | | | | | | | | | | | | | | | |
Class A Shares | | | 4.75 | % | | | 4.75 | % | | | 4.75 | % | | | 4.75 | % |
| | | | | | | | | | | | | | | | | |
(See notes which are an integral part of the Financial Statements)
Annual Shareholder Report
98
| | | | | | | | | | | | | | | | | | |
Huntington
Fixed Income
Securities
Fund | | | Huntington
Intermediate
Government
Income Fund | | | Huntington
Mortgage
Securities
Fund | | | Huntington
Ohio
Tax-Free
Fund | | | Huntington
Short/Intermediate
Fixed Income
Securities Fund | |
| | | | | | | | | | | | | | | | | | |
| $ | 288,341,530 | | | $ | 113,099,665 | | | $ | 72,748,897 | | | $ | 51,864,087 | | | $ | 193,646,127 | |
| $ | 303,602,831 | | | $ | 118,527,443 | | | $ | 75,195,632 | | | $ | 54,074,216 | | | $ | 195,763,391 | |
| | 5,299,225 | | | | 2,607,089 | | | | 3,940,040 | | | | — | | | | 2,150,783 | |
| | — | | | | — | | | | — | | | | — | | | | — | |
| | 308,902,056 | | | | 121,134,532 | | | | 79,135,672 | | | | 54,074,216 | | | | 197,914,174 | |
| | — | | | | — | | | | 119 | | | | — | | | | — | |
| | — | | | | — | | | | — | | | | — | | | | — | |
| | 3,593,705 | | | | 607,743 | | | | 263,018 | | | | 377,662 | | | | 1,320,090 | |
| | — | | | | 808 | | | | 528 | | | | — | | | | — | |
| | 127,295 | | | | 43,567 | | | | 40,756 | | | | 60 | | | | 54,583 | |
| | — | | | | — | | | | — | | | | — | | | | — | |
| | 21,536 | | | | 12,833 | | | | 11,197 | | | | 9,372 | | | | 16,440 | |
| | 312,644,592 | | | | 121,799,483 | | | | 79,451,290 | | | | 54,461,310 | | | | 199,305,287 | |
| | | | | | | | | | | | | | | | | | |
| | — | | | | — | | | | 705,024 | | | | — | | | | — | |
| — | | | | — | | | | — | | | | — | | | | — | |
| | 308,485 | | | | 104,265 | | | | — | | | | 74,888 | | | | 166,547 | |
| | — | | | | — | | | | — | | | | 261,785 | | | | — | |
| | 67,135 | | | | 42,434 | | | | 34,276 | | | | 21,571 | | | | 6,536 | |
| | | | | | | | | | | | | | | | | | |
| | 132,600 | | | | 52,697 | | | | 34,010 | | | | 23,040 | | | | 84,438 | |
| | 48,319 | | | | 19,202 | | | | 12,393 | | | | 8,395 | | | | 30,769 | |
| | 7,163 | | | | 3,399 | | | | 3,055 | | | | 1,437 | | | | 5,382 | |
| | 5,580 | | | | 7,062 | | | | 6,692 | | | | 11,089 | | | | 5,263 | |
| | 2,015 | | | | 1,132 | | | | 1,011 | | | | 721 | | | | 2,443 | |
| | 66,300 | | | | 26,348 | | | | 17,004 | | | | 11,520 | | | | 42,219 | |
| | 17,210 | | | | 9,143 | | | | 7,511 | | | | 6,212 | | | | 9,451 | |
| | 22,902 | | | | 8,481 | | | | 7,784 | | | | 5,700 | | | | 14,227 | |
| | 16,095 | | | | 4,682 | | | | 2,692 | | | | 1,688 | | | | 6,826 | |
| | 2,995 | | | | 1,193 | | | | 829 | | | | 519 | | | | 1,983 | |
| | 1,430 | | | | 781 | | | | 110 | | | | 337 | | | | 1,299 | |
| | 698,229 | | | | 280,819 | | | | 832,391 | | | | 428,902 | | | | 377,383 | |
| $ | 311,946,363 | | | $ | 121,518,664 | | | $ | 78,618,899 | | | $ | 54,032,408 | | | $ | 198,927,904 | |
| | | | | | | | | | | | | | | | | | | |
| | | | | | | | | | | | | | | | | | |
| $ | 290,453,994 | | | $ | 113,187,711 | | | $ | 72,034,266 | | | $ | 51,473,327 | | | $ | 194,608,100 | |
| 20,560,526 | | | | 8,034,867 | | | | 6,386,775 | | | | 2,210,129 | | | | 4,268,047 | |
| 951,811 | | | | 107,049 | | | | 203,065 | | | | 348,952 | | | | 51,757 | |
| | (19,968 | ) | | | 189,037 | | | | (5,207 | ) | | | — | | | | — | |
| $ | 311,946,363 | | | $ | 121,518,664 | | | $ | 78,618,899 | | | $ | 54,032,408 | | | $ | 198,927,904 | |
| | | | | | | | | | | | | | | | | | | |
| | | | | | | | | | | | | | | | | | |
| $ | 302,441,645 | | | $ | 116,280,333 | | | $ | 73,818,158 | | | $ | 50,551,771 | | | $ | 187,744,422 | |
| $ | 9,504,718 | | | $ | 5,238,331 | | | $ | 4,800,741 | | | $ | 3,480,637 | | | $ | 11,183,482 | |
| | | | | | | | | | | | | | | | | | |
| | 13,315,431 | | | | 10,475,309 | | | | 7,997,155 | | | | 2,304,084 | | | | 9,294,855 | |
| | 418,497 | | | | 472,007 | | | | 516,894 | | | | 158,749 | | | | 553,587 | |
| | | | | | | | | | | | | | | | | | |
| $ | 22.71 | | | $ | 11.10 | | | $ | 9.23 | | | $ | 21.94 | | | $ | 20.20 | |
| $ | 22.71 | | | $ | 11.10 | | | $ | 9.29 | | | $ | 21.93 | | | $ | 20.20 | |
$ | 23.59 | | | $ | 11.53 | | | $ | 9.65 | | | $ | 22.78 | | | $ | 20.51 | |
| | | | | | | | | | | | | | | | | | |
| | 3.75 | % | | | 3.75 | % | | | 3.75 | % | | | 3.75 | % | | | 1.50 | % |
| | | | | | | | | | | | | | | | | | | |
Annual Shareholder Report
99
Statements of Assets and Liabilities (Continued)
December 31, 2012
| | | | | | | | | | | | |
| | | Huntington
Balanced
Allocation
Fund | | | Huntington
Conservative
Allocation
Fund | | | Huntington
Growth
Allocation
Fund | |
| Assets: | | | | | | | | | | | | |
Investments, at cost | | $ | 16,770,378 | | | $ | 4,525,376 | | | $ | 11,714,807 | |
Investments in affiliated securities, at value | | $ | 18,210,291 | | | $ | 4,838,957 | | | $ | 13,180,268 | |
Total investments | | | 18,210,291 | | | | 4,838,957 | | | | 13,180,268 | |
Income receivable | | | 8,609 | | | | 5,154 | | | | 2,454 | |
Receivable for shares sold | | | 30,350 | | | | 38,131 | | | | 21,643 | |
Receivable from advisor | | | 4,480 | | | | 2,155 | | | | 4,893 | |
Prepaid expenses and other assets | | | 4,792 | | | | 4,265 | | | | 4,569 | |
Total assets | | | 18,258,522 | | | | 4,888,662 | | | | 13,213,827 | |
| Liabilities: | | | | | | | | | | | | |
Income distribution payable | | | 4,388 | | | | 1,133 | | | | 4,025 | |
Payable for shares redeemed | | | 40,858 | | | | 113,805 | | | | 2,527 | |
Accrued expenses and other payables: | | | | | | | | | | | | |
Administration fees | | | 2,772 | | | | 742 | | | | 2,000 | |
Custodian fees | | | 269 | | | | 346 | | | | 309 | |
Financial administration fees | | | 426 | | | | 425 | | | | 425 | |
Distribution services fee | | | 3,804 | | | | 1,018 | | | | 2,744 | |
Transfer agent fees | | | 10,167 | | | | 3,255 | | | | 8,277 | |
Professional fees | | | 1,324 | | | | 533 | | | | 976 | |
Printing and postage | | | 2,319 | | | | 40 | | | | 1,850 | |
Compliance service fees | | | 171 | | | | 95 | | | | 124 | |
Other | | | 149 | | | | 90 | | | | 112 | |
Total Liabilities | | | 66,647 | | | | 121,482 | | | | 23,369 | |
Net Assets | | $ | 18,191,875 | | | $ | 4,767,180 | | | $ | 13,190,458 | |
| | | | | | | | | | | | | |
| Net Assets consist of: | | | | | | | | | | | | |
Paid in capital | | $ | 16,316,853 | | | $ | 4,401,609 | | | $ | 11,324,131 | |
Net unrealized appreciation of investments, options and translations of assets and liabilities in foreign currency | | | 1,439,913 | | | | 313,581 | | | | 1,465,461 | |
Accumulated net realized gain on investments, options and foreign currency transactions | | | 434,412 | | | | 51,990 | | | | 400,866 | |
Accumulated net investment income (loss) | | | 697 | | | | — | | | | — | |
Net Assets | | $ | 18,191,875 | | | $ | 4,767,180 | | | $ | 13,190,458 | |
| | | | | | | | | | | | | |
| Net Assets: | | | | | | | | | | | | |
Class A Shares | | $ | 18,191,875 | | | $ | 4,767,180 | | | $ | 13,190,458 | |
| Shares Outstanding: (unlimited number of shares authorized, no par value): | | | | | | | | | | | | |
Class A Shares | | | 1,655,601 | | | | 522,827 | | | | 1,213,651 | |
| Net Asset Value, Redemption Price and Offering Price Per Share: | | | | | | | | | | | | |
Class A Shares | | $ | 10.99 | | | $ | 9.12 | | | $ | 10.87 | |
| Offering Price Per Share (100%/(100%-maximum sales charge) of net asset value adjusted to the nearest cent) per share: | | | | | | | | | | | | |
Class A Shares | | $ | 11.54 | | | $ | 9.57 | | | $ | 11.41 | |
| Maximum Sales Charge: | | | | | | | | | | | | |
Class A Shares | | | 4.75 | % | | | 4.75 | % | | | 4.75 | % |
| | | | | | | | | | | | | |
(See notes which are an integral part of the Financial Statements)
Annual Shareholder Report
100
[THIS PAGE INTENTIONALLY LEFT BLANK]
Statements of Operations
Year Ended December 31, 2012
| | | | | | | | | | | | | | | | |
| | | Huntington
Tax Free
Money Market
Fund | | | Huntington
Money Market
Fund | | | Huntington
Ohio Municipal
Money Market
Fund | | | Huntington
U.S. Treasury
Money Market
Fund | |
| Investment Income: | | | | | | | | | | | | | | | | |
Dividend income | | $ | 575 | | | $ | 74,977 | | | $ | 998 | | | $ | — | |
Dividend income from affiliated securities | | | — | | | | — | | | | — | | | | — | |
Interest income | | | 179,295 | | | | 893,313 | | | | 295,031 | | | | 350,366 | |
Income from securities lending, net(a) | | | — | | | | — | | | | — | | | | — | |
Foreign dividend taxes withheld | | | — | | | | — | | | | — | | | | — | |
Total investment income | | | 179,870 | | | | 968,290 | | | | 296,029 | | | | 350,366 | |
| Expenses: | | | | | | | | | | | | | | | | |
Investment advisor fees | | | 235,958 | | | | 1,205,214 | | | | 427,077 | | | | 704,613 | |
Administration fees | | | 143,304 | | | | 731,997 | | | | 259,377 | | | | 641,894 | |
Custodian fees | | | 21,381 | | | | 108,304 | | | | 38,460 | | | | 92,440 | |
Transfer and dividend disbursing agent fees and expenses | | | 30,882 | | | | 75,864 | | | | 37,196 | | | | 50,305 | |
Trustees’ fees | | | 6,421 | | | | 32,778 | | | | 11,751 | | | | 28,194 | |
Professional fees | | | 22,332 | | | | 116,979 | | | | 39,745 | | | | 81,023 | |
Financial administration fees | | | 4,055 | | | | 5,254 | | | | 4,032 | | | | 1,516 | |
Distribution services fee—Class A Shares | | | 46,356 | | | | 249,946 | | | | 201,286 | | | | 191,628 | |
Shareholder services fee—Trust Shares | | | 150,276 | | | | 575,694 | | | | 154,613 | | | | 689,134 | |
Shareholder services fee—Class A Shares | | | 46,356 | | | | 249,946 | | | | 201,286 | | | | 191,628 | |
State registration costs | | | 30,464 | | | | 30,128 | | | | 31,235 | | | | 33,458 | |
Offering costs | | | — | | | | — | | | | — | | | | — | |
Printing and postage | | | 4,610 | | | | 77,014 | | | | 9,004 | | | | 19,885 | |
Insurance premiums | | | 4,417 | | | | 13,101 | | | | 6,268 | | | | 12,319 | |
Compliance service fees | | | 3,009 | | | | 15,208 | | | | 5,592 | | | | 11,408 | |
Line of credit fees and interest expense | | | 1,796 | | | | 8,821 | | | | 2,916 | | | | 6,808 | |
Other | | | 24,534 | | | | 40,605 | | | | 28,064 | | | | 65,572 | |
Recoupment of prior expenses waived/reimbursed by investment advisor | | | — | | | | — | | | | — | | | | — | |
Total expenses | | | 776,151 | | | | 3,536,853 | | | | 1,457,902 | | | | 2,821,825 | |
Investment advisory fees waived | | | (235,958 | ) | | | (1,205,214 | ) | | | (427,077 | ) | | | (704,613 | ) |
Distribution fees waived | | | (46,356 | ) | | | (249,946 | ) | | | (201,286 | ) | | | (185,920 | ) |
Shareholder servicing fees waived | | | (196,632 | ) | | | (825,640 | ) | | | (355,899 | ) | | | (880,762 | ) |
Reimbursement from advisor | | | (126,066 | ) | | | (328,192 | ) | | | (192,007 | ) | | | (728,994 | ) |
Net expenses | | | 171,139 | | | | 927,861 | | | | 281,633 | | | | 321,536 | |
Net investment income | | | 8,731 | | | | 40,429 | | | | 14,396 | | | | 28,830 | |
| Net Realized/Unrealized Gain (Loss) on Investments, Options and Foreign Currency Transactions: | | | | | | | | | | | | | | | | |
Net realized gain (loss) on investment transactions | | | 205 | | | | (163,708 | ) | | | (1,213 | ) | | | 67 | |
Net realized gain (loss) on option transactions | | | — | | | | — | | | | — | | | | — | |
Net realized loss on foreign currency transactions | | | — | | | | — | | | | — | | | | — | |
Net realized gain (loss) on investments, options and foreign currency transactions | | | 205 | | | | (163,708 | ) | | | (1,213 | ) | | | 67 | |
Net change in unrealized appreciation of investments, options and translation of assets and liabilities in foreign currency | | | — | | | | — | | | | — | | | | — | |
Net realized and unrealized gain (loss) on investments, options and foreign currency transactions | | | 205 | | | | (163,708 | ) | | | (1,213 | ) | | | 67 | |
Change in net assets resulting from operations | | $ | 8,936 | | | $ | (123,279 | ) | | $ | 13,183 | | | $ | 28,897 | |
| | | | | | | | | | | | | | | | | |
| (a) | Income from securities lending is net of ($-, $-, $-, $-, $-, $9,042, $6,405, $5,651, $3,616 and $41,063) expenses paid to Huntington Bank. |
(See notes which are an integral part of the Financial Statements)
Annual Shareholder Report
102
| | | | | | | | | | | | | | | | | | | | | | |
Huntington
Disciplined
Equity
Fund | | | Huntington
Dividend
Capture
Fund | | | Huntington
Global Select
Markets
Fund | | | Huntington
Growth
Fund | | | Huntington
Income Equity
Fund | | | Huntington
International
Equity
Fund | |
| | | | | | | | | | | | | | | | | | | | | | |
| $ | 2,059,026 | | | $ | 8,351,333 | | | $ | 809,028 | | | $ | 2,621,350 | | | $ | 6,331,943 | | | $ | 8,907,226 | |
| | 910 | | | | 540 | | | | 139 | | | | 626 | | | | 321 | | | | 1,904 | |
| | — | | | | — | | | | 160,694 | | | | — | | | | — | | | | — | |
| | — | | | | 49,753 | | | | 30,770 | | | | 28,234 | | | | 23,071 | | | | 198,142 | |
| | — | | | | (114,536 | ) | | | (44,116 | ) | | | (15,319 | ) | | | (140,691 | ) | | | (972,394 | ) |
| | 2,059,936 | | | | 8,287,090 | | | | 956,515 | | | | 2,634,891 | | | | 6,214,644 | | | | 8,134,878 | |
| | | | | | | | | | | | | | | | | | | | | | |
| | 543,668 | | | | 1,300,716 | | | | 415,446 | | | | 813,677 | | | | 763,380 | | | | 2,807,135 | |
| | 165,093 | | | | 315,985 | | | | 75,694 | | | | 247,085 | | | | 231,812 | | | | 511,456 | |
| | 25,955 | | | | 46,695 | | | | 56,167 | | | | 36,696 | | | | 34,230 | | | | 116,172 | |
| | 34,219 | | | | 101,093 | | | | 29,564 | | | | 67,294 | | | | 54,471 | | | | 77,796 | |
| | 6,467 | | | | 14,384 | | | | 4,470 | | | | 11,172 | | | | 10,520 | | | | 23,357 | |
| | 25,319 | | | | 51,514 | | | | 12,098 | | | | 37,789 | | | | 36,762 | | | | 80,061 | |
| | 7,709 | | | | 5,867 | | | | 19,428 | | | | 4,234 | | | | 4,375 | | | | 21,029 | |
| | 18,260 | | | | 94,088 | | | | 1,051 | | | | 19,986 | | | | 14,667 | | | | 21,826 | |
| | 208,269 | | | | 339,484 | | | | 102,810 | | | | 319,047 | | | | 303,409 | | | | 679,958 | |
| | 18,260 | | | | 94,088 | | | | 1,051 | | | | 19,986 | | | | 14,667 | | | | 21,826 | |
| | 19,346 | | | | 27,903 | | | | 26,544 | | | | 27,453 | | | | 27,016 | | | | 27,872 | |
| | 33,450 | | | | — | | | | — | | | | — | | | | — | | | | — | |
| | 12,080 | | | | 26,418 | | | | 2,683 | | | | 12,611 | | | | 12,595 | | | | 22,283 | |
| | 4,786 | | | | 6,274 | | | | 3,571 | | | | 5,709 | | | | 5,357 | | | | 9,404 | |
| | 3,554 | | | | 6,703 | | | | 1,608 | | | | 5,224 | | | | 4,855 | | | | 11,231 | |
| | 1,551 | | | | 3,078 | | | | 812 | | | | 3,485 | | | | 2,459 | | | | 5,402 | |
| | 5,948 | | | | 12,457 | | | | 8,439 | | | | 9,933 | | | | 9,194 | | | | 23,007 | |
| | | | | |
| | — | | | | — | | | | 29,744 | | | | — | | | | — | | | | — | |
| | 1,133,934 | | | | 2,446,747 | | | | 791,180 | | | | 1,641,381 | | | | 1,529,769 | | | | 4,459,815 | |
| | (24,912 | ) | | | (254,226 | ) | | | — | | | | — | | | | — | | | | — | |
| | — | | | | — | | | | — | | | | — | | | | — | | | | — | |
| | — | | | | — | | | | — | | | | — | | | | — | | | | — | |
| | — | | | | — | | | | — | | | | — | | | | — | | | | — | |
| | 1,109,022 | | | | 2,192,521 | | | | 791,180 | | | | 1,641,381 | | | | 1,529,769 | | | | 4,459,815 | |
| | 950,914 | | | | 6,094,569 | | | | 165,335 | | | | 993,510 | | | | 4,684,875 | | | | 3,675,063 | |
| | | | | |
| | | | | | | | | | | | | | | | | | | | | | |
| | 944,784 | | | | 8,102,441 | | | | (1,843,004 | ) | | | 4,518,009 | | | | 3,378,253 | | | | 659,549 | |
| | (10,286,095 | ) | | | 149,295 | | | | 236,247 | | | | 89,622 | | | | 208,107 | | | | — | |
| | — | | | | — | | | | (52,564 | ) | | | — | | | | (23,075 | ) | | | (607,613 | ) |
| | | | | |
| | (9,341,311 | ) | | | 8,251,736 | | | | (1,659,321 | ) | | | 4,607,631 | | | | 3,563,285 | | | | 51,936 | |
| | | | | |
| | 8,777,939 | | | | 2,647,533 | | | | 5,612,636 | | | | 7,401,161 | | | | 4,345,968 | | | | 33,598,528 | |
| | | | | |
| | (563,372 | ) | | | 10,899,269 | | | | 3,953,315 | | | | 12,008,792 | | | | 7,909,253 | | | | 33,650,464 | |
| $ | 387,542 | | | $ | 16,993,838 | | | $ | 4,118,650 | | | $ | 13,002,302 | | | $ | 12,594,128 | | | $ | 37,325,527 | |
| | | | | | | | | | | | | | | | | | | | | | | |
Annual Shareholder Report
103
Statements of Operations (Continued)
Year Ended December 31, 2012
| | | | | | | | | | | | | | | | |
| | | Huntington
Mid Corp
America
Fund | | | Huntington
Real
Strategies
Fund | | | Huntington
Rotating
Markets
Fund | | | Huntington
Situs
Fund | |
| Investment Income: | | | | | | | | | | | | | | | | |
Dividend income | | $ | 2,276,446 | | | $ | 1,961,972 | | | $ | 733,473 | | | $ | 3,367,496 | |
Dividend income from affiliated securities | | | 766 | | | | 267,108 | | | | 129 | | | | 700 | |
Interest income | | | — | | | | — | | | | — | | | | — | |
Income from securities lending, net(a) | | | 121,620 | | | | 702,041 | | | | 8,902 | | | | 238,795 | |
Foreign dividend taxes withheld | | | (7,703 | ) | | | (96,066 | ) | | | (1,445 | ) | | | (8,390 | ) |
Total investment income | | | 2,391,129 | | | | 2,835,055 | | | | 741,059 | | | | 3,598,601 | |
| Expenses: | | | | | | | | | | | | | | | | |
Investment advisor fees | | | 1,057,513 | | | | 727,180 | | | | 200,488 | | | | 1,539,700 | |
Administration fees | | | 256,903 | | | | 176,655 | | | | 73,057 | | | | 374,041 | |
Custodian fees | | | 35,147 | | | | 25,277 | | | | 10,861 | | | | 59,784 | |
Transfer and dividend disbursing agent fees and expenses | | | 69,824 | | | | 39,092 | | | | 32,843 | | | | 94,288 | |
Trustees’ fees | | | 11,344 | | | | 8,024 | | | | 3,303 | | | | 17,132 | |
Professional fees | | | 54,201 | | | | 36,054 | | | | 11,240 | | | | 58,576 | |
Financial administration fees | | | 5,621 | | | | 3,529 | | | | 4,447 | | | | 20,633 | |
Distribution services fee—Class A Shares | | | 21,149 | | | | 5,000 | | | | 6,125 | | | | 62,812 | |
Shareholder services fee—Trust Shares | | | 331,355 | | | | 237,394 | | | | 94,119 | | | | 450,422 | |
Shareholder services fee—Class A Shares | | | 21,149 | | | | 5,000 | | | | 6,125 | | | | 62,812 | |
State registration costs | | | 46,006 | | | | 28,354 | | | | 25,924 | | | | 28,521 | |
Printing and postage | | | 26,104 | | | | 6,984 | | | | 3,826 | | | | 20,986 | |
Insurance premiums | | | 7,405 | | | | 4,977 | | | | 3,427 | | | | 7,445 | |
Compliance service fees | | | 5,225 | | | | 3,685 | | | | 1,573 | | | | 8,188 | |
Line of credit fees and interest expense | | | 3,531 | | | | 1,973 | | | | 799 | | | | 4,291 | |
Other | | | 10,191 | | | | 33,953 | | | | 2,951 | | | | 17,155 | |
Total expenses | | | 1,962,668 | | | | 1,343,131 | | | | 481,108 | | | | 2,826,786 | |
Net investment income | | | 428,461 | | | | 1,491,924 | | | | 259,951 | | | | 771,815 | |
| Net Realized/Unrealized Gain (Loss) on Investments, Options and Foreign Currency Transactions: | | | | | | | | | | | | | | | | |
Net realized gain on investment transactions | | | 16,918,500 | | | | 1,531,796 | | | | 8,738,493 | | | | 5,445,342 | |
Net realized gain on option transactions | | | — | | | | 337,144 | | | | — | | | | 1,057,428 | |
Net realized loss on foreign currency transactions | | | — | | | | — | | | | (91 | ) | | | (10,254 | ) |
Net realized gain on investments, options and foreign currency transactions | | | 16,918,500 | | | | 1,868,940 | | | | 8,738,402 | | | | 6,492,516 | |
Net change in unrealized appreciation/depreciation of investments, options and translation of assets and liabilities in foreign currency | | | 2,610,302 | | | | 1,336,944 | | | | (6,562,094 | ) | | | 37,169,548 | |
Net realized and unrealized gain (loss) on investments, options and foreign currency transactions | | | 19,528,802 | | | | 3,205,884 | | | | 2,176,308 | | | | 43,662,064 | |
Change in net assets resulting from operations | | $ | 19,957,263 | | | $ | 4,697,808 | | | $ | 2,436,259 | | | $ | 44,433,879 | |
| | | | | | | | | | | | | | | | | |
| (a) | Income from securities lending is net of ($31,268, $149,933, $1,507, $49,349, $-, $-, $564, $- and $- ) expenses paid to Huntington Bank. |
(See notes which are an integral part of the Financial Statements)
Annual Shareholder Report
104
| | | | | | | | | | | | | | | | | | |
Huntington
Fixed Income
Securities
Fund | | | Huntington
Intermediate
Government
Income Fund | | | Huntington
Mortgage
Securities
Fund | | | Huntington
Ohio
Tax-Free
Fund | | | Huntington
Short/Intermediate
Fixed Income
Securities Fund | |
| | | | | | | | | | | | | | | | | | |
| $ | 498,705 | | | $ | — | | | $ | 321,749 | | | $ | 37 | | | $ | — | |
| | 853 | | | | 462 | | | | 503 | | | | — | | | | 344 | |
| | 10,389,698 | | | | 4,073,942 | | | | 2,824,849 | | | | 1,737,245 | | | | 5,053,632 | |
| | — | | | | — | | | | 2,946 | | | | — | | | | — | |
| | — | | | | — | | | | (84 | ) | | | — | | | | — | |
| | 10,889,256 | | | | 4,074,404 | | | | 3,149,963 | | | | 1,737,282 | | | | 5,053,976 | |
| | | | | | | | | | | | | | | | | | |
| | 1,556,445 | | | | 690,956 | | | | 523,367 | | | | 279,080 | | | | 1,109,394 | |
| | 567,164 | | | | 251,782 | | | | 190,713 | | | | 101,696 | | | | 404,260 | |
| | 84,627 | | | | 38,138 | | | | 29,572 | | | | 15,327 | | | | 59,990 | |
| | 63,955 | | | | 42,612 | | | | 38,112 | | | | 31,085 | | | | 45,574 | |
| | 25,781 | | | | 11,474 | | | | 8,720 | | | | 4,622 | | | | 18,373 | |
| | 88,788 | | | | 37,013 | | | | 29,094 | | | | 15,892 | | | | 57,744 | |
| | 16,422 | | | | 21,031 | | | | 26,910 | | | | 33,210 | | | | 15,824 | |
| | 21,397 | | | | 13,009 | | | | 11,529 | | | | 8,010 | | | | 27,761 | |
| | 756,826 | | | | 332,469 | | | | 250,154 | | | | 131,530 | | | | 526,936 | |
| | 21,397 | | | | 13,009 | | | | 11,529 | | | | 8,010 | | | | 27,761 | |
| | 29,833 | | | | 32,686 | | | | 29,840 | | | | 28,015 | | | | 29,539 | |
| | 26,399 | | | | 9,037 | | | | 6,105 | | | | 3,743 | | | | 12,149 | |
| | 10,372 | | | | 6,089 | | | | 5,183 | | | | 3,841 | | | | 8,871 | |
| | 11,846 | | | | 4,977 | | | | 3,719 | | | | 2,160 | | | | 8,036 | |
| | 6,070 | | | | 2,821 | | | | 2,211 | | | | 1,111 | | | | 4,649 | |
| | 18,240 | | | | 8,719 | | | | 9,038 | | | | 3,764 | | | | 13,606 | |
| | 3,305,562 | | | | 1,515,822 | | | | 1,175,796 | | | | 671,096 | | | | 2,370,467 | |
| | 7,583,694 | | | | 2,558,582 | | | | 1,974,167 | | | | 1,066,186 | | | | 2,683,509 | |
| | | | | | | | | | | | | | | | | | |
| | 3,821,523 | | | | 538,950 | | | | 2,666,188 | | | | 1,310,617 | | | | 1,265,862 | |
| | — | | | | — | | | | — | | | | — | | | | — | |
| | — | | | | — | | | | (51 | ) | | | — | | | | — | |
|
3,821,523 |
| | | 538,950 | | | | 2,666,137 | | | | 1,310,617 | | | | 1,265,862 | |
|
777,910 |
| | | (645,661 | ) | | | (1,286,525 | ) | | | (236,909 | ) | | | (40,547 | ) |
|
4,599,433 |
| | | (106,711 | ) | | | 1,379,612 | | | | 1,073,708 | | | | 1,225,315 | |
| $ | 12,183,127 | | | $ | 2,451,871 | | | $ | 3,353,779 | | | $ | 2,139,894 | | | $ | 3,908,824 | |
| | | | | | | | | | | | | | | | | | | |
Annual Shareholder Report
105
Statements of Operations (Continued)
Year Ended December 31, 2012
| | | | | | | | | | | | |
| | | Huntington
Balanced
Allocation
Fund | | | Huntington
Conservative
Allocation
Fund | | | Huntington
Growth
Allocation
Fund | |
| Investment Income: | | | | | | | | | | | | |
Dividend income from affiliated securities | | $ | 339,254 | | | $ | 144,937 | | | $ | 220,120 | |
Total investment income | | | 339,254 | | | | 144,937 | | | | 220,120 | |
| Expenses: | | | | | | | | | | | | |
Investment advisor fees | | | 20,425 | | | | 7,614 | | | | 14,901 | |
Administration fees | | | 37,214 | | | | 13,872 | | | | 27,150 | |
Custodian fees | | | 2,269 | | | | 1,054 | | | | 1,738 | |
Transfer and dividend disbursing agent fees and expenses | | | 40,838 | | | | 16,464 | | | | 33,483 | |
Trustees’ fees | | | 1,683 | | | | 622 | | | | 1,219 | |
Professional fees | | | 5,458 | | | | 1,964 | | | | 3,926 | |
Financial administration fees | | | 1,136 | | | | 1,136 | | | | 1,136 | |
Distribution services fee-Class A Shares | | | 51,062 | | | | 19,034 | | | | 37,253 | |
State registration costs | | | 6,955 | | | | 7,173 | | | | 7,304 | |
Printing and postage | | | 8,683 | | | | 2,756 | | | | 7,776 | |
Insurance premiums | | | 3,121 | | | | 2,806 | | | | 2,955 | |
Compliance service fees | | | 659 | | | | 227 | | | | 453 | |
Line of credit fees and interest expense | | | 500 | | | | 253 | | | | 381 | |
Other | | | 1,452 | | | | 1,002 | | | | 1,425 | |
Total expenses | | | 181,455 | | | | 75,977 | | | | 141,100 | |
Investment advisory fees waived | | | (20,425 | ) | | | (7,614 | ) | | | (14,901 | ) |
Reimbursement from advisor | | | (21,625 | ) | | | (7,573 | ) | | | (31,965 | ) |
Net expenses | | | 139,405 | | | | 60,790 | | | | 94,234 | |
Net investment income | | | 199,849 | | | | 84,147 | | | | 125,886 | |
| Net Realized/Unrealized Gain (Loss) on Investments, Options and Foreign Currency Transactions: | | | | | | | | | | | | |
Net realized gain on investment transactions of affiliates | | | 1,945,715 | | | | 847,999 | | | | 1,993,339 | |
Net change in unrealized appreciation/depreciation of investments, options and translation of assets and liabilities in foreign currency | | | (96,551 | ) | | | (405,122 | ) | | | 59,471 | |
Net realized and unrealized gain on investments, options and foreign currency transactions | | | 1,849,164 | | | | 442,877 | | | | 2,052,810 | |
Change in net assets resulting from operations | | $ | 2,049,013 | | | $ | 527,024 | | | $ | 2,178,696 | |
| | | | | | | | | | | | | |
(See notes which are an integral part of the Financial Statements)
Annual Shareholder Report
106
[THIS PAGE INTENTIONALLY LEFT BLANK]
Statements of Changes in Net Assets
| | | | | | | | | | | | | | | | |
| | | Huntington Tax Free
Money Market Fund | | | Huntington Money
Market Fund | |
| | | Year Ended
December 31,
2012 | | | Year Ended
December 31,
2011 | | | Year Ended
December 31,
2012 | | | Year Ended
December 31,
2011 | |
| Increase (Decrease) in Net Assets: | | | | | | | | | | | | | | | | |
| Operations— | | | | | | | | | | | | | | | | |
Net investment income | | $ | 8,731 | | | $ | 8,164 | | | $ | 40,429 | | | $ | 42,252 | |
Net realized gain (loss) on investments, options and foreign currency transactions | | | 205 | | | | (2,595 | ) | | | (163,708 | ) | | | 1,625 | |
Net change in unrealized appreciation/depreciation of investments and foreign currency transactions | | | — | | | | — | | | | — | | | | — | |
Net increase (decrease) in net assets resulting from operations | | | 8,936 | | | | 5,569 | | | | (123,279 | ) | | | 43,877 | |
| Distributions to Shareholders— | | | | | | | | | | | | | | | | |
From and/or excess of net investment income: | | | | | | | | | | | | | | | | |
Trust Shares | | | (6,023 | ) | | | (6,724 | ) | | | (23,192 | ) | | | (21,900 | ) |
Class A Shares | | | (1,859 | ) | | | (1,440 | ) | | | (10,010 | ) | | | (12,137 | ) |
Interfund Shares | | | — | | | | — | | | | (7,157 | ) | | | (8,215 | ) |
From net realized gain on investments: | | | | | | | | | | | | | | | | |
Trust Shares | | | — | | | | — | | | | — | | | | — | |
Class A Shares | | | — | | | | — | | | | — | | | | — | |
Change in net assets resulting from distributions to shareholders | | | (7,882 | ) | | | (8,164 | ) | | | (40,359 | ) | | | (42,252 | ) |
Change in net assets resulting from capital transactions | | | (17,947,325 | ) | | | 9,573,351 | | | | (87,148,541 | ) | | | 38,243,528 | |
Change in net assets | | | (17,946,271 | ) | | | 9,570,756 | | | | (87,312,179 | ) | | | 38,245,153 | |
| Net Assets | | | | | | | | | | | | | | | | |
Beginning of period | | | 92,028,340 | | | | 82,457,584 | | | | 433,924,056 | | | | 395,678,903 | |
End of period | | $ | 74,082,069 | | | $ | 92,028,340 | | | $ | 346,611,877 | | | $ | 433,924,056 | |
| | | | | | | | | | | | | | | | | |
Accumulated net investment income (loss) included in net assets at
end of period | | $ | 849 | | | $ | — | | | $ | 70 | | | $ | — | |
| Capital Transactions: | | | | | | | | | | | | | | | | |
Trust Shares | | | | | | | | | | | | | | | | |
Shares Sold | | $ | 56,902,494 | | | $ | 67,664,242 | | | $ | 716,193,750 | | | $ | 773,485,556 | |
Shares issued in connection with the tax-free transfer of assets from Common Trust Fund | | | — | | | | — | | | | — | | | | — | |
Dividends reinvested | | | — | | | | — | | | | 503 | | | | 354 | |
Shares redeemed | | | (72,732,681 | ) | | | (61,434,072 | ) | | | (737,240,395 | ) | | | (726,400,546 | ) |
Total Trust Shares | | | (15,830,187 | ) | | | 6,230,170 | | | | (21,046,142 | ) | | | 47,085,364 | |
Class A Shares | | | | | | | | | | | | | | | | |
Shares Sold | | | 56,740,268 | | | | 58,167,655 | | | | 287,718,828 | | | | 261,065,458 | |
Shares issued in connection with the tax-free transfer of assets from Common Trust Fund | | | — | | | | — | | | | — | | | | — | |
Dividends reinvested | | | 347 | | | | 342 | | | | 7,974 | | | | 9,269 | |
Shares redeemed | | | (58,857,753 | ) | | | (54,824,816 | ) | | | (279,941,190 | ) | | | (298,113,211 | ) |
Total Class A Shares | | | (2,117,138 | ) | | | 3,343,181 | | | | 7,785,612 | | | | (37,038,484 | ) |
Interfund Shares | | | | | | | | | | | | | | | | |
Shares Sold | | | — | | | | — | | | | 403,044,413 | | | | 417,315,494 | |
Shares redeemed | | | — | | | | — | | | | (476,932,424 | ) | | | (389,118,846 | ) |
Total Interfund Shares | | | — | | | | — | | | | (73,888,011 | ) | | | 28,196,648 | |
Net change resulting from capital transactions | | $ | (17,947,325 | ) | | $ | 9,573,351 | | | $ | (87,148,541 | ) | | $ | 38,243,528 | |
| Share Transactions: | | | | | | | | | | | | | | | | |
Trust Shares | | | | | | | | | | | | | | | | |
Shares Sold | | | 56,902,494 | | | | 67,664,242 | | | | 716,193,750 | | | | 773,485,556 | |
Shares issued in connection with the tax-free transfer of assets from Common Trust Fund | | | — | | | | — | | | | — | | | | — | |
Dividends reinvested | | | — | | | | — | | | | 503 | | | | 354 | |
Shares redeemed | | | (72,732,681 | ) | | | (61,434,072 | ) | | | (737,206,459 | ) | | | (726,400,546 | ) |
Total Trust Shares | | | (15,830,187 | ) | | | 6,230,170 | | | | (21,012,206 | ) | | | 47,085,364 | |
Class A Shares | | | | | | | | | | | | | | | | |
Shares Sold | | | 56,740,268 | | | | 58,167,655 | | | | 287,718,828 | | | | 261,065,458 | |
Shares issued in connection with the tax-free transfer of assets from Common Trust Fund | | | — | | | | — | | | | — | | | | — | |
Dividends reinvested | | | 347 | | | | 342 | | | | 7,974 | | | | 9,269 | |
Shares redeemed | | | (58,857,753 | ) | | | (54,824,816 | ) | | | (279,926,202 | ) | | | (298,113,211 | ) |
Total Class A Shares | | | (2,117,138 | ) | | | 3,343,181 | | | | 7,800,600 | | | | (37,038,484 | ) |
Interfund Shares | | | | | | | | | | | | | | | | |
Shares Sold | | | — | | | | — | | | | 402,995,491 | | | | 417,315,494 | |
Shares redeemed | | | — | | | | — | | | | (476,932,423 | ) | | | (389,118,846 | ) |
Total Interfund Shares | | | — | | | | — | | | | (73,936,932 | ) | | | 28,196,648 | |
Net change resulting from share transactions | | | (17,947,325 | ) | | | 9,573,351 | | | | (87,148,538 | ) | | | 38,243,528 | |
| | | | | | | | | | | | | | | | | |
| (a) | For the period August 1, 2011 (commencement of operations) to December 31, 2011. |
(See notes which are an integral part of the Financial Statements)
Annual Shareholder Report
108
| | | | | | | | | | | | | | | | | | | | | | |
Huntington Ohio Municipal
Money Market Fund | | | Huntington U.S. Treasury
Money Market Fund | | | Huntington Disciplined
Equity Fund | |
Year Ended
December 31,
2012 | | | Year Ended
December 31,
2011 | | | Year Ended
December 31,
2012 | | | Year Ended
December 31,
2011 | | | Year Ended
December 31,
2012 | | | Year Ended
December 31,
2011 (a) | |
| | | | | | | | | | | | | | | | | | | | | | |
| | | | | | | | | | | | | | | | | | | | | | |
| $ | 14,396 | | | $ | 16,680 | | | $ | 28,830 | | | $ | 29,996 | | | $ | 950,914 | | | $ | 247,125 | |
| (1,213 | ) | | | (40,071 | ) | | | 67 | | | | 6,373 | | | | (9,341,311 | ) | | | (1,058,624 | ) |
| — | | | | — | | | | — | | | | — | | | | 8,777,939 | | | | (26,485 | ) |
| | 13,183 | | | | (23,391 | ) | | | 28,897 | | | | 36,369 | | | | 387,542 | | | | (837,984 | ) |
| | | | | | | | | | | | | | | | | | | | | | |
| | | | | | | | | | | | | | | | | | | | | | |
| | (6,202 | ) | | | (5,621 | ) | | | (28,863 | ) | | | (23,538 | ) | | | (892,663 | ) | | | (266,766 | ) |
| | (8,065 | ) | | | (11,059 | ) | | | — | | | | (6,145 | ) | | | (57,785 | ) | | | (21,232 | ) |
| | — | | | | — | | | | — | | | | — | | | | — | | | | — | |
| | | | | | | | | | | | | | | | | | | | | | |
| | — | | | | — | | | | — | | | | (8,142 | ) | | | — | | | | — | |
| | — | | | | — | | | | — | | | | (3,375 | ) | | | — | | | | — | |
| | (14,267 | ) | | | (16,680 | ) | | | (28,863 | ) | | | (41,200 | ) | | | (950,448 | ) | | | (287,998 | ) |
| | (13,261,003 | ) | | | (53,022,242 | ) | | | 511,287,647 | | | | (52,802,464 | ) | | | 23,594,794 | | | | 72,080,981 | |
| | (13,262,087 | ) | | | (53,062,313 | ) | | | 511,287,681 | | | | (52,807,295 | ) | | | 23,031,888 | | | | 70,954,999 | |
| | | | | | | | | | | | | | | | | | | | | | |
| | 145,069,678 | | | | 198,131,991 | | | | 334,907,800 | | | | 387,715,095 | | | | 70,954,999 | | | | — | |
| $ | 131,807,591 | | | $ | 145,069,678 | | | $ | 846,195,481 | | | $ | 334,907,800 | | | $ | 93,986,887 | | | $ | 70,954,999 | |
| | | | | | | | | | | | | | | | | | | | | | | |
$ | 129 | | | $ | — | | | $ | (105 | ) | | $ | (72 | ) | | $ | 466 | | | $ | — | |
| | | | | | | | | | | | | | | | | | | | | | |
| | | | | | | | | | | | | | | | | | | | | | |
| $ | 123,063,456 | | | $ | 126,996,635 | | | $ | 1,109,564,739 | | | $ | 648,652,822 | | | $ | 41,393,993 | | | $ | 21,204,767 | |
| — | | | | — | | | | — | | | | — | | | | — | | | | 48,595,623 | |
| | 15 | | | | 13 | | | | — | | | | 8,142 | | | | 218,645 | | | | 24,187 | |
| | (125,995,370 | ) | | | (146,794,278 | ) | | | (623,958,239 | ) | | | (709,824,569 | ) | | | (20,003,257 | ) | | | (3,438,144 | ) |
| | (2,931,899 | ) | | | (19,797,630 | ) | | | 485,606,500 | | | | (61,163,605 | ) | | | 21,609,381 | | | | 66,386,433 | |
| | | | | | | | | | | | | | | | | | | | | | |
| | 130,273,917 | | | | 548,673,359 | | | | 265,702,247 | | | | 197,411,425 | | | | 3,540,272 | | | | 5,789,312 | |
| — | | | | — | | | | — | | | | — | | | | — | | | | 10 | |
| | 4,139 | | | | 6,629 | | | | — | | | | 4,581 | | | | 48,941 | | | | 17,894 | |
| | (140,607,160 | ) | | | (581,904,600 | ) | | | (240,021,100 | ) | | | (189,054,865 | ) | | | (1,603,800 | ) | | | (112,668 | ) |
| | (10,329,104 | ) | | | (33,224,612 | ) | | | 25,681,147 | | | | 8,361,141 | | | | 1,985,413 | | | | 5,694,548 | |
| | | | | | | | | | | | | | | | | | | | | | |
| | — | | | | — | | | | — | | | | — | | | | — | | | | — | |
| | — | | | | — | | | | — | | | | — | | | | — | | | | — | |
| | — | | | | — | | | | — | | | | — | | | | — | | | | — | |
| $ | (13,261,003 | ) | | $ | (53,022,242 | ) | | $ | 511,287,647 | | | $ | (52,802,464 | ) | | $ | 23,594,794 | | | $ | 72,080,981 | |
| | | | | | | | | | | | | | | | | | | | | | |
| | | | | | | | | | | | | | | | | | | | | | |
| | 123,063,456 | | | | 126,996,635 | | | | 1,109,564,739 | | | | 648,652,822 | | | | 4,144,406 | | | | 2,143,223 | |
| — | | | | — | | | | — | | | | — | | | | — | | | | 4,859,562 | |
| | 15 | | | | 13 | | | | — | | | | 8,142 | | | | 22,494 | | | | 2,460 | |
| | (125,995,370 | ) | | | (146,794,278 | ) | | | (623,958,239 | ) | | | (709,824,569 | ) | | | (2,007,308 | ) | | | (348,160 | ) |
| | (2,931,899 | ) | | | (19,797,630 | ) | | | 485,606,500 | | | | (61,163,605 | ) | | | 2,159,592 | | | | 6,657,085 | |
| | | | | | | | | | | | | | | | | | | | | | |
| | 130,273,917 | | | | 548,673,359 | | | | 265,702,247 | | | | 197,411,425 | | | | 355,559 | | | | 587,829 | |
| — | | | | — | | | | — | | | | — | | | | — | | | | 1 | |
| | 4,139 | | | | 6,629 | | | | — | | | | 4,581 | | | | 5,040 | | | | 1,822 | |
| | (140,607,160 | ) | | | (581,904,600 | ) | | | (240,021,699 | ) | | | (189,054,265 | ) | | | (161,132 | ) | | | (11,443 | ) |
| | (10,329,104 | ) | | | (33,224,612 | ) | | | 25,680,548 | | | | 8,361,741 | | | | 199,467 | | | | 578,209 | |
| | | | | | | | | | | | | | | | | | | | | | |
| | — | | | | — | | | | — | | | | — | | | | — | | | | — | |
| | — | | | | — | | | | — | | | | — | | | | — | | | | — | |
| | — | | | | — | | | | — | | | | — | | | | — | | | | — | |
| | (13,261,003 | ) | | | (53,022,242 | ) | | | 511,287,048 | | | | (52,801,864 | ) | | | 2,359,059 | | | | 7,235,294 | |
| | | | | | | | | | | | | | | | | | | | | | | |
Annual Shareholder Report
109
Statements of Changes in Net Assets (Continued)
| | | | | | | | | | | | | | | | |
| | | Huntington Dividend
Capture Fund | | | Huntington Global Select
Markets Fund | |
| | | Year Ended
December 31,
2012 | | | Year Ended
December 31,
2011 | | | Year Ended
December 31,
2012 | | | Year Ended
December 31,
2011 | |
| Increase (Decrease) in Net Assets: | | | | | | | | | | | | | | | | |
| Operations— | | | | | | | | | | | | | | | | |
Net investment income | | $ | 6,094,569 | | | $ | 4,501,614 | | | $ | 165,335 | | | $ | 315,881 | |
Net realized gain (loss) on investments, options and foreign currency transactions | | | 8,251,736 | | | | 7,699,867 | | | | (1,659,321 | ) | | | 497,541 | |
Net change in unrealized appreciation/depreciation of investments and foreign currency transactions | | | 2,647,533 | | | | (4,530,906 | ) | | | 5,612,636 | | | | (8,647,406 | ) |
Net increase (decrease) in net assets resulting from operations | | | 16,993,838 | | | | 7,670,575 | | | | 4,118,650 | | | | (7,833,984 | ) |
| Distributions to Shareholders— | | | | | | | | | | | | | | | | |
From and/or excess of net investment income: | | | | | | | | | | | | | | | | |
Trust Shares | | | (5,565,125 | ) | | | (3,761,305 | ) | | | (159,357 | ) | | | (187,151 | ) |
Class A Shares | | | (1,525,931 | ) | | | (724,300 | ) | | | (642 | ) | | | (276 | ) |
From net realized gain on investments: | | | | | | | | | | | | | | | | |
Trust Shares | | | — | | | | — | | | | — | | | | (593,451 | ) |
Class A Shares | | | — | | | | — | | | | — | | | | (8,008 | ) |
From return of capital: | | | | | | | | | | | | | | | | |
Trust Shares | | | — | | | | — | | | | — | | | | — | |
Class A Shares | | | — | | | | — | | | | — | | | | — | |
Change in net assets resulting from distributions to shareholders | | | (7,091,056 | ) | | | (4,485,605 | ) | | | (159,999 | ) | | | (788,886 | ) |
Change in net assets resulting from capital transactions | | | 37,745,146 | | | | 23,049,868 | | | | (4,258,786 | ) | | | 6,059,221 | |
Change in net assets | | | 47,647,928 | | | | 26,234,838 | | | | (300,135 | ) | | | (2,563,649 | ) |
| Net Assets | | | | | | | | | | | | | | | | |
Beginning of period | | | 144,640,502 | | | | 118,405,664 | | | | 39,411,920 | | | | 41,975,569 | |
End of period | | $ | 192,288,430 | | | $ | 144,640,502 | | | $ | 39,111,785 | | | $ | 39,411,920 | |
| | | | | | | | | | | | | | | | | |
Accumulated net investment income (loss) included in net assets at end of period | | $ | (43,141 | ) | | $ | 37,108 | | | $ | (107,164 | ) | | $ | (16,915 | ) |
| Capital Transactions: | | | | | | | | | | | | | | | | |
Trust Shares | | | | | | | | | | | | | | | | |
Shares Sold | | $ | 40,172,943 | | | $ | 32,050,584 | | | $ | 10,312,738 | | | $ | 12,307,401 | |
Dividends reinvested | | | 3,233,036 | | | | 2,070,087 | | | | 84,555 | | | | 411,825 | |
Shares redeemed | | | (23,219,956 | ) | | | (19,607,001 | ) | | | (14,476,689 | ) | | | (6,510,892 | ) |
Total Trust Shares | | | 20,186,023 | | | | 14,513,670 | | | | (4,079,396 | ) | | | 6,208,334 | |
Class A Shares | | | | | | | | | | | | | | | | |
Shares Sold | | | 22,580,560 | | | | 11,825,724 | | | | 67,677 | | | | 340,116 | |
Dividends reinvested | | | 1,291,922 | | | | 635,178 | | | | 580 | | | | 7,714 | |
Shares redeemed | | | (6,313,359 | ) | | | (3,924,704 | ) | | | (247,647 | ) | | | (496,943 | ) |
Total Class A Shares | | | 17,559,123 | | | | 8,536,198 | | | | (179,390 | ) | | | (149,113 | ) |
Net change resulting from capital transactions | | $ | 37,745,146 | | | $ | 23,049,868 | | | $ | (4,258,786 | ) | | $ | 6,059,221 | |
| Share Transactions: | | | | | | | | | | | | | | | | |
Trust Shares | | | | | | | | | | | | | | | | |
Shares Sold | | | 4,271,135 | | | | 3,598,324 | | | | 1,026,696 | | | | 1,145,551 | |
Dividends reinvested | | | 343,572 | | | | 233,205 | | | | 8,241 | | | | 44,429 | |
Shares redeemed | | | (2,461,311 | ) | | | (2,182,272 | ) | | | (1,440,815 | ) | | | (626,131 | ) |
Total Trust Shares | | | 2,153,396 | | | | 1,649,257 | | | | (405,878 | ) | | | 563,849 | |
Class A Shares | | | | | | | | | | | | | | | | |
Shares Sold | | | 2,403,076 | | | | 1,337,708 | | | | 6,708 | | | | 30,193 | |
Dividends reinvested | | | 137,278 | | | | 71,696 | | | | 57 | | | | 838 | |
Shares redeemed | | | (669,608 | ) | | | (440,854 | ) | | | (24,303 | ) | | | (48,403 | ) |
Total Class A Shares | | | 1,870,746 | | | | 968,550 | | | | (17,538 | ) | | | (17,372 | ) |
Net change resulting from share transactions | | | 4,024,142 | | | | 2,617,807 | | | | (423,416 | ) | | | 546,477 | |
| | | | | | | | | | | | | | | | | |
(See notes which are an integral part of the Financial Statements)
Annual Shareholder Report
110
| | | | | | | | | | | | | | | | | | | | | | |
| Huntington Growth Fund | | | Huntington Income Equity Fund | | | Huntington International
Equity Fund | |
Year Ended
December 31,
2012 | | | Year Ended
December 31,
2011 | | | Year Ended
December 31,
2012 | | | Year Ended
December 31,
2011 | | | Year Ended
December 31,
2012 | | | Year Ended
December 31,
2011 | |
| | | | | | | | | | | | | | | | | | | | | | |
| | | | | | | | | | | | | | | | | | | | | | |
| $ | 993,510 | | | $ | 254,102 | | | $ | 4,684,875 | | | $ | 3,740,028 | | | $ | 3,675,063 | | | $ | 3,803,378 | |
|
4,607,631 |
| | | 2,647,005 | | | | 3,563,285 | | | | 3,950,748 | | | | 51,936 | | | | 9,790,649 | |
|
7,401,161 |
| | | (6,371,707 | ) | | | 4,345,968 | | | | (193,285 | ) | | | 33,598,528 | | | | (49,158,771 | ) |
| | 13,002,302 | | | | (3,470,600 | ) | | | 12,594,128 | | | | 7,497,491 | | | | 37,325,527 | | | | (35,564,744 | ) |
| | | | | | | | | | | | | | | | | | | | | | |
| | | | | | | | | | | | | | | | | | | | | | |
| | (1,018,815 | ) | | | — | | | | (4,338,945 | ) | | | (3,684,539 | ) | | | (4,653,459 | ) | | | (3,152,983 | ) |
| | (45,103 | ) | | | — | | | | (194,157 | ) | | | (181,417 | ) | | | (125,919 | ) | | | (75,222 | ) |
| | | | | | | | | | | | | | | | | | | | | | |
| | (5,675,876 | ) | | | (445,352 | ) | | | — | | | | — | | | | — | | | | — | |
| | (359,556 | ) | | | (29,303 | ) | | | — | | | | — | | | | — | | | | — | |
| | | | | | | | | | | | | | | | | | | | | | |
| | — | | | | — | | | | — | | | | — | | | | (94,060 | ) | | | — | |
| | — | | | | — | | | | — | | | | — | | | | (2,989 | ) | | | — | |
| | (7,099,350 | ) | | | (474,655 | ) | | | (4,533,102 | ) | | | (3,865,956 | ) | | | (4,876,427 | ) | | | (3,228,205 | ) |
| | 1,601,548 | | | | (724,066 | ) | | | 10,150,918 | | | | 8,869,137 | | | | (2,006,776 | ) | | | (4,611,886 | ) |
| | 7,504,500 | | | | (4,669,321 | ) | | | 18,211,944 | | | | 12,500,672 | | | | 30,442,324 | | | | (43,404,835 | ) |
| | | | | | | | | | | | | | | | | | | | | | |
| | 127,671,002 | | | | 132,340,323 | | | | 119,512,372 | | | | 107,011,700 | | | | 264,023,852 | | | | 307,428,687 | |
| $ | 135,175,502 | | | $ | 127,671,002 | | | $ | 137,724,316 | | | $ | 119,512,372 | | | $ | 294,466,176 | | | $ | 264,023,852 | |
| | | | | | | | | | | | | | | | | | | | | | | |
$ | — | | | $ | 274,078 | | | $ | 87,791 | | | $ | — | | | $ | (46,740 | ) | | $ | 1,808,148 | |
| | | | | | | | | | | | | | | | | | | | | | |
| | | | | | | | | | | | | | | | | | | | | | |
| $ | 24,365,943 | | | $ | 19,681,244 | | | $ | 29,782,777 | | | $ | 21,812,192 | | | $ | 52,256,824 | | | $ | 45,417,973 | |
| | 4,073,038 | | | | 267,140 | | | | 2,304,326 | | | | 1,916,821 | | | | 1,568,036 | | | | 1,022,412 | |
| | (26,472,457 | ) | | | (20,052,189 | ) | | | (22,127,076 | ) | | | (14,202,169 | ) | | | (55,721,464 | ) | | | (49,868,098 | ) |
| | 1,966,524 | | | | (103,805 | ) | | | 9,960,027 | | | | 9,526,844 | | | | (1,896,604 | ) | | | (3,427,713 | ) |
| | | | | | | | | | | | | | | | | | | | | | |
| | 841,494 | | | | 764,285 | | | | 835,914 | | | | 489,422 | | | | 1,968,828 | | | | 1,180,536 | |
| | 377,113 | | | | 26,996 | | | | 181,480 | | | | 172,508 | | | | 106,396 | | | | 64,241 | |
| | (1,583,583 | ) | | | (1,411,542 | ) | | | (826,503 | ) | | | (1,319,637 | ) | | | (2,185,396 | ) | | | (2,428,950 | ) |
| | (364,976 | ) | | | (620,261 | ) | | | 190,891 | | | | (657,707 | ) | | | (110,172 | ) | | | (1,184,173 | ) |
| $ | 1,601,548 | | | $ | (724,066 | ) | | $ | 10,150,918 | | | $ | 8,869,137 | | | $ | (2,006,776 | ) | | $ | (4,611,886 | ) |
| | | | | | | | | | | | | | | | | | | | | | |
| | | | | | | | | | | | | | | | | | | | | | |
| | 902,650 | | | | 770,849 | | | | 1,339,802 | | | | 1,048,330 | | | | 4,794,798 | | | | 4,037,721 | |
| | 156,456 | | | | 11,053 | | | | 104,419 | | | | 92,008 | | | | 139,629 | | | | 102,037 | |
| | (977,812 | ) | | | (787,063 | ) | | | (994,295 | ) | | | (680,027 | ) | | | (5,136,796 | ) | | | (4,505,642 | ) |
| | 81,294 | | | | (5,161 | ) | | | 449,926 | | | | 460,311 | | | | (202,369 | ) | | | (365,884 | ) |
| | | | | | | | | | | | | | | | | | | | | | |
| | 31,701 | | | | 30,660 | | | | 37,777 | | | | 23,485 | | | | 185,750 | | | | 103,553 | |
| | 14,993 | | | | 1,152 | | | | 8,219 | | | | 8,264 | | | | 9,542 | | | | 6,456 | |
| | (60,738 | ) | | | (56,960 | ) | | | (37,614 | ) | | | (63,577 | ) | | | (204,547 | ) | | | (220,778 | ) |
| | (14,044 | ) | | | (25,148 | ) | | | 8,382 | | | | (31,828 | ) | | | (9,255 | ) | | | (110,769 | ) |
| | 67,250 | | | | (30,309 | ) | | | 458,308 | | | | 428,483 | | | | (211,624 | ) | | | (476,653 | ) |
| | | | | | | | | | | | | | | | | | | | | | | |
Annual Shareholder Report
111
Statements of Changes in Net Assets (Continued)
| | | | | | | | | | | | | | | | |
| | | Huntington Mid Corp
America Fund | | | Huntington Real
Strategies Fund | |
| | | Year Ended
December 31,
2012 | | | Year Ended
December 31,
2011 | | | Year Ended
December 31,
2012 | | | Year Ended
December 31,
2011 | |
| Increase (Decrease) in Net Assets: | | | | | | | | | | | | | | | | |
| Operations— | | | | | | | | | | | | | | | | |
Net investment income (loss) | | $ | 428,461 | | | $ | 23,935 | | | $ | 1,491,924 | | | $ | 654,257 | |
Net realized gain (loss) on investments, options and foreign currency transactions | | | 16,918,500 | | | | 18,097,557 | | | | 1,868,940 | | | | (709,068 | ) |
Net change in unrealized appreciation/depreciation of investments and foreign currency transactions | | | 2,610,302 | | | | (21,804,829 | ) | | | 1,336,944 | | | | (10,531,268 | ) |
Net increase (decrease) in net assets resulting from operations | | | 19,957,263 | | | | (3,683,337 | ) | | | 4,697,808 | | | | (10,586,079 | ) |
| Distributions to Shareholders— | | | | | | | | | | | | | | | | |
From and/or excess of net investment income: | | | | | | | | | | | | | | | | |
Trust Shares | | | (149,997 | ) | | | (97,655 | ) | | | (1,285,857 | ) | | | (899,313 | ) |
Class A Shares | | | — | | | | — | | | | (24,146 | ) | | | (13,736 | ) |
From net realized gain on investments: | | | | | | | | | | | | | | | | |
Trust Shares | | | (17,640,298 | ) | | | (12,319,260 | ) | | | — | | | | — | |
Class A Shares | | | (1,242,961 | ) | | | (639,236 | ) | | | — | | | | — | |
Change in net assets resulting from distributions to shareholders | | | (19,033,256 | ) | | | (13,056,151 | ) | | | (1,310,003 | ) | | | (913,049 | ) |
Change in net assets resulting from capital transactions | | | 4,718,571 | | | | (3,322,751 | ) | | | 597,559 | | | | 13,113,232 | |
Change in net assets | | | 5,642,578 | | | | (20,062,239 | ) | | | 3,985,364 | | | | 1,614,104 | |
| Net Assets | | | | | | | | | | | | | | | | |
Beginning of period | | | 128,733,382 | | | | 148,795,621 | | | | 94,479,482 | | | | 92,865,378 | |
End of period | | $ | 134,375,960 | | | $ | 128,733,382 | | | $ | 98,464,846 | | | $ | 94,479,482 | |
| | | | | | | | | | | | | | | | | |
Accumulated net investment income (loss) included in net assets at end of period | | $ | 215,397 | | | $ | 5,876 | | | $ | (991,906 | ) | | $ | (915,791 | ) |
| Capital Transactions: | | | | | | | | | | | | | | | | |
Trust Shares | | | | | | | | | | | | | | | | |
Shares Sold | | $ | 13,827,713 | | | $ | 18,588,560 | | | $ | 20,221,413 | | | $ | 37,420,468 | |
Shares issued in connection with merger | | | 13,560,775 | | | | — | | | | — | | | | — | |
Dividends reinvested | | | 6,759,528 | | | | 4,371,336 | | | | 408,815 | | | | 258,126 | |
Shares redeemed | | | (31,979,155 | ) | | | (26,171,585 | ) | | | (20,138,159 | ) | | | (24,780,098 | ) |
Total Trust Shares | | | 2,168,861 | | | | (3,211,689 | ) | | | 492,069 | | | | 12,898,496 | |
Class A Shares | | | | | | | | | | | | | | | | |
Shares Sold | | | 603,617 | | | | 664,160 | | | | 600,612 | | | | 705,556 | |
Shares issued in connection with merger | | | 2,975,148 | | | | — | | | | — | | | | — | |
Dividends reinvested | | | 1,210,525 | | | | 616,095 | | | | 20,226 | | | | 12,963 | |
Shares redeemed | | | (2,239,580 | ) | | | (1,391,317 | ) | | | (515,348 | ) | | | (503,783 | ) |
Total Class A Shares | | | 2,549,710 | | | | (111,062 | ) | | | 105,490 | | | | 214,736 | |
Net change resulting from capital transactions | | $ | 4,718,571 | | | $ | (3,322,751 | ) | | $ | 597,559 | | | $ | 13,113,232 | |
| Share Transactions: | | | | | | | | | | | | | | | | |
Trust Shares | | | | | | | | | | | | | | | | |
Shares Sold | | | 798,431 | | | | 1,166,714 | | | | 2,703,233 | | | | 4,740,773 | |
Shares issued in connection with merger | | | 964,397 | | | | — | | | | — | | | | — | |
Dividends reinvested | | | 500,075 | | | | 328,570 | | | | 56,002 | | | | 36,254 | |
Shares redeemed | | | (1,992,180 | ) | | | (1,661,809 | ) | | | (2,713,598 | ) | | | (3,210,607 | ) |
Total Trust Shares | | | 270,723 | | | | (166,525 | ) | | | 45,637 | | | | 1,566,420 | |
Class A Shares | | | | | | | | | | | | | | | | |
Shares Sold | | | 32,860 | | | | 43,592 | | | | 80,216 | | | | 85,751 | |
Shares issued in connection with merger | | | 218,019 | | | | — | | | | — | | | | — | |
Dividends reinvested | | | 93,189 | | | | 47,722 | | | | 2,771 | | | | 1,818 | |
Shares redeemed | | | (146,351 | ) | | | (89,497 | ) | | | (70,324 | ) | | | (64,265 | ) |
Total Class A Shares | | | 197,717 | | | | 1,817 | | | | 12,663 | | | | 23,304 | |
Net change resulting from share transactions | | | 468,440 | | | | (164,708 | ) | | | 58,300 | | | | 1,589,724 | |
| | | | | | | | | | | | | | | | | |
(See notes which are an integral part of the Financial Statements)
Annual Shareholder Report
112
| | | | | | | | | | | | | | | | | | | | | | |
Huntington Rotating
Markets Fund | | | Huntington Situs Fund | | | Huntington Fixed Income
Securities Fund | |
Year Ended
December 31,
2012 | | | Year Ended
December 31,
2011 | | | Year Ended
December 31,
2012 | | | Year Ended
December 31,
2011 | | | Year Ended
December 31,
2012 | | | Year Ended
December 31,
2011 | |
| | | | | | | | | | | | | | | | | | | | | | |
| | | | | | | | | | | | | | | | | | | | | | |
| $ | 259,951 | | | $ | 539,094 | | | $ | 771,815 | | | $ | (581,219 | ) | | $ | 7,583,694 | | | $ | 7,762,353 | |
| | | | | | | | | | | | | | | | | | | | | | |
| | 8,738,402 | | | | 629,341 | | | | 6,492,516 | | | | 8,676,937 | | | | 3,821,523 | | | | 4,032,626 | |
| | | | | | | | | | | | | | | | | | | | | | |
| | (6,562,094 | ) | | | 1,308,609 | | | | 37,169,548 | | | | (14,992,446 | ) | | | 777,910 | | | | 5,839,115 | |
|
2,436,259 |
| | | 2,477,044 | | | | 44,433,879 | | | | (6,896,728 | ) | | | 12,183,127 | | | | 17,634,094 | |
| | | | | | | | | | | | | | | | | | | | | | |
| | | | | | | | | | | | | | | | | | | | | | |
| | (758,865 | ) | | | (100,111 | ) | | | (325,001 | ) | | | — | | | | (7,395,799 | ) | | | (7,570,193 | ) |
| | (39,134 | ) | | | (954 | ) | | | — | | | | — | | | | (187,895 | ) | | | (192,160 | ) |
| | | | | | | | | | | | | | | | | | | | | | |
| | (4,850,052 | ) | | | — | | | | (5,957,785 | ) | | | — | | | | (2,812,485 | ) | | | (4,143,613 | ) |
| | (309,983 | ) | | | — | | | | (901,370 | ) | | | — | | | | (87,923 | ) | | | (118,667 | ) |
| | | | | | | | | | | | | | | | | | | | | | |
| | (5,958,034 | ) | | | (101,065 | ) | | | (7,184,156 | ) | | | — | | | | (10,484,102 | ) | | | (12,024,633 | ) |
| | | | | | | | | | | | | | | | | | | | | | |
| | 6,656,674 | | | | (4,287,636 | ) | | | (4,551,643 | ) | | | (11,860,698 | ) | | | 10,923,774 | | | | 1,347,901 | |
| | 3,134,899 | | | | (1,911,657 | ) | | | 32,698,080 | | | | (18,757,426 | ) | | | 12,622,799 | | | | 6,957,362 | |
| | | | | | | | | | | | | | | | | | | | | | |
| | 37,417,567 | | | | 39,329,224 | | | | 188,543,742 | | | | 207,301,168 | | | | 299,323,564 | | | | 292,366,202 | |
| $ | 40,552,466 | | | $ | 37,417,567 | | | $ | 221,241,822 | | | $ | 188,543,742 | | | $ | 311,946,363 | | | $ | 299,323,564 | |
| | | | | | | | | | | | | | | | | | | | | | | |
| | | | | | | | | | | | | | | | | | | | | | |
| $ | 10,846 | | | $ | 539,093 | | | $ | 235,461 | | | $ | (155,891 | ) | | $ | (19,968 | ) | | $ | (16,774 | ) |
| | | | | | | | | | | | | | | | | | | | | | |
| | | | | | | | | | | | | | | | | | | | | | |
| $ | 6,366,986 | | | $ | 3,900,442 | | | $ | 35,261,454 | | | $ | 34,971,497 | | | $ | 89,501,492 | | | $ | 68,344,071 | |
| | — | | | | — | | | | — | | | | — | | | | — | | | | — | |
| | 3,965,424 | | | | 67,159 | | | | 2,781,390 | | | | — | | | | 4,976,640 | | | | 5,506,054 | |
| | (3,795,494 | ) | | | (7,875,296 | ) | | | (44,258,695 | ) | | | (46,157,899 | ) | | | (84,907,102 | ) | | | (72,071,979 | ) |
| | 6,536,916 | | | | (3,907,695 | ) | | | (6,215,851 | ) | | | (11,186,402 | ) | | | 9,571,030 | | | | 1,778,146 | |
| | | | | | | | | | | | | | | | | | | | | | |
| | 404,293 | | | | 257,504 | | | | 11,402,172 | | | | 5,596,096 | | | | 3,201,216 | | | | 1,931,458 | |
| | — | | | | — | | | | — | | | | — | | | | — | | | | — | |
| | 345,792 | | | | 928 | | | | 718,866 | | | | — | | | | 236,380 | | | | 251,171 | |
| | (630,327 | ) | | | (638,373 | ) | | | (10,456,830 | ) | | | (6,270,392 | ) | | | (2,084,852 | ) | | | (2,612,874 | ) |
| | 119,758 | | | | (379,941 | ) | | | 1,664,208 | | | | (674,296 | ) | | | 1,352,744 | | | | (430,245 | ) |
| $ | 6,656,674 | | | $ | (4,287,636 | ) | | $ | (4,551,643 | ) | | $ | (11,860,698 | ) | | $ | 10,923,774 | | | $ | 1,347,901 | |
| | | | | | | | | | | | | | | | | | | | | | |
| | | | | | | | | | | | | | | | | | | | | | |
| | 565,034 | | | | 353,974 | | | | 1,603,245 | | | | 1,699,623 | | | | 3,926,861 | | | | 3,043,221 | |
| | — | | | | — | | | | — | | | | — | | | | — | | | | — | |
| | 374,798 | | | | 5,790 | | | | 121,716 | | | | — | | | | 218,067 | | | | 244,585 | |
| | (316,263 | ) | | | (704,813 | ) | | | (2,010,143 | ) | | | (2,260,429 | ) | | | (3,719,536 | ) | | | (3,212,395 | ) |
| | 623,569 | | | | (345,049 | ) | | | (285,182 | ) | | | (560,806 | ) | | | 425,392 | | | | 75,411 | |
| | | | | | | | | | | | | | | | | | | | | | |
| | 33,519 | | | | 22,904 | | | | 525,642 | | | | 281,070 | | | | 139,993 | | | | 85,665 | |
| | — | | | | — | | | | — | | | | — | | | | — | | | | — | |
| | 32,970 | | | | 81 | | | | 32,367 | | | | — | | | | 10,361 | | | | 11,160 | |
| | (52,598 | ) | | | (57,171 | ) | | | (486,707 | ) | | | (318,174 | ) | | | (91,472 | ) | | | (116,908 | ) |
| | 13,891 | | | | (34,186 | ) | | | 71,302 | | | | (37,104 | ) | | | 58,882 | | | | (20,083 | ) |
| | 637,460 | | | | (379,235 | ) | | | (213,880 | ) | | | (597,910 | ) | | | 484,274 | | | | 55,328 | |
| | | | | | | | | | | | | | | | | | | | | | | |
Annual Shareholder Report
113
Statements of Changes in Net Assets (Continued)
| | | | | | | | |
| | | Huntington Intermediate
Government Income Fund | |
| | | Year Ended
December 31,
2012 | | | Year Ended
December 31,
2011 | |
| Increase (Decrease) in Net Assets: | | | | | | | | |
| Operations— | | | | | | | | |
Net investment income | | $ | 2,558,582 | | | $ | 3,112,888 | |
Net realized gain on investments, options and foreign currency transactions | | | 538,950 | | | | 385,408 | |
Net change in unrealized appreciation of investments and foreign currency transactions | | | (645,661 | ) | | | 3,095,131 | |
Net increase in net assets resulting from operations | | | 2,451,871 | | | | 6,593,427 | |
| Distributions to Shareholders— | | | | | | | | |
From and/or excess of net investment income: | | | | | | | | |
Trust Shares | | | (2,679,518 | ) | | | (3,130,811 | ) |
Class A Shares | | | (91,998 | ) | | | (100,933 | ) |
From net realized gain on investments: | | | | | | | | |
Trust Shares | | | (119,827 | ) | | | (243,420 | ) |
Class A Shares | | | (5,540 | ) | | | (8,818 | ) |
Change in net assets resulting from distributions to shareholders | | | (2,896,883 | ) | | | (3,483,982 | ) |
Change in net assets resulting from capital transactions | | | (17,016,952 | ) | | | 15,726,741 | |
Change in net assets | | | (17,461,964 | ) | | | 18,836,186 | |
| Net Assets | | | | | | | | |
Beginning of period | | | 138,980,628 | | | | 120,144,442 | |
End of period | | $ | 121,518,664 | | | $ | 138,980,628 | |
| | | | | | | | | |
Accumulated net investment income (loss) included in net assets at end of period | | $ | 189,037 | | | $ | 55,015 | |
| Capital Transactions: | | | | | | | | |
Trust Shares | | | | | | | | |
Shares Sold | | $ | 23,029,934 | | | $ | 31,715,627 | |
Dividends reinvested | | | 1,394,820 | | | | 1,774,826 | |
Shares redeemed | | | (41,870,812 | ) | | | (17,822,795 | ) |
Total Trust Shares | | | (17,446,058 | ) | | | 15,667,658 | |
Class A Shares | | | | | | | | |
Shares Sold | | | 1,630,219 | | | | 1,381,276 | |
Dividends reinvested | | | 81,811 | | | | 92,463 | |
Shares redeemed | | | (1,282,924 | ) | | | (1,414,656 | ) |
Total Class A Shares | | | 429,106 | | | | 59,083 | |
Net change resulting from capital transactions | | $ | (17,016,952 | ) | | $ | 15,726,741 | |
| Share Transactions: | | | | | | | | |
Trust Shares | | | | | | | | |
Shares Sold | | | 2,068,338 | | | | 2,898,201 | |
Dividends reinvested | | | 125,215 | | | | 161,097 | |
Shares redeemed | | | (3,754,805 | ) | | | (1,617,949 | ) |
Total Trust Shares | | | (1,561,252 | ) | | | 1,441,349 | |
Class A Shares | | | | | | | | |
Shares Sold | | | 146,311 | | | | 125,356 | |
Dividends reinvested | | | 7,344 | | | | 8,399 | |
Shares redeemed | | | (115,206 | ) | | | (129,148 | ) |
Total Class A Shares | | | 38,449 | | | | 4,607 | |
Net change resulting from share transactions | | | (1,522,803 | ) | | | 1,445,956 | |
| | | | | | | | | |
(See notes which are an integral part of the Financial Statements)
Annual Shareholder Report
114
| | | | | | | | | | | | | | | | | | | | | | |
Huntington Mortgage
Securities Fund | | | Huntington Ohio Tax-Free Fund | | | Huntington Short/Intermediate
Fixed Income Securities Fund | |
Year Ended
December 31,
2012 | | | Year Ended
December 31,
2011 | | | Year Ended
December 31,
2012 | | | Year Ended
December 31,
2011 | | | Year Ended
December 31,
2012 | | | Year Ended
December 31,
2011 | |
| | | | | | | | | | | | | | | | | | | | | | |
| | | | | | | | | | | | | | | | | | | | | | |
| $ | 1,974,167 | | | $ | 2,669,878 | | | $ | 1,066,186 | | | $ | 1,073,310 | | | $ | 2,683,509 | | | $ | 3,081,317 | |
| | 2,666,137 | | | | 93,954 | | | | 1,310,617 | | | | 362,402 | | | | 1,265,862 | | | | 827,430 | |
| | (1,286,525 | ) | | | 2,273,738 | | | | (236,909 | ) | | | 2,185,575 | | | | (40,547 | ) | | | 599,081 | |
| | 3,353,779 | | | | 5,037,570 | | | | 2,139,894 | | | | 3,621,287 | | | | 3,908,824 | | | | 4,507,828 | |
| | | | | | | | | | | | | | | | | | | | | | |
| | | | | | | | | | | | | | | | | | | | | | |
| | (2,535,226 | ) | | | (3,164,131 | ) | | | (1,012,511 | ) | | | (1,018,866 | ) | | | (2,576,124 | ) | | | (2,985,572 | ) |
| | (106,188 | ) | | | (119,222 | ) | | | (53,675 | ) | | | (54,444 | ) | | | (107,385 | ) | | | (95,745 | ) |
| | | | | | | | | | | | | | | | | | | | | | |
| | (491,462 | ) | | | — | | | | (978,245 | ) | | | (343,755 | ) | | | — | | | | — | |
| | (31,853 | ) | | | — | | | | (63,005 | ) | | | (21,841 | ) | | | — | | | | — | |
| | (3,164,729 | ) | | | (3,283,353 | ) | | | (2,107,436 | ) | | | (1,438,906 | ) | | | (2,683,509 | ) | | | (3,081,317 | ) |
| | (30,102,651 | ) | | | 6,036,305 | | | | 230,660 | | | | (346,421 | ) | | | (27,238,642 | ) | | | 19,396,728 | |
| | (29,913,601 | ) | | | 7,790,522 | | | | 263,118 | | | | 1,835,960 | | | | (26,013,327 | ) | | | 20,823,239 | |
| | | | | | | | | | | | | | | | | | | | | | |
| | 108,532,500 | | | | 100,741,978 | | | | 53,769,290 | | | | 51,933,330 | | | | 224,941,231 | | | | 204,117,992 | |
| $ | 78,618,899 | | | $ | 108,532,500 | | | $ | 54,032,408 | | | $ | 53,769,290 | | | $ | 198,927,904 | | | $ | 224,941,231 | |
| | | | | | | | | | | | | | | | | | | | | | | |
| $ | (5,207 | ) | | $ | (11,193 | ) | | $ | — | | | $ | (187 | ) | | $ | — | | | $ | — | |
| | | | | | | | | | | | | | | | | | | | | | |
| | | | | | | | | | | | | | | | | | | | | | |
| $ | 22,299,497 | | | $ | 18,868,700 | | | $ | 15,045,712 | | | $ | 10,430,577 | | | $ | 68,828,660 | | | $ | 66,951,627 | |
| | 1,094,220 | | | | 1,349,960 | | | | 165,244 | | | | 136,228 | | | | 662,525 | | | | 878,814 | |
| | (53,882,025 | ) | | | (14,633,514 | ) | | | (15,321,574 | ) | | | (10,741,564 | ) | | | (98,661,516 | ) | | | (49,955,588 | ) |
| | (30,488,308 | ) | | | 5,585,146 | | | | (110,618 | ) | | | (174,759 | ) | | | (29,170,331 | ) | | | 17,874,853 | |
| | | | | | | | | | | | | | | | | | | | | | |
| | 1,439,782 | | | | 1,083,210 | | | | 831,863 | | | | 782,345 | | | | 4,842,752 | | | | 2,850,984 | |
| | 125,643 | | | | 101,070 | | | | 93,631 | | | | 64,269 | | | | 105,494 | | | | 93,552 | |
| | (1,179,768 | ) | | | (733,121 | ) | | | (584,216 | ) | | | (1,018,276 | ) | | | (3,016,557 | ) | | | (1,422,661 | ) |
| | 385,657 | | | | 451,159 | | | | 341,278 | | | | (171,662 | ) | | | 1,931,689 | | | | 1,521,875 | |
| $ | (30,102,651 | ) | | $ | 6,036,305 | | | $ | 230,660 | | | $ | (346,421 | ) | | $ | (27,238,642 | ) | | $ | 19,396,728 | |
| | | | | | | | | | | | | | | | | | | | | | |
| | | | | | | | | | | | | | | | | | | | | | |
| | 2,389,996 | | | | 2,118,175 | | | | 680,696 | | | | 485,519 | | | | 3,405,258 | | | | 3,344,127 | |
| | 117,258 | | | | 146,729 | | | | 7,478 | | | | 6,330 | | | | 32,779 | | | | 43,770 | |
| | (5,751,919 | ) | | | (1,658,877 | ) | | | (691,230 | ) | | | (503,886 | ) | | | (4,879,412 | ) | | | (2,487,971 | ) |
| | (3,244,665 | ) | | | 606,027 | | | | (3,056 | ) | | | (12,037 | ) | | | (1,441,375 | ) | | | 899,926 | |
| | | | | | | | | | | | | | | | | | | | | | |
| | 153,113 | | | | 117,347 | | | | 37,704 | | | | 36,252 | | | | 239,572 | | | | 141,855 | |
| | 13,420 | | | | 10,918 | | | | 4,241 | | | | 2,983 | | | | 5,217 | | | | 4,660 | |
| | (125,517 | ) | | | (79,294 | ) | | | (26,431 | ) | | | (47,983 | ) | | | (149,321 | ) | | | (70,786 | ) |
| | 41,016 | | | | 48,971 | | | | 15,514 | | | | (8,748 | ) | | | 95,468 | | | | 75,729 | |
| | (3,203,649 | ) | | | 654,998 | | | | 12,458 | | | | (20,785 | ) | | | (1,345,907 | ) | | | 975,655 | |
| | | | | | | | | | | | | | | | | | | | | | | |
Annual Shareholder Report
115
Statements of Changes in Net Assets (Continued)
| | | | | | | | |
| | | Huntington Balanced
Allocation Fund | |
| | | Year Ended
December 31,
2012 | | | Year Ended
December 31,
2011 | |
| Increase (Decrease) in Net Assets: | | | | | | | | |
| Operations— | | | | | | | | |
Net investment income | | $ | 199,849 | | | $ | 245,948 | |
Net realized gain on investments, options and foreign currency transactions | | | 1,945,715 | | | | 374,595 | |
Net change in unrealized appreciation/depreciation of investments and foreign currency transactions | | | (96,551 | ) | | | (762,769 | ) |
Net increase (decrease) in net assets resulting from operations | | | 2,049,013 | | | | (142,226 | ) |
| Distributions to Shareholders— | | | | | | | | |
From and/or excess of net investment income: | | | | | | | | |
Class A Shares | | | (195,879 | ) | | | (248,774 | ) |
From net realized gain on investments: | | | | | | | | |
Class A Shares | | | (1,634,017 | ) | | | (269,854 | ) |
Change in net assets resulting from distributions to shareholders | | | (1,829,896 | ) | | | (518,628 | ) |
Change in net assets resulting from capital transactions | | | (9,669,159 | ) | | | 3,646,786 | |
Change in net assets | | | (9,450,042 | ) | | | 2,985,932 | |
| Net Assets | | | | | | | | |
Beginning of period | | | 27,641,917 | | | | 24,655,985 | |
End of period | | $ | 18,191,875 | | | $ | 27,641,917 | |
| | | | | | | | | |
Accumulated net investment income (loss) included in net assets at end of period | | $ | 697 | | | $ | (2,275 | ) |
| Capital Transactions: | | | | | | | | |
Shares | | | | | | | | |
Shares Sold | | $ | 4,756,802 | | | $ | 7,107,781 | |
Dividends reinvested | | | 1,725,282 | | | | 506,384 | |
Shares redeemed | | | (16,151,243 | ) | | | (3,967,379 | ) |
Total Shares | | | (9,669,159 | ) | | | 3,646,786 | |
Net change resulting from capital transactions | | $ | (9,669,159 | ) | | $ | 3,646,786 | |
| Share Transactions: | | | | | | | | |
Shares | | | | | | | | |
Shares Sold | | | 401,594 | | | | 605,947 | |
Dividends reinvested | | | 156,281 | | | | 44,859 | |
Shares redeemed | | | (1,341,396 | ) | | | (343,104 | ) |
Total Shares | | | (783,521 | ) | | | 307,702 | |
Net change resulting from share transactions | | | (783,521 | ) | | | 307,702 | |
| | | | | | | | | |
(See notes which are an integral part of the Financial Statements)
Annual Shareholder Report
116
| | | | | | | | | | | | | | |
Huntington Conservative
Allocation Fund | | | Huntington Growth
Allocation Fund | |
Year Ended
December 31,
2012 | | | Year Ended
December 31,
2011 | | | Year Ended
December 31,
2012 | | | Year Ended
December 31,
2011 | |
| | | | | | | | | | | | | | |
| | | | | | | | | | | | | | |
| $ | 84,147 | | | $ | 219,151 | | | $ | 125,886 | | | $ | 133,794 | |
| | 847,999 | | | | 162,459 | | | | 1,993,339 | | | | 353,889 | |
| (405,122 | ) | | | (14,265 | ) | | | 59,471 | | | | (1,007,581 | ) |
| | 527,024 | | | | 367,345 | | | | 2,178,696 | | | | (519,898 | ) |
| | | | | | | | | | | | | | |
| | | | | | | | | | | | | | |
| | (84,937 | ) | | | (219,159 | ) | | | (127,525 | ) | | | (132,455 | ) |
| | | | | | | | | | | | | | |
| | (858,976 | ) | | | (116,841 | ) | | | (1,685,603 | ) | | | (272,255 | ) |
| | (943,913 | ) | | | (336,000 | ) | | | (1,813,128 | ) | | | (404,710 | ) |
| | (10,360,220 | ) | | | 673,063 | | | | (8,793,409 | ) | | | 3,410,873 | |
| | (10,777,109 | ) | | | 704,408 | | | | (8,427,841 | ) | | | 2,486,265 | |
| | | | | | | | | | | | | | |
| | 15,544,289 | | | | 14,839,881 | | | | 21,618,299 | | | | 19,132,034 | |
| $ | 4,767,180 | | | $ | 15,544,289 | | | $ | 13,190,458 | | | $ | 21,618,299 | |
| | | | | | | | | | | | | | | |
| $ | — | | | $ | 664 | | | $ | — | | | $ | 1,537 | |
| | | | | | | | | | | | | | |
| | | | | | | | | | | | | | |
| $ | 2,358,583 | | | $ | 2,181,503 | | | $ | 4,045,897 | | | $ | 4,824,443 | |
| | 875,337 | | | | 331,192 | | | | 1,747,429 | | | | 396,051 | |
| | (13,594,140 | ) | | | (1,839,632 | ) | | | (14,586,735 | ) | | | (1,809,621 | ) |
| | (10,360,220 | ) | | | 673,063 | | | | (8,793,409 | ) | | | 3,410,873 | |
| $ | (10,360,220 | ) | | $ | 673,063 | | | $ | (8,793,409 | ) | | $ | 3,410,873 | |
| | | | | | | | | | | | | | |
| | | | | | | | | | | | | | |
| | 215,570 | | | | 202,069 | | | | 332,783 | | | | 398,784 | |
| | 94,671 | | | | 30,758 | | | | 160,209 | | | | 35,088 | |
| | (1,237,186 | ) | | | (171,085 | ) | | | (1,167,770 | ) | | | (155,795 | ) |
| | (926,945 | ) | | | 61,742 | | | | (674,778 | ) | | | 278,077 | |
| | (926,945 | ) | | | 61,742 | | | | (674,778 | ) | | | 278,077 | |
| | | | | | | | | | | | | | | |
Annual Shareholder Report
117
Financial Highlights
Money Market Funds
(For a share outstanding throughout each period)
| | | | | | | | | | | | | | | | | | | | | | | | | | | | |
| | | Net Asset
Value,
beginning
of period | | | Net
investment
income (loss) | | | Net realized
and unrealized
gain (loss) on
investments | | | Total from
investment
operations | | | Distributions
from net
investment
income | | | Distributions
from net
realized gain
on investment
transactions | | | Total
distributions | |
| HUNTINGTON TAX FREE MONEY MARKET FUND | | | | | | | | | | | | | |
| Trust Shares | | | | | | | | | | | | | |
2008 | | $ | 1.00 | | | | 0.02 | | | | — | (2) | | | 0.02 | | | | (0.02 | ) | | | — | | | | (0.02 | ) |
2009 | | $ | 1.00 | | | | — | (2) | | | — | (2) | | | — | (2) | | | — | (2) | | | — | | | | — | (2) |
2010 | | $ | 1.00 | | | | — | (2) | | | — | (2) | | | — | (2) | | | — | (2) | | | — | | | | — | (2) |
2011 | | $ | 1.00 | | | | — | (2) | | | — | (2) | | | — | (2) | | | — | (2) | | | — | | | | — | (2) |
2012 | | $ | 1.00 | | | | — | (2) | | | — | (2) | | | — | (2) | | | — | (2) | | | — | | | | — | (2) |
| Class A Shares | | | | | | | | | | | | | |
2008 | | $ | 1.00 | | | | 0.02 | | | | — | (2) | | | 0.02 | | | | (0.02 | ) | | | — | | | | (0.02 | ) |
2009 | | $ | 1.00 | | | | — | (2) | | | — | (2) | | | — | (2) | | | — | (2) | | | — | (2) | | | — | (2) |
2010 | | $ | 1.00 | | | | — | (2) | | | — | (2) | | | — | (2) | | | — | (2) | | | — | | | | — | (2) |
2011 | | $ | 1.00 | | | | — | (2) | | | — | (2) | | | — | (2) | | | — | (2) | | | — | | | | — | (2) |
2012 | | $ | 1.00 | | | | — | (2) | | | — | (2) | | | — | (2) | | | — | (2) | | | — | | | | — | (2) |
| HUNTINGTON MONEY MARKET FUND | | | | | | | | | | | | | |
| Trust Shares | | | | | | | | | | | | | |
2008 | | $ | 1.00 | | | | 0.02 | | | | — | (2) | | | 0.02 | | | | (0.02 | ) | | | — | | | | (0.02 | ) |
2009 | | $ | 1.00 | | | | — | (2) | | | — | (2) | | | — | (2) | | | — | (2) | | | — | | | | — | (2) |
2010 | | $ | 1.00 | | | | — | (2) | | | — | (2) | | | — | (2) | | | — | (2) | | | — | | | | — | (2) |
2011 | | $ | 1.00 | | | | — | (2) | | | — | (2) | | | — | (2) | | | — | (2) | | | — | | | | — | (2) |
2012 | | $ | 1.00 | | | | — | (2) | | | — | (2) | | | — | (2) | | | — | (2) | | | — | | | | — | (2) |
| Class A Shares | | | | | | | | | | | | | |
2008 | | $ | 1.00 | | | | 0.01 | | | | — | (2) | | | 0.01 | | | | (0.01 | ) | | | — | | | | (0.01 | ) |
2009 | | $ | 1.00 | | | | — | (2) | | | — | (2) | | | — | (2) | | | — | (2) | | | — | | | | — | (2) |
2010 | | $ | 1.00 | | | | — | (2) | | | — | (2) | | | — | (2) | | | — | (2) | | | — | | | | — | (2) |
2011 | | $ | 1.00 | | | | — | (2) | | | — | (2) | | | — | (2) | | | — | (2) | | | — | | | | — | (2) |
2012 | | $ | 1.00 | | | | — | (2) | | | — | (2) | | | — | (2) | | | — | (2) | | | — | | | | — | (2) |
| Interfund Shares | | | | | | | | | | | | | | | | | | | | | | | | | | | | |
2008 | | $ | 1.00 | | | | 0.02 | | | | — | (2) | | | 0.02 | | | | (0.02 | ) | | | — | | | | (0.02 | ) |
2009 | | $ | 1.00 | | | | — | (2) | | | — | (2) | | | — | (2) | | | — | (2) | | | — | | | | — | (2) |
2010 | | $ | 1.00 | | | | — | (2) | | | — | (2) | | | — | (2) | | | — | (2) | | | — | | | | — | (2) |
2011 | | $ | 1.00 | | | | — | (2) | | | — | (2) | | | — | (2) | | | — | (2) | | | — | | | | — | (2) |
2012(3) | | $ | 1.00 | | | | — | (2) | | | — | (2) | | | — | (2) | | | — | (2) | | | — | | | | — | (2) |
| (1) | If applicable, certain fees were waived and/or reimbursed. If such waivers/reimbursements had not occurred, the ratios would have been as indicated. |
| (2) | Amount is less than $0.005. |
| (3) | For the period January 1, 2012 to November 28, 2012. All of the assets of the Interfund shares were redeemed on November 28, 2012. As of December 31, 2012, the Interfund shares are available for purchase; however the balance remains zero. |
| (5) | Computed on an annualized basis. |
(See notes which are an integral part of the Financial Statements)
Annual Shareholder Report
118
| | | | | | | | | | | | | | | | | | | | | | |
Net Asset
Value, end
of period | | | Total
return | | | Ratio of Net
Expenses to
Average Net
Assets | | | Ratio of Net
Investment
Income (Loss)
to Average
Net Assets | | | Ratio of Expenses
(Prior to
Reimbursements)
to Average
Net Assets(1) | | | Net Assets,
end of
period
(000 omitted) | |
| | | | | | | | | | | | | | | | | | | | | | |
| | | | | | | | | | | | | | | | | | | | | | |
| $ | 1.00 | | | | 1.86 | % | | | 0.88 | % | | | 1.75 | % | | | 0.88 | % | | $ | 144,861 | |
| $ | 1.00 | | | | 0.10 | % | | | 0.78 | % | | | 0.12 | % | | | 0.89 | % | | $ | 76,805 | |
| $ | 1.00 | | | | 0.01 | % | | | 0.44 | % | | | 0.01 | % | | | 0.89 | % | | $ | 66,919 | |
| $ | 1.00 | | | | 0.01 | % | | | 0.30 | % | | | 0.01 | % | | | 0.92 | % | | $ | 73,147 | |
| $ | 1.00 | | | | 0.01 | % | | | 0.22 | % | | | 0.01 | % | | | 0.93 | % | | $ | 57,317 | |
| | | | | | | | | | | | | | | | | | | | | | |
| $ | 1.00 | | | | 1.61 | % | | | 1.13 | % | | | 1.48 | % | | | 1.13 | % | | $ | 38,466 | |
| $ | 1.00 | | | | 0.03 | % | | | 0.87 | % | | | 0.03 | % | | | 1.15 | % | | $ | 21,709 | |
| $ | 1.00 | | | | 0.01 | % | | | 0.45 | % | | | 0.01 | % | | | 1.16 | % | | $ | 15,539 | |
| $ | 1.00 | | | | 0.01 | % | | | 0.30 | % | | | 0.01 | % | | | 1.17 | % | | $ | 18,882 | |
| $ | 1.00 | | | | 0.01 | % | | | 0.22 | % | | | 0.01 | % | | | 1.18 | % | | $ | 16,765 | |
| | | | | | | | | | | | | | | | | | | | | | |
| | | | | | | | | | | | | | | | | | | | | | |
| $ | 1.00 | | | | 1.59 | % | | | 0.80 | % | | | 1.53 | % | | | 0.80 | % | | $ | 779,158 | |
| $ | 1.00 | | | | 0.01 | % | | | 0.45 | % | | | 0.02 | % | | | 0.87 | % | | $ | 260,720 | |
| $ | 1.00 | | | | 0.01 | % | | | 0.31 | % | | | 0.01 | % | | | 0.88 | % | | $ | 214,981 | |
| $ | 1.00 | | | | 0.01 | % | | | 0.24 | % | | | 0.01 | % | | | 0.84 | % | | $ | 262,067 | |
| $ | 1.00 | | | | 0.01 | % | | | 0.23 | % | | | 0.01 | % | | | 0.86 | % | | $ | 240,924 | |
| | | | | | | | | | | | | | | | | | | | | | |
| $ | 1.00 | | | | 1.34 | % | | | 1.04 | % | | | 1.48 | % | | | 1.04 | % | | $ | 299,329 | |
| $ | 1.00 | | | | 0.01 | % | | | 0.42 | % | | | 0.01 | % | | | 1.12 | % | | $ | 135,260 | |
| $ | 1.00 | | | | 0.01 | % | | | 0.32 | % | | | 0.01 | % | | | 1.13 | % | | $ | 134,974 | |
| $ | 1.00 | | | | 0.01 | % | | | 0.24 | % | | | 0.01 | % | | | 1.09 | % | | $ | 97,936 | |
| $ | 1.00 | | | | 0.01 | % | | | 0.23 | % | | | 0.01 | % | | | 1.11 | % | | $ | 105,688 | |
| | | | | | | | | | | | | | | | | | | | | | |
| $ | 1.00 | | | | 1.85 | % | | | 0.55 | % | | | 1.91 | % | | | 0.55 | % | | $ | 36,102 | |
| $ | 1.00 | | | | 0.03 | % | | | 0.37 | % | | | 0.03 | % | | | 0.63 | % | | $ | 62,376 | |
| $ | 1.00 | | | | 0.01 | % | | | 0.31 | % | | | 0.01 | % | | | 0.63 | % | | $ | 45,724 | |
| $ | 1.00 | | | | 0.01 | % | | | 0.24 | % | | | 0.01 | % | | | 0.59 | % | | $ | 73,921 | |
| $ | 1.00 | | | | 0.01 | %(4) | | | 0.23 | %(5) | | | 0.01 | %(5) | | | 0.61 | %(5) | | $ | — | |
Annual Shareholder Report
119
Financial Highlights (Continued)
Money Market Funds (Continued)
(For a share outstanding throughout each period)
| | | | | | | | | | | | | | | | | | | | | | | | | | | | |
| | | Net Asset
Value,
beginning
of period | | | Net
investment
income (loss) | | | Net realized
and unrealized
gain (loss) on
investments | | | Total from
investment
operations | | | Distributions
from net
investment
income | | | Distributions
from net
realized gain
on investment
transactions | | | Total
distributions | |
| HUNTINGTON OHIO MUNICIPAL MONEY MARKET FUND | | | | | | | | | | | | | |
| Trust Shares | | | | | | | | | | | | | |
2008 | | $ | 1.00 | | | | 0.02 | | | | — | (2) | | | 0.02 | | | | (0.02 | ) | | | — | | | | (0.02 | ) |
2009 | | $ | 1.00 | | | | — | (2) | | | — | (2) | | | — | (2) | | | — | (2) | | | — | | | | — | (2) |
2010 | | $ | 1.00 | | | | — | (2) | | | — | (2) | | | — | (2) | | | — | (2) | | | — | | | | — | (2) |
2011 | | $ | 1.00 | | | | — | (2) | | | — | (2) | | | — | (2) | | | — | (2) | | | — | | | | — | (2) |
2012 | | $ | 1.00 | | | | — | (2) | | | — | (2) | | | — | (2) | | | — | (2) | | | — | | | | — | (2) |
| Class A Shares | | | | | | | | | | | | | |
2008 | | $ | 1.00 | | | | 0.02 | | | | — | (2) | | | 0.02 | | | | (0.02 | ) | | | — | | | | (0.02 | ) |
2009 | | $ | 1.00 | | | | — | (2) | | | — | (2) | | | — | (2) | | | — | (2) | | | — | | | | — | (2) |
2010 | | $ | 1.00 | | | | — | (2) | | | — | (2) | | | — | (2) | | | — | (2) | | | — | | | | — | (2) |
2011 | | $ | 1.00 | | | | — | (2) | | | — | (2) | | | — | (2) | | | — | (2) | | | — | | | | — | (2) |
2012 | | $ | 1.00 | | | | — | (2) | | | — | (2) | | | — | (2) | | | — | (2) | | | — | | | | — | (2) |
| HUNTINGTON U.S. TREASURY MONEY MARKET FUND | | | | | | | | | | | | | |
| Trust Shares | | | | | | | | | | | | | |
2008 | | $ | 1.00 | | | | 0.01 | | | | — | (2) | | | 0.01 | | | | (0.01 | ) | | | — | | | | (0.01 | ) |
2009 | | $ | 1.00 | | | | — | (2) | | | — | (2) | | | — | (2) | | | — | (2) | | | — | | | | — | (2) |
2010 | | $ | 1.00 | | | | — | (2) | | | — | (2) | | | — | (2) | | | — | (2) | | | — | | | | — | (2) |
2011 | | $ | 1.00 | | | | — | (2) | | | — | (2) | | | — | (2) | | | — | (2) | | | — | (2) | | | — | (2) |
2012 | | $ | 1.00 | | | | — | (2) | | | — | (2) | | | — | (2) | | | — | (2) | | | — | | | | — | (2) |
| Class A Shares | | | | | | | | | | | | | |
2008 | | $ | 1.00 | | | | 0.01 | | | | — | (2) | | | 0.01 | | | | (0.01 | ) | | | — | | | | (0.01 | ) |
2009 | | $ | 1.00 | | | | — | (2) | | | — | (2) | | | — | (2) | | | — | (2) | | | — | | | | — | (2) |
2010 | | $ | 1.00 | | | | — | (2) | | | — | (2) | | | — | (2) | | | — | (2) | | | — | | | | — | (2) |
2011 | | $ | 1.00 | | | | — | (2) | | | — | (2) | | | — | (2) | | | — | (2) | | | — | (2) | | | — | (2) |
2012 | | $ | 1.00 | | | | — | (2) | | | — | (2) | | | — | (2) | | | — | | | | — | | | | — | |
| (1) | If applicable, certain fees were waived and/or reimbursed. If such waivers/reimbursements had not occurred, the ratios would have been as indicated. |
| (2) | Amount is less than $0.005. |
| (3) | Rounds to less than 0.005%. |
(See notes which are an integral part of the Financial Statements)
Annual Shareholder Report
120
| | | | | | | | | | | | | | | | | | | | | | |
Net Asset
Value, end
of period | | | Total
return | | | Ratio of Net
Expenses to
Average Net
Assets | | | Ratio of Net
Investment
Income (Loss)
to Average
Net Assets | | | Ratio of Expenses
(Prior to
Reimbursements)
to Average
Net Assets(1) | | | Net Assets,
end of
period
(000 omitted) | |
| | | | | | | | | | | | | | | | | | | | | | |
| | | | | | | | | | | | | | | | | | | | | | |
| $ | 1.00 | | | | 1.81 | % | | | 0.83 | % | | | 1.73 | % | | | 0.83 | % | | $ | 312,467 | |
| $ | 1.00 | | | | 0.12 | % | | | 0.78 | % | | | 0.14 | % | | | 0.89 | % | | $ | 142,956 | |
| $ | 1.00 | | | | 0.01 | % | | | 0.42 | % | | | 0.01 | % | | | 0.88 | % | | $ | 81,023 | |
| $ | 1.00 | | | | 0.01 | % | | | 0.28 | % | | | 0.01 | % | | | 0.84 | % | | $ | 61,212 | |
| $ | 1.00 | | | | 0.01 | % | | | 0.20 | % | | | 0.01 | % | | | 0.88 | % | | $ | 58,279 | |
| | | | | | | | | | | | | | | | | | | | | | |
| $ | 1.00 | | | | 1.56 | % | | | 1.08 | % | | | 1.54 | % | | | 1.08 | % | | $ | 106,617 | |
| $ | 1.00 | | | | 0.02 | % | | | 0.82 | % | | | 0.02 | % | | | 1.14 | % | | $ | 112,048 | |
| $ | 1.00 | | | | 0.01 | % | | | 0.41 | % | | | 0.01 | % | | | 1.12 | % | | $ | 117,109 | |
| $ | 1.00 | | | | 0.01 | % | | | 0.28 | % | | | 0.01 | % | | | 1.09 | % | | $ | 83,858 | |
| $ | 1.00 | | | | 0.01 | % | | | 0.20 | % | | | 0.01 | % | | | 1.13 | % | | $ | 73,528 | |
| | | | | | | | | | | | | | | | | | | | | | |
| | | | | | | | | | | | | | | | | | | | | | |
| $ | 1.00 | | | | 0.93 | % | | | 0.69 | % | | | 0.93 | % | | | 0.76 | % | | $ | 583,050 | |
| $ | 1.00 | | | | 0.01 | % | | | 0.20 | % | | | 0.01 | % | | | 0.79 | % | | $ | 261,263 | |
| $ | 1.00 | | | | 0.01 | % | | | 0.15 | % | | | 0.01 | % | | | 0.76 | % | | $ | 312,870 | |
| $ | 1.00 | | | | 0.01 | % | | | 0.07 | % | | | 0.01 | % | | | 0.74 | % | | $ | 251,704 | |
| $ | 1.00 | | | | 0.01 | % | | | 0.09 | % | | | 0.01 | % | | | 0.74 | % | | $ | 737,310 | |
| | | | | | | | | | | | | | | | | | | | | | |
| $ | 1.00 | | | | 0.74 | % | | | 0.83 | % | | | 0.67 | % | | | 0.98 | % | | $ | 126,485 | |
| $ | 1.00 | | | | 0.01 | % | | | 0.20 | % | | | 0.01 | % | | | 1.03 | % | | $ | 54,935 | |
| $ | 1.00 | | | | 0.01 | % | | | 0.15 | % | | | 0.01 | % | | | 1.01 | % | | $ | 74,845 | |
| $ | 1.00 | | | | 0.01 | % | | | 0.07 | % | | | 0.01 | % | | | 0.99 | % | | $ | 83,204 | |
| $ | 1.00 | | | | — | % | | | 0.09 | % | | | — | %(3) | | | 0.99 | % | | $ | 108,885 | |
Annual Shareholder Report
121
Financial Highlights (Continued)
Equity Funds
(For a share outstanding throughout each period)
| | | | | | | | | | | | | | | | | | | | | | | | | | | | | | | | |
| | | Net Asset
Value,
beginning
of period | | | Net
investment
income (loss) | | | Net realized
and unrealized
gain (loss) on
investments | | | Total from
investment
operations | | | Distributions
from net
investment
income | | | Distributions
from net
realized gain
on investment
transactions | | | Distributions
from return
of capital | | | Total
distributions | |
| HUNTINGTON DISCIPLINED EQUITY FUND | | | | | | | | | | | | | | | | | |
| Trust Shares | | | | | | | | | | | | | | | | | |
2011(4) | | $ | 10.00 | | | | 0.04 | | | | (0.19 | ) | | | (0.15 | ) | | | (0.04 | ) | | | — | | | | — | | | | (0.04 | ) |
2012 | | $ | 9.81 | | | | 0.10 | | | | (0.01 | ) | | | 0.09 | | | | (0.10 | ) | | | — | | | | — | | | | (0.10 | ) |
| Class A Shares | | | | | | | | | | | | | | | | | |
2011(4) | | $ | 10.00 | | | | 0.02 | | | | (0.19 | ) | | | (0.17 | ) | | | (0.04 | ) | | | — | | | | — | | | | (0.04 | ) |
2012 | | $ | 9.79 | | | | 0.08 | | | | (0.02 | ) | | | 0.06 | | | | (0.07 | ) | | | — | | | | — | | | | (0.07 | ) |
| HUNTINGTON DIVIDEND CAPTURE FUND | | | | | | | | | | | | | | | | | |
| Trust Shares | | | | | | | | | | | | | | | | | |
2008 | | $ | 9.89 | | | | 0.40 | | | | (3.18 | ) | | | (2.78 | ) | | | (0.39 | ) | | | (0.12 | ) | | | (0.03 | ) | | | (0.54 | ) |
2009 | | $ | 6.57 | | | | 0.29 | | | | 1.31 | | | | 1.60 | | | | (0.29 | ) | | | — | | | | (0.02 | ) | | | (0.31 | ) |
2010 | | $ | 7.86 | | | | 0.25 | | | | 0.83 | | | | 1.08 | | | | (0.25 | ) | | | — | | | | — | | | | (0.25 | ) |
2011 | | $ | 8.69 | | | | 0.30 | | | | 0.22 | | | | 0.52 | | | | (0.30 | ) | | | — | | | | — | | | | (0.30 | ) |
2012 | | $ | 8.91 | | | | 0.33 | | | | 0.63 | | | | 0.96 | | | | (0.38 | ) | | | — | | | | — | | | | (0.38 | ) |
| Class A Shares | | | | | | | | | | | | | | | | | |
2008 | | $ | 9.89 | | | | 0.38 | | | | (3.18 | ) | | | (2.80 | ) | | | (0.37 | ) | | | (0.12 | ) | | | (0.03 | ) | | | (0.52 | ) |
2009 | | $ | 6.57 | | | | 0.27 | | | | 1.31 | | | | 1.58 | | | | (0.27 | ) | | | — | | | | (0.02 | ) | | | (0.29 | ) |
2010 | | $ | 7.86 | | | | 0.23 | | | | 0.83 | | | | 1.06 | | | | (0.23 | ) | | | — | | | | — | | | | (0.23 | ) |
2011 | | $ | 8.69 | | | | 0.28 | | | | 0.21 | | | | 0.49 | | | | (0.28 | ) | | | — | | | | — | | | | (0.28 | ) |
2012 | | $ | 8.90 | | | | 0.30 | | | | 0.65 | | | | 0.95 | | | | (0.36 | ) | | | — | | | | — | | | | (0.36 | ) |
| (1) | Based on net asset value, which does not reflect a sales charge or contingent deferred sales charge, if applicable. |
| (2) | If applicable, certain fees were waived and/or reimbursed. If such waivers/reimbursements had not occurred, the ratios would have been as indicated. |
| (3) | Portfolio Turnover is calculated on the basis of the Fund as a whole without distinguishing among the classes of shares. |
| (4) | Reflects operations for the period from August 1, 2011 (commencement of operations) to December 31, 2011. |
| (6) | Computed on an annualized basis. |
(See notes which are an integral part of the Financial Statements)
Annual Shareholder Report
122
| | | | | | | | | | | | | | | | | | | | | | | | | | |
Net Asset
Value, end
of period | | | Total
return(1) | | | Ratio of Net
Expenses to
Average Net
Assets | | | Ratio of Net
Investment
Income (Loss)
to Average
Net Assets | | | Ratio of Expenses
(Prior to
Reimbursements)
to Average
Net Assets(2) | | | Net Assets,
end of
period
(000 omitted) | | | Portfolio
turnover
rate(3) | |
| | | | | | | | | | | | | | | | | | | | | | | | | | |
| | | | | | | | | | | | | | | | | | | | | | | | | | |
| $ | 9.81 | | | | (1.50 | )%(5) | | | 1.20 | %(6) | | | 0.98 | %(6) | | | 1.33 | %(6) | | $ | 65,294 | | | | 3 | %(5) |
| $ | 9.80 | | | | 0.91 | % | | | 1.20 | % | | | 1.07 | % | | | 1.23 | % | | $ | 86,382 | | | | 9 | % |
| | | | | | | | | | | | | | | | | | | | | | | | | | |
| $ | 9.79 | | | | (1.73 | )%(5) | | | 1.45 | %(6) | | | 0.72 | %(6) | | | 1.58 | %(6) | | $ | 5,661 | | | | 3 | %(5) |
| $ | 9.78 | | | | 0.67 | % | | | 1.45 | % | | | 0.82 | % | | | 1.48 | % | | $ | 7,605 | | | | 9 | % |
| | | | | | | | | | | | | | | | | | | | | | | | | | |
| | | | | | | | | | | | | | | | | | | | | | | | | | |
| $ | 6.57 | | | | (29.26 | )% | | | 1.31 | % | | | 4.56 | % | | | 1.31 | % | | $ | 60,162 | | | | 66 | % |
| $ | 7.86 | | | | 25.24 | % | | | 1.41 | % | | | 4.37 | % | | | 1.41 | % | | $ | 74,593 | | | | 99 | % |
| $ | 8.69 | | | | 13.99 | % | | | 1.40 | % | | | 3.05 | % | | | 1.40 | % | | $ | 100,622 | | | | 115 | % |
| $ | 8.91 | | | | 6.03 | % | | | 1.36 | % | | | 3.40 | % | | | 1.36 | % | | $ | 117,798 | | | | 143 | % |
| $ | 9.49 | | | | 10.87 | % | | | 1.21 | % | | | 3.55 | % | | | 1.36 | % | | $ | 145,946 | | | | 109 | % |
| | | | | | | | | | | | | | | | | | | | | | | | | | |
| $ | 6.57 | | | | (29.41 | )% | | | 1.56 | % | | | 4.18 | % | | | 1.56 | % | | $ | 5,094 | | | | 66 | % |
| $ | 7.86 | | | | 24.93 | % | | | 1.66 | % | | | 4.10 | % | | | 1.66 | % | | $ | 5,473 | | | | 99 | % |
| $ | 8.69 | | | | 13.72 | % | | | 1.64 | % | | | 2.82 | % | | | 1.64 | % | | $ | 17,784 | | | | 115 | % |
| $ | 8.90 | | | | 5.65 | % | | | 1.61 | % | | | 3.19 | % | | | 1.61 | % | | $ | 26,843 | | | | 143 | % |
| $ | 9.49 | | | | 10.72 | % | | | 1.46 | % | | | 3.37 | % | | | 1.61 | % | | $ | 46,343 | | | | 109 | % |
Annual Shareholder Report
123
Financial Highlights (Continued)
Equity Funds (Continued)
(For a share outstanding throughout each period)
| | | | | | | | | | | | | | | | | | | | | | | | | | | | | | | | |
| | | Net Asset
Value,
beginning
of period | | | Net
investment
income (loss) | | | Net realized
and unrealized
gain (loss) on
investments | | | Total from
investment
operations | | | Distributions
from net
investment
income | | | Distributions
from net
realized gain
on investment
transactions | | | Distributions
from return
of capital | | | Total
distributions | |
| HUNTINGTON GLOBAL SELECT MARKETS FUND | | | | | | | | | | | | | | | | | |
| Trust Shares | | | | | | | | | | | | | | | | | |
2009(4) | | $ | 10.00 | | | | — | (5) | | | — | (5) | | | — | (5) | | | — | | | | — | | | | — | | | | — | |
2010 | | $ | 10.00 | | | | 0.03 | | | | 1.55 | | | | 1.58 | | | | (0.11 | ) | | | — | | | | (0.01 | ) | | | (0.12 | ) |
2011 | | $ | 11.46 | | | | 0.08 | | | | (1.99 | ) | | | (1.91 | ) | | | (0.05 | ) | | | (0.14 | ) | | | — | | | | (0.19 | ) |
2012 | | $ | 9.36 | | | | 0.04 | | | | 0.97 | | | | 1.01 | | | | (0.04 | ) | | | — | | | | — | | | | (0.04 | ) |
| Class A Shares | | | | | | | | | | | | | | | | | |
2009(4) | | $ | 10.00 | | | | — | (5) | | | — | (5) | | | — | (5) | | | — | | | | — | | | | — | | | | — | |
2010 | | $ | 10.00 | | | | 0.01 | | | | 1.53 | | | | 1.54 | | | | (0.09 | ) | | | — | | | | (0.02 | ) | | | (0.11 | ) |
2011 | | $ | 11.43 | | | | 0.04 | | | | (1.97 | ) | | | (1.93 | ) | | | — | (5) | | | (0.14 | ) | | | — | | | | (0.14 | ) |
2012 | | $ | 9.36 | | | | 0.01 | | | | 0.97 | | | | 0.98 | | | | (0.02 | ) | | | — | | | | — | | | | (0.02 | ) |
| HUNTINGTON GROWTH FUND | | | | | | | | | | | | | | | | | |
| Trust Shares | | | | | | | | | | | | | | | | | |
2008 | | $ | 35.01 | | | | 0.05 | | | | (12.12 | ) | | | (12.07 | ) | | | (0.04 | ) | | | (3.19 | ) | | | — | | | | (3.23 | ) |
2009 | | $ | 19.71 | | | | 0.01 | | | | 3.45 | | | | 3.46 | | | | — | (5) | | | — | | | | — | | | | — | (5) |
2010 | | $ | 23.17 | | | | 0.01 | | | | 2.36 | | | | 2.37 | | | | — | (5) | | | — | | | | — | | | | — | (5) |
2011 | | $ | 25.54 | | | | 0.05 | | | | (0.72 | ) | | | (0.67 | ) | | | — | | | | (0.09 | ) | | | — | | | | (0.09 | ) |
2012 | | $ | 24.78 | | | | 0.20 | | | | 2.35 | | | | 2.55 | | | | (0.21 | ) | | | (1.22 | ) | | | — | | | | (1.43 | ) |
| Class A Shares | | | | | | | | | | | | | | | | | |
2008 | | $ | 34.31 | | | | (0.03 | ) | | | (11.83 | ) | | | (11.86 | ) | | | — | (5) | | | (3.19 | ) | | | — | | | | (3.19 | ) |
2009 | | $ | 19.26 | | | | (0.04 | ) | | | 3.37 | | | | 3.33 | | | | — | | | | — | | | | — | | | | — | |
2010 | | $ | 22.59 | | | | (0.03 | ) | | | 2.27 | | | | 2.24 | | | | — | (5) | | | — | | | | — | | | | — | (5) |
2011 | | $ | 24.83 | | | | (0.01 | ) | | | (0.70 | ) | | | (0.71 | ) | | | — | | | | (0.09 | ) | | | — | | | | (0.09 | ) |
2012 | | $ | 24.03 | | | | 0.14 | | | | 2.27 | | | | 2.41 | | | | (0.15 | ) | | | (1.22 | ) | | | — | | | | (1.37 | ) |
| (1) | Based on net asset value, which does not reflect a sales charge or contingent deferred sales charge, if applicable. |
| (2) | If applicable, certain fees were waived and/or reimbursed. If such waivers/reimbursements had not occurred, the ratios would have been as indicated. |
| (3) | Portfolio Turnover is calculated on the basis of the Fund as a whole without distinguishing among the classes of shares. |
| (4) | Reflects operations for the period from December 30, 2009 (commencement of operations) to December 31, 2009. |
| (5) | Amount is less than $0.005. |
| (7) | Computed on an annualized basis. |
| (8) | Ratios include recoupment of fees waived in prior periods. |
(See notes which are an integral part of the Financial Statements)
Annual Shareholder Report
124
| | | | | | | | | | | | | | | | | | | | | | | | | | |
Net Asset
Value, end
of period | | | Total
return(1) | | | Ratio of Net
Expenses to
Average Net
Assets | | | Ratio of Net
Investment
Income (Loss)
to Average
Net Assets | | | Ratio of Expenses
(Prior to
Reimbursements)
to Average
Net Assets(2) | | | Net Assets,
end of
period
(000 omitted) | | | Portfolio
turnover
rate(3) | |
| | | | | | | | | | | | | | | | | | | | | | | | | | |
| | | | | | | | | | | | | | | | | | | | | | | | | | |
| $ | 10.00 | | | | — | %(6) | | | 1.83 | %(7) | | | (1.46 | )%(7) | | | 1.83 | %(7) | | $ | 1 | | | | — | %(6) |
| $ | 11.46 | | | | 15.85 | % | | | 1.90 | % | | | 0.40 | % | | | 2.19 | % | | $ | 41,116 | | | | 45 | % |
| $ | 9.36 | | | | (16.67 | )% | | | 1.79 | % | | | 0.71 | % | | | 1.79 | % | | $ | 38,871 | | | | 110 | % |
| $ | 10.33 | | | | 10.82 | % | | | 1.90 | %(8) | | | 0.40 | % | | | 1.90 | %(8) | | $ | 38,696 | | | | 97 | % |
| | | | | | | | | | | | | | | | | | | | | | | | | | |
| $ | 10.00 | | | | — | %(6) | | | 2.19 | %(7) | | | (2.92 | )%(7) | | | 2.19 | %(7) | | $ | 1 | | | | — | %(6) |
| $ | 11.43 | | | | 15.38 | % | | | 2.16 | % | | | 0.20 | % | | | 2.44 | % | | $ | 860 | | | | 45 | % |
| $ | 9.36 | | | | (16.80 | )% | | | 2.04 | % | | | 0.48 | % | | | 2.04 | % | | $ | 541 | | | | 110 | % |
| $ | 10.32 | | | | 10.43 | % | | | 2.15 | %(8) | | | 0.09 | % | | | 2.15 | %(8) | | $ | 416 | | | | 97 | % |
| | | | | | | | | | | | | | | | | | | | | | | | | | |
| | | | | | | | | | | | | | | | | | | | | | | | | | |
| $ | 19.71 | | | | (37.76 | )% | | | 1.15 | % | | | 0.15 | % | | | 1.15 | % | | $ | 129,745 | | | | 83 | % |
| $ | 23.17 | | | | 17.58 | % | | | 1.20 | % | | | 0.03 | % | | | 1.20 | % | | $ | 140,206 | | | | 120 | % |
| $ | 25.54 | | | | 10.23 | % | | | 1.23 | % | | | 0.04 | % | | | 1.23 | % | | $ | 123,809 | | | | 292 | % |
| $ | 24.78 | | | | (2.61 | )% | | | 1.19 | % | | | 0.21 | % | | | 1.19 | % | | $ | 120,019 | | | | 137 | % |
| $ | 25.90 | | | | 10.30 | % | | | 1.20 | % | | | 0.75 | % | | | 1.20 | % | | $ | 127,545 | | | | 136 | % |
| | | | | | | | | | | | | | | | | | | | | | | | | | |
| $ | 19.26 | | | | (37.92 | )% | | | 1.40 | % | | | (0.11 | )% | | | 1.40 | % | | $ | 5,436 | | | | 83 | % |
| $ | 22.59 | | | | 17.29 | % | | | 1.45 | % | | | (0.22 | )% | | | 1.45 | % | | $ | 6,096 | | | | 120 | % |
| $ | 24.83 | | | | 9.92 | % | | | 1.47 | % | | | (0.15 | )% | | | 1.47 | % | | $ | 8,532 | | | | 292 | % |
| $ | 24.03 | | | | (2.84 | )% | | | 1.44 | % | | | (0.03 | )% | | | 1.44 | % | | $ | 7,652 | | | | 137 | % |
| $ | 25.07 | | | | 10.02 | % | | | 1.45 | % | | | 0.50 | % | | | 1.45 | % | | $ | 7,631 | | | | 136 | % |
Annual Shareholder Report
125
Financial Highlights (Continued)
Equity Funds (Continued)
(For a share outstanding throughout each period)
| | | | | | | | | | | | | | | | | | | | | | | | | | | | | | | | |
| | | Net Asset
Value,
beginning
of period | | | Net
investment
income (loss) | | | Net realized
and unrealized
gain (loss) on
investments | | | Total from
investment
operations | | | Distributions
from net
investment
income | | | Distributions
from net
realized gain
on investment
transactions | | | Distributions
from return
of capital | | | Total
distributions | |
| HUNTINGTON INCOME EQUITY FUND | | | | | | | | | | | | | | | | | |
| Trust Shares | | | | | | | | | | | | | | | | | |
2008 | | $ | 26.46 | | | | 0.55 | | | | (10.54 | ) | | | (9.99 | ) | | | (0.54 | ) | | | (0.11 | ) | | | (0.03 | ) | | | (0.68 | ) |
2009 | | $ | 15.79 | | | | 0.47 | | | | 2.87 | | | | 3.34 | | | | (0.47 | ) | | | — | | | | (0.01 | ) | | | (0.48 | ) |
2010 | | $ | 18.65 | | | | 0.49 | | | | 1.62 | | | | 2.11 | | | | (0.48 | ) | | | — | | | | — | | | | (0.48 | ) |
2011 | | $ | 20.28 | | | | 0.70 | | | | 0.69 | | | | 1.39 | | | | (0.72 | ) | | | — | | | | — | | | | (0.72 | ) |
2012 | | $ | 20.95 | | | | 0.81 | | | | 1.37 | | | | 2.18 | | | | (0.79 | ) | | | — | | | | — | | | | (0.79 | ) |
| Class A Shares | | | | | | | | | | | | | | | | | |
2008 | | $ | 26.46 | | | | 0.51 | | | | (10.54 | ) | | | (10.03 | ) | | | (0.49 | ) | | | (0.11 | ) | | | (0.03 | ) | | | (0.63 | ) |
2009 | | $ | 15.80 | | | | 0.44 | | | | 2.86 | | | | 3.30 | | | | (0.43 | ) | | | — | | | | (0.01 | ) | | | (0.44 | ) |
2010 | | $ | 18.66 | | | | 0.44 | | | | 1.62 | | | | 2.06 | | | | (0.43 | ) | | | — | | | | — | | | | (0.43 | ) |
2011 | | $ | 20.29 | | | | 0.65 | | | | 0.68 | | | | 1.33 | | | | (0.67 | ) | | | — | | | | — | | | | (0.67 | ) |
2012 | | $ | 20.95 | | | | 0.76 | | | | 1.37 | | | | 2.13 | | | | (0.73 | ) | | | — | | | | — | | | | (0.73 | ) |
| HUNTINGTON INTERNATIONAL EQUITY FUND | | | | | | | | | | | | | | | | | |
| Trust Shares | | | | | | | | | | | | | | | | | |
2008 | | $ | 15.01 | | | | 0.17 | | | | (6.36 | ) | | | (6.19 | ) | | | (0.13 | ) | | | (0.47 | ) | | | — | | | | (0.60 | ) |
2009 | | $ | 8.22 | | | | 0.17 | | | | 2.52 | | | | 2.69 | | | | (0.10 | ) | | | (0.02 | ) | | | — | | | | (0.12 | ) |
2010 | | $ | 10.79 | | | | 0.13 | | | | 0.70 | | | | 0.83 | | | | (0.09 | ) | | | — | | | | — | | | | (0.09 | ) |
2011 | | $ | 11.53 | | | | 0.15 | | | | (1.47 | ) | | | (1.32 | ) | | | (0.12 | ) | | | — | | | | — | | | | (0.12 | ) |
2012 | | $ | 10.09 | | | | 0.14 | | | | 1.30 | | | | 1.44 | | | | (0.19 | ) | | | — | | | | — | (3) | | | (0.19 | ) |
| Class A Shares | | | | | | | | | | | | | | | | | |
2008 | | $ | 14.90 | | | | 0.13 | | | | (6.29 | ) | | | (6.16 | ) | | | (0.11 | ) | | | (0.47 | ) | | | — | | | | (0.58 | ) |
2009 | | $ | 8.16 | | | | 0.13 | | | | 2.51 | | | | 2.64 | | | | (0.06 | ) | | | (0.02 | ) | | | — | | | | (0.08 | ) |
2010 | | $ | 10.72 | | | | 0.08 | | | | 0.73 | | | | 0.81 | | | | (0.08 | ) | | | — | | | | — | | | | (0.08 | ) |
2011 | | $ | 11.45 | | | | 0.13 | | | | (1.47 | ) | | | (1.34 | ) | | | (0.09 | ) | | | — | | | | — | | | | (0.09 | ) |
2012 | | $ | 10.02 | | | | 0.12 | | | | 1.28 | | | | 1.40 | | | | (0.16 | ) | | | — | | | | — | (3) | | | (0.16 | ) |
| (1) | Based on net asset value, which does not reflect a sales charge or contingent deferred sales charge, if applicable. |
| (2) | Portfolio Turnover is calculated on the basis of the Fund as a whole without distinguishing among the classes of shares. |
| (3) | Amount is less than $0.005. |
(See notes which are an integral part of the Financial Statements)
Annual Shareholder Report
126
| | | | | | | | | | | | | | | | | | | | | | | | | | |
Net Asset
Value, end
of period | | | Total
return(1) | | | Ratio of Net
Expenses to
Average Net
Assets | | | Ratio of Net
Investment
Income (Loss)
to Average
Net Assets | | | Ratio of Expenses
(Prior to
Reimbursements)
to Average
Net Assets | | | Net Assets,
end of
period
(000 omitted) | | | Portfolio
turnover
rate(2) | |
| | | | | | | | | | | | | | | | | | | | | | | | | | |
| | | | | | | | | | | | | | | | | | | | | | | | | | |
| $ | 15.79 | | | | (38.35 | )% | | | 1.16 | % | | | 2.60 | % | | | 1.16 | % | | $ | 89,815 | | | | 88 | % |
| $ | 18.65 | | | | 21.92 | % | | | 1.22 | % | | | 3.05 | % | | | 1.22 | % | | $ | 104,433 | | | | 90 | % |
| $ | 20.28 | | | | 11.59 | % | | | 1.22 | % | | | 2.59 | % | | | 1.22 | % | | $ | 101,076 | | | | 89 | % |
| $ | 20.95 | | | | 6.92 | % | | | 1.19 | % | | | 3.36 | % | | | 1.19 | % | | $ | 114,048 | | | | 197 | % |
| $ | 22.34 | | | | 10.50 | % | | | 1.19 | % | | | 3.69 | % | | | 1.19 | % | | $ | 131,708 | | | | 203 | % |
| | | | | | | | | | | | | | | | | | | | | | | | | | |
| $ | 15.80 | | | | (38.47 | )% | | | 1.41 | % | | | 2.34 | % | | | 1.41 | % | | $ | 3,214 | | | | 88 | % |
| $ | 18.66 | | | | 21.60 | % | | | 1.47 | % | | | 2.83 | % | | | 1.47 | % | | $ | 3,271 | | | | 90 | % |
| $ | 20.29 | | | | 11.31 | % | | | 1.47 | % | | | 2.39 | % | | | 1.47 | % | | $ | 5,935 | | | | 89 | % |
| $ | 20.95 | | | | 6.60 | % | | | 1.44 | % | | | 3.08 | % | | | 1.44 | % | | $ | 5,464 | | | | 197 | % |
| $ | 22.35 | | | | 10.27 | % | | | 1.44 | % | | | 3.44 | % | | | 1.44 | % | | $ | 6,016 | | | | 203 | % |
| | | | | | | | | | | | | | | | | | | | | | | | | | |
| | | | | | | | | | | | | | | | | | | | | | | | | | |
| $ | 8.22 | | | | (41.73 | )% | | | 1.57 | % | | | 1.37 | % | | | 1.57 | % | | $ | 191,163 | | | | 21 | % |
| $ | 10.79 | | | | 32.84 | % | | | 1.59 | % | | | 1.68 | % | | | 1.59 | % | | $ | 322,427 | | | | 26 | % |
| $ | 11.53 | | | | 7.72 | % | | | 1.59 | % | | | 1.14 | % | | | 1.59 | % | | $ | 296,797 | | | | 41 | % |
| $ | 10.09 | | | | (11.40 | )% | | | 1.56 | % | | | 1.28 | % | | | 1.56 | % | | $ | 255,832 | | | | 39 | % |
| $ | 11.34 | | | | 14.28 | % | | | 1.58 | % | | | 1.32 | % | | | 1.58 | % | | $ | 285,361 | | | | 25 | % |
| | | | | | | | | | | | | | | | | | | | | | | | | | |
| $ | 8.16 | | | | (41.88 | )% | | | 1.82 | % | | | 1.13 | % | | | 1.82 | % | | $ | 6,929 | | | | 21 | % |
| $ | 10.72 | | | | 32.45 | % | | | 1.84 | % | | | 1.28 | % | | | 1.84 | % | | $ | 7,547 | | | | 26 | % |
| $ | 11.45 | | | | 7.54 | % | | | 1.84 | % | | | 0.86 | % | | | 1.84 | % | | $ | 10,631 | | | | 41 | % |
| $ | 10.02 | | | | (11.67 | )% | | | 1.81 | % | | | 1.03 | % | | | 1.81 | % | | $ | 8,192 | | | | 39 | % |
| $ | 11.26 | | | | 14.00 | % | | | 1.83 | % | | | 1.06 | % | | | 1.83 | % | | $ | 9,105 | | | | 25 | % |
Annual Shareholder Report
127
Financial Highlights (Continued)
Equity Funds (Continued)
(For a share outstanding throughout each period)
| | | | | | | | | | | | | | | | | | | | | | | | | | | | | | | | |
| | | Net Asset
Value,
beginning
of period | | | Net
investment
income (loss) | | | Net realized
and unrealized
gain (loss) on
investments | | | Total from
investment
operations | | | Distributions
from net
investment
income | | | Distributions
from net
realized gain
on investment
transactions | | | Distributions
from return
of capital | | | Total
distributions | |
| HUNTINGTON MID CORP AMERICA FUND | | | | | | | | | | | | | | | | | |
| Trust Shares | | | | | | | | | | | | | | | | | |
2008 | | $ | 16.31 | | | | 0.02 | | | | (5.98 | ) | | | (5.96 | ) | | | (0.01 | ) | | | (0.41 | ) | | | — | | | | (0.42 | ) |
2009 | | $ | 9.93 | | | | 0.04 | | | | 3.20 | | | | 3.24 | | | | (0.04 | ) | | | — | | | | — | | | | (0.04 | ) |
2010 | | $ | 13.13 | | | | 0.01 | | | | 3.00 | | | | 3.01 | | | | (0.01 | ) | | | (0.50 | ) | | | — | | | | (0.51 | ) |
2011 | | $ | 15.63 | | | | 0.01 | | | | (0.43 | ) | | | (0.42 | ) | | | (0.01 | ) | | | (1.44 | ) | | | — | | | | (1.45 | ) |
2012 | | $ | 13.76 | | | | 0.05 | | | | 1.95 | | | | 2.00 | | | | (0.02 | ) | | | (2.04 | ) | | | — | | | | (2.06 | ) |
| Class A Shares | | | | | | | | | | | | | | | | | |
2008 | | $ | 16.00 | | | | (0.02 | ) | | | (5.84 | ) | | | (5.86 | ) | | | — | | | | (0.41 | ) | | | — | | | | (0.41 | ) |
2009 | | $ | 9.73 | | | | 0.01 | | | | 3.12 | | | | 3.13 | | | | (0.01 | ) | | | — | | | | — | | | | (0.01 | ) |
2010 | | $ | 12.85 | | | | (0.01 | ) | | | 2.91 | | | | 2.90 | | | | — | | | | (0.50 | ) | | | — | | | | (0.50 | ) |
2011 | | $ | 15.25 | | | | (0.03 | ) | | | (0.41 | ) | | | (0.44 | ) | | | — | | | | (1.44 | ) | | | — | | | | (1.44 | ) |
2012 | | $ | 13.37 | | | | 0.01 | | | | 1.83 | | | | 1.84 | | | | — | | | | (2.04 | ) | | | — | | | | (2.04 | ) |
| HUNTINGTON REAL STRATEGIES FUND | | | | | | | | | | | | | | | | | |
| Trust Shares | | | | | | | | | | | | | | | | | |
2008 | | $ | 10.79 | | | | 0.05 | (3) | | | (5.86 | ) | | | (5.81 | ) | | | (0.05 | ) | | | — | | | | (0.03 | ) | | | (0.08 | ) |
2009 | | $ | 4.90 | | | | 0.04 | | | | 1.54 | | | | 1.58 | | | | (0.06 | ) | | | — | | | | — | | | | (0.06 | ) |
2010 | | $ | 6.42 | | | | 0.02 | | | | 1.59 | | | | 1.61 | | | | (0.04 | ) | | | — | | | | — | | | | (0.04 | ) |
2011 | | $ | 7.99 | | | | 0.05 | | | | (0.82 | ) | | | (0.77 | ) | | | (0.07 | ) | | | — | | | | — | | | | (0.07 | ) |
2012 | | $ | 7.15 | | | | 0.11 | | | | 0.26 | | | | 0.37 | | | | (0.10 | ) | | | — | | | | — | | | | (0.10 | ) |
| Class A Shares | | | | | | | | | | | | | | | | | |
2008 | | $ | 10.78 | | | | 0.03 | (3) | | | (5.85 | ) | | | (5.82 | ) | | | (0.02 | ) | | | — | | | | (0.02 | ) | | | (0.04 | ) |
2009 | | $ | 4.92 | | | | 0.03 | | | | 1.54 | | | | 1.57 | | | | (0.06 | ) | | | — | | | | — | | | | (0.06 | ) |
2010 | | $ | 6.43 | | | | 0.01 | | | | 1.59 | | | | 1.60 | | | | (0.03 | ) | | | — | | | | — | | | | (0.03 | ) |
2011 | | $ | 8.00 | | | | 0.03 | | | | (0.82 | ) | | | (0.79 | ) | | | (0.05 | ) | | | — | | | | — | | | | (0.05 | ) |
2012 | | $ | 7.16 | | | | 0.09 | | | | 0.26 | | | | 0.35 | | | | (0.08 | ) | | | — | | | | — | | | | (0.08 | ) |
| (1) | Based on net asset value, which does not reflect a sales charge or contingent deferred sales charge, if applicable. |
| (2) | Portfolio Turnover is calculated on the basis of the Fund as a whole without distinguishing among the classes of shares. |
| (3) | Per share net investment income (loss) has been calculated using the average shares method. |
(See notes which are an integral part of the Financial Statements)
Annual Shareholder Report
128
| | | | | | | | | | | | | | | | | | | | | | | | | | |
Net Asset
Value, end
of period | | | Total
return(1) | | | Ratio of Net
Expenses to
Average Net
Assets | | | Ratio of Net
Investment
Income (Loss)
to Average
Net Assets | | | Ratio of Expenses
(Prior to
Reimbursements)
to Average
Net Assets | | | Net Assets,
end of
period
(000 omitted) | | | Portfolio
turnover
rate(2) | |
| | | | | | | | | | | | | | | | | | | | | | | | | | |
| | | | | | | | | | | | | | | | | | | | | | | | | | |
| $ | 9.93 | | | | (37.51 | )% | | | 1.31 | % | | | 0.10 | % | | | 1.31 | % | | $ | 87,843 | | | | 18 | % |
| $ | 13.13 | | | | 32.59 | % | | | 1.36 | % | | | 0.30 | % | | | 1.36 | % | | $ | 131,638 | | | | 12 | % |
| $ | 15.63 | | | | 22.94 | % | | | 1.36 | % | | | 0.08 | % | | | 1.36 | % | | $ | 141,282 | | | | 19 | % |
| $ | 13.76 | | | | (2.37 | )% | | | 1.32 | % | | | 0.03 | % | | | 1.32 | % | | $ | 122,124 | | | | 25 | % |
| $ | 13.70 | | | | 14.70 | % | | | 1.38 | % | | | 0.32 | % | | | 1.38 | % | | $ | 125,258 | | | | 18 | % |
| | | | | | | | | | | | | | | | | | | | | | | | | | |
| $ | 9.73 | | | | (37.62 | )% | | | 1.56 | % | | | (0.16 | )% | | | 1.56 | % | | $ | 2,875 | | | | 18 | % |
| $ | 12.85 | | | | 32.19 | % | | | 1.61 | % | | | 0.04 | % | | | 1.61 | % | | $ | 3,608 | | | | 12 | % |
| $ | 15.25 | | | | 22.61 | % | | | 1.61 | % | | | (0.13 | )% | | | 1.61 | % | | $ | 7,513 | | | | 19 | % |
| $ | 13.37 | | | | (2.56 | )% | | | 1.57 | % | | | (0.23 | )% | | | 1.57 | % | | $ | 6,610 | | | | 25 | % |
| $ | 13.17 | | | | 13.94 | % | | | 1.63 | % | | | 0.08 | % | | | 1.63 | % | | $ | 9,118 | | | | 18 | % |
| | | | | | | | | | | | | | | | | | | | | | | | | | |
| | | | | | | | | | | | | | | | | | | | | | | | | | |
| $ | 4.90 | | | | (53.87 | )% | | | 1.38 | % | | | 0.65 | % | | | 1.38 | % | | $ | 35,110 | | | | 72 | % |
| $ | 6.42 | | | | 32.33 | % | | | 1.38 | % | | | 0.82 | % | | | 1.38 | % | | $ | 72,641 | | | | 36 | % |
| $ | 7.99 | | | | 25.09 | % | | | 1.35 | % | | | 0.27 | % | | | 1.35 | % | | $ | 90,813 | | | | 22 | % |
| $ | 7.15 | | | | (9.64 | )% | | | 1.35 | % | | | 0.66 | % | | | 1.35 | % | | $ | 92,475 | | | | 60 | % |
| $ | 7.42 | | | | 5.20 | % | | | 1.35 | % | | | 1.54 | % | | | 1.35 | % | | $ | 96,292 | | | | 30 | % |
| | | | | | | | | | | | | | | | | | | | | | | | | | |
| $ | 4.92 | | | | (53.95 | )% | | | 1.63 | % | | | 0.39 | % | | | 1.63 | % | | $ | 514 | | | | 72 | % |
| $ | 6.43 | | | | 31.82 | % | | | 1.63 | % | | | 0.64 | % | | | 1.63 | % | | $ | 1,114 | | | | 36 | % |
| $ | 8.00 | | | | 24.85 | % | | | 1.60 | % | | | 0.03 | % | | | 1.60 | % | | $ | 2,052 | | | | 22 | % |
| $ | 7.16 | | | | (9.88 | )% | | | 1.60 | % | | | 0.39 | % | | | 1.60 | % | | $ | 2,004 | | | | 60 | % |
| $ | 7.43 | | | | 4.96 | % | | | 1.60 | % | | | 1.30 | % | | | 1.60 | % | | $ | 2,173 | | | | 30 | % |
Annual Shareholder Report
129
Financial Highlights (Continued)
Equity Funds (Continued)
(For a share outstanding throughout each period)
| | | | | | | | | | | | | | | | | | | | | | | | | | | | | | | | |
| | | Net Asset
Value,
beginning
of period | | | Net
investment
income (loss) | | | Net realized
and unrealized
gain (loss) on
investments | | | Total from
investment
operations | | | Distributions
from net
investment
income | | | Distributions
from net
realized gain
on investment
transactions | | | Distributions
from return
of capital | | | Total
distributions | |
| HUNTINGTON ROTATING MARKETS FUND | | | | | | | | | | | | | | | | | |
| Trust Shares | | | | | | | | | | | | | | | | | |
2008 | | $ | 13.63 | | | | 0.10 | | | | (5.71 | ) | | | (5.61 | ) | | | (0.10 | ) | | | (0.19 | ) | | | — | | | | (0.29 | ) |
2009 | | $ | 7.73 | | | | 0.10 | | | | 2.50 | | | | 2.60 | | | | (0.10 | ) | | | — | | | | — | | | | (0.10 | ) |
2010 | | $ | 10.23 | | | | 0.03 | | | | 0.59 | | | | 0.62 | | | | — | (3) | | | — | | | | — | | | | — | (3) |
2011 | | $ | 10.85 | | | | 0.17 | | | | 0.54 | | | | 0.71 | | | | (0.03 | ) | | | — | | | | — | | | | (0.03 | ) |
2012 | | $ | 11.53 | | | | 0.04 | | | | 0.69 | | | | 0.73 | | | | (0.21 | ) | | | (1.60 | ) | | | — | | | | (1.81 | ) |
| Class A Shares | | | | | | | | | | | | | | | | | |
2008 | | $ | 13.54 | | | | 0.07 | | | | (5.66 | ) | | | (5.59 | ) | | | (0.07 | ) | | | (0.19 | ) | | | — | | | | (0.26 | ) |
2009 | | $ | 7.69 | | | | 0.08 | | | | 2.48 | | | | 2.56 | | | | (0.07 | ) | | | — | | | | — | | | | (0.07 | ) |
2010 | | $ | 10.18 | | | | 0.01 | | | | 0.59 | | | | 0.60 | | | | — | (3) | | | — | | | | — | | | | — | (3) |
2011 | | $ | 10.78 | | | | 0.14 | | | | 0.53 | | | | 0.67 | | | | — | (3) | | | — | | | | — | | | | — | (3) |
2012 | | $ | 11.45 | | | | 0.04 | | | | 0.65 | | | | 0.69 | | | | (0.18 | ) | | | (1.60 | ) | | | — | | | | (1.78 | ) |
| HUNTINGTON SITUS FUND | | | | | | | | | | | | | | | | | |
| Trust Shares | | | | | | | | | | | | | | | | | |
2008 | | $ | 20.00 | | | | 0.01 | | | | (7.83 | ) | | | (7.82 | ) | | | — | | | | (0.47 | ) | | | — | | | | (0.47 | ) |
2009 | | $ | 11.71 | | | | 0.03 | | | | 4.27 | | | | 4.30 | | | | (0.01 | ) | | | (0.03 | ) | | | (0.02 | ) | | | (0.06 | ) |
2010 | | $ | 15.95 | | | | (0.03 | ) | | | 4.29 | | | | 4.26 | | | | — | | | | — | | | | — | | | | — | |
2011 | | $ | 20.21 | | | | (0.05 | ) | | | (0.63 | ) | | | (0.68 | ) | | | — | | | | — | | | | — | | | | — | |
2012 | | $ | 19.53 | | | | 0.09 | | | | 4.60 | | | | 4.69 | | | | (0.04 | ) | | | (0.74 | ) | | | — | | | | (0.78 | ) |
| Class A Shares | | | | | | | | | | | | | | | | | |
2008 | | $ | 19.70 | | | | (0.03 | ) | | | (7.71 | ) | | | (7.74 | ) | | | — | | | | (0.47 | ) | | | — | | | | (0.47 | ) |
2009 | | $ | 11.49 | | | | (0.01 | ) | | | 4.19 | | | | 4.18 | | | | — | (3) | | | (0.03 | ) | | | — | (3) | | | (0.03 | ) |
2010 | | $ | 15.64 | | | | (0.06 | ) | | | 4.20 | | | | 4.14 | | | | — | | | | — | | | | — | | | | — | |
2011 | | $ | 19.78 | | | | (0.10 | ) | | | (0.62 | ) | | | (0.72 | ) | | | — | | | | — | | | | — | | | | — | |
2012 | | $ | 19.06 | | | | 0.04 | | | | 4.48 | | | | 4.52 | | | | — | | | | (0.74 | ) | | | — | | | | (0.74 | ) |
| (1) | Based on net asset value, which does not reflect a sales charge or contingent deferred sales charge, if applicable. |
| (2) | Portfolio Turnover is calculated on the basis of the Fund as a whole without distinguishing among the classes of shares. |
| (3) | Amount is less than $0.005. |
(See notes which are an integral part of the Financial Statements)
Annual Shareholder Report
130
| | | | | | | | | | | | | | | | | | | | | | | | | | |
Net Asset
Value, end
of period | | | Total
return(1) | | | Ratio of Net
Expenses to
Average Net
Assets | | | Ratio of Net
Investment
Income (Loss)
to Average
Net Assets | | | Ratio of Expenses
(Prior to
Reimbursements)
to Average
Net Assets | | | Net Assets,
end of
period
(000 omitted) | | | Portfolio
turnover
rate(2) | |
| | | | | | | | | | | | | | | | | | | | | | | | | | |
| | | | | | | | | | | | | | | | | | | | | | | | | | |
| $ | 7.73 | | | | (41.68 | )% | | | 1.18 | % | | | 0.85 | % | | | 1.18 | % | | $ | 28,390 | | | | 218 | % |
| $ | 10.23 | | | | 33.64 | % | | | 1.19 | % | | | 1.16 | % | | | 1.19 | % | | $ | 41,786 | | | | 230 | % |
| $ | 10.85 | | | | 6.07 | % | | | 1.19 | % | | | 0.27 | % | | | 1.19 | % | | $ | 36,729 | | | | 250 | % |
| $ | 11.53 | | | | 6.57 | % | | | 1.21 | % | | | 1.39 | % | | | 1.21 | % | | $ | 35,046 | | | | 2 | % |
| $ | 10.45 | | | | 6.40 | % | | | 1.18 | % | | | 0.66 | % | | | 1.18 | % | | $ | 38,263 | | | | 105 | % |
| | | | | | | | | | | | | | | | | | | | | | | | | | |
| $ | 7.69 | | | | (41.81 | )% | | | 1.43 | % | | | 0.59 | % | | | 1.43 | % | | $ | 2,000 | | | | 218 | % |
| $ | 10.18 | | | | 33.32 | % | | | 1.44 | % | | | 0.85 | % | | | 1.44 | % | | $ | 1,937 | | | | 230 | % |
| $ | 10.78 | | | | 5.90 | % | | | 1.43 | % | | | 0.09 | % | | | 1.43 | % | | $ | 2,600 | | | | 250 | % |
| $ | 11.45 | | | | 6.26 | % | | | 1.46 | % | | | 1.13 | % | | | 1.46 | % | | $ | 2,371 | | | | 2 | % |
| $ | 10.36 | | | | 6.07 | % | | | 1.43 | % | | | 0.42 | % | | | 1.43 | % | | $ | 2,290 | | | | 105 | % |
| | | | | | | | | | | | | | | | | | | | | | | | | | |
| | | | | | | | | | | | | | | | | | | | | | | | | | |
| $ | 11.71 | | | | (39.25 | )% | | | 1.34 | % | | | 0.06 | % | | | 1.34 | % | | $ | 77,947 | | | | 19 | % |
| $ | 15.95 | | | | 36.86 | % | | | 1.38 | % | | | 0.25 | % | | | 1.38 | % | | $ | 141,342 | | | | 25 | % |
| $ | 20.21 | | | | 26.71 | % | | | 1.36 | % | | | (0.16 | )% | | | 1.36 | % | | $ | 183,311 | | | | 32 | % |
| $ | 19.53 | | | | (3.36 | )% | | | 1.32 | % | | | (0.25 | )% | | | 1.32 | % | | $ | 166,134 | | | | 18 | % |
| $ | 23.44 | | | | 24.11 | % | | | 1.35 | % | | | 0.41 | % | | | 1.35 | % | | $ | 192,757 | | | | 11 | % |
| | | | | | | | | | | | | | | | | | | | | | | | | | |
| $ | 11.49 | | | | (39.44 | )% | | | 1.59 | % | | | (0.21 | )% | | | 1.59 | % | | $ | 12,121 | | | | 19 | % |
| $ | 15.64 | | | | 36.52 | % | | | 1.63 | % | | | (0.01 | )% | | | 1.63 | % | | $ | 16,747 | | | | 25 | % |
| $ | 19.78 | | | | 26.47 | % | | | 1.61 | % | | | (0.38 | )% | | | 1.61 | % | | $ | 23,990 | | | | 32 | % |
| $ | 19.06 | | | | (3.64 | )% | | | 1.57 | % | | | (0.50 | )% | | | 1.57 | % | | $ | 22,409 | | | | 18 | % |
| $ | 22.84 | | | | 23.82 | % | | | 1.60 | % | | | 0.17 | % | | | 1.60 | % | | $ | 28,485 | | | | 11 | % |
Annual Shareholder Report
131
Financial Highlights (Continued)
Income Funds
(For a share outstanding throughout each period)
| | | | | | | | | | | | | | | | | | | | | | | | | | | | | | | | |
| | | Net Asset
Value,
beginning
of period | | | Net
investment
income (loss) | | | Net realized
and unrealized
gain (loss) on
investments | | | Total from
investment
operations | | | Distributions
from net
investment
income | | | Distributions
from net
realized gain
on investment
transactions | | | Distributions
from return
of capital | | | Total
distributions | |
| HUNTINGTON FIXED INCOME SECURITIES FUND | | | | | | | | | | | | | | | | | |
| Trust Shares | | | | | | | | | | | | | | | | | |
2008 | | $ | 21.15 | | | | 0.85 | | | | 0.24 | | | | 1.09 | | | | (0.85 | ) | | | (0.05 | ) | | | — | | | | (0.90 | ) |
2009 | | $ | 21.34 | | | | 0.78 | | | | 0.34 | | | | 1.12 | | | | (0.78 | ) | | | (0.06 | ) | | | — | | | | (0.84 | ) |
2010 | | $ | 21.62 | | | | 0.67 | | | | 0.57 | | | | 1.24 | | | | (0.67 | ) | | | (0.03 | ) | | | — | | | | (0.70 | ) |
2011 | | $ | 22.16 | | | | 0.60 | | | | 0.76 | | | | 1.36 | | | | (0.60 | ) | | | (0.33 | ) | | | — | | | | (0.93 | ) |
2012 | | $ | 22.59 | | | | 0.56 | | | | 0.33 | | | | 0.89 | | | | (0.56 | ) | | | (0.21 | ) | | | — | | | | (0.77 | ) |
| Class A Shares | | | | | | | | | | | | | | | | | |
2008 | | $ | 21.15 | | | | 0.80 | | | | 0.24 | | | | 1.04 | | | | (0.80 | ) | | | (0.05 | ) | | | — | | | | (0.85 | ) |
2009 | | $ | 21.34 | | | | 0.73 | | | | 0.34 | | | | 1.07 | | | | (0.73 | ) | | | (0.06 | ) | | | — | | | | (0.79 | ) |
2010 | | $ | 21.62 | | | | 0.61 | | | | 0.57 | | | | 1.18 | | | | (0.61 | ) | | | (0.03 | ) | | | — | | | | (0.64 | ) |
2011 | | $ | 22.16 | | | | 0.55 | | | | 0.76 | | | | 1.31 | | | | (0.55 | ) | | | (0.33 | ) | | | — | | | | (0.88 | ) |
2012 | | $ | 22.59 | | | | 0.51 | | | | 0.33 | | | | 0.84 | | | | (0.51 | ) | | | (0.21 | ) | | | — | | | | (0.72 | ) |
| HUNTINGTON INTERMEDIATE GOVERNMENT INCOME FUND | | | | | | | | | | | | | | | | | |
| Trust Shares | | | | | | | | | | | | | | | | | |
2008 | | $ | 10.49 | | | | 0.41 | | | | 0.40 | | | | 0.81 | | | | (0.41 | ) | | | — | | | | — | | | | (0.41 | ) |
2009 | | $ | 10.89 | | | | 0.35 | | | | (0.15 | ) | | | 0.20 | | | | (0.35 | ) | | | — | | | | — | | | | (0.35 | ) |
2010 | | $ | 10.74 | | | | 0.31 | | | | 0.19 | | | | 0.50 | | | | (0.31 | ) | | | (0.03 | ) | | | — | | | | (0.34 | ) |
2011 | | $ | 10.90 | | | | 0.26 | | | | 0.28 | | | | 0.54 | | | | (0.27 | ) | | | (0.02 | ) | | | — | | | | (0.29 | ) |
2012 | | $ | 11.15 | | | | 0.20 | | | | (0.02 | ) | | | 0.18 | | | | (0.22 | ) | | | (0.01 | ) | | | — | | | | (0.23 | ) |
| Class A Shares | | | | | | | | | | | | | | | | | |
2008 | | $ | 10.49 | | | | 0.38 | | | | 0.40 | | | | 0.78 | | | | (0.38 | ) | | | — | | | | — | | | | (0.38 | ) |
2009 | | $ | 10.89 | | | | 0.32 | | | | (0.15 | ) | | | 0.17 | | | | (0.32 | ) | | | — | | | | — | | | | (0.32 | ) |
2010 | | $ | 10.74 | | | | 0.28 | | | | 0.19 | | | | 0.47 | | | | (0.28 | ) | | | (0.03 | ) | | | — | | | | (0.31 | ) |
2011 | | $ | 10.90 | | | | 0.24 | | | | 0.26 | | | | 0.50 | | | | (0.24 | ) | | | (0.02 | ) | | | — | | | | (0.26 | ) |
2012 | | $ | 11.14 | | | | 0.18 | | | | (0.01 | ) | | | 0.17 | | | | (0.20 | ) | | | (0.01 | ) | | | — | | | | (0.21 | ) |
| (1) | Based on net asset value, which does not reflect a sales charge or contingent deferred sales charge, if applicable. |
| (2) | Portfolio Turnover is calculated on the basis of the Fund as a whole without distinguishing among the classes of shares. |
(See notes which are an integral part of the Financial Statements)
Annual Shareholder Report
132
| | | | | | | | | | | | | | | | | | | | | | | | | | |
Net Asset
Value, end
of period | | | Total
return(1) | | | Ratio of Net
Expenses to
Average Net
Assets | | | Ratio of Net
Investment
Income (Loss)
to Average
Net Assets | | | Ratio of Expenses
(Prior to
Reimbursements)
to Average
Net Assets | | | Net Assets,
end of
period
(000 omitted) | | | Portfolio
turnover
rate(2) | |
| | | | | | | | | | | | | | | | | | | | | | | | | | |
| | | | | | | | | | | | | | | | | | | | | | | | | | |
| $ | 21.34 | | | | 5.32 | % | | | 1.06 | % | | | 4.05 | % | | | 1.06 | % | | $ | 183,011 | | | | 31 | % |
| $ | 21.62 | | | | 5.36 | % | | | 1.08 | % | | | 3.62 | % | | | 1.08 | % | | $ | 229,570 | | | | 30 | % |
| $ | 22.16 | | | | 5.75 | % | | | 1.06 | % | | | 2.99 | % | | | 1.06 | % | | $ | 283,953 | | | | 19 | % |
| $ | 22.59 | | | | 6.26 | % | | | 1.04 | % | | | 2.70 | % | | | 1.04 | % | | $ | 291,200 | | | | 35 | % |
| $ | 22.71 | | | | 3.98 | % | | | 1.06 | % | | | 2.44 | % | | | 1.06 | % | | $ | 302,442 | | | | 30 | % |
| | | | | | | | | | | | | | | | | | | | | | | | | | |
| $ | 21.34 | | | | 5.06 | % | | | 1.31 | % | | | 3.80 | % | | | 1.31 | % | | $ | 2,525 | | | | 31 | % |
| $ | 21.62 | | | | 5.10 | % | | | 1.33 | % | | | 3.36 | % | | | 1.33 | % | | $ | 3,420 | | | | 30 | % |
| $ | 22.16 | | | | 5.50 | % | | | 1.30 | % | | | 2.68 | % | | | 1.30 | % | | $ | 8,413 | | | | 19 | % |
| $ | 22.59 | | | | 6.01 | % | | | 1.29 | % | | | 2.45 | % | | | 1.29 | % | | $ | 8,123 | | | | 35 | % |
| $ | 22.71 | | | | 3.74 | % | | | 1.31 | % | | | 2.19 | % | | | 1.31 | % | | $ | 9,505 | | | | 30 | % |
| | | | | | | | | | | | | | | | | | | | | | | | | | |
| | | | | | | | | | | | | | | | | | | | | | | | | | |
| $ | 10.89 | | | | 7.88 | % | | | 1.07 | % | | | 3.84 | % | | | 1.07 | % | | $ | 115,159 | | | | 27 | % |
| $ | 10.74 | | | | 1.86 | % | | | 1.10 | % | | | 3.21 | % | | | 1.10 | % | | $ | 110,761 | | | | 26 | % |
| $ | 10.90 | | | | 4.64 | % | | | 1.10 | % | | | 2.80 | % | | | 1.10 | % | | $ | 115,470 | | | | 6 | % |
| $ | 11.15 | | | | 5.05 | % | | | 1.08 | % | | | 2.38 | % | | | 1.08 | % | | $ | 134,149 | | | | 21 | % |
| $ | 11.10 | | | | 1.68 | % | | | 1.09 | % | | | 1.86 | % | | | 1.09 | % | | $ | 116,280 | | | | 20 | % |
| | | | | | | | | | | | | | | | | | | | | | | | | | |
| $ | 10.89 | | | | 7.62 | % | | | 1.32 | % | | | 3.60 | % | | | 1.32 | % | | $ | 1,438 | | | | 27 | % |
| $ | 10.74 | | | | 1.60 | % | | | 1.35 | % | | | 2.93 | % | | | 1.35 | % | | $ | 2,215 | | | | 26 | % |
| $ | 10.90 | | | | 4.38 | % | | | 1.34 | % | | | 2.50 | % | | | 1.34 | % | | $ | 4,675 | | | | 6 | % |
| $ | 11.14 | | | | 4.69 | % | | | 1.33 | % | | | 2.13 | % | | | 1.33 | % | | $ | 4,832 | | | | 21 | % |
| $ | 11.10 | | | | 1.53 | % | | | 1.34 | % | | | 1.60 | % | | | 1.34 | % | | $ | 5,238 | | | | 20 | % |
Annual Shareholder Report
133
Financial Highlights (Continued)
Income Funds (Continued)
(For a share outstanding throughout each period)
| | | | | | | | | | | | | | | | | | | | | | | | | | | | | | | | |
| | | Net Asset
Value,
beginning
of period | | | Net
investment
income (loss) | | | Net realized
and unrealized
gain (loss) on
investments | | | Total from
investment
operations | | | Distributions
from net
investment
income | | | Distributions
from net
realized gain
on investment
transactions | | | Distributions
from return
of capital | | | Total
distributions | |
| HUNTINGTON MORTGAGE SECURITIES FUND | | | | | | | | | | | | | | | | | |
| Trust Shares | | | | | | | | | | | | | | | | | |
2008 | | $ | 8.92 | | | | 0.34 | | | | (0.12 | ) | | | 0.22 | | | | (0.34 | ) | | | (0.01 | ) | | | — | | | | (0.35 | ) |
2009 | | $ | 8.79 | | | | 0.29 | | | | 0.15 | | | | 0.44 | | | | (0.31 | ) | | | — | | | | — | | | | (0.31 | ) |
2010 | | $ | 8.92 | | | | 0.27 | | | | 0.19 | | | | 0.46 | | | | (0.28 | ) | | | — | | | | — | | | | (0.28 | ) |
2011 | | $ | 9.10 | | | | 0.24 | | | | 0.21 | | | | 0.45 | | | | (0.29 | ) | | | — | | | | — | | | | (0.29 | ) |
2012 | | $ | 9.26 | | | | 0.16 | | | | 0.11 | | | | 0.27 | | | | (0.24 | ) | | | (0.06 | ) | | | — | | | | (0.30 | ) |
| Class A Shares | | | | | | | | | | | | | | | | | |
2008 | | $ | 8.97 | | | | 0.32 | | | | (0.13 | ) | | | 0.19 | | | | (0.31 | ) | | | (0.01 | ) | | | — | | | | (0.32 | ) |
2009 | | $ | 8.84 | | | | 0.27 | | | | 0.15 | | | | 0.42 | | | | (0.29 | ) | | | — | | | | — | | | | (0.29 | ) |
2010 | | $ | 8.97 | | | | 0.23 | | | | 0.22 | | | | 0.45 | | | | (0.26 | ) | | | — | | | | — | | | | (0.26 | ) |
2011 | | $ | 9.16 | | | | 0.21 | | | | 0.22 | | | | 0.43 | | | | (0.27 | ) | | | — | | | | — | | | | (0.27 | ) |
2012 | | $ | 9.32 | | | | 0.15 | | | | 0.10 | | | | 0.25 | | | | (0.22 | ) | | | (0.06 | ) | | | — | | | | (0.28 | ) |
| HUNTINGTON OHIO TAX-FREE FUND | | | | | | | | | | | | | | | | | |
| Trust Shares | | | | | | | | | | | | | | | | | |
2008 | | $ | 20.95 | | | | 0.57 | | | | (0.17 | ) | | | 0.40 | | | | (0.57 | ) | | | (0.03 | ) | | | — | | | | (0.60 | ) |
2009 | | $ | 20.75 | | | | 0.59 | | | | 0.45 | | | | 1.04 | | | | (0.59 | ) | | | — | | | | — | | | | (0.59 | ) |
2010 | | $ | 21.20 | | | | 0.50 | | | | (0.11 | ) | | | 0.39 | | | | (0.50 | ) | | | (0.07 | ) | | | — | | | | (0.57 | ) |
2011 | | $ | 21.02 | | | | 0.46 | | | | 1.08 | | | | 1.54 | | | | (0.46 | ) | | | (0.16 | ) | | | — | | | | (0.62 | ) |
2012 | | $ | 21.94 | | | | 0.43 | | | | 0.42 | | | | 0.85 | | | | (0.43 | ) | | | (0.42 | ) | | | — | | | | (0.85 | ) |
| Class A Shares | | | | | | | | | | | | | | | | | |
2008 | | $ | 20.93 | | | | 0.51 | | | | (0.16 | ) | | | 0.35 | | | | (0.51 | ) | | | (0.03 | ) | | | — | | | | (0.54 | ) |
2009 | | $ | 20.74 | | | | 0.54 | | | | 0.44 | | | | 0.98 | | | | (0.54 | ) | | | — | | | | — | | | | (0.54 | ) |
2010 | | $ | 21.18 | | | | 0.45 | | | | (0.11 | ) | | | 0.34 | | | | (0.45 | ) | | | (0.07 | ) | | | — | | | | (0.52 | ) |
2011 | | $ | 21.00 | | | | 0.40 | | | | 1.09 | | | | 1.49 | | | | (0.40 | ) | | | (0.16 | ) | | | — | | | | (0.56 | ) |
2012 | | $ | 21.93 | | | | 0.37 | | | | 0.42 | | | | 0.79 | | | | (0.37 | ) | | | (0.42 | ) | | | — | | | | (0.79 | ) |
| (1) | Based on net asset value, which does not reflect a sales charge or contingent deferred sales charge, if applicable. |
| (2) | Portfolio Turnover is calculated on the basis of the Fund as a whole without distinguishing among the classes of shares. |
(See notes which are an integral part of the Financial Statements)
Annual Shareholder Report
134
| | | | | | | | | | | | | | | | | | | | | | | | | | |
Net Asset
Value, end
of period | | | Total
return(1) | | | Ratio of Net
Expenses to
Average Net
Assets | | | Ratio of Net
Investment
Income (Loss)
to Average
Net Assets | | | Ratio of Expenses
(Prior to
Reimbursements)
to Average
Net Assets | | | Net Assets,
end of
period
(000 omitted) | | | Portfolio
turnover
rate(2) | |
| | | | | | | | | | | | | | | | | | | | | | | | | | |
| | | | | | | | | | | | | | | | | | | | | | | | | | |
| $ | 8.79 | | | | 2.45 | % | | | 1.10 | % | | | 3.82 | % | | | 1.10 | % | | $ | 82,729 | | | | 13 | % |
| $ | 8.92 | | | | 5.17 | % | | | 1.11 | % | | | 3.32 | % | | | 1.11 | % | | $ | 100,114 | | | | 24 | % |
| $ | 9.10 | | | | 5.21 | % | | | 1.11 | % | | | 2.87 | % | | | 1.11 | % | | $ | 96,832 | | | | 6 | % |
| $ | 9.26 | | | | 5.01 | % | | | 1.11 | % | | | 2.57 | % | | | 1.11 | % | | $ | 104,098 | | | | 22 | % |
| $ | 9.23 | | | | 2.95 | % | | | 1.11 | % | | | 1.89 | % | | | 1.11 | % | | $ | 73,818 | | | | 26 | % |
| | | | | | | | | | | | | | | | | | | | | | | | | | |
| $ | 8.84 | | | | 2.16 | % | | | 1.35 | % | | | 3.55 | % | | | 1.35 | % | | $ | 3,022 | | | | 13 | % |
| $ | 8.97 | | | | 4.85 | % | | | 1.36 | % | | | 3.07 | % | | | 1.36 | % | | $ | 2,629 | | | | 24 | % |
| $ | 9.16 | | | | 5.03 | % | | | 1.35 | % | | | 2.62 | % | | | 1.35 | % | | $ | 3,910 | | | | 6 | % |
| $ | 9.32 | | | | 4.71 | % | | | 1.36 | % | | | 2.29 | % | | | 1.36 | % | | $ | 4,434 | | | | 22 | % |
| $ | 9.29 | | | | 2.68 | % | | | 1.36 | % | | | 1.62 | % | | | 1.36 | % | | $ | 4,801 | | | | 26 | % |
| | | | | | | | | | | | | | | | | | | | | | | | | | |
| | | | | | | | | | | | | | | | | | | | | | | | | | |
| $ | 20.75 | | | | 1.95 | % | | | 1.22 | % | | | 2.73 | % | | | 1.22 | % | | $ | 32,946 | | | | 19 | % |
| $ | 21.20 | | | | 5.05 | % | | | 1.20 | % | | | 2.80 | % | | | 1.20 | % | | $ | 42,568 | | | | 21 | % |
| $ | 21.02 | | | | 1.85 | % | | | 1.20 | % | | | 2.36 | % | | | 1.20 | % | | $ | 48,741 | | | | 18 | % |
| $ | 21.94 | | | | 7.37 | % | | | 1.22 | % | | | 2.13 | % | | | 1.22 | % | | $ | 50,628 | | | | 28 | % |
| $ | 21.94 | | | | 3.90 | % | | | 1.19 | % | | | 1.92 | % | | | 1.19 | % | | $ | 50,552 | | | | 47 | % |
| | | | | | | | | | | | | | | | | | | | | | | | | | |
| $ | 20.74 | | | | 1.74 | % | | | 1.47 | % | | | 2.49 | % | | | 1.47 | % | | $ | 1,422 | | | | 19 | % |
| $ | 21.18 | | | | 4.74 | % | | | 1.45 | % | | | 2.54 | % | | | 1.45 | % | | $ | 1,745 | | | | 21 | % |
| $ | 21.00 | | | | 1.60 | % | | | 1.45 | % | | | 2.09 | % | | | 1.45 | % | | $ | 3,192 | | | | 18 | % |
| $ | 21.93 | | | | 7.16 | % | | | 1.47 | % | | | 1.88 | % | | | 1.47 | % | | $ | 3,141 | | | | 28 | % |
| $ | 21.93 | | | | 3.65 | % | | | 1.44 | % | | | 1.67 | % | | | 1.44 | % | | $ | 3,481 | | | | 47 | % |
Annual Shareholder Report
135
Financial Highlights (Continued)
Income Funds (Continued)
(For a share outstanding throughout each period)
| | | | | | | | | | | | | | | | | | | | | | | | | | | | | | | | |
| | | Net Asset
Value,
beginning
of period | | | Net
investment
income (loss) | | | Net realized
and unrealized
gain (loss) on
investments | | | Total from
investment
operations | | | Distributions
from net
investment
income | | | Distributions
from net
realized gain
on investment
transactions | | | Distributions
from return
of capital | | | Total
distributions | |
| HUNTINGTON SHORT/INTERMEDIATE FIXED INCOME SECURITIES FUND | | | | | | | | | | | | | |
| Trust Shares | | | | | | | | | | | | | | | | | |
2008 | | $ | 19.46 | | | | 0.67 | | | | (0.59 | ) | | | 0.08 | | | | (0.67 | ) | | | — | | | | — | | | | (0.67 | ) |
2009 | | $ | 18.87 | | | | 0.53 | | | | 0.91 | | | | 1.44 | | | | (0.53 | ) | | | — | | | | — | | | | (0.53 | ) |
2010 | | $ | 19.78 | | | | 0.40 | | | | 0.19 | | | | 0.59 | | | | (0.40 | ) | | | — | | | | — | | | | (0.40 | ) |
2011 | | $ | 19.97 | | | | 0.27 | | | | 0.12 | | | | 0.39 | | | | (0.27 | ) | | | — | | | | — | | | | (0.27 | ) |
2012 | | $ | 20.09 | | | | 0.25 | | | | 0.11 | | | | 0.36 | | | | (0.25 | ) | | | — | | | | — | | | | (0.25 | ) |
| Class A Shares | | | | | | | | | | | | | | | | | |
2008 | | $ | 19.46 | | | | 0.63 | | | | (0.59 | ) | | | 0.04 | | | | (0.63 | ) | | | — | | | | — | | | | (0.63 | ) |
2009 | | $ | 18.87 | | | | 0.48 | | | | 0.91 | | | | 1.39 | | | | (0.48 | ) | | | — | | | | — | | | | (0.48 | ) |
2010 | | $ | 19.78 | | | | 0.35 | | | | 0.20 | | | | 0.55 | | | | (0.35 | ) | | | — | | | | — | | | | (0.35 | ) |
2011 | | $ | 19.98 | | | | 0.22 | | | | 0.12 | | | | 0.34 | | | | (0.22 | ) | | | — | | | | — | | | | (0.22 | ) |
2012 | | $ | 20.10 | | | | 0.20 | | | | 0.10 | | | | 0.30 | | | | (0.20 | ) | | | — | | | | — | | | | (0.20 | ) |
| (1) | Based on net asset value, which does not reflect a sales charge or contingent deferred sales charge, if applicable. |
| (2) | Portfolio Turnover is calculated on the basis of the Fund as a whole without distinguishing among the classes of shares. |
(See notes which are an integral part of the Financial Statements)
Annual Shareholder Report
136
| | | | | | | | | | | | | | | | | | | | | | | | | | |
Net Asset
Value, end
of period | | | Total
return(1) | | | Ratio of Net
Expenses to
Average Net
Assets | | | Ratio of Net
Investment
Income (Loss)
to Average
Net Assets | | | Ratio of Expenses
(Prior to
Reimbursements)
to Average
Net Assets | | | Net Assets,
end of
period
(000 omitted) | | | Portfolio
turnover
rate(2) | |
| | | | | | | | | | | | | | | | | | | | | | | | | | |
| | | | | | | | | | | | | | | | | | | | | | | | | | |
| $ | 18.87 | | | | 0.43 | % | | | 1.08 | % | | | 3.51 | % | | | 1.08 | % | | $ | 79,130 | | | | 51 | % |
| $ | 19.78 | | | | 7.70 | % | | | 1.09 | % | | | 2.67 | % | | | 1.09 | % | | $ | 149,384 | | | | 50 | % |
| $ | 19.97 | | | | 2.99 | % | | | 1.06 | % | | | 1.97 | % | | | 1.06 | % | | $ | 196,479 | | | | 24 | % |
| $ | 20.09 | | | | 1.98 | % | | | 1.05 | % | | | 1.35 | % | | | 1.05 | % | | $ | 215,735 | | | | 31 | % |
| $ | 20.20 | | | | 1.79 | % | | | 1.06 | % | | | 1.22 | % | | | 1.06 | % | | $ | 187,744 | | | | 23 | % |
| | | | | | | | | | | | | | | | | | | | | | | | | | |
| $ | 18.87 | | | | 0.18 | % | | | 1.33 | % | | | 3.26 | % | | | 1.33 | % | | $ | 555 | | | | 51 | % |
| $ | 19.78 | | | | 7.43 | % | | | 1.33 | % | | | 2.38 | % | | | 1.33 | % | | $ | 1,076 | | | | 50 | % |
| $ | 19.98 | | | | 2.78 | % | | | 1.30 | % | | | 1.60 | % | | | 1.30 | % | | $ | 7,639 | | | | 24 | % |
| $ | 20.10 | | | | 1.72 | % | | | 1.30 | % | | | 1.10 | % | | | 1.30 | % | | $ | 9,207 | | | | 31 | % |
| $ | 20.20 | | | | 1.48 | % | | | 1.31 | % | | | 0.97 | % | | | 1.31 | % | | $ | 11,183 | | | | 23 | % |
Annual Shareholder Report
137
Financial Highlights (Continued)
Asset Allocation Funds
(For a share outstanding throughout each period)
| | | | | | | | | | | | | | | | | | | | | | | | | | | | | | | | |
| | | Net Asset
Value,
beginning
of period | | | Net
investment
income (loss) | | | Net realized
and unrealized
gain (loss) on
investments | | | Total from
investment
operations | | | Distributions
from net
investment
income | | | Distributions
from net
realized gain
on investment
transactions | | | Distributions
from return
of capital | | | Total
distributions | |
| HUNTINGTON BALANCED ALLOCATION FUND | | | | | | | | | | | | | | | | | |
2009(3) | | $ | 10.00 | | | | 0.05 | | | | 0.75 | | | | 0.80 | | | | (0.06 | ) | | | — | (4) | | | — | | | | (0.06 | ) |
2010 | | $ | 10.74 | | | | 0.09 | | | | 0.88 | | | | 0.97 | | | | (0.09 | ) | | | (0.05 | ) | | | — | | | | (0.14 | ) |
2011 | | $ | 11.57 | | | | 0.10 | | | | (0.13 | ) | | | (0.03 | ) | | | (0.10 | ) | | | (0.11 | ) | | | — | | | | (0.21 | ) |
2012 | | $ | 11.33 | | | | 0.12 | | | | 0.75 | | | | 0.87 | | | | (0.12 | ) | | | (1.09 | ) | | | — | | | | (1.21 | ) |
| HUNTINGTON CONSERVATIVE ALLOCATION FUND | | | | | | | | | | | | | | | | | |
2009(3) | | $ | 10.00 | | | | 0.08 | | | | 0.34 | | | | 0.42 | | | | (0.09 | ) | | | (0.01 | ) | | | — | | | | (0.10 | ) |
2010 | | $ | 10.32 | | | | 0.17 | | | | 0.41 | | | | 0.58 | | | | (0.16 | ) | | | (0.05 | ) | | | — | | | | (0.21 | ) |
2011 | | $ | 10.69 | | | | 0.15 | | | | 0.11 | | | | 0.26 | | | | (0.15 | ) | | | (0.08 | ) | | | — | | | | (0.23 | ) |
2012 | | $ | 10.72 | | | | 0.14 | | | | 0.33 | | | | 0.47 | | | | (0.14 | ) | | | (1.93 | ) | | | — | | | | (2.07 | ) |
| HUNTINGTON GROWTH ALLOCATION FUND | | | | | | | | | | | | | | | | | |
2009(3) | | $ | 10.00 | | | | 0.04 | | | | 0.88 | | | | 0.92 | | | | (0.05 | ) | | | — | (4) | | | — | | | | (0.05 | ) |
2010 | | $ | 10.87 | | | | 0.06 | | | | 1.09 | | | | 1.15 | | | | (0.06 | ) | | | (0.08 | ) | | | — | | | | (0.14 | ) |
2011 | | $ | 11.88 | | | | 0.07 | | | | (0.28 | ) | | | (0.21 | ) | | | (0.07 | ) | | | (0.15 | ) | | | — | | | | (0.22 | ) |
2012 | | $ | 11.45 | | | | 0.11 | | | | 1.03 | | | | 1.14 | | | | (0.11 | ) | | | (1.61 | ) | | | — | | | | (1.72 | ) |
| (1) | Based on net asset value, which does not reflect a sales charge or contingent deferred sales charge, if applicable. |
| (2) | If applicable, certain fees were waived and/or reimbursed. If such waivers/reimbursements had not occurred, the ratios would have been as indicated. |
| (3) | Reflects operations for the period from July 31, 2009 (commencement of operations) to December 31, 2009. |
| (4) | Amount is less than $0.005. |
| (6) | Computed on an annualized basis. |
| (7) | Does not include the effect of expenses of underlying funds. |
(See notes which are an integral part of the Financial Statements)
Annual Shareholder Report
138
| | | | | | | | | | | | | | | | | | | | | | | | | | |
Net Asset
Value, end
of period | | | Total
return(1) | | | Ratio of Net
Expenses to
Average Net
Assets | | | Ratio of Net
Investment
Income (Loss)
to Average
Net Assets | | | Ratio of Expenses
(Prior to
Reimbursements)
to Average
Net Assets(2) | | | Net Assets,
end of
period
(000 omitted) | | | Portfolio
turnover
rate | |
| | | | | | | | | | | | | | | | | | | | | | | | | | |
| $ | 10.74 | | | | 8.03 | %(5) | | | 0.62 | %(6)(7) | | | 1.30 | %(6) | | | 0.85 | %(6)(7) | | $ | 13,336 | | | | 42 | %(5) |
| $ | 11.57 | | | | 9.14 | % | | | 0.59 | %(7) | | | 0.94 | % | | | 0.74 | %(7) | | $ | 24,656 | | | | 26 | % |
| $ | 11.33 | | | | (0.18 | )% | | | 0.67 | %(7) | | | 0.90 | % | | | 0.80 | %(7) | | $ | 27,642 | | | | 23 | % |
| $ | 10.99 | | | | 7.79 | % | | | 0.68 | %(7) | | | 0.98 | % | | | 0.89 | %(7) | | $ | 18,192 | | | | 74 | % |
| | | | | | | | | | | | | | | | | | | | | | | | | | |
| $ | 10.32 | | | | 4.13 | %(5) | | | 0.72 | %(6)(7) | | | 1.91 | %(6) | | | 0.86 | %(6)(7) | | $ | 11,248 | | | | 32 | %(5) |
| $ | 10.69 | | | | 5.70 | % | | | 0.70 | %(7) | | | 1.60 | % | | | 0.79 | %(7) | | $ | 14,840 | | | | 22 | % |
| $ | 10.72 | | | | 2.50 | % | | | 0.73 | %(7) | | | 1.43 | % | | | 0.83 | %(7) | | $ | 15,544 | | | | 15 | % |
| $ | 9.12 | | | | 4.43 | % | | | 0.80 | %(7) | | | 1.11 | % | | | 1.00 | %(7) | | $ | 4,767 | | | | 37 | % |
| | | | | | | | | | | | | | | | | | | | | | | | | | |
| $ | 10.87 | | | | 9.21 | %(5) | | | 0.52 | %(6)(7) | | | 1.03 | %(6) | | | 0.85 | %(6)(7) | | $ | 12,923 | | | | 52 | %(5) |
| $ | 11.88 | | | | 10.69 | % | | | 0.51 | %(7) | | | 0.61 | % | | | 0.77 | %(7) | | $ | 19,132 | | | | 29 | % |
| $ | 11.45 | | | | (1.75 | )% | | | 0.64 | %(7) | | | 0.63 | % | | | 0.84 | %(7) | | $ | 21,618 | | | | 23 | % |
| $ | 10.87 | | | | 10.01 | % | | | 0.63 | %(7) | | | 0.85 | % | | | 0.95 | %(7) | | $ | 13,190 | | | | 54 | % |
Annual Shareholder Report
139
Notes to Financial Statements
December 31, 2012
The Huntington Funds (the “Trust”) was originally two separate Massachusetts business trusts: The Huntington Funds, established on February 10, 1987, and Huntington VA Funds, established on June 30, 1999 (together, the “Original Trusts”). On June 23, 2006, the Original Trusts were reorganized into a single Delaware statutory trust retaining the name of The Huntington Funds. The Trust is registered under the Investment Company Act of 1940, as amended (the “1940 Act”), as an open-end management investment company. At December 31, 2012, the Trust operated 35 separate series, or mutual funds, each with its own investment objective and strategy. The Funds’ prospectus provides a description of each Fund’s investment objectives, policies and strategies along with information on the classes of shares currently being offered. This report contains financial statements and financial highlights of the retail funds listed below (individually referred to as a “Fund,” or collectively as the “Funds”):
| | |
| Funds | | Investment Share
Classes Offered* |
Huntington Tax-Free Money Market Fund (“Tax-Free Money Market Fund”) | | Trust & A |
Huntington Money Market Fund
(“Money Market Fund”) | | Trust, A & Interfund |
Huntington Ohio Municipal Money Market Fund (“Ohio Municipal Money Market Fund”) | | Trust & A |
Huntington U.S. Treasury Money Market Fund (“U.S. Treasury Money Market Fund”) | | Trust & A |
Huntington Disciplined Equity Fund (“Disciplined Equity Fund”)** | | Trust & A |
Huntington Dividend Capture Fund
(“Dividend Capture Fund”) | | Trust & A |
Huntington Global Select Markets Fund (“Global Select Markets Fund”) | | Trust & A |
Huntington Growth Fund
(“Growth Fund”) | | Trust & A |
Huntington Income Equity Fund
(“Income Equity Fund”) | | Trust & A |
Huntington International Equity Fund (“International Equity Fund”) | | Trust & A |
Huntington Mid Corp America Fund
(“Mid Corp America Fund”) | | Trust & A |
Huntington Real Strategies Fund
(“Real Strategies Fund”) | | Trust & A |
Huntington Rotating Markets Fund
(“Rotating Markets Fund”) | | Trust & A |
Huntington Situs Fund
(“Situs Fund”) | | Trust & A |
Huntington Fixed Income Securities Fund (“Fixed Income Securities Fund”) | | Trust & A |
Huntington Intermediate Government
Income Fund
(“Intermediate Government Income Fund”) | | Trust & A |
Huntington Mortgage Securities Fund (“Mortgage Securities Fund”) | | Trust & A |
Huntington Ohio Tax-Free Fund
(“Ohio Tax-Free Fund”) | | Trust & A |
| | |
| Funds | | Investment Share
Classes Offered* |
Huntington Short/Intermediate Fixed Income Securities Fund
(“Short/Intermediate Fixed Income Securities Fund”) | | Trust & A |
Huntington Balanced Allocation Fund (“Balanced Allocation Fund”) | | A |
Huntington Conservative Allocation Fund (“Conservative Allocation Fund”) | | A |
Huntington Growth Allocation Fund
(“Growth Allocation Fund”) | | A |
| * | Each class of shares for each Fund has identical rights and privileges except with respect to distribution (12b-1) and service fees, voting rights on matters affecting a single class of shares, exchange privileges of each class of shares and sales charges. The price at which the Funds will offer or redeem shares is the net asset value (“NAV”) per share next determined after the order is considered received, subject to any applicable front end or contingent deferred sales charges. Class A has a maximum sales charge on purchases of 4.75% as a percentage of the original purchase price except for the Fixed Income Securities Fund, Intermediate Government Income Fund, Mortgage Securities Fund and Ohio Tax-Free Fund which are 3.75%, and the Short/Intermediate Fixed Income Securities Fund which is 1.50%. The Tax-Free Money Market Fund, Money Market Fund, Ohio Municipal Money Market Fund and the U.S. Treasury Money Market Fund (collectively the “Money Market Funds”) do not have sales charges on original purchases. |
| ** | Disciplined Equity Fund commenced operations on August 1, 2011. |
The Disciplined Equity Fund was originally organized as a Common Trust Fund. Effective as of the close of business on July 29, 2011, the Common Trust Fund was reorganized into a series of the Trust through a tax-free exchange of 4,859,563 shares of the Disciplined Equity Fund (valued at $10.00 per share) in exchange for the net assets of the Common Trust Fund. At the time of the exchange, the Common Trust Fund had net assets of $48,595,633 including net unrealized appreciation of $4,573,904.
On May 18, 2012 the Huntington Mid Corp America Fund (“Acquiring Fund”) acquired all of the assets and assumed all of the liabilities of the Huntington New Economy Fund (“Acquired Fund”) pursuant to an agreement and plan of reorganization approved by the Board of Trustees on January 17, 2012. The reorganization provides shareholders of the Acquired Fund access to a larger and more diversified portfolio with a similar investment strategy and lower expenses. The reorganization qualified as a tax-free reorganization for federal income tax purposes with no gain or loss recognized to the Funds or their shareholders.
The acquisition was accomplished by a tax-free exchange of 964,397 Institutional Class shares of the Acquiring Fund (valued at $13,560,775) for 1,364,414 Institutional Class shares of the Acquired Fund, 218,019 Class A shares of the
Annual Shareholder Report
140
Acquiring Fund (valued at $2,975,148) for 308,667 Class A shares of the Acquired Fund, each outstanding on May 18, 2012. The investment portfolio of the Acquired Fund, with a fair value of $16,514,542 and identified cost of $18,597,144 was the principal asset acquired by the Acquiring Fund. For financial reporting purposes, assets received and shares issued by the Acquiring Fund were recorded at fair value; however, the identified cost of the investments received from the Acquired Fund was carried forward to align ongoing reporting of the Acquiring Fund’s realized and unrealized gains and losses with amounts distributable to shareholders for tax purposes. The aggregate net assets of the Acquiring Fund immediately before the acquisition were $123,890,843. The aggregate net assets of the Acquired Fund at that date of $16,535,923, including $(2,082,602) of unrealized depreciation, were combined with those of the Acquiring Fund, resulting in combined aggregate net assets of $140,426,766.
Assuming the acquisition had been completed on January 1, 2012, the beginning of the annual reporting period of the Acquiring Fund, the Acquiring Fund’s pro forma results of operations for the year ended December 31, 2012, are as follows:
| | | | |
| | | (unaudited) | |
Net Investment Income* | | $ | 390,496 | |
Net Realized and Unrealized Gain on Investments | | $ | 22,956,534 | |
Net Increase in Net Assets Resulting From Operations | | $ | 23,347,030 | |
| * | Net Investment Income includes $17,000 of pro forma additional merger expenses. |
Because the combined investment portfolios have been managed as a single portfolio since the acquisition was completed, it is not practicable to separate the amounts of revenue and earnings of the Acquired Fund that have been included in the Acquiring Fund’s accompanying Statement of Operations since May 18, 2012.
Under the Trust’s organizational documents, its officers and Board of Trustees (“Trustees”) are indemnified against certain liabilities arising out of the performance of their duties to the Funds. In addition, in the normal course of business, the Trust may enter into contracts with vendors and others that provide for general indemnifications. The Trust’s maximum exposure under these arrangements is unknown, as this would involve future claims that may be made against the Trust. However, based on experience, the Trust expects that risk of loss to be remote.
| (2) | Significant Accounting Policies |
The following is a summary of significant accounting policies consistently followed by each Fund in the preparation of its financial statements. These policies are in conformity with generally accepted accounting principles in the United States of America (“GAAP”). The preparation of financial statements in conformity with GAAP requires management to make estimates and assumptions that affect the amounts of assets, liabilities, and disclosure of contingent assets and liabilities at the date of the financial statements and the reported amounts of income and expenses for the period. Actual results could differ from those estimates.
The Trust calculates the NAV for each of the Funds (other than the Money Market Funds) by valuing securities held based on fair value. Fair value is defined as the price that would be received to sell an asset or paid to transfer a liability in an orderly transaction between market participants at the measurement date.
For the Money Market Funds, the Trust attempts to stabilize the NAV per share at $1.00 per share by valuing portfolio securities using the amortized cost method, which approximates market value. Under the amortized cost method, premium or discount, if any, is amortized or accreted, respectively, on a constant (straight-line) basis to the maturity of the security.
The valuation techniques described below maximize the use of observable inputs and minimize the use of unobservable inputs in determining fair value. The inputs used for valuing the Funds’ investments are summarized in the three broad levels listed below:
| • | | Level 1—quoted prices in active markets for identical assets. |
| • | | Level 2—other significant observable inputs (including quoted prices for similar securities, interest rates, prepayment speeds, credit risk, etc.). |
| • | | Level 3—significant unobservable inputs (including the Funds’ own assumptions in determining the fair value of investments). |
Changes in valuation techniques may result in transfers in or out of an assigned level within the disclosure hierarchy. The Trust recognizes transfers between fair value hierarchy levels at the reporting period end. The inputs or methodology used for valuing investments is not necessarily an indication of the risk associated with investing in those investments.
In computing the NAV of the Funds, other than the Money Market Funds, fair value is based on market valuations with respect to portfolio securities for which market quotations are readily available. Pursuant to Trustee-approved policies, the Trust relies on certain security pricing services to provide the current market value of securities. Those security pricing services value equity securities (including foreign equity securities, exchange-traded funds and closed-end funds) traded on a securities exchange at the last reported sales price on the principal exchange. Equity securities quoted by NASDAQ are valued at the NASDAQ official closing price. If there is no reported sale on the principal exchange, and in the case of over-the-counter securities, equity securities are valued at a bid price estimated by the security pricing service. In each of these situations, valuations are typically categorized as Level 1 in the fair value hierarchy. Investments in open-end investment companies are valued at their respective net asset value as reported by such companies and are typically categorized as Level 1 in the fair value hierarchy.
Option contracts are generally valued using the closing price based on quote data from the six major U.S. options exchanges on which such options are traded, and are typically categorized as Level 1 in the fair value hierarchy.
Annual Shareholder Report
141
Notes to Financial Statements (Continued)
Debt securities traded on a national securities exchange or in the over-the-counter market are valued at the last reported sales price on the principal exchange, except that U.S. government obligations held by Mortgage Securities Fund are valued at the mean between the over-the-counter bid and asked prices furnished by the security pricing service. If there is no reported sale on the principal exchange, and for all other debt securities, debt securities are valued at a bid price estimated by the security pricing service. Foreign securities quoted in foreign currencies are translated in U.S. dollars at the foreign exchange rate in effect as of the close of the New York Stock Exchange (NYSE) (generally 4:00 p.m. Eastern Time), on the day the value of the foreign security is determined. Short-term investments with remaining maturities of 60 days or less at the time of purchase are valued at amortized cost. In each of these situations, valuations are typically categorized as Level 2 in the fair value hierarchy.
Under certain circumstances, a good faith determination of the fair value of a security may be used instead of its current market value, even if the security’s market price is readily available. In such circumstances, the Trust’s Administrator may request that the Trust’s Pricing Committee make its own fair value determination.
Securities for which market quotations are not readily available are valued at fair value under Trust procedures approved by the Trustees. In these cases, a Pricing Committee established and appointed by the Trustees determines in good faith, subject to Trust procedures, the fair value of portfolio securities held by a Fund (“good faith fair valuation”). When a good faith fair valuation of a security is required, consideration is generally given to a number of factors including, but not limited to the following: dealer quotes, published analyses by dealers or analysts regarding the security, transactions which provide implicit valuation of the security (such as a merger or tender offer transaction), the value of other securities or contracts which derive their value from the security at issue, and the implications of any other circumstances which have caused trading in the security to halt. With respect to certain narrow categories of securities, the procedures utilized by the Pricing Committee detail specific valuation methodologies to be applied in lieu of considering the aforementioned list of factors. Depending on the source and relative significance of valuation inputs, these instruments may be classified as Level 2 or Level 3 in the fair value hierarchy.
Fair valuation procedures are also used when a significant event affecting the value of a portfolio security is determined to have occurred between the time when the price of the portfolio security is determined and the close of trading on the NYSE, which is when each Fund’s NAV is computed. An event is considered significant if there is both an affirmative expectation that the security’s value will change in response to the event and a reasonable basis for quantifying the resulting
change in value. Significant events include significant securities market movements occurring between the time the price of the portfolio security is determined and the close of trading on the NYSE. For domestic fixed income securities, such events may occur where the cut-off time for the market information used by the independent pricing service is earlier than the end of regular trading on the NYSE. For securities normally priced at their last sale price in a foreign market, such events can occur between the close of trading in the foreign market and the close of trading on the NYSE.
In some cases, events affecting the issuer of a portfolio security may be considered significant events. Examples of potentially significant events include announcements concerning earnings, acquisitions, new products, management changes, litigation developments, a strike or natural disaster affecting the company’s operations or regulatory changes or market developments affecting the issuer’s industry occurring between the time when the price of the portfolio security is determined and the close of trading on the NYSE. For securities of foreign issuers, such events could also include political or other developments affecting the economy or markets in which the issuer conducts its operations or its securities are traded.
There can be no assurance that a Fund could purchase or sell a portfolio security at the price used to calculate the Fund’s NAV. In the case of good faith fair valued portfolio securities, lack of information and uncertainty as to the significance of information may lead to a conclusion that a prior valuation is the best indication of a portfolio security’s present value. Good faith fair valuations generally remain unchanged until new information becomes available. Consequently, changes in good faith fair valuation of portfolio securities may be less frequent and of greater magnitude than changes in the price of portfolio securities valued at their last sale price, by an independent pricing service, or based on market quotations.
The Funds’ Trustees have authorized the use of an independent fair valuation service to monitor changes in a designated U.S. market index after foreign markets close, and to implement a fair valuation methodology to adjust the closing prices of foreign securities if the movement in the index is significant. In the event of an increase or decrease greater than predetermined levels, the Funds may use a systematic valuation model provided by an independent third party to fair value its international equity securities, which are then typically categorized as Level 2 in the fair value hierarchy.
In accordance with the valuation procedures adopted by the Trustees, real estate investments are fair valued using discounted cash flow models, which the Trustees deem indicative of the estimated fair value of the real estate investments.
Annual Shareholder Report
142
The following is a summary of the inputs used to value the Funds’ investments as of December 31, 2012, while the breakdown, by category, of common stocks is disclosed in the Portfolio of Investments for each Fund:
| | | | | | | | | | | | | | | | |
| | | LEVEL 1 | | | LEVEL 2 | | | LEVEL 3 | | | Total | |
Tax-Free Money Market Fund | | | | | | | | | | | | | | | | |
Investment Securities: | | | | | | | | | | | | | | | | |
Municipal Bonds | | $ | — | | | $ | 70,827,144 | | | $ | — | | | $ | 70,827,144 | |
Cash Equivalents | | | 3,552,659 | | | | — | | | | — | | | | 3,552,659 | |
| | | | | | | | | | | | | | | | |
Total Investment Securities | | | 3,552,659 | | | | 70,827,144 | | | | — | | | | 74,379,803 | |
| | | | | | | | | | | | | | | | |
Money Market Fund | | | | | | | | | | | | | | | | |
Investment Securities: | | | | | | | | | | | | | | | | |
U.S. Government Agencies | | | | | | | | | | | | | | | | |
Federal Farm Credit Bank | | | — | | | | 35,000,540 | | | | — | | | | 35,000,540 | |
Federal Home Loan Bank | | | — | | | | 64,397,050 | | | | — | | | | 64,397,050 | |
Repurchase Agreements | | | — | | | | 52,054,200 | | | | — | | | | 52,054,200 | |
Commercial Papers | | | — | | | | 49,154,984 | | | | — | | | | 49,154,984 | |
Municipal Bonds | | | — | | | | 44,600,000 | | | | — | | | | 44,600,000 | |
Yankee Certificates of Deposit | | | — | | | | 40,076,052 | | | | — | | | | 40,076,052 | |
Corporate Bonds | | | | | | | | | | | | | | | | |
Consumer Staples | | | — | | | | 5,002,829 | | | | — | | | | 5,002,829 | |
Financials | | | — | | | | 21,046,784 | | | | — | | | | 21,046,784 | |
Cash Equivalents | | | 35,000,000 | | | | — | | | | — | | | | 35,000,000 | |
| | | | | | | | | | | | | | | | |
Total Investment Securities | | | 35,000,000 | | | | 311,332,439 | | | | — | | | | 346,332,439 | |
| | | | | | | | | | | | | | | | |
Ohio Municipal Money Market Fund | | | | | | | | | | | | | | | | |
Investment Securities: | | | | | | | | | | | | | | | | |
Municipal Bonds | | | — | | | | 125,503,644 | | | | — | | | | 125,503,644 | |
Cash Equivalents | | | 6,234,643 | | | | — | | | | — | | | | 6,234,643 | |
| | | | | | | | | | | | | | | | |
Total Investment Securities | | | 6,234,643 | | | | 125,503,644 | | | | — | | | | 131,738,287 | |
| | | | | | | | | | | | | | | | |
U.S. Treasury Money Market Fund | | | | | | | | | | | | | | | | |
Investment Securities: | | | | | | | | | | | | | | | | |
U.S. Treasury Obligations | | | — | | | | 470,392,296 | | | | — | | | | 470,392,296 | |
Repurchase Agreements | | | — | | | | 375,452,800 | | | | — | | | | 375,452,800 | |
| | | | | | | | | | | | | | | | |
Total Investment Securities | | | — | | | | 845,845,096 | | | | — | | | | 845,845,096 | |
| | | | | | | | | | | | | | | | |
Disciplined Equity Fund | | | | | | | | | | | | | | | | |
Investment Securities: | | | | | | | | | | | | | | | | |
Common Stocks | | | | | | | | | | | | | | | | |
Consumer Discretionary | | | 8,370,753 | | | | — | | | | — | | | | 8,370,753 | |
Consumer Staples | | | 10,993,240 | | | | — | | | | — | | | | 10,993,240 | |
Energy | | | 11,272,020 | | | | — | | | | — | | | | 11,272,020 | |
Financials | | | 10,869,355 | | | | — | | | | — | | | | 10,869,355 | |
Health Care | | | 10,673,297 | | | | — | | | | — | | | | 10,673,297 | |
Industrials | | | 8,552,085 | | | | — | | | | — | | | | 8,552,085 | |
Information Technology | | | 20,832,869 | | | | — | | | | — | | | | 20,832,869 | |
Materials | | | 1,817,035 | | | | — | | | | — | | | | 1,817,035 | |
Real Estate Investment Trusts | | | 316,180 | | | | — | | | | — | | | | 316,180 | |
Telecommunication Services | | | 3,513,900 | | | | — | | | | — | | | | 3,513,900 | |
Utilities | | | 662,660 | | | | — | | | | — | | | | 662,660 | |
Exchange-Traded Funds | | | 223,680 | | | | — | | | | — | | | | 223,680 | |
Options Purchased | | | 1,353,000 | | | | — | | | | — | | | | 1,353,000 | |
Cash Equivalents | | | 5,903,706 | | | | — | | | | — | | | | 5,903,706 | |
| | | | | | | | | | | | | | | | |
Total Investment Securities | | | 95,353,780 | | | | — | | | | — | | | | 95,353,780 | |
| | | | | | | | | | | | | | | | |
Other Financial Instruments:* | | | | | | | | | | | | | | | | |
Written Options | | | (1,169,878 | ) | | | — | | | | — | | | | (1,169,878 | ) |
| | | | | | | | | | | | | | | | |
Total Investments | | | 94,183,902 | | | | — | | | | — | | | | 94,183,902 | |
| | | | | | | | | | | | | | | | |
Annual Shareholder Report
143
Notes to Financial Statements (Continued)
| | | | | | | | | | | | | | | | |
| | | LEVEL 1 | | | LEVEL 2 | | | LEVEL 3 | | | Total | |
Dividend Capture Fund | | | | | | | | | | | | | | | | |
Investment Securities: | | | | | | | | | | | | | | | | |
Common Stocks | | | | | | | | | | | | | | | | |
Consumer Discretionary | | $ | 5,929,430 | | | $ | — | | | $ | — | | | $ | 5,929,430 | |
Consumer Staples | | | 11,678,643 | | | | — | | | | — | | | | 11,678,643 | |
Energy | | | 31,919,872 | | | | — | | | | — | | | | 31,919,872 | |
Financials | | | 23,181,960 | | | | — | | | | — | | | | 23,181,960 | |
Health Care | | | 10,454,068 | | | | — | | | | — | | | | 10,454,068 | |
Industrials | | | 13,454,487 | | | | — | | | | — | | | | 13,454,487 | |
Information Technology | | | 10,466,212 | | | | — | | | | — | | | | 10,466,212 | |
Materials | | | 4,379,780 | | | | — | | | | — | | | | 4,379,780 | |
Real Estate Investment Trusts | | | 22,093,531 | | | | — | | | | — | | | | 22,093,531 | |
Telecommunication Services | | | 4,893,510 | | | | — | | | | — | | | | 4,893,510 | |
Utilities | | | 6,424,360 | | | | — | | | | — | | | | 6,424,360 | |
Preferred Stocks | | | | | | | | | | | | | | | | |
Financials | | | 25,657,000 | | | | 1,138,500 | | | | — | | | | 26,795,500 | |
Real Estate Investment Trusts | | | 5,600,370 | | | | — | | | | — | | | | 5,600,370 | |
Telecommunication Services | | | 2,427,300 | | | | — | | | | — | | | | 2,427,300 | |
Utilities | | | 5,901,500 | | | | — | | | | — | | | | 5,901,500 | |
Exchange-Traded Funds | | | 3,114,937 | | | | — | | | | — | | | | 3,114,937 | |
Cash Equivalents | | | 3,354,143 | | | | — | | | | — | | | | 3,354,143 | |
Short-Term Securities Held as Collateral for Securities Lending | | | 9,634,051 | | | | — | | | | — | | | | 9,634,051 | |
| | | | | | | | | | | | | | | | |
Total Investment Securities | | | 200,565,154 | | | | 1,138,500 | | | | — | | | | 201,703,654 | |
| | | | | | | | | | | | | | | | |
Other Financial Instruments:* | | | | | | | | | | | | | | | | |
Written Options | | | (30,600 | ) | | | — | | | | — | | | | (30,600 | ) |
| | | | | | | | | | | | | | | | |
Total Investments | | | 200,534,554 | | | | 1,138,500 | | | | — | | | | 201,673,054 | |
| | | | | | | | | | | | | | | | |
Global Select Markets Fund | | | | | | | | | | | | | | | | |
Investment Securities: | | | | | | | | | | | | | | | | |
Common Stocks | | | | | | | | | | | | | | | | |
Consumer Discretionary | | | 796,800 | | | | 5,855,185 | | | | — | | | | 6,651,985 | |
Consumer Staples | | | 1,402,010 | | | | 1,809,278 | | | | — | | | | 3,211,288 | |
Energy | | | 1,039,350 | | | | 1,481,155 | | | | — | | | | 2,520,505 | |
Financials | | | 1,317,470 | | | | 6,900,725 | | | | — | | | | 8,218,195 | |
Health Care | | | — | | | | 3,507,291 | | | | — | | | | 3,507,291 | |
Industrials | | | — | | | | 2,167,523 | | | | — | | | | 2,167,523 | |
Information Technology | | | 1,490,780 | | | | 2,638,776 | | | | — | | | | 4,129,556 | |
Materials | | | 342,000 | | | | 2,405,150 | | | | — | | | | 2,747,150 | |
Utilities | | | — | | | | 1,156,164 | | | | — | | | | 1,156,164 | |
Exchange-Traded Funds | | | 3,291,430 | | | | — | | | | — | | | | 3,291,430 | |
Corporate Bonds | | | | | | | | | | | | | | | | |
Financials | | | — | | | | 871,349 | | | | — | | | | 871,349 | |
Foreign Government Bonds | | | — | | | | 188,811 | | | | — | | | | 188,811 | |
Cash Equivalents | | | 1,038,116 | | | | — | | | | — | | | | 1,038,116 | |
Short-Term Securities Held as Collateral for Securities Lending | | | 1,593,389 | | | | — | | | | — | | | | 1,593,389 | |
| | | | | | | | | | | | | | | | |
Total Investment Securities | | | 12,311,345 | | | | 28,981,407 | | | | — | | | | 41,292,752 | |
| | | | | | | | | | | | | | | | |
Growth Fund | | | | | | | | | | | | | | | | |
Investment Securities: | | | | | | | | | | | | | | | | |
Common Stocks | | | | | | | | | | | | | | | | |
Consumer Discretionary | | | 17,227,987 | | | | — | | | | — | | | | 17,227,987 | |
Consumer Staples | | | 14,911,462 | | | | — | | | | — | | | | 14,911,462 | |
Energy | | | 7,165,535 | | | | — | | | | — | | | | 7,165,535 | |
Financials | | | 6,040,945 | | | | — | | | | — | | | | 6,040,945 | |
Health Care | | | 21,530,802 | | | | — | | | | — | | | | 21,530,802 | |
Industrials | | | 8,126,830 | | | | — | | | | — | | | | 8,126,830 | |
Information Technology | | | 45,284,825 | | | | — | | | | — | | | | 45,284,825 | |
Materials | | | 6,071,112 | | | | — | | | | — | | | | 6,071,112 | |
Real Estate Investment Trusts | | | 3,288,653 | | | | — | | | | — | | | | 3,288,653 | |
Telecommunication Services | | | 728,655 | | | | — | | | | — | | | | 728,655 | |
Utilities | | | 270,281 | | | | — | | | | — | | | | 270,281 | |
Cash Equivalents | | | 1,621,894 | | | | — | | | | — | | | | 1,621,894 | |
Short-Term Securities Held as Collateral for Securities Lending | | | 1,390,967 | | | | — | | | | — | | | | 1,390,967 | |
| | | | | | | | | | | | | | | | |
Total Investment Securities | | | 133,659,948 | | | | — | | | | — | | | | 133,659,948 | |
| | | | | | | | | | | | | | | | |
Annual Shareholder Report
144
| | | | | | | | | | | | | | | | |
| | | LEVEL 1 | | | LEVEL 2 | | | LEVEL 3 | | | Total | |
Income Equity Fund | | | | | | | | | | | | | | | | |
Investment Securities: | | | | | | | | | | | | | | | | |
Common Stocks | | | | | | | | | | | | | | | | |
Consumer Discretionary | | $ | 9,287,517 | | | $ | — | | | $ | — | | | $ | 9,287,517 | |
Consumer Staples | | | 13,946,775 | | | | — | | | | — | | | | 13,946,775 | |
Energy | | | 23,987,318 | | | | — | | | | — | | | | 23,987,318 | |
Financials | | | 21,933,830 | | | | — | | | | — | | | | 21,933,830 | |
Health Care | | | 12,462,915 | | | | — | | | | — | | | | 12,462,915 | |
Industrials | | | 14,020,371 | | | | — | | | | — | | | | 14,020,371 | |
Information Technology | | | 13,074,467 | | | | — | | | | — | | | | 13,074,467 | |
Materials | | | 5,352,213 | | | | — | | | | — | | | | 5,352,213 | |
Real Estate Investment Trusts | | | 9,130,681 | | | | — | | | | — | | | | 9,130,681 | |
Telecommunication Services | | | 5,157,402 | | | | — | | | | — | | | | 5,157,402 | |
Utilities | | | 7,710,099 | | | | — | | | | — | | | | 7,710,099 | |
Cash Equivalents | | | 1,391,488 | | | | — | | | | — | | | | 1,391,488 | |
Short-Term Securities Held as Collateral for Securities Lending | | | 15,044,485 | | | | — | | | | — | | | | 15,044,485 | |
| | | | | | | | | | | | | | | | |
Total Investment Securities | | | 152,499,561 | | | | — | | | | — | | | | 152,499,561 | |
| | | | | | | | | | | | | | | | |
International Equity Fund | | | | | | | | | | | | | | | | |
Investment Securities: | | | | | | | | | | | | | | | | |
Common Stocks | | | | | | | | | | | | | | | | |
Consumer Discretionary | | | 4,196,250 | | | | 27,012,339 | | | | — | | | | 31,208,589 | |
Consumer Staples | | | 6,142,700 | | | | 21,314,152 | | | | — | | | | 27,456,852 | |
Energy | | | 7,448,820 | | | | 19,378,527 | | | | — | | | | 26,827,347 | |
Financials | | | 15,886,628 | | | | 37,116,284 | | | | — | | | | 53,002,912 | |
Health Care | | | 11,816,460 | | | | 12,162,417 | | | | — | | | | 23,978,877 | |
Industrials | | | — | | | | 46,613,699 | | | | — | | | | 46,613,699 | |
Information Technology | | | 3,601,095 | | | | 13,690,215 | | | | — | | | | 17,291,310 | |
Materials | | | 5,744,880 | | | | 14,218,089 | | | | — | | | | 19,962,969 | |
Telecommunication Services | | | 3,355,300 | | | | 13,802,394 | | | | — | | | | 17,157,694 | |
Utilities | | | 971,459 | | | | 8,734,531 | | | | — | | | | 9,705,990 | |
Exchange-Traded Funds | | | 10,411,295 | | | | — | | | | — | | | | 10,411,295 | |
Cash Equivalents | | | 10,717,674 | | | | — | | | | — | | | | 10,717,674 | |
Short-Term Securities Held as Collateral for Securities Lending | | | 1,478,160 | | | | — | | | | — | | | | 1,478,160 | |
| | | | | | | | | | | | | | | | |
Total Investment Securities | | | 81,770,721 | | | | 214,042,647 | | | | — | | | | 295,813,368 | |
| | | | | | | | | | | | | | | | |
Mid Corp America Fund | | | | | | | | | | | | | | | | |
Investment Securities: | | | | | | | | | | | | | | | | |
Common Stocks | | | | | | | | | | | | | | | | |
Consumer Discretionary | | | 12,715,285 | | | | — | | | | — | | | | 12,715,285 | |
Consumer Staples | | | 5,781,474 | | | | — | | | | — | | | | 5,781,474 | |
Energy | | | 8,542,812 | | | | — | | | | — | | | | 8,542,812 | |
Financials | | | 17,442,854 | | | | — | | | | — | | | | 17,442,854 | |
Health Care | | | 18,915,711 | | | | — | | | | — | | | | 18,915,711 | |
Industrials | | | 21,293,278 | | | | — | | | | — | | | | 21,293,278 | |
Information Technology | | | 22,244,369 | | | | — | | | | — | | | | 22,244,369 | |
Materials | | | 9,056,239 | | | | — | | | | — | | | | 9,056,239 | |
Real Estate Investment Trusts | | | 9,252,845 | | | | — | | | | — | | | | 9,252,845 | |
Telecommunication Services | | | 586,260 | | | | — | | | | — | | | | 586,260 | |
Utilities | | | 5,064,222 | | | | — | | | | — | | | | 5,064,222 | |
Cash Equivalents | | | 3,531,522 | | | | — | | | | — | | | | 3,531,522 | |
Short-Term Securities Held as Collateral for Securities Lending | | | 6,116,911 | | | | — | | | | — | | | | 6,116,911 | |
| | | | | | | | | | | | | | | | |
Total Investment Securities | | | 140,543,782 | | | | — | | | | — | | | | 140,543,782 | |
| | | | | | | | | | | | | | | | |
Annual Shareholder Report
145
Notes to Financial Statements (Continued)
| | | | | | | | | | | | | | | | |
| | | LEVEL 1 | | | LEVEL 2 | | | LEVEL 3 | | | Total | |
Real Strategies Fund | | | | | | | | | | | | | | | | |
Investment Securities: | | | | | | | | | | | | | | | | |
Common Stocks | | | | | | | | | | | | | | | | |
Consumer Staples | | $ | 4,293,103 | | | $ | — | | | $ | — | | | $ | 4,293,103 | |
Energy | | | 28,423,913 | | | | — | | | | — | | | | 28,423,913 | |
Industrials | | | 14,743,343 | | | | — | | | | — | | | | 14,743,343 | |
Materials | | | 21,255,669 | | | | — | | | | — | | | | 21,255,669 | |
Real Estate Investment Trusts | | | 9,175,750 | | | | — | | | | — | | | | 9,175,750 | |
Exchange-Traded Funds | | | 7,132,727 | | | | — | | | | — | | | | 7,132,727 | |
Real Estate Investments | | | — | | | | — | | | | 4,668,985 | | | | 4,668,985 | |
Closed-End Fund | | | 3,068,088 | | | | — | | | | — | | | | 3,068,088 | |
Warrants | | | 211,680 | | | | — | | | | — | | | | 211,680 | |
Options Purchased | | | 45,000 | | | | — | | | | — | | | | 45,000 | |
Cash Equivalents | | | 5,395,632 | | | | — | | | | — | | | | 5,395,632 | |
Short-Term Securities Held as Collateral for Securities Lending | | | 20,507,976 | | | | — | | | | — | | | | 20,507,976 | |
| | | | | | | | | | | | | | | | |
Total Investment Securities | | | 114,252,881 | | | | — | | | | 4,668,985 | | | | 118,921,866 | |
| | | | | | | | | | | | | | | | |
Rotating Markets Fund | | | | | | | | | | | | | | | | |
Investment Securities: | | | | | | | | | | | | | | | | |
Common Stocks | | | | | | | | | | | | | | | | |
Consumer Discretionary | | | 6,547,925 | | | | — | | | | — | | | | 6,547,925 | |
Consumer Staples | | | 1,013,119 | | | | — | | | | — | | | | 1,013,119 | |
Health Care | | | 4,784,280 | | | | — | | | | — | | | | 4,784,280 | |
Industrials | | | 753,569 | | | | — | | | | — | | | | 753,569 | |
Information Technology | | | 25,281,383 | | | | — | | | | — | | | | 25,281,383 | |
Materials | | | 196,996 | | | | — | | | | — | | | | 196,996 | |
Telecommunication Services | | | 314,850 | | | | — | | | | — | | | | 314,850 | |
Exchange-Traded Funds | | | 255,492 | | | | — | | | | — | | | | 255,492 | |
Cash Equivalents | | | 1,385,688 | | | | — | | | | — | | | | 1,385,688 | |
Short-Term Securities Held as Collateral for Securities Lending | | | 1,839,691 | | | | — | | | | — | | | | 1,839,691 | |
| | | | | | | | | | | | | | | | |
Total Investment Securities | | | 42,372,993 | | | | — | | | | — | | | | 42,372,993 | |
| | | | | | | | | | | | | | | | |
Situs Fund | | | | | | | | | | | | | | | | |
Investment Securities: | | | | | | | | | | | | | | | | |
Common Stocks | | | | | | | | | | | | | | | | |
Consumer Discretionary | | | 24,818,552 | | | | 1,826,579 | | | | — | | | | 26,645,131 | |
Consumer Staples | | | 5,846,578 | | | | 1,556,010 | | | | — | | | | 7,402,588 | |
Energy | | | 12,166,299 | | | | — | | | | — | | | | 12,166,299 | |
Financials | | | 22,843,000 | | | | 398,851 | | | | — | | | | 23,241,851 | |
Health Care | | | 23,891,240 | | | | 3,455,414 | | | | — | | | | 27,346,654 | |
Industrials | | | 37,781,143 | | | | 1,008,033 | | | | — | | | | 38,789,176 | |
Information Technology | | | 47,889,379 | | | | — | | | | — | | | | 47,889,379 | |
Materials | | | 23,526,480 | | | | — | | | | — | | | | 23,526,480 | |
Real Estate Investment Trusts | | | 5,378,015 | | | | — | | | | — | | | | 5,378,015 | |
Telecommunication Services | | | 374,010 | | | | — | | | | — | | | | 374,010 | |
Utilities | | | 4,003,161 | | | | — | | | | — | | | | 4,003,161 | |
Exchange-Traded Funds | | | 1,012,000 | | | | — | | | | — | | | | 1,012,000 | |
Closed-End Fund | | | 630,900 | | | | — | | | | — | | | | 630,900 | |
Cash Equivalents | | | 3,588,928 | | | | — | | | | — | | | | 3,588,928 | |
Short-Term Securities Held as Collateral for Securities Lending | | | 25,978,626 | | | | — | | | | — | | | | 25,978,626 | |
| | | | | | | | | | | | | | | | |
Total Investment Securities | | | 239,728,311 | | | | 8,244,887 | | | | — | | | | 247,973,198 | |
| | | | | | | | | | | | | | | | |
Other Financial Instruments:* | | | | | | | | | | | | | | | | |
Written Options | | | (103,750 | ) | | | — | | | | — | | | | (103,750 | ) |
| | | | | | | | | | | | | | | | |
Total Investments | | | 239,624,561 | | | | 8,244,887 | | | | — | | | | 247,869,448 | |
| | | | | | | | | | | | | | | | |
Annual Shareholder Report
146
| | | | | | | | | | | | | | | | |
| | | LEVEL 1 | | | LEVEL 2 | | | LEVEL 3 | | | Total | |
Fixed Income Securities Fund | | | | | | | | | | | | | | | | |
Investment Securities: | | | | | | | | | | | | | | | | |
Corporate Bonds | | | | | | | | | | | | | | | | |
Consumer Discretionary | | $ | — | | | $ | 16,198,210 | | | $ | — | | | $ | 16,198,210 | |
Consumer Staples | | | — | | | | 10,940,973 | | | | — | | | | 10,940,973 | |
Energy | | | — | | | | 18,993,992 | | | | — | | | | 18,993,992 | |
Financials | | | — | | | | 70,788,530 | | | | — | | | | 70,788,530 | |
Health Care | | | — | | | | 20,864,469 | | | | — | | | | 20,864,469 | |
Industrials | | | — | | | | 8,688,153 | | | | — | | | | 8,688,153 | |
Information Technology | | | — | | | | 20,500,367 | | | | — | | | | 20,500,367 | |
Materials | | | — | | | | 11,851,168 | | | | — | | | | 11,851,168 | |
Real Estate Investment Trusts | | | — | | | | 15,688,126 | | | | — | | | | 15,688,126 | |
Telecommunication Services | | | — | | | | 6,611,958 | | | | — | | | | 6,611,958 | |
Utilities | | | — | | | | 25,826,662 | | | | — | | | | 25,826,662 | |
U.S. Treasury Obligations | | | | | | | | | | | | | | | | |
U.S. Treasury Bonds | | | — | | | | 31,076,870 | | | | — | | | | 31,076,870 | |
U.S. Treasury Notes | | | — | | | | 8,124,064 | | | | — | | | | 8,124,064 | |
U.S. Government Agencies | | | | | | | | | | | | | | | | |
Federal Farm Credit Bank | | | — | | | | 2,190,166 | | | | — | | | | 2,190,166 | |
Federal Home Loan Bank | | | — | | | | 15,610,490 | | | | — | | | | 15,610,490 | |
Federal Home Loan Mortgage Corporation | | | — | | | | 9,264,938 | | | | — | | | | 9,264,938 | |
Federal National Mortgage Association | | | — | | | | 3,479,898 | | | | — | | | | 3,479,898 | |
Preferred Stocks | | | | | | | | | | | | | | | | |
Financials | | | 2,349,200 | | | | — | | | | — | | | | 2,349,200 | |
Real Estate Investment Trusts | | | 541,600 | | | | — | | | | — | | | | 541,600 | |
Utilities | | | 801,300 | | | | — | | | | — | | | | 801,300 | |
U.S. Government Mortgage Backed Agencies | | | | | | | | | | | | | | | | |
Federal Home Loan Mortgage Corporation | | | — | | | | 1,217,622 | | | | — | | | | 1,217,622 | |
Federal National Mortgage Association | | | — | | | | 126,976 | | | | — | | | | 126,976 | |
Government National Mortgage Association | | | — | | | | 1,867,099 | | | | — | | | | 1,867,099 | |
Cash Equivalents | | | 5,299,225 | | | | — | | | | — | | | | 5,299,225 | |
| | | | | | | | | | | | | | | | |
Total Investment Securities | | | 8,991,325 | | | | 299,910,731 | | | | — | | | | 308,902,056 | |
| | | | | | | | | | | | | | | | |
Intermediate Government Income Fund | | | | | | | | | | | | | | | | |
Investment Securities: | | | | | | | | | | | | | | | | |
U.S. Government Agencies | | | | | | | | | | | | | | | | |
Federal Farm Credit Bank | | | — | | | | 22,045,937 | | | | — | | | | 22,045,937 | |
Federal Home Loan Bank | | | — | | | | 32,320,050 | | | | — | | | | 32,320,050 | |
Federal National Mortgage Association | | | — | | | | 2,060,380 | | | | — | | | | 2,060,380 | |
U.S. Government Mortgage Backed Agencies | | | | | | | | | | | | | | | | |
Federal Home Loan Mortgage Corporation | | | — | | | | 9,477,863 | | | | — | | | | 9,477,863 | |
Federal National Mortgage Association | | | — | | | | 14,955,245 | | | | — | | | | 14,955,245 | |
Government National Mortgage Association | | | — | | | | 7,574,280 | | | | — | | | | 7,574,280 | |
U.S. Treasury Obligations | | | | | | | | | | | | | | | | |
U.S. Treasury Notes | | | — | | | | 26,826,404 | | | | — | | | | 26,826,404 | |
Collateralized Mortgage Obligations | | | | | | | | | | | | | | | | |
Federal Home Loan Bank | | | — | | | | 1,080,011 | | | | — | | | | 1,080,011 | |
Federal Home Loan Mortgage Corporation | | | — | | | | 888,390 | | | | — | | | | 888,390 | |
Federal National Mortgage Association | | | — | | | | 142,647 | | | | — | | | | 142,647 | |
Government National Mortgage Association | | | — | | | | 1,156,236 | | | | — | | | | 1,156,236 | |
Cash Equivalents | | | 2,607,089 | | | | — | | | | — | | | | 2,607,089 | |
| | | | | | | | | | | | | | | | |
Total Investment Securities | | | 2,607,089 | | | | 118,527,443 | | | | — | | | | 121,134,532 | |
| | | | | | | | | | | | | | | | |
Annual Shareholder Report
147
Notes to Financial Statements (Continued)
| | | | | | | | | | | | | | | | |
| | | LEVEL 1 | | | LEVEL 2 | | | LEVEL 3 | | | Total | |
Mortgage Securities Fund | | | | | | | | | | | | | | | | |
Investment Securities: | | | | | | | | | | | | | | | | |
U.S. Government Mortgage Backed Agencies | | | | | | | | | | | | | | | | |
Federal Home Loan Mortgage Corporation | | $ | — | | | $ | 13,662,884 | | | $ | — | | | $ | 13,662,884 | |
Federal National Mortgage Association | | | — | | | | 42,522,586 | | | | — | | | | 42,522,586 | |
Government National Mortgage Association | | | — | | | | 5,360,317 | | | | — | | | | 5,360,317 | |
Common Stocks | | | | | | | | | | | | | | | | |
Real Estate Investment Trusts | | | 9,120,578 | | | | — | | | | — | | | | 9,120,578 | |
U.S. Government Agencies | | | | | | | | | | | | | | | | |
Federal Farm Credit Bank | | | — | | | | 2,511,912 | | | | — | | | | 2,511,912 | |
Collateralized Mortgage Obligations | | | | | | | | | | | | | | | | |
Federal Home Loan Bank | | | — | | | | 187,583 | | | | — | | | | 187,583 | |
Federal Home Loan Mortgage Corporation | | | — | | | | 877,275 | | | | — | | | | 877,275 | |
Federal National Mortgage Association | | | — | | | | 247,473 | | | | — | | | | 247,473 | |
Cash Equivalents | | | 3,940,040 | | | | — | | | | — | | | | 3,940,040 | |
Short-Term Securities Held as Collateral for Securities Lending | | | 705,024 | | | | — | | | | — | | | | 705,024 | |
| | | | | | | | | | | | | | | | |
Total Investment Securities | | | 13,765,642 | | | | 65,370,030 | | | | — | | | | 79,135,672 | |
| | | | | | | | | | | | | | | | |
Ohio Tax-Free Fund | | | | | | | | | | | | | | | | |
Investment Securities: | | | | | | | | | | | | | | | | |
Municipal Bonds | | | — | | | | 53,908,578 | | | | — | | | | 53,908,578 | |
Cash Equivalents | | | 165,638 | | | | — | | | | — | | | | 165,638 | |
| | | | | | | | | | | | | | | | |
Total Investment Securities | | | 165,638 | | | | 53,908,578 | | | | — | | | | 54,074,216 | |
| | | | | | | | | | | | | | | | |
Short/Intermediate Fixed Income Securities Fund | | | | | | | | | | | | | | | | |
Investment Securities: | | | | | | | | | | | | | | | | |
Corporate Bonds | | | | | | | | | | | | | | | | |
Consumer Discretionary | | | — | | | | 10,370,689 | | | | — | | | | 10,370,689 | |
Consumer Staples | | | — | | | | 12,864,233 | | | | — | | | | 12,864,233 | |
Energy | | | — | | | | 10,993,032 | | | | — | | | | 10,993,032 | |
Financials | | | — | | | | 34,501,033 | | | | — | | | | 34,501,033 | |
Health Care | | | — | | | | 23,543,131 | | | | — | | | | 23,543,131 | |
Industrials | | | — | | | | 14,423,430 | | | | — | | | | 14,423,430 | |
Information Technology | | | — | | | | 10,776,305 | | | | — | | | | 10,776,305 | |
Materials | | | — | | | | 13,376,878 | | | | — | | | | 13,376,878 | |
Real Estate Investment Trusts | | | — | | | | 3,202,583 | | | | — | | | | 3,202,583 | |
Telecommunication Services | | | — | | | | 4,162,189 | | | | — | | | | 4,162,189 | |
Utilities | | | — | | | | 7,794,468 | | | | — | | | | 7,794,468 | |
U.S. Government Agencies | | | | | | | | | | | | | | | | |
Federal Agricultural Mortgage Corporation | | | — | | | | 3,125,295 | | | | — | | | | 3,125,295 | |
Federal Home Loan Bank | | | — | | | | 19,105,796 | | | | — | | | | 19,105,796 | |
Federal Home Loan Mortgage Corporation | | | — | | | | 3,546,773 | | | | — | | | | 3,546,773 | |
Federal National Mortgage Association | | | — | | | | 13,272,755 | | | | — | | | | 13,272,755 | |
U.S. Treasury Obligations | | | | | | | | | | | | | | | | |
U.S. Treasury Notes | | | — | | | | 10,704,801 | | | | — | | | | 10,704,801 | |
Cash Equivalents | | | 2,150,783 | | | | — | | | | — | | | | 2,150,783 | |
| | | | | | | | | | | | | | | | |
Total Investment Securities | | | 2,150,783 | | | | 195,763,391 | | | | — | | | | 197,914,174 | |
| | | | | | | | | | | | | | | | |
Balanced Allocation Fund | | | | | | | | | | | | | | | | |
Investment Securities: | | | | | | | | | | | | | | | | |
Mutual Funds | | | 16,271,327 | | | | — | | | | — | | | | 16,271,327 | |
Exchange-Traded Funds | | | 1,709,472 | | | | — | | | | — | | | | 1,709,472 | |
Cash Equivalents | | | 229,492 | | | | — | | | | — | | | | 229,492 | |
| | | | | | | | | | | | | | | | |
Total Investment Securities | | | 18,210,291 | | | | — | | | | — | | | | 18,210,291 | |
| | | | | | | | | | | | | | | | |
Conservative Allocation Fund | | | | | | | | | | | | | | | | |
Investment Securities: | | | | | | | | | | | | | | | | |
Mutual Funds | | | 4,647,453 | | | | — | | | | — | | | | 4,647,453 | |
Exchange-Traded Funds | | | 175,592 | | | | — | | | | — | | | | 175,592 | |
Cash Equivalents | | | 15,912 | | | | — | | | | — | | | | 15,912 | |
| | | | | | | | | | | | | | | | |
Total Investment Securities | | | 4,838,957 | | | | — | | | | — | | | | 4,838,957 | |
| | | | | | | | | | | | | | | | |
Annual Shareholder Report
148
| | | | | | | | | | | | | | | | |
| | | LEVEL 1 | | | LEVEL 2 | | | LEVEL 3 | | | Total | |
Growth Allocation Fund | | | | | | | | | | | | | | | | |
Investment Securities: | | | | | | | | | | | | | | | | |
Mutual Funds | | $ | 11,423,190 | | | $ | — | | | $ | — | | | $ | 11,423,190 | |
Exchange-Traded Funds | | | 1,625,841 | | | | — | | | | — | | | | 1,625,841 | |
Cash Equivalents | | | 131,237 | | | | — | | | | — | | | | 131,237 | |
| | | | | | | | | | | | | | | | |
Total Investment Securities | | | 13,180,268 | | | | — | | | | — | | | | 13,180,268 | |
| | | | | | | | | | | | | | | | |
| * | Other Financial Instruments are derivative instruments not reflected on the Portfolio of Investments, such as written option contracts. |
The following is a summary of the transfers between Level 1 and Level 2 of the fair value hierarchy for the year ended December 31, 2012:
| | | | | | | | |
| | | Transfers from
Level 1 to Level 2 | | | Transfers from
Level 2 to Level 1 | |
Global Select Markets Fund | | | | | | | | |
Common Stocks | | | | | | | | |
Consumer Discretionary | | $ | 5,855,185 | | | $ | — | |
Consumer Staples | | | 1,809,278 | | | | — | |
Energy | | | 1,481,155 | | | | — | |
Financials | | | 6,900,725 | | | | — | |
Health Care | | | 3,507,291 | | | | — | |
Industrials | | | 2,167,523 | | | | — | |
Information Technology | | | 2,638,776 | | | | — | |
Materials | | | 2,405,150 | | | | — | |
Utilities | | | 1,156,164 | | | | — | |
| | | | | | | | |
Total | | | 27,921,247 | | | | — | |
| | | | | | | | |
International Equity Fund | | | | | | | | |
Common Stocks | | | | | | | | |
Consumer Discretionary | | | 27,012,339 | | | | — | |
Consumer Staples | | | 21,314,152 | | | | — | |
Energy | | | 19,378,527 | | | | — | |
Financials | | | 37,116,284 | | | | — | |
Health Care | | | 12,162,417 | | | | — | |
Industrials | | | 46,613,699 | | | | — | |
Information Technology | | | 13,690,215 | | | | — | |
Materials | | | 14,218,089 | | | | — | |
Telecommunication Services | | | 13,802,394 | | | | — | |
Utilities | | | 8,734,531 | | | | — | |
| | | | | | | | |
Total | | | 214,042,647 | | | | — | |
| | | | | | | | |
Situs Fund | | | | | | | | |
Common Stocks | | | | | | | | |
Consumer Discretionary | | | 1,826,579 | | | | — | |
Consumer Staples | | | 1,556,010 | | | | — | |
Financials | | | 398,851 | | | | — | |
Health Care | | | 3,455,414 | | | | — | |
Industrials | | | 1,008,033 | | | | — | |
| | | | | | | | |
Total | | | 8,244,887 | | | | — | |
| | | | | | | | |
Transfers from Level 1 to Level 2 are due to significant movement of a designated U.S. market index, triggering a systematic valuation model provided by an independent third party to fair value the international equity securities at reporting period end.
| | | | | | | | | | | | |
Quantitative Information about Level 3 Fair Value Measurements | |
| Type of Assets | | Fair Value At December 31, 2012 | | | Valuation Techniques | | Unobservable Input(s) | | Range
(weighted average) | |
Real Strategies Fund | | | | | | | | | | | | |
Real Estate Investments | | $ | 4,668,985 | | | Discounted cash flow | | Discount Rate | | | 3.0%-14.8%(9.6%) | |
| | | | | | | | Market Cap Rate | | | 7.0%-12.0%(8.7%) | |
The significant unobservable inputs used in the fair value measurement of Real Strategies Fund’s real estate investments were cash flows and discount and market cap rates. An increase in the cash flows and/or market cap rate or decreases in the discount
Annual Shareholder Report
149
Notes to Financial Statements (Continued)
rate used would increase the value of the investment. A decrease in the cash flows and/or market cap rate or increases in the discount rate used would decrease the value of the investment. Although the changes in the unobservable inputs may significantly change the security’s value, significant and reasonable changes to any of these inputs would not significantly impact the net assets of the Real Strategies Fund.
Following is a reconciliation of assets in which significant unobservable inputs (Level 3) were used in determining fair value:
| | | | |
| Real Strategies Fund | | Real Estate
Investments | |
Balance as of December 31, 2011 | | $ | 4,269,542 | |
Transfers into Level 3 | | | — | |
Transfers out of Level 3 | | | — | |
Purchases | | | 950,000 | |
Sales | | | — | |
Realized Gain | | | — | |
Realized Loss | | | — | |
Change in unrealized appreciation (depreciation) | | | (550,557 | ) |
| | | | |
Ending Balance as of December 31, 2012 | | $ | 4,668,985 | |
| | | | |
The Funds may enter into repurchase agreements with banks and other recognized financial institutions, such as broker/dealers, which are deemed by Huntington Asset Advisors, Inc., a subsidiary of The Huntington National Bank, to be creditworthy pursuant to the guidelines and/or standards reviewed or established by the Trustees. It is the policy of the Funds to require the custodian bank to take possession of, to have legally segregated in the Federal Reserve Book Entry System, or to have segregated within the custodian bank’s vault, all securities held as collateral under repurchase agreement transactions. Additionally, procedures have been established by the Funds to monitor, on a daily basis, the market value of each repurchase agreement’s collateral to ensure that the value of collateral at least equals the repurchase price to be paid under the repurchase agreement transaction. If the counterparty defaults and the fair value of the collateral declines, realization of the collateral by the Funds may be delayed or limited.
| C. | When-Issued and Delayed-Delivery Transactions |
The Funds may engage in when-issued or delayed delivery transactions. The Funds record when-issued securities on the trade date and maintain security positions such that sufficient liquid assets will be available to make payment for the securities purchased. Securities purchased on a when-issued or delayed delivery basis are marked to market daily and begin earning interest on the settlement date. Losses may occur on these transactions due to changes in market conditions or the failure of counterparties to perform under the contract. The Funds did not own any when-issued or delayed-delivery securities at December 31, 2012.
| D. | Foreign Currency Translation |
The accounting records of the Funds are maintained in U.S. dollars. Foreign currency amounts are translated into U.S. dollars at the current rate of exchange each business day to determine the value of investments, and other assets and liabilities. Purchases and sales of foreign securities, and income and expenses, are translated at the prevailing rate of
exchange on the respective date of these transactions. The Funds do not isolate that portion of the results of operations resulting from changes in foreign exchange rates on investments from fluctuation arising from changes in market prices of securities held. These fluctuations are included with the net realized and unrealized gain or loss from investments and foreign currency transactions.
Certain of the Funds may be subject to equity price risk and foreign currency exchange risk in the normal course of pursuing their investment objectives. Certain of the Funds may invest in various financial instruments including positions in foreign currency contracts and written option contracts to gain exposure to or hedge against changes in the value of equities or foreign currencies. The following is a description of the derivative instruments utilized by the Funds, including the primary underlying risk exposure related to each instrument type.
Foreign Exchange Contracts—Global Select Markets Fund, International Equity Fund, Real Strategies Fund, Situs Fund and Technical Opportunities Fund may enter into forward foreign exchange contracts. A forward foreign exchange contract involves an obligation to purchase or sell a specific currency at a future date at a price set at the time of the contract. Such contracts are used to sell unwanted currency exposure that comes with holding securities in a market, or to buy currency exposure where the exposure from holding securities is insufficient to provide the desired currency exposure. The contracts are marked-to-market daily and the change in market value is recorded as unrealized appreciation or depreciation. When a forward foreign currency contract is closed, a Fund records a realized gain or loss equal to the difference between the value at the time it was opened and the value at the time it was closed. The Funds could be exposed to risks if the counterparties to the contracts are unable to meet the terms of their contracts and from unanticipated movements in exchange rates. At December 31, 2012, Global Select Markets Fund, International Equity Fund, Real Strategies Fund and Situs Fund did not have any forward foreign exchange contracts outstanding.
Annual Shareholder Report
150
Written Options Contracts—Certain of the Funds may write options contracts for which premiums received are recorded as liabilities and are subsequently adjusted to the current value of the options written. Premiums received from writing options which expire are treated as realized gains. Premiums
received from writing options which are either exercised or closed are offset against the proceeds received or the amount paid on the transaction to determine realized gains or losses. Investing in written options contracts exposes a Fund to equity price risk.
The following is a summary of Disciplined Equity Fund’s written option activity for the year ended December 31, 2012:
| | | | | | | | |
| Contracts | | Number of
Contracts | | | Premium | |
Outstanding at 12/31/2011 | | | 6,152 | | | $ | 1,280,648 | |
Options written | | | 18,496 | | | | 3,008,233 | |
Options expired | | | (10,371 | ) | | | (1,507,017 | ) |
Options closed | | | (6,410 | ) | | | (1,411,135 | ) |
Options exercised | | | (780 | ) | | | (99,487 | ) |
Outstanding at 12/31/2012 | | | 7,087 | | | $ | 1,271,242 | |
At December 31, 2012, Disciplined Equity Fund had the following outstanding options:
WRITTEN OPTION CONTRACTS
| | | | | | | | | | | | | | | | | | | | | | | | |
| Contract | | Type | | | Expiration
Date | | | Exercise
Price | | | Number of
Contracts | | | Fair
Value | | | Unrealized
Appreciation
(Depreciation) | |
3M Co. | | | Call | | | | April 2013 | | | $ | 100 | | | | 80 | | | $ | 6,960 | | | $ | 7,599 | |
Amazon.com, Inc. | | | Call | | | | January 2013 | | | | 255 | | | | 40 | | | | 18,200 | | | | 35,279 | |
Amgen, Inc. | | | Call | | | | July 2013 | | | | 92.5 | | | | 110 | | | | 29,920 | | | | 1,079 | |
Bank of America Corp. | | | Call | | | | May 2013 | | | | 11 | | | | 400 | | | | 56,400 | | | | (39,202 | ) |
Bank of New York Mellon Corp./The | | | Call | | | | January 2013 | | | | 25 | | | | 100 | | | | 11,450 | | | | (8,546 | ) |
Chubb Corp./The | | | Call | | | | January 2013 | | | | 80 | | | | 45 | | | | 248 | | | | 6,547 | |
Cisco Systems, Inc. | | | Call | | | | February 2013 | | | | 20 | | | | 300 | | | | 20,100 | | | | (8,401 | ) |
Citigroup, Inc. | | | Call | | | | March 2013 | | | | 38 | | | | 200 | | | | 67,800 | | | | (46,160 | ) |
Coca-Cola Co./The | | | Call | | | | January 2013 | | | | 37.5 | | | | 120 | | | | 1,800 | | | | 3,780 | |
Coca-Cola Co./The | | | Call | | | | February 2013 | | | | 42.5 | | | | 200 | | | | 200 | | | | 13,999 | |
Comcast Corp., Class A | | | Call | | | | January 2013 | | | | 36 | | | | 250 | | | | 41,750 | | | | (18,502 | ) |
ConocoPhillips | | | Call | | | | January 2013 | | | | 60 | | | | 100 | | | | 2,100 | | | | 10,399 | |
Costco Wholesale Corp. | | | Call | | | | January 2013 | | | | 105 | | | | 50 | | | | 11,025 | | | | (5,563 | ) |
CVS Caremark Corp. | | | Call | | | | February 2013 | | | | 49 | | | | 100 | | | | 9,150 | | | | 1,649 | |
Dow Chemical Co/The | | | Call | | | | January 2013 | | | | 33 | | | | 100 | | | | 4,500 | | | | (1,000 | ) |
eBay, Inc. | | | Call | | | | April 2013 | | | | 52.5 | | | | 100 | | | | 29,450 | | | | (7,118 | ) |
Eli Lilly & Co. | | | Call | | | | January 2013 | | | | 45 | | | | 100 | | | | 44,500 | | | | (31,081 | ) |
Emerson Electric Co. | | | Call | | | | January 2013 | | | | 55 | | | | 100 | | | | 2,000 | | | | 11,199 | |
Exxon Mobil Corp. | | | Call | | | | January 2013 | | | | 95 | | | | 150 | | | | 300 | | | | 13,349 | |
Exxon Mobil Corp. | | | Call | | | | April 2013 | | | | 100 | | | | 250 | | | | 1,500 | | | | 12,749 | |
General Electric Co. | | | Call | | | | January 2013 | | | | 20 | | | | 200 | | | | 23,600 | | | | (588 | ) |
Google, Inc., Class A | | | Call | | | | January 2013 | | | | 750 | | | | 20 | | | | 9,000 | | | | 22,039 | |
Home Depot, Inc./The | | | Call | | | | January 2013 | | | | 57.5 | | | | 110 | | | | 50,600 | | | | (35,201 | ) |
Home Depot, Inc./The | | | Call | | | | January 2013 | | | | 60 | | | | 100 | | | | 24,750 | | | | (9,851 | ) |
Honeywell International, Inc. | | | Call | | | | January 2013 | | | | 65 | | | | 85 | | | | 4,548 | | | | 722 | |
Annual Shareholder Report
151
Notes to Financial Statements (Continued)
| | | | | | | | | | | | | | | | | | | | | | | | |
| Contract | | Type | | | Expiration
Date | | | Exercise
Price | | | Number of
Contracts | | | Fair
Value | | | Unrealized
Appreciation
(Depreciation) | |
International Business Machines Corp. | | | Call | | | | April 2013 | | | $ | 205 | | | | 60 | | | $ | 13,410 | | | $ | 4,109 | |
International Business Machines Corp. | | | Call | | | | April 2013 | | | | 225 | | | | 60 | | | | 1,200 | | | | 18,899 | |
Johnson & Johnson | | | Call | | | | January 2013 | | | | 72.5 | | | | 100 | | | | 500 | | | | 8,200 | |
JPMorgan Chase & Co. | | | Call | | | | June 2013 | | | | 45 | | | | 200 | | | | 48,600 | | | | (22,201 | ) |
MasterCard, Inc., Class A | | | Call | | | | April 2013 | | | | 525 | | | | 7 | | | | 8,417 | | | | 517 | |
Merck & Co., Inc. | | | Call | | | | January 2013 | | | | 45 | | | | 150 | | | | 450 | | | | 6,900 | |
Metlife, Inc. | | | Call | | | | March 2013 | | | | 39 | | | | 100 | | | | 2,200 | | | | 5,049 | |
Microsoft Corp. | | | Call | | | | January 2013 | | | | 32.5 | | | | 250 | | | | 375 | | | | 15,392 | |
Monsanto Co. | | | Call | | | | January 2013 | | | | 92.5 | | | | 50 | | | | 17,000 | | | | 599 | |
NIKE, Inc. | | | Call | | | | April 2013 | | | | 52.5 | | | | 100 | | | | 21,900 | | | | (13,300 | ) |
PepsiCo., Inc. | | | Call | | | | January 2013 | | | | 75 | | | | 100 | | | | 250 | | | | 6,449 | |
Pfizer, Inc. | | | Call | | | | January 2013 | | | | 25 | | | | 250 | | | | 11,000 | | | | 1,899 | |
Philip Morris International, Inc. | | | Call | | | | January 2013 | | | | 95 | | | | 100 | | | | 200 | | | | 20,227 | |
Procter & Gamble Co. | | | Call | | | | January 2013 | | | | 72.5 | | | | 50 | | | | 175 | | | | 3,552 | |
Procter & Gamble Co. | | | Call | | | | April 2013 | | | | 72.5 | | | | 150 | | | | 6,150 | | | | 3,029 | |
Schlumberger Ltd. | | | Call | | | | January 2013 | | | | 80 | | | | 100 | | | | 100 | | | | 28,749 | |
S&P 100 Index | | | Put | | | | January 2013 | | | | 620 | | | | 250 | | | | 70,000 | | | | 29,249 | |
S&P 100 Index | | | Put | | | | February 2013 | | | | 600 | | | | 300 | | | | 115,500 | | | | 21,599 | |
S&P 100 Index | | | Put | | | | March 2013 | | | | 600 | | | | 400 | | | | 296,000 | | | | (5,202 | ) |
Target Corp. | | | Call | | | | April 2013 | | | | 70 | | | | 60 | | | | 660 | | | | 7,020 | |
Union Pacific Corp. | | | Call | | | | January 2013 | | | | 130 | | | | 50 | | | | 3,425 | | | | 17,674 | |
U.S. Bancorp | | | Call | | | | January 2013 | | | | 32 | | | | 150 | | | | 10,575 | | | | 11,325 | |
Visa, Inc., Class A | | | Call | | | | March 2013 | | | | 145 | | | | 60 | | | | 61,050 | | | | (35,731 | ) |
Walgreen Co. | | | Call | | | | January 2013 | | | | 40 | | | | 100 | | | | 500 | | | | 6,099 | |
Wal-Mart Stores, Inc. | | | Call | | | | January 2013 | | | | 75 | | | | 180 | | | | 540 | | | | 22,937 | |
Walt Disney Co./The | | | Call | | | | April 2013 | | | | 57.5 | | | | 100 | | | | 2,450 | | | | 5,950 | |
Wells Fargo & Co. | | | Call | | | | April 2013 | | | | 39 | | | | 200 | | | | 5,400 | | | | 3,199 | |
NET UNREALIZED APPRECIATION ON WRITTEN OPTION CONTRACTS | | | | | | | | | | | | | | | | | | | | | | $ | 101,364 | |
The following is a summary of Dividend Capture Fund’s written option activity for the year ended December 31, 2012:
| | | | | | | | |
| Contracts | | Number of
Contracts | | | Premium | |
Outstanding at 12/31/2011 | | | 100 | | | $ | 37,399 | |
Options written | | | 2,208 | | | | 257,285 | |
Options expired | | | (2 | ) | | | (148 | ) |
Options closed | | | (1,606 | ) | | | (215,858 | ) |
Options exercised | | | (300 | ) | | | (38,099 | ) |
Outstanding at 12/31/2012 | | | 400 | | | $ | 40,579 | |
Annual Shareholder Report
152
At December 31, 2012, Dividend Capture Fund had the following outstanding options:
WRITTEN OPTION CONTRACTS
| | | | | | | | | | | | | | | | | | | | | | | | |
| Contract | | Type | | | Expiration
Date | | | Exercise
Price | | | Number of
Contracts | | | Fair
Value | | | Unrealized
Appreciation
(Depreciation) | |
D.R. Horton, Inc. | | | Call | | | | February 2013 | | | $ | 20 | | | | 200 | | | $ | 19,300 | | | $ | 5,380 | |
D.R. Horton, Inc. | | | Call | | | | February 2013 | | | | 21 | | | | 200 | | | | 11,300 | | | | 4,599 | |
NET UNREALIZED APPRECIATION ON WRITTEN OPTION CONTRACTS | | | | | | | | | | | | | | | | | | | | | | $ | 9,979 | |
The following is a summary of Global Select Markets Fund written option activity for the year ended December 31, 2012:
| | | | | | | | |
| Contracts | | Number of
Contracts | | | Premium | |
Outstanding at 12/31/2011 | | | 10 | | | $ | 31,019 | |
Options written | | | 1,220 | | | | 398,288 | |
Options expired | | | (290 | ) | | | (129,346 | ) |
Options closed | | | (460 | ) | | | (138,166 | ) |
Options exercised | | | (480 | ) | | | (161,795 | ) |
Outstanding at 12/31/2012 | | | — | | | $ | — | |
The following is a summary of Growth Fund’s written option activity for the year ended December 31, 2012:
| | | | | | | | |
| Contracts | | Number of
Contracts | | | Premium | |
Outstanding at 12/31/2011 | | | — | | | $ | — | |
Options written | | | 125 | | | | 89,622 | |
Options expired | | | (125 | ) | | | (89,622 | ) |
Options closed | | | — | | | | — | |
Options exercised | | | — | | | | — | |
Outstanding at 12/31/2012 | | | — | | | $ | — | |
The following is a summary of Income Equity Fund’s written option activity for the year ended December 31, 2012:
| | | | | | | | |
| Contracts | | Number of
Contracts | | | Premium | |
Outstanding at 12/31/2011 | | | — | | | $ | — | |
Options written | | | 4,348 | | | | 271,242 | |
Options expired | | | (3,203 | ) | | | (225,967 | ) |
Options closed | | | (795 | ) | | | (39,325 | ) |
Options exercised | | | (350 | ) | | | (5,950 | ) |
Outstanding at 12/31/2012 | | | — | | | $ | — | |
The following is a summary of Real Strategies Fund’s written option activity for the year ended December 31, 2012:
| | | | | | | | |
| Contracts | | Number of
Contracts | | | Premium | |
Outstanding at 12/31/2011 | | | 1,845 | | | $ | 916,341 | |
Options written | | | 2,916 | | | | 1,057,888 | |
Options expired | | | (1,814 | ) | | | (616,070 | ) |
Options closed | | | (2,886 | ) | | | (1,321,194 | ) |
Options exercised | | | (61 | ) | | | (36,965 | ) |
Outstanding at 12/31/2012 | | | — | | | $ | — | |
Annual Shareholder Report
153
Notes to Financial Statements (Continued)
The following is a summary of Situs Fund’s written option activity for the year ended December 31, 2012:
| | | | | | | | |
| Contracts | | Number of
Contracts | | | Premium | |
Outstanding at 12/31/2011 | | | — | | | $ | — | |
Options written | | | 7,409 | | | | 2,432,859 | |
Options expired | | | (3,250 | ) | | | (749,421 | ) |
Options closed | | | (2,750 | ) | | | (1,230,603 | ) |
Options exercised | | | (909 | ) | | | (265,264 | ) |
Outstanding at 12/31/2012 | | | 500 | | | $ | 187,571 | |
At December 31, 2012, Situs Fund had the following outstanding options:
WRITTEN OPTION CONTRACTS
| | | | | | | | | | | | | | | | | | | | | | | | |
| Contract | | Type | | | Expiration
Date | | | Exercise
Price | | | Number of
Contracts | | | Fair
Value | | | Unrealized
Appreciation
(Depreciation) | |
Edwards LifeSciences Corp. | | | Call | | | | February 2013 | | | $ | 95 | | | | 500 | | | $ | 103,750 | | | $ | 83,821 | |
NET UNREALIZED APPRECIATION ON WRITTEN OPTION CONTRACTS | | | | | | | | | | | | | | | | | | | | | | $ | 83,821 | |
The following tables provide a summary of the fair value of derivative instruments, not accounted for as hedging instruments as of December 31, 2012, and the effect of derivative instruments on the Statement of Operations for the year ended December 31, 2012.
The Fair Value of Derivative Instruments as of December 31, 2012:
| | | | | | | | | | |
| | | Asset Derivatives | | Liability Derivatives | | | | | |
| Primary Risk Exposure | | Statements of Assets and
Liabilities Location | | Statements of Assets and
Liabilities Location | | Fund | | Fair Value | |
Option Contracts | | | | Options Written, at value | | Disciplined Equity Fund | | $ | 1,169,878 | |
| | | | | | Dividend Capture Fund | | | 30,600 | |
| | | | | | Situs Fund | | | 103,750 | |
| | | | |
| | Investments, at value | | | | Disciplined Equity Fund | | | 1,353,000 | |
| | | | | | Real Strategies Fund | | | 45,000 | |
The effect of Derivative Instruments on the Statements of Operations for the year ended December 31, 2012:
| | | | | | | | | | | | |
| Primary Risk Exposure | | Location of Gain (Loss)
on Derivatives
Recognized in Income | | Fund | | Realized Gain (Loss) on
Derivatives Recognized
in Income | | | Change in Unrealized
Appreciation/Depreciation
on Derivatives Recognized
in Income | |
Option Contracts | | Net Realized gain (loss) on option transactions/net change in unrealized appreciation/depreciation of investments and options | | Disciplined Equity Fund Dividend Capture Fund Global Select Markets Fund Growth Fund Income Equity Fund Real Strategies Fund
Situs Fund | | $
| (10,286,095
149,295 236,247
89,622
208,107
337,144
1,057,428 | )
| | $
| 962,581
(15,220 (40,209 — —
225,533
83,821 |
) )
|
The notional value of the written options contracts outstanding at December 31, 2012 and the month-end average notional amount for the year ended December 31, 2012 are detailed in the table below:
| | | | | | | | |
| Portfolio | | Average
Month-End
Notional Amount | | | December 31, 2012
Notional Amount | |
Disciplined Equity Fund | | $ | 46,826,619 | | | $ | 93,715,000 | |
Dividend Capture Fund | | | 1,114,000 | | | | 820,000 | |
Global Select Markets Fund | | | 621,538 | | | | — | |
Growth Fund | | | 625,000 | | | | — | |
Income Equity Fund | | | 1,711,038 | | | | — | |
Real Strategies Fund | | | 2,327,904 | | | | — | |
Situs Fund | | | 9,969,615 | | | | 4,750,000 | |
Annual Shareholder Report
154
Derivative positions open during the period and at period end are reflected for each Fund in the tables above. The volume of these positions relative to each Fund’s net assets at the close of the reporting period is generally higher than the volume of such positions at the beginning of the reporting period. The Funds value derivative instruments at fair value and recognize changes in fair value currently in the results on operations.
To generate additional income, the Funds may lend a certain percentage of their total assets, to the extent permitted by the 1940 Act or the rules or regulations thereunder, on a short-term basis to certain brokers, dealers or other financial institutions pursuant to a securities lending agreement with Morgan Stanley & Co. LLC and MS Securities Services, Inc. In determining whether to lend to a particular broker, dealer or financial institution, Huntington Asset Advisors, Inc. (the “Advisor”) will consider all relevant facts and circumstances, including the size, creditworthiness and reputation of the borrower. Any loans made will be continuously secured by collateral in cash at least equal to 100% of the value of the securities on loan for the Funds, based on the prior day’s closing price. When the collateral falls below specified amounts the lending agent will use its best effort to obtain additional collateral on the next business day to meet required
amounts under the security lending agreement. The Funds receive payments from the borrowers equivalent to the dividends and interest that would have been earned on securities on loan. In addition, the Funds lending securities receive an annual minimum securities lending fee and retain a portion of the interest, dividends and other distributions received on investment of cash collateral. Collateral is marked-to-market daily. One of the risks in lending portfolio securities, as with other extensions of credit, is the possible delay in recovery of the securities or possible loss of rights in the collateral should the borrower fail financially. Although the loan is fully collateralized, if a borrower defaults, a Fund could lose money. There is also the risk that, when lending portfolio securities, the securities may not be available to a Fund on a timely basis and a Fund may, therefore, lose the opportunity to sell the securities at a desirable price. In addition, in the event that a borrower of securities would file for bankruptcy or become insolvent, disposition of the securities may be delayed pending court action. Loans are subject to termination by the Funds or the borrower at any time and, therefore, are not considered to be illiquid investments. Huntington National Bank (“Huntington”) serves as the custodian for related collateral and receives an annual securities lending fee for collateral monitoring and recordkeeping services.
| | | | | | | | | | | | | | | | | | | | |
| Fund | | Value of
Loaned
Securities | | | Value of
Collateral | | | Average Loan
Outstanding
During
the Period | | | Securities Lending
Income Received
by the Funds | | | Fees Paid by the
Funds to
Huntington from
Securities Lending | |
Dividend Capture Fund | | $ | 9,610,624 | | | $ | 9,634,051 | | | $ | 11,526,306 | | | $ | 58,795 | | | $ | 9,042 | |
Global Select Markets Fund | | | 1,530,738 | | | | 1,593,389 | | | | 2,406,213 | | | | 37,175 | | | | 6,405 | |
Growth Fund | | | 1,363,693 | | | | 1,390,967 | | | | 3,984,835 | | | | 33,885 | | | | 5,651 | |
Income Equity Fund | | | 14,749,495 | | | | 15,044,485 | | | | 12,398,778 | | | | 26,687 | | | | 3,616 | |
International Equity Fund | | | 1,462,448 | | | | 1,478,160 | | | | 15,429,422 | | | | 239,205 | | | | 41,063 | |
Mid Corp America Fund | | | 6,074,742 | | | | 6,116,911 | | | | 5,229,766 | | | | 152,888 | | | | 31,268 | |
Real Strategies Fund | | | 20,583,002 | | | | 20,507,976 | | | | 14,920,661 | | | | 851,974 | | | | 149,933 | |
Rotating Markets Fund | | | 1,840,533 | | | | 1,839,691 | | | | 3,264,452 | | | | 10,409 | | | | 1,507 | |
Situs Fund | | | 25,938,935 | | | | 25,978,626 | | | | 21,323,285 | | | | 288,144 | | | | 49,349 | |
Mortgage Securities Fund | | | 692,745 | | | | 705,024 | | | | 1,148,687 | | | | 3,510 | | | | 564 | |
All cash collateral received is held and administered by the Funds’ custodian for the benefit of the Funds in the applicable custody account or other account established for the purpose of holding collateral. Pursuant to the Funds’ securities lending agreement, and according to normal operating procedures, the custodian segregated an additional $469,469 and $37,653 in collateral the following business day for securities on loan in the Real Strategies Fund and Rotating Markets Fund as of December 31, 2012.
Restricted securities are securities that may only be resold upon registration under federal securities laws or in transactions exempt from such registration. In some cases, the issuer of restricted securities has agreed to register such securities for resale, at the issuer’s expense, either upon demand by the Funds or in connection with another registered offering of the securities. Many restricted securities may be resold in the secondary market in transactions exempt from registration. Such restricted securities may be determined to be liquid. The Funds will not incur any registration costs upon such resale. The Funds’ restricted securities are valued at the price provided by dealers in the secondary market or, if no market prices are available, at the fair value price as determined by the Trust’s Pricing Committee. At December 31, 2012, the Real Strategies Fund and Fixed Income Securities Fund held illiquid restricted securities representing 4.74% and 9.34% respectively, of net assets as listed below:
| | | | | | | | | | | | | | | | |
| Issuer Description | | Acquisition Date | | | Principal Amount | | | Cost | | | Value | |
Real Strategies Fund: | | | | | | | | | | | | | | | | |
Discount Retail Portfolio II DST | | | 11/30/11 | | | | N/A | | | $ | 950,000 | | | $ | 884,472 | |
Grocery & Pharmacy DST | | | 8/26/11 | | | | N/A | | | | 950,000 | | | | 919,418 | |
New York Power DST | | | 7/21/11 | | | | N/A | | | | 950,000 | | | | 862,254 | |
Scotts Gahanna LLC | | | 12/13/11 | | | | N/A | | | | 1,344,000 | | | | 1,143,804 | |
Winston-Salem DST | | | 2/22/12 | | | | N/A | | | | 950,000 | | | | 859,037 | |
Annual Shareholder Report
155
Notes to Financial Statements (Continued)
| | | | | | | | | | | | | | | | |
| Issuer Description | | Acquisition Date | | | Principal Amount | | | Cost | | | Value | |
Fixed Income Securities Fund: | | | | | | | | | | | | | | | | |
American Express Co., 4.050%,12/3/42 | | | 12/4/12 | | | $ | 2,700,000 | | | $ | 2,563,098 | | | $ | 2,712,123 | |
Bank of Nova Scotia, 1.950%, 1/30/17 | | | 2/3/12 | | | | 5,000,000 | | | | 5,083,543 | | | | 5,208,000 | |
Bank of Montreal, 2.500%, 1/11/17 | | | 6/19/12 | | | | 5,000,000 | | | | 5,148,369 | | | | 5,241,185 | |
Barrick International Bank Corp., 5.750%, 10/15/16 | | | 2/20/09 | | | | 2,000,000 | | | | 1,955,387 | | | | 2,294,262 | |
Canadian Imperial Bank of Commerce, 2.600%, 7/2/15 | | | 10/25/11 | | | | 5,000,000 | | | | 5,131,140 | | | | 5,254,000 | |
Royal Bank of Canada, 3.125%, 4/14/15 | | | 5/3/11 | | | | 5,000,000 | | | | 5,111,351 | | | | 5,289,000 | |
Toronto-Dominion Bank, 2.200%, 7/29/15 | | | 6/29/11 | | | | 3,000,000 | | | | 3,038,878 | | | | 3,126,000 | |
| H. | Security Transactions and Related Income |
During the period, investment transactions are accounted for no later than the first calculation of the NAV on the business day following the trade date. For financial reporting purposes, however, security transactions are accounted for on the trade date on the last business day of the reporting period. Discounts and premiums on securities purchased are amortized over the lives of the respective securities. Securities gains and losses are calculated on the identified cost basis. Interest income and expenses are accrued daily. Dividends, less foreign tax withholding (if any), are recorded on the ex-dividend date.
| I. | Dividends and Distributions to Shareholders |
Dividends from net investment income are declared daily and paid monthly for Tax-Free Money Market Fund, Money Market Fund, Ohio Municipal Money Market Fund, U.S. Treasury Money Market Fund, Fixed Income Securities Fund, Intermediate Government Income Fund, Ohio Tax-Free Fund and Short/Intermediate Fixed Income Securities Fund. Dividends from net investment income are declared and paid annually for Disciplined Equity Fund, Global Select Markets Fund, International Equity Fund, Mid Corp America Fund, Rotating Markets Fund, Situs Fund and Growth Allocation Fund. Dividends from net investment income are declared and paid quarterly for Growth Fund, Real Strategies Fund and Balanced Allocation Fund. Dividends from net investment income are declared and paid monthly for Dividend Capture Fund, Income Equity Fund, Mortgage Securities Fund and Conservative Allocation Fund.
The amount of dividends from net investment income and net realized gains are determined in accordance with the federal income tax regulations, which may differ from GAAP. These “book/tax” differences are either considered temporary or permanent in nature. To the extent these differences are permanent in nature (e.g. tax treatment of foreign currency gain/loss, paydowns, expiration of capital loss carryforwards and carryovers of tax attributes due to mergers, distributions and income received from pass through investments and net investment loss adjustments), such amounts are reclassified within the capital accounts based on their nature for federal income tax purposes; temporary differences do not require reclassification. Temporary differences are primarily due to market discounts, capital loss carryforwards and losses
deferred due to wash sales, straddles and return of capital from investments.
Dividends are declared separately for each class. No class has preferential rights; differences in per share dividend rates are generally due to differences in separate class expenses. Net realized capital gains, if any, are distributed at least annually.
Certain of the Funds may own shares of real estate investments trusts (“REITs”) which report information on the source of their distributions annually. Distributions received from investments in REITs in excess of income from underlying investments are recorded as realized gain and/or as a reduction to the cost of the individual REIT.
Certain of the Funds may invest in Master Limited Partnerships (“MLPs”), which generally are treated as partnerships for Federal income tax purposes. As a limited partner in the MLPs, the Fund includes its allocable share of the MLPs’ taxable income in computing its own taxable income.
| J. | Allocation of Expenses, Income, and Gains and Losses |
Expenses directly attributable to a Fund are charged to that Fund. Expenses specific to a class are charged to that class. Except for the daily dividend Funds, expenses not directly attributable to a Fund are allocated proportionally among various Funds or all Funds within the Trust in relation to the net assets of each Fund or on another reasonable basis. For the daily dividend Funds, expenses not directly attributable to a Fund are allocated pursuant to the “settled shares method.” Income and realized and unrealized gains or losses on investments are allocated to each class of shares based on its relative net assets.
It is the policy of each Fund to qualify or continue to qualify as a regulated investment company by complying with the provisions available to certain investment companies, as defined in applicable sections of the Internal Revenue Code, and to make distributions of net investment income and net realized capital gains sufficient to relieve it from all, or substantially all, federal income taxes.
Withholding taxes on foreign interest, dividends and capital gains with respect to the Funds have been provided for in accordance with each applicable country’s tax rules and rates.
Annual Shareholder Report
156
As of December 31, 2012, the tax cost of securities and the breakdown of unrealized appreciation (depreciation) for each Fund was as follows:
| | | | | | | | | | | | | | | | |
| Fund | | Tax Cost of
Securities | | | Unrealized
Appreciation | | | Unrealized
Depreciation | | | Net Unrealized
Appreciation/
(Depreciation)* | |
Tax-Free Money Market Fund | | $ | 74,379,803 | | | $ | — | | | $ | — | | | $ | — | |
Money Market Fund | | | 346,332,439 | | | | — | | | | — | | | | — | |
Ohio Municipal Money Market Fund | | | 131,738,287 | | | | — | | | | — | | | | — | |
U.S. Treasury Money Market Fund | | | 845,845,096 | | | | — | | | | — | | | | — | |
Disciplined Equity Fund | | | 82,129,786 | | | | 14,665,916 | | | | (1,441,922 | ) | | | 13,223,994 | |
Dividend Capture Fund | | | 195,067,243 | | | | 10,844,376 | | | | (4,207,965 | ) | | | 6,636,411 | |
Global Select Markets Fund | | | 39,986,470 | | | | 3,710,467 | | | | (2,404,185 | ) | | | 1,306,282 | |
Growth Fund | | | 115,535,426 | | | | 19,123,870 | | | | (999,348 | ) | | | 18,124,522 | |
Income Equity Fund | | | 141,124,836 | | | | 14,004,811 | | | | (2,630,086 | ) | | | 11,374,725 | |
International Equity Fund | | | 250,161,029 | | | | 56,662,469 | | | | (11,010,130 | ) | | | 45,652,339 | |
Mid Corp America Fund | | | 96,418,285 | | | | 46,438,777 | | | | (2,313,280 | ) | | | 44,125,497 | |
Real Strategies Fund | | | 118,729,881 | | | | 10,588,854 | | | | (10,396,869 | ) | | | 191,985 | |
Rotating Markets Fund | | | 42,491,137 | | | | 2,642,021 | | | | (2,760,165 | ) | | | (118,144 | ) |
Situs Fund | | | 163,499,601 | | | | 87,477,707 | | | | (3,004,110 | ) | | | 84,473,597 | |
Fixed Income Securities Fund | | | 288,311,480 | | | | 21,003,043 | | | | (412,467 | ) | | | 20,590,576 | |
Intermediate Government Income Fund | | | 113,099,665 | | | | 8,098,361 | | | | (63,494 | ) | | | 8,034,867 | |
Mortgage Securities Fund | | | 72,764,370 | | | | 6,400,206 | | | | (28,904 | ) | | | 6,371,302 | |
Ohio Tax-Free Fund | | | 51,864,087 | | | | 2,298,473 | | | | (88,344 | ) | | | 2,210,129 | |
Short/Intermediate Fixed Income Securities Fund | | | 193,646,127 | | | | 4,349,894 | | | | (81,847 | ) | | | 4,268,047 | |
Balanced Allocation Fund | | | 16,795,028 | | | | 1,469,360 | | | | (54,097 | ) | | | 1,415,263 | |
Conservative Allocation Fund | | | 4,535,751 | | | | 323,196 | | | | (19,990 | ) | | | 303,206 | |
Growth Allocation Fund | | | 11,744,657 | | | | 1,481,012 | | | | (45,401 | ) | | | 1,435,611 | |
| * | The differences between the book-basis unrealized appreciation/(depreciation) are attributable primarily to: tax deferral of losses on wash sales, the tax treatment of Trust Preferred securities, hybrid securities and Grantor trusts, differences related to partnership investments, the realization for tax purposes of unrealized gains/losses on investments in passive foreign investment companies and the return of capital adjustments from real estate investment trusts. |
The tax character of distributions paid during the fiscal year ended December 31, 2012, was as follows:
| | | | | | | | | | | | | | | | | | | | | | | | |
| | | Distributions Paid From * | | | | | | | | | | | | | |
| Fund | | Ordinary
Income | | | Net Long Term
Capital Gains | | | Total
Taxable
Distributions | | | Tax Exempt
Distributions | | | Tax Return
of Capital | | | Total
Distributions
Paid | |
Tax-Free Money Market Fund | | $ | — | | | $ | — | | | $ | — | | | $ | 7,882 | | | $ | — | | | $ | 7,882 | |
Money Market Fund | | | 40,359 | | | | — | | | | 40,359 | | | | — | | | | — | | | | 40,359 | |
Ohio Municipal Money Market Fund | | | — | | | | — | | | | — | | | | 14,267 | | | | — | | | | 14,267 | |
U.S. Treasury Money Market Fund | | | 28,863 | | | | — | | | | 28,863 | | | | — | | | | — | | | | 28,863 | |
Disciplined Equity Fund | | | 950,448 | | | | — | | | | 950,448 | | | | — | | | | — | | | | 950,448 | |
Dividend Capture Fund | | | 7,091,056 | | | | — | | | | 7,091,056 | | | | — | | | | — | | | | 7,091,056 | |
Global Select Markets Fund | | | 159,999 | | | | — | | | | 159,999 | | | | — | | | | — | | | | 159,999 | |
Growth Fund | | | 881,262 | | | | 6,218,088 | | | | 7,099,350 | | | | — | | | | — | | | | 7,099,350 | |
Income Equity Fund | | | 4,533,102 | | | | — | | | | 4,533,102 | | | | — | | | | — | | | | 4,533,102 | |
International Equity Fund | | | 4,779,378 | | | | — | | | | 4,779,378 | | | | — | | | | 97,049 | | | | 4,876,427 | |
Mid Corp America Fund | | | 216,660 | | | | 18,816,596 | | | | 19,033,256 | | | | — | | | | — | | | | 19,033,256 | |
Real Strategies Fund | | | 1,310,003 | | | | — | | | | 1,310,003 | | | | — | | | | — | | | | 1,310,003 | |
Rotating Markets Fund | | | 797,997 | | | | 5,160,037 | | | | 5,958,034 | | | | — | | | | — | | | | 5,958,034 | |
Situs Fund | | | 1,931,376 | | | | 5,252,780 | | | | 7,184,156 | | | | — | | | | — | | | | 7,184,156 | |
Fixed Income Securities Fund | | | 8,130,390 | | | | 2,353,712 | | | | 10,484,102 | | | | — | | | | — | | | | 10,484,102 | |
Intermediate Government Income Fund | | | 2,771,516 | | | | 125,367 | | | | 2,896,883 | | | | — | | | | — | | | | 2,896,883 | |
Mortgage Securities Fund | | | 2,641,414 | | | | 523,315 | | | | 3,164,729 | | | | — | | | | — | | | | 3,164,729 | |
Ohio Tax-Free Fund | | | 202,643 | | | | 891,712 | | | | 1,094,355 | | | | 1,013,080 | | | | — | | | | 2,107,435 | |
Short/Intermediate Fixed Income Securities Fund | | | 2,683,509 | | | | — | | | | 2,683,509 | | | | — | | | | — | | | | 2,683,509 | |
Balanced Allocation Fund | | | 539,385 | | | | 1,290,511 | | | | 1,829,896 | | | | — | | | | — | | | | 1,829,896 | |
Conservative Allocation Fund | | | 185,980 | | | | 757,933 | | | | 943,913 | | | | — | | | | — | | | | 943,913 | |
Growth Allocation Fund | | | 353,776 | | | | 1,459,352 | | | | 1,813,128 | | | | — | | | | — | | | | 1,813,128 | |
| * | The tax character of distributions paid may differ from the character of distributions shown on the statements of changes in net assets due to short-term capital gains being treated as ordinary income for tax purposes. |
Annual Shareholder Report
157
Notes to Financial Statements (Continued)
The tax character of distributions paid during the fiscal year ended December 31, 2011, was as follows:
| | | | | | | | | | | | | | | | | | | | | | | | |
| | | Distributions Paid From * | | | | | | | | | | | | | |
| Fund | | Ordinary
Income | | | Net Long Term
Capital Gains | | | Total
Taxable
Distributions | | | Tax Exempt
Distributions | | | Tax Return
of Capital | | | Total Distributions Paid | |
Tax-Free Money Market Fund | | $ | — | | | $ | — | | | $ | — | | | $ | 8,164 | | | $ | — | | | $ | 8,164 | |
Money Market Fund | | | 42,252 | | | | — | | | | 42,252 | | | | — | | | | — | | | | 42,252 | |
Ohio Municipal Money Market Fund | | | — | | | | — | | | | — | | | | 16,680 | | | | — | | | | 16,680 | |
U.S. Treasury Money Market Fund | | | 41,200 | | | | — | | | | 41,200 | | | | — | | | | — | | | | 41,200 | |
Disciplined Equity Fund | | | 287,998 | | | | — | | | | 287,998 | | | | — | | | | — | | | | 287,998 | |
Dividend Capture Fund | | | 4,485,605 | | | | — | | | | 4,485,605 | | | | — | | | | — | | | | 4,485,605 | |
Global Select Markets Fund | | | 187,427 | | | | 601,459 | | | | 788,886 | | | | — | | | | — | | | | 788,886 | |
Growth Fund | | | — | | | | 474,655 | | | | 474,655 | | | | — | | | | — | | | | 474,655 | |
Income Equity Fund | | | 3,865,956 | | | | — | | | | 3,865,956 | | | | — | | | | — | | | | 3,865,956 | |
International Equity Fund | | | 3,228,205 | | | | — | | | | 3,228,205 | | | | — | | | | — | | | | 3,228,205 | |
Mid Corp America Fund | | | 139,573 | | | | 12,916,579 | | | | 13,056,152 | | | | — | | | | — | | | | 13,056,152 | |
Real Strategies Fund | | | 913,049 | | | | — | | | | 913,049 | | | | — | | | | — | | | | 913,049 | |
Rotating Markets Fund | | | 101,065 | | | | — | | | | 101,065 | | | | — | | | | — | | | | 101,065 | |
Fixed Income Securities Fund | | | 8,258,591 | | | | 3,766,042 | | | | 12,024,633 | | | | — | | | | — | | | | 12,024,633 | |
Intermediate Government Income Fund | | | 3,409,107 | | | | 74,875 | | | | 3,483,982 | | | | — | | | | — | | | | 3,483,982 | |
Mortgage Securities Fund | | | 3,283,353 | | | | — | | | | 3,283,353 | | | | — | | | | — | | | | 3,283,353 | |
Ohio Tax-Free Fund | | | 6,641 | | | | 365,596 | | | | 372,237 | | | | 1,066,669 | | | | — | | | | 1,438,906 | |
Short/Intermediate Fixed Income Securities Fund | | | 3,081,317 | | | | — | | | | 3,081,317 | | | | — | | | | — | | | | 3,081,317 | |
Balanced Allocation Fund | | | 344,465 | | | | 174,163 | | | | 518,628 | | | | — | | | | — | | | | 518,628 | |
Conservative Allocation Fund | | | 237,291 | | | | 98,709 | | | | 336,000 | | | | — | | | | — | | | | 336,000 | |
Growth Allocation Fund | | | 181,796 | | | | 222,914 | | | | 404,710 | | | | — | | | | — | | | | 404,710 | |
| * | The tax character of distributions paid may differ from the character of distributions shown on the statements of changes in net assets due to short-term capital gains being treated as ordinary income for tax purposes. |
As of December 31, 2012, the components of accumulated earnings (deficit) were as follows:
| | | | | | | | | | | | | | | | | | | | | | | | | | | | | | | | |
| Fund | | Undistributed
Ordinary
Income | | | Undistributed
Tax Exempt
Income | | | Undistributed
Long-Term
Capital Gains | | | Accumulated
Earnings | | | Accumulated
Capital and
Other
Losses | | | Other
Temporary
Differences | | | Unrealized
Appreciation
(Depreciation) | | | Total
Accumulated
Earnings
(Deficit) | |
Tax-Free Money Market Fund | | $ | — | | | $ | 849 | | | $ | — | | | $ | 849 | | | $ | (131,697 | ) | | $ | — | | | $ | — | | | $ | (130,848 | ) |
Money Market Fund | | | 70 | | | | — | | | | — | | | | 70 | | | | (177,140 | ) | | | — | | | | — | | | | (177,070 | ) |
Ohio Municipal Money Market Fund | | | — | | | | 129 | | | | — | | | | 129 | | | | (294,657 | ) | | | — | | | | — | | | | (294,528 | ) |
U.S. Treasury Money Market Fund | | | — | | | | — | | | | — | | | | — | | | | (882 | ) | | | (105 | ) | | | — | | | | (987 | ) |
Disciplined Equity Fund | | | 442 | | | | — | | | | — | | | | 442 | | | | (10,839,419 | ) | | | — | | | | 13,764,866 | | | | 2,925,889 | |
Dividend Capture Fund | | | — | | | | — | | | | — | | | | — | | | | (14,692,340 | ) | | | — | | | | 6,646,386 | | | | (8,045,954 | ) |
Global Select Markets Fund | | | 399,207 | | | | — | | | | — | | | | 399,207 | | | | (1,777,795 | ) | | | — | | | | 1,304,690 | | | | (73,898 | ) |
Growth Fund | | | — | | | | — | | | | 834,874 | | | | 834,874 | | | | — | | | | — | | | | 18,124,522 | | | | 18,959,396 | |
Income Equity Fund | | | 62,607 | | | | — | | | | — | | | | 62,607 | | | | (10,183,952 | ) | | | — | | | | 11,374,795 | | | | 1,253,450 | |
International Equity Fund | | | — | | | | — | | | | — | | | | — | | | | (13,851,153 | ) | | | — | | | | 45,658,146 | | | | 31,806,993 | |
Mid Corp America Fund | | | 215,398 | | | | — | | | | 3,417,740 | | | | 3,633,138 | | | | (2,200,408 | ) | | | — | | | | 44,125,497 | | | | 45,558,227 | |
Real Strategies Fund | | | — | | | | — | | | | — | | | | — | | | | (18,722,940 | ) | | | — | | | | 191,985 | | | | (18,530,955 | ) |
Rotating Markets Fund | | | — | | | | — | | | | — | | | | — | | | | (66,526 | ) | | | — | | | | (118,144 | ) | | | (184,670 | ) |
Situs Fund | | | 119,551 | | | | — | | | | — | | | | 119,551 | | | | — | | | | — | | | | 84,558,425 | | | | 84,677,976 | |
Fixed Income Securities Fund | | | — | | | | — | | | | 953,917 | | | | 953,917 | | | | — | | | | (52,126 | ) | | | 20,590,576 | | | | 21,492,367 | |
Intermediate Government Income Fund | | | 190,993 | | | | — | | | | 105,093 | | | | 296,086 | | | | — | | | | — | | | | 8,034,867 | | | | 8,330,953 | |
Mortgage Securities Fund | | | 10,258 | | | | — | | | | 203,073 | | | | 213,331 | | | | — | | | | — | | | | 6,371,302 | | | | 6,584,633 | |
Ohio Tax-Free Fund | | | 39,880 | | | | — | | | | 309,073 | | | | 348,953 | | | | — | | | | — | | | | 2,210,129 | | | | 2,559,082 | |
Short/Intermediate Fixed Income Securities Fund | | | — | | | | — | | | | 51,757 | | | | 51,757 | | | | — | | | | — | | | | 4,268,047 | | | | 4,319,804 | |
Balanced Allocation Fund | | | 1,699 | | | | — | | | | 459,073 | | | | 460,772 | | | | (1,013 | ) | | | — | | | | 1,415,263 | | | | 1,875,022 | |
Conservative Allocation Fund | | | 1,460 | | | | — | | | | 60,905 | | | | 62,365 | | | | — | | | | — | | | | 303,206 | | | | 365,571 | |
Growth Allocation Fund | | | 3,079 | | | | — | | | | 427,637 | | | | 430,716 | | | | — | | | | — | | | | 1,435,611 | | | | 1,866,327 | |
Annual Shareholder Report
158
Certain capital and qualified late year losses incurred after October 31 and within the current taxable year, are deemed to arise on the first business day of the Funds’ following taxable year. For the tax year ended December 31, 2012 the Funds deferred post October capital and late year ordinary losses as follows:
| | | | | | | | |
| Fund | | Capital
Losses | | | Late Year
Ordinary
Losses | |
Global Select Markets Fund | | $ | 963,110 | | | $ | — | |
Income Equity Fund | | | 3,170,369 | | | | — | |
International Equity Fund | | | — | | | | 55,271 | |
Real Strategies Fund | | | 564,260 | | | | 47,585 | |
Rotating Markets Fund | | | 66,435 | | | | 91 | |
Balanced Allocation Fund | | | 1,013 | | | | — | |
As of December 31, 2012, for federal income tax purposes, the following Funds had capital loss carryforwards available to offset future gains, if any, to the extent provided by the Treasury regulations:
| | | | | | | | | | | | | | | | | | | | | | | | |
| | | Expiration Year | |
| | | 2013 | | | 2014 | | | 2015 | | | 2016 | | | 2017 | | | 2018 | |
Tax-Free Money Market Fund | | $ | 5,818 | | | $ | 4,861 | | | $ | 1,434 | | | $ | 60,543 | | | $ | 55,252 | | | $ | — | |
Money Market Fund | | | 7,224 | | | | 921 | | | | 106 | | | | — | | | | — | | | | — | |
Ohio Municipal Money Market Fund | | | 25,291 | | | | 7,739 | | | | 12,350 | | | | — | | | | 193,762 | | | | 14,231 | |
Dividend Capture Fund | | | — | | | | — | | | | — | | | | — | | | | 14,692,340 | | | | — | |
Income Equity Fund | | | — | | | | — | | | | — | | | | — | | | | 6,937,588 | | | | — | |
International Equity Fund | | | — | | | | — | | | | — | | | | — | | | | 2,956,288 | | | | 3,821,239 | |
Mid Corp America Fund | | | — | | | | — | | | | — | | | | 2,200,408 | * | | | — | | | | — | |
Real Strategies Fund | | | — | | | | — | | | | — | | | | 145,084 | | | | 15,813,875 | | | | 2,136,294 | |
| * | Future utilization of these losses is limited due to merger related capital loss carryover limitations. |
During the year ended December 31, 2012, the Dividend Capture Fund, Income Equity Fund, Mid Corp America Fund, Real Strategies Fund, Rotating Markets Fund, Mortgage Securities Fund and Short/Intermediate Fixed Income Securities Fund utilized $8,053,467, $5,669,414, $342,118, $2,593,339, $3,654,675, $1,170,801 and $1,214,105, respectively, in capital loss carryforwards.
At December 31, 2012, the Tax-Free Money Market Fund, Money Market Fund and Ohio Municipal Money Market Fund had capital loss carryforwards expire in the amounts of $1,529, $3,032 and $463, respectively.
During the year ended December 31, 2012, capital loss carryfoward from the New Economy Fund (merged into the Mid Corp America Fund) expired in the amount of $17,781,917.
On December 22, 2010, the Regulated Investment Company Modernization Act of 2010 (the “Act”) was enacted, which changed various technical rules governing the tax treatment of regulated investment companies. The changes are generally effective for taxable years beginning after the date of enactment. One of the more prominent changes addresses capital loss carryforwards. Under the Act, each Fund will be permitted to carry forward capital losses incurred in taxable years beginning after the date of enactment for an unlimited period. However, any losses incurred during those future taxable years will be required to be utilized prior to the losses incurred in pre-enactment taxable years, which carry an expiration date. As a result of this ordering rule, pre-enactment capital loss carryforwards may be more likely to
expire unused. Additionally, post-enactment capital loss carryforwards will retain their character as either short-term or long-term capital losses rather than being considered all short-term as permitted under previous regulation.
Losses incurred that will be carried forward under the provisions of the Act are as follows:
| | | | | | | | |
| | | Loss Carryforward Character | |
| Fund | | Short Term | | | Long Term | |
Tax-Free Money Market Fund | | $ | 3,789 | | | $ | — | |
Money Market Fund | | | 168,889 | | | | — | |
Ohio Municipal Money Market Fund | | | 41,284 | | | | — | |
U.S. Treasury Money Market Fund | | | 882 | | | | — | |
Disciplined Equity Fund | | | 4,212,722 | | | | 6,626,697 | |
Global Select Markets Fund | | | 806,135 | | | | 8,550 | |
International Equity Fund | | | 4,290,312 | | | | 2,728,043 | |
Management of the Funds has reviewed tax positions taken in tax years that remain subject to examination by all major tax jurisdictions, including federal (i.e., the last four tax year ends and the interim tax period since then). Management believes there is no tax liability resulting from unrecognized tax benefits related to uncertain tax positions taken.
| L. | New Accounting Pronouncement |
In December 2011, the Financial Accounting Standards Board issued Accounting Standards Update (“ASU”) No. 2011-11 “Disclosures about Offsetting Assets and Liabilities” (“ASU 2011-11”). ASU 2011-11 requires disclosure of both gross and net information related to offsetting and related arrangements, enabling users of financial statements to
Annual Shareholder Report
159
Notes to Financial Statements (Continued)
understand the effect of those arrangements on the entity’s financial position. The objective of this disclosure is to facilitate comparison between those entities that prepare their financial statements on the basis of U.S. GAAP and those entities that prepare their financial statements on the basis of International Financial Reporting Standards. ASU 2011-11 is effective for fiscal years beginning on or after January 1, 2013, and interim periods within those annual periods. At this time, management is evaluating the implications of ASU 2011-11 and its impact on the financial statements has not yet been determined.
Effective February 1, 2013, the Advisor has contractually agreed to waive all or a portion of its management fee and/or reimburse certain operating expenses of the U.S. Treasury Money Market Fund to the extent necessary in order to limit the Fund’s total annual operating expenses (after fee waivers and/or expenses reimbursements, and exclusive of brokerage costs, interest, taxes and dividends, and extraordinary expenses) to not more than 0.25% and 0.50% of the Trust Shares and Class A Shares average daily net assets, respectively, through April 30, 2015.
| (3) | Investment Advisory Fee and Other Transactions with Affiliates |
Investment Advisory Fee—Huntington Asset Advisors, Inc. (the “Advisor”), a subsidiary of The Huntington National Bank (“Huntington”), serves as the Funds’ investment advisor. The Advisor receives a fee for its services, computed daily and paid monthly, based on a percentage of each Fund’s average daily net assets on a tiered basis, according to the table below:
| | | | | | | | | | | | |
| | | Tiered Annual Rate: | |
| Fund | | Up to $500 million | | | On the next $500 million | | | In Excess of $1 billion | |
Tax-Free Money Market Fund | | | 0.30 | % | | | 0.25 | % | | | 0.20 | % |
Money Market Fund | | | 0.30 | % | | | 0.25 | % | | | 0.20 | % |
Ohio Municipal Money Market Fund | | | 0.30 | % | | | 0.25 | % | | | 0.20 | % |
Disciplined Equity Fund | | | 0.60 | % | | | 0.55 | % | | | 0.50 | % |
Dividend Capture Fund | | | 0.75 | % | | | 0.70 | % | | | 0.65 | % |
Global Select Markets Fund | | | 1.00 | % | | | 0.95 | % | | | 0.90 | % |
Growth Fund | | | 0.60 | % | | | 0.55 | % | | | 0.50 | % |
Income Equity Fund | | | 0.60 | % | | | 0.55 | % | | | 0.50 | % |
International Equity Fund | | | 1.00 | % | | | 0.95 | % | | | 0.90 | % |
Mid Corp America Fund | | | 0.75 | % | | | 0.70 | % | | | 0.65 | % |
Real Strategies Fund | | | 0.75 | % | | | 0.70 | % | | | 0.65 | % |
Rotating Markets Fund | | | 0.50 | % | | | 0.45 | % | | | 0.40 | % |
Situs Fund | | | 0.75 | % | | | 0.70 | % | | | 0.65 | % |
Fixed Income Securities Fund | | | 0.50 | % | | | 0.45 | % | | | 0.40 | % |
Intermediate Government Income Fund | | | 0.50 | % | | | 0.45 | % | | | 0.40 | % |
Mortgage Securities Fund | | | 0.50 | % | | | 0.45 | % | | | 0.40 | % |
Ohio Tax-Free Fund | | | 0.50 | % | | | 0.45 | % | | | 0.40 | % |
Short/Intermediate Fixed Income Securities Fund | | | 0.50 | % | | | 0.45 | % | | | 0.40 | % |
The U.S. Treasury Money Market Fund pays the Advisor a fee of 0.20% of its average daily net assets, computed daily and paid monthly. Each of Balanced Allocation Fund, Conservative Allocation Fund and Growth Allocation Fund pays the Advisor a fee of 0.10% of its average daily net assets, computed daily and paid monthly.
Huntington and the Advisor may also pay out of their reasonable profits and other resources (including those of their affiliates) advertising, marketing, and other expenses for the benefit of the Funds.
The Tax-Free Money Market Fund, Money Market Fund, Ohio Municipal Money Market Fund and U.S. Treasury Money Market Fund are subject to a fee waiver and expense reimbursement agreement with the Advisor whereby the Advisor has agreed to waive fees or reimburse expenses in amounts necessary to maintain a minimum yield of 0.01% (0.05% for the Trust Shares and 0.00% for the Class A Shares of the U.S. Treasury Money Market Fund) and in which the Money Market Funds have agreed to repay amounts that were waived or reimbursed by the Adviser for a period up to three years after such waiver or reimbursement was made to the extent that such repayments would not cause the yield of a class to decrease below their
applicable minimum yield. Prior to November 15, 2012, the Advisor had agreed to waive fees or reimburse expenses for the U.S. Treasury Money Market Fund in amounts necessary to maintain a minimum yield of 0.00% in both share classes.
The Advisor has agreed to contractually waive all or a portion of its investment advisory fee for Disciplined Equity Fund (based on average daily net assets) to which it is otherwise entitled to receive and/or to reimburse certain operating expenses to not more than 1.20% and 1.45% of Trust Shares and Class A Shares, respectively, through April 30, 2013.
Effective September 28, 2012, the Advisor has agreed to contractually waive all or a portion of its investment advisory fee for Dividend Capture Fund (based on average daily net assets) to which it is otherwise entitled to receive and/or to reimburse certain operating expenses to not more than 0.90% and 1.15% of Trust Shares and Class A Shares, respectively, through April 30, 2015.
The Advisor has agreed to contractually waive all or a portion of its investment advisory fee for Global Select Markets Fund (based on average daily net assets) to which it is otherwise entitled to receive and/or to reimburse certain operating
Annual Shareholder Report
160
expenses to not more than 1.90% and 2.15% of Trust Shares and Class A Shares, respectively, through April 30, 2013.
The Advisor has agreed to contractually waive all or a portion of its investment advisory fee for Balanced Allocation Fund, Conservative Allocation Fund and Growth Allocation Fund (based on average daily net assets) to which it is otherwise entitled to receive and/or to reimburse certain operating expenses of Balanced Allocation Fund, Conservative Allocation Fund and Growth Allocation Fund in order to limit the total direct net annual operating expenses and acquired (underlying) fund operating expenses to not more than 1.90% of the average daily net assets of each of Balanced Allocation Fund, Conservative Allocation Fund and Growth Allocation Fund through April 30, 2013.
Amounts waived or reimbursed in the contractual period may be recouped by the Advisor within three years of the waiver and/or reimbursement. As of December 31, 2012, the following amounts have been waived or reimbursed by the Adviser and are subject to repayment by the respective Fund:
| | | | | | | | |
| Fund | | Amount
Waived or
Reimbursed | | | Expiring
Beginning
December 31, | |
Tax-Free Money Market Fund | | $ | 474,740 | | | | 2013 | |
| | | | 538,831 | | | | 2014 | |
| | | | 605,012 | | | | 2015 | |
Money Market Fund | | | 2,696,185 | | | | 2013 | |
| | | | 2,629,761 | | | | 2014 | |
| | | | 2,608,992 | | | | 2015 | |
Ohio Municipal Money Market Fund | | | 1,357,243 | | | | 2013 | |
| | | | 1,218,010 | | | | 2014 | |
| | | | 1,176,269 | | | | 2015 | |
U.S. Treasury Money Market Fund | | | 2,375,535 | | | | 2013 | |
| | | | 2,637,763 | | | | 2014 | |
| | | | 2,500,289 | | | | 2015 | |
Disciplined Equity Fund | | | 32,303 | | | | 2014 | |
| | | | 24,912 | | | | 2015 | |
Dividend Capture Fund | | | 254,226 | | | | 2015 | |
Global Select Markets Fund | | | 19,914 | | | | 2013 | |
Balanced Allocation Fund | | | 28,952 | | | | 2013 | |
| | | | 37,593 | | | | 2014 | |
| | | | 42,051 | | | | 2015 | |
Conservative Allocation Fund | | | 11,431 | | | | 2013 | |
| | | | 15,227 | | | | 2014 | |
| | | | 15,187 | | | | 2015 | |
Growth Allocation Fund | | | 40,912 | | | | 2013 | |
| | | | 41,180 | | | | 2014 | |
| | | | 46,866 | | | | 2015 | |
Administrative Fees— Effective December 1, 2012, Huntington Asset Services, Inc. (“HASI”), a wholly owned subsidiary of Huntington Bancshares, Incorporated, replaced Huntington as Administrator to the Trust. Prior to December 1, 2102 Huntington served as the Administrator and HASI as the Sub-Administrator to the Trust. The fees paid for administrative services are based on the level of average net assets of each Fund for the period.
| | |
Maximum
Administrative Fee | | Average Daily Net Assets of the Trust |
0.1822% | | On the first $4 billion |
0.1650% | | On the next $2 billion |
0.1575% | | On the next $2 billion |
0.1450% | | On assets in excess of $8 billion |
There is no minimum annual fee per fund or class of shares.
Distribution and Shareholder Services Fees—The Funds have adopted a Distribution Plan (the “Plan”) pursuant to Rule 12b-1 under the 1940 Act. Under the terms of the Plan, the Funds will compensate qualified intermediaries for distribution services in connection with Class A Shares not to exceed 0.25% of the daily net assets of each Fund’s Class A Shares. Trust Shares are not subject to Rule 12b-1 fees. Class A Shares (except for the Asset Allocation Funds) and Trust Shares are also subject to a shareholder services fee not to exceed 0.25% of the daily net assets of such shares. For the year ended December 31, 2012, Huntington and its affiliates received $5,507,486 in shareholder service fees. For the year ended December 31, 2012, Unified Financial Securities, Inc., the Funds’ distributor, received underwriter commissions of $92,117 earned on sales of Class A Shares. For the year ended December 31, 2012, the Funds paid $364,276 to affiliated broker-dealers of the Funds.
Transfer and Dividend Disbursing Agent Fees and Expense—HASI is the transfer and dividend disbursing agent for the Funds. For its services, HASI receives a yearly fixed amount per shareholder account, subject to a yearly minimum fee of $12,000 for each of the Funds. HASI is also entitled to receive additional amounts that may be activity or time-based charges, plus reimbursement for out-of-pocket expenses.
Custodian Fees—Huntington serves as custodian for each of the Funds. Brown Brothers Harriman serves as sub-custodian for each Fund’s foreign assets. Huntington and Brown Brothers Harriman receive fees based on the level of each Fund’s average daily net assets for the period, plus out-of-pocket expenses.
Compliance Services—The Trust has contracted with Huntington to provide a Chief Compliance Officer to the Trust, for which it pays Huntington $135,188 annually.
General—Certain officers of the Trust are Officers, Directors and/or Trustees of the above companies.
Trustees and Officers affiliated with the Advisor are not compensated by the Trust for their services. Each Trustee who is not an “interested person” of the Trust, as such term is defined in the 1940 Act, receives a $25,000 annual retainer plus $2,500 per regular Board meeting. The Independent Chairman of the Board receives a $40,000 annual retainer plus
Annual Shareholder Report
161
Notes to Financial Statements (Continued)
$2,500 per Board meeting. The Board or a Committee may establish ad hoc committees or sub-committees. Any Committee or sub-committee member may be compensated by the Fund for incremental work outside of the regular meeting process based on the value added to the Fund. In
addition, the Fund reimburses Trustees who are not employees of or affiliated with the Advisor for out-of-pocket expenses incurred in conjunction with attendance at meetings. For the year ended December 31, 2012, actual Trustee compensation was $292,000 in aggregate from the Trust.
Pursuant to an exemptive order issued by the Securities and Exchange Commission, the Funds may invest in certain affiliated money market funds which are managed by the Advisor. Income distributions earned from investments in these funds are recorded as income from affiliates in the accompanying financial statements. A summary of each Fund’s investment in such affiliated money market funds is set forth below:
| | | | | | | | | | | | | | | | | | | | |
| Money Market Fund | | 12/31/11
Market Value | | | Purchases | | | Sales | | | 12/31/12
Market Value | | | Income | |
Disciplined Equity Fund | | $ | 5,320,691 | | | $ | 34,772,182 | | | $ | (40,092,873 | ) | | $ | — | | | $ | 644 | |
Dividend Capture Fund | | | 1,668,276 | | | | 53,125,500 | | | | (54,793,776 | ) | | | — | | | | 386 | |
Global Select Markets Fund | | | 15,861 | | | | 30,879,547 | | | | (30,895,408 | ) | | | — | | | | 106 | |
Growth Fund | | | 7,003,037 | | | | 86,039,614 | | | | (93,042,651 | ) | | | — | | | | 533 | |
Income Equity Fund | | | 1,958,941 | | | | 20,734,201 | | | | (22,693,142 | ) | | | — | | | | 163 | |
International Equity Fund | | | 8,602,735 | | | | 59,470,894 | | | | (68,073,629 | ) | | | — | | | | 1,156 | |
Mid Corp America Fund | | | 3,584,660 | | | | 32,782,655 | | | | (36,367,315 | ) | | | — | | | | 574 | |
Real Strategies Fund | | | 1,616,330 | | | | 24,839,407 | | | | (26,455,737 | ) | | | — | | | | 298 | |
Rotating Markets Fund | | | 494,529 | | | | 12,329,877 | | | | (12,824,406 | ) | | | — | | | | 61 | |
Situs Fund | | | 2,858,167 | | | | 42,811,401 | | | | (45,669,568 | ) | | | — | | | | 420 | |
Fixed Income Securities Fund | | | 10,236,344 | | | | 75,943,601 | | | | (86,179,945 | ) | | | — | | | | 637 | |
Intermediate Government Income Fund | | | 1,933,516 | | | | 43,603,192 | | | | (45,536,708 | ) | | | — | | | | 322 | |
Mortgage Securities Fund | | | 4,172,889 | | | | 58,777,967 | | | | (62,950,856 | ) | | | — | | | | 382 | |
Short/Intermediate Fixed Income Securities Fund | | | 791,255 | | | | 92,927,743 | | | | (93,718,998 | ) | | | — | | | | 288 | |
| | | | | | | | | | | | | | | | | | | | |
| U.S. Treasury Money Market Fund | | 12/31/11
Market Value | | | Purchases | | | Sales | | | 12/31/12
Market Value | | | Income | |
Disciplined Equity Fund | | $ | — | | | $ | 11,479,186 | | | $ | (5,575,480 | ) | | $ | 5,903,706 | | | $ | 266 | |
Dividend Capture Fund | | | — | | | | 8,772,881 | | | | (5,418,738 | ) | | | 3,354,143 | | | | 154 | |
Global Select Markets Fund | | | — | | | | 2,964,902 | | | | (1,926,786 | ) | | | 1,038,116 | | | | 33 | |
Growth Fund | | | — | | | | 6,241,760 | | | | (4,619,866 | ) | | | 1,621,894 | | | | 93 | |
Income Equity Fund | | | — | | | | 17,730,506 | | | | (16,339,018 | ) | | | 1,391,488 | | | | 158 | |
International Equity Fund | | | — | | | | 24,742,883 | | | | (14,025,209 | ) | | | 10,717,674 | | | | 748 | |
Mid Corp America Fund | | | — | | | | 17,282,683 | | | | (13,751,161 | ) | | | 3,531,522 | | | | 192 | |
Real Strategies Fund | | | — | | | | 8,692,335 | | | | (3,296,703 | ) | | | 5,395,632 | | | | 220 | |
Rotating Markets Fund | | | — | | | | 4,836,711 | | | | (3,451,023 | ) | | | 1,385,688 | | | | 68 | |
Situs Fund | | | — | | | | 11,100,479 | | | | (7,511,551 | ) | | | 3,588,928 | | | | 280 | |
Fixed Income Securities Fund | | | — | | | | 15,695,923 | | | | (10,396,698 | ) | | | 5,299,225 | | | | 216 | |
Intermediate Government Income Fund | | | — | | | | 9,731,845 | | | | (7,124,756 | ) | | | 2,607,089 | | | | 140 | |
Mortgage Securities Fund | | | — | | | | 14,053,765 | | | | (10,113,725 | ) | | | 3,940,040 | | | | 121 | |
Short/Intermediate Fixed Income Securities Fund | | | — | | | | 6,541,673 | | | | (4,390,890 | ) | | | 2,150,783 | | | | 56 | |
Additionally, Balanced Allocation Fund, Conservative Allocation Fund and Growth Allocation Fund invest in other Funds within the Trust. A summary of these investments in affiliated funds is set forth below:
| | | | | | | | | | | | | | | | | | | | |
| Balanced Allocation Fund | | 12/31/11
Market Value | | | Purchases | | | Sales | | | 12/31/12
Market Value | | | Income | |
Money Market Fund | | $ | 392,902 | | | $ | 4,270,476 | | | $ | (4,663,378 | ) | | $ | — | | | $ | 21 | |
U.S. Treasury Money Market Fund | | | — | | | | 1,297,801 | | | | (1,068,309 | ) | | | 229,492 | | | | 13 | |
Disciplined Equity Fund | | | — | | | | 1,958,716 | | | | (885,893 | ) | | | 1,070,033 | | | | 10,638 | |
Dividend Capture Fund | | | 1,180,570 | | | | 99,683 | | | | (787,215 | ) | | | 569,908 | | | | 25,005 | |
Global Select Markets Fund | | | 579,943 | | | | 1,240,012 | | | | (1,487,589 | ) | | | 394,114 | | | | 1,620 | |
Growth Fund | | | 3,469,274 | | | | 3,201,289 | | | | (4,596,436 | ) | | | 2,160,587 | | | | 16,829 | |
Income Equity Fund | | | 3,231,359 | | | | 524,818 | | | | (2,017,876 | ) | | | 1,986,378 | | | | 76,288 | |
International Equity Fund | | | 2,501,390 | | | | 814,394 | | | | (1,588,437 | ) | | | 2,047,158 | | | | 33,529 | |
Mid Corp America Fund | | | 1,127,411 | | | | 1,858,642 | | | | (2,549,437 | ) | | | 970,450 | | | | 1,626 | |
Situs Fund | | | 1,984,456 | | | | 974,950 | | | | (2,256,358 | ) | | | 975,336 | | | | 8,436 | |
Fixed Income Securities Fund | | | 4,252,688 | | | | 834,927 | | | | (2,330,054 | ) | | | 2,772,839 | | | | 81,809 | |
Intermediate Government Income Fund | | | 1,985,449 | | | | 387,809 | | | | (1,071,202 | ) | | | 1,293,512 | | | | 29,545 | |
Mortgage Securities Fund | | | 1,137,097 | | | | 197,149 | | | | (595,117 | ) | | | 739,706 | | | | 20,692 | |
Short/Intermediate Fixed Income Securities Fund | | | 1,967,727 | | | | 365,828 | | | | (1,053,095 | ) | | | 1,291,306 | | | | 17,909 | |
Huntington US Equity Rotation Strategy ETF | | | — | | | | 1,761,530 | | | | (39,923 | ) | | | 1,709,472 | | | | 4,383 | |
Annual Shareholder Report
162
| | | | | | | | | | | | | | | | | | | | |
| Conservative Allocation Fund | | 12/31/11
Market Value | | | Purchases | | | Sales | | | 12/31/12
Market Value | | | Income | |
Money Market Fund | | $ | 166,086 | | | $ | 2,619,446 | | | $ | (2,785,532 | ) | | $ | — | | | $ | 10 | |
U.S. Treasury Money Market Fund | | | — | | | | 189,557 | | | | (173,645 | ) | | | 15,912 | | | | 2 | |
Disciplined Equity Fund | | | — | | | | 394,138 | | | | (280,124 | ) | | | 109,900 | | | | 1,093 | |
Dividend Capture Fund | | | 248,290 | | | | 30,084 | | | | (236,745 | ) | | | 58,540 | | | | 3,085 | |
Global Select Markets Fund | | | 122,014 | | | | 19,525 | | | | (114,237 | ) | | | 40,486 | | | | 166 | |
Growth Fund | | | 730,551 | | | | 140,198 | | | | (722,207 | ) | | | 221,908 | | | | 1,679 | |
Income Equity Fund | | | 679,101 | | | | 126,937 | | | | (655,346 | ) | | | 204,022 | | | | 9,579 | |
International Equity Fund | | | 525,195 | | | | 128,400 | | | | (506,878 | ) | | | 210,329 | | | | 3,445 | |
Mid Corp America Fund | | | 237,016 | | | | 56,148 | | | | (255,842 | ) | | | 99,676 | | | | 168 | |
Situs Fund | | | 417,503 | | | | 60,247 | | | | (440,939 | ) | | | 100,194 | | | | 883 | |
Fixed Income Securities Fund | | | 5,279,315 | | | | 682,143 | | | | (4,332,967 | ) | | | 1,638,243 | | | | 67,349 | |
Intermediate Government Income Fund | | | 2,464,781 | | | | 331,476 | | | | (2,021,277 | ) | | | 764,224 | | | | 24,814 | |
Mortgage Securities Fund | | | 1,411,773 | | | | 163,512 | | | | (1,144,442 | ) | | | 437,018 | | | | 16,115 | |
Short/Intermediate Fixed Income Securities Fund | | | 2,442,796 | | | | 304,662 | | | | (1,997,841 | ) | | | 762,913 | | | | 14,943 | |
Huntington US Equity Rotation Strategy ETF | | | — | | | | 193,596 | | | | (20,407 | ) | | | 175,592 | | | | 461 | |
| | | | | | | | | | | | | | | | | | | | |
| Growth Allocation Fund | | 12/31/11
Market Value | | | Purchases | | | Sales | | | 12/31/12
Market Value | | | Income | |
Money Market Fund | | $ | 242,736 | | | $ | 3,571,190 | | | $ | (3,813,926 | ) | | $ | — | | | $ | 18 | |
U.S. Treasury Money Market Fund | | | — | | | | 1,140,725 | | | | (1,009,488 | ) | | | 131,237 | | | | 14 | |
Disciplined Equity Fund | | | — | | | | 2,196,982 | | | | (1,181,072 | ) | | | 1,017,758 | | | | 10,118 | |
Dividend Capture Fund | | | 1,215,602 | | | | 120,751 | | | | (875,408 | ) | | | 542,030 | | | | 23,548 | |
Global Select Markets Fund | | | 596,904 | | | | 146,749 | | | | (436,732 | ) | | | 374,815 | | | | 1,540 | |
Growth Fund | | | 3,571,521 | | | | 613,702 | | | | (2,426,454 | ) | | | 2,055,026 | | | | 15,649 | |
Income Equity Fund | | | 3,326,710 | | | | 597,840 | | | | (2,289,679 | ) | | | 1,889,296 | | | | 70,770 | |
International Equity Fund | | | 2,573,980 | | | | 772,536 | | | | (1,729,856 | ) | | | 1,946,752 | | | | 31,885 | |
Mid Corp America Fund | | | 1,160,455 | | | | 249,652 | | | | (911,618 | ) | | | 923,021 | | | | 1,540 | |
Situs Fund | | | 2,042,634 | | | | 235,986 | | | | (1,683,639 | ) | | | 927,573 | | | | 7,935 | |
Fixed Income Securities Fund | | | 1,315,105 | | | | 372,287 | | | | (896,931 | ) | | | 794,425 | | | | 23,357 | |
Intermediate Government Income Fund | | | 613,972 | | | | 175,814 | | | | (416,567 | ) | | | 370,597 | | | | 8,460 | |
Mortgage Securities Fund | | | 351,592 | | | | 94,553 | | | | (234,533 | ) | | | 211,931 | | | | 5,836 | |
Short/Intermediate Fixed Income Securities Fund | | | 608,465 | | | | 173,979 | | | | (415,871 | ) | | | 369,966 | | | | 5,102 | |
Huntington US Equity Rotation Strategy ETF | | | 608,465 | | | | 1,657,938 | | | | (33,987 | ) | | | 1,625,841 | | | | 4,111 | |
Affiliated issuers, as defined under the Investment Company Act of 1940, are those in which a Fund’s holdings of an issuer represent 5% or more of the outstanding voting securities of the issuer. A summary of each of Real Strategies Fund’s holdings in the securities of such issuers is set forth below:
| | | | | | | | | | | | | | | | | | | | | | | | |
| | | 12/31/11
Market Value | | | Change in
unrealized
appreciation
(depreciation) | | | Purchases | | | Sales | | | 12/31/12
Market Value | | | Income | |
Discount Retail Portfolio II DST | | $ | 958,307 | | | $ | (73,835 | ) | | $ | — | | | $ | — | | | $ | 884,472 | | | $ | 78,439 | |
New York Power DST | | | 949,088 | | | | (86,834 | ) | | | — | | | | — | | | | 862,254 | | | | 69,554 | |
Scotts Gahanna LLC* | | | 1,428,252 | | | | (284,448 | ) | | | — | | | | — | | | | 1,143,804 | | | | 92,136 | |
| * | Controlled affiliate in which the Real Stategies Fund owns 25% or more of the outstanding voting securities. |
| (5) | Balanced Allocation Fund, Conservative Allocation Fund and Growth Allocation Fund Structure |
Balanced Allocation Fund, Conservative Allocation Fund and Growth Allocation Fund (“Investing Funds”), in accordance with their prospectus, seek to achieve their investment objectives by investing in other investment companies
(“Underlying Funds”) with similar investment objectives. As a result, investors in the Investing Funds incur expenses of both the Investing Funds and Underlying Funds, including transaction costs related to the purchases and sales of Underlying Fund shares.
Annual Shareholder Report
163
Notes to Financial Statements (Continued)
| (6) | Investment Transactions |
Purchases and sales of investments, excluding short-term securities, for the year ended December 31, 2012, were as follows:
| | | | | | | | |
| Fund | | Purchases | | | Sales | |
Disciplined Equity | | $ | 22,538,063 | | | $ | 7,411,727 | |
Dividend Capture Fund | | | 219,949,652 | | | | 184,400,551 | |
Global Select Markets Fund | | | 39,235,326 | | | | 43,486,780 | |
Growth Fund | | | 177,457,680 | | | | 175,444,289 | |
Income Equity Fund | | | 265,396,168 | | | | 254,255,665 | |
International Equity Fund | | | 66,210,894 | | | | 71,973,005 | |
Mid Corp America Fund* | | | 23,564,144 | | | | 47,441,220 | |
Real Strategies Fund | | | 27,652,739 | | | | 30,564,942 | |
Rotating Markets Fund | | | 41,402,152 | | | | 41,323,257 | |
Situs Fund | | | 21,579,568 | | | | 31,402,279 | |
Fixed Income Securities Fund | | | 105,096,883 | | | | 89,723,171 | |
Intermediate Government Income Fund | | | 26,681,792 | | | | 44,223,637 | |
Mortgage Securities Fund | | | 26,445,829 | | | | 56,787,272 | |
Ohio Tax-Free Fund | | | 27,676,776 | | | | 26,128,468 | |
Short/Intermediate Fixed Income Securities Fund | | | 49,525,922 | | | | 76,956,985 | |
Balanced Allocation Fund | | | 14,786,237 | | | | 25,645,553 | |
Conservative Allocation Fund | | | 2,709,465 | | | | 13,661,189 | |
Growth Allocation Fund | | | 7,811,813 | | | | 17,919,775 | |
| * | Excludes $15,657,675 and $3,471,643 purchases and sales, respectively, related to the securities held in the New Economy Fund prior to the merger. |
Purchases and sales of long-term U.S. government securities, for the year ended December 31, 2012, were as follows:
| | | | | | | | |
| Fund | | Purchases | | | Sales | |
Fixed Income Securities Fund | | $ | 31,804,883 | | | $ | 36,309,357 | |
Intermediate Government Income Fund | | | 17,499,272 | | | | 42,223,637 | |
Mortgage Securities Fund | | | 23,267,017 | | | | 51,349,740 | |
Short/Intermediate Fixed Income Securities Fund | | | 1,501,245 | | | | 31,651,076 | |
| (7) | Concentration of Credit Risk |
Since each of Ohio Municipal Money Market Fund and Ohio Tax-Free Fund invest a substantial portion of their assets in issuers located in the state of Ohio, they will be more susceptible to factors adversely affecting issuers of Ohio than would be a comparable tax-exempt mutual fund that invests nationally. In order to reduce the credit risk associated with such factors, at December 31, 2012, the securities in the portfolio of investments are backed by letters of credit or bond insurance from various financial institutions and financial guaranty assurance agencies, as indicated on each Fund’s Portfolio of Investments.
| (8) | Foreign Investment Risk |
Compared with investing in the United States, investing in foreign markets involves a greater degree and variety of risk. Investors in international or foreign markets may face delayed settlements, currency controls and adverse economic developments as well as higher overall transaction costs. In addition, fluctuations in the U.S. dollar’s value versus other currencies may erode or reverse gains from investments denominated in foreign currencies or widen losses. Foreign governments may expropriate assets, imposed capital or currency controls, impose punitive taxes, impose limits on ownership or nationalize a company or industry. Any of these actions could have severe effect on security prices and impair the Fund’s ability to bring its capital or income back to the U.S. Exchange rate fluctuations also may impair an issuer’s ability to repay U.S. dollar denominated debt, thereby increasing credit risk of such debt. Finally, the value of foreign securities may be affected by incomplete, less frequent or inaccurate financial information about their issuers, social upheavals or political actions ranging from tax code changes to government collapse. Foreign companies may also receive less coverage than U.S. companies by market analysts, and financial reporting standards or regulatory requirements may not be comparable to those applicable to U.S. companies.
Annual Shareholder Report
164
Notes to Financial Statements (Continued)
The Trust participates in a short-term credit agreement (“Line of Credit”) with Citibank, N.A. (“Citi”). Under the terms of the agreement, the Trust may borrow up to $20 million. The purpose of the agreement is to meet temporary or emergency cash needs, including redemption requests that might otherwise require the untimely disposition of securities. Citi receives an annual facility fee of 0.10% on $20 million for providing the Line of Credit. Each fund in the Trust pays a pro-rata portion of this facility fee plus any interest on amounts borrowed. For the year ended December 31, 2012, the following Funds had borrowings under this Line of Credit.
| | | | | | | | | | | | | | | | | | | | |
| Fund | | Average
Loan Balance | | | Weighted
Average
Interest Rate | | | Number of
Days
Outstanding* | | | Interest
Expense
Incurred | | | Maximum
Loan
Outstanding | |
Dividend Capture Fund | | $ | 105,099 | | | | 1.41 | % | | | 2 | | | $ | 4 | | | $ | 105,099 | |
Global Select Markets Fund | | | 20,359 | | | | 1.41 | % | | | 2 | | | | 1 | | | | 20,359 | |
Growth Fund | | | 4,000,000 | | | | 1.51 | % | | | 5 | | | | 841 | | | | 4,000,000 | |
International Equity Fund | | | 78,754 | | | | 1.41 | % | | | 5 | | | | 10 | | | | 195,814 | |
Mid Corp America Fund | | | 3,534,841 | | | | 1.41 | % | | | 5 | | | | 686 | | | | 5,774,922 | |
Real Strategies Fund | | | 1,447,146 | | | | 1.41 | % | | | 2 | | | | 56 | | | | 1,447,146 | |
Rotating Markets Fund | | | 128,229 | | | | 1.41 | % | | | 5 | | | | 21 | | | | 211,302 | |
Situs Fund | | | 2,297,993 | | | | 1.44 | % | | | 4 | | | | 368 | | | | 3,191,970 | |
Intermediate Government Income Fund | | | 16,373 | | | | 1.41 | % | | | 2 | | | | 1 | | | | 16,373 | |
Mortgage Securities Fund | | | 38,787 | | | | 1.41 | % | | | 2 | | | | 2 | | | | 38,787 | |
Ohio Tax-Free Fund | | | 767,086 | | | | 1.41 | % | | | 2 | | | | 30 | | | | 767,086 | |
Short/Intermediate Fixed Income Securities Fund | | | 690,636 | | | | 1.41 | % | | | 2 | | | | 86 | | | | 1,190,636 | |
Growth Allocation Fund | | | 694 | | | | 1.41 | % | | | 2 | | | | — | ** | | | 694 | |
| * | Number of Days Outstanding represents the total days during the year ended December 31, 2012 that each Fund utilized the Line of Credit. |
| ** | Amount is less than $0.005. |
As of December 31, 2012, the Funds had no outstanding borrowings under this Line of Credit.
| (10) | Other Tax Information (unaudited) |
For the year ended December 31, 2012, certain dividends paid by the Funds may be subject to a maximum tax rate of 15% as provided for by the Jobs and Growth Tax Relief Reconciliation Act of 2003. The Funds intend to designate the maximum amount allowable as taxed at a maximum rate of 15%. Complete information will be reported in conjunction with your 2012 Form 1099-DIV.
For the year ended December 31, 2012, the following Funds paid qualified dividend income:
| | | | |
| Fund | | Qualified
Dividend
Income | |
Disciplined Equity | | | 100.0 | % |
Dividend Capture Fund | | | 62.8 | % |
Global Select Markets Fund | | | 100.0 | % |
Growth Fund | | | 100.0 | % |
Income Equity Fund | | | 79.2 | % |
International Equity Fund | | | 97.3 | % |
Mid Corp America Fund | | | 100.0 | % |
Real Strategies Fund | | | 88.0 | % |
Rotating Markets Fund | | | 88.8 | % |
Situs Fund | | | 100.0 | % |
Mortgage Securities Fund | | | 7.0 | % |
Balanced Allocation Fund | | | 29.1 | % |
Conservative Allocation Fund | | | 9.1 | % |
Growth Allocation Fund | | | 32.9 | % |
For the taxable year ended December 31, 2012, the following percentage of ordinary income dividends paid by the Funds qualify for the dividends received deduction available to corporations:
| | | | |
| Fund | | Dividends
Received
Deduction | |
Disciplined Equity | | | 100.0 | % |
Dividend Capture Fund | | | 93.8 | % |
Global Select Markets Fund | | | 100.0 | % |
Growth Fund | | | 100.0 | % |
Income Equity Fund | | | 91.8 | % |
International Equity Fund | | | 100.0 | % |
Mid Corp America Fund | | | 100.0 | % |
Real Strategies Fund | | | 100.0 | % |
Rotating Markets Fund | | | 89.5 | % |
Situs Fund | | | 100.0 | % |
Fixed Income Securities Fund | | | 3.3 | % |
Mortgage Securities Fund | | | 15.3 | % |
Balanced Allocation Fund | | | 46.0 | % |
Conservative Allocation Fund | | | 27.1 | % |
Growth Allocation Fund | | | 51.2 | % |
Annual Shareholder Report
165
Notes to Financial Statements (Continued)
For the year ended December 31, 2012, certain dividends paid by the Funds may be subject to a maximum tax rate of 15%, as provided for by the Jobs and Growth Tax Relief Reconciliation Act of 2003. The following Funds designated the following percentage of ordinary dividends paid as qualified interest income distribution:
| | | | |
| Fund | | Qualified
Interest
Income | |
Money Market Fund | | | 100.0 | % |
U.S. Treasury Money Market Fund | | | 100.0 | % |
Fixed Income Securities Fund | | | 100.0 | % |
Intermediate Government Income Fund | | | 99.2 | % |
Mortgage Securities Fund | | | 100.0 | % |
Short/Intermediate Fixed Income Securities Fund | | | 100.0 | % |
Balanced Allocation Fund | | | 44.1 | % |
Conservative Allocation Fund | | | 84.9 | % |
Growth Allocation Fund | | | 19.4 | % |
The Funds designate the following amounts as long-term capital gains distributions. The amounts designated may not agree with long term capital gains in the tax character of distribution table due to utilization of earnings and profits distributed to shareholders on redemption of shares.
| | | | |
| Fund | | Long Term
Capital Gains
Paid Amount | |
Growth Fund | | $ | 6,218,088 | |
Mid Corp America Fund | | | 18,816,596 | |
Rotating Markets Fund | | | 5,160,037 | |
Situs Fund | | | 5,252,780 | |
Fixed Income Securities Fund | | | 2,353,712 | |
Intermediate Government Income Fund | | | 125,367 | |
Mortgage Securities Fund | | | 523,315 | |
Ohio Tax-Free Fund | | | 891,712 | |
Balanced Allocation Fund | | | 1,290,511 | |
Conservative Allocation Fund | | | 757,933 | |
Growth Allocation Fund | | | 1,459,352 | |
The Funds designated the following amounts as short term capital gain distributions:
| | | | |
| Fund | | Short Term
Capital Gains
Paid Amount | |
Mid Corp America Fund | | $ | 66,663 | |
Situs Fund | | | 1,606,375 | |
Fixed Income Securities Fund | | | 546,696 | |
Ohio Tax-Free Fund | | | 202,643 | |
Balanced Allocation Fund | | | 343,506 | |
Conservative Allocation Fund | | | 101,043 | |
Growth Allocation Fund | | | 226,251 | |
The following funds intend to elect to pass through to shareholders the income tax credit for taxes paid to foreign countries. Foreign source income and foreign tax expense per outstanding shares on December 31, 2012 are as follows:
| | | | | | |
| Fund | | Foreign
Source
Income | | Foreign
Tax
Expense | |
Global Select Markets Fund | | 0.22 | | | 0.01 | |
International Equity Fund | | 0.29 | | | 0.03 | |
The pass-through of the foreign tax credit will only affect those persons who are shareholders on the dividend record date in December 2012. These shareholders will receive more detailed information along with their 2012 Form 1099-DIV.
Annual Shareholder Report
166
Report of Independent Registered Public Accounting Firm
The Board of Trustees and Shareholders of The Huntington Funds:
We have audited the accompanying statements of assets and liabilities of the Huntington Tax-Free Money Fund, Huntington Money Market Fund, Huntington Ohio Municipal Money Market Fund, Huntington U.S. Treasury Money Market Fund, Huntington Disciplined Equity Fund, Huntington Dividend Capture Fund, Huntington Global Select Markets Fund, Huntington Growth Fund, Huntington Income Equity Fund, Huntington International Equity Fund, Huntington Mid Corp America Fund, Huntington Real Strategies Fund, Huntington Rotating Markets Fund, Huntington Situs Fund, Huntington Fixed Income Securities Fund, Huntington Intermediate Government Income Fund, Huntington Mortgage Securities Fund, Huntington Ohio Tax-Free Fund, Huntington Short/Intermediate Fixed Income Securities Fund, Huntington Balanced Allocation Fund, Huntington Conservative Allocation Fund, and Huntington Growth Allocation Fund (twenty-two of the portfolios constituting The Huntington Funds, collectively referred to as the “Funds”), including the portfolios of investments, as of December 31, 2012 and the related statements of operations for the year then ended, and the statements of changes in net assets and the financial highlights for each of the periods indicated therein. These financial statements and financial highlights are the responsibility of the Funds’ management. Our responsibility is to express an opinion on these financial statements and financial highlights based on our audits.
We conducted our audits in accordance with the standards of the Public Company Accounting Oversight Board (United States). Those standards require that we plan and perform the audits to obtain reasonable assurance about whether the financial statements and financial highlights are free of material misstatement. We were not engaged to perform an audit of the Funds’ internal control over financial reporting. Our audits included
consideration of internal control over financial reporting as a basis for designing audit procedures that are appropriate in the circumstances, but not for the purpose of expressing an opinion on the effectiveness of the Funds’ internal control over financial reporting. Accordingly, we express no such opinion. An audit also includes examining, on a test basis, evidence supporting the amounts and disclosures in the financial statements and financial highlights, assessing the accounting principles used and significant estimates made by management, and evaluating the overall financial statement presentation. Our procedures included confirmation of securities owned as of December 31, 2012, by correspondence with the custodians and brokers or by other appropriate auditing procedures where replies from brokers were not received. We believe that our audits provide a reasonable basis for our opinion.
In our opinion, the financial statements and financial highlights referred to above present fairly, in all material respects, the financial position of each of the Huntington Funds referred to above at December 31, 2012, the results of their operations for the year then ended, and the changes in their net assets and the financial highlights for each of the periods indicated therein, in conformity with U.S. generally accepted accounting principles.

Columbus, Ohio
February 28, 2013
Annual Shareholder Report
167
Board of Trustees and Trust Officers
The following tables give information about Independent Trustees (Trustees who are not “interested persons” of the Trust, as defined in the 1940 Act), Interested Trustees (Trustees who are “interested persons” of the Trust, as defined in the 1940 Act) and the senior officers of the Trust. Each Trustee oversees all portfolios of the Trust and serves for an indefinite term (subject to mandatory retirement provisions). Unless otherwise noted, the business address of each person listed below is 2960 North Meridian Street, Suite 300, Attention: Huntington Trust Officer, Indianapolis, IN 46208. Unless otherwise noted, each officer is elected annually. The Huntington Funds consists of 36 portfolios. Each Trustee serves as Trustee for all portfolios of The Huntington Funds. The Funds’ Statement of Additional Information includes additional information about The Huntington Funds’ Trustees and is available, without charge and upon request, by calling 1-800-253-0412.
Interested Trustees’ Background
| | |
Name Age Positions Held with Trust Date Service Began | | Principal Occupation(s) for Past Five Years, Previous Position(s) and Other Directorships Held |
B. Randolph Bateman* Age: 63 TRUSTEE Began Serving: February 2008 | | Principal Occupations: President and Chief Investment Officer, Huntington Asset Advisors, Inc. (May 2001 to present); Chief Investment Officer, The Huntington National Bank (October 2000 to present). Previous Positions: Senior Vice President, Star Bank (June 1988 to October 2000). Other Directorships Held: Board Member, The Huntington Strategy Shares. |
| * | B. Randolph Bateman has been deemed an Interested Trustee due to the positions he holds with The Huntington National Bank and its affiliates. |
Independent Trustees’ Background
| | |
Name Age Positions Held with Trust Date Service Began | | Principal Occupation(s) for Past Five Years, Previous Position(s) and Other Directorships Held |
David S. Schoedinger* Age: 70 CHAIRMAN OF THE BOARD and TRUSTEE Began serving: May 1990 | | Principal Occupation: Chairman of the Board and Funeral Director, Schoedinger Funeral Service (1965 to present); CEO, Schoedinger Financial Services, Inc. (1987 to present). Other Directorships Held: Board Member, The Huntington Strategy Shares. |
Eddie R. Munson Age: 62 TRUSTEE Began serving: June 2012 | | Principal Occupation: Retired (September 2006-present). Previous Positions: Certified Public Accountant, KPMG LLP (June 1972-September 2006) Other Directorships Held: Board Member, The Huntington Strategy Shares; Board Member, Bearingpoint (2006-2008); Board Member, United American Healthcare (September 2006-June 2008); Board Member, Caraco (June 2011-December 2011). |
Tadd C. Seitz Age: 71 TRUSTEE Began serving: June 2006 | | Principal Occupation: Retired (July 1996-present); Board advisor and private investor (July 1996-present). Previous Positions: Chairman and Chief Executive Officer, The Scotts-Miracle Gro Company (June 1983-June 1996); Chief Operating Officer The Scotts Company (1982-1983); General Manager W. Atlee Burpee Company (1980-1982). Other Directorships Held: Board Member, The Huntington Strategy Shares; West Point Products, Shade Tree Systems and Cold Jet (both private companies) and Chairman of Central Benefits, a mutual insurance company. |
Mark D. Shary Age: 52 TRUSTEE Began serving: June 2006 | | Principal Occupations: Private investor (2007 to present). Previous Position: Chief Executive Officer and President, BestTransport.com, Inc. (2003 to 2007); President, Bostech Corporation (2000 to 2002). Other Directorships Held: Board Member, The Huntington Strategy Shares. |
Thomas J. Westerfield Age: 57 TRUSTEE Began serving: January 2001 | | Principal Occupation: Of Counsel, Dinsmore & Shohl LLP (law firm)
(August 2005 to present). Previous Position: Of Counsel, Cors & Bassett LLC (law firm) (1993 – 2005). Other Directorships Held: Board Member, The Huntington Strategy Shares. |
Annual Shareholder Report
168
| | |
Name Age Positions Held with Trust Date Service Began | | Principal Occupation(s) for Past Five Years, Previous Position(s) and Other Directorships Held |
William H. Zimmer, III Age: 59 TRUSTEE Began Serving: December 2006 | | Principal Occupation: Chief Executive Officer, Cintel Federal Credit Union (January 2011 to present). Previous Positions: Consultant, WHZIII, LLC (March 2009 to December 2010); Assistant Treasurer, Dana Holding Corp. (September 2006 to February 2009) (manufacturing); Vice President and Manager, Global Treasury Management, National City Bank (January 2004 to March 2006); Vice President, Treasury Management Operations, Provident Bank (June 2003 to January 2004); Financial Consultant (April 2001 to June 2003). Other Directorships Held: Board Member, The Huntington Strategy Shares. |
| * | David S. Schoedinger became Chairman of the Funds on April 30, 2003. |
Officers
| | |
Name Age Address Positions Held with Trust Date Service Began | | Principal Occupation(s) and Previous Positions |
Joseph L. Rezabek Age: 44 PRESIDENT Began Serving: February 2013 | | Principal Occupations: President, HASI (March 2012 to present); Executive Vice President, The Huntington National Bank (March 2012 to present). Previous Positions: Managing Director, Citi (2006-2012), Chief Operating Officer, State Street Europe (1999-2006) |
R. Jeffrey Young Age: 48 CHIEF EXECUTIVE OFFICER Began Serving: February 2010 | | Principal Occupations: Senior Vice President, HASI (January 2010 to present); Chairman of the Board, Valued Advisers Trust (June 2010 to present); Chief Executive Officer and President, Valued Advisers Trust (January 2010 to present); President and Chief Executive Officer, Dreman Contrarian Funds (March 2011 to present); Chief Executive Officer, The Huntington Strategy Shares (November 2010 to present). Previous Positions: Independent Chair, Valued Advisers Trust (August 2008-Janaury 2010); Managing Director, Chief Operating Officer, WealthStone (2007 to 2009); Senior Vice President, Operations, BISYS Fund Services (2006 to 2007); Senior Vice President/Vice President, Client Services, BISYS Fund Services (1994 to 2006). |
Matthew J. Miller Age: 36 VICE PRESIDENT Began Serving: February 2010 | | Principal Occupations: Vice President, Relationship Management, HASI (2008 to present). Previous Position: Vice President, Transfer Agency Operations, HASI (2002 to 2008). |
David R. Carson Age: 54 CHIEF COMPLIANCE OFFICER and ANTI-MONEY LAUNDERING OFFICER Began Serving: September 2005 | | Principal Occupations: Chief Compliance Officer and Anti-Money Laundering Officer of the Huntington Funds (September 2005 to present) and the Huntington Strategy Shares (November 2010 to present). Previous Positions: Treasurer and Assistant Treasurer of The Huntington Funds, Huntington Asset Advisors, Inc. (February 2002 to February 2005); Vice President and Private Financial Capital Group Marketing Manager, The Huntington National Bank (June 2001 to September 2005); Trust Officer, Firstar Bank (October 1982 to February 2001). |
Robert W. Silva Age: 46 TREASURER Began Serving: November 2010 | | Principal Occupation: Senior Vice President, Financial Administration, HASI; Treasurer, Dreman Contrarian Funds (March 2011 – present); Chief Financial Officer and Treasurer, Unified Series Trust (June 2011 to present); Chief Financial Officer and Treasurer, The Huntington Strategy Shares (November 2010 to present). Previous Positions: Senior Vice President, Citi Fund Services Ohio, Inc., (September 2007 to September 2010) |
Jay S. Fitton Age: 43 SECRETARY Began Serving: February 2012 | | Principal Occupations: Vice President of Legal Administration for HASI (November 2011 to present). Previous Positions: Vice President and Senior Counsel, J.P. Morgan Chase (February 2007-April 2007). |
Annual Shareholder Report
169
Investment Contract Review Disclosure
BOARD OF TRUSTEES’ CONSIDERATION OF INVESTMENT ADVISORY AGREEMENTS FOR THE HUNTINGTON FUNDS (the “Funds”)
The Board of Trustees is responsible for determining whether to approve the Funds’ investment advisory agreements. At a meeting held on August 9, 2012, the Board unanimously approved the investment advisory agreements between Huntington Asset Advisors, Inc. (the “Advisor”) and the Funds (the “Advisory Agreements”). Pursuant to the Advisory Agreements between the Advisor and the Funds, the Advisor provides advisory services to the Funds.
During the review process, the Board received assistance and advice from, and met separately with, independent legal counsel. In approving each of the Advisory Agreements, the Board, including a majority of the independent Trustees, considered many factors, the most significant of which were: (1) the nature of the services provided to the Funds by the Advisor in relation to the advisory fees; (2) the individual performance of the Funds; (3) the Advisor’s costs and the profits realized through providing the Funds with advisory services; (4) whether the Advisor has realized or may realize economies of scale in providing services to the Funds and if these economies are shared with the Funds; and (5) a comparison of the fees and performance of comparable funds.
Nature, Extent and Quality of Services in Relation to the Advisory Fees—In considering the nature, extent and quality of the services provided by the Advisor, the Board reviewed information relating to the Advisor’s operations and personnel. Among other things, the Advisor provided descriptions of its organizational and management structure, biographical information on its supervisory and portfolio management staff on a fund-by-fund basis, and financial information. The Advisor also provided a presentation of its past and current initiatives. The Trustees also took into account the financial condition of the Advisor with respect to its ability to provide the services required under the Advisory Agreements. The Board determined that the nature, extent and quality of the services provided by the Advisor, in relation to the advisory fees, were acceptable.
Individual Performance of the Funds—The Board reviewed the Funds’ short-term and long-term performance records and the Advisor’s management styles in relation to comparable funds and appropriate benchmarks. The Board noted that it reviews detailed information about the Funds’ performance on a quarterly basis. The Board also reviewed various comparative data for each of the Funds provided to them in connection with their consideration of the renewal of the Advisory Agreements, including, among other information, each Fund’s performance compared to similar funds based on information provided by Lipper Inc. (“Lipper”) for the one-, three-, and five-year and since-inception periods, as applicable, ending March 31, 2012, as well as each Fund’s performance compared to its benchmark index for the one-, three-, five-, and ten-year and since-inception periods, as applicable, ending June 30, 2012.
Advisor’s Costs and the Profits Realized Through Providing the Funds With Advisory Services— In considering the reasonableness of the advisory fees, the Board reviewed information provided by the Advisor setting forth all revenues and other benefits, both direct and indirect, received by the Advisor and its affiliates attributable to managing each of the Funds individually, the cost of providing such services and the resulting profitability to the Advisor and its affiliates from these relationships. The Board also took into consideration the Advisor’s agreement with the Trust with respect to the Huntington Growth Allocation Fund, the Huntington Balanced Allocation Fund and the Huntington Conservative Allocation Fund (the “Allocation Funds”), whereby the Advisor agreed to waive all or a portion of its advisory fee in order to limit each Allocation Fund’s total annual fund operating expenses for the period ending April 30, 2013. The Board also considered the Advisor’s agreement with the Trust with respect to the Disciplined Equity Fund and the Global Select Markets Fund, whereby the Advisor agreed to waive all or a portion of its advisory fee in order to limit the Fund’s total annual fund operation expenses for the period ending April 30, 2013. In addition, the Board considered the Advisor’s agreement with the four money market funds, whereby the Advisor agreed to waive all or a portion of its investment advisory fee and/or reimburse certain operating expenses of each money market fund to the extent necessary to ensure that each money market fund maintains a positive yield of at least 0.01%. The Trustees determined that the profitability of the Advisor was acceptable in relation to the nature and quality of services provided to the Funds.
Annual Shareholder Report
170
Economies of Scale in Providing Services to the Funds and Whether These Economies Are Shared With the Funds—The Board also considered the effect of the Funds’ growth and size on their performance and fees. The Board noted that, with the exception of the Allocation Funds and the Huntington U.S. Treasury Money Market Fund, all of the Funds’ Advisory Agreements reflect the implementation of investment advisory fee breakpoints for the Funds. The Board further noted that the administration fee charged to all Funds included fee breakpoints, which allowed the Funds to realize economies of scale as the assets of the Funds increased over time.
Comparison of the Fees and Performance of Comparable Funds—With respect to the Funds’ performance and fees, the Board considered comparisons to other mutual funds with comparable investment programs to be particularly useful, given the high degree of competition in the mutual fund business. The Board used Lipper peer group information provided by Strategic Insight, Inc. with respect to its comparable fee and performance analysis for the Funds. The data for the fee and performance analysis was generated on an aggregate portfolio level since not all Funds offer the same types of share classes. The Board also received information concerning fees charged by the Advisor to other accounts, but did not consider that information to be as relevant in light of the differences in services provided.
Other Considerations—The Board also requests and receives substantial and detailed information about the Funds and the Advisor on a regular basis. The Advisor provides much of this information at each regular meeting of the Board and furnishes additional reports in connection with the Board’s formal review of the Advisory Agreements. The Board may also receive information between regular meetings relating to particular matters as the need arises. The Board’s evaluation of the Advisory Agreements is informed by reports covering such matters as: the Advisor’s investment philosophy, personnel, and processes; operating strategies; the Funds’ short- and long term performance (in absolute terms, both on a gross basis and net of expenses, as well as in relationship to its particular investment program and certain competitive funds and/or other benchmarks, as appropriate) and comments on reasons for performance. The Board also considered reports concerning the Funds’ expenses (including the advisory fee itself and the overall expense structure of the Funds, both in absolute terms and relative to similar and/or competing funds, with due regard for contractual or voluntary expense limitations); the use and allocation of brokerage commissions derived from trading the Funds’ portfolio securities; the nature and extent of the advisory and other services provided to the Funds by the Advisor and its affiliates; compliance and audit reports concerning the Funds (including communications from regulatory agencies), as well as the Advisor’s responses to any issues raised therein; and relevant developments in the mutual fund industry and how the Funds and the Advisor are responding to them. In the course of their deliberations regarding the Advisory Agreements, the Board also evaluated, among other things, the Advisor’s ability to supervise each of the Fund’s other service providers and its compliance program.
The Board based its decision to approve the Advisory Agreements on the totality of the circumstances and relevant factors and with a view to past and future long-term considerations. Not all of the factors and considerations identified above are relevant to each of the Funds, nor does the Board consider any one of them to be determinative. With respect to the factors that are relevant, the Board’s decision to approve the Advisory Agreements reflects its determination that the Advisor’s performance and actions provide an acceptable basis to support the decision to continue the existing arrangements.
While attention was given to all information furnished, the following discusses the primary factors relevant to the Board’s decisions. In each case, the Board concluded that the Funds’ combined advisory fee and administrative fee and total expenses were reasonable in light of the quality and nature of services provided by the Advisor and its affiliates.
| I. | HUNTINGTON MONEY MARKET FUNDS |
Huntington Tax-Free Money Market Fund
Among other data considered, the Board noted that the Fund’s performance was equal to the median and average of its Lipper peer group for the one-year period ended March 31, 2012, and underperformed the median and
Annual Shareholder Report
171
Investment Contract Review Disclosure (Continued)
average of its Lipper peer group for the three-year and since-inception periods ended March 31, 2012. For the five-year period ended March 31, 2012, the Board noted that the Fund outperformed the average and underperformed the median of its Lipper peer group. The Board took into consideration the Advisor’s agreement to waive all or a portion of its advisory fee and/or reimburse operating expenses of the Fund and noted that the Fund’s combined advisory fee and administrative fee is below the average and median of its Lipper peer group and that the Fund’s total expenses were below the average and median of its Lipper peer group.
Huntington Money Market Fund
Among other data considered, the Board noted that the Fund underperformed the median and average of its Lipper peer group for the one-, three-, and five-year periods ended March 31, 2012. The Board also noted that the Fund outperformed the median and average of its Lipper peer group for the since-inception period ended March 31, 2012. The Board took into consideration the Advisor’s agreement to waive all or a portion of its advisory fee and/or reimburse operating expenses of the Fund and noted that the Fund’s combined advisory fee and administrative fee is below the average and median of its Lipper peer group and that the Fund’s total expenses were above the average and median of its Lipper peer group. The Board took into account management’s discussion of the Fund’s performance, including the impact of market conditions on the Fund’s performance.
Huntington Ohio Municipal Money Market Fund
Among other data considered, the Board noted that the Fund outperformed its Lipper peer group for the since-inception period ended March 31, 2012. The Board also noted that the Fund’s performance was equal to the median and average of its Lipper peer group for the one-year period ended March 31, 2012, and that the Fund underperformed the median and average of its Lipper peer group for the three-year period ended March 31, 2012. For the five-year period ended March 31, 2012, the Board noted that the Fund outperformed the average and underperformed the median of its Lipper peer group. The Board took into consideration the Advisor’s agreement to waive all or a portion of its advisory fee and/or reimburse operating expenses of the Fund and noted that the Fund’s combined advisory fee and administrative fee is below the average and median of its Lipper peer group and that the Fund’s total expenses are below the average and median of its Lipper peer group.
Huntington U.S. Treasury Money Market Fund
Among other data considered, the Board noted that the Fund’s performance was equal to the median and average of its Lipper peer group for the one-year period ended March 31, 2012, and underperformed the median and average of its Lipper peer group for the three- and five-year periods ended March 31, 2012. For the since-inception period ended March 31, 2012, the Board noted that the Fund outperformed the average and median of its Lipper peer group. The Board took into consideration the Advisor’s agreement to waive all or a portion of its advisory fee and/or reimburse operating expenses of the Fund and noted that the Fund’s combined advisory fee and administrative fee is below the average and median of its Lipper peer group and that the Fund’s total expenses were below the average and median of its Lipper peer group.
| II. | HUNTINGTON EQUITY FUNDS |
Huntington Disciplined Equity Fund
Among other data considered, the Board noted that the Fund underperformed the median and average of its Lipper peer group for the since-inception period ended March 31, 2012. The Board also noted that the Fund underperformed its benchmark index for the since-inception period ended June 30, 2012. The Board noted that the Fund’s combined advisory fee and administrative fee is below the median and average of its Lipper peer group and that the Fund’s total expenses were above the median and average of its Lipper peer group. The Board took into account the advisor’s discussion of the Fund’s performance, including the impact of market conditions on the Fund’s performance and management’s plans with respect to the Fund.
Annual Shareholder Report
172
Huntington Dividend Capture Fund
Among other data considered, the Board noted that the Fund outperformed the median and average of its Lipper peer group for the one-, three- and five-year and since-inception periods ended March 31, 2012. The Board also noted that the Fund outperformed its benchmark index for the five-year and since-inception periods ended June 30, 2012, and underperformed its benchmark index for the one-, three-, and ten-year periods ended June 30, 2012. The Board noted that the Fund’s combined advisory fee and administrative fee and total expenses were above the median and average of its Lipper peer group.
Huntington Global Select Markets Fund
Among other data considered, the Board noted that the Fund underperformed the median and average of its Lipper peer group for the one-year period ended March 31, 2012. The Board also noted that the Fund underperformed the median and outperformed the average of its Lipper peer group for the since-inception period ended March 31, 2012. The Board noted that the Fund underperformed its benchmark index for the one-year and since-inception periods ended June 30, 2012. The Board also noted that the Fund’s combined advisory fee and administrative fee and total expenses were above the median and average of its Lipper peer group. The Board took into account the advisor’s discussion of the Fund’s performance, including the impact of market conditions on the Fund’s performance and management’s plans with respect to the Fund.
Huntington Growth Fund
Among other data considered, the Board noted that the Fund underperformed the median and average of its Lipper peer group for the one-, three- and five-year periods ended March 31, 2012. The Board noted that the Fund underperformed the median and outperformed the average of its Lipper peer group for the since-inception period ended March 31, 2012. The Board also noted that the Fund underperformed its benchmark index for the one-, three-, five-, and ten-year and since-inception periods ended June 30, 2012. The Board noted that the Fund’s combined advisory fee and administrative fee was above the average and below the median of its Lipper peer group, and that the Fund’s total expenses were below the median and average of its Lipper peer group. The Board took into account the advisor’s discussion of the Fund’s performance, including the impact of market conditions on the Fund’s performance and management’s plans with respect to the Fund.
Huntington Income Equity Fund
Among other data considered, the Board noted that the Fund outperformed the median and average of its Lipper peer group for the one- and three-year and since-inception periods ended March 31, 2012. The Board noted that the Fund’s performance was equal to the average and outperformed the median of its Lipper peer group for the five-year period ended March 31, 2012. The Board further noted that the Fund outperformed its benchmark index for the one-, three-, and five-year and since-inception periods ended June 30, 2012. The Board noted that the Fund underperformed its benchmark index for the ten-year period ended June 30, 2012. The Board also noted that the Fund’s combined advisory fee and administrative fee and total expenses were above the average and median of its Lipper peer group.
Huntington International Equity Fund
Among other data considered, the Board noted that the Fund underperformed the median and average of its Lipper peer group for the three-year and since-inception periods ended March 31, 2012. The Board noted that the Fund outperformed the median and average of its Lipper peer group for the one- and five-year periods ended March 31, 2012. The Board further noted that the Fund outperformed its benchmark index for the one-, five-, and ten-year and since-inception periods ended June 30, 2012. The Board noted that the Fund underperformed its benchmark index for the three-year period ended June 30, 2012. The Board noted that the Fund’s combined advisory fee and administrative fee and total expenses were above the average and median of its Lipper peer group.
Annual Shareholder Report
173
Investment Contract Review Disclosure (Continued)
Huntington Macro 100 Fund
Among other data considered, the Board noted that the Fund underperformed the median and average of its Lipper peer group for the one- and five-year and since-inception periods ended March 31, 2012. The Board noted that the Fund’s performance was equal to the median and underperformed the average of its Lipper peer group for the three-year period ended March 31, 2012. The Board further noted that the Fund underperformed its benchmark index for the one-, three-, and five-year and since-inception periods ended June 30, 2012. The Board noted that the Fund’s combined advisory fee and administrative fee and total expenses were above the average and median of its Lipper peer group. The Board took into account the advisor’s discussion of the Fund’s performance, including the impact of market conditions on the Fund’s performance and management’s plans with respect to the Fund.
Huntington Mid Corp America Fund
Among other data considered, the Board noted that the Fund outperformed the median and average of its Lipper peer group for the one- and five-year periods ended March 31, 2012. The Board also noted that the Fund underperformed the median and average of its Lipper peer group for the three-year and since-inception periods ended March 31, 2012. The Board further noted that the Fund outperformed its benchmark index for the one-year period ended June 30, 2012, and underperformed its benchmark index for the three-, five-, and ten-year and since-inception periods ended June 30, 2012. In addition, the Board noted that the Fund’s combined advisory fee and administrative fee and total expenses were above the median and average of its Lipper peer group. The Board took into account the advisor’s discussion of the Fund’s performance, including the impact of market conditions on the Fund’s performance and management’s plans with respect to the Fund.
Huntington Real Strategies Fund
Among other data considered, the Board noted that the Fund outperformed the median and average of its Lipper peer group for the one- and three-year periods ended March 31, 2012. The Board noted that the Fund underperformed the median and average of its Lipper peer group for the since-inception period ended March 31, 2012. The Board also noted that the Fund outperformed its benchmark index for the three-year and since-inception periods ended June 30, 2012, and underperformed its benchmark index for the one- and five-year periods ended June 30, 2012. The Board noted that the Fund’s combined advisory fee and administrative fee and total expenses were above the median and average of its Lipper peer group. The Board took into account the advisor’s discussion of the Fund’s performance, including the impact of market conditions on the Fund’s performance, and management’s plans with respect to the Fund.
Huntington Rotating Markets Fund
Among other data considered, the Board noted that the Fund outperformed the median and average of its Lipper peer group for the one-year period ended March 31, 2012, and underperformed the median and average of its Lipper peer group for the three- and five-year and since-inception periods ended March 31, 2012. The Board also noted that the Fund outperformed its benchmark index for the since-inception period ended June 30, 2012, and underperformed its benchmark index for the one-, three-, five-, and ten-year periods ended June 30, 2012. The Board noted that the Fund’s combined advisory fee and administrative fee and total expenses were below the average and median of its Lipper peer group. The Board took into account the advisor’s discussion of the Fund’s performance, including the impact of market conditions on the Fund’s performance and management’s plans with respect to the Fund.
Huntington Situs Fund
Among other data considered, the Board noted that the Fund outperformed the median and average of its Lipper peer group for the one-, three- and five- year and since-inception periods ended March 31, 2012. The Board also noted that the Fund outperformed its benchmark index for since-inception period ended June 30, 2012, and underperformed its benchmark index for the one-, three-, and five-year periods ended June 30, 2012. The Board
Annual Shareholder Report
174
also noted that the Fund’s combined advisory fee and administrative fee and total expenses were above the median and average of its Lipper peer group.
| III. | HUNTINGTON INCOME FUNDS |
Huntington Fixed Income Securities Fund
Among other data considered, the Board noted that the Fund underperformed the average and median of its Lipper peer group for the one- and three-year and since-inception periods ended March 31, 2012. The Board noted that the Fund underperformed the median and outperformed the average of its Lipper peer group for the five-year period ended March 31, 2012. The Board also noted that the Fund underperformed its benchmark index for the one-, three-, five-, and ten-year and since-inception periods ended June 30, 2012. The Board noted that the Fund’s combined advisory fee and administrative fee and total expenses were above the average and median of its Lipper peer group. The Board took into account management’s discussion of the Fund’s performance, including the impact of market conditions on the Fund’s performance, and management’s plans with respect to the Fund.
Huntington Intermediate Government Income Fund
Among other data considered, the Board noted that the Fund outperformed the median and average of its Lipper peer group for the one-, three- and five-year and since-inception periods ended March 31, 2012. The Board also noted that the Fund underperformed its benchmark index for the one-, three-, five-, and ten-year and since-inception periods ended June 30, 2012. The Board noted that the Fund’s combined advisory fee and administrative fee and total expenses were above the average and median of its Lipper peer group.
Huntington Mortgage Securities Fund
Among other data considered, the Board noted that the Fund underperformed the median and average of its Lipper peer group for the one-, three- and five-year periods ended March 31, 2012. The Board noted that the Fund’s performance was equal to the median and outperformed the average of its Lipper peer group for the since-inception period ended March 31, 2012. The Board also noted that the Fund outperformed its benchmark index for the three-year period ended June 30, 2012, and underperformed its benchmark index for the one-, five-, and ten-year and since-inception periods ended June 30, 2012. In addition, the Board noted that the Fund’s combined advisory fee and administrative fee and total expenses were above the average and median of its Lipper peer group. The Board took into account management’s discussion of the Fund’s performance, including the impact of market conditions on the Fund’s performance, and management’s plans with respect to the Fund.
Huntington Ohio Tax-Free Fund
Among other data considered, the Board noted that the Fund underperformed the median and average of its Lipper peer group for the one-, three- and five-year and since-inception periods ended March 31, 2012. The Board also noted that the Fund underperformed its benchmark index for the one-, three-, five-, and ten-year and since-inception periods ended June 30, 2012. The Board noted that the Fund’s combined advisory fee and administrative fee and total expenses were above the average and median of its Lipper peer group. In addition, the Board took into account management’s discussion of the Fund’s performance, including the impact of market conditions on the Fund’s performance, and management’s plans with respect to the Fund.
Huntington Short/Intermediate Fixed Income Securities Fund
Among other data considered, the Board noted that the Fund underperformed the median and average of its Lipper peer group for the one-, three- and five-year and since-inception periods ended March 31, 2012. The Board also noted that the Fund outperformed its benchmark index for the since-inception period ended June 30, 2012, and underperformed its benchmark index for the one-, three-, and five-year periods ended June 30, 2012. The Board noted that the Fund’s combined advisory fee and administrative fee and total expenses are above the aver-
Annual Shareholder Report
175
Investment Contract Review Disclosure (Continued)
age and median of its Lipper peer group. The Board took into account management’s discussion of the Fund’s performance, including the impact of market conditions on the Fund’s performance, and management’s plans with respect to the Fund.
| IV. | HUNTINGTON ASSET ALLOCATION FUNDS |
Huntington Balanced Allocation Fund
Among other data considered, the Board noted that the Fund underperformed the median and average of its Lipper peer group for the one-year period ended March 31, 2012, and outperformed the median and average of its Lipper peer group for the since-inception period ended March 31, 2012. The Board also noted that the Fund underperformed its benchmark index for the one-year and since-inception periods ended June 30, 2012. The Board took into consideration the Advisor’s agreement to waive all or a portion of its advisory fee for the Fund and noted that the Fund’s combined advisory fee and administrative fee and total expenses were below the median and average of its Lipper peer group.
Huntington Conservative Allocation Fund
Among other data considered, the Board noted that the Fund underperformed the median and average of its Lipper peer group for the one-year period ended March 31, 2012, and outperformed the median and average of its Lipper peer group for the since-inception period ended March 31, 2012. The Board also noted that the Fund underperformed its benchmark index for the one-year and since-inception periods ended June 30, 2012. The Board took into consideration the Advisor’s agreement to waive all or a portion of its advisory fee for the Fund and noted that the Fund’s combined advisory fee and administrative fee was above the average and below the median of its Lipper peer group and that the Fund’s total expenses were below the median and average of its Lipper peer group.
Huntington Growth Allocation Fund
Among other data considered, the Board noted that the Fund underperformed the median and average of its Lipper peer group for the one-year period ended March 31, 2012, and outperformed the median and average of its Lipper peer group for the since-inception period ended March 31, 2012. The Board also noted that the Fund underperformed its benchmark index for the one-year and since-inception periods ended June 30, 2012. The Board took into consideration the Advisor’s agreement to waive all or a portion of its advisory fee for the Fund and noted that the Fund’s combined advisory fee and administrative fee and total expenses were below the median and average of its Lipper peer group.
Annual Shareholder Report
176
Supplemental Information (Unaudited)
Shareholder Expense Examples
Fund Expenses—As a shareholder of a Fund, you incur two types of costs: (1) transaction costs, which may include sales charges (loads) on purchase payments, contingent deferred sales charges on redemptions; and (2) ongoing costs, including management fees, distribution and service fees; and other Fund expenses. These examples are intended to help you understand your ongoing costs (in dollars) of investing in the Funds and to compare these costs with the ongoing costs of investing in other mutual funds.
The examples are based on an investment of $1,000.00 invested at the beginning of the period and held for the entire six-month period from July 1, 2012 to December 31, 2012.
Actual Expenses—The “Actual” lines of the table provide information about actual account values and actual expenses. You may use the information on this line for the class of shares you hold, together with the amount you invested, to estimate the expenses that you paid over the period. Simply divide your account value by $1,000.00 (for example, an $8,600.00 account value divided by $1,000.00 = 8.60), then multiply the result by the number in the “Actual” line under the heading entitled “Expenses Paid During Period” to estimate the expenses you paid on your account during this period.
Hypothetical Example for Comparison Purposes—The “Hypothetical” lines of the table provide information about hypothetical account values and hypothetical expenses based on the Funds’ actual expense ratios for each class of shares and an assumed rate of return of 5% per year before expenses, which are not the Funds’ actual returns. The hypothetical account values and expenses may not be used to estimate the actual ending account balance or expenses you paid for the period. You may use this information to compare the ongoing costs of investing in the Funds and other funds. To do so, compare the 5% hypothetical examples with the 5% hypothetical examples that appear in the shareholder reports of other funds.
Please note that the expenses shown in the table are meant to highlight your ongoing costs only and do not reflect any transactional costs. Therefore, the “Hypothetical” lines of the table are useful in comparing ongoing costs only, and will not help you determine the relative total costs of owning different funds. In addition, if these transactional costs were included, your costs would have been higher.
| | | | | | | | | | | | | | | | | | |
| | | | | Beginning
Account
Value,
July 1, 2012 | | | Ending
Account Value,
December 31, 2012 | | | Expenses
Paid
During
Period(1) | | | Annualized
Expense
Ratio | |
| | | | |
Tax-Free Money Market Fund | | | | | | | | | | | | | | | | |
Trust Shares | | Actual | | $ | 1,000.00 | | | $ | 1,000.10 | | | $ | 0.96 | | | | 0.19 | % |
| | | Hypothetical (2) | | $ | 1,000.00 | | | $ | 1,024.18 | | | $ | 0.97 | | | | 0.19 | % |
Class A Shares | | Actual | | $ | 1,000.00 | | | $ | 1,000.10 | | | $ | 0.96 | | | | 0.19 | % |
| | | Hypothetical (2) | | $ | 1,000.00 | | | $ | 1,024.18 | | | $ | 0.97 | | | | 0.19 | % |
Money Market Fund | | | | | | | | | | | | | | | | | | |
Trust Shares | | Actual | | $ | 1,000.00 | | | $ | 1,000.10 | | | $ | 1.06 | | | | 0.21 | % |
| | | Hypothetical (2) | | $ | 1,000.00 | | | $ | 1,024.08 | | | $ | 1.07 | | | | 0.21 | % |
Class A Shares | | Actual | | $ | 1,000.00 | | | $ | 1,000.10 | | | $ | 1.05 | | | | 0.21 | % |
| | | Hypothetical (2) | | $ | 1,000.00 | | | $ | 1,024.08 | | | $ | 1.07 | | | | 0.21 | % |
Ohio Municipal Money Market Fund | | | | | | | | | | | | | | | | | | |
Trust Shares | | Actual | | $ | 1,000.00 | | | $ | 1,000.10 | | | $ | 0.97 | | | | 0.19 | % |
| | | Hypothetical (2) | | $ | 1,000.00 | | | $ | 1,024.17 | | | $ | 0.98 | | | | 0.19 | % |
Class A Shares | | Actual | | $ | 1,000.00 | | | $ | 1,000.10 | | | $ | 0.96 | | | | 0.19 | % |
| | | Hypothetical (2) | | $ | 1,000.00 | | | $ | 1,024.17 | | | $ | 0.98 | | | | 0.19 | % |
U.S. Treasury Money Market Fund | | | | | | | | | | | | | | | | | | |
Trust Shares | | Actual | | $ | 1,000.00 | | | $ | 1,000.10 | | | $ | 0.53 | | | | 0.11 | % |
| | | Hypothetical (2) | | $ | 1,000.00 | | | $ | 1,024.61 | | | $ | 0.54 | | | | 0.11 | % |
Class A Shares | | Actual | | $ | 1,000.00 | | | $ | 1,000.00 | | | $ | 0.61 | | | | 0.12 | % |
| | | Hypothetical (2) | | $ | 1,000.00 | | | $ | 1,024.52 | | | $ | 0.62 | | | | 0.12 | % |
Disciplined Equity Fund | | | | | | | | | | | | | | | | |
Trust Shares | | Actual | | $ | 1,000.00 | | | $ | 992.90 | | | $ | 6.02 | | | | 1.20 | % |
| | | Hypothetical (2) | | $ | 1,000.00 | | | $ | 1,019.10 | | | $ | 6.09 | | | | 1.20 | % |
Class A Shares | | Actual | | $ | 1,000.00 | | | $ | 991.50 | | | $ | 7.27 | | | | 1.45 | % |
| | | Hypothetical (2) | | $ | 1,000.00 | | | $ | 1,017.85 | | | $ | 7.35 | | | | 1.45 | % |
Annual Shareholder Report
177
Supplemental Information (Continued)
| | | | | | | | | | | | | | | | | | |
| | | | | Beginning
Account
Value,
July 1, 2012 | | | Ending
Account Value,
December 31, 2012 | | | Expenses
Paid
During
Period(1) | | | Annualized
Expense
Ratio | |
Dividend Capture Fund | | | | | | | | | | | | | | | | |
Trust Shares | | Actual | | $ | 1,000.00 | | | $ | 1,047.20 | | | $ | 5.65 | | | | 1.10 | % |
| | | Hypothetical (2) | | $ | 1,000.00 | | | $ | 1,019.62 | | | $ | 5.57 | | | | 1.10 | % |
Class A Shares | | Actual | | $ | 1,000.00 | | | $ | 1,045.90 | | | $ | 6.95 | | | | 1.35 | % |
| | | Hypothetical (2) | | $ | 1,000.00 | | | $ | 1,018.34 | | | $ | 6.85 | | | | 1.35 | % |
Global Select Markets Fund | | | | | | | | | | | | | | | | | | |
Trust Shares | | Actual | | $ | 1,000.00 | | | $ | 1,110.60 | | | $ | 10.10 | | | | 1.90 | % |
| | | Hypothetical (2) | | $ | 1,000.00 | | | $ | 1,015.56 | | | $ | 9.65 | | | | 1.90 | % |
Class A Shares | | Actual | | $ | 1,000.00 | | | $ | 1,109.00 | | | $ | 11.42 | | | | 2.15 | % |
| | | Hypothetical (2) | | $ | 1,000.00 | | | $ | 1,014.31 | | | $ | 10.91 | | | | 2.15 | % |
Growth Fund | | | | | | | | | | | | | | | | |
Trust Shares | | Actual | | $ | 1,000.00 | | | $ | 1,018.70 | | | $ | 6.12 | | | | 1.21 | % |
| | | Hypothetical (2) | | $ | 1,000.00 | | | $ | 1,019.07 | | | $ | 6.12 | | | | 1.21 | % |
Class A Shares | | Actual | | $ | 1,000.00 | | | $ | 1,017.60 | | | $ | 7.39 | | | | 1.46 | % |
| | | Hypothetical (2) | | $ | 1,000.00 | | | $ | 1,017.81 | | | $ | 7.39 | | | | 1.46 | % |
Income Equity Fund | | | | | | | | | | | | | | | | |
Trust Shares | | Actual | | $ | 1,000.00 | | | $ | 1,042.40 | | | $ | 6.20 | | | | 1.21 | % |
| | | Hypothetical (2) | | $ | 1,000.00 | | | $ | 1,019.06 | | | $ | 6.13 | | | | 1.21 | % |
Class A Shares | | Actual | | $ | 1,000.00 | | | $ | 1,041.10 | | | $ | 7.48 | | | | 1.46 | % |
| | | Hypothetical (2) | | $ | 1,000.00 | | | $ | 1,017.81 | | | $ | 7.39 | | | | 1.46 | % |
International Equity Fund | | | | | | | | | | | | | | | | |
Trust Shares | | Actual | | $ | 1,000.00 | | | $ | 1,109.80 | | | $ | 8.40 | | | | 1.58 | % |
| | | Hypothetical (2) | | $ | 1,000.00 | | | $ | 1,017.17 | | | $ | 8.03 | | | | 1.58 | % |
Class A Shares | | Actual | | $ | 1,000.00 | | | $ | 1,108.00 | | | $ | 9.72 | | | | 1.83 | % |
| | | Hypothetical (2) | | $ | 1,000.00 | | | $ | 1,015.92 | | | $ | 9.29 | | | | 1.83 | % |
Mid Corp America Fund | | | | | | | | | | | | | | | | |
Trust Shares | | Actual | | $ | 1,000.00 | | | $ | 1,062.80 | | | $ | 7.34 | | | | 1.42 | % |
| | | Hypothetical (2) | | $ | 1,000.00 | | | $ | 1,018.02 | | | $ | 7.18 | | | | 1.42 | % |
Class A Shares | | Actual | | $ | 1,000.00 | | | $ | 1,060.90 | | | $ | 8.63 | | | | 1.67 | % |
| | | Hypothetical (2) | | $ | 1,000.00 | | | $ | 1,016.76 | | | $ | 8.44 | | | | 1.67 | % |
Real Strategies Fund | | | | | | | | | | | | | | | | | | |
Trust Shares | | Actual | | $ | 1,000.00 | | | $ | 1,049.00 | | | $ | 7.03 | | | | 1.36 | % |
| | | Hypothetical (2) | | $ | 1,000.00 | | | $ | 1,018.28 | | | $ | 6.92 | | | | 1.36 | % |
Class A Shares | | Actual | | $ | 1,000.00 | | | $ | 1,048.10 | | | $ | 8.31 | | | | 1.61 | % |
| | | Hypothetical (2) | | $ | 1,000.00 | | | $ | 1,017.02 | | | $ | 8.19 | | | | 1.61 | % |
Rotating Markets Fund | | | | | | | | | | | | | | | | | | |
Trust Shares | | Actual | | $ | 1,000.00 | | | $ | 1,018.10 | | | $ | 6.13 | | | | 1.21 | % |
| | | Hypothetical (2) | | $ | 1,000.00 | | | $ | 1,019.06 | | | $ | 6.13 | | | | 1.21 | % |
Class A Shares | | Actual | | $ | 1,000.00 | | | $ | 1,015.50 | | | $ | 7.39 | | | | 1.46 | % |
| | | Hypothetical (2) | | $ | 1,000.00 | | | $ | 1,017.80 | | | $ | 7.40 | | | | 1.46 | % |
Situs Fund | | | | | | | | | | | | | | | | |
Trust Shares | | Actual | | $ | 1,000.00 | | | $ | 1,147.70 | | | $ | 7.29 | | | | 1.35 | % |
| | | Hypothetical (2) | | $ | 1,000.00 | | | $ | 1,018.34 | | | $ | 6.86 | | | | 1.35 | % |
Class A Shares | | Actual | | $ | 1,000.00 | | | $ | 1,146.20 | | | $ | 8.64 | | | | 1.60 | % |
| | | Hypothetical (2) | | $ | 1,000.00 | | | $ | 1,017.09 | | | $ | 8.12 | | | | 1.60 | % |
Annual Shareholder Report
178
| | | | | | | | | | | | | | | | | | |
| | | | | Beginning
Account
Value,
July 1, 2012 | | | Ending
Account Value,
December 31, 2012 | | | Expenses
Paid
During
Period(1) | | | Annualized
Expense
Ratio | |
Fixed Income Securities Fund | | | | | | | | | | | | | | | | |
Trust Shares | | Actual | | $ | 1,000.00 | | | $ | 1,018.10 | | | $ | 5.42 | | | | 1.07 | % |
| | | Hypothetical (2) | | $ | 1,000.00 | | | $ | 1,019.77 | | | $ | 5.42 | | | | 1.07 | % |
Class A Shares | | Actual | | $ | 1,000.00 | | | $ | 1,017.00 | | | $ | 6.69 | | | | 1.32 | % |
| | | Hypothetical (2) | | $ | 1,000.00 | | | $ | 1,018.50 | | | $ | 6.70 | | | | 1.32 | % |
Intermediate Government Income Fund | | | | | | | | | | | | | | | | | | |
Trust Shares | | Actual | | $ | 1,000.00 | | | $ | 1,006.10 | | | $ | 5.56 | | | | 1.10 | % |
| | | Hypothetical (2) | | $ | 1,000.00 | | | $ | 1,019.59 | | | $ | 5.60 | | | | 1.10 | % |
Class A Shares | | Actual | | $ | 1,000.00 | | | $ | 1,005.00 | | | $ | 6.82 | | | | 1.35 | % |
| | | Hypothetical (2) | | $ | 1,000.00 | | | $ | 1,018.33 | | | $ | 6.87 | | | | 1.35 | % |
Mortgage Securities Fund | | | | | | | | | | | | | | | | | | |
Trust Shares | | Actual | | $ | 1,000.00 | | | $ | 1,003.90 | | | $ | 5.72 | | | | 1.14 | % |
| | | Hypothetical (2) | | $ | 1,000.00 | | | $ | 1,019.43 | | | $ | 5.76 | | | | 1.14 | % |
Class A Shares | | Actual | | $ | 1,000.00 | | | $ | 1,002.60 | | | $ | 6.99 | | | | 1.39 | % |
| | | Hypothetical (2) | | $ | 1,000.00 | | | $ | 1,018.16 | | | $ | 7.04 | | | | 1.39 | % |
Ohio Tax-Free Fund | | | | | | | | | | | | | | | | | | |
Trust Shares | | Actual | | $ | 1,000.00 | | | $ | 1,023.20 | | | $ | 6.15 | | | | 1.21 | % |
| | | Hypothetical (2) | | $ | 1,000.00 | | | $ | 1,019.06 | | | $ | 6.14 | | | | 1.21 | % |
Class A Shares | | Actual | | $ | 1,000.00 | | | $ | 1,022.00 | | | $ | 7.42 | | | | 1.46 | % |
| | | Hypothetical (2) | | $ | 1,000.00 | | | $ | 1,017.79 | | | $ | 7.41 | | | | 1.46 | % |
Short/Intermediate Fixed Income Securities Fund | | | | | | | | | | | | | | | | |
Trust Shares | | Actual | | $ | 1,000.00 | | | $ | 1,007.90 | | | $ | 5.37 | | | | 1.06 | % |
| | | Hypothetical (2) | | $ | 1,000.00 | | | $ | 1,019.79 | | | $ | 5.40 | | | | 1.06 | % |
Class A Shares | | Actual | | $ | 1,000.00 | | | $ | 1,006.20 | | | $ | 6.63 | | | | 1.31 | % |
| | | Hypothetical (2) | | $ | 1,000.00 | | | $ | 1,018.53 | | | $ | 6.67 | | | | 1.31 | % |
Balanced Allocation Fund | | | | | | | | | | | | | | | | | | |
Class A Shares | | Actual | | $ | 1,000.00 | | | $ | 1,034.60 | | | $ | 3.55 | | | | 0.70 | % |
| | | Hypothetical (2) | | $ | 1,000.00 | | | $ | 1,021.64 | | | $ | 3.53 | | | | 0.70 | % |
Conservative Allocation Fund | | | | | | | | | | | | | | | | | | |
Class A Shares | | Actual | | $ | 1,000.00 | | | $ | 1,017.40 | | | $ | 3.96 | | | | 0.78 | % |
| | | Hypothetical (2) | | $ | 1,000.00 | | | $ | 1,021.21 | | | $ | 3.96 | | | | 0.78 | % |
Growth Allocation Fund | | | | | | | | | | | | | | | | | | |
Class A Shares | | Actual | | $ | 1,000.00 | | | $ | 1,043.60 | | | $ | 3.25 | | | | 0.63 | % |
| | | Hypothetical (2) | | $ | 1,000.00 | | | $ | 1,021.95 | | | $ | 3.22 | | | | 0.63 | % |
| (1) | Expenses are equal to the Fund’s annualized expense ratios, multiplied by the average account value over the period, multiplied by 184/366 (to reflect the one-half year period). The annualized expense ratios reflect reimbursement of expenses by the Funds’ Adviser for the period beginning July 1, 2012 through December 31, 2012. The “Financial Highlights” tables in the Funds’ financial statements, included in the report, also show the gross expense ratios, without such reimbursements. |
| (2) | Hypothetical assumes 5% annual return before expenses. |
Annual Shareholder Report
179
VOTING PROXIES ON FUND PORTFOLIO SECURITIES
A copy of the policies and procedures that the Funds use to determine how to vote proxies relating to securities held in the Funds’ portfolios, as well as a record of how the Funds voted any such proxies during the most recent 12-month period ended June 30, is available without charge and upon request by calling 1-800-253-0412 or at www.huntingtonfunds.com. This information is also available from the EDGAR database on the SEC’s website at www.sec.gov.
QUARTERLY PORTFOLIO SCHEDULE
The Funds file with the SEC a complete schedule of their portfolio holdings, as of the close of the first and third quarters of their fiscal year, on “Form N-Q.” These filings are available on the SEC’s website at www.sec.gov and may be reviewed and copied at the SEC’s Public Reference Room in Washington, DC. (call 1-202-551-8090 for information on the operation of the Public Reference Room.) You may also access this information at www.huntingtonfunds.com by selecting “Form N-Q”.
The Huntington National Bank, a subsidiary of Huntington Bancshares, Inc., is the Custodian of The Huntington Funds. Huntington Asset Services, Inc. serves as the Administrator and Fund Accountant and is affiliated with the Huntington National Bank. Additionally, Brown Brothers Harriman & Co. is the Sub-Custodian of certain of the Funds. Huntington Asset Advisors, Inc., a subsidiary of the Huntington National Bank, serves as Investment Advisor to the Funds. Unified Financial Securities, Inc. serves as the Distributor of The Huntington Funds and is affiliated with the Huntington National Bank.
Mutual funds, including money market funds, are not bank deposits or obligations, are not guaranteed by any bank, and are not insured or guaranteed by the U.S. government, the Federal Deposit Insurance Corporation, the Federal Reserve Board, or any other government agency. Investment in mutual funds involves investment risk, including the possible loss of principal. Although money market funds seek to preserve the value of your investment at $1.00 per share, it is possible to lose money by investing in the Funds.
This report is authorized for distribution to prospective investors only when preceded or accompanied by a prospectus which contains facts concerning the Funds’ objectives and policies, management fees, expenses and other information.
| | | | | | |
CUSIP 446327504 | | CUSIP 446327660 | | CUSIP 446327546 | | CUSIP 446327843 |
CUSIP 446327603 | | CUSIP 446327645 | | CUSIP 446327298 | | CUSIP 446327835 |
CUSIP 446327108 | | CUSIP 446327124 | | CUSIP 446327272 | | CUSIP 446327827 |
CUSIP 446327207 | | CUSIP 446327116 | | CUSIP 446327520 | | CUSIP 446327819 |
CUSIP 446327496 | | CUSIP 446327884 | | CUSIP 446327538 | | CUSIP 446327413 |
CUSIP 446327306 | | CUSIP 446327876 | | CUSIP 446327488 | | CUSIP 446327744 |
CUSIP 446327405 | | CUSIP 446327868 | | CUSIP 446327462 | | CUSIP 446327157 |
CUSIP 446327702 | | CUSIP 446327850 | | CUSIP 446327777 | | CUSIP 446327140 |
CUSIP 446327801 | | CUSIP 446327637 | | CUSIP 446327769 | | CUSIP 446327132 |
CUSIP 44632P306 | | CUSIP 446327611 | | CUSIP 446327736 | | |
CUSIP 44632P405 | | CUSIP 446327561 | | CUSIP 446327728 | | |
Huntington Shareholder Services: 800-253-0412
27057 02/13

Annual Shareholder Report
DECEMBER 31, 2012
BALANCED FUND
Huntington VA Balanced Fund
EQUITY FUNDS
Huntington VA Dividend Capture Fund
Huntington VA Growth Fund
Huntington VA Income Equity Fund
Huntington VA International Equity Fund
Huntington VA Macro 100 Fund
Huntington VA Mid Corp America Fund
Huntington VA Real Strategies Fund
Huntington VA Rotating Markets Fund
Huntington VA Situs Fund
INCOME FUNDS
Huntington VA Mortgage Securities Fund
Huntington
VA Balanced Fund
Management’s Discussion of Fund Performance
Investment Advisor: Kristi Abbey
Huntington Asset Advisors, Inc.
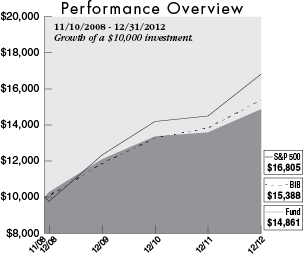
| | | | |
| | | Average Annual
Total Return for
the Period Ended
12/31/12 | |
1 Year | | | 9.42 | % |
3 Year | | | 7.13 | % |
Start of Performance (11/10/08) | | | 10.04 | % |
| | | | |
| | | Expense Ratios | |
Gross | | | 1.48 | % |
With Contractual Waivers | | | 0.10 | % |
Huntington Asset Advisors, Inc. (the “Advisor”) has contractually agreed to waive all or a portion of its investment advisory fee (based on average daily net assets) and/or reimburse certain operating expenses of the Fund to the extent necessary in order to limit the Fund’s total annual fund operating expenses (after the fee waivers and/or expense reimbursements, and exclusive of acquired fund fees and expenses, brokerage costs, interest, taxes and dividends, and extraordinary expenses) to not more than 0.10% of the Fund’s daily net assets through April 30, 2013.
The graph above illustrates the hypothetical investment of $10,000* in the Huntington VA Balanced Fund from November 10, 2008 (inception) to December 31, 2012, compared to the S&P 500 and Balanced Indices Blend.
The performance information does not include the charges and expenses imposed by the insurance company separate accounts or charges and expenses under the variable insurance product contracts. The inclusion of such charges would lower performance. Please refer to the variable insurance product prospectus for a complete listing of these expenses. The above expense ratios are from the Funds’ prospectus dated April 30, 2012. Additional information pertaining to the Fund’s expense ratio as of December 31, 2012 can be found in the financial highlights. For the fiscal year ended December 31, 2012, Fund shares were available exclusively as a funding vehicle for Hartford Life Insurance Company’s separate accounts in connection with the Huntington Director, Huntington Director Outlook and Huntington Hartford Leaders Outlook variable annuity contracts, Transamerica Life Insurance Company’s separate accounts in connection with the Huntington Allstar Select variable annuity contract, and to the separate accounts of Nationwide Life and Annuity Insurance Company, Nationwide Life Insurance Company and Sun Life Assurance Company of Canada (U.S.). Variable investment options are not obligations of or guaranteed by any bank and are not federally insured.
| * | The Fund’s performance assumes the reinvestment of all dividends and distributions. The S&P 500 and Balanced Indices Blend have been adjusted to reflect reinvestment of dividends on securities in the indices. |
For the fiscal year ended December 31, 2012, the Huntington VA Balanced Fund produced a total return of 9.42%. This underperformed the total return of 16.00% for the Fund’s benchmark, the Standard & Poor’s 500 Index (S&P 500)1 for the same period. The Balanced Indices Blend2 returned 11.29% for the same period. Within the equity class arena, small and mid-cap stocks fared the best while other equity asset classes underperformed S&P 500. Additionally, our fixed income holdings underperformed the index.
The VA Balanced Fund is a fund of funds3, which invests solely in the shares of other underlying funds (Huntington VA Funds and Huntington Funds). The Fund’s assets are allocated approximately 60% equities and 40% fixed income.
Relative to the Fund’s benchmark total return of 16.00%, underlying funds contributing positive performance for the year ended December 31, 2012, included the VA Situs Fund 22.63%, VA Mid Corp America Fund 14.59%, VA Dividend Capture Fund 11.47%, VA Income Equity Fund 10.73%, VA International Equity Fund 14.04%, VA Macro 100 Fund 10.61%, VA Growth Fund 10.45%, Huntington Fixed Income Securities Fund Trust Shares 3.98%, and VA Mortgage Securities Fund 3.35%.
Performance data quoted represents past performance which is no guarantee of future results. Investment return and principal value will fluctuate so that an investor’s shares, when redeemed, may be worth more or less than their original cost. Performance for a variable investment option changes over time and current performance may be lower or higher than what is stated. For current to the most recent month end performance, contact your insurance company.
| 1 | The S&P 500 is a capitalization-weighted index comprised of 500 stocks and designed to measure performance of the broad domestic economy through changes in the aggregate market value of 500 stocks representing all major industries. The index is unmanaged and, unlike the Fund, is not affected by cashflows. It is not possible to invest directly in an index. |
| 2 | The Balanced Indices Blend is a custom, blended index comprised of 60% S&P 500 and 40% Barclays Capital U.S. Aggregate Bond Index. This custom, blended index and its weightings are reflective of the Fund’s equity/fixed income allocation. The S&P 500 Index is composed of 500 widely held common stocks. The Barclays Capital U.S. Aggregate Bond Index includes U.S. government, corporate and mortgage-backed securities with maturities up to 30 years. It is not possible to invest directly in an index. |
| 3 | Because the Fund invests in other funds, the Fund is a shareholder of those underlying funds and indirectly bears its proportionate share of operating expenses, including management fees, of the underlying funds. |
The composition of the Fund’s holdings is subject to change.
Huntington
VA Dividend Capture Fund
Management’s Discussion of Fund Performance
Portfolio Manager: Kirk Mentzer, MBA,
Director of Research
Huntington Asset Advisors, Inc.
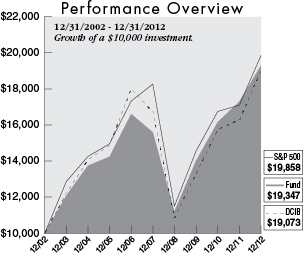
| | | | |
| | | Average Annual
Total Return for
the Period Ended
12/31/12 | |
1 Year | | | 11.47 | % |
3 Year | | | 11.17 | % |
5 Year | | | 4.33 | % |
10 Year | | | 6.82 | % |
The graph above illustrates the hypothetical investment of $10,000* in the Huntington VA Dividend Capture Fund from December 31, 2002 to December 31, 2012, compared to the S&P 500 and DCIB.
The performance information does not include the charges and expenses imposed by the insurance company separate accounts or charges and expenses under the variable insurance product contracts. The inclusion of such charges would lower performance. Please refer to the variable insurance product prospectus for a complete listing of these expenses. The above expense ratio is from the Funds’ prospectus dated April 30, 2012. Additional information pertaining to the Fund’s expense ratio as of December 31, 2012 can be found in the financial highlights. For the fiscal year ended December 31, 2012, Fund shares were available exclusively as a funding vehicle for Hartford Life Insurance Company’s separate accounts in connection with the Huntington Director, Huntington Director Outlook and Huntington Hartford Leaders Outlook variable annuity contracts, Transamerica Life Insurance Company’s separate accounts in connection with the Huntington Allstar Select variable annuity contract, and to the separate accounts of Nationwide Life and Annuity Insurance Company, Nationwide Life Insurance Company and Sun Life Assurance Company of Canada (U.S.). Variable investment options are not obligations of or guaranteed by any bank and are not federally insured.
| * | The Fund’s performance assumes the reinvestment of all dividends and distributions. The S&P 500 and DCIB have been adjusted to reflect reinvestment of dividends on securities in the indices. |
For the fiscal year ended December 31, 2012, the Huntington VA Dividend Capture Fund produced a total return of 11.47% based on net asset value. This performance fell below the total return of 16.00% for the Fund’s benchmark, the Standard & Poor’s 500 Index (S&P 500)1 and the total return of 16.45% for the Dividend Capture Indices Blend (DCIB)2 for the same period.
The Fund is managed using our top-down style and portfolio construction techniques, which are aimed at producing a high level of stable income while managing volatility by investing in three distinct asset classes: common stocks REITs, and preferred stocks.
| ¢ | | Value-style common stocks: Despite slowing economic and profit growth, U.S. equity markets produced a +16.00% total return for 2012. Sector performance favored financials, consumer discretion and healthcare areas over utilities, energy and staples. Investors had less preference for high quality, low volatility, dividend-paying stocks that the Fund was focused on for the period. As a result, the common stocks in the Fund underperformed the overall market. The Fund’s common stock total return for 2012 was +13.76% compared to the S&P 500 Value Index of +17.62%. |
| ¢ | | Real Estate Investment Trusts (REITs)**: REITs were the best performing asset class for the Fund in 2012. The Fund’s REIT holdings produced a total return of +21.96% which compared favorably to the benchmark NAREIT index total return of +19.56%. |
| ¢ | | Preferred Stocks***: Preferred stocks generally lagged the equity market, but outperformed corporate bonds with a +13.52% total return for 2012. Investors’ search for yield drove prices higher as credit spreads compressed. Performance for the preferred stocks landed between corporate bonds and common stock. |
Trading activity was responsible for 4.13% of the performance relative to the benchmark while portfolio structure had a negative impact of -5.30%. Portfolio structure can be explained by adding Security Characteristics: -8.02%, Sector Allocation: -1.84% and Security Selection: 4.57%.
The three holdings that had the largest positive contribution to the Fund’s performance were Waddell & Reed Financial, Inc. (0.8%)*, GAP, Inc. (sold) and Sunoco Logistic Partners LP (0.7%)*. These three holdings added 1.53% to the Fund’s return. The three holdings that had the largest negative contribution to the Fund’s performance were Freeport-McMoRan Copper & Gold, Inc. (0.8%)*, Total SA (sold) and Exelon Corp. (sold). These three holdings subtracted -0.65% from the Fund’s return.
Performance data quoted represents past performance which is no guarantee of future results. Investment return and principal value will fluctuate so that an investor’s shares, when redeemed, may be worth more or less than their original cost. Performance for a variable investment option changes over time and current performance may be lower or higher than what is stated. For current to the most recent month end performance, contact your insurance company.
| * | Percentage of holdings based on Fund’s net assets as of 12/31/2012. The composition of the Fund’s holdings is subject to change. |
| ** | REIT returns represented by the NAREIT Index. |
| *** | Preferred returns represented by Merrill Lynch Fixed Rate Preferred Securities Stock Index. |
| 1 | The S&P 500 is a capitalization-weighted index comprised of 500 stocks and is designed to measure performance of the broad domestic economy through changes in the aggregate market value of 500 stocks representing all major industries. The index is unmanaged and, unlike the Fund, is not affected by cashflows. It is not possible to invest directly in an Index. |
| 2 | The DCIB is a custom, blended index comprised of the following three indices with their noted respective weightings: S&P 500 Value Index (40%), Merrill Lynch Fixed Rate Preferred Index (40%) and NAREIT Index (20%). This custom, blended index and its respective weightings are reflective of the Fund’s sector diversification. Indices are unmanaged and, unlike the Fund, are not affected by cashflows. It is not possible to invest directly in an Index. |
There are no guarantees that dividend paying stocks will continue to pay dividends. In addition, dividend paying stocks may not experience the same capital appreciation potential as non-dividend paying stocks.
Huntington
VA Growth Fund
Management’s Discussion of Fund Performance
Portfolio Manager: Herb Chen, MBA
Senior Vice President
Huntington Asset Advisors, Inc.
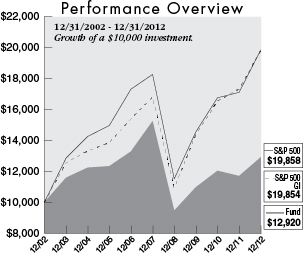
| | | | |
| | | Average Annual
Total Return for
the Period Ended
12/31/12 | |
1 Year | | | 10.45 | % |
3 Year | | | 5.57 | % |
5 Year | | | (3.26 | )% |
10 Year | | | 2.60 | % |
The graph above illustrates the hypothetical investment of $10,000* in the Huntington VA Growth Fund from December 31, 2002 to December 31, 2012, compared to the S&P 500 GI and S&P 500.
The performance information does not include the charges and expenses imposed by the insurance company separate accounts or charges and expenses under the variable insurance product contracts. The inclusion of such charges would lower performance. Please refer to the variable insurance product prospectus for a complete listing of these expenses. The above expense ratio is from the Funds’ prospectus dated April 30, 2012. Additional information pertaining to the Fund’s expense ratio as of December 31, 2012 can be found in the financial highlights. For the fiscal year ended December 31, 2012, Fund shares were available exclusively as a funding vehicle for Hartford Life Insurance Company’s separate accounts in connection with the Huntington Director, Huntington Director Outlook and Huntington Hartford Leaders Outlook variable annuity contracts, Transamerica Life Insurance Company’s separate accounts in connection with the Huntington Allstar Select variable annuity contract, and to the separate accounts of Nationwide Life and Annuity Insurance Company, Nationwide Life Insurance Company and Sun Life Assurance Company of Canada (U.S.). Variable investment options are not obligations of or guaranteed by any bank and are not federally insured.
| * | The Fund’s performance assumes the reinvestment of all dividends and distributions. The S&P 500 GI and S&P 500 have been adjusted to reflect reinvestment of dividends on securities in the indices. |
For the fiscal year ended December 31, 2012, the Huntington VA Growth produced a return of 10.45% based on net asset value. This performance was less than the total return of 14.60% for the Fund’s benchmark, the Standard & Poor’s 500 Growth Index (S&P 500 GI)1 for the same period. The Standard & Poor’s 500 Index (S&P 500)2 returned 16.00% for the same period. The Huntington VA Growth Fund underperformed the benchmark by 4.15% for the same period.
The Fund is designed to provide investors with portfolio of medium-to-large sized companies with potential for above-average growth potential. A top-down investment strategy is followed, using qualitative, quantitative, and technical analysis to evaluate the potential growth of companies in each industry. The stock selection process is also based on relative price to earnings growth methodology. While security selection had a positive effect on performance relative to the benchmark, both portfolio structure and trading activity had a negative impact. Portfolio structure consists of three components: security characteristics, sector allocation and security selection.
The three holdings that had the largest positive contribution to the Fund’s performance were Apple, Inc. (5.1%)*, Rackspace Hosting, Inc. (2.2%)* and Whole Foods Market, Inc. (2.9%)*. The three holdings that had the largest negative contribution to the Fund’s performance were Cirrus Logic, Inc. (sold), CARBO Ceramics, Inc. (sold) and Express Scripts Holding Co. (sold).
Performance data quoted represents past performance which is no guarantee of future results. Investment return and principal value will fluctuate so that an investor’s shares, when redeemed, may be worth more or less than their original cost. Performance for a variable investment option changes over time and current performance maybe lower or higher than what is stated. For current to the most recent month end performance, contact your insurance company.
| * | Percentage of holdings based on Fund’s net assets as of 12/31/2012. The composition of the Fund’s holdings is subject to change. |
| 1 | The S&P 500 GI is a capitalization-weighted index comprised of stocks in the S&P 500 having the highest price to book ratios. The index consists of approximately half of the S&P 500 on a market capitalization basis. The index is unmanaged and, unlike the Fund, is not affected by cashflows. It is not possible to invest directly in an index. |
| 2 | The S&P 500 is a capitalization-weighted index comprised of 500 stocks and designed to measure performance of the broad domestic economy through changes in the aggregate market value of 500 stocks representing all major industries. The index is unmanaged and, unlike the Fund, is not affected by cashflows. It is not possible to invest directly in an Index. |
Huntington
VA Income Equity Fund
Management’s Discussion of Fund Performance
Portfolio Manager: Craig J. Hardy, CFA, MBA
Senior Vice President
Huntington Asset Advisors, Inc.
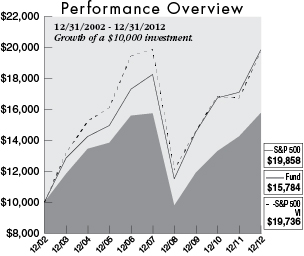
| | | | |
| | | Average Annual
Total Return for
the Period Ended
12/31/12 | |
1 Year | | | 10.73 | % |
3 Year | | | 9.84 | % |
5 Year | | | 0.04 | % |
10 Year | | | 4.67 | % |
The graph above illustrates the hypothetical investment of $10,000* in the Huntington VA Income Equity Fund from December 31, 2002 to December 31, 2012, compared to the S&P 500 VI and the S&P 500.
The performance information does not include the charges and expenses imposed by the insurance company separate accounts or charges and expenses under the variable insurance product contracts. The inclusion of such charges would lower performance. Please refer to the variable insurance product prospectus for a complete listing of these expenses. The above expense ratio is from the Funds’ prospectus dated April 30, 2012. Additional information pertaining to the Fund’s expense ratio as of December 31, 2012 can be found in the financial highlights. For the fiscal year ended December 31, 2012, Fund shares were available exclusively as a funding vehicle for Hartford Life Insurance Company’s separate accounts in connection with the Huntington Director, Huntington Director Outlook and Huntington Hartford Leaders Outlook variable annuity contracts, Transamerica Life Insurance Company’s separate accounts in connection with the Huntington Allstar Select variable annuity contract, and to the separate accounts of Nationwide Life and Annuity Insurance Company, Nationwide Life Insurance Company and Sun Life Assurance Company of Canada (U.S.). Variable investment options are not obligations of or guaranteed by any bank and are not federally insured.
| * | The Fund’s performance assumes the reinvestment of all dividends and distributions. The S&P 500 and S&P 500 VI have been adjusted to reflect reinvestment of all dividends on securities in the indices. |
For the fiscal year ended December 31, 2012, the total return for the Huntington VA Income Equity Fund was 10.73% based on net asset value. This return compares with a total return of 17.68% for the Standard & Poor’s 500 Value Index (S&P 500 VI)1, the Fund’s benchmark for the same period. The Standard & Poor’s 500 Index (S&P 500)2 returned 16.00% for the same period.
During the fiscal year, the Fund was positioned relatively conservatively, with an emphasis on stocks with above average dividend yields, reasonable dividend growth prospects and value orientation. Constructing the Fund with those characteristics meant that the Fund’s largest sector exposure during the fiscal year was in the financials sector, followed by the energy sector. This combination of characteristics produced returns for the Fund that were somewhat lower than the return of the S&P 500 VI and the S&P 500 for the reporting period.
The sectors that contributed most positively to the performance of the Fund during the year were financials, health care and consumer staples. Although the financial sector provided the highest total return for the Fund, the performance of the Fund’s financial stocks trailed that of the S&P 500 VI’s financial stocks, thus contributing largely to the relative underperformance of the Fund. The sectors that most negatively impacted the Fund’s performance during the reporting period were telecommunications and utilities. During a year of rather strong stock market returns, these sectors did not enjoy the higher level of growth that characterized the broader market, although they did provide a healthy stream of income for the Fund. The stocks that contributed most positively to the performance of the Fund during the year were Seagate Technology (sold), Time Warner Cable, Inc. (1.2%)* and Lyondellbasell Industries N.V. (1.3%)*. The stocks that most negatively impacted Fund performance during the year were Best Buy (sold), Windstream Corp. (1.2%)* and Banco Santander S.A. (sold). In general, the sale of covered calls as a hedging technique added to the performance of the Fund.
Performance data quoted represents past performance which is no guarantee of future results. Investment return and principal value will fluctuate so that an investor’s shares, when redeemed, may be worth more or less than their original cost. Performance for a variable investment option changes over time and current performance maybe lower or higher than what is stated. For current to the most recent month end performance, contact your insurance company.
| * | Percentage of holdings based on Fund’s net assets as of 12/31/2012. The composition of the Fund’s holdings is subject to change. |
| 1 | The S&P 500 VI is a capitalization-weighted index comprised of the stocks in the S&P 500 having the lowest price to book ratios and consists of approximately half of the S&P 500 on a market capitalization basis. The S&P multifactor methodology is used to score constituents, which are weighted according to market cap and classified as value. The index has a relatively low turnover. The index is unmanaged and, unlike the Fund, is not affected by cashflows. It is not possible to invest directly in an index. |
| 2 | The S&P 500 is a capitalization-weighted index comprised of 500 stocks and designed to measure performance of the broad domestic economy through changes in the aggregate market value of 500 stocks representing all major industries. The index is unmanaged and, unlike the Fund, is not affected by cashflows. It is not possible to invest directly in an index. |
There are no guarantees that dividend paying stocks will continue to pay dividends. In addition, dividend paying stocks may not experience the same capital appreciation potential as non-dividend paying stocks.
Huntington
VA International Equity Fund
Management’s Discussion of Fund Performance
Portfolio Manager: Paul W. Attwood, CFA
Vice President
Huntington Asset Advisors, Inc.
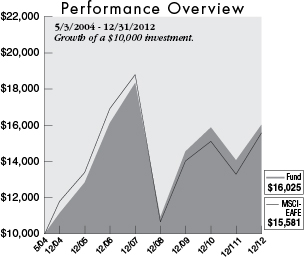
| | | | |
| | | Average Annual
Total Return for
the Period Ended
12/31/12 | |
1 Year | | | 14.04 | % |
3 Year | | | 3.27 | % |
5 Year | | | (2.66 | )% |
Start of Performance (5/3/04) | | | 5.59 | % |
The graph above illustrates the hypothetical investment of $10,000* in the Huntington VA International Equity Fund from May 3, 2004 (inception) to December 31, 2012, compared to the MSCI-EAFE.
The performance information does not include the charges and expenses imposed by the insurance company separate accounts or charges and expenses under the variable insurance product contracts. The inclusion of such charges would lower performance. Please refer to the variable insurance product prospectus for a complete listing of these expenses. The above expense ratio is from the Funds’ prospectus dated April 30, 2012. Additional information pertaining to the Fund’s expense ratio as of December 31, 2012 can be found in the financial highlights. For the fiscal year ended December 31, 2012, Fund shares were available exclusively as a funding vehicle for Hartford Life Insurance Company’s separate accounts in connection with the Huntington Director, Huntington Director Outlook and Huntington Hartford Leaders Outlook variable annuity contracts, Transamerica Life Insurance Company’s separate accounts in connection with the Huntington Allstar Select variable annuity contract, and to the separate accounts of Nationwide Life and Annuity Insurance Company, Nationwide Life Insurance Company and Sun Life Assurance Company of Canada (U.S.). Variable investment options are not obligations of or guaranteed by any bank and are not federally insured.
| * | The Fund’s performance assumes the reinvestment of all dividends and distributions. The MSCI-EAFE has been adjusted to reflect reinvestment of all dividends on securities in the index. |
For the fiscal year ended December 31, 2012, the Huntington VA International Equity Fund produced a total return of 14.04% based on net asset value. This underperformed the total return of 17.32% for the Morgan Stanley Capital International Europe, Australasia and Far East Index (MSCI-EAFE)1, the Fund’s benchmark index for the same period.
The underperformance of the Fund was attributable to an overweight in weaker global markets such as Japan and the United Kingdom. Allocation to the telecommunication and energy sector also affected relative performance.
Surprisingly, the top 3 performing countries in the Index were all European: Belgium (+36%), Denmark (+30%) and Germany (+27%). With the almost daily headlines coming out of Europe with regards to the collapse in sovereign debt prices, it is surprising that these markets were able to weather the storm and produce phenomenal returns for the year. On the flipside, as is to be expected, three of the bottom four performers were also European: Greece (-1%), Portugal (-1%) and Spain (-3%). Considering the potentially disastrous outcome from a collapse in both the Euro currency and the related Government debt, the equity markets were able to look through the morass to what appears to be a brighter future.
Within the top five holdings contributing to performance, three of the names were financial: Barclays PLC (0.6%)*, BNP Paribas (0.5%)* and AXA SA (0.5%)*. This is not surprising considering that the financial sector was the best performer in the MSCI-EAFE Index, with a price appreciation of over 28%. The weaker areas in the index were utilities (-1%), energy (-4%) and telecommunication services (-6%). This was reflected in the performance of the stocks in the Fund which were a drag on performance, namely BG Group PLC (0.3%)*.
With the exception of the weak Japanese Yen (-11%), most currencies had a beneficial effect on overall return. Of the G10 countries, only Japan was weaker against the U.S Dollar in 2012.
Performance data quoted represents past performance which is no guarantee of future results. Investment return and principal value will fluctuate so that an investor’s shares, when redeemed, may be worth more or less than their original cost. Performance for a variable investment option changes over time and current performance maybe lower or higher than what is stated. For current to the most recent month end performance, contact your insurance company. Performance data quoted represents past performance which is no guarantee of future results. Investment return and principal value will fluctuate so that an investor’s shares, when redeemed, may be worth more or less than their original cost. Performance for a variable investment option changes over time and current performance maybe lower or higher than what is stated. For current to the most recent month end performance, contact your insurance company.
| * | Percentage of holdings based on Fund’s net assets as 12/31/2012. The composition of the Fund’s holdings is subject to change. |
| 1 | The MSCI-EAFE is a market capitalization-weighted equity index comprising 20 of the 48 countries in the MSCI universe and representing the developed world outside of North America. Each MSCI country index is created separately, then aggregated, without change, into regional MSCI indices. The index is unmanaged and, unlike the Fund, is not affected by cash flows. It is not possible to invest directly in an index. |
International investing involves special risks including currency risk, political risk, increased volatility of foreign securities, and differences in auditing and other financial standards. Prices of emerging markets securities can be significantly more than the prices of securities in developed countries and currency risk and political risks are accentuated in emerging markets.
Huntington
VA Macro 100 Fund
Management’s Discussion of Fund Performance
Portfolio Manager: Andrew Hagedorn,
Vice President and Senior Portfolio Manager
Huntington Asset Advisors, Inc.
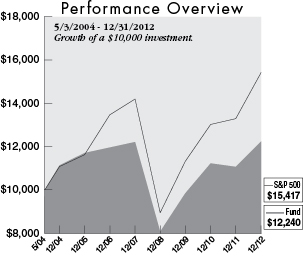
| | | | |
| | | Average Annual
Total Return for
the Period Ended
12/31/12 | |
1 Year | | | 10.61 | % |
3 Year | | | 7.59 | % |
5 Year | | | 0.06 | % |
Start of Performance (5/3/04) | | | 2.36 | % |
The graph above illustrates the hypothetical investment of $10,000* in the Huntington VA Macro 100 Fund from May 3, 2004 (inception) to December 31, 2012, compared to the S&P 500.
The performance information does not include the charges and expenses imposed by the insurance company separate accounts or charges and expenses under the variable insurance product contracts. The inclusion of such charges would lower performance. Please refer to the variable insurance product prospectus for a complete listing of these expenses. The above expense ratio is from the Funds’ prospectus dated April 30, 2012. Additional information pertaining to the Fund’s expense ratio as of December 31, 2012 can be found in the financial highlights. For the fiscal year ended December 31, 2012, Fund shares were available exclusively as a funding vehicle for Hartford Life Insurance Company’s separate accounts in connection with the Huntington Director, Huntington Director Outlook and Huntington Hartford Leaders Outlook variable annuity contracts, Transamerica Life Insurance Company’s separate accounts in connection with the Huntington Allstar Select variable annuity contract, and to the separate accounts of Nationwide Life and Annuity Insurance Company, Nationwide Life Insurance Company and Sun Life Assurance Company of Canada (U.S.). Variable investment options are not obligations of or guaranteed by any bank and are not federally insured.
| * | The Fund’s performance assumes the reinvestment of all dividends and distributions. The S&P 500 has been adjusted to reflect reinvestment of all dividends on securities in the index. |
For the fiscal year ended December 31, 2012, the Huntington VA Macro 100 Fund produced total return of 10.61%. The Fund underperformed the total return of 16.00% for the Standard & Poor’s 500 Index (S&P 500)1, the Fund’s benchmark index for the same period.
The Fund’s underperformance relative to the S&P 500 was, in large part, due to a low beta, high quality, high dividend approach for the Fund given what was thought to be a very volatile outlook for the market in 2012. The Fund had its largest underperformance in quarters where the stock market accelerated and had strong outperformance in quarters where the stock market decelerated due to the lower beta strategy. In November, the Huntington Funds Board of Trustees approved the reorganization of the VA Macro 100 Fund into the VA Dividend Capture Fund, which is scheduled to occur on March 28, 2013. We believe this will be in the best interest of the VA Macro 100 Fund’s shareholders, as the VA Dividend Capture Fund’s total annual operating expenses are expected to be lower than the respective total annual operating expenses of Huntington VA Macro 100 and equal to the Huntington VA Dividend Capture prior to the Reorganization. Moreover, following the Reorganization, Huntington VA Dividend Capture may achieve operating efficiencies due to the spreading of fixed costs over a larger pool of assets in the surviving Fund.
Performance data quoted represents past performance which is no guarantee of future results. Investment return and principal value will fluctuate so that an investor’s shares, when redeemed, may be worth more or less than their original cost. Performance for a variable investment option changes over time and current performance may be lower or higher than what is stated. For current to the most recent month end performance, contact your insurance company.
| 1 | The S&P 500 is a capitalization-weighted index comprised of 500 stocks and designed to measure performance of the broad domestic economy through changes in the aggregate market value of 500 stocks representing all major industries. The index is unmanaged and, unlike the Fund, is not affected by cashflows. It is not possible to invest directly in an index. |
The composition of the Fund’s holdings is subject to change.
Because the Fund invests in a limited number of holdings, an increase or decrease in the value of a single security may have a greater impact on the Fund’s net asset value and total return.
Huntington
VA Mid Corp America Fund
Management’s Discussion of Fund Performance
Portfolio Manager: Christopher M. Rowane, CFA, MBA
Senior Vice President
Huntington Asset Advisors, Inc.
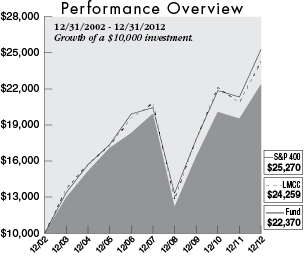
| | | | |
| | | Average Annual
Total Return for
the Period Ended
12/31/12 | |
1 Year | | | 14.59 | % |
3 Year | | | 11.01 | % |
5 Year | | | 2.35 | % |
10 Year | | | 8.38 | % |
The graph above illustrates the hypothetical investment of $10,000* in the Huntington VA Mid Corp America Fund from December 31, 2002 to December 31, 2012, compared to the S&P 400 and the LMCC.
The performance information does not include the charges and expenses imposed by the insurance company separate accounts or charges and expenses under the variable insurance product contracts. The inclusion of such charges would lower performance. Please refer to the variable insurance product prospectus for a complete listing of these expenses. The above expense ratio is from the Funds’ prospectus dated April 30, 2012. Additional information pertaining to the Fund’s expense ratio as of December 31, 2012 can be found in the financial highlights. For the fiscal year ended December 31, 2012, Fund shares were available exclusively as a funding vehicle for Hartford Life Insurance Company’s separate accounts in connection with the Huntington Director, Huntington Director Outlook and Huntington Hartford Leaders Outlook variable annuity contracts, Transamerica Life Insurance Company’s separate accounts in connection with the Huntington Allstar Select variable annuity contract, and to the separate accounts of Nationwide Life and Annuity Insurance Company, Nationwide Life Insurance Company and Sun Life Assurance Company of Canada (U.S.). Variable investment options are not obligations of or guaranteed by any bank and are not federally insured.
| * | The Fund’s performance assumes the reinvestment of all dividends and distributions. The S&P 400 and LMCC have been adjusted to reflect reinvestment of dividends on securities in the indices and average. |
For the fiscal year ended December 31, 2012, the Huntington VA Mid Corp America Fund produced a total return of 14.59% based on net asset value. In the same period, the Fund’s benchmark, the Standard & Poor’s MidCap 400 Index (S&P 400)1, produced a total return of 17.88%. The Lipper Mid Cap Core Average (LMCC)2 returned 15.59% for the same time period, reflecting Huntington VA Mid Corp America Fund’s close performance against its peer group.
The three holdings that had the largest positive contribution to the Fund’s performance were Timken Co. (1.8%)*, Mylan, Inc. (2.3%)* and Albemarle Corp. (1.5%)*. These three holdings added 0.94% to the Fund’s return. The three holdings that had the largest negative contribution to the Fund’s performance were Teradata Corp. (2.2%)*, Citrix Systems, Inc. (1.8%)* and ITT Educational Services, Inc. (0.2%)*. These three holdings subtracted 1.00% from the Fund’s return. The Fund’s sector strategy benefited from allocations in healthcare, consumer staples and energy. The funds underweight in the consumer discretionary sector as well as the security selections in that sector hampered the performance.
The equity market produced strong returns, especially in the mid-cap space, despite numerous levels of uncertainty from the U.S. Presidential election, European recession and Middle East conflicts. Mid-caps are primarily focused companies that operate and distribute on the domestic economy, which benefited from quantitative easing from the Federal Reserve.
Performance data quoted represents past performance which is no guarantee of future results. Investment return and principal value will fluctuate so that an investor’s shares, when redeemed, may be worth more or less than their original cost. Performance for a variable investment option changes over time and current performance may be lower or higher than what is stated. For current to the most recent month end performance, contact your insurance company.
| * | Percentage of holdings based on Fund’s net assets as of 12/31/2012. The composition of the Fund’s holdings is subject to change. |
| 1 | The S&P 400 is a capitalization weighted index comprised of common stocks representing all major industries in the mid-cap range of the U.S. stock market. The index is unmanaged and, unlike the Fund, is not affected by cashflows. It is not possible to invest directly in an index. |
| 2 | LMCC figures represent the average of the total returns reported by all of the mutual funds designated by Lipper Inc. as falling in the category indicated. They do not reflect sales charges. |
Mid-cap investing involves greater risk not associated with investing in more established companies, such as greater price volatility, business risk, less liquidity and increased competitive threat.
Huntington
VA Real Strategies Fund
Management’s Discussion of Fund Performance
Portfolio Manager: Peter Sorrentino, CFA
Vice President
Huntington Asset Advisors, Inc.
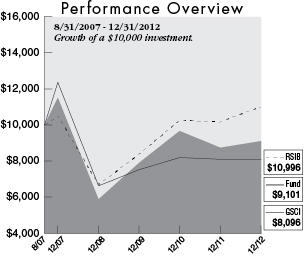
| | | | |
| | | Average Annual
Total Return for
the Period Ended
12/31/12 | |
1 Year | | | 4.34 | % |
3 Year | | | 4.82 | % |
5 Year | | | (4.57 | )% |
Start of Performance (8/31/07) | | | (1.75 | )% |
The graph above illustrates the hypothetical investment of $10,000* in the Huntington VA Real Strategies Fund from August 31, 2007 (inception) to December 31, 2012, compared to the S&P GSCI and RSIB.
The performance information does not include the charges and expenses imposed by the insurance company separate accounts or charges and expenses under the variable insurance product contracts. The inclusion of such charges would lower performance. Please refer to the variable insurance product prospectus for a complete listing of these expenses. The above expense ratios are from the Funds’ prospectus dated April 30, 2012. Additional information pertaining to the Fund’s expense ratio as of December 31, 2012 can be found in the financial highlights. For the fiscal year ended December 31, 2012, Fund shares were available exclusively as a funding vehicle for Hartford Life Insurance Company’s separate accounts in connection with the Huntington Director, Huntington Director Outlook and Huntington Hartford Leaders Outlook variable annuity contracts, Transamerica Life Insurance Company’s separate accounts in connection with the Huntington Allstar Select variable annuity contract, and to the separate accounts of Nationwide Life and Annuity Insurance Company, Nationwide Life Insurance Company and Sun Life Assurance Company of Canada (U.S.). Variable investment options are not obligations of or guaranteed by any bank and are not federally insured.
| * | The Fund’s performance assumes the reinvestment of all dividends and distributions. The S&P GSCI and the RSIB have been adjusted to reflect reinvestment of dividends on securities in the indices. |
For the fiscal year ended December 31, 2012, the Huntington VA Real Strategies produced a total return (not including the deduction of applicable sales charges) of 4.34%, based upon net asset value. The Fund outperformed its benchmark, the S&P GSCI® Index (S&P GSCI)1, which had a total return of 0.08% for the same period. The Fund underperformed the Real Strategies Indices Blend (RSIB)2, which returned 8.14% for the same period.
The Fund’s performance during the year was driven by a wide range of agricultural holdings. Three of the Fund’s top performing holdings were Agrium, Inc. (2.0%)* in the fertilizer arena, along with Valmont Industries, Inc. (2.5%)* and Lindsay Corp. (2.3%)*, both manufacturers of irrigation systems. Rounding out the Fund’s top five contributors were Dean Foods (sold) and Rayonier, Inc. (3.1%)*, both closely related to the agricultural industry. These investments represent the deliberate shift in emphasis of the portfolio from the areas of energy and industrial minerals to food related opportunities.
After an extended period of higher prices fueled global capacity additions, the Fund witnessed the price impact of those new volumes coming to market. This was particularly evident in 2012 for the prices in the energy and industrial metals markets. Coal producers were among those hard it as witnessed by the performance of the Fund’s holdings in Natural Resource Partners, down 31.6% and Adaro Energy, down 9.7%. The decline in energy prices impacted many of the Fund’s foreign holdings as the U.S. Dollar was stronger relative to resource exporters such as Canada, Brazil and Indonesia. The negative currency impact hurt the Fund’s holding in Canadian Natural Resources Ltd. (1.7%)*, Canadian Oil Sands Ltd. (1.9%)*, Cameco Corp. (1.2%)*, Vale SA (1.2%)*and BHP Billiton Ltd. (1.2%)*.
Following over a decade of strong price advances, gold and silver turned in modest returns for 2012. The Fund’s silver holdings gained just 7.8% followed by the gold positions gain of 7.3%. These modest returns were still far better than the fate of the gold mining stocks as evidenced by the 22.6% decline for shares of Barrick Gold Corp.
These returns bear out the shift in asset emphasis towards food and away from energy and metals.
Performance data quoted represents past performance which is no guarantee of future results. Investment return and principal value will fluctuate so that an investor’s shares, when redeemed, may be worth more or less than their original cost. Performance for a variable option changes over time and current performance may be lower or higher than what is stated. For current to the most recent month end performance, contact your insurance company.
| * | Percentage of holdings based on Fund’s net assets as of 12/31/2012. The composition of the Fund’s holdings is subject to change. |
| 1 | The S&P GSCI® Index measures general price movements and inflation in the world economy. The index is calculated primarily on a world production-weighted basis and is comprised of the principal physical commodities that are the subject of active, liquid futures markets. The index is unmanaged and, unlike the Fund, is not affected by cashflows. It is not possible to invest directly in an index. |
| 2 | The Real Strategies Indices Blend is a custom blended index comprised of the following two indices with their noted respective weightings: Reuters/Jefferies CRB Total Return Index (50%) and NAREIT Index (50%). The Reuters/Jefferies CRB Total Return Index is a commodity index, a basket of exchange-traded futures contract representing long-only positions in underlying commodities. Indices typically include a variety of commodity sectors to provide investors broader exposure to commodities as an asset class and free the investor from the mechanics of future trading (e.g., contract rolling and physical delivery). The index return does not reflect the deduction of expenses, which have been deducted from the Fund’s returns. The index return assumes reinvestment of all distributions and does not reflect the deduction of taxes and fees. Individuals cannot invest directly in the index, however, an individual can invest in exchange traded funds or other investment vehicles that attempt to track the performance of a benchmark index. The NAREIT represents returns for the National Association of Real Estate Investment Trust Equity Index. The indices are unmanaged and, unlike the Fund, are not affected by cashflows. |
Investments in real estate investment trusts (“REITs”) and real-estate related securities involve special risks associated with an investment in real estate, such as limited liquidity and interest rate risks and may be more volatile than other securities. In addition, the value of REITs and other real estate-related investments is sensitive to changes in real estate values, extended vacancies of properties and other environmental and economic factors.
Commodities-related investments are subject to the same risks as direct investments in commodities and prices may rise and fall in response to many factors such as economic, political and regulatory developments.
Funds whose investments are concentrated in a specific industry or sector may be subject to a higher degree of market risk than funds whose investments are diversified.
Huntington
VA Rotating Markets Fund
Management’s Discussion of Fund Performance
Portfolio Manager: Paul Koscik, JD
Vice President
Huntington Asset Advisors, Inc.
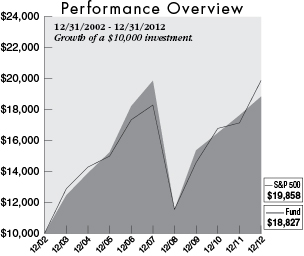
| | | | |
| | | Average Annual
Total Return for
the Period Ended
12/31/12 | |
1 Year | | | 6.94 | % |
3 year | | | 7.04 | % |
5 Year | | | (1.06 | )% |
10 Year | | | 6.53 | % |
The graph above illustrates the hypothetical investment of $10,000* in the Huntington VA Rotating Markets Fund from December 31, 2002 to December 31, 2012, compared to the S&P 500.
The performance information does not include the charges and expenses imposed by the insurance company separate accounts or changes and expenses under the variable insurance product contracts. The inclusion of such charges would lower performance. Please refer to the variable insurance product prospectus for a complete listing of these expenses. The above expense ratio is from the Funds’ prospectus dated April 30, 2012. Additional information pertaining to the Fund’s expense ratio as of December 31, 2012 can be found in the financial highlights. For the fiscal year ended December 31, 2012, Fund shares were available exclusively as a funding vehicle for Hartford Life Insurance Company’s separate accounts in connection with the Huntington Director, Huntington Director Outlook and Huntington Hartford Leaders Outlook variable annuity contracts, Transamerica Life Insurance Company’s separate accounts in connection with the Huntington Allstar Select variable annuity contract, and to the separate accounts of Nationwide Life and Annuity Insurance Company, Nationwide Life Insurance Company and Sun Life Assurance Company of Canada (U.S.). Variable investment options are not obligations of or guaranteed by any bank and are not federally insured.
| * | The Fund’s performance assumes the reinvestment of all dividends and distributions. The S&P 500 has been adjusted to reflect reinvestment of all dividends on securities in the index. |
For the fiscal year ended December 31, 2012, the Huntington VA Rotating Markets Fund produced a total return of 6.94% based on net asset value. In the same period, the Fund’s benchmark, the Standard & Poor’s 500 Index (S&P 500) 1, produced a total return of 16.00%.
The Fund began 2012 emulating the Dow Jones Industrial Average (DJIA). By the end of March, the DJIA began to underperform the S&P 500. Based on circumstances at that time, it was determined that the best index to emulate was the NASDAQ-100 Index. The reasoning behind the decision was that mid-caps, small-caps, and international indices were underperforming the S&P 500. The only major index outperforming the S&P 500 was the NASDAQ-100 Index. Initially, the rotation was beneficial, however, the NASDAQ-100 Index began to underperform the S&P 500 in September. The underperformance accelerated as leading stocks such as Apple, Microsoft, Oracle, Intel, and Cisco sold off sharply on fears of a weakening economy. For the last half of the year, the Fund returned only 2.2%.
Although 2012 was a difficult year for the Rotating Markets Fund, a long-term perspective is very important. The Fund has been in existence for over ten years and has rotated seven times since inception. In 2013, we intend to continue to follow our strategy of focusing on cyclical macroeconomic trends to identify the areas that have the potential to offer the best combination of risk/return potential over the next 12 months and rotate to a different market segment should we decide that it the best course of action for the Fund.
Performance data quoted represents past performance which is no guarantee of future results. Investment return and principal value will fluctuate so that an investor’s shares, when redeemed, may be worth more or less than their original cost. Performance for a variable investment option changes over time and current performance may be lower or higher than what is stated. For current to the most recent month end performance, contact your insurance company.
| 1 | The S&P 500 is a capitalization-weighted index comprised of 500 stocks and designed to measure performance of the broad domestic economy through changes in the aggregate market value of 500 stocks representing all major industries. The index is unmanaged and, unlike the Fund, is not affected by cashflows. It is not possible to invest directly in an Index. |
The composition of the Fund’s holdings is subject to change.
International investing involves special risks, including currency risk, increased volatility of foreign securities, political risks, and differences in auditing and other financial standards. Prices of emerging markets securities can be significantly more volatile than the prices of securities in developed countries and currency risk and political risks are accentuated in emerging markets. Small company stocks may be less liquid and subject to greater price volatility than large capitalization stocks.
Huntington
VA Situs Fund
Management’s Discussion of Fund Performance
Portfolio Manager: B. Randolph Bateman, CFA
Chief Investment Officer
Huntington Asset Advisors, Inc.
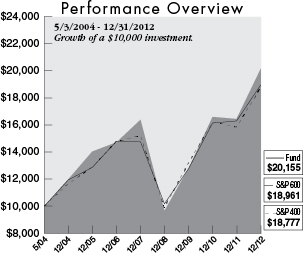
| | | | |
| | | Average Annual
Total Return for
the Period Ended
12/31/12 | |
1 Year | | | 22.63 | % |
3 Year | | | 16.35 | % |
5 Year | | | 4.24 | % |
Start of Performance (5/3/04) | | | 8.42 | % |
The graph above illustrates the hypothetical investment of $10,000* in the Huntington VA Situs Fund from May 3, 2004 (inception) to December 31, 2012, compared to the S&P 600 and the S&P 400.
The performance information does not include the charges and expenses imposed by the insurance company separate accounts or changes and expenses under the variable insurance product contracts. The inclusion of such charges would lower performance. Please refer to the variable insurance product prospectus for a complete listing of these expenses. The above expense ratio is from the Funds’ prospectus dated April 30, 2012. Additional information pertaining to the Fund’s expense ratio as of December 31, 2012 can be found in the financial highlights. For the fiscal year ended December 31, 2012, Fund shares were available exclusively as a funding vehicle for Hartford Life Insurance Company’s separate accounts in connection with the Huntington Director, Huntington Director Outlook and Huntington Hartford Leaders Outlook variable annuity contracts, Transamerica Life Insurance Company’s separate accounts in connection with the Huntington Allstar Select variable annuity contract, and to the separate accounts of Nationwide Life and Annuity Insurance Company, Nationwide Life Insurance Company and Sun Life Assurance Company of Canada (U.S.). Variable investment options are not obligations of or guaranteed by any bank and are not federally insured.
| * | The Fund’s performance assumes the reinvestment of all dividends and distributions. The S&P 600 and the S&P 400 indices have been adjusted to reflect reinvestment of dividends on securities in the indices. |
For the fiscal year ended December 31, 2012, the Huntington VA Situs Fund produced a total return of 22.63% based upon net asset value. The Fund significantly over performed its static benchmark, the Standard and Poor’s SmallCap 600 Index (S&P 600)1, which rose 16.32% for the same period. The Standard and Poor’s MidCap 400 Index (S&P 400)2 gained 17.88% for the same period. An attribution evaluation that Huntington Asset Advisors, Inc. conducts on all Huntington Funds, indicates that the Fund’s performance was primarily created by security selection, but also shows significant contribution from sector emphasis or avoidance as well.
The management contribution of performance over the benchmark for the Fund was 3.63%. That contribution was attributed to portfolio structure, of which 1.88% was sector allocation and 8.58% was individual stock selection. Since security selection was the primary contributor to overperformance, the larger holdings seemed to be the major drivers of performance. Geoscience Technologies Corp. added 4.36%, Cabela’s, Inc. contributed 2.21%, Flowserve Corp. rose 1.35% and a takeover, Asia Pacific Brewers Ltd. added 1.3% to the superior performance over the benchmark.
Despite significant uncertainty in the markets due to the economy, the Presidential election, tax uncertainty and international turmoil, investors still found value in the equity markets, which virtually all performed well. Going into 2013, we believe the markets will react to political efforts to reduce and control the budget deficit. The tax questions have been cleared a bit but the freezing of fiscal activities could be of investor concern. In reflection of the passage of the Sarbanes Oxley law earlier this century, the sweeping Healthcare Reform laws and the Dodd Frank regulations could create a spate of merger and acquisition activities. We are looking at ways to take advantage of the potential for smaller cap stocks to seek merger partners, to go private or otherwise seek to develop economies of scale. This scenario could uncover significant value in companies that the Fund holds.
Performance data quoted represents past performance which is no guarantee of future results. Investment return and principal value will fluctuate so that an investor’s shares, when redeemed, may be worth more or less than their original cost. Performance for a variable investment option changes over time and current performance may be lower or higher than what is stated. For current to the most recent month end performance, contact your insurance company.
| 1 | The S&P 600 is a capitalization-weighted index representing all major industries in the small-cap range of the U.S. stock market. The index is unmanaged and, unlike the Fund, is not affected by cashflows. It is not possible to invest directly in an index. |
| 2 | The S&P 400 is a capitalization-weighted index comprised of common stocks representing all major industries in the mid-range of the U.S. stock market. The index is unmanaged and, unlike the Fund, is not affected by cashflows. It is not possible to invest directly in an index. |
The composition of the Fund’s holdings is subject to change.
International investing involves special risks, including currency risk, increased volatility of foreign securities, political risks, and differences in auditing and other financial standards. Small company stocks may be less liquid and subject to greater price volatility than large capitalization stocks.
Funds whose investments are concentrated in a specific industry or sector may be subject to a higher degree of market risk than funds whose investments are diversified. In addition, the Fund may be subject to specific risks of the information technology sector, such as obsolescence.
Huntington
VA Mortgage Securities Fund
Management’s Discussion of Fund Performance
Co-Portfolio Managers: William G. Doughty, MBA
Vice President
Gustave J. Seasongood
Vice President
Huntington Asset Advisors, Inc.
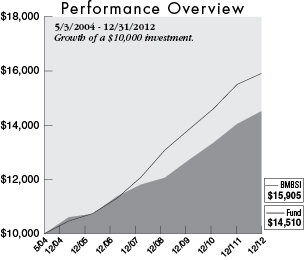
| | | | |
| | | Average Annual
Total Return for
the Period Ended
12/31/12 | |
1 Year | | | 3.35 | % |
3 Year | | | 4.51 | % |
5 Year | | | 4.22 | % |
Start of Performance (5/3/04) | | | 4.39 | % |
The graph above illustrates the hypothetical investment of $10,000* in the Huntington VA Mortgage Securities Fund from May 3, 2004 (inception) to December 31, 2012, compared to the BMBSI.
The performance information does not include the charges and expenses imposed by the insurance company separate accounts or changes and expenses under the variable insurance product contracts. The inclusion of such charges would lower performance. Please refer to the variable insurance product prospectus for a complete listing of these expenses. The above expense ratios are from the Funds’ prospectus dated April 30, 2012. Additional information pertaining to the Fund’s expense ratio as of December 31, 2012 can be found in the financial highlights. For the fiscal year ended December 31, 2012, Fund shares were available exclusively as a funding vehicle for Hartford Life Insurance Company’s separate accounts in connection with the Huntington Director, Huntington Director Outlook and Huntington Hartford Leaders Outlook variable annuity contracts, Transamerica Life Insurance Company’s separate accounts in connection with the Huntington Allstar Select variable annuity contract, and to the separate accounts of Nationwide Life and Annuity Insurance Company, Nationwide Life Insurance Company and Sun Life Assurance Company of Canada (U.S.). Variable investment options are not obligations of or guaranteed by any bank and are not federally insured.
| * | The Fund’s performance assumes the reinvestment of all dividends and distributions. The BMBSI has been adjusted to reflect reinvestment of dividends on securities in the index. |
For the fiscal year ended December 31, 2012, the Huntington VA Mortgage Securities Fund produced a return of 3.35%, based on net asset value. This compared to the total return of 2.59% for the Fund’s benchmark, the Barclays Capital Mortgage Backed Securities Index (BMBSI)1, and the Lipper U.S. Mortgage Funds Average2 return of 4.32% for the same reporting period.
During 2012, the mortgage market outperformed Treasury securities. Mortgage securities had a return of 2.59%, as measured by the BMBSI for the year, compared to a return of 2.16% for Treasuries. The Agency position had no impact on the Fund’s performance. The relative overperformance of the Fund compared to its benchmark was due to its more defensive nature and the concern of pre-payment risk due to lower interest rates, as well as faster prepayments. The 11% exposure to the Real Estate Investment Trust (REITs) market helped the Fund’s return. As measured by the NAREIT Index (NAREIT)3, REITs produced a return of 18.39%.
Performance data quoted represents past performance which is no guarantee of future results. Investment return and principal value will fluctuate so that an investor’s shares, when redeemed, may be worth more or less than their original cost. Performance for a variable investment option changes over time and current performance maybe lower or higher than what is stated. For current to the most recent month end performance, contact your insurance company.
| 1 | The BMBSI is composed of all fixed securities mortgage pools by the Government National Mortgage Association (GNMA), Federal National Mortgage Association and the Federal Home Loan Mortgage Corporation, including GNMA Graduated Payment Mortgages. The index is unmanaged and, unlike the Fund, is not affected by cashflows. It is not possible to invest directly in an index. |
| 2 | Lipper figures represent the average of the total returns reported by all of the mutual funds designated by Lipper Inc. as falling into the category indicated. They do not reflect sales charges. |
| 3 | The NAREIT Index represents returns for the National Association of Real Estate Investment Trust Equity Index. The index is unmanaged and, unlike the Fund, is not affected by cashflows. It is not possible to invest directly in an Index. |
The composition of the Fund’s holdings is subject to change.
Bond prices are sensitive to changes in interest rates, and a rise in interest rates can cause a decline in their prices.
Investments in real estate investment trusts (“REITs”) involve special risks associated with an investment in real estate such as limited liquidity and interest rate risk. In addition, the value of REITs and other real estate-related investments is sensitive to changes in real estate values, extended vacancies of properties and other environmental and economic factors.
Huntington VA Balanced Fund
Portfolio of Investments Summary Table (Unaudited)
December 31, 2012
| | | | |
| Asset Allocation | | Percentage of
Market Value | |
Equity Mutual Funds1 | | | 60.1 | % |
Fixed Income Mutual Funds1 | | | 37.9 | % |
Cash1 | | | 2.0 | % |
| | | | |
Total | | | 100.0 | % |
| 1 | Investments in affiliated funds. |
Portfolio holdings and allocations are subject to change. Percentages in the table above, as of December 31, 2012, are based on total investments, which may differ from the percentages set forth below in the Portfolio of Investments which are computed using the Fund’s total net assets.
Portfolio of Investments
December 31, 2012
| | | | | | | | |
| Shares | | | | | Value | |
| | | | | | | | |
| | | | Mutual Funds — 97.9% (a) | | | | |
| | 613,274 | | | Huntington Fixed Income Securities Fund, Trust Shares | | $ | 13,927,448 | |
| | 164,477 | | | Huntington VA Dividend Capture Fund | | | 1,773,065 | |
| | 960,720 | | | Huntington VA Growth Fund | | | 7,993,194 | |
| | 552,873 | | | Huntington VA Income Equity Fund | | | 5,307,578 | |
| | 313,456 | | | Huntington VA International
Equity Fund | | | 4,460,478 | |
| | 228,464 | | | Huntington VA Macro 100 Fund | | | 2,220,675 | |
| | 192,536 | | | Huntington VA Mid Corp America Fund | | | 3,561,922 | |
| | 240,536 | | | Huntington VA Mortgage
Securities Fund | | | 2,876,808 | |
| | 73,657 | | | Huntington VA Situs Fund | | | 1,341,294 | |
| | | | | | | | |
| | | | Total Mutual Funds
(Cost $38,873,716) | | | 43,462,462 | |
| | | | | | | | |
| | | | | | | | |
| Shares | | | | | Value | |
| | | | | | | | |
| | | | Cash Equivalents — 2.1% | | | | |
| | 901,499 | | | Huntington U.S. Treasury Money Market Fund, Trust Shares, 0.050% (a) (b) | | $ | 901,499 | |
| | | | | | | | |
| | | | Total Cash Equivalents
(Cost $901,499) | | | 901,499 | |
| | | | | | | | |
| | | | Total Investments
(Cost $39,775,215) — 100.0% | | | 44,363,961 | |
| | | | | | | | |
| | | | Other Assets in Excess of
Liabilities — 0.0% | | | 18,744 | |
| | | | | | | | |
| | | | Net Assets — 100.0% | | $ | 44,382,705 | |
| | | | | | | | |
| (a) | Investment in affiliate. |
| (b) | Rate disclosed is the seven day yield as of December 31, 2012. |
See Notes which are an integral part of the Financial Statements.
Huntington VA Dividend Capture Fund
Portfolio of Investments Summary Table (Unaudited)
December 31, 2012
| | | | |
| Asset Allocation | | Percentage of
Market Value | |
Common Stocks | | | 74.3 | % |
Preferred Stocks | | | 20.2 | % |
Short-Term Securities Held as Collateral for Securities Lending | | | 3.1 | % |
Cash1 | | | 1.8 | % |
Exchange-Traded Funds | | | 0.6 | % |
| | | | |
Total | | | 100.0 | % |
| 1 | Investments in an affiliated money market fund. |
Portfolio holdings and allocations are subject to change. Percentages in the table above, as of December 31, 2012, are based on total investments, which may differ from the percentages set forth below in the Portfolio of Investments which are computed using the Fund’s total net assets.
The Portfolio of Investments are broken down by sectors, and these sectors do not represent industry categories for purposes of identifying “industry concentration” as described in the Investment Company Act of 1940, as amended.
Portfolio of Investments
December 31, 2012
| | | | | | | | |
| Shares | | | | | Value | |
| | | | | | | | |
| | | | Common Stocks — 76.7% | | | | |
| | | | Consumer Discretionary — 3.4% | | | | |
| | 5,250 | | | Comcast Corp., Class A | | $ | 196,245 | |
| | 11,750 | | | D.R. Horton, Inc. | | | 232,415 | |
| | 3,500 | | | Family Dollar Stores, Inc. | | | 221,935 | |
| | 7,250 | | | Genuine Parts Co. | | | 460,955 | |
| | | | | | | | |
| | | | 1,111,550 | |
| | | | | | | | |
| | | | Consumer Staples — 6.2% | | | | |
| | 4,750 | | | Colgate-Palmolive Co. | | | 496,565 | |
| | 4,250 | | | General Mills, Inc. | | | 171,743 | |
| | 3,250 | | | H.J. Heinz Co. | | | 187,460 | |
| | 2,250 | | | Kimberly-Clark Corp. | | | 189,968 | |
| | 7,500 | | | Kroger Co./The | | | 195,150 | |
| | 2,750 | | | Philip Morris International, Inc. | | | 230,010 | |
| | 11,500 | | | Sysco Corp. | | | 364,090 | |
| | 2,750 | | | Wal-Mart Stores, Inc. | | | 187,633 | |
| | | | | | | | |
| | | | 2,022,619 | |
| | | | | | | | |
| | | | Energy — 16.7% | | | | |
| | 13,750 | | | BP PLC ADR | | | 572,550 | |
| | 16,500 | | | Cenovus Energy, Inc. | | | 553,410 | |
| | 2,750 | | | Chevron Corp. | | | 297,385 | |
| | 7,250 | | | ConocoPhillips | | | 420,427 | |
| | 26,500 | | | Crosstex Energy LP | | | 385,310 | |
| | 17,250 | | | Enbridge Energy Partners LP (a) | | | 481,275 | |
| | 6,750 | | | Exxon Mobil Corp. | | | 584,212 | |
| | 8,000 | | | Linn Energy LLC | | | 281,920 | |
| | 7,500 | | | Magellan Midstream Partners LP | | | 323,925 | |
| | 10,000 | | | Marathon Oil Corp. | | | 306,600 | |
| | 4,000 | | | Plains All American Pipeline LP | | | 180,960 | |
| | 7,500 | | | Royal Dutch Shell PLC ADR | | | 517,125 | |
| | 7,000 | | | Spectra Energy Corp. | | | 191,660 | |
| | 4,750 | | | Sunoco Logistics Partners LP | | | 236,218 | |
| | 3,000 | | | Williams Partners LP (a) | | | 145,980 | |
| | | | | | | | |
| | | | 5,478,957 | |
| | | | | | | | |
| | | | Financials — 12.3% | | | | |
| | 10,750 | | | American Financial Group, Inc. | | | 424,840 | |
| | 7,500 | | | Bank of Montreal | | | 459,750 | |
| | | | | | | | |
| Shares | | | | | Value | |
| | | | | | | | |
| | | | Financials — (continued) | | | | |
| | 9,500 | | | Cullen/Frost Bankers, Inc. | | $ | 515,565 | |
| | 2,000 | | | Federated Investors, Inc., Class B (a) | | | 40,460 | |
| | 20,000 | | | Fulton Financial Corp. | | | 192,200 | |
| | 8,000 | | | JPMorgan Chase & Co. | | | 351,760 | |
| | 10,000 | | | Principal Financial Group, Inc. | | | 285,200 | |
| | 10,000 | | | Royal Bank of Canada | | | 603,000 | |
| | 9,500 | | | U.S. Bancorp | | | 303,430 | |
| | 5,250 | | | Unum Group | | | 109,305 | |
| | 8,000 | | | Waddell & Reed Financial, Inc., Class A | | | 278,560 | |
| | 14,000 | | | Wells Fargo & Co. | | | 478,520 | |
| | | | | | | | |
| | | | 4,042,590 | |
| | | | | | | | |
| | | | Health Care — 5.5% | | | | |
| | 9,500 | | | Abbott Laboratories | | | 622,250 | |
| | 10,000 | | | AstraZeneca PLC ADR | | | 472,700 | |
| | 2,250 | | | Becton, Dickinson & Co. | | | 175,928 | |
| | 10,000 | | | Cardinal Health, Inc. | | | 411,800 | |
| | 3,000 | | | Merck & Co., Inc. | | | 122,820 | |
| | | | | | | | |
| | | | 1,805,498 | |
| | | | | | | | |
| | | | Industrials — 7.1% | | | | |
| | 4,750 | | | 3M Co. | | | 441,037 | |
| | 13,500 | | | CSX Corp. | | | 266,355 | |
| | 9,750 | | | Republic Services, Inc. | | | 285,968 | |
| | 6,250 | | | Rockwell Automation, Inc. | | | 524,937 | |
| | 7,000 | | | Rockwell Collins, Inc. | | | 407,190 | |
| | 11,500 | | | Waste Management, Inc. | | | 388,010 | |
| | | | | | | | |
| | | | 2,313,497 | |
| | | | | | | | |
| | | | Information Technology — 5.6% | | | | |
| | 20,250 | | | Cisco Systems, Inc. | | | 397,912 | |
| | 1,250 | | | Harris Corp. | | | 61,200 | |
| | 24,500 | | | Intel Corp. | | | 505,435 | |
| | 13,000 | | | Microsoft Corp. | | | 347,490 | |
| | 12,250 | | | Paychex, Inc. | | | 381,465 | |
| | 6,000 | | | Total System Services, Inc. | | | 128,520 | |
| | | | | | | | |
| | | | 1,822,022 | |
| | | | | | | | |
See Notes which are an integral part of the Financial Statements.
Huntington VA Dividend Capture Fund
Portfolio of Investments (continued)
December 31, 2012
| | | | | | | | |
| Shares | | | | | Value | |
| | | | | | | | |
| | | | Common Stocks — (continued) | | | | |
| | | | Materials — 2.3% | | | | |
| | 7,250 | | | Freeport-McMoRan Copper & Gold, Inc. | | $ | 247,950 | |
| | 4,500 | | | Sensient Technologies Corp. | | | 160,020 | |
| | 11,750 | | | Sonoco Products Co. | | | 349,327 | |
| | | | | | | | |
| | | | 757,297 | |
| | | | | | | | |
| | | | Real Estate Investment Trusts — 11.6% | |
| | 6,500 | | | EastGroup Properties, Inc. | | | 349,765 | |
| | 7,250 | | | EPR Properties (a) | | | 334,297 | |
| | 3,000 | | | HCP, Inc. | | | 135,540 | |
| | 7,000 | | | Highwoods Properties, Inc. | | | 234,150 | |
| | 5,250 | | | Home Properties, Inc. | | | 321,878 | |
| | 19,000 | | | Kimco Realty Corp. | | | 367,080 | |
| | 7,500 | | | Liberty Property Trust | | | 268,275 | |
| | 2,500 | | | LTC Properties, Inc. | | | 87,975 | |
| | 9,500 | | | Mack-Cali Realty Corp. | | | 248,045 | |
| | 5,250 | | | Mid-America Apartment
Communities, Inc. | | | 339,937 | |
| | 3,500 | | | National Health Investors, Inc. | | | 197,855 | |
| | 3,250 | | | National Retail Properties, Inc. | | | 101,400 | |
| | 8,500 | | | Omega Healthcare Investors, Inc. | | | 202,725 | |
| | 5,000 | | | ProLogis, Inc. | | | 182,450 | |
| | 874 | | | Simon Property Group, Inc. | | | 138,171 | |
| | 4,500 | | | Ventas, Inc. | | | 291,240 | |
| | | | | | | | |
| | | | 3,800,783 | |
| | | | | | | | |
| | | | Telecommunication Services — 2.6% | | | | |
| | 15,250 | | | AT&T, Inc. | | | 514,077 | |
| | 8,000 | | | Verizon Communications, Inc. | | | 346,160 | |
| | | | | | | | |
| | | | 860,237 | |
| | | | | | | | |
| | | | Utilities — 3.4% | | | | |
| | 14,500 | | | CenterPoint Energy, Inc. | | | 279,125 | |
| | 16,750 | | | CMS Energy Corp. | | | 408,365 | |
| | 10,500 | | | PG&E Corp. | | | 421,890 | |
| | | | | | | | |
| | | | 1,109,380 | |
| | | | | | | | |
| | | | Total Common Stocks
(Cost $23,634,350) | | | 25,124,430 | |
| | | | | | | | |
| | | | Preferred Stocks — 20.9% | | | | |
| | | | Financials — 14.2% | | | | |
| | 15,000 | | | Allianz SE, 8.375% | | | 379,500 | |
| | 13,000 | | | American Financial Group, Inc., 7.000% | | | 348,790 | |
| | 6,500 | | | Ameriprise Financial, Inc., 7.750% | | | 178,555 | |
| | 11,500 | | | Axis Capital Holdings Ltd.,
Series C, 6.875% | | | 307,050 | |
| | 1,000 | | | BB&T Corp., 5.850% | | | 25,980 | |
| | 13,000 | | | Charles Schwab Corp./The,
Series B, 6.000% | | | 339,950 | |
| | 14,000 | | | Credit Suisse Guernsey, 7.900% | | | 355,040 | |
| | 17,000 | | | JPMorgan Chase Capital XXIX, 6.700% | | | 434,350 | |
| | 15,000 | | | KKR Financial Holdings LLC,
8.375%, 11/15/41 | | | 417,450 | |
| | 12,000 | | | M&T Capital Trust IV, 8.500% | | | 304,200 | |
| | 6,000 | | | PartnerRe Ltd., Series E, 7.250% | | | 162,180 | |
| | 16,000 | | | Prudential Financial, Inc., 9.000% | | | 413,120 | |
| | 14,000 | | | Raymond James Financial, Inc., 6.900% | | | 381,780 | |
| | 9,000 | | | Wells Fargo & Co., Series J, 8.000% | | | 264,150 | |
| | | | | | | | |
| Shares | | | | | Value | |
| | | | | | | | |
| | | | Financials — (continued) | | | | |
| | 13,000 | | | Wells Fargo Capital Trust XII, 7.875% | | $ | 329,290 | |
| | | | | | | | |
| | | | 4,641,385 | |
| | | | | | | | |
| | | | Real Estate Investment Trusts — 2.3% | |
| | 1,000 | | | Kimco Realty Corp., Series H, 6.900% | | | 26,630 | |
| | 3,000 | | | PS Business Parks, Inc.,
Series S, 6.450% | | | 79,110 | |
| | 8,000 | | | Realty Income Corp., Series F, 6.625% | | | 212,160 | |
| | 16,000 | | | Vornado Realty LP, 7.875% | | | 433,280 | |
| | | | | | | | |
| | | | 751,180 | |
| | | | | | | | |
| | | | Telecommunication Services — 1.4% | |
| | 17,000 | | | Qwest Corp., 7.500% | | | 458,490 | |
| | | | | | | | |
| | | | Utilities — 3.0% | | | | |
| | 14,000 | | | Dominion Resources, Inc.,
Class A, 8.375% | | | 377,020 | |
| | 23,000 | | | NextEra Energy Capital Holdings, Inc., Series F, 8.750% | | | 614,330 | |
| | | | | | | | |
| | | | 991,350 | |
| | | | | | | | |
| | | | Total Preferred Stocks
(Cost $6,693,327) | | | 6,842,405 | |
| | | | | | | | |
| | | | Exchange-Traded Funds — 0.6% | |
| | 2,000 | | | iShares S&P 500 Value Index Fund | | | 132,780 | |
| | 2,250 | | | Technology Select Sector
SPDR Fund (a) | | | 65,138 | |
| | | | | | | | |
| | | | Total Exchange-Traded Funds
(Cost $132,821) | | | 197,918 | |
| | | | | | | | |
| | | | Cash Equivalents — 1.8% | | | | |
| | 606,094 | | | Huntington U.S. Treasury Money Market Fund, Trust Shares,
0.050% (b) (c) | | | 606,094 | |
| | | | | | | | |
| | | | Total Cash Equivalents
(Cost $606,094) | | | 606,094 | |
| | | | | | | | |
| | | | Short-Term Securities Held as Collateral for Securities
Lending — 3.2% | | | | |
| | 1,060,536 | | | Fidelity Institutional Money Market Portfolio, Institutional
Class, 0.180% (c) | | | 1,060,536 | |
| | | | | | | | |
| | | | Total Short-Term Securities Held as Collateral for Securities Lending
(Cost $1,060,536) | | | 1,060,536 | |
| | | | | | | | |
| | | | Total Investments
(Cost $32,127,128) — 103.2% | | | 33,831,383 | |
| | | | | | | | |
| | | | Liabilities in Excess of Other
Assets — (3.2)% | | | (1,055,742 | ) |
| | | | | | | | |
| | | | Net Assets — 100.0% | | $ | 32,775,641 | |
| | | | | | | | |
| (a) | All or a portion of the security was on loan as of December 31, 2012. The total value of securities on loan as of December 31, 2012 was $1,039,741. |
| (b) | Investment in affiliate. |
| (c) | Rate disclosed is the seven day yield as of December 31, 2012. |
| | |
| ADR | | —American Depositary Receipt |
See Notes which are an integral part of the Financial Statements.
Huntington VA Growth Fund
Portfolio of Investments Summary Table (Unaudited)
December 31, 2012
| | | | |
| Asset Allocation | | Percentage of
Market Value | |
Information Technology | | | 34.0 | % |
Health Care | | | 15.8 | % |
Consumer Discretionary | | | 12.9 | % |
Consumer Staples | | | 11.3 | % |
Industrials | | | 6.0 | % |
Energy | | | 5.5 | % |
Financials | | | 4.5 | % |
Materials | | | 4.5 | % |
Real Estate Investment Trusts | | | 2.5 | % |
Cash1 | | | 1.3 | % |
Short-Term Securities Held as Collateral for Securities Lending | | | 1.0 | % |
Telecommunication Services | | | 0.5 | % |
Utilities | | | 0.2 | % |
| | | | |
Total | | | 100.0 | % |
| 1 | Investments in an affiliated money market fund. |
Portfolio holdings and allocations are subject to change. Percentages in the table above, as of December 31, 2012, are based on total investments, which may differ from the percentages set forth below in the Portfolio of Investments which are computed using the Fund’s total net assets.
The Portfolio of Investments Summary Table and the Portfolio of Investments are broken down by sectors, and these sectors do not represent industry categories for purposes of identifying “industry concentration” as described in the Investment Company Act of 1940, as amended.
Portfolio of Investments
December 31, 2012
| | | | | | | | |
| Shares | | | | | Value | |
| | | | | | | | |
| | | | Common Stocks — 93.4% | | | | |
| | | | Consumer Discretionary — 12.3% | | | | |
| | 4,820 | | | Comcast Corp., Class A | | $ | 180,172 | |
| | 8,950 | | | D.R. Horton, Inc. | | | 177,031 | |
| | 3,730 | | | Home Depot, Inc./The | | | 230,700 | |
| | 3,270 | | | Jarden Corp. * | | | 169,059 | |
| | 3,070 | | | Lululemon Athletica, Inc. * | | | 234,026 | |
| | 9,780 | | | Pulte Group, Inc. * | | | 177,605 | |
| | 1,970 | | | Tractor Supply Co. | | | 174,069 | |
| | 3,460 | | | Under Armour, Inc., Class A (a) * | | | 167,914 | |
| | 1,490 | | | VF Corp. | | | 224,945 | |
| | 3,310 | | | Viacom, Inc., Class B | | | 174,569 | |
| | 4,820 | | | Walt Disney Co./The | | | 239,988 | |
| | | | | | | | |
| | | | 2,150,078 | |
| | | | | | | | |
| | | | Consumer Staples — 10.9% | | | | |
| | 6,450 | | | Church & Dwight Co., Inc. | | | 345,526 | |
| | 3,540 | | | Costco Wholesale Corp. | | | 349,646 | |
| | 7,150 | | | CVS Caremark Corp. | | | 345,702 | |
| | 5,080 | | | Wal-Mart Stores, Inc. | | | 346,608 | |
| | 5,510 | | | Whole Foods Market, Inc. | | | 503,228 | |
| | | | | | | | |
| | | | 1,890,710 | |
| | | | | | | | |
| | | | Energy — 5.2% | | | | |
| | 3,130 | | | EOG Resources, Inc. | | | 378,073 | |
| | 4,230 | | | Marathon Petroleum Corp. | | | 266,490 | |
| | 7,800 | | | Valero Energy Corp. | | | 266,136 | |
| | | | | | | | |
| | | | 910,699 | |
| | | | | | | | |
| | | | Financials — 4.3% | | | | |
| | 1,940 | | | Berkshire Hathaway, Inc., Class B * | | | 174,018 | |
| | | | | | | | |
| Shares | | | | | Value | |
| | | | | | | | |
| | | | Financials — (continued) | | | | |
| | 990 | | | Chubb Corp./The | | $ | 74,567 | |
| | 640 | | | Goldman Sachs Group, Inc./The | | | 81,638 | |
| | 3,980 | | | JPMorgan Chase & Co. | | | 175,001 | |
| | 2,390 | | | MetLife, Inc. | | | 78,727 | |
| | 1,580 | | | Prudential Financial, Inc. | | | 84,261 | |
| | 2,540 | | | Wells Fargo & Co. | | | 86,817 | |
| | | | | | | | |
| | | | 755,029 | |
| | | | | | | | |
| | | | Health Care — 15.1% | | | | |
| | 5,910 | | | Abbott Laboratories | | | 387,105 | |
| | 7,060 | | | Baxter International, Inc. | | | 470,620 | |
| | 6,360 | | | Gilead Sciences, Inc. * | | | 467,142 | |
| | 2,270 | | | Johnson & Johnson | | | 159,127 | |
| | 2,682 | | | Novo-Nordisk A/S ADR | | | 437,729 | |
| | 12,650 | | | Pfizer, Inc. | | | 317,262 | |
| | 4,490 | | | Stryker Corp. | | | 246,142 | |
| | 1,780 | | | Watson Pharmaceutical, Inc. * | | | 153,080 | |
| | | | | | | | |
| | | | 2,638,207 | |
| | | | | | | | |
| | | | Industrials — 5.7% | | | | |
| | 860 | | | Caterpillar, Inc. | | | 77,039 | |
| | 1,630 | | | Cummins, Inc. | | | 176,611 | |
| | 3,620 | | | Deere & Co. | | | 312,840 | |
| | 3,050 | | | Illinois Tool Works, Inc. | | | 185,471 | |
| | 1,200 | | | W.W. Grainger, Inc. | | | 242,844 | |
| | | | | | | | |
| | | | 994,805 | |
| | | | | | | | |
| | | | Information Technology — 32.5% | | | | |
| | 4,680 | | | Accenture PLC, Class A | | | 311,220 | |
| | 1,682 | | | Apple, Inc. | | | 896,556 | |
See Notes which are an integral part of the Financial Statements.
Huntington VA Growth Fund
Portfolio of Investments (continued)
December 31, 2012
| | | | | | | | |
| Shares | | | | | Value | |
| | | | | | | | |
| | | | Common Stocks — (continued) | | | | |
| | | | Information Technology — (continued) | |
| | 10,050 | | | Broadcom Corp., Class A | | $ | 333,760 | |
| | 25,410 | | | Cisco Systems, Inc. | | | 499,306 | |
| | 2,560 | | | CommVault Systems, Inc. * | | | 178,458 | |
| | 10,740 | | | eBay, Inc. * | | | 547,955 | |
| | 7,050 | | | EMC Corp. * | | | 178,365 | |
| | 730 | | | Google, Inc., Class A * | | | 517,840 | |
| | 2,070 | | | NeuStar, Inc., Class A * | | | 86,795 | |
| | 13,660 | | | Oracle Corp. | | | 455,151 | |
| | 6,840 | | | QUALCOMM, Inc. | | | 424,217 | |
| | 5,280 | | | Rackspace Hosting, Inc. * | | | 392,146 | |
| | 20,390 | | | Taiwan Semiconductor Manufacturing Co. Ltd. ADR | | | 349,892 | |
| | 2,940 | | | Trimble Navigation Ltd. * | | | 175,753 | |
| | 2,190 | | | Visa, Inc., Class A | | | 331,960 | |
| | | | | | | | |
| | | | | | | 5,679,374 | |
| | | | | | | | |
| | | | Materials — 4.3% | | | | |
| | 3,890 | | | Ball Corp. | | | 174,078 | |
| | 1,510 | | | Eagle Materials, Inc. | | | 88,335 | |
| | 840 | | | Monsanto Co. | | | 79,506 | |
| | 1,550 | | | Nucor Corp. | | | 66,929 | |
| | 1,570 | | | Praxair, Inc. | | | 171,837 | |
| | 1,110 | | | Sherwin-Williams Co./The | | | 170,740 | |
| | | | | | | | |
| | | | 751,425 | |
| | | | | | | | |
| | | | Real Estate Investment Trusts — 2.4% | |
| | 990 | | | American Tower Corp. | | | 76,497 | |
| | 1,750 | | | HCP, Inc. | | | 79,065 | |
| | 1,300 | | | Health Care REIT, Inc. | | | 79,677 | |
| | 1,100 | | | Simon Property Group, Inc. | | | 173,899 | |
| | | | | | | | |
| | | | 409,138 | |
| | | | | | | | |
| | | | Telecommunication Services — 0.5% | | | | |
| | 2,350 | | | BT Group PLC ADR | | | 89,371 | |
| | | | | | | | |
| | | | Utilities — 0.2% | | | | |
| | 490 | | | Sempra Energy | | | 34,761 | |
| | | | | | | | |
| | | | Total Common Stocks
(Cost $14,781,287) | | | 16,303,597 | |
| | | | | | | | |
| | | | | | | | |
| Shares | | | | | Value | |
| | | | | | | | |
| | | | Cash Equivalents — 1.2% | | | | |
| | 211,690 | | | Huntington U.S. Treasury Money Market Fund, Trust Shares, 0.050% (b) (c) | | $ | 211,690 | |
| | | | | | | | |
| | | | Total Cash Equivalents
(Cost $211,690) | | | 211,690 | |
| | | | | | | | |
| | | | Short-Term Securities Held as Collateral for Securities
Lending — 0.9% | | | | |
| | 163,352 | | | Fidelity Institutional Money Market Portfolio, Institutional
Class, 0.180% (c) | | | 163,352 | |
| | | | | | | | |
| | | | Total Short-Term Securities Held as Collateral for Securities Lending
(Cost $163,352) | | | 163,352 | |
| | | | | | | | |
| | | | Total Investments
(Cost $15,156,329) — 95.5% | | | 16,678,639 | |
| | | | | | | | |
| | | | Other Assets in Excess of
Liabilities — 4.5% | | | 786,539 | |
| | | | | | | | |
| | | | Net Assets — 100.0% | | $ | 17,465,178 | |
| | | | | | | | |
| (a) | All or a portion of the security was on loan as of December 31, 2012. The total value of securities on loan as of December 31, 2012 was $160,149. |
| (b) | Investment in affiliate. |
| (c) | Rate disclosed is the seven day yield as of December 31, 2012. |
| * | Non-income producing security. |
| | |
| ADR | | —American Depositary Receipt |
See Notes which are an integral part of the Financial Statements.
Huntington VA Income Equity Fund
Portfolio of Investments Summary Table (Unaudited)
December 31, 2012
| | | | |
| Asset Allocation | | Percentage of
Market Value | |
Energy | | | 15.8 | % |
Financials | | | 14.4 | % |
Industrials | | | 9.2 | % |
Consumer Staples | | | 9.2 | % |
Short-Term Securities Held as Collateral for Securities Lending | | | 8.7 | % |
Information Technology | | | 8.6 | % |
Health Care | | | 6.8 | % |
Consumer Discretionary | | | 6.1 | % |
Real Estate Investment Trusts | | | 6.0 | % |
Utilities | | | 5.1 | % |
Materials | | | 3.5 | % |
Telecommunication Services | | | 3.4 | % |
Cash1 | | | 3.2 | % |
| | | | |
Total | | | 100.0 | % |
| 1 | Investments in an affiliated money market fund. |
Portfolio holdings and allocations are subject to change. Percentages in the table above, as of December 31, 2012, are based on total investments, which may differ from the percentages set forth below in the Portfolio of Investments which are computed using the Fund’s total net assets.
The Portfolio of Investments Summary Table and the Portfolio of Investments are broken down by sectors, and these sectors do not represent industry categories for purposes of identifying “industry concentration” as described in the Investment Company Act of 1940, as amended.
Portfolio of Investments
December 31, 2012
| | | | | | | | |
| Shares | | | | | Value | |
| | | | | | | | |
| | | | Common Stocks — 96.4% | | | | |
| | | | Consumer Discretionary — 6.7% | | | | |
| | 7,300 | | | Comcast Corp., Class A | | $ | 272,874 | |
| | 14,600 | | | Gannett Co., Inc. | | | 262,946 | |
| | 11,900 | | | Shaw Communications, Inc.,
Class B (a) | | | 273,462 | |
| | 10,400 | | | Thomson Reuters Corp. (a) | | | 302,224 | |
| | 2,500 | | | Time Warner Cable, Inc., Class A | | | 242,975 | |
| | | | | | | | |
| | | | 1,354,481 | |
| | | | | | | | |
| | | | Consumer Staples — 10.1% | | | | |
| | 8,800 | | | Altria Group, Inc. | | | 276,496 | |
| | 8,500 | | | Campbell Soup Co. (a) | | | 296,565 | |
| | 9,900 | | | ConAgra Foods, Inc. | | | 292,050 | |
| | 7,200 | | | General Mills, Inc. | | | 290,952 | |
| | 3,400 | | | Kimberly-Clark Corp. | | | 287,062 | |
| | 9,500 | | | Sysco Corp. | | | 300,770 | |
| | 8,000 | | | Walgreen Co. | | | 296,080 | |
| | | | | | | | |
| | | | 2,039,975 | |
| | | | | | | | |
| | | | Energy — 17.3% | | | | |
| | 5,700 | | | BP PLC ADR | | | 237,348 | |
| | 2,800 | | | Chevron Corp. | | | 302,792 | |
| | 2,800 | | | China Petroleum & Chemical Corp. ADR | | | 321,776 | |
| | 5,300 | | | ConocoPhillips | | | 307,347 | |
| | 5,400 | | | Eni SpA ADR (a) | | | 265,356 | |
| | 6,200 | | | Enterprise Products Partners LP | | | 310,496 | |
| | 3,500 | | | Exxon Mobil Corp. | | | 302,925 | |
| | 10,100 | | | Marathon Oil Corp. | | | 309,666 | |
| | | | | | | | |
| Shares | | | | | Value | |
| | | | | | | | |
| | | | Energy — (continued) | | | | |
| | 4,900 | | | Marathon Petroleum Corp. | | $ | 308,700 | |
| | 4,000 | | | Royal Dutch Shell PLC ADR | | | 275,800 | |
| | 4,800 | | | Total SA ADR | | | 249,648 | |
| | 9,000 | | | Valero Energy Corp. | | | 307,080 | |
| | | | | | | | |
| | | | 3,498,934 | |
| | | | | | | | |
| | | | Financials — 15.8% | | | | |
| | 5,100 | | | Bank of Montreal | | | 312,630 | |
| | 4,700 | | | Bank of Nova Scotia (a) | | | 272,036 | |
| | 8,600 | | | BB&T Corp. | | | 250,346 | |
| | 3,700 | | | Canadian Imperial Bank of Commerce (a) | | | 298,257 | |
| | 5,600 | | | HSBC Holdings PLC ADR | | | 297,192 | |
| | 6,500 | | | JPMorgan Chase & Co. | | | 285,805 | |
| | 4,500 | | | Royal Bank of Canada | | | 271,350 | |
| | 18,100 | | | SLM Corp. | | | 310,053 | |
| | 4,200 | | | Travelers Cos., Inc./The | | | 301,644 | |
| | 9,300 | | | U.S. Bancorp | | | 297,042 | |
| | 8,900 | | | Wells Fargo & Co. | | | 304,202 | |
| | | | | | | | |
| | | | 3,200,557 | |
| | | | | | | | |
| | | | Health Care — 7.4% | | | | |
| | 4,800 | | | Abbott Laboratories | | | 314,400 | |
| | 6,700 | | | AstraZeneca PLC ADR | | | 316,709 | |
| | 5,900 | | | Eli Lilly & Co. | | | 290,988 | |
| | 6,900 | | | Merck & Co., Inc. | | | 282,486 | |
| | 11,800 | | | Pfizer, Inc. | | | 295,944 | |
| | | | | | | | |
| | | | 1,500,527 | |
| | | | | | | | |
See Notes which are an integral part of the Financial Statements.
Huntington VA Income Equity Fund
Portfolio of Investments (continued)
December 31, 2012
| | | | | | | | |
| Shares | | | | | Value | |
| | | | | | | | |
| | | | Common Stocks — (continued) | | | | |
| | | | Industrials — 10.1% | | | | |
| | 3,300 | | | 3M Co. | | $ | 306,405 | |
| | 13,200 | | | CSX Corp. | | | 260,436 | |
| | 3,500 | | | Deere & Co. | | | 302,470 | |
| | 5,600 | | | Eaton Corp. PLC | | | 303,520 | |
| | 13,700 | | | General Electric Co. | | | 287,563 | |
| | 11,000 | | | Koninklijke (Royal) Philips
Electronics NV | | | 291,940 | |
| | 8,800 | | | Waste Management, Inc. | | | 296,912 | |
| | | | | | | | |
| | | | 2,049,246 | |
| | | | | | | | |
| | | | Information Technology — 9.4% | | | | |
| | 12,700 | | | CA, Inc. | | | 279,146 | |
| | 15,500 | | | Cisco Systems, Inc. | | | 304,575 | |
| | 6,100 | | | Harris Corp. | | | 298,656 | |
| | 17,500 | | | Hewlett-Packard Co. | | | 249,375 | |
| | 13,100 | | | Intel Corp. | | | 270,253 | |
| | 9,500 | | | Microsoft Corp. | | | 253,935 | |
| | 8,200 | | | Paychex, Inc. | | | 255,348 | |
| | | | | | | | |
| | | | 1,911,288 | |
| | | | | | | | |
| | | | Materials — 3.8% | | | | |
| | 5,700 | | | Du Pont (E.I.) de Nemours & Co. | | | 256,329 | |
| | 6,500 | | | International Paper Co. | | | 258,960 | |
| | 4,600 | | | Lyondellbasell Industries N.V. | | | 262,614 | |
| | | | | | | | |
| | | | 777,903 | |
| | | | | | | | |
| | | | Real Estate Investment Trusts — 6.6% | |
| | 6,400 | | | HCP, Inc. | | | 289,152 | |
| | 4,100 | | | Health Care REIT, Inc. | | | 251,289 | |
| | 12,000 | | | Hospitality Properties Trust | | | 281,040 | |
| | 12,500 | | | Kimco Realty Corp. | | | 241,500 | |
| | 10,300 | | | Mack-Cali Realty Corp. | | | 268,933 | |
| | | | | | | | |
| | | | 1,331,914 | |
| | | | | | | | |
| | | | Telecommunication Services — 3.7% | |
| | 7,600 | | | AT&T, Inc. | | | 256,196 | |
| | 5,900 | | | Verizon Communications, Inc. | | | 255,293 | |
| | 29,000 | | | Windstream Corp. (a) | | | 240,120 | |
| | | | | | | | |
| | | | 751,609 | |
| | | | | | | | |
| | | | Utilities — 5.5% | | | | |
| | 9,400 | | | Exelon Corp. | | | 279,556 | |
| | 6,900 | | | FirstEnergy Corp. | | | 288,144 | |
| | 6,900 | | | PG&E Corp. | | | 277,242 | |
| | 9,700 | | | PPL Corp. | | | 277,711 | |
| | | | | | | | |
| | | | 1,122,653 | |
| | | | | | | | |
| | | | Total Common Stocks
(Cost $17,609,786) | | | 19,539,087 | |
| | | | | | | | |
| | | | | | | | |
| Shares | | | | | Value | |
| | | | Cash Equivalents — 3.5% | | | | |
| | 712,658 | | | Huntington U.S. Treasury Money Market Fund, Trust
Shares, 0.050% (b) (c) | | $ | 712,658 | |
| | | | | | | | |
| | | | Total Cash Equivalents
(Cost $712,658) | | | 712,658 | |
| | | | | | | | |
| | | | Short-Term Securities Held as Collateral for Securities
Lending — 9.5% | | | | |
| | 1,923,852 | | | Fidelity Institutional Money Market Portfolio, Institutional
Class, 0.180% (c) | | | 1,923,852 | |
| | | | | | | | |
| | | | Total Short-Term Securities Held as Collateral for Securities Lending
(Cost $1,923,852) | | | 1,923,852 | |
| | | | | | | | |
| | | | Total Investments
(Cost $20,246,296) — 109.4% | | | 22,175,597 | |
| | | | | | | | |
| | | | Liabilities in Excess of
Other Assets — (9.4)% | | | (1,899,558 | ) |
| | | | | | | | |
| | | | Net Assets — 100.0% | | $ | 20,276,039 | |
| | | | | | | | |
| (a) | All or a portion of the security was on loan as of December 31, 2012. The total value of securities on loan as of December 31, 2012 was $1,886,129. |
| (b) | Investment in affiliate. |
| (c) | Rate disclosed is the seven day yield as of December 31, 2012. |
ADR—American Depositary Receipt
See Notes which are an integral part of the Financial Statements.
Huntington VA International Equity Fund
Portfolio of Investments Summary Table (Unaudited)
December 31, 2012
| | | | |
| Asset Allocation | | Percentage of
Market Value | |
United Kingdom | | | 24.0 | % |
Japan | | | 12.4 | % |
France | | | 12.0 | % |
Germany | | | 7.2 | % |
Sweden | | | 5.6 | % |
Switzerland | | | 5.5 | % |
Singapore | | | 5.0 | % |
Short-Term Securities Held as Collateral for Securities Lending | | | 3.9 | % |
Cash1 | | | 3.6 | % |
Italy | | | 3.5 | % |
Australia | | | 3.3 | % |
Mexico | | | 3.2 | % |
Exchanged-Traded Funds | | | 3.0 | % |
Hong Kong | | | 2.0 | % |
Israel | | | 1.7 | % |
Taiwan | | | 1.5 | % |
Canada | | | 1.5 | % |
United States | | | 1.1 | % |
| | | | |
Total | | | 100.0 | % |
| 1 | Investments in an affiliated money market fund. |
Portfolio holdings and allocations are subject to change. Percentages in the table above, as of December 31, 2012, are based on total investments, which may differ from the percentages set forth below in the Portfolio of Investments which are computed using the Fund’s total net assets.
The Portfolio of Investments are broken down by sectors, and these sectors do not represent industry categories for purposes of identifying “industry concentration” as described in the Investment Company Act of 1940, as amended.
Portfolio of Investments
December 31, 2012
| | | | | | | | |
| Shares | | | | | Value+ | |
| | | | | | | | |
| | | | Common Stocks — 92.8% | | | | |
| | | | Australia — 3.4% | | | | |
| | | | Industrials — 1.5% | | | | |
| | 18,000 | | | Orica Ltd. | | $ | 474,113 | |
| | | | | | | | |
| | | | Materials — 1.9% | | | | |
| | 15,200 | | | BHP Billiton Ltd. | | | 594,170 | |
| | | | | | | | |
| | | | 1,068,283 | |
| | | | | | | | |
| | | | Canada — 1.5% | | | | |
| | | | Energy — 1.5% | | | | |
| | 14,170 | | | Cenovus Energy, Inc. | | | 475,262 | |
| | | | | | | | |
| | | | France — 12.4% | | | | |
| | | | Consumer Discretionary — 1.9% | | | | |
| | 6,000 | | | Cie Generale des Etablissements Michelin SCA | | | 574,727 | |
| | | | | | | | |
| | | | Energy — 2.3% | | | | |
| | 2,400 | | | Total SA | | | 124,839 | |
| | 11,100 | | | Total SA ADR (a) | | | 577,311 | |
| | | | | | | | |
| | | | 702,150 | |
| | | | | | | | |
| | | | Financials — 4.5% | | | | |
| | 38,509 | | | AXA SA ADR | | | 701,634 | |
| | 12,347 | | | BNP Paribas | | | 702,687 | |
| | | | | | | | |
| | | | 1,404,321 | |
| | | | | | | | |
| | | | | | | | |
| Shares | | | | | Value+ | |
| | | | | | | | |
| | | | France — (continued) | | | | |
| | | | Health Care — 2.4% | | | | |
| | 6,000 | | | Sanofi-Aventis ADR | | $ | 284,280 | |
| | 5,000 | | | Sanofi-Aventis | | | 473,996 | |
| | | | | | | | |
| | | | 758,276 | |
| | | | | | | | |
| | | | Utilities — 1.3% | | | | |
| | 10,600 | | | GDF Suez | | | 218,248 | |
| | 9,323 | | | GDF Suez SA ADR | | | 196,156 | |
| | | | | | | | |
| | | | 414,404 | |
| | | | | | | | |
| | | | 3,853,878 | |
| | | | | | | | |
| | | | Germany — 7.5% | | | | |
| | | | Consumer Staples — 2.1% | | | | |
| | 8,100 | | | Henkel AG & Co. KGaA | | | 666,179 | |
| | | | | | | | |
| | | | Energy — 1.6% | | | | |
| | 5,100 | | | BASF SE | | | 482,099 | |
| | | | | | | | |
| | | | Industrials — 3.8% | | | | |
| | 17,200 | | | GEA Group AG | | | 559,089 | |
| | 2,636 | | | Siemens AG ADR | | | 288,563 | |
| | 3,000 | | | Siemens AG | | | 327,945 | |
| | | | | | | | |
| | | | 1,175,597 | |
| | | | | | | | |
| | | | 2,323,875 | |
| | | | | | | | |
See Notes which are an integral part of the Financial Statements.
Huntington VA International Equity Fund
Portfolio of Investments (continued)
December 31, 2012
| | | | | | | | |
| Shares | | | | | Value+ | |
| | | | | | | | |
| | | | Common Stocks — (continued) | | | | |
| | | | Hong Kong — 2.1% | | | | |
| | | | Financials — 2.1% | | | | |
| | 79,800 | | | Wharf (Holdings) Ltd./The | | $ | 636,031 | |
| | | | | | | | |
| | | | Israel — 1.8% | | | | |
| | | | Health Care — 1.8% | | | | |
| | 14,900 | | | Teva Pharmaceutical Industries Ltd. ADR | | | 556,366 | |
| | | | | | | | |
| | | | Italy — 3.6% | | | | |
| | | | Energy — 3.6% | | | | |
| | 29,200 | | | Eni SpA | | | 715,095 | |
| | 10,600 | | | Saipem SpA | | | 412,768 | |
| | | | | | | | |
| | | | | | | 1,127,863 | |
| | | | | | | | |
| | | | Japan — 12.9% | | | | |
| | | | Consumer Discretionary — 2.2% | | | | |
| | 18,110 | | | Honda Motor Co. Ltd. ADR | | | 668,983 | |
| | | | | | | | |
| | | | Consumer Staples — 1.0% | | | | |
| | 6,000 | | | Unicharm Corp. | | | 311,392 | |
| | | | | | | | |
| | | | Industrials — 5.6% | | | | |
| | 3,400 | | | FANUC Ltd. | | | 631,767 | |
| | 46,000 | | | KUBOTA Corp. | | | 528,210 | |
| | 12,500 | | | Makita Corp. | | | 579,943 | |
| | | | | | | | |
| | | | | | | 1,739,920 | |
| | | | | | | | |
| | | | Information Technology — 4.1% | | | | |
| | 18,000 | | | Hoya Corp. | | | 354,221 | |
| | 1,870 | | | KEYENCE Corp. | | | 517,940 | |
| | 6,800 | | | Murata Manufacturing Co. Ltd. | | | 400,633 | |
| | | | | | | | |
| | | | | | | 1,272,794 | |
| | | | | | | | |
| | | | | | | 3,993,089 | |
| | | | | | | | |
| | | | Mexico — 3.3% | | | | |
| | | | Consumer Staples — 2.1% | | | | |
| | 6,500 | | | Fomento Economico Mexicano SAB de CV ADR | | | 654,550 | |
| | | | | | | | |
| | | | Telecommunication Services — 1.2% | |
| | 15,900 | | | America Movil SA de CV,
Series L ADR | | | 367,926 | |
| | | | | | | | |
| | | | | | | 1,022,476 | |
| | | | | | | | |
| | | | Singapore — 5.2% | | | | |
| | | | Financials — 1.8% | | | | |
| | 46,600 | | | DBS Group Holdings Ltd. | | | 572,161 | |
| | | | | | | | |
| | | | Industrials — 1.8% | | | | |
| | 60,300 | | | Keppel Corp Ltd. | | | 550,705 | |
| | | | | | | | |
| | | | Telecommunication Services — 1.6% | |
| | 17,805 | | | Singapore Telecommunications Ltd. ADR | | | 485,008 | |
| | | | | | | | |
| | | | 1,607,874 | |
| | | | | | | | |
| | | | Sweden — 5.8% | | | | |
| | | | Consumer Discretionary — 1.8% | | | | |
| | 16,600 | | | Hennes & Mauritz AB | | | 575,473 | |
| | | | | | | | |
| | | | | | | | |
| Shares | | | | | Value+ | |
| | | | | | | | |
| | | | Sweden — (continued) | | | | |
| | | | Industrials — 2.1% | | | | |
| | 46,300 | | | Volvo AB | | $ | 638,621 | |
| | | | | | | | |
| | | | Materials — 1.9% | | | | |
| | 27,700 | | | Svenska Cellulosa AB (SCA) | | | 602,445 | |
| | | | | | | | |
| | | | | | | 1,816,539 | |
| | | | | | | | |
| | | | Switzerland — 5.7% | | | | |
| | | | Financials — 1.4% | | | | |
| | 5,600 | | | ACE Ltd. | | | 446,880 | |
| | | | | | | | |
| | | | Health Care — 2.2% | | | | |
| | 10,590 | | | Novartis AG ADR (a) | | | 670,347 | |
| | | | | | | | |
| | | | Materials — 2.1% | | | | |
| | 8,030 | | | Syngenta AG ADR | | | 648,824 | |
| | | | | | | | |
| | | | | | | 1,766,051 | |
| | | | | | | | |
| | | | Taiwan — 1.6% | | | | |
| | | | Information Technology — 1.6% | | | | |
| | 29,077 | | | Taiwan Semiconductor Manufacturing Co. Ltd. ADR | | | 498,961 | |
| | | | | | | | |
| | | | United Kingdom — 24.9% | | | | |
| | | | Consumer Discretionary — 3.8% | | | | |
| | 68,000 | | | Greene King PLC | | | 697,003 | |
| | 24,750 | | | Pearson PLC ADR | | | 483,615 | |
| | | | | | | | |
| | | | | | | 1,180,618 | |
| | | | | | | | |
| | | | Consumer Staples — 4.0% | | | | |
| | 118,400 | | | Tesco PLC | | | 652,473 | |
| | 15,300 | | | Unilever PLC | | | 594,960 | |
| | | | | | | | |
| | | | | | | 1,247,433 | |
| | | | | | | | |
| | | | Energy — 1.4% | | | | |
| | 26,550 | | | BG Group PLC ADR | | | 443,651 | |
| | | | | | | | |
| | | | Financials — 6.3% | | | | |
| | 190,000 | | | Barclays PLC | | | 825,682 | |
| | 10,000 | | | HSBC Holdings PLC ADR | | | 530,700 | |
| | 23,000 | | | Standard Chartered PLC | | | 595,469 | |
| | | | | | | | |
| | | | | | | 1,951,851 | |
| | | | | | | | |
| | | | Health Care — 2.7% | | | | |
| | 6,200 | | | AstraZeneca PLC ADR | | | 293,074 | |
| | 12,645 | | | GlaxoSmithKline PLC ADR | | | 549,678 | |
| | | | | | | | |
| | | | | | | 842,752 | |
| | | | | | | | |
| | | | Industrials — 1.9% | | | | |
| | 41,900 | | | Rolls-Royce Holdings PLC * | | | 601,225 | |
| | | | | | | | |
| | | | Telecommunication Services — 2.9% | |
| | 107,000 | | | BT Group PLC | | | 408,388 | |
| | 194,000 | | | Vodafone Group PLC | | | 488,542 | |
| | | | | | | | |
| | | | | | | 896,930 | |
| | | | | | | | |
| | | | Utilities — 1.9% | | | | |
| | 8,525 | | | SSE PLC ADR | | | 198,292 | |
| | 16,100 | | | SSE PLC | | | 374,700 | |
| | | | | | | | |
| | | | | | | 572,992 | |
| | | | | | | | |
| | | | | | | 7,737,452 | |
| | | | | | | | |
See Notes which are an integral part of the Financial Statements.
Huntington VA International Equity Fund
Portfolio of Investments (continued)
December 31, 2012
| | | | | | | | |
| Shares | | | | | Value+ | |
| | | | | | | | |
| | | | Common Stocks — (continued) | | | | |
| | | | United States — 1.1% | | | | |
| | | | Energy — 1.1% | | | | |
| | 5,080 | | | Schlumberger Ltd. | | $ | 351,993 | |
| | | | | | | | |
| | | | Total Common Stocks
(Cost $24,848,825) | | | 28,835,993 | |
| | | | | | | | |
| | | | Exchange-Traded Funds — 3.2% | |
| | | | | | | | |
| | 20,000 | | | iShares MSCI Malaysia Index Fund | | | 302,600 | |
| | 6,000 | | | iShares MSCI South Korea Index Fund | | | 380,160 | |
| | 22,100 | | | iShares MSCI Taiwan Index Fund | | | 301,002 | |
| | | | | | | | |
| | | | Total Exchange-Traded Funds
(Cost $789,815) | | | 983,762 | |
| | | | | | | | |
| | | | Cash Equivalents — 3.7% | | | | |
| | 1,158,404 | | | Huntington U.S. Treasury Money Market Fund, Trust
Shares, 0.050% (b) (c) | | | 1,158,404 | |
| | | | | | | | |
| | | | Total Cash Equivalents
(Cost $1,158,404) | | | 1,158,404 | |
| | | | | | | | |
| | | | | | | | |
| Shares | | | | | Value+ | |
| | | | Short-Term Securities Held as Collateral for Securities
Lending — 4.0% | | | | |
| | 1,244,288 | | | Fidelity Institutional Money Market Portfolio, Institutional Class, 0.180% (c) | | $ | 1,244,288 | |
| | | | | | | | |
| | | | Total Short-Term Securities Held as Collateral for Securities Lending
(Cost $1,244,288) | | | 1,244,288 | |
| | | | | | | | |
| | | | Total Investments
(Cost $28,041,332) — 103.7% | | | 32,222,447 | |
| | | | | | | | |
| | | | Liabilities in Excess of Other Assets — (3.7)% | | | (1,151,647 | ) |
| | | | | | | | |
| | | | Net Assets — 100.0% | | $ | 31,070,800 | |
| | | | | | | | |
| (a) | All or a portion of the security was on loan as of December 31, 2012. The total value of securities on loan as of December 31, 2012 was $1,230,430. |
| (b) | Investment in affiliate. |
| (c) | Rate disclosed is the seven day yield as of December 31, 2012. |
| * | Non-income producing security. |
| + | All securities, except those traded on United States (including ADRs) and Canadian exchanges, Cash Equivalents or Short-Term Securities were fair valued at December 31, 2012. |
ADR—American DepositaryReceipt
See Notes which are an integral part of the Financial Statements.
Huntington VA Macro 100 Fund
Portfolio of Investments Summary Table (Unaudited)
December 31, 2012
| | | | |
| Asset Allocation | | Percentage of
Market Value | |
Information Technology | | | 17.7 | % |
Energy | | | 12.0 | % |
Health Care | | | 11.3 | % |
Financials | | | 11.1 | % |
Industrials | | | 10.3 | % |
Consumer Staples | | | 9.4 | % |
Consumer Discretionary | | | 8.7 | % |
Cash1 | | | 7.2 | % |
Materials | | | 3.5 | % |
Utilities | | | 3.4 | % |
Telecommunication Services | | | 2.9 | % |
Short-Term Securities Held as Collateral for Securities Lending | | | 1.8 | % |
Real Estate Investment Trusts | | | 0.7 | % |
| | | | |
Total | | | 100.0 | % |
| 1 | Investments in an affiliated money market fund. |
Portfolio holdings and allocations are subject to change. Percentages in the table above, as of December 31, 2012, are based on total investments, which may differ from the percentages set forth below in the Portfolio of Investments which are computed using the Fund’s total net assets.
The Portfolio of Investments Summary Table and the Portfolio of Investments are broken down by sectors, and these sectors do not represent industry categories for purposes of identifying “industry concentration” as described in the Investment Company Act of 1940, as amended.
Portfolio of Investments
December 31, 2012
| | | | | | | | |
| Shares | | | | | Value | |
| | | | | | | | |
| | | | Common Stocks — 92.7% | | | | |
| | | | Consumer Discretionary — 8.8% | | | | |
| | 4,340 | | | D.R. Horton, Inc. | | $ | 85,845 | |
| | 4,500 | | | Goodyear Tire & Rubber Co./The * | | | 62,145 | |
| | 3,700 | | | International Game Technology | | | 52,429 | |
| | 2,330 | | | Leggett & Platt, Inc. | | | 63,423 | |
| | 2,000 | | | Marriott International, Inc., Class A | | | 74,540 | |
| | 4,230 | | | News Corp., Class A | | | 108,034 | |
| | 1,420 | | | Target Corp. | | | 84,021 | |
| | 950 | | | TJX Cos., Inc./The | | | 40,328 | |
| | 210 | | | VF Corp. | | | 31,704 | |
| | 1,325 | | | Viacom, Inc., Class B | | | 69,881 | |
| | | | | | | | |
| | | | | | | 672,350 | |
| | | | | | | | |
| | | | Consumer Staples — 9.6% | | | | |
| | 3,500 | | | Archer-Daniels-Midland Co. | | | 95,865 | |
| | 950 | | | Clorox Co./The | | | 69,559 | |
| | 650 | | | Colgate-Palmolive Co. | | | 67,951 | |
| | 2,590 | | | ConAgra Foods, Inc. | | | 76,405 | |
| | 3,820 | | | Kroger Co./The | | | 99,396 | |
| | 2,120 | | | Mondelez International, Inc., Class A | | | 53,996 | |
| | 1,160 | | | PepsiCo, Inc. | | | 79,379 | |
| | 2,440 | | | Walgreen Co. | | | 90,304 | |
| | 1,410 | | | Wal-Mart Stores, Inc. | | | 96,204 | |
| | | | | | | | |
| | | | | | | 729,059 | |
| | | | | | | | |
| | | | Energy — 12.3% | | | | |
| | 630 | | | Anadarko Petroleum Corp. | | | 46,815 | |
| | 430 | | | Apache Corp. | | | 33,755 | |
| | 1,060 | | | Chevron Corp. | | | 114,628 | |
| | 1,300 | | | ConocoPhillips | | | 75,387 | |
| | | | | | | | |
| Shares | | | | | Value | |
| | | | | | | | |
| | | | Energy — (continued) | | | | |
| | 1,220 | | | Diamond Offshore Drilling, Inc. | | $ | 82,911 | |
| | 734 | | | Energy Transfer Partners LP | | | 31,511 | |
| | 2,013 | | | Exxon Mobil Corp. | | | 174,225 | |
| | 1,940 | | | Marathon Oil Corp. | | | 59,480 | |
| | 1,600 | | | Marathon Petroleum Corp. | | | 100,800 | |
| | 1,200 | | | Murphy Oil Corp. | | | 71,460 | |
| | 3,050 | | | Peabody Energy Corp. | | | 81,161 | |
| | 1,350 | | | Tesoro Corp. | | | 59,468 | |
| | | | | | | | |
| | | | | | | 931,601 | |
| | | | | | | | |
| | | | Financials — 11.3% | | | | |
| | 2,530 | | | Allstate Corp./The | | | 101,630 | |
| | 1,430 | | | American Express Co. | | | 82,196 | |
| | 2,650 | | | BB&T Corp. | | | 77,142 | |
| | 1,080 | | | Berkshire Hathaway, Inc., Class B * | | | 96,876 | |
| | 1,870 | | | Discover Financial Services | | | 72,089 | |
| | 2,400 | | | Federated Investors, Inc., Class B (a) | | | 48,552 | |
| | 1,100 | | | PNC Financial Services Group, Inc. | | | 64,141 | |
| | 1,470 | | | State Street Corp. | | | 69,105 | |
| | 1,050 | | | Torchmark Corp. | | | 54,254 | |
| | 2,010 | | | U.S. Bancorp | | | 64,199 | |
| | 2,120 | | | Unum Group | | | 44,138 | |
| | 2,530 | | | Wells Fargo & Co. | | | 86,475 | |
| | | | | | | | |
| | | | | | | 860,797 | |
| | | | | | | | |
| | | | Health Care — 11.5% | | | | |
| | 530 | | | Amgen, Inc. | | | 45,750 | |
| | 1,280 | | | Baxter International, Inc. | | | 85,325 | |
| | 860 | | | Becton, Dickinson & Co. | | | 67,243 | |
| | 1,740 | | | Eli Lilly & Co. | | | 85,817 | |
See Notes which are an integral part of the Financial Statements.
Huntington VA Macro 100 Fund
Portfolio of Investments (continued)
December 31, 2012
| | | | | | | | |
| Shares | | | | | Value | |
| | | | | | | | |
| | | | Common Stocks — (continued) | | | | |
| | | | Health Care — (continued) | | | | |
| | 2,640 | | | Forest Laboratories, Inc. * | | $ | 93,245 | |
| | 1,060 | | | Johnson & Johnson | | | 74,306 | |
| | 790 | | | McKesson Corp. | | | 76,598 | |
| | 2,430 | | | Medtronic, Inc. | | | 99,679 | |
| | 2,000 | | | Merck & Co., Inc. | | | 81,880 | |
| | 2,180 | | | Patterson Cos., Inc. | | | 74,621 | |
| | 2,645 | | | Tenet Healthcare Corp. * | | | 85,883 | |
| | | | | | | | |
| | | | | | | 870,347 | |
| | | | | | | | |
| | | | Industrials — 10.5% | | | | |
| | 780 | | | 3M Co. | | | 72,423 | |
| | 310 | | | Caterpillar, Inc. | | | 27,770 | |
| | 850 | | | Deere & Co. | | | 73,457 | |
| | 1,000 | | | Fluor Corp. | | | 58,740 | |
| | 2,500 | | | General Electric Co. | | | 52,475 | |
| | 1,160 | | | Honeywell International, Inc. | | | 73,625 | |
| | 2,292 | | | Iron Mountain, Inc. | | | 71,167 | |
| | 960 | | | L-3 Communications Holdings, Inc. | | | 73,555 | |
| | 540 | | | Pall Corp. | | | 32,540 | |
| | 2,120 | | | Quanta Services, Inc. * | | | 57,855 | |
| | 4,000 | | | R.R. Donnelley & Sons Co. (a) | | | 36,000 | |
| | 580 | | | Stericycle, Inc. * | | | 54,097 | |
| | 500 | | | Union Pacific Corp. | | | 62,860 | |
| | 710 | | | United Parcel Service, Inc., Class B | | | 52,348 | |
| | | | | | | | |
| | | | 798,912 | |
| | | | | | | | |
| | | | Information Technology — 18.0% | | | | |
| | 6,500 | | | Advanced Micro Devices, Inc. (a) * | | | 15,600 | |
| | 2,280 | | | Analog Devices, Inc. | | | 95,897 | |
| | 440 | | | Apple, Inc. | | | 234,533 | |
| | 5,990 | | | Applied Materials, Inc. | | | 68,526 | |
| | 1,950 | | | Autodesk, Inc. * | | | 68,933 | |
| | 4,960 | | | Cisco Systems, Inc. | | | 97,464 | |
| | 630 | | | Cognizant Technology Solutions Corp., Class A * | | | 46,652 | |
| | 3,390 | | | Corning, Inc. | | | 42,782 | |
| | 140 | | | Google, Inc., Class A * | | | 99,312 | |
| | 3,400 | | | Hewlett-Packard Co. | | | 48,450 | |
| | 3,700 | | | Intel Corp. | | | 76,331 | |
| | 585 | | | International Business Machines Corp. | | | 112,057 | |
| | 1,800 | | | KLA-Tencor Corp. | | | 85,968 | |
| | 3,910 | | | Microsoft Corp. | | | 104,514 | |
| | 4,570 | | | NVIDIA Corp. | | | 56,165 | |
| | 1,100 | | | Oracle Corp. | | | 36,652 | |
| | 7,110 | | | SAIC, Inc. | | | 80,485 | |
| | | | | | | | |
| | | | 1,370,321 | |
| | | | | | | | |
| | | | Materials — 3.6% | | | | |
| | 1,590 | | | Bemis Co., Inc. | | | 53,201 | |
| | 2,620 | | | Dow Chemical Co./The | | | 84,678 | |
| | 2,420 | | | Freeport-McMoRan Copper & Gold, Inc. | | | 82,764 | |
| | 900 | | | Mosaic Co./The | | | 50,967 | |
| | | | | | | | |
| | | | 271,610 | |
| | | | | | | | |
| | | | Real Estate Investment
Trusts — 0.7% | | | | |
| | 2,700 | | | Kimco Realty Corp. | | | 52,164 | |
| | | | | | | | |
| | | | | | | | |
| Shares | | | | | Value | |
| | | | Telecommunication Services — 3.0% | | | | |
| | 2,120 | | | AT&T, Inc. | | $ | 71,465 | |
| | 850 | | | CenturyLink, Inc. | | | 33,252 | |
| | 5,200 | | | MetroPCS Communications, Inc. * | | | 51,688 | |
| | 1,640 | | | Verizon Communications, Inc. | | | 70,963 | |
| | | | | | | | |
| | | | 227,368 | |
| | | | | | | | |
| | | | Utilities — 3.4% | | | | |
| | 810 | | | Consolidated Edison, Inc. | | | 44,987 | |
| | 990 | | | Entergy Corp. | | | 63,113 | |
| | 2,120 | | | Pepco Holdings, Inc. (a) | | | 41,573 | |
| | 1,150 | | | Public Service Enterprise Group, Inc. | | | 35,190 | |
| | 700 | | | Southern Co. | | | 29,967 | |
| | 2,640 | | | TECO Energy, Inc. | | | 44,246 | |
| | | | | | | | |
| | | | 259,076 | |
| | | | | | | | |
| | | | Total Common Stocks
(Cost $6,245,846) | | | 7,043,605 | |
| | | | | | | | |
| | | | Cash Equivalents — 7.3% | | | | |
| | 556,435 | | | Huntington U.S. Treasury Money Market Fund, Trust Shares, 0.050% (b) (c) | | | 556,435 | |
| | | | | | | | |
| | | | Total Cash Equivalents
(Cost $556,435) | | | 556,435 | |
| | | | | | | | |
| | | | Short-Term Securities Held as Collateral for Securities
Lending — 1.8% | | | | |
| | 136,265 | | | Fidelity Institutional Money Market Portfolio, Institutional
Class, 0.180% (c) | | | 136,265 | |
| | | | | | | | |
| | | | Total Short-Term Securities Held as Collateral for Securities Lending
(Cost $136,265) | | | 136,265 | |
| | | | | | | | |
| | | | Total Investments
(Cost $6,938,546) — 101.8% | | | 7,736,305 | |
| | | | | | | | |
| | | | Liabilities in Excess of Other
Assets — (1.8)% | | | (139,423 | ) |
| | | | | | | | |
| | | | Net Assets — 100.0% | | $ | 7,596,882 | |
| | | | | | | | |
| (a) | All or a portion of the security was on loan as of December 31, 2012. The total value of securities on loan as of December 31, 2012 was $136,170. |
| (b) | Investment in affiliate. |
| (c) | Rate disclosed is the seven day yield as of December 31, 2012. |
| * | Non-income producing security. |
See Notes which are an integral part of the Financial Statements.
Huntington VA Mid Corp America Fund
Portfolio of Investments Summary Table (Unaudited)
December 31, 2012
| | | | |
| Asset Allocation | | Percentage of
Market Value | |
Information Technology | | | 17.9 | % |
Industrials | | | 15.1 | % |
Health Care | | | 12.7 | % |
Financials | | | 11.8 | % |
Consumer Discretionary | | | 8.5 | % |
Real Estate Investment Trusts | | | 6.9 | % |
Materials | | | 6.7 | % |
Energy | | | 6.4 | % |
Consumer Staples | | | 3.9 | % |
Utilities | | | 3.8 | % |
Cash1 | | | 3.0 | % |
Short-Term Securities Held as Collateral for Securities Lending | | | 2.9 | % |
Telecommunication Services | | | 0.4 | % |
| | | | |
Total | | | 100.0 | % |
| 1 | Investments in an affiliated money market fund. |
Portfolio holdings and allocations are subject to change. Percentages in the table above, as of December 31, 2012, are based on total investments, which may differ from the percentages set forth below in the Portfolio of Investments which are computed using the Fund’s total net assets.
The Portfolio of Investments Summary Table and the Portfolio of Investments are broken down by sectors, and these sectors do not represent industry categories for purposes of identifying “industry concentration” as described in the Investment Company Act of 1940, as amended.
Portfolio of Investments
December 31, 2012
| | | | | | | | |
| Shares | | | | | Value | |
| | | | | | | | |
| | | | Common Stocks — 97.0% | | | | |
| | | | Consumer Discretionary — 8.8% | | | | |
| | 1,210 | | | Advance Auto Parts, Inc. | | $ | 87,543 | |
| | 1,950 | | | American Public Education, Inc. (a) * | | | 70,415 | |
| | 4,420 | | | Bob Evans Farms, Inc. | | | 177,684 | |
| | 6,440 | | | D.R. Horton, Inc. | | | 127,383 | |
| | 7,060 | | | Iconix Brand Group, Inc. * | | | 157,579 | |
| | 3,150 | | | ITT Educational Services, Inc. (a) * | | | 54,527 | |
| | 4,530 | | | Kohl’s Corp. | | | 194,699 | |
| | 7,668 | | | Nordstrom, Inc. | | | 410,238 | |
| | 4,320 | | | PetSmart, Inc. | | | 295,229 | |
| | 1,150 | | | Ralph Lauren Corp. | | | 172,408 | |
| | 5,490 | | | Ross Stores, Inc. | | | 297,283 | |
| | 3,170 | | | Vitamin Shoppe, Inc. * | | | 181,831 | |
| | | | | | | | |
| | | | | | | 2,226,819 | |
| | | | | | | | |
| | | | Consumer Staples — 4.0% | | | | |
| | 4,800 | | | Church & Dwight Co., Inc. | | | 257,136 | |
| | 4,570 | | | Constellation Brands, Inc., Class A* | | | 161,732 | |
| | 8,100 | | | Dr. Pepper Snapple Group, Inc. | | | 357,858 | |
| | 6,230 | | | Harris Teeter Supermarkets, Inc. | | | 240,229 | |
| | | | | | | | |
| | | | | | | 1,016,955 | |
| | | | | | | | |
| | | | Energy — 6.6% | | | | |
| | 1,500 | | | Baker Hughes, Inc. | | | 61,260 | |
| | 9,328 | | | Chesapeake Energy Corp. | | | 155,031 | |
| | 5,680 | | | Helmerich & Payne, Inc. | | | 318,137 | |
| | 5,000 | | | Murphy Oil Corp. | | | 297,750 | |
| | 3,014 | | | Noble Energy, Inc. | | | 306,644 | |
| | 5,930 | | | Oceaneering International, Inc. | | | 318,975 | |
| | 1,831 | | | Superior Energy Services, Inc. * | | | 37,938 | |
| | | | | | | | |
| Shares | | | | | Value | |
| | | | | | | | |
| | | | Energy — (continued) | | | | |
| | 1,993 | | | Unit Corp. * | | $ | 89,785 | |
| | 6,438 | | | Weatherford International Ltd. * | | | 72,041 | |
| | | | | | | | |
| | | | | | | 1,657,561 | |
| | | | | | | | |
| | | | Financials — 12.1% | | | | |
| | 14,740 | | | Brown & Brown, Inc. | | | 375,280 | |
| | 4,840 | | | Community Bank System, Inc. | | | 132,422 | |
| | 4,740 | | | Cullen/Frost Bankers, Inc. | | | 257,240 | |
| | 8,950 | | | Discover Financial Services | | | 345,022 | |
| | 780 | | | Everest Re Group Ltd. | | | 85,761 | |
| | 25,920 | | | First Niagara Financial Group, Inc. | | | 205,546 | |
| | 3,800 | | | Invesco Ltd. | | | 99,142 | |
| | 1,700 | | | Jones Lang LaSalle, Inc. | | | 142,698 | |
| | 5,600 | | | Montpelier Re Holdings Ltd. | | | 128,016 | |
| | 7,940 | | | Principal Financial Group, Inc. | | | 226,449 | |
| | 5,930 | | | Prosperity Bancshares, Inc. | | | 249,060 | |
| | 1,950 | | | T. Rowe Price Group, Inc. | | | 127,004 | |
| | 8,060 | | | Torchmark Corp. | | | 416,460 | |
| | 13,228 | | | Unum Group | | | 275,407 | |
| | | | | | | | |
| | | | | | | 3,065,507 | |
| | | | | | | | |
| | | | Health Care — 13.1% | | | | |
| | 9,920 | | | AmerisourceBergen Corp. | | | 428,346 | |
| | 7,030 | | | Cepheid, Inc. (a) * | | | 237,684 | |
| | 2,540 | | | Computer Programs & Systems, Inc. | | | 127,864 | |
| | 10,856 | | | Life Technologies Corp. * | | | 532,812 | |
| | 21,100 | | | Mylan, Inc. * | | | 579,828 | |
| | 2,800 | | | Quest Diagnostics, Inc. | | | 163,156 | |
| | 9,510 | | | St. Jude Medical, Inc. | | | 343,691 | |
| | 4,983 | | | Thermo Fisher Scientific, Inc. | | | 317,816 | |
See Notes which are an integral part of the Financial Statements.
Huntington VA Mid Corp America Fund
Portfolio of Investments (continued)
December 31, 2012
| | | | | | | | |
| Shares | | | | | Value | |
| | | | | | | | |
| | | | Common Stocks — (continued) | | | | |
| | | | Health Care — (continued) | | | | |
| | 6,820 | | | Watson Pharmaceutical, Inc. * | | $ | 586,520 | |
| | | | | | | | |
| | | | | | | 3,317,717 | |
| | | | | | | | |
| | | | Industrials — 15.6% | | | | |
| | 1,775 | | | Alliant Techsystems, Inc. | | | 109,979 | |
| | 10,280 | | | Babcock & Wilcox Co. | | | 269,336 | |
| | 3,900 | | | BorgWarner, Inc. * | | | 279,318 | |
| | 5,300 | | | CNH Global NV * | | | 213,537 | |
| | 2,800 | | | Elbit Systems Ltd. | | | 112,140 | |
| | 550 | | | Flowserve Corp. | | | 80,740 | |
| | 11,340 | | | Jacobs Engineering Group, Inc. * | | | 482,744 | |
| | 9,400 | | | John Bean Technologies Corp. | | | 167,038 | |
| | 10,418 | | | Kennametal, Inc. | | | 416,720 | |
| | 4,134 | | | Parker Hannifin Corp. | | | 351,638 | |
| | 3,020 | | | Rockwell Automation, Inc. | | | 253,650 | |
| | 11,270 | | | Rollins, Inc. | | | 248,391 | |
| | 3,700 | | | Ryder System, Inc. | | | 184,741 | |
| | 2,010 | | | Stericycle, Inc. * | | | 187,473 | |
| | 9,640 | | | Timken Co. | | | 461,081 | |
| | 1,800 | | | UniFirst Corp. | | | 131,976 | |
| | | | | | | | |
| | | | 3,950,502 | |
| | | | | | | | |
| | | | Information Technology — 18.5% | | | | |
| | 1,900 | | | Amdocs Ltd. | | | 64,581 | |
| | 10,920 | | | Autodesk, Inc. * | | | 386,022 | |
| | 3,330 | | | BMC Software, Inc. * | | | 132,068 | |
| | 5,460 | | | Broadcom Corp., Class A | | | 181,327 | |
| | 7,110 | | | Citrix Systems, Inc. * | | | 467,482 | |
| | 9,400 | | | CTS Corp. | | | 99,922 | |
| | 5,805 | | | Fidelity National Information
Services, Inc. | | | 202,072 | |
| | 2,500 | | | Fiserv, Inc. * | | | 197,575 | |
| | 1,810 | | | FleetCor Technologies, Inc. * | | | 97,107 | |
| | 12,582 | | | FLIR Systems, Inc. | | | 280,704 | |
| | 5,800 | | | Harris Corp. | | | 283,968 | |
| | 4,830 | | | j2 Global, Inc. (a) | | | 147,701 | |
| | 4,550 | | | Molex, Inc. | | | 124,352 | |
| | 5,448 | | | NCR Corp. * | | | 138,815 | |
| | 3,100 | | | NetApp, Inc. * | | | 104,005 | |
| | 8,700 | | | NVIDIA Corp. | | | 106,923 | |
| | 19,720 | | | ON Semiconductor Corp. * | | | 139,026 | |
| | 7,690 | | | Paychex, Inc. | | | 239,467 | |
| | 4,560 | | | Progress Software Corp. * | | | 95,714 | |
| | 4,700 | | | Seagate Technology PLC | | | 143,256 | |
| | 9,400 | | | Synopsys, Inc. * | | | 299,296 | |
| | 3,600 | | | Syntel, Inc. | | | 192,924 | |
| | 8,868 | | | Teradata Corp. * | | | 548,841 | |
| | | | | | | | |
| | | | 4,673,148 | |
| | | | | | | | |
| | | | Materials — 6.9% | | | | |
| | 5,950 | | | Albemarle Corp. | | | 369,614 | |
| | 3,200 | | | AptarGroup, Inc. | | | 152,704 | |
| | 2,100 | | | Ball Corp. | | | 93,975 | |
| | 3,160 | | | Cia de Minas Buenaventura SA (a) | | | 113,602 | |
| | 9,500 | | | FMC Corp. | | | 555,940 | |
| | 2,150 | | | PPG Industries, Inc. | | | 291,002 | |
| | 1,700 | | | Silver Wheaton Corp. | | | 61,336 | |
| | | | | | | | |
| Shares | | | | | Value | |
| | | | Materials — (continued) | | | | |
| | 3,500 | | | Sonoco Products Co. | | $ | 104,055 | |
| | | | | | | | |
| | | | 1,742,228 | |
| | | | | | | | |
| | | | | | | | |
| | | | Real Estate Investment Trusts — 7.1% | |
| | 4,660 | | | EPR Properties (a) | | | 214,873 | |
| | 1,600 | | | Federal Realty Investment Trust | | | 166,432 | |
| | 3,970 | | | Highwoods Properties, Inc. | | | 132,797 | |
| | 2,100 | | | Home Properties, Inc. | | | 128,751 | |
| | 2,100 | | | Liberty Property Trust | | | 75,117 | |
| | 3,820 | | | Mack-Cali Realty Corp. | | | 99,740 | |
| | 18,400 | | | Medical Properties Trust, Inc. | | | 220,064 | |
| | 2,300 | | | Mid-America Apartment
Communities, Inc. | | | 148,925 | |
| | 2,940 | | | PS Business Parks, Inc. | | | 191,041 | |
| | 4,000 | | | Rayonier, Inc. | | | 207,320 | |
| | 3,240 | | | Sovran Self Storage, Inc. | | | 201,204 | |
| | | | | | | | |
| | | | 1,786,264 | |
| | | | | | | | |
| | | | Telecommunication Services — 0.4% | | | | |
| | 1,600 | | | TELUS Corp. | | | 104,224 | |
| | | | | | | | |
| | | | Utilities — 3.9% | | | | |
| | 5,870 | | | Alliant Energy Corp. | | | 257,752 | |
| | 11,240 | | | CMS Energy Corp. | | | 274,031 | |
| | 1,240 | | | DTE Energy Co. | | | 74,462 | |
| | 2,500 | | | New Jersey Resources Corp. | | | 99,050 | |
| | 5,900 | | | Portland General Electric Co. | | | 161,424 | |
| | 4,560 | | | Xcel Energy, Inc. | | | 121,798 | |
| | | | | | | | |
| | | | 988,517 | |
| | | | | | | | |
| | | | Total Common Stocks
(Cost $18,115,820) | | | 24,529,442 | |
| | | | | | | | |
| | | | Cash Equivalents — 3.1% | | | | |
| | 782,960 | | | Huntington U.S. Treasury Money Market Fund, Trust Shares, 0.050% (b) (c) | | | 782,960 | |
| | | | | | | | |
| | | | Total Cash Equivalents
(Cost $782,960) | | | 782,960 | |
| | | | | | | | |
| | | | Short-Term Securities Held as Collateral for Securities Lending — 3.0% | | | | |
| | 754,921 | | | Fidelity Institutional Money Market Portfolio, Institutional Class, 0.180% (c) | | | 754,921 | |
| | | | | | | | |
| | | | Total Short-Term Securities Held as Collateral for Securities Lending (Cost $754,921) | | | 754,921 | |
| | | | | | | | |
| | | | Total Investments
(Cost $19,653,701) — 103.1% | | | 26,067,323 | |
| | | | | | | | |
| | | | Liabilities in Excess of Other Assets — (3.1)% | | | (793,400 | ) |
| | | | | | | | |
| | | | Net Assets — 100.0% | | $ | 25,273,923 | |
| | | | | | | | |
| (a) | All or a portion of the security was on loan as of December 31, 2012. The total value of securities on loan as of December 31, 2012 was $750,024. |
| (b) | Investment in affiliate. |
| (c) | Rate disclosed is the seven day yield as of December 31, 2012. |
| * | Non-income producing security. |
See Notes which are an integral part of the Financial Statements.
Huntington VA Real Strategies Fund
Portfolio of Investments Summary Table (Unaudited)
December 31, 2012
| | | | |
| Asset Allocation | | Percentage of
Market Value | |
Energy | | | 25.8 | % |
Materials | | | 19.0 | % |
Industrials | | | 13.3 | % |
Short-Term Securities Held as Collateral for Securities Lending | | | 10.1 | % |
Real Estate Investment Trusts | | | 8.3 | % |
Exchange-Traded Funds | | | 6.4 | % |
Real Estate Investments | | | 5.5 | % |
Cash1 | | | 4.6 | % |
Consurmer Staples | | | 3.9 | % |
Closed-End Fund | | | 2.8 | % |
Warrants | | | 0.2 | % |
Options Purchased | | | 0.1 | % |
| | | | |
Total | | | 100.0 | % |
| 1 | Investments in an affiliated money market fund. |
Portfolio holdings and allocations are subject to change. Percentages in the table above, as of December 31, 2012, are based on total investments, which may differ from the percentages set forth below in the Portfolio of Investments which are computed using the Fund’s total net assets.
The Portfolio of Investments Summary Table and the Portfolio of Investments are broken down by sectors, and these sectors do not represent industry categories for purposes of identifying “industry concentration” as described in the Investment Company Act of 1940, as amended.
Portfolio of Investments
December 31, 2012
| | | | | | | | |
| Shares | | | | | Value | |
| | | | | | | | |
| | | | Common Stocks — 78.2% | | | | |
| | | | Consumer Staples — 4.3% | | | | |
| | 1,260 | | | Bunge Ltd. | | $ | 91,589 | |
| | 3,320 | | | Smithfield Foods, Inc. * | | | 71,612 | |
| | | | | | | | |
| | | | | | | 163,201 | |
| | | | | | | | |
| | | | Energy — 28.7% | | | | |
| | 7,400 | | | Adaro Energy Tbk PT | | | 61,420 | |
| | 2,400 | | | Cameco Corp. (a) | | | 47,328 | |
| | 2,300 | | | Canadian Natural Resources Ltd. | | | 66,401 | |
| | 3,500 | | | Canadian Oil Sands Ltd. (a) | | | 71,190 | |
| | 3,000 | | | Cheniere Energy, Inc. * | | | 56,340 | |
| | 3,870 | | | Chesapeake Energy Corp. | | | 64,319 | |
| | 1,770 | | | Enterprise Products Partners LP | | | 88,642 | |
| | 1,389 | | | Kinder Morgan, Inc. | | | 49,073 | |
| | 2,000 | | | Linn Energy LLC | | | 70,480 | |
| | 1,100 | | | National Oilwell Varco, Inc. | | | 75,185 | |
| | 3,000 | | | Natural Resource Partners LP | | | 55,620 | |
| | 1,600 | | | Sasol Ltd. ADR | | | 69,264 | |
| | 2,500 | | | Spectra Energy Corp. | | | 68,450 | |
| | 2,986 | | | Statoil ASA ADR | | | 74,770 | |
| | 1,600 | | | Tenaris SA ADR (a) | | | 67,072 | |
| | 1,100 | | | Transocean Ltd. | | | 49,115 | |
| | 21,300 | | | Uranium Energy Corp. (a) * | | | 54,528 | |
| | | | | | | | |
| | | | | | | 1,089,197 | |
| | | | | | | | |
| | | | Industrials — 14.8% | | | | |
| | 1,700 | | | AGCO Corp. * | | | 83,504 | |
| | 900 | | | Caterpillar, Inc. | | | 80,622 | |
| | 2,200 | | | Chicago Bridge & Iron Co. NV | | | 101,970 | |
| | 1,320 | | | Deere & Co. | | | 114,074 | |
| | | | | | | | |
| Shares | | | | | Value | |
| | | | | | | | |
| | | | Industrials — (continued) | | | | |
| | 1,100 | | | Lindsay Corp. | | $ | 88,132 | |
| | 700 | | | Valmont Industries, Inc. | | | 95,585 | |
| | | | | | | | |
| | | | | | | 563,887 | |
| | | | | | | | |
| | | | Materials — 21.1% | | | | |
| | 750 | | | Agrium, Inc. (a) | | | 74,933 | |
| | 2,300 | | | AngloGold Ashanti Ltd. ADR | | | 72,151 | |
| | 1,800 | | | Barrick Gold Corp. | | | 63,018 | |
| | 600 | | | BHP Billiton Ltd. ADR | | | 47,064 | |
| | 1,500 | | | Cliffs Natural Resources, Inc. (a) | | | 57,840 | |
| | 2,000 | | | Molycorp, Inc. (a) * | | | 18,880 | |
| | 1,310 | | | Potash Corporation of Saskatchewan, Inc. | | | 53,304 | |
| | 500 | | | Praxair, Inc. | | | 54,725 | |
| | 1,280 | | | Rio Tinto PLC ADR | | | 74,355 | |
| | 4,100 | | | Stillwater Mining Co. * | | | 52,398 | |
| | 800 | | | Syngenta AG ADR | | | 64,640 | |
| | 300 | | | Terra Nitrogen Co. LP | | | 64,227 | |
| | 2,200 | | | Vale SA ADR | | | 46,112 | |
| | 1,200 | | | Yara International ASA ADR | | | 59,688 | |
| | | | | | | | |
| | | | | | | 803,335 | |
| | | | | | | | |
| | | | Real Estate Investment Trusts — 9.3% | | | | |
| | 500 | | | AvalonBay Communities, Inc. | | | 67,795 | |
| | 5,100 | | | Duke Realty Corp. | | | 70,737 | |
| | 2,300 | | | Rayonier, Inc. | | | 119,209 | |
| | 3,400 | | | Weyerhaeuser Co. | | | 94,588 | |
| | | | | | | | |
| | | | | | | 352,329 | |
| | | | | | | | |
| | | | Total Common Stocks
(Cost $2,841,346) | | | 2,971,949 | |
| | | | | | | | |
See Notes which are an integral part of the Financial Statements.
Huntington VA Real Strategies Fund
Portfolio of Investments (continued)
December 31, 2012
| | | | | | | | |
Shares or
Contracts | | | | | Value | |
| | | | | | | | |
| | | | | | | | |
| | | | | | | | |
| | | | Exchange-Traded Funds — 7.2% | | | | |
| | 3,020 | | | iShares Silver Trust * | | $ | 88,637 | |
| | 3,200 | | | Market Vectors Junior Gold Miners Fund ETF | | | 63,360 | |
| | 1,400 | | | Market Vectors Oil Services ETF (a) | | | 54,152 | |
| | 2,400 | | | PowerShares DB Agriculture Fund * | | | 67,080 | |
| | | | | | | | |
| | | | Total Exchange-Traded Funds
(Cost $318,763) | | | 273,229 | |
| | | | | | | | |
| | | | Real Estate
Investments (b) (c) (d) — 6.1% | | | | |
| | | | Discount Retail Portfolio II DST | | | 46,551 | |
| | | | Grocery & Pharmacy DST | | | 48,390 | |
| | | | New York Power DST | | | 45,382 | |
| | | | Scotts Gahanna LLC (e) | | | 47,659 | |
| | | | Winston-Salem DST | | | 45,213 | |
| | | | | | | | |
| | | | Total Real Estate Investments
(Cost $256,000) | | | 233,195 | |
| | | | | | | | |
| | | | Closed-End Fund — 3.1% | | | | |
| | 5,600 | | | Central Fund of Canada Ltd., Class A (a) | | | 117,768 | |
| | | | | | | | |
| | | | Total Closed-End Fund
(Cost $98,635) | | | 117,768 | |
| | | | | | | | |
| | | | Warrants — 0.2% | | | | |
| | 1,818 | | | Kinder Morgan, Inc., Expires 5/25/2017 | | | 6,871 | |
| | | | | | | | |
| | | | Total Warrants
(Cost $2,869) | | | 6,871 | |
| | | | | | | | |
| | | | Options Purchased — 0.1% | | | | |
| | 5 | | | Market Vectors Gold Miners ETF, Call @ $42, Expiring January 2013 | | | 2,250 | |
| | | | | | | | |
| | | | Total Options Purchased
(Cost $2,725) | | | 2,250 | |
| | | | | | | | |
| | | | Cash Equivalents — 5.1% | | | | |
| | 194,383 | | | Huntington U.S. Treasury Money Market Fund, Trust Shares, 0.050% (e) (f) | | | 194,383 | |
| | | | | | | | |
| | | | Total Cash Equivalents
(Cost $194,383) | | | 194,383 | |
| | | | | | | | |
| | | | | | | | |
| Shares | | | | | Value | |
| | | | Short-Term Securities Held as Collateral for Securities Lending — 11.3% | | | | |
| | 428,558 | | | Fidelity Institutional Money Market Portfolio, Institutional Class, 0.180% (f) | | $ | 428,558 | |
| | | | | | | | |
| | | | Total Short-Term Securities Held as Collateral for Securities Lending
(Cost $428,558) | | | 428,558 | |
| | | | | | | | |
| | | | Total Investments
(Cost $4,143,279) — 111.3% | | | 4,228,203 | |
| | | | | | | | |
| | | | Liabilities in Excess of Other Assets — (11.3)% | | | (427,752 | ) |
| | | | | | | | |
| | | | Net Assets — 100.0% | | $ | 3,800,451 | |
| | | | | | | | |
| (a) | All or a portion of the security was on loan as of December 31, 2012. The total value of securities on loan as of December 31, 2012 was $432,496. |
| (c) | Security is currently being valued according to the fair value procedures approved by the Pricing Committee. |
| (d) | Investments do not offer shares. Fair value represents direct ownership of Real Estate. |
| (e) | Investment in affiliate. |
| (f) | Rate disclosed is the seven day yield as of December 31, 2012. |
| * | Non-income producing security. |
| | |
| ADR | | —American Depositary Receipt |
| DST | | —Delaware Statutory Trust |
| ETF | | —Exchange-Traded Fund |
See Notes which are an integral part of the Financial Statements.
Huntington VA Rotating Markets Fund
Portfolio of Investments Summary Table (Unaudited)
December 31, 2012
| | | | |
| Asset Allocation | | Percentage of
Market Value | |
Information Technology | | | 59.2 | % |
Consumer Discretionary | | | 16.7 | % |
Health Care | | | 12.2 | % |
Exchange-Traded Funds | | | 4.5 | % |
Consumer Staples | | | 2.5 | % |
Industrials | | | 1.9 | % |
Cash1 | | | 1.4 | % |
Telecommunication Services | | | 0.8 | % |
Materials | | | 0.5 | % |
Short-Term Securities Held as Collateral for Securities Lending | | | 0.3 | % |
| | | | |
Total | | | 100.0 | % |
| 1 | Investments in an affiliated money market fund. |
Portfolio holdings and allocations are subject to change. Percentages in the table above, as of December 31, 2012, are based on total investments, which may differ from the percentages set forth below in the Portfolio of Investments which are computed using the Fund’s total net assets.
The Portfolio of Investments Summary Table and the Portfolio of Investments are broken down by sectors, and these sectors do not represent industry categories for purposes of identifying “industry concentration” as described in the Investment Company Act of 1940, as amended.
Portfolio of Investments
December 31, 2012
| | | | | | | | |
| Shares | | | | | Value | |
| | | | | | | |
| | | | Common Stocks — 94.2% | | | | |
| | | | Consumer Discretionary — 16.8% | |
| | 945 | | | Amazon.com, Inc. * | | $ | 237,327 | |
| | 265 | | | Apollo Group, Inc., Class A * | | | 5,544 | |
| | 490 | | | Bed Bath & Beyond, Inc. * | | | 27,396 | |
| | 4,245 | | | Comcast Corp., Class A | | | 158,678 | |
| | 1,430 | | | DIRECTV, Class A * | | | 71,729 | |
| | 495 | | | Dollar Tree, Inc. * | | | 20,077 | |
| | 245 | | | Expedia, Inc. | | | 15,055 | |
| | 130 | | | Fossil, Inc. * | | | 12,103 | |
| | 405 | | | Garmin Ltd. (a) | | | 16,532 | |
| | 1,150 | | | Liberty Interactive, Inc. * | | | 22,632 | |
| | 57 | | | Liberty Ventures Group, Series A * | | | 3,862 | |
| | 690 | | | Mattel, Inc. | | | 25,268 | |
| | 120 | | | Netflix, Inc. * | | | 11,134 | |
| | 3,475 | | | News Corp., Class A | | | 88,751 | |
| | 255 | | | O’Reilly Automotive, Inc. * | | | 22,802 | |
| | 110 | | | Priceline.com, Inc. * | | | 68,332 | |
| | 475 | | | Ross Stores, Inc. | | | 25,721 | |
| | 87 | | | Sears Canada, Inc. * | | | 883 | |
| | 205 | | | Sears Holdings Corp. * | | | 8,479 | |
| | 7,495 | | | Sirius XM Radio, Inc. * | | | 21,661 | |
| | 1,440 | | | Staples, Inc. | | | 16,416 | |
| | 1,490 | | | Starbucks Corp. | | | 79,894 | |
| | 610 | | | Virgin Media, Inc. | | | 22,417 | |
| | 205 | | | Wynn Resorts Ltd. | | | 23,060 | |
| | | | | | | | |
| | | | | | | 1,005,753 | |
| | | | | | | | |
| | | | Consumer Staples — 2.6% | |
| | 865 | | | Costco Wholesale Corp. | | | 85,436 | |
| | 375 | | | Green Mountain Coffee Roasters, Inc. (a) * | | | 15,510 | |
| | 345 | | | Monster Beverage Corp. * | | | 18,244 | |
| | | | | | | | |
| Shares | | | | | Value | |
| | | | | | | |
| | | | Consumer Staples — (continued) | |
| | 375 | | | Whole Foods Market, Inc. | | $ | 34,249 | |
| | | | | | | | |
| | | | | | | 153,439 | |
| | | | | | | | |
| | | | Health Care — 12.2% | |
| | 385 | | | Alexion Pharmaceuticals, Inc. * | | | 36,117 | |
| | 1,795 | | | Amgen, Inc. | | | 154,944 | |
| | 505 | | | Biogen Idec, Inc. * | | | 74,068 | |
| | 895 | | | Celgene Corp. * | | | 70,454 | |
| | 345 | | | Cerner Corp. * | | | 26,786 | |
| | 285 | | | DENTSPLY International, Inc. | | | 11,289 | |
| | 975 | | | Express Scripts Holding Co. * | | | 52,650 | |
| | 1,545 | | | Gilead Sciences, Inc. * | | | 113,480 | |
| | 175 | | | Henry Schein, Inc. * | | | 14,081 | |
| | 80 | | | Intuitive Surgical, Inc. * | | | 39,230 | |
| | 365 | | | Life Technologies Corp. * | | | 17,914 | |
| | 870 | | | Mylan, Inc. * | | | 23,908 | |
| | 185 | | | Perrigo Co. | | | 19,246 | |
| | 1,440 | | | Teva Pharmaceutical Industries Ltd. ADR | | | 53,770 | |
| | 435 | | | Vertex Pharmaceuticals, Inc. * | | | 18,244 | |
| | 520 | | | Warner Chilcott PLC, Class A | | | 6,261 | |
| | | | | | | | |
| | | | | | | 732,442 | |
| | | | | | | | |
| | | | Industrials — 1.9% | |
| | 335 | | | CH Robinson Worldwide, Inc. | | | 21,179 | |
| | 435 | | | Expeditors International of
Washington, Inc. | | | 17,204 | |
| | 600 | | | Fastenal Co. | | | 28,014 | |
| | 730 | | | PACCAR, Inc. | | | 33,003 | |
| | 165 | | | Stericycle, Inc. * | | | 15,390 | |
| | | | | | | | |
| | | | | | | 114,790 | |
| | | | | | | | |
| | | | Information Technology — 59.4% | |
| | 2,365 | | | Activision Blizzard, Inc. | | | 25,116 | |
See Notes which are an integral part of the Financial Statements.
Huntington VA Rotating Markets Fund
Portfolio of Investments (continued)
December 31, 2012
| | | | | | | | |
| Shares | | | | | Value | |
| | | | | | | |
| | | | Common Stocks — (continued) | | | | |
| | | | Information Technology — (continued) | |
| | 985 | | | Adobe Systems, Inc. * | | $ | 37,115 | |
| | 365 | | | Akamai Technologies, Inc. * | | | 14,932 | |
| | 650 | | | Altera Corp. | | | 22,386 | |
| | 1,880 | | | Apple, Inc. | | | 1,002,096 | |
| | 2,660 | | | Applied Materials, Inc. | | | 30,430 | |
| | 450 | | | Autodesk, Inc. * | | | 15,907 | |
| | 995 | | | Automatic Data Processing, Inc. | | | 56,725 | |
| | 490 | | | Avago Technologies Ltd. | | | 15,513 | |
| | 540 | | | Baidu, Inc. ADR * | | | 54,157 | |
| | 345 | | | BMC Software, Inc. * | | | 13,683 | |
| | 985 | | | Broadcom Corp., Class A | | | 32,712 | |
| | 1,005 | | | CA, Inc. | | | 22,090 | |
| | 435 | | | Check Point Software Technologies Ltd. * | | | 20,723 | |
| | 10,945 | | | Cisco Systems, Inc. | | | 215,069 | |
| | 385 | | | Citrix Systems, Inc. * | | | 25,314 | |
| | 620 | | | Cognizant Technology Solutions Corp., Class A * | | | 45,911 | |
| | 3,745 | | | Dell, Inc. | | | 37,937 | |
| | 2,610 | | | eBay, Inc. * | | | 133,162 | |
| | 170 | | | F5 Networks, Inc. * | | | 16,515 | |
| | 180 | | | First Solar, Inc. * | | | 5,558 | |
| | 285 | | | Fiserv, Inc. * | | | 22,524 | |
| | 1,450 | | | Flextronics International Ltd. * | | | 9,005 | |
| | 390 | | | Google, Inc., Class A * | | | 276,654 | |
| | 10,345 | | | Intel Corp. | | | 213,417 | |
| | 590 | | | Intuit, Inc. | | | 35,105 | |
| | 335 | | | KLA-Tencor Corp. | | | 16,000 | |
| | 235 | | | Lam Research Corp. * | | | 8,491 | |
| | 475 | | | Linear Technology Corp. | | | 16,292 | |
| | 1,240 | | | Marvell Technology Group Ltd. | | | 9,002 | |
| | 590 | | | Maxim Integrated Products, Inc. | | | 17,346 | |
| | 395 | | | Microchip Technology, Inc. | | | 12,873 | |
| | 1,980 | | | Micron Technology, Inc. * | | | 12,573 | |
| | 9,834 | | | Microsoft Corp. | | | 262,863 | |
| | 740 | | | NetApp, Inc. * | | | 24,827 | |
| | 620 | | | Nuance Communications, Inc. * | | | 13,838 | |
| | 1,250 | | | NVIDIA Corp. | | | 15,362 | |
| | 10,315 | | | Oracle Corp. | | | 343,696 | |
| | 740 | | | Paychex, Inc. | | | 23,044 | |
| | 3,420 | | | QUALCOMM, Inc. | | | 212,108 | |
| | 1,035 | | | Research In Motion Ltd. * | | | 12,296 | |
| | 470 | | | SanDisk Corp. * | | | 20,473 | |
| | 935 | | | Seagate Technology PLC | | | 28,499 | |
| | 1,485 | | | Symantec Corp. * | | | 27,933 | |
| | 325 | | | VeriSign, Inc. * | | | 12,617 | |
| | 530 | | | Xilinx, Inc. | | | 19,027 | |
| | 2,530 | | | Yahoo!, Inc. * | | | 50,347 | |
| | | | | | | | |
| | | | | | | 3,559,263 | |
| | | | | | | | |
| | | | Materials — 0.5% | |
| | 105 | | | Randgold Resources Ltd. ADR | | | 10,421 | |
| | 235 | | | Sigma-Aldrich Corp. | | | 17,291 | |
| | | | | | | | |
| | | | | | | 27,712 | |
| | | | | | | | |
| | | | | | | | |
| Shares | | | | | Value | |
| | | | | | | |
| | | | Telecommunication Services — 0.8% | |
| | 1,910 | | | Vodafone Group PLC ADR | | $ | 48,113 | |
| | | | | | | | |
| | | | Total Common Stocks
(Cost $5,692,939) | | | 5,641,512 | |
| | | | | | | | |
| | | | Exchange-Traded Funds — 4.5% | | | | |
| | 4,142 | | | Powershares QQQ Trust, Series 1 | | | 269,686 | |
| | | | | | | | |
| | | | Total Exchange-Traded Funds
(Cost $282,019) | | | 269,686 | |
| | | | | | | | |
| | | | Cash Equivalents — 1.4% | | | | |
| | 86,329 | | | Huntington U.S. Treasury Money Market Fund, Trust Shares, 0.050% (b) (c) | | | 86,329 | |
| | | | | | | | |
| | | | Total Cash Equivalents
(Cost $86,329) | | | 86,329 | |
| | | | | | | | |
| | | | Short-Term Securities Held as Collateral for Securities Lending — 0.3% | | | | |
| | 16,391 | | | Fidelity Institutional Money Market Portfolio, Institutional Class, 0.180% (c) | | | 16,391 | |
| | | | | | | | |
| | | | Total Short-Term Securities Held as Collateral for Securities Lending
(Cost $16,391) | | | 16,391 | |
| | | | | | | | |
| | | | Total Investments
(Cost $6,077,678) — 100.4% | | | 6,013,918 | |
| | | | | | | | |
| | | | Liabilities in Excess of Other
Assets — (0.4)% | | | (22,619 | ) |
| | | | | | | | |
| | | | Net Assets — 100.0% | | $ | 5,991,299 | |
| | | | | | | | |
| (a) | All or a portion of the security was on loan as of December 31, 2012. The total value of securities on loan as of December 31, 2012 was $16,418. |
| (b) | Investment in affiliate. |
| (c) | Rate disclosed is the seven day yield as of December 31, 2012. |
| * | Non-income producing security. |
| | |
| ADR | | —American Depositary Receipt |
See Notes which are an integral part of the Financial Statements.
Huntington VA Situs Fund
Portfolio of Investments Summary Table (Unaudited)
December 31, 2012
| | | | |
| Asset Allocation | | Percentage of
Market Value | |
Information Technology | | | 22.4 | % |
Industrials | | | 15.6 | % |
Health Care | | | 12.6 | % |
Consumer Discretionary | | | 10.7 | % |
Financials | | | 10.6 | % |
Materials | | | 7.9 | % |
Short-Term Securities Held as Collateral for Securities Lending | | | 6.0 | % |
Energy | | | 4.9 | % |
Cash1 | | | 4.3 | % |
Consumer Staples | | | 2.0 | % |
Utilities | | | 1.2 | % |
Real Estate Investment Trusts | | | 1.2 | % |
Telecommunication Services | | | 0.3 | % |
Exchange-Traded Funds | | | 0.3 | % |
| | | | |
Total | | | 100.0 | % |
| 1 | Investments in an affiliated money market fund. |
Portfolio holdings and allocations are subject to change. Percentages in the table above, as of December 31, 2012, are based on total investments, which may differ from the percentages set forth below in the Portfolio of Investments which are computed using the Fund’s total net assets.
The Portfolio of Investments Summary Table and the Portfolio of Investments are broken down by sectors, and these sectors do not represent industry categories for purposes of identifying “industry concentration” as described in the Investment Company Act of 1940, as amended.
Portfolio of Investments
December 31, 2012
| | | | | | | | |
| Shares | | | | | Value+ | |
| | | | | | | | |
| | | | Common Stocks — 94.3% | | | | |
| | | | Bermuda — 1.7% | | | | |
| | | | Financials — 1.7% | | | | |
| | 17,750 | | | Arch Capital Group Ltd. * | | $ | 781,355 | |
| | | | | | | | |
| | | | Brazil — 0.1% | | | | |
| | | | Consumer Staples — 0.1% | | | | |
| | 1,000 | | | Cia Brasileira de Distribuicao Grupo Pao de Acucar ADR (a) | | | 44,390 | |
| | | | | | | | |
| | | | Chile — 0.1% | | | | |
| | | | Materials — 0.1% | | | | |
| | 800 | | | Sociedad Quimica y Minera de Chile SA ADR | | | 46,112 | |
| | | | | | | | |
| | | | Finland — 0.8% | | | | |
| | | | Industrials — 0.8% | | | | |
| | 2,000 | | | Cargotec Oyj | | | 53,217 | |
| | 4,200 | | | Kone Oyj | | | 310,530 | |
| | | | | | | | |
| | | | | | | 363,747 | |
| | | | | | | | |
| | | | Germany — 0.3% | | | | |
| | | | Consumer Discretionary — 0.2% | | | | |
| | 1,500 | | | Douglas Holding AG | | | 75,371 | |
| | | | | | | | |
| | | | Health Care — 0.1% | | | | |
| | 1,900 | | | Stada Arzneimittel AG | | | 61,469 | |
| | | | | | | | |
| | | | | | | 136,840 | |
| | | | | | | | |
| | | | Hong Kong — 0.2% | | | | |
| | | | Consumer Discretionary — 0.2% | | | | |
| | 13,000 | | | Television Broadcasts Ltd. | | | 97,752 | |
| | | | | | | | |
| | | | | | | | |
| Shares | | | | | Value+ | |
| | | | | | | | |
| | | | Ireland — 0.4% | | | | |
| | | | Consumer Staples — 0.4% | | | | |
| | 3,500 | | | Kerry Group PLC | | $ | 184,813 | |
| | | | | | | | |
| | | | Japan — 0.4% | | | | |
| | | | Consumer Discretionary — 0.2% | | | | |
| | 2,000 | | | Honda Motor Co. Ltd. ADR | | | 73,880 | |
| | | | | | | | |
| | | | Industrials — 0.1% | | | | |
| | 3,500 | | | Sato Corp. | | | 56,511 | |
| | | | | | | | |
| | | | Information Technology — 0.1% | | | | |
| | 14,800 | | | Furuno Electric Co. Ltd. | | | 68,427 | |
| | | | | | | | |
| | | | | | | 198,818 | |
| | | | | | | | |
| | | | Sweden — 0.1% | | | | |
| | | | Consumer Discretionary — 0.1% | | | | |
| | 4,800 | | | Haldex AB | | | 24,850 | |
| | | | | | | | |
| | | | Switzerland — 0.2% | | | | |
| | | | Consumer Discretionary — 0.2% | | | | |
| | 2,000 | | | Garmin Ltd. (a) | | | 81,640 | |
| | | | | | | | |
| | | | United Kingdom — 0.5% | | | | |
| | | | Industrials — 0.5% | | | | |
| | 4,800 | | | Concentric AB | | | 41,426 | |
| | 26,424 | | | HALMA PLC | | | 198,915 | |
| | | | | | | | |
| | | | | | | 240,341 | |
| | | | | | | | |
| | | | United States — 89.5% | | | | |
| | | | Consumer Discretionary — 10.5% | | | | |
| | 55,000 | | | Cabela’s, Inc., Class A * | | | 2,296,250 | |
| | 3,000 | | | Jakks Pacific, Inc. | | | 37,560 | |
| | 1,500 | | | Papa John’s International, Inc. * | | | 82,410 | |
See Notes which are an integral part of the Financial Statements.
Huntington VA Situs Fund
Portfolio of Investments (continued)
December 31, 2012
| | | | | | | | |
| Shares | | | | | Value+ | |
| | | | | | | | |
| | | | Common Stocks — (continued) | | | | |
| | | | United States — (continued) | | | | |
| | | | Consumer Discretionary — (continued) | |
| | 2,000 | | | Rent-A-Center, Inc. | | $ | 68,720 | |
| | 25,000 | | | Sonic Corp. * | | | 260,250 | |
| | 17,000 | | | Sturm Ruger & Co., Inc. (a) | | | 771,800 | |
| | 15,000 | | | Tempur-Pedic International, Inc. * | | | 472,350 | |
| | 2,000 | | | Tractor Supply Co. | | | 176,720 | |
| | 15,000 | | | Urban Outfitters, Inc. * | | | 590,400 | |
| | | | | | | | |
| | | | | | | 4,756,460 | |
| | | | | | | | |
| | | | Consumer Staples — 1.6% | | | | |
| | 700 | | | Darling International, Inc. * | | | 11,228 | |
| | 15,100 | | | Fresh Del Monte Produce, Inc. | | | 397,885 | |
| | 7,000 | | | Sanderson Farms, Inc. | | | 332,850 | |
| | | | | | | | |
| | | | | | | 741,963 | |
| | | | | | | | |
| | | | Energy — 5.2% | | | | |
| | 7,000 | | | Alliance Resource Partners LP | | | 406,490 | |
| | 4,000 | | | Atwood Oceanics, Inc. * | | | 183,160 | |
| | 9,000 | | | CARBO Ceramics, Inc. (a) | | | 705,060 | |
| | 8,000 | | | Denbury Resources, Inc. * | | | 129,600 | |
| | 700 | | | Dril-Quip, Inc. * | | | 51,135 | |
| | 9,660 | | | Halcon Resources Corp. * | | | 66,847 | |
| | 1,744 | | | Helix Energy Solutions Group, Inc.* | | | 35,996 | |
| | 9,000 | | | Lufkin Industries, Inc. (a) | | | 523,170 | |
| | 5,000 | | | SM Energy Co. | | | 261,050 | |
| | | | | | | | |
| | | | | | | 2,362,508 | |
| | | | | | | | |
| | | | Financials — 9.4% | | | | |
| | 30,000 | | | Cullen/Frost Bankers, Inc. | | | 1,628,100 | |
| | 2,000 | | | Evercore Partners, Inc. | | | 60,380 | |
| | 1,200 | | | EZCORP, Inc., Class A * | | | 23,832 | |
| | 8,000 | | | International Bancshares Corp. | | | 144,400 | |
| | 15,000 | | | Protective Life Corp. | | | 428,700 | |
| | 45,000 | | | Raymond James Financial, Inc. | | | 1,733,850 | |
| | 5,000 | | | SCBT Financial Corp. | | | 200,900 | |
| | 1,500 | | | WSFS Financial Corp. | | | 63,375 | |
| | | | | | | | |
| | | | | | | 4,283,537 | |
| | | | | | | | |
| | | | Health Care — 13.1% | | | | |
| | 4,500 | | | AmSurg Corp. * | | | 135,045 | |
| | 13,000 | | | Arena Pharmaceuticals, Inc. (a) * | | | 117,260 | |
| | 650 | | | Bio-Rad Laboratories, Inc., Class A * | | | 68,283 | |
| | 20,000 | | | Cerner Corp. * | | | 1,552,800 | |
| | 15,000 | | | Edwards LifeSciences Corp. (b) * | | | 1,352,550 | |
| | 3,000 | | | Healthways, Inc. * | | | 32,100 | |
| | 3,000 | | | Kindred Healthcare, Inc. * | | | 32,460 | |
| | 5,000 | | | Merit Medical Systems, Inc. * | | | 69,500 | |
| | 22,000 | | | Myriad Genetics, Inc. * | | | 599,500 | |
| | 7,000 | | | Osiris Therapeutics, Inc. (a) * | | | 62,860 | |
| | 1 | | | PharMerica Corp. * | | | 14 | |
| | 1,500 | | | PSS World Medical, Inc. * | | | 43,320 | |
| | 22,000 | | | Watson Pharmaceutical, Inc. * | | | 1,892,000 | |
| | | | | | | | |
| | | | | | | 5,957,692 | |
| | | | | | | | |
| | | | | | | | |
| Shares | | | | | Value+ | |
| | | | | | | | |
| | | | United States — (continued) | | | | |
| | | | Industrials — 15.0% | | | | |
| | 1,000 | | | American Superconductor Corp. (a) * | | $ | 2,620 | |
| | 5,000 | | | BE Aerospace, Inc. * | | | 247,000 | |
| | 20,000 | | | EnPro Industries, Inc. * | | | 818,000 | |
| | 15,000 | | | Flowserve Corp. | | | 2,202,000 | |
| | 20,000 | | | Harsco Corp. | | | 470,000 | |
| | 4,000 | | | Lindsay Corp. | | | 320,480 | |
| | 2,000 | | | Mine Safety Appliances Co. | | | 85,420 | |
| | 15,000 | | | Quanta Services, Inc. * | | | 409,350 | |
| | 1,000 | | | Ryder System, Inc. | | | 49,930 | |
| | 22,000 | | | Southwest Airlines Co. | | | 225,280 | |
| | 40,000 | | | Trinity Industries, Inc. | | | 1,432,800 | |
| | 10,000 | | | Watts Water Technologies, Inc., Class A | | | 429,900 | |
| | 5,000 | | | Werner Enterprises, Inc. | | | 108,350 | |
| | | | | | | | |
| | | | | | | 6,801,130 | |
| | | | | | | | |
| | | | Information Technology — 23.5% | | | | |
| | 2,500 | | | 3D Systems Corp. * | | | 133,375 | |
| | 13,000 | | | ACI Worldwide, Inc. * | | | 567,970 | |
| | 17,000 | | | Anixter International, Inc. * | | | 1,087,660 | |
| | 4,000 | | | Black Box Corp. | | | 97,360 | |
| | 6,000 | | | Cardtronics, Inc. * | | | 142,440 | |
| | 25,000 | | | Diodes, Inc. * | | | 433,750 | |
| | 3,000 | | | Exlservice Holdings, Inc. * | | | 79,500 | |
| | 42,000 | | | Geospace Technologies Corp. * | | | 3,732,540 | |
| | 3,000 | | | Hutchinson Technology, Inc. (a) * | | | 6,000 | |
| | 50,000 | | | Jabil Circuit, Inc. | | | 964,500 | |
| | 20,000 | | | Red Hat, Inc. * | | | 1,059,200 | |
| | 10,000 | | | ScanSource, Inc. * | | | 317,700 | |
| | 10,000 | | | Sigma Designs, Inc. * | | | 51,500 | |
| | 28,000 | | | Trimble Navigation Ltd. * | | | 1,673,840 | |
| | 10,000 | | | TriQuint Semiconductor, Inc. * | | | 48,400 | |
| | 5,500 | | | Tyler Technologies, Inc. * | | | 266,420 | |
| | | | | | | | |
| | | | | | | 10,662,155 | |
| | | | | | | | |
| | | | Materials — 8.3% | | | | |
| | 5,000 | | | Albemarle Corp. | | | 310,600 | |
| | 12,000 | | | Buckeye Technologies, Inc. | | | 344,520 | |
| | 3,000 | | | Commercial Metals Co. | | | 44,580 | |
| | 2,500 | | | Eagle Materials, Inc. | | | 146,250 | |
| | 7,000 | | | Eastman Chemical Co. | | | 476,350 | |
| | 9,000 | | | Owens-Illinois, Inc. * | | | 191,430 | |
| | 8,000 | | | Quaker Chemical Corp. | | | 430,880 | |
| | 4,000 | | | RTI International Metals, Inc. * | | | 110,240 | |
| | 10,800 | | | Scotts Miracle-Gro Co., Class A (a) | | | 475,740 | |
| | 4,000 | | | Terra Nitrogen Co. LP | | | 856,360 | |
| | 5,000 | | | Texas Industries, Inc. (a) * | | | 255,050 | |
| | 2,500 | | | United States Lime & Minerals, Inc.* | | | 117,800 | |
| | | | | | | | |
| | | | | | | 3,759,800 | |
| | | | | | | | |
| | | | Real Estate Investment Trusts — 1.3% | |
| | 3,500 | | | Camden Property Trust | | | 238,735 | |
| | 1,064 | | | CBL & Associates Properties, Inc. | | | 22,568 | |
| | 8,500 | | | Equity One, Inc. | | | 178,585 | |
| | 5,000 | | | Weingarten Realty Investors | | | 133,850 | |
| | | | | | | | |
| | | | | | | 573,738 | |
| | | | | | | | |
See Notes which are an integral part of the Financial Statements.
Huntington VA Situs Fund
Portfolio of Investments (continued)
December 31, 2012
| | | | | | | | |
| Shares | | | | | Value+ | |
| | | | | | | | |
| | | | Common Stocks — (continued) | | | | |
| | | | United States — (continued) | | | | |
| | | | Telecommunication Services — 0.3% | |
| | 15,000 | | | General Communication, Inc., Class A * | | $ | 143,850 | |
| | | | | | | | |
| | | | Utilities — 1.3% | | | | |
| | 1,000 | | | AGL Resources, Inc. | | | 39,970 | |
| | 5,000 | | | Hawaiian Electric Industries, Inc. | | | 125,700 | |
| | 6,000 | | | Portland General Electric Co. | | | 164,160 | |
| | 7,500 | | | UGI Corp. | | | 245,325 | |
| | | | | | | | |
| | | | | | | 575,155 | |
| | | | | | | | |
| | | | | | | 40,617,988 | |
| | | | | | | | |
| | | | Total Common Stocks
(Cost $31,619,124) | | | 42,818,646 | |
| | | | | | | | |
| | | | Exchange-Traded Funds — 0.3% | |
| | 3,500 | | | iShares FTSE China 25 Index Fund | | | 141,680 | |
| | | | | | | | |
| | | | Total Exchange-Traded Funds
(Cost $89,145) | | | 141,680 | |
| | | | | | | | |
| | | | Cash Equivalents — 4.6% | | | | |
| | 2,078,878 | | | Huntington U.S. Treasury Money Market Fund, Trust Shares, 0.050% (c) (d) | | | 2,078,878 | |
| | | | | | | | |
| | | | Total Cash Equivalents
(Cost $2,078,878) | | | 2,078,878 | |
| | | | | | | | |
| | | | | | | | |
| Shares | | | | | Value+ | |
| | | | Short-Term Securities Held as Collateral for Securities Lending — 6.3% | | | | |
| | 2,856,982 | | | Fidelity Institutional Money Market Portfolio, Institutional Class, 0.180% (d) | | $ | 2,856,982 | |
| | | | | | | | |
| | | | Total Short-Term Securities Held as Collateral for Securities Lending
(Cost $2,856,982) | | | 2,856,982 | |
| | | | | | | | |
| | | | Total Investments
(Cost $36,644,129) — 105.5% | | | 47,896,186 | |
| | | | | | | | |
| | | | Liabilities in Excess of Other Assets — (5.5)% | | | (2,493,888 | ) |
| | | | | | | | |
| | | | Net Assets — 100.0% | | $ | 45,402,298 | |
| | | | | | | | |
| (a) | All or a portion of the security was on loan as of December 31, 2012. The total value of securities on loan as of December 31, 2012 was $2,875,020. |
| (b) | All or a portion of the security is held as collateral for written call options. |
| (c) | Investment in affiliate. |
| (d) | Rate disclosed is the seven day yield as of December 31, 2012. |
| * | Non-income producing security. |
| + | All securities, except those traded on United States (including ADRs) and Canadian exchanges, Cash Equivalents or Short-Term Securities were fair valued at December 31, 2012. |
| | |
| ADR | | —American Depositary Receipt |
See Notes which are an integral part of the Financial Statements.
Huntington VA Mortgage Securities Fund
Portfolio of Investments Summary Table (Unaudited)
December 31, 2012
| | | | |
| Asset Allocation | | Percentage of
Market Value | |
U.S. Government Mortgage Backed Agencies | | | 67.2 | % |
U.S. Government Agencies | | | 16.2 | % |
Common Stocks | | | 11.7 | % |
Cash1 | | | 2.8 | % |
Collateralized Mortgage Obligations | | | 1.6 | % |
Short-Term Securities Held as Collateral for Securities Lending | | | 0.5 | % |
| | | | |
Total | | | 100.0 | % |
| 1 | Investments in an affiliated money market fund. |
Portfolio holdings and allocations are subject to change. Percentages in the table above, as of December 31, 2012, are based on total investments, which may differ from the percentages set forth below in the Portfolio of Investments which are computed using the Fund’s total net assets.
Portfolio of Investments
December 31, 2012
| | | | | | | | |
Principal
Amount | | | | | Value | |
| | | | | | | | |
| | | | U.S. Government Mortgage Backed Agencies — 67.4% | | | | |
| | | | Federal Home Loan Mortgage Corporation — 15.6% | | | | |
| $ | 1,798 | | | Pool # M81004, 5.000%, 1/1/13 | | $ | 1,805 | |
| | 5,136 | | | Pool # B18052, 4.500%, 3/1/15 | | | 5,498 | |
| | 12,274 | | | Pool # J03237, 5.500%, 8/1/16 | | | 13,118 | |
| | 7,063 | | | Pool # E96459, 5.000%, 5/1/18 | | | 7,600 | |
| | 45,592 | | | Pool # J10396, 4.000%, 7/1/19 | | | 48,620 | |
| | 7,204 | | | Pool # G18008, 4.500%, 9/1/19 | | | 7,681 | |
| | 3,867 | | | Pool # G18015, 4.500%, 10/1/19 | | | 4,123 | |
| | 31,942 | | | Pool # G12286, 5.000%, 7/1/21 | | | 34,385 | |
| | 27,031 | | | Pool # G12297, 6.000%, 7/1/21 | | | 29,723 | |
| | 28,393 | | | Pool # G12425, 5.500%, 10/1/21 | | | 30,647 | |
| | 45,531 | | | Pool # E02402, 6.000%, 10/1/22 | | | 50,462 | |
| | 22,456 | | | Pool # C90779, 5.000%, 1/1/24 | | | 24,171 | |
| | 8,186 | | | Pool # C90837, 5.500%, 6/1/24 | | | 8,933 | |
| | 76,806 | | | Pool # G13629, 4.500%, 8/1/24 | | | 81,746 | |
| | 73,351 | | | Pool # J11053, 4.500%, 10/1/24 | | | 78,069 | |
| | 174,607 | | | Pool # J11829, 4.000%, 3/1/25 | | | 187,761 | |
| | 90,576 | | | Pool # E02696, 4.000%, 5/1/25 | | | 95,786 | |
| | 17,837 | | | Pool # C91000, 6.000%, 11/1/26 | | | 19,473 | |
| | 179,645 | | | Pool # D97248, 5.500%, 4/1/27 | | | 194,572 | |
| | 45,651 | | | Pool # C91175, 5.000%, 5/1/28 | | | 49,172 | |
| | 99,925 | | | Pool # C91251, 4.500%, 6/1/29 | | | 107,744 | |
| | 144,463 | | | Pool # C91284, 4.500%, 1/1/30 | | | 155,768 | |
| | 175,975 | | | Pool # C91296, 5.000%, 4/1/30 | | | 189,415 | |
| | 238,818 | | | Pool # C91441, 3.000%, 4/1/32 | | | 250,919 | |
| | 293,800 | | | Pool # C91484, 3.000%, 8/1/32 | | | 308,688 | |
| | 22,524 | | | Pool # 1G0865, 2.825%, 7/1/35 (a) | | | 24,010 | |
| | 48,007 | | | Pool # A55565, 6.000%, 12/1/36 | | | 52,327 | |
| | 50,939 | | | Pool # G03498, 5.500%, 11/1/37 | | | 55,036 | |
| | 202,690 | | | Pool # A93316, 4.500%, 8/1/40 | | | 218,328 | |
| | 185,632 | | | Pool # A93936, 4.500%, 9/1/40 | | | 199,954 | |
| | 318,979 | | | Pool # A94008, 4.000%, 9/1/40 | | | 340,927 | |
| | 233,549 | | | Pool # G06784, 3.500%, 10/1/41 | | | 248,621 | |
| | | | | | | | |
| | | | | | | 3,125,082 | |
| | | | | | | | |
| | | | | | | | |
Principal
Amount | | | | | Value | |
| | | | | | | | |
| | | | Federal National Mortgage Association — 39.5% | | | | |
| $ | 80,479 | | | Pool # 786729, 5.500%, 8/1/19 | | $ | 87,202 | |
| | 344,809 | | | Pool # MA0670, 3.500%, 3/1/21 | | | 365,990 | |
| | 328,096 | | | Pool # MA0740, 3.500%, 5/1/21 | | | 348,916 | |
| | 45,253 | | | Pool # 254501, 5.500%, 9/1/22 | | | 49,183 | |
| | 163,704 | | | Pool # 962070, 4.000%, 3/1/23 | | | 175,499 | |
| | 69,994 | | | Pool # 889255, 5.000%, 3/1/23 | | | 75,879 | |
| | 6,807 | | | Pool # 254908, 5.000%, 9/1/23 | | | 7,380 | |
| | 4,481 | | | Pool # 255360, 5.000%, 8/1/24 | | | 4,926 | |
| | 135,583 | | | Pool # 935763, 4.000%, 11/1/24 | | | 148,148 | |
| | 229,558 | | | Pool # 932438, 4.000%, 1/1/25 | | | 246,026 | |
| | 20,088 | | | Pool # 255711, 5.500%, 4/1/25 | | | 22,008 | |
| | 18,957 | | | Pool # 255745, 5.500%, 5/1/25 | | | 20,769 | |
| | 13,878 | | | Pool # 357771, 5.000%, 5/1/25 | | | 15,219 | |
| | 17,918 | | | Pool # 255767, 5.500%, 6/1/25 | | | 19,630 | |
| | 45,241 | | | Pool # 255834, 4.500%, 6/1/25 | | | 49,621 | |
| | 12,946 | | | Pool # 255808, 5.000%, 7/1/25 | | | 14,198 | |
| | 43,207 | | | Pool # 255984, 4.500%, 11/1/25 | | | 47,391 | |
| | 18,675 | | | Pool # 256116, 6.000%, 2/1/26 | | | 20,451 | |
| | 294,872 | | | Pool # AL0238, 3.500%, 3/1/26 | | | 313,077 | |
| | 51,575 | | | Pool # 257163, 5.000%, 4/1/28 | | | 55,917 | |
| | 125,808 | | | Pool # 257237, 4.500%, 6/1/28 | | | 137,202 | |
| | 37,132 | | | Pool # 257238, 5.000%, 6/1/28 | | | 40,258 | |
| | 126,255 | | | Pool # MA0022, 4.500%, 4/1/29 | | | 136,821 | |
| | 100,749 | | | Pool # MA0115, 4.500%, 7/1/29 | | | 109,181 | |
| | 175,321 | | | Pool # AC1219, 4.500%, 8/1/29 | | | 193,884 | |
| | 92,504 | | | Pool # MA0171, 4.500%, 9/1/29 | | | 100,246 | |
| | 219,984 | | | Pool # MA0443, 5.000%, 5/1/30 | | | 238,366 | |
| | 141,947 | | | Pool # MA0563, 4.000%, 11/1/30 | | | 152,849 | |
| | 220,127 | | | Pool # MA0776, 4.500%, 6/1/31 | | | 239,375 | |
| | 176,336 | | | Pool # MA0804, 4.000%, 7/1/31 | | | 189,880 | |
| | 254,600 | | | Pool # MA0976, 3.500%, 2/1/32 | | | 272,293 | |
| | 472,404 | | | Pool # AB4713, 3.000%, 3/1/32 | | | 497,375 | |
| | 214,413 | | | Pool # MA1084, 3.500%, 6/1/32 | | | 229,314 | |
| | 8,967 | | | Pool # 721540, 5.000%, 7/1/33 | | | 9,771 | |
| | 58,816 | | | Pool # 746683, 5.500%, 10/1/33 | | | 67,426 | |
See Notes which are an integral part of the Financial Statements.
Huntington VA Mortgage Securities Fund
Portfolio of Investments (continued)
December 31, 2012
| | | | | | | | |
Principal
Amount | | | | | Value | |
| | | | | | | | |
| | | | Federal National Mortgage Association — (continued) | | | | |
| $ | 13,326 | | | Pool # 786457, 5.355%, 7/1/34 (a) | | $ | 14,344 | |
| | 8,015 | | | Pool # 845573, 3.406%, 2/1/36 (a) | | | 8,624 | |
| | 36,337 | | | Pool # 831487, 5.500%, 4/1/36 | | | 39,533 | |
| | 57,980 | | | Pool # 745511, 5.000%, 4/1/36 | | | 62,816 | |
| | 56,599 | | | Pool # 868935, 5.500%, 5/1/36 | | | 61,576 | |
| | 28,516 | | | Pool # 903812, 5.500%, 12/1/36 | | | 31,023 | |
| | 16,117 | | | Pool # 907484, 6.000%, 1/1/37 | | | 17,647 | |
| | 349,767 | | | Pool # AD7724, 5.000%, 7/1/40 | | | 379,813 | |
| | 178,591 | | | Pool # AD7906, 5.000%, 7/1/40 | | | 198,956 | |
| | 353,131 | | | Pool # AE4310, 4.000%, 9/1/40 | | | 379,040 | |
| | 179,633 | | | Pool # AE0395, 4.500%, 10/1/40 | | | 195,507 | |
| | 188,855 | | | Pool # AE7535, 4.000%, 10/1/40 | | | 202,711 | |
| | 186,763 | | | Pool # AE4628, 4.500%, 10/1/40 | | | 202,451 | |
| | 177,455 | | | Pool # AE8395, 4.000%, 11/1/40 | | | 190,475 | |
| | 382,016 | | | Pool # AH6655, 4.000%, 2/1/41 | | | 410,045 | |
| | 355,361 | | | Pool # AJ5469, 3.500%, 11/1/41 | | | 379,279 | |
| | 414,635 | | | Pool # AB4106, 3.500%, 12/1/41 | | | 442,543 | |
| | | | | | | | |
| | | | | | | 7,918,054 | |
| | | | | | | | |
| | | | Government National Mortgage Association — 12.3% | | | | |
| | 8,058 | | | Pool # 3590, 5.500%, 8/20/19 | | | 8,725 | |
| | 20,113 | | | Pool # 3708, 5.500%, 5/20/20 | | | 21,815 | |
| | 33,319 | | | Pool # 3741, 4.500%, 8/20/20 | | | 36,495 | |
| | 20,729 | | | Pool # 683937, 6.000%, 2/15/23 | | | 22,868 | |
| | 117,542 | | | Pool # 666057, 5.000%, 3/15/23 | | | 128,418 | |
| | 320,964 | | | Pool # 741854, 4.000%, 5/15/25 | | | 346,196 | |
| | 149,468 | | | Pool # 4886, 4.500%, 12/20/25 | | | 162,947 | |
| | 457,975 | | | Pool # 5326, 3.000%, 3/20/27 | | | 490,057 | |
| | 311,876 | | | Pool # 3457, 4.500%, 10/20/33 | | | 344,344 | |
| | 6,459 | | | Pool # 3571, 6.500%, 6/20/34 | | | 7,404 | |
| | 76,663 | | | Pool # 605653, 5.500%, 8/15/34 | | | 85,504 | |
| | 5,245 | | | Pool # 3637, 5.500%, 11/20/34 | | | 5,835 | |
| | 126,111 | | | Pool # 3689, 4.500%, 3/20/35 | | | 139,240 | |
| | 18,457 | | | Pool # 3710, 5.000%, 5/20/35 | | | 20,355 | |
| | 17,130 | | | Pool # 650348, 5.500%, 11/15/35 | | | 18,887 | |
| | 105,571 | | | Pool # 676974, 5.500%, 5/15/38 | | | 115,869 | |
| | 185,866 | | | Pool # 733602, 5.000%, 4/15/40 | | | 210,946 | |
| | 285,201 | | | Pool # 4978, 4.500%, 3/20/41 | | | 313,887 | |
| | | | | | | | |
| | | | | | | 2,479,792 | |
| | | | | | | | |
| | | | Total U.S. Government Mortgage Backed Agencies
(Cost $12,996,756) | | | 13,522,928 | |
| | | | | | | | |
| | | | U.S. Government Agencies — 16.3% | | | | |
| | | | Federal Farm Credit Bank — 7.8% | | | | |
| | 500,000 | | | 1.500%, 11/16/15 | | | 516,418 | |
| | 500,000 | | | 2.580%, 6/8/18 | | | 540,125 | |
| | 500,000 | | | 1.950%, 7/19/22 | | | 502,383 | |
| | | | | | | | |
| | | | | | | 1,558,926 | |
| | | | | | | | |
| | | | | | | | |
Shares or
Principal
Amount | | | | | Value | |
| | | | | | | | |
| | | | Federal Home Loan Bank — 4.2% | | | | |
| $ | 500,000 | | | 3.125%, 12/8/17 | | $ | 556,271 | |
| | 250,000 | | | 4.125%, 12/13/19 | | | 296,719 | |
| | | | | | | | |
| | | | | | | 852,990 | |
| | | | | | | | |
| | | | Federal Home Loan Mortgage Corporation — 3.0% | | | | |
| | 600,000 | | | 0.450%, 11/24/15 | | | 600,868 | |
| | | | | | | | |
| | | | Federal National Mortgage Association — 1.3% | | | | |
| | 250,000 | | | 1.125%, 9/17/13 | | | 251,716 | |
| | | | | | | | |
| | | | Total U.S. Government Agencies
(Cost $3,104,519) | | | 3,264,500 | |
| | | | | | | | |
| | | | Common Stocks — 11.7% | | | | |
| | | | Real Estate Investment Trusts — 11.7% | | | | |
| | 1,553 | | | Acadia Realty Trust | | | 38,949 | |
| | 1,300 | | | Alexandria Real Estate Equities, Inc. | | | 90,116 | |
| | 2,500 | | | American Campus Communities, Inc. | | | 115,325 | |
| | 500 | | | Associated Estates Realty Corp. | | | 8,060 | |
| | 500 | | | BioMed Realty Trust, Inc. | | | 9,665 | |
| | 1,000 | | | Boston Properties, Inc. | | | 105,810 | |
| | 300 | | | Brookfield Office Properties, Inc. | | | 5,103 | |
| | 500 | | | Colonial Properties Trust | | | 10,685 | |
| | 1,200 | | | Coresite Realty Corp. | | | 33,192 | |
| | 700 | | | CubeSmart | | | 10,199 | |
| | 100 | | | DDR Corp. | | | 1,566 | |
| | 300 | | | DiamondRock Hospitality Co. | | | 2,700 | |
| | 1,500 | | | Digital Realty Trust, Inc. (b) | | | 101,835 | |
| | 2,400 | | | Douglas Emmett, Inc. | | | 55,920 | |
| | 4,300 | | | Duke Realty Corp. | | | 59,641 | |
| | 900 | | | DuPont Fabros Technology, Inc. | | | 21,744 | |
| | 2,100 | | | EastGroup Properties, Inc. | | | 113,001 | |
| | 1,800 | | | Equity Lifestyle Properties, Inc. | | | 121,122 | |
| | 1,000 | | | Equity Residential | | | 56,670 | |
| | 800 | | | Essex Property Trust, Inc. | | | 117,320 | |
| | 700 | | | Excel Trust, Inc. | | | 8,869 | |
| | 300 | | | Extra Space Storage, Inc. | | | 10,917 | |
| | 300 | | | Federal Realty Investment Trust | | | 31,206 | |
| | 1,400 | | | HCP, Inc. | | | 63,252 | |
| | 1,000 | | | Health Care REIT, Inc. | | | 61,290 | |
| | 1,900 | | | Home Properties, Inc. | | | 116,489 | |
| | 3,614 | | | Host Hotels & Resorts, Inc. | | | 56,631 | |
| | 1,100 | | | Kimco Realty Corp. | | | 21,252 | |
| | 1,500 | | | Kite Realty Group Trust | | | 8,385 | |
| | 2,500 | | | LaSalle Hotel Properties | | | 63,475 | |
| | 1,600 | | | Macerich Co./The | | | 93,280 | |
| | 200 | | | Mack-Cali Realty Corp. | | | 5,222 | |
| | 1,100 | | | National Retail Properties, Inc. | | | 34,320 | |
| | 1,400 | | | Pennsylvania Real Estate
Investment Trust | | | 24,696 | |
| | 300 | | | Post Properties, Inc. | | | 14,985 | |
| | 946 | | | ProLogis, Inc. | | | 34,520 | |
| | 500 | | | Public Storage, Inc. | | | 72,480 | |
| | 400 | | | Regency Centers Corp. | | | 18,848 | |
See Notes which are an integral part of the Financial Statements.
Huntington VA Mortgage Securities Fund
Portfolio of Investments (continued)
December 31, 2012
| | | | | | | | |
Shares or
Principal
Amount | | | | | Value | |
| | | | | | | | |
| | | | Common Stocks — (continued) | | | | |
| | | | Real Estate Investment
Trusts — (continued) | | | | |
| | 300 | | | Retail Properties of America, Inc. | | $ | 3,591 | |
| | 200 | | | Sabra Health Care REIT, Inc. | | | 4,344 | |
| | 1,100 | | | Simon Property Group, Inc. | | | 173,899 | |
| | 400 | | | SL Green Realty Corp. | | | 30,660 | |
| | 200 | | | Sovran Self Storage, Inc. | | | 12,420 | |
| | 1,900 | | | Tanger Factory Outlet Centers, Inc. | | | 64,980 | |
| | 816 | | | UDR, Inc. | | | 19,404 | |
| | 1,986 | | | Ventas, Inc. | | | 128,534 | |
| | 316 | | | Vornado Realty Trust | | | 25,305 | |
| | 2,300 | | | Weingarten Realty Investors | | | 61,571 | |
| | 200 | | | Westfield Group | | | 2,196 | |
| | 200 | | | Westfield Retail Trust | | | 628 | |
| | | | | | | | |
| | | | Total Common Stocks
(Cost $1,725,591) | | | 2,346,272 | |
| | | | | | | | |
| | | | Collateralized Mortgage Obligations — 1.6% | | | | |
| | | | Federal Home Loan Bank — 0.2% | | | | |
| $ | 13,327 | | | Series Z2-2013, 4.800%, 2/25/13 | | | 13,399 | |
| | 18,985 | | | Series SK-2015, 5.140%, 8/18/15 | | | 20,245 | |
| | | | | | | | |
| | | | | | | 33,644 | |
| | | | | | | | |
| | | | Federal Home Loan Mortgage Corporation — 1.1% | | | | |
| | 16,133 | | | Series 2770, 4.000%, 1/15/18 | | | 16,330 | |
| | 177,252 | | | Series 2784, 4.000%, 4/15/19 | | | 188,238 | |
| | 7,481 | | | Series R010, 5.500%, 12/15/19 | | | 7,506 | |
| | 7,288 | | | Series 2672, 5.500%, 8/15/31 | | | 7,330 | |
| | | | | | | | |
| | | | | | | 219,404 | |
| | | | | | | | |
| | | | Federal National Mortgage Association — 0.1% | | | | |
| | 21,894 | | | Series 1999-13, 6.000%, 4/25/29 | | | 24,747 | |
| | | | | | | | |
| | | | Government National Mortgage Association — 0.2% | | | | |
| | 45,520 | | | Series 2005-55, 5.000%, 5/20/32 | | | 45,873 | |
| | | | | | | | |
| | | | Total Collateralized Mortgage Obligations
(Cost $308,512) | | | 323,668 | |
| | | | | | | | |
| | | | | | | | |
Shares | | | | | Value | |
| | | | | | | | |
| | | | Cash Equivalents — 2.9% | | | | |
| | 572,278 | | | Huntington U.S. Treasury Money Market Fund, Trust Shares 0.050% (c) (d) | | $ | 572,278 | |
| | | | | | | | |
| | | | Total Cash Equivalents
(Cost $572,278) | | | 572,278 | |
| | | | | | | | |
| | | | Short-Term Securities Held as Collateral for Securities Lending —0.5% | | | | |
| | 103,566 | | | Fidelity Institutional Money Market Portfolio, Institutional
Class, 0.180% (d) | | | 103,566 | |
| | | | | | | | |
| | | | Total Short-Term Securities Held as Collateral for Securities Lending
(Cost $103,566) | | | 103,566 | |
| | | | | | | | |
| | | | Total Investments
(Cost $18,811,222) — 100.4% | | | 20,133,212 | |
| | | | | | | | |
| | | | Liabilities in Excess of Other Assets —(0.4)% | | | (70,672 | ) |
| | | | | | | | |
| | | | Net Assets — 100.0% | | $ | 20,062,540 | |
| | | | | | | | |
| (a) | Variable or Floating Rate Security. Rate disclosed is as of December 31, 2012. |
| (b) | All or a portion of the security was on loan as of December 31, 2012. The total value of securities on loan as of December 31, 2012 was $101,835. |
| (c) | Investment in affiliate. |
| (d) | Rate disclosed is the seven day yield as of December 31, 2012. |
See Notes which are an integral part of the Financial Statements.
Huntington Funds
Statements of Assets and Liabilities
December 31, 2012
| | | | | | | | | | | | | | | | |
| | | Huntington VA
Balanced
Fund | | | Huntington VA
Dividend
Capture Fund | | | Huntington VA
Growth Fund | | | Huntington VA
Income Equity
Fund | |
Assets: | | | | | | | | | | | | | | | | |
Investments, at cost | | $ | 39,775,215 | | | $ | 32,127,128 | | | $ | 15,156,329 | | | $ | 20,246,296 | |
| | | | | | | | | | | | | | | | |
Investments, at value | | $ | — | | | $ | 33,225,289 | | | $ | 16,466,949 | | | $ | 21,462,939 | |
Investments in affiliated securities, at value | | | 44,363,961 | | | | 606,094 | | | | 211,690 | | | | 712,658 | |
| | | | | | | | | | | | | | | | |
Total investments | | | 44,363,961 | | | | 33,831,383 | | | | 16,678,639 | | | | 22,175,597 | |
Cash | | | — | | | | 3,092 | | | | — | | | | — | |
Income receivable | | | 27,425 | | | | 66,866 | | | | 11,771 | | | | 57,010 | |
Receivable for investments sold | | | — | | | | — | | | | 4,322,368 | | | | — | |
Receivable for shares sold | | | 1,720 | | | | — | | | | 3,889 | | | | — | |
Receivable from Advisor | | | 8,337 | | | | — | | | | — | | | | — | |
Prepaid expenses and other assets | | | 3,482 | | | | 3,097 | | | | 2,579 | | | | 2,679 | |
| | | | | | | | | | | | | | | | |
Total assets | | | 44,404,925 | | | | 33,904,438 | | | | 21,019,246 | | | | 22,235,286 | |
Liabilities: | | | | | | | | | | | | | | | | |
Payable for return of collateral on loaned securities | | | — | | | | 1,060,536 | | | | 163,352 | | | | 1,923,852 | |
Payable for investments purchased | | | — | | | | — | | | | 3,359,195 | | | | — | |
Payable for shares redeemed | | | 3,115 | | | | 35,277 | | | | 13,053 | | | | 14,052 | |
Accrued expenses and other payables: | | | | | | | | | | | | | | | | |
Investment advisor fees | | | — | | | | 16,558 | | | | 8,889 | | | | 10,314 | |
Administration fees | | | 6,823 | | | | 5,028 | | | | 2,699 | | | | 3,132 | |
Custodian fees | | | 420 | | | | 752 | | | | 435 | | | | 491 | |
Professional fees | | | 3,273 | | | | 2,536 | | | | 1,316 | | | | 1,605 | |
Financial administration fees | | | 329 | | | | 1,720 | | | | 982 | | | | 1,372 | |
Printing and postage | | | 5,210 | | | | 3,780 | | | | 2,220 | | | | 2,366 | |
Transfer agent fees | | | 2,510 | | | | 2,116 | | | | 1,649 | | | | 1,766 | |
Compliance service fees | | | 422 | | | | 324 | | | | 170 | | | | 204 | |
Other | | | 118 | | | | 170 | | | | 108 | | | | 93 | |
| | | | | | | | | | | | | | | | |
Total Liabilities | | | 22,220 | | | | 1,128,797 | | | | 3,554,068 | | | | 1,959,247 | |
| | | | | | | | | | | | | | | | |
Net Assets | | $ | 44,382,705 | | | $ | 32,775,641 | | | $ | 17,465,178 | | | $ | 20,276,039 | |
| | | | | | | | | | | | | | | | |
Net Assets consist of: | | | | | | | | | | | | | | | | |
Paid in capital | | $ | 39,047,165 | | | $ | 39,036,804 | | | $ | 16,727,439 | | | $ | 22,161,249 | |
Net unrealized appreciation of investments, options and translations of assets and liabilities in foreign currency | | | 4,588,746 | | | | 1,704,255 | | | | 1,522,310 | | | | 1,929,312 | |
Accumulated net realized loss on investments, options and foreign currency transactions | | | (94,204 | ) | | | (9,215,960 | ) | | | (923,702 | ) | | | (4,612,922 | ) |
Accumulated net investment income | | | 840,998 | | | | 1,250,542 | | | | 139,131 | | | | 798,400 | |
| | | | | | | | | | | | | | | | |
Net Assets | | $ | 44,382,705 | | | $ | 32,775,641 | | | $ | 17,465,178 | | | $ | 20,276,039 | |
| | | | | | | | | | | | | | | | |
Shares Outstanding (unlimited number of shares authorized, no par value) | | | 3,092,086 | | | | 3,040,604 | | | | 2,098,691 | | | | 2,111,479 | |
| | | | | | | | | | | | | | | | |
Net Asset Value, Redemption Price and
Offering Price Per Share: | | | | | | | | | | | | | | | | |
(Net asset value, offering and redemption price per share) | | $ | 14.35 | | | $ | 10.78 | | | $ | 8.32 | | | $ | 9.60 | |
| | | | | | | | | | | | | | | | |
See Notes which are an integral part of the Financial Statements.
Huntington Funds
Statements of Assets and Liabilities
December 31, 2012
| | | | | | | | | | | | | | | | |
| | | Huntington VA
International
Equity Fund | | | Huntington VA
Macro 100
Fund | | | Huntington VA
Mid Corp
America Fund | | | Huntington VA
Real Strategies
Fund | |
Assets: | | | | | | | | | | | | | | | | |
Investments, at cost | | $ | 28,041,332 | | | $ | 6,938,546 | | | $ | 19,653,701 | | | $ | 4,143,279 | |
| | | | | | | | | | | | | | | | |
Investments, at value | | $ | 31,064,043 | | | $ | 7,179,870 | | | $ | 25,284,363 | | | $ | 3,986,161 | |
Investments in affiliated securities, at value | | | 1,158,404 | | | | 556,435 | | | | 782,960 | | | | 242,042 | |
| | | | | | | | | | | | | | | | |
Total investments | | | 32,222,447 | | | | 7,736,305 | | | | 26,067,323 | | | | 4,228,203 | |
Cash | | | 2,508 | | | | — | | | | — | | | | — | |
Foreign currencies, at value (Cost $17, $-, $- and $-) | | | 18 | | | | — | | | | — | | | | — | |
Income receivable | | | 53,771 | | | | 6,465 | | | | 30,230 | | | | 4,776 | |
Receivable for investments sold | | | 5,175 | | | | — | | | | — | | | | — | |
Receivable for shares sold | | | 61,875 | | | | 1,404 | | | | — | | | | 312 | |
Tax reclaims receivable | | | 11,168 | | | | — | | | | — | | | | — | |
Prepaid expenses and other assets | | | 3,029 | | | | 2,235 | | | | 2,441 | | | | 2,105 | |
| | | | | | | | | | | | | | | | |
Total assets | | | 32,359,991 | | | | 7,746,409 | | | | 26,099,994 | | | | 4,235,396 | |
Liabilities: | | | | | | | | | | | | | | | | |
Payable for return of collateral on loaned securities | | | 1,244,288 | | | | 136,265 | | | | 754,921 | | | | 428,558 | |
Payable for investments purchased | | | — | | | | — | | | | — | | | | 70 | |
Payable for shares redeemed | | | 10,675 | | | | 3,041 | | | | 42,700 | | | | 433 | |
Accrued expenses and other payables: | | | | | | | | | | | | | | | | |
Investment advisor fees | | | 15,967 | | | | 3,845 | | | | 12,833 | | | | 1,887 | |
Administration fees | | | 4,849 | | | | 1,168 | | | | 3,897 | | | | 573 | |
Custodian fees | | | 1,511 | | | | 156 | | | | 633 | | | | 92 | |
Professional fees | | | 2,356 | | | | 569 | | | | 1,944 | | | | 282 | |
Financial administration fees | | | 2,503 | | | | 1,963 | | | | 3,564 | | | | 1,260 | |
Printing and postage | | | 3,304 | | | | 929 | | | | 3,306 | | | | 452 | |
Transfer agent fees | | | 2,149 | | | | 1,419 | | | | 1,778 | | | | 1,291 | |
Compliance service fees | | | 299 | | | | 73 | | | | 246 | | | | 37 | |
Other | | | 1,290 | | | | 99 | | | | 249 | | | | 10 | |
| | | | | | | | | | | | | | | | |
Total Liabilities | | | 1,289,191 | | | | 149,527 | | | | 826,071 | | | | 434,945 | |
| | | | | | | | | | | | | | | | |
Net Assets | | $ | 31,070,800 | | | $ | 7,596,882 | | | $ | 25,273,923 | | | $ | 3,800,451 | |
| | | | | | | | | | | | | | | | |
Net Assets consist of: | | | | | | | | | | | | | | | | |
Paid in capital | | $ | 30,379,014 | | | $ | 9,019,884 | | | $ | 18,613,628 | | | $ | 3,570,769 | |
Net unrealized appreciation of investments, options and translations of assets and liabilities in foreign currency | | | 4,181,834 | | | | 797,759 | | | | 6,413,622 | | | | 84,924 | |
Accumulated net realized gain (loss) on investments, options and foreign currency transactions | | | (3,973,856 | ) | | | (2,315,676 | ) | | | 54,178 | | | | 118,415 | |
Accumulated net investment income | | | 483,808 | | | | 94,915 | | | | 192,495 | | | | 26,343 | |
| | | | | | | | | | | | | | | | |
Net Assets | | $ | 31,070,800 | | | $ | 7,596,882 | | | $ | 25,273,923 | | | $ | 3,800,451 | |
| | | | | | | | | | | | | | | | |
Shares Outstanding (unlimited number of shares authorized, no par value) | | | 2,184,074 | | | | 781,516 | | | | 1,366,384 | | | | 436,992 | |
| | | | | | | | | | | | | | | | |
Net Asset Value, Redemption Price and
Offering Price Per Share: | | | | | | | | | | | | | | | | |
(Net asset value, offering and redemption price per share) | | $ | 14.23 | | | $ | 9.72 | | | $ | 18.50 | | | $ | 8.70 | |
| | | | | | | | | | | | | | | | |
See Notes which are an integral part of the Financial Statements.
Huntington Funds
Statements of Assets and Liabilities
December 31, 2012
| | | | | | | | | | | | |
| | | Huntington VA
Rotating
Markets Fund | | | Huntington VA
Situs Fund | | | Huntington VA
Mortgage
Securities Fund | |
Assets: | | | | | | | | | | | | |
Investments, at cost | | $ | 6,077,678 | | | $ | 36,644,129 | | | $ | 18,811,222 | |
| | | | | | | | | | | | |
Investments, at value | | $ | 5,927,589 | | | $ | 45,817,308 | | | $ | 19,560,934 | |
Investments in affiliated securities, at value | | | 86,329 | | | | 2,078,878 | | | | 572,278 | |
| | | | | | | | | | | | |
Total investments | | | 6,013,918 | | | | 47,896,186 | | | | 20,133,212 | |
Cash | | | 74 | | | | — | | | | 36 | |
Income receivable | | | 2,517 | | | | 23,637 | | | | 60,334 | |
Receivable for investments sold | | | — | | | | — | | | | 73 | |
Receivable for shares sold | | | 368 | | | | 443,869 | | | | 3,536 | |
Tax reclaims receivable | | | — | | | | 1,547 | | | | — | |
Prepaid expenses and other assets | | | 2,183 | | | | 3,450 | | | | 2,651 | |
| | | | | | | | | | | | |
Total assets | | | 6,019,060 | | | | 48,368,689 | | | | 20,199,842 | |
Liabilities: | | | | | | | | | | | | |
Payable for return of collateral on loaned securities | | | 16,391 | | | | 2,856,982 | | | | 103,566 | |
Options written, at value (premium received $-, $56,121 and $-) | | | — | | | | 31,125 | | | | — | |
Payable for shares redeemed | | | 3,444 | | | | 34,352 | | | | 3,769 | |
Accrued expenses and other payables: | | | | | | | | | | | | |
Investment advisor fees | | | 3,010 | | | | 21,983 | | | | 10,155 | |
Administration fees | | | 914 | | | | 6,675 | | | | 3,083 | |
Custodian fees | | | 165 | | | | 1,053 | | | | 468 | |
Professional fees | | | 432 | | | | 3,202 | | | | 1,451 | |
Financial administration fees | | | 1,147 | | | | 2,319 | | | | 10,146 | |
Printing and postage | | | 796 | | | | 5,188 | | | | 2,674 | |
Transfer agent fees | | | 1,318 | | | | 2,505 | | | | 1,712 | |
Compliance service fees | | | 56 | | | | 399 | | | | 191 | |
Other | | | 88 | | | | 608 | | | | 87 | |
| | | | | | | | | | | | |
Total Liabilities | | | 27,761 | | | | 2,966,391 | | | | 137,302 | |
| | | | | | | | | | | | |
Net Assets | | $ | 5,991,299 | | | $ | 45,402,298 | | | $ | 20,062,540 | |
| | | | | | | | | | | | |
Net Assets consist of: | | | | | | | | | | | | |
Paid in capital | | $ | 5,426,568 | | | $ | 34,885,417 | | | $ | 18,682,811 | |
Net unrealized appreciation (depreciation) of investments, options and translations of assets and liabilities in foreign currency | | | (63,760 | ) | | | 11,277,110 | | | | 1,321,990 | |
Accumulated net realized gain (loss) on investments, options and foreign currency transactions | | | 581,280 | | | | (1,068,006 | ) | | | (412,605 | ) |
Accumulated net investment income | | | 47,211 | | | | 307,777 | | | | 470,344 | |
| | | | | | | | | | | | |
Net Assets | | $ | 5,991,299 | | | $ | 45,402,298 | | | $ | 20,062,540 | |
| | | | | | | | | | | | |
Shares Outstanding (unlimited number of shares authorized, no par value) | | | 481,921 | | | | 2,492,985 | | | | 1,677,759 | |
| | | | | | | | | | | | |
Net Asset Value, Redemption Price and
Offering Price Per Share: | | | | | | | | | | | | |
(Net asset value, offering and redemption price per share) | | $ | 12.43 | | | $ | 18.21 | | | $ | 11.96 | |
| | | | | | | | | | | | |
See Notes which are an integral part of the Financial Statements.
Huntington Funds
Statements of Operations
Year Ended December 31, 2012
| | | | | | | | | | | | | | | | |
| | | Huntington VA
Balanced Fund | | | Huntington VA
Dividend
Capture Fund | | | Huntington VA
Growth Fund | | | Huntington VA
Income Equity
Fund | |
Investment Income: | | | | | | | | | | | | | | | | |
Dividend income | | $ | — | | | $ | 1,591,307 | | | $ | 354,412 | | | $ | 1,031,442 | |
Dividend income from affiliated securities | | | 885,192 | | | | 67 | | | | 62 | | | | 31 | |
Income from securities lending, net(a) | | | — | | | | 33,135 | | | | 3,905 | | | | 3,352 | |
Foreign dividend taxes withheld | | | — | | | | (22,683 | ) | | | (2,177 | ) | | | (23,479 | ) |
| | | | | | | | | | | | | | | | |
Total investment income | | | 885,192 | | | | 1,601,826 | | | | 356,202 | | | | 1,011,346 | |
| | | | | | | | | | | | | | | | |
Expenses: | | | | | | | | | | | | | | | | |
Investment advisor fees | | | 43,365 | | | | 200,451 | | | | 109,539 | | | | 126,017 | |
Administration fees | | | 79,011 | | | | 60,870 | | | | 33,263 | | | | 38,267 | |
Custodian fees | | | 4,902 | | | | 9,000 | | | | 4,930 | | | | 5,637 | |
Transfer and dividend disbursing agent fees and expenses | | | 11,032 | | | | 9,986 | | | | 8,607 | | | | 8,812 | |
Trustees’ fees | | | 3,591 | | | | 2,781 | | | | 1,517 | | | | 1,754 | |
Professional fees | | | 12,075 | | | | 9,376 | | | | 5,008 | | | | 5,916 | |
Financial administration fees | | | 1,038 | | | | 5,408 | | | | 3,820 | | | | 4,147 | |
Printing and postage | | | 12,310 | | | | 9,220 | | | | 5,032 | | | | 5,862 | |
Insurance premiums | | | 3,474 | | | | 3,245 | | | | 2,882 | | | | 2,935 | |
Compliance service fees | | | 1,568 | | | | 1,348 | | | | 716 | | | | 859 | |
Line of credit fees and interest expense | | | 817 | | | | 643 | | | | 364 | | | | 404 | |
Other | | | 4,263 | | | | 3,627 | | | | 1,911 | | | | 2,186 | |
| | | | | | | | | | | | | | | | |
Total expenses | | | 177,446 | | | | 315,955 | | | | 177,589 | | | | 202,796 | |
| | | | | | | | | | | | | | | | |
Investment advisory fees waived | | | (43,365 | ) | | | — | | | | — | | | | — | |
Reimbursement from advisor | | | (89,886 | ) | | | — | | | | — | | | | — | |
| | | | | | | | | | | | | | | | |
Net expenses | | | 44,195 | | | | 315,955 | | | | 177,589 | | | | 202,796 | |
| | | | | | | | | | | | | | | | |
Net investment income | | | 840,997 | | | | 1,285,871 | | | | 178,613 | | | | 808,550 | |
| | | | | | | | | | | | | | | | |
Net Realized/Unrealized Gain (Loss) on Investments,
Options and Foreign Currency Transactions: | | | | | | | | | | | | | | | | |
Net realized gain on investment transactions | | | — | | | | 1,953,006 | | | | 1,072,802 | | | | 775,757 | |
Net realized gain on transactions from affiliates | | | 342,088 | | | | — | | | | — | | | | — | |
Net realized gain on option transactions | | | — | | | | — | | | | 11,472 | | | | 34,670 | |
Net realized loss on foreign currency transactions | | | — | | | | — | | | | — | | | | (4,043 | ) |
| | | | | | | | | | | | | | | | |
Net realized gain on investments, options and foreign currency transactions | | | 342,088 | | | | 1,953,006 | | | | 1,084,274 | | | | 806,384 | |
| | | | | | | | | | | | | | | | |
Net change in unrealized appreciation of investments, options and translation of assets and liabilities in foreign currency | | | 2,629,042 | | | | 288,287 | | | | 582,487 | | | | 465,841 | |
| | | | | | | | | | | | | | | | |
Net realized and unrealized gain on investments options and foreign currency transactions | | | 2,971,130 | | | | 2,241,293 | | | | 1,666,761 | | | | 1,272,225 | |
| | | | | | | | | | | | | | | | |
Change in net assets resulting from operations | | $ | 3,812,127 | | | $ | 3,527,164 | | | $ | 1,845,374 | | | $ | 2,080,775 | |
| | | | | | | | | | | | | | | | |
| (a) | Income from securities lending is net of ($—, $7,158, $754 and $564) expenses paid to Huntington Bank. |
See Notes which are an integral part of the Financial Statements.
Huntington Funds
Statements of Operations
Year Ended December 31, 2012
| | | | | | | | | | | | | | | | |
| | | Huntington VA
International
Equity Fund | | | Huntington VA
Macro 100
Fund | | | Huntington VA
Mid Corp
America Fund | | | Huntington VA
Real Strategies
Fund | |
Investment Income: | | | | | | | | | | | | | | | | |
Dividend income | | $ | 912,515 | | | $ | 175,095 | | | $ | 425,117 | | | $ | 79,058 | |
Dividend income from affiliated securities | | | 338 | | | | 67 | | | | 110 | | | | 3,883 | |
Income from securities lending, net(a) | | | 11,906 | | | | 916 | | | | 24,860 | | | | 22,569 | |
Foreign dividend taxes withheld | | | (99,439 | ) | | | — | | | | (8,945 | ) | | | (3,229 | ) |
| | | | | | | | | | | | | | | | |
Total investment income | | | 825,320 | | | | 176,078 | | | | 441,142 | | | | 102,281 | |
| | | | | | | | | | | | | | | | |
Expenses: | | | | | | | | | | | | | | | | |
Investment advisor fees | | | 177,581 | | | | 43,471 | | | | 139,410 | | | | 22,549 | |
Administration fees | | | 53,925 | | | | 13,201 | | | | 42,334 | | | | 6,848 | |
Custodian fees | | | 16,448 | | | | 1,926 | | | | 6,114 | | | | 1,011 | |
Transfer and dividend disbursing agent fees and expenses | | | 9,749 | | | | 7,633 | | | | 8,709 | | | | 7,431 | |
Trustees’ fees | | | 2,458 | | | | 605 | | | | 1,994 | | | | 312 | |
Professional fees | | | 8,284 | | | | 2,080 | | | | 19,158 | | | | 1,399 | |
Financial administration fees | | | 6,911 | | | | 5,791 | | | | 7,631 | | | | 3,468 | |
Printing and postage | | | 8,686 | | | | 2,705 | | | | 11,450 | | | | 1,169 | |
Insurance premiums | | | 3,109 | | | | 2,596 | | | | 4,449 | | | | 2,530 | |
Compliance service fees | | | 1,127 | | | | 299 | | | | 989 | | | | 144 | |
Line of credit fees and interest expense | | | 543 | | | | 130 | | | | 463 | | | | 73 | |
Other | | | 6,169 | | | | 868 | | | | 2,896 | | | | 484 | |
| | | | | | | | | | | | | | | | |
Total expenses | | | 294,990 | | | | 81,305 | | | | 245,597 | | | | 47,418 | |
| | | | | | | | | | | | | | | | |
Net investment income | | | 530,330 | | | | 94,773 | | | | 195,545 | | | | 54,863 | |
| | | | | | | | | | | | | | | | |
Net Realized/Unrealized Gain (Loss) on Investments,
Options and Foreign Currency Transactions: | | | | | | | | | | | | | | | | |
Net realized gain (loss) on investment transactions | | | (1,029,723 | ) | | | 92,605 | | | | 1,738,788 | | | | 84,077 | |
Net realized gain on option transactions | | | — | | | | — | | | | — | | | | 21,781 | |
Net realized loss on foreign currency transactions | | | (40,909 | ) | | | — | | | | — | | | | — | |
| | | | | | | | | | | | | | | | |
Net realized gain (loss) on investments, options and foreign currency transactions | | | (1,070,632 | ) | | | 92,605 | | | | 1,738,788 | | | | 105,858 | |
| | | | | | | | | | | | | | | | |
Net change in unrealized appreciation/depreciation of investments, options and translation of assets and liabilities in foreign currency | | | 4,376,541 | | | | 492,008 | | | | 472,293 | | | | (199 | ) |
| | | | | | | | | | | | | | | | |
Net realized and unrealized gain on investments options and foreign currency transactions | | | 3,305,909 | | | | 584,613 | | | | 2,211,081 | | | | 105,659 | |
| | | | | | | | | | | | | | | | |
Change in net assets resulting from operations | | $ | 3,836,239 | | | $ | 679,386 | | | $ | 2,406,626 | | | $ | 160,522 | |
| | | | | | | | | | | | | | | | |
| (a) | Income from securities lending is net of ($2,261, $187, $6,028 and $4,898) expenses paid to Huntington Bank. |
See Notes which are an integral part of the Financial Statements.
Huntington Funds
Statements of Operations
Year Ended December 31, 2012
| | | | | | | | | | | | |
| | | Huntington VA
Rotating
Markets Fund | | | Huntington VA
Situs Fund | | | Huntington VA
Mortgage
Securities Fund | |
Investment Income: | | | | | | | | | | | | |
Dividend income | | $ | 117,418 | | | $ | 582,978 | | | $ | 62,374 | |
Dividend income from affiliated securities | | | 13 | | | | 276 | | | | 109 | |
Interest income | | | — | | | | — | | | | 499,011 | |
Income from securities lending, net(a) | | | 995 | | | | 29,095 | | | | 689 | |
Foreign dividend taxes withheld | | | (236 | ) | | | (1,519 | ) | | | (23 | ) |
| | | | | | | | | | | | |
Total investment income | | | 118,190 | | | | 610,830 | | | | 562,160 | |
| | | | | | | | | | | | |
Expenses: | | | | | | | | | | | | |
Investment advisor fees | | | 38,239 | | | | 241,439 | | | | 122,322 | |
Administration fees | | | 11,612 | | | | 73,316 | | | | 37,145 | |
Custodian fees | | | 1,732 | | | | 13,484 | | | | 5,498 | |
Transfer and dividend disbursing agent fees and expenses | | | 7,491 | | | | 10,872 | | | | 8,682 | |
Trustees’ fees | | | 527 | | | | 3,325 | | | | 1,693 | |
Professional fees | | | 1,754 | | | | 11,416 | | | | 5,714 | |
Financial administration fees | | | 4,005 | | | | 6,819 | | | | 30,819 | |
Printing and postage | | | 1,775 | | | | 16,043 | | | | 6,046 | |
Insurance premiums | | | 2,596 | | | | 3,255 | | | | 2,977 | |
Compliance service fees | | | 258 | | | | 1,491 | | | | 789 | |
Line of credit fees and interest expense | | | 134 | | | | 844 | | | | 394 | |
Other | | | 833 | | | | 6,049 | | | | 2,601 | |
| | | | | | | | | | | | |
Total expenses | | | 70,956 | | | | 388,353 | | | | 224,680 | |
| | | | | | | | | | | | |
Net investment income | | | 47,234 | | | | 222,477 | | | | 337,480 | |
| | | | | | | | | | | | |
Net Realized/Unrealized Gain (Loss) on Investments,
Options and Foreign Currency Transactions: | | | | | | | | | | | | |
Net realized gain (loss) on investment transactions | | | 1,461,412 | | | | 264,682 | | | | 25,685 | |
Net realized gain on option transactions | | | — | | | | 128,503 | | | | — | |
Net realized loss on foreign currency transactions | | | (14 | ) | | | (559 | ) | | | (6 | ) |
| | | | | | | | | | | | |
Net realized gain (loss) on investments, options and foreign currency transactions | | | 1,461,398 | | | | 392,626 | | | | 25,679 | |
| | | | | | | | | | | | |
Net change in unrealized appreciation/depreciation of investments, options and translation of assets and liabilities in foreign currency | | | (1,066,523 | ) | | | 7,616,183 | | | | 300,304 | |
| | | | | | | | | | | | |
Net realized and unrealized gain on investments options and foreign currency transactions | | | 394,875 | | | | 8,008,809 | | | | 325,983 | |
| | | | | | | | | | | | |
Change in net assets resulting from operations | | $ | 442,109 | | | $ | 8,231,286 | | | $ | 663,463 | |
| | | | | | | | | | | | |
| (a) | Income from securities lending is net of ($187, $6,028 and $151) expenses paid to Huntington Bank. |
See Notes which are an integral part of the Financial Statements.
Huntington Funds
Statements of Changes in Net Assets
| | | | | | | | | | | | | | | | |
| | | Huntington VA
Balanced Fund | | | Huntington VA
Dividend Capture Fund | |
| | | Year Ended
December 31, 2012 | | | Year Ended
December 31, 2011 | | | Year Ended
December 31, 2012 | | | Year Ended
December 31, 2011 | |
Increase (Decrease) in Net Assets: | | | | | | | | | | | | | | | | |
Operations— | | | | | | | | | | | | | | | | |
Net investment income | | $ | 840,997 | | | $ | 657,205 | | | $ | 1,285,871 | | | $ | 1,240,780 | |
Net realized gain (loss) on investments | | | 342,088 | | | | (161,106 | ) | | | 1,953,006 | | | | 2,484,913 | |
Net change in unrealized appreciation/depreciation of investments | | | 2,629,042 | | | | (91,120 | ) | | | 288,287 | | | | (1,520,449 | ) |
| | | | | | | | | | | | | | | | |
Change in net assets resulting from operations | | | 3,812,127 | | | | 404,979 | | | | 3,527,164 | | | | 2,205,244 | |
| | | | | | | | | | | | | | | | |
Distributions to Shareholders— | | | | | | | | | | | | | | | | |
From net investment income | | | (657,202 | ) | | | (355,696 | ) | | | (1,257,345 | ) | | | (1,161,458 | ) |
From net realized gain on investments | | | (193,193 | ) | | | (1,630 | ) | | | — | | | | — | |
| | | | | | | | | | | | | | | | |
Change in net assets resulting from distributions to shareholders | | | (850,395 | ) | | | (357,326 | ) | | | (1,257,345 | ) | | | (1,161,458 | ) |
| | | | | | | | | | | | | | | | |
Change in net assets resulting from capital transactions | | | 2,096,820 | | | | 12,407,778 | | | | (1,320,035 | ) | | | (2,842,867 | ) |
| | | | | | | | | | | | | | | | |
Change in net assets | | | 5,058,552 | | | | 12,455,431 | | | | 949,784 | | | | (1,799,081 | ) |
Net Assets: | | | | | | | | | | | | | | | | |
Beginning of year | | | 39,324,153 | | | | 26,868,722 | | | | 31,825,857 | | | | 33,624,938 | |
| | | | | | | | | | | | | | | | |
End of year | | $ | 44,382,705 | | | $ | 39,324,153 | | | $ | 32,775,641 | | | $ | 31,825,857 | |
| | | | | | | | | | | | | | | | |
Accumulated net investment income included in net assets at end of year | | $ | 840,998 | | | $ | 657,203 | | | $ | 1,250,542 | | | $ | 1,225,213 | |
| | | | | | | | | | | | | | | | |
Capital Transactions: | | | | | | | | | | | | | | | | |
Shares Sold | | | 4,527,533 | | | | 13,389,240 | | | | 5,180,583 | | | | 5,148,394 | |
Dividends reinvested | | | 850,395 | | | | 357,326 | | | | 1,257,345 | | | | 1,161,458 | |
Shares redeemed | | | (3,281,108 | ) | | | (1,338,788 | ) | | | (7,757,963 | ) | | | (9,152,719 | ) |
| | | | | | | | | | | | | | | | |
Net change resulting from capital transactions | | $ | 2,096,820 | | | $ | 12,407,778 | | | $ | (1,320,035 | ) | | $ | (2,842,867 | ) |
| | | | | | | | | | | | | | | | |
Share Transactions: | | | | | | | | | | | | | | | | |
Shares Sold | | | 321,702 | | | | 990,533 | | | | 481,474 | | | | 509,850 | |
Dividends reinvested | | | 59,149 | | | | 26,747 | | | | 117,729 | | | | 115,110 | |
Shares redeemed | | | (230,111 | ) | | | (101,750 | ) | | | (721,790 | ) | | | (911,404 | ) |
| | | | | | | | | | | | | | | | |
Net change resulting from share transactions | | | 150,740 | | | | 915,530 | | | | (122,587 | ) | | | (286,444 | ) |
| | | | | | | | | | | | | | | | |
See Notes which are an integral part of the Financial Statements.
Huntington Funds
Statements of Changes in Net Assets
| | | | | | | | | | | | | | | | |
| | | Huntington VA
Growth Fund | | | Huntington VA
Income Equity Fund | |
| | | Year Ended
December 31, 2012 | | | Year Ended
December 31, 2011 | | | Year Ended
December 31, 2012 | | | Year Ended
December 31, 2011 | |
Increase (Decrease) in Net Assets: | | | | | | | | | | | | | | | | |
Operations— | | | | | | | | | | | | | | | | |
Net investment income | | $ | 178,613 | | | $ | 73,659 | | | $ | 808,550 | | | $ | 756,346 | |
Net realized gain on investments | | | 1,084,274 | | | | 442,382 | | | | 806,384 | | | | 980,260 | |
Net change in unrealized appreciation/depreciation of investments | | | 582,487 | | | | (966,798 | ) | | | 465,841 | | | | (304,346 | ) |
| | | | | | | | | | | | | | | | |
Change in net assets resulting from operations | | | 1,845,374 | | | | (450,757 | ) | | | 2,080,775 | | | | 1,432,260 | |
| | | | | | | | | | | | | | | | |
Distributions to Shareholders— | | | | | | | | | | | | | | | | |
From net investment income | | | (61,447 | ) | | | (27,515 | ) | | | (776,185 | ) | | | (566,505 | ) |
| | | | | | | | | | | | | | | | |
Change in net assets resulting from distributions to shareholders | | | (61,447 | ) | | | (27,515 | ) | | | (776,185 | ) | | | (566,505 | ) |
| | | | | | | | | | | | | | | | |
Change in net assets resulting from capital transactions | | | (1,932,099 | ) | | | (419,828 | ) | | | (1,055,762 | ) | | | (2,636,859 | ) |
| | | | | | | | | | | | | | | | |
Change in net assets | | | (148,172 | ) | | | (898,100 | ) | | | 248,828 | | | | (1,771,104 | ) |
Net Assets: | | | | | | | | | | | | | | | | |
Beginning of year | | | 17,613,350 | | | | 18,511,450 | | | | 20,027,211 | | | | 21,798,315 | |
| | | | | | | | | | | | | | | | |
End of year | | $ | 17,465,178 | | | $ | 17,613,350 | | | $ | 20,276,039 | | | $ | 20,027,211 | |
| | | | | | | | | | | | | | | | |
Accumulated net investment income included in net assets at end of year | | $ | 139,131 | | | $ | 74,975 | | | $ | 798,400 | | | $ | 770,078 | |
| | | | | | | | | | | | | | | | |
Capital Transactions: | | | | | | | | | | | | | | | | |
Shares Sold | | | 1,772,989 | | | | 4,530,067 | | | | 2,935,290 | | | | 2,966,234 | |
Dividends reinvested | | | 61,447 | | | | 27,515 | | | | 776,185 | | | | 566,505 | |
Shares redeemed | | | (3,766,535 | ) | | | (4,977,410 | ) | | | (4,767,237 | ) | | | (6,169,598 | ) |
| | | | | | | | | | | | | | | | |
Net change resulting from capital transactions | | $ | (1,932,099 | ) | | $ | (419,828 | ) | | $ | (1,055,762 | ) | | $ | (2,636,859 | ) |
| | | | | | | | | | | | | | | | |
Share Transactions: | | | | | | | | | | | | | | | | |
Shares Sold | | | 215,070 | | | | 598,210 | | | | 304,026 | | | | 333,449 | |
Dividends reinvested | | | 7,503 | | | | 3,620 | | | | 81,963 | | | | 62,666 | |
Shares redeemed | | | (452,632 | ) | | | (647,003 | ) | | | (494,160 | ) | | | (689,519 | ) |
| | | | | | | | | | | | | | | | |
Net change resulting from share transactions | | | (230,059 | ) | | | (45,173 | ) | | | (108,171 | ) | | | (293,404 | ) |
| | | | | | | | | | | | | | | | |
See Notes which are an integral part of the Financial Statements.
Huntington Funds
Statements of Changes in Net Assets
| | | | | | | | | | | | | | | | |
| | | Huntington VA
International Equity Fund | | | Huntington VA
Macro 100 Fund | |
| | | Year Ended
December 31, 2012 | | | Year Ended
December 31, 2011 | | | Year Ended
December 31, 2012 | | | Year Ended
December 31, 2011 | |
Increase (Decrease) in Net Assets: | | | | | | | | | | | | | | | | |
Operations— | | | | | | | | | | | | | | | | |
Net investment income | | $ | 530,330 | | | $ | 438,264 | | | $ | 94,773 | | | $ | 38,763 | |
Net realized gain (loss) on investments | | | (1,070,632 | ) | | | (75,278 | ) | | | 92,605 | | | | 304,411 | |
Net change in unrealized appreciation/depreciation of investments | | | 4,376,541 | | | | (3,427,524 | ) | | | 492,008 | | | | (459,421 | ) |
| | | | | | | | | | | | | | | | |
Change in net assets resulting from operations | | | 3,836,239 | | | | (3,064,538 | ) | | | 679,386 | | | | (116,247 | ) |
| | | | | | | | | | | | | | | | |
Distributions to Shareholders— | | | | | | | | | | | | | | | | |
From net investment income | | | (380,441 | ) | | | (323,030 | ) | | | (44,426 | ) | | | (34,846 | ) |
| | | | | | | | | | | | | | | | |
Change in net assets resulting from distributions to shareholders | | | (380,441 | ) | | | (323,030 | ) | | | (44,426 | ) | | | (34,846 | ) |
| | | | | | | | | | | | | | | | |
Change in net assets resulting from capital transactions | | | 1,530,045 | | | | 6,824,594 | | | | 801,234 | | | | (303,138 | ) |
| | | | | | | | | | | | | | | | |
Change in net assets | | | 4,985,843 | | | | 3,437,026 | | | | 1,436,194 | | | | (454,231 | ) |
Net Assets: | | | | | | | | | | | | | | | | |
Beginning of year | | | 26,084,957 | | | | 22,647,931 | | | | 6,160,688 | | | | 6,614,919 | |
| | | | | | | | | | | | | | | | |
End of year | | $ | 31,070,800 | | | $ | 26,084,957 | | | $ | 7,596,882 | | | $ | 6,160,688 | |
| | | | | | | | | | | | | | | | |
Accumulated net investment income included in net assets at end of year | | $ | 483,808 | | | $ | 384,196 | | | $ | 94,915 | | | $ | 44,568 | |
| | | | | | | | | | | | | | | | |
Capital Transactions: | | | | | | | | | | | | | | | | |
Shares Sold | | | 7,227,331 | | | | 11,517,948 | | | | 2,201,625 | | | | 1,399,148 | |
Dividends reinvested | | | 380,441 | | | | 323,030 | | | | 44,426 | | | | 34,846 | |
Shares redeemed | | | (6,077,727 | ) | | | (5,016,384 | ) | | | (1,444,817 | ) | | | (1,737,132 | ) |
| | | | | | | | | | | | | | | | |
Net change resulting from capital transactions | | $ | 1,530,045 | | | $ | 6,824,594 | | | $ | 801,234 | | | $ | (303,138 | ) |
| | | | | | | | | | | | | | | | |
Share Transactions: | | | | | | | | | | | | | | | | |
Shares Sold | | | 540,031 | | | | 835,329 | | | | 232,320 | | | | 157,913 | |
Dividends reinvested | | | 27,001 | | | | 25,719 | | | | 4,642 | | | | 3,929 | |
Shares redeemed | | | (448,471 | ) | | | (362,222 | ) | | | (152,447 | ) | | | (199,023 | ) |
| | | | | | | | | | | | | | | | |
Net change resulting from share transactions | | | 118,561 | | | | 498,826 | | | | 84,515 | | | | (37,181 | ) |
| | | | | | | | | | | | | | | | |
See Notes which are an integral part of the Financial Statements.
Huntington Funds
Statements of Changes in Net Assets
| | | | | | | | | | | | | | | | |
| | | Huntington VA
Mid Corp America Fund | | | Huntington VA
Real Strategies Fund | |
| | | Year Ended
December 31, 2012 | | | Year Ended
December 31, 2011 | | | Year Ended
December 31, 2012 | | | Year Ended
December 31, 2011 | |
Increase (Decrease) in Net Assets: | | | | | | | | | | | | | | | | |
Operations— | | | | | | | | | | | | | | | | |
Net investment income | | $ | 195,545 | | | $ | 61,991 | | | $ | 54,863 | | | $ | 10,726 | |
Net realized gain on investments | | | 1,738,788 | | | | 2,383,834 | | | | 105,858 | | | | 81,142 | |
Net change in unrealized appreciation/depreciation of investments | | | 472,293 | | | | (2,887,980 | ) | | | (199 | ) | | | (462,169 | ) |
| | | | | | | | | | | | | | | | |
Change in net assets resulting from operations | | | 2,406,626 | | | | (442,155 | ) | | | 160,522 | | | | (370,301 | ) |
| | | | | | | | | | | | | | | | |
Distributions to Shareholders— | | | | | | | | | | | | | | | | |
From net investment income | | | (63,776 | ) | | | (78,630 | ) | | | (8,929 | ) | | | (5,592 | ) |
From net realized gain on investments | | | (1,305,821 | ) | | | — | | | | (18,205 | ) | | | — | |
| | | | | | | | | | | | | | | | |
Change in net assets resulting from distributions to shareholders | | | (1,369,597 | ) | | | (78,630 | ) | | | (27,134 | ) | | | (5,592 | ) |
| | | | | | | | | | | | | | | | |
Change in net assets resulting from capital transactions | | | 7,765,302 | | | | (3,323,703 | ) | | | 126,277 | | | | 896,349 | |
| | | | | | | | | | | | | | | | |
Change in net assets | | | 8,802,331 | | | | (3,844,488 | ) | | | 259,665 | | | | 520,456 | |
Net Assets: | | | | | | | | | | | | | | | | |
Beginning of year | | | 16,471,592 | | | | 20,316,080 | | | | 3,540,786 | | | | 3,020,330 | |
| | | | | | | | | | | | | | | | |
End of year | | $ | 25,273,923 | | | $ | 16,471,592 | | | $ | 3,800,451 | | | $ | 3,540,786 | |
| | | | | | | | | | | | | | | | |
Accumulated net investment income included in net assets at end of year | | $ | 192,495 | | | $ | 60,726 | | | $ | 26,343 | | | $ | (8,669 | ) |
| | | | | | | | | | | | | | | | |
Capital Transactions: | | | | | | | | | | | | | | | | |
Shares Sold | | | 1,962,153 | | | | 1,816,414 | | | | 678,400 | | | | 1,237,780 | |
Shares issued in connection with merger | | | 11,114,709 | | | | — | | | | | | | | | |
Dividends reinvested | | | 1,369,597 | | | | 78,630 | | | | 27,134 | | | | 5,592 | |
Shares redeemed | | | (6,681,157 | ) | | | (5,218,747 | ) | | | (579,257 | ) | | | (347,023 | ) |
| | | | | | | | | | | | | | | | |
Net change resulting from capital transactions | | $ | 7,765,302 | | | $ | (3,323,703 | ) | | $ | 126,277 | | | $ | 896,349 | |
| | | | | | | | | | | | | | | | |
Share Transactions: | | | | | | | | | | | | | | | | |
Shares Sold | | | 104,397 | | | | 104,174 | | | | 78,869 | | | | 134,954 | |
Shares issued in connection with merger | | | 577,960 | | | | — | | | | | | | | | |
Dividends reinvested | | | 74,855 | | | | 4,582 | | | | 3,159 | | | | 668 | |
Shares redeemed | | | (355,997 | ) | | | (295,427 | ) | | | (66,516 | ) | | | (38,397 | ) |
| | | | | | | | | | | | | | | | |
Net change resulting from share transactions | | | 401,215 | | | | (186,671 | ) | | | 15,512 | | | | 97,225 | |
| | | | | | | | | | | | | | | | |
See Notes which are an integral part of the Financial Statements.
Huntington Funds
Statements of Changes in Net Assets
| | | | | | | | | | | | | | | | |
| | | Huntington VA
Rotating Markets Fund | | | Huntington VA
Situs Fund | |
| | | Year Ended
December 31, 2012 | | | Year Ended
December 31, 2011 | | | Year Ended
December 31, 2012 | | | Year Ended
December 31, 2011 | |
Increase (Decrease) in Net Assets: | | | | | | | | | | | | | | | | |
Operations— | | | | | | | | | | | | | | | | |
Net investment income | | $ | 47,234 | | | $ | 97,697 | | | $ | 222,477 | | | $ | 950 | |
Net realized gain on investments | | | 1,461,398 | | | | 104,371 | | | | 392,626 | | | | 801,403 | |
Net change in unrealized appreciation/depreciation of investments | | | (1,066,523 | ) | | | 241,094 | | | | 7,616,183 | | | | (1,158,137 | ) |
| | | | | | | | | | | | | | | | |
Change in net assets resulting from operations | | | 442,109 | | | | 443,162 | | | | 8,231,286 | | | | (355,784 | ) |
| | | | | | | | | | | | | | | | |
Distributions to Shareholders— | | | | | | | | | | | | | | | | |
From net investment income | | | (97,697 | ) | | | (21,470 | ) | | | — | | | | (8,225 | ) |
| | | | | | | | | | | | | | | | |
Change in net assets resulting from distributions to shareholders | | | (97,697 | ) | | | (21,470 | ) | | | — | | | | (8,225 | ) |
| | | | | | | | | | | | | | | | |
Change in net assets resulting from capital transactions | | | (815,541 | ) | | | (916,614 | ) | | | 1,900,338 | | | | 11,951,894 | |
| | | | | | | | | | | | | | | | |
Change in net assets | | | (471,129 | ) | | | (494,922 | ) | | | 10,131,624 | | | | 11,587,885 | |
Net Assets: | | | | | | | | | | | | | | | | |
Beginning of year | | | 6,462,428 | | | | 6,957,350 | | | | 35,270,674 | | | | 23,682,789 | |
| | | | | | | | | | | | | | | | |
End of year | | $ | 5,991,299 | | | $ | 6,462,428 | | | $ | 45,402,298 | | | $ | 35,270,674 | |
| | | | | | | | | | | | | | | | |
Accumulated net investment income included in net assets at end of year | | $ | 47,211 | | | $ | 97,697 | | | $ | 307,777 | | | $ | 36,595 | |
| | | | | | | | | | | | | | | | |
Capital Transactions: | | | | | | | | | | | | | | | | |
Shares Sold | | | 644,785 | | | | 655,665 | | | | 13,584,039 | | | | 18,928,040 | |
Dividends reinvested | | | 97,697 | | | | 21,470 | | | | — | | | | 8,225 | |
Shares redeemed | | | (1,558,023 | ) | | | (1,593,749 | ) | | | (11,683,701 | ) | | | (6,984,371 | ) |
| | | | | | | | | | | | | | | | |
Net change resulting from capital transactions | | $ | (815,541 | ) | | $ | (916,614 | ) | | $ | 1,900,338 | | | $ | 11,951,894 | |
| | | | | | | | | | | | | | | | |
Share Transactions: | | | | | | | | | | | | | | | | |
Shares Sold | | | 51,034 | | | | 56,901 | | | | 817,181 | | | | 1,259,300 | |
Dividends reinvested | | | 8,028 | | | | 1,807 | | | | — | | | | 550 | |
Shares redeemed | | | (124,001 | ) | | | (138,399 | ) | | | (698,962 | ) | | | (465,166 | ) |
| | | | | | | | | | | | | | | | |
Net change resulting from share transactions | | | (64,939 | ) | | | (79,691 | ) | | | 118,219 | | | | 794,684 | |
| | | | | | | | | | | | | | | | |
See Notes which are an integral part of the Financial Statements.
Huntington Funds
Statements of Changes in Net Assets
| | | | | | | | |
| | | Huntington VA
Mortgage Securities Fund | |
| | | Year Ended
December 31, 2012 | | | Year Ended
December 31, 2011 | |
Increase (Decrease) in Net Assets: | | | | | | | | |
Operations— | | | | | | | | |
Net investment income | | $ | 337,480 | | | $ | 402,901 | |
Net realized gain (loss) on investments | | | 25,679 | | | | 4,224 | |
Net change in unrealized appreciation of investments | | | 300,304 | | | | 595,218 | |
| | | | | | | | |
Change in net assets resulting from operations | | | 663,463 | | | | 1,002,343 | |
| | | | | | | | |
Distributions to Shareholders— | | | | | | | | |
From net investment income | | | (487,131 | ) | | | (386,232 | ) |
| | | | | | | | |
Change in net assets resulting from distributions to shareholders | | | (487,131 | ) | | | (386,232 | ) |
| | | | | | | | |
Change in net assets resulting from capital transactions | | | 292,511 | | | | 1,629,844 | |
| | | | | | | | |
Change in net assets | | | 468,843 | | | | 2,245,955 | |
Net Assets: | | | | | | | | |
Beginning of year | | | 19,593,697 | | | | 17,347,742 | |
| | | | | | | | |
End of year | | $ | 20,062,540 | | | $ | 19,593,697 | |
| | | | | | | | |
Accumulated net investment income included in net assets at end of year | | $ | 470,344 | | | $ | 483,927 | |
| | | | | | | | |
Capital Transactions: | | | | | | | | |
Shares Sold | | | 3,252,286 | | | | 6,290,570 | |
Dividends reinvested | | | 487,131 | | | | 386,232 | |
Shares redeemed | | | (3,446,906 | ) | | | (5,046,958 | ) |
| | | | | | | | |
Net change resulting from capital transactions | | $ | 292,511 | | | $ | 1,629,844 | |
| | | | | | | | |
Share Transactions: | | | | | | | | |
Shares Sold | | | 269,096 | | | | 536,119 | |
Dividends reinvested | | | 40,798 | | | | 32,566 | |
Shares redeemed | | | (283,992 | ) | | | (426,704 | ) |
| | | | | | | | |
Net change resulting from share transactions | | | 25,902 | | | | 141,981 | |
| | | | | | | | |
See Notes which are an integral part of the Financial Statements.
Huntington Funds
Financial Highlights
(For a share outstanding throughout each period)
| | | | | | | | | | | | | | | | | | | | | | | | | | | | | | | | |
| | | Net Asset
Value,
Beginning
of Period | | | Net
Investment
Income (Loss) | | | Net Realized
and Unrealized
Gain (Loss) on
Investments | | | Total From
Investment
Operations | | | Distributions
from Net
Investment
Income | | |
Distributions
from Net
Realized Gain
on Investment
Transactions | | | Distributions
from Return
of Capital | | | Total
Distributions | |
Huntington VA Balanced Fund | |
2008(3) | | $ | 10.00 | | | | 0.18 | | | | 0.09 | | | | 0.27 | | | | (0.01 | ) | | | — | | | | — | | | | (0.01 | ) |
2009 | | $ | 10.26 | | | | 0.13 | (7) | | | 1.68 | | | | 1.81 | | | | (0.05 | ) | | | — | | | | — | | | | (0.05 | ) |
2010 | | $ | 12.02 | | | | 0.16 | | | | 1.09 | | | | 1.25 | | | | (0.01 | ) | | | — | | | | — | | | | (0.01 | ) |
2011 | | $ | 13.26 | | | | 0.17 | | | | 0.06 | | | | 0.23 | | | | (0.12 | ) | | | — | (8) | | | — | | | | (0.12 | ) |
2012 | | $ | 13.37 | | | | 0.27 | | | | 0.99 | | | | 1.26 | | | | (0.22 | ) | | | (0.06 | ) | | | — | | | | (0.28 | ) |
Huntington VA Dividend Capture Fund | |
2008 | | $ | 11.77 | | | | 0.58 | | | | (3.57 | ) | | | (2.99 | ) | | | (1.05 | ) | | | (0.58 | ) | | | (0.06 | ) | | | (1.69 | ) |
2009 | | $ | 7.09 | | | | 0.37 | | | | 1.41 | | | | 1.78 | | | | — | | | | — | | | | — | | | | — | |
2010 | | $ | 8.87 | | | | 0.38 | | | | 0.91 | | | | 1.29 | | | | (0.41 | ) | | | — | | | | — | | | | (0.41 | ) |
2011 | | $ | 9.75 | | | | 0.44 | | | | 0.25 | | | | 0.69 | | | | (0.38 | ) | | | — | | | | — | | | | (0.38 | ) |
2012 | | $ | 10.06 | | | | 0.45 | | | | 0.70 | | | | 1.15 | | | | (0.43 | ) | | | — | | | | — | | | | (0.43 | ) |
| | | | | | | | | | | | | | | | | | | | | | | | | | | | | | | | | |
| (1) | Total returns do not include any insurance, sales or administrative charges of variable annuity or life insurance contracts. If these were included, the returns would be lower. |
| (2) | If applicable, certain fees were waived and/or reimbursed. If such waivers/reimbursements had not occurred, the ratios would have been as indicated. |
| (3) | Reflects operations for the period from November 10, 2008 (commencement of operations) to December 31, 2008. |
| (5) | Computed on an annualized basis. |
| (6) | Does not include the effect of expenses of underlying funds. |
| (7) | Per share net investment income (loss) has been calculated using the average shares method. |
| (8) | Amount is less than $0.005. |
See Notes which are an integral part of the Financial Statements.
| | | | | | | | | | | | | | | | | | | | | | | | | | |
Net Asset
Value,
End of
Period | | | Total
Return(1) | | | Ratio of Net
Expenses
to Average
Net Assets | | | Ratio of Net
Investment
Income (Loss)
to Average
Net Assets | | | Ratio of
Expenses
(Prior to
Reimbursements)
to Average
Net Assets(2) | | | Net Assets,
End of Period
(000 Omitted) | | | Portfolio
Turnover
Rate | |
| | | | | | | | | | | | | | | | | | | | | | | | | | |
| $ | 10.26 | | | | 2.68 | %(4) | | | 0.10 | %(5)(6) | | | 14.05 | %(5) | | | 31.88 | %(5)(6) | | $ | 234 | | | | 19 | %(4) |
| $ | 12.02 | | | | 17.70 | % | | | 0.10 | %(6) | | | 1.11 | % | | | 0.61 | %(6) | | $ | 6,810 | | | | 20 | % |
| $ | 13.26 | | | | 10.43 | % | | | 0.10 | %(6) | | | 2.08 | % | | | 0.45 | %(6) | | $ | 26,869 | | | | 17 | % |
| $ | 13.37 | | | | 1.75 | % | | | 0.10 | %(6) | | | 1.94 | % | | | 0.46 | %(6) | | $ | 39,324 | | | | 27 | % |
| $ | 14.35 | | | | 9.42 | % | | | 0.10 | %(6) | | | 1.94 | % | | | 0.41 | %(6) | | $ | 44,383 | | | | 13 | % |
| | | | | | | | | | | | | | | | | | | | | | | | | | |
| $ | 7.09 | | | | (28.08 | )% | | | 0.91 | % | | | 4.88 | % | | | 0.91 | % | | $ | 29,332 | | | | 65 | % |
| $ | 8.87 | | | | 25.11 | % | | | 1.00 | % | | | 4.81 | % | | | 1.00 | % | | $ | 33,557 | | | | 94 | % |
| $ | 9.75 | | | | 15.12 | % | | | 0.98 | % | | | 3.54 | % | | | 0.98 | % | | $ | 33,625 | | | | 120 | % |
| $ | 10.06 | | | | 7.07 | % | | | 0.97 | % | | | 3.74 | % | | | 0.97 | % | | $ | 31,826 | | | | 142 | % |
| $ | 10.78 | | | | 11.47 | % | | | 0.95 | % | | | 3.85 | % | | | 0.95 | % | | $ | 32,776 | | | | 110 | % |
| | | | | | | | | | | | | | | | | | | | | | | | | | | |
Huntington Funds
Financial Highlights
(For a share outstanding throughout each period)
| | | | | | | | | | | | | | | | | | | | | | | | | | | | | | | | |
| | | Net Asset
Value,
Beginning
of Period | | | Net
Investment
Income (Loss) | | | Net Realized
and Unrealized
Gain (Loss) on
Investments | | | Total From
Investment
Operations | | | Distributions
from Net
Investment
Income | | |
Distributions
from Net
Realized Gain
on Investment
Transactions | | | Distributions
from Return
of Capital | | | Total
Distributions | |
Huntington VA Growth Fund | |
2008 | | $ | 10.86 | | | | 0.05 | | | | (3.84 | ) | | | (3.79 | ) | | | (0.10 | ) | | | (0.83 | ) | | | — | | | | (0.93 | ) |
2009 | | $ | 6.14 | | | | 0.01 | | | | 0.97 | | | | 0.98 | | | | — | | | | — | | | | — | | | | — | |
2010 | | $ | 7.12 | | | | 0.01 | | | | 0.68 | | | | 0.69 | | | | (0.01 | ) | | | — | | | | — | | | | (0.01 | ) |
2011 | | $ | 7.80 | | | | 0.03 | | | | (0.26 | ) | | | (0.23 | ) | | | (0.01 | ) | | | — | | | | — | | | | (0.01 | ) |
2012 | | $ | 7.56 | | | | 0.09 | | | | 0.70 | | | | 0.79 | | | | (0.03 | ) | | | — | | | | — | | | | (0.03 | ) |
Huntington VA Income Equity Fund | |
2008 | | $ | 12.11 | | | | 0.31 | | | | (4.58 | ) | | | (4.27 | ) | | | (0.56 | ) | | | (0.70 | ) | | | (0.01 | ) | | | (1.27 | ) |
2009 | | $ | 6.57 | | | | 0.22 | | | | 1.20 | | | | 1.42 | | | | — | | | | — | | | | — | | | | — | |
2010 | | $ | 7.99 | | | | 0.24 | | | | 0.67 | | | | 0.91 | | | | (0.23 | ) | | | — | | | | — | | | | (0.23 | ) |
2011 | | $ | 8.67 | | | | 0.38 | | | | 0.23 | | | | 0.61 | | | | (0.26 | ) | | | — | | | | — | | | | (0.26 | ) |
2012 | | $ | 9.02 | | | | 0.42 | | | | 0.54 | | | | 0.96 | | | | (0.38 | ) | | | — | | | | — | | | | (0.38 | ) |
| | | | | | | | | | | | | | | | | | | | | | | | | | | | | | | | | |
| (1) | Total returns do not include any insurance, sales or administrative charges of variable annuity or life insurance contracts. If these were included, the returns would be lower. |
| (2) | If applicable, certain fees were waived and/or reimbursed. If such waivers/reimbursements had not occurred, the ratios would have been as indicated. |
See Notes which are an integral part of the Financial Statements.
| | | | | | | | | | | | | | | | | | | | | | | | | | |
Net Asset
Value,
End of
Period | | | Total
Return(1) | | | Ratio of Net
Expenses
to Average
Net Assets | | | Ratio of Net
Investment
Income (Loss)
to Average
Net Assets | | | Ratio of
Expenses
(Prior to
Reimbursements)
to Average
Net Assets(2) | | | Net Assets,
End of Period
(000 Omitted) | | | Portfolio
Turnover
Rate | |
| | | | | | | | | | | | | | | | | | | | | | | | | | |
| $ | 6.14 | | | | (37.91 | )% | | | 0.87 | % | | | 0.46 | % | | | 0.87 | % | | $ | 12,661 | | | | 84 | % |
| $ | 7.12 | | | | 15.96 | % | | | 0.99 | % | | | 0.19 | % | | | 0.99 | % | | $ | 15,272 | | | | 118 | % |
| $ | 7.80 | | | | 9.72 | % | | | 1.02 | % | | | 0.19 | % | | | 1.02 | % | | $ | 18,511 | | | | 331 | % |
| $ | 7.56 | | | | (2.93 | )% | | | 1.00 | % | | | 0.40 | % | | | 1.00 | % | | $ | 17,613 | | | | 137 | % |
| $ | 8.32 | | | | 10.45 | % | | | 0.97 | % | | | 0.98 | % | | | 0.97 | % | | $ | 17,465 | | | | 140 | % |
| | | | | | | | | | | | | | | | | | | | | | | | | | |
| $ | 6.57 | | | | (37.83 | )% | | | 0.92 | % | | | 2.85 | % | | | 0.92 | % | | $ | 18,187 | | | | 96 | % |
| $ | 7.99 | | | | 21.61 | % | | | 0.97 | % | | | 3.28 | % | | | 0.97 | % | | $ | 20,704 | | | | 96 | % |
| $ | 8.67 | | | | 11.79 | % | | | 1.00 | % | | | 2.81 | % | | | 1.00 | % | | $ | 21,798 | | | | 107 | % |
| $ | 9.02 | | | | 7.06 | % | | | 0.99 | % | | | 3.57 | % | | | 0.99 | % | | $ | 20,027 | | | | 199 | % |
| $ | 9.60 | | | | 10.73 | % | | | 0.97 | % | | | 3.85 | % | | | 0.97 | % | | $ | 20,276 | | | | 201 | % |
| | | | | | | | | | | | | | | | | | | | | | | | | | | |
Huntington Funds
Financial Highlights
(For a share outstanding throughout each period)
| | | | | | | | | | | | | | | | | | | | | | | | | | | | |
| | | Net Asset
Value,
Beginning
of Period | | | Net
Investment
Income (Loss) | | | Net Realized
and Unrealized
Gain (Loss) on
Investments | | | Total From
Investment
Operations | | | Distributions
from Net
Investment
Income | | |
Distributions
from Net
Realized Gain
on Investment
Transactions | | | Total
Distributions | |
Huntington VA International Equity Fund | |
2008 | | $ | 17.87 | | | | 0.26 | | | | (7.31 | ) | | | (7.05 | ) | | | (0.40 | ) | | | (0.36 | ) | | | (0.76 | ) |
2009 | | $ | 10.06 | | | | 0.23 | | | | 3.14 | | | | 3.37 | | | | (0.01 | ) | | | — | | | | (0.01 | ) |
2010 | | $ | 13.42 | | | | 0.14 | | | | 1.06 | | | | 1.20 | | | | (0.16 | ) | | | — | | | | (0.16 | ) |
2011 | | $ | 14.46 | | | | 0.17 | | | | (1.84 | ) | | | (1.67 | ) | | | (0.16 | ) | | | — | | | | (0.16 | ) |
2012 | | $ | 12.63 | | | | 0.23 | | | | 1.54 | | | | 1.77 | | | | (0.17 | ) | | | — | | | | (0.17 | ) |
Huntington VA Macro 100 Fund | |
2008 | | $ | 10.14 | | | | 0.16 | | | | (3.60 | ) | | | (3.44 | ) | | | (0.16 | ) | | | — | | | | (0.16 | ) |
2009 | | $ | 6.54 | | | | 0.07 | | | | 1.36 | | | | 1.43 | | | | — | | | | — | | | | — | |
2010 | | $ | 7.97 | | | | 0.05 | | | | 1.06 | | | | 1.11 | | | | (0.07 | ) | | | — | | | | (0.07 | ) |
2011 | | $ | 9.01 | | | | 0.06 | | | | (0.18 | ) | | | (0.12 | ) | | | (0.05 | ) | | | — | | | | (0.05 | ) |
2012 | | $ | 8.84 | | | | 0.12 | | | | 0.82 | | | | 0.94 | | | | (0.06 | ) | | | — | | | | (0.06 | ) |
| | | | | | | | | | | | | | | | | | | | | | | | | | | | | |
| (1) | Total returns do not include any insurance, sales or administrative charges of variable annuity or life insurance contracts. If these were included, the returns would be lower. |
| (2) | If applicable, certain fees were waived and/or reimbursed. If such waivers/reimbursements had not occurred, the ratios would have been as indicated. |
See Notes which are an integral part of the Financial Statements.
| | | | | | | | | | | | | | | | | | | | | | | | | | |
Net Asset
Value,
End of
Period | | | Total
Return(1) | | | Ratio of Net
Expenses
to Average
Net Assets | | | Ratio of Net
Investment
Income (Loss)
to Average
Net Assets | | | Ratio of
Expenses
(Prior to
Reimbursements)
to Average
Net Assets(2) | | | Net Assets,
End of Period
(000 Omitted) | | | Portfolio
Turnover
Rate | |
| | | | | | | | | | | | | | | | | | | | | | | | | | |
| $ | 10.06 | | | | (40.56 | )% | | | 0.99 | % | | | 2.02 | % | | | 1.03 | % | | $ | 9,983 | | | | 16 | % |
| $ | 13.42 | | | | 33.47 | % | | | 1.01 | % | | | 2.17 | % | | | 1.05 | % | | $ | 16,362 | | | | 29 | % |
| $ | 14.46 | | | | 9.18 | % | | | 1.10 | % | | | 1.42 | % | | | 1.10 | % | | $ | 22,648 | | | | 35 | % |
| $ | 12.63 | | | | (11.55 | )% | | | 1.03 | % | | | 1.77 | % | | | 1.03 | % | | $ | 26,085 | | | | 36 | % |
| $ | 14.23 | | | | 14.04 | % | | | 1.00 | % | | | 1.79 | % | | | 1.00 | % | | $ | 31,071 | | | | 25 | % |
| | | | | | | | | | | | | | | | | | | | | | | | | | |
| $ | 6.54 | | | | (33.91 | )% | | | 0.98 | % | | | 1.46 | % | | | 0.98 | % | | $ | 4,464 | | | | 287 | % |
| $ | 7.97 | | | | 21.87 | % | | | 1.04 | % | | | 1.09 | % | | | 1.06 | % | | $ | 5,590 | | | | 10 | % |
| $ | 9.01 | | | | 14.12 | % | | | 1.16 | % | | | 0.60 | % | | | 1.20 | % | | $ | 6,615 | | | | 29 | % |
| $ | 8.84 | | | | (1.33 | )% | | | 1.22 | % | | | 0.60 | % | | | 1.22 | % | | $ | 6,161 | | | | 102 | % |
| $ | 9.72 | | | | 10.61 | % | | | 1.12 | % | | | 1.31 | % | | | 1.12 | % | | $ | 7,597 | | | | 50 | % |
| | | | | | | | | | | | | | | | | | | | | | | | | | | |
Huntington Funds
Financial Highlights
(For a share outstanding throughout each period)
| | | | | | | | | | | | | | | | | | | | | | | | | | | | | | | | |
| | | Net Asset
Value,
Beginning
of Period | | | Net
Investment
Income (Loss) | | | Net Realized
and Unrealized
Gain (Loss) on
Investments | | | Total From
Investment
Operations | | | Distributions
from Net
Investment
Income | | |
Distributions
from Net
Realized Gain
on Investment
Transactions | | | Distributions
from Return
of Capital | | | Total
Distributions | |
Huntington VA Mid Corp America Fund | |
2008 | | $ | 18.61 | | | | 0.08 | | | | (6.95 | ) | | | (6.87 | ) | | | (0.19 | ) | | | (0.77 | ) | | | — | | | | (0.96 | ) |
2009 | | $ | 10.78 | | | | 0.10 | | | | 3.59 | | | | 3.69 | | | | — | | | | — | | | | — | | | | — | |
2010 | | $ | 14.47 | | | | 0.08 | | | | 3.19 | | | | 3.27 | | | | (0.10 | ) | | | — | | | | — | | | | (0.10 | ) |
2011 | | $ | 17.64 | | | | 0.08 | | | | (0.57 | ) | | | (0.49 | ) | | | (0.08 | ) | | | — | | | | — | | | | (0.08 | ) |
2012 | | $ | 17.07 | | | | 0.13 | | | | 2.35 | | | | 2.48 | | | | (0.05 | ) | | | (1.00 | ) | | | — | | | | (1.05 | ) |
Huntington VA Real Strategies Fund | |
2008 | | $ | 11.50 | | | | 0.04 | (3) | | | (5.50 | ) | | | (5.46 | ) | | | (0.13 | ) | | | (0.21 | ) | | | (0.03 | ) | | | (0.37 | ) |
2009 | | $ | 5.67 | | | | 0.03 | | | | 1.94 | | | | 1.97 | | | | — | | | | — | | | | — | | | | — | |
2010 | | $ | 7.64 | | | | (0.03 | ) | | | 1.72 | | | | 1.69 | | | | (0.02 | ) | | | — | | | | — | | | | (0.02 | ) |
2011 | | $ | 9.31 | | | | 0.03 | | | | (0.93 | ) | | | (0.90 | ) | | | (0.01 | ) | | | — | | | | — | | | | (0.01 | ) |
2012 | | $ | 8.40 | | | | 0.13 | | | | 0.23 | | | | 0.36 | | | | (0.02 | ) | | | (0.04 | ) | | | — | | | | (0.06 | ) |
| | | | | | | | | | | | | | | | | | | | | | | | | | | | | | | | | |
| (1) | Total returns do not include any insurance, sales or administrative charges of variable annuity or life insurance contracts. If these were included, the returns would be lower. |
| (2) | If applicable, certain fees were waived and/or reimbursed. If such waivers/reimbursements had not occurred, the ratios would have been as indicated. |
| (3) | Per share net investment income (loss) has been calculated using the average shares method. |
See Notes which are an integral part of the Financial Statements.
| | | | | | | | | | | | | | | | | | | | | | | | | | |
Net Asset
Value,
End of
Period | | | Total
Return(1) | | | Ratio of Net
Expenses
to Average
Net Assets | | | Ratio of Net
Investment
Income (Loss)
to Average
Net Assets | | | Ratio of
Expenses
(Prior to
Reimbursements)
to Average
Net Assets(2) | | | Net Assets,
End of Period
(000 Omitted) | | | Portfolio
Turnover
Rate | |
| | | | | | | | | | | | | | | | | | | | | | | | | | |
| $ | 10.78 | | | | (38.83 | )% | | | 0.93 | % | | | 0.43 | % | | | 0.93 | % | | $ | 15,413 | | | | 19 | % |
| $ | 14.47 | | | | 34.23 | % | | | 0.97 | % | | | 0.76 | % | | | 0.97 | % | | $ | 18,673 | | | | 23 | % |
| $ | 17.64 | | | | 22.80 | % | | | 1.02 | % | | | 0.41 | % | | | 1.02 | % | | $ | 20,316 | | | | 21 | % |
| $ | 17.07 | | | | (2.77 | )% | | | 1.02 | % | | | 0.33 | % | | | 1.02 | % | | $ | 16,472 | | | | 24 | % |
| $ | 18.50 | | | | 14.59 | % | | | 1.06 | % | | | 0.84 | % | | | 1.06 | % | | $ | 25,274 | | | | 29 | % |
| | | | | | | | | | | | | | | | | | | | | | | | | | |
| $ | 5.67 | | | | (49.00 | )% | | | 1.00 | % | | | 0.41 | % | | | 3.59 | % | | $ | 270 | | | | 44 | % |
| $ | 7.64 | | | | 34.74 | % | | | 1.42 | % | | | 0.75 | % | | | 1.79 | % | | $ | 1,166 | | | | 33 | % |
| $ | 9.31 | | | | 22.15 | % | | | 1.68 | % | | | (0.28 | )% | | | 1.68 | % | | $ | 3,020 | | | | 23 | % |
| $ | 8.40 | | | | (9.63 | )% | | | 1.54 | % | | | 0.32 | % | | | 1.54 | % | | $ | 3,541 | | | | 65 | % |
| $ | 8.70 | | | | 4.34 | % | | | 1.26 | % | | | 1.46 | % | | | 1.26 | % | | $ | 3,800 | | | | 33 | % |
| | | | | | | | | | | | | | | | | | | | | | | | | | | |
Huntington Funds
Financial Highlights
(For a share outstanding throughout each period)
| | | | | | | | | | | | | | | | | | | | | | | | | | | | | | | | |
| | | Net Asset
Value,
Beginning
of Period | | | Net
Investment
Income (Loss) | | | Net Realized
and Unrealized
Gain (Loss) on
Investments | | | Total From
Investment
Operations | | | Distributions
from Net
Investment
Income | | |
Distributions
from Net
Realized Gain
on Investment
Transactions | | | Distributions
from Return
of Capital | | | Total
Distributions | |
Huntington VA Rotating Markets Fund | |
2008 | | $ | 15.04 | | | | 0.15 | | | | (6.02 | ) | | | (5.87 | ) | | | (0.31 | ) | | | (1.01 | ) | | | — | | | | (1.32 | ) |
2009 | | $ | 7.85 | | | | 0.12 | | | | 2.50 | | | | 2.62 | | | | — | | | | — | | | | — | | | | — | |
2010 | | $ | 10.47 | | | | 0.03 | | | | 0.72 | | | | 0.75 | | | | (0.12 | ) | | | — | | | | — | | | | (0.12 | ) |
2011 | | $ | 11.10 | | | | 0.18 | | | | 0.58 | | | | 0.76 | | | | (0.04 | ) | | | — | | | | — | | | | (0.04 | ) |
2012 | | $ | 11.82 | | | | 0.13 | | | | 0.69 | | | | 0.82 | | | | (0.21 | ) | | | — | | | | — | | | | (0.21 | ) |
Huntington VA Situs Fund | |
2008 | | $ | 15.15 | | | | 0.02 | | | | (6.18 | ) | | | (6.16 | ) | | | (0.03 | ) | | | (0.22 | ) | | | — | | | | (0.25 | ) |
2009 | | $ | 8.74 | | | | 0.07 | | | | 2.81 | | | | 2.88 | | | | — | | | | — | | | | — | | | | — | |
2010 | | $ | 11.62 | | | | 0.01 | | | | 3.41 | | | | 3.42 | | | | (0.05 | ) | | | — | | | | — | | | | (0.05 | ) |
2011 | | $ | 14.99 | | | | (0.01 | ) | | | (0.13 | ) | | | (0.14 | ) | | | — | (3) | | | — | | | | — | | | | — | (3) |
2012 | | $ | 14.85 | | | | 0.09 | | | | 3.27 | | | | 3.36 | | | | — | | | | — | | | | — | | | | — | |
| | | | | | | | | | | | | | | | | | | | | | | | | | | | | | | | | |
| (1) | Total returns do not include any insurance, sales or administrative charges of variable annuity or life insurance contracts. If these were included, the returns would be lower. |
| (2) | If applicable, certain fees were waived and/or reimbursed. If such waivers/reimbursements had not occurred, the ratios would have been as indicated. |
| (3) | Amount is less than $0.005. |
| (4) | Rounds to less than 0.005%. |
See Notes which are an integral part of the Financial Statements.
| | | | | | | | | | | | | | | | | | | | | | | | | | |
Net Asset
Value,
End of
Period | | | Total
Return(1) | | | Ratio of Net
Expenses
to Average
Net Assets | | | Ratio of Net
Investment
Income (Loss)
to Average
Net Assets | | | Ratio of
Expenses
(Prior to
Reimbursements)
to Average
Net Assets(2) | | | Net Assets,
End of Period
(000 Omitted) | | | Portfolio
Turnover
Rate | |
| | | | | | | | | | | | | | | | | | | | | | | | | | |
| $ | 7.85 | | | | (42.03 | )% | | | 0.93 | % | | | 1.09 | % | | | 0.93 | % | | $ | 5,041 | | | | 221 | % |
| $ | 10.47 | | | | 33.38 | % | | | 1.01 | % | | | 1.34 | % | | | 1.02 | % | | $ | 6,473 | | | | 229 | % |
| $ | 11.10 | | | | 7.34 | % | | | 1.14 | % | | | 0.33 | % | | | 1.14 | % | | $ | 6,957 | | | | 254 | % |
| $ | 11.82 | | | | 6.84 | % | | | 1.15 | % | | | 1.44 | % | | | 1.15 | % | | $ | 6,462 | | | | 2 | % |
| $ | 12.43 | | | | 6.94 | % | | | 1.11 | % | | | 0.74 | % | | | 1.11 | % | | $ | 5,991 | | | | 113 | % |
| | | | | | | | | | | | | | | | | | | | | | | | | | |
| $ | 8.74 | | | | (41.23 | )% | | | 0.95 | % | | | 0.18 | % | | | 0.95 | % | | $ | 11,510 | | | | 21 | % |
| $ | 11.62 | | | | 32.95 | % | | | 1.01 | % | | | 0.73 | % | | | 1.01 | % | | $ | 17,035 | | | | 10 | % |
| $ | 14.99 | | | | 29.61 | % | | | 1.02 | % | | | 0.13 | % | | | 1.02 | % | | $ | 23,683 | | | | 19 | % |
| $ | 14.85 | | | | (0.91 | )% | | | 0.99 | % | | | — | %(4) | | | 0.99 | % | | $ | 35,271 | | | | 14 | % |
| $ | 18.21 | | | | 22.63 | % | | | 0.96 | % | | | 0.55 | % | | | 0.96 | % | | $ | 45,402 | | | | 10 | % |
| | | | | | | | | | | | | | | | | | | | | | | | | | | |
Huntington Funds
Financial Highlights
(For a share outstanding throughout each period)
| | | | | | | | | | | | | | | | | | | | | | | | | | | | |
| | | Net Asset
Value,
Beginning
of Period | | | Net
Investment
Income (Loss) | | | Net Realized
and Unrealized
Gain (Loss) on
Investments | | | Total From
Investment
Operations | | | Distributions
from Net
Investment
Income | | |
Distributions
from Net
Realized Gain
on Investment
Transactions | | | Total
Distributions | |
Huntington VA Mortgage Securities Fund | |
2008 | | $ | 11.32 | | | | 0.51 | | | | (0.27 | ) | | | 0.24 | | | | (0.92 | ) | | | (0.02 | ) | | | (0.94 | ) |
2009 | | $ | 10.62 | | | | 0.32 | | | | 0.26 | | | | 0.58 | | | | — | | | | — | | | | — | |
2010 | | $ | 11.20 | | | | 0.16 | | | | 0.39 | | | | 0.55 | | | | (0.26 | ) | | | — | | | | (0.26 | ) |
2011 | | $ | 11.49 | | | | 0.23 | | | | 0.38 | | | | 0.61 | | | | (0.24 | ) | | | — | | | | (0.24 | ) |
2012 | | $ | 11.86 | | | | 0.21 | | | | 0.19 | | | | 0.40 | | | | (0.30 | ) | | | — | | | | (0.30 | ) |
| | | | | | | | | | | | | | | | | | | | | | | | | | | | | |
| (1) | Total returns do not include any insurance, sales or administrative charges of variable annuity or life insurance contracts. If these were included, the returns would be lower. |
| (2) | If applicable, certain fees were waived and/or reimbursed. If such waivers/reimbursements had not occurred, the ratios would have been as indicated. |
See Notes which are an integral part of the Financial Statements.
| | | | | | | | | | | | | | | | | | | | | | | | | | |
Net Asset
Value,
End of
Period | | | Total
Return(1) | | | Ratio of Net
Expenses
to Average
Net Assets | | | Ratio of Net
Investment
Income (Loss)
to Average
Net Assets | | | Ratio of
Expenses
(Prior to
Reimbursements)
to Average
Net Assets(2) | | | Net Assets,
End of Period
(000 Omitted) | | | Portfolio
Turnover
Rate | |
| | | | | | | | | | | | | | | | | | | | | | | | | | |
| $ | 10.62 | | | | 2.15 | % | | | 1.00 | % | | | 3.98 | % | | | 1.04 | % | | $ | 8,990 | | | | 23 | % |
| $ | 11.20 | | | | 5.46 | % | | | 1.05 | % | | | 3.40 | % | | | 1.07 | % | | $ | 10,958 | | | | 29 | % |
| $ | 11.49 | | | | 4.89 | % | | | 1.11 | % | | | 2.44 | % | | | 1.11 | % | | $ | 17,348 | | | | 3 | % |
| $ | 11.86 | | | | 5.30 | % | | | 1.15 | % | | | 2.09 | % | | | 1.15 | % | | $ | 19,594 | | | | 27 | % |
| $ | 11.96 | | | | 3.35 | % | | | 1.10 | % | | | 1.66 | % | | | 1.10 | % | | $ | 20,063 | | | | 27 | % |
| | | | | | | | | | | | | | | | | | | | | | | | | | | |
Huntington Funds
Notes to Financial Statements
December 31, 2012
The Huntington Funds (the “Trust”) was originally two separate Massachusetts business trusts: The Huntington Funds, established on February 10, 1987, and Huntington VA Funds, established on June 30, 1999 (together, the “Original Trusts��). On June 23, 2006, the Original Trusts were reorganized into a single Delaware statutory trust that retained the name of The Huntington Funds. The Trust is registered under the Investment Company Act of 1940, as amended (the “1940 Act”), as an open-end management investment company. At December 31, 2012, the Trust operated 35 separate series, or mutual funds, each with its own investment objective and strategy. The Funds’ prospectus provides a description of each Fund’s investment objectives, policies and strategies along with information on the classes of shares currently being offered. The price at which the Funds will offer or redeem shares is the net asset value (“NAV”) per share next determined after the order is considered received. This report contains financial statements and financial highlights of the funds listed below (individually referred to as a “Fund”, or collectively as the “Funds”):
Huntington VA Balanced Fund (“VA Balanced Fund”)
Huntington VA Dividend Capture Fund (“VA Dividend Capture Fund”)
Huntington VA Growth Fund (“VA Growth Fund”)
Huntington VA Income Equity Fund (“VA Income Equity Fund”)
Huntington VA International Equity Fund (“VA International Equity Fund”)
Huntington VA Macro 100 Fund (“VA Macro 100 Fund”)
Huntington VA Mid Corp America Fund (“VA Mid Corp America Fund”)
Huntington VA Real Strategies Fund (“VA Real Strategies Fund”)
Huntington VA Rotating Markets Fund (“VA Rotating Markets Fund”)
Huntington VA Situs Fund (“VA Situs Fund”)
Huntington VA Mortgage Securities Fund (“VA Mortgage Securities Fund”)
The assets of each Fund are segregated and a shareholder’s interest is limited to the Fund in which shares are held.
The Trust accounts for the assets, liabilities and operations of each Fund separately. Shares of the Funds are not offered directly to the public but, pursuant to an exemptive order granted by the Securities and Exchange Commission and procedures adopted by the Trust’s Board of Trustees (the “Trustees”), the Funds were sold during the year only to separate accounts of Hartford Life Insurance Company, Hartford Life and Annuity Insurance Company, Lincoln Insurance Company, Nationwide Insurance Company, Sun Life Assurance Company of Canada (U.S.) and Transamerica Life Insurance Company for use with their respective variable insurance contracts and policies.
On April 27, 2012 the Huntington VA Mid Corp America Fund (“Acquiring Fund”) acquired all of the assets and assumed all of the liabilities of the Huntington VA New Economy Fund (“Acquired Fund”) pursuant to an agreement and plan of reorganization approved by the Board of Trustees on January 17, 2012. The reorganization provides shareholders of the Acquired Fund access to a larger and more diversified portfolio with a similar investment strategy and lower expenses. The reorganization qualified as a tax-free reorganization for federal income tax purposes with no gain or loss recognized to the Funds or their shareholders.
The acquisition was accomplished by a tax-free exchange of 577,960 shares of the Acquiring Fund (valued at $11,114,709) for 842,598 shares of the Acquired Fund outstanding on April 27, 2012. The investment portfolio of the Acquired Fund, with a fair value of $11,117,120 and identified cost of $10,121,659 was the principal asset acquired by the Acquiring Fund. For financial reporting purposes, assets received and shares issued by the Acquiring Fund were recorded at fair value; however, the identified cost of the investments received from the Acquired Fund was carried forward to align ongoing reporting of the Acquiring Fund’s realized and unrealized gains and losses with amounts distributable to shareholders for tax purposes. The aggregate net assets of the Acquiring Fund immediately before the acquisition were $17,787,998. The net assets of the Acquired Fund at that date of $11,114,709, including $995,461 of unrealized appreciation, were combined with those of the Acquiring Fund, resulting in combined net assets of $28,902,707.
Assuming the acquisition had been completed on January 1, 2012, the beginning of the annual reporting period of the Acquiring Fund, the Acquiring Fund’s pro forma results of operations for the year ended December 31, 2012, are as follows:
| | | | |
| | | (Unaudited) | |
Net Investment Income* | | $ | 176,464 | |
Net Realized and Unrealized Gain on Investments | | $ | 2,155,034 | |
Net Increase in Net Assets Resulting From Operations | | $ | 2,331,498 | |
| | * | Net Investment Income includes $8,000 of pro forma additional merger expenses. |
Huntington Funds
Notes to Financial Statements (continued)
December 31, 2012
Because the combined investment portfolios have been managed as a single portfolio since the acquisition was completed, it is not practicable to separate the amounts of revenue and earnings of the Acquired Fund that have been included in the Acquiring Fund’s accompanying Statement of Operations since April 27, 2012.
Under the Trust’s organizational documents, its officers and Trustees are indemnified against certain liabilities arising out of the performance of their duties to the Funds. In addition, in the normal course of business, the Trust may enter into contracts with vendors and others that provide for general indemnifications. The Trust’s maximum exposure under these arrangements is unknown, as this would involve future claims that may be made against the Trust. However, based on experience, the Trust expects that risk of loss to be remote.
| (2) | Significant Accounting Policies |
The following is a summary of significant accounting policies consistently followed by each Fund in the preparation of its financial statements. These policies are in conformity with generally accepted accounting principles in the United States of America (“GAAP”). The preparation of financial statements in conformity with GAAP requires management to make estimates and assumptions that affect the amounts of assets, liabilities, and disclosure of contingent assets and liabilities at the date of the financial statements and the reported amounts of income and expenses for the period. Actual results could differ from those estimates.
The Trust calculates the NAV for each of the Funds by valuing securities held based on fair value. Fair value is defined as the price that would be received to sell an asset or paid to transfer a liability in an orderly transaction between market participants at the measurement date.
The valuation techniques described below maximize the use of observable inputs and minimize the use of unobservable inputs in determining fair value. The inputs used for valuing the Funds’ investments are summarized in the three broad levels listed below:
| | |
| |
•Level 1 | | - quoted prices in active markets for identical assets. |
| |
•Level 2 | | - other significant observable inputs (including quoted prices for similar securities, interest rates, prepayment speeds, credit risk, etc.). |
| |
•Level 3 | | - significant unobservable inputs (including the Funds’ own assumptions in determining the fair value of investments). |
Changes in valuation techniques may result in transfers in or out of an assigned level within the disclosure hierarchy. The Trust recognizes transfers between fair value hierarchy levels at the reporting period end. The inputs or methodology used for valuing investments is not necessarily an indication of the risk associated with investing in those investments.
In computing the NAV of the Funds, fair value is based on market valuations with respect to portfolio securities for which market quotations are readily available. Pursuant to Trustee-approved policies, the Trust relies on certain security pricing services to provide current market value of securities. Those security pricing services value equity securities (including foreign equity securities, exchange-traded funds and closed-end funds) traded on a securities exchange at the last reported sales price on the principal exchange. Equity securities quoted by NASDAQ are valued at the NASDAQ official closing price. If there is no reported sale on the principal exchange, and in the case of over-the-counter securities, equity securities are valued at a bid price estimated by the security pricing service. In each of these situations, valuations are typically categorized as Level 1 in the fair value hierarchy. Investments in open-end investment companies are valued at their respective net asset value as reported by such companies and are typically categorized as Level 1 in the fair value hierarchy.
Option contracts are generally valued using the closing price based on quote data from the six major U.S. options exchanges on which such options are traded, which are then typically categorized as Level 1 in the fair value hierarchy.
Debt securities traded on a national securities exchange or in the over-the-counter market are valued at the last reported sales price on the principal exchange, except the U.S. government obligations held by the VA Mortgage Securities Fund are valued at the mean between the over-the-counter bid and asked prices furnished by the security pricing service. If there is no reported sale on the principal exchange, and for all other debt securities, debt securities are valued at a bid price estimated by the security pricing service. In valuing debt securities, a security pricing service may use various pricing techniques which take into account appropriate factors such as market activity, yield, quality, coupon rate, maturity, type of issue, trading characteristics, call features, credit ratings and other data, as well as broker quotes. Foreign securities quoted in foreign currencies are translated in U.S.
Huntington Funds
Notes to Financial Statements (continued)
December 31, 2012
dollars at the foreign exchange rate in effect as of the close of the New York Stock Exchange (NYSE) (generally 4:00 p.m. Eastern Time), on the day the value of the foreign security is determined. Short-term investments with remaining maturities of 60 days or less at the time of purchase are valued at amortized cost. Investments in other open-end investment companies are valued at the NAV. In each of these situations, valuations are typically categorized as Level 2 in the fair value hierarchy.
Under certain circumstances, a good faith determination of the fair value of a security may be used instead of its current market value, even if the security’s market price is readily available. In such circumstances, the Trust’s Administrator may request that the Trust’s Pricing Committee make its own fair value determination.
Securities for which market quotations are not readily available are valued at fair value under Trust procedures approved by the Trustees. In these cases, a Pricing Committee established and appointed by the Trustees determines in good faith, subject to Trust procedures, the fair value of portfolio securities held by a Fund (“good faith fair valuation”). When a good faith fair valuation of a security is required, consideration is generally given to a number of factors including, but not limited to the following: dealer quotes, published analyses by dealers or analysts regarding the security, transactions which provide implicit valuation of the security (such as a merger or tender offer transaction), the value of other securities or contracts which derive their value from the security at issue, and the implications of any other circumstances which have caused trading in the security to halt. With respect to certain narrow categories of securities, the procedures utilized by the Pricing Committee detail specific valuation methodologies to be applied in lieu of considering the aforementioned list of factors. Depending on the source and relative significance of valuation inputs, these instruments may be classified as Level 2 or Level 3 in the fair value hierarchy.
Fair valuation procedures are also used when a significant event affecting the value of a portfolio security is determined to have occurred between the time when the price of the portfolio security is determined and the close of trading on the NYSE, which is when each Fund’s NAV is computed. An event is considered significant if there is both an affirmative expectation that the security’s value will change in response to the event and a reasonable basis for quantifying the resulting change in value. Significant events include significant securities market movements occurring between the time the price of the portfolio security is determined and the close of trading on the NYSE. For domestic fixed income securities, such events may occur where the cut-off time for the market information used by the independent pricing service is earlier than the end of regular trading on the NYSE. For securities normally priced at their last sale price in a foreign market, such events can occur between the close of trading in the foreign market and the close of trading on the NYSE.
In some cases, events affecting the issuer of a portfolio security may be considered significant events. Examples of potentially significant events include announcements concerning earnings, acquisitions, new products, management changes, litigation developments, a strike or natural disaster affecting the company’s operations or regulatory changes or market developments affecting the issuer’s industry occurring between the time when the price of the portfolio security is determined and the close of trading on the NYSE. For securities of foreign issuers, such events could also include political or other developments affecting the economy or markets in which the issuer conducts its operations or its securities are traded.
There can be no assurance that a Fund could purchase or sell a portfolio security at the price used to calculate the Fund’s NAV. In the case of good faith fair valued portfolio securities, lack of information and uncertainty as to the significance of information may lead to a conclusion that a prior valuation is the best indication of a portfolio security’s present value. Good faith fair valuations generally remain unchanged until new information becomes available. Consequently, changes in good faith fair valuation of portfolio securities may be less frequent and of greater magnitude than changes in the price of portfolio securities valued at their last sale price, by an independent pricing service, or based on market quotations.
The Funds’ Trustees have authorized the use of an independent fair valuation service to monitor changes in a designated U.S. market index after foreign markets close, and to implement a fair valuation methodology to adjust the closing prices of foreign securities if the movement in the index is significant. In the event of an increase or decrease greater than predetermined levels, the Funds may use a systematic valuation model provided by an independent third party to fair value its international equity securities, which are then typically categorized as Level 2 in the fair value hierarchy.
In accordance with the valuation procedures adopted by the Trustees, real estate investments are fair valued using discounted cash flow models, which the Trustees deem indicative of the estimated fair value of the real estate investments.
Huntington Funds
Notes to Financial Statements (continued)
December 31, 2012
The following is a summary of the inputs used to value the Funds’ investments as of December 31, 2012 based on the three levels defined above:
| | | | | | | | | | | | | | | | |
| | | LEVEL 1 | | | LEVEL 2 | | | LEVEL 3 | | | Total | |
VA Balanced Fund | | | | | | | | | | | | | | | | |
Investment Securities: | | | | | | | | | | | | | | | | |
Mutual Funds | | $ | 43,462,462 | | | $ | — | | | $ | — | | | $ | 43,462,462 | |
Cash Equivalents | | | 901,499 | | | | — | | | | — | | | | 901,499 | |
| | | | | | | | | | | | | | | | |
Total Investment Securities | | | 44,363,961 | | | | — | | | | — | | | | 44,363,961 | |
| | | | | | | | | | | | | | | | |
VA Dividend Capture Fund | | | | | | | | | | | | | | | | |
Investment Securities: | | | | | | | | | | | | | | | | |
Common Stocks | | | | | | | | | | | | | | | | |
Consumer Discretionary | | | 1,111,550 | | | | — | | | | — | | | | 1,111,550 | |
Consumer Staples | | | 2,022,619 | | | | — | | | | — | | | | 2,022,619 | |
Energy | | | 5,478,957 | | | | — | | | | — | | | | 5,478,957 | |
Financials | | | 4,042,590 | | | | — | | | | — | | | | 4,042,590 | |
Health Care | | | 1,805,498 | | | | — | | | | — | | | | 1,805,498 | |
Industrials | | | 2,313,497 | | | | — | | | | — | | | | 2,313,497 | |
Information Technology | | | 1,822,022 | | | | — | | | | — | | | | 1,822,022 | |
Materials | | | 757,297 | | | | — | | | | — | | | | 757,297 | |
Real Estate Investment Trusts | | | 3,800,783 | | | | — | | | | — | | | | 3,800,783 | |
Telecommunication Services | | | 860,237 | | | | — | | | | — | | | | 860,237 | |
Utilities | | | 1,109,380 | | | | — | | | | — | | | | 1,109,380 | |
Preferred Stocks | | | | | | | | | | | | | | | | |
Financials | | | 4,261,885 | | | | 379,500 | | | | — | | | | 4,641,385 | |
Real Estate Investment Trusts | | | 751,180 | | | | — | | | | — | | | | 751,180 | |
Telecommunication Services | | | 458,490 | | | | — | | | | — | | | | 458,490 | |
Utilities | | | 991,350 | | | | — | | | | — | | | | 991,350 | |
Exchange-Traded Funds | | | 197,918 | | | | — | | | | — | | | | 197,918 | |
Cash Equivalents | | | 606,094 | | | | — | | | | — | | | | 606,094 | |
Short-Term Securities Held as Collateral for Securities Lending | | | 1,060,536 | | | | — | | | | — | | | | 1,060,536 | |
| | | | | | | | | | | | | | | | |
Total Investment Securities | | | 33,451,883 | | | | 379,500 | | | | — | | | | 33,831,383 | |
| | | | | | | | | | | | | | | | |
VA Growth Fund | | | | | | | | | | | | | | | | |
Investment Securities: | | | | | | | | | | | | | | | | |
Common Stocks | | | | | | | | | | | | | | | | |
Consumer Discretionary | | | 2,150,078 | | | | — | | | | — | | | | 2,150,078 | |
Consumer Staples | | | 1,890,710 | | | | — | | | | — | | | | 1,890,710 | |
Energy | | | 910,699 | | | | — | | | | — | | | | 910,699 | |
Financials | | | 755,029 | | | | — | | | | — | | | | 755,029 | |
Health Care | | | 2,638,207 | | | | — | | | | — | | | | 2,638,207 | |
Industrials | | | 994,805 | | | | — | | | | — | | | | 994,805 | |
Information Technology | | | 5,679,374 | | | | — | | | | — | | | | 5,679,374 | |
Materials | | | 751,425 | | | | — | | | | — | | | | 751,425 | |
Real Estate Investment Trusts | | | 409,138 | | | | — | | | | — | | | | 409,138 | |
Telecommunication Services | | | 89,371 | | | | — | | | | — | | | | 89,371 | |
Utilities | | | 34,761 | | | | — | | | | — | | | | 34,761 | |
Cash Equivalents | | | 211,690 | | | | — | | | | — | | | | 211,690 | |
Short-Term Securities Held as Collateral for Securities Lending | | | 163,352 | | | | — | | | | — | | | | 163,352 | |
| | | | | | | | | | | | | | | | |
Total Investment Securities | | | 16,678,639 | | | | — | | | | — | | | | 16,678,639 | |
| | | | | | | | | | | | | | | | |
Huntington Funds
Notes to Financial Statements (continued)
December 31, 2012
| | | | | | | | | | | | | | | | |
| | | LEVEL 1 | | | LEVEL 2 | | | LEVEL 3 | | | Total | |
VA Income Equity Fund | | | | | | | | | | | | | | | | |
Investment Securities: | | | | | | | | | | | | | | | | |
Common Stocks | | | | | | | | | | | | | | | | |
Consumer Discretionary | | $ | 1,354,481 | | | $ | — | | | $ | — | | | $ | 1,354,481 | |
Consumer Staples | | | 2,039,975 | | | | — | | | | — | | | | 2,039,975 | |
Energy | | | 3,498,934 | | | | — | | | | — | | | | 3,498,934 | |
Financials | | | 3,200,557 | | | | — | | | | — | | | | 3,200,557 | |
Health Care | | | 1,500,527 | | | | — | | | | — | | | | 1,500,527 | |
Industrials | | | 2,049,246 | | | | — | | | | — | | | | 2,049,246 | |
Information Technology | | | 1,911,288 | | | | — | | | | — | | | | 1,911,288 | |
Materials | | | 777,903 | | | | — | | | | — | | | | 777,903 | |
Real Estate Investment Trusts | | | 1,331,914 | | | | — | | | | — | | | | 1,331,914 | |
Telecommunication Services | | | 751,609 | | | | — | | | | — | | | | 751,609 | |
Utilities | | | 1,122,653 | | | | — | | | | — | | | | 1,122,653 | |
Cash Equivalents | | | 712,658 | | | | — | | | | — | | | | 712,658 | |
Short-Term Securities Held as Collateral for Securities Lending | | | 1,923,852 | | | | — | | | | — | | | | 1,923,852 | |
| | | | | | | | | | | | | | | | |
Total Investment Securities | | | 22,175,597 | | | | — | | | | — | | | | 22,175,597 | |
| | | | | | | | | | | | | | | | |
VA International Equity Fund | | | | | | | | | | | | | | | | |
Investment Securities: | | | | | | | | | | | | | | | | |
Common Stocks | | | | | | | | | | | | | | | | |
Consumer Discretionary | | | 1,152,598 | | | | 1,847,203 | | | | — | | | | 2,999,801 | |
Consumer Staples | | | 654,550 | | | | 2,225,004 | | | | — | | | | 2,879,554 | |
Energy | | | 1,848,217 | | | | 1,734,801 | | | | — | | | | 3,583,018 | |
Financials | | | 1,679,214 | | | | 3,332,030 | | | | — | | | | 5,011,244 | |
Health Care | | | 2,353,745 | | | | 473,996 | | | | — | | | | 2,827,741 | |
Industrials | | | 288,563 | | | | 4,891,618 | | | | — | | | | 5,180,181 | |
Information Technology | | | 498,961 | | | | 1,272,794 | | | | — | | | | 1,771,755 | |
Materials | | | 648,824 | | | | 1,196,615 | | | | — | | | | 1,845,439 | |
Telecommunication Services | | | 852,934 | | | | 896,930 | | | | — | | | | 1,749,864 | |
Utilities | | | 394,448 | | | | 592,948 | | | | — | | | | 987,396 | |
Exchange-Traded Funds | | | 983,762 | | | | — | | | | — | | | | 983,762 | |
Cash Equivalents | | | 1,158,404 | | | | — | | | | — | | | | 1,158,404 | |
Short-Term Securities Held as Collateral for Securities Lending | | | 1,244,288 | | | | — | | | | — | | | | 1,244,288 | |
| | | | | | | | | | | | | | | | |
Total Investment Securities | | | 13,758,508 | | | | 18,463,939 | | | | — | | | | 32,222,447 | |
| | | | | | | | | | | | | | | | |
VA Macro 100 Fund | | | | | | | | | | | | | | | | |
Investment Securities: | | | | | | | | | | | | | | | | |
Common Stocks | | | | | | | | | | | | | | | | |
Consumer Discretionary | | | 672,350 | | | | — | | | | — | | | | 672,350 | |
Consumer Staples | | | 729,059 | | | | — | | | | — | | | | 729,059 | |
Energy | | | 931,601 | | | | — | | | | — | | | | 931,601 | |
Financials | | | 860,797 | | | | — | | | | — | | | | 860,797 | |
Health Care | | | 870,347 | | | | — | | | | — | | | | 870,347 | |
Industrials | | | 798,912 | | | | — | | | | — | | | | 798,912 | |
Information Technology | | | 1,370,321 | | | | — | | | | — | | | | 1,370,321 | |
Materials | | | 271,610 | | | | — | | | | — | | | | 271,610 | |
Real Estate Investment Trusts | | | 52,164 | | | | — | | | | — | | | | 52,164 | |
Telecommunication Services | | | 227,368 | | | | — | | | | — | | | | 227,368 | |
Utilities | | | 259,076 | | | | — | | | | — | | | | 259,076 | |
Cash Equivalents | | | 556,435 | | | | — | | | | — | | | | 556,435 | |
Short-Term Securities Held as Collateral for Securities Lending | | | 136,265 | | | | — | | | | — | | | | 136,265 | |
| | | | | | | | | | | | | | | | |
Total Investment Securities | | | 7,736,305 | | | | — | | | | — | | | | 7,736,305 | |
| | | | | | | | | | | | | | | | |
Huntington Funds
Notes to Financial Statements (continued)
December 31, 2012
| | | | | | | | | | | | | | | | |
| | | LEVEL 1 | | | LEVEL 2 | | | LEVEL 3 | | | Total | |
VA Mid Corp America Fund | | | | | | | | | | | | | | | | |
Investment Securities: | | | | | | | | | | | | | | | | |
Common Stocks | | | | | | | | | | | | | | | | |
Consumer Discretionary | | $ | 2,226,819 | | | $ | — | | | $ | — | | | $ | 2,226,819 | |
Consumer Staples | | | 1,016,955 | | | | — | | | | — | | | | 1,016,955 | |
Energy | | | 1,657,561 | | | | — | | | | — | | | | 1,657,561 | |
Financials | | | 3,065,507 | | | | — | | | | — | | | | 3,065,507 | |
Health Care | | | 3,317,717 | | | | — | | | | — | | | | 3,317,717 | |
Industrials | | | 3,950,502 | | | | — | | | | — | | | | 3,950,502 | |
Information Technology | | | 4,673,148 | | | | — | | | | — | | | | 4,673,148 | |
Materials | | | 1,742,228 | | | | — | | | | — | | | | 1,742,228 | |
Real Estate Investment Trusts | | | 1,786,264 | | | | — | | | | — | | | | 1,786,264 | |
Telecommunication Services | | | 104,224 | | | | — | | | | — | | | | 104,224 | |
Utilities | | | 988,517 | | | | — | | | | — | | | | 988,517 | |
Cash Equivalents | | | 782,960 | | | | — | | | | — | | | | 782,960 | |
Short-Term Securities Held as Collateral for Securities Lending | | | 754,921 | | | | — | | | | — | | | | 754,921 | |
| | | | | | | | | | | | | | | | |
Total Investment Securities | | | 26,067,323 | | | | — | | | | — | | | | 26,067,323 | |
| | | | | | | | | | | | | | | | |
VA Real Strategies Fund | | | | | | | | | | | | | | | | |
Investment Securities: | | | | | | | | | | | | | | | | |
Common Stocks | | | | | | | | | | | | | | | | |
Consumer Staples | | | 163,201 | | | | — | | | | — | | | | 163,201 | |
Energy | | | 1,089,197 | | | | — | | | | — | | | | 1,089,197 | |
Industrials | | | 563,887 | | | | — | | | | — | | | | 563,887 | |
Materials | | | 803,335 | | | | — | | | | — | | | | 803,335 | |
Real Estate Investment Trusts | | | 352,329 | | | | — | | | | — | | | | 352,329 | |
Exchange-Traded Funds | | | 273,229 | | | | — | | | | — | | | | 273,229 | |
Real Estate Investments | | | — | | | | — | | | | 233,195 | | | | 233,195 | |
Closed-End Fund | | | 117,768 | | | | — | | | | — | | | | 117,768 | |
Warrants | | | 6,871 | | | | — | | | | — | | | | 6,871 | |
Options Purchased | | | 2,250 | | | | — | | | | — | | | | 2,250 | |
Cash Equivalents | | | 194,383 | | | | — | | | | — | | | | 194,383 | |
Short-Term Securities Held as Collateral for Securities Lending | | | 428,558 | | | | — | | | | — | | | | 428,558 | |
| | | | | | | | | | | | | | | | |
Total Investment Securities | | | 3,995,008 | | | | — | | | | 233,195 | | | | 4,228,203 | |
| | | | | | | | | | | | | | | | |
VA Rotating Markets Fund | | | | | | | | | | | | | | | | |
Investment Securities: | | | | | | | | | | | | | | | | |
Common Stocks | | | | | | | | | | | | | | | | |
Consumer Discretionary | | | 1,005,753 | | | | — | | | | — | | | | 1,005,753 | |
Consumer Staples | | | 153,439 | | | | — | | | | — | | | | 153,439 | |
Health Care | | | 732,442 | | | | — | | | | — | | | | 732,442 | |
Industrials | | | 114,790 | | | | — | | | | — | | | | 114,790 | |
Information Technology | | | 3,559,263 | | | | — | | | | — | | | | 3,559,263 | |
Materials | | | 27,712 | | | | — | | | | — | | | | 27,712 | |
Telecommunication Services | | | 48,113 | | | | — | | | | — | | | | 48,113 | |
Exchange-Traded Funds | | | 269,686 | | | | — | | | | — | | | | 269,686 | |
Cash Equivalents | | | 86,329 | | | | — | | | | — | | | | 86,329 | |
Short-Term Securities Held as Collateral for Securities Lending | | | 16,391 | | | | — | | | | — | | | | 16,391 | |
| | | | | | | | | | | | | | | | |
Total Investment Securities | | | 6,013,918 | | | | — | | | | — | | | | 6,013,918 | |
| | | | | | | | | | | | | | | | |
Huntington Funds
Notes to Financial Statements (continued)
December 31, 2012
| | | | | | | | | | | | | | | | |
| | | LEVEL 1 | | | LEVEL 2 | | | LEVEL 3 | | | Total | |
VA Situs Fund | | | | | | | | | | | | | | | | |
Investment Securities: | | | | | | | | | | | | | | | | |
Common Stocks | | | | | | | | | | | | | | | | |
Consumer Discretionary | | $ | 4,911,980 | | | $ | 197,973 | | | $ | — | | | $ | 5,109,953 | |
Consumer Staples | | | 786,353 | | | | 184,813 | | | | — | | | | 971,166 | |
Energy | | | 2,362,508 | | | | — | | | | — | | | | 2,362,508 | |
Financials | | | 5,064,892 | | | | — | | | | — | | | | 5,064,892 | |
Health Care | | | 5,957,692 | | | | 61,469 | | | | — | | | | 6,019,161 | |
Industrials | | | 6,801,130 | | | | 660,599 | | | | — | | | | 7,461,729 | |
Information Technology | | | 10,662,155 | | | | 68,427 | | | | — | | | | 10,730,582 | |
Materials | | | 3,805,912 | | | | — | | | | — | | | | 3,805,912 | |
Real Estate Investment Trusts | | | 573,738 | | | | — | | | | — | | | | 573,738 | |
Telecommunication Services | | | 143,850 | | | | — | | | | — | | | | 143,850 | |
Utilities | | | 575,155 | | | | — | | | | — | | | | 575,155 | |
Exchange-Traded Funds | | | 141,680 | | | | — | | | | — | | | | 141,680 | |
Cash Equivalents | | | 2,078,878 | | | | — | | | | — | | | | 2,078,878 | |
Short-Term Securities Held as Collateral for Securities Lending | | | 2,856,982 | | | | — | | | | — | | | | 2,856,982 | |
| | | | | | | | | | | | | | | | |
Total Investment Securities | | | 46,722,905 | | | | 1,173,281 | | | | — | | | | 47,896,186 | |
Other Financial Instruments:* | | | | | | | | | | | | | | | | |
Written Options | | | (31,125 | ) | | | — | | | | — | | | | (31,125 | ) |
| | | | | | | | | | | | | | | | |
Total Investments | | | 46,691,780 | | | | 1,173,281 | | | | — | | | | 47,865,061 | |
| | | | | | | | | | | | | | | | |
VA Mortgage Securities Fund | | | | | | | | | | | | | | | | |
Investment Securities: | | | | | | | | | | | | | | | | |
U.S. Government Mortgage Backed Agencies | | | | | | | | | | | | | | | | |
Federal Home Loan Mortgage Corporation | | | — | | | | 3,125,082 | | | | — | | | | 3,125,082 | |
Federal National Mortgage Association | | | — | | | | 7,918,054 | | | | — | | | | 7,918,054 | |
Government National Mortgage Association | | | — | | | | 2,479,792 | | | | — | | | | 2,479,792 | |
U.S. Government Agencies | | | | | | | | | | | | | | | | |
Federal Farm Credit Bank | | | — | | | | 1,558,926 | | | | — | | | | 1,558,926 | |
Federal Home Loan Bank | | | — | | | | 852,990 | | | | | | | | 852,990 | |
Federal Home Loan Mortgage Corporation | | | — | | | | 600,868 | | | | | | | | 600,868 | |
Federal National Mortgage Association | | | — | | | | 251,716 | | | | — | | | | 251,716 | |
Common Stocks | | | | | | | | | | | | | | | | |
Real Estate Investment Trusts | | | 2,346,272 | | | | — | | | | — | | | | 2,346,272 | |
Collateralized Mortgage Obligations | | | | | | | | | | | | | | | | |
Federal Home Loan Bank | | | — | | | | 33,644 | | | | — | | | | 33,644 | |
Federal Home Loan Mortgage Corporation | | | — | | | | 219,404 | | | | | | | | 219,404 | |
Federal National Mortgage Association | | | — | | | | 24,747 | | | | — | | | | 24,747 | |
Government National Mortgage Association | | | — | | | | 45,873 | | | | — | | | | 45,873 | |
Cash Equivalents | | | 572,278 | | | | — | | | | — | | | | 572,278 | |
Short-Term Securities Held as Collateral for Securities Lending | | | 103,566 | | | | — | | | | — | | | | 103,566 | |
| | | | | | | | | | | | | | | | |
Total Investment Securities | | | 3,022,116 | | | | 17,111,096 | | | | — | | | | 20,133,212 | |
| | | | | | | | | | | | | | | | |
| | * | Other Financial Instruments are derivative instruments not reflected on the Portfolio of Investments, such as written option contracts. |
Huntington Funds
Notes to Financial Statements (continued)
December 31, 2012
The following is a summary of the transfers between Level 1 and Level 2 of the fair value hierarchy for the year ended December 31, 2012:
| | | | | | | | |
| | | Transfers
from
Level 1 to
Level 2 | | | Transfers
from
Level 2 to
Level 1 | |
VA International Equity Fund | | | | | | | | |
Common Stocks | | | | | | | | |
Consumer Discretionary | | $ | 1,847,203 | | | $ | — | |
Consumer Staples | | | 2,225,004 | | | | — | |
Energy | | | 1,734,801 | | | | — | |
Financials | | | 3,332,030 | | | | — | |
Health Care | | | 473,996 | | | | — | |
Industrials | | | 4,891,618 | | | | — | |
Information Technology | | | 1,272,794 | | | | — | |
Materials | | | 1,196,615 | | | | — | |
Telecommunication Services | | | 896,930 | | | | — | |
Utilities | | | 592,948 | | | | — | |
| | | | | | | | |
Total | | $ | 18,463,939 | | | $ | — | |
| | | | | | | | |
VA Situs Fund | | | | | | | | |
Common Stocks | | | | | | | | |
Consumer Discretionary | | | 197,973 | | | | — | |
Consumer Staples | | | 184,813 | | | | — | |
Health Care | | | 61,469 | | | | — | |
Industrials | | | 660,599 | | | | — | |
Information Technology | | | 68,427 | | | | — | |
| | | | | | | | |
Total | | $ | 1,173,281 | | | $ | — | |
| | | | | | | | |
Transfers from Level 1 to Level 2 are due to significant movement of a designated U.S. market index, triggering a systematic valuation model provided by an independent third party to fair value the international equity securities at reporting period end.
| | | | | | | | | | |
Quantitative Information about Level 3 Fair Value Measurements |
Type of Assets | | Fair Value At
December 31,
2012 | | | Valuation
Techniques | | Unobservable
Input(s) | | Range (weighted
average) |
VA Real Strategies Fund | | | | | | | | | | |
Real Estate Investments | | $ | 233,195 | | | Discounted cash flow | | Discount Rate Market Cap Rate | | 3.0%-14.8% (9.6%)
7.0%-12.0% (8.7%) |
The significant unobservable inputs used in the fair value measurement of VA Real Strategies Fund’s investments in real estate investments were cash flows and discount and market cap rates. An increase in the cash flows and/or market cap rate or decreases in the discount rate used would increase the value of the investment. A decrease in the cash flows and/or market cap rate or increases in the discount rate used would decrease the value of the investment. Although the changes in the unobservable inputs may significantly change the security’s value, significant and reasonable changes to any of these inputs would not significantly impact the net assets of the VA Real Strategies Fund.
Following is a reconciliation of assets in which significant unobservable inputs (Level 3) were used in determining fair value:
| | | | |
| | | Real Estate
Investments | |
VA Real Strategies Fund | | | | |
Balance as of December 31, 2011 | | $ | 209,051 | |
Transfers into Level 3 | | | — | |
Transfers out of Level 3 | | | — | |
Purchases | | | 50,000 | |
Sales | | | — | |
Realized Gain | | | — | |
Realized Loss | | | — | |
Change in unrealized appreciation (depreciation) | | | (25,856 | ) |
| | | | |
Ending Balance as of December 31, 2012 | | $ | 233,195 | |
| | | | |
Huntington Funds
Notes to Financial Statements (continued)
December 31, 2012
The Funds may enter into repurchase agreements with banks and other recognized financial institutions, such as broker/dealers, which are deemed by Huntington Asset Advisors, Inc., a subsidiary of The Huntington National Bank, to be creditworthy pursuant to the guidelines and/or standards reviewed or established by the Trustees. It is the policy of the Funds to require the custodian bank to take possession of, to have legally segregated in the Federal Reserve Book Entry System, or to have segregated within the custodian bank’s vault, all securities held as collateral under repurchase agreement transactions. Additionally, procedures have been established by the Funds to monitor, on a daily basis, the market value of each repurchase agreement’s collateral to ensure that the value of collateral at least equals the repurchase price to be paid under the repurchase agreement transaction. If the counterparty defaults and the fair value of the collateral declines, realization of the collateral by the Funds may be delayed or limited. The Funds did not own any repurchase agreements at December 31, 2012.
| C. | When-Issued and Delayed Transactions |
The Funds may engage in when-issued or delayed delivery transactions. The Funds record when-issued securities on the trade date and maintain security positions such that sufficient liquid assets will be available to make payment for the securities purchased. Securities purchased on a when-issued or delayed delivery basis are marked to market daily and begin earning interest on the settlement date. Losses may occur on these transactions due to changes in market conditions or the failure of counterparties to perform under the contract. The Funds did not own any when-issued securities at December 31, 2012.
| D. | Foreign Currency Translation |
The accounting records of the Funds are maintained in U.S. dollars. Foreign currency amounts are translated into U.S. dollars at the current rate of exchange each business day to determine the value of investments, and other assets and liabilities. Purchases and sales of foreign securities, and income and expenses, are translated at the prevailing rate of exchange on the respective date of these transactions. The Funds do not isolate that portion of the results of operations resulting from changes in foreign exchange rates on investments from fluctuation arising from changes in market prices of securities held. These fluctuations are included with the net realized and unrealized gain or loss from investments and foreign currency transactions.
Certain of the Funds may be subject to equity price risk and foreign currency exchange risk in the normal course of pursuing their investment objectives. Certain of the Funds may invest in various financial instruments including positions in foreign currency contracts and written option contracts to gain exposure to or hedge against changes in the value of equities or foreign currencies. The following is a description of the derivative instruments utilized by the Funds, including the primary underlying risk exposure related to each instrument type.
Foreign Exchange Contracts—VA International Equity Fund, VA Real Strategies Fund and VA Situs Fund may enter into forward foreign exchange contracts. A forward foreign exchange contract involves an obligation to purchase or sell a specific currency at a future date at a price set at the time of the contract. Such contracts are used to sell unwanted currency exposure that comes with holding securities in a market, or to buy currency exposure where the exposure from holding securities is insufficient to provide the desired currency exposure. The contracts are marked-to-market daily and the change in market value is recorded as unrealized appreciation or depreciation. When a forward foreign currency contract is closed, a Fund records a realized gain or loss equal to the difference between the value at the time it was opened and the value at the time it was closed. These unrealized and realized gains and losses are reported on the Statement of Operations. The Funds could be exposed to risks if the counterparties to the contracts are unable to meet the terms of their contracts and from unanticipated movements in exchange rates. At December 31, 2012, VA International Equity Fund, VA Real Strategies Fund and VA Situs Fund did not have any forward foreign exchange contracts outstanding.
Written Options Contracts—Certain of the Funds may write options contracts for which premiums received are recorded as liabilities and are subsequently adjusted to the current value of the options written. Premiums received from writing options which expire are treated as realized gains. Premiums received from writing options which are either exercised or closed are offset against the proceeds received or amount paid on the transaction to determine realized gains or losses. Investing in written options contracts exposes a Fund to equity price risk.
Huntington Funds
Notes to Financial Statements (continued)
December 31, 2012
The following is a summary of VA Growth Fund’s written option activity for the year ended December 31, 2012:
| | | | | | | | |
Contracts | | Number of Contracts | | | Premium | |
Outstanding at 12/31/2011 | | | — | | | $ | — | |
Options written | | | 16 | | | | 11,472 | |
Options expired | | | (16 | ) | | | (11,472 | ) |
Options closed | | | — | | | | — | |
Options exercised | | | — | | | | — | |
| | | | | | | | |
Outstanding at 12/31/2012 | | | — | | | $ | — | |
| | | | | | | | |
The following is a summary of VA Income Equity Fund’s written option activity for the year ended December 31, 2012:
| | | | | | | | |
Contracts | | Number of Contracts | | | Premium | |
Outstanding at 12/31/2011 | | | — | | | $ | — | |
Options written | | | 722 | | | | 44,970 | |
Options expired | | | (532 | ) | | | (37,448 | ) |
Options closed | | | (130 | ) | | | (6,502 | ) |
Options exercised | | | (60 | ) | | | (1,020 | ) |
| | | | | | | | |
Outstanding at 12/31/2012 | | | — | | | $ | — | |
| | | | | | | | |
The following is a summary of VA Real Strategies Fund’s written option activity for the year ended December 31, 2012:
| | | | | | | | |
Contracts | | Number of Contracts | | | Premium | |
Outstanding at 12/31/2011 | | | 66 | | | $ | 32,207 | |
Options written | | | 110 | | | | 42,785 | |
Options expired | | | (72 | ) | | | (23,142 | ) |
Options closed | | | (104 | ) | | | (51,850 | ) |
Options exercised | | | — | | | | — | |
| | | | | | | | |
Outstanding at 12/31/2012 | | | — | | | $ | — | |
| | | | | | | | |
The following is a summary of VA Situs Fund’s written option activity for the year ended December 31, 2012:
| | | | | | | | |
Contracts | | Number of Contracts | | | Premium | |
Outstanding at 12/31/2011 | | | — | | | $ | — | |
Options written | | | 1,296 | | | | 505,393 | |
Options expired | | | (256 | ) | | | (56,633 | ) |
Options closed | | | (720 | ) | | | (337,951 | ) |
Options exercised | | | (170 | ) | | | (54,688 | ) |
| | | | | | | | |
Outstanding at 12/31/2012 | | | 150 | | | $ | 56,121 | |
| | | | | | | | |
At December 31, 2012, VA Situs Fund had the following outstanding written option contracts:
| | | | | | | | | | | | | | | | | | | | | | | | |
Contract | | Type | | | Expiration
Date | | | Exercise
Price | | | Number of
Contracts | | | Fair
Value | | | Unrealized
Appreciation
(Depreciation) | |
Edwards LifeSciences Corp. | | | Call | | | | February 2013 | | | $ | 95 | | | | 150 | | | $ | 31,125 | | | $ | 24,996 | |
NET UNREALIZED APPRECIATION ON WRITTEN OPTION CONTRACTS | | | $ | 24,996 | |
| | | | | | | | | | | | | | | | | | | | | | | | |
Huntington Funds
Notes to Financial Statements (continued)
December 31, 2012
The following tables provide a summary of the fair value of derivative instruments, not accounted for as hedging instruments as of December 31, 2012, and the effect of derivative instruments on the Statements of Operations for the year ended December 31, 2012.
The fair value of Derivative Instruments as of December 31, 2012 is as follows:
| | | | | | | | | | |
| | | Asset Derivatives | | Liability Derivatives | | | | | |
Primary Risk Exposure | | Statements of Assets and
Liabilities Location | | Statements of Assets and
Liabilities Location | | Fund | | Fair Value | |
Option Contracts | | | | Options Written, at value | | VA Situs Fund | | $ | 31,125 | |
| | Investments (purchased options), at value | | | | VA Real Strategies Fund | | | 2,250 | |
The effect of Derivative Instruments on the Statements of Operations for the year ended December 31, 2012 is as follows:
| | | | | | | | | | | | |
Primary Risk Exposure | | Location of Gain (Loss)
on Derivatives
Recognized in Income | | Fund | | Realized
Gain (Loss)
on Derivatives
Recognized in
Income | | | Change in
Unrealized
Appreciation
(Depreciation)
on Derivatives
Recognized in
Income | |
Option Contracts | | Net realized gain (loss) on | | VA Growth Fund | | $ | 11,472 | | | $ | — | |
| | option transactions/net | | VA Income Equity Fund | | | 34,670 | | | | — | |
| | change in unrealized | | VA Real Strategies Fund | | | 21,780 | | | | 6,632 | |
| | appreciation(depreciation) of investments and options | | VA Situs Fund | | | 128,502 | | | | 24,996 | |
The notional value of the written options contracts outstanding at December 31, 2012 and the month-end average notional amount for the year ended December 31, 2012 are detailed in the table below:
| | | | | | | | |
Fund | | Average Month-End
Notional Amount | | | December 31, 2012
Notional Amount | |
VA Growth Fund | | $ | 80,000 | | | $ | — | |
VA Income Equity Fund | | | 284,346 | | | | — | |
VA Real Strategies Fund | | | 88,762 | | | | — | |
VA Situs Fund | | | 1,606,308 | | | | 31,125 | |
Derivative positions during the period and at period end are reflected for each Fund in the tables presented above. The volume of these positions relative to each Fund’s net assets at the close of the reporting period is generally higher than the volume of such positions at the beginning of the reporting period. The Funds value derivative instruments at fair value and recognize changes in fair value currently in the results on operations.
To generate additional income, the Funds may lend a certain percentage of their total assets, to the extent permitted by the 1940 Act or the rules or regulations thereunder, on a short-term basis to certain brokers, dealers or other financial institutions pursuant to a securities lending agreement with Morgan Stanley & Co. LLC and MS Securities Services, Inc. In determining whether to lend to a particular broker, dealer or financial institution, Huntington Asset Advisors, Inc. (the “Advisor”) will consider all relevant facts and circumstances, including the size, creditworthiness and reputation of the borrower. Any loans made will be continuously secured by collateral in cash at least equal to 100% of the value of the securities on loan for the Funds, based on the prior day’s closing price. When the collateral falls below specified amounts the lending agent will use its best effort to obtain additional collateral on the next business day to meet required amounts under the security lending agreement. The Funds receive payments from the borrowers equivalent to the dividends and interest that would have been earned on securities on loan. In addition, the Funds lending securities receive an annual minimum securities lending fee and retain a portion of the interest, dividends and other distributions received on investment of cash collateral. Collateral is marked-to-market daily. One of the risks in lending portfolio securities, as with other extensions of credit, is the possible delay in recovery of the securities or possible loss of rights in the collateral should the borrower fail financially. Although the loan is fully collateralized, if a borrower defaults, a Fund could lose money. There is also the risk that, when lending portfolio securities, the securities may not be available to a Fund on a timely basis and a Fund may, therefore, lose the opportunity to sell the securities at a desirable price. In addition, in the event that a borrower of securities would file for bankruptcy or become insolvent, disposition of the securities may be delayed pending
Huntington Funds
Notes to Financial Statements (continued)
December 31, 2012
court action. Loans are subject to termination by the Funds or the borrower at any time and, therefore, are not considered to be illiquid investments. Huntington National Bank (“Huntington”) serves as the custodian for related collateral and receives an annual securities lending fee for collateral monitoring and recordkeeping services.
As of December 31, 2012, the following Funds had securities with the following market values on loan and related activity:
| | | | | | | | | | | | | | | | | | | | |
Fund | | Value of Loaned
Securities | | | Value of Collateral | | | Average Loan
Outstanding During
the Period | | | Securities Lending
Income Received by
the Funds | | | Fees Paid by the Funds
to Huntington from
Securities Lending | |
VA Dividend Capture Fund | | $ | 1,039,741 | | | $ | 1,060,536 | | | $ | 1,661,392 | | | $ | 40,293 | | | $ | 7,158 | |
VA Growth Fund | | | 160,149 | | | | 163,352 | | | | 443,365 | | | | 4,659 | | | | 754 | |
VA Income Equity Fund | | | 1,886,129 | | | | 1,923,852 | | | | 1,743,627 | | | | 3,916 | | | | 564 | |
VA International Equity Fund | | | 1,230,430 | | | | 1,244,288 | | | | 1,544,392 | | | | 14,167 | | | | 2,261 | |
VA Macro 100 Fund | | | 136,170 | | | | 136,265 | | | | 217,787 | | | | 1,103 | | | | 187 | |
VA Mid Corp America Fund | | | 750,024 | | | | 754,921 | | | | 556,997 | | | | 30,888 | | | | 6,028 | |
VA Real Strategies Fund | | | 432,496 | | | | 428,558 | | | | 361,251 | | | | 27,467 | | | | 4,898 | |
VA Rotating Markets Fund | | | 16,418 | | | | 16,391 | | | | 127,351 | | | | 1,182 | | | | 187 | |
VA Situs Fund | | | 2,875,020 | | | | 2,856,982 | | | | 2,266,466 | | | | 35,123 | | | | 6,028 | |
VA Mortgage Securities Fund | | | 101,835 | | | | 103,566 | | | | 120,746 | | | | 840 | | | | 151 | |
All cash collateral received is held and administered by the Funds’ custodian for the benefit of the Funds in the applicable custody account or other account established for the purpose of holding collateral. Pursuant to the Funds’ securities lending agreement, and according to normal operating procedures, the custodian segregated an additional $22,981, $355 and $75,538 in collateral the following business day for securities on loan in the VA Real Strategies Fund, VA Rotating Markets Fund and VA Situs Fund as of December 31, 2012.
Restricted securities are securities that may only be resold upon registration under federal securities laws or in transactions exempt from such registration. In some cases, the issuer of restricted securities has agreed to register such securities for resale, at the issuer’s expense, either upon demand by the Funds or in connection with another registered offering of the securities. Many restricted securities may be resold in the secondary market in transactions exempt from registration. Such restricted securities may be determined to be liquid. The Funds will not incur any registration costs upon such resale. The Funds’ restricted securities are valued at the price provided by dealers in the secondary market or, if no market prices are available, at the fair value price as determined by the Trust’s Pricing Committee. At December 31, 2012, the VA Real Strategies Fund held illiquid restricted securities representing 6.14% respectively, of net assets as listed below:
| | | | | | | | | | | | |
Issuer Description | | Acquisition Date | | | Cost | | | Value | |
VA Real Strategies Fund: | | | | | | | | | | | | |
Discount Retail Portfolio II DST | | | 11/30/11 | | | $ | 50,000 | | | $ | 46,551 | |
Grocery & Pharmacy DST | | | 8/26/11 | | | | 50,000 | | | | 48,390 | |
New York Power DST | | | 7/21/11 | | | | 50,000 | | | | 45,382 | |
Scotts Gahanna LLC | | | 12/13/11 | | | | 56,000 | | | | 47,659 | |
Winston-Salem DST | | | 2/22/12 | | | | 50,000 | | | | 45,213 | |
| H. | Security Transactions and Related Income |
During the period, investment transactions are accounted for no later than the first calculation of the NAV on the business day following the trade date. For financial reporting purposes, however, security transactions are accounted for on trade date on the last business day of the reporting period. Discounts and premiums on securities purchased are amortized over the lives of the respective securities. Securities gains and losses are calculated on the identified cost basis. Interest income and expenses are accrued daily. Dividends, less foreign tax withholding (if any), are recorded on the ex-dividend date.
| I. | Dividends and Distributions to Shareholders |
Dividends from net investment income, if any, are declared and paid annually for the Funds. Net realized capital gains, if any, are distributed at least annually. The amount of dividends from net investment income and net realized gains are determined in accordance with the federal income tax regulations, which may differ from GAAP. These “book/tax” differences are either
Huntington Funds
Notes to Financial Statements (continued)
December 31, 2012
considered temporary or permanent in nature. To the extent these differences are permanent in nature (e.g. tax treatment of foreign currency gain/loss, non-deductible stock issuance costs, paydowns, distributions and income received from pass through investments and net investment loss adjustments), such amounts are reclassified within the capital accounts based on their nature for federal income tax purposes; temporary differences do not require reclassification. Temporary differences are primarily due to market discounts, capital loss carryforwards and losses deferred due to wash sales, straddles and return of capital from investments.
Certain of the Funds may own shares of real estate investment trusts (“REITs”) which report information on the source of their distributions annually. Distributions received from investments in REITs in excess of income from underlying investments are recorded as realized gain and/or as a reduction to the cost of the individual REIT.
Certain of the Funds may invest in Master Limited Partnerships (“MLPs”), which generally are treated as partnerships for Federal income tax purposes. As a limited partner in the MLPs, the Fund includes its allocable share of the MLPs’ taxable income in computing its own taxable income.
Expenses directly attributable to a Fund are charged to that Fund. Expenses not directly attributable to a Fund are allocated proportionally among various Funds or all Funds within the Trust in relation to the net assets of each Fund or on another reasonable basis.
It is the policy of each Fund to qualify or continue to qualify as a regulated investment company by complying with the provisions available to certain investment companies, as defined in applicable sections of the Internal Revenue Code, and to make distributions of net investment income and net realized capital gains sufficient to relieve it from all, or substantially all, federal income taxes. In addition to complying with the federal tax requirements applicable to regulated investment companies, the Funds also plan to comply with certain diversification standards applicable to underlying assets of variable annuity contracts in order to avoid taxation on the variable contract owners with respect to earnings allocable to the contract from investments in the Funds.
Withholding taxes on foreign interest, dividends and capital gains with respect to the Funds have been provided for in accordance with each applicable country’s tax rules and rates.
As of December 31, 2012, the tax cost of securities and the breakdown of unrealized appreciation (depreciation) for each Fund was as follows:
| | | | | | | | | | | | | | | | |
Fund | | Tax Cost of
Securities | | | Unrealized
Appreciation | | | Unrealized
Depreciation | | | Net Unrealized
Appreciation/
(Depreciation)* | |
VA Balanced Fund | | $ | 40,265,170 | | | $ | 4,588,746 | | | $ | (489,955 | ) | | $ | 4,098,791 | |
VA Dividend Capture Fund | | | 32,196,857 | | | | 2,216,456 | | | | (581,930 | ) | | | 1,634,526 | |
VA Growth Fund | | | 15,207,582 | | | | 1,510,973 | | | | (39,916 | ) | | | 1,471,057 | |
VA Income Equity Fund | | | 20,461,603 | | | | 2,102,485 | | | | (388,491 | ) | | | 1,713,994 | |
VA International Equity Fund | | | 28,041,661 | | | | 6,541,896 | | | | (2,361,130 | ) | | | 4,180,766 | |
VA Macro 100 Fund | | | 6,976,682 | | | | 988,037 | | | | (228,414 | ) | | | 759,623 | |
VA Mid Corp America Fund | | | 19,656,783 | | | | 6,725,167 | | | | (314,627 | ) | | | 6,410,540 | |
VA Real Strategies Fund | | | 4,148,898 | | | | 339,762 | | | | (260,457 | ) | | | 79,305 | |
VA Rotating Markets Fund | | | 6,077,262 | | | | 387,917 | | | | (451,261 | ) | | | (63,344 | ) |
VA Situs Fund | | | 36,620,669 | | | | 13,425,997 | | | | (2,150,480 | ) | | | 11,275,517 | |
VA Mortgage Securities Fund | | | 18,813,939 | | | | 1,333,960 | | | | (14,687 | ) | | | 1,319,273 | |
| | * | The differences between the book-basis unrealized appreciation/(depreciation) are attributable primarily to: tax deferral of losses on wash sales, the tax treatment of Trust Preferred securities, hybrid securities and Grantor trusts, differences related to partnership investments, the realization for tax purposes of unrealized gains/losses on investments in passive foreign investment companies and the return of capital adjustments from real estate investment trusts. |
Huntington Funds
Notes to Financial Statements (continued)
December 31, 2012
The tax character of distributions paid during the fiscal year ended December 31, 2012, was as follows:
| | | | | | | | | | | | | | | | | | | | |
| | | Distributions Paid From* | | | | | | | | | | |
Fund | | Ordinary
Income | | | Net Long Term
Capital Gains | | | Total Taxable
Distributions | | | Tax Return
of Capital | | | Total
Distributions Paid | |
VA Balanced Fund | | $ | 689,697 | | | $ | 160,698 | | | $ | 850,395 | | | $ | — | | | $ | 850,395 | |
VA Dividend Capture Fund | | | 1,257,345 | | | | — | | | | 1,257,345 | | | | — | | | | 1,257,345 | |
VA Growth Fund | | | 61,447 | | | | — | | | | 61,447 | | | | — | | | | 61,447 | |
VA Income Equity Fund | | | 776,186 | | | | — | | | | 776,186 | | | | — | | | | 776,186 | |
VA International Equity Fund | | | 380,441 | | | | — | | | | 380,441 | | | | — | | | | 380,441 | |
VA Macro 100 Fund | | | 44,426 | | | | — | | | | 44,426 | | | | — | | | | 44,426 | |
VA Mid Corp America Fund | | | 63,776 | | | | 1,305,821 | | | | 1,369,597 | | | | — | | | | 1,369,597 | |
VA Real Strategies Fund | | | 8,929 | | | | 18,205 | | | | 27,134 | | | | — | | | | 27,134 | |
VA Rotating Markets Fund | | | 97,697 | | | | — | | | | 97,697 | | | | — | | | | 97,697 | |
VA Mortgage Securities Fund | | | 487,131 | | | | — | | | | 487,131 | | | | — | | | | 487,131 | |
| | * | The tax character of distributions paid may differ from the character of distributions shown on the statements of changes in net assets due to short-term capital gains being treated as ordinary income for tax purposes. |
The tax character of distributions paid during the fiscal year ended December 31, 2011, was as follows:
| | | | | | | | | | | | | | | | | | | | |
| | | Distributions Paid From* | | | | | | | | | | |
Fund | | Ordinary
Income | | | Net Long Term
Capital Gains | | | Total Taxable
Distributions | | | Tax Return
of Capital | | | Total
Distributions Paid | |
VA Balanced Fund | | $ | 355,696 | | | $ | 1,631 | | | $ | 357,327 | | | $ | — | | | $ | 357,327 | |
VA Dividend Capture Fund | | | 1,161,458 | | | | — | | | | 1,161,458 | | | | — | | | | 1,161,458 | |
VA Growth Fund | | | 27,515 | | | | — | | | | 27,515 | | | | — | | | | 27,515 | |
VA Income Equity Fund | | | 566,505 | | | | — | | | | 566,505 | | | | — | | | | 566,505 | |
VA International Equity Fund | | | 323,030 | | | | — | | | | 323,030 | | | | — | | | | 323,030 | |
VA Macro 100 Fund | | | 34,846 | | | | — | | | | 34,846 | | | | — | | | | 34,846 | |
VA Mid Corp America Fund | | | 78,630 | | | | — | | | | 78,630 | | | | — | | | | 78,630 | |
VA Real Strategies Fund | | | 5,592 | | | | — | | | | 5,592 | | | | — | | | | 5,592 | |
VA Rotating Markets Fund | | | 21,470 | | | | — | | | | 21,470 | | | | — | | | | 21,470 | |
VA Situs Fund | | | 8,225 | | | | — | | | | 8,225 | | | | — | | | | 8,225 | |
VA Mortgage Securities Fund | | | 386,232 | | | | — | | | | 386,232 | | | | — | | | | 386,232 | |
| | * | The tax character of distributions paid may differ from the character of distributions shown on the statements of changes in net assets due to short-term capital gains being treated as ordinary income for tax purposes. |
As of December 31, 2012, the components of accumulated earnings (deficit) on a tax basis were as follows:
| | | | | | | | | | | | | | | | | | | | | | | | | | | | |
Fund | | Undistributed
Ordinary Income | | | Undistributed
Long-Term
Capital Gains | | | Accumulated
Earnings | | | Accumulated
Capital and
Other Losses | | | Other
Temporary
Differences | | | Unrealized
Appreciation
(Depreciation) | | | Total
Accumulated
Earnings
(Deficit) | |
VA Balanced Fund | | $ | 919,511 | | | $ | 317,237 | | | $ | 1,236,748 | | | $ | — | | | $ | — | | | $ | 4,098,791 | | | $ | 5,335,539 | |
VA Dividend Capture Fund | | | 1,294,812 | | | | — | | | | 1,294,812 | | | | (9,190,501 | ) | | | — | | | | 1,634,526 | | | | (6,261,163 | ) |
VA Growth Fund | | | 139,137 | | | | — | | | | 139,137 | | | | (872,453 | ) | | | — | | | | 1,471,057 | | | | 737,741 | |
VA Income Equity Fund | | | 798,401 | | | | — | | | | 798,401 | | | | (4,397,616 | ) | | | — | | | | 1,714,004 | | | | (1,885,211 | ) |
VA International Equity Fund | | | 485,949 | | | | — | | | | 485,949 | | | | (3,973,807 | ) | | | (2,441 | ) | | | 4,182,085 | | | | 691,786 | |
VA Macro 100 Fund | | | 94,915 | | | | — | | | | 94,915 | | | | (2,277,540 | ) | | | — | | | | 759,623 | | | | (1,423,002 | ) |
VA Mid Corp America Fund | | | 807,542 | | | | 881,931 | | | | 1,689,473 | | | | (1,439,721 | ) | | | — | | | | 6,410,540 | | | | 6,660,291 | |
VA Real Strategies Fund | | | 67,039 | | | | 83,339 | | | | 150,378 | | | | — | | | | — | | | | 79,305 | | | | 229,683 | |
VA Rotating Markets Fund | | | 46,795 | | | | 581,280 | | | | 628,075 | | | | — | | | | — | | | | (63,344 | ) | | | 564,731 | |
VA Situs Fund | | | 220,517 | | | | ��� | | | | 220,517 | | | | (1,004,206 | ) | | | — | | | | 11,300,570 | | | | 10,516,881 | |
VA Mortgage Securities Fund | | | 472,061 | | | | — | | | | 472,061 | | | | (411,605 | ) | | | — | | | | 1,319,273 | | | | 1,379,729 | |
Huntington Funds
Notes to Financial Statements (continued)
December 31, 2012
Certain capital and qualified late year losses incurred after October 31 and within the current taxable year, are deemed to arise on the first business day of the Funds’ following taxable year. For the tax year ended December 31, 2012 the Funds deferred post October capital and qualified late year losses as follows:
| | | | | | | | |
Fund | | Capital
Losses | | | Qualified Late
Year Losses | |
VA Growth Fund | | $ | 149,243 | | | | — | |
VA Income Equity Fund | | | 473,823 | | | | — | |
VA Mortgage Securities Fund | | | 22,224 | | | | — | |
As of December 31, 2012, for federal income tax purposes, the following Funds had capital loss carryforwards available to offset future gains, if any, to the extent provided by the Treasury regulations:
| | | | | | | | | | | | | | | | | | | | | | | | |
| | | Expiration Year | |
Fund | | 2013 | | | 2014 | | | 2015 | | | 2016 | | | 2017 | | | 2018 | |
VA Dividend Capture Fund | | $ | — | | | $ | — | | | $ | — | | | $ | — | | | $ | 9,190,501 | | | $ | — | |
VA Growth Fund | | | — | | | | — | | | | — | | | | — | | | | 723,206 | | | | — | |
VA Income Equity Fund | | | — | | | | — | | | | — | | | | — | | | | 3,923,793 | | | | — | |
VA International Equity Fund | | | — | | | | — | | | | — | | | | — | | | | 1,812,920 | | | | 567,263 | |
VA Macro 100 Fund | | | — | | | | — | | | | — | | | | 1,345,904 | | | | 436,650 | | | | 494,985 | |
VA Mid Corp America Fund | | | — | | | | — | | | | — | | | | 1,439,721 | * | | | — | | | | — | |
VA Situs Fund | | | — | | | | — | | | | — | | | | — | | | | 910,379 | | | | 93,827 | |
VA Mortgage Securities Fund | | | — | | | | — | | | | — | | | | 100,360 | | | | 90,146 | | | | 21,805 | |
| | * | Future utilization of these losses is limited due to merger related capital loss carryover limitations. |
During the year ended December 31, 2012 VA Dividend Capture Fund, VA Growth Fund, VA Income Equity Fund, VA Macro 100, VA Mid Corp America Fund, VA Rotating Markets Fund and VA Situs Fund utilized $1,903,006, $1,226,192, $1,075,779, $62,759, $176,757, $879,923 and $394,829, respectively, in capital loss carryforwards.
On December 22, 2010, the Regulated Investment Company Modernization Act of 2010 (the “Act”) was enacted, which changed various technical rules governing the tax treatment of regulated investment companies. The changes are generally effective for taxable years beginning after the date of enactment. One of the more prominent changes addresses capital loss carryforwards. Under the Act, each Fund will be permitted to carry forward capital losses incurred in taxable years beginning after the date of enactment for an unlimited period. However, any losses incurred during those future taxable years will be required to be utilized prior to the losses incurred in pre-enactment taxable years, which carry an expiration date. As a result of this ordering rule, pre-enactment capital loss carryforwards may be more likely to expire unused. Additionally, post-enactment capital loss carryforwards will retain their character as either short-term or long-term capital losses rather than being considered all short-term as permitted under previous regulation.
Losses incurred that will be carried forward under the provisions of the Act are as follows:
| | | | | | | | |
| | | Loss Carryforward Character | |
Fund | | Short Term | | | Long Term | |
VA International Equity Fund | | $ | 653,181 | | | $ | 940,443 | |
VA Mortgage Securities Fund | | | 68,437 | | | | 108,633 | |
Management of the Funds has reviewed tax positions taken in tax years that remain subject to examination by all major tax jurisdictions, including federal (i.e., the last four tax year ends and the interim tax period since then). Management believes there is no tax liability resulting from unrecognized tax benefits related to uncertain tax positions taken.
| L. | New Accounting Pronouncement |
In December 2011, the Financial Accounting Standards Board issued Accounting Standards Update (“ASU”) No. 2011-11 “Disclosures about Offsetting Assets and Liabilities” (“ASU 2011-11”). ASU 2011-11 requires disclosure of both gross and net information related to offsetting and related arrangements, enabling users of financial statements to understand the effect of those arrangements on the entity’s financial position. The objective of this disclosure is to facilitate comparison between those entities that prepare their financial statements on the basis of U.S. GAAP and those entities that prepare their financial statements on the basis of International Financial Reporting Standards. ASU 2011-11 is effective for fiscal years beginning on or after January 1, 2013, and interim periods within those annual periods. At this time, management is evaluating the implications of ASU 2011-11 and its impact on the financial statements has not yet been determined.
Huntington Funds
Notes to Financial Statements (continued)
December 31, 2012
On November 8, 2012, the Board of Trustees (the “Trustees”) of the Huntington Funds approved a proposal to reorganize the VA Macro 100 Fund into the VA Dividend Capture Fund. Pursuant to the reorganization, the VA Macro 100 Fund will liquidate by transferring substantially all of its assets to the Huntington VA Dividend Capture Fund. The reorganization is scheduled to take place at the close of business on or about March 28, 2013.
| (3) | Investment Advisory Fee and Other Transactions with Affiliates |
Investment Advisory Fee—Huntington Asset Advisors, Inc. (the “Advisor”), a subsidiary of The Huntington National Bank (“Huntington”), serves as the Funds’ investment advisor. The Advisor receives a fee for its services, computed daily and paid monthly, at an annual rate of 0.60% of the average daily net assets of each Fund, except for VA Balanced Fund, for which the Advisor receives a fee, computed daily and paid monthly, at an annual rate of 0.10% of the average daily net assets of the VA Balanced Fund.
The Advisor has agreed to contractually waive all or a portion of its investment advisory fee for VA Balanced Fund (based on average daily net assets) to which it is otherwise entitled and/or to reimburse certain operating expenses of VA Balanced Fund in order to limit the total direct net annual operating expenses to not more than 0.10% of the average daily net assets of VA Balanced Fund through April 30, 2013. Huntington and the Advisor may also pay out of their reasonable profits and other resources (including those of their affiliates) advertising, marketing, and other expenses for the benefit of the Funds.
Consulting Fee—Laffer Investments, Inc. acts as a consultant (the “Consultant”) to the Advisor for VA Macro 100 Fund. The Advisor pays the Consultant a fee for its services. Neither the Trust nor VA Macro 100 Fund is liable for payment of this fee.
Administrative Fees— Effective December 1, 2012, Huntington Asset Services, Inc. (“HASI”), a wholly owned subsidiary of Huntington Bancshares, Incorporated, replaced Huntington as Administrator to the Trust. The fees paid for administrative services are based on the level of average net assets of each Fund for the period.
HASI provides administrative and accounting services at the following annual rate on a tiered basis:
| | |
Maximum Administrative Fee | | Average Daily Net Assets of the Trust |
0.1822% | | On the first $4 billion |
0.1650% | | On the next $2 billion |
0.1575% | | On the next $2 billion |
0.1450% | | On assets in excess of $8 billion |
There is no minimum annual fee per fund or class of shares.
Transfer and Dividend Disbursing Agent Fees and Expenses—HASI is the transfer and dividend disbursing agent for the Funds. For its services, HASI receives a yearly fixed amount per shareholder account, subject to a yearly minimum of $6,000 for each of the Funds. HASI is also entitled to receive additional amounts that may be activity or time-based charges, plus reimbursement for out-of-pocket expenses.
Custodian Fees—Huntington serves as custodian for each of the Funds. Brown Brothers Harriman serves as sub-custodian for VA International Equity Fund’s, VA Real Strategies Fund’s and VA Situs Fund’s foreign assets. Huntington and Brown Brothers Harriman receive fees based on the level of a Fund’s average daily net assets for the period, plus out-of-pocket expenses.
Compliance Services—The Trust has contracted with Huntington to provide a Chief Compliance Officer to the Trust, for which it pays Huntington $135,188 annually.
General—Certain officers of the Trust are Officers and/or Directors or Trustees of the above companies.
Trustees and Officers affiliated with the Advisor are not compensated by the Trust for their services. Each Trustee who is not an “interested person” of the Trust, as such term is defined in the 1940 Act, receives a $25,000 annual retainer plus $2,500 per regular Board meeting. The Independent Chairman of the Board receives a $40,000 annual retainer plus $2,500 per Board meeting. The Board or a Committee may establish ad hoc committees or sub-committees. Any Committee or sub-committee member may be compensated by the Fund for incremental work outside of the regular meeting process based on the value added to the Fund. In addition, the Fund reimburses Trustees who are not employees of or affiliated with the Advisor for out-of-pocket expenses incurred in conjunction with attendance at meetings. For the year ended December 31, 2012, actual Trustee compensation was $292,000 in aggregate from the Trust.
Huntington Funds
Notes to Financial Statements (continued)
December 31, 2012
Pursuant to an exemptive order issued by the Securities and Exchange Commission, the Funds may invest in certain affiliated money market funds which are managed by the Advisor. Income distributions earned from investments in these funds are recorded as income from affiliates in the accompanying financial statements. A summary of each Fund’s investment in such affiliated money market funds is set forth below:
| | | | | | | | | | | | | | | | | | | | |
Fund | | 12/31/11
Market Value | | | Purchases | | | Sales | | | 12/31/12
Market Value | | | Income | |
Money Market Fund | | | | | | | | | | | | | | | | | | | | |
VA Dividend Capture Fund | | $ | 586,341 | | | $ | 8,619,358 | | | $ | (9,205,699 | ) | | $ | — | | | $ | 50 | |
VA Growth Fund | | | 1,057,957 | | | | 12,274,030 | | | | (13,331,987 | ) | | | — | | | | 59 | |
VA Income Equity Fund | | | 208,178 | | | | 4,393,589 | | | | (4,601,767 | ) | | | — | | | | 26 | |
VA International Equity Fund | | | 2,788,095 | | | | 8,026,990 | | | | (10,815,085 | ) | | | — | | | | 246 | |
VA Macro 100 Fund | | | 277,908 | | | | 2,029,402 | | | | (2,307,310 | ) | | | — | | | | 43 | |
VA Mid Corp America Fund | | | 1,329,367 | | | | 6,667,887 | | | | (7,997,254 | ) | | | — | | | | 82 | |
VA Real Strategies Fund | | | 433,113 | | | | 1,062,526 | | | | (1,495,639 | ) | | | — | | | | 37 | |
VA Rotating Markets Fund | | | 151,793 | | | | 1,237,310 | | | | (1,389,103 | ) | | | — | | | | 12 | |
VA Situs Fund | | | 4,985,370 | | | | 9,142,988 | | | | (14,128,358 | ) | | | — | | | | 212 | |
VA Mortgage Securities Fund | | | 724,088 | | | | 6,935,791 | | | | (7,659,879 | ) | | | — | | | | 70 | |
| | | | | |
U.S. Treasury Money Market Fund | | | | | | | | | | | | | | | | | | | | |
VA Dividend Capture Fund | | $ | — | | | $ | 1,238,606 | | | $ | (632,512 | ) | | $ | 606,094 | | | $ | 17 | |
VA Growth Fund | | | — | | | | 447,848 | | | | (236,157 | ) | | | 211,691 | | | | 3 | |
VA Income Equity Fund | | | — | | | | 1,002,724 | | | | (290,066 | ) | | | 712,658 | | | | 5 | |
VA International Equity Fund | | | — | | | | 2,533,612 | | | | (1,375,208 | ) | | | 1,158,404 | | | | 92 | |
VA Macro 100 Fund | | | — | | | | 652,495 | | | | (96,060 | ) | | | 556,435 | | | | 24 | |
VA Mid Corp America Fund | | | — | | | | 1,498,677 | | | | (715,717 | ) | | | 782,960 | | | | 28 | |
VA Real Strategies Fund | | | — | | | | 273,154 | | | | (78,771 | ) | | | 194,383 | | | | 7 | |
VA Rotating Markets Fund | | | — | | | | 131,680 | | | | (45,351 | ) | | | 86,329 | | | | 1 | |
VA Situs Fund | | | — | | | | 2,476,434 | | | | (397,556 | ) | | | 2,078,878 | | | | 64 | |
VA Mortgage Securities Fund | | | — | | | | 1,851,324 | | | | (1,279,046 | ) | | | 572,278 | | | | 39 | |
Additionally, VA Balanced Fund invests in other funds within the Trust. A summary of the VA Balanced Fund’s investments in these affiliated funds is set forth below:
| | | | | | | | | | | | | | | | | | | | |
VA Balanced Fund | | 12/31/11
Market Value | | | Purchases | | | Sales | | | 12/31/12
Market Value | | | Income | |
Huntington Money Market Fund | | $ | 795,945 | | | $ | 4,732,904 | | | $ | (5,528,849 | ) | | $ | — | | | $ | 83 | |
Huntington U.S. Treasury Money Market Fund | | | — | | | | 1,740,248 | | | | (838,749 | ) | | | 901,499 | | | | 35 | |
Huntington Fixed Income Securities Fund | | | 12,447,187 | | | | 3,129,073 | | | | (1,828,743 | ) | | | 13,927,448 | | | | 440,870 | |
VA Dividend Capture Fund | | | 1,565,519 | | | | 229,042 | | | | (139,256 | ) | | | 1,773,065 | | | | 67,837 | |
VA Growth Fund | | | 7,039,619 | | | | 1,066,864 | | | | (853,623 | ) | | | 7,993,194 | | | | 28,251 | |
VA Income Equity Fund | | | 4,709,579 | | | | 856,134 | | | | (584,661 | ) | | | 5,307,578 | | | | 203,699 | |
VA International Equity Fund | | | 3,933,982 | | | | 726,311 | | | | (729,027 | ) | | | 4,460,478 | | | | 52,836 | |
VA Macro 100 Fund | | | 1,958,316 | | | | 281,448 | | | | (223,290 | ) | | | 2,220,675 | | | | 13,038 | |
VA Mid Corp America Fund | | | 1,554,602 | | | | 541,786 | | | | (814,593 | ) | | | 3,561,922 | | | | 8,971 | |
VA New Economy Fund | | | 1,749,481 | | | | 84,373 | | | | (146,433 | ) | | | — | | | | — | |
VA Situs Fund | | | 975,502 | | | | 381,214 | | | | (274,966 | ) | | | 1,341,294 | | | | — | |
VA Mortgage Securities Fund | | | 2,551,075 | | | | 524,898 | | | | (220,081 | ) | | | 2,876,808 | | | | 69,572 | |
Affiliated issuers, as defined under the Investment Company Act of 1940, are those in which a Fund’s holdings of an issuer represent 5% or more of the outstanding voting securities of the issuer. The Huntington Real Strategies Fund owns a 96% interest in Scotts Gahanna LLC. The VA Real Strategies Fund is an affiliate of the Huntington Real Strategies Fund, and together they own 100% of Scotts Gahanna LLC.
| (5) | VA Balanced Fund Structure |
The VA Balanced Fund (“Investing Fund”), in accordance with its prospectus, seeks to achieve its investment objectives by investing in other investment companies (“Underlying Funds”) with similar investment objectives. As a result, investors in the Investing Fund incur expenses of both the Investing Fund and Underlying Funds, including transaction costs related to the purchases and sales of Underlying Fund shares.
Huntington Funds
Notes to Financial Statements (continued)
December 31, 2012
| (6) | Investment Transactions |
Purchases and sales of investments, excluding short-term securities, for the year ended December 31, 2012, were as follows:
| | | | | | | | |
Fund | | Purchases | | | Sales | |
VA Balanced Fund | | $ | 7,821,144 | | | $ | 5,524,643 | |
VA Dividend Capture Fund | | | 35,918,709 | | | | 37,154,694 | |
VA Growth Fund | | | 24,353,968 | | | | 25,739,796 | |
VA Income Equity Fund | | | 41,303,739 | | | | 42,740,888 | |
VA International Equity Fund | | | 10,013,559 | | | | 6,757,859 | |
VA Macro 100 Fund | | | 3,997,692 | | | | 3,393,929 | |
VA Mid Corp America Fund* | | | 11,834,085 | | | | 6,592,678 | |
VA Real Strategies Fund | | | 1,545,268 | | | | 1,131,619 | |
VA Rotating Markets Fund | | | 7,047,775 | | | | 7,841,089 | |
VA Situs Fund | | | 7,408,495 | | | | 3,908,691 | |
VA Mortgage Securities Fund | | | 5,760,763 | | | | 5,294,178 | |
| | * | Excludes $9,155,554 and $8,197,080 purchases and sales, respectively, related to the securities held in the VA New Economy Fund prior to the merger. |
Purchases and sales of long-term U.S. government securities for the year ended December 31, 2012 were as follows:
| | | | | | | | |
Fund | | Purchases | | | Sales | |
VA Mortgage Securities Fund | | $ | 5,484,885 | | | $ | 4,962,288 | |
| (7) | Foreign Investment Risk |
Compared with investing in the United States, investing in foreign markets involves a greater degree and variety of risk. Investors in international or foreign markets may face delayed settlements, currency controls and adverse economic developments as well as higher overall transaction costs. In addition, fluctuations in the U.S. dollar’s value versus other currencies may erode or reverse gains from investments denominated in foreign currencies or widen losses. Foreign governments may expropriate assets, impose capital or currency controls, impose punitive taxes, impose limits on ownership or nationalize a company or industry. Any of these actions could have a sever effect on security prices and impair the Fund’s ability to bring its capital or income back to the U.S. Exchange rate. Fluctuations also may impair an issuer’s ability to repay U.S. dollar denominated debt, thereby increasing credit risk of such debt. Finally, the value of foreign securities may be affected by incomplete, less frequent or inaccurate financial information about their issuers, social upheavals or political actions ranging from tax code changes to government collapse. Foreign companies may also receive less coverage than U.S. companies by market analysts and financial reporting standards or regulatory requirements comparable to those applicable to U.S. companies.
The Trust participates in a short-term credit agreement (“Line of Credit”) with Citibank, N.A. (“Citi”). Under the terms of the agreement, the Trust may borrow up to $20 million. The purpose of the agreement is to meet temporary or emergency cash needs, including redemption requests that might otherwise require the untimely disposition of securities. Citi receives an annual facility fee of 0.10% on $20 million for providing the Line of Credit. Each fund in the Trust pays a pro-rata portion of this facility fee plus any interest on amounts borrowed. For the year ended December 31, 2012, the following Funds had borrowings under this Line of Credit.
| | | | | | | | | | | | | | | | | | | | |
Fund | | Average Loan
Balance | | | Weighted Average
Interest Rate | | | Number of Days
Outstanding* | | | Interest Expense
Incurred | | | Maximum Loan
Outstanding | |
VA Dividend Capture Fund | | $ | 86,605 | | | | 1.41 | % | | | 2 | | | $ | 3 | | | $ | 86,605 | |
VA Growth Fund | | | 3,178 | | | | 1.41 | % | | | 5 | | | | 2 | | | | 3,266 | |
VA International Equity Fund | | | 9,771 | | | | 1.41 | % | | | 2 | | | | 8 | | | | 9,771 | |
VA Mid Corp America Fund | | | 51,527 | | | | 1.41 | % | | | 2 | | | | 2 | | | | 51,527 | |
VA Real Strategies Fund | | | 58,062 | | | | 1.41 | % | | | 2 | | | | 2 | | | | 58,062 | |
VA Rotating Markets Fund | | | 9,943 | | | | 1.41 | % | | | 3 | | | | 2 | | | | 9,943 | |
VA Situs Fund | | | 1,096,652 | | | | 1.41 | % | | | 2 | | | | 101 | | | | 1,596,652 | |
| | * | Number of Days Outstanding represents the total days during the year ended December 31, 2012 that each Fund utilized the Line of Credit. |
As of December 31, 2012, the Funds had no outstanding borrowings under this Line of Credit.
Huntington Funds
Notes to Financial Statements (continued)
December 31, 2012
| (9) | Other Tax Information (unaudited) |
For the year ended December 31, 2012, certain dividends paid by the Funds may be subject to a maximum tax rate of 15% as provided for by the Jobs and Growth Tax Relief Reconciliation Act of 2003. The Funds intend to designate the maximum amount allowable as taxed at a maximum rate of 15%. Complete information will be reported in conjunction with your 2012 Form 1099-DIV.
For the year ended December 31, 2012, the following Funds paid qualified dividend income:
| | | | |
Fund | | Qualified
Dividend
Income | |
VA Dividend Capture Fund | | | 60.6 | % |
VA Growth Fund | | | 100.0 | % |
VA Income Equity Fund | | | 75.0 | % |
VA International Equity Fund | | | 97.4 | % |
VA Macro 100 Fund | | | 100.0 | % |
VA Mid Corp America Fund | | | 100.0 | % |
VA Real Strategies Fund | | | 100.0 | % |
VA Rotating Markets Fund | | | 100.0 | % |
VA Mortgage Securities Fund | | | 8.0 | % |
For the taxable year ended December 31, 2012, the following percentage of ordinary income dividends paid by the Funds qualify for the dividends received deduction available to corporations:
| | | | |
Fund | | Dividends
Received
Deduction | |
VA Balanced Fund | | | 50.8 | % |
VA Dividend Capture Fund | | | 100.0 | % |
VA Growth Fund | | | 100.0 | % |
VA Income Equity Fund | | | 89.6 | % |
VA International Equity Fund | | | 100.0 | % |
VA Macro 100 Fund | | | 100.0 | % |
VA Mid Corp America Fund | | | 100.0 | % |
VA Real Strategies Fund | | | 100.0 | % |
VA Rotating Markets Fund | | | 100.0 | % |
VA Mortgage Securities Fund | | | 16.4 | % |
The VA International Equity Fund intends to elect to pass through to shareholders the income tax credit for taxes paid to foreign countries. Foreign source income and foreign tax expense per outstanding shares on December 31, 2012 are as follows:
| | | | | | | | |
Fund | | Foreign
Source
Income | | | Foreign
Tax
Expense | |
VA International Equity Fund | | $ | 0.36 | | | $ | 0.04 | |
The pass-through of the foreign tax credit will only affect those persons who are shareholders on the dividend record date in December 2012. These shareholders will receive more detailed information along with their 2012, Form 1099-DIV.
Huntington Funds
Report of Independent Registered Public Accounting Firm
The Board of Trustees and Shareholders of the Huntington Funds:
We have audited the accompanying statements of assets and liabilities of the Huntington VA Balanced Fund, Huntington VA Dividend Capture Fund, Huntington VA Growth Fund, Huntington VA Income Equity Fund, Huntington VA International Equity Fund, Huntington VA Macro 100 Fund, Huntington VA Mid Corp America Fund, Huntington VA Real Strategies Fund, Huntington VA Rotating Markets Fund, Huntington VA Situs Fund, and Huntington VA Mortgage Securities Fund, (eleven of the portfolios constituting The Huntington Funds, collectively referred to as the “Funds”), including the portfolios of investments, as of December 31, 2012 and the related statements of operations for the year then ended, and the statements of changes in net assets and the financial highlights for each of the periods indicated therein. These financial statements and financial highlights are the responsibility of the Funds’ management. Our responsibility is to express an opinion on these financial statements and financial highlights based on our audits.
We conducted our audits in accordance with the standards of the Public Company Accounting Oversight Board (United States). Those standards require that we plan and perform the audits to obtain reasonable assurance about whether the financial statements and financial highlights are free of material misstatement. We were not engaged to perform an audit of the Funds’ internal control over financial reporting. Our audits included consideration of internal control over financial reporting as a basis for designing audit procedures that are appropriate in the circumstances, but not for the purpose of expressing an opinion on the effectiveness of the Funds’ internal control over financial reporting. Accordingly, we express no such opinion. An audit also includes examining, on a test basis, evidence supporting the amounts and disclosures in the financial statements and financial highlights, assessing the accounting principles used and significant estimates made by management, and evaluating the overall financial statement presentation. Our procedures included confirmation of securities owned as of December 31, 2012, by correspondence with the custodians and brokers or by other appropriate auditing procedures where replies from brokers were not received. We believe that our audits provide a reasonable basis for our opinion.
In our opinion, the financial statements and financial highlights referred to above present fairly, in all material respects, the financial position of each of the Huntington Funds referred to above at December 31, 2012, the results of their operations for the year then ended, and the changes in their net assets and the financial highlights for each of the periods indicated therein, in conformity with U.S. generally accepted accounting principles.

Columbus, Ohio
February 14, 2013
Huntington Funds
Board of Trustees and Trust Officers
The following tables give information about Independent Trustees (Trustees who are not “interested persons” of the Trust, as defined in the 1940 Act), Interested Trustees (Trustees who are “interested persons” of the Trust, as defined in the 1940 Act) and the senior officers of the Trust. Each Trustee oversees all portfolios of the Trust and serves for an indefinite term (subject to mandatory retirement provisions). Unless otherwise noted, the business address of each person listed below is 2960 North Meridian Street, Suite 300, Attention: Huntington Trust Officer, Indianapolis, IN 46208. Unless otherwise noted, each officer is elected annually. The Huntington Funds consists of 36 portfolios. Each Trustee serves as Trustee for all portfolios of The Huntington Funds. The Funds’ Statement of Additional Information includes additional information about The Huntington Funds’ Trustees and is available, without charge and upon request, by calling 1-800-253-0412.
INTERESTED TRUSTEES’ BACKGROUND
| | |
Name
Age
Positions Held with Trust
Date Service Began | | Principal Occupation(s) for Past Five Years, Previous Position(s) and Other Directorships Held |
B. Randolph Bateman* Age: 63 TRUSTEE Began Serving: February 2008 | | Principal Occupations: President and Chief Investment Officer, Huntington Asset Advisors, Inc. (May 2001 to present); Chief Investment Officer, The Huntington National Bank (October 2000 to present). Previous Positions: Senior Vice President, Star Bank (June 1988 to October 2000). Other Directorships Held: Board Member, The Huntington Strategy Shares. |
| * | B. Randolph Bateman has been deemed an Interested Trustee due to the positions he holds with The Huntington National Bank and its affiliates. |
INDEPENDENT TRUSTEES’ BACKGROUND
| | |
Name
Age
Positions Held with Trust
Date Service Began | | Principal Occupation(s) for Past Five Years, Previous Position(s) and Other Directorships Held |
David S. Schoedinger* Age: 70 CHAIRMAN OF THE BOARD AND TRUSTEE Began serving: May 1990 | | Principal Occupation: Chairman of the Board and Funeral Director, Schoedinger Funeral Service (1965 to present); CEO, Schoedinger Financial Services, Inc. (1987 to present). Other Directorships Held: Board Member, The Huntington Strategy Shares. |
Eddie R. Munson Age: 62 TRUSTEE Began serving: June 2012 | | Principal Occupation: Retired (September 2006-present). Previous Positions: Certified Public Accountant, KPMG LLP (June 1972-September 2006) Other Directorships Held: Board Member, The Huntington Strategy Shares; Board Member, Bearingpoint (2006-2008); Board Member, United American Healthcare (September 2006-June 2008); Board Member, Caraco (June 2011-December 2011). |
Tadd C. Seitz Age: 71 TRUSTEE Began serving: June 2006 | | Principal Occupation: Retired (July 1996-present); Board advisor and private investor (July 1996-present). Previous Positions: Chairman and Chief Executive Officer, The Scotts-Miracle Gro Company (June 1983-June 1996); Chief Operating Officer The Scotts Company (1982-1983); General Manager W. Atlee Burpee Company (1980-1982). Other Directorships Held: Board Member, The Huntington Strategy Shares; West Point Products, Shade Tree Systems and Cold Jet (both private companies) and Chairman of Central Benefits, a mutual insurance company. |
Huntington Funds
Board of Trustees and Trust Officers (continued)
| | |
Name
Age
Positions Held with Trust
Date Service Began | | Principal Occupation(s) for Past Five Years, Previous Position(s) and Other Directorships Held |
Mark D. Shary Age: 52 TRUSTEE Began serving: June 2006 | | Principal Occupations: Private investor (2007 to present). Previous Position: Chief Executive Officer and President, BestTransport.com, Inc. (2003 to 2007); President, Bostech Corporation (2000 to 2002). Other Directorships Held: Board Member, The Huntington Strategy Shares. |
Thomas J. Westerfield Age: 57 TRUSTEE Began serving: January 2001 | | Principal Occupation: Of Counsel, Dinsmore & Shohl LLP (law firm) (August 2005 to present). Previous Position: Of Counsel, Cors & Bassett LLC (law firm) (1993-2005). Other Directorships Held: Board Member, The Huntington Strategy Shares. |
William H. Zimmer, III Age: 59 TRUSTEE Began Serving: December 2006 | | Principal Occupation: Chief Executive Officer, Cintel Federal Credit Union (January 2011 to present). Previous Positions: Consultant, WHZIII, LLC (March 2009 to December 2010); Assistant Treasurer, Dana Holding Corp. (September 2006 to February 2009) (manufacturing); Vice President and Manager, Global Treasury Management, National City Bank (January 2004 to March 2006); Vice President, Treasury Management Operations, Provident Bank (June 2003 to January 2004); Financial Consultant (April 2001 to June 2003). Other Directorships Held: Board Member, The Huntington Strategy Shares. |
| * | David S. Schoedinger became Chairman of the Funds on April 30, 2003. |
Officers
| | |
Name
Age
Address
Positions Held with Trust
Date Service Began | | Principal Occupation(s) and Previous Positions |
Joseph L. Rezabek Age: 44 PRESIDENT Began Serving: February 2013 | | Principal Occupations: President, Huntington Asset Services, Inc. (March 2012 to present); Executive Vice President, The Huntington National Bank (March 2012 to present). Previous Positions: Managing Director, Citi (2006-2012), Chief Operating Officer, State Street Europe (1999-2006) |
R. Jeffrey Young Age: 48 CHIEF EXECUTIVE OFFICER Began Serving: February 2010 | | Principal Occupations: Senior Vice President, HASI (formerly, Unified Fund Services, Inc.) (January 2010 to present); Chairman of the Board, Valued Advisers Trust (June 2010 to present); Chief Executive Officer and President, Valued Advisers Trust (January 2010 to present); President and Chief Executive Officer, Dreman Contrarian Funds (March 2011 to present); Chief Executive Officer, The Huntington Strategy Shares (November 2010 to present). Previous Positions: Independent Chair, Valued Advisers Trust (August 2008-Janaury 2010); Managing Director, Chief Operating Officer, WealthStone (2007 to 2009); Senior Vice President, Operations, BISYS Fund Services (2006 to 2007); Senior Vice President/Vice President, Client Services, BISYS Fund Services (1994 to 2006). |
Matthew J. Miller Age: 36 VICE PRESIDENT Began Serving: February 2010 | | Principal Occupations: Vice President, Relationship Management, HASI (formerly, Unified Fund Services, Inc.) (2008 to present). Previous Position: Vice President, Transfer Agency Operations, HASI (formerly, Unified Fund Services, Inc.) (2002 to 2008). |
David R. Carson Age: 54 CHIEF COMPLIANCE OFFICER AND ANTI-MONEY LAUNDERING OFFICER Began Serving: September 2005 | | Principal Occupations: Chief Compliance Officer and Anti-Money Laundering Officer of the Huntington Funds (September 2005 to present) and the Huntington Strategy Shares (November 2010 to present). Previous Positions: Treasurer and Assistant Treasurer of The Huntington Funds, Huntington Asset Advisors, Inc. (February 2002 to February 2005); Vice President and Private Financial Capital Group Marketing Manager, The Huntington National Bank (June 2001 to September 2005); Trust Officer, Firstar Bank (October 1982 to February 2001). |
Huntington Funds
Board of Trustees and Trust Officers (continued)
| | |
Name
Age
Address
Positions Held with Trust
Date Service Began | | Principal Occupation(s) and Previous Positions |
Robert W. Silva Age: 46 TREASURER Began Serving: November 2010 | | Principal Occupation: Senior Vice President, Financial Administration, HASI; Treasurer, Dreman Contrarian Funds (March 2011 – present); Chief Financial Officer and Treasurer, Unified Series Trust (June 2011 to present); Chief Financial Officer and Treasurer, The Huntington Strategy Shares (November 2010 to present). Previous Positions: Senior Vice President, Citi Fund Services Ohio, Inc., (September 2007 to September 2010) |
Jay S. Fitton Age: 43 SECRETARY Began Serving: February 2012 | | Principal Occupations: Vice President of Legal Administration for HASI (formerly, Unified Fund Services, Inc.) (November 2011 to present). Previous Positions: Vice President and Senior Counsel, J.P. Morgan Chase (February 2007-April 2007). |
Huntington Funds
Board of Trustees’ Consideration of Investment Advisory Agreement for
The Huntington VA Funds (the “Funds”)
The Board of Trustees is responsible for determining whether to approve the Funds’ investment advisory agreements. At a meeting held on August 9, 2012, the Board, including a majority of the independent Trustees, approved the investment advisory agreements (the “Advisory Agreements”) between Huntington Asset Advisors, Inc. (the “Advisor”) and the Funds. Pursuant to the Advisory Agreements between the Advisor and the Funds, the Advisor provides advisory services to the Funds.
During the review process, the Board received assistance and advice from, and met separately with, independent legal counsel. In approving each of the Advisory Agreements, the Board, including a majority of the independent Trustees, considered many factors, among the most significant of which are: (1) the nature of the services provided to the Funds by the Advisor in relation to the advisory fees; (2) the individual performance of the Funds; (3) the Advisor’s costs and the profits realized through providing the Funds with advisory services; (4) whether the Advisor has realized or may realize economies of scale in providing services to the Funds and if these economies are shared with the Funds; and (5) a comparison of the fees and performance of comparable funds.
Nature, Extent and Quality of Services in Relation to the Advisory Fee. In considering the nature, extent and quality of the services provided by the Advisor, the Board reviewed information relating to the Advisor’s operations and personnel. Among other things, the Advisor provided descriptions of its organizational and management structure, biographical information on its supervisory and portfolio management staff on a fund-by-fund basis, and financial information. The Trustees also took into account the financial condition of the Advisor with respect to its ability to provide the services required under the Advisory Agreements. The Board determined that the nature, extent and quality of the services provided by the Advisor in relation to the advisory fees were acceptable.
Individual Performance of the Funds. The Board reviewed the Funds’ performance record and the Advisor’s management styles in relation to comparable funds and appropriate benchmarks. The Board noted that the Board reviews on a quarterly basis detailed information about the Funds’ performance. The Board also reviewed various comparative data for each of the Funds provided to them in connection with their consideration of the renewal of the Advisory Agreements, including, among other information, each Fund’s performance compared to similar funds based on information provided by Lipper Inc. (“Lipper”) for the one-, three- and five-year and since-inception periods ending April 30, 2012, as applicable, as well as each Fund’s performance compared to its benchmark index for the one-, three- and five-year, and since-inception periods ending April 30, 2012, as applicable.
Advisor’s Costs and the Profits Realized Through Providing the Funds With Advisory Services. In considering the reasonableness of the advisory fees, the Board reviewed information provided by the Advisor setting forth all revenues and other benefits, both direct and indirect, received by the Advisor and its affiliates attributable to managing each of the Funds individually, the cost of providing such services and the resulting profitability to the Advisor and its affiliates from these relationships. The Board also took into account the Advisor’s agreement to limit the total direct net annual operating expenses of the VA Balanced Fund to not more than 0.10% of its average daily net assets through April 30, 2013. The Trustees determined that the profitability of the Advisor was acceptable in relation to the nature and quality of services provided to the Funds.
Economies of Scale in Providing Services to the Funds and Whether These Economies are Shared With the Funds. The Board also considered the effect of the Funds’ growth and size on their performance and fees. The Board considered the fees under the Advisory Agreements for each Fund and possible economies of scale that may be realized as the assets of the Funds grow. The Board noted that none of the Funds was currently large enough to have realized economies of scale. However, the Board noted that the administrative fee charged to all of the Funds included fee breakpoints, which allowed the Funds to realize economies of scale as the assets of the Funds increased over time.
Comparison of the Fees and Performance of Comparable Funds. With respect to the Funds’ performance and fees, the Board considered comparisons to other mutual funds with comparable investment programs to be particularly useful, given the high degree of competition in the mutual fund business. The Board used Lipper peer group information provided by Strategic Insight, Inc. with respect to its comparable fee and performance analysis for the Funds. The Board also received information concerning fees charged by the Advisor to other accounts but did not consider that information to be as relevant in light of the differences in services provided.
Other Considerations. The Board also requests and receives substantial and detailed information about the Funds and the Advisor on a regular basis. The Advisor provides much of this information at each regular meeting of the Board and furnishes additional reports in connection with the Board’s formal review of the Advisory Agreements. The Board may also receive information between regular meetings relating to particular matters as the need arises. The Board’s evaluation of the Advisory Agreements is informed by reports covering such matters as the Advisor’s investment philosophy, personnel, and processes; operating strategies; each Fund’s short- and long-term performance (in absolute terms, both on a gross basis and net of expenses, as well as in relationship to its particular investment program and certain competitive funds and/or other benchmarks, as appropriate) and comments on reasons for performance; the Funds’ expenses (including the advisory fee itself and the overall expense structure of the Funds, both in absolute terms and relative to similar and/or competing funds, with due regard for contractual or voluntary expense limitations); the use and allocation of brokerage commissions derived from trading the Funds’ portfolio securities; the nature and extent of the advisory and other services provided to
Huntington Funds
Board of Trustees’ Consideration of Investment Advisory Agreement for
The Huntington VA Funds (the “Funds”)
the Funds by the Advisor and its affiliates; compliance and audit reports concerning the Funds (including communications from regulatory agencies), as well as the Advisor’s responses to any issues raised therein; and relevant developments in the mutual fund industry and how the Funds and the Advisor are responding to them. In the course of their deliberations regarding the Advisory Agreements, the Board also evaluated, among other things, the Advisor’s ability to supervise each of the Fund’s other service providers and their compliance programs.
The Board based its decision to approve the Advisory Agreements on the totality of the circumstances and relevant factors and with a view to past and future long-term considerations. Not all of the factors and considerations identified above are relevant to each of the Funds, nor does the Board consider any one of them to be determinative. With respect to the factors that are relevant, the Board’s decision to approve the Advisory Agreements reflects its determination that the Advisor’s performance and actions provide an acceptable basis to support the decision to continue the existing arrangements.
While attention was given to all information furnished, the following discusses the primary factors relevant to the Board’s decisions. In each case, the Board concluded that the Funds’ performance was acceptable and that the Funds’ advisory fee and total expenses, which included the administrative fee, were reasonable in light of the quality and nature of services provided by the Advisor and its affiliates.
Huntington VA Balanced Fund
Among other data considered, the Board noted that the Fund outperformed the median and average of its Lipper peer group for the one-year and since-inception periods ended April 30, 2012, and underperformed the median and average of its Lipper peer group for the three-year period ended April 30, 2012. The Board also noted that the Fund underperformed its benchmark index for the one- and three-year and since-inception periods ended April 30, 2012. The Board also considered the Fund’s advisory fee and total expenses, which included the administrative fee. The Board noted that the Fund’s advisory fee and total expenses were each below the median and average of its Lipper peer group, respectively.
Huntington VA Dividend Capture Fund
Among other data considered, the Board noted that the Fund outperformed the median and average of its Lipper peer group for the one-, three- and five-year and since-inception periods ended April 30, 2012. The Board also noted that the Fund outperformed its benchmark index for the one-, three- and five-year and since-inception periods ended April 30, 2012. The Board also considered the Fund’s advisory fee and total expenses, which included the administrative fee. The Board noted that the Fund’s advisory fee was equal to the median and below the average of its Lipper peer group and total expenses were equal to the median and below the average of its Lipper peer group.
Huntington VA Growth Fund
Among other data considered, the Board noted that the Fund underperformed the median and average of its Lipper peer group for the one-, three- and five-year and since-inception periods ended April 30, 2012. The Board also noted that the Fund underperformed its benchmark index for the one-, three- and five-year and since-inception periods ended April 30, 2012. The Board also considered the Fund’s advisory fee and total expenses, which included the administrative fee. The Board noted that the Fund’s advisory fee was below the average and median of its Lipper peer group and total expenses were above the average and median of its Lipper peer group.
Huntington VA Income Equity Fund
Among other data considered, the Board noted that the Fund outperformed the median and average of its Lipper peer group for the one- and three-year periods but underperformed the median and average of its Lipper peer group for the five-year and since-inception periods ended April 30, 2012. The Board also noted that the Fund outperformed its benchmark index for the one-, three-, and five-year periods ended April 30, 2012, and underperformed its benchmark index for the since-inception periods ended April 30, 2012. The Board also considered the Fund’s advisory fee and total expenses, which included the administrative fee. The Board noted that the Fund’s advisory fee was equal to the median and below the average of its Lipper peer group and total expenses were above the average and median of its Lipper peer group.
Huntington VA International Equity Fund
Among other data considered, the Board noted that the Fund outperformed the median and average of its Lipper peer group for the five-year and since-inception periods ended April 30, 2012, and underperformed the median and average of its Lipper peer group for
Huntington Funds
Board of Trustees’ Consideration of Investment Advisory Agreement for
The Huntington VA Funds (the “Funds”)
the one- and three-year periods ended April 30, 2012. The Board also noted that the Fund outperformed its benchmark index for the one- and five-year and since-inception periods ended April 30, 2012, and underperformed its benchmark index for the three-year period ended April 30, 2012. The Board also considered the Fund’s advisory fee and total expenses, which included the administrative fee. The Board noted that the Fund’s advisory fee was above the average and below the median of its Lipper peer group and total expenses were below the average and median of its Lipper peer group.
Huntington VA Macro 100 Fund
Among other data considered, the Board noted that the Fund underperformed the median and average of its Lipper peer group for the three- and five-year and since-inception periods ended April 30, 2012, and outperformed the median and average of its Lipper peer group for the one-year period ended April 30, 2012. The Board also noted that the Fund underperformed its benchmark index for the one-, three- and five-year and since-inception periods ended April 30, 2012. The Board also considered the Fund’s advisory fee and total expenses, which included the administrative fee. The Board noted that the Fund’s advisory fee was equal to the median and above the average of its Lipper peer group and total expenses were above the average and median of its Lipper peer group.
Huntington VA Mid Corp America Fund
Among other data considered, the Board noted that the Fund outperformed the median and average of its Lipper peer group for the one- and five-year and since-inception periods ended April 30, 2012, and underperformed the median and average of its Lipper peer group for the three-year period ended April 30, 2012. The Board also noted that the Fund underperformed its benchmark index for the one-, three- and five-year and since-inception periods ended April 30, 2012. The Board also considered the Fund’s advisory fee and total expenses, which included the administrative fee. The Board noted that the Fund’s advisory fee was below the median and average of its Lipper peer group and total expenses were below the average and above the median of its Lipper peer group.
Huntington VA Real Strategies Fund
Among other data considered, the Board noted that the Fund outperformed the median and average of its Lipper peer group for the three-year period ended April 30, 2012, and underperformed the median and average of its Lipper peer group for the one-year and since-inception periods ended April 30, 2012. The Board also noted that the Fund outperformed its benchmark index for the three-year and since-inception periods ended April 30, 2012, and underperformed its benchmark index for the one-year period ended April 30, 2012. The Board also considered the Fund’s advisory fee and total expenses, which included the administrative fee. The Board noted that the Fund’s advisory fee was below the average and median of its Lipper peer group and total expenses were equal to the median and above the average of its Lipper peer group.
Huntington VA Rotating Markets Fund
Among other data considered, the Board noted that the Fund outperformed the median and average of its Lipper peer group for the one- and three-year and since-inception periods ended April 30, 2012. The Board noted that the Fund underperformed the median and average of its Lipper peer group for the five-year period ended April 30, 2012. The Board also noted that the Fund underperformed its benchmark index for the one-, three- and five-year periods ended April 30, 2012, and outperformed its benchmark index for the since-inception period ended April 30, 2012. The Board also considered the Fund’s advisory fee and total expenses, which included the administrative fee. The Board noted that the Fund’s advisory fee and total expenses were each above the median and average of its Lipper peer group, respectively.
Huntington VA Situs Fund
Among other data considered, the Board noted that the Fund outperformed the median and average of its Lipper peer group for the one-, three- and five-year and since-inception periods ended April 30, 2012. The Board also noted that the Fund outperformed its benchmark index for the one- and three-year periods ended April 30, 2012, and underperformed its benchmark index for the five-year and since-inception periods ended April 30, 2012. The Board also considered the Fund’s advisory fee and total expenses, which included the administrative fee. The Board noted that the Fund’s advisory fee was above the median and average of its Lipper peer group and total expenses were below the average and above the median of its Lipper peer group.
Huntington VA Mortgage Securities Fund
Among other data considered, the Board noted that the Fund underperformed the median and average of its Lipper peer group for the one-, three- and five-year and since-inception periods ended April 30, 2012. The Board also noted that the Fund underperformed its
Huntington Funds
Board of Trustees’ Consideration of Investment Advisory Agreement for
The Huntington VA Funds (the “Funds”)
benchmark index for the one- and five-year and since-inception periods ended April 30, 2012, and outperformed its benchmark index for the three-year period ended April 30, 2012. The Board also considered the Fund’s advisory fee and total expenses, which included the administrative fee. The Board noted that the Fund’s advisory fee and total expenses were above the average and median of its Lipper peer group, respectively.
Huntington Funds
Supplemental Information (Unaudited)
Shareholder Expense Examples
Fund Expenses. As a shareholder of a Fund, you incur ongoing costs, including management fees and other Fund expenses. These examples are intended to help you understand your ongoing costs (in dollars) of investing in the Funds and to compare these costs with the ongoing costs of investing in other mutual funds.
These examples are based on an investment of $1,000.00 invested at the beginning of the period and held for the entire six-month period from July 1, 2012 to December 31, 2012.
Actual Expenses. The “Actual” lines of the table provide information about actual account values and actual expenses. You may use the information on this line together with the amount you invested to estimate the expense that you paid over the period. Simply divide your account value by $1,000.00 (for example, an $8,600.00 account value divided by $1,000.00 = 8.60), then multiply the result by the number in the “Actual” line under the heading entitled “Expenses Paid During Period” to estimate the expenses you paid on your account during this period.
Hypothetical Example for Comparison Purposes. The “Hypothetical” lines of the table provide information about hypothetical account values and hypothetical expenses based on the Funds’ actual expense ratios and an assumed rate of return of 5% per year before expenses, which are not the Funds’ actual returns. The hypothetical account values and expenses may not be used to estimate the actual ending account balance or expenses you paid for the period. You may use this information to compare the ongoing costs of investing in the Funds and other funds. To do so, compare the 5% hypothetical examples with the 5% hypothetical examples that appear in the shareholder reports of other funds.
Please note that the expenses shown in the table are meant to highlight your ongoing costs only and do not reflect any transactional costs, such as withdrawal charges, mortality and expense risk fees and other charges that may be assessed by participating insurance companies under the separate accounts, variable annuity contracts or variable life insurance policies. Therefore, the “Hypothetical” lines of the table are useful in comparing ongoing costs only, and will not help you determine the relative total costs of owning different funds. In addition, if these transactional costs were included, your costs would have been higher.
| | | | | | | | | | | | | | | | |
| | | Beginning
Account
Value,
July 1, 2012 | | | Ending
Account
Value,
December 31, 2012 | | | Expenses
Paid
During
Period(1) | | | Annualized
Expense
Ratio | |
VA Balanced Fund | | | | | | | | | | | | | | | | |
Actual | | $ | 1,000.00 | | | $ | 1,040.50 | | | $ | 0.52 | | | | 0.10 | % |
Hypothetical(2) | | $ | 1,000.00 | | | $ | 1,024.62 | | | $ | 0.52 | | | | 0.10 | % |
VA Dividend Capture Fund | | | | | | | | | | | | | | | | |
Actual | | $ | 1,000.00 | | | $ | 1,050.00 | | | $ | 4.92 | | | | 0.95 | % |
Hypothetical(2) | | $ | 1,000.00 | | | $ | 1,020.34 | | | $ | 4.85 | | | | 0.95 | % |
VA Growth Fund | | | | | | | | | | | | | | | | |
Actual | | $ | 1,000.00 | | | $ | 1,019.50 | | | $ | 4.98 | | | | 0.98 | % |
Hypothetical(2) | | $ | 1,000.00 | | | $ | 1,020.20 | | | $ | 4.98 | | | | 0.98 | % |
VA Income Equity Fund | | | | | | | | | | | | | | | | |
Actual | | $ | 1,000.00 | | | $ | 1,044.80 | | | $ | 5.02 | | | | 0.98 | % |
Hypothetical(2) | | $ | 1,000.00 | | | $ | 1,020.23 | | | $ | 4.96 | | | | 0.98 | % |
VA International Equity Fund | | | | | | | | | | | | | | | | |
Actual | | $ | 1,000.00 | | | $ | 1,107.00 | | | $ | 5.35 | | | | 1.01 | % |
Hypothetical(2) | | $ | 1,000.00 | | | $ | 1,020.06 | | | $ | 5.12 | | | | 1.01 | % |
VA Macro 100 Fund | | | | | | | | | | | | | | | | |
Actual | | $ | 1,000.00 | | | $ | 1,042.50 | | | $ | 5.90 | | | | 1.15 | % |
Hypothetical(2) | | $ | 1,000.00 | | | $ | 1,019.36 | | | $ | 5.83 | | | | 1.15 | % |
VA Mid Corp America Fund | | | | | | | | | | | | | | | | |
Actual | | $ | 1,000.00 | | | $ | 1,064.80 | | | $ | 5.83 | | | | 1.12 | % |
Hypothetical(2) | | $ | 1,000.00 | | | $ | 1,019.49 | | | $ | 5.71 | | | | 1.12 | % |
VA Real Strategies Fund | | | | | | | | | | | | | | | | |
Actual | | $ | 1,000.00 | | | $ | 1,040.90 | | | $ | 6.49 | | | | 1.27 | % |
Hypothetical(2) | | $ | 1,000.00 | | | $ | 1,018.77 | | | $ | 6.42 | | | | 1.27 | % |
VA Rotating Markets Fund | | | | | | | | | | | | | | | | |
Actual | | $ | 1,000.00 | | | $ | 1,021.80 | | | $ | 5.89 | | | | 1.16 | % |
Hypothetical(2) | | $ | 1,000.00 | | | $ | 1,019.31 | | | $ | 5.89 | | | | 1.16 | % |
Huntington Funds
| | | | | | | | | | | | | | | | |
| | | Beginning
Account
Value,
July 1, 2012 | | | Ending
Account
Value,
December 31, 2012 | | | Expenses
Paid
During
Period(1) | | | Annualized
Expense
Ratio | |
VA Situs Fund | | | | | | | | | | | | | | | | |
Actual | | $ | 1,000.00 | | | $ | 1,143.80 | | | $ | 5.35 | | | | 0.99 | % |
Hypothetical(2) | | $ | 1,000.00 | | | $ | 1,020.14 | | | $ | 5.04 | | | | 0.99 | % |
VA Mortgage Securities Fund | | | | | | | | | | | | | | | | |
Actual | | $ | 1,000.00 | | | $ | 1,006.40 | | | $ | 5.65 | | | | 1.12 | % |
Hypothetical(2) | | $ | 1,000.00 | | | $ | 1,019.50 | | | $ | 5.69 | | | | 1.12 | % |
| (1) | Expenses are equal to the Fund’s annualized expense ratios, multiplied by the average account value over the period, multiplied by 184/366 (to reflect the one-half year period). The annualized expense ratios reflect reimbursement of expenses by the Funds’ Adviser for the period beginning July 1, 2012 through December 31, 2012. The “Financial Highlights” tables in the Funds’ financial statements, included in the report, also show the gross expense ratios, without such reimbursements. |
| (2) | Hypothetical assumes 5% annual return before expenses. |
Variable investment options are not bank deposits or obligations, are not guaranteed by any bank, and are not insured or guaranteed by the U.S. government, the Federal Deposit Insurance Corporation, the Federal Reserve Board or any other government agency. Investment in variable investment options involves investment risk, including the possible loss of principal.
This report is authorized for distribution to prospective investors only when preceded or accompanied by the Funds’ prospectus, which contains facts concerning each Fund’s objective and policies, management fees, expenses and other information.
VOTING PROXIES ON FUND PORTFOLIO SECURITIES
A copy of the policies and procedures that the Funds use to determine how to vote proxies relating to securities held in the Funds’ portfolios, as well as a record of how the Funds voted any such proxies during the most recent 12-month period ended June 30, is available without charge and upon request by calling 1-800-253-0412 or at www.huntingtonvafunds.com. This information is also available from the EDGAR database on the SEC’s website at www.sec.gov.
QUARTERLY PORTFOLIO SCHEDULE
The Funds file with the SEC a complete schedule of their portfolio holdings, as of the first and third quarters of their fiscal year, on “Form N-Q”. These filings are available on the SEC’s website at www.sec.gov and may be reviewed and copied at the SEC’s Public Reference Room in Washington, D.C. (call 1-202-551-8090 for information on the operation of the Public Reference Room.) You may also access this information at www.huntingtonvafunds.com by selecting “Form N-Q.”
The Huntington National Bank, a subsidiary of Huntington Bancshares, Inc., is the Custodian of The Huntington Funds. Huntington Asset Services, Inc. serves as the Administrator and Fund Accountant and is affiliated with the Huntington National Bank. Additionally, Brown Brothers Harriman & Co. is the Sub-Custodian of certain of the Funds. Huntington Asset Advisors, Inc., a subsidiary of the Huntington National Bank, serves as Investment Advisor to the Funds. Unified Financial Securities, Inc. serves as the Distributor of The Huntington Funds and is affiliated with the Huntington National Bank.
CUSIP 446327165
CUSIP 446771305
CUSIP 446771206
CUSIP 446771107
CUSIP 446771800
CUSIP 446771875
CUSIP 446771503
CUSIP 446327215
CUSIP 446771701
CUSIP 446771883
CUSIP 446771867
| | |
| Huntington Shareholder Services: 800-253-0412 | | 27057 02/13 |
Item 2. Code of Ethics.
(a) As of the end of the period covered by the report, the registrant has adopted a code of ethics that applies to the registrant’s Principal Executive Officer and Principal Financial Officer.
(b) Not applicable.
(c) During the period covered by the report, with respect to the registrant’s code of ethics that applies to its Principal Executive Officer and Principal Financial Officer: there have been no amendments to a provision that relates to any element of the code of ethics definition enumerated in paragraph (b) of this Item 2.
(d) During the period covered by the report, with respect to the registrant’s code of ethics that applies to its Principal Executive Officer and Principal Financial Officer: there have been no waivers granted from a provision that relates to any element of the code of ethics definition enumerated in paragraph (b) of this Item 2.
(e) Not applicable.
(f) The registrant has included a copy of the code of ethics that applies to the registrant’s Principal Executive Officer and Principal Financial Officer. This code of ethics is included as an Exhibit on this Form N-CSR.
Item 3. Audit Committee Financial Expert.
3(a)(1) The registrant’s Board of Trustees has determined that the registrant has at least one audit committee financial expert serving on its audit committee.
3(a)(2) The audit committee financial expert is William H. Zimmer III, who is “independent” for purposes of this Item 3 of Form N-CSR.
Item 4. Principal Accountant Fees and Services.
(a) Audit Fees billed to the registrant by its principal accountants for the two most recent fiscal years:
Fiscal year ended 2012: $468,050
Fiscal year ended 2011: $480,527
(b) Audit-Related Fees billed to the registrant by its principal accountants for the two most recent fiscal years:
Fiscal year ended 2012: $26,500
Fiscal year ended 2011: $21,625
Fees for 2012 and 2011 related to the agreed-upon review of items within the Management’s Discussion of Fund Performance sections of the Funds’ Form N-CSR filing. 2011 fees also include the review of Form N-1A for 2011. Amount requiring approval of the registrant’s audit committee pursuant to paragraph (c)(7)(ii) of Rule 2-01 of Regulation S-X, $0 and $21,625 respectively.
(c) Tax Fees billed to the registrant by its principal accountants for the two most recent fiscal years:
Fiscal year ended 2012: $276,050
Fiscal year ended 2011: $212,568
Fees for 2012 and 2011 related to the review of the registrant’s tax returns. Amount requiring approval of the registrant’s audit committee pursuant to paragraph (c)(7)(ii) of Rule 2-01 of Regulation S-X, $0 and $0 respectively.
(d) All other fees billed to the registrant by its principal accountants for the two most recent fiscal years:
Fiscal year ended 2012: $0
Fiscal year ended 2011: $0
Amount requiring approval of the registrant’s audit committee pursuant to paragraph (c)(7)(ii) of Rule 2-01 of Regulation S-X, $0 and $0 respectively.
(e)(1) Audit and Non-Audit Services Pre-Approval Policies and Procedures
I. Purpose
Under the Sarbanes-Oxley Act of 2002 (the “Act”), the Audit Committee of the Board of Trustees of The Huntington Funds (the “Fund”) is responsible for the appointment, compensation and oversight of the work of the Fund’s independent auditor. As part of this responsibility, the Audit Committee is required to grant approval for audit and non-audit services performed by the independent auditor for the Fund in order assure that they do not impair the auditor’s independence from the Fund. In addition, the Audit Committee also must pre-approve its independent auditor’s engagement for non-audit services with the Fund’s investment adviser (not including a sub-adviser whose role is primarily portfolio management and is sub-contracted or overseen by another investment adviser) and any entity controlling, controlled by, or under common control with the investment adviser that provides ongoing services to the Fund, if the engagement relates directly to the operations and/or financial reporting of the Fund.
To implement these provisions of the Act, the Securities and Exchange Commission (the “SEC”) has issued rules specifying the types of services that the Fund’s independent auditor may not provide to the Fund, as well as the Audit Committee’s administration of the engagement of the independent auditor. Under these rules, the SEC has provided that a permissible approval of
audit and non-audit services can take the form of either (i) a general pre-approval, or (ii) a specific pre-approval (where a specific type of service is authorized, generally subject to a fee maximum). General pre-approvals are authorized by SEC rules only subject to detailed policies and procedures. Unless a type of service has received general pre-approval, it will require specific pre-approval by the Audit Committee if it is to be provided by the independent auditor. Accordingly, the Audit Committee has adopted these Audit and Non-Audit Services Pre-Approval Policies and Procedures, which set forth the procedures and the conditions pursuant to which services for the Fund may be performed by the independent auditor under pre-approvals.
II. General Pre-Approval Policies
It is the policy of the Audit Committee that audit and non-audit services to be performed by the Fund’s independent auditor be pre-approved only when in the best interests of the Fund’s shareholders and fully consistent with applicable law and, particularly, the maintenance of the auditor’s independence. In granting any pre-approval, consideration shall be given to:
1. the qualifications of the auditor to perform the services involved;
2. the proposed costs (which may be presented as an estimate or based on professional time charges subject to a ceiling) of the services and the reasonableness thereof;
3. the permissibility of the services under applicable rules and guidance of the SEC;
4. the effect, if any, of the performance of the proposed services on the auditor’s independence;
5. the effect of the compensation for the proposed services on the auditor’s independence; and
6. the effect, if any, of the proposed services on the Fund’s ability to manage or control risk or to improve audit quality.
In accordance with SEC rules, non-audit services performed by the Fund’s independent auditor may not include the following:
1. Bookkeeping or other services related to the accounting records or financial statements of the audit client;
2. Financial information systems design and implementation;
3. Appraisal or valuation services, fairness opinions or contribution-in-kind reports;
4. Actuarial services;
5. Internal audit outsourcing services;
6. Management functions or human resources;
7. Broker-dealer, investment adviser or investment banking services; and
8. Legal services and expert services unrelated to the audit.
III. Procedures for Pre-Approval by the Audit Committee
1. Requests for pre-approval shall be in writing and may be made by either the independent auditors or by management of the Fund.
2. All requests for pre-approval shall be made to the full Audit Committee at regularly scheduled meetings thereof (or at a special meeting of the Audit Committee set to coincide with regular meetings of the Fund’s Board of Trustees) whenever practicable.
3. Under normal circumstances, requests for pre-approval should be presented at least 7 days prior (and in no event later than 48 hours prior) to the proposed commencement of the engagement.
4. If consideration of a request for pre-approval on the dates identified in Section III (2) would not be timely, the requesting party shall notify the Chairman of the Audit Committee. The Chairman of the Audit Committee shall then determine whether to schedule a special meeting of the Audit Committee (which may be conducted telephonically) on an alternative date or whether the request may appropriately be presented to a delegate of the Audit Committee under procedures set forth in Section IV below.
5. Requests for pre-approval may include, but are not limited to, the following services:
a. audit engagement, particularly for interim periods;
b. tax compliance, tax planning, and tax advice;
c. review and consents with respect to use of reports in post-effective amendments to the registration statements of the Fund;
d. review of IRS shareholder materials;
e. review and validation of fund procedures (e.g., valuation, interfund lending, etc.), and
f. market research and strategic insights.
6. Requests for pre-approval should identify the nature of the services to be provided in a manner sufficiently specific to allow evaluation of the considerations identified above in Section II.
In accordance with PCAOB Rule 3524, requests for pre-approval of permissible tax services by the independent auditor must have the following items described in writing for the audit committee:
a. the scope of the proposed tax service,
b. the fee structure for the engagement,
c. any side letters, amendments to the engagement letter or any other agreements, whether oral, written, or otherwise, relating to the service between the audit firm and the Funds, and
d. any compensation arrangements or other agreements between the audit firm and any third party with respect to promoting, marketing, or recommending a transaction covered by the proposed tax service.
The audit firm should discuss with the Audit Committee, the potential effect of the proposed tax service(s) on the audit firm’s independence.
7. Requests for pre-approval must include an assessment by the independent auditor of its independence should the request be granted and the proposed services rendered.
8. The Audit Committee’s action on a request for pre-approval shall be recorded in the Audit Committee’s minutes.
9. The Audit Committee’s action on a request for pre-approval shall be communicated in writing to the independent auditor and, under normal circumstances, a copy of this communication shall be provided to the Fund’s management.
10. The Audit Committee’s action on a request for pre-approval shall be reported to the full Board of Trustees.
11. Pre-approvals will be granted for a period of no more than one year.
IV. Procedures for Pre-Approval by a Delegate of the Audit Committee
1. Where it has been determined by the Chairman of the Audit Committee that consideration of a request for pre-approval by the full Audit Committee would not be timely, the Chairman may determine that the request be presented to a member(s) of the Audit Committee appointed by the Audit Committee as its delegate (the “Delegate”) for this purpose. (As of the date of the adoption of these guidelines and procedures, the Chairman of the Audit Committee has been so appointed, and such appointment may be revoked or modified by the Audit Committee at any time.)
2. Requests for pre-approval shall be in writing and may be made by either the independent auditors or by management of the Fund.
3. Under normal circumstances, requests for pre-approval should be presented at least 7 days prior (and in no event later than 48 hours prior) to the proposed commencement of the engagement.
4. Requests for pre-approval may include, but are not limited to, the following services:
a. audit engagement, particularly for interim periods;
b. tax compliance, tax planning, and tax advice;
c. review and consents with respect to use of reports in post-effective amendments to the registration statements of the Fund;
d. review of IRS shareholder materials;
e. review and validation of fund procedures (e.g., valuation, interfund lending, etc.); and
f. market research and strategic insights.
5. Requests for pre-approval should identify the nature of the services to be provided in a manner sufficiently specific to allow evaluation of the considerations identified above in Section II.
6. Requests for pre-approval must include an assessment by the independent auditor of its independence should the request be granted and the proposed services rendered.
7. The Delegate’s action on a request for pre-approval shall be communicated in writing to the independent auditor, with a copy to each other member of the Audit Committee and, under normal circumstances, to the Fund’s management.
8. Pre-approvals by the Delegate shall be reviewed by the Audit Committee at a meeting held no later than the next scheduled meeting of the Board of Trustees or the Audit Committee, whichever occurs sooner. An earlier review shall be conducted upon the written request of one or more Audit Committee members addressed to the Chairman of the Audit Committee.
9. Pre-approvals by the Delegate may be modified or revoked by the Audit Committee, but will not absolve the Fund of its responsibility to compensate the independent auditor for services rendered prior to such modification or revocation.
10. The results of the Audit Committee’s review of the Delegate’s action on a request for pre-approval shall be recorded in the Audit Committee’s minutes and reported to the full Board of Trustees.
11. Pre-approvals will be granted by the Delegate for a period of no more than one year.
V. Procedures for Monitoring Engagements Authorized Under Pre-Approval Procedures
The independent auditor shall inform the Audit Committee in writing upon the commencement of services rendered under a pre-approval. The independent auditor shall thereafter provide the Audit Committee with written quarterly progress reports within one month of the close of each calendar quarter detailing the work done and fees and other charges incurred during said calendar quarter. Should fees and expenses exceed those specified in a pre-approval (or appear likely to do so prior to completion of the work), the independent auditor or management shall so apprise the Audit Committee and an additional express approval or pre-approval must be obtained.
VI. Amendment
These Policies and Procedures may be amended or revoked at any time by the Audit Committee and shall be reviewed at least annually in conjunction with review of the Audit Committee Charter.
Adopted May 4, 2006 and revised February 14, 2007 and October 23, 2007
(e)(2) Percentage of services described in each of paragraphs (b) through (d) of this Item that were approved by the audit committee pursuant to paragraph (C)(7)(i)(C) of Rule 2-01 of Regulation S-X.
Fiscal year ended 2012 - 0%
Fiscal year ended 2011 - 0%
Percentage of services provided to the registrant’s investment adviser and any entity controlling, controlled by, or under common control with the investment adviser that provides ongoing services to the registrant that were approved by the registrant’s audit committee pursuant to paragraph (C)(7)(i)(C) of Rule 2-01 of Regulation S-X, 0% and 0% respectively.
(f) Not applicable.
(g) The aggregate non-audit fees billed by Ernst and Young LLP for the Funds and certain entities (including the adviser (excluding sub-adviser) and any entity controlling, controlled by or under common control with the advisor that provides ongoing services to the registrant (Funds)), totaled $260,550 and $212,568 in 2012 and 2011, respectively, which includes the Funds’ tax fees above in Section I and tax fees for Huntington’s Trust Department related to settlement funds where Huntington National Bank is the executor.
(h) The registrant’s Audit Committee has considered whether the provision of non audit services that were rendered to registrant’s investment adviser (not including any sub adviser whose role is primarily portfolio management and is subcontracted with or overseen by another investment adviser), and any entity controlling, controlled by, or under common control with the investment adviser that provide ongoing services to the registrant that were not pre-approved pursuant to paragraph (c)(7)(ii) of Rule 2-01 of Regulation S-X is compatible with maintaining the principal account’s independence.
Item 5. Audit Committee of Listed Registrants.
Not applicable.
Item 6. Schedule of Investments.
(a) Not applicable.
(b) Not applicable.
Item 7. Disclosure of Proxy Voting Policies and Procedures for Closed-End Management Investment Companies.
Not applicable.
Item 8. Portfolio Managers of Closed-End Management Investment Companies.
Not applicable.
Item 9. Purchases of Equity Securities by Closed-End Management Investment Company and Affiliated Purchasers.
Not applicable.
Item 10. Submission of Matters to a Vote of Security Holders.
Not applicable.
Item 11. Controls and Procedures.
(a) The registrant’s Principal Executive Officer and Principal Financial Officer have concluded that the registrant’s disclosure controls and procedures (as defined in Rule 30a-3(c) under the Act) are effective in design and operation and are sufficient to form the basis of the certifications required by Rule 30a-2 under the Act, based on their evaluation of these disclosure controls and procedures within 90 days of the filing of this report on Form N-CSR.
(b) There were no changes in the registrant’s internal control over financial reporting (as defined in Rule 30a-3(d) under the Act (17 CFR 270.30a-3(d)) that occurred during the second fiscal quarter of the period covered by this report that have materially affected or are reasonably likely to materially affect, the registrant’s internal control over financial reporting.
Item 12. Exhibits.
(a)(1) The code of ethics that is the subject of the disclosure required by Item 2 is attached hereto.
(a)(2) Certifications pursuant to Rule 30a-2(a) are attached hereto.
(a)(3) Not applicable.
(b) Certifications pursuant to Rule 30a-2(b) are furnished herewith.
SIGNATURES
Pursuant to the requirements of the Securities Exchange Act of 1934 and the Investment Company Act of 1940, the registrant has duly caused this report to be signed on its behalf by the undersigned, thereunto duly authorized.
(Registrant) The Huntington Funds
| | | | |
| By (Signature and Title)* | | /s/ R. Jeffrey Young | | |
| | R. Jeffrey Young, Chief Executive Officer and Principal Executive Officer | | |
Date 3/1/2013
Pursuant to the requirements of the Securities Exchange Act of 1934 and the Investment Company Act of 1940, this report has been signed below by the following persons on behalf of the registrant and in the capacities and on the dates indicated.
| | | | |
| By (Signature and Title)* | | /s/ R. Jeffrey Young | | |
| | R. Jeffrey Young, Chief Executive Officer and Principal Executive Officer | | |
Date 3/1/2013
| | | | |
| By (Signature and Title)* | | /s/ Robert Silva | | |
| | Robert Silva, Treasurer and Principal Financial Officer | | |
Date 3/1/2013