UNITED STATES
SECURITIES AND EXCHANGE COMMISSION
Washington, D.C. 20549
FORM N-CSR
CERTIFIED SHAREHOLDER REPORT OF REGISTERED
MANAGEMENT INVESTMENT COMPANIES
Investment Company Act file number 811-05010
THE HUNTINGTON FUNDS
(Exact name of registrant as specified in charter)
2960 North Meridian Street, Suite 300
Attn: Huntington Funds Officer
Indianapolis, IN 46208
(Address of principal executive offices) (Zip code)
Martin R. Dean
The Huntington National Bank
37 West Broad Street, 6th Floor
Columbus, OH 43215
(Name and address of agent for service)
Copies to:
David C. Mahaffey, Esq.
Sullivan & Worcester
1666 K Street, N.W.
Washington, DC 20006
Registrant’s telephone number, including area code: 1-800-253-0412
Date of fiscal year end: October 31
Date of reporting period: October 31, 2013
Item 1. Reports to Stockholders.

A Message from the
Chief Investment Officer and
Annual Shareholder Report
OCTOBER 31, 2013
CLASS A SHARES
CLASS C SHARES
TRUST SHARES
Message from the Chief Investment Officer
Dear Shareholder:
Despite a raft of economic, political, earnings, international and market concerns during 2012 and into 2013, many of the equity markets produced attractive returns for the year ended October 31, 2013. Buoyed by a continuation of Federal Reserve (Fed) bond buying programs and global central banks providing excess liquidity, investors were encouraged by the flood of capital provided to the economic system. Small and middle capitalized companies led the performance derby with returns of 39.08% and 33.48%, as measured by the Standard and Poor’s SmallCap 600 Index1 and Standard and Poor’s MidCap 400 Index2 respectively, for the year ended October 31, 2013. The large caps, as represented by the Dow Jones Industrial Average3 and the Standard & Poor’s 500 Index4, were also up 21.81% and 27.15%, respectively.
The most significant investment event during this past year was certainly the Presidential election in November 2012. Virtually all investment strategies were based upon who would win the White House. With diametrically opposed views on taxes and economic stimulus, the two candidates were deadlocked up until the day of the election. Huntington Asset Advisors, Inc. (the “Adviser”) developed two separate strategies based upon the eventual outcome. We believed that certain sectors would perform differently under the policies of the two candidates. Upon confirmation of the election, the Adviser moved quickly in all Huntington Funds to implement our predetermined strategy. This included reducing betas and emphasizing certain industries that would be favored under the Obama administration. Expectations regarding the changes in tax policies associated with capital gains and dividends that had been espoused by Obama ultimately were muted in the fiscal cliff negotiations. This carried positive momentum for investors into 2013.
One of the longer-term strategies that the Adviser employed during the year was to emphasize the agribusiness sector. With back-to-back strong years in farm income and dramatically growing international demand for food, our analysts looked into a variety of avenues to uncover opportunities. The traditional approach would be to invest in farm equipment, fertilizers and seed companies. We looked deeper into the periphery of agribusiness that included investments in rural retail establishments, irrigation and flow control devices, transportation equipment and catalog companies that cater to outdoor life. We firmly believe that this strategy has longer-term positive investment implications that can be implemented irrespective of Fed policy, economic issues and regulatory initiatives.
Interest rates remained at a very low range due to Fed monetary policy. While this policy was good for the nation to help stimulate exports and domestic consumption, it had extremely negative implications for investors that wanted income from their investment dollars. Within the Adviser’s top-down investment philosophy, there is a strong focus on the recognition of trends in the markets, demographics and economy. As we developed our investment strategies relative to this macro environment, we perceived a need for non-fixed income producers. Investors’ desire to replace their dwindling bond income with more robust equity-based strategies have favored the Huntington Income Generation Fund and the Huntington World Income Fund. Both Funds have helped shareholders to replace their traditional income sources with the potential for high current income and with hedged volatility.
Looking into 2014, there are two major pieces of legislation that will start to have significant implications for the economy and the financial markets. With the drafting of Dodd-Frank provisions and the institution of the new healthcare laws, there will be additional costs and regulations impacting critical aspects of the economy. Just as the passage of Sarbanes-Oxley created ripples in the markets ten years ago, the banking and healthcare bills will need to be sorted out by investors. We believe that one accompaniment of the Dodd-Frank legislation will be an increase in merger and acquisition activities as smaller financial firms seek to cover costs by adding economies of scale. This would be consistent with the experience of Sarbanes-Oxley as many firms merged, went private or sold out. The year following the passage of Sarbances-Oxley, there were fewer publically traded companies than the year before, as many firms merged with significant premiums to previous valuations. This could be an interesting opportunity for 2014 strategies, if past is prologue.
As the Adviser to the Huntington Funds, we are focused on increasing shareholder value, improving competitive advantages, and addressing changing industry trends. We conduct our efforts with the highest level of attention to the investment disciplines we have employed for several decades, with the goal of controlling risk. We believe there are four key investor needs that will be increasing in demand: strategic income, protection against impending inflation, managing volatility, and capital appreciation. Please take a moment to review the following October 31, 2013 Annual
Message from the Chief Investment Officer
Message from the Chief Investment Officer (Continued)
Report. We believe these two Huntington Funds—Huntington Income Generation Fund and Huntington World Income Fund—will continue to provide you with strategic income opportunities as we head into 2014.
Sincerely,

B. Randolph Bateman, CFA
President
Huntington Asset Advisors, Inc.
| (1) | The Standard & Poor’s SmallCap 600 Index is a capitalization-weighted index which generally represents all major industries in the small cap range of the U.S. stock market. The index is unmanaged and, unlike the Fund, is not affected by cashflows. It is not possible to invest directly in an index. |
| (2) | The Standard & Poor’s MidCap 400 Index is a capitalization-weighted index of common stocks representing the mid-range sector of the U.S. stock market. The index is unmanaged and, unlike the Fund, is not affected by cashflows. It is not possible to invest directly in an index. |
| (3) | The Dow Jones Industrial Average is a price-weighted average of 30 significant stocks traded on the New York Stock Exchange and Nasdaq. |
| (4) | The Standard & Poor’s 500 Index is a capitalization-weighted index comprised of 500 stocks and is designed to measure performance of the broad domestic economy through changes in the aggregate market value of 500 stocks representing all major industries. The index is unmanaged and, unlike the Fund, is not affected by cashflows. It is not possible to invest directly in an index. |
This commentary may include statements that constitute “forward-looking statements” under the U.S. securities laws. Forward-looking statements include, among other things, projections, estimates, and information about possible or future results related to the Funds, market or regulatory developments. The views expressed above are not guarantees of future performance or economic results and involve certain risks, uncertainties and assumptions that could cause actual outcomes and results to differ materially from the views expressed herein. The views expressed above are those of the Adviser as of October 31, 2013 and are subject to change at any time based upon economic, market, or other conditions and the Adviser undertakes no obligation to update the views expressed herein. Any discussions of specific securities should not be considered a recommendation to buy or sell those securities. The views expressed above (including any forward-looking statement) may not be relied upon as investment advice or as an indication of the Funds’ trading intent. Information about the Funds’ holdings, asset allocation or country diversification is historical and is not an indication of future Funds’ composition, which may vary.
The performance of any index mentioned in this commentary has not been adjusted for ongoing management, distribution and operating expenses, and sales charges applicable to mutual fund investments. In addition, the returns do not reflect additional fees charged by separate accounts or variable insurance contracts that an investor in the Funds may pay. If these additional fees were reflected, performance would have been lower.
This material represents the manager’s assessment of the Funds and market environment at a specific point in time and should not be relied upon by the reader as research, tax or investment advice.
The Adviser does not provide tax advice. Please note that i) any discussion of U.S. tax matters contained in this communication cannot be used by you for the purpose of avoiding tax penalties; ii) this communication was written to support the promotion or marketing of the matters addressed herein; and iii) you should seek advice based on your particular circumstances from an independent tax advisor.
Message from the Chief Investment Officer
Annual Shareholder Report
Huntington World Income Fund
Huntington Income Generation Fund
| | |
Huntington World Income Fund | | As of 10/31/2013 |
Management’s Discussion of Fund Performance
Portfolio Manager:
Chip Hendon, MBA,
Senior Portfolio Manager
Huntington Asset Advisors, Inc.
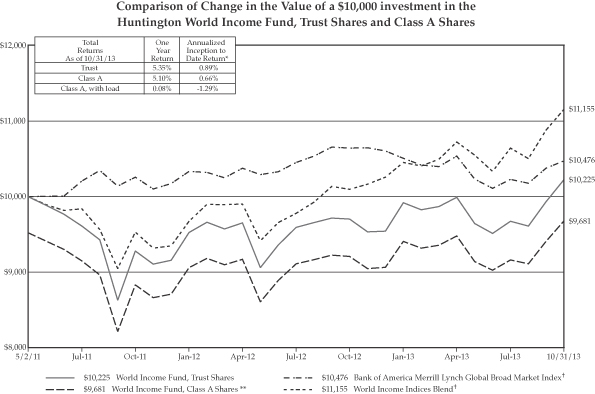
For the fiscal year ended October 31, 2013, the Huntington World Income Fund’s (“Fund”) Trust Shares and Class A Shares produced total returns (not including the deduction of applicable sales charges) of 5.35% and 5.10%, respectively, based on net asset value. This performance was higher than the total return of -1.57% for the Fund’s primary benchmark, the Bank of America Merrill Lynch Global Broad Market Index1 for the same period. However, since the World Income Fund has both equity and fixed income exposure in its portfolio and the primary benchmark does not reflect investments in equity securities, the Fund’s performance is also compared to the World Income Indices Blend1. This is a custom blended index reflecting the performance of two benchmarks, the MSCI AC World Index1 (“MSCI ACWI”), which focuses on international equities, and the Bank of America Merrill Lynch Global Broad Market Index, which incorporates international bonds. This custom blended index produced a return of 10.86% for the same period.
The Fund is managed using our top-down style and portfolio construction techniques which are aimed at producing a high level of income and low volatility through the use of high dividend-paying domestic and foreign stocks, and preferred stocks. Foreign and domestic debt option hedges are also utilized to help mitigate the potential for loss and smooth out performance.
The Fund concluded its second full fiscal year on October 31, 2013. Over the last year, the Fund participated in both the up and down cycles of the markets. Following the November 2012 Presidential election, there were fears that the new tax laws on income-producing products would have an adverse effect on investors. As a result, we saw a selloff in the main components of the Fund. However, once the realization that income-oriented vehicles would not be as negatively impacted as originally thought, we saw a rally in the Fund that lasted through April. In April and May of 2013, interest rates rose unexpectedly as the Federal Reserve (Fed) hinted that quantitative easing would be coming to an end, again negatively impacting income-oriented stocks and bonds. Then, in June through the end of the fiscal year, interest rates stabilized and the equity markets continued to make new highs. Since that time, the Fund has rallied back to finish the year strong and delivered a positive return for investors.
The Fund is focused on income and invests in Master Limited Partnerships (“MLPs”)2, Canadian Royalty Trusts, preferred stocks and foreign and domestic bonds. The Fund also utilizes options and hedging techniques to try to mitigate the volatility and lower risk. For the fiscal year ended October 31, 2013, the options in the portfolio subtracted -4.79% of incremental return. Going into 2014, the focus will be on the Fed, under Janet Yellen’s leadership, ending quantitative easing and potentially raising interest rates sometime during the year. We will continue to focus on income as our first priority, but also intend to continue to utilize options to lower volatility as we did in 2013 when the volatility of the Fund decreased significantly.
| (1) | The Bank of America Merrill Lynch Global Broad Market Index tracks the performance of investment grade debt publicly issued in the major domestic and Eurobond markets, including sovereign, quasi-government, corporate, securitized and collateralized securities. The World Income Indices Blend is a custom blended index comprised of the following two indices with their noted respective weightings: MSCI ACWI (50%) and Bank of America Merrill Lynch Global Broad Market Index (50%). MSCI ACWI is a free float-adjusted market capitalization weighted index that is designed to measure the equity market performance of developed and emerging markets. The MSCI ACWI consists of 45 country indices comprising 24 developed and 21 emerging market country indices. This custom blended index and its respective weightings are reflective of the Fund’s sector diversification. Indices are unmanaged and, unlike the Fund, are not affected by cash flows. It is not possible to invest directly in an index. |
| (2) | Funds that invest in MLPs may have additional expense, as some MLPs pay incentive distribution fees to their general partners. |
| | Investments in international markets present special risks including currency fluctuation, the potential for diplomatic and political instability, regulatory and liquidity risks, foreign taxation and differences in auditing and other financial standards. Risks of foreign investing are generally intensified for investments in emerging markets. |
| | Bonds are affected by a number of risks, including fluctuations in interest rates, credit risks, and prepayment risk. In general, as prevailing interest rates rise, fixed income securities prices will fall. Bonds face credit risk if a decline in an issuer’s credit rating or credit worthiness, causes a bond’s price to decline. High yield bonds are subject to additional risks such as increased risk of default and greater volatility because of lower credit quality of the issues. |
Annual Shareholder Report
1
Huntington World Income Fund (Continued)
The Fund’s past performance does not guarantee future results. The investment return and principal value of an investment in the Fund will fluctuate so that an investor’s shares, when redeemed, may be worth more or less than their original cost. Current performance of the Fund may be lower or higher than the performance quoted. Performance data current ot the most recent month end or after-tax returns may be obtained by calling 1-800-253-0412. Returns shown do not reflect the deduction of taxes that a shareholder would pay on Fund distributions or the redemption of Fund shares. Mutual funds are not obligations of or guaranteed by any bank and are not federally insured. Total returns, at load, include the 4.75% maximum sales charge for the Class A shares.
| | | | |
| Class | | Expense Ratios | |
A | | | 1.35% | |
Trust | | | 1.10% | |
The above expense ratios are from the Fund’s prospectus dated February 28, 2013. Additional information pertaining to the Fund’s expense ratio as of October 31, 2013 can be found in the financial highlights.
The Fund and its benchmarks performance assumes the reinvestment of all dividends and distributions.
The Fund is distributed by Unified Financial Securities, Inc. (Member FINRA), a wholly-owned subsidiary of Huntington Bancshares, Inc. and an affiliate of Huntington Asset Advisors, Inc., the adviser of the Huntington Funds.
| * | The Fund commenced operations for all share classes on May 2, 2011. |
| ** | Represents a hypothetical investment of $10,000 in the Fund after deducting the maximum sales load of 4.75% ($10,000 investment minus $475 sales load = $9,525). |
| + | The Bank of America Merrill Lynch Global Broad Market Index and World Income Indices Blend are not adjusted to reflect sales charges, expenses, or other fees that the Securities and Exchange Commission requires to be reflected in the Fund’s performance. The indices are unmanaged and, unlike the Fund, are not affected by cash flows. It is not possible to invest directly in an index. |
Annual Shareholder Report
2
| | |
Huntington Income Generation Fund | | As of 10/31/2013 |
Management’s Discussion of Fund Performance
Portfolio Manager:
Randy Bateman, CIO,
Senior Portfolio Manager
Huntington Asset Advisors, Inc.
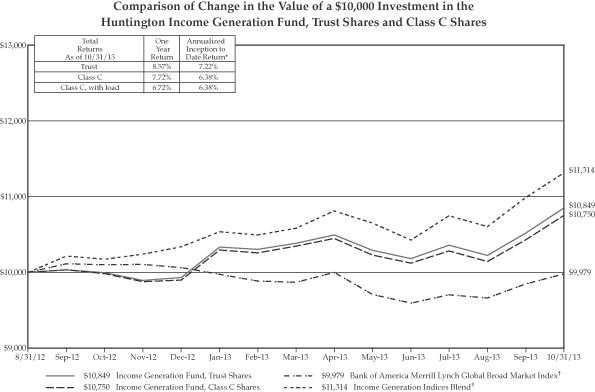
For the fiscal year ended October 31, 2013, the Huntington Income Generation Fund’s (“Fund”) Trust Shares and Class C Shares produced total returns (not including the deduction of applicable sales charges) of 8.57% and 7.72%, respectively, based on net asset value. This performance was significantly greater than the total return of -1.57% for the Fund’s primary benchmark, the Bank of America Merrill Lynch Global Broad Market Index1 for the same period. However, since the Fund has both equity and fixed income exposure in its portfolio and the primary benchmark does not reflect investments in equity securities, the Fund’s performance is also compared to the Income Generation Indices Blend1. This is a custom blended index reflecting the performance of two benchmarks, the MSCI AC World Index1 (“MSCI ACWI”), which focuses on international equities, and the Bank of America Merrill Lynch Global Broad Market Index1, which incorporates international bonds. This custom blended index produced a return of 10.86% for the same period due to the strong equity performance in the world’s stock markets.
The Fund is managed using our top-down style and portfolio construction techniques which are aimed at producing a high level of income and low volatility through the use of high dividend-paying domestic and foreign stocks, Master Limited Partnerships, Real Estate Investment Trusts (“REITs”)2 and preferred stocks. Foreign and domestic debt option hedges are also utilized to help mitigate the potential for loss and smooth out performance. These strategies are all incorporated within the Huntington World Income Fund, Huntington Dividend Capture Fund and Huntington Income Equity Fund, which are underlying investments of the Fund that are tactically allocated to produce the Income Generation Fund.
The Fund concluded its first fiscal year on October 31, 2013. Over the last year, the Fund faced significant market volatility as investors assessed the pending U.S. election. From its outset, the Fund has focused on income and has been fully invested. The Fund will typically hold a predominance of its assets in the World Income Fund, to assist in the generation of income, and in combination with other Funds, to potentially add both income as well as a hedge against the volatile markets in both stocks and fixed income investments. The Fund’s prospectus now allows for the inclusion of the Huntington Disciplined Equity Fund to add a level of incremental safety and lower volatility.
| (1) | The Bank of America Merrill Lynch Global Broad Market Index tracks the performance of investment grade debt publicly issued in the major domestic and Eurobond markets, including sovereign, quasi-government, corporate, securitized and collateralized securities. The Income Generation Indices Blend is a custom blended index comprised of the following two indices with their noted respective weightings: MSCI ACWI (50%) and Bank of America Merrill Lynch Global Broad Market Index (50%). MSCI ACWI is a free float-adjusted market capitalization weighted index that is designed to measure the equity market performance of developed and emerging markets. The MSCI ACWI consists of 45 country indices comprising 24 developed and 21 emerging market country indices. This custom blended index and its respective weightings are reflective of the Fund’s sector diversification. Indices are unmanaged and, unlike the Fund, are not affected by cash flows. It is not possible to invest directly in an index. |
| (2) | Investments in REITs and real-estate related securities involve special risks associated with an investment in real estate, such as limited liquidity and interest rate risks and may be more volatile than other securities. In addition, the value of REITs and other real estate-related investments is sensitive to changes in real estate values, extended vacancies of properties and other environmental and economic factors. |
Annual Shareholder Report
3
Huntington Income Generation Fund (Continued)
The Fund’s past performance does not guarantee future results. The investment return and principal value of an investment in the Fund will fluctuate so that an investor’s shares, when redeemed, may be worth more or less than their original cost. Current performance of the Fund may be lower or higher than the performance quoted. Performance data current ot the most recent month end and after-tax returns may be obtained by calling 1-800-253-0412. Returns shown do not reflect the deduction of taxes that a shareholder would pay on Fund distributions or the redemption of Fund shares. Mutual funds are not obligations of or guaranteed by any bank and are not federally insured. Total returns, at load, include the 1.00% maximum deferred sales charge for the Class C shares.
| | | | |
| Class | | Expense Ratios | |
C | | | 1.99% | |
Trust | | | 1.24% | |
The above expense ratios are from the Fund’s prospectus dated February 28, 2013. Additional information pertaining to the Fund’s expense ratio as of October 31, 2013 can be found in the financial highlights.
The Fund and its benchmarks performance assumes the reinvestment of all dividends and distributions.
The Fund is distributed by Unified Financial Securities, Inc. (Member FINRA), a wholly-owned subsidiary of Huntington Bancshares, Inc. and an affiliate of Huntington Asset Advisors, Inc., the adviser of the Huntington Funds.
| * | The Fund commenced operations for all share classes on August 31, 2012. |
| + | The Bank of America Merrill Lynch Global Broad Market Index and Income Generation Indices Blend are not adjusted to reflect sales charges, expenses, or other fees that the Securities and Exchange Commission requires to be reflected in the Fund’s performance. The indices are unmanaged and, unlike the Fund, are not affected by cash flows. It is not possible to invest directly in an index. |
Annual Shareholder Report
4
| | |
| | |
| Huntington World Income Fund | | October 31, 2013 |
| | |
| Portfolio of Investments Summary Table | | (unaudited) |
| | | | |
| Asset Allocation | | Percentage of Market Value | |
Common Stocks | | | 59.9% | |
Short-Term Securities Held as Collateral for Securities Lending | | | 16.4% | |
Preferred Stocks | | | 11.2% | |
Corporate Bonds | | | 4.3% | |
Foreign Government Bonds | | | 3.3% | |
Cash1 | | | 2.6% | |
Options Purchased | | | 1.5% | |
Closed-End Funds | | | 0.8% | |
Total | | | 100.0% | |
| 1 | Investments in an affliated money market fund. |
Portfolio holdings and allocations are subject to change. As of October 31, 2013, percentages in the table above are based on total investments. Such total investments may differ from the percentage set forth below in the Portfolio of Investments which are computed using the Fund’s net assets.
The Portfolio of Investments are broken down by sectors, and these sectors do no represent industry categories for purposes of identifying “industy concentration” as described in the Investment Company Act of 1940, as amended.
Portfolio of Investments
| | | | | | | | | | |
| Shares | | | | | Value | | | |
| | | | | | | | | | |
| Common Stocks — 71.4% | | | | | | |
| Australia — 1.0% | | | | | | |
| Financials — 1.0% | | | | | | |
| | 10,000 | | | National Australia Bank Ltd. | | $ | 333,727 | | | |
| Bermuda — 0.9% | | | | | | |
| Energy — 0.9% | | | | | | |
| | 9,500 | | | Golar LNG Partners LP | | | 293,930 | | | |
| Brazil — 1.1% | | | | | | |
| Telecommunication Services — 1.1% | | | | | | |
| | 16,000 | | | Telefonica Brasil SA ADR | | | 354,880 | | | |
| Canada — 10.3% | | | | | | |
| Energy — 4.5% | | | | | | |
| | 11,000 | | | Crescent Point Energy Corp. | | | 427,163 | | | |
| | 20,000 | | | Freehold Royalties Ltd. | | | 455,178 | | | |
| | 17,212 | | | Pembina Pipeline Corp. (a) | | | 564,554 | | | |
| | | | | | | | 1,446,895 | | | |
| Financials — 1.2% | | | | | | |
| | 4,700 | | | Canadian Imperial Bank of Commerce | | | 400,205 | | | |
| Industrials — 2.5% | | | | | | |
| | 13,000 | | | Norbord, Inc. | | | 370,370 | | | |
| | 70,000 | | | Student Transportation, Inc. (a) | | | 441,700 | | | |
| | | | | | | | 812,070 | | | |
| Real Estate Investment Trusts — 0.8% | | | | | | |
| | 9,400 | | | Dundee Real Estate Investment Trust, Class A | | | 260,633 | | | |
| Telecommunication Services — 1.3% | | | | | | |
| | 9,800 | | | BCE, Inc. ADR | | | 426,594 | | | |
| | | | | | | | 3,346,397 | | | |
| | | | | | | | | | |
| Shares | | | | | Value | | | |
| | | | | | | | | | |
| Common Stocks — (Continued) | | | | | | |
| France — 3.1% | | | | | | |
| Industrials — 1.5% | | | | | | |
| | 12,000 | | | Bouygues SA (a) | | $ | 469,052 | | | |
| Utilities — 1.6% | | | | | | |
| | 31,000 | | | Veolia Environnement SA ADR | | | 533,510 | | | |
| | | | | | | | 1,002,562 | | | |
| Germany — 1.0% | | | | | | |
| Telecommunication Services — 1.0% | | | | | | |
| | 42,700 | | | Telefonica Deutschland | | | 336,765 | | | |
| Italy — 0.3% | | | | | | |
| Energy — 0.3% | | | | | | |
| | 2,100 | | | Eni SpA ADR (a) | | | 106,680 | | | |
| Netherlands — 3.5% | | | | | | |
| Energy — 0.9% | | | | | | |
| | 4,400 | | | Royal Dutch Shell PLC ADR | | | 305,888 | | | |
| Real Estate Investment Trusts — 1.2% | | | | | | |
| | 4,900 | | | Wereldhave NV | | | 381,396 | | | |
| Telecommunication Services — 1.4% | | | | | | |
| | 32,700 | | | VimpelCom Ltd. ADR | | | 470,553 | | | |
| | | | | | | | 1,157,837 | | | |
| New Zealand — 1.5% | | | | | | |
| Telecommunication Services — 1.5% | | | | | | |
| | 50,000 | | | Telecom Corp. of New Zealand Ltd. ADR | | | 480,000 | | | |
| Norway — 1.1% | | | | | | |
| Energy — 1.1% | | | | | | |
| | 21,000 | | | Ship Finance International Ltd. (a) | | | 347,550 | | | |
(See notes which are an integral part of the Financial Statements)
Annual Shareholder Report
5
| | |
| Huntington World Income Fund | | (Continued) |
| | | | | | | | | | |
| Shares | | | | | Value | | | |
| | | | | | | | | | |
| Common Stocks — (Continued) | | | | | | |
| Russian Federation — 1.2% | | | | | | |
| Consumer Discretionary — 1.2% | | | | | | |
| | 30,000 | | | CTC Media, Inc. | | $ | 379,200 | | | |
| South Africa — 1.3% | | | | | | |
| Consumer Discretionary — 1.3% | | | | | | |
| | 141,000 | | | JD Group Ltd. | | | 433,993 | | | |
| Spain — 1.4% | | | | | | |
| Financials — 1.4% | | | | | | |
| | 50,907 | | | Banco Santander SA ADR (a) | | | 453,581 | | | |
| Switzerland — 1.1% | | | | | | |
| Financials — 1.1% | | | | | | |
| | 4,100 | | | Swiss Re AG | | | 360,125 | | | |
| United Kingdom — 3.4% | | | | | | |
| Financials — 1.8% | | | | | | |
| | 40,000 | | | Aviva PLC ADR (a) | | | 577,600 | | | |
| Health Care — 1.6% | | | | | | |
| | 10,000 | | | AstraZeneca PLC ADR | | | 528,600 | | | |
| | | | | | | | 1,106,200 | | | |
| United States — 39.2% | | | | | | |
| Consumer Staples — 1.0% | | | | | | |
| | 8,500 | | | Altria Group, Inc. | | | 316,455 | | | |
| Energy — 7.7% | | | | | | |
| | 11,200 | | | Calumet Specialty Products
Partners LP | | | 333,872 | | | |
| | 60,000 | | | Eagle Rock Energy Partners LP | | | 368,400 | | | |
| | 6,500 | | | Energy Transfer Partners LP | | | 344,305 | | | |
| | 9,663 | | | Kinder Morgan Energy
Partners LP (a) | | | 779,804 | | | |
| | 17,500 | | | Natural Resource Partners LP | | | 374,500 | | | |
| | 13,000 | | | North European Oil Royalty Trust | | | 299,000 | | | |
| | | | | | | | 2,499,881 | | | |
| Financials — 10.2% | | | | | | |
| | 17,000 | | | AllianceBernstein Holding LP (a) | | | 377,740 | | | |
| | 19,600 | | | Apollo Global Management LLC | | | 632,296 | | | |
| | 40,000 | | | Fifth Street Finance Corp. | | | 408,000 | | | |
| | 35,000 | | | KKR Financial Holdings LLC (a) | | | 346,850 | | | |
| | 20,500 | | | New Mountain Finance Corp. | | | 290,690 | | | |
| | 30,000 | | | New York Community Bancorp, Inc. (b) | | | 486,300 | | | |
| | 40,000 | | | Prospect Capital Corp. (a) | | | 453,600 | | | |
| | 14,800 | | | Solar Capital Ltd. | | | 339,660 | | | |
| | | | | | | | 3,335,136 | | | |
| Industrials — 3.0% | | | | | | |
| | 11,000 | | | Corrections Corp. of America (b) | | | 407,000 | | | |
| | 12,200 | | | TAL International Group, Inc. (a) | | | 589,382 | | | |
| | | | | | | | 996,382 | | | |
| Materials — 2.3% | | | | | | |
| | 12,000 | | | Southern Copper Corp. | | | 335,400 | | | |
| | 2,000 | | | Terra Nitrogen Co. LP (a) | | | 408,660 | | | |
| | | | | | | | 744,060 | | | |
| | | | | | | | | | |
| Shares | | | | | Value | | | |
| | | | | | | | | | |
| Common Stocks — (Continued) | | | | | | |
| Real Estate Investment Trusts — 9.9% | | | | | | |
| | 32,500 | | | Annaly Capital Management, Inc. | | $ | 383,175 | | | |
| | 6,900 | | | EPR Properties | | | 354,453 | | | |
| | 2,500 | | | Hatteras Financial Corp. | | | 45,500 | | | |
| | 16,000 | | | Hospitality Properties Trust | | | 470,080 | | | |
| | 36,000 | | | Inland Real Estate Corp. | | | 384,840 | | | |
| | 7,300 | | | Invesco Mortgage Capital, Inc. | | | 112,785 | | | |
| | 27,500 | | | Lexington Realty Trust | | | 321,750 | | | |
| | 20,000 | | | Medical Properties Trust, Inc. | | | 260,800 | | | |
| | 47,000 | | | NorthStar Realty Finance Corp. | | | 438,510 | | | |
| | 11,011 | | | Realty Income Corp. (a) | | | 458,608 | | | |
| | | | | | | | 3,230,501 | | | |
| Telecommunication Services — 4.1% | | | | | | |
| | 10,000 | | | AT&T, Inc. | | | 362,000 | | | |
| | 28,500 | | | NTELOS Holdings Corp. | | | 542,640 | | | |
| | 50,000 | | | Windstream Holdings, Inc. (a) | | | 427,500 | | | |
| | | | | | | | 1,332,140 | | | |
| Utilities — 1.0% | | | | | | |
| | 8,300 | | | Southern Co. | | | 339,553 | | | |
| | | | | | | | 12,794,108 | | | |
| Total Common Stocks (Cost $22,139,920) | | | 23,287,535 | | | |
| Preferred Stocks — 13.3% | | | | | | |
| Bermuda — 0.9% | | | | | | |
| Financials — 0.9% | | | | | | |
| | 11,500 | | | Axis Capital Holdings Ltd.,
Series C, 6.875% | | | 281,175 | | | |
| United States — 12.4% | | | | | | |
| Financials — 7.8% | | | | | | |
| | 13,000 | | | Ameriprise Financial, Inc., 7.750% | | | 337,740 | | | |
| | 16,000 | | | Deutsche Bank Contingent Capital Trust II, 6.550% | | | 400,960 | | | |
| | 14,000 | | | First Republic Bank, Series A, 6.700% | | | 342,300 | | | |
| | 15,000 | | | Merrill Lynch Preferred Capital Trust V,
Series F, 7.280% | | | 379,350 | | | |
| | 12,000 | | | PNC Financial Services Group, Inc.,
Series P, 6.125% | | | 304,560 | | | |
| | 15,000 | | | Raymond James Financial, Inc., 6.900% | | | 384,450 | | | |
| | 13,500 | | | Wells Fargo & Co., Series J, 8.000% | | | 383,940 | | | |
| | | | | | | | 2,533,300 | | | |
| Real Estate Investment Trusts — 3.3% | | | | | | |
| | 16,000 | | | PS Business Parks, Inc.,
Series S, 6.450% | | | 363,680 | | | |
| | 14,000 | | | Realty Income Corp., Series F, 6.625% | | | 342,580 | | | |
| | 14,500 | | | Vornado Realty LP, 7.875% | | | 383,525 | | | |
| | | | | | | | 1,089,785 | | | |
| Telecommunication Services — 1.3% | | | | | | |
| | 17,500 | | | Qwest Corp., 7.500% | | | 441,350 | | | |
| | | | | | | | 4,064,435 | | | |
| Total Preferred Stocks (Cost $4,497,910) | | | 4,345,610 | | | |
(See notes which are an integral part of the Financial Statements)
Annual Shareholder Report
6
| | |
| Huntington World Income Fund | | (Continued) |
| | | | | | | | | | |
Principal
Amount
or Shares | | | | | Value | | | |
| | | | | | | | | | |
| Corporate Bonds — 5.1% | | | | | | |
| Multi-Nationals — 1.2% | | | | | | |
| Financials — 1.2% | | | | | | |
| | 1,000,000 | | | Inter-American Development
Bank, 5.250%, 7/19/16 (c) | | $ | 402,441 | | | |
| United States — 3.9% | | | | | | |
| Financials — 1.6% | | | | | | |
| $ | 255,000 | | | General Electric Capital Corp.,
5.000%, 2/28/14 EMTN | | | 211,693 | | | |
| | 350,000 | | | General Electric Capital Corp.,
5.500%, 2/1/17 GMTN | | | 297,020 | | | |
| | | | | | | | 508,713 | | | |
| Materials — 1.6% | | | | | | |
| | 500,000 | | | Cliffs Natural Resources, Inc., 5.900%, 3/15/20 | | | 522,474 | | | |
| Real Estate Investment Trusts — 0.7% | | | | | | |
| | 200,000 | | | Developers Diversified Realty Corp., 7.500%, 4/1/17 | | | 234,296 | | | |
| | | | | | | | 1,265,483 | | | |
| Total Corporate Bonds (Cost $1,719,579) | | | 1,667,924 | | | |
| Foreign Government Bonds — 4.0% | | | | | | |
| Indonesia — 0.5% | | | | | | |
| | 1,700,000,000 | | | Indonesian Government,
Series FR55, 7.375%, 9/15/16 (d) | | | 152,955 | | | |
| Mexico — 1.3% | | | | | | |
| | 23,500 | | | Mexican Bonos,
Series M, 7.000%, 6/19/14 (d) | | | 183,798 | | | |
| | 30,000 | | | Mexican Bonos,
Series M, 5.000%, 6/15/17 (d) | | | 232,180 | | | |
| | | | | | | | 415,978 | | | |
| Poland — 1.4% | | | | | | |
| | 530,000 | | | Poland Government Bond,
Series 414, 5.750%, 4/25/14 (d) | | | 174,548 | | | |
| | 279,000 | | | Poland Government Bond,
Series 415, 5.500%, 4/25/15 (d) | | | 94,149 | | | |
| | 560,000 | | | Poland Government Bond,
Series 416, 5.000%, 4/25/16 (d) | | | 190,217 | | | |
| | | | | | | | 458,914 | | | |
| South Africa — 0.2% | | | | | | |
| | 620,000 | | | South Africa Government Bond,
Series R201, 8.750%,12/21/14 (d) | | | 64,344 | | | |
| Turkey — 0.6% | | | | | | |
| | 394,000 | | | Turkey Government Bond,
8.000%, 1/29/14 (d) | | | 197,957 | | | |
| Total Foreign Government Bonds (Cost $1,494,188) | | | 1,290,148 | | | |
| Options Purchased — 1.8% | | | | | | |
| | 200 | | | CBOE Volatility Index, Call @ $12,
Expiring December 2013 | | | 70,000 | | | |
| | 600 | | | CBOE Volatility Index, Call @ $12,
Expiring November 2013 | | | 148,800 | | | |
| | | | | | | | | | |
Contracts
or Shares | | | | | Value | | | |
| | | | | | | | | | |
| Options Purchased — (Continued) | | | | | | |
| | 200 | | | CBOE Volatility Index, Call @ $13,
Expiring November 2013 | | $ | 33,000 | | | |
| | 800 | | | SPDR S&P 500 Index ETF,
Call @ $185, Expiring
December 2013 (b) | | | 28,800 | | | |
| | 800 | | | SPDR S&P 500 Index ETF, Put @
$176, Expiring
December 2013 (e) | | | 310,400 | | | |
| Total Options Purchased (Cost $670,071) | | | 591,000 | | | |
| Cash Equivalents — 3.1% | | | | | | |
| | | | | | | | | | |
| | 1,007,686 | | | Huntington U.S. Treasury Money Market Fund, Trust Shares,
0.030% (f) (g) | | | 1,007,686 | | | |
| Total Cash Equivalents (Cost $1,007,686) | | | 1,007,686 | | | |
| Closed-End Funds — 1.0% | | | | | | |
| | 31,000 | | | GAMCO Global Gold, Natural Resources & Income Trust by
Gabelli | | | 329,840 | | | |
| Total Closed-End Funds (Cost $476,480) | | | 329,840 | | | |
| Short-Term Securities Held as Collateral for
Securities Lending — 19.5% | | | | | | |
| | 6,369,808 | | | Fidelity Institutional Money Market Portfolio, Institutional Class,
0.080% (g) | | | 6,369,808 | | | |
| Total Short-Term Securities Held as Collateral for
Securities Lending (Cost $6,369,808) | | | 6,369,808 | | | |
| Total Investments (Cost $38,375,642) — 119.2% | | | 38,889,551 | | | |
| Liabilities in Excess of Other Assets — (19.2)% | | | (6,262,052) | | | |
| Net Assets — 100.0% | | $ | 32,627,499 | | | |
| (a) | All or a portion of the security was on loan as of October 31, 2013. The total value of securities on loan as of October 31, 2013 was $6,228,028. |
| (b) | All or a portion of the security is held as collateral for written call options. |
| (c) | Foreign-denominated security. Principal amount is reported in Brazilian Real. |
| (d) | Foreign-denominated security. Principal amount is reported in applicable country’s currency. |
| (e) | All or a portion of the security is held as collateral for written put options. |
| (f) | Investment in affiliate. |
| (g) | Rate disclosed is the seven day yield as of October 31, 2013. |
| ADR | — American Depositary Receipt |
| EMTN | — Euro Medium Term Note |
| GMTN | — Global Medium Term Note |
(See notes which are an integral part of the Financial Statements)
Annual Shareholder Report
7
| | |
| | |
| Huntington Income Generation Fund | | October 31, 2013 |
| | |
| Portfolio of Investments Summary Table | | (unaudited) |
| | | | |
| Asset Allocation | | Percentage of
Market Value | |
Equity Mutual Funds1 | | | 100.0% | |
Total | | | 100.0% | |
| 1 | Investments in an affliated funds. |
Portfolio holdings are subject to change. As of October 31, 2013, percentages in the table above are based on total investments. Such total investments may differ from the percentage set forth below in the Portfolio of Investments which are computed using the Fund’s total nets assets.
Portfolio of Investments
| | | | | | | | | | |
| Shares | | | | | Value | | | |
| | | | | | | | | | |
| Mutual Funds — 99.7% (a) | | | | | | |
| | 15,495 | | | Huntington Disciplined Equity Fund, Trust Shares | | $ | 167,347 | | | |
| | 22,600 | | | Huntington Dividend Capture Fund, Trust Shares | | | 245,883 | | | |
| | 4,294 | | | Huntington Income Equity Fund, Trust Shares | | | 111,998 | | | |
| | 204,724 | | | Huntington World Income Fund, Trust Shares | | | 1,770,859 | | | |
| Total Mutual Funds (Cost $2,239,658) | | | 2,296,087 | | | |
| Total Investments
(Cost $2,239,658) — 99.7% | | | 2,296,087 | | | |
| Other Assets in Excess of Liabilities — 0.3% | | | 6,058 | | | |
| Net Assets — 100.0% | | $ | 2,302,145 | | | |
| (a) | Investment in affiliate. |
(See notes which are an integral part of the Financial Statements)
Annual Shareholder Report
8
Statements of Assets and Liabilities
October 31, 2013
| | | | | | | | |
| | | Huntington
World Income
Fund | | | Huntington
Income Generation
Fund | |
| Assets: | | | | | | | | |
Investments, at cost | | $ | 38,375,642 | | | $ | 2,239,658 | |
Investments, at value | | $ | 37,881,865 | | | $ | — | |
Investments in affiliated securities, at value | | | 1,007,686 | | | | 2,296,087 | |
Total investments | | | 38,889,551 | | | | 2,296,087 | |
Foreign currencies, at value (Cost $3,946 and $ -) | | | 3,947 | | | | — | |
Income receivable | | | 172,197 | | | | — | |
Receivable for investments sold | | | 1,009,296 | | | | — | |
Receivable for shares sold | | | 7,920 | | | | — | |
Receivable from Adviser | | | 44,427 | | | | 5,546 | |
Tax reclaims receivable | | | 17,014 | | | | — | |
Prepaid expenses and other assets | | | 16,566 | | | | 20,572 | |
Total assets | | | 40,160,918 | | | | 2,322,205 | |
| Liabilities: | | | | | | | | |
Payable for return of collateral on loaned securities | | | 6,369,808 | | | | — | |
Payable to custodian | | | — | | | | 4,453 | |
Options written, at value (premium received $203,701 and $ -) | | | 203,100 | | | | — | |
Payable for investments purchased | | | 895,936 | | | | — | |
Payable for shares redeemed | | | 13,383 | | | | 605 | |
Accrued expenses and other payables: | | | | | | | | |
Administration fees | | | 4,993 | | | | 349 | |
Custodian fees | | | 3,093 | | | | 279 | |
Distribution service fee | | | 1,591 | | | | 1,460 | |
Shareholder services fee | | | 6,943 | | | | 487 | |
Transfer and dividend disbursing agent fees and expenses | | | 2,781 | | | | 2,258 | |
Professional fees | | | 15,811 | | | | 8,898 | |
Printing and postage | | | 10,109 | | | | 943 | |
Compliance service fees | | | 269 | | | | 28 | |
Other | | | 5,602 | | | | 300 | |
Total Liabilities | | | 7,533,419 | | | | 20,060 | |
Net Assets | | $ | 32,627,499 | | | $ | 2,302,145 | |
| | | | | | | | | |
| Net Assets consist of: | | | | | | | | |
Paid in capital | | $ | 35,153,234 | | | $ | 2,235,678 | |
Net unrealized appreciation of investments, options and translations of assets and liabilities in foreign currency | | | 513,059 | | | | 56,429 | |
Accumulated net realized gain (loss) on investments, options and foreign currency transactions | | | (3,203,728 | ) | | | 10,038 | |
Accumulated net investment income | | | 164,934 | | | | — | |
Net Assets | | $ | 32,627,499 | | | $ | 2,302,145 | |
| | | | | | | | | |
| Net Assets: | | | | | | | | |
Trust Shares | | $ | 24,780,464 | | | $ | 539 | |
Class A Shares | | $ | 7,847,035 | | | $ | — | |
Class C Shares | | $ | — | | | $ | 2,301,606 | |
| Shares Outstanding: (unlimited number of shares authorized, no par value): | | | | | | | | |
Trust Shares | | | 2,864,895 | | | | 52 | |
Class A Shares | | | 907,445 | | | | — | |
Class C Shares | | | — | | | | 223,606 | |
| Net Asset Value, Redemption Price and Offering Price Per Share: | | | | | | | | |
Trust Shares | | $ | 8.65 | | | $ | 10.30 | (b) |
Class A Shares | | $ | 8.65 | | | $ | — | |
Class C Shares (a) | | $ | — | | | $ | 10.29 | |
| Offering Price Per Share (100%/(100%-maximum sales charge) of net asset value adjusted to the nearest cent) per share: | | | | | | | | |
Class A Shares | | $ | 9.08 | | | $ | — | |
| Maximum Sales Charge: | | | | | | | | |
Class A Shares | | | 4.75 | % | | | — | |
| | | | | | | | | |
| (a) | A contingent deferred sales charge (“CDSC”) of 1.00% may be charged on shares held less than 12 months. |
| (b) | Per share amount does not recalculate due to rounding of net assets and/or shares outstanding. |
(See notes which are an integral part of the Financial Statements)
Annual Shareholder Report
9
Statements of Operations
Year Ended October 31, 2013
| | | | | | | | |
| | | Huntington
World Income
Fund | | | Huntington
Income Generation
Fund | |
| Investment Income: | | | | | | | | |
Dividend income | | $ | 2,681,798 | | | $ | — | |
Dividend income from affiliated securities | | | 439 | | | | 108,662 | |
Interest income | | | 271,329 | | | | — | |
Income from securities lending, net | | | 65,423 | | | | — | |
Foreign dividend taxes withheld | | | (102,718 | ) | | | — | |
Total investment income | | | 2,916,271 | | | | 108,662 | |
| Expenses: | | | | | | | | |
Investment adviser fees | | | 174,000 | | | | 2,278 | |
Administration fees | | | 62,933 | | | | 4,118 | |
Custodian fees | | | 16,956 | | | | 569 | |
Transfer and dividend disbursing agent fees and expenses | | | 31,828 | | | | 25,697 | |
Trustees’ fees | | | 3,002 | | | | 183 | |
Professional fees | | | 32,722 | | | | 10,071 | |
Class A Distribution services fee-Class A Shares | | | 16,867 | | | | — | |
Class C Distribution services fee-Class C Shares | | | — | | | | 16,398 | |
Trust Shareholder services fee-Trust Shares | | | 70,133 | | | | 230 | |
Class A Shareholder services fee-Class A Shares | | | 16,867 | | | | — | |
Class C Shareholder services fee-Class C Shares | | | — | | | | 5,466 | |
State registration costs | | | 35,198 | | | | 44,452 | |
Offering costs | | | — | | | | 6,969 | |
Printing and postage | | | 32,072 | | | | 8,074 | |
Insurance premiums | | | 3,612 | | | | 2,675 | |
Compliance service fees | | | 921 | | | | 13 | |
Line of credit fees | | | 614 | | | | 40 | |
Interest expense | | | — | | | | 35 | |
Other | | | 20,924 | | | | 1,914 | |
Total expenses | | | 518,649 | | | | 129,182 | |
Investment adviser fees contractually waived | | | (166,706 | ) | | | (2,278 | ) |
Investment adviser fees voluntarily waived | | | (7,294 | ) | | | — | |
Reimbursement from Adviser | | | (45,374 | ) | | | (105,366 | ) |
Net expenses | | | 299,275 | | | | 21,538 | |
Net investment income | | | 2,616,996 | | | | 87,124 | |
| Net Realized/Unrealized Gain (Loss) on Investments, Options and Foreign Currency Transactions: | | | | | | | | |
Net realized loss on investment transactions | | | (3,553,814 | ) | | | — | |
Net realized gain on investment transactions of affiliates | | | — | | | | 12,026 | |
Net realized gain on written option transactions | | | 681,300 | | | | — | |
Net realized gain on foreign currency transactions | | | 14,336 | | | | — | |
Net realized gain (loss) on investments, options and translation of assets and liabilities in foreign currency transactions | | | (2,858,178 | ) | | | 12,026 | |
Net change in unrealized appreciation of investments, options and translation of assets and liabilities in foreign currency | | | 1,883,593 | | | | 75,779 | |
Net realized and unrealized gain (loss) on investments, options and foreign currency transactions | | | (974,585 | ) | | | 87,805 | |
Change in net assets resulting from operations | | $ | 1,642,411 | | | $ | 174,929 | |
| | | | | | | | | |
(See notes which are an integral part of the Financial Statements)
Annual Shareholder Report
10
Statements of Changes in Net Assets
| | | | | | | | | | | | | | | | |
| | | Huntington World
Income Fund | | | Huntington Income
Generation Fund | |
| | | Year Ended
October 31,
2013 | | | Year Ended
October 31,
2012 | | | Year Ended
October 31,
2013 | | | Period Ended
October 31,
2012 (a) | |
| Increase (Decrease) in Net Assets: | | | | | | | | | | | | | | | | |
| Operations— | | | | | | | | | | | | | | | | |
Net investment income | | $ | 2,616,996 | | | $ | 2,242,114 | | | $ | 87,124 | | | $ | 6,430 | |
Net realized gain (loss) on investments, options and foreign currency transactions | | | (2,858,178 | ) | | | (777,432 | ) | | | 12,026 | | | | (113 | ) |
Net change in unrealized appreciation/depreciation of investments and foreign currency transactions | | | 1,883,593 | | | | (139,781 | ) | | | 75,779 | | | | (19,350 | ) |
Net increase (decrease) in net assets resulting from operations | | | 1,642,411 | | | | 1,324,901 | | | | 174,929 | | | | (13,033 | ) |
| Distributions to Shareholders— | | | | | | | | | | | | | | | | |
From and/or excess of net investment income: | | | | | | | | | | | | | | | | |
Trust Shares | | | (1,824,950 | ) | | | (1,911,632 | ) | | | (4,066 | ) | | | (331 | ) |
Class A Shares | | | (432,126 | ) | | | (345,108 | ) | | | — | | | | — | |
Class C Shares | | | — | | | | — | | | | (87,878 | ) | | | (3,407 | ) |
Change in net assets resulting from distributions to shareholders | | | (2,257,076 | ) | | | (2,256,740 | ) | | | (91,944 | ) | | | (3,738 | ) |
Change in net assets resulting from capital transactions | | | (5,248,382 | ) | | | 16,962,889 | | | | 554,626 | | | | 1,681,305 | |
Change in net assets | | | (5,863,047 | ) | | | 16,031,050 | | | | 637,611 | | | | 1,664,534 | |
| Net Assets | | | | | | | | | | | | | | | | |
Beginning of period | | | 38,490,546 | | | | 22,459,496 | | | | 1,664,534 | | | | — | |
End of period | | $ | 32,627,499 | | | $ | 38,490,546 | | | $ | 2,302,145 | | | $ | 1,664,534 | |
| | | | | | | | | | | | | | | | | |
Accumulated net investment income included in net assets at end of period | | $ | 164,934 | | | $ | 25,587 | | | $ | — | | | $ | 2,808 | |
| Capital Transactions: | | | | | | | | | | | | | | | | |
Trust Shares | | | | | | | | | | | | | | | | |
Shares sold | | | 6,593,362 | | | | 17,455,125 | | | | 3,111 | | | | 100,180 | |
Dividends reinvested | | | 889,869 | | | | 1,037,461 | | | | 4,057 | | | | 332 | |
Shares redeemed | | | (14,114,548 | ) | | | (4,548,333 | ) | | | (107,427 | ) | | | — | |
Total Trust Shares | | | (6,631,317 | ) | | | 13,944,253 | | | | (100,259 | ) | | | 100,512 | |
Class A Shares | | | | | | | | | | | | | | | | |
Shares sold | | | 5,079,956 | | | | 3,746,956 | | | | — | | | | — | |
Dividends reinvested | | | 234,913 | | | | 199,468 | | | | — | | | | — | |
Shares redeemed | | | (3,931,934 | ) | | | (927,788 | ) | | | — | | | | — | |
Total Class A Shares | | | 1,382,935 | | | | 3,018,636 | | | | — | | | | — | |
Class C Shares | | | | | | | | | | | | | | | | |
Shares sold | | | — | | | | — | | | | 1,053,717 | | | | 1,579,996 | |
Dividends reinvested | | | — | | | | — | | | | 55,356 | | | | 1,092 | |
Shares redeemed | | | — | | | | — | | | | (454,188 | ) | | | (295 | ) |
Total Class C Shares | | | — | | | | — | | | | 654,885 | | | | 1,580,793 | |
Net change resulting from capital transactions | | $ | (5,248,382 | ) | | $ | 16,962,889 | | | $ | 554,626 | | | $ | 1,681,305 | |
| Share Transactions: | | | | | | | | | | | | | | | | |
Trust Shares | | | | | | | | | | | | | | | | |
Shares sold | | | 767,418 | | | | 1,953,446 | | | | 306 | | | | 10,000 | |
Dividends reinvested | | | 104,142 | | | | 117,793 | | | | 407 | | | | 33 | |
Shares redeemed | | | (1,649,662 | ) | | | (509,367 | ) | | | (10,694 | ) | | | — | |
Total Trust Shares | | | (778,102 | ) | | | 1,561,872 | | | | (9,981 | ) | | | 10,033 | |
Class A Shares | | | | | | | | | | | | | | | | |
Shares sold | | | 592,161 | | | | 420,849 | | | | — | | | | — | |
Dividends reinvested | | | 27,517 | | | | 22,654 | | | | — | | | | — | |
Shares redeemed | | | (460,012 | ) | | | (106,163 | ) | | | — | | | | — | |
Total Class A Shares | | | 159,666 | | | | 337,340 | | | | — | | | | — | |
Class C Shares | | | | | | | | | | | | | | | | |
Shares sold | | | — | | | | — | | | | 105,955 | | | | 157,194 | |
Dividends reinvested | | | — | | | | — | | | | 5,529 | | | | 109 | |
Shares redeemed | | | — | | | | — | | | | (45,152 | ) | | | (29 | ) |
Total Class C Shares | | | — | | | | — | | | | 66,332 | | | | 157,274 | |
Net change resulting from share transactions | | | (618,436 | ) | | | 1,899,212 | | | | 56,351 | | | | 167,307 | |
| | | | | | | | | | | | | | | | | |
| (a) | Reflects operations from the period August 31, 2012 (commencement of operations) to October 31, 2012. |
(See notes which are an integral part of the Financial Statements)
Annual Shareholder Report
11
Financial Highlights
| | | | | | | | | | | | | | | | | | | | | | | | |
| | | Net Asset
Value,
beginning
of period | | | Net
investment
income (loss) | | | Net realized
and unrealized
gain (loss) on
investments | | | Total from
investment
operations | | |
Distributions
from net
investment
income | | | Total
distributions | |
| HUNTINGTON WORLD INCOME FUND | | | | | | | | | | | | | |
| Trust Shares | | | | | | | | | | | | | | | | | | | | | |
2011(4) | | $ | 10.00 | | | | 0.29 | | | | (1.00 | ) | | | (0.71 | ) | | | (0.28 | ) | | | (0.28 | ) |
2012 | | $ | 9.01 | | | | 0.61 | | | | (0.22 | ) | | | 0.39 | | | | (0.63 | ) | | | (0.63 | ) |
2013 | | $ | 8.77 | | | | 0.65 | (7) | | | (0.21 | ) | | | 0.44 | | | | (0.56 | ) | | | (0.56 | ) |
| Class A Shares | | | | | | | | | | | | | | | | | | | | | |
2011(4) | | $ | 10.00 | | | | 0.26 | | | | (0.98 | ) | | | (0.72 | ) | | | (0.27 | ) | | | (0.27 | ) |
2012 | | $ | 9.01 | | | | 0.58 | | | | (0.21 | ) | | | 0.37 | | | | (0.61 | ) | | | (0.61 | ) |
2013 | | $ | 8.77 | | | | 0.62 | (7) | | | (0.20 | ) | | | 0.42 | | | | (0.54 | ) | | | (0.54 | ) |
| HUNTINGTON INCOME GENERATION FUND | | | | | | | | | | | | | |
| Trust Shares | | | | | | | | | | | | | | | | | | | | | |
2012(8) | | $ | 10.00 | | | | 0.05 | | | | (0.06 | ) | | | (0.01 | ) | | | (0.03 | ) | | | (0.03 | ) |
2013 | | $ | 9.96 | | | | 0.41 | (7) | | | 0.42 | | | | 0.83 | | | | (0.49 | ) | | | (0.49 | ) |
| Class C Shares | | | | | | | | | | | | | | | | | | | | | |
2012(8) | | $ | 10.00 | | | | 0.04 | | | | (0.06 | ) | | | (0.02 | ) | | | (0.03 | ) | | | (0.03 | ) |
2013 | | $ | 9.95 | | | | 0.38 | (7) | | | 0.37 | | | | 0.75 | | | | (0.41 | ) | | | (0.41 | ) |
| (1) | Based on net asset value, which does not reflect a sales charge or contingent deferred sales charge, if applicable. |
| (2) | If applicable, certain fees were waived and/or reimbursed. If such waivers/reimbursements had not occurred, the ratios would have been as indicated. |
| (3) | Portfolio Turnover is calculated on the basis of the Fund as a whole without distinguishing among the classes of shares. |
| (4) | For the period May 2, 2011 (commencement of operations) to October 31, 2011. |
| (6) | Computed on an annualized basis. |
| (7) | Calculated using average shares for the period. |
| (8) | For the period August 31, 2012 (commencement of operations) to October 31, 2012. |
| (9) | Does not include the effect of expenses of underlying funds. |
(See notes which are an integral part of the Financial Statements)
Annual Shareholder Report
12
| | | | | | | | | | | | | | | | | | | | | | | | | | |
Net Asset
Value, end
of period | | | Total
return(1) | | | Ratio of Net
Expenses to
Average Net
Assets | | | Ratio of Net
Investment
Income (Loss)
to Average
Net Assets | | | Ratio of Expenses
(Prior to
Reimbursements)
to Average Net Assets(2) | | | Net Assets,
end of
period (000 omitted) | | | Portfolio
turnover
rate(3) | |
| | | | | | | | | | | | | | | | | | | | | | | | | | |
| | | | | | | | | | | | | | | | | | | | | | | | | | |
| $ | 9.01 | | | | (7.17 | )%(5) | | | 1.79 | %(6) | | | 6.38 | %(6) | | | 1.79 | %(6) | | $ | 18,760 | | | | 60 | %(5) |
| $ | 8.77 | | | | 4.55 | % | | | 1.25 | % | | | 7.10 | % | | | 1.48 | % | | $ | 31,935 | | | | 76 | % |
| $ | 8.65 | | | | 5.35 | % | | | 0.81 | % | | | 7.59 | % | | | 1.44 | % | | $ | 24,780 | | | | 104 | % |
| | | | | | | | | | | | | | | | | | | | | | | | | | |
| $ | 9.01 | | | | (7.27 | )%(5) | | | 2.04 | %(6) | | | 6.13 | %(6) | | | 2.04 | %(6) | | $ | 3,699 | | | | 60 | %(5) |
| $ | 8.77 | | | | 4.29 | % | | | 1.50 | % | | | 6.83 | % | | | 1.73 | % | | $ | 6,556 | | | | 76 | % |
| $ | 8.65 | | | | 5.10 | % | | | 1.06 | % | | | 7.23 | % | | | 1.69 | % | | $ | 7,847 | | | | 104 | % |
| | | | | | | | | | | | | | | | | | | | | | | | | | |
| | | | | | | | | | | | | | | | | | | | | | | | | | |
| $ | 9.96 | | | | (0.07 | )%(5) | | | 0.04 | %(6)(9) | | | 2.83 | %(6) | | | 27.64 | %(6)(9) | | $ | 100 | | | | 2 | %(5) |
| $ | 10.30 | | | | 8.57 | % | | | 0.19 | %(9) | | | 4.15 | % | | | 5.18 | %(9) | | $ | 1 | | | | 62 | % |
| | | | | | | | | | | | | | | | | | | | | | | | | | |
| $ | 9.95 | | | | (0.20 | )%(5) | | | 0.79 | %(6)(9) | | | 3.47 | %(6) | | | 26.85 | %(6)(9) | | $ | 1,565 | | | | 2 | %(5) |
| $ | 10.29 | | | | 7.72 | % | | | 0.98 | %(9) | | | 3.81 | % | | | 5.68 | %(9) | | $ | 2,302 | | | | 62 | % |
Annual Shareholder Report
13
Notes to Financial Statements
October 31, 2013
The Huntington Funds (the “Trust”) was organized as a single Delaware statutory trust on June 30, 2006. The Trust is registered under the Investment Company Act of 1940, as amended (the “1940 Act”), as an open-end management investment company. As of October 31, 2013, the Trust operated 33 separate series, or mutual funds, each with its own investment objective and strategy. The prospectus provides a description of each fund’s investment objectives, policies and strategies along with information on the classes of shares currently being offered. This report contains financial statements and financial highlights of the Huntington World Income Fund (“World Income Fund”) and Huntington Income Generation Fund (“Income Generation Fund”) (individually referred to as a “Fund”, or collectively as the “Funds”). The World Income Fund commenced operations on May 2, 2011. The Income Generation Fund commenced operations on August 31, 2012. The World Income Fund offers Trust and Class A shares. The Income Generation Fund offers Trust and Class C shares. Each class of shares has identical rights and privileges except with respect to distribution (12b-1) and service fees, voting rights on matters affecting a single class of shares, exchange privileges of each class of shares and sales charges. The price at which the Fund will offer or redeem shares is the net asset value (“NAV”) per share next determined after the order is considered received, subject to any applicable front end or contingent deferred sales charges. Class A has a maximum sales charge on purchases of 4.75% as a percentage of the original purchase price. Class C has a contingent deferred sales charge of 1.00% on shares sold within one year of purchase.
Under the Trust’s organizational documents, its officers and Board of Trustees (“Trustees”) are indemnified against certain liabilities arising out of the performance of their duties to the Funds. In addition, in the normal course of business, the Trust may enter into contracts with vendors and others that provide for general indemnifications. The Trust’s maximum exposure under these arrangements is unknown, as this would involve future claims that may be made against the Trust. However, based on experience, the Trust expects that risk of loss to be remote.
| (2) | Significant Accounting Policies |
The following is a summary of significant accounting policies consistently followed by the Funds in the preparation of its financial statements. These policies are in conformity with generally accepted accounting principles in the United States of America (“GAAP”). The preparation of financial statements in conformity with GAAP requires management to make estimates and assumptions that affect the amounts of assets, liabilities, and disclosure of contingent assets and liabilities at the date of the financial statements and the reported amounts of income and expenses for the period. Actual results could differ from those estimates.
The Trust calculates the NAV for each of the Funds by valuing securities held based on fair value. Fair value is defined as the price that would be received to sell an asset or paid to transfer a liability in an orderly transaction between market participants at the measurement date.
The valuation techniques described below maximize the use of observable inputs and minimize the use of unobservable inputs in determining fair value. The inputs used for valuing the Funds’ investments are summarized in the three broad levels listed below:
| • | | Level 1—quoted prices in active markets for identical assets. |
| • | | Level 2—other significant observable inputs (including quoted prices for similar securities, interest rates, prepayment speeds, credit risk, etc.). |
| • | | Level 3—significant unobservable inputs (including the Funds’ own assumptions in determining the fair value of investments). |
Changes in valuation techniques may result in transfers in or out of an assigned level within the disclosure hierarchy. The Trust recognizes transfers between fair value hierarchy levels at the reporting period end. The inputs or methodology used for valuing investments is not necessarily an indication of the risk associated with investing in those investments.
In computing the NAV of the Funds fair value is based on market valuations with respect to portfolio securities for which market quotations are readily available. Pursuant to Trustee-approved policies, the Trust relies on certain security pricing services to provide the current market value of securities. Those security pricing services value equity securities (including foreign equity securities, exchange-traded funds and closed-end funds) traded on a securities exchange at the last reported sales price on the principal exchange. Equity securities quoted by NASDAQ are valued at the NASDAQ official closing price. If there is no reported sale on the principal exchange, and in the case of over-the-counter securities, equity securities are valued at a bid price estimated by the security pricing service. In each of these situations, valuations are typically categorized as Level 1 in the fair value hierarchy. Investments in open-end investment companies are valued at their respective net asset value as reported by such companies and are typically categorized as Level 1 in the fair value hierarchy.
Option contracts are generally valued using the closing price based on quote data from the six major U.S. options exchanges on which such options are traded, and are typically categorized as Level 1 in the fair value hierarchy.
Debt securities traded on a national securities exchange or in the over-the-counter market are valued at the last reported sales price on the principal exchange. If there is no reported sale on the principal exchange, and for all other debt securities, debt securities are valued at a bid price estimated
Annual Shareholder Report
14
by the security pricing service. Foreign securities quoted in foreign currencies are translated in U.S. dollars at the foreign exchange rate in effect as of the close of the New York Stock Exchange (NYSE) (generally 4:00 p.m. Eastern Time), on the day the value of the foreign security is determined. Short-term investments with remaining maturities of 60 days or less at the time of purchase are valued at amortized cost. In each of these situations, valuations are typically categorized as Level 2 in the fair value hierarchy.
Under certain circumstances, a good faith determination of the fair value of a security may be used instead of its current market value, even if the security’s market price is readily available. In such circumstances, the Trust’s Administrator may request that the Trust’s Pricing Committee make its own fair value determination.
Securities for which market quotations are not readily available are valued at fair value under Trust procedures approved by the Trustees. In these cases, a Pricing Committee established and appointed by the Trustees determines in good faith, subject to Trust procedures, the fair value of portfolio securities held by a Fund (“good faith fair valuation”). When a good faith fair valuation of a security is required, consideration is generally given to a number of factors including, but not limited to the following: dealer quotes, published analyses by dealers or analysts regarding the security, transactions which provide implicit valuation of the security (such as a merger or tender offer transaction), the value of other securities or contracts which derive their value from the security at issue, and the implications of any other circumstances which have caused trading in the security to halt. With respect to certain narrow categories of securities, the procedures utilized by the Pricing Committee detail specific valuation methodologies to be applied in lieu of considering the aforementioned list of factors. Depending on the source and relative significance of valuation inputs, these instruments may be classified as Level 2 or Level 3 in the fair value hierarchy.
Fair valuation procedures are also used when a significant event affecting the value of a portfolio security is determined to have occurred between the time when the price of the portfolio security is determined and the close of trading on the NYSE, which is when each Fund’s NAV is computed. An event is considered significant if there is both an affirmative expectation that the security’s value will change in response to the event and a reasonable basis for quantifying the resulting change in value. Significant events include significant
securities market movements occurring between the time the price of the portfolio security is determined and the close of trading on the NYSE. For domestic fixed income securities, such events may occur where the cut-off time for the market information used by the independent pricing service is earlier than the end of regular trading on the NYSE. For securities normally priced at their last sale price in a foreign market, such events can occur between the close of trading in the foreign market and the close of trading on the NYSE.
In some cases, events affecting the issuer of a portfolio security may be considered significant events. Examples of potentially significant events include announcements concerning earnings, acquisitions, new products, management changes, litigation developments, a strike or natural disaster affecting the company’s operations or regulatory changes or market developments affecting the issuer’s industry occurring between the time when the price of the portfolio security is determined and the close of trading on the NYSE. For securities of foreign issuers, such events could also include political or other developments affecting the economy or markets in which the issuer conducts its operations or its securities are traded.
There can be no assurance that a Fund could purchase or sell a portfolio security at the price used to calculate the Fund’s NAV. In the case of good faith fair valued portfolio securities, lack of information and uncertainty as to the significance of information may lead to a conclusion that a prior valuation is the best indication of a portfolio security’s present value. Good faith fair valuations generally remain unchanged until new information becomes available. Consequently, changes in good faith fair valuation of portfolio securities may be less frequent and of greater magnitude than changes in the price of portfolio securities valued at their last sale price, by an independent pricing service, or based on market quotations.
The Funds’ Trustees have authorized the use of an independent fair valuation service to monitor changes in a designated U.S. market index after foreign markets close, and to implement a fair valuation methodology to adjust the closing prices of foreign securities if the movement in the index is significant. In the event of an increase or decrease greater than predetermined levels, the Funds may use a systematic valuation model provided by an independent third party to fair value its international equity securities, which are then typically categorized as Level 2 in the fair value hierarchy.
Annual Shareholder Report
15
Notes to Financial Statements (Continued)
The following is a summary of the inputs used to value the Funds’ investments as of October 31, 2013, based on the three levels defined previously:
| | | | | | | | | | | | | | | | |
| | | LEVEL 1 | | | LEVEL 2 | | | LEVEL 3 | | | Total | |
World Income Fund | | | | | | | | | | | | | | | | |
Investment Securities: | | | | | | | | | | | | | | | | |
Common Stocks | | $ | 23,287,535 | | | $ | — | | | $ | — | | | $ | 23,287,535 | |
Preferred Stocks | | | 4,345,610 | | | | — | | | | — | | | | 4,345,610 | |
Corporate Bonds | | | — | | | | 1,667,924 | | | | — | | | | 1,667,924 | |
Foreign Government Bonds | | | — | | | | 1,290,148 | | | | — | | | | 1,290,148 | |
Closed-End Funds | | | 329,840 | | | | — | | | | — | | | | 329,840 | |
Options Purchased | | | 591,000 | | | | — | | | | — | | | | 591,000 | |
Cash Equivalents | | | 1,007,686 | | | | — | | | | — | | | | 1,007,686 | |
Short-Term Securities Held as Collateral for Securities | | | 6,369,808 | | | | — | | | | — | | | | 6,369,808 | |
| | | | | | | | | | | | | | | | |
Total Investment Securities | | | 35,931,479 | | | | 2,958,072 | | | | — | | | | 38,889,551 | |
| | | | | | | | | | | | | | | | |
Other Financial Instruments:** | | | | | | | | | | | | | | | | |
Written Options | | | (203,100 | ) | | | — | | | | — | | | | (203,100 | ) |
| | | | | | | | | | | | | | | | |
Total Investments | | | 35,728,379 | | | | 2,958,072 | | | | — | | | | 38,686,451 | |
| | | | | | | | | | | | | | | | |
Income Generation Fund | | | | | | | | | | | | | | | | |
Investment Securities: | | | | | | | | | | | | | | | | |
Mutual Funds | | | 2,296,087 | | | | — | | | | — | | | | 2,296,087 | |
| | | | | | | | | | | | | | | | |
Total Investment Securities | | | 2,296,087 | | | | — | | | | — | | | | 2,296,087 | |
| | | | | | | | | | | | | | | | |
| ** | Other Financial Instruments are derivative instruments not reflected on the Porfolio of Investments, such as written option contracts. |
For the year ended October 31, 2013, there were no Level 3 investments for which significant unobservable inputs were used to determine fair value. The Trust recognizes significant transfers between fair value hierarchy levels at the reporting period end. There were no transfers between all levels as of October 31, 2013.
| B. | When-Issued and Delayed Transactions |
The World Income Fund may engage in when-issued or delayed delivery transactions. The World Income Fund records when-issued securities on the trade date and maintains security positions such that sufficient liquid assets will be available to make payment for the securities purchased. Securities purchased on a when-issued or delayed delivery basis are marked to market daily and begin earning interest on the settlement date. Losses may occur on these transactions due to changes in market conditions or the failure of counterparties to perform under the contract. The funds did not own any when-issued or delayed-delivery securities as of October 31, 2013.
| C. | Foreign Currency Translation |
The accounting records of the Funds are maintained in U.S. dollars. Foreign currency amounts are translated into U.S. dollars at the current rate of exchange each business day to determine the value of investments, and other assets and liabilities. Purchases and sales of foreign securities, and income and expenses, are translated at the prevailing rate of exchange on the respective date of these transactions. The Funds do not isolate that portion of the results of operations resulting from changes in foreign exchange rates on investments from fluctuation arising from changes in market prices of securities held. These fluctuations are included with
the net realized and unrealized gain or loss from investments and foreign currency transactions.
The Funds may be subject to equity price risk and foreign currency exchange risk in the normal course of pursuing its investment objectives. The Funds may invest in various financial instruments including positions in foreign currency contracts and written option contracts to gain exposure to or hedge against changes in the value of equities or foreign currencies. The following is a description of the derivative instruments utilized by the Funds, including the primary underlying risk exposure related to each instrument type.
Foreign Exchange Contracts—The Funds may enter into forward foreign exchange contracts. A forward foreign exchange contract involves an obligation to purchase or sell a specific currency at a future date at a price set at the time of the contract. Such contracts are used to sell unwanted currency exposure that comes with holding securities in a market, or to buy currency exposure where the exposure from holding securities is insufficient to provide the desired currency exposure. The contracts are marked-to-market daily and the change in market value is recorded as unrealized appreciation or depreciation. When a forward foreign currency contract is closed, the Fund records a realized gain or loss equal to the difference between the value at the time it was opened and the value at the time it was closed. The Funds could be exposed to risks if the counterparties to the contracts are unable to meet the terms of their contracts and from unanticipated movements in exchange rates. At October 31, 2013 the Funds did not have any forward foreign exchange contracts outstanding.
Annual Shareholder Report
16
Written Options Contracts—The Funds may write options contracts for which premiums received are recorded as liabilities and are subsequently adjusted to the current value of the options written. Premiums received from writing options which expire are treated as realized gains. Premiums received
from writing options which are either exercised or closed are offset against the proceeds received or the amount paid on the transaction to determine realized gains or losses. Investing in written options contracts exposes the Funds to equity price risk.
The following is a summary of World Income Fund’s written option activity for the year ended October 31, 2013:
| | | | | | | | |
| Contracts | | Number of
Contracts | | | Premium | |
Outstanding at 10/31/2012 | | | 204 | | | $ | 17,755 | |
Options written | | | 33,256 | | | | 2,200,328 | |
Options closed | | | (21,304 | ) | | | (1,389,355 | ) |
Options expired | | | (4,909 | ) | | | (325,572 | ) |
Options exercised | | | (5,237 | ) | | | (299,455 | ) |
Outstanding at 10/31/2013 | | | 2,010 | | | $ | 203,701 | |
As of October 31, 2013, World Income Fund had the following outstanding written option contracts:
| | | | | | | | | | | | | | | | | | | | | | | | |
| Contract | | Type | | | Expiration
Date | | | Exercise
Price | | | Number
of Contracts | | | Fair
Value | | | Unrealized
Appreciation/
Depreciation | |
Corrections Corp. of America | | | Call | | | | November 2013 | | | $ | 37 | | | | 110 | | | $ | 8,800 | | | $ | 3,174 | |
New York Community Bancorp | | | Call | | | | November 2013 | | | | 16 | | | | 300 | | | | 7,500 | | | | (2,112 | ) |
SPDR S&P 500 Index ETF | | | Call | | | | December 2013 | | | | 182 | | | | 800 | | | | 68,400 | | | | 13,170 | |
SPDR S&P 500 Index ETF | | | Put | | | | December 2013 | | | | 168 | | | | 800 | | | | 118,400 | | | | (13,631 | ) |
Net unrealized appreciation on written
option contracts | | | | | | | | | | | | | | | | | | | | | | $ | 601 | |
The following tables provide a summary of the fair value of derivative instruments, not accounted for as hedging instruments as of October 31, 2013, and the effect of derivative instruments on the Statement of Operations for the year ended October 31, 2013.
The Fair Value of Derivative Instruments as of October 31, 2013:
| | | | | | | | | | |
| | | Asset Derivatives | | Liability Derivatives | | | | | |
| Primary Risk Exposure | | Statements of Assets
and Liabilities Location | | Statements of Assets and
Liabilities Location | | Fund | | Fair Value | |
Option Contracts | | | | Options Written, at value | | World Income Fund | | $ | 203,100 | |
| | | | |
| | Investments, at value | | | | World Income Fund | | | 591,000 | |
The effect of Derivative Instruments on the Statement of Operations for the fiscal year ended October 31, 2013:
| | | | | | | | | | | | |
| Primary Risk Exposure | | Location of Gain (Loss)
on Derivatives
Recognized in Income | | Fund | | Realized Loss on
Derivatives Recognized
in Income | | | Change in Unrealized
Appreciation/(Depreciation)
on Derivatives Recognized
in Income | |
Option Contracts | | Net realized loss on option transactions/net change in unrealized appreciation/(depreciation) of investments and options | | World Income Fund | | $ | (1,291,997 | ) | | $ | 57,834 | |
The notional value of the written options contracts outstanding as of October 31, 2013 and the month-end average notional amount for the year ended October 31, 2013 are detailed in the table below:
| | | | | | | | |
| Fund | | Average
Month-End
Notional Amount | | | October 31, 2013
Notional Amount | |
World Income Fund | | $ | 17,885,942 | | | $ | 28,887,000 | |
Annual Shareholder Report
17
Notes to Financial Statements (Continued)
Derivative positions open during the period and at period end are reflected for each Fund in the tables above. The volume of these positions relative to each Fund’s net assets at the close of the reporting period is generally higher than the volume of such positions at the beginning of the reporting period. The Funds value derivative instruments at fair value and recognize changes in fair value currently in the results on operations.
Restricted securities are securities that may only be resold upon registration under federal securities laws or in transactions exempt from such registration. In some cases, the issuer of restricted securities has agreed to register such securities for resale, at the issuer’s expense, either upon demand by the Funds or in connection with another registered offering of the securities. Many restricted securities may be resold in the secondary market in transactions exempt from registration. Such restricted securities may be determined to be liquid. The Funds will not incur any registration costs upon such resale. The Fund’s restricted securities are valued at the price provided by dealers in the secondary market or, if no market prices are available, at the fair value price as determined by the Trust’s Pricing Committee. At October 31, 2013, the Funds did not hold restricted securities.
To generate additional income, the World Income Fund may lend a certain percentage of their total assets, to the extent permitted by the 1940 Act or the rules or regulations thereunder, on a short-term basis to certain brokers, dealers or other financial institutions pursuant to a securities lending agreement with Morgan Stanley & Co. LLC. In determining whether to lend to a particular broker, dealer or financial
institution, Huntington Asset Advisors, Inc. (the “Adviser”) will consider all relevant facts and circumstances, including the size, creditworthiness and reputation of the borrower. Any loans made will be continuously secured by collateral in cash at least equal to 100% of the value of the securities on loan for the Fund, based on the prior day’s closing price. When the collateral falls below specified amounts, the lending agent will use its best effort to obtain additional collateral on the next business day to meet the required amounts under the securities lending agreement. The Fund receives payments from borrowers equivalent to the dividends and interest that would have been earned on securities on loan. In addition, the Fund’s lending securities receive an annual minimum securities lending fee and retain a portion of the interest, dividends and other distributions received on investment of cash collateral. Collateral is marked-to-market daily. One of the risks in lending portfolio securities, as with other extensions of credit, is the possible delay in recovery of the securities or possible loss of rights in the collateral should the borrower fail financially. Although the loan is fully collateralized, if a borrower defaults, the Fund could lose money. There is also the risk that, when lending portfolio securities, the securities may not be available to the Fund on a timely basis and the Fund may, therefore, lose the opportunity to sell the securities at a desirable price. In addition, in the event that a borrower of securities would file for bankruptcy or become insolvent, disposition of the securities may be delayed pending court action. Loans are subject to termination by the Fund or the borrower at any time and, therefore, are not considered to be illiquid investments. Huntington National Bank (“Huntington”) serves as the custodian for related collateral and receives an annual securities lending fee for collateral monitoring and recordkeeping services.
As of October 31, 2013, the following the World Income Fund had securities with the following market values on loan and related activity:
| | | | | | | | | | | | | | | | | | | | |
| Fund | | Value of
Loaned
Securities | | | Value of
Collateral | | | Average Loan
Outstanding
During
the Period | | | Securities Lending
Income Received
by the Fund | | | Fees Paid by the
Funds to
Huntington From
Securities Lending | |
World Income Fund | | $ | 6,228,028 | | | $ | 6,369,808 | | | $ | 5,450,867 | | | $ | 79,768 | | | $ | 14,345 | |
All cash collateral received is held and administered by the Fund’s custodian for the benefit of the Fund in the applicable custody account or other account established for the purpose of holding collateral.
| G. | Security Transactions and Related Income |
During the period, investment transactions are accounted for no later than the first calculation of the NAV on the business day following the trade date. For financial reporting purposes, however, security transactions are accounted for on the trade date on the last business day of the reporting period. Discounts and premiums on securities purchased are amortized over the lives of the respective securities. Securities gains and losses are calculated on the identified cost basis. Interest income and expenses are accrued daily. Dividends, less foreign tax withholding (if any), are recorded on the ex-dividend date.
| H. | Dividends and Distributions to Shareholders |
Dividends from net investment income are declared and paid monthly for the Funds. Dividends are declared separately for each class. No class has preferential rights; differences in per share dividend rates are generally due to differences in separate class expenses. Net realized capital gains, if any, are distributed at least annually. The amount of dividends from net investment income and net realized gains are determined in accordance with the federal income tax regulations, which may differ from GAAP. These “book/tax” differences are either considered temporary or permanent in nature. To the extent these differences are permanent in nature (e.g. tax treatment of foreign currency gain/loss, non-deductible stock issuance costs, return of capital distributions, distributions and income received from pass through investments), such amounts are reclassified within the capital accounts based on their nature
Annual Shareholder Report
18
for federal income tax purposes; temporary differences do not require reclassification. Temporary differences are primarily due to market discounts, capital loss carryforwards and losses deferred due to wash sales, straddles, and return of capital from investments.
The Funds may own shares of real estate investments trusts (“REITs”) which report information on the source of their distributions annually. Distributions received from investments in REITs in excess of income from underlying investments are recorded as realized gain and/or as a reduction to the cost of the individual REIT.
The Funds may invest in Master Limited Partnerships (“MLPs”), which generally are treated as partnerships for Federal income tax purposes. As a limited partner in the MLPs, the Fund includes its allocable share of the MLPs’ taxable income in computing its own taxable income.
| I. | Allocation of Expenses, Income, and Gains and Losses |
Expenses directly attributable to a Fund are charged to that Fund. Expenses specific to a class are charged to that class.
Expenses not directly attributable to the Fund are allocated proportionally among various Funds or all Funds within the
Trust in relation to the net assets of each Fund or on another reasonable basis. Income and realized and unrealized gains or losses on investments are allocated to each class of shares based on its relative net assets.
Costs incurred in connection with the offering and initial registration of the Funds have been deferred in conformity with GAAP and are being amortized to expense on a straight-line basis over the first twelve months after commencement of operations.
It is the policy of the Funds to qualify or continue to qualify as a regulated investment company by complying with the provisions available to certain investment companies, as defined in applicable sections of the Internal Revenue Code, and to make distributions of net investment income and net realized capital gains sufficient to relieve it from all, or substantially all, federal income taxes.
Withholding taxes on foreign interest, dividends and capital gains with respect to the Funds have been provided for in accordance with each applicable country’s tax rules and rates.
As of October 31, 2013, the tax cost of securities and the breakdown of unrealized appreciation (depreciation) for each Fund was as follows:
| | | | | | | | | | | | | | | | |
| Fund | | Tax Cost of
Securities | | | Unrealized
Appreciation | | | Unrealized
Depreciation | | | Net Unrealized
Appreciation/
(Depreciation)* | |
World Income Fund | | $ | 38,219,818 | | | $ | 2,420,519 | | | $ | (1,750,786 | ) | | $ | 669,733 | |
Income Generation Fund | | | 2,254,532 | | | | 43,923 | | | | (2,368 | ) | | | 41,555 | |
| * | The differences between the book-basis unrealized appreciation/(depreciation) are attributable primarily to: tax deferral of losses on wash sales, mark-to-market adjustments on passive foreign investment companies and tax adjustments related to underlying investments in partnerships, grantor trusts, trust preferred securities and real estate investment trusts. |
The tax character of distributions paid during the fiscal year ended October 31, 2013, was as follows:
| | | | | | | | | | | | | | | | | | | | |
| | | Distributions Paid From* | | | | | | | | | | |
| Fund | | Ordinary
Income | | | Net
Long-Term
Capital Gains | | | Total
Taxable
Distributions | | | Tax Return
of Capital | | | Total
Distributions
Paid | |
World Income Fund | | $ | 2,305,936 | | | $ | — | | | $ | 2,305,936 | | | $ | 49,053 | | | $ | 2,354,989 | |
Income Generation Fund | | | 91,944 | | | | — | | | | 91,944 | | | | — | | | | 91,944 | |
| * | The tax character of distributions paid may differ from the character of distributions shown on the statements of changes in net assets due to short-term capital gains being treated as ordinary income for tax purposes. |
The tax character of distributions paid during the fiscal year ended October 31, 2012, was as follows:
| | | | | | | | | | | | | | | | | | | | |
| | | Distributions Paid From* | | | | | | | | | | |
| Fund | | Ordinary
Income | | | Net
Long-Term
Capital Gains | | | Total
Taxable
Distributions | | | Tax Return
of Capital | | | Total
Distributions
Paid | |
World Income Fund | | $ | 1,648,814 | | | $ | — | | | $ | 1,648,814 | | | $ | 245,154 | | | $ | 1,893,968 | |
Income Generation Fund | | | 3,738 | | | | — | | | | 3,738 | | | | — | | | | 3,738 | |
| * | The tax character of distributions paid may differ from the character of distributions shown on the statements of changes in net assets due to short-term capital gains being treated as ordinary income for tax purposes. |
Annual Shareholder Report
19
Notes to Financial Statements (Continued)
As of October 31, 2013, the components of accumulated earnings (deficit) on a tax basis were as follows:
| | | | | | | | | | | | | | | | | | | | | | | | | | | | |
| Fund | | Undistributed
Ordinary
Income | | | Undistributed
Long-Term
Capital Gains | | | Accumulated
Earnings | | | Other
Temporary
Differences | | | Accumulated
Capital and
Other
Losses | | | Unrealized
Appreciation
(Depreciation) | | | Total
Accumulated
Earnings
(Deficit) | |
World Income Fund | | $ | — | | | $ | — | | | $ | — | | | $ | (38,255 | ) | | $ | (3,245,602 | ) | | $ | 758,121 | | | $ | (2,525,736 | ) |
Income Generation Fund | | | 24,618 | | | | 294 | | | | 24,912 | | | | — | | | | — | | | | 41,555 | | | | 66,467 | |
On December 22, 2010, the Regulated Investment Company Modernization Act of 2010 (the “Act”) was enacted, which changed various technical rules governing the tax treatment of regulated investment companies. The changes are generally effective for taxable years beginning after the date of enactment. One of the more prominent changes addresses capital loss carryforwards. Under the Act, each Fund will be permitted to carry forward capital losses incurred in taxable
years beginning after the date of enactment for an unlimited period. However, any losses incurred during those future taxable years will be required to be utilized prior to the losses incurred in pre-enactment taxable years, which carry an expiration date. As a result of this ordering rule, pre-enactment capital loss carryforwards may be more likely to expire unused. Additionally, post-enactment capital loss carryforwards will retain their character as either short-term or long-term capital losses rather than being considered all short-term as permitted under previous regulation.
Losses incurred that will be carried forward under the provisions of the Act are as follows:
| | | | | | | | |
| | | Loss Carryforward Character | |
| Fund | | Short-Term | | | Long-Term | |
World Income Fund | | $ | 2,697,601 | | | $ | 548,001 | |
Management of the Funds has reviewed tax positions taken in tax years that remain subject to examination by all major tax
jurisdictions, including federal (i.e. the last four tax year ends and the interim tax period since then). Management believes there is no tax liability resulting from unrecognized tax benefits related to uncertain tax positions taken.
| L. | New Accounting Pronouncement |
In December 2011, Financial Accounting Standards Board issued Accounting Standards Update (“ASU”) No. 2011-11, Balance Sheet (Topic 210): Disclosures about Offsetting Assets and Liabilities (“ASU 2011-11”). ASU 2011-11 relates to disclosures about offsetting assets and liabilities. In January 2013, the Financial Accounting Standards Board issued Accounting Standards Update No. 2013-01, Clarifying the Scope of Disclosures about Offsetting Assets and Liabilities (“ASU 2013-01”). This update gives additional clarifications to ASU 2011-11. The amendments in ASU 2013-01 require an entity to disclose information about offsetting and related arrangements to enable user of its financial statements to understand the effect of those arrangements on its financial position. ASU 2013-01 is effective for annual reporting periods beginning on or after January 1, 2013, and interim periods within those annual periods. At this time, management is evaluating the implications of ASU 2013-01 and its impact on the financial statements. However, management believes the adoption of these ASUs will not have a material impact on the financial statements.
| (3) | Investment Advisory Fee and Other Transactions with Affiliates |
Investment Advisory Fee—The Adviser, a subsidiary of Huntington, serves as the Funds’ investment adviser. The World Income Fund pays the Adviser a fee for its services on a tiered schedule as shown below, computed daily and paid monthly. The Income Generation Fund pays the Adviser a fee for its services of 0.10% of its average daily net assets, computed daily and paid monthly.
| | | | | | | | |
| Fund | | Tier | | | Annual Rate | |
World Income Fund | | | Up to $500 million | | | | 0.50 | % |
| | On the next $ | 500 million to $1 billion | | | | 0.45 | % |
| | | | On excess of $1 billion | | | | 0.40 | % |
Huntington and the Adviser may also pay out of their profits and other resources (including those of their affiliates) advertising, marketing, and other expenses for the benefit of the Fund.
Effective November 30, 2012, the Adviser has agreed to contractually waive all or a portion of its investment advisory fee for the World Income Fund (based on average daily net assets) to which it is otherwise entitled to receive and/or to reimburse certain operating expenses of the World Income Fund in order to limit the total direct net annual operating expenses and acquired (underlying) fund operating expenses to not more than 1.10% and 1.35% of Trust Shares and
Class A Shares, respectively, through February 27, 2015. Prior to November 30, 2012, the Adviser agreed to voluntarily waive 0.25% of its investment advisory fee for the World Income Fund (based on average daily net assets). Any amounts waived or reimbursed under this voluntary agreement are not subject to repayment by the World Income Fund. For the period from November 1, 2012 through November 29, 2012, the Adviser voluntarily waived $7,294.
The Adviser has agreed to contractually waive all or a portion of its investment advisory fee for the Income Generation Fund (based on average daily net assets) to which it is otherwise entitled to receive and/or to reimburse certain operating
Annual Shareholder Report
20
expenses of the Income Generation Fund in order to limit the total direct net annual operating expenses and acquired (underlying) fund operating expenses to not more than 1.24% and 1.99% of Trust Shares and Class C Shares, respectively, through August 31, 2014.
Amounts waived or reimbursed in the contractual period may be recouped by the Adviser within three years of the waiver and/or reimbursement. As of October 31, 2013, the following amounts have been waived or reimbursed by the Adviser and are subject to repayment by the respective Fund:
| | | | | | | | |
| Fund | | Amount
Waived or
Reimbursed | | | Expiring
Beginning
October 31, | |
World Income Fund | | $ | 212,080 | | | | 2016 | |
Income Generation Fund | | $ | 38,466 | | | | 2015 | |
| | | $ | 107,644 | | | | 2016 | |
Administrative Fees—Huntington Asset Services, Inc. (“HASI”), an affiliate of Huntington, is the Administrator to the Trust. As Administrator, HASI provides the Funds with certain administrative services and fund accounting services. The fees paid for these services are based on the level of average net assets of each Fund for the period, subject to minimum fees in certain circumstances.
| | |
Maximum Administrative Fee | | Average Daily Net Assets of the Trust |
0.1822% | | On the first $4 billion |
0.1650% | | On the next $2 billion |
0.1575% | | On the next $2 billion |
0.1450% | | On assets in excess of $8 billion |
There is no minimum annual fee per fund or class of shares.
Distribution and Shareholder Services Fees—The Funds have adopted a Distribution Plan (the “Plan”) pursuant to Rule 12b-1 under the 1940 Act. Under the terms of the Plan, the Funds will compensate qualified intermediaries for distribution services not to exceed 0.25% of the daily net assets of the World Income Fund’s Class A Shares and not to exceed 1.00% of the daily net assets of the Income Generation Fund’s Class C Shares. Trust Shares are not subject to Rule 12b-1 fees. For the year ended October 31, 2013, the World Income and Income Generation Funds paid $16,544 and $20,242, respectively, to affiliated broker-dealers of the Funds.
Class A Shares, Class C Shares and Trust Shares are also subject to a shareholder services fee not to exceed 0.25% of
the daily net assets of such shares. For the year ended October 31, 2013, Huntington and its affiliates received $11,710 in shareholder service fees from the World Income Fund.
In addition, Unified Financial Securities, Inc. (“Unified”), the Funds’ distributor, is entitled to receive commissions on sales of the Class A Shares of the World Income Fund. For the year ended October 31, 2013, Unified received underwriter commissions of $3,584 earned on sales of Class A Shares.
Transfer and Dividend Disbursing Agent Fees and Expense—HASI is the transfer and dividend disbursing agent for the Funds. For its services, HASI receives a yearly fixed amount per shareholder account, subject to a yearly minimum fee of $12,000 for each of the Funds. HASI is also entitled to receive additional amounts that may be activity or time-based charges, plus reimbursement for out-of-pocket expenses.
Custodian Fees—Huntington serves as custodian for each of the Funds. Brown Brothers Harriman serves as sub-custodian for the Fund’s foreign assets. Huntington and Brown Brothers Harriman receive fees based on the level of the Fund’s average daily net assets for the period, plus out-of-pocket expenses.
Compliance Services—The Trust has contracted with Huntington to provide a Chief Compliance Officer to the Trust, for which it pays Huntington $135,188 annually.
General—Certain officers of the Trust are Officers, Directors and/or Trustees of the above companies.
Trustees and Officers affiliated with the Advisor are not compensated by the Trust for their services. Each Trustee who is not an “interested person” of the Trust, as such term is defined in the 1940 Act, receives a $25,000 annual retainer plus $2,500 per regular Board meeting. The Audit Committee Chairman receives a $33,000 annual retainer plus $2,500 per regular board meeting. The Independent Chairman of the Board receives a $50,000 annual retainer plus $2,500 per Board meeting. The Board or a committee may establish ad hoc committees or sub-committees. Any committee or sub-committee member may be compensated by the Funds for incremental work outside of the regular meeting process based on the value added to the Funds. In addition, the Funds reimburse Trustees who are not employees of or affiliated with the Adviser for out-of-pocket expenses incurred in conjunction with attendance at meetings.
Pursuant to an exemptive order issued by the Securities and Exchange Commission, the Funds may invest in a certain affiliated money market funds which are managed by the Adviser. Income distributions earned from investments in these funds are recorded as income from affiliates in the accompanying financial statements. A summary of each Fund’s investment in such affiliated money market funds is set forth below:
| | | | | | | | | | | | | | | | | | | | |
| Huntington Money Market Fund | | 10/31/2012
Market Value | | | Purchases | | | Sales | | | 10/31/2013
Market Value | | | Income | |
World Income Fund | | $ | 1,270,934 | | | $ | 2,403,209 | | | $ | (3,674,143 | ) | | $ | — | | | $ | 4 | |
Annual Shareholder Report
21
Notes to Financial Statements (Continued)
| | | | | | | | | | | | | | | | | | | | |
| Huntington U.S. Treasury Money Market Fund | | 10/31/2012
Market Value | | | Purchases | | | Sales | | | 10/31/2013
Market Value | | | Income | |
World Income Fund | | $ | — | | | $ | 29,182,362 | | | $ | (28,174,676 | ) | | $ | 1,007,686 | | | $ | 435 | |
Additionally, Income Generation Fund invests in other funds within the Trust. A summary of the investments in affiliated funds is set forth below:
| | | | | | | | | | | | | | | | | | | | |
| Income Generation Fund | | 10/31/2012
Market Value | | | Purchases | | | Sales | | | 10/31/2013
Market Value | | | Income | |
Huntington Money Market Fund | | $ | 86,588 | | | $ | 284,310 | | | $ | (370,898 | ) | | $ | — | | | $ | 1 | |
Huntington U.S. Treasury Money Market Fund | | | — | | | | 1,169,174 | | | | (1,169,174 | ) | | | — | | | | 59 | |
Huntington Disciplined Equity Fund | | | — | | | | 450,000 | | | | (302,900 | ) | | | 167,347 | | | | — | |
Huntington Dividend Capture Fund | | | 298,120 | | | | 146,266 | | | | (230,645 | ) | | | 245,883 | | | | 11,418 | |
Huntington Income Equity Fund | | | 231,036 | | | | 330,011 | | | | (479,806 | ) | | | 111,998 | | | | 5,067 | |
Huntington World Income Fund | | | 986,317 | | | | 1,066,142 | | | | (281,300 | ) | | | 1,770,859 | | | | 92,117 | |
| (4) | Income Generation Fund Structure |
The Income Generation Fund, in accordance with its prospectus, seeks to achieve its investment objective by investing in other investment companies (“Underlying Funds”) with similar investment objectives. As a result, investors in the Income Generation Fund incur expenses of both the Income Generation Fund and Underlying Funds, including transaction costs related to the purchases and sales of Underlying Fund shares.
| (5) | Investment Transactions |
Purchases and sales of investments, excluding short-term securities and U.S. government securities, for the year ended October 31, 2013, were as follows:
| | | | | | | | |
| Fund | | Purchases | | | Sales | |
World Income Fund | | $ | 34,831,128 | | | $ | 41,203,000 | |
Income Generation Fund | | | 1,992,419 | | | | 1,294,651 | |
The Funds made no purchases or sales of long-term U.S. government securities for the year ended October 31, 2013.
| (6) | Foreign Investment Risk |
Compared with investing in the United States, investing in foreign markets involves a greater degree and variety of risk.
Investors in international or foreign markets may face delayed settlements, currency controls and adverse economic developments as well as higher overall transaction costs. In addition, fluctuations in the U.S. dollar’s value versus other currencies may erode or reverse gains from investments denominated in foreign currencies or widen losses. Foreign governments may expropriate assets, imposed capital or currency controls, impose punitive taxes, impose limits on ownership or nationalize a company or industry. Any of these actions could have severe effect on security prices and impair the Funds ability to bring its capital or income back to the U.S. Exchange rate fluctuations also may impair an issuer’s ability to repay U.S. dollar denominated debt, thereby increasing credit risk of such debt. Finally, the value of foreign securities may be affected by incomplete, less frequent or inaccurate financial information about their issuers, social upheavals or political actions ranging from tax code changes to government collapse. Foreign companies may also receive less coverage than U.S. companies by market analysts, and financial reporting standards or regulatory requirements may not be comparable to those applicable to U.S. companies.
The Trust participates in a short-term credit agreement (“Line of Credit”) with Citibank N.A. (“Citi”). Under the terms of the agreement, the Trust may borrow up to $20 million. The purpose of the agreement is to meet temporary or emergency cash needs, including redemption requests that might otherwise require the untimely disposition of securities. Citi receives an annual facility fee of 0.10% on $20 million for providing the Line of Credit. Each fund in the Trust pays a pro-rata portion of this facility fee plus any interest on amounts borrowed. For the year ended October 31, 2013, the following Funds had borrowings under this Line of Credit:
| | | | | | | | | | | | | | | | | | | | |
| Fund | | Average
Loan Balance | | | Weighted
Average
Interest Rate | | | Number of
Days
Outstanding* | | | Interest
Expense
Incurred | | | Maximum
Loan
Outstanding | |
World Income Fund | | $ | 197,405 | | | | 1.41 | % | | | 1 | | | $ | — | | | $ | 197,405 | |
Income Generation Fund | | | 927,653 | | | | 1.36 | % | | | 1 | | | | 35 | | | | 927,653 | |
| * | Number of Days Outstanding represents the total days during the year ended October 31, 2013 that each Fund utilize the Line of Credit. |
As of October 31, 2013, the Funds had no outstanding borrowings under this Line of Credit.
Annual Shareholder Report
22
| (8) | Other Tax Information (unaudited) |
For the year ended October 31, 2013, certain dividends paid by the Funds may be subject to a maximum tax rate of 15% as provided by the Jobs and Growth Tax Relief Reconciliation Act of 2003. The Funds intend to designate the maximum amount allowable as taxed at a maximum rate of 15%. Complete information will be reported in conjunction with your 2013 Form 1099-DIV.
For the year ended October 31, 2013, the following Funds paid qualified dividend income:
| | | | |
| Fund | | Qualified
Dividend
Income | |
World Income Fund | | | 36.4 | % |
Income Generation Fund | | | 40.6 | % |
For the taxable year ended October 31, 2013, the following percentage of ordinary income dividends paid by the Funds qualify for the dividends received deduction available to corporations:
| | | | |
| Fund | | Dividends
Received
Deduction | |
World Income Fund | | | 38.2 | % |
Income Generation Fund | | | 45.2 | % |
The Funds intend to elect to pass through to shareholders the income tax credit for taxes paid to foreign countries. Foreign source income and foreign tax expense per outstanding shares on October 31, 2013 are as follows:
| | | | | | | | |
| Fund | | Foreign
Source
Income | | | Foreign
Tax
Expense | |
World Income Fund | | | 0.27 | | | | 0.02 | |
The pass-through of the foreign tax credit will only affect those persons who are shareholders on the dividend record date in October 2013. These shareholders will receive more detailed information along with the 2013 Form 1099-DIV.
Effective December 13, 2013, the Trust Shares of the Funds will become Institutional Shares with the same rights, privileges and expenses as the Trust Shares. Also on December 13, 2013, World Income Fund will begin offering Class C Shares and Income Generation Fund will begin offering Class A Shares. These share classes offer different rights, privileges, exchange options and expenses to other share classes within their respective funds. Finally, the Advisor has contractually agreed to waive all or a portion of its management fee and/or reimburse certain operating expenses of the World Income Fund to the extent necessary in order to limit the Fund’s total annual direct fund operating expenses and acquired (underlying) fund operating expenses (after the fee waivers and/or expense reimbursements, and exclusive of brokerage costs, interest, taxes and dividends, and extraordinary expenses) to not more than 0.74%, 0.99% and 1.49% of the Institutional (formerly Trust) Shares, Class A Shares and Class C Shares daily net assets, respectively, through February 27, 2015. This arrangement may only be terminated prior to this date with the agreement of the Fund’s Board of Trustees.
Annual Shareholder Report
23
|
| Report of Independent Registered Public Accounting Firm |
The Board of Trustees and Shareholders of the Huntington Funds:
We have audited the accompanying statements of assets and liabilities of the Huntington World Income Fund and Huntington Income Generation Fund (two of the portfolios constituting The Huntington Funds, collectively referred to as the “Funds”), including the portfolios of investments, as of October 31, 2013 and the related statements of operations for the year then ended, the statements of changes in net assets for each of the two periods in the period then ended, and the financial highlights for each of the periods indicated therein. These financial statements and financial highlights are the responsibility of the Funds’ management. Our responsibility is to express an opinion on these financial statements and financial highlights based on our audits.
We conducted our audits in accordance with the standards of the Public Company Accounting Oversight Board (United States). Those standards require that we plan and perform the audits to obtain reasonable assurance about whether the financial statements and financial highlights are free of material misstatement. We were not engaged to perform an audit of the Funds’ internal control over financial reporting. Our audits included consideration of internal control over financial reporting as a basis for designing audit procedures that are appropriate in the circumstances, but not for the purpose of expressing an opinion on the effectiveness of the Funds’ internal control over financial reporting. Accordingly, we express no such opinion. An audit also includes examining, on a test basis, evidence supporting the amounts and disclosures in the financial statements and financial highlights, assessing the accounting principles used and significant estimates made by management, and evaluating the overall financial statement presentation. Our procedures included confirmation of securities owned as of October 31, 2013, by correspondence with the custodians and brokers or by other appropriate auditing procedures where replies from brokers were not received. We believe that our audits provide a reasonable basis for our opinion.
In our opinion, the financial statements and financial highlights referred to above present fairly, in all material respects, the financial position of each of the Huntington Funds referred to above at October 31, 2013, the results of their operations for the year then ended, the changes in their net assets for each of the periods in the period then ended, and financial highlights for each of the periods indicated therein, in conformity with U.S. generally accepted accounting principles.

Columbus, Ohio
December 30, 2013
Annual Shareholder Report
24
Supplemental Information (Unaudited)
Shareholder Expense Examples
Fund Expenses— As a shareholder of a Fund, you incur two types of costs: (1) transaction costs, which may include sales charges (loads) on purchase payments, contingent deferred sales charges on redemptions; and (2) ongoing costs, including management fees, distribution and service fees; and other Fund expenses. These examples are intended to help you understand your ongoing costs (in dollars) of investing in the Fund and to compare these costs with the ongoing costs of investing in other mutual funds.
This example is based on an investment of $1,000 invested at the beginning of the period and held for the entire period May 1, 2013 to October 31, 2013.
Actual Expenses—The “Actual” lines of the table provide information about actual account values and actual expenses. You may use the information on this line for the class of shares you hold, together with the amount you invested, to estimate the expenses that you paid over the period. Simply divide your account value by $1,000.00 (for example, an $8,600.00 account value divided by $1,000.00 = 8.60), then multiply the result by the number in the “Actual” line under the heading
entitled “Expenses Paid During Period” to estimate the expenses you paid on your account during this period.
Hypothetical Example for Comparison Purposes—The “Hypothetical” lines of the table provide information about hypothetical account values and hypothetical expenses based on the Fund’s actual expense ratios for each class of shares and an assumed rate of return of 5% per year before expenses, which are not the Fund’s actual returns. The hypothetical account values and expenses may not be used to estimate the actual ending account balance or expenses you paid for the period. You may use this information to compare the ongoing costs of investing in the Fund and other funds. To do so, compare the 5% hypothetical examples with the 5% hypothetical examples that appear in the shareholder reports of other funds.
Please note that the expenses shown in the table are meant to highlight your ongoing costs only and do not reflect any transactional costs. Therefore, the “Hypothetical” lines of the table are useful in comparing ongoing costs only, and will not help you determine the relative total costs of owning different funds. In addition, if these transactional costs were included, your costs would have been higher.
| | | | | | | | | | | | | | | | | | |
| | | | | Beginning
Account Value,
May 1, 2013 | | | Ending
Account Value,
October 31, 2013 | | | Expenses Paid During Period(1) | | | Annualized Expense Ratio | |
World Income Fund | | | | | | | | | | | | | | | | | | |
Trust Shares | | Actual | | $ | 1,000.00 | | | $ | 1,023.30 | | | $ | 2.60 | | | | 0.51 | % |
| | | Hypothetical (2) | | $ | 1,000.00 | | | $ | 1,022.63 | | | $ | 2.60 | | | | 0.51 | % |
Class A Shares | | Actual | | $ | 1,000.00 | | | $ | 972.10 | | | $ | 4.10 | | | | 0.82 | % |
| | | Hypothetical (2) | | $ | 1,000.00 | | | $ | 1,021.05 | | | $ | 4.20 | | | | 0.82 | % |
| (1) | Expenses are equal to the Fund’s annualized expense ratios, multiplied by the average account value over the period, multiplied by 184/365 (to reflect the one-half year period). The annualized expense ratios reflect reimbursement of expenses by the Funds’ Adviser for the period beginning May 1, 2013 through October 31, 2013. The “Financial Highlights” tables in the Funds’ financial statements, included in the report, also show the gross expense ratios, without such reimbursements. |
| (2) | Hypothetical assumes 5% annual return before expenses. |
| | | | | | | | | | | | | | | | | | |
| | | | | Beginning
Account Value,
May 1, 2013 | | | Ending
Account Value,
October 31, 2013 | | | Expenses Paid During Period | | | Annualized Expense Ratio | |
Income Generation Fund | | | | | | | | | | | | | | | | | | |
Trust Shares | | Actual (1) | | $ | 1,000.00 | | | $ | 1,034.10 | | | $ | 1.59 | | | | 0.31 | % |
| | | Hypothetical (2) | | $ | 1,000.00 | | | $ | 1,023.64 | | | $ | 1.59 | | | | 0.31 | % |
Class C Shares | | Actual (1) | | $ | 1,000.00 | | | $ | 1,019.30 | | | $ | 5.53 | | | | 1.09 | % |
| | | Hypothetical (2) | | $ | 1,000.00 | | | $ | 1,019.73 | | | $ | 5.53 | | | | 1.09 | % |
| (1) | Expenses are equal to the Fund’s annualized expense ratios, multiplied by the average account value over the period, multiplied by 184/365 (to reflect the one-half year period). The annualized expense ratios reflect reimbursement of expenses by the Funds’ Adviser for the period beginning May 1, 2013 through October 31, 2013. The “Financial Highlights” tables in the Funds’ financial statements, included in the report, also show the gross expense ratios, without such reimbursements. |
| (2) | Hypothetical assumes 5% annual return before expenses. |
Annual Shareholder Report
25
Board of Trustees and Trust Officers
Independent Trustees Background
| | |
Name Age Positions Held with Trust Date Service Began | | Principal Occupation(s) During Past Five Years, Previous Position(s) and Other Directorships Held |
Thomas J. Westerfield* Age: 58 CHAIRMAN OF THE BOARD AND TRUSTEE Began serving: January 2001 | | Principal Occupation(s): Chairman of the Board and Of Counsel, Dinsmore & Shohl LLP (law firm) (August 2005 to present). Previous Position(s): Of Counsel, Cors & Bassett LLC (law firm) (1993-2005). Other Directorships Held: Board Member, Huntington Strategy Shares. |
Eddie R. Munson Age: 62 TRUSTEE Began Serving: June 2012 | | Principal Occupation(s): Retired (September 2006 to present). Previous Position(s): Certified Public Accountant, KPMG LLP (June 1972 to September 2006). Other Directorships Held: Board Member, Huntington Strategy Shares; Board Member, Bearingpoint (2006 to 2008); Board Member, United American Healthcare (September 2006 to June 2008); Board Member, Caraco (June 2011 to December 2011). |
David S. Schoedinger Age: 70 TRUSTEE Began serving: May 1990 | | Principal Occupation(s): Funeral Director, Schoedinger Funeral Service (1965 to present); CEO, Schoedinger Financial Services, Inc. (1987 to present). Other Directorships Held: Board Member, Huntington Strategy Shares. |
Mark D. Shary Age: 53 TRUSTEE Began serving: November 2010 | | Principal Occupation(s): Managing Director, ET Partner (consulting) (2008 to present); Private investor (2007 to present). Previous Position(s): Chief Executive Officer and President, BestTransport.com, Inc. (2003 to 2007); President, Bostech Corporation (2000 to 2002). Other Directorships Held: Board Member, Huntington Strategy Shares; Director, SafeWhite, hc1.com, Updox, MBA Focus, InnerApps, and Vantage Point Logistics (all private companies); Trustee, TechColumbus (non-profit); Director, Healthcare.com (1998-2000) (public company). |
William H. Zimmer, III Age: 59 TRUSTEE Began Serving: December 2006 | | Principal Occupation(s): Chief Executive Officer, Cintel Federal Credit Union, (January 2011 to present). Previous Position(s): Consultant, WHZIII, LLC (March 2009 to January 2011); Assistant Treasurer, Dana Holding Corp. (September 2006 to February 2009) (manufacturing); Vice President and Manager, Global Treasury Management, National City Bank (January 2004 to March 2006); Vice President, Treasury Management Operations, Provident Bank (June 2003 to January 2004); Financial Consultant (April 2001 to June 2003). Other Directorships Held: Board Member, Huntington Strategy Shares. |
| * | Thomas J. Westerfield became Chairman of the Funds on February 14, 2013. |
Officers
| | |
Name Age Positions Held with Trust Address Date Service Began | | Principal Occupation(s) and Previous Position(s) |
Joseph L. Rezabek Age: 45 PRESIDENT 37 West Broad Street Columbus, OH 43215 Began Serving: February 2013 | | Principal Occupation(s): President, Huntington Asset Services, Inc. (“HASI”) (March 2012 to present); President, Huntington Strategy Shares (February 2013 to present). Previous Position(s): Managing Director and Head of Fund Services, Citi (2006 to 2012); Chief Operating Officer (Milan, Italy), State Street Corporation (1999 to 2006). |
R. Jeffrey Young Age: 49 CHIEF EXECUTIVE OFFICER 37 West Broad Street Columbus, OH 43215 Began Serving: February 2010 | | Principal Occupation(s): Senior Vice President, HASI (January 2010 to present); Chief Executive Officer, Huntington Strategy Shares (November 2010 to present); Chairman of the Board, Valued Advisers Trust (June 2010 to present); Chief Executive Officer and President, Valued Advisers Trust (January 2010 to present). Previous Position(s): President and Chief Executive Officer, Dreman Contrarian Funds (March 2011 to February 2013); Independent Chair, Valued Advisers Trust (August 2008 to Janaury 2010); Managing Director, WealthStone (2007 to 2009); Senior Vice President, Operations, BISYS Fund Services (2006 to 2007); Senior Vice President/Vice President, Client Services, BISYS Fund Services (1994 to 2006). |
Annual Shareholder Report
26
| | |
Name Age Positions Held with Trust Address Date Service Began | | Principal Occupation(s) and Previous Position(s) |
Martin R. Dean Age: 50 ANTI-MONEY LAUNDERING OFFICER AND CHIEF COMPLIANCE OFFICER 37 West Broad Street Columbus, OH 43215 Began Serving: July 2013 | | Principal Occupation(s): Senior Vice President and Compliance Group Manager, HASI (July 2013 to present); Anti-Money Laundering Officer and Chief Compliance Officer, Huntington Strategy Shares (July 2013 to present). Previous Position(s): Director and Fund Accounting and Fund Administration Product Manager, Citi (2008 to June 2013); Senior Vice President/Vice President, Fund Administration, Citi (formerly, BISYS Fund Services) (May 1994 to 2008) |
Matthew J. Miller Age: 37 VICE PRESIDENT 2960 N. Meridian St., Ste 300 Indianapolis, IN 46208 Began Serving: February 2010 | | Principal Occupation(s): Vice President, Relationship Management, HASI (2008 to present). Previous Position(s): Vice President, Transfer Agency Operations, HASI (2002 to 2008). |
Bryan W. Ashmus Age: 40 TREASURER 37 West Broad Street Columbus, OH 43215 Began Serving: November 2013 | | Principal Occupation(s): Vice President, Financial Administration, HASI (September 2013 to present); Treasurer, Huntington Strategy Shares (November 2013 to present). Previous Position(s): Vice President, Treasurer Services, Citi (May 2005 to September 2013). |
Jay S. Fitton Age: 43 SECRETARY 3805 Edwards Road Cincinnati, OH 45209 Began Serving: February 2012 | | Principal Occupation(s): Vice President of Legal Administration, HASI (November 2011 to present); Secretary, Huntington Strategy Shares (October 2012 to present). Previous Position(s): Vice President and Senior Counsel, J.P. Morgan Chase (April 2007 to November 2011). |
Annual Shareholder Report
27
Investment Contract Review Disclosure
BOARD OF TRUSTEES’ CONSIDERATION OF INVESTMENT ADVISORY AGREEMENT FOR THE HUNTINGTON INCOME GENERATION FUND AND HUNTINGTON WORLD INCOME FUND (the “Funds”)
The Board of Trustees is responsible for determining whether to approve the Funds’ investment advisory agreement. At a meeting held on August 19, 2013, the Board unanimously approved the investment advisory agreement between the Adviser and the Funds (the “Advisory Agreement”). Pursuant to the Advisory Agreement between the Adviser and the Funds, the Adviser provides advisory services to the Funds.
During the review process, the Board received assistance and advice from, and met separately with, independent legal counsel. In approving the Advisory Agreement, the Board, including a majority of the independent Trustees, considered many factors, the most significant of which were: (1) the nature of the services provided to the Funds by the Adviser in relation to the advisory fees; (2) the individual performance of the Funds; (3) the Adviser’s costs and the profits realized through providing the Funds with advisory services; (4) whether the Adviser has realized or may realize economies of scale in providing services to the Funds and if these economies are shared with the Funds; and (5) a comparison of the fees and performance of comparable funds.
Nature, Extent and Quality of Services in Relation to the Advisory Fees—In considering the nature, extent and quality of the services provided by the Adviser, the Board reviewed information relating to the Adviser’s operations and personnel. Among other things, the Adviser provided descriptions of its organizational and management structure, biographical information on its supervisory and portfolio management staff on a fund-by-fund basis, and financial information. The Adviser also provided a presentation of its past and current initiatives. The Trustees also took into account the financial condition of the Adviser with respect to its ability to provide the services required under the Advisory Agreement. The Board determined that the nature, extent and quality of the services provided by the Adviser, in relation to the advisory fees, were acceptable.
Individual Performance of the Funds—The Board reviewed each Fund’s short-term and long-term performance records and the Adviser’s management styles in relation to comparable funds and appropriate benchmarks. The Board noted that it reviews detailed information about each Fund’s performance on a quarterly basis. The Board also reviewed various comparative data for the Funds provided to them in connection with their consideration of the renewal of the Advisory Agreement, including, among other information, each Fund’s performance compared to similar funds based on information provided by Lipper Inc. (“Lipper”) for the time periods of one-year, three-years, five-years, ten-years and since inception, as applicable, ending March 31, 2013.
Advisor’s Costs and the Profits Realized Through Providing the Fund With Advisory Services—In considering the reasonableness of the advisory fees, the Board reviewed information provided by the Adviser setting forth all revenues and other benefits, both direct and indirect, received by the Adviser and its affiliates attributable to managing the Funds, the cost of providing such services and the resulting profitability to the Adviser and its affiliates from these relationships. The Trustees determined that the profitability of the Adviser was acceptable in relation to the nature and quality of services provided to the Funds.
Economies of Scale in Providing Services to the Funds and Whether These Economies Are Shared With the Funds—The Board considered the effect of each Fund’s growth and size on its performance and fees. The Board also noted that with the current renewal of the Advisory Agreement, the Advisory Agreement reflects the implementation of investment advisory fee breakpoints. The Board further noted that the administration fee charged to the Funds included fee breakpoints, which allowed the Funds to realize economies of scale as the assets of the Funds increase over time.
Comparison of the Fees and Performance of Comparable Funds—With respect to each Fund’s performance and fees, the Board considered comparisons to other mutual funds with comparable investment programs to be particularly useful, given the high degree of competition in the mutual fund business. The Board used Lipper peer group information provided by Strategic Insight, Inc. with respect to comparable fee and performance analysis for
Annual Shareholder Report
28
each of the Funds. The data for the fee and performance analysis was generated on an aggregate portfolio level since not all funds offer the same types of share classes. The Board also received information concerning fees charged by the Adviser to other accounts, but did not consider that information to be as relevant in light of the differences in services provided.
Other Considerations—In addition to the detailed review of the individual Funds below and among other data considered, the Board also requests and receives substantial and detailed information about the Funds and the Adviser on a regular basis. The Adviser provides much of this information at each regular meeting of the Board and furnishes additional reports in connection with the Board’s formal review of the Advisory Agreement. The Board may also receive information between regular meetings relating to particular matters as the need arises. The Board’s evaluation of the Advisory Agreement is informed by reports covering such matters as: the Adviser’s investment philosophy, personnel, and processes; operating strategies; each Fund’s short- and long-term performance (in absolute terms, both on a gross basis and net of expenses, as well as in relationship to its particular investment program and certain competitive funds and/or other benchmarks, as appropriate) and comments on reasons for performance. The Board also considered reports concerning each Fund’s expenses (including the advisory fee itself and the overall expense structure of each Fund, both in absolute terms and relative to similar and/or competing funds, with due regard for contractual or voluntary expense limitations); the use and allocation of brokerage commissions derived from trading the Fund’s portfolio securities; the nature and extent of the advisory and other services provided to the Funds by the Adviser and its affiliates; compliance and audit reports concerning the Funds (including communications from regulatory agencies), as well as the Adviser’s responses to any issues raised therein; and relevant developments in the mutual fund industry and how the Funds and the Adviser are responding to them. In the course of their deliberations regarding the Advisory Agreements, the Board also evaluated, among other things, the Adviser’s ability to supervise the Funds’ other service providers and its compliance program.
The Board based its decision to approve the Advisory Agreement on the totality of the circumstances and relevant factors and with a view to past and future long-term considerations. Not all of the factors and considerations identified above are relevant to the Funds, nor does the Board consider any one of them to be determinative. With respect to the factors that are relevant, the Board’s decision to approve the Advisory Agreement reflects its determination that the Adviser’s performance and actions provide an acceptable basis to support the decision to continue the existing arrangements.
While attention was given to all information furnished, the following discusses the primary factors relevant to the Board’s decisions. The Board concluded that the Funds’ advisory and total fees were reasonable in light of the quality and nature of services provided by the Adviser and its affiliates.
World Income Fund
Among other data considered, the Board noted that the Fund underperformed the median and average of its Lipper peer group for the one-year and since-inception periods ended March 31, 2013. The Board also noted that the Fund outperformed its benchmark for the one-year period ended June 30, 2013, and underperformed its benchmark for the since-inception period ended June 30, 2013. The Board also noted that the Fund’s combined advisory/administrative fee is below the average and median of its Lipper peer group and its total net fees are below the median and average of its Lipper peer group. The Board took into account management’s discussion of the Fund’s performance, including the impact of market conditions.
Income Generation Fund
Among other data considered, the Board noted that the Fund underperformed the median and average of its Lipper peer group for the since-inception period ended March 31, 2013. The Board also noted that the Fund outperformed its benchmark for the since-inception period ended June 30, 2013. The Board also noted that the Fund’s combined advisory/administrative fee is below the average and median of its Lipper peer group and its total net fees are below the median and average of its Lipper peer group. The Board took into account management’s discussion of the Fund’s performance, including the impact of market conditions.
Annual Shareholder Report
29
VOTING PROXIES ON FUND PORTFOLIO SECURITIES
A copy of the policies and procedures that the Funds use to determine how to vote proxies relating to securities held in the Funds’ portfolios, as well as a record of how the Funds voted any such proxies during the most recent 12-month period ended June 30, is available without charge and upon request by calling 1-800-253-0412 or at www.huntingtonfunds.com. This information is also available from the EDGAR database on the SEC’s website at www.sec.gov.
QUARTERLY PORTFOLIO SCHEDULE
The Funds file with the SEC a complete schedule of their portfolio holdings, as of the close of the first and third quarters of their fiscal year, on “Form N-Q.” These filings are available on the SEC’s website at www.sec.gov and may be reviewed and copied at the SEC’s Public Reference Room in Washington, DC. (call 1-202-551-8090 for information on the operation of the Public Reference Room.) You may also access this information at www.huntingtonfunds.com by selecting “Form N-Q”.
The Huntington National Bank, a subsidiary of Huntington Bancshares, Inc., is the Custodian of The Huntington Funds. Huntington Asset Services, Inc. serves as the Administrator and Fund Accountant and is affiliated with the Huntington National Bank. Additionally, Brown Brothers Harriman & Co. is the Sub-Custodian of certain of the Funds. Huntington Asset Advisors, Inc., a subsidiary of the Huntington National Bank, serves as Investment Adviser to the Funds. Unified Financial Securities, Inc. serves as the Distributor of The Huntington Funds and is affiliated with the Huntington National Bank.
Mutual funds, including money market funds, are not bank deposits or obligations, are not guaranteed by any bank, and are not insured or guaranteed by the U.S. government, the Federal Deposit Insurance Corporation, the Federal Reserve Board, or any other government agency. Investment in mutual funds involves investment risk, including the possible loss of principal. Although money market funds seek to preserve the value of your investment at $1.00 per share, it is possible to lose money by investing in the Funds.
This report is authorized for distribution to prospective investors only when preceded or accompanied by a prospectus which contains facts concerning the Funds’ objectives and policies, management fees, expenses and other information.
Distributed by Unified Financial Securities, Inc., 2960 North Meridian Street, Suite 300, Indianapolis, IN 46208. (Member FINRA)
| | |
| Huntington Shareholder Services: 800-253-0412 | | |
Item 2. Code of Ethics.
(a) As of the end of the period covered by the report, the registrant has adopted a code of ethics that applies to the registrant’s Principal Executive Officer and Principal Financial Officer.
(c) During the period covered by the report, with respect to the registrant’s code of ethics that applies to its Principal Executive Officer and Principal Financial Officer: there have been no amendments to a provision that relates to any element of the code of ethics definition enumerated in paragraph (b) of this Item 2.
(d) During the period covered by the report, with respect to the registrant’s code of ethics that applies to its Principal Executive Officer and Principal Financial Officer: there have been no waivers granted from a provision that relates to any element of the code of ethics definition enumerated in paragraph (b) of this Item 2.
Item 3. Audit Committee Financial Expert.
3(a)(1) The registrant’s Board of Trustees has determined that the registrant has at least one audit committee financial expert serving on its audit committee.
3(a)(2) The audit committee financial expert is William H. Zimmer III, who is “independent” for purposes of this Item 3 of Form N-CSR.
Item 4. Principal Accountant Fees and Services.
(a) Audit Fees billed to the registrant by its principal accountants for the two most recent fiscal years:
Fiscal year ended 2013: $18,233
Fiscal year ended 2012: $18,500
(b) Audit-Related Fees billed to the registrant by its principal accountants for the two most recent fiscal years:
Fiscal year ended 2013: $0
Fiscal year ended 2012: $0
Fees for 2013 and 2012 related to the agreed-upon review of items within the Management’s Discussion of Fund Performance sections of the Funds’ Form N-CSR filing. Amount requiring approval of the registrant’s audit committee pursuant to paragraph (c)(7)(ii) of Rule 2-01 of Regulation S-X, $0 and $0 respectively.
(c) Tax Fees billed to the registrant by its principal accountants for the two most recent fiscal years:
Fiscal year ended 2013: $7,173
Fiscal year ended 2012: $5,000
Fees for 2013 and 2012 related to the review of the registrant’s tax returns. Amount requiring approval of the registrant’s audit committee pursuant to paragraph (c)(7)(ii) of Rule 2-01 of Regulation S-X, $0 and $0 respectively.
(d) All other fees billed to the registrant by its principal accountants for the two most recent fiscal years:
Fiscal year ended 2013: $0
Fiscal year ended 2012: $0
Amount requiring approval of the registrant’s audit committee pursuant to paragraph (c)(7)(ii) of Rule 2-01 of Regulation S-X, $0 and $0 respectively.
(e)(1) Audit and Non-Audit Services Pre-Approval Policies and Procedures
Under the Sarbanes-Oxley Act of 2002 (the “Act”), the Audit Committee of the Board of Trustees of The Huntington Funds (the “Fund”) is responsible for the appointment, compensation and oversight of the work of the Fund’s independent auditor. As part of this responsibility, the Audit Committee is required to grant approval for audit and non-audit services performed by the independent auditor for the Fund in order assure that they do not impair the auditor’s independence from the Fund. In addition, the Audit Committee also must pre-approve its independent auditor’s engagement for non-audit services with the Fund’s investment adviser (not including a sub-adviser whose role is primarily portfolio management and is sub-contracted or overseen by another investment adviser) and any entity controlling, controlled by, or under common control with the investment adviser that provides ongoing services to the Fund, if the engagement relates directly to the operations and/or financial reporting of the Fund.
To implement these provisions of the Act, the Securities and Exchange Commission (the “SEC”) has issued rules specifying the types of services that the Fund’s independent auditor may not provide to the Fund, as well as the Audit Committee’s administration of the engagement of the independent auditor. Under these rules, the SEC has provided that a permissible approval of audit and non-audit services can take the form of either (i) a general pre-approval, or (ii) a specific pre-approval (where a specific type of service is authorized, generally subject to a fee maximum). General pre-approvals are authorized by SEC rules only subject to detailed policies and procedures. Unless a type of service has received general pre-approval, it will require specific pre-approval by the Audit Committee if it is to be provided by the independent auditor. Accordingly, the Audit Committee has adopted these Audit and Non-Audit Services Pre-Approval Policies and Procedures, which set forth the procedures and the conditions pursuant to which services for the Fund may be performed by the independent auditor under pre-approvals.
| II. | General Pre-Approval Policies |
It is the policy of the Audit Committee that audit and non-audit services to be performed by the Fund’s independent auditor be pre-approved only when in the best interests of the Fund’s shareholders and fully consistent with applicable law and, particularly, the maintenance of the auditor’s independence. In granting any pre-approval, consideration shall be given to:
1. the qualifications of the auditor to perform the services involved;
2. the proposed costs (which may be presented as an estimate or based on professional time charges subject to a ceiling) of the services and the reasonableness thereof;
3. the permissibility of the services under applicable rules and guidance of the SEC;
4. the effect, if any, of the performance of the proposed services on the auditor’s independence;
5. the effect of the compensation for the proposed services on the auditor’s independence; and
6. the effect, if any, of the proposed services on the Fund’s ability to manage or control risk or to improve audit quality.
In accordance with SEC rules, non-audit services performed by the Fund’s independent auditor may not include the following:
1. Bookkeeping or other services related to the accounting records or financial statements of the audit client;
2. Financial information systems design and implementation;
3. Appraisal or valuation services, fairness opinions or contribution-in-kind reports;
4. Actuarial services;
5. Internal audit outsourcing services;
6. Management functions or human resources;
7. Broker-dealer, investment adviser or investment banking services; and
8. Legal services and expert services unrelated to the audit.
| III. | Procedures for Pre-Approval by the Audit Committee |
1. Requests for pre-approval shall be in writing and may be made by either the independent auditors or by management of the Fund.
2. All requests for pre-approval shall be made to the full Audit Committee at regularly scheduled meetings thereof (or at a special meeting of the Audit Committee set to coincide with regular meetings of the Fund’s Board of Trustees) whenever practicable.
3. Under normal circumstances, requests for pre-approval should be presented at least 7 days prior (and in no event later than 48 hours prior) to the proposed commencement of the engagement.
4. If consideration of a request for pre-approval on the dates identified in Section III (2) would not be timely, the requesting party shall notify the Chairman of the Audit Committee. The Chairman of the Audit Committee shall then determine whether to schedule a special meeting of the Audit Committee (which may be conducted telephonically) on an alternative date or whether the request may appropriately be presented to a delegate of the Audit Committee under procedures set forth in Section IV below.
5. Requests for pre-approval may include, but are not limited to, the following services:
a. audit engagement, particularly for interim periods;
b. tax compliance, tax planning, and tax advice;
c. review and consents with respect to use of reports in post-effective amendments to the registration statements of the Fund;
d. review of IRS shareholder materials;
e. review and validation of fund procedures (e.g., valuation, interfund lending, etc.), and
f. market research and strategic insights.
6. Requests for pre-approval should identify the nature of the services to be provided in a manner sufficiently specific to allow evaluation of the considerations identified above in Section II.
In accordance with PCAOB Rule 3524, requests for pre-approval of permissible tax services by the independent auditor must have the following items described in writing for the audit committee:
a. the scope of the proposed tax service,
b. the fee structure for the engagement,
c. any side letters, amendments to the engagement letter or any other agreements, whether oral, written, or otherwise, relating to the service between the audit firm and the Funds, and
d. any compensation arrangements or other agreements between the audit firm and any third party with respect to promoting, marketing, or recommending a transaction covered by the proposed tax service.
The audit firm should discuss with the Audit Committee, the potential effect of the proposed tax service(s) on the audit firm’s independence.
7. Requests for pre-approval must include an assessment by the independent auditor of its independence should the request be granted and the proposed services rendered.
8. The Audit Committee’s action on a request for pre-approval shall be recorded in the Audit Committee’s minutes.
9. The Audit Committee’s action on a request for pre-approval shall be communicated in writing to the independent auditor and, under normal circumstances, a copy of this communication shall be provided to the Fund’s management.
10. The Audit Committee’s action on a request for pre-approval shall be reported to the full Board of Trustees.
11. Pre-approvals will be granted for a period of no more than one year.
| IV. | Procedures for Pre-Approval by a Delegate of the Audit Committee |
1. Where it has been determined by the Chairman of the Audit Committee that consideration of a request for pre-approval by the full Audit Committee would not be timely, the Chairman may determine that the request be presented to a member(s) of the Audit Committee appointed by the Audit Committee as its delegate (the “Delegate”) for this purpose. (As of the date of the adoption of these guidelines and procedures, the Chairman of the Audit Committee has been so appointed, and such appointment may be revoked or modified by the Audit Committee at any time.)
2. Requests for pre-approval shall be in writing and may be made by either the independent auditors or by management of the Fund.
3. Under normal circumstances, requests for pre-approval should be presented at least 7 days prior (and in no event later than 48 hours prior) to the proposed commencement of the engagement.
4. Requests for pre-approval may include, but are not limited to, the following services:
a. audit engagement, particularly for interim periods;
b. tax compliance, tax planning, and tax advice;
c. review and consents with respect to use of reports in post-effective amendments to the registration statements of the Fund;
d. review of IRS shareholder materials;
e. review and validation of fund procedures (e.g., valuation, interfund lending, etc.); and
f. market research and strategic insights.
5. Requests for pre-approval should identify the nature of the services to be provided in a manner sufficiently specific to allow evaluation of the considerations identified above in Section II.
6. Requests for pre-approval must include an assessment by the independent auditor of its independence should the request be granted and the proposed services rendered.
7. The Delegate’s action on a request for pre-approval shall be communicated in writing to the independent auditor, with a copy to each other member of the Audit Committee and, under normal circumstances, to the Fund’s management.
8. Pre-approvals by the Delegate shall be reviewed by the Audit Committee at a meeting held no later than the next scheduled meeting of the Board of Trustees or the Audit Committee, whichever occurs sooner. An earlier review shall be conducted upon the written request of one or more Audit Committee members addressed to the Chairman of the Audit Committee.
9. Pre-approvals by the Delegate may be modified or revoked by the Audit Committee, but will not absolve the Fund of its responsibility to compensate the independent auditor for services rendered prior to such modification or revocation.
10. The results of the Audit Committee’s review of the Delegate’s action on a request for pre-approval shall be recorded in the Audit Committee’s minutes and reported to the full Board of Trustees.
11. Pre-approvals will be granted by the Delegate for a period of no more than one year.
| V. | Procedures for Monitoring Engagements Authorized Under Pre-Approval Procedures |
The independent auditor shall inform the Audit Committee in writing upon the commencement of services rendered under a pre-approval. The independent auditor shall thereafter provide the Audit Committee with written quarterly progress reports within one month of the close of each calendar quarter detailing the work done and fees and other charges incurred during said calendar quarter. Should fees and expenses exceed those specified in a pre-approval (or appear likely to do so prior to completion of the work), the independent auditor or management shall so apprise the Audit Committee and an additional express approval or pre-approval must be obtained.
These Policies and Procedures may be amended or revoked at any time by the Audit Committee and shall be reviewed at least annually in conjunction with review of the Audit Committee Charter.
Adopted May 4, 2006 and revised February 14, 2007 and October 23, 2007
(e)(2) Percentage of services described in each of paragraphs (b) through (d) of this Item that were approved by the audit committee pursuant to paragraph (C)(7)(i)(C) of Rule 2-01 of Regulation S-X.
Fiscal year ended 2013- 0%
Fiscal year ended 2012- 0%
Percentage of services provided to the registrant’s investment adviser and any entity controlling, controlled by, or under common control with the investment adviser that provides ongoing services to the registrant that were approved by the registrant’s audit committee pursuant to paragraph (C)(7)(i)(C) of Rule 2-01 of Regulation S-X, 0% and 0% respectively.
(f) Not applicable.
(g) The aggregate non-audit fees billed by Ernst and Young LLP for the Funds and certain entities (including the adviser (excluding sub-adviser) and any entity controlling, controlled by or under common control with the advisor that provides ongoing services to the registrant (Funds)), totaled $10,200 and $21,000 in 2013 and 2012, respectively, which includes the Funds’ tax fees above in Section I and tax fees for Huntington’s Trust Department related to settlement funds where Huntington National Bank is the executor.
(h) The registrant’s Audit Committee has considered whether the provision of non audit services that were rendered to registrant’s investment adviser (not including any sub adviser whose role is primarily portfolio management and is subcontracted with or overseen by another investment adviser), and any entity controlling, controlled by, or under common control with the investment adviser that provide ongoing services to the registrant that were not pre-approved pursuant to paragraph (c)(7)(ii) of Rule 2-01 of Regulation S-X is compatible with maintaining the principal account’s independence.
Item 5. Audit Committee of Listed Registrants.
Not applicable.
Item 6. Schedule of Investments.
(a) Not applicable.
(b) Not applicable.
Item 7. Disclosure of Proxy Voting Policies and Procedures for Closed-End Management Investment Companies.
Not applicable.
Item 8. Portfolio Managers of Closed-End Management Investment Companies.
Not applicable.
Item 9. Purchases of Equity Securities by Closed-End Management Investment Company and Affiliated Purchasers.
Not applicable.
Item 10. Submission of Matters to a Vote of Security Holders.
Not applicable.
Item 11. Controls and Procedures.
(a) The registrant’s Principal Executive Officer and Principal Financial Officer have concluded that the registrant’s disclosure controls and procedures (as defined in Rule 30a-3(c) under the Act) are effective in design and operation and are sufficient to form the basis of the certifications required by Rule 30a-2 under the Act, based on their evaluation of these disclosure controls and procedures within 90 days of the filing of this report on Form N-CSR.
(b) There were no changes in the registrant’s internal control over financial reporting (as defined in Rule 30a-3(d) under the Act (17 CFR 270.30a-3(d)) that occurred during the second fiscal quarter of the period covered by this report that have materially affected or are reasonably likely to materially affect, the registrant’s internal control over financial reporting.
Item 12. Exhibits.
(a)(1) The Not applicable.
(a)(2) Certifications pursuant to Rule 30a-2(a) are attached hereto.
(a)(3) Not applicable.
| (b) | Certifications pursuant to Rule 30a-2(b) are furnished herewith. |
SIGNATURES
Pursuant to the requirements of the Securities Exchange Act of 1934 and the Investment Company Act of 1940, the registrant has duly caused this report to be signed on its behalf by the undersigned, thereunto duly authorized.
| | |
| (Registrant) The Huntington Funds |
| |
| By (Signature and Title)* | | /s/ R. Jeffrey Young |
| | R. Jeffrey Young, Chief Executive Officer and Principal Executive Officer |
|
| Date 1/6/2014 |
Pursuant to the requirements of the Securities Exchange Act of 1934 and the Investment Company Act of 1940, this report has been signed below by the following persons on behalf of the registrant and in the capacities and on the dates indicated.
| | |
| By (Signature and Title)* | | /s/ R. Jeffrey Young |
| | R. Jeffrey Young, Chief Executive Officer and Principal Executive Officer |
|
| Date 1/6/2014 |
| | |
| By (Signature and Title)* | | /s/ Bryan W. Ashmus |
| | Bryan W. Ashmus, Treasurer and Principal Financial Officer |
|
| Date 1/6/2014 |