UNITED STATES
SECURITIES AND EXCHANGE COMMISSION
Washington, D.C. 20549
FORM N-CSR
CERTIFIED SHAREHOLDER REPORT OF REGISTERED
MANAGEMENT INVESTMENT COMPANIES
Investment Company Act file number 811-05010
THE HUNTINGTON FUNDS
(Exact name of registrant as specified in charter)
2960 North Meridian Street, Suite 300
Attn: Huntington Funds Officer
Indianapolis, IN 46208
(Address of principal executive offices) (Zip code)
Martin R. Dean
The Huntington National Bank
37 West Broad Street, 6th Floor
Columbus, OH 43215
(Name and address of agent for service)
Copies to:
David C. Mahaffey, Esq.
Sullivan & Worcester
1666 K Street, N.W.
Washington, DC 20006
Registrant’s telephone number, including area code: 1-800-253-0412
Date of fiscal year end: December 31
Date of reporting period: December 31, 2014
Item 1. Reports to Stockholders.

Annual Shareholder Report
DECEMBER 31, 2014
CLASS A SHARES
CLASS C SHARES
INSTITUTIONAL SHARES
Message from the Chief Investment Officer
Dear Shareholder:
Much like last year, the final quarter of 2014 provided most of the performance for the entire year. This was particularly true for the Standard and Poor’s SmallCap 600 Index®(a) (“S&P 600”) which rose 9.85% during the quarter, pushing it into positive territory for the entire year. The larger cap issues, as highlighted by the Standard and Poor’s 500 Index®(b) (“S&P 500”), gained almost 5% for the quarter driving the index to exceed the other major indices with an annual return of 13.69%. Beset by currency and economic woes, the international equity markets as characterized by the Morgan Stanley Capital International Europe, Australasia and Far East Index(c) (“MSCI-EAFE”), fell in both the fourth quarter of 2014 and the entire year.
With this backdrop of mixed results, the managers of the Huntington Funds have characterized this past year as one that experienced a number of transitions. These transitions evoked both positive and negative perceptions within the investment community and, as a result, short-term volatility increased as investors tried to figure out the most attractive or prudent courses. The markets and economy have had to adjust to six very significant changes during the year.
First and probably foremost, is the decision by the Federal Reserve (“Fed”) to cease its six year quantitative easing monetary policy. This was of concern to some investors as liquidity provided by the Fed has served as a stimulus to the equity markets and to the economy, especially in certain sectors such as housing. The second impactful change was to the make-up of Congress, which shifted stronger control to the Republican Party as a result of the November elections. This could affect budgetary, regulatory and defense issues as the new majority deals with the Administration over the next two years. The third alteration of course was the assumption of a more bellicose attitude by Russia in its dealings with the West. Since 1989 and the fall of the Berlin Wall, the former components of the Soviet Union have moved more closely in alignment with the West in commerce and politics. This took a radical turn as conflict escalated within Ukraine and sanctions were imposed upon Russia.
The U.S. Dollar was also a highlight in 2014 as its surprising strength helped contain inflation and will probably make it more difficult to sell U.S. manufactured goods overseas. The year also marked the first time the U.S. has become energy independent, could export petroleum products and exceeded the actual production of Saudi Arabia. The resulting reduction of cost at the pump has become a boon to U.S. consumers. In our opinion, perhaps the most significant issue in 2014 was the most subtle. The perception of robotics in the workplace has been well established in manufacturing over the past few years. It is, however, remarkable that in this past year the use of drones and robots of various types became acceptable in the service and consumer sectors. This phenomenon may lay the ground work for a rapid expansion of robotics in daily life. While the long term implications of robotics in the work place and in the home may include the acceptance of a higher intrinsic level of unemployment, there will likely be an explosion of investor interest much like the halcyon days of the dot-com era with frequent Initial Public Offerings (IPOs) and significant technological breakthroughs.
It will be an interesting first quarter of 2015 for investors who will need to assess these transitions and how they will affect their investment strategies. Our experienced investment team of fund managers will strive to provide our own interpretations of these influences and chart a course that takes advantage of the forthcoming opportunities. As a business practice within Huntington Asset Advisors, we are continuously evaluating products and growth opportunities. In 2014, Huntington Funds made a strategic decision to close some of its funds with lower asset sizes in order to focus on a select group of core funds. We believe this
Message from the Chief Investment Officer
Message from the Chief Investment Officer (Continued)
action will strengthen our position and allow us to continue to generate growth and meet the investment needs of our shareholders. We are committed to the ongoing success of Huntington Funds and leveraging the expertise of our fund managers.

B. Randolph Bateman, CFA
Chief Investment Officer
Huntington Asset Advisors, Inc.
| (a) | The S&P 600 is a capitalization-weighted index representing all major industries in the small-cap range of the U.S. stock market. |
| (b) | The S&P 500 is a capitalization-weighted index comprised of 500 stocks and designed to measure performance of the broad domestic economy through changes in the aggregate market value of 500 stocks representing all major industries. |
| (c) | The MSCI-EAFE is a market-capitalization weighted equity index comprising 20 of the 48 countries in the MSCI universe and representing the developed world outside of North America. Each MSCI country index is created separately, and then aggregated, without change, into MSCI indices. |
The indices are unmanaged and, unlike the Fund, are not affected by cash flows. It is not possible to invest directly in an Index, although, you may invest in the underlying securities.
Message from the Chief Investment Officer
Annual Shareholder Report
MONEY MARKET FUNDS
Huntington Money Market Fund
Huntington U.S. Treasury Money Market Fund
EQUITY FUNDS
Huntington Dividend Capture Fund
Huntington Global Select Markets Fund
Huntington Real Strategies Fund
Huntington Situs Fund
ASSET ALLOCATION FUNDS
Huntington Balanced Allocation Fund
Huntington Conservative Allocation Fund
Huntington Growth Allocation Fund
| | |
| Dividend Capture Fund | | As of December 31, 2014 |
Management’s Discussion of Fund Performance
Portfolio Managers:
Kirk Mentzer, MBA
Director of Fund Research
Peter Sorrentino, CFA
Senior Vice President
For the fiscal year ended December 31, 2014, the Huntington Dividend Capture Fund’s (“Fund”) Institutional Shares and Class A Shares produced total returns (not including the deduction of applicable sales charges) of 9.59% and 9.45%, respectively, based on net asset value. The Fund underperformed relative to the 12.36% total return of the Standard & Poor’s 500 Value Index® (“S&P 500 Value”)(a), its benchmark, and the 13.69% return of the Standard & Poor’s 500 Index® (“S&P 500” )(a), its previous benchmark for the same period. The Fund’s Class A Shares underperformed the benchmark by 2.91% for the same period. The Fund underperformed relative to the 16.74% total return of the Dividend Capture Indices Blend (“DCIB”)(b) for the same period.
The Fund is managed using our top-down style and portfolio construction techniques, which are aimed at producing a high level of stable income and low volatility by investing in three distinct asset classes highlighted below:
| | • | | Value-Style Common Stocks: Domestic equity market returns were nearly zero for the year in early October, but managed to rally during the fourth quarter to produce strong gains for all of 2014. Seasonal factors, improving economic growth (U.S.), low inflation, plentiful liquidity, and plummeting oil prices and bond yields all factored prominently into rising stock markets. Stocks as measured by the S&P 500 Value ended the year with a 12.36% total return. The Fund was overweight common stocks for the entire period versus the DCIB unmanaged custom index. Within this class, sector allocation subtracted 83 basis points and security selection detracted 388 basis points from performance. As a result, the common stocks in the Fund underperformed the overall market. The Fund’s common stock total return for 2014 was 7.07%, trailing the S&P 500 Value return for the year. The three largest positive contributors to performance were: Intel Corp. (+0.73%), Cisco Systems, Inc. (+0.72%) and CSX Corp. (+0.48%). The three largest detractors were: Noble Corp. PLC (-0.70%), Marathon Oil Corp. (-0.32%) and Peabody Energy Corp. (-0.31%). |
| | • | | Real Estate Investment Trusts (REITs)(c): Falling interest rates helped propel REIT markets in 2014, making them the best performing asset class. The Fund’s REIT holdings produced a total return of 26.13% for the fiscal year ended December 31, 2014, which slightly underperformed the benchmark NAREIT Index total return of 27.20% for the same period. The three largest positive contributors to performance were: HCP, Inc. (+2.83%), Kimco Realty Corp. (+2.79%) and Camden Property Trust (+2.06%). The three largest detractors were: Hospitality Properties Trust (-0.05%), Ramco-Gershenson Properties Trust (-0.02%) and Healthcare Realty Trust, Inc. (-0.01%). |
| | • | | Preferred Stocks(d): Declining yields, likewise, gave preferred stocks a tail wind for the year, making the class second best performing asset class of the Fund. The Fund’s preferred stocks holdings produced a total return of 17.33%, which outperformed the benchmark, BofA Merrill Lynch Fixed Rate Preferred Securities Index, total return of 15.44%. The three largest positive contributors to performance were: BB&T Corp., 5.85% (+0.38%), PS Business Parks, Inc., Series S, 6.45% (+0.33%) and Charles Schwab Corp., Series B, 6.00% (+0.32%). The three largest underperforming issues were: Ameriprise Financial, Inc., 7.75 % (+0.01%), Vornado Realty LP 7.875% (+0.01%) and NextEra Energy Capital Holdings, Inc., Series F, 8.75% (Called at 100) (0.00%), which were sold during the year. |
The composition of the Fund’s holdings is subject to change.
Annual Shareholder Report
1
Dividend Capture Fund (Continued)
| (a) | Effective 11/18/2014, the Dividend Capture Fund’s benchmark was updated from the S&P 500 Index® to the S&P 500 Value Index® as it was determined to more closely reflect the investment strategy of the Fund. The S&P 500 Index® is an unmanaged index generally representing the performance of the broad domestic economy through changes in the aggregate market value of 500 stocks representing all major industries. The S&P 500 Value Index® is an unmanaged market-capitalization-weighted index consisting of those stocks within the S&P 500 Index® that exhibit strong value characteristics. It uses a numerical ranking system based on four value factors and three growth factors to determine the constituents and their weightings |
| | Indices are unmanaged and, unlike the Fund, are not affected by cash flows. It is not possible to invest directly in an Index. |
| (b) | The DCIB is a custom, blended index comprised of the following three indices with their noted respective weightings: S&P 500 Value Index (40%), Merrill Lynch Fixed Rate Preferred Index (40%) and NAREIT Index (20%). This custom, blended index and its respective weightings are reflective of the Fund’s sector diversification. Indices are unmanaged and, unlike the Fund, are not affected by cash flows. It is not possible to invest directly in an Index. |
| (c) | REIT returns represented by the NAREIT Index. The NAREIT Index represents returns for the National Association of Real Estate Investment Trust Equity Index. The index is unmanaged and, unlike the Fund, is not affected by cash flows. It is not possible to invest directly in an Index. |
| (d) | Preferred returns represented by BofA Merrill Lynch Fixed Rate Preferred Securities Index. The BofA Merrill Lynch Fixed Rate Preferred Securities Index is a capitalization-weighted index that tracks the performance of fixed rate U.S. dollar denominated preferred securities issued in the U.S. domestic market. |
This commentary may include statements that constitute “forward looking statements” under the U.S. securities laws. Forward-looking statements include, among other things, projections, estimates, and information about possible or future results related to the Fund, market or regulatory developments. The views expressed above are not guarantees of future performance or economic results and involve certain risks, uncertainties and assumptions that could cause actual outcomes and results to differ materially from the views expressed herein. The views expressed above are those of the Advisor as of December 31, 2014 and are subject to change at any time based upon economic, market, or other conditions and the Advisor undertakes no obligation to update the views expressed herein. Any discussions of specific securities should not be considered a recommendation to buy or sell those securities. The views expressed above (including any forward-looking statement) may not be relied upon as investment advice or as an indication of the Fund’s trading intent. Information about the Fund’s holdings, asset allocation or country diversification is historical and is not an indication of future Fund composition, which may vary.
The performance of any index mentioned in this commentary has not been adjusted for ongoing management, distribution and operating expenses, and sales charges applicable to mutual fund investments. If these additional fees were reflected, performance would have been lower.
There are no guarantees that dividend paying stocks will continue to pay dividends. In addition, dividend paying stocks may not experience the same capital appreciation potential as non-dividend paying stocks.
Annual Shareholder Report
2
Dividend Capture Fund (Continued)
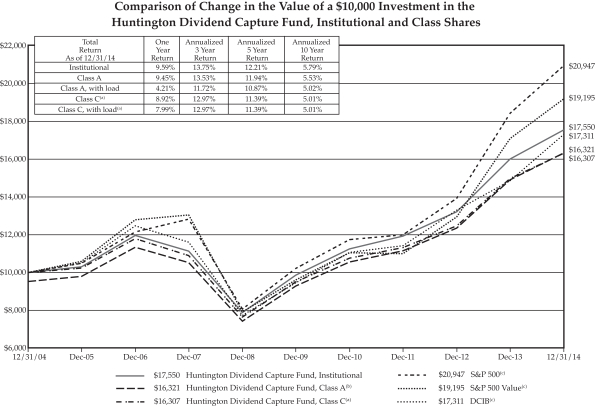
The Fund’s past performance does not guarantee future results. The investment return and principal value of an investment in the Fund will fluctuate so that an investor’s shares, when redeemed, may be worth more or less than their original cost. Current performance of the Fund may be lower or higher than the performance quoted. Performance data current to the most recent month end or after-tax returns may be obtained by calling 1-800-253-0412. Returns shown do not reflect the deduction of taxes that a shareholder would pay on Fund distributions or the redemption of Fund shares. Mutual funds are not obligations of or guaranteed by any bank and are not federally insured. Total returns, with load, include the 4.75% maximum sales charge for the Class A shares or the 1.00% maximum deferred sales charge for the Class C shares.
| | | | |
| Class | | Expense Ratios | |
| Institutional Shares | | | 0.90% | |
| Class A Shares | | | 1.15% | |
| Class C Shares | | | 1.65% | |
The above expense ratios are from the Fund’s prospectus dated April 30, 2014, as amended September 2, 2014. Additional information pertaining to the Fund’s expense ratios as of December 31, 2014 can be found in the financial highlights.
The Fund’s performance assumes the reinvestment of all dividends and distributions on securities. The performance above reflects any fee reductions during the applicable periods. If such fee reductions had not occurred, the quoted performance would have been lower. The S&P 500 Value, S&P 500 and DCIB have been adjusted to reflect reinvestment of dividends on securities in the indices.
Investments in real estate investment trusts (“REITs”) and real-estate related securities involves special risks associated with an investment in real estate, such as limited liquidity and interest rate risks and may be more volatile than other securities. In addition, the value of REITs and other real estate-related investments is sensitive to changes in real estate values, extended vacancies of properties and other environmental and economic factors.
There are no guarantees that dividend paying stocks will continue to pay dividends. In addition, dividend paying stocks may not experience the same capital appreciation potential as non-dividend paying stocks.
The Fund is distributed by Unified Financial Securities, Inc. (Member FINRA), a wholly-owned subsidiary of Huntington Bancshares, Inc., and an affiliate of Huntington Asset Advisors, Inc., the advisor of the Huntington Funds.
| (a) | Class C Shares commenced operations on January 3, 2014. Prior to January 3, 2014, performance is based on the performance of Class A Shares adjusted for the Class C Shares 12b-1 fees and contingent deferred sales charge. |
| (b) | Represents a hypothetical investment of $10,000 in the Fund after deducting the maximum sales load of 4.75% ($10,000 investment minus $475 sales load = $9,525). |
| (c) | The S&P 500 Value, S&P 500 and DCIB are not adjusted to reflect sales charges, expenses, or other fees that are reflected in the Fund’s performance. The indices are unmanaged and, unlike the Fund, are not affected by cash flows. It is not possible to invest directly in an index. |
Annual Shareholder Report
3
| | |
| Global Select Markets Fund | | As of December 31, 2014 |
Management’s Discussion of Fund Performance
Portfolio Managers:
Paul W. Attwood, CFA
Senior Vice President
Martina Cheung, CFA, MBA
Vice President
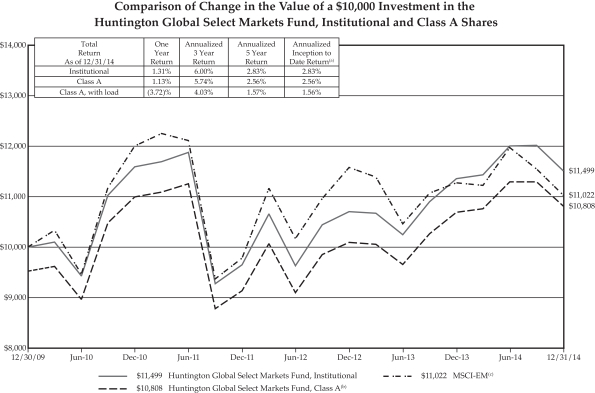
For the fiscal year ended December 31, 2014, the Huntington Global Select Markets Fund’s (“Fund”) Institutional Shares and Class A Shares reported total returns (not including the deduction of applicable sales charges) of 1.31% and 1.13%, respectively, based on net asset value. The Fund outperformed relative to the (2.19)% total return of the Morgan Stanley Capital International Emerging Markets Index (“MSCI-EM”)(a), its benchmark, for the same time period. The Fund’s Class A Shares outperformed the benchmark by 3.32% for the same period.
Although the MSCI-EM reported a negative total return in 2014, there were some very strong performances by individual countries. The Fund was able to outperform its benchmark by being overweight in some of these areas, such as India and Indonesia. In addition, the Fund had no exposure to Russia which experienced a collapse of both their equity market and currency. A substantial underweight in Brazil also contributed to the strong relative performance.
Energy and Material stocks were particularly weak. The Fund had very little exposure to these sectors. The Fund had a significant overweight in Healthcare, which was the best performing sector throughout 2014. Stock selection added to the relative outperformance of the Fund, relative to its benchmark. The three holdings that had the largest positive contribution to the Fund’s performance were KCE Electronics, Amara Raja Batteries and ICICI Bank Ltd. Collectively these holdings added 3.83% to the Fund’s return. The three holdings that had the largest negative contribution to the Fund’s return were LPP S.A., Kingsoft Corp. and Supermax Corp. These three holdings subtracted 2.12% from the Fund’s return and were all sold before the end of the year.
On December 19, 2014, Huntington International Equity Fund was merged into the Huntington Global Select Markets Fund. As we headed into year-end activities, the Fund retained some of the holdings from the International Equity Fund. The Fund’s December 31, 2014 Portfolio of Investments reflects these combined positions. The Fund’s portfolio is now being fully positioned to provide investors with exposure to what we consider to be the most attractive markets in the world, in a risk managed portfolio. As we begin 2015, we are targeting those countries that we believe display positive and improving fiscal and monetary policies and other key attributes that are essential to solid long-term performance.
| (a) | The MSCI-EM is a market-capitalization weighted equity index comprising 21 of the 48 countries in the MSCI universe. Each MSCI country index is created separately, then aggregated, without change, into MSCI indices. The index is unmanaged and, unlike the Fund, is not affected by cash flows. It is not possible to invest directly in an Index. |
This commentary may include statements that constitute “forward looking statements” under the U.S. securities laws. Forward-looking statements include, among other things, projections, estimates, and information about possible or future results related to the Portfolio, market or regulatory developments. The views expressed above are not guarantees of future performance or economic results and involve certain risks, uncertainties and assumptions that could cause actual outcomes and results to differ materially from the views expressed herein. The views expressed above are those of the Advisor as of December 31, 2014 and are subject to change at any time based upon economic, market, or other conditions and the Advisor undertakes no obligation to update the views expressed herein. Any discussions of specific securities should not be considered a recommendation to buy or sell those securities. The views expressed above (including any forward-looking statement) may not be relied upon as investment advice or as an indication of the Fund’s trading intent. Information about the Fund’s holdings, asset allocation or country diversification is historical and is not an indication of future Fund composition, which may vary.
The performance of any index mentioned in this commentary has not been adjusted for ongoing management, distribution and operating expenses, and sales charges applicable to mutual fund investments. If these additional fees were reflected, performance would have been lower.
Annual Shareholder Report
4
Global Select Markets Fund (Continued)
The Fund’s past performance does not guarantee future results. The investment return and principal value of an investment in the Fund will fluctuate so that an investor’s shares, when redeemed, may be worth more or less than their original cost. Current performance of the Fund may be lower or higher than the performance quoted. Performance data current to the most recent month end or after-tax returns may be obtained by calling 1-800-253-0412. Returns shown do not reflect the deduction of taxes that a shareholder would pay on Fund distributions or the redemption of Fund shares. Mutual funds are not obligations of or guaranteed by any bank and are not federally insured. Total returns, at load, include the 4.75% maximum sales charge for the Class A Shares.
| | | | |
| Class | | Expense Ratios | |
| Institutional Shares | | | 0.96% | |
| Class A Shares | | | 1.21% | |
The above expense ratios are from the Fund’s prospectus dated April 30, 2014, as amended September 2, 2014, and as supplemented October 1, 2014. Additional information pertaining to the Fund’s expense ratios as of December 31, 2014 can be found in the financial highlights.
The Fund’s performance assumes the reinvestment of all dividends and distributions on securities. The performance above reflects any fee reductions during the applicable periods. If such fee reductions had not occurred, the quoted performance would have been lower. The MSCI-EM has been adjusted to reflect reinvestment of dividends on securities in the index.
International investing involves special risks including currency risk, political risk, increased volatility of foreign securities, and differences in auditing and other financial standards. In addition, prices of emerging markets securities can be significantly more volatile than the prices of securities in developed countries.
The Fund is distributed by Unified Financial Securities, Inc. (Member FINRA), a wholly-owned subsidiary of Huntington Bancshares, Inc., and an affiliate of Huntington Asset Advisors, Inc., the advisor of the Huntington Funds.
| (a) | The Fund commenced operations for all share classes on December 30, 2009. |
| (b) | Represents a hypothetical investment of $10,000 in the Fund after deducting the maximum sales load of 4.75% ($10,000 investment minus $475 sales load = $9,525). |
| (c) | The MSCI-EM is not adjusted to reflect sales charges, expenses, or other fees that are reflected in the Fund’s performance. The index is unmanaged and, unlike the Fund, is not affected by cash flows. It is not possible to invest directly in an index. |
Annual Shareholder Report
5
| | |
| Real Strategies Fund | | As of December 31, 2014 |
Management’s Discussion of Fund Performance
Portfolio Managers:
Peter Sorrentino, CFA
Senior Vice President
Paul Attwood, CFA
Senior Vice President
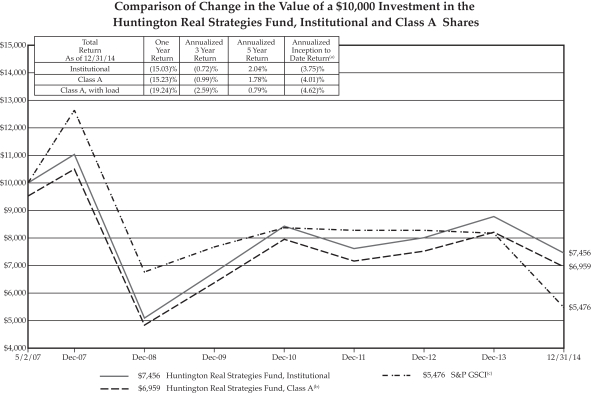
For the fiscal year ended December 31, 2014, the Huntington Real Strategies Fund’s (“Fund”) Institutional Shares and Class A Shares produced total returns (not including the deduction of applicable sales charges) of (15.03)% and (15.23)%, respectively, based upon net asset value. The Fund outperformed relative to the (33.05)% total return of the Standard & Poor’s Goldman Sachs Commodity Index® (“S&P GSCI”)(a), its benchmark, for the same period. The Fund’s Class A Shares outperformed its benchmark by 17.82%.
Thanks to the relatively stable pricing of natural gas during 2014, the Fund achieved returns that significantly outperformed its benchmark. With a number of natural gas liquefaction facilities nearing completion, the prospect of exporting low cost North American natural gas to the world market produced solid gains for companies such as Cheniere Energy (+63%) and Magellan Midstream Partners (+30%). Unfortunately, the confluence of a decade of over-investment along with slowing global growth and a rising U.S. Dollar drove virtually all other commodity prices down. At some point in 2014, every traded commodity, with the exception of gold, suffered at least a 25% price decline. Nowhere was this more evident than in the share prices of commodity driven economies, where the Fund’s investment in Canadian Oil Sands fell 52% and in Brazilian miner Vale S.A. lost 46%.
Efforts to insulate the Fund from these negative price actions contributed significantly to the outperformance relative to the benchmark. The covered call writing on the Fund’s holdings generated incremental return, as did the downside hedging through the purchase of put options on the Standard & Poor’s 500 Index® and the MSCI Emerging Markets Index. The Fund continued to employ the purchase of forward volatility through call options on the Chicago Board Options Exchange Volatility Index as another means of mitigating negative price action. The Fund disposed of two of its direct real estate holdings, the Scott’s Gahanna property and its interest in the BB&T office tower in Winston-Salem, North Carolina during the fourth quarter.
| (a) | The S&P GSCI® Index measures general price movements and inflation in the world economy. The Index is calculated primarily on a world production-weighted basis and is comprised of the principal physical commodities that are the subject of active, liquid futures markets. The index is unmanaged and, unlike the Fund, is not affected by cash flows. It is not possible to invest directly in an Index. |
This commentary may include statements that constitute “forward looking statements” under the U.S. securities laws. Forward-looking statements include, among other things, projections, estimates, and information about possible or future results related to the Portfolio, market or regulatory developments. The views expressed above are not guarantees of future performance or economic results and involve certain risks, uncertainties and assumptions that could cause actual outcomes and results to differ materially from the views expressed herein. The views expressed above are those of the Advisor as of December 31, 2014 and are subject to change at any time based upon economic, market, or other conditions and the Advisor undertakes no obligation to update the views expressed herein. Any discussions of specific securities should not be considered a recommendation to buy or sell those securities. The views expressed above (including any forward-looking statement) may not be relied upon as investment advice or as an indication of the Fund’s trading intent. Information about the Fund’s holdings, asset allocation or country diversification is historical and is not an indication of future Fund composition, which may vary.
The performance of any index mentioned in this commentary has not been adjusted for ongoing management, distribution and operating expenses, and sales charges applicable to mutual fund investments. If these additional fees were reflected, performance would have been lower.
Annual Shareholder Report
6
Real Strategies Fund (Continued)
The Fund’s past performance does not guarantee future results. The investment return and principal value of an investment in the Fund will fluctuate so that an investor’s shares, when redeemed, may be worth more or less than their original cost. Current performance of the Fund may be lower or higher than the performance quoted. Performance data current to the most recent month end or after-tax returns may be obtained by calling 1-800-253-0412. Returns shown do not reflect the deduction of taxes that a shareholder would pay on Fund distributions or the redemption of Fund shares. Mutual funds are not obligations of or guaranteed by any bank and are not federally insured. Total returns, at load, include the 4.75% maximum sales charge for the Class A Shares.
| | | | |
| Class | | Expense Ratios | |
| Institutional Shares | | | 1.10% | |
| Class A Shares | | | 1.35% | |
The above expense ratios are from the Fund’s prospectus dated April 30, 2014, as amended September 2, 2014. Additional information pertaining to the Fund’s expense ratios as of December 31, 2014 can be found in the financial highlights.
The Fund’s performance assumes the reinvestment of all dividends and distributions. The performance above reflects any fee reductions during the applicable periods. If such fee reductions had not occurred, the quoted performance would have been lower. The S&P GSCI has been adjusted to reflect reinvestment of dividends on securities in the indices.
Investments in real estate investment trusts (“REITs”) and real-estate related securities involve special risks associated with an investment in real estate, such as limited liquidity and interest rate risks and may be more volatile than other securities. In addition, the value of REITs and other real estate-related investments is sensitive to changes in real estate values, extended vacancies of properties and other environmental and economic factors.
Commodities-related investments are subject to the same risks as direct investments in commodities and prices may rise and fall in response to many factors such as economic, political and regulatory developments.
Funds whose investments are concentrated in a specific industry or sector may be subject to a higher degree of market risk than funds whose investments are diversified.
The Fund is distributed by Unified Financial Securities, Inc. (Member FINRA), a wholly-owned subsidiary of Huntington Bancshares, Inc., and an affiliate of Huntington Asset Advisors, Inc., the advisor of the Huntington Funds.
| (a) | The Fund commenced operations for all share classes on May 2, 2007. |
| (b) | Represents a hypothetical investment of $10,000 in the Fund after deducting the maximum sales load of 4.75% ($10,000 investment minus $475 sales load = $9,525). |
| (c) | The S&P GSCI is not adjusted to reflect sales charges, expenses, or other fees that are reflected in the Fund’s performance. The index is unmanaged and, unlike the Fund, is not affected by cash flows. It is not possible to invest directly in an index. |
Annual Shareholder Report
7
| | |
| Situs Fund | | As of December 31, 2014 |
Management’s Discussion of Fund Performance
Portfolio Managers:
Randy Bateman, CFA
Chief Investment Officer
Kirk Mentzer, MBA
Director of Fund Research
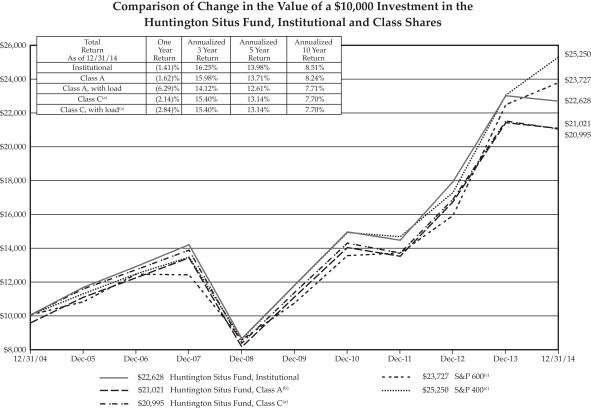
For the fiscal year ended December 31, 2014, the Huntington Situs Fund’s (“Fund”) Institutional Shares and Class A Shares produced total returns (not including the deduction of applicable sales charges) of (1.41)% and (1.62)%, respectively, based upon net asset value. The Fund underperformed relative to the 5.76% total return of the Standard and Poor’s SmallCap 600 Index® (“S&P 600”)(a), its benchmark, and the 9.77% total return of the Standard and Poor’s MidCap 400 Index® (“S&P 400”)(b) for the same period. The Fund’s Class A shares underperformed the benchmark by (7.38)%.
Prior to the beginning of the fiscal year, the Huntington Mid Corp America Fund was merged into the Fund adding close to $200 million to the size of the Fund and providing an opportunity to reduce the Fund’s expense ratio. Much of the portfolio structure underperformance was as a result of the integration of the Huntington Mid Corp America Fund as its capitalization had always been benchmarked to the Mid Cap marketplace. The Fund’s underperformance was primarily the result of certain stocks that fell along with the drop in the price of oil. With overproduction and a commitment by OPEC to maintain current production levels, oil prices fell precipitously during the final quarter of 2014, and GeoSpace Technologies and Carbo Ceramics were both heavily impacted by the energy price change.
One of the major drivers of performance from a stock selection perspective was TASER International, Inc. (“TASER”), which added 1.96% to the Fund’s performance for the 4th quarter and had been a minor holding until early autumn. The Fund made a major commitment to the holding following the events in Ferguson, Missouri. In the aftermath of the incident, a large number of police departments made commitments to TASER’s body cameras. This was duplicated internationally and the stock rose accordingly. Currently, the company is the largest single holding of the Fund. In addition to TASER, four other companies moved into the top ten holdings of the Fund. Watts Water, South State Bank, Sanderson Farms and Tyler Technologies were among the major structural changes in the Fund’s efforts to expand into earnings driven corporations for the coming quarters.
The markets in 2014 were primarily impacted by activities surrounding the monetary policies of the Federal Reserve System (“Fed”), international turmoil, the Ebola virus scare and the change in Congressional makeup as a result of the November 2014 elections. The Fed ended its quantitative easing monetary policy in October and the markets handled the news in stride. In fact, much of the performance of the markets for the entire year occurred following the Fed’s withdrawal from its bond purchase program. This was particularly evident in the S&P 600, which was down 3.74% for the first nine months of the year then recovered with a 9.83% rebound in the fourth quarter, allowing the index to increase 5.76% for the entire year.
Annual Shareholder Report
8
Situs Fund (Continued)
| (a) | The S&P 600 is a capitalization-weighted index representing all major industries in the small-cap range of the U.S. stock market. The index is unmanaged and, unlike the Fund, is not affected by cash flows. It is not possible to invest directly in an Index. |
| (b) | The S&P 400 is a capitalization-weighted index comprised of common stocks representing all major industries in the mid-range of the U.S. stock market. The index is unmanaged and, unlike the Fund, is not affected by cash flows. It is not possible to invest directly in an Index. |
This commentary may include statements that constitute “forward looking statements” under the U.S. securities laws. Forward-looking statements include, among other things, projections, estimates, and information about possible or future results related to the Fund, market or regulatory developments. The views expressed above are not guarantees of future performance or economic results and involve certain risks, uncertainties and assumptions that could cause actual outcomes and results to differ materially from the views expressed herein. The views expressed above are those of the Advisor as of December 31, 2014 and are subject to change at any time based upon economic, market, or other conditions and the Advisor undertakes no obligation to update the views expressed herein. Any discussions of specific securities should not be considered a recommendation to buy or sell those securities. The views expressed above (including any forward-looking statement) may not be relied upon as investment advice or as an indication of the Fund’s trading intent. Information about the Fund’s holdings, asset allocation or country diversification is historical and is not an indication of future Fund composition, which may vary.
The performance of any index mentioned in this commentary has not been adjusted for ongoing management, distribution and operating expenses, and sales charges applicable to mutual fund investments. If these additional fees were reflected, performance would have been lower.
Annual Shareholder Report
9
Situs Fund (Continued)
The Fund’s past performance does not guarantee future results. The investment return and principal value of an investment in the Fund will fluctuate so that an investor’s shares, when redeemed, may be worth more or less than their original cost. Current performance of the Fund may be lower or higher than the performance quoted. Performance data current to the most recent month end or after-tax returns may be obtained by calling 1-800-253-0412. Returns shown do not reflect the deduction of taxes that a shareholder would pay on Fund distributions or the redemption of Fund shares. Mutual funds are not obligations of or guaranteed by any bank and are not federally insured. Total returns, with load, include the 4.75% maximum sales charge for the Class A shares or the 1.00% maximum deferred sales charge for the Class C shares.
| | | | |
| Class | | Expense Ratios | |
| Institutional Shares | | | 1.03% | |
| Class A Shares | | | 1.28% | |
| Class C Shares | | | 1.78% | |
The above expense ratios are from the Fund’s prospectus dated April 30, 2014, as amended September 2, 2014. Additional information pertaining to the Fund’s expense ratios as of December 31, 2014 can be found in the financial highlights.
The Fund’s performance assumes the reinvestment of all dividends and distributions. The performance above reflects any fee reductions during the applicable periods. If such fee reductions had not occurred, the quoted performance would have been lower. The S&P 600 and S&P 400 have been adjusted to reflect reinvestment of dividends on securities in the indices.
International investing involves special risks including currency risk, political risk, increased volatility of foreign securities, and differences in auditing and other financial standards. In addition, prices of emerging markets securities can be significantly more volatile than the prices of securities in developed countries.
Small company stocks may be less liquid and subject to greater price volatility than large capitalization stocks.
Funds whose investments are concentrated in a specific industry or sector may be subject to a higher degree of market risk than funds whose investments are diversified. In addition, the Fund may be subject to specific risks of the information technology sector, such as obsolescence.
The Fund is distributed by Unified Financial Securities, Inc. (Member FINRA), a wholly-owned subsidiary of Huntington Bancshares, Inc., and an affiliate of Huntington Asset Advisors, Inc., the advisor of the Huntington Funds.
Annual Shareholder Report
10
Situs Fund (Continued)
| (a) | Class C Shares commenced operations on January 3, 2014. Prior to January 3, 2014, performance is based on the performance of Class A Shares adjusted for the Class C Shares’ 12b-1 fees and contingent deferred sales charge. |
| (b) | Represents a hypothetical investment of $10,000 in the Fund after deducting the maximum sales load of 4.75% ($10,000 investment minus $475 sales load = $9,525). |
| (c) | The S&P 600 and S&P 400 are not adjusted to reflect sales charges, expenses, or other fees that are reflected in the Fund’s performance. The indices are unmanaged and, unlike the Fund, are not affected by cash flows. It is not possible to invest directly in an index. |
Annual Shareholder Report
11
| | |
| Balanced Allocation Fund | | As of December 31, 2014 |
Management’s Discussion of Fund Performance
Portfolio Manager:
Randy Bateman, CFA
Chief Investment Officer
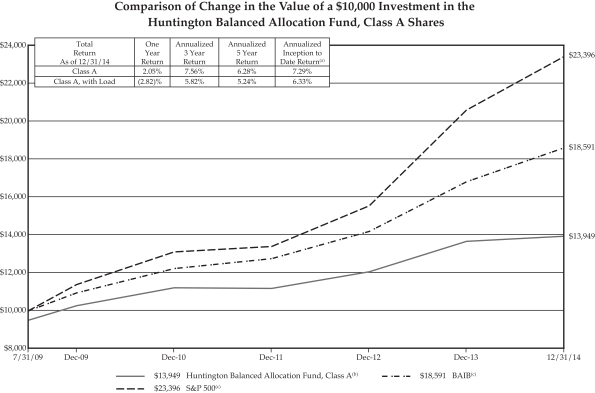
For the fiscal year ended December 31, 2014, the Huntington Balanced Allocation Fund’s (“Fund”) Class A Shares produced a total return (not including the deduction of applicable sales charges) of 2.05% based upon net asset value. The Fund underperformed relative to the 13.69% total return of the Standard & Poor’s 500 Index® (“S&P 500”)(a), its benchmark, and the 10.60% total return of the Balanced Allocation Indices Blend (“BAIB”)(b) for the same period.
Contributing to the performance was the Fund’s exposure of 57.3% in growth assets, 19.5% in income focused securities and 22.2% in stable assets. At year end, the Fund was balanced with exposure to the Federated Short-Intermediate Total Return Bond Fund at 7.2%(c) of net assets, the Huntington Global Select Markets Fund at 15.0%(c) of net assets and the Huntington Dividend Capture Fund, at 9.5%(c) of net assets. Other levels of exposure included the Huntington EcoLogical Strategy ETF at 12.7%(c) of net assets, the Huntington US Equity Rotation Strategy ETF at 11.6%(c) of net assets and the Huntington Situs Fund at 8.5%(c) of net assets. Other fixed income exposures included the Federated Total Return Government Bond Fund at 7.2%(c) of net assets and the Federated Mortgage Fund at 5.1%(c) of net assets. During the last days of 2014, the Fund was reallocated and the money market fund position was larger than traditionally maintained. Overall, the Fund was extremely diversified and reflected the market expectations of the Huntington Asset Advisors, Inc.
During much of the year, the Federal Reserve Bank (“Fed”) continued its strategy of maintaining an extremely easy monetary policy through quantitative easing (“QE”). In October, however, the Fed ceased the formal QE program and, despite fears of a market reversal, investors took the change in stride. In fact, most of the equity markets improved significantly in the fourth quarter. Stocks continued to build on their five year rally as Fed liquidity and the economic recovery led to higher corporate profits and continued optimism by investors. It was against this backdrop that the Fund maintained a moderate exposure to risk-based securities and rebalanced cash into equities. During the year, substantial changes were effected to adjust the asset allocation to match the opportunities that the markets presented.
| (a) | The S&P 500 is a capitalization-weighted index comprised of 500 stocks and designed to measure performance of the broad domestic economy through changes in the aggregate market value of 500 stocks representing all major industries. The index is unmanaged and, unlike the Fund, is not affected by cash flows. It is not possible to invest directly in an Index. |
| (b) | The Balanced Allocation Indices Blended Benchmark is a custom blended index comprised of the following two indices with their noted respective weightings: S&P 500 (60%) and the Barclays U.S. Aggregate Bond Index (40%). The Barclays U.S. Aggregate Bond Index is comprised of securities from the Barclays Government/Corporate Bond Index, Mortgage Securities Index and the Asset Based Index. Total return comprises price appreciation/depreciation and income as a percentage of the original investment. Indices are rebalanced monthly by market capitalization. The index is unmanaged and, unlike the Fund, is not affected by cash flows. It is not possible to invest directly in an Index. |
| (c) | Percentage of holdings based on Fund’s net assets as of 12/31/2014. The composition of the Fund’s holdings is subject to change. |
This commentary may include statements that constitute “forward looking statements” under the U.S. securities laws. Forward-looking statements include, among other things, projections, estimates, and information about possible or future results related to the Fund, market or regulatory developments. The views expressed above are not guarantees of future performance or economic results and involve certain risks, uncertainties and assumptions that could cause actual outcomes and results to differ materially from the views expressed herein. The views expressed above are those of the Advisor as of December 31, 2014 and are subject to change at any time based upon economic, market, or other conditions and the Advisor undertakes no obligation to update the views expressed herein. Any discussions of specific securities should not be considered a recommendation to buy or sell those securities. The views expressed above (including any forward-looking statement) may not be relied upon as investment advice or as an indication of the Fund’s trading intent. Information about the Fund’s holdings, asset allocation or country diversification is historical and is not an indication of future Fund composition, which may vary.
The performance of any index mentioned in this commentary has not been adjusted for ongoing management, distribution and operating expenses, and sales charges applicable to mutual fund investments. If these additional fees were reflected, performance would have been lower.
Annual Shareholder Report
12
Balanced Allocation Fund (Continued)
The Fund’s past performance does not guarantee future results. The investment return and principal value of an investment in the Fund will fluctuate so that an investor’s shares, when redeemed, may be worth more or less than their original cost. Current performance of the Fund may be lower or higher than the performance quoted. Performance data current to the most recent month end or after-tax returns may be obtained by calling 1-800-253-0412. Returns shown do not reflect the deduction of taxes that a shareholder would pay on Fund distributions or the redemption of Fund shares. Mutual funds are not obligations of or guaranteed by any bank and are not federally insured. Total returns, at load, include the 4.75% maximum sales charge for the Class A Shares.
| | | | |
| Class | | Expense Ratio | |
| Class A Shares | | | 1.90% | |
The above expense ratio is from the Fund’s prospectus dated April 30, 2014, as amended September 2, 2014. Additional information pertaining to the Fund’s expense ratio as of December 31, 2014 can be found in the financial highlights.
The Fund’s performance assumes the reinvestment of all dividends and distributions on securities. The performance above reflects any fee reductions during the applicable periods. If such fee reductions had not occurred, the quoted performance would have been lower. The S&P 500 and BAIB have been adjusted to reflect reinvestment of dividends on securities in the indices.
The Fund is distributed by Unified Financial Securities, Inc. (Member FINRA) a wholly-owned subsidiary of Huntington Bancshares, Inc. and an affiliate of Huntington Asset Advisors, Inc., the advisor to the Huntington Funds.
| (a) | The Fund commenced operations on July 31, 2009. |
| (b) | Represents a hypothetical investment of $10,000 in the Fund after deducting the maximum sales load of 4.75% ($10,000 investment minus $475 sales load = $9,525). |
| (c) | The S&P 500 and BAIB are not adjusted to reflect sales charges, expenses, or other fees that are reflected in the Fund’s performance. The indices are unmanaged and, unlike the Fund, are not affected by cash flows. It is not possible to invest directly in an index. |
Annual Shareholder Report
13
| | |
| Conservative Allocation Fund | | As of December 31, 2014 |
Management’s Discussion of Fund Performance
Portfolio Manager:
Randy Bateman, CFA
Chief Investment Officer
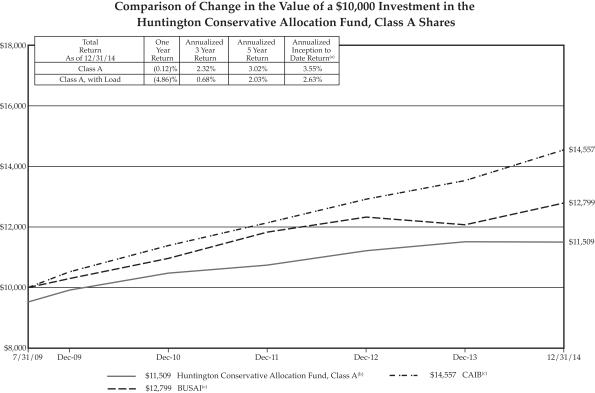
For the fiscal year ended December 31, 2014, the Huntington Conservative Allocation Fund’s (“Fund”) Class A Shares produced a total return (not including the deduction of applicable sales charges) of (0.12)% based upon net asset value. The Fund underperformed relative to the 5.97% total return of the Barclays U.S. Aggregate Bond Index (“BUSAI”)(a), its benchmark, and underperformed relative to the 7.51% total return for the Conservative Allocation Indices Blend (“CAIB”)(b) for the same period.
The Fund’s investment in the Huntington World Income Fund, sold in Q4, detracted from performance during the year. Despite the underperformance to the benchmark index, the Fund maintained relatively larger exposure to the equity markets, which enjoyed a strong fourth quarter, later in the year and could set the Fund up for better performance as we begin 2015. At year end, the Fund was balanced with exposure to the Federated Total Return Bond Fund at 14.1%(c) of net assets, the Federated Short-Intermediate Total Return Bond Fund with 14.1%(c) of net assets and the Federated Mortgage Fund, at 9.8%(c) of net assets. The largest growth components were a 10.8%(c) of net assets to the Huntington Global Select Markets Fund, 6.6%(c) of net assets to the Huntington Dividend Capture Fund and exposure to both the Huntington Ecological Strategy ETF and the Huntington U.S. Equity Rotation Strategy ETF for a combined 9.9%(c) of net assets. There was a rebalancing that occurred at year end that resulted in a heavier exposure to money markets funds. Those funds were allocated to the fixed income portion of the portfolio. For those reasons, the Fund maintained a beta(d) of only 0.6 at year-end.
During much of the year, the Federal Reserve Bank (“Fed”) continued its strategy of maintaining an extremely easy monetary policy through quantitative easing (“QE”). In October, however, the Fed ceased the formal QE program and, despite fears of a market reversal, investors took the change in stride. In fact, most of the equity markets improved significantly in the fourth quarter and bond portfolios fared better than expected. Extremely low international interest rates prevailed as worldwide economies were virtually inflation-free and central banks were willing to provide liquidity. Stocks continued to build on their five year rally as Fed liquidity and the economic recovery led to higher corporate profits and continued optimism by investors. It was against this backdrop that the manager of the Fund maintained its exposure to risk-based securities. During the year substantial changes were effected to adjust the asset allocation to match the opportunities that the markets presented.
Annual Shareholder Report
14
Conservative Allocation Fund (Continued)
| (a) | The Barclay’s U.S. Aggregate Bond Index is composed of securities from the Barclay’s Government/Corporate Bond Index, Mortgage Securities Index and the Asset Based Securities Index. Total return comprises price appreciation/depreciation and income as a percentage of the original investment. Indices are rebalanced monthly by market capitalization. The index is unmanaged and, unlike the Fund, is not affected by cash flows. It is not possible to invest directly in an Index. |
| (b) | The Conservative Allocation Indices Blended Benchmark is a custom blended index comprised of the following two indices with their noted respective weightings: Standard & Poor’s 500 Index® (“S&P 500”) (20%) and the Barclays U.S. Aggregate Bond Index (80%). The S&P 500 is an unmanaged index generally representing the performance of the broad domestic economy through changes in the aggregate market value of 500 stocks representing all major industries. Investments cannot be made in an index. |
| (c) | Percentage of holdings based on Fund’s net assets as of 12/31/2014. The composition of the Fund’s holdings is subject to change. |
| (d) | The beta of an investment is a measure of the risk arising from exposure to general market movements as opposed to idiosyncratic factors. A beta below 1 can indicate either an investment with lower volatility than the market, or a volatile investment whose price movements are not highly correlated with the market. |
This commentary may include statements that constitute “forward looking statements” under the U.S. securities laws. Forward-looking statements include, among other things, projections, estimates, and information about possible or future results related to the Portfolio, market or regulatory developments. The views expressed above are not guarantees of future performance or economic results and involve certain risks, uncertainties and assumptions that could cause actual outcomes and results to differ materially from the views expressed herein. The views expressed above are those of the Advisor as of December 31, 2014 and are subject to change at any time based upon economic, market, or other conditions and the Advisor undertakes no obligation to update the views expressed herein. Any discussions of specific securities should not be considered a recommendation to buy or sell those securities. The views expressed above (including any forward-looking statement) may not be relied upon as investment advice or as an indication of the Fund’s trading intent. Information about the Fund’s holdings, asset allocation or country diversification is historical and is not an indication of future Fund composition, which may vary.
The performance of any index mentioned in this commentary has not been adjusted for ongoing management, distribution and operating expenses, and sales charges applicable to mutual fund investments. If these additional fees were reflected, performance would have been lower.
Annual Shareholder Report
15
Conservative Allocation Fund (Continued)
The Fund’s past performance does not guarantee future results. The investment return and principal value of an investment in the Fund will fluctuate so that an investor’s shares, when redeemed, may be worth more or less than their original cost. Current performance of the Fund may be lower or higher than the performance quoted. Performance data current to the most recent month end or after-tax returns may be obtained by calling 1-800-253-0412. Returns shown do not reflect the deduction of taxes that a shareholder would pay on Fund distributions or the redemption of Fund shares. Mutual funds are not obligations of or guaranteed by any bank and are not federally insured. Total returns, at load, include the 4.75% maximum sales charge for the Class A Shares.
| | | | |
| Class | | Expense Ratio | |
| Class A Shares | | | 1.90% | |
The above expense ratio is from the Fund’s prospectus dated April 30, 2014, as amended September 2, 2014. Additional information pertaining to the Fund’s expense ratio as of December 31, 2014 can be found in the financial highlights.
The Fund’s performance assumes the reinvestment of all dividends and distributions on securities. The performance above reflects any fee reductions during the applicable periods. If such fee reductions had not occurred, the quoted performance would have been lower. The BUSAI and CAIB have been adjusted to reflect reinvestment of dividends on securities in the indices.
The Fund is distributed by Unified Financial Securities, Inc. (Member FINRA) a wholly-owned subsidiary of Huntington Bancshares, Inc. and an affiliate of Huntington Asset Advisors, Inc., the advisor to the Huntington Funds.
| (a) | The Fund commenced operations on July 31, 2009. |
| (b) | Represents a hypothetical investment of $10,000 in the Fund after deducting the maximum sales load of 4.75% ($10,000 investment minus $475 sales load = $9,525). |
| (c) | The BUSAI and CAIB are not adjusted to reflect sales charges, expenses, or other fees that are reflected in the Fund’s performance. The indices are unmanaged and, unlike the Fund, are not affected by cash flows. It is not possible to invest directly in an index. |
Annual Shareholder Report
16
| | |
| Growth Allocation Fund | | As of December 31, 2014 |
Management’s Discussion of Fund Performance
Portfolio Manager:
Randy Bateman, CFA
Chief Investment Officer
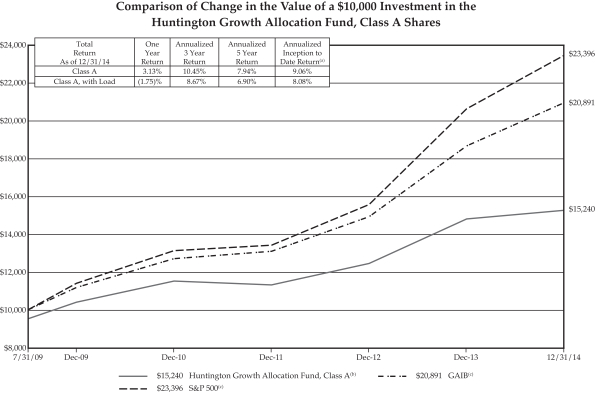
For the fiscal year ended December 31, 2014, the Huntington Growth Allocation Fund’s (“Fund”) Class A Shares produced a total return of (not including the deduction of applicable sales charges) 3.13% based upon net asset value. The Fund underperformed relative to the 13.69% total return of the Standard & Poor’s 500 Index®, (“S&P 500”)(a), its benchmark and the 12.14% total return for the Growth Allocation Indices Blend (“GAIB”)(b) for the same period.
Contributing to the Fund’s performance was its exposure of 77.7% to growth assets, 10.4% to income focused securities and 11.6% to stable assets. At year end, the Fund was balanced with exposure to the Huntington Global Select Markets Fund at 21.2%(c) of net assets, and the Huntington EcoLogical Strategy ETF which constituted 16.2%(c) of net assets. Other levels of exposure included the Huntington U.S. Equity Rotation Strategy ETF at 14.7%(c) of net assets, the Huntington Dividend Capture Fund at 13.9%(c) of net assets and the Huntington Situs Fund at 11.8%(c) of net assets. The largest exposure to fixed income funds was the 7.4%(c) of net assets commitment to the Federated Total Return Bond Fund. Overall, the Fund was extremely diversified and reflected the market expectations of Huntington Asset Advisors, Inc.
During much of the year, the Federal Reserve Bank (“Fed”) continued its strategy of maintaining an extremely easy monetary policy through quantitative easing (“QE”). In October, however, the Fed ceased the formal QE program and, despite fears of a market reversal, investors took the change in stride. In fact most of the equity markets improved significantly in the fourth quarter. Stocks continued to build on their five year rally as Fed liquidity and the economic recovery led to higher corporate profits and continued optimism by investors. It was against this backdrop that the manager of the Fund maintained its heavy exposure to risk-based securities. During the year substantial changes were effected to adjust the asset allocation to match the opportunities that the markets presented.
| (a) | The S&P 500 is a capitalization-weighted index comprised of 500 stocks and designed to measure performance of the broad domestic economy through changes in the aggregate market value of 500 stocks representing all major industries. The index is unmanaged and, unlike the Fund, is not affected by cash flows. It is not possible to invest directly in an Index. |
| (b) | The Growth Allocation Indices Blended Benchmark is a custom blended index comprised of the following two indices with their noted respective weightings: S&P 500 (80%) and the Barclays U.S. Aggregate Bond Index (20%). The Barclays U.S. Aggregate Bond Index is comprised of securities from the Barclays Government/Corporate Bond Index, Mortgage Securities Index and the Asset Based Index. Total return comprises price appreciation/depreciation and income as a percentage of the original investment. Indices are rebalanced monthly by market capitalization. The index is unmanaged and, unlike the Fund, is not affected by cash flows. It is not possible to invest directly in an Index. Investments cannot be made in an index. |
| (c) | Percentage of holdings based on Fund’s net assets as of 12/31/2014. The composition of the Fund’s holdings is subject to change. |
This commentary may include statements that constitute “forward looking statements” under the U.S. securities laws. Forward-looking statements include, among other things, projections, estimates, and information about possible or future results related to the Portfolio, market or regulatory developments. The views expressed above are not guarantees of future performance or economic results and involve certain risks, uncertainties and assumptions that could cause actual outcomes and results to differ materially from the views expressed herein. The views expressed above are those of the Advisor as of December 31, 2014 and are subject to change at any time based upon economic, market, or other conditions and the Advisor undertakes no obligation to update the views expressed herein. Any discussions of specific securities should not be considered a recommendation to buy or sell those securities. The views expressed above (including any forward-looking statement) may not be relied upon as investment advice or as an indication of the Fund’s trading intent. Information about the Fund’s holdings, asset allocation or country diversification is historical and is not an indication of future Fund composition, which may vary.
The performance of any index mentioned in this commentary has not been adjusted for ongoing management, distribution and operating expenses, and sales charges applicable to mutual fund investments. If these additional fees were reflected, performance would have been lower.
Annual Shareholder Report
17
Growth Allocation Fund (Continued)
The Fund’s past performance does not guarantee future results. The investment return and principal value of an investment in the Fund will fluctuate so that an investor’s shares, when redeemed, may be worth more or less than their original cost. Current performance of the Fund may be lower or higher than the performance quoted. Performance data current to the most recent month end or after-tax returns may be obtained by calling 1-800-253-0412. Returns shown do not reflect the deduction of taxes that a shareholder would pay on Fund distributions or the redemption of Fund shares. Mutual funds are not obligations of or guaranteed by any bank and are not federally insured. Total returns, at load, include the 4.75% maximum sales charge for the Class A Shares.
| | | | |
| Class | | Expense Ratio | |
| Class A Shares | | | 1.90% | |
The above expense ratio is from the Fund’s prospectus dated April 30, 2014, as amended September 2, 2014. Additional information pertaining to the Fund’s expense ratio as of December 31, 2014 can be found in the financial highlights.
The Fund’s performance assumes the reinvestment of all dividends and distributions on securities. The performance above reflects any fee reductions during the applicable periods. If such fee reductions had not occurred, the quoted performance would have been lower. The S&P 500 and GAIB have been adjusted to reflect reinvestment of dividends on securities in the indices.
The Fund is distributed by Unified Financial Securities, Inc. (Member FINRA) a wholly-owned subsidiary of Huntington Bancshares, Inc. and an affiliate of Huntington Asset Advisors, Inc., the advisor to the Huntington Funds.
| (a) | The Fund commenced operations on July 31, 2009. |
| (b) | Represents a hypothetical investment of $10,000 in the Fund after deducting the maximum sales load of 4.75% ($10,000 investment minus $475 sales load = $9,525). |
| (c) | The S&P 500 and GAIB are not adjusted to reflect sales charges, expenses, or other fees that are reflected in the Fund’s performance. The indices are unmanaged and, unlike the Fund, are not affected by cash flows. It is not possible to invest directly in an index. |
Annual Shareholder Report
18
| | |
| Huntington Money Market Fund | | December 31, 2014 |
| | |
| Portfolio of Investments Summary Table | | (unaudited) |
| | | | |
| Asset Allocation | | Percentage of
Market Value | |
U.S. Government Agencies | | | 29.1% | |
Corporate Bonds | | | 24.5% | |
Repurchase Agreements | | | 24.2% | |
Commercial Paper | | | 20.0% | |
Yankee Certificates of Deposit | | | 2.2% | |
Total | | | 100.0% | |
Portfolio holdings and allocations are subject to change. As of December 31, 2014, percentages in the table above are based on total investments. Such total investments may differ from the percentages set forth below in the Portfolio of Investments which are computed using the Fund’s net assets.
Portfolio of Investments
| | | | | | | | | | |
Principal
Amount | | | | | Fair Value | | | |
| | | | | | | | | | |
| | | | | | | | | | |
| Corporate Bonds — 23.9% | | | | | | |
| Consumer Staples — 1.9% | | | | | | |
| $ | 1,985,000 | | | PepsiCo, Inc.,
3.100%, 1/15/15 | | $ | 1,987,203 | | | |
| | 1,720,000 | | | PepsiCo, Inc., 0.433%, 7/30/15 (a) | | | 1,721,934 | | | |
| | 1,950,000 | | | Procter & Gamble Co./The, 3.500%, 2/15/15 | | | 1,957,678 | | | |
| | | | | | | | 5,666,815 | | | |
| Financials — 13.6% | | | | | | |
| | 10,000,000 | | | Bank of Montreal, MTN, 0.505%, 9/24/15 (a) | | | 10,017,404 | | | |
| | 7,500,000 | | | JPMorgan Chase & Co., MTN, 1.297%, 3/20/15 (a) | | | 7,515,455 | | | |
| | 7,500,000 | | | National Australia Bank Ltd., 0.436%, 5/28/15 (a) (b) | | | 7,506,067 | | | |
| | 6,540,000 | | | Royal Bank of Canada, 3.125%, 4/14/15 (b) | | | 6,593,557 | | | |
| | 7,573,000 | | | Wells Fargo & Co., 0.433%, 10/28/15 (a) | | | 7,580,714 | | | |
| | 1,000,000 | | | Westpac Banking Corp., 0.483%, 1/29/15 (a) (b) | | | 1,000,221 | | | |
| | | | | | | | 40,213,418 | | | |
| Health Care — 1.7% | | | | | | |
| | 5,000,000 | | | Medtronic, Inc., 3.000%, 3/15/15 | | | 5,027,401 | | | |
| Industrials — 4.1% | | | | | | |
| | 1,200,000 | | | Emerson Electric Co., 4.125%, 4/15/15 | | | 1,213,008 | | | |
| | 7,500,000 | | | Honeywell International, 0.210%, 6/24/15 (c) (d) | | | 7,492,388 | | | |
| | 3,600,000 | | | John Deere Capital Corp., MTN, 0.361%, 6/15/15 (a) | | | 3,602,795 | | | |
| | | | | | | | 12,308,191 | | | |
| Information Technology — 2.6% | | | | | | |
| | 2,650,000 | | | eBay, Inc., 1.625%, 10/15/15 | | | 2,672,230 | | | |
| | | | | | | | | | |
Principal
Amount | | | | | Fair Value | | | |
| | | | | | | | | | |
| | | | | | | | | | |
| Corporate Bonds — (Continued) | | | | | | |
| Information Technology — (Continued) | | | | | | |
| $ | 5,000,000 | | | International Business Machines Corp.,
0.550%, 2/6/15 | | $ | 5,001,657 | | | |
| | | | | | | | 7,673,887 | | | |
| Total Corporate Bonds (Cost $70,889,712) | | | 70,889,712 | | | |
| Commercial Paper — 19.6% (c) (d) | | | | | | |
| Consumer Discretionary — 2.5% | | | | | | |
| | 7,500,000 | | | Walt Disney Co./The, 0.110%, 3/18/15 | | | 7,498,258 | | | |
| Consumer Staples — 1.7% | | | | | | |
| | 5,000,000 | | | Coca-Cola Co.,
0.160%, 4/10/15 | | | 4,997,800 | | | |
| Financials — 12.7% | | | | | | |
| | 10,000,000 | | | Bank of Nova Scotia, 0.230%, 6/19/15 | | | 9,989,203 | | | |
| | 7,500,000 | | | Credit Suisse,
0.321%, 5/21/15 | | | 7,490,667 | | | |
| | 10,000,000 | | | Mizuho Funding LLC, 0.200%, 2/23/15 | | | 9,997,056 | | | |
| | 10,000,000 | | | Toronto-Dominion Holdings, Inc., 0.210%, 6/1/15 | | | 9,991,192 | | | |
| | | | | | | | 37,468,118 | | | |
| Industrials — 2.7% | | | | | | |
| | 8,000,000 | | | Emerson Electric Co., 0.170%, 4/6/15 | | | 7,996,411 | | | |
| Total Commercial Paper (Cost $57,960,587) | | | 57,960,587 | | | |
| Yankee Certificates of Deposit — 2.1% | | | | | | |
| Financials — 2.1% | | | | | | |
| | 634,000 | | | Bank of Montreal, 0.230%, 4/14/15 (a) | | | 633,964 | | | |
| | 4,850,000 | | | Credit Suisse,
0.553%, 8/24/15 (a) | | | 4,852,259 | | | |
(See notes which are an integral part of the Financial Statements)
Annual Shareholder Report
19
| | |
| Huntington Money Market Fund | | (Continued) |
| | | | | | | | | | |
Principal
Amount | | | | | Fair Value | | | |
| | | | | | | | | | |
| Yankee Certificates of Deposit — (Continued) | | | | | | |
| Financials — (Continued) | | | | | | |
| $ | 500,000 | | | Toronto-Dominion Bank, 0.231%, 4/15/15 (a) | | $ | 499,986 | | | |
| | 300,000 | | | Westpac Banking Corp., 0.247%, 3/20/15 (a) | | | 299,986 | | | |
| Total Yankee Certificates of Deposit
(Cost $6,286,195) | | | 6,286,195 | | | |
| U.S. Government Agencies — 28.5% | | | | | | |
| Federal Farm Credit Bank — 13.4% | | | | | | |
| | 10,000,000 | | | 0.230%, 3/16/15 (a) | | | 10,003,000 | | | |
| | 5,045,000 | | | 0.190%, 3/20/15 (a) | | | 5,046,163 | | | |
| | 4,500,000 | | | 0.184%, 4/23/15 (a) | | | 4,501,277 | | | |
| | 10,000,000 | | | 0.185%, 4/27/15 (a) | | | 10,002,434 | | | |
| | 10,000,000 | | | 0.130%, 8/7/15 (a) | | | 10,000,623 | | | |
| | | | | | | | 39,553,497 | | | |
| Federal Home Loan Bank — 3.4% | | | | | | |
| | 10,000,000 | | | 0.250%, 2/20/15 | | | 10,002,336 | | | |
| Federal Home Loan Bank Discount
Note — 7.8% | | | | | | |
| | 23,125,000 | | | 0.169%, 3/20/15 (c) (d) | | | 23,116,633 | | | |
| Federal National Mortgage
Association — 3.9% | | | | | | |
| | 11,650,000 | | | 0.140%, 2/27/15 (a) | | | 11,650,955 | | | |
| Total U.S. Government Agencies
(Cost $84,323,421) | | | 84,323,421 | | | |
| | | | | | | | | | |
Principal
Amount | | | | | Fair Value | | | |
| | | | | | | | | | |
| Repurchase Agreements — 23.6% | | | | | | |
| $ | 70,000,000 | | | TD Securities, 0.060%,
dated 12/30/14, due 1/2/15, repurchase price $70,000,467 (collateralized by U.S. Treasury Note, 3.750% 11/15/18, market value $71,701,398) | | $ | 70,000,000 | | | |
| Total Repurchase Agreements
(Cost $70,000,000) | | | 70,000,000 | | | |
| Total Investments
(Cost $289,459,915) — 97.7% | | | 289,459,915 | | | |
| Other Assets in Excess of Liabilities — 2.3% | | | 6,813,640 | | | |
| Net Assets — 100.0% | | $ | 296,273,555 | | | |
| (a) | Variable or Floating Rate Security. Rate disclosed is as of December 31, 2014. |
| (b) | Security exempt from registration under Rule 144A or Section 4(2) of the Securities Act of 1933. The security may be resold in transactions exempt from registration, normally to qualified institutional buyers. These securities have been deemed liquid by the Advisor in accordance with guidelines established by the Trustees. |
| (c) | Rate represents the effective yield at purchase. |
(See notes which are an integral part of the Financial Statements)
Annual Shareholder Report
20
| | |
| Huntington U.S. Treasury Money Market Fund | | December 31, 2014 |
| | |
| Portfolio of Investments Summary Table | | (unaudited) |
| | | | |
| Asset Allocation | | Percentage of
Market Value | |
U.S. Treasury Obligations | | | 73.8% | |
Repurchase Agreements | | | 26.2% | |
Total | | | 100.0% | |
Portfolio holdings and allocations are subject to change. As of December 31, 2014, percentages in the table above are based on total investments. Such total investments may differ from the percentages set forth below in the Portfolio of Investments which are computed using the Fund’s net assets.
Portfolio of Investments
| | | | | | | | | | |
Principal
Amount | | | | | Fair Value | | | |
| | | | | | | | | | |
| U.S. Treasury Obligations — 72.9% | | | | | | |
| U.S. Treasury Bills — 15.5% (a) | | | | | | |
| $ | 40,215,000 | | | 0.031%, 1/15/15 | | $ | 40,214,515 | | | |
| | 90,000,000 | | | 0.000%, 1/22/15 | | | 90,000,000 | | | |
| | 35,000,000 | | | 0.117%, 6/25/15 | | | 34,980,166 | | | |
| | | | | | | | 165,194,681 | | | |
| U.S. Treasury Notes — 57.4% | | | | | | |
| | 75,000,000 | | | 2.250%, 1/31/15 | | | 75,135,294 | | | |
| | 25,000,000 | | | 0.250%, 1/31/15 | | | 25,003,447 | | | |
| | 75,000,000 | | | 0.250%, 2/15/15 | | | 75,019,655 | | | |
| | 35,000,000 | | | 2.375%, 2/28/15 | | | 35,131,231 | | | |
| | 50,000,000 | | | 0.375%, 3/15/15 | | | 50,028,892 | | | |
| | 25,000,000 | | | 0.250%, 3/31/15 | | | 25,011,763 | | | |
| | 75,000,000 | | | 0.125%, 4/30/15 | | | 75,014,628 | | | |
| | 50,000,000 | | | 0.250%, 5/15/15 | | | 50,027,173 | | | |
| | 50,000,000 | | | 0.250%, 5/31/15 | | | 50,037,029 | | | |
| | 125,000,000 | | | 0.099%, 4/30/16 (b) | | | 125,006,394 | | | |
| | 25,000,000 | | | 0.083%, 10/31/16 (b) | | | 24,977,041 | | | |
| | | | | | | | 610,392,547 | | | |
| Total U.S. Treasury Obligations
(Cost $775,587,228) | | | 775,587,228 | | | |
| | | | | | | | | | |
Principal
Amount | | | | | Fair Value | | | |
| | | | | | | | | | |
| Repurchase Agreements — 25.8% | | | | | | |
| $ | 150,000,000 | | | TD Securities, 0.060%,
dated 12/30/14, due 1/2/15, repurchase price $150,000,750 (collateralized by U.S. Treasury Note, 3.750% 11/15/18, market value $153,645,852) | | $ | 150,000,000 | | | |
| | 125,000,000 | | | TD Securities, 0.080%,
dated 12/29/14, due 1/2/15, repurchase price $125,001,111 (collateralized by U.S. Treasury Note, 2.125% 6/30/21, market value $127,500,000) | | | 125,000,000 | | | |
| Total Repurchase Agreements
(Cost $275,000,000) | | | 275,000,000 | | | |
| Total Investments
(Cost $1,050,587,228) — 98.7% | | | 1,050,587,228 | | | |
| Other Assets in Excess of Liabilities — 1.3% | | | 14,156,573 | | | |
| Net Assets — 100.0% | | $ | 1,064,743,801 | | | |
| (a) | Rate represents the effective yield at purchase. |
| (b) | Variable or Floating Rate Security. Rate disclosed is as of December 31, 2014. |
(See notes which are an integral part of the Financial Statements)
Annual Shareholder Report
21
| | |
| Huntington Dividend Capture Fund | | December 31, 2014 |
| | |
| Portfolio of Investments Summary Table | | (unaudited) |
| | | | |
| Asset Allocation | | Percentage of
Market Value | |
Financials | | | 31.5% | |
Real Estate Investment Trusts | | | 13.9% | |
Energy | | | 8.7% | |
Information Technology | | | 7.4% | |
Health Care | | | 6.7% | |
Consumer Staples | | | 6.0% | |
Industrials | | | 5.9% | |
Cash(a) | | | 4.4% | |
Utilities | | | 3.8% | |
Short-Term Securities Held as Collateral for Securities Lending | | | 3.0% | |
Consumer Discretionary | | | 2.9% | |
Telecommunication Services | | | 2.5% | |
Exchange-Traded Funds | | | 1.7% | |
Materials | | | 1.6% | |
Total | | | 100.0% | |
| (a) | Investments in an affiliated money market fund. |
Portfolio holdings and allocations are subject to change. As of December 31, 2014, percentages in the table above are based on total investments. Such total investments may differ from the percentages set forth below in the Portfolio of Investments which are computed using the Fund’s net assets.
The Portfolio of Investments Summary Table and the Portfolio of Investments are broken down by sectors, and these sectors do not represent industry categories for purposes of identifying “industry concentration” as described in the Investment Company Act of 1940, as amended.
Portfolio of Investments
| | | | | | | | | | |
| Shares | | | | | Fair Value | | | |
| | | | | | | | | | |
| Common Stocks — 70.2% | | | | | | |
| Consumer Discretionary — 3.0% | | | | | | |
| | 16,500 | | | Comcast Corp., Class A | | $ | 957,165 | | | |
| | 72,000 | | | Ford Motor Co. | | | 1,116,000 | | | |
| | 53,250 | | | International Game Technology | | | 918,563 | | | |
| | 10,000 | | | McDonalds Corp. | | | 937,000 | | | |
| | 27,000 | | | Starwood Hotels & Resorts Worldwide, Inc. | | | 2,188,890 | | | |
| | | | | | | | 6,117,618 | | | |
| Consumer Staples — 6.2% | | | | | | |
| | 68,250 | | | Campbell Soup Co. | | | 3,003,000 | | | |
| | 21,750 | | | Colgate-Palmolive Co. | | | 1,504,882 | | | |
| | 50,000 | | | Flowers Foods, Inc. | | | 959,500 | | | |
| | 24,500 | | | Kellogg Co. | | | 1,603,280 | | | |
| | 26,000 | | | Kimberly-Clark Corp. | | | 3,004,040 | | | |
| | 22,500 | | | Philip Morris International, Inc. | | | 1,832,625 | | | |
| | 7,000 | | | Wal-Mart Stores, Inc. | | | 601,160 | | | |
| | | | | | | | 12,508,487 | | | |
| Energy — 8.9% | | | | | | |
| | 30,650 | | | ConocoPhillips | | | 2,116,689 | | | |
| | 7,500 | | | Enterprise Products Partners LP | | | 270,900 | | | |
| | 60,050 | | | Exxon Mobil Corp. | | | 5,551,622 | | | |
| | 101,000 | | | Marathon Oil Corp. | | | 2,857,290 | | | |
| | 15,250 | | | Murphy Oil Corp. | | | 770,430 | | | |
| | | | | | | | | | |
| Shares | | | | | Fair Value | | | |
| | | | | | | | | | |
| Common Stocks — (Continued) | | | | | | |
| Energy — (Continued) | | | | | | |
| | 105,000 | | | Noble Corp. PLC | | $ | 1,739,850 | | | |
| | 32,000 | | | Occidental Petroleum Corp. | | | 2,579,520 | | | |
| | 50,250 | | | Peabody Energy Corp. (a) | | | 388,935 | | | |
| | 56,150 | | | Suncor Energy, Inc. | | | 1,784,447 | | | |
| | | | | | | | 18,059,683 | | | |
| Financials — 15.9% | | | | | | |
| | 193,500 | | | Apollo Investment Corp. (a) (b) | | | 1,435,770 | | | |
| | 48,500 | | | Ares Capital Corp. (b) | | | 756,843 | | | |
| | 43,500 | | | Bank of Nova Scotia/The (a) | | | 2,482,980 | | | |
| | 17,250 | | | BB&T Corp. | | | 670,853 | | | |
| | 37,000 | | | Eaton Vance Corp. | | | 1,514,410 | | | |
| | 188,500 | | | Fulton Financial Corp. | | | 2,329,860 | | | |
| | 21,000 | | | Healthcare Trust of America, Inc. | | | 565,740 | | | |
| | 59,500 | | | JPMorgan Chase & Co. | | | 3,723,510 | | | |
| | 50,000 | | | Northern Trust Corp., Series C | | | 1,252,500 | | | |
| | 30,000 | | | Royal Bank of Canada | | | 2,072,100 | | | |
| | 91,000 | | | TCF Financial Corp. | | | 1,445,990 | | | |
| | 35,000 | | | Toronto-Dominion Bank/The (a) | | | 1,672,300 | | | |
| | 13,000 | | | Travelers Cos., Inc./The | | | 1,376,050 | | | |
| | 52,100 | | | U.S. Bancorp | | | 2,341,895 | | | |
| | 72,000 | | | Unum Group | | | 2,511,360 | | | |
| | 52,250 | | | Waddell & Reed Financial, Inc., Class A | | | 2,603,095 | | | |
(See notes which are an integral part of the Financial Statements)
Annual Shareholder Report
22
| | |
| Huntington Dividend Capture Fund | | (Continued) |
| | | | | | | | | | |
| Shares | | | | | Fair Value | | | |
| | | | | | | | | | |
| Common Stocks — (Continued) | | | | | | |
| Financials — (Continued) | | | | | | |
| | 62,600 | | | Wells Fargo & Co. | | $ | 3,431,732 | | | |
| | | | | | | | 32,186,988 | | | |
| Health Care — 6.9% | | | | | | |
| | 21,000 | | | AbbVie, Inc. | | | 1,374,240 | | | |
| | 36,250 | | | Baxter International, Inc. | | | 2,656,762 | | | |
| | 7,000 | | | Becton, Dickinson and Co. | | | 974,120 | | | |
| | 31,250 | | | GlaxoSmithKline PLC ADR | | | 1,335,625 | | | |
| | 19,500 | | | Johnson & Johnson | | | 2,039,115 | | | |
| | 2,500 | | | Medtronic, Inc. | | | 180,500 | | | |
| | 38,250 | | | Merck & Co., Inc. | | | 2,172,217 | | | |
| | 107,000 | | | Pfizer, Inc. | | | 3,333,050 | | | |
| | | | | | | | 14,065,629 | | | |
| Industrials — 4.8% | | | | | | |
| | 39,000 | | | ADT Corp./The (a) | | | 1,412,970 | | | |
| | 16,000 | | | CSX Corp. | | | 579,680 | | | |
| | 228,750 | | | General Electric Co. | | | 5,780,512 | | | |
| | 16,750 | | | United Parcel Service, Inc., Class B | | | 1,862,097 | | | |
| | | | | | | | 9,635,259 | | | |
| Information Technology — 7.6% | | | | | | |
| | 7,750 | | | Accenture PLC, Class A | | | 692,153 | | | |
| | 50,000 | | | CA, Inc. | | | 1,522,500 | | | |
| | 99,250 | | | Cisco Systems, Inc. | | | 2,760,639 | | | |
| | 67,600 | | | Intel Corp. | | | 2,453,204 | | | |
| | 11,500 | | | International Business Machines Corp. | | | 1,845,060 | | | |
| | 51,250 | | | Microchip Technology, Inc. | | | 2,311,887 | | | |
| | 28,550 | | | Paychex, Inc. | | | 1,318,154 | | | |
| | 53,250 | | | Symantec Corp. | | | 1,366,129 | | | |
| | 26,250 | | | Xilinx, Inc. | | | 1,136,363 | | | |
| | | | | | | | 15,406,089 | | | |
| Materials — 1.6% | | | | | | |
| | 35,500 | | | Bemis Co., Inc. | | | 1,604,955 | | | |
| | 38,750 | | | Sonoco Products Co. | | | 1,693,375 | | | |
| | | | | | | | 3,298,330 | | | |
| Real Estate Investment Trusts — 9.2% | | | | | | |
| | 29,000 | | | Camden Property Trust | | | 2,141,360 | | | |
| | 45,000 | | | Equity One, Inc. | | | 1,141,200 | | | |
| | 53,050 | | | HCP, Inc. | | | 2,335,791 | | | |
| | 38,500 | | | Highwoods Properties, Inc. | | | 1,704,780 | | | |
| | 53,850 | | | Kimco Realty Corp. | | | 1,353,789 | | | |
| | 194,000 | | | Lexington Realty Trust | | | 2,130,120 | | | |
| | 198,169 | | | Medical Properties Trust, Inc. | | | 2,730,769 | | | |
| | 168,000 | | | Piedmont Office Realty Trust, Inc. (a) | | | 3,165,120 | | | |
| | 84,000 | | | Retail Properties of America, Inc. | | | 1,401,960 | | | |
| | 21,000 | | | UDR, Inc. | | | 647,220 | | | |
| | | | | | | | 18,752,109 | | | |
| Telecommunication Services — 2.1% | | | | | | |
| | 79,000 | | | AT&T, Inc. | | | 2,653,610 | | | |
| | 34,750 | | | Verizon Communications, Inc. | | | 1,625,605 | | | |
| | | | | | | | 4,279,215 | | | |
| | | | | | | | | | |
| Shares | | | | | Fair Value | | | |
| | | | | | | | | | |
| Common Stocks — (Continued) | | | | | | |
| Utilities — 4.0% | | | | | | |
| | 113,500 | | | CenterPoint Energy, Inc. | | $ | 2,659,305 | | | |
| | 29,750 | | | Hawaiian Electric Industries, Inc. | | | 996,030 | | | |
| | 117,750 | | | Questar Corp. | | | 2,976,720 | | | |
| | 28,500 | | | TransCanada Corp. | | | 1,399,350 | | | |
| | | | | | | | 8,031,405 | | | |
| Total Common Stocks (Cost $128,577,022) | | | 142,340,812 | | | |
| Preferred Stocks — 23.5% | | | | | | |
| Financials — 16.6% | | | | | | |
| | 110,000 | | | Allstate Corp./The, 5.100% | | | 2,786,300 | | | |
| | 80,000 | | | American Financial Group,
Inc., 7.000% | | | 2,076,000 | | | |
| | 104,700 | | | Axis Capital Holdings Ltd.,
Series C, 6.875% | | | 2,797,584 | | | |
| | 80,000 | | | BB&T Corp., 5.850% | | | 2,004,000 | | | |
| | 115,000 | | | Charles Schwab Corp./The,
Series B, 6.000% | | | 2,944,000 | | | |
| | 155,000 | | | JPMorgan Chase Capital
XXIX, 6.700% | | | 3,937,000 | | | |
| | 95,000 | | | KKR Financial Holdings
LLC, 8.375% | | | 2,637,200 | | | |
| | 115,000 | | | PartnerRe Ltd.,
Series E, 7.250% | | | 3,063,600 | | | |
| | 80,000 | | | Prudential Financial,
Inc., 5.700% | | | 1,998,400 | | | |
| | 120,000 | | | Raymond James Financial,
Inc., 6.900% | | | 3,274,800 | | | |
| | 55,000 | | | State Street Corp.,
Series C, 5.250% | | | 1,261,150 | | | |
| | 170,000 | | | Wells Fargo & Co.,
Series J, 8.000% | | | 4,958,900 | | | |
| | | | | | | | 33,738,934 | | | |
| Industrials — 1.3% | | | | | | |
| | 105,000 | | | Stanley Black & Decker,
Inc., 5.750% (a) | | | 2,652,300 | | | |
| Real Estate Investment Trusts — 5.1% | | | | | | |
| | 140,000 | | | Kimco Realty Corp.,
Series H, 6.900% | | | 3,593,800 | | | |
| | 89,101 | | | PS Business Parks, Inc.,
Series S, 6.450% | | | 2,284,550 | | | |
| | 40,000 | | | Public Storage, Inc.,
Series V, 5.375% | | | 939,200 | | | |
| | 130,000 | | | Realty Income Corp.,
Series F, 6.625% | | | 3,408,600 | | | |
| | 6,746 | | | Senior Housing Properties
Trust, 5.625% | | | 162,511 | | | |
| | | | | | | | 10,388,661 | | | |
| Telecommunication Services — 0.5% | | | | | | |
| | 35,000 | | | Verizon Communications,
Inc., 5.900% | | | 916,300 | | | |
| Total Preferred Stocks (Cost $46,352,984) | | | 47,696,195 | | | |
(See notes which are an integral part of the Financial Statements)
Annual Shareholder Report
23
| | |
| Huntington Dividend Capture Fund | | (Continued) |
| | | | | | | | | | |
| Shares | | | | | Fair Value | | | |
| | | | | | | | | | |
| Exchange-Traded Funds — 1.8% | | | | | | |
| | 9,250 | | | iShares U.S. Real Estate ETF (a) | | $ | 710,770 | | | |
| | 36,750 | | | SPDR S&P Dividend ETF (a) | | | 2,895,900 | | | |
| Total Exchange-Traded Funds
(Cost $3,105,742) | | | 3,606,670 | | | |
| Cash Equivalents — 4.5% | | | | | | |
| | 9,104,401 | | | Huntington Money Market Fund, Institutional Shares, 0.040% (c) (d) | | | 9,104,401 | | | |
| Total Cash Equivalents (Cost $9,104,401) | | | 9,104,401 | | | |
| Short-Term Securities Held as Collateral for
Securities Lending — 3.1% | | | | | | |
| | 6,334,281 | | | Fidelity Institutional Money Market Portfolio, Institutional Class, 0.110% (d) | | | 6,334,281 | | | |
| Total Short-Term Securities Held as Collateral
for Securities Lending (Cost $6,334,281) | | | 6,334,281 | | | |
| Total Investments
(Cost $193,474,430) — 103.1% | | | 209,082,359 | | | |
| Liabilities in Excess of Other Assets — (3.1)% | | | (6,306,452) | | | |
| Net Assets — 100.0% | | $ | 202,775,907 | | | |
| (a) | All or a portion of the security was on loan as of December 31, 2014. The total value of securities on loan as of December 31, 2014 was $6,172,073. |
| (b) | Business Development Company |
| (c) | Investment in affiliate. |
| (d) | Rate disclosed is the seven day yield as of December 31, 2014. |
ADR — American Depositary Receipt
ETF — Exchange-Traded Fund
SPDR — Standard & Poor’s Depositary Receipts
(See notes which are an integral part of the Financial Statements)
Annual Shareholder Report
24
| | |
| Huntington Global Select Markets Fund | | December 31, 2014 |
| | | | |
| Portfolio of Investments Summary Table | | (unaudited) |
| | | | |
| Asset Allocation | | Percentage of
Market Value | |
Japan | | | 18.4% | |
United Kingdom | | | 13.7% | |
China | | | 10.5% | |
Switzerland | | | 7.9% | |
Germany | | | 7.8% | |
India | | | 6.3% | |
United States | | | 5.5% | |
France | | | 5.3% | |
Canada | | | 5.3% | |
Belgium | | | 2.8% | |
Sweden | | | 2.8% | |
Republic of South Korea | | | 2.7% | |
Spain | | | 2.6% | |
Taiwan | | | 2.2% | |
Indonesia | | | 1.9% | |
Brazil | | | 1.4% | |
Mexico | | | 1.2% | |
Malaysia | | | 0.7% | |
Hong Kong | | | 0.7% | |
Thailand | | | 0.3% | |
Cash(a) | | | 0.0% | |
Total | | | 100.0% | |
| (a) | Investments in an affiliated money market fund. |
Portfolio holdings and allocations are subject to change. As of December 31, 2014, percentages in the table above are based on total investments. Such total investments may differ from the percentages set forth below in the Portfolio of Investments which are computed using the Fund’s net assets.
The Portfolio of Investments are broken down by sectors, and these sectors do not represent industry categories for purposes of identifying “industry concentration” as described in the Investment Company Act of 1940, as amended.
Portfolio of Investments
| | | | | | | | | | |
| Shares | | | | | Fair Value | | | |
| | | | | | | | | | |
| Common Stocks — 104.8% | | | | | | |
| Belgium — 3.0% | | | | | | |
| Consumer Staples — 3.0% | | | | | | |
| | 7,300 | | | Anheuser-Busch InBev NV | | $ | 821,614 | | | |
| Brazil — 1.5% | | | | | | |
| Consumer Discretionary — 0.7% | | | | | | |
| | 35,400 | | | Kroton Educacional SA | | | 206,372 | | | |
| Information Technology — 0.8% | | | | | | |
| | 11,000 | | | Linx SA | | | 209,000 | | | |
| | | | | | | | 415,372 | | | |
| Canada — 5.6% | | | | | | |
| Industrials — 5.6% | | | | | | |
| | 11,000 | | | Canadian National Railway Co. | | | 757,635 | | | |
| | 4,000 | | | Canadian Pacific Railway Ltd. | | | 770,760 | | | |
| | | | | | | | 1,528,395 | | | |
| | | | | | | | | | |
| Shares | | | | | Fair Value | | | |
| | | | | | | | | | |
| Common Stocks — (Continued) | | | | | | |
| China — 11.1% | | | | | | |
| Consumer Discretionary — 1.1% | | | | | | |
| | 19,000 | | | Byd Co. Ltd. | | $ | 73,275 | | | |
| | 12,000 | | | Vipshop Holdings Ltd. ADR * | | | 234,480 | | | |
| | | | | | | | 307,755 | | | |
| Health Care — 0.6% | | | | | | |
| | 130,000 | | | China Animal Healthcare Ltd. | | | 89,975 | | | |
| | 110,000 | | | Consun Pharmaceutical Group Ltd. | | | 82,720 | | | |
| | | | | | | | 172,695 | | | |
| Industrials — 0.8% | | | | | | |
| | 220,000 | | | CT Environmental Group Ltd. | | | 224,343 | | | |
| Information Technology — 8.6% | | | | | | |
| | 9,900 | | | Alibaba Group Holding Ltd. ADR * | | | 1,029,006 | | | |
| | 4,750 | | | Baidu, Inc. ADR * | | | 1,082,857 | | | |
(See notes which are an integral part of the Financial Statements)
Annual Shareholder Report
25
| | |
| Huntington Global Select Markets Fund | | (Continued) |
| | | | | | | | | | |
| Shares | | | | | Fair Value | | | |
| | | | | | | | | | |
| Common Stocks — (Continued) | | | | | | |
| China — (Continued) | | | | | | |
| Information Technology — (Continued) | | | | | | |
| | 15,500 | | | Tencent Holdings Ltd. | | $ | 224,270 | | | |
| | | | | | | | 2,336,133 | | | |
| | | | | | | | 3,040,926 | | | |
| France — 5.5% | | | | | | |
| Financials — 2.8% | | | | | | |
| | 60,000 | | | Credit Agricole SA | | | 774,570 | | | |
| Industrials — 2.7% | | | | | | |
| | 12,000 | | | Safran SA | | | 740,395 | | | |
| | | | | | | | 1,514,965 | | | |
| Germany — 8.2% | | | | | | |
| Financials — 3.0% | | | | | | |
| | 4,900 | | | Allianz SE | | | 811,629 | | | |
| Health Care — 2.5% | | | | | | |
| | 5,000 | | | Bayer AG | | | 681,594 | | | |
| Industrials — 2.7% | | | | | | |
| | 17,000 | | | GEA Group AG | | | 747,481 | | | |
| | | | | | | | 2,240,704 | | | |
| Hong Kong — 0.7% | | | | | | |
| Health Care — 0.7% | | | | | | |
| | 210,000 | | | Sino Biopharmaceutical Ltd. | | | 189,233 | | | |
| India — 6.5% | | | | | | |
| Consumer Discretionary — 1.3% | | | | | | |
| | 57,000 | | | Zee Entertainment Enterprises Ltd. | | | 342,000 | | | |
| Energy — 0.3% | | | | | | |
| | 10,500 | | | Oil India Ltd. | | | 95,333 | | | |
| Financials — 1.6% | | | | | | |
| | 7,200 | | | HDFC Bank Ltd. | | | 108,011 | | | |
| | 29,000 | | | ICICI Bank Ltd. ADR | | | 334,950 | | | |
| | | | | | | | 442,961 | | | |
| Health Care — 0.7% | | | | | | |
| | 15,000 | | | Sun Pharmaceutical Industries Ltd. | | | 195,799 | | | |
| Industrials — 1.2% | | | | | | |
| | 25,000 | | | Amara Raja Batteries Ltd. | | | 325,130 | | | |
| Information Technology — 1.4% | | | | | | |
| | 3,300 | | | Tata Consultancy Services Ltd. | | | 133,466 | | | |
| | 6,200 | | | Tech Mahindra Ltd. | | | 253,891 | | | |
| | | | | | | | 387,357 | | | |
| | | | | | | | 1,788,580 | | | |
| Indonesia — 1.5% | | | | | | |
| Consumer Discretionary — 0.7% | | | | | | |
| | 155,000 | | | Matahari Department Store Tbk PT | | | 186,468 | | | |
| | | | | | | | | | |
| Shares | | | | | Fair Value | | | |
| | | | | | | | | | |
| Common Stocks — (Continued) | | | | | | |
| Indonesia — (Continued) | | | | | | |
| Health Care — 0.6% | | | | | | |
| | 145,000 | | | Siloam International Hospitals Tbk PT * | | $ | 160,113 | | | |
| Telecommunication Services — 0.2% | | | | | | |
| | 75,000 | | | Tower Bersama Infrastructure Tbk PT | | | 58,564 | | | |
| | | | | | | | 405,145 | | | |
| Japan — 19.5% | | | | | | |
| Consumer Staples — 5.7% | | | | | | |
| | 22,000 | | | Seven & I Holdings Co. Ltd. | | | 791,469 | | | |
| | 25,600 | | | Welcia Holdings Co. Ltd. | | | 758,067 | | | |
| | | | | | | | 1,549,536 | | | |
| Health Care — 2.8% | | | | | | |
| | 55,000 | | | Astellas Pharma, Inc. | | | 765,812 | | | |
| Industrials — 2.6% | | | | | | |
| | 16,000 | | | Makita Corp. | | | 721,082 | | | |
| Information Technology — 5.8% | | | | | | |
| | 1,780 | | | KEYENCE Corp. | | | 793,258 | | | |
| | 7,200 | | | Murata Manufacturing Co. Ltd. | | | 785,770 | | | |
| | | | | | | | 1,579,028 | | | |
| Telecommunication Services — 2.6% | | | | | | |
| | 12,000 | | | Softbank Corp. | | | 714,369 | | | |
| | | | | | | | 5,329,827 | | | |
| Malaysia — 0.7% | | | | | | |
| Information Technology — 0.7% | | | | | | |
| | 162,000 | | | Globetronics Technology BHD | | | 197,695 | | | |
| Mexico — 1.2% | | | | | | |
| Financials — 1.2% | | | | | | |
| | 125,000 | | | Compartamos SAB de CV | | | 251,212 | | | |
| | 12,100 | | | Grupo Financiero Interacciones SA de CV | | | 82,465 | | | |
| | | | | | | | 333,677 | | | |
| Republic of South Korea — 2.8% | | | | | | |
| Consumer Staples — 1.6% | | | | | | |
| | 2,244 | | | Cosmax, Inc. * | | | 203,992 | | | |
| | 4,000 | | | i-SENS, Inc. * | | | 230,041 | | | |
| | | | | | | | 434,033 | | | |
| Financials — 0.7% | | | | | | |
| | 4,900 | | | Shinhan Financial Group Co. Ltd. | | | 198,336 | | | |
| Information Technology — 0.5% | | | | | | |
| | 3,600 | | | Koh Young Technology, Inc. | | | 140,583 | | | |
| | | | | | | | 772,952 | | | |
| Spain — 2.7% | | | | | | |
| Financials — 2.7% | | | | | | |
| | 77,097 | | | Banco Bilbao Vizcaya SA | | | 728,190 | | | |
(See notes which are an integral part of the Financial Statements)
Annual Shareholder Report
26
| | |
| Huntington Global Select Markets Fund | | (Continued) |
| | | | | | | | | | |
Shares | | | | | Fair Value | | | |
| | | | | | | | | | |
| Common Stocks — (Continued) | | | | | | |
| Sweden — 3.0% | | | | | | |
| Consumer Discretionary — 3.0% | | | | | | |
| | 19,500 | | | Hennes & Mauritz AB | | $ | 810,104 | | | |
| Switzerland — 8.3% | | | | | | |
| Financials — 2.9% | | | | | | |
| | 7,000 | | | ACE Ltd. | | | 804,160 | | | |
| Health Care — 5.4% | | | | | | |
| | 8,000 | | | Novartis AG | | | 742,022 | | | |
| | 2,700 | | | Roche Holding AG | | | 731,618 | | | |
| | | | | | | | 1,473,640 | | | |
| | | | | | | | 2,277,800 | | | |
| Taiwan — 2.4% | | | | | | |
| Consumer Discretionary — 0.1% | | | | | | |
| | 1,945 | | | PChome Online, Inc. | | | 20,831 | | | |
| Financials — 0.9% | | | | | | |
| | 152,687 | | | Fubon Financial Holding Co. Ltd. | | | 242,453 | | | |
| Industrials — 0.8% | | | | | | |
| | 36,700 | | | Delta Electronics, Inc. | | | 216,349 | | | |
| Materials — 0.6% | | | | | | |
| | 132,190 | | | Asia Cement Corp. | | | 162,393 | | | |
| | | | | 642,026 | | | |
| Thailand — 0.3% | | | | | | |
| Information Technology — 0.3% | | | | | | |
| | 82,000 | | | KCE Electronics PCL | | | 84,785 | | | |
| United Kingdom — 14.5% | | | | | | |
| Consumer Discretionary — 5.8% | | | | | | |
| | 16,000 | | | Liberty Global PLC, Class A * | | | 803,280 | | | |
| | 16,000 | | | Liberty Global PLC, Class C * | | | 772,960 | | | |
| | | | | | | | 1,576,240 | | | |
| Consumer Staples — 2.9% | | | | | | |
| | 9,601 | | | Reckitt Benckiser Group PLC | | | 777,685 | | | |
| Health Care — 2.9% | | | | | | |
| | 11,000 | | | AstraZeneca PLC ADR | | | 774,180 | | | |
| | 9,601 | | | Indivior PLC * | | | 22,358 | | | |
| | | | | | | | 796,538 | | | |
| Telecommunication Services — 2.9% | | | | | | |
| | 129,000 | | | BT Group PLC | | | 802,452 | | | |
| | | | | | | | 3,952,915 | | | |
| United States — 5.8% | | | | | | |
| Health Care — 2.9% | | | | | | |
| | 7,000 | | | Celgene Corp. * | | | 783,020 | | | |
| | | | | | | | | | |
Shares/
Principal
Amount | | | | | Fair Value | | | |
| | | | | | | | | | |
| Common Stocks — (Continued) | | | | | | |
| United States — (Continued) | | | | | | |
| Information Technology — 2.9% | | | | | | |
| | 1,500 | | | Google, Inc., Class A * | | $ | 795,990 | | | |
| | | | | | | | 1,579,010 | | | |
| Total Common Stocks (Cost $23,225,277) | | | 28,653,915 | | | |
| Preferred Stocks — 0.1% | | | | | | |
| India — 0.1% | | | | | | |
| Consumer Discretionary — 0.1% | | | | | | |
| | 2,730,000 | | | Zee Entertainment Enterprises
Ltd., 6.000% | | | 37,550 | | | |
| Total Preferred Stocks (Cost $44,695) | | | 37,550 | | | |
| Foreign Government Bonds — 0.5% | | | | | | |
| Indonesia — 0.5% | | | | | | |
| | 1,700,000 | | | Indonesian Government
Series FR55,
7.375%, 9/15/16 (a) | | | 136,356 | | | |
| Total Foreign Government Bonds
(Cost $200,781) | | | 136,356 | | | |
| Rights — 0.0% | | | | | | |
| Spain — 0.0% | | | | | | |
| Financials — 0.0% | | | | | | |
| | 77,097 | | | Banco Bilbao Vizcaya
Argentaria SA * | | | 7,371 | | | |
| Total Rights (Cost $7,464) | | | 7,371 | | | |
| Cash Equivalents — 0.0% | | | | | | |
| | 7,588 | | | Huntington Money Market Fund, Institutional Shares, 0.040% (b) (c) | | | 7,588 | | | |
| Total Cash Equivalents (Cost $7,588) | | | 7,588 | | | |
| Total Investments
(Cost $23,485,805) — 105.4% | | | 28,842,780 | | | |
| Liabilities in Excess of Other Assets — (5.4)% | | | (1,490,524) | | | |
| Net Assets — 100.0% | | $ | 27,352,256 | | | |
| (a) | Foreign-denominated security. Principal amount is reported in applicable country’s currency. |
| (b) | Investment in affiliate. |
| (c) | Rate disclosed is the seven day yield as of December 31, 2014. |
| * | Non-income producing security. |
| ADR | — American Depositary Receipt |
(See notes which are an integral part of the Financial Statements)
Annual Shareholder Report
27
| | |
| Huntington Real Strategies Fund | | December 31, 2014 |
| | |
| Portfolio of Investments Summary Table | | (unaudited) |
| | | | |
| Asset Allocation | | Percentage of
Market Value | |
Energy | | | 51.9% | |
Materials | | | 11.9% | |
Industrials | | | 11.7% | |
Cash(a) | | | 7.8% | |
Real Estate Investments | | | 5.2% | |
Exchange-Traded Funds | | | 4.4% | |
Short-Term Securities Held as Collateral for Securities Lending | | | 3.8% | |
Closed-End Funds | | | 1.8% | |
Options Purchased | | | 1.5% | |
Total | | | 100.0% | |
| (a) | Investments in an affiliated money market fund. |
Portfolio holdings and allocations are subject to change. As of December 31, 2014, percentages in the table above are based on total investments. Such total investments may differ from the percentages set forth below in the Portfolio of Investments which are computed using the Fund’s net assets.
The Portfolio of Investments Summary Table and the Portfolio of Investments are broken down by sectors, and these sectors do not represent industry categories for purposes of identifying “industry concentration” as described in the Investment Company Act of 1940, as amended.
Portfolio of Investments
| | | | | | | | | | |
| Shares | | | | | Fair Value | | | |
| | | | | | | | | | |
| Common Stocks — 79.6% | | | | | | |
| Energy — 54.7% | | | | | | |
| | 16,500 | | | Alliance Resource Partners LP (a) | | $ | 710,325 | | | |
| | 38,600 | | | Canadian Natural Resources Ltd. (a) | | | 1,191,968 | | | |
| | 49,100 | | | Canadian Oil Sands Ltd. | | | 439,813 | | | |
| | 11,500 | | | Carrizo Oil & Gas, Inc. (a) * | | | 478,400 | | | |
| | 17,400 | | | Cheniere Energy, Inc. (a) * | | | 1,224,960 | | | |
| | 49,310 | | | Chesapeake Energy Corp. (a) | | | 964,997 | | | |
| | 17,900 | | | Consol Energy, Inc. (a) | | | 605,199 | | | |
| | 51,700 | | | EnCana Corp. | | | 717,079 | | | |
| | 3,500 | | | Energy Transfer Equity LP | | | 200,830 | | | |
| | 3,000 | | | Energy Transfer Partners LP | | | 195,000 | | | |
| | 31,000 | | | Enterprise Products Partners LP | | | 1,119,720 | | | |
| | 18,800 | | | Halliburton Co. (a) | | | 739,404 | | | |
| | 12,200 | | | Helmerich & Payne, Inc. (a) | | | 822,524 | | | |
| | 20,236 | | | Kinder Morgan, Inc. (b) | | | 856,185 | | | |
| | 15,500 | | | Magellan Midstream Partners LP (a) | | | 1,281,230 | | | |
| | 47,900 | | | Natural Resource Partners LP | | | 443,075 | | | |
| | 28,600 | | | Oasis Petroleum, Inc. (a) * | | | 473,044 | | | |
| | 7,000 | | | Regency Energy Partners LP | | | 168,000 | | | |
| | 6,000 | | | Schlumberger Ltd. (a) | | | 512,460 | | | |
| | 14,700 | | | SM Energy Co. (a) | | | 567,126 | | | |
| | 26,900 | | | Spectra Energy Corp. (a) | | | 976,470 | | | |
| | 2,000 | | | SunCoke Energy Partners LP | | | 54,260 | | | |
| | 30,400 | | | Suncor Energy, Inc. (a) | | | 966,112 | | | |
| | 4,000 | | | Sunoco Logistics Partners LP (a) | | | 167,120 | | | |
| | 4,000 | | | Sunoco LP | | | 199,080 | | | |
| | 19,000 | | | Valero Energy Corp. (a) | | | 940,500 | | | |
| | | | | | | | 17,014,881 | | | |
| | | | | | | | | | |
| Shares | | | | | Fair Value | | | |
| | | | | | | | | | |
| Common Stocks — (Continued) | | | | | | |
| Industrials — 12.4% | | | | | | |
| | 12,200 | | | AGCO Corp. (a) | | $ | 551,440 | | | |
| | 16,800 | | | Chicago Bridge & Iron Co. NV (a) | | | 705,264 | | | |
| | 20,090 | | | GATX Corp. (a) | | | 1,155,979 | | | |
| | 19,200 | | | Joy Global, Inc. (a) | | | 893,184 | | | |
| | 25,600 | | | Navigator Holdings Ltd. * | | | 539,136 | | | |
| | | | | | | | 3,845,003 | | | |
| Materials — 12.5% | | | | | | |
| | 3,470 | | | Agrium, Inc. (a) | | | 328,678 | | | |
| | 35,660 | | | Barrick Gold Corp. (a) | | | 383,345 | | | |
| | 10,800 | | | BHP Billiton Ltd. ADR (a) | | | 511,056 | | | |
| | 10,000 | | | Potash Corporation of Saskatchewan, Inc. (b) | | | 353,200 | | | |
| | 9,950 | | | Rio Tinto PLC ADR (a) | | | 458,297 | | | |
| | 32,130 | | | Southern Copper Corp. (a) | | | 906,066 | | | |
| | 3,700 | | | Terra Nitrogen Co. LP | | | 379,990 | | | |
| | 69,500 | | | Vale SA ADR (a) | | | 568,510 | | | |
| | | | | | | | 3,889,142 | | | |
| Total Common Stocks (Cost $24,075,879) | | | 24,749,026 | | | |
| Exchange-Traded Funds — 4.6% | | | | | | |
| | 37,030 | | | iShares Silver Trust * | | | 557,672 | | | |
| | 15,000 | | | Market Vectors Junior Gold Miners ETF | | | 358,950 | | | |
| | 35,000 | | | United States Natural Gas Fund LP (a) * | | | 516,950 | | | |
| Total Exchange-Traded Funds (Cost $2,259,294) | | | 1,433,572 | | | |
(See notes which are an integral part of the Financial Statements)
Annual Shareholder Report
28
| | |
| Huntington Real Strategies Fund | | (Continued) |
| | | | | | | | | | |
Shares/
Contracts | | | | | Fair Value | | | |
| | | | | | | | | | |
| Real Estate Investments — 5.5% (c) (d) (e) | | | | | | |
| | | | Grocery & Pharmacy DST | | $ | 886,908 | | | |
| | | | | New York Power DST (f) | | | 826,482 | | | |
| Total Real Estate Investments (Cost $1,941,705) | | | 1,713,390 | | | |
| Closed-End Fund — 1.8% | | | | | | |
| | 49,721 | | | Central Fund of Canada Ltd.,
Class A | | | 575,769 | | | |
| Total Closed-End Fund (Cost $562,506) | | | 575,769 | | | |
| Options Purchased — 1.6% | | | | | | |
| | 600 | | | CBOE Volatility Index, Call @ $19, Expiring January 2015 (a) | | | 108,000 | | | |
| | 300 | | | CBOE Volatility Index, Call @ $19, Expiring March 2015 (a) | | | 80,400 | | | |
| | 300 | | | CBOE Volatility Index, Call @ $19, Expiring May 2015 (a) | | | 91,500 | | | |
| | 1,500 | | | iShares MSCI Emerging Markets ETF, Put @ $39, Expiring
January 2015 (g) | | | 76,500 | | | |
| | 132 | | | PowerShares DB U.S. Dollar Index Bullish Fund, Call @ $24, Expiring March 2015 | | | 4,884 | | | |
| | 600 | | | SPDR S&P 500 ETF Trust, Put @ $205, Expiring January 2015 (g) | | | 141,000 | | | |
| Total Options Purchased (Cost $838,561) | | | 502,284 | | | |
| Cash Equivalents — 8.3% | | | | | | |
| | 2,571,738 | | | Huntington Money Market Fund, Institutional Shares,
0.040% (f) (h) | | | 2,571,738 | | | |
| Total Cash Equivalents (Cost $2,571,738) | | | 2,571,738 | | | |
| | | | | | | | | | |
Shares | | | | | Fair Value | | | |
| | | | | | | | | | |
| Short-Term Securities Held as Collateral for
Securities Lending — 4.0% | | | | | | |
| | 1,232,339 | | | Fidelity Institutional Money Market Portfolio, Institutional Class, 0.110% (h) | | $ | 1,232,339 | | | |
| Total Short-Term Securities Held as Collateral
for Securities Lending (Cost $1,232,339) | | | 1,232,339 | | | |
| Total Investments
(Cost $33,482,021) — 105.4% | | | 32,778,118 | | | |
| Liabilities in Excess of Other Assets — (5.4)% | | | (1,668,926) | | | |
| Net Assets — 100.0% | | $ | 31,109,192 | | | |
| (a) | All or a portion of the security is held as collateral for written call options. |
| (b) | All or a portion of the security was on loan as of December 31, 2014. The total value of securities on loan as of December 31, 2014 was $1,200,099. |
| (d) | Investments do not offer shares. Fair value represents direct ownership of real estate. |
| (e) | Security is currently being valued by the Pricing Committee according to the fair value procedures approved by the Board of Trustees. |
| (f) | Investment in affiliate. |
| (g) | All or a portion of the security is held as collateral for written put options. |
| (h) | Rate disclosed is the seven day yield as of December 31, 2014. |
| * | Non-income producing security. |
ADR — American Depositary Receipt
DST — Delaware Statutory Trust
ETF — Exchange-Traded Fund
CBOE — Chicago Board Options Exchange
SPDR — Standard & Poor’s Depositary Receipts
(See notes which are an integral part of the Financial Statements)
Annual Shareholder Report
29
| | |
| Huntington Situs Fund | | December 31, 2014 |
| | |
| Portfolio of Investments Summary Table | | (unaudited) |
| | | | |
| Asset Allocation | | Percentage of
Market Value | |
Industrials | | | 18.2% | |
Information Technology | | | 17.6% | |
Short-Term Securities Held as Collateral for Securities Lending | | | 17.4% | |
Health Care | | | 13.1% | |
Financials | | | 10.5% | |
Consumer Discretionary | | | 8.0% | |
Materials | | | 7.4% | |
Consumer Staples | | | 3.5% | |
Energy | | | 1.8% | |
Real Estate Investment Trusts | | | 1.7% | |
Utilities | | | 0.5% | |
Telecommunication Services | | | 0.2% | |
Exchange-Traded Funds | | | 0.1% | |
Total | | | 100.0% | |
Portfolio holdings and allocations are subject to change. As of December 31, 2014, percentages in the table above are based on total investments. Such total investments may differ from the percentages set forth below in the Portfolio of Investments which are computed using the Fund’s net assets.
The Portfolio of Investments Summary Table and the Portfolio of Investments are broken down by sectors, and these sectors do not represent industry categories for purposes of identifying “industry concentration” as described in the Investment Company Act of 1940, as amended.
Portfolio of Investments
| | | | | | | | | | |
| Shares | | | | | Fair Value | | | |
| | | | | | | | | | |
| Common Stocks — 99.9% | | | | | | |
| Bermuda — 2.4% | | | | | | |
| Financials — 2.4% | | | | | | |
| | 80,000 | | | Arch Capital Group Ltd. * | | $ | 4,728,000 | | | |
| Brazil — 0.7% | | | | | | |
| Consumer Staples — 0.7% | | | | | | |
| | 38,200 | | | Cia Brasileira de Distribuicao Grupo Pao de Acucar ADR | | | 1,406,906 | | | |
| Chile — 0.3% | | | | | | |
| Materials — 0.3% | | | | | | |
| | 24,000 | | | Sociedad Quimica y Minera de Chile SA ADR | | | 573,120 | | | |
| Denmark — 0.7% | | | | | | |
| Health Care — 0.7% | | | | | | |
| | 32,500 | | | Novozymes A/S, Class B | | | 1,368,059 | | | |
| Germany — 0.5% | | | | | | |
| Health Care — 0.5% | | | | | | |
| | 35,500 | | | Stada Arzneimittel AG | | | 1,077,249 | | | |
| Hong Kong — 0.5% | | | | | | |
| Consumer Discretionary — 0.5% | | | | | | |
| | 162,500 | | | Television Broadcasts Ltd. | | | 945,697 | | | |
| | | | | | | | | | |
| Shares | | | | | Fair Value | | | |
| | | | | | | | | | |
| Common Stocks — (Continued) | | | | | | |
| Japan — 0.9% | | | | | | |
| Consumer Staples — 0.2% | | | | | | |
| | 38,300 | | | Shiseido Co. Ltd. | | $ | 537,202 | | | |
| Financials — 0.2% | | | | | | |
| | 70 | | | Japan Prime Realty Investment Corp. | | | 243,592 | | | |
| | 40 | | | Japan Real Estate Investment Corp. | | | 192,755 | | | |
| | | | | | | | 436,347 | | | |
| Health Care — 0.5% | | | | | | |
| | 41,200 | | | Terumo Corp. | | | 935,203 | | | |
| | | | | | | | 1,908,752 | | | |
| Sweden — 0.8% | | | | | | |
| Consumer Discretionary — 0.8% | | | | | | |
| | 116,800 | | | Haldex AB | | | 1,513,808 | | | |
| United Kingdom — 1.4% | | | | | | |
| Consumer Staples — 0.7% | | | | | | |
| | 16,238 | | | Reckitt Benckiser Group PLC * | | | 1,315,284 | | | |
| Health Care — 0.0% | | | | | | |
| | 16,238 | | | Indivior PLC * | | | 37,814 | | | |
| Industrials — 0.7% | | | | | | |
| | 116,800 | | | Concentric AB | | | 1,384,825 | | | |
| | | | | | | | 2,737,923 | | | |
(See notes which are an integral part of the Financial Statements)
Annual Shareholder Report
30
| | |
| Huntington Situs Fund | | (Continued) |
| | | | | | | | | | |
| Shares | | | | | Fair Value | | | |
| | | | | | | | | | |
| Common Stocks — (Continued) | | | | | | |
| United States — 91.7% | | | | | | |
| Consumer Discretionary — 8.4% | | | | | | |
| | 100,000 | | | Cabela’s, Inc., Class A (a) * | | $ | 5,271,000 | | | |
| | 20,000 | | | Columbia Sportswear Co. | | | 890,800 | | | |
| | 50,000 | | | Papa John’s International, Inc. | | | 2,790,000 | | | |
| | 50,000 | | | Sonic Corp. | | | 1,361,500 | | | |
| | 1,200 | | | Tempur Sealy International, Inc. * | | | 65,892 | | | |
| | 80,000 | | | Tractor Supply Co. | | | 6,305,600 | | | |
| | | | | �� | | | 16,684,792 | | | |
| Consumer Staples — 2.7% | | | | | | |
| | 63,000 | | | Sanderson Farms, Inc. | | | 5,293,575 | | | |
| Energy — 2.2% | | | | | | |
| | 10,000 | | | Atwood Oceanics, Inc. | | | 283,700 | | | |
| | 35,000 | | | CARBO Ceramics, Inc. (a) | | | 1,401,750 | | | |
| | 80,000 | | | Denbury Resources, Inc. | | | 650,400 | | | |
| | 15,000 | | | Dril-Quip, Inc. * | | | 1,150,950 | | | |
| | 10,810 | | | Oceaneering International, Inc. | | | 635,736 | | | |
| | 7,000 | | | SM Energy Co. | | | 270,060 | | | |
| | | | | | | | 4,392,596 | | | |
| Financials — 10.1% | | | | | | |
| | 70,000 | | | Cullen/Frost Bankers, Inc. | | | 4,944,800 | | | |
| | 100,000 | | | Evercore Partners, Inc. | | | 5,237,000 | | | |
| | 120,000 | | | International Bancshares Corp. | | | 3,184,800 | | | |
| | 20,000 | | | Raymond James Financial, Inc. | | | 1,145,800 | | | |
| | 83,383 | | | South State Corp. | | | 5,593,332 | | | |
| | | | | | | | 20,105,732 | | | |
| Health Care — 14.1% | | | | | | |
| | 66,000 | | | Abaxis, Inc. (a) | | | 3,750,780 | | | |
| | 20,000 | | | AmerisourceBergen Corp. | | | 1,803,200 | | | |
| | 70,000 | | | AmSurg Corp. * | | | 3,831,100 | | | |
| | 15,000 | | | Bio-Rad Laboratories, Inc., Class A * | | | 1,808,400 | | | |
| | 39,930 | | | Cepheid, Inc. (a) * | | | 2,161,810 | | | |
| | 47,515 | | | Cerner Corp. * | | | 3,072,320 | | | |
| | 20,000 | | | Edwards LifeSciences Corp. * | | | 2,547,600 | | | |
| | 50,000 | | | Luminex Corp. * | | | 938,000 | | | |
| | 180,000 | | | Myriad Genetics, Inc. (a) * | | | 6,130,800 | | | |
| | 17,500 | | | Neogen Corp. * | | | 867,825 | | | |
| | 75,000 | | | Osiris Therapeutics, Inc. (a) * | | | 1,199,250 | | | |
| | | | | | | | 28,111,085 | | | |
| Industrials — 21.3% | | | | | | |
| | 5,000 | | | Allegiant Travel Co. | | | 751,650 | | | |
| | 40,000 | | | B/E Aerospace, Inc. * | | | 2,320,800 | | | |
| | 50,000 | | | Babcock & Wilcox Co./The | | | 1,515,000 | | | |
| | 35,000 | | | EnPro Industries, Inc. (a) * | | | 2,196,600 | | | |
| | 62,080 | | | Flowserve Corp. | | | 3,714,246 | | | |
| | 53,400 | | | John Bean Technologies Corp. | | | 1,754,724 | | | |
| | 50,000 | | | Lindsay Corp. (a) | | | 4,287,000 | | | |
| | 35,000 | | | Old Dominion Freight Line, Inc. * | | | 2,717,400 | | | |
| | 110,000 | | | Quanta Services, Inc. * | | | 3,122,900 | | | |
| | | | | | | | | | |
| Shares | | | | | Fair Value | | | |
| | | | | | | | | | |
| Common Stocks — (Continued) | | | | | | |
| United States — (Continued) | | | | | | |
| Industrials — (Continued) | | | | | | |
| | 400,000 | | | TASER International, Inc. (a) * | | $ | 10,592,000 | | | |
| | 116,500 | | | Trinity Industries, Inc. | | | 3,263,165 | | | |
| | 92,500 | | | Watts Water Technologies, Inc., Class A | | | 5,868,200 | | | |
| | 12,750 | | | Werner Enterprises, Inc. | | | 397,163 | | | |
| | | | | | | | 42,500,848 | | | |
| Information Technology — 21.3% | | | | | | |
| | 240,000 | | | ACI Worldwide, Inc. * | | | 4,840,800 | | | |
| | 30,000 | | | Anixter International, Inc. * | | | 2,653,800 | | | |
| | 100,000 | | | Cardtronics, Inc. (a) * | | | 3,858,000 | | | |
| | 53,400 | | | CTS Corp. | | | 952,122 | | | |
| | 140,000 | | | Diodes, Inc. * | | | 3,859,800 | | | |
| | 7,000 | | | FleetCor Technologies, Inc. * | | | 1,040,970 | | | |
| | 313,500 | | | Geospace Technologies Corp. (a)* | | | 8,307,750 | | | |
| | 25,000 | | | Jabil Circuit, Inc. | | | 545,750 | | | |
| | 65,000 | | | Red Hat, Inc. (b) * | | | 4,494,100 | | | |
| | 40,000 | | | ScanSource, Inc. * | | | 1,606,400 | | | |
| | 193,000 | | | Trimble Navigation Ltd. * | | | 5,122,220 | | | |
| | 47,000 | | | Tyler Technologies, Inc. * | | | 5,143,680 | | | |
| | | | | | | | 42,425,392 | | | |
| Materials — 8.7% | | | | | | |
| | 38,910 | | | Albemarle Corp. (a) | | | 2,339,658 | | | |
| | 40,000 | | | Eagle Materials, Inc. | | | 3,041,200 | | | |
| | 20,000 | | | Eastman Chemical Co. | | | 1,517,200 | | | |
| | 47,000 | | | Quaker Chemical Corp. | | | 4,325,880 | | | |
| | 40,000 | | | Sensient Technologies Corp. | | | 2,413,600 | | | |
| | 50,000 | | | United States Lime & Minerals, Inc. | | | 3,643,000 | | | |
| | | | | | | | 17,280,538 | | | |
| Real Estate Investment Trusts — 2.0% | | | | | | |
| | 90,000 | | | Equity One, Inc. | | | 2,282,400 | | | |
| | 50,000 | | | Weingarten Realty Investors (a) | | | 1,746,000 | | | |
| | | | | | | | 4,028,400 | | | |
| Telecommunication Services — 0.3% | | | | | | |
| | 39,000 | | | General Communication, Inc.,
Class A * | | | 536,250 | | | |
| Utilities — 0.6% | | | | | | |
| | 15,000 | | | AGL Resources, Inc. | | | 817,650 | | | |
| | 8,250 | | | UGI Corp. | | | 313,335 | | | |
| | | | | | | | 1,130,985 | | | |
| | | | | | | | 182,490,193 | | | |
| Total Common Stocks (Cost $112,472,885) | | | 198,749,707 | | | |
| Exchange-Traded Funds — 0.1% | | | | | | |
| | 7,600 | | | Robo-Stox Global Robotics & Automation Index ETF | | | 195,320 | | | |
| Total Exchange-Traded Funds (Cost $199,570) | | | 195,320 | | | |
(See notes which are an integral part of the Financial Statements)
Annual Shareholder Report
31
| | |
| Huntington Situs Fund | | (Continued) |
| | | | | | | | | | |
| Shares | | | | | Fair Value | | | |
| | | | | | | | | | |
| Short-Term Securities Held as Collateral for
Securities Lending — 21.0% | | | | | | |
| | 41,789,842 | | | Fidelity Institutional Money Market Portfolio, Institutional Class, 0.110% (c) | | $ | 41,789,842 | | | |
| Total Short-Term Securities Held as Collateral
for Securities Lending (Cost $41,789,842) | | | 41,789,842 | | | |
| Total Investments
(Cost $154,757,533) — 121.0% | | | 240,734,869 | | | |
| Liabilities in Excess of Other Assets — (21.0)% | | | (41,753,810) | | | |
| Net Assets — 100.0% | | $ | 198,981,059 | | | |
| (a) | All or a portion of the security was on loan as of December 31, 2014. The total value of securities on loan as of December 31, 2014 was $40,505,658. |
| (b) | All or a portion of the security is held as collateral for written call options. |
| (c) | Rate disclosed is the seven day yield as of December 31, 2014. |
| * | Non-income producing security. |
ADR — American Depositary Receipt
ETF — Exchange-Traded Fund
(See notes which are an integral part of the Financial Statements)
Annual Shareholder Report
32
| | |
| Huntington Balanced Allocation Fund | | December 31, 2014 |
| | |
| Portfolio of Investments Summary Table | | (unaudited) |
| | | | |
| Asset Allocation | | Percentage of
Market Value | |
Equity Mutual Funds(a) | | | 33.3% | |
Exchange-Traded Funds(a) | | | 24.5% | |
Cash(a) | | | 22.5% | |
Fixed Income Mutual Funds | | | 19.7% | |
Total | | | 100.0% | |
| (a) | Investments in affiliated funds. |
Portfolio holdings and allocations are subject to change. As of December 31, 2014, percentages in the table above are based on total investments. Such total investments may differ from the percentages set forth below in the Portfolio of Investments which are computed using the Fund’s net assets.
Portfolio of Investments
| | | | | | | | | | |
| Shares | | | | | Fair Value | | | |
| | | | | | | | | | |
| Mutual Funds — 52.5% | | | | | | |
| | 108,546 | | | Federated Mortgage Fund, Institutional Shares | | $ | 1,055,071 | | | |
| | 145,855 | | | Federated Short-Intermediate Total Return Bond Fund, Institutional Shares | | | 1,521,268 | | | |
| | 136,172 | | | Federated Total Return Government Bond Fund, Institutional Shares | | | 1,516,953 | | | |
| | 199,868 | | | Huntington Dividend Capture Fund, Institutional Shares (a) | | | 2,000,680 | | | |
| | 336,506 | | | Huntington Global Select Markets Fund, Institutional Shares (a) | | | 3,156,426 | | | |
| | 85,659 | | | Huntington Situs Fund, Institutional Shares (a) | | | 1,777,421 | | | |
| Total Mutual Funds (Cost $11,201,413) | | | 11,027,819 | | | |
| Exchange-Traded Funds — 24.3% (a) | | | | | | |
| | 72,928 | | | Huntington EcoLogical Strategy ETF | | | 2,661,872 | | | |
| | 64,079 | | | Huntington US Equity Rotation Strategy ETF | | | 2,434,297 | | | |
| Total Exchange-Traded Funds (Cost $4,000,812) | | | 5,096,169 | | | |
| | | | | | | | | | |
| Shares | | | | | Fair Value | | | |
| | | | | | | | | | |
| Cash Equivalents — 22.2% | | | | | | |
| | 4,673,951 | | | Huntington Money Market Fund, Institutional Shares,
0.040% (a) (b) | | $ | 4,673,951 | | | |
| Total Cash Equivalents (Cost $4,673,951) | | | 4,673,951 | | | |
| Total Investments (Cost $19,876,176) — 99.0% | | | 20,797,939 | | | |
| Other Assets in Excess of Liabilities — 1.0% | | | 210,284 | | | |
| Net Assets — 100.0% | | $ | 21,008,223 | | | |
| (a) | Investment in affiliate. |
| (b) | Rate disclosed is the seven day yield as of December 31, 2014. |
ETF — Exchange-Traded Fund
(See notes which are an integral part of the Financial Statements)
Annual Shareholder Report
33
| | |
| Huntington Conservative Allocation Fund | | December 31, 2014 |
| | | | |
| Portfolio of Investments Summary Table | | (unaudited) |
| | | | |
| Asset Allocation | | Percentage of
Market Value | |
Fixed Income Mutual Funds | | | 38.1% | |
Cash(a) | | | 29.7% | |
Equity Mutual Funds(a) | | | 22.3% | |
Exchange-Traded Funds(a) | | | 9.9% | |
Total | | | 100.0% | |
| (a) | Investments in affiliated funds. |
Portfolio holdings and allocations are subject to change. As of December 31, 2014, percentages in the table above are based on total investments. Such total investments may differ from the percentages set forth below in the Portfolio of Investments which are computed using the Fund’s net assets.
Portfolio of Investments
| | | | | | | | | | |
| Shares | | | | | Fair Value | | | |
| | | | | | | | | | |
| Mutual Funds — 60.4% | | | | | | |
| | 30,747 | | | Federated Mortgage Fund, Institutional Shares | | $ | 298,856 | | | |
| | 41,178 | | | Federated Short-Intermediate Total Return Bond Fund, Institutional Shares | | | 429,483 | | | |
| | 38,809 | | | Federated Total Return Bond Fund, Institutional Shares | | | 428,454 | | | |
| | 19,955 | | | Huntington Dividend Capture Fund, Institutional Shares (a) | | | 199,748 | | | |
| | 34,905 | | | Huntington Global Select Markets Fund, Institutional Shares (a) | | | 327,409 | | | |
| | 7,216 | | | Huntington Situs Fund, Institutional Shares (a) | | | 149,728 | | | |
| Total Mutual Funds (Cost $1,895,608) | | | 1,833,678 | | | |
| Exchange-Traded Funds — 9.9% (a) | | | | | | |
| | 4,350 | | | Huntington EcoLogical Strategy ETF | | | 158,775 | | | |
| | 3,714 | | | Huntington US Equity Rotation Strategy ETF | | | 141,091 | | | |
| Total Exchange-Traded Funds (Cost $236,386) | | | 299,866 | | | |
| | | | | | | | | | |
| Shares | | | | | Fair Value | | | |
| | | | | | | | | | |
| Cash Equivalents — 29.6% | | | | | | |
| | 900,523 | | | Huntington Money Market Fund, Institutional Shares, 0.040% (a) (b) | | $ | 900,523 | | | |
| Total Cash Equivalents (Cost $900,523) | | | 900,523 | | | |
| Total Investments (Cost $3,032,517) — 99.9% | | | 3,034,067 | | | |
| Other Assets in Excess of Liabilities — 0.1% | | | 2,588 | | | |
| Net Assets — 100.0% | | $ | 3,036,655 | | | |
| (a) | Investment in affiliate. |
| (b) | Rate disclosed is the seven day yield as of December 31, 2014. |
ETF — Exchange-Traded Fund
(See notes which are an integral part of the Financial Statements)
Annual Shareholder Report
34
| | |
| Huntington Growth Allocation Fund | | December 31, 2014 |
| | |
| Portfolio of Investments Summary Table | | (unaudited) |
| | | | |
| Asset Allocation | | Percentage of
Market Value | |
Equity Mutual Funds(a) | | | 47.0% | |
Exchange-Traded Funds(a) | | | 31.0% | |
Cash(a) | | | 11.6% | |
Fixed Income Mutual Funds | | | 10.4% | |
Total | | | 100.0% | |
| (a) | Investments in affiliated funds. |
Portfolio holdings and allocations are subject to change. As of December 31, 2014, percentages in the table above are based on total investments. Such total investments may differ from the percentages set forth below in the Portfolio of Investments which are computed using the Fund’s net assets.
Portfolio of Investments
| | | | | | | | | | |
| Shares | | | | | Fair Value | | | |
| | | | | | | | | | |
| Mutual Funds — 57.2% | | | | | | |
| | 42,176 | | | Federated Mortgage Fund, Institutional Shares | | $ | 409,951 | | | |
| | 92,918 | | | Federated Total Return Bond Fund, Institutional Shares | | | 1,025,818 | | | |
| | 192,069 | | | Huntington Dividend Capture Fund, Institutional Shares (a) | | | 1,922,613 | | | |
| | 313,222 | | | Huntington Global Select Markets Fund, Institutional Shares (a) | | | 2,938,023 | | | |
| | 78,936 | | | Huntington Situs Fund, Institutional Shares (a) | | | 1,637,931 | | | |
| Total Mutual Funds (Cost $7,974,766) | | | 7,934,336 | | | |
| Exchange-Traded Funds — 30.9% (a) | | | | | | |
| | 61,532 | | | Huntington EcoLogical Strategy ETF | | | 2,245,918 | | | |
| | 53,845 | | | Huntington US Equity Rotation Strategy ETF | | | 2,045,518 | | | |
| Total Exchange-Traded Funds (Cost $3,260,528) | | | 4,291,436 | | | |
| | | | | | | | | | |
| Shares | | | | | Fair Value | | | |
| | | | | | | | | | |
| Cash Equivalents — 11.6% | | | | | | |
| | 1,610,966 | | | Huntington Money Market Fund, Institutional Shares, 0.040% (a) (b) | | $ | 1,610,966 | | | |
| Total Cash Equivalents (Cost $1,610,966) | | | 1,610,966 | | | |
| Total Investments (Cost $12,846,260) — 99.7% | | | 13,836,738 | | | |
| Other Assets in Excess of Liabilities — 0.3% | | | 35,107 | | | |
| Net Assets — 100.0% | | $ | 13,871,845 | | | |
| (a) | Investment in affiliate. |
| (b) | Rate disclosed is the seven day yield as of December 31, 2014. |
ETF — Exchange-Traded Fund
(See notes which are an integral part of the Financial Statements)
Annual Shareholder Report
35
| | |
| Statements of Assets and Liabilities | | December 31, 2014 |
| | | | | | | | | | | | | | | | |
| | | Huntington
Money Market
Fund | | | Huntington
U.S. Treasury
Money Market
Fund | | | Huntington
Dividend
Capture
Fund | | | Huntington
Global Select
Markets
Fund | |
| Assets: | | | | | | | | | | | | | | | | |
Investments, at cost | | $ | 289,459,915 | | | $ | 1,050,587,228 | | | $ | 193,474,430 | | | $ | 23,485,805 | |
Investments, in unaffiliated securities, at fair value | | $ | 219,459,915 | | | $ | 775,587,228 | | | $ | 199,977,958 | | | $ | 28,835,192 | |
Investments in affiliated securities, at fair value | | | — | | | | — | | | | 9,104,401 | | | | 7,588 | |
Investments in repurchase agreements, at cost | | | 70,000,000 | | | | 275,000,000 | | | | — | | | | — | |
Total investments | | | 289,459,915 | | | | 1,050,587,228 | | | | 209,082,359 | | | | 28,842,780 | |
Cash | | | 6,666,494 | | | | 13,027,736 | | | | — | | | | — | |
Foreign currencies, at value (Cost $-, $-, $-, $4,784, $-, $1, $-, $- and $-) | | | — | | | | — | | | | — | | | | 3,908 | |
Dividends and interest receivable | | | 206,207 | | | | 1,226,805 | | | | 658,214 | | | | 13,766 | |
Receivable from affiliate | | | — | | | | — | | | | — | | | | 257,860 | |
Receivable for investments sold | | | — | | | | — | | | | — | | | | 1,180,544 | |
Receivable for shares sold | | | 901 | | | | — | | | | 100,088 | | | | 1,121 | |
Receivable from Advisor | | | 75,014 | | | | 250,366 | | | | — | | | | — | |
Tax reclaims receivable | | | — | | | | — | | | | 16,104 | | | | 590,824 | |
Prepaid expenses and other assets | | | 26,726 | | | | 64,093 | | | | 18,614 | | | | 21,793 | |
Total assets | | | 296,435,257 | | | | 1,065,156,228 | | | | 209,875,379 | | | | 30,912,596 | |
| Liabilities: | | | | | | | | | | | | | | | | |
Payable for return of collateral on loaned securities | | | — | | | | — | | | | 6,334,281 | | | | — | |
Payable for return of short-term borrowings | | | — | | | | — | | | | — | | | | 3,101,027 | |
Options written, at value (premium received $-, $-, $-, $-, $671,989, $131,176, $-, $- and $-) | | | — | | | | — | | | | — | | | | — | |
Income distribution payable | | | 5,988 | | | | 24,463 | | | | — | | | | — | |
Payable for shares redeemed | | | — | | | | — | | | | 540,701 | | | | 356,790 | |
Accrued expenses and other payables: | | | | | | | | | | | | | | | | |
Investment advisory | | | — | | | | — | | | | 37,186 | | | | 3,822 | |
Administration | | | 48,000 | | | | 162,328 | | | | 33,132 | | | | 2,720 | |
Custodian | | | 18,188 | | | | 50,718 | | | | 11,034 | | | | 13,375 | |
Distribution (12b-1) | | | — | | | | 2,268 | | | | 16,566 | | | | 526 | |
Shareholder services | | | — | | | | — | | | | 45,459 | | | | 3,732 | |
Transfer and dividend disbursing agent | | | 13,478 | | | | 27,686 | | | | 28,176 | | | | 17,832 | |
Professional | | | 38,566 | | | | 79,402 | | | | 33,049 | | | | 44,108 | |
Printing and postage | | | 20,639 | | | | 22,955 | | | | 9,198 | | | | 4,703 | |
Compliance services | | | 3,407 | | | | 11,654 | | | | 2,462 | | | | 1,755 | |
Other | | | 13,436 | | | | 30,953 | | | | 8,228 | | | | 9,950 | |
Total Liabilities | | | 161,702 | | | | 412,427 | | | | 7,099,472 | | | | 3,560,340 | |
Net Assets | | $ | 296,273,555 | | | $ | 1,064,743,801 | | | $ | 202,775,907 | | | $ | 27,352,256 | |
| | | | | | | | | | | | | | | | | |
| Net Assets consist of: | | | | | | | | | | | | | | | | |
Paid in capital | | $ | 296,438,587 | | | $ | 1,064,750,357 | | | $ | 182,675,060 | | | $ | 21,537,569 | |
Net unrealized appreciation (depreciation) of investments, options and translations of assets and liabilities in foreign currency | | | — | | | | — | | | | 15,607,929 | | | | 5,295,931 | |
Accumulated net realized gain (loss) on investments, options and foreign currency transactions | | | (168,329 | ) | | | (15,554 | ) | | | 4,199,006 | | | | 401,880 | |
Accumulated net investment income (loss) | | | 3,297 | | | | 8,998 | | | | 293,912 | | | | 116,876 | |
Net Assets | | $ | 296,273,555 | | | $ | 1,064,743,801 | | | $ | 202,775,907 | | | $ | 27,352,256 | |
| | | | | | | | | | | | | | | | | |
| Net Assets: | | | | | | | | | | | | | | | | |
Institutional Shares | | $ | 153,459,942 | | | $ | 968,005,804 | | | $ | 132,177,277 | | | $ | 20,578,434 | |
Class A Shares | | $ | 142,813,613 | | | $ | 96,737,997 | | | $ | 66,444,540 | | | $ | 6,773,822 | |
Class C Shares | | | | | | | | | | $ | 4,154,090 | | | | | |
| Shares Outstanding: (unlimited number of shares authorized, no par value): | | | | | | | | | | | | | | | | |
Institutional Shares | | | 153,852,195 | | | | 967,985,491 | | | | 13,198,713 | | | | 2,193,525 | |
Class A Shares | | | 143,029,654 | | | | 96,767,301 | | | | 6,639,895 | | | | 724,376 | |
Class C Shares | | | | | | | | | | | 415,925 | | | | | |
| Net Asset Value, Redemption Price and Offering Price Per Share: | | | | | | | | | | | | | | | | |
Institutional Shares | | $ | 1.00 | | | $ | 1.00 | | | $ | 10.01 | | | $ | 9.38 | |
Class A Shares | | $ | 1.00 | | | $ | 1.00 | | | $ | 10.01 | | | $ | 9.35 | |
Class C Shares(a) | | | | | | | | | | $ | 9.99 | | | | | |
| Offering Price Per Share (100%/(100%-maximum sales charge) of net asset value adjusted to the nearest cent) per share: | | | | | | | | | | | | | | | | |
Class A Shares | | $ | — | | | $ | — | | | $ | 10.51 | | | $ | 9.82 | |
| Maximum Sales Charge: | | | | | | | | | | | | | | | | |
Class A Shares | | | — | | | | — | | | | 4.75 | % | | | 4.75 | % |
| | | | | | | | | | | | | | | | | |
| (a) | A contingent deferred sales charge (“CDSC”) of 1.00% may be charged on shares held less than 12 months. |
(See notes which are an integral part of the Financial Statements)
Annual Shareholder Report
36
| | | | | | | | | | | | | | | | | | |
Huntington
Real
Strategies
Fund | | | Huntington
Situs
Fund | | | Huntington
Balanced
Allocation
Fund | | | Huntington
Conservative
Allocation
Fund | | | Huntington
Growth
Allocation
Fund | |
| | | | | | | | | | | | | | | | | | |
| $ | 33,482,021 | | | $ | 154,757,533 | | | $ | 19,876,176 | | | $ | 3,032,517 | | | $ | 12,846,260 | |
| $ | 29,379,898 | | | $ | 240,734,869 | | | $ | 4,093,292 | | | $ | 1,156,793 | | | $ | 1,435,769 | |
| | 3,398,220 | | | | — | | | | 16,704,647 | | | | 1,877,274 | | | | 12,400,969 | |
| | — | | | | — | | | | — | | | | — | | | | — | |
| | 32,778,118 | | | | 240,734,869 | | | | 20,797,939 | | | | 3,034,067 | | | | 13,836,738 | |
| | 3,252 | | | | 1,061,586 | | | | — | | | | 697 | | | | 1,668 | |
|
— |
| | | 7 | | | | — | | | | — | | | | — | |
| | 6,330 | | | | 105,068 | | | | 161,356 | | | | 11,748 | | | | 133,096 | |
| | — | | | | 78 | | | | — | | | | — | | | | — | |
| | — | | | | 556,317 | | | | — | | | | — | | | | — | |
| | 73,986 | | | | 80,391 | | | | 92,604 | | | | — | | | | — | |
| | 6,289 | | | | — | | | | 4,270 | | | | 3,966 | | | | 5,281 | |
| | 12,746 | | | | 21,189 | | | | — | | | | — | | | | — | |
| | 10,347 | | | | 31,837 | | | | 5,543 | | | | 4,154 | | | | 4,621 | |
| | 32,891,068 | | | | 242,591,342 | | | | 21,061,712 | | | | 3,054,632 | | | | 13,981,404 | |
| | | | | | | | | | | | | | | | | | |
| | 1,232,339 | | | | 41,789,842 | | | | — | | | | — | | | | — | |
| | — | | | | 906,701 | | | | — | | | | — | | | | — | |
|
448,339 |
| | | 132,000 | | | | — | | | | — | | | | — | |
| | — | | | | — | | | | — | | | | — | | | | — | |
| | 49,699 | | | | 513,359 | | | | 22,459 | | | | 1,886 | | | | 82,710 | |
| | | | | | | | | | | | | | | | | | |
| | — | | | | 71,451 | | | | — | | | | — | | | | — | |
| | 4,789 | | | | 34,063 | | | | 3,242 | | | | 517 | | | | 2,245 | |
| | 2,134 | | | | 15,611 | | | | 354 | | | | 66 | | | | 241 | |
| | 352 | | | | 10,550 | | | | 4,449 | | | | 710 | | | | 3,080 | |
| | 6,570 | | | | 46,736 | | | | — | | | | — | | | | — | |
| | 5,917 | | | | 33,921 | | | | 7,963 | | | | 2,835 | | | | 7,049 | |
| | 28,078 | | | | 31,427 | | | | 12,413 | | | | 10,990 | | | | 11,653 | |
| | 995 | | | | 12,759 | | | | 1,144 | | | | 18 | | | | 869 | |
| | 818 | | | | 2,671 | | | | 239 | | | | 44 | | | | 195 | |
| | 1,846 | | | | 9,192 | | | | 1,226 | | | | 911 | | | | 1,517 | |
| | 1,781,876 | | | | 43,610,283 | | | | 53,489 | | | | 17,977 | | | | 109,559 | |
| $ | 31,109,192 | | | $ | 198,981,059 | | | $ | 21,008,223 | | | $ | 3,036,655 | | | $ | 13,871,845 | |
| | | | | | | | | | | | | | | | | | | |
| | | | | | | | | | | | | | | | | | |
| $ | 45,477,502 | | | $ | 90,887,523 | | | $ | 18,506,679 | | | $ | 2,999,397 | | | $ | 11,122,690 | |
| | (480,253 | ) | |
|
85,973,756 |
| | | 921,763 | | | | 1,550 | | | | 990,478 | |
| | (14,375,401 | ) | |
|
21,978,578 |
| | | 1,578,318 | | | | 35,709 | | | | 1,758,298 | |
| | 487,344 | | | | 141,202 | | | | 1,463 | | | | (1 | ) | | | 379 | |
| $ | 31,109,192 | | | $ | 198,981,059 | | | $ | 21,008,223 | | | $ | 3,036,655 | | | $ | 13,871,845 | |
| | | | | | | | | | | | | | | | | | | |
| | | | | | | | | | | | | | | | | | |
| $ | 29,452,978 | | | $ | 152,846,330 | | | | | | | | | | | | | |
| $ | 1,656,214 | | | $ | 44,589,412 | | | $ | 21,008,223 | | | $ | 3,036,655 | | | $ | 13,871,845 | |
| | | | | $ | 1,545,317 | | | | | | | | | | | | | |
| | | | | | | | | | | | | | | | | | |
| | 4,378,920 | | | | 7,365,657 | | | | | | | | | | | | | |
| | 246,011 | | | | 2,242,241 | | | | 1,850,013 | | | | 368,921 | | | | 1,204,728 | |
| | | | | | 78,225 | | | | | | | | | | | | | |
| | | | | | | | | | | | | | | | | | |
| $ | 6.73 | | | $ | 20.75 | | | | | | | | | | | | | |
| $ | 6.73 | | | $ | 19.89 | | | $ | 11.36 | | | $ | 8.23 | | | $ | 11.51 | |
| | | | | $ | 19.75 | | | | | | | | | | | | | |
| | | | | | | | | | | | | | | | | | |
| $ | 7.07 | | | $ | 20.88 | | | $ | 11.93 | | | $ | 8.64 | | | $ | 12.08 | |
| | | | | | | | | | | | | | | | | | |
| | 4.75 | % | | | 4.75 | % | | | 4.75 | % | | | 4.75 | % | | | 4.75 | % |
| | | | | | | | | | | | | | | | | | | |
Annual Shareholder Report
37
| | |
| Statements of Operations | | Year Ended December 31, 2014 |
| | | | | | | | | | | | |
| | | Huntington
Money Market
Fund | | | Huntington
U.S. Treasury
Money Market
Fund | | | Huntington
Dividend
Capture
Fund | |
| Investment Income: | | | | | | | | | | | | |
Dividend income from unaffiliated securities | | $ | — | | | $ | — | | | $ | 11,040,543 | |
Dividend income from affiliated securities | | | — | | | | — | | | | 1,744 | |
Interest income | | | 325,675 | | | | 718,952 | | | | — | |
Income from securities lending, net(a) | | | — | | | | — | | | | 58,074 | |
Foreign dividend taxes withheld | | | — | | | | — | | | | (82,828 | ) |
Total investment income | | | 325,675 | | | | 718,952 | | | | 11,017,533 | |
| Expenses: | | | | | | | | | | | | |
Investment advisory | | | 1,062,457 | | | | 2,401,784 | | | | 2,013,238 | |
Administration | | | 645,742 | | | | 2,190,185 | | | | 489,598 | |
Custodian | | | 101,079 | | | | 306,588 | | | | 70,013 | |
Transfer and dividend disbursing agent | | | 67,400 | | | | 125,026 | | | | 162,773 | |
Trustee | | | 33,941 | | | | 118,727 | | | | 26,532 | |
Professional | | | 78,406 | | | | 224,438 | | | | 65,537 | |
Class A Distribution (12b-1)—Class A Shares | | | 361,856 | | | | 266,369 | | | | 172,540 | |
Class C Distribution (12b-1)—Class C Shares | | | — | | | | — | | | | 14,327 | (b) |
Institutional Shareholder services—Institutional Shares | | | 523,520 | | | | 2,735,829 | | | | 493,764 | |
Class A Shareholder services—Class A Shares | | | 361,856 | | | | 266,369 | | | | 172,540 | |
Class C Shareholder services—Class C Shares | | | — | | | | — | | | | 4,776 | (b) |
State registration costs | | | 32,457 | | | | 38,991 | | | | 59,188 | |
Printing and postage | | | 50,269 | | | | 91,269 | | | | 56,492 | |
Insurance premiums | | | 9,413 | | | | 37,159 | | | | 11,962 | |
Compliance services | | | 15,425 | | | | 53,561 | | | | 11,354 | |
Line of credit | | | 7,367 | | | | 24,889 | | | | 6,616 | |
Interest expense | | | 1,216 | | | | 2 | | | | 157 | |
Other | | | 51,036 | | | | 149,995 | | | | 30,971 | |
Total expenses | | | 3,403,440 | | | | 9,031,181 | | | | 3,862,378 | |
Investment advisory fees waived | | | (1,062,457 | ) | | | (2,401,784 | ) | | | (1,313,835 | ) |
Distribution fees voluntarily waived | | | (361,856 | ) | | | (234,424 | ) | | | — | |
Shareholder servicing fees voluntarily waived | | | (885,376 | ) | | | (3,002,198 | ) | | | — | |
Reimbursement from Advisor | | | (814,587 | ) | | | (3,001,662 | ) | | | — | |
Net expenses | | | 279,164 | | | | 391,113 | | | | 2,548,543 | |
Net investment income (loss) | | | 46,511 | | | | 327,839 | | | | 8,468,990 | |
| Net Realized/Unrealized Gain (Loss) on Investments, Options and Foreign Currency Transactions: | | | | | | | | | | | | |
Long-Term capital gain dividends from investment companies | | | — | | | | — | | | | 41,717 | |
Long-term capital gain dividends from affiliated investment companies | | | — | | | | — | | | | — | |
Net realized gain (loss) on investment transactions | | | 6,255 | | | | (10,640 | ) | | | 28,731,763 | |
Net realized loss on investment transactions of affiliates | | | — | | | | — | | | | — | |
Net realized gain on written option transactions | | | — | | | | — | | | | 70,939 | |
Net realized gain (loss) on foreign currency transactions | | | — | | | | — | | | | (13,860 | ) |
Net realized gain (loss) on investments, options and translation of assets and liabilities in foreign currency transactions | | | 6,255 | | | | (10,640 | ) | | | 28,830,559 | |
Net change in unrealized depreciation of investments, options and translation of assets and liabilities in foreign currency | | | — | | | | — | | | | (12,285,350 | ) |
Net realized and unrealized gain (loss) on investments, options and foreign currency transactions | | | 6,255 | | | | (10,640 | ) | | | 16,545,209 | |
Change in net assets resulting from operations | | $ | 52,766 | | | $ | 317,199 | | | $ | 25,014,199 | |
| | | | | | | | | | | | | |
(a) Income from securities lending is net of ($-, $-, $33,098, $6,737, $109,000, $236,002, $-, $- and $-) expenses paid to Huntington National Bank.
(b) For the period January 3, 2014 (commencement of operations) to December 31, 2014.
(See notes which are an integral part of the Financial Statements)
Annual Shareholder Report
38
| | | | | | | | | | | | | | | | | | | | | | |
Huntington
Global Select
Markets
Fund | | | Huntington
Real Strategies
Fund | | | Huntington
Situs
Fund | | | Huntington
Balanced
Allocation
Fund | | | Huntington
Conservative
Allocation
Fund | | | Huntington
Growth
Allocation
Fund | |
| | | | | | | | | | | | | | | | | | | | | | |
| $ | 251,781 | | | $ | 1,407,323 | | | $ | 3,354,976 | | | $ | 65,569 | | | $ | 27,844 | | | $ | 31,655 | |
| | 372 | | | | 491 | | | | 1,114 | | | | 379,899 | | | | 74,773 | | | | 242,239 | |
| | 9,967 | | | | — | | | | — | | | | — | | | | — | | | | — | |
| | 7,859 | | | | 162,107 | | | | 769,281 | | | | — | | | | — | | | | — | |
| | (23,323 | ) | | | (42,414 | ) | | | (28,280 | ) | | | — | | | | — | | | | — | |
| | 246,656 | | | | 1,527,507 | | | | 4,097,091 | | | | 445,468 | | | | 102,617 | | | | 273,894 | |
| | | | | | | | | | | | | | | | | | | | | | |
| | 176,319 | | | | 446,568 | | | | 2,444,015 | | | | 21,104 | | | | 3,507 | | | | 15,091 | |
| | 32,165 | | | | 108,615 | | | | 594,291 | | | | 38,484 | | | | 6,397 | | | | 27,519 | |
| | 22,253 | | | | 15,642 | | | | 96,293 | | | | 2,151 | | | | 344 | | | | 1,543 | |
| | 28,072 | | | | 35,354 | | | | 197,532 | | | | 46,643 | | | | 16,739 | | | | 41,172 | |
| | 1,884 | | | | 5,932 | | | | 31,492 | | | | 2,054 | | | | 343 | | | | 1,465 | |
| | 26,606 | | | | 36,015 | | | | 72,453 | | | | 15,346 | | | | 11,951 | | | | 13,901 | |
| | 2,004 | | | | 5,773 | | | | 163,727 | | | | 52,760 | | | | 8,768 | | | | 37,729 | |
| | — | | | | — | | | | 7,314 | (b) | | | — | | | | — | | | | — | |
| | 42,075 | | | | 143,083 | | | | 648,507 | | | | — | | | | — | | | | — | |
| | 2,004 | | | | 5,773 | | | | 163,727 | | | | — | | | | — | | | | — | |
| | — | | | | — | | | | 2,438 | (b) | | | — | | | | — | | | | — | |
| | 29,647 | | | | 27,780 | | | | 57,860 | | | | 9,055 | | | | 7,951 | | | | 8,351 | |
| | 4,793 | | | | 10,604 | | | | 60,961 | | | | 5,788 | | | | 2,245 | | | | 5,078 | |
| | 3,397 | | | | 4,405 | | | | 13,472 | | | | 3,266 | | | | 2,903 | | | | 3,133 | |
| | 784 | | | | 2,643 | | | | 13,692 | | | | 895 | | | | 140 | | | | 657 | |
| | 549 | | | | 1,574 | | | | 7,848 | | | | 443 | | | | 71 | | | | 309 | |
| | 839 | | | | 430 | | | | 7,055 | | | | 144 | | | | 51 | | | | — | |
| | 19,911 | | | | 56,509 | | | | 38,329 | | | | 3,686 | | | | 2,814 | | | | 3,958 | |
| | 393,302 | | | | 906,700 | | | | 4,621,006 | | | | 201,819 | | | | 64,224 | | | | 159,906 | |
| | (96,711 | ) | | | (282,469 | ) | | | (1,097,463 | ) | | | (21,104 | ) | | | (3,507 | ) | | | (15,091 | ) |
| | — | | | | — | | | | — | | | | — | | | | — | | | | — | |
| | — | | | | — | | | | — | | | | — | | | | — | | | | — | |
| | — | | | | — | | | | — | | | | (26,922 | ) | | | (34,586 | ) | | | (41,335 | ) |
| | 296,591 | | | | 624,231 | | | | 3,523,543 | | | | 153,793 | | | | 26,131 | | | | 103,480 | |
| | (49,935 | ) | | | 903,276 | | | | 573,548 | | | | 291,675 | | | | 76,486 | | | | 170,414 | |
| | | | | | | | | | | | | | | | | | | | | | |
| | — | | | | — | | | | — | | | | 2,685 | | | | 231 | | | | 553 | |
| | — | | | | — | | | | — | | | | 2,422,413 | | | | 250,057 | | | | 2,314,226 | |
| | 4,199,876 | | | | 3,783,060 | | | | 93,275,156 | | | | (85,238 | ) | | | (29,138 | ) | | | (29,525 | ) |
| | — | | | | — | | | | — | | | | (313,697 | ) | | | (109,973 | ) | | | (203,709 | ) |
| | — | | | | 1,869,991 | | | | 1,146,749 | | | | — | | | | — | | | | — | |
| | 237,061 | | | | (3,008 | ) | | | (5,952 | ) | | | — | | | | — | | | | — | |
| 4,436,937 | | | | 5,650,043 | | | | 94,415,953 | | | | 2,026,163 | | | | 111,177 | | | | 2,081,545 | |
| (3,783,033 | ) | | | (9,831,968 | ) | | | (103,449,180 | ) | | | (1,897,780 | ) | | | (190,594 | ) | | | (1,790,894 | ) |
| 653,904 | | | | (4,181,925 | ) | | | (9,033,227 | ) | | | 128,383 | �� | | | (79,417 | ) | | | 290,651 | |
| $ | 603,969 | | | $ | (3,278,649 | ) | | $ | (8,459,679 | ) | | $ | 420,058 | | | $ | (2,931 | ) | | $ | 461,065 | |
| | | | | | | | | | | | | | | | | | | | | | | |
Annual Shareholder Report
39
| | |
| Statements of Changes in Net Assets | | |
| | | | | | | | |
| | | Huntington Money
Market Fund | |
| | | Year Ended
December 31,
2014 | | | Year Ended
December 31,
2013 | |
| Increase (Decrease) in Net Assets: | | | | | | | | |
| Operations— | | | | | | | | |
Net investment income (loss) | | $ | 46,511 | | | $ | 35,029 | |
Long term capital gain dividends from investment companies | | | — | | | | — | |
Net realized gain (loss) on investments, options and foreign currency transactions | | | 6,255 | | | | (5,589 | ) |
Net change in unrealized appreciation/depreciation of investments, options and foreign currency transactions | | | — | | | | — | |
Net increase (decrease) in net assets resulting from operations | | | 52,766 | | | | 29,440 | |
| Distributions to Shareholders— | | | | | | | | |
From and/or in excess of net investment income: | | | | | | | | |
Institutional Shares | | | (26,538 | ) | | | (20,085 | ) |
Class A Shares | | | (19,233 | ) | | | (12,528 | ) |
Class C Shares | | | — | | | | — | |
From net realized gain on investments: | | | | | | | | |
Institutional Shares | | | — | | | | — | |
Class A Shares | | | — | | | | — | |
Class C Shares | | | — | | | | — | |
Change in net assets resulting from distributions to shareholders | | | (45,771 | ) | | | (32,613 | ) |
Change in net assets resulting from capital transactions | | | (49,105,018 | ) | | | (1,237,126 | ) |
Change in net assets | | | (49,098,023 | ) | | | (1,240,299 | ) |
| Net Assets | | | | | | | | |
Beginning of year | | | 345,371,578 | | | | 346,611,877 | |
End of year | | $ | 296,273,555 | | | $ | 345,371,578 | |
| | | | | | | | | |
Accumulated net investment income (loss) included in net assets at end of year | | $ | 3,297 | | | $ | 2,486 | |
| Capital Transactions: | | | | | | | | |
Institutional Shares | | | | | | | | |
Shares sold | | $ | 759,641,704 | | | $ | 412,318,400 | |
Shares issued in connection with merger | | | — | | | | — | |
Contribution from Adviser | | | 6,808 | | | | — | |
Dividends reinvested | | | 144 | | | | 584 | |
Shares redeemed | | | (815,177,051 | ) | | | (444,458,996 | ) |
Total Institutional Shares | | | (55,528,395 | ) | | | (32,140,012 | ) |
Class A Shares | | | | | | | | |
Shares sold | | | 284,064,031 | | | | 174,740,334 | |
Shares issued in connection with merger | | | — | | | | — | |
Contribution from Adviser | | | 5,192 | | | | — | |
Dividends reinvested | | | 15,179 | | | | 9,547 | |
Shares redeemed | | | (277,661,025 | ) | | | (143,846,995 | ) |
Total Class A Shares | | | 6,423,377 | | | | 30,902,886 | |
Class C Shares | | | | | | | | |
Shares sold | | | — | | | | — | |
Dividends reinvested | | | — | | | | — | |
Shares redeemed | | | — | | | | — | |
Total Class C Shares | | | — | | | | — | |
Net change resulting from capital transactions | | $ | (49,105,018 | ) | | $ | (1,237,126 | ) |
| Share Transactions: | | | | | | | | |
Institutional Shares | | | | | | | | |
Shares sold | | | 759,641,704 | | | | 412,318,400 | |
Shares issued in connection with merger | | | — | | | | — | |
Dividends reinvested | | | 144 | | | | 584 | |
Shares redeemed | | | (815,177,051 | ) | | | (444,458,996 | ) |
Total Institutional Shares | | | (55,535,203 | ) | | | (32,140,012 | ) |
Class A Shares | | | | | | | | |
Shares sold | | | 284,064,031 | | | | 174,740,334 | |
Shares issued in connection with merger | | | — | | | | — | |
Dividends reinvested | | | 15,179 | | | | 9,547 | |
Shares redeemed | | | (277,661,025 | ) | | | (143,846,995 | ) |
Total Class A Shares | | | 6,418,185 | | | | 30,902,886 | |
Class C Class C Shares | | | | | | | | |
Shares sold | | | — | | | | — | |
Dividends reinvested | | | — | | | | — | |
Shares redeemed | | | — | | | | — | |
Total Class C Shares | | | — | | | | — | |
Net change resulting from share transactions | | | (49,117,018 | ) | | | (1,237,126 | ) |
| | | | | | | | | |
| (a) | For the period January 3, 2014 (commencement of operations) to December 31, 2014. |
(See notes which are an integral part of the Financial Statements)
Annual Shareholder Report
40
| | | | | | | | | | | | | | | | | | | | | | |
Huntington U.S. Treasury
Money Market Fund | | | Huntington Dividend
Capture Fund | | | Huntington Global Select
Markets Fund | |
Year Ended
December 31,
2014 | | | Year Ended
December 31,
2013 | | | Year Ended
December 31,
2014 | | | Year Ended
December 31,
2013 | | | Year Ended
December 31,
2014 | | | Year Ended
December 31,
2013 | |
| | | | | | | | | | | | | | | | | | | | | | |
| | | | | | | | | | | | | | | | | | | | | | |
| $ | 327,839 | | | $ | 509,465 | | | $ | 8,468,990 | | | $ | 7,986,962 | | | $ | (49,935 | ) | | $ | 127,687 | |
| | — | | | | — | | | | 41,717 | | | | — | | | | — | | | | — | |
| | (10,640 | ) | | | 12,943 | | | | 28,788,842 | | | | 35,535,585 | | | | 4,436,937 | | | | (324,862 | ) |
| | | | | |
| | — | | | | — | | | | (12,285,350 | ) | | | 1,470,626 | | | | (3,783,033 | ) | | | 1,973,884 | |
| | 317,199 | | | | 522,408 | | | | 25,014,199 | | | | 44,993,173 | | | | 603,969 | | | | 1,776,709 | |
| | | | | | | | | | | | | | | | | | | | | | |
| | | | | | | | | | | | | | | | | | | | | | |
| | (328,282 | ) | | | (509,465 | ) | | | (7,115,979 | ) | | | (5,035,169 | ) | | | — | | | | (529,326 | ) |
| | — | | | | — | | | | (2,381,600 | ) | | | (1,627,730 | ) | | | — | | | | (7,478 | ) |
| | — | | | | — | | | | (63,718 | )(a) | | | — | | | | — | | | | — | |
| | | | | | | | | | | | | | | | | | | | | | |
| | (6,824 | ) | | | — | | | | (17,240,460 | ) | | | (5,849,039 | ) | | | (1,125,901 | ) | | | — | |
| | (605 | ) | | | — | | | | (7,984,544 | ) | | | (2,279,917 | ) | | | (46,166 | ) | | | — | |
| | — | | | | — | | | | (502,676 | )(a) | | | — | | | | — | | | | — | |
| | (335,711 | ) | | | (509,465 | ) | | | (35,288,977 | ) | | | (14,791,855 | ) | | | (1,172,067 | ) | | | (536,804 | ) |
| | (43,233,219 | ) | | | 261,787,108 | | | | (137,124,546 | ) | | | 127,685,483 | | | | 476,136 | | | | (12,907,472 | ) |
| | (43,251,731 | ) | | | 261,800,051 | | | | (147,399,324 | ) | | | 157,886,801 | | | | (91,962 | ) | | | (11,667,567 | ) |
| | | | | | | | | | | | | | | | | | | | | | |
| | 1,107,995,532 | | | | 846,195,481 | | | | 350,175,231 | | | | 192,288,430 | | | | 27,444,218 | | | | 39,111,785 | |
| $ | 1,064,743,801 | | | $ | 1,107,995,532 | | | $ | 202,775,907 | | | $ | 350,175,231 | | | $ | 27,352,256 | | | $ | 27,444,218 | |
| | | | | | | | | | | | | | | | | | | | | | | |
| $ | 8,998 | | | $ | (105 | ) | | $ | 293,912 | | | $ | 1,142,625 | | | $ | 116,876 | | | $ | (88,846 | ) |
| | | | | | | | | | | | | | | | | | | | | | |
| | | | | | | | | | | | | | | | | | | | | | |
| $ | 1,689,717,625 | | | $ | 3,317,558,574 | | | $ | 14,686,823 | | | $ | 40,456,341 | | | $ | 1,515,649 | | | $ | 9,210,782 | |
| | — | | | | — | | | | — | | | | 122,033,458 | | | | 24,958,498 | | | | — | |
| | — | | | | — | | | | — | | | | — | | | | — | | | | — | |
| | 6,824 | | | | 8,224 | | | | 8,406,713 | | | | 6,373,492 | | | | 285,210 | | | | 217,928 | |
| | (1,698,869,994 | ) | | | (3,077,720,457 | ) | | | (164,006,532 | ) | | | (59,373,034 | ) | | | (32,711,164 | ) | | | (22,325,770 | ) |
| | (9,145,545 | ) | | | 239,846,341 | | | | (140,912,996 | ) | | | 109,490,257 | | | | (5,951,807 | ) | | | (12,897,060 | ) |
| | | | | | | | | | | | | | | | | | | | | | |
| | 239,504,827 | | | | 516,442,279 | | | | 12,966,113 | | | | 19,935,672 | | | | 1,479,342 | | | | 794,702 | |
| | — | | | | — | | | | — | | | | 7,139,788 | | | | 6,560,828 | | | | — | |
| | — | | | | — | | | | — | | | | — | | | | — | | | | — | |
| | 605 | | | | — | | | | 9,036,272 | | | | 3,369,466 | | | | 45,716 | | | | 7,171 | |
| | (273,593,106 | ) | | | (494,501,512 | ) | | | (22,800,567 | ) | | | (12,249,700 | ) | | | (1,657,943 | ) | | | (812,285 | ) |
| | (34,087,674 | ) | | | 21,940,767 | | | | (798,182 | ) | | | 18,195,226 | | | | 6,427,943 | | | | (10,412 | ) |
| | | | | | | | | | | | | | | | | | | | | | |
| | — | | | | — | | | | 4,253,748 | (a) | | | — | | | | — | | | | — | |
| | — | | | | — | | | | 440,688 | (a) | | | — | | | | — | | | | — | |
| | — | | | | — | | | | (107,804 | )(a) | | | — | | | | — | | | | — | |
| | — | | | | — | | | | 4,586,632 | | | | — | | | | — | | | | — | |
| $ | (43,233,219 | ) | | $ | 261,787,108 | | | $ | (137,124,546 | ) | | $ | 127,685,483 | | | $ | 476,136 | | | $ | (12,907,472 | ) |
| | | | | | | | | | | | | | | | | | | | | | |
| | | | | | | | | | | | | | | | | | | | | | |
| | 1,689,717,625 | | | | 3,317,558,574 | | | | 1,320,335 | | | | 3,904,476 | | | | 168,445 | | | | 870,663 | |
| | — | | | | — | | | | — | | | | 11,740,025 | | | | 2,618,940 | | | | — | |
| | 6,824 | | | | 8,224 | | | | 806,136 | | | | 613,138 | | | | 30,569 | | | | 20,815 | |
| | (1,698,869,994 | ) | | | (3,077,720,457 | ) | | | (14,899,961 | ) | | | (5,660,506 | ) | | | (3,140,586 | ) | | | (2,121,108 | ) |
| | (9,145,545 | ) | | | 239,846,341 | | | | (12,773,490 | ) | | | 10,597,133 | | | | (322,632 | ) | | | (1,229,630 | ) |
| | | | | | | | | | | | | | | | | | | | | | |
| | 239,504,827 | | | | 516,442,279 | | | | 1,167,654 | | | | 1,915,390 | | | | 137,123 | | | | 74,929 | |
| | — | | | | — | | | | — | | | | 687,211 | | | | 690,613 | | | | — | |
| | 605 | | | | — | | | | 878,981 | | | | 324,156 | | | | 4,916 | | | | 686 | |
| | (273,593,106 | ) | | | (494,501,512 | ) | | | (2,046,154 | ) | | | (1,172,718 | ) | | | (148,275 | ) | | | (75,917 | ) |
| | (34,087,674 | ) | | | 21,940,767 | | | | 481 | | | | 1,754,039 | | | | 684,377 | | | | (302 | ) |
| | | | | | | | | | | | | | | | | | | | | | |
| | — | | | | — | | | | 382,321 | (a) | | | — | | | | — | | | | — | |
| | — | | | | — | | | | 43,343 | (a) | | | — | | | | — | | | | — | |
| | — | | | | — | | | | (9,739 | )(a) | | | — | | | | — | | | | — | |
| | — | | | | — | | | | 415,925 | | | | — | | | | — | | | | — | |
| | (43,233,219 | ) | | | 261,787,108 | | | | (12,357,084 | ) | | | 12,351,172 | | | | 361,745 | | | | (1,229,932 | ) |
| | | | | | | | | | | | | | | | | | | | | | | |
Annual Shareholder Report
41
| | |
| Statements of Changes in Net Assets (Continued) | | |
| | | | | | | | | | | | | | | | |
| | | Huntington Real
Strategies Fund | | | Huntington Situs
Fund | |
| | | Year Ended
December 31,
2014 | | | Year Ended
December 31,
2013 | | | Year Ended
December 31,
2014 | | | Year Ended
December 31,
2013 | |
| Increase (Decrease) in Net Assets: | | | | | | | | | | | | | | | | |
| Operations— | | | | | | | | | | | | | | | | |
Net investment income (loss) | | $ | 903,276 | | | $ | 1,821,476 | | | $ | 573,548 | | | $ | (253,579 | ) |
Long term capital gain dividends from investment companies | | | — | | | | — | | | | — | | | | — | |
Net realized gain (loss) on investments, options and foreign currency transactions | | | 5,650,043 | | | | (2,801,755 | ) | | | 94,415,953 | | | | 30,069,243 | |
Net change in unrealized appreciation/depreciation of investments, options and foreign currency transactions | | | (9,831,968 | ) | | | 9,395,865 | | | | (103,449,180 | ) | | | 42,722,995 | |
Net increase (decrease) in net assets resulting from operations | | | (3,278,649 | ) | | | 8,415,586 | | | | (8,459,679 | ) | | | 72,538,659 | |
| Distributions to Shareholders— | | | | | | | | | | | | | | | | |
From and/or in excess of net investment income: | | | | | | | | | | | | | | | | |
Institutional Shares | | | (477,697 | ) | | | (801,086 | ) | | | (110,029 | ) | | | (63,694 | ) |
Class A Shares | | | (21,852 | ) | | | (15,687 | ) | | | — | | | | — | |
Class C Shares | | | — | | | | — | | | | — | | | | — | |
From net realized gain on investments: | | | | | | | | | | | | | | | | |
Institutional Shares | | | — | | | | — | | | | (49,484,679 | ) | | | (10,208,103 | ) |
Class A Shares | | | — | | | | — | | | | (12,530,796 | ) | | | (2,767,773 | ) |
Class C Shares | | | — | | | | — | | | | (430,286 | )(a) | | | — | |
Change in net assets resulting from distributions to shareholders | | | (499,549 | ) | | | (816,773 | ) | | | (62,555,790 | ) | | | (13,039,570 | ) |
Change in net assets resulting from capital transactions | | | (57,049,407 | ) | | | (14,126,862 | ) | | | (144,119,064 | ) | | | 133,374,681 | |
Change in net assets | | | (60,827,605 | ) | | | (6,528,049 | ) | | | (215,134,533 | ) | | | 192,873,770 | |
| Net Assets | | | | | | | | | | | | | | | | |
Beginning of year | | | 91,936,797 | | | | 98,464,846 | | | | 414,115,592 | | | | 221,241,822 | |
End of year | | $ | 31,109,192 | | | $ | 91,936,797 | | | $ | 198,981,059 | | | $ | 414,115,592 | |
| | | | | | | | | | | | | | | | | |
Accumulated net investment income (loss) included in net assets at end of year | | $ | 487,344 | | | $ | 558,170 | | | $ | 141,202 | | | $ | 154,571 | |
| Capital Transactions: | | | | | | | | | | | | | | | | |
Institutional Shares | | | | | | | | | | | | | | | | |
Shares sold | | $ | 9,556,192 | | | $ | 15,451,545 | | | $ | 25,316,955 | | | $ | 63,734,270 | |
Shares issued in connection with merger | | | — | | | | — | | | | — | | | | 110,849,711 | |
Dividends reinvested | | | 51,918 | | | | 278,838 | | | | 22,195,877 | | | | 5,392,478 | |
Shares redeemed | | | (66,329,891 | ) | | | (29,861,048 | ) | | | (178,626,049 | ) | | | (82,175,365 | ) |
Total Institutional Shares | | | (56,721,781 | ) | | | (14,130,665 | ) | | | (131,113,217 | ) | | | 97,801,094 | |
Class A Shares | | | | | | | | | | | | | | | | |
Shares sold | | | 600,959 | | | | 678,375 | | | | 14,940,892 | | | | 42,800,605 | |
Shares issued in connection with merger | | | — | | | | — | | | | — | | | | 10,770,013 | |
Dividends reinvested | | | 21,091 | | | | 13,943 | | | | 11,853,239 | | | | 2,178,445 | |
Shares redeemed | | | (949,676 | ) | | | (688,515 | ) | | | (41,789,298 | ) | | | (20,175,476 | ) |
Total Class A Shares | | | (327,626 | ) | | | 3,803 | | | | (14,995,167 | ) | | | 35,573,587 | |
Class C Shares | | | | | | | | | | | | | | | | |
Shares sold | | | — | | | | — | | | | 1,674,862 | (a) | | | — | |
Dividends reinvested | | | — | | | | — | | | | 408,639 | (a) | | | — | |
Shares redeemed | | | — | | | | — | | | | (94,181 | )(a) | | | — | |
Total Class C Shares | | | — | | | | — | | | | 1,989,320 | | | | — | |
Net change resulting from capital transactions | | $ | (57,049,407 | ) | | $ | (14,126,862 | ) | | $ | (144,119,064 | ) | | $ | 133,374,681 | |
| Share Transactions: | | | | | | | | | | | | | | | | |
Institutional Shares | | | | | | | | | | | | | | | | |
Shares sold | | | 1,331,576 | | | | 2,045,251 | | | | 892,581 | | | | 2,445,645 | |
Shares issued in connection with merger | | | — | | | | — | | | | — | | | | 4,035,610 | |
Dividends reinvested | | | 8,176 | | | | 35,887 | | | | 1,081,670 | | | | 196,806 | |
Shares redeemed | | | (8,093,407 | ) | | | (3,921,276 | ) | | | (6,432,257 | ) | | | (3,076,833 | ) |
Total Institutional Shares | | | (6,753,655 | ) | | | (1,840,138 | ) | | | (4,458,006 | ) | | | 3,601,228 | |
Class A Shares | | | | | | | | | | | | | | | | |
Shares sold | | | 70,129 | | | | 90,158 | | | | 537,752 | | | | 1,708,512 | |
Shares issued in connection with merger | | | — | | | | — | | | | — | | | | 403,763 | |
Dividends reinvested | | | 3,316 | | | | 1,792 | | | | 602,605 | | | | 81,866 | |
Shares redeemed | | | (121,313 | ) | | | (90,582 | ) | | | (1,553,228 | ) | | | (786,187 | ) |
Total Class A Shares | | | (47,868 | ) | | | 1,368 | | | | (412,871 | ) | | | 1,407,954 | |
Class C Class C Shares | | | | | | | | | | | | | | | | |
Shares sold | | | — | | | | — | | | | 60,966 | (a) | | | — | |
Dividends reinvested | | | — | | | | — | | | | 20,913 | (a) | | | — | |
Shares redeemed | | | — | | | | — | | | | (3,654 | )(a) | | | — | |
Total Class C Shares | | | — | | | | — | | | | 78,225 | | | | — | |
Net change resulting from share transactions | | | (6,801,523 | ) | | | (1,838,770 | ) | | | (4,792,652 | ) | | | 5,009,182 | |
| | | | | | | | | | | | | | | | | |
| {a} | For the period January 3, 2014 (commencement of operations) to December 31, 2014. |
(See notes which are an integral part of the Financial Statements)
Annual Shareholder Report
42
| | | | | | | | | | | | | | | | | | | | | | |
Huntington Balanced
Allocation Fund | | | Huntington Conservative
Allocation Fund | | | Huntington Growth
Allocation Fund | |
Year Ended
December 31,
2014 | | | Year Ended
December 31,
2013 | | | Year Ended
December 31,
2014 | | | Year Ended
December 31,
2013 | | | Year Ended
December 31,
2014 | | | Year Ended
December 31,
2013 | |
| | | | | | | | | | | | | | | | | | | | | | |
| | | | | | | | | | | | | | | | | | | | | | |
| $ | 291,675 | | | $ | 147,860 | | | $ | 76,486 | | | $ | 45,282 | | | $ | 170,414 | | | $ | 91,466 | |
| | — | | | | — | | | | — | | | | — | | | | — | | | | — | |
| 2,026,163 | | | | 956,335 | | | | 111,177 | | | | 198,151 | | | | 2,081,545 | | | | 1,082,855 | |
| (1,897,780 | ) | | | 1,379,630 | | | | (190,594 | ) | | | (121,437 | ) | | | (1,790,894 | ) | | | 1,315,911 | |
| 420,058 | | | | 2,483,825 | | | | (2,931 | ) | | | 121,996 | | | | 461,065 | | | | 2,490,232 | |
| | | | | | | | | | | | | | | | | | | | | | |
| | | | | | | | | | | | | | | | | | | | | | |
| | (426,585 | ) | | | (422,243 | ) | | | (80,778 | ) | | | (69,332 | ) | | | (316,107 | ) | | | (351,136 | ) |
| | — | | | | — | | | | — | | | | — | | | | — | | | | — | |
| | — | | | | — | | | | — | | | | — | | | | — | | | | — | |
| | | | | | | | | | | | | | | | | | | | | | |
| | (725,138 | ) | | | (703,395 | ) | | | (136,926 | ) | | | (160,338 | ) | | | (538,415 | ) | | | (854,665 | ) |
| | — | | | | — | | | | — | | | | — | | | | — | | | | — | |
| | — | | | | — | | | | — | | | | — | | | | — | | | | — | |
| (1,151,723 | ) | | | (1,125,638 | ) | | | (217,704 | ) | | | (229,670 | ) | | | (854,522 | ) | | | (1,205,801 | ) |
| | 674,722 | | | | 1,515,104 | | | | (421,054 | ) | | | (981,162 | ) | | | (843,749 | ) | | | 634,162 | |
| | (56,943 | ) | | | 2,873,291 | | | | (641,689 | ) | | | (1,088,836 | ) | | | (1,237,206 | ) | | | 1,918,593 | |
| | | | | | | | | | | | | | | | | | | | | | |
| | 21,065,166 | | | | 18,191,875 | | | | 3,678,344 | | | | 4,767,180 | | | | 15,109,051 | | | | 13,190,458 | |
| $ | 21,008,223 | | | $ | 21,065,166 | | | $ | 3,036,655 | | | $ | 3,678,344 | | | $ | 13,871,845 | | | $ | 15,109,051 | |
| | | | | | | | | | | | | | | | | | | | | | | |
$ | 1,463 | | | $ | 2,451 | | | $ | (1 | ) | | $ | 1,357 | | | $ | 379 | | | $ | 4,042 | |
| | | | | | | | | | | | | | | | | | | | | | |
| | | | | | | | | | | | | | | | | | | | | | |
| $ | — | | | $ | — | | | $ | — | | | $ | — | | | $ | — | | | $ | — | |
| | — | | | | — | | | | — | | | | — | | | | — | | | | — | |
| | — | | | | — | | | | — | | | | — | | | | — | | | | — | |
| | — | | | | — | | | | — | | | | — | | | | — | | | | — | |
| | — | | | | — | | | | — | | | | — | | | | — | | | | — | |
| | | | | | | | | | | | | | | | | | | | | | |
| | 4,231,795 | | | | 5,791,160 | | | | 874,624 | | | | 3,928,019 | | | | 2,280,294 | | | | 4,369,361 | |
| | — | | | | — | | | | — | | | | — | | | | — | | | | — | |
| | 1,100,024 | | | | 1,076,050 | | | | 191,499 | | | | 213,381 | | | | 832,459 | | | | 1,168,868 | |
| | (4,657,097 | ) | | | (5,352,106 | ) | | | (1,487,177 | ) | | | (5,122,562 | ) | | | (3,956,502 | ) | | | (4,904,067 | ) |
| | 674,722 | | | | 1,515,104 | | | | (421,054 | ) | | | (981,162 | ) | | | (843,749 | ) | | | 634,162 | |
| | | | | | | | | | | | | | | | | | | | | | |
| | — | | | | — | | | | — | | | | — | | | | — | | | | — | |
| | — | | | | — | | | | — | | | | — | | | | — | | | | — | |
| | — | | | | — | | | | — | | | | — | | | | — | | | | — | |
| | — | | | | — | | | | — | | | | — | | | | — | | | | — | |
| $ | 674,722 | | | $ | 1,515,104 | | | $ | (421,054 | ) | | $ | (981,162 | ) | | $ | (843,749 | ) | | $ | 634,162 | |
| | | | | | | | | | | | | | | | | | | | | | |
| | | | | | | | | | | | | | | | | | | | | | |
| | — | | | | — | | | | — | | | | — | | | | — | | | | — | |
| | — | | | | — | | | | — | | | | — | | | | — | | | | — | |
| | — | | | | — | | | | — | | | | — | | | | — | | | | — | |
| | — | | | | — | | | | — | | | | — | | | | — | | | | — | |
| | — | | | | — | | | | — | | | | — | | | | — | | | | — | |
| | | | | | | | | | | | | | | | | | | | | | |
| | 356,685 | | | | 499,181 | | | | 98,801 | | | | 427,116 | | | | 189,482 | | | | 367,995 | |
| | — | | | | — | | | | — | | | | — | | | | — | | | | — | |
| | 95,856 | | | | 92,476 | | | | 22,671 | | | | 23,929 | | | | 71,702 | | | | 98,722 | |
| | (391,846 | ) | | | (457,940 | ) | | | (168,966 | ) | | | (557,457 | ) | | | (328,204 | ) | | | (408,620 | ) |
| | 60,695 | | | | 133,717 | | | | (47,494 | ) | | | (106,412 | ) | | | (67,020 | ) | | | 58,097 | |
| | | | | | | | | | | | | | | | | | | | | | |
| | — | | | | — | | | | — | | | | — | | | | — | | | | — | |
| | — | | | | — | | | | — | | | | — | | | | — | | | | — | |
| | — | | | | — | | | | — | | | | — | | | | — | | | | — | |
| | — | | | | — | | | | — | | | | — | | | | — | | | | — | |
| | 60,695 | | | | 133,717 | | | | (47,494 | ) | | | (106,412 | ) | | | (67,020 | ) | | | 58,097 | |
| | | | | | | | | | | | | | | | | | | | | | | |
Annual Shareholder Report
43
| | |
| Financial Highlights | | |
| (For a share outstanding throughout each year ended December 31) | | |
| | | | | | | | | | | | | | | | | | | | | | | | | | | | |
| | | Net Asset
Value,
beginning
of year | | | Net
investment
income (loss) | | | Net realized
and unrealized
gain (loss) on
investments | | | Total from
investment
operations | | | Distributions
from net
investment
income | | | Distributions
from net
realized gain
on investment
transactions | | | Total
distributions | |
| HUNTINGTON MONEY MARKET FUND | | | | | | | | | | | | | | | | | |
| Institutional Shares | | | | | | | | | | | | | | | | | | | | | | | | | | | | |
2010 | | $ | 1.00 | | | | — | (b) | | | — | (b) | | | — | (b) | | | — | (b) | | | — | | | | — | (b) |
2011 | | $ | 1.00 | | | | — | (b) | | | — | (b) | | | — | (b) | | | — | (b) | | | — | | | | — | (b) |
2012 | | $ | 1.00 | | | | — | (b) | | | — | (b) | | | — | (b) | | | — | (b) | | | — | | | | — | (b) |
2013 | | $ | 1.00 | | | | — | (b) | | | — | (b) | | | — | (b) | | | — | (b) | | | — | | | | — | (b) |
2014 | | $ | 1.00 | | | | — | (b) | | | — | (b) | | | — | (b) | | | — | (b) | | | — | | | | — | (b) |
| Class A Shares | | | | | | | | | | | | | | | | | | | | | | | | | | | | |
2010 | | $ | 1.00 | | | | — | (b) | | | — | (b) | | | — | (b) | | | — | (b) | | | — | | | | — | (b) |
2011 | | $ | 1.00 | | | | — | (b) | | | — | (b) | | | — | (b) | | | — | (b) | | | — | | | | — | (b) |
2012 | | $ | 1.00 | | | | — | (b) | | | — | (b) | | | — | (b) | | | — | (b) | | | — | | | | — | (b) |
2013 | | $ | 1.00 | | | | — | (b) | | | — | (b) | | | — | (b) | | | — | (b) | | | — | | | | — | (b) |
2014 | | $ | 1.00 | | | | — | (b) | | | — | (b) | | | — | (b) | | | — | (b) | | | — | | | | — | (b) |
| HUNTINGTON U.S. TREASURY MONEY MARKET FUND | | | | | | | | | | | | | | | | | |
| Institutional Shares | | | | | | | | | | | | | | | | | | | | | | | | | | | | |
2010 | | $ | 1.00 | | | | — | (b) | | | — | (b) | | | — | (b) | | | — | (b) | | | — | | | | — | (b) |
2011 | | $ | 1.00 | | | | — | (b) | | | — | (b) | | | — | (b) | | | — | (b) | | | — | (b) | | | — | (b) |
2012 | | $ | 1.00 | | | | — | (b) | | | — | (b) | | | — | (b) | | | — | (b) | | | — | | | | — | (b) |
2013 | | $ | 1.00 | | | | — | (b) | | | — | (b) | | | — | (b) | | | — | (b) | | | — | | | | — | (b) |
2014 | | $ | 1.00 | | | | — | (b) | | | — | (b) | | | — | (b) | | | — | (b) | | | — | | | | — | (b) |
| Class A Shares | | | | | | | | | | | | | | | | | | | | | | | | | | | | |
2010 | | $ | 1.00 | | | | — | (b) | | | — | (b) | | | — | (b) | | | — | (b) | | | — | | | | — | (b) |
2011 | | $ | 1.00 | | | | — | (b) | | | — | (b) | | | — | (b) | | | — | (b) | | | — | (b) | | | — | (b) |
2012 | | $ | 1.00 | | | | — | (b) | | | — | (b) | | | — | (b) | | | — | | | | — | | | | — | |
2013 | | $ | 1.00 | | | | — | | | | — | (b) | | | — | (b) | | | — | | | | — | | | | — | |
2014 | | $ | 1.00 | | | | — | | | | — | (b) | | | — | (b) | | | — | | | | — | | | | — | |
| (a) | If applicable, certain fees were waived and/or reimbursed. If such waivers/reimbursements had not occurred, the ratios would have been as indicated. |
| (b) | Amount is less than $0.005. |
| (c) | Rounds to less than 0.005% |
(See notes which are an integral part of the Financial Statements)
Annual Shareholder Report
44
| | | | | | | | | | | | | | | | | | | | | | |
Net Asset
Value, end
of year | | | Total
return | | | Ratio of Net
Expenses to
Average Net
Assets | | | Ratio of Net
Investment
Income (Loss)
to Average
Net Assets | | | Ratio of Expenses
(Prior to
Reimbursements)
to Average
Net Assets(a) | | | Net Assets,
end of
year
(000 omitted) | |
| | | | | | | | | | | | | | | | | | | | | | |
| | | | | | | | | | | | | | | | | | | | | | |
| $ | 1.00 | | | | 0.01 | % | | | 0.31 | % | | | 0.01 | % | | | 0.88 | % | | $ | 214,981 | |
| $ | 1.00 | | | | 0.01 | % | | | 0.24 | % | | | 0.01 | % | | | 0.84 | % | | $ | 262,067 | |
| $ | 1.00 | | | | 0.01 | % | | | 0.23 | % | | | 0.01 | % | | | 0.86 | % | | $ | 240,924 | |
| $ | 1.00 | | | | 0.01 | % | | | 0.12 | % | | | 0.01 | % | | | 0.84 | % | | $ | 208,783 | |
| $ | 1.00 | | | | 0.01 | % | | | 0.08 | % | | | 0.01 | % | | | 0.86 | % | | $ | 153,460 | |
| | | | | | | | | | | | | | | | | | | | | | |
| $ | 1.00 | | | | 0.01 | % | | | 0.32 | % | | | 0.01 | % | | | 1.13 | % | | $ | 134,974 | |
| $ | 1.00 | | | | 0.01 | % | | | 0.24 | % | | | 0.01 | % | | | 1.09 | % | | $ | 97,936 | |
| $ | 1.00 | | | | 0.01 | % | | | 0.23 | % | | | 0.01 | % | | | 1.11 | % | | $ | 105,688 | |
| $ | 1.00 | | | | 0.01 | % | | | 0.12 | % | | | 0.01 | % | | | 1.09 | % | | $ | 136,589 | |
| $ | 1.00 | | | | 0.01 | % | | | 0.08 | % | | | 0.01 | % | | | 1.11 | % | | $ | 142,814 | |
| | | | | | | | | | | | | | | | | | | | | | |
| | | | | | | | | | | | | | | | | | | | | | |
| $ | 1.00 | | | | 0.01 | % | | | 0.15 | % | | | 0.01 | % | | | 0.76 | % | | $ | 312,870 | |
| $ | 1.00 | | | | 0.01 | % | | | 0.07 | % | | | 0.01 | % | | | 0.74 | % | | $ | 251,704 | |
| $ | 1.00 | | | | 0.01 | % | | | 0.09 | % | | | 0.01 | % | | | 0.74 | % | | $ | 737,310 | |
| $ | 1.00 | | | | 0.04 | % | | | 0.04 | % | | | 0.04 | % | | | 0.69 | % | | $ | 977,168 | |
| $ | 1.00 | | | | 0.03 | % | | | 0.03 | % | | | 0.03 | % | | | 0.73 | % | | $ | 968,006 | |
| | | | | | | | | | | | | | | | | | | | | | |
| $ | 1.00 | | | | 0.01 | % | | | 0.15 | % | | | 0.01 | % | | | 1.01 | % | | $ | 74,845 | |
| $ | 1.00 | | | | 0.01 | % | | | 0.07 | % | | | 0.01 | % | | | 0.99 | % | | $ | 83,204 | |
| $ | 1.00 | | | | — | % | | | 0.09 | % | | | — | %(c) | | | 0.99 | % | | $ | 108,885 | |
| $ | 1.00 | | | | — | % | | | 0.08 | % | | | — | % | | | 0.94 | % | | $ | 130,827 | |
| $ | 1.00 | | | | — | % | | | 0.06 | % | | | — | % | | | 0.98 | % | | $ | 96,738 | |
Annual Shareholder Report
45
| | |
| Financial Highlights (Continued) | | |
| (For a share outstanding throughout each period ended December 31) | | |
| | | | | | | | | | | | | | | | | | | | | | | | | | | | | | | | |
| | | Net Asset
Value,
beginning
of period | | | Net
investment
income (loss) | | | Net realized
and unrealized
gain (loss) on
investments | | | Total from
investment
operations | | | Distributions
from net
investment
income | | | Distributions
from net
realized gain
on investment
transactions | | | Distributions
from return
of capital | | | Total
distributions | |
| HUNTINGTON DIVIDEND CAPTURE FUND | | | | | | | | | | | | | | | | | | | | | |
| Institutional Shares | | | | | | | | | | | | | | | | | | | | | |
2010 | | $ | 7.86 | | | | 0.25 | | | | 0.83 | | | | 1.08 | | | | (0.25 | ) | | | — | | | | — | | | | (0.25 | ) |
2011 | | $ | 8.69 | | | | 0.30 | | | | 0.22 | | | | 0.52 | | | | (0.30 | ) | | | — | | | | — | | | | (0.30 | ) |
2012 | | $ | 8.91 | | | | 0.33 | | | | 0.63 | | | | 0.96 | | | | (0.38 | ) | | | — | | | | — | | | | (0.38 | ) |
2013 | | $ | 9.49 | | | | 0.36 | | | | 1.60 | | | | 1.96 | | | | (0.32 | ) | | | (0.39 | ) | | | — | | | | (0.71 | ) |
2014 | | $ | 10.74 | | | | 0.39 | | | | 0.64 | | | | 1.03 | | | | (0.41 | ) | | | (1.35 | ) | | | — | | | | (1.76 | ) |
| Class A Shares | | | | | | | | | | | | | | | | | | | | | |
2010 | | $ | 7.86 | | | | 0.23 | | | | 0.83 | | | | 1.06 | | | | (0.23 | ) | | | — | | | | — | | | | (0.23 | ) |
2011 | | $ | 8.69 | | | | 0.28 | | | | 0.21 | | | | 0.49 | | | | (0.28 | ) | | | — | | | | — | | | | (0.28 | ) |
2012 | | $ | 8.90 | | | | 0.30 | | | | 0.65 | | | | 0.95 | | | | (0.36 | ) | | | — | | | | — | | | | (0.36 | ) |
2013 | | $ | 9.49 | | | | 0.34 | | | | 1.59 | | | | 1.93 | | | | (0.30 | ) | | | (0.39 | ) | | | — | | | | (0.69 | ) |
2014 | | $ | 10.73 | | | | 0.34 | | | | 0.67 | | | | 1.01 | | | | (0.38 | ) | | | (1.35 | ) | | | — | | | | (1.73 | ) |
| Class C Shares | | | | | | | | | | | | | | | | | | | | | |
2014(d) | | $ | 10.67 | | | | 0.32 | | | | 0.70 | | | | 1.02 | | | | (0.35 | ) | | | (1.35 | ) | | | — | | | | (1.70 | ) |
| HUNTINGTON GLOBAL SELECT MARKETS FUND | | | | | | | | | | | | | | | | | | | | | |
| Institutional Shares | | | | | | | | | | | | | | | | | | | | | |
2010 | | $ | 10.00 | | | | 0.03 | | | | 1.55 | | | | 1.58 | | | | (0.11 | ) | | | — | | | | (0.01 | ) | | | (0.12 | ) |
2011 | | $ | 11.46 | | | | 0.08 | | | | (1.99 | ) | | | (1.91 | ) | | | (0.05 | ) | | | (0.14 | ) | | | — | | | | (0.19 | ) |
2012 | | $ | 9.36 | | | | 0.04 | | | | 0.97 | | | | 1.01 | | | | (0.04 | ) | | | — | | | | — | | | | (0.04 | ) |
2013 | | $ | 10.33 | | | | 0.04 | | | | 0.58 | | | | 0.62 | | | | (0.21 | ) | | | — | | | | — | | | | (0.21 | ) |
2014 | | $ | 10.74 | | | | (0.03 | )(h) | | | 0.16 | | | | 0.13 | | | | — | | | | (1.49 | ) | | | — | | | | (1.49 | ) |
| Class A Shares | | | | | | | | | | | | | | | | | | | | | |
2010 | | $ | 10.00 | | | | 0.01 | | | | 1.53 | | | | 1.54 | | | | (0.09 | ) | | | — | | | | (0.02 | ) | | | (0.11 | ) |
2011 | | $ | 11.43 | | | | 0.04 | | | | (1.97 | ) | | | (1.93 | ) | | | — | (g) | | | (0.14 | ) | | | — | | | | (0.14 | ) |
2012 | | $ | 9.36 | | | | 0.01 | | | | 0.97 | | | | 0.98 | | | | (0.02 | ) | | | — | | | | — | | | | (0.02 | ) |
2013 | | $ | 10.32 | | | | 0.01 | | | | 0.59 | | | | 0.60 | | | | (0.19 | ) | | | — | | | | — | | | | (0.19 | ) |
2014 | | $ | 10.73 | | | | (0.02 | )(h) | | | 0.13 | | | | 0.11 | | | | — | | | | (1.49 | ) | | | — | | | | (1.49 | ) |
| (a) | Based on net asset value, which does not reflect a sales charge or contingent deferred sales charge, if applicable. |
| (b) | If applicable, certain fees were waived and/or reimbursed. If such waivers/reimbursements had not occurred, the ratios would have been as indicated. |
| (c) | Portfolio Turnover is calculated on the basis of the Fund as a whole without distinguishing among the classes of shares. |
| (d) | Reflects operations for the period from January 3, 2014 (commencement of operations) to December 31, 2014. |
| (f) | Computed on an annualized basis. |
| (g) | Amount is less than $0.005. |
| (h) | Calculated using average shares outstanding for the year. |
(See notes which are an integral part of the Financial Statements)
Annual Shareholder Report
46
| | | | | | | | | | | | | | | | | | | | | | | | | | |
Net Asset
Value, end
of period | | | Total
return(a) | | | Ratio of Net
Expenses to
Average Net
Assets | | | Ratio of Net
Investment
Income (Loss)
to Average
Net Assets
| | | Ratio of Expenses
(Prior to
Reimbursements)
to Average
Net Assets(b) | | | Net Assets,
end of
period
(000 omitted) | | | Portfolio
turnover
rate(c) | |
| | | | | | | | | | | | | | | | | | | | | | | | | | |
| | | | | | | | | | | | | | | | | | | | | | | | | | |
| $ | 8.69 | | | | 13.99 | % | | | 1.40 | % | | | 3.05 | % | | | 1.40 | % | | $ | 100,622 | | | | 115 | % |
| $ | 8.91 | | | | 6.03 | % | | | 1.36 | % | | | 3.40 | % | | | 1.36 | % | | $ | 117,798 | | | | 143 | % |
| $ | 9.49 | | | | 10.87 | % | | | 1.21 | % | | | 3.55 | % | | | 1.36 | % | | $ | 145,946 | | | | 109 | % |
| $ | 10.74 | | | | 21.14 | % | | | 0.89 | % | | | 3.59 | % | | | 1.33 | % | | $ | 278,917 | | | | 130 | % |
| $ | 10.01 | | | | 9.59 | % | | | 0.88 | % | | | 3.22 | % | | | 1.38 | % | | $ | 132,177 | | | | 92 | % |
| | | | | | | | | | | | | | | | | | | | | | | | | | |
| $ | 8.69 | | | | 13.72 | % | | | 1.64 | % | | | 2.82 | % | | | 1.64 | % | | $ | 17,784 | | | | 115 | % |
| $ | 8.90 | | | | 5.65 | % | | | 1.61 | % | | | 3.19 | % | | | 1.61 | % | | $ | 26,843 | | | | 143 | % |
| $ | 9.49 | | | | 10.72 | % | | | 1.46 | % | | | 3.37 | % | | | 1.61 | % | | $ | 46,343 | | | | 109 | % |
| $ | 10.73 | | | | 20.74 | % | | | 1.14 | % | | | 3.32 | % | | | 1.58 | % | | $ | 71,258 | | | | 130 | % |
| $ | 10.01 | | | | 9.45 | % | | | 1.13 | % | | | 3.01 | % | | | 1.63 | % | | $ | 66,445 | | | | 92 | % |
| | | | | | | | | | | | | | | | | | | | | | | | | | |
| $ | 9.99 | | | | 9.54 | %(e) | | | 1.63 | %(f) | | | 2.69 | %(f) | | | 2.16 | %(f) | | $ | 4,154 | | | | 92 | %(e) |
| | | | | | | | | | | | | | | | | | | | | | | | | | |
| | | | | | | | | | | | | | | | | | | | | | | | | | |
| $ | 11.46 | | | | 15.85 | % | | | 1.90 | % | | | 0.40 | % | | | 2.19 | % | | $ | 41,116 | | | | 45 | % |
| $ | 9.36 | | | | (16.67 | )% | | | 1.79 | % | | | 0.71 | % | | | 1.79 | % | | $ | 38,871 | | | | 110 | % |
| $ | 10.33 | | | | 10.82 | % | | | 1.90 | % | | | 0.40 | % | | | 1.90 | % | | $ | 38,696 | | | | 97 | % |
| $ | 10.74 | | | | 6.08 | % | | | 1.87 | % | | | 0.40 | % | | | 2.01 | % | | $ | 27,015 | | | | 156 | % |
| $ | 9.38 | | | | 1.31 | % | | | 1.63 | % | | | (0.29 | )% | | | 2.22 | % | | $ | 20,578 | | | | 88 | % |
| | | | | | | | | | | | | | | | | | | | | | | | | | |
| $ | 11.43 | | | | 15.38 | % | | | 2.16 | % | | | 0.20 | % | | | 2.44 | % | | $ | 860 | | | | 45 | % |
| $ | 9.36 | | | | (16.80 | )% | | | 2.04 | % | | | 0.48 | % | | | 2.04 | % | | $ | 541 | | | | 110 | % |
| $ | 10.32 | | | | 10.43 | % | | | 2.15 | % | | | 0.09 | % | | | 2.15 | % | | $ | 416 | | | | 97 | % |
| $ | 10.73 | | | | 5.87 | % | | | 2.12 | % | | | 0.06 | % | | | 2.26 | % | | $ | 429 | | | | 156 | % |
| $ | 9.35 | | | | 1.13 | % | | | 1.88 | % | | | (0.15 | )% | | | 2.47 | % | | $ | 6,774 | | | | 88 | % |
Annual Shareholder Report
47
| | |
| Financial Highlights (Continued) | | |
| (For a share outstanding throughout each period ended December 31) | | |
| | | | | | | | | | | | | | | | | | | | | | | | | | | | |
| | | Net Asset
Value,
beginning
of period | | | Net
investment
income (loss) | | | Net realized
and unrealized
gain (loss) on
investments | | | Total from
investment
operations | | | Distributions
from net
investment
income | | | Distributions
from net
realized gain
on investment
transactions | | | Total
distributions | |
| HUNTINGTON REAL STRATEGIES FUND | |
| Institutional Shares | | | | | | | | | | | | | | | | | | | | | | | | | | | | |
2010 | | $ | 6.42 | | | | 0.02 | | | | 1.59 | | | | 1.61 | | | | (0.04 | ) | | | — | | | | (0.04 | ) |
2011 | | $ | 7.99 | | | | 0.05 | | | | (0.82 | ) | | | (0.77 | ) | | | (0.07 | ) | | | — | | | | (0.07 | ) |
2012 | | $ | 7.15 | | | | 0.11 | | | | 0.26 | | | | 0.37 | | | | (0.10 | ) | | | — | | | | (0.10 | ) |
2013 | | $ | 7.42 | | | | 0.15 | | | | 0.55 | | | | 0.70 | | | | (0.07 | ) | | | — | | | | (0.07 | ) |
2014 | | $ | 8.05 | | | | 0.13 | (g) | | | (1.35 | ) | | | (1.22 | ) | | | (0.10 | ) | | | — | | | | (0.10 | ) |
| Class A Shares | | | | | | | | | | | | | | | | | | | | | | | | | | | | |
2010 | | $ | 6.43 | | | | 0.01 | | | | 1.59 | | | | 1.60 | | | | (0.03 | ) | | | — | | | | (0.03 | ) |
2011 | | $ | 8.00 | | | | 0.03 | | | | (0.82 | ) | | | (0.79 | ) | | | (0.05 | ) | | | — | | | | (0.05 | ) |
2012 | | $ | 7.16 | | | | 0.09 | | | | 0.26 | | | | 0.35 | | | | (0.08 | ) | | | — | | | | (0.08 | ) |
2013 | | $ | 7.43 | | | | 0.13 | | | | 0.54 | | | | 0.67 | | | | (0.05 | ) | | | — | | | | (0.05 | ) |
2014 | | $ | 8.05 | | | | 0.10 | (g) | | | (1.33 | ) | | | (1.23 | ) | | | (0.09 | ) | | | — | | | | (0.09 | ) |
| HUNTINGTON SITUS FUND | | | | | | | | | | | | | | | | | | | | | |
| Institutional Shares | | | | | | | | | | | | | | | | | | | | | | | | | | | | |
2010 | | $ | 15.95 | | | | (0.03 | ) | | | 4.29 | | | | 4.26 | | | | — | | | | — | | | | — | |
2011 | | $ | 20.21 | | | | (0.05 | ) | | | (0.63 | ) | | | (0.68 | ) | | | — | | | | — | | | | — | |
2012 | | $ | 19.53 | | | | 0.09 | | | | 4.60 | | | | 4.69 | | | | (0.04 | ) | | | (0.74 | ) | | | (0.78 | ) |
2013 | | $ | 23.44 | | | | (0.01 | ) | | | 6.60 | | | | 6.59 | | | | (0.01 | ) | | | (1.27 | ) | | | (1.28 | ) |
2014 | | $ | 28.75 | | | | 0.09 | | | | (0.58 | ) | | | (0.49 | ) | | | (0.02 | ) | | | (7.49 | ) | | | (7.51 | ) |
| Class A Shares | | | | | | | | | | | | | | | | | | | | | | | | | | | | |
2010 | | $ | 15.64 | | | | (0.06 | ) | | | 4.20 | | | | 4.14 | | | | — | | | | — | | | | — | |
2011 | | $ | 19.78 | | | | (0.10 | ) | | | (0.62 | ) | | | (0.72 | ) | | | — | | | | — | | | | — | |
2012 | | $ | 19.06 | | | | 0.04 | | | | 4.48 | | | | 4.52 | | | | — | | | | (0.74 | ) | | | (0.74 | ) |
2013 | | $ | 22.84 | | | | (0.07 | ) | | | 6.42 | | | | 6.35 | | | | — | | | | (1.27 | ) | | | (1.27 | ) |
2014 | | $ | 27.92 | | | | 0.01 | | | | (0.55 | ) | | | (0.54 | ) | | | — | | | | (7.49 | ) | | | (7.49 | ) |
| Class C Shares | | | | | | | | | | | | | | | | | | | | | | | | | | | | |
2014(d) | | $ | 27.60 | | | | (0.07 | ) | | | (0.29 | ) | | | (0.36 | ) | | | — | | | | (7.49 | ) | | | (7.49 | ) |
| (a) | Based on net asset value, which does not reflect a sales charge or contingent deferred sales charge, if applicable. |
| (b) | If applicable, certain fees were waived and/or reimbursed. If such waivers/reimbursements had not occurred, the ratios would have been as indicated. |
| (c) | Portfolio Turnover is calculated on the basis of the Fund as a whole without distinguishing among the classes of shares. |
| (d) | Reflects operations for the period from January 3, 2014 (commencement of operations) to December 31, 2014. |
| (f) | Computed on an annualized basis. |
| (g) | Calculated using average shares outstanding for the year. |
(See notes which are an integral part of the Financial Statements)
Annual Shareholder Report
48
| | | | | | | | | | | | | | | | | | | | | | | | | | |
Net Asset
Value, end
of period | | | Total
return(a) | | | Ratio of Net
Expenses to
Average Net
Assets | | | Ratio of Net
Investment
Income (Loss)
to Average
Net Assets | | | Ratio of Expenses
(Prior to
Reimbursements)
to Average
Net Assets(b) | | | Net Assets,
end of
period
(000 omitted) | | | Portfolio
turnover
rate(c) | |
| | | | | | | | | | | | | | | | | | | | | | | | | | |
| | | | | | | | | | | | | | | | | | | | | | | | | | |
| $ | 7.99 | | | | 25.09 | % | | | 1.35 | % | | | 0.27 | % | | | 1.35 | % | | $ | 90,813 | | | | 22 | % |
| $ | 7.15 | | | | (9.64 | )% | | | 1.35 | % | | | 0.66 | % | | | 1.35 | % | | $ | 92,475 | | | | 60 | % |
| $ | 7.42 | | | | 5.20 | % | | | 1.35 | % | | | 1.54 | % | | | 1.35 | % | | $ | 96,292 | | | | 30 | % |
| $ | 8.05 | | | | 9.49 | % | | | 1.34 | % | | | 1.93 | % | | | 1.36 | % | | $ | 89,571 | | | | 43 | % |
| $ | 6.73 | | | | (15.03 | )% | | | 1.04 | % | | | 1.53 | % | | | 1.52 | % | | $ | 29,453 | | | | 31 | % |
| | | | | | | | | | | | | | | | | | | | | | | | | | |
| $ | 8.00 | | | | 24.85 | % | | | 1.60 | % | | | 0.03 | % | | | 1.60 | % | | $ | 2,052 | | | | 22 | % |
| $ | 7.16 | | | | (9.88 | )% | | | 1.60 | % | | | 0.39 | % | | | 1.60 | % | | $ | 2,004 | | | | 60 | % |
| $ | 7.43 | | | | 4.96 | % | | | 1.60 | % | | | 1.30 | % | | | 1.60 | % | | $ | 2,173 | | | | 30 | % |
| $ | 8.05 | | | | 9.09 | % | | | 1.59 | % | | | 1.68 | % | | | 1.61 | % | | $ | 2,366 | | | | 43 | % |
| $ | 6.73 | | | | (15.23 | )% | | | 1.29 | % | | | 1.21 | % | | | 1.77 | % | | $ | 1,656 | | | | 31 | % |
| | | | | | | | | | | | | | | | | | | | | | | | | | |
| | | | | | | | | | | | | | | | | | | | | | | | | | |
| $ | 20.21 | | | | 26.71 | % | | | 1.36 | % | | | (0.16 | )% | | | 1.36 | % | | $ | 183,311 | | | | 32 | % |
| $ | 19.53 | | | | (3.36 | )% | | | 1.32 | % | | | (0.25 | )% | | | 1.32 | % | | $ | 166,134 | | | | 18 | % |
| $ | 23.44 | | | | 24.11 | % | | | 1.35 | % | | | 0.41 | % | | | 1.35 | % | | $ | 192,757 | | | | 11 | % |
| $ | 28.75 | | | | 28.38 | % | | | 1.30 | % | | | 0.05 | % | | | 1.33 | % | | $ | 339,983 | | | | 22 | % |
| $ | 20.75 | | | | (1.41 | )% | | | 1.03 | % | | | 0.23 | % | | | 1.37 | % | | $ | 152,846 | | | | 12 | % |
| | | | | | | | | | | | | | | | | | | | | | | | | | |
| $ | 19.78 | | | | 26.47 | % | | | 1.61 | % | | | (0.38 | )% | | | 1.61 | % | | $ | 23,990 | | | | 32 | % |
| $ | 19.06 | | | | (3.64 | )% | | | 1.57 | % | | | (0.50 | )% | | | 1.57 | % | | $ | 22,409 | | | | 18 | % |
| $ | 22.84 | | | | 23.82 | % | | | 1.60 | % | | | 0.17 | % | | | 1.60 | % | | $ | 28,485 | | | | 11 | % |
| $ | 27.92 | | | | 28.09 | % | | | 1.55 | % | | | (0.27 | )% | | | 1.58 | % | | $ | 74,132 | | | | 22 | % |
| $ | 19.89 | | | | (1.62 | )% | | | 1.28 | % | | | 0.01 | % | | | 1.62 | % | | $ | 44,589 | | | | 12 | % |
| | | | | | | | | | | | | | | | | | | | | | | | | | |
| $ | 19.75 | | | | (1.00 | )%(e) | | | 1.79 | %(f) | | | (0.54 | )%(f) | | | 2.15 | %(f) | | $ | 1,545 | | | | 12 | %(e) |
Annual Shareholder Report
49
| | |
| Financial Highlights (Continued) | | |
| (For a share outstanding throughout each year ended December 31) | | |
| | | | | | | | | | | | | | | | | | | | | | | | | | | | |
| | | Net Asset
Value,
beginning
of year | | | Net
investment
income (loss) | | | Net realized
and unrealized
gain (loss) on
investments | | | Total from
investment
operations | | | Distributions
from net
investment
income | | | Distributions
from net
realized gain
on investment
transactions | | | Total
distributions | |
| HUNTINGTON BALANCED ALLOCATION FUND | | | | | | | | | | | | | | | | | | | | | |
| Class A Shares | | | | | | | | | | | | | | | | | | | | | | | | | | | | |
2010 | | $ | 10.74 | | | | 0.09 | | | | 0.88 | | | | 0.97 | | | | (0.09 | ) | | | (0.05 | ) | | | (0.14 | ) |
2011 | | $ | 11.57 | | | | 0.10 | | | | (0.13 | ) | | | (0.03 | ) | | | (0.10 | ) | | | (0.11 | ) | | | (0.21 | ) |
2012 | | $ | 11.33 | | | | 0.12 | | | | 0.75 | | | | 0.87 | | | | (0.12 | ) | | | (1.09 | ) | | | (1.21 | ) |
2013 | | $ | 10.99 | | | | 0.09 | | | | 1.34 | | | | 1.43 | | | | (0.24 | ) | | | (0.41 | ) | | | (0.65 | ) |
2014 | | $ | 11.77 | | | | 0.17 | | | | 0.07 | | | | 0.24 | | | | (0.24 | ) | | | (0.41 | ) | | | (0.65 | ) |
| HUNTINGTON CONSERVATIVE ALLOCATION FUND | | | | | | | | | | | | | | | | | |
| Class A Shares | | | | | | | | | | | | | | | | | | | | | | | | | | | | |
2010 | | $ | 10.32 | | | | 0.17 | | | | 0.41 | | | | 0.58 | | | | (0.16 | ) | | | (0.05 | ) | | | (0.21 | ) |
2011 | | $ | 10.69 | | | | 0.15 | | | | 0.11 | | | | 0.26 | | | | (0.15 | ) | | | (0.08 | ) | | | (0.23 | ) |
2012 | | $ | 10.72 | | | | 0.14 | | | | 0.33 | | | | 0.47 | | | | (0.14 | ) | | | (1.93 | ) | | | (2.07 | ) |
2013 | | $ | 9.12 | | | | 0.07 | | | | 0.17 | | | | 0.24 | | | | (0.13 | ) | | | (0.40 | ) | | | (0.53 | ) |
2014 | | $ | 8.83 | | | | 0.20 | | | | (0.20 | ) | | | — | | | | (0.21 | ) | | | (0.39 | ) | | | (0.60 | ) |
| HUNTINGTON GROWTH ALLOCATION FUND | | | | | | | | | | | | | | | | | |
| Class A Shares | | | | | | | | | | | | | | | | | | | | | | | | | | | | |
2010 | | $ | 10.87 | | | | 0.06 | | | | 1.09 | | | | 1.15 | | | | (0.06 | ) | | | (0.08 | ) | | | (0.14 | ) |
2011 | | $ | 11.88 | | | | 0.07 | | | | (0.28 | ) | | | (0.21 | ) | | | (0.07 | ) | | | (0.15 | ) | | | (0.22 | ) |
2012 | | $ | 11.45 | | | | 0.11 | | | | 1.03 | | | | 1.14 | | | | (0.11 | ) | | | (1.61 | ) | | | (1.72 | ) |
2013 | | $ | 10.87 | | | | 0.09 | | | | 1.95 | | | | 2.04 | | | | (0.30 | ) | | | (0.73 | ) | | | (1.03 | ) |
2014 | | $ | 11.88 | | | | 0.16 | | | | 0.22 | | | | 0.38 | | | | (0.28 | ) | | | (0.47 | ) | | | (0.75 | ) |
| (a) | Based on net asset value, which does not reflect a sales charge or contingent deferred sales charge, if applicable. |
| (b) | Does not include the effect of expenses of underlying funds. |
| (c) | If applicable, certain fees were waived and/or reimbursed. If such waivers/reimbursements had not occurred, the ratios would have been as indicated. |
(See notes which are an integral part of the Financial Statements)
Annual Shareholder Report
50
| | | | | | | | | | | | | | | | | | | | | | | | | | |
Net Asset
Value, end
of year | | | Total
return(a) | | | Ratio of Net
Expenses to
Average Net
Assets(b) | | | Ratio of Net
Investment
Income (Loss)
to Average
Net Assets | | | Ratio of Expenses
(Prior to
Reimbursements)
to Average
Net Assets(b)(c) | | | Net Assets,
end of
year
(000 omitted) | | | Portfolio
turnover
rate | |
| | | | | | | | | | | | | | | | | | | | | | | | | | |
| | | | | | | | | | | | | | | | | | | | | | | | | | |
| $ | 11.57 | | | | 9.14 | % | | | 0.59 | % | | | 0.94 | % | | | 0.74 | % | | $ | 24,656 | | | | 26 | % |
| $ | 11.33 | | | | (0.18 | )% | | | 0.67 | % | | | 0.90 | % | | | 0.80 | % | | $ | 27,642 | | | | 23 | % |
| $ | 10.99 | | | | 7.79 | % | | | 0.68 | % | | | 0.98 | % | | | 0.89 | % | | $ | 18,192 | | | | 74 | % |
| $ | 11.77 | | | | 13.14 | % | | | 0.74 | % | | | 0.72 | % | | | 0.93 | % | | $ | 21,065 | | | | 44 | % |
| $ | 11.36 | | | | 2.05 | % | | | 0.73 | % | | | 1.38 | % | | | 0.96 | % | | $ | 21,008 | | | | 52 | % |
| | | | | | | | | | | | | | | | | | | | | | | | | | |
| | | | | | | | | | | | | | | | | | | | | | | | | | |
| $ | 10.69 | | | | 5.70 | % | | | 0.70 | % | | | 1.60 | % | | | 0.79 | % | | $ | 14,840 | | | | 22 | % |
| $ | 10.72 | | | | 2.50 | % | | | 0.73 | % | | | 1.43 | % | | | 0.83 | % | | $ | 15,544 | | | | 15 | % |
| $ | 9.12 | | | | 4.43 | % | | | 0.80 | % | | | 1.11 | % | | | 1.00 | % | | $ | 4,767 | | | | 37 | % |
| $ | 8.83 | | | | 2.69 | % | | | 0.83 | % | | | 0.90 | % | | | 1.38 | % | | $ | 3,678 | | | | 55 | % |
| $ | 8.23 | | | | (0.12 | )% | | | 0.75 | % | | | 2.18 | % | | | 1.83 | % | | $ | 3,037 | | | | 89 | % |
| | | | | | | | | | | | | | | | | | | | | | | | | | |
| | | | | | | | | | | | | | | | | | | | | | | | | | |
| $ | 11.88 | | | | 10.69 | % | | | 0.51 | % | | | 0.61 | % | | | 0.77 | % | | $ | 19,132 | | | | 29 | % |
| $ | 11.45 | | | | (1.75 | )% | | | 0.64 | % | | | 0.63 | % | | | 0.84 | % | | $ | 21,618 | | | | 23 | % |
| $ | 10.87 | | | | 10.01 | % | | | 0.63 | % | | | 0.85 | % | | | 0.95 | % | | $ | 13,190 | | | | 54 | % |
| $ | 11.88 | | | | 18.75 | % | | | 0.70 | % | | | 0.62 | % | | | 1.02 | % | | $ | 15,109 | | | | 55 | % |
| $ | 11.51 | | | | 3.13 | % | | | 0.69 | % | | | 1.13 | % | | | 1.06 | % | | $ | 13,872 | | | | 44 | % |
Annual Shareholder Report
51
Notes to Financial Statements
December 31, 2014
The Huntington Funds (the “Trust”) was organized as a single Delaware statutory trust on June 23, 2006. The Trust is registered under the Investment Company Act of 1940, as amended (the “1940 Act”), as an open-end management investment company. As of December 31, 2014, the Trust operated 12 separate series, or mutual funds, each with its own investment objective and strategy. This report contains financial statements and financial highlights of the retail funds listed below (individually referred to as a “Fund,” or collectively as the “Funds”):
| | |
| Funds | | Investment Share
Classes Offered* |
Huntington Money Market Fund
(“Money Market Fund”) | | Institutional, A & Interfund** |
Huntington U.S. Treasury
Money Market Fund
(“U.S. Treasury Money Market Fund”) | | Institutional & A |
Huntington Dividend Capture Fund (“Dividend Capture Fund”) | | Institutional, A & C |
Huntington Global Select Markets Fund
(“Global Select Markets Fund”) | | Institutional & A |
Huntington Real Strategies Fund
(“Real Strategies Fund”) | | Institutional & A |
Huntington Situs Fund
(“Situs Fund”) | | Institutional, A & C |
Huntington Balanced Allocation Fund
(“Balanced Allocation Fund”) | | A |
Huntington Conservative Allocation Fund
(“Conservative Allocation Fund”) | | A |
Huntington Growth Allocation Fund
(“Growth Allocation Fund”) | | A |
| * | Each class of shares for each Fund has identical rights and privileges except with respect to distribution (12b-1) and service fees, voting rights on matters affecting a single class of shares, exchange privileges of each class of shares and sales charges. The price at which the Funds will offer or redeem shares is the net asset value (“NAV”) per share next determined after the order is considered received, subject to any applicable front end or contingent deferred sales charges. Class A shares have a maximum sales charge on purchases of 4.75% as a percentage of the original purchase price. Class C shares have a contingent deferred sales charge of 1.00% on shares sold within one year of purchase. The Money Market Fund and the U.S. Treasury Money Market Fund (collectively the “Money Market Funds”) do not have sales charges on purchases. |
| ** | As of December 31, 2014, the Interfund shares are available for purchase; however the balance remains zero. |
The prospectus provides a description of each Fund’s investment objectives, policies and strategies along with information on the classes of shares currently being offered.
Under the Trust’s organizational documents, its officers and Trustees are indemnified against certain liabilities arising out of the performance of their duties to the Funds. In addition, in the normal course of business, the Trust
may enter into contracts with vendors and others that provide for general indemnifications. The Trust’s maximum exposure under these arrangements is unknown, as this would involve future claims that may be made against the Trust. However, based on experience, the Trust expects that risk of loss to be remote.
On December 19, 2014, the Global Select Markets Fund acquired all of the assets and assumed all of the liabilities of the Huntington International Equity Fund (“International Equity Fund”) pursuant to an agreement and plan of reorganization approved by the Board of Trustees (“Trustees”) on September 22, 2014. The reorganization provides shareholders of the International Equity Fund access to a larger and more diversified portfolio with a similar investment strategy and lower expenses. The reorganization qualified as a tax-free reorganization for federal income tax purposes with no gain or loss recognized to the funds or their shareholders.
The acquisition was accomplished by a tax-free exchange of 2,618,940 Institutional Class shares of the Global Select Markets Fund (valued at $24,958,498) for 3,641,716 Institutional Class shares of the International Equity Fund and 690,613 Class A shares of the Global Select Markets Fund (valued at $6,560,828) for 980,223 Class A shares of the International Equity Fund, each outstanding on December 19, 2014. The investment portfolio of the International Equity Fund, with a fair value of $27,128,665 and identified cost of $21,876,394 was the principal asset acquired by the Global Select Markets Fund. For financial reporting purposes, assets received and shares issued by the Global Select Markets Fund were recorded at fair value; however, the identified cost of the investments received from the International Equity Fund was carried forward to align ongoing reporting of the Global Select Markets Fund’s realized and unrealized gains and losses with amounts distributable to shareholders for tax purposes. The aggregate net assets of the Global Select Markets Fund immediately before the acquisition were $7,795,589. The aggregate net assets of the International Equity Fund at that date of $31,519,326, including $5,199,907 of unrealized appreciation, were combined with those of the Global Select Markets Fund, resulting in combined aggregate net assets of $39,314,915.
Assuming the acquisition had been completed on January 1, 2014, the beginning of the annual reporting period of the Global Select Markets Fund, the Global Select Markets Fund’s pro forma results of operations for the year ended December 31, 2014, are as follows:
| | | | |
Net Investment Income | | $ | 2,611,201 | |
Net Realized and Unrealized Loss on Investments | | ($ | 13,305,478 | ) |
Net Decrease in Net Assets Resulting From Operations | | ($ | 10,694,277 | ) |
Annual Shareholder Report
52
| (2) | Significant Accounting Policies |
The Funds are each an investment company and each follow accounting and reporting guidance under Financial Accounting Standards Board (“FASB”) Accounting Standards Codification (“ASC”) Topic 946, “Financial Services-Investment Companies”. The following is a summary of significant accounting policies consistently followed by the Funds in the preparation of their financial statements. The policies are in conformity with accounting principles generally accepted in the United States of America (“GAAP”).
The preparation of financial statements in conformity with GAAP requires management to make estimates and assumptions that affect the amounts of assets, liabilities, and disclosure of contingent assets and liabilities at the date of the financial statements and the reported amounts of income and expenses for the period. Actual results could differ from those estimates.
The Trust calculates the NAV for each of the Funds (other than the Money Market Funds) by valuing securities held based on fair value. Fair value is defined as the price that would be received to sell an asset or paid to transfer a liability in an orderly transaction between market participants at the measurement date.
For the Money Market Funds, the Trust attempts to stabilize the NAV per share at $1.00 per share by valuing portfolio securities using the amortized cost method, which approximates market value. Under the amortized cost method, premium or discount, if any, is amortized or accreted, respectively, on a constant (straight-line) basis to the maturity of the security.
The valuation techniques described below maximize the use of observable inputs and minimize the use of unobservable inputs in determining fair value. The inputs used for valuing the Funds’ investments are summarized in the three broad levels listed below:
| • | | Level 1—quoted prices in active markets for identical assets. |
| • | | Level 2—other significant observable inputs (including quoted prices for similar securities, interest rates, prepayment speeds, credit risk, etc.). |
| • | | Level 3—significant unobservable inputs (including the Funds’ own assumptions in determining the fair value of investments). |
Changes in valuation techniques may result in transfers in or out of an assigned level within the disclosure hierarchy. The Trust recognizes transfers between fair value hierarchy levels at the reporting period end. The inputs or methodology used for valuing investments is not necessarily an indication of the risk associated with investing in those investments.
In computing the NAV of the Funds, other than the Money Market Funds, fair value is based on market valuations with respect to portfolio securities for which market quotations are readily available. Pursuant to Trustee-approved policies, the Trust relies on certain security pricing services to provide the current market value of securities. Those security pricing services value equity securities (including foreign equity securities, exchange-traded funds and closed-end funds) traded on a securities exchange at the last reported sales price on the principal exchange. Equity securities quoted by NASDAQ are valued at the NASDAQ official closing price. If there is no reported sale on the principal exchange, and in the case of over-the-counter securities, equity securities are valued at a bid price estimated by the security pricing service. In each of these situations, valuations are typically categorized as Level 1 in the fair value hierarchy. Investments in open-end investment companies are valued at their respective net asset value as reported by such companies and are typically categorized as Level 1 in the fair value hierarchy.
Option contracts are generally valued using the closing price based on quote data from the six major U.S. options exchanges on which such options are traded which are typically categorized as Level 1 in the fair value hierarchy.
Debt securities traded on a national securities exchange or in the over-the-counter market are valued at the last reported sales price on the principal exchange. If there is no reported sale on the principal exchange, and for all other debt securities, debt securities are valued at a bid price estimated by the security pricing service. Foreign securities quoted in foreign currencies are translated in U.S. dollars at the foreign exchange rate in effect as of the close of the New York Stock Exchange (NYSE) (generally 4:00 p.m. Eastern Time), on the day the value of the foreign security is determined. Short-term investments with remaining maturities of 60 days or less at the time of purchase may be valued at amortized cost. In each of these situations, valuations are typically categorized as Level 2 in the fair value hierarchy.
Securities for which market quotations are not readily available are valued at fair value under Trust procedures approved by the Trustees. In these cases, a Pricing Committee established and appointed by the Trustees determines in good faith, subject to Trust procedures, the fair value of portfolio securities held by a Fund (“good faith fair valuation”). When a good faith fair valuation of a security is required, consideration is generally given to a number of factors including, but not limited to the following: dealer quotes, published analyses by dealers or analysts regarding the security, transactions which provide implicit valuation of the security (such as a merger or tender offer transaction), the value of other securities or contracts which derive their value from the security at issue, and the implications of any other circumstances which have caused trading in the security to halt. With
Annual Shareholder Report
53
Notes to Financial Statements (Continued)
respect to certain categories of securities, the procedures utilized by the Pricing Committee detail specific valuation methodologies to be applied in lieu of considering the aforementioned list of factors. Depending on the source and relative significance of valuation inputs, these instruments may be classified as Level 2 or Level 3 in the fair value hierarchy.
Fair valuation procedures are also used when a significant event affecting the value of a portfolio security is determined to have occurred between the time when the price of the portfolio security is determined and the close of trading on the NYSE, which is when each Fund’s NAV is computed. An event is considered significant if there is both an affirmative expectation that the security’s value will change in response to the event and a reasonable basis for quantifying the resulting change in value. Significant events include significant securities market movements occurring between the time the price of the portfolio security is determined and the close of trading on the NYSE. For domestic fixed income securities, such events may occur where the cut-off time for the market information used by the independent pricing service is earlier than the end of regular trading on the NYSE. For securities normally priced at their last sale price in a foreign market, such events can occur between the close of trading in the foreign market and the close of trading on the NYSE.
In some cases, events affecting the issuer of a portfolio security may be considered significant events. Examples of potentially significant events include announcements concerning earnings, acquisitions, new products, management changes, litigation developments, a strike or natural disaster affecting the company’s operations or regulatory changes or market developments affecting the issuer’s industry occurring between the time when the price of the portfolio security is determined and the close of trading on the NYSE. For securities of foreign issuers, such events could also include political or other
developments affecting the economy or markets in which the issuer conducts its operations or its securities are traded.
There can be no assurance that a Fund could purchase or sell a portfolio security at the price used to calculate the Fund’s NAV. In the case of good faith fair valued portfolio securities, lack of information and uncertainty as to the significance of information may lead to a conclusion that a prior valuation is the best indication of a portfolio security’s present value. Good faith fair valuations generally remain unchanged until new information becomes available. Consequently, changes in good faith fair valuation of portfolio securities may be less frequent and of greater magnitude than changes in the price of portfolio securities valued at their last sale price, by an independent pricing service, or based on market quotations.
The Trustees have authorized the use of an independent fair valuation service. If the movement in a designated U.S. market index, after foreign markets close, is greater than predetermined levels, the Funds may use a systematic valuation model provided from that independent third party to fair value its international equity securities. Securities which are fair value according to this model are then typically categorized as Level 2 in the fair value hierarchy.
In accordance with the valuation procedures adopted by the Trustees, real estate investments are fair valued using the results of an appraisal conducted by an independent valuation agent on the property(ies) underlying investment, as adjusted by any outstanding debt related to the property(ies). The Trustees deem this to be indicative of the fair value of the real estate investments. Such valuations are categorized as Level 3 in the fair value hierarchy. Prior to May 2014, real estate investments were valued by applying a discounted cash flows model to establish the fair value of each investment.
The following is a summary of the inputs used to value the Funds’ investments as of December 31, 2014 based on the three levels defined previously:
| | | | | | | | | | | | | | | | |
| | | LEVEL 1 | | | LEVEL 2 | | | LEVEL 3 | | | Total | |
Money Market Fund | | | | | | | | | | | | | | | | |
Investment Securities: | | | | | | | | | | | | | | | | |
Corporate Bonds | | $ | — | | | $ | 70,889,712 | | | $ | — | | | $ | 70,889,712 | |
Commercial Paper | | | — | | | | 57,960,587 | | | | — | | | | 57,960,587 | |
Yankee Certificates of Deposit | | | — | | | | 6,286,195 | | | | — | | | | 6,286,195 | |
U.S. Government Agencies | | | — | | | | 84,323,421 | | | | — | | | | 84,323,421 | |
Repurchase Agreements | | | — | | | | 70,000,000 | | | | — | | | | 70,000,000 | |
| | | | | | | | | | | | | | | | |
Total Investment Securities | | | — | | | | 289,459,915 | | | | — | | | | 289,459,915 | |
| | | | | | | | | | | | | | | | |
Annual Shareholder Report
54
| | | | | | | | | | | | | | | | |
| | | LEVEL 1 | | | LEVEL 2 | | | LEVEL 3 | | | Total | |
U.S. Treasury Money Market Fund | | | | | | | | | | | | | | | | |
Investment Securities: | | | | | | | | | | | | | | | | |
U.S. Treasury Obligations | | $ | — | | | $ | 775,587,228 | | | $ | — | | | $ | 775,587,228 | |
Repurchase Agreements | | | — | | | | 275,000,000 | | | | — | | | | 275,000,000 | |
| | | | | | | | | | | | | | | | |
Total Investment Securities | | | — | | | | 1,050,587,228 | | | | — | | | | 1,050,587,228 | |
| | | | | | | | | | | | | | | | |
Dividend Capture Fund | | | | | | | | | | | | | | | | |
Investment Securities: | | | | | | | | | | | | | | | | |
Common Stocks | | | 142,340,812 | | | | — | | | | — | | | | 142,340,812 | |
Preferred Stocks | | | 47,696,195 | | | | — | | | | — | | | | 47,696,195 | |
Exchange-Traded Funds | | | 3,606,670 | | | | — | | | | — | | | | 3,606,670 | |
Cash Equivalents | | | 9,104,401 | | | | — | | | | — | | | | 9,104,401 | |
Short-Term Securities Held as Collateral for Securities Lending | | | 6,334,281 | | | | — | | | | — | | | | 6,334,281 | |
| | | | | | | | | | | | | | | | |
Total Investment Securities | | | 209,082,359 | | | | — | | | | — | | | | 209,082,359 | |
| | | | | | | | | | | | | | | | |
Global Select Markets Fund | | | | | | | | | | | | | | | | |
Investment Securities: | | | | | | | | | | | | | | | | |
Common Stocks | | | 9,299,313 | | | | 19,354,602 | | | | — | | | | 28,653,915 | |
Preferred Stocks | | | — | | | | 37,550 | | | | — | | | | 37,550 | |
Foreign Government Bonds | | | — | | | | 136,356 | | | | — | | | | 136,356 | |
Rights | | | 7,371 | | | | — | | | | — | | | | 7,371 | |
Cash Equivalents | | | 7,588 | | | | — | | | | — | | | | 7,588 | |
| | | | | | | | | | | | | | | | |
Total Investment Securities | | | 9,314,272 | | | | 19,528,508 | | | | — | | | | 28,842,780 | |
| | | | | | | | | | | | | | | | |
Real Strategies Fund | | | | | | | | | | | | | | | | |
Investment Securities: | | | | | | | | | | | | | | | | |
Common Stocks | | | 24,749,026 | | | | — | | | | — | | | | 24,749,026 | |
Exchange-Traded Funds | | | 1,433,572 | | | | — | | | | — | | | | 1,433,572 | |
Real Estate Investments | | | — | | | | — | | | | 1,713,390 | | | | 1,713,390 | |
Closed-End Fund | | | 575,769 | | | | — | | | | — | | | | 575,769 | |
Options Purchased | | | 502,284 | | | | — | | | | — | | | | 502,284 | |
Cash Equivalents | | | 2,571,738 | | | | — | | | | — | | | | 2,571,738 | |
Short-Term Securities Held as Collateral for Securities Lending | | | 1,232,339 | | | | — | | | | — | | | | 1,232,339 | |
| | | | | | | | | | | | | | | | |
Total Investment Securities | | | 31,064,728 | | | | — | | | | 1,713,390 | | | | 32,778,118 | |
| | | | | | | | | | | | | | | | |
Other Financial Instruments:(a) | | | | | | | | | | | | | | | | |
Written Options | | | (448,339 | ) | | | — | | | | — | | | | (448,339 | ) |
| | | | | | | | | | | | | | | | |
Total Investments | | | 30,616,389 | | | | — | | | | 1,713,390 | | | | 32,329,779 | |
| | | | | | | | | | | | | | | | |
Situs Fund | | | | | | | | | | | | | | | | |
Investment Securities: | | | | | | | | | | | | | | | | |
Common Stocks | | | 189,428,787 | | | | 9,320,920 | | | | — | | | | 198,749,707 | |
Exchange-Traded Funds | | | 195,320 | | | | — | | | | — | | | | 195,320 | |
Short-Term Securities Held as Collateral for Securities Lending | | | 41,789,842 | | | | — | | | | — | | | | 41,789,842 | |
| | | | | | | | | | | | | | | | |
Total Investment Securities | | | 231,413,949 | | | | 9,320,920 | | | | — | | | | 240,734,869 | |
| | | | | | | | | | | | | | | | |
Other Financial Instruments:(a) | | | | | | | | | | | | | | | | |
Written Options | | | (132,000 | ) | | | — | | | | — | | | | (132,000 | ) |
| | | | | | | | | | | | | | | | |
Total Investments | | | 231,281,949 | | | | 9,320,920 | | | | — | | | | 240,602,869 | |
| | | | | | | | | | | | | | | | |
Balanced Allocation Fund | | | | | | | | | | | | | | | | |
Investment Securities: | | | | | | | | | | | | | | | | |
Mutual Funds | | | 11,027,819 | | | | — | | | | — | | | | 11,027,819 | |
Exchange-Traded Funds | | | 5,096,169 | | | | — | | | | — | | | | 5,096,169 | |
Cash Equivalents | | | 4,673,951 | | | | — | | | | — | | | | 4,673,951 | |
| | | | | | | | | | | | | | | | |
Total Investment Securities | | | 20,797,939 | | | | — | | | | — | | | | 20,797,939 | |
| | | | | | | | | | | | | | | | |
Annual Shareholder Report
55
Notes to Financial Statements (Continued)
| | | | | | | | | | | | | | | | |
| | | LEVEL 1 | | | LEVEL 2 | | | LEVEL 3 | | | Total | |
Conservative Allocation Fund | | | | | | | | | | | | | | | | |
Investment Securities: | | | | | | | | | | | | | | | | |
Mutual Funds | | $ | 1,833,678 | | | $ | — | | | $ | — | | | $ | 1,833,678 | |
Exchange-Traded Funds | | | 299,866 | | | | — | | | | — | | | | 299,866 | |
Cash Equivalents | | | 900,523 | | | | — | | | | — | | | | 900,523 | |
| | | | | | | | | | | | | | | | |
Total Investment Securities | | | 3,034,067 | | | | — | | | | — | | | | 3,034,067 | |
| | | | | | | | | | | | | | | | |
Growth Allocation Fund | | | | | | | | | | | | | | | | |
Investment Securities: | | | | | | | | | | | | | | | | |
Mutual Funds | | | 7,934,336 | | | | — | | | | — | | | | 7,934,336 | |
Exchange-Traded Funds | | | 4,291,436 | | | | — | | | | — | | | | 4,291,436 | |
Cash Equivalents | | | 1,610,966 | | | | — | | | | — | | | | 1,610,966 | |
| | | | | | | | | | | | | | | | |
Total Investment Securities | | | 13,836,738 | | | | — | | | | — | | | | 13,836,738 | |
| | | | | | | | | | | | | | | | |
| (a) | Other Financial Instruments are derivative instruments not reflected on the Portfolio of Investments, such as written option contracts. |
Transfers from Level 1 to Level 2 are due to significant movement of a designated U.S. market index, triggering a systematic valuation model provided by an independent third party to fair value the international equity securities at reporting period end. Transfers from Level 2 to Level 1 indicate that the fair valuation of international equity securities used at the previous reporting period end did not occur as of the current reporting period end.
The Trust recognizes significant transfers between fair value hierarchy levels at the reporting period end. The following is a summary of the transfers between Level 1 and Level 2 of the fair value hierarchy for the year ended December 31, 2014:
| | | | | | | | |
| | | Transfers from
Level 1 to Level 2 | | | Transfers from
Level 2 to Level 1 | |
Global Select Markets Fund | | | | | | | | |
Investment Securities: | | | | | | | | |
Common Stocks | | $ | 2,301,649 | | | $ | — | |
Situs Fund | | | | | | | | |
Investment Securities: | | | | | | | | |
Common Stocks | | | 9,320,920 | | | | — | |
The following is a summary of the inputs used to value the Real Strategies Fund’s Level 3 investments as of December 31, 2014:
| | | | | | | | | | | | |
| Type of Assets | | Fair Value
At 12/31/2014 | | | Valuation Techniques | | Unobservable Input(s) | | Range
(Weighted Average) | |
Real Estate Investments | | $ | 1,713,390 | | | Independent Valuation | | Sales Comparison Approach | | | N/A | |
| | | | | | | | Income Approach | | | N/A | |
| | | | | | | | Market Cap Rate | | | 5.30%-13.60%(7.00%) | |
As noted previously, the Real Strategies Fund’s investments in real estate investments are valued by using the results of an independent valuation appraisal. The independent valuation agent will utilize either an income approach, a sales comparison approach, or a combination thereof to arrive at the valuation. The significant unobservable inputs used in the income approach include the net cash flow from each underlying property and the related discount and market cap rates. An increase in the cash flows and/or market cap rates or decreases in the discount rate used would increase the value of the real estate. A decrease in the cash flows and/or market cap rate or increases in the discount rate used would decrease the value of the real estate. The significant unobservable inputs used in the sales comparison approach include measurable units of comparison (such as price per acre, price per unit, price per square foot, or gross rent multiplier), as adjusted for each comparable property’s location, physical condition or other economic characteristics.
Annual Shareholder Report
56
Following is a reconciliation of assets in which significant unobservable inputs (Level 3) were used in determining fair value:
| | | | |
| Real Strategies Fund | | Real Estate
Investments | |
Balance as of December 31, 2013 | | $ | 4,662,492 | |
Transfers into Level 3 | | | — | |
Transfers out of Level 3 | | | — | |
Purchases | | | 87,305 | |
Sales | | | (2,097,243 | ) |
Realized Gain/(Loss) | | | (242,357 | ) |
Change in unrealized appreciation/(depreciation) | | | (696,807 | ) |
| | | | |
Ending Balance as of December 31, 2014 | | $ | 1,713,390 | |
| | | | |
The Funds may enter into repurchase agreements with banks and other recognized financial institutions, such as broker/dealers, which are deemed by Huntington Asset Advisors, Inc., a subsidiary of The Huntington National Bank, to be creditworthy pursuant to the guidelines and/or standards reviewed or established by the Trustees. It is the policy of the Funds to require the custodian bank to take possession of, to have legally segregated in the Federal Reserve Book Entry System, or to have segregated within the custodian bank’s vault, all securities held as collateral under repurchase agreement transactions. Additionally, procedures have been established by the Funds to monitor, on a daily basis, the market value of each repurchase agreement’s collateral to ensure that the value of collateral at least equals the repurchase price to be paid under the repurchase agreement transaction. If the counterparty defaults and the fair value of the collateral declines, realization of the collateral by the Funds may be delayed or limited.
| C. | Foreign Currency Translation |
The accounting records of the Funds are maintained in U.S. dollars. Foreign currency amounts are translated into U.S. dollars at the current rate of exchange each business day to determine the value of investments, and other assets and liabilities. Purchases and sales of foreign securities, and income and expenses, are translated at the prevailing rate of exchange on the respective date of these transactions. The Funds do not isolate that portion of the results of operations resulting from changes in foreign exchange rates on investments from fluctuation arising from changes in market prices of securities held. These fluctuations are included with the net realized and unrealized gain or loss from investments and foreign currency transactions.
Certain of the Funds may be subject to equity price risk and foreign currency exchange risk in the normal course
of pursuing their investment objectives. Certain of the Funds may invest in various financial instruments including positions in foreign currency contracts and written option contracts to gain exposure to or hedge against changes in the value of equities or foreign currencies. The following is a description of the derivative instruments utilized by the Funds, including the primary underlying risk exposure related to each instrument type.
Foreign Exchange Contracts—Certain of the Funds may enter into forward foreign exchange contracts. A forward foreign exchange contract involves an obligation to purchase or sell a specific currency at a future date at a price set at the time of the contract. Such contracts are used to sell unwanted currency exposure that comes with holding securities in a market, or to buy currency exposure where the exposure from holding securities is insufficient to provide the desired currency exposure. The contracts are marked-to-market daily and the change in market value is recorded as unrealized appreciation or depreciation. When a forward foreign currency contract is closed, a Fund records a realized gain or loss equal to the difference between the value at the time it was opened and the value at the time it was closed. The Funds could be exposed to risks if the counterparties to the contracts are unable to meet the terms of their contracts and from unanticipated movements in exchange rates. As of December 31, 2014, the Funds did not have any forward foreign exchange contracts outstanding.
Written Options Contracts—Certain of the Funds may write options contracts for which premiums received are recorded as liabilities and are subsequently adjusted to the current value of the options written. Premiums received from writing options which expire are treated as realized gains. Premiums received from writing options which are either exercised or closed are offset against the proceeds received or the amount paid on the transaction to determine realized gains or losses. Investing in written options contracts exposes a Fund to equity price risk.
Annual Shareholder Report
57
Notes to Financial Statements (Continued)
The following is a summary of Dividend Capture Fund’s written option activity for the year ended December 31, 2014:
| | | | | | | | |
| Contracts | | Number of
Contracts | | | Premium | |
Outstanding at 12/31/2013 | | | 200 | | | $ | 42,282 | |
Options written | | | 1,200 | | | | 171,155 | |
Options expired | | | (200 | ) | | | (24,800 | ) |
Options closed | | | (500 | ) | | | (71,085 | ) |
Options exercised | | | (700 | ) | | | (117,552 | ) |
Outstanding at 12/31/2014 | | | — | | | $ | — | |
The following is a summary of Real Strategies Fund’s written option activity for the year ended December 31, 2014:
| | | | | | | | |
| Contracts | | Number of
Contracts | | | Premium | |
Outstanding at 12/31/2013 | | | 200 | | | $ | 67,535 | |
Options written | | | 59,162 | | | | 4,219,822 | |
Options expired | | | (4,547 | ) | | | (512,188 | ) |
Options closed | | | (45,511 | ) | | | (3,092,691 | ) |
Options exercised | | | (86 | ) | | | (10,489 | ) |
Outstanding at 12/31/2014 | | | 9,218 | | | $ | 671,989 | |
As of December 31, 2014, Real Strategies Fund had the following outstanding written option contracts:
| | | | | | | | | | | | | | | | | | | | | | | | |
| Contract | | Type | | | Expiration Date | | | Exercise
Price | | | Number of
Contracts | | | Fair Value | | | Unrealized
Appreciation
(Depreciation) | |
AGCO Corp. | | | Call | | | | January 2015 | | | $ | 45 | | | | 122 | | | $ | 14,030 | | | $ | 2,051 | |
Agrium, Inc. | | | Call | | | | January 2015 | | | | 100 | | | | 34 | | | | 1,530 | | | | 835 | |
Alliance Resource Partners | | | Call | | | | January 2015 | | | | 45 | | | | 165 | | | | 7,425 | | | | (116 | ) |
Barrick Gold Corp. | | | Call | | | | January 2015 | | | | 13 | | | | 356 | | | | 712 | | | | 13,063 | |
BHP Billiton Ltd. | | | Call | | | | January 2015 | | | | 50 | | | | 108 | | | | 3,456 | | | | 1,940 | |
Canadian Natural Resources Ltd. | | | Call | | | | January 2015 | | | | 35 | | | | 386 | | | | 3,860 | | | | 6,162 | |
Carrizo Oil & Gas, Inc. | | | Call | | | | January 2015 | | | | 40 | | | | 115 | | | | 35,650 | | | | (23,263 | ) |
CBOE Volatility Index | | | Call | | | | January 2015 | | | | 24 | | | | 600 | | | | 60,000 | | | | 55,179 | |
CBOE Volatility Index | | | Call | | | | March 2015 | | | | 24 | | | | 300 | | | | 51,000 | | | | 16,189 | |
CBOE Volatility Index | | | Call | | | | May 2015 | | | | 24 | | | | 300 | | | | 59,250 | | | | 17,839 | |
Cheniere Energy, Inc. | | | Call | | | | January 2015 | | | | 80 | | | | 174 | | | | 7,830 | | | | 10,806 | |
Chesapeake Energy Corp. | | | Call | | | | January 2015 | | | | 22 | | | | 493 | | | | 6,902 | | | | 2,940 | |
Chicago Bridge & Iron Co. NV | | | Call | | | | January 2015 | | | | 47 | | | | 168 | | | | 3,360 | | | | 666 | |
Consol Energy, Inc. | | | Call | | | | January 2015 | | | | 40 | | | | 179 | | | | 537 | | | | 3,228 | |
GATX Corp. | | | Call | | | | January 2015 | | | | 60 | | | | 200 | | | | 12,000 | | | | (2,207 | ) |
Halliburton Co. | | | Call | | | | January 2015 | | | | 45 | | | | 188 | | | | 1,316 | | | | 5,257 | |
Helmerich & Payne, Inc. | | | Call | | | | January 2015 | | | | 72.5 | | | | 122 | | | | 12,200 | | | | 4,375 | |
iShares MSCI Emerging Markets ETF | | | Put | | | | January 2015 | | | | 36 | | | | 1,500 | | | | 7,500 | | | | 25,913 | |
Joy Global, Inc. | | | Call | | | | January 2015 | | | | 50 | | | | 192 | | | | 4,512 | | | | 8,921 | |
Magellan Midstream Partners LP | | | Call | | | | January 2015 | | | | 85 | | | | 155 | | | | 17,437 | | | | (176 | ) |
Oasis Petroleum, Inc. | | | Call | | | | January 2015 | | | | 20 | | | | 286 | | | | 2,860 | | | | 9,714 | |
Rio Tinto PLC | | | Call | | | | January 2015 | | | | 47.5 | | | | 99 | | | | 6,435 | | | | (736 | ) |
Annual Shareholder Report
58
| | | | | | | | | | | | | | | | | | | | | | | | |
| Contract | | Type | | | Expiration Date | | | Exercise
Price | | | Number of
Contracts | | | Fair Value | | | Unrealized
Appreciation
(Depreciation) | |
Schlumberger Ltd. | | | Call | | | | January 2015 | | | $ | 90 | | | | 60 | | | $ | 4,500 | | | $ | 3,452 | |
SM Energy Co. | | | Call | | | | January 2015 | | | | 45 | | | | 147 | | | | 5,880 | | | | 2,788 | |
Southern Copper Corp. | | | Call | | | | January 2015 | | | | 30 | | | | 321 | | | | 4,494 | | | | 1,487 | |
SPDR S&P 500 ETF Trust | | | Put | | | | January 2015 | | | | 200 | | | | 600 | | | | 73,200 | | | | 63,575 | |
Spectra Energy Corp. | | | Call | | | | January 2015 | | | | 39 | | | | 269 | | | | 3,363 | | | | (387 | ) |
Suncor Energy, Inc. | | | Call | | | | January 2015 | | | | 35 | | | | 304 | | | | 3,040 | | | | 5,157 | |
Sunoco Logistics Partners LP | | | Call | | | | January 2015 | | | | 45 | | | | 40 | | | | 1,300 | | | | 658 | |
United States Natural Gas Fund LP | | | Call | | | | January 2015 | | | | 24 | | | | 350 | | | | 525 | | | | 3,662 | |
Vale SA | | | Call | | | | January 2015 | | | | 8 | | | | 695 | | | | 27,105 | | | | (15,315 | ) |
Valero Energy Corp. | | | Call | | | | January 2015 | | | | 52.5 | | | | 190 | | | | 5,130 | | | | (7 | ) |
Net unrealized appreciation on written option contracts | | | | | | | | | | | | | | | | | | | | | | $ | 223,650 | |
The following is a summary of Situs Fund’s written option activity for the year ended December 31, 2014:
| | | | | | | | |
| Contracts | | Number of
Contracts | | | Premium | |
Outstanding at 12/31/2013 | | | 1,500 | | | $ | 497,136 | |
Options written | | | 11,220 | | | | 2,824,201 | |
Options expired | | | (5,115 | ) | | | (1,418,896 | ) |
Options closed | | | (1,400 | ) | | | (584,518 | ) |
Options exercised | | | (5,905 | ) | | | (1,186,747 | ) |
Outstanding at 12/31/2014 | | | 300 | | | $ | 131,176 | |
As of December 31, 2014, Situs Fund had the following outstanding written option contracts:
| | | | | | | | | | | | | | | | | | | | | | | | |
| Contract | | Type | | | Expiration Date | | | Exercise
Price | | | Number of
Contracts | | | Fair Value | | | Unrealized
Appreciation
(Depreciation) | |
Red Hat, Inc. | | | Call | | | | January 2015 | | | $ | 65 | | | | 300 | | | $ | 132,000 | | | $ | (824 | ) |
Net unrealized depreciation on written option contracts | | | | | | | | | | | | | | | | | | | | | | $ | (824 | ) |
The following tables identify the location and fair value of derivative instruments on the Statements of Assets and Liabilities as of December 31, 2014, and the effect of derivative instruments on the Statements of Operations for the year ended December 31, 2014.
The Fair Value of Derivative Instruments as of December 31, 2014:
| | | | | | | | | | |
| | | Asset Derivatives | | Liability Derivatives | | | | | |
| Primary Risk Exposure | | Statements of Assets and
Liabilities Location | | Statements of Assets and
Liabilities Location | | Fund | | Fair Value | |
Written Option Contracts | | None | | Options Written, at value | | Real Strategies Fund | | $ | 448,339 | |
| | | | | | Situs Fund | | | 132,000 | |
The effect of Derivative Instruments on the Statements of Operations for the year ended December 31, 2014:
| | | | | | | | | | | | |
| Primary Risk Exposure | | Location of Gain/(Loss)
on Derivatives
Recognized from Operations | | Fund | | Realized Gain/(Loss) on
Derivatives Recognized
from Operations | | | Change in Unrealized
Appreciation/(Depreciation)
on Derivatives Recognized
from Operations | |
Written Option Contracts | | Net Realized gain/(loss) on written option transactions/net change in unrealized appreciation/(depreciation) of investments and written options | | Dividend Capture Fund
Real Strategies Fund
Situs Fund | | $
| 70,939
1,869,991 1,146,749 |
| | $
| 82,718
270,115 237,539 |
|
Annual Shareholder Report
59
Notes to Financial Statements (Continued)
| Balance | Sheet Offsetting Information |
Netting Agreements—During the ordinary course of business, the Funds may enter into transactions subject to enforceable netting agreements or other similar arrangements (“netting agreements”). Generally, the right to offset in netting agreements allows a Fund to offset any exposure to a specific counterparty with any collateral
received or delivered to that counterparty based on the terms of the agreement. Generally, a Fund manages its cash collateral and securities collateral on a counterparty basis. As of December 31, 2014, the Funds were not invested in any portfolio securities or derivatives that could be netted subject to the netting agreements.
The following tables provide a summary of offsetting financial liabilities and derivatives and the effect of derivative instruments on the Statements of Assets and Liabilities as of December 31, 2014.
| | | | | | | | | | | | | | | | | | | | | | | | |
| Securities Loaned | | | | | | | | | | | Gross Amounts Not Offset in
Statements of Assets and
Liabilities | | | | |
| Fund | | Gross Amounts
of Recognized
Liabilities | | | Gross Amounts
Offset in
Statements of
Assets and
Liabilities | | | Net Amounts of
Liabilities Presented
in Statements of
Assets and Liabilities | | | Financial
Instruments | | | Cash
Collateral
Pledged | | | Net Amount
(not less than 0) | |
Dividend Capture Fund | | $ | 6,334,281 | | | $ | — | | | $ | 6,334,281 | | | $ | (6,334,281 | ) | | $ | — | | | $ | — | |
Real Strategies Fund | | | 1,232,339 | | | | — | | | | 1,232,339 | | | | (1,232,339 | ) | | | — | | | | — | |
Situs Fund | | | 41,789,842 | | | | — | | | | 41,789,842 | | | | (41,789,842 | ) | | | — | | | | — | |
| | | | | | | | | | | | | | | | | | | | | | | | |
| Written Options | | | | | | | | | | | Gross Amounts Not Offset in
Statements of Assets and
Liabilities | | | | |
| Fund | | Gross Amounts
of Recognized
Liabilities(a) | | | Gross Amounts
Offset in
Statements of
Assets and
Liabilities | | | Net Amounts of
Liabilities Presented
in Statements of
Assets and Liabilities | | | Financial
Instruments | | | Cash
Collateral
Pledged | | | Net Amount
(not less than 0) | |
Real Strategies Fund | | $ | 448,339 | | | $ | — | | | $ | 448,339 | | | $ | (20,098,008 | ) | | $ | — | | | $ | — | |
Situs Fund | | | 132,000 | | | | — | | | | 132,000 | | | | (4,494,100 | ) | | | — | | | | — | |
| (a) | Gross Amounts of Recognized Liabilities as presented on the Statements of Assets and Liabilities are the actual closing values of liabilities outstanding as of December 31, 2014. Notional Values for Written Options as of December 31, 2014 are presented in the subsequent table. |
The notional value of the written options contracts outstanding as of December 31, 2014 and the month-end average notional amount for the year ended December 31, 2014 are detailed in the table below:
| | | | | | | | |
| Portfolio | | Average
Month-End
Notional Amount | | | December 31, 2014
Notional Amount | |
Dividend Capture Fund | | $ | 1,377,692 | | | $ | — | |
Real Strategies Fund | | | 28,939,485 | | | | 41,808,850 | |
Situs Fund | | | 12,666,377 | | | | 1,950,000 | |
Derivative positions open during the year and at year end, if any, are reflected for each Fund in the previous tables. The volume of these positions relative to each Fund’s net assets at the close of the reporting period is generally higher than the volume of such positions at the beginning of the reporting period. The Funds value derivative instruments at fair value and recognize changes in fair value currently in the results on operations.
To generate additional income, the Funds may lend a certain percentage of their total assets, to the extent permitted by the 1940 Act or the rules or regulations thereunder, on a short-term basis to certain brokers, dealers or other financial institutions pursuant to a
securities lending agreement with Morgan Stanley & Co. LLC. In determining whether to lend to a particular broker, dealer or financial institution, Huntington Asset Advisors, Inc. (the “Advisor”) will consider all relevant facts and circumstances, including the size, creditworthiness and reputation of the borrower. Any loans made will be continuously secured by collateral in cash at least equal to 100% of the value of the securities on loan for the Funds, based on the prior day’s closing price. When the collateral falls below specified amounts, the lending agent will use its best effort to obtain additional collateral on the next business day to meet required amounts under the securities lending agreement. The Funds receive payments from the borrowers equivalent to the dividends and interest that would have been earned on securities on
Annual Shareholder Report
60
loan. In addition, the Funds lending securities receive an annual minimum securities lending fee and retain a portion of the interest, dividends and other distributions received on investment of cash collateral. Collateral is marked-to-market daily. One of the risks in lending portfolio securities, as with other extensions of credit, is the possible delay in recovery of the securities or possible loss of rights in the collateral should the borrower fail financially. Although the loan is fully collateralized, if a borrower defaults, a Fund could lose money. There is also the risk that, when lending portfolio securities, the
securities may not be available to a Fund on a timely basis and a Fund may, therefore, lose the opportunity to sell the securities at a desirable price. In addition, in the event that a borrower of securities would file for bankruptcy or become insolvent, disposition of the securities may be delayed pending court action. Loans are subject to termination by the Funds or the borrower at any time and, therefore, are not considered to be illiquid investments. Huntington National Bank (“Huntington”) serves as the custodian and receives an annual securities lending fee for collateral monitoring and recordkeeping services.
As of December 31, 2014, the following Funds had securities with the following market values on loan and related activity for the year ended December 31, 2014:
| | | | | | | | | | | | | | | | | | | | |
| Fund | | Value of
Loaned
Securities | | | Value of
Collateral | | | Average Loan
Outstanding
During
the Year | | | Securities Lending
Income Received
by the Funds | | | Fees Paid by the
Funds to
Huntington from
Securities
Lending | |
Dividend Capture Fund | | $ | 6,172,073 | | | $ | 6,334,281 | | | $ | 21,657,399 | | | $ | 91,172 | | | $ | 33,098 | |
Global Select Markets Fund | | | — | | | | — | | | | 253,125 | | | | 14,596 | | | | 6,737 | |
Real Strategies Fund | | | 1,200,099 | | | | 1,232,339 | | | | 10,551,366 | | | | 271,107 | | | | 109,000 | |
Situs Fund | | | 40,505,658 | | | | 41,789,842 | | | | 70,962,014 | | | | 1,005,283 | | | | 236,002 | |
Restricted securities are securities that may only be resold upon registration under federal securities laws or in transactions exempt from such registration. In some cases, the issuer of restricted securities has agreed to register such securities for resale, at the issuer’s expense, either upon demand by the Funds or in connection with another registered offering of the securities. Many restricted securities may be resold in the secondary market in transactions exempt from registration. Such restricted securities may be determined to be liquid. The Funds will not incur any registration costs upon such resale. The Funds’ restricted securities are valued at the price provided by dealers in the secondary market or, if no market prices are available, at the fair value price as determined by the Trust’s Pricing Committee. As of December 31, 2014, the Real Strategies Fund and the Money Market Fund held restricted securities representing 5.5% and 5.1%, respectively, of net assets as listed below:
| | | | | | | | | | | | | | | | |
| Issuer Description | | Acquisition Date | | | Principal Amount | | | Cost | | | Value | |
Real Strategies Fund: | | | | | | | | | | | | | | | | |
Grocery & Pharmacy DST | | | 8/26/11, 5/15/14 | | | | N/A | | | $ | 991,705 | | | $ | 886,908 | |
New York Power DST | | | 7/21/11 | | | | N/A | | | | 950,000 | | | | 826,482 | |
| | | | |
Money Market Fund: | | | | | | | | | | | | | | | | |
National Australia Bank Ltd. | | | 11/21/14 | | | $ | 7,500,000 | | | $ | 7,507,553 | | | $ | 7,506,067 | |
Royal Bank of Canada | | | 10/29/14 | | | | 6,540,000 | | | | 6,624,235 | | | | 6,593,557 | |
Westpac Banking Corp. | | | 11/21/14 | | | | 1,000,000 | | | | 1,000,520 | | | | 1,000,221 | |
| G. | Security Transactions and Related Income |
During the period, investment transactions are accounted for no later than the first calculation of the NAV on the business day following the trade date. For financial reporting purposes, however, security transactions are accounted for on the trade date on the last business day of the reporting period. Discounts and premiums on securities purchased are amortized over the lives of the respective securities. Securities gains and losses are calculated on the identified cost basis. Interest income and expenses are accrued daily. Dividends, less foreign tax withholding (if any), are recorded on the ex-dividend date.
| H. | Dividends and Distributions to Shareholders |
Dividends from net investment income are declared daily and paid monthly by the Money Market Fund and U.S. Treasury Money Market Fund. Dividends from net investment income are declared and paid annually by the Global Select Markets Fund, Real Strategies Fund, Situs Fund and Growth Allocation Fund. Dividends from net investment income are declared and paid quarterly by the Balanced Allocation Fund. Dividends from net investment income are declared and paid monthly by the Dividend Capture Fund and Conservative Allocation Fund.
Annual Shareholder Report
61
Notes to Financial Statements (Continued)
The amount of dividends from net investment income and net realized gains are determined in accordance with the federal income tax regulations, which may differ from GAAP. These “book/tax” differences are either considered temporary or permanent in nature. To the extent these differences are permanent in nature (e.g. tax treatment of foreign currency gain/loss, non-deductible stock issuance costs, distributions and income received from pass through investments and net investment loss adjustments), such amounts are reclassified within the capital accounts based on their nature for federal income tax purposes; temporary differences do not require reclassification. Temporary differences are primarily due to market discounts, capital loss carryforwards and losses deferred due to wash sales, straddles and return of capital from investments.
Dividends are declared separately for each class. No class has preferential rights; differences in per share dividend rates are generally due to differences in separate class expenses. Net realized capital gains, if any, are distributed at least annually.
Certain of the Funds may own shares of real estate investments trusts (“REITs”) which report information on the source of their distributions annually. Distributions received from investments in REITs in excess of income from underlying investments are recorded as realized gain and/or as a reduction to the cost of the individual REIT.
Certain of the Funds may invest in Master Limited Partnerships (“MLPs”), which generally are treated as partnerships for Federal income tax purposes. As a limited
partner in the MLPs, the Fund includes its allocable share of the MLPs’ taxable income in computing its own taxable income.
| I. | Allocation of Expenses, Income, and Gains and Losses |
Expenses directly attributable to a Fund are charged to that Fund. Expenses specific to a class are charged to that class. Except for the daily dividend Funds, expenses not directly attributable to a Fund are allocated proportionally among various Funds or all Funds within the Trust in relation to the net assets of each Fund or on another reasonable basis. For the daily dividend Funds, expenses not directly attributable to a Fund are allocated pursuant to the “settled shares method.” Income and realized and unrealized gains or losses on investments are allocated to each class of shares based on its relative net assets.
It is the policy of each Fund to qualify or continue to qualify as a regulated investment company by complying with the provisions available to certain investment companies, as defined in applicable sections of the Internal Revenue Code, and to make distributions of net investment income and net realized capital gains sufficient to relieve it from all, or substantially all, federal income taxes.
Withholding taxes on foreign interest, dividends and capital gains with respect to the Funds have been provided for in accordance with each applicable country’s tax rules and rates.
As of December 31, 2014, the tax cost of securities and the breakdown of unrealized appreciation (depreciation) for each Fund were as follows:
| | | | | | | | | | | | | | | | |
| Fund | | Tax Cost of
Securities | | | Unrealized
Appreciation | | | Unrealized
Depreciation | | | Net Unrealized
Appreciation/
(Depreciation)(a) | |
Money Market Fund | | $ | 289,459,915 | | | $ | — | | | $ | — | | | $ | — | |
U.S. Treasury Money Market Fund | | | 1,050,589,588 | | | | — | | | | (2,360 | ) | | | (2,360 | ) |
Dividend Capture Fund | | | 193,781,123 | | | | 19,710,688 | | | | (4,409,452 | ) | | | 15,301,236 | |
Global Select Markets Fund | | | 23,509,814 | | | | 5,846,240 | | | | (513,274 | ) | | | 5,332,966 | |
Real Strategies Fund | | | 33,463,215 | | | | 4,601,942 | | | | (5,287,039 | ) | | | (685,097 | ) |
Situs Fund | | | 155,455,963 | | | | 91,467,031 | | | | (6,188,125 | ) | | | 85,278,906 | |
Balanced Allocation Fund | | | 19,937,711 | | | | 1,649,929 | | | | (789,701 | ) | | | 860,228 | |
Conservative Allocation Fund | | | 3,048,131 | | | | 81,795 | | | | (95,859 | ) | | | (14,064 | ) |
Growth Allocation Fund | | | 12,945,508 | | | | 1,571,523 | | | | (680,293 | ) | | | 891,230 | |
| (a) | The differences between the book-basis unrealized appreciation (depreciation) are attributable primarily to: tax deferral of losses on wash sales, the tax treatment of Trust Preferred securities, hybrid securities and Grantor trusts, differences related to partnership investments, the realization for tax purposes of unrealized gains/losses on investments in passive foreign investment companies, the utilization of earnings and profits due to shareholder redemptions and the return of capital adjustments from real estate investment trusts. |
Annual Shareholder Report
62
The tax character of distributions paid during the fiscal year ended December 31, 2014, were as follows:
| | | | | | | | | | | | | | | | |
| | | Distributions Paid From(a) | | | | | | | |
| Fund | | Ordinary
Income | | | Net Long-Term
Capital Gains | | | Total Taxable
Distributions | | | Total
Distributions
Paid | |
Money Market Fund | | $ | 45,771 | | | $ | — | | | $ | 45,771 | | | $ | 45,771 | |
U.S. Treasury Money Market Fund | | | 335,711 | | | | — | | | | 335,711 | | | | 335,711 | |
Dividend Capture Fund | | | 18,570,793 | | | | 16,718,184 | | | | 35,288,977 | | | | 35,288,977 | |
Global Select Markets Fund | | | — | | | | 1,172,067 | | | | 1,172,067 | | | | 1,172,067 | |
Real Strategies Fund | | | 499,549 | | | | — | | | | 499,549 | | | | 499,549 | |
Situs Fund | | | 1,251,429 | | | | 61,304,361 | | | | 62,555,790 | | | | 62,555,790 | |
Balanced Allocation Fund | | | 502,779 | | | | 648,944 | | | | 1,151,723 | | | | 1,151,723 | |
Conservative Allocation Fund | | | 97,978 | | | | 119,726 | | | | 217,704 | | | | 217,704 | |
Growth Allocation Fund | | | 395,183 | | | | 459,339 | | | | 854,522 | | | | 854,522 | |
| (a) | The tax character of distributions paid may differ from the character of distributions shown on the statements of changes in net assets due to short-term capital gains being treated as ordinary income for tax purposes. |
The tax character of distributions paid during the fiscal year ended December 31, 2013, were as follows:
| | | | | | | | | | | | | | | | | | | | | | | | |
| | | Distributions Paid From(a) | | | | | | | | | | | | | |
| Fund | | Ordinary
Income | | | Net
Long-Term
Capital Gains | | | Taxable
Over
Distribution | | | Total
Taxable
Distributions | | | Tax Exempt
Distributions | | | Total
Distributions
Paid | |
Money Market Fund | | $ | 32,613 | | | $ | — | | | $ | — | | | $ | 32,613 | | | $ | — | | | $ | 32,613 | |
U.S. Treasury Money Market Fund | | | 509,465 | | | | — | | | | — | | | | 509,465 | | | | — | | | | 509,465 | |
Dividend Capture Fund | | | 6,662,899 | | | | 8,128,956 | | | | — | | | | 14,791,855 | | | | — | | | | 14,791,855 | |
Global Select Markets Fund | | | 536,804 | | | | — | | | | — | | | | 536,804 | | | | — | | | | 536,804 | |
Real Strategies Fund | | | 816,773 | | | | — | | | | — | | | | 816,773 | | | | — | | | | 816,773 | |
Situs Fund | | | 1,552,693 | | | | 11,486,877 | | | | — | | | | 13,039,570 | | | | — | | | | 13,039,570 | |
Balanced Allocation Fund | | | 485,464 | | | | 640,174 | | | | — | | | | 1,125,638 | | | | — | | | | 1,125,638 | |
Conservative Allocation Fund | | | 70,534 | | | | 159,136 | | | | — | | | | 229,670 | | | | — | | | | 229,670 | |
Growth Allocation Fund | | | 409,359 | | | | 796,443 | | | | — | | | | 1,205,802 | | | | — | | | | 1,205,802 | |
| (a) | The tax character of distributions paid may differ from the character of distributions shown on the statements of changes in net assets due to short-term capital gains being treated as ordinary income for tax purposes. |
As of December 31, 2014, the components of accumulated earnings (deficit) were as follows:
| | | | | | | | | | | | | | | | | | | | | | | | | | | | |
| Fund | | Undistributed
Ordinary
Income | | | Undistributed
Long-Term
Capital Gains | | | Accumulated
Earnings | | | Accumulated
Capital and
Other Losses | | | Other
Temporary
Differences | | | Unrealized
Appreciation
(Depreciation) | | | Total
Accumulated
Earnings
(Deficit) | |
Money Market Fund | | $ | 3,297 | | | $ | — | | | $ | 3,297 | | | $ | (168,329 | ) | | $ | — | | | $ | — | | | $ | (165,032 | ) |
U.S. Treasury Money Market Fund | | | 8,998 | | | | — | | | | 8,998 | | | | (13,194 | ) | | | — | | | | (2,360 | ) | | | (6,556 | ) |
Dividend Capture Fund | | | 3,512,254 | | | | 1,360,410 | | | | 4,872,664 | | | | — | | | | (73,053 | ) | | | 15,301,236 | | | | 20,100,847 | |
Global Select Markets Fund | | | 140,885 | | | | 401,880 | | | | 542,765 | | | | — | | | | — | | | | 5,271,922 | | | | 5,814,687 | |
Real Strategies Fund | | | 521,844 | | | | — | | | | 521,844 | | | | (14,313,834 | ) | | | (157,410 | ) | | | (418,912 | ) | | | (14,368,312 | ) |
Situs Fund | | | 255,148 | | | | 23,113,164 | | | | 23,368,312 | | | | (550,102 | ) | | | — | | | | 85,275,326 | | | | 108,093,536 | |
Balanced Allocation Fund | | | — | | | | 1,944,436 | | | | 1,944,436 | | | | (303,120 | ) | | | — | | | | 860,228 | | | | 2,501,544 | |
Conservative Allocation Fund | | | — | | | | 158,795 | | | | 158,795 | | | | (107,473 | ) | | | — | | | | (14,064 | ) | | | 37,258 | |
Growth Allocation Fund | | | 914 | | | | 1,974,630 | | | | 1,975,544 | | | | (117,619 | ) | | | — | | | | 891,230 | | | | 2,749,155 | |
Annual Shareholder Report
63
Notes to Financial Statements (Continued)
As of December 31, 2014, for federal income tax purposes and the treatment of distributions payable, the following Funds had capital loss carryforwards available to offset future gains, if any, to the extent provided by the Treasury regulations:
| | | | | | | | | | | | | | | | | | | | | | | | | | | | |
| Fund | | 2015 | | | 2016 | | | 2017 | | | 2018 | | | No Expiration
Short-Term(a) | | | No Expiration
Long-Term(b) | | | Total | |
Money Market Fund | | $ | 106 | | | $ | — | | | $ | — | | | $ | — | | | $ | 168,222 | | | $ | — | | | $ | 168,328 | |
U.S. Treasury Money Market Fund | | | — | | | | — | | | | — | | | | — | | | | 9,793 | | | | — | | | | 9,793 | |
Real Strategies Fund | | | — | | | | — | | | | 12,177,540 | | | | 2,136,294 | | | | — | | | | — | | | | 14,313,834 | |
Situs Fund | | | 550,102 | | | | — | | | | — | | | | — | | | | — | | | | — | | | | 550,102 | |
| (a) | The Regulated Investment Company Modernization Act of 2010 (the “Act”) was enacted on December 22, 2010. The Act made changes to several tax rules impacting the Funds. The provisions of the Act were effective for the Funds’ fiscal year ending December 31, 2012. Although the Act provides several benefits, including the unlimited carryover of future capital losses, there may be a greater likelihood that all or a portion of each Fund’s pre-enactment capital loss carryovers may expire without being utilized due to the fact that post-enactment capital losses must be utilized before pre-enactment capital loss carryovers may be utilized. Under the Act, new capital losses may now be carried forward indefinitely, and retain the character of the original loss as compared with pre-enactment law, where capital losses could be carried forward for up to eight years, and carried forward as short-term capital losses, irrespective of the character of the original loss. |
| (b) | Future utilization is limited under current tax law. |
During the year ended December 31, 2014, the following Funds utilized capital loss carryforwards and had capital loss carryforwards expire:
| | | | | | | | |
| Fund | | Utilized
Amount | | | Expired Amount | |
Money Market Fund | | $ | — | | | $ | 921 | |
Real Strategies Fund | | | 3,771,959 | | | | — | |
Situs Fund | | | 550,102 | | | | — | |
Certain capital and qualified late year losses incurred after October 31 and within the current taxable year are deemed to arise on the first business day of the Funds’ following taxable year. For the tax year ended December 31, 2014, the Funds deferred post October capital and late year ordinary losses as follows:
| | | | | | | | |
| Fund | | Capital
Losses | | | Late Year
Ordinary
Losses | |
U.S. Treasury Money Market Fund | | $ | 3,401 | | | $ | — | |
Balanced Allocation Fund | | | 303,120 | | | | — | |
Conservative Allocation Fund | | | 107,473 | | | | | |
Growth Allocation Fund | | | 117,619 | | | | — | |
Management of the Funds has reviewed tax positions taken in tax years that remain subject to examination by all major tax jurisdictions, including federal (i.e., the last three tax year ends and the interim tax period since then). Management believes there is no tax liability resulting from unrecognized tax benefits related to uncertain tax positions taken.
| (3) | Investment Advisory Fee and Other Transactions with Affiliates |
Investment Advisory Fee—Huntington Asset Advisors, Inc. (the “Advisor”), a subsidiary of The Huntington National Bank (“Huntington”), serves as the Funds’ investment adviser. The Advisor receives a fee for its services, computed daily and paid monthly, based on a percentage of each Fund’s average daily net assets on a tiered basis, according to the table below:
| | | | | | | | | | | | |
| | | Tiered Annual Rate: | |
| Fund | | Up to $500 million | | | On the next $500 million | | | In Excess of $1 billion | |
Money Market Fund | | | 0.30 | % | | | 0.25 | % | | | 0.20 | % |
Dividend Capture Fund | | | 0.75 | % | | | 0.70 | % | | | 0.65 | % |
Global Select Markets Fund | | | 1.00 | % | | | 0.95 | % | | | 0.90 | % |
Real Strategies Fund | | | 0.75 | % | | | 0.70 | % | | | 0.65 | % |
Situs Fund | | | 0.75 | % | | | 0.70 | % | | | 0.65 | % |
Annual Shareholder Report
64
The U.S. Treasury Money Market Fund pays the Advisor a fee of 0.20% of its average daily net assets, computed daily and paid monthly. Each of Balanced Allocation Fund, Conservative Allocation Fund and Growth Allocation Fund pays the Advisor a fee of 0.10% of its average daily net assets, computed daily and paid monthly.
Huntington and the Advisor may also pay out of their reasonable profits and other resources (including those of their affiliates) advertising, marketing, and other expenses for the benefit of the Funds.
The Money Market Fund and U.S. Treasury Money Market Fund are subject to a fee waiver and expense
reimbursement agreement with the Advisor whereby the Advisor has agreed to waive fees or reimburse expenses in amounts necessary to maintain a minimum yield of 0.01% for the Money Market Fund and the U.S. Treasury Money Market Fund. The Money Market Funds have agreed to repay amounts that were waived or reimbursed by the Advisor for a period up to three years after such waiver or reimbursement was made to the extent that such repayments would not cause the yield of the Money Market Funds to decrease below their applicable minimum yield.
The Advisor has agreed to contractually waive all or a portion of its investment advisory fee for the following funds (based on average daily net assets) to which it is otherwise entitled to receive and/or to reimburse certain operating expenses in order to limit each Fund’s total annual fund expenses (after fee waivers, and/or expense reimbursements, and exclusive of acquired fund fees and expenses, brokerage costs, interest, taxes and dividends, and extraordinary expenses) (“Expense Cap”) to the following (prior to April 30, 2014, each Fund’s Expense Cap included the acquired fund fees and expenses):
| | | | | | | | | | | | | | | | | | | | |
| | | Expense Cap | |
| Fund | | Institutional Shares | | | Class A Shares | | | Class C Shares | | | Expense Cap Effective Date | | | Expense Cap Expiration Date | |
Dividend Capture Fund | | | 0.88 | % | | | 1.13 | % | | | 1.63 | % | | | April 30, 2014 | | | | April 30, 2016 | |
| | | 0.90 | % | | | 1.15 | % | | | 1.65 | % | | | December 13, 2013 | | | | April 30, 2016 | |
Global Select Markets Fund | | | 0.87 | % | | | 1.12 | % | | | — | | | | October 1, 2014 | | | | April 30, 2017 | |
| | | 1.81 | % | | | 2.06 | % | | | — | | | | April 30, 2014 | | | | April 30, 2015 | |
| | | 1.90 | % | | | 2.15 | % | | | — | | | | April 30, 2013 | | | | April 30, 2014 | |
Real Strategies Fund | | | 1.04 | % | | | 1.29 | % | | | — | | | | April 30, 2014 | | | | April 30, 2015 | |
| | | 1.10 | % | | | 1.35 | % | | | — | | | | December 13, 2013 | | | | April 30, 2015 | |
Situs Fund | | | 1.03 | % | | | 1.28 | % | | | 1.78 | % | | | December 13, 2013 | | | | April 30, 2015 | |
Balanced Allocation Fund | | | — | | | | 0.70 | % | | | — | | | | April 30, 2014 | | | | April 30, 2015 | |
| | | — | | | | 1.90 | % | | | — | | | | April 30, 2013 | | | | April 30, 2014 | |
Conservative Allocation Fund | | | — | | | | 0.70 | % | | | — | | | | April 30, 2014 | | | | April 30, 2015 | |
| | | — | | | | 1.90 | % | | | — | | | | April 30, 2013 | | | | April 30, 2014 | |
Growth Allocation Fund | | | — | | | | 0.65 | % | | | — | | | | April 30, 2014 | | | | April 30, 2015 | |
| | | | — | | | | 1.90 | % | | | — | | | | April 30, 2013 | | | | April 30, 2014 | |
Annual Shareholder Report
65
Notes to Financial Statements (Continued)
Amounts waived or reimbursed in the contractual period may be recouped by the Advisor within three years of the waiver and/or reimbursement. As of December 31, 2014, the following amounts have been waived or reimbursed by the Advisor and are subject to repayment by the respective Fund:
| | | | | | | | |
| Fund | | Amount
Waived or
Reimbursed | | | Expiring
Beginning
December 31, | |
Money Market Fund | | $ | 1,533,406 | | | | 2015 | |
| | | | 1,526,624 | | | | 2016 | |
| | | | 1,877,044 | | | | 2017 | |
U.S. Treasury Money Market Fund | | | 1,433,607 | | | | 2015 | |
| | | | 5,772,291 | | | | 2016 | |
| | | | 5,403,446 | | | | 2017 | |
Dividend Capture Fund | | | 254,226 | | | | 2015 | |
| | | | 1,004,031 | | | | 2016 | |
| | | | 1,313,835 | | | | 2017 | |
Global Select Markets Fund | | | 43,287 | | | | 2016 | |
| | | | 96,711 | | | | 2017 | |
Real Strategies Fund | | | 14,797 | | | | 2016 | |
| | | | 282,469 | | | | 2017 | |
Situs Fund | | | 73,283 | | | | 2016 | |
| | | | 1,097,463 | | | | 2017 | |
Balanced Allocation Fund | | | 42,051 | | | | 2015 | |
| | | | 37,483 | | | | 2016 | |
| | | | 48,026 | | | | 2017 | |
Conservative Allocation Fund | | | 15,187 | | | | 2015 | |
| | | | 27,965 | | | | 2016 | |
| | | | 38,093 | | | | 2017 | |
Growth Allocation Fund | | | 46,866 | | | | 2015 | |
| | | | 47,116 | | | | 2016 | |
| | | | 56,426 | | | | 2017 | |
Administrative and Financial Administration Fees—Huntington Asset Services, Inc. (“HASI”), a wholly owned subsidiary of Huntington Bancshares, Inc., serves as Administrator to the Trust. The fees paid for administrative services are based on the level of average net assets of each Fund for the period, subject to minimum fees in certain circumstances.
| | |
Maximum
Administrative Fee | | Average Daily Net Assets of the Trust |
0.1822% | | On the first $4 billion |
0.1650% | | On the next $2 billion |
0.1575% | | On the next $2 billion |
0.1450% | | On assets in excess of $8 billion |
There is no minimum annual fee per fund or class of shares.
Distribution and Shareholder Services Fees—The Funds have adopted a Distribution Plan (the “Plan”) pursuant to Rule 12b-1 under the 1940 Act. Under the terms of the Plan, the Funds will compensate qualified intermediaries for distribution services in connection with Class A Shares not to exceed 0.25% of the daily net assets of each Fund’s Class A Shares and not to exceed 1.00% of the daily net assets of each Fund’s Class C Shares. Institutional Shares are not subject to Rule 12b-1 fees. Class A Shares (except for the Asset Allocation Funds) and Institutional Shares are also subject to a shareholder services fee not to exceed 0.25% of the daily net assets of such shares. For the year ended December 31, 2014, Huntington and its affiliates received $354,665 in 12b-1 fees from the Funds. For the year ended December 31, 2014, Huntington and its affiliates received $1,451,096 in shareholder service fees from the Funds. For the year ended December 31, 2014, Unified Financial Securities, Inc. (the “Distributor”) received commissions of $658,654 earned on sales of Class A Shares of the Funds. For the year ended December 31, 2014, the Distributor paid out commissions earned on Class A Shares on behalf of the Funds of $65,205 to affiliated broker-dealers of the Funds. For the year ended December 31, 2014, the Distributor voluntarily waived 12b-1 and shareholder servicing fees of $361,856 and $885,376 from the Money Market Fund and $234,424 and $3,002,198 from the U.S. Treasury Money Market Fund.
Transfer and Dividend Disbursing Agent Fees and Expense—HASI is the transfer and dividend disbursing agent for the Funds. For its services, HASI receives a yearly fixed amount per shareholder account, subject to a yearly minimum fee of $12,000 for each of the Funds. HASI is also entitled to receive additional amounts that may be activity or time-based charges, plus reimbursement for out-of-pocket expenses.
Custodian Fees—Huntington serves as custodian for each of the Funds. Brown Brothers Harriman serves as sub-custodian for each Fund’s foreign assets. Huntington and Brown Brothers Harriman receive fees based on the level of each Fund’s average daily net assets for the period, plus out-of-pocket expenses.
General—Certain officers of the Trust are officers, directors and/or trustees of the Distributor.
Each Trustee who is not an “interested person” of the Trust, as such term is defined in the 1940 Act, receives a $25,000 annual retainer plus $2,500 per regular Board meeting. The Audit Committee Chairman receives $33,000 annual retainer plus $2,500 per regular Board meeting. The Independent Chairman of the Board receives a $50,000 annual retainer plus $2,500 per regular Board meeting. The Board or a committee may establish ad hoc committees or sub-committees. Any committee or sub-committee member may be compensated by the Funds for incremental work outside of the regular meeting process based on the value added
Annual Shareholder Report
66
to the Funds. In addition, the Funds reimburse Trustees for out-of-pocket expenses incurred in conjunction with attendance at meetings. For the year ended
December 31, 2014, actual Trustee compensation was $299,000 in aggregate from the Trust.
Affiliated Funds—Pursuant to an exemptive order issued by the Securities and Exchange Commission, the Funds may invest in certain affiliated money market funds which are managed by the Advisor. Income distributions earned from investments in these funds are recorded as income from affiliates in the accompanying financial statements. A summary of each Fund’s investment in such affiliated money market funds is set forth below:
| | | | | | | | | | | | | | | | | | | | |
| Money Market Fund | | 12/31/2013
Market Value | | | Purchases | | | Sales | | | 12/31/2014
Market Value | | | Income | |
Dividend Capture Fund | | $ | — | | | $ | 27,925,119 | | | $ | (18,820,718 | ) | | $ | 9,104,401 | | | $ | 426 | |
Global Select Markets Fund | | | — | | | | 4,813,831 | | | | (4,806,243 | ) | | | 7,588 | | | | 164 | |
Real Strategies Fund | | | — | | | | 9,179,789 | | | | (6,608,051 | ) | | | 2,571,738 | | | | 95 | |
Situs Fund | | | — | | | | 21,029,721 | | | | (21,029,721 | ) | | | — | | | | 150 | |
| | | | | | | | | | | | | | | | | | | | |
| U.S. Treasury Money Market Fund | | 12/31/2013
Market Value | | | Purchases | | | Sales | | | 12/31/2014
Market Value | | | Income | |
Dividend Capture Fund | | $ | 3,933,704 | | | $ | 106,444,718 | | | $ | (110,378,422 | ) | | $ | — | | | $ | 1,318 | |
Global Select Markets Fund | | | 772,081 | | | | 26,757,672 | | | | (27,529,753 | ) | | | — | | | | 208 | |
Real Strategies Fund | | | 3,182,304 | | | | 51,718,886 | | | | (54,901,190 | ) | | | — | | | | 396 | |
Situs Fund | | | 18,125,529 | | | | 118,912,611 | | | | (137,038,140 | ) | | | — | | | | 964 | |
Additionally, Balanced Allocation Fund, Conservative Allocation Fund and Growth Allocation Fund invest in other Funds within the Trust. A summary of these investments in affiliated funds is set forth below:
| | | | | | | | | | | | | | | | | | | | |
| Balanced Allocation Fund | | 12/31/2013
Market Value | | | Purchases | | | Sales | | | 12/31/2014
Market Value | | | Income | |
U.S. Treasury Money Market Fund | | $ | 386,673 | | | $ | 3,798,920 | | | $ | (4,185,593 | ) | | $ | — | | | $ | 113 | |
Money Market Fund | | | — | | | | 5,051,744 | | | | (377,793 | ) | | | 4,673,951 | | | | 58 | |
Huntington Disciplined Equity Fund | | | 1,237,631 | | | | 709,595 | | | | (1,871,385 | ) | | | — | | | | 64,888 | |
Dividend Capture Fund | | | 2,595,303 | | | | 441,542 | | | | (1,177,329 | ) | | | 2,000,680 | | | | 92,598 | |
Global Select Markets Fund | | | 824,455 | | | | 535,677 | | | | (376,746 | ) | | | 3,156,426 | | | | — | |
Huntington International Equity Fund | | | 2,402,533 | | | | 1,445,230 | | | | (1,540,392 | ) | | | — | | | | 24,965 | |
Situs Fund | | | 1,688,698 | | | | 1,019,287 | | | | (916,325 | ) | | | 1,777,421 | | | | 1,051 | |
Huntington World Income Fund | | | — | | | | 3,713,349 | | | | (3,364,564 | ) | | | — | | | | 118,079 | |
Huntington Fixed Income Securities Fund | | | 3,436,730 | | | | 396,092 | | | | (3,909,327 | ) | | | — | | | | 30,206 | |
Huntington Intermediate Government Income Fund | | | 1,604,908 | | | | 156,777 | | | | (1,777,697 | ) | | | — | | | | 13,719 | |
Huntington Mortgage Securities Fund | | | 914,614 | | | | 107,604 | | | | (1,037,488 | ) | | | — | | | | 8,358 | |
Huntington Short/Intermediate Fixed Income Securities Fund | | | 1,605,605 | | | | 137,613 | | | | (1,756,366 | ) | | | — | | | | 4,813 | |
Huntington EcoLogical Strategy ETF | | | 2,287,036 | | | | 597,742 | | | | (367,845 | ) | | | 2,661,872 | | | | 34,367 | |
Huntington US Equity Rotation Strategy ETF | | | 2,036,957 | | | | 520,149 | | | | (304,441 | ) | | | 2,434,297 | | | | 119,307 | |
| | | | | | | | | | | | | | | | | | | | |
| Conservative Allocation Fund | | 12/31/2013
Market Value | | | Purchases | | | Sales | | | 12/31/2014
Market Value | | | Income | |
U.S. Treasury Money Market Fund | | $ | 53,198 | | | $ | 1,345,968 | | | $ | (1,399,166 | ) | | $ | — | | | $ | 21 | |
Money Market Fund | | | — | | | | 1,361,352 | | | | (460,829 | ) | | | 900,523 | | | | 11 | |
Huntington Disciplined Equity Fund | | | 76,681 | | | | 46,582 | | | | (118,896 | ) | | | — | | | | 3,805 | |
Dividend Capture Fund | | | 160,963 | | | | 104,671 | | | | (74,203 | ) | | | 199,748 | | | | 5,808 | |
Global Select Markets Fund | | | 51,248 | | | | 127,980 | | | | (37,670 | ) | | | 327,409 | | | | — | |
Huntington International Equity Fund | | | 149,241 | | | | 180,682 | | | | (130,360 | ) | | | — | | | | 2,184 | |
Situs Fund | | | 104,926 | | | | 143,281 | | | | (97,686 | ) | | | 149,728 | | | | 89 | |
Huntington World Income Fund | | | — | | | | 1,350,338 | | | | (1,228,087 | ) | | | — | | | | 41,037 | |
Huntington Fixed Income Securities Fund | | | 1,269,000 | | | | 92,487 | | | | (1,389,015 | ) | | | — | | | | 10,823 | |
Huntington Intermediate Government Income Fund | | | 592,070 | | | | 33,985 | | | | (631,767 | ) | | | — | | | | 4,946 | |
Huntington Mortgage Securities Fund | | | 337,796 | | | | 23,384 | | | | (366,690 | ) | | | — | | | | 3,004 | |
Huntington Short/Intermediate Fixed Income Securities Fund | | | 592,330 | | | | 29,545 | | | | (626,603 | ) | | | — | | | | 1,815 | |
Huntington EcoLogical Strategy ETF | | | 141,563 | | | | 54,622 | | | | (45,475 | ) | | | 158,775 | | | | 2,050 | |
Huntington US Equity Rotation Strategy ETF | | | 126,475 | | | | 46,185 | | | | (41,581 | ) | | | 141,091 | | | | 6,915 | |
Annual Shareholder Report
67
Notes to Financial Statements (Continued)
| | | | | | | | | | | | | | | | | | | | |
| Growth Allocation Fund | | 12/31/2013
Market Value | | | Purchases | | | Sales | | | 12/31/2014
Market Value | | | Income | |
U.S. Treasury Money Market Fund | | $ | 269,842 | | | $ | 3,446,017 | | | $ | (3,715,859 | ) | | $ | — | | | $ | 79 | |
Money Market Fund | | | — | | | | 2,378,193 | | | | (767,227 | ) | | | 1,610,966 | | | | 24 | |
Disciplined Equity Fund | | | 1,166,308 | | | | 1,061,236 | | | | (2,137,318 | ) | | | — | | | | 74,913 | |
Dividend Capture Fund | | | 2,446,220 | | | | 420,542 | | | | (1,078,384 | ) | | | 1,922,613 | | | | 88,527 | |
Global Select Markets Fund | | | 777,105 | | | | 391,119 | | | | (312,568 | ) | | | 2,938,023 | | | | — | |
Huntington International Equity Fund | | | 2,265,497 | | | | 1,325,355 | | | | (1,381,421 | ) | | | — | | | | 23,883 | |
Situs Fund | | | 1,594,037 | | | | 1,133,412 | | | | (1,069,829 | ) | | | 1,637,931 | | | | 1,020 | |
Huntington World Income Fund | | | — | | | | 622,545 | | | | (572,525 | ) | | | 514,998 | | | | 17,912 | |
Huntington Fixed Income Securities Fund | | | 1,090,148 | | | | 143,029 | | | | (1,257,625 | ) | | | — | | | | 9,553 | |
Huntington Intermediate Government Income Fund | | | 507,631 | | | | 58,498 | | | | (571,292 | ) | | | — | | | | 4,355 | |
Huntington Mortgage Securities Fund | | | 290,097 | | | | 39,281 | | | | (334,285 | ) | | | — | | | | 2,667 | |
Huntington Short/Intermediate Fixed Income Securities Fund | | | 507,853 | | | | 52,430 | | | | (564,500 | ) | | | — | | | | 1,597 | |
Huntington EcoLogical Strategy ETF | | | 2,156,159 | | | | 326,440 | | | | (369,372 | ) | | | 2,245,918 | | | | 28,997 | |
Huntington US Equity Rotation Strategy ETF | | | 1,919,551 | | | | 287,573 | | | | (330,094 | ) | | | 2,045,518 | | | | 100,252 | |
Affiliated issuers, as defined under the Investment Company Act of 1940, are those in which a Fund’s holdings of an issuer represent 5% or more of the outstanding voting securities of the issuer. A summary of the Real Strategies Fund’s investment in New York Power DST, representing approximately 8.26% of the issuer, is set forth below:
| | | | | | | | | | | | | | | | | | | | | | | | |
| | | 12/31/2013
Fair Value | | | Change in
Unrealized
Appreciation
(Depreciation) | | | Purchases | | | Sales | | | 12/31/2014
Fair Value | | | Income | |
New York Power DST | | $ | 1,098,500 | | | $ | (272,018 | ) | | $ | — | | | $ | — | | | $ | 826,482 | | | $ | 71,823 | |
| (5) | Balanced Allocation Fund, Conservative Allocation Fund and Growth Allocation Fund Structure |
Balanced Allocation Fund, Conservative Allocation Fund and Growth Allocation Fund (“Investing Funds”), in accordance with their prospectus, seek to achieve their investment objectives by investing in other investment companies (“Underlying Funds”) with similar investment objectives. As a result, investors in the Investing Funds incur expenses of both the Investing Funds and Underlying Funds, including transaction costs related to the purchases and sales of Underlying Fund shares.
| (6) | Investment Transactions |
Purchases and sales of investments, excluding short-term securities, for the year ended December 31, 2014, were as follows:
| | | | | | | | |
| Fund | | Purchases | | | Sales | |
Dividend Capture Fund | | $ | 241,352,116 | | | $ | 405,392,773 | |
Global Select Markets Fund | | | 15,690,978 | | | | 41,167,449 | |
Real Strategies Fund | | | 17,914,973 | | | | 74,776,461 | |
Situs Fund | | | 39,173,173 | | | | 227,118,222 | |
Balanced Allocation Fund | | | 10,551,923 | | | | 12,533,040 | |
Conservative Allocation Fund | | | 3,013,473 | | | | 4,132,771 | |
Growth Allocation Fund | | | 6,436,191 | | | | 6,704,555 | |
There were no purchases or sales of long-term U.S. government obligations during the year ended December 31, 2014.
| (7) | Foreign Investment Risk |
Compared with investing in the United States, investing in foreign markets involves a greater degree and variety of risk. Investors in international or foreign markets may face delayed settlements, currency controls and adverse economic developments as well as higher overall transaction costs. In addition, fluctuations in the U.S. dollar’s value versus other currencies may erode or reverse gains from investments denominated in foreign currencies or widen losses. Foreign governments may expropriate assets, impose capital or currency controls, impose punitive taxes, impose limits on ownership or nationalize a company or industry. Any of these actions could have severe effect on security prices and impair the Fund’s ability to bring its capital or income back to the U.S. Exchange rate. Fluctuations also may impair an issuer’s ability to repay U.S. dollar denominated debt, thereby increasing credit risk of such debt. Finally, the value of foreign securities may be affected by incomplete, less frequent, or inaccurate financial information about their issuers, social upheavals or political actions ranging from tax code changes to government collapse. Foreign companies may also receive less coverage than U.S. companies by market analysts, and financial reporting standards or regulatory requirements may not be comparable to those applicable to U.S. companies.
Annual Shareholder Report
68
The Trust participates in a short-term credit agreement (“Line of Credit”) with Huntington. Prior to December 18, 2014, the Trust’s short-term credit agreement was with Citibank, N.A. Under the terms of the agreement, the Funds may borrow up to $30 million at an interest rate of LIBOR plus 135 basis points. The purpose of the agreement is to meet temporary or emergency cash needs, including redemption requests that might otherwise require the untimely disposition of securities. Huntington receives an annual facility fee of 0.125% on $30 million as well as an additional annual fee of 0.125% on any unused portion of the credit facility for providing the Line of Credit. Each Fund in the Trust pays a pro-rata portion of this facility fee, and unused fee, plus any interest on amounts borrowed. For the year ended December 31, 2014, the following Funds had borrowings under this Line of Credit or the previous agreement with Citibank, N.A.
| | | | | | | | | | | | | | | | | | | | |
| Fund | | Average
Loan Balance | | | Weighted
Average
Interest Rate | | | Number of
Days
Outstanding(a) | | | Interest
Expense
Incurred | | | Maximum
Loan
Outstanding | |
Money Market Fund | | $ | 6,210,000 | | | | 1.41 | % | | | 5 | | | $ | 1,216 | | | $ | 10,000,000 | |
U.S. Treasury Money Market Fund | | | 9,676,069 | | | | 1.51 | % | | | 4 | | | | 2 | | | | 12,884,779 | |
Dividend Capture Fund | | | 4,000,000 | | | | 1.41 | % | | | 1 | | | | 157 | | | | 4,000,000 | |
Global Select Markets Fund | | | 1,277,176 | | | | 1.44 | % | | | 13 | | | | 401 | | | | 3,101,027 | |
Real Strategies Fund | | | 1,100,000 | | | | 1.41 | % | | | 10 | | | | 430 | | | | 2,000,000 | |
Situs Fund | | | 2,697,120 | | | | 1.41 | % | | | 70 | | | | 7,055 | | | | 9,590,322 | |
Balanced Allocation Fund | | | 3,688,679 | | | | 1.41 | % | | | 1 | | | | 144 | | | | 3,688,679 | |
Conservative Allocation Fund | | | 1,311,321 | | | | 1.41 | % | | | 1 | | | | 51 | | | | 1,311,321 | |
Growth Allocation Fund | | | 296,029 | | | | 1.51 | % | | | 1 | | | | — | | | | 296,029 | |
| (a) | Number of Days Outstanding represents the total days during the year ended December 31, 2014 that each Fund utilized the Line of Credit. |
As of December 31, 2014, the Global Select Markets Fund had $3,101,027 and the Situs Fund had $906,701 in outstanding borrowings at an interest rate of 1.51% under this Line of Credit.
At a meeting of the Board of Trustees of the Trust held on October 30, 2014, the Trustees considered and approved the recommendation of the Advisor to dissolve and liquidate the Conservative Allocation Fund and Growth Allocation Fund on or about the close of business on March 6, 2015, pursuant to Plans of Liquidation.
| (10) | Other Tax Information (unaudited) |
For the year ended December 31, 2014, certain dividends paid by the Funds may be subject to a maximum tax rate of 15% as provided by the Jobs and Growth Tax Relief Reconciliation Act of 2003. The Funds intend to designate the maximum amount allowable as taxed at a maximum rate of 15%. Complete information will be reported in conjunction with your 2014 Form 1099-DIV.
For the year ended December 31, 2014, the following Funds paid qualified dividend income:
| | | | |
| Fund | | Qualified
Dividend
Income | |
Dividend Capture Fund | | | 33.6 | % |
Real Strategies Fund | | | 57.6 | % |
Situs Fund | | | 72.8 | % |
Balanced Allocation Fund | | | 51.8 | % |
Conservative Allocation Fund | | | 27.0 | % |
Growth Allocation Fund | | | 58.0 | % |
Annual Shareholder Report
69
Notes to Financial Statements (Continued)
For the taxable year ended December 31, 2014, the following percentage of ordinary income dividends paid by the Funds qualify for the dividends received deduction available to corporations:
| | | | |
| Fund | | Dividends
Received
Deduction | |
Dividend Capture Fund | | | 41.3 | % |
Real Strategies Fund | | | 54.9 | % |
Situs Fund | | | 69.8 | % |
Balanced Allocation Fund | | | 42.9 | % |
Conservative Allocation Fund | | | 18.1 | % |
Growth Allocation Fund | | | 51.1 | % |
The Funds designate the following amounts as long-term capital gains distributions. The amounts designated may not agree with long term capital gains in the tax character of distribution table due to utilization of earnings and profits distributed to shareholders on redemption of shares.
| | | | |
| Fund | | Long-Term
Capital Gains
Paid Amount | |
Dividend Capture Fund | | $ | 24,320,444 | |
Global Select Market Fund | | | 1,172,067 | |
Situs Fund | | | 87,111,278 | |
Balanced Allocation Fund | | | 648,944 | |
Conservative Allocation Fund | | | 119,725 | |
Growth Allocation Fund | | | 459,339 | |
The Funds designated the following amounts as short term capital gain distributions:
| | | | |
| Fund | | Short-Term
Capital Gains
Paid Amount | |
U.S. Treasury Money Market Fund | | $ | 16,975 | |
Dividend Capture Fund | | | 12,596,945 | |
Situs Fund | | | 1,141,393 | |
Balanced Allocation Fund | | | 80,294 | |
Conservative Allocation Fund | | | 18,176 | |
Growth Allocation Fund | | | 79,076 | |
Annual Shareholder Report
70
Report of Independent Registered Public Accounting Firm
The Board of Trustees and Shareholders of the Huntington Funds:
We have audited the accompanying statements of assets and liabilities of the Huntington Money Market Fund, Huntington U.S. Treasury Money Market Fund, Huntington Dividend Capture Fund, Huntington Global Select Markets Fund, Huntington Real Strategies Fund, Huntington Situs Fund, Huntington Balanced Allocation Fund, Huntington Conservative Allocation Fund, and Huntington Growth Allocation Fund (nine of the portfolios constituting The Huntington Funds, collectively referred to as the “Funds”), including the portfolios of investments, as of December 31, 2014 and the related statements of operations for the year then ended, the statements of changes in net assets for each of the two years in the period then ended, and the financial highlights for each of the periods indicated therein. These financial statements and financial highlights are the responsibility of the Funds’ management. Our responsibility is to express an opinion on these financial statements and financial highlights based on our audits.
We conducted our audits in accordance with the standards of the Public Company Accounting Oversight Board (United States). Those standards require that we plan and perform the audits to obtain reasonable assurance about whether the financial statements and financial highlights are free of material misstatement. We were not engaged to perform an audit of the Funds’ internal control over financial reporting. Our audits included consideration of internal control over financial reporting as a basis for designing audit procedures that are appropriate in the circumstances, but not for the purpose of expressing an opinion on the effectiveness of the Funds’ internal control over financial reporting. Accordingly, we express no such opinion. An audit also includes examining, on a test basis, evidence supporting the amounts and disclosures in the financial statements and financial highlights, assessing the accounting principles used and significant estimates made by management, and evaluating the overall financial statement presentation. Our procedures included confirmation of securities owned as of December 31, 2014, by correspondence with the custodians and brokers. We believe that our audits provide a reasonable basis for our opinion.
In our opinion, the financial statements and financial highlights referred to above present fairly, in all material respects, the financial position of each of the Huntington Funds referred to above at December 31, 2014, the results of their operations for the year then ended, the changes in their net assets for each of two years in the period then ended, and financial highlights for each of the periods indicated therein, in conformity with U.S. generally accepted accounting principles.

Columbus, Ohio
February 26, 2015
Annual Shareholder Report
71
Supplemental Information (Unaudited)
Shareholder Expense Examples
Fund Expenses— As a shareholder of a Fund, you incur two types of costs: (1) transaction costs, which may include sales charges (loads) on purchase payments, contingent deferred sales charges on redemptions; and (2) ongoing costs, including management fees, distribution and service fees; and other Fund expenses. These examples are intended to help you understand your ongoing costs (in dollars) of investing in the Fund and to compare these costs with the ongoing costs of investing in other mutual funds.
This example is based on an investment of $1,000 invested at the beginning of the period and held for the entire six-month period July 1, 2014 to December 31, 2014.
Actual Expenses—The “Actual” lines of the table provide information about actual account values and actual expenses. You may use the information on this line for the class of shares you hold, together with the amount you invested, to estimate the expenses that you paid over the period. Simply divide your account value by $1,000.00 (for example, an $8,600.00 account value divided by $1,000.00 = 8.60), then multiply the result by the number
in the “Actual” line under the heading entitled “Expenses Paid During Period” to estimate the expenses you paid on your account during this period.
Hypothetical Example for Comparison Purposes—The “Hypothetical” lines of the table provide information about hypothetical account values and hypothetical expenses based on the Fund’s actual expense ratios for each class of shares and an assumed rate of return of 5% per year before expenses, which are not the Fund’s actual returns. The hypothetical account values and expenses may not be used to estimate the actual ending account balance or expenses you paid for the period. You may use this information to compare the ongoing costs of investing in the Fund and other funds. To do so, compare the 5% hypothetical examples with the 5% hypothetical examples that appear in the shareholder reports of other funds.
Please note that the expenses shown in the table are meant to highlight your ongoing costs only and do not reflect any transactional costs. Therefore, the “Actual” and “Hypothetical” lines of the table are useful in comparing ongoing costs only, and will not help you determine the relative total costs of owning different funds. In addition, if these transactional costs were included, your costs would have been higher.
| | | | | | | | | | | | | | | | | | |
| | | | | Beginning
Account
Value,
July 1, 2014 | | | Ending
Account Value,
December 31, 2014 | | | Expenses
Paid
During
Period(a) | | | Annualized
Expense
Ratio | |
Money Market Fund | | | | | | | | | | | | | | | | | | |
Institutional Shares | | Actual | | $ | 1,000.00 | | | $ | 1,000.10 | | | $ | 0.40 | | | | 0.08 | % |
| | | Hypothetical (b) | | $ | 1,000.00 | | | $ | 1,024.80 | | | $ | 0.41 | | | | 0.08 | % |
Class A Shares | | Actual | | $ | 1,000.00 | | | $ | 1,000.10 | | | $ | 0.40 | | | | 0.08 | % |
| | | Hypothetical (b) | | $ | 1,000.00 | | | $ | 1,024.80 | | | $ | 0.41 | | | | 0.08 | % |
U.S. Treasury Money Market Fund | | | | | | | | | | | | | | | | | | |
Institutional Shares | | Actual | | $ | 1,000.00 | | | $ | 1,000.20 | | | $ | 0.15 | | | | 0.03 | % |
| | | Hypothetical (b) | | $ | 1,000.00 | | | $ | 1,025.05 | | | $ | 0.15 | | | | 0.03 | % |
Class A Shares | | Actual | | $ | 1,000.00 | | | $ | 1,000.00 | | | $ | 0.30 | | | | 0.06 | % |
| | | Hypothetical (b) | | $ | 1,000.00 | | | $ | 1,024.90 | | | $ | 0.31 | | | | 0.06 | % |
Dividend Capture Fund | | | | | | | | | | | | | | | | | | |
Institutional Shares | | Actual | | $ | 1,000.00 | | | $ | 1,010.60 | | | $ | 4.46 | | | | 0.88 | % |
| | | Hypothetical (b) | | $ | 1,000.00 | | | $ | 1,020.77 | | | $ | 4.48 | | | | 0.88 | % |
Class A Shares | | Actual | | $ | 1,000.00 | | | $ | 1,010.40 | | | $ | 5.73 | | | | 1.13 | % |
| | | Hypothetical (b) | | $ | 1,000.00 | | | $ | 1,019.51 | | | $ | 5.75 | | | | 1.13 | % |
Class C Shares | | Actual | | $ | 1,000.00 | | | $ | 1,008.40 | | | $ | 8.25 | | | | 1.63 | % |
| | | Hypothetical (b) | | $ | 1,000.00 | | | $ | 1,016.99 | | | $ | 8.29 | | | | 1.63 | % |
Global Select Markets Fund | | | | | | | | | | | | | | | | | | |
Institutional Shares | | Actual | | $ | 1,000.00 | | | $ | 958.70 | | | $ | 6.91 | | | | 1.40 | % |
| | | Hypothetical (b) | | $ | 1,000.00 | | | $ | 1,018.15 | | | $ | 7.12 | | | | 1.40 | % |
Class A Shares | | Actual | | $ | 1,000.00 | | | $ | 957.70 | | | $ | 8.14 | | | | 1.65 | % |
| | | Hypothetical (b) | | $ | 1,000.00 | | | $ | 1,016.89 | | | $ | 8.39 | | | | 1.65 | % |
Annual Shareholder Report
72
| | | | | | | | | | | | | | | | | | |
| | | | | Beginning
Account
Value,
July 1, 2014 | | | Ending
Account Value,
December 31, 2014 | | | Expenses
Paid
During
Period(a) | | | Annualized
Expense
Ratio | |
Real Strategies Fund | | | | | | | | | | | | | | | | | | |
Institutional Shares | | Actual | | $ | 1,000.00 | | | $ | 774.70 | | | $ | 4.65 | | | | 1.04 | % |
| | | Hypothetical (b) | | $ | 1,000.00 | | | $ | 1,019.96 | | | $ | 5.30 | | | | 1.04 | % |
Class A Shares | | Actual | | $ | 1,000.00 | | | $ | 773.70 | | | $ | 5.77 | | | | 1.29 | % |
| | | Hypothetical (b) | | $ | 1,000.00 | | | $ | 1,018.70 | | | $ | 6.56 | | | | 1.29 | % |
Situs Fund | | | | | | | | | | | | | | | | | | |
Institutional Shares | | Actual | | $ | 1,000.00 | | | $ | 963.50 | | | $ | 5.15 | | | | 1.04 | % |
| | | Hypothetical (b) | | $ | 1,000.00 | | | $ | 1,019.96 | | | $ | 5.30 | | | | 1.04 | % |
Class A Shares | | Actual | | $ | 1,000.00 | | | $ | 962.80 | | | $ | 6.38 | | | | 1.29 | % |
| | | Hypothetical (b) | | $ | 1,000.00 | | | $ | 1,018.70 | | | $ | 6.56 | | | | 1.29 | % |
Class C Shares | | Actual | | $ | 1,000.00 | | | $ | 959.80 | | | $ | 8.84 | | | | 1.79 | % |
| | | Hypothetical (b) | | $ | 1,000.00 | | | $ | 1,016.18 | | | $ | 9.10 | | | | 1.79 | % |
Balanced Allocation Fund | | | | | | | | | | | | | | | | | | |
Class A Shares | | Actual | | $ | 1,000.00 | | | $ | 989.60 | | | $ | 3.51 | | | | 0.70 | % |
| | | Hypothetical (b) | | $ | 1,000.00 | | | $ | 1,021.68 | | | $ | 3.57 | | | | 0.70 | % |
Conservative Allocation Fund | | | | | | | | | | | | | | | | | | |
Class A Shares | | Actual | | $ | 1,000.00 | | | $ | 969.40 | | | $ | 3.47 | | | | 0.70 | % |
| | | Hypothetical (b) | | $ | 1,000.00 | | | $ | 1,021.68 | | | $ | 3.57 | | | | 0.70 | % |
Growth Allocation Fund | | | | | | | | | | | | | | | | | | |
Class A Shares | | Actual | | $ | 1,000.00 | | | $ | 999.30 | | | $ | 3.28 | | | | 0.65 | % |
| | | Hypothetical (b) | | $ | 1,000.00 | | | $ | 1,021.93 | | | $ | 3.31 | | | | 0.65 | % |
| (a) | Expenses are equal to the Fund’s annualized expense ratios, multiplied by the average account value over the period, multiplied by 184/365 (to reflect the one-half year period). The annualized expense ratios reflect reimbursement of expenses by the Fund’s Advisor for the period beginning July 1, 2014 to December 31, 2014. The “Financial Highlights” tables in the Fund’s financial statements, included in the report, also show the gross expense ratios, without such reimbursements. |
| (b) | Hypothetical assumes 5% annual return before expenses. |
Annual Shareholder Report
73
Board of Trustees and Trust Officers (Unaudited)
Independent Trustees Background
| | |
Name Age Positions Held with Trust Date Service Began with
Huntington Complex | | Principal Occupation(s) During Past Five Years, Previous Position(s) and Other Directorships Held |
Thomas J. Westerfield Age: 59 CHAIRMAN OF THE BOARD and TRUSTEE Began Serving: January 2001 and Chairman since February 2013 | | Principal Occupation(s): Chairman of the Board and Of Counsel, Dinsmore & Shohl LLP (law firm) (August 2005 to present). Previous Position(s): Of Counsel, Cors & Bassett LLC (law firm) (1993-2005). Other Directorships Held: Board Member, Huntington Strategy Shares. |
Mark D. Shary Age: 54 TRUSTEE Began Serving: November 2010 | | Principal Occupation(s): Managing Director, ET Partner (consulting) (2008 to present); Private investor (2007 to present). Previous Position(s): Chief Executive Officer and President, BestTransport.com, Inc. (2003 to 2007); President, Bostech Corporation (2000 to 2002). Other Directorships Held: Board Member, Huntington Strategy Shares; Director, SafeWhite, hc1.com, Updox, MBA Focus, InnerApps, and Vantage Point Logistics (all private companies); Trustee, TechColumbus (non-profit); Director, Healthcare.com (1998-2000) (public company). |
William H. Zimmer, III Age: 61 TRUSTEE Began Serving: December 2006 | | Principal Occupation(s): Chief Executive Officer, Cintel Federal Credit Union, (January 2011 to present); Consultant, WHZIII, LLC (January 2014 to present). Previous Position(s): Consultant, WHZIII, LLC (March 2009 to January 2011); Assistant Treasurer, Dana Holding Corp. (September 2006 to February 2009) (manufacturing); Vice President and Manager, Global Treasury Management, National City Bank (January 2004 to March 2006); Vice President, Treasury Management Operations, Provident Bank (June 2003 to January 2004); Financial Consultant (April 2001 to June 2003). Other Directorships Held: Board Member, Huntington Strategy Shares. |
Officers(a)
| | |
Name Age Positions Held with Trust Address Date Service Began with
Huntington Complex | | Principal Occupation(s) and Previous Position(s) |
Joseph L. Rezabek Age: 45 PRESIDENT 37 West Broad Street Columbus, OH 43215 Began Serving: February 2013 | | Principal Occupation(s): President, Huntington Asset Services, Inc. (“HASI”) (March 2012 to present); President, Huntington Strategy Shares (February 2013 to present). Previous Position(s): Managing Director and Head of Fund Services, Citi (2006 to 2012); Chief Operating Officer (Milan, Italy), State Street Corporation (1999 to 2006). |
R. Jeffrey Young Age: 50 CHIEF EXECUTIVE OFFICER 37 West Broad Street Columbus, OH 43215 Began Serving: February 2010 | | Principal Occupation(s): Senior Vice President, HASI (January 2010 to present); Chief Executive Officer, Huntington Strategy Shares (November 2010 to present); Chairman of the Board, Valued Advisers Trust (June 2010 to present); Chief Executive Officer and President, Valued Advisers Trust (January 2010 to present); Chairman of the Board, Capitol Series Trust (September 2013 to present). Previous Position(s): President and Chief Executive Officer, Dreman Contrarian Funds (March 2011 to February 2013); Independent Chair, Valued Advisers Trust (August 2008 to January 2010); Managing Director, WealthStone (2007 to 2009); Senior Vice President, Operations, BISYS Fund Services (2006 to 2007); Senior Vice President/Vice President, Client Services, BISYS Fund Services (1994 to 2006). |
Annual Shareholder Report
74
| | |
Name Age Positions Held with Trust Address Date Service Began with
Huntington Complex | | Principal Occupation(s) and Previous Position(s) |
Martin R. Dean Age: 51 ANTI-MONEY LAUNDERING OFFICER AND CHIEF COMPLIANCE OFFICER 37 West Broad Street Columbus, OH 43215 Began Serving: July 2013 | | Principal Occupation(s): Senior Vice President and Compliance Group Manager, HASI (July 2013 to present); Anti-Money Laundering Officer and Chief Compliance Officer, Huntington Strategy Shares (July 2013 to present). Previous Position(s): Director and Fund Accounting and Fund Administration Product Manager, Citi (2008 to June 2013); Senior Vice President/Vice President, Fund Administration, Citi (formerly, BISYS Fund Services) (May 1994 to 2008). |
Matthew J. Miller Age: 38 VICE PRESIDENT 2960 N. Meridian St., Ste 300 Indianapolis, IN 46208 Began Serving: February 2010 | | Principal Occupation(s): Vice President, Relationship Management, HASI (2008 to present). Previous Position(s): Vice President, Transfer Agency Operations, HASI (2002 to 2008). |
Bryan W. Ashmus Age: 42 TREASURER 37 West Broad Street Columbus, OH 43215 Began Serving: November 2013 | | Principal Occupation(s): Vice President, Financial Administration, HASI (September 2013 to present); Principal Financial Officer and Treasurer, Valued Advisers Trust (December 2013 to present); Treasurer, Huntington Strategy Shares (November 2013 to present). Previous Position(s): Vice President, Fund Administration, Citi Fund Services, Ohio, Inc. (May 2005 to September 2013). |
Jay S. Fitton Age: 44 SECRETARY 3805 Edwards Road Cincinnati, OH 45209 Began Serving: February 2012 | | Principal Occupation(s): Vice President of Legal Administration, HASI (November 2011 to present); Secretary, Huntington Strategy Shares (October 2012 to present). Previous Position(s): Vice President and Senior Counsel, J.P. Morgan Chase (April 2007 to November 2011). |
| (a) | Officers do not receive any compensation from the Trust. |
The Funds’ Statement of Additional Information (“SAI”) includes additional information about the trustees and is available without charge, upon request. You may call toll-free at 800-253-0412 to request a copy of the SAI or to make shareholder inquiries.
Annual Shareholder Report
75
Investment Contract Review Disclosure (Unaudited)
BOARD OF TRUSTEES’ CONSIDERATION OF INVESTMENT ADVISORY AGREEMENTS FOR THE HUNTINGTON FUNDS (the “Funds”)
The Board of Trustees is responsible for determining whether to approve the Funds’ investment advisory agreements. At a meeting held on August 19, 2014, the Board unanimously approved the investment advisory agreements (the “Advisory Agreements”) between Huntington Asset Advisors, Inc. (the “Advisor”) and the Funds. Pursuant to the Advisory Agreements between the Advisor and the Funds, the Advisor provides advisory services to the Funds.
During the review process, the Board received assistance and advice from, and met separately with, independent legal counsel. In approving each of the Advisory Agreements, the Board, including a majority of the independent Trustees, considered many factors, the most significant of which were: (1) the nature of the services provided to the Funds by the Advisor in relation to the advisory fees; (2) the individual performance of the Funds; (3) the Advisor’s costs and the profits realized through providing the Funds with advisory services; (4) whether the Advisor has realized or may realize economies of scale in providing services to the Funds and, if so, whether these economies are shared with the Funds; and (5) a comparison of the fees and performance of comparable funds.
Nature, Extent and Quality of Services in Relation to the Advisory Fees—In considering the nature, extent and quality of the services provided by the Advisor, the Board reviewed information relating to the Advisor’s operations and personnel. Among other things, the Advisor provided descriptions of its organizational and management structure, biographical information on its supervisory and portfolio management staff on a fund-by-fund basis, and financial information. The Trustees also took into account the financial condition of the Advisor with respect to its ability to provide the services required under the Advisory Agreements. The Board determined that the nature, extent and quality of the services provided by the Advisor, in relation to the advisory fees, were acceptable.
Individual Performance of the Funds—The Board reviewed the Funds’ short-term and long-term performance records and the Advisor’s management styles in relation to comparable funds and appropriate benchmarks. The Board noted that it reviews detailed information about the Funds’ performance on a quarterly basis. The Board also reviewed various comparative data for each of the Funds provided to them in connection with their consideration of the renewal of the Advisory Agreements, including, among other information, each Fund’s performance compared to similar funds based on information provided by Lipper Inc. (“Lipper”) for the one-, three-, five and ten-year periods, as applicable, ending March 31, 2014, as well as each Fund’s performance compared to its benchmark index for the one-, three-, five-, and ten-year and since-inception periods, as applicable, ending March 31, 2014.
Advisor’s Costs and the Profits Realized Through Providing the Funds With Advisory Services—In considering the reasonableness of the advisory fees, the Board reviewed information provided by the Advisor setting forth all revenues and other benefits, both direct and indirect, received by the Advisor and its affiliates attributable to managing each of the Funds individually, the cost of providing such services and the resulting profitability to the Advisor and its affiliates from these relationships. The Trustees determined that the profitability of the Advisor was acceptable in relation to the nature and quality of services provided to the Funds. The Board took into consideration the Advisor’s agreement with the Trust with respect to the Huntington Real Strategies Fund and Huntington Situs Fund, whereby the Advisor agreed to waive all or a portion of its advisory fee in order to limit each Fund’s total annual fund operating expenses through April 30, 2015. The Board also considered the Advisor’s agreement with the Trust with respect to the Huntington Dividend Capture Fund, whereby the Advisor agreed to waive all or a portion of its advisory fee in order to limit the Fund’s total annual fund operating expenses through April 30, 2016. The Board also considered the Advisor’s agreement with the Trust with respect to the Huntington Global
Annual Shareholder Report
76
Select Markets Fund, whereby the Advisor agreed to waive all or a portion of its advisory fee in order to limit the Fund’s total annual fund operating expenses through April 30, 2017. The Board also took into consideration the Advisor’s agreement with the Trust with respect to the Huntington Balanced Allocation Fund, Huntington Conservative Allocation Fund and Huntington Growth Allocation Fund (the “Allocation Funds”), whereby the Advisor agreed to waive all or a portion of its advisory fee in order to limit each Allocation Fund’s total annual fund operating expenses through April 30, 2015. In addition, the Board considered that, with respect to the Huntington Money Market Fund (“Money Market Fund”), the Advisor voluntarily agreed to waive or reimburse all or a portion of its advisory fee. The Board also considered that the Advisor entered into an agreement with the Trust on behalf of the Huntington U.S. Treasury Money Market Fund (“U.S. Treasury Money Market Fund”) whereby the Advisor agreed to waive or reimburse all or a portion of its advisory fee in order to limit the Fund’s total operating expenses through April 30, 2015. In addition, the Board considered the Advisor’s agreement with the Money Market Fund and U.S. Treasury Money Market Fund, whereby the Advisor agreed to waive all or a portion of its investment advisory fee and/or reimburse certain operating expenses of the Funds to the extent necessary to ensure that Money Market Fund maintains a positive yield of at least 0.01% and that the U.S. Treasury Money Market Fund maintains a positive yield of at least 0.00%.
Economies of Scale in Providing Services to the Funds and Whether These Economies Are Shared With the Funds—The Board also considered the effect of the Funds’ growth and size on their performance and fees. The Board noted that, with the exception of the Allocation Funds and the Huntington U.S. Treasury Money Market Fund, all of the Funds’ Advisory Agreements reflect the implementation of investment advisory fee breakpoints for the Funds. The Board further noted that the administration fee charged to all Funds included fee breakpoints, which allowed the Funds to realize economies of scale as the assets of the Funds increased over time.
Comparison of the Fees and Performance of Comparable Funds—With respect to the Funds’ performance and fees, the Board considered comparisons to other mutual funds with comparable investment programs to be particularly useful, given the high degree of competition in the mutual fund business. The Board used Lipper peer group information provided by Strategic Insight, Inc. with respect to its comparable fee and performance analysis for the Funds. The Board considered that the data for the fee and performance analysis was generated on an aggregate portfolio level since not all Funds offer the same types of share classes. The Board noted that the Advisor does not provide services to other accounts. The Board also considered updated fee and expense information from management which reflected the impact of certain waivers and reimbursements.
Other Considerations—The Board also requests and receives substantial and detailed information about the Funds and the Advisor on a regular basis. The Advisor provides much of this information at each regular meeting of the Board and furnishes additional reports in connection with the Board’s formal review of the Advisory Agreements. The Board may also receive information between regular meetings relating to particular matters as the need arises. The Board’s evaluation of the Advisory Agreements is informed by reports covering such matters as: the Advisor’s investment philosophy, personnel, and processes; operating strategies; the Funds’ short- and long term performance (in absolute terms, both on a gross basis and net of expenses, as well as in relationship to its particular investment program and certain competitive funds and/or other benchmarks, as appropriate) and comments on reasons for performance. The Board also considered reports concerning the Funds’ expenses (including the advisory fee itself and the overall expense structure of the Funds, both in absolute terms and relative to similar and/or competing funds, with due regard for contractual or voluntary expense limitations); the use and allocation of brokerage commissions derived from trading the Funds’ portfolio securities; the nature and extent of the advisory and other services provided to the Funds by the Advisor and its affiliates; compliance and audit reports
Annual Shareholder Report
77
Investment Contract Review Disclosure (Unaudited) (Continued)
concerning the Funds (including communications from regulatory agencies), as well as the Advisor’s responses to any issues raised therein; and relevant developments in the mutual fund industry and how the Funds and the Advisor are responding to them.
The Board based its decision to approve the Advisory Agreements on the totality of the circumstances and relevant factors and with a view to past and future long-term considerations. Not all of the factors and considerations identified above are relevant to each of the Funds, nor does the Board consider any one of them to be determinative. With respect to the factors that are relevant, the Board’s decision to approve the Advisory Agreements reflects its determination that the Advisor’s performance and actions provide an acceptable basis to support the decision to continue the existing arrangements.
While attention was given to all information furnished, the following discusses the primary factors relevant to the Board’s decisions. In each case, the Board concluded that the Funds’ performance was acceptable and expenses were reasonable in light of the quality and nature of services provided by the Advisor and its affiliates.
| I. | HUNTINGTON MONEY MARKET FUNDS |
Huntington Money Market Fund
Among other data considered, the Board noted that the Fund was equal to the average and median of its Lipper peer group for the one-year period ended March 31, 2014, and underperformed the average and was equal to the median of its Lipper peer group for the three-year period ended March 31, 2014. The Board also noted that the Fund underperformed the average and median of its Lipper peer group for the five-year period ended March 31, 2014 and outperformed the average and was equal to the median of its Lipper peer group for the ten-year period ended March 31, 2014. The Board also considered the Fund’s advisory fee and total expenses, which included the administrative fee. The Board noted that the Fund’s combined advisory/administrative fee was above the average and median of its Lipper peer group. The Board noted that total net expenses were below the average and median of its Lipper peer group.
Huntington U.S. Treasury Money Market Fund
Among other data considered, the Board noted that the Fund outperformed the average and median of its Lipper peer group for the one-, three- and five-year periods ended March 31, 2014. The Board also noted that the Fund outperformed the average and underperformed the median of its Lipper peer group for the ten-year period ended March 31, 2014. The Board also considered the Fund’s advisory fee and total expenses, which included the administrative fee. The Board took into consideration the Advisor’s agreement to waive all or a portion of its advisory fee and/or reimburse operating expenses of the Fund and noted that the Fund’s combined advisory/administrative fee was above the average and median of its Lipper peer group. The Board noted that total net expenses were below the average and above the median of its Lipper peer group.
| II. | HUNTINGTON EQUITY FUNDS |
Huntington Dividend Capture Fund
Among other data considered, the Board noted that the Fund underperformed the median and average of its Lipper peer group for the one-, three-, five- and ten-year periods ended March 31, 2014. The Board also noted that the Fund underperformed its benchmark index for the one-, three-, five and ten-year periods ended March 31, 2014, and outperformed its benchmark index for the since-inception period ended March 31, 2014. The Board also considered the Fund’s advisory fee and total expenses, which included the administrative fee. The Board took into consideration the Advisor’s agreement to waive all or a portion of its advisory fee and/or reimburse operating expenses of the Fund, and noted that the Fund’s combined
Annual Shareholder Report
78
advisory/administrative fee and total net expenses were above the average and median of its Lipper peer group, respectively. The Board took into account the Advisor’s discussion of the Fund’s performance, including the impact of market conditions on the Fund’s performance, and management’s continued close monitoring of the Fund’s performance.
Huntington Global Select Markets Fund
Among other data considered, the Board noted that the Fund outperformed the average and median of its Lipper peer group for the one- and three-year periods ended March 31, 2014. The Board noted that the Fund outperformed its benchmark index for the one- and three-year periods ended March 31, 2014, and underperformed its benchmark index for the since-inception period ended March 31, 2014. The Board also considered the Fund’s advisory fee and total expenses, which included the administrative fee. The Board took into consideration the Advisor’s agreement to waive all or a portion of its advisory fee and/or reimburse operating expenses of the Fund and noted that the Fund’s combined advisory/administrative fee was below the average and above the median of its Lipper peer group. The Board noted that total net expenses were above the average and median of its Lipper peer group.
Huntington Real Strategies Fund
Among other data considered, the Board noted that the Fund underperformed the average and median of its Lipper peer group for the one-year period ended March 31, 2014, and outperformed the average and median of its Lipper peer group for the three- and five-year periods ended March 31, 2014. The Board also noted that the Fund outperformed its benchmark index for the one-, three- and five-year and since-inception periods ended March 31, 2014. The Board also considered the Fund’s advisory fee and total expenses, which included the administrative fee. The Board took into consideration the Advisor’s agreement to waive all or a portion of its advisory fee and/or reimburse operating expenses of the Fund and noted that the Fund’s combined advisory/administrative fee was below the average and at the median of its Lipper peer group. The Board noted that the Fund’s total net expenses were below the average and median of its Lipper peer group.
Huntington Situs Fund
Among other data considered, the Board noted that the Fund underperformed the average and median of its Lipper peer group for the one-year period ended March 31, 2014, and outperformed the average and median of its Lipper peer group for the three-, five- and ten- year periods ended March 31, 2014. The Board also noted that the Fund underperformed its benchmark index for the one-, three- and five-year periods ended March 31, 2014, and outperformed its benchmark index for the ten-year and since-inception periods ended March 31, 2014. The Board also considered the Fund’s advisory fee and total expenses, which included the administrative fee. The Board took into consideration the Advisor’s agreement to waive all or a portion of its advisory fee and/or reimburse operating expenses of the Fund and noted that the Fund’s combined advisory/administrative fee and total net expenses were above the average and median of its Lipper peer group, respectively. The Board took into account the Advisor’s discussion of the Fund’s performance, including the impact of market conditions on the Fund’s performance, and management’s continued close monitoring of the Fund’s performance.
| III. | HUNTINGTON ASSET ALLOCATION FUNDS |
Huntington Balanced Allocation Fund
Among other data considered, the Board noted that the Fund underperformed the average and median of its Lipper peer group for the one- and three-year periods ended March 31, 2014. The Board also noted that the Fund underperformed its benchmark index for the one- and three-year and since-inception periods ended March 31, 2014. The Board also considered the Fund’s advisory fee and total expenses,
Annual Shareholder Report
79
Investment Contract Review Disclosure (Unaudited) (Continued)
which included the administrative fee. The Board took into consideration the Advisor’s agreement to waive all or a portion of its advisory fee and/or reimburse operating expenses of the Fund and noted that the Fund’s combined advisory/administrative fee was below the average and above the median of its Lipper peer group. The Board noted that total net expenses were below the average and median of its Lipper peer group. The Board took into account the Advisor’s discussion of the Fund’s performance, including the impact of market conditions on the Fund’s performance, and management’s continued close monitoring of the Fund’s performance.
Huntington Conservative Allocation Fund (a)
Among other data considered, the Board noted that the Fund underperformed the average and median of its Lipper peer group for the one- and three-year periods ended March 31, 2014. The Board also noted that the Fund outperformed its benchmark index for the one-year period ended March 31, 2014, and underperformed its benchmark index for the three-year period ended March 31, 2014. In addition, the Board noted that the Fund’s performance was equal to its benchmark index for the since-inception period ended March 31, 2014. The Board also considered the Fund’s advisory fee and total expenses, which included the administrative fee. The Board took into consideration the Advisor’s agreement to waive all or a portion of its advisory fee and/or reimburse operating expenses of the Fund and noted that the Fund’s combined advisory/administrative fee was below the average and above the median of its Lipper peer group. The Board noted that total net expenses were above the average and median of its Lipper peer group. The Board took into account the Advisor’s discussion of the Fund’s performance, including the impact of market conditions on the Fund’s performance, and management’s continued close monitoring of the Fund’s performance.
Huntington Growth Allocation Fund (a)
Among other data considered, the Board noted that the Fund underperformed the average and median of its Lipper peer group for the one- and three-year periods ended March 31, 2014. The Board also noted that the Fund underperformed its benchmark index for the one- and three-year and since-inception periods ended March 31, 2014. The Board also considered the Fund’s advisory fee and total expenses, which included the administrative fee. The Board took into consideration the Advisor’s agreement to waive all or a portion of its advisory fee and/or reimburse operating expenses of the Fund and noted that the Fund’s combined advisory/administrative fee and total net expenses were below the average and median of its Lipper peer group, respectively. The Board took into account the Advisor’s discussion of the Fund’s performance, including the impact of market conditions on the Fund’s performance, and management’s continued close monitoring of the Fund’s performance.
| (a) | The Conservation Allocation Fund and Growth Allocation Fund are scheduled for liquidation on March 6, 2015. |
Annual Shareholder Report
80
This report is authorized for distribution to prospective investors only when preceded or accompanied by a prospectus which contains facts concerning the Funds’ objectives and policies, management fees, expenses and other information.
A copy of the policies and procedures that the Funds use to determine how to vote proxies relating to securities held in the Funds’ portfolios, as well as a record of how the Funds voted any such proxies during the most recent 12-month period ended June 30, is available without charge and upon request by calling 1-800-253-0412 or at www.huntingtonfunds.com. This information is also available from the EDGAR database on the SEC’s website at www.sec.gov.
The Funds file with the SEC a complete schedule of their portfolio holdings, as of the close of the first and third quarters of their fiscal year, on “Form N-Q.” These filings are available on the SEC’s website at www.sec.gov and may be reviewed and copied at the SEC’s Public Reference Room in Washington, DC. (call 202-551-8090 for information on the operation of the Public Reference Room.) You may also access this information at www.huntingtonfunds.com by selecting “Form N-Q.” The Huntington National Bank, a subsidiary of Huntington Bancshares, Inc., is the Custodian of The Huntington Funds. Huntington Asset Services, Inc. serves as the Administrator, Transfer Agent and Fund Accountant and is affiliated with the Huntington National Bank. Additionally, Brown Brothers Harriman & Co. is the Sub-Custodian of certain of the Funds. Huntington Asset Advisors, Inc., a subsidiary of the Huntington National Bank, serves as Investment Advisor to the Funds. Unified Financial Securities, Inc. serves as the Distributor of The Huntington Funds and is affiliated with the Huntington National Bank.
Mutual funds, including money market funds, are not bank deposits or obligations, are not guaranteed by any bank, and are not insured or guaranteed by the U.S. government, the Federal Deposit Insurance Corporation, the Federal Reserve Board, or any other government agency. Investment in mutual funds involves investment risk, including the possible loss of principal. Although money market funds seek to preserve the value of your investment at $1.00 per share, it is possible to lose money by investing in the Funds.
The S&P 500 Index®, S&P Goldman Sachs Commodity Index®, S&P SmallCap 600 Index® and S&P MidCap 400 Index® are products of S&P Dow Jones Indices LLX (“SPDJI”), and have been licensed for use by Huntington Asset Advisors, Inc. Standard and Poor’s® and S&P® are registered trademarks of Standard and Poor’s Financial Services LLC (“S&P”); Dow Jones® is a registered trademark of Dow Jones Trademark Holdings LLC (“Dow Jones”). Huntington Funds are not sponsored, endorsed, sold or promoted by SPDJI, Dow Jones, S&P, their respective affiliates and none of such parties make any representations regarding the advisability of investing in Huntington Funds nor do they have any liability for any errors, omissions, or interruptions of the S&P 500 Index®, S&P SmallCap 600 Index® and S&P MidCap 400 Index®.
| | | | |
| Huntington Shareholder Services: 800-253-0412 | | | 27057 12/14 | |

Annual Shareholder Report
DECEMBER 31, 2014
EQUITY FUNDS
Huntington VA Dividend Capture Fund
Huntington VA International Equity Fund
Huntington VA Situs Fund
Huntington
VA Dividend Capture Fund
Management’s Discussion of Fund Performance
Portfolio Managers:
| | |
Kirk Mentzer, MBA Director of Fund Research | | Peter Sorrentino, CFA Senior Vice President |
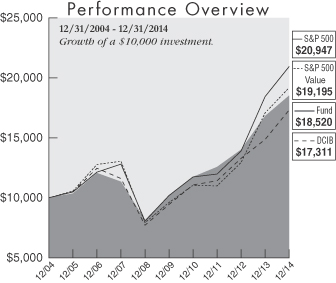
| | | | |
| | | Average Annual
Total Return for
the Period Ended
12/31/14 | |
1 Year | | | 10.16 | % |
3 Year | | | 13.78 | % |
5 Year | | | 12.67 | % |
10 Year | | | 6.36 | % |
The above expense ratio is from the Fund’s prospectus dated April 30, 2014. Huntington Asset Advisors, Inc. (the “Advisor”) has contractually agreed to waive all or a portion of its investment advisory fee (based on average daily net assets) and/or reimburse certain operating expenses of the Fund to the extent necessary in order to limit the Fund’s total annual fund operating expenses (after the fee waivers and/or expense reimbursements, and exclusive of acquired fund fees and expenses, brokerage costs, interest, taxes and dividends, and extraordinary expenses) to not more than 0.99% of the Fund’s daily net assets through April 30, 2015.
The graph above illustrates the hypothetical investment of $10,000(a) in the Huntington VA Dividend Capture Fund from December 31, 2004 to December 31, 2014, compared to the S&P 500 Value, S&P 500 and DCIB.
The performance information does not include the charges and expenses imposed by the insurance company separate accounts or charges and expenses under the variable insurance product contracts. The inclusion of such charges would lower performance. Please refer to the variable insurance product prospectus for a complete listing of these expenses. Additional information pertaining to the Fund’s expense ratio as of December 31, 2014 can be found in the financial highlights. For the fiscal year ended December 31, 2014, Fund shares were available only through variable annuity contracts or variable life insurance policies offered by participating insurance companies. Variable investment options are not obligations of or guaranteed by any bank and are not federally insured.
| (a) | The Fund’s performance assumes the reinvestment of all dividends and distributions. The S&P 500 Value, S&P 500 and DCIB have been adjusted to reflect reinvestment of dividends on securities in the indices. |
| | The composition of the Fund’s holdings is subject to change. |
For the fiscal year ended December 31, 2014, the Huntington VA Dividend Capture Fund (“Fund”) reported a total return of 10.16% based on net asset value. The Fund underperformed relative to the 12.36% total return of the Standard & Poor’s 500 Value Index® (“S&P 500 Value”)(b), its benchmark, and the 13.69% total return of the Standard & Poor’s 500 Index® (“S&P 500”)(b), its previous benchmark for the same period. The Fund underperformed its benchmark by 2.20%. The Fund underperformed relative to the 16.74% total return of the Dividend Capture Indices Blend (“DCIB”)(c) for the same period.
The Fund is managed using our top-down style and portfolio construction techniques, which are aimed at producing a high level of stable income and low volatility by investing in three distinct asset classes highlighted below:
| ¢ | | Value-Style Common Stocks: Domestic equity market returns were nearly zero for the year in early October, but managed to rally during the fourth quarter to produce strong gains for all of 2014. Seasonal factors, improving economic growth (US), low inflation, plentiful liquidity and plummeting oil prices and bond yields all factored prominently into rising stock markets. Stocks as measured by the S&P 500 Value ended the year with a 12.36% total return. The Fund was overweight common stocks for the entire period versus the DCIB unmanaged custom index. Within this class, sector allocation subtracted 83 basis points and security selection detracted 299 basis points from performance. As a result, the common stocks in the Fund underperformed the overall market. The Fund’s common stock total return for 2014 was 7.84% trailing the S&P 500 Value for the year. The three largest positive contributors to performance were: Intel Corp. (+0.76%), Hawaiian Electric Industries, Inc. (+0.72%) and Cisco Systems, Inc. (+0.70%). The three largest detractors were: Noble Corporation PLC (-0.66%), Marathon Oil Corp. (-0.40%) and International Business Machines Corp. (-0.36%). |
| ¢ | | Real Estate Investment Trusts (REITs)(d): Falling interest rates helped propel REIT markets in 2014, making them the best performing asset class. The Fund’s REIT holdings produced a total return of 26.77%, which slightly underperformed the benchmark NAREIT Index total return of 27.20%. The three largest positive contributors to performance were: Camden Property Trust (+2.55%), Lexington Realty Trust (+2.50%) and Highwoods Properties, Inc. (+2.42%). The three largest detractors were Ramco-Gershenson Properties Trust (-0.05%), CBL & Associates Properties, Inc. (-0.01%) and Healthcare Realty Trust Inc. (-0.01%), which were sold during the year. |
| ¢ | | Preferred Stocks(e): Declining yields likewise gave preferred stocks a tail wind for the year, making it second best performing asset class of the Fund. The Fund’s preferred share holdings produced a total return of 16.18%, which outperformed the benchmark BofA Merrill Lynch U.S. Preferred Stock Fixed Rate Index total return of 15.44%. The three largest positive contributors to performance were: PS Business Parks, Series S, 6.45% (+0.42%), BB&T Corp., 5.85% (+0.38%) and Charles Schwab Corp., Series B, 6.00% (+0.37%). The three largest underperforming issues were: Vornado Realty LP, 7.875% (+0.01%), Ameriprise Financial, Inc., 7.75% (+0.01%) and NextEra Energy Capital Holdings, Inc., Series F, 8.75% (Called at 100%) (0.00%), which were sold during the year. |
Performance data quoted represents past performance which is no guarantee of future results. Investment return and principal value will fluctuate so that an investor’s shares, when redeemed, may be worth more or less than their original cost. Performance for a variable investment option changes over time and current performance may be lower or higher than what is stated. For current to the most recent month end performance, contact your insurance company.
| (b) | Effective 11/18/2014, the VA Dividend Capture Fund’s benchmark was updated from the S&P 500 Index® to the S&P 500 Value Index® as it was determined to more closely reflect the investment strategy of the Fund. The S&P 500 Index® is an unmanaged index generally representing the performance of the broad domestic economy through changes in the aggregate market value of 500 stocks representing all major industries. The S&P 500 Value Index® is an unmanaged market-capitalization-weighted index consisting of those stocks within the S&P 500 Index® that exhibit strong value characteristics. It uses a numerical ranking system based on four value factors and three growth factors to determine the constituents and their weightings. Investments cannot be made in an index. |
| (c) | The DCIB is a custom, blended index comprised of the following three indices with their noted respective weightings: S&P 500 Value Index (40%), Merrill Lynch Fixed Rate Preferred Index (40%) and NAREIT Index (20%). This custom, blended index and its respective weightings are reflective of the Fund’s sector diversification. Indices are unmanaged and, unlike the Fund, are not affected by cash flows. It is not possible to invest directly in an Index. |
| (d) | REIT returns represented by the NAREIT Index. The NAREIT Index represents returns for the National Association of Real Estate Investment Trust Equity Index. The index is unmanaged and, unlike the Fund, is not affected by cash flows. It is not possible to invest directly in an Index. |
| (e) | Preferred returns represented by BofA Merrill Lynch U.S. Preferred Stock Fixed Rate Index. |
There are no guarantees that dividend paying stocks will continue to pay dividends. In addition, dividend paying stocks may not experience the same capital appreciation potential as non-dividend paying stocks.
For a full discussion of the principal investment risks of investing in this fund, please see the Fund’s prospectus.
H U N T I N G T O N F U N D S
Huntington
VA International Equity Fund
Management’s Discussion of Fund Performance
Portfolio Managers:
| | |
Paul W. Attwood, CFA Senior Vice President | | Martina Cheung, CFA, MBA Vice President |
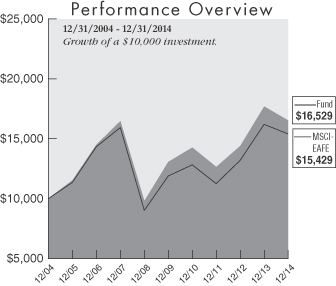
| | | | |
| | | Average Annual
Total Return for
the Period Ended
12/31/14 | |
1 Year | | | (6.63 | )% |
3 Year | | | 9.38 | % |
5 Year | | | 4.79 | % |
10 Year | | | 5.15 | % |
| | | | |
| | | Expense Ratio | |
Gross | | | 1.03 | % |
With Contractual Waivers | | | 1.00 | % |
The above expense ratios are from the Fund’s prospectus dated April 30, 2014. Huntington Asset Advisors, Inc. (the “Advisor”) has contractually agreed to waive all or a portion of its investment advisory fee (based on average daily net assets) and/or reimburse certain operating expenses of the Fund to the extent necessary in order to limit the Fund’s total annual fund operating expenses (after the fee waivers and/or expense reimbursements, and exclusive of acquired fund fees and expenses, brokerage costs, interest, taxes and dividends, and extraordinary expenses) to not more than 0.98% of the Fund’s daily net assets through April 30, 2015.
The graph above illustrates the hypothetical investment of $10,000(a) in the Huntington VA International Equity Fund from December 31, 2004 to December 31, 2014, compared to the MSCI-EAFE.
The performance information does not include the charges and expenses imposed by the insurance company separate accounts or charges and expenses under the variable insurance product contracts. The inclusion of such charges would lower performance. Please refer to the variable insurance product prospectus for a complete listing of these expenses. Additional information pertaining to the Fund’s expense ratio as of December 31, 2014 can be found in the financial highlights. For the fiscal year ended December 31, 2014, Fund shares were available only through variable annuity contracts or variable life insurance policies offered by participating insurance companies. Variable investment options are not obligations of or guaranteed by any bank and are not federally insured.
For the fiscal year ended December 31, 2014, the Huntington VA International Equity Fund (“Fund”) produced a total return of -6.63% based on net asset value. The Fund underperformed relative to the -4.90% total return of the Morgan Stanley Capital International Europe, Australasia and Far East Index (“MSCI-EAFE”)(b), its benchmark, for the same time period. The Fund underperformed the benchmark by -1.73%.
One of the primary factors that produced the underperformance of the Fund relative to its benchmark was the Fund’s exposure to both French and German equities, which had a weak 2014 due to economic growth concerns. With the exception of a few countries, most members of the MSCI-EAFE declined for the year. The Fund’s overweight exposure in the Healthcare sector was beneficial, but the relative overweight in the Industrials sector negatively affected performance.
Once again, the weakest performing sectors were Materials and Energy. Energy stocks had a particularly big decline in the fourth quarter as oil prices collapsed. The three stocks that contributed the most to performance were Murata Manufacturing (a Japanese technology company), Celgene Corp. (a US based healthcare company) and Novartis AG (a Swiss based pharmaceutical company). Their combined contribution to performance was 1.77%. The three stocks that detracted the most from performance were Rolls Royce PLC (a UK based industrial company), Svenska Cellulosa Aktiebolaget (a Swedish consumer company) and Stada Arzneimitte (a German based healthcare company). Their total negative contribution to performance amounted to 2%.
Performance data quoted represents past performance which is no guarantee of future results. Investment return and principal value will fluctuate so that an investor’s shares, when redeemed, may be worth more or less than their original cost. Performance for a variable investment option changes over time and current performance may be lower or higher than what is stated. For current to the most recent month end performance, contact your insurance company.
| | The composition of the Fund’s holdings is subject to change. |
| (a) | The Fund’s performance assumes the reinvestment of all dividends and distributions. The MSCI-EAFE has been adjusted to reflect reinvestment of all dividends on securities in the index. |
| (b) | The MSCI-EAFE is a market capitalization-weighted equity index comprising 20 of the 48 countries in the MSCI universe and representing the developed world outside of North America. Each MSCI country index is created separately, then aggregated, without change, into regional MSCI indices. The index is unmanaged and, unlike the Fund, is not affected by cash flows. It is not possible to invest directly in an index. |
International investing involves special risks including currency risk, political risk, increased volatility of foreign securities, and differences in auditing and other financial standards. Prices of emerging markets securities can be significantly more than the prices of securities in developed countries and currency risk and political risks are accentuated in emerging markets.
For a full discussion of the principal investment risks of investing in this fund, please see the Fund’s prospectus.
Huntington
VA Situs Fund
Management’s Discussion of Fund Performance
Portfolio Managers:
| | |
B. Randolph Bateman, CFA Chief Investment Officer | | Kirk Mentzer, MBA Director of Fund Research |
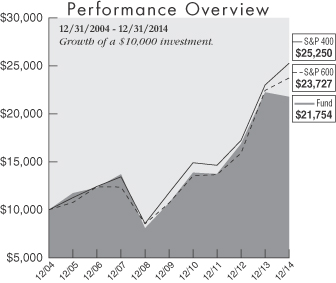
| | | | |
| | | Average Annual
Total Return for
the Period Ended
12/31/14 | |
1 Year | | | (2.06 | %) |
3 Year | | | 16.58 | % |
5 Year | | | 15.27 | % |
10 Year | | | 8.08 | % |
The above expense ratio is from the Fund’s prospectus dated April 30, 2014. Huntington Asset Advisors, Inc. (the “Advisor”) has contractually agreed to waive all or a portion of its investment advisory fee (based on average daily net assets) and/or reimburse certain operating expenses of the Fund to the extent necessary in order to limit the Fund’s total annual fund operating expenses (after the fee waivers and/or expense reimbursements, and exclusive of acquired fund fees and expenses, brokerage costs, interest, taxes and dividends, and extraordinary expenses) to not more than 1.00% of the Fund’s daily net assets through April 30, 2015.
The graph above illustrates the hypothetical investment of $10,000(a) in the Huntington VA Situs Fund from December 31, 2004 to December 31, 2014, compared to the S&P 600 and the S&P 400.
The performance information does not include the charges and expenses imposed by the insurance company separate accounts or charges and expenses under the variable insurance product contracts. The inclusion of such charges would lower performance. Please refer to the variable insurance product prospectus for a complete listing of these expenses. Additional information pertaining to the Fund’s expense ratio as of December 31, 2014 can be found in the financial highlights. For the fiscal year ended December 31, 2014, Fund shares were available only through variable annuity contracts or variable life insurance policies offered by participating insurance companies. Variable investment options are not obligations of or guaranteed by any bank and are not federally insured.
For the fiscal year ended December 31, 2014, the Huntington VA Situs Fund (“Fund”) reported a total return of -2.06%, based on net asset value. The Fund underperformed relative to the 5.76% total return of the Standard and Poor’s SmallCap 600 Index® (“S&P 600®”)(b), its benchmark, and the 9.77% total return of the Standard and Poor’s MidCap 400 Index® (“S&P 400”)(b) for the same period. The Fund underperformed the benchmark by -7.82%.
During the year, the Huntington VA Mid Corp America Fund was merged into the Fund. Much of the portfolio structure underperformance was as a result of the integration of the VA Mid Corp America Fund as its capitalization has always been benchmarked to the Mid Cap marketplace. The Huntington VA Situs Fund’s underperformance was primarily the result of certain stocks that fell along with the drop in the price of oil. With overproduction and a commitment by OPEC to maintain current production levels, oil prices fell precipitously during the final quarter of 2014 and GeoSpace Technologies and Carbo Ceramics were both heavily impacted by the energy price change.
One of the major drivers of performance from a stock selection perspective was TASER, which rose 1.96% during the fourth quarter and had been a minor holding until early autumn. However, the Fund made a major commitment to the holding following the events in Ferguson, Missouri. In the aftermath of the incident, a large number of police departments made commitments to TASER’s body cameras. This was duplicated internationally and the stock rose accordingly. Currently the company is the largest single holding of the Fund. In addition to TASER, four other companies moved into the top ten holdings of the Fund. Watts Water, South State Bank, Sanderson Farms and Tyler Technologies were among the major structural changes in the Fund’s efforts to expand into earnings driven corporations for the coming quarters.
The markets in 2014 were primarily impacted by activities surrounding the monetary policies of the Federal Reserve System (“Fed”), international turmoil, the Ebola virus scare and the change in Congressional makeup. The Fed ended its QE monetary policy in October and the markets handled the news in stride. In fact, much of the performance of the markets for the entire year occurred following the Fed’s withdrawal from its bond purchase program. This was particularly evident in the S&P 600®, which was down 3.74% for the first nine months of the year then recovered with a 9.83% rebound in the fourth quarter, allowing the index to increase 5.76% for the entire year.
Performance data quoted represents past performance which is no guarantee of future results. Investment return and principal value will fluctuate so that an investor’s shares, when redeemed, may be worth more or less than their original cost. Performance for a variable investment option changes over time and current performance may be lower or higher than what is stated. For current to the most recent month end performance, contact your insurance company.
| | The composition of the Fund’s holdings is subject to change. |
| (a) | The Fund’s performance assumes the reinvestment of all dividends and distributions. The S&P 600 and S&P 400 have been adjusted to reflect reinvestment of all dividends on securities in the index. |
| (b) | The S&P 600 is a capitalization-weighted index representing all major industries in the small-cap range of the U.S. stock market. The S&P 400 is a capitalization-weighted index comprised of common stocks representing all major industries in the mid-range of the U.S. stock market. The indices are unmanaged and, unlike the Fund, are not affected by cash flows. It is not possible to invest directly in an index. |
International investing involves special risks, including currency risk, increased volatility of foreign securities, political risks, and differences in auditing and other financial standards.
Small company stocks may be less liquid and subject to greater price volatility than large company stocks.
Funds whose investments are concentrated in a specific industry or sector may be subject to a higher degree of market risk than funds whose investments are diversified. In addition, the Fund may be subject to specific risks of the information technology sector, such as obsolescence.
For a full discussion of the principal investment risks of investing in this fund, please see the Fund’s prospectus.
H U N T I N G T O N F U N D S
Huntington VA Dividend Capture Fund
Portfolio of Investments Summary Table (Unaudited)
December 31, 2014
| | | | |
| Asset Allocation | | Percentage of
Market Value | |
Financials | | | 32.2 | % |
Real Estate Investment Trusts | | | 14.4 | % |
Energy | | | 8.6 | % |
Information Technology | | | 6.9 | % |
Health Care | | | 6.7 | % |
Industrials | | | 6.2 | % |
Consumer Staples | | | 5.9 | % |
Utilities | | | 3.9 | % |
Exchange-Traded Funds | | | 3.8 | % |
Cash(a) | | | 2.8 | % |
Consumer Discretionary | | | 2.7 | % |
Telecommunication Services | | | 2.5 | % |
Materials | | | 2.0 | % |
Short-Term Securities Held as Collateral for Securities Lending | | | 1.4 | % |
| | | | |
Total | | | 100.0 | % |
| (a) | Investments in an affiliated money market fund. |
Portfolio holdings and allocations are subject to change. As of December 31, 2014, percentages in the table above are based on total investments. Such total investments may differ from the percentage set forth below in the Portfolio of Investments which are computed using the Fund’s net assets.
The Portfolio of Investments are broken down by sectors, and these sectors do not represent industry categories for purposes of identifying “industry concentration” as described in the Investment Company Act of 1940, as amended.
Portfolio of Investments
December 31, 2014
| | | | | | | | |
| Shares | | | | | Fair Value | |
| | | | | | | | |
| | | | Common Stocks — 68.9% | | | | |
| | | | Consumer Discretionary — 2.8% | | | | |
| | 1,750 | | | Comcast Corp., Class A | | $ | 101,518 | |
| | 10,000 | | | Ford Motor Co. | | | 155,000 | |
| | 12,000 | | | International Game Technology | | | 207,000 | |
| | 1,750 | | | McDonalds Corp. | | | 163,975 | |
| | 4,250 | | | Starwood Hotels & Resorts Worldwide, Inc. | | | 344,547 | |
| | | | | | | | |
| | | | | | | 972,040 | |
| | | | | | | | |
| | | | Consumer Staples — 6.0% | | | | |
| | 12,750 | | | Campbell Soup Co. | | | 561,000 | |
| | 2,500 | | | Colgate-Palmolive Co. | | | 172,975 | |
| | 6,750 | | | Flowers Foods, Inc. | | | 129,533 | |
| | 6,300 | | | Kellogg Co. | | | 412,272 | |
| | 3,750 | | | Kimberly-Clark Corp. | | | 433,275 | |
| | 3,500 | | | Philip Morris International, Inc. | | | 285,075 | |
| | 1,500 | | | Wal-Mart Stores, Inc. | | | 128,820 | |
| | | | | | | | |
| | | | | | | 2,122,950 | |
| | | | | | | | |
| | | | Energy — 8.7% | | | | |
| | 5,500 | | | ConocoPhillips | | | 379,830 | |
| | 5,400 | | | Enterprise Products Partners LP | | | 195,048 | |
| | 10,000 | | | Exxon Mobil Corp. | | | 924,500 | |
| | 12,000 | | | Marathon Oil Corp. | | | 339,480 | |
| | 5,950 | | | Murphy Oil Corp. | | | 300,594 | |
| | 15,000 | | | Noble Corp. PLC | | | 248,550 | |
| | 4,750 | | | Occidental Petroleum Corp. | | | 382,897 | |
| | 5,500 | | | Peabody Energy Corp. (a) | | | 42,570 | |
| | 7,750 | | | Suncor Energy, Inc. | | | 246,295 | |
| | | | | | | | |
| | | | | | | 3,059,764 | |
| | | | | | | | |
| | | | | | | | |
| Shares | | | | | Fair Value | |
| | | | | | | | |
| | | | Financials — 15.4% | | | | |
| | 40,750 | | | Apollo Investment Corp. (b) | | $ | 302,365 | |
| | 8,500 | | | Ares Capital Corp. (b) | | | 132,643 | |
| | 7,000 | | | Bank of Nova Scotia/The | | | 399,560 | |
| | 2,800 | | | BB&T Corp. | | | 108,892 | |
| | 7,250 | | | Eaton Vance Corp. | | | 296,742 | |
| | 33,250 | | | Fulton Financial Corp. | | | 410,970 | |
| | 3,625 | | | Healthcare Trust of America, Inc. | | | 97,658 | |
| | 9,950 | | | JPMorgan Chase & Co. | | | 622,671 | |
| | 14,000 | | | Northern Trust Corp., Series C | | | 350,700 | |
| | 4,750 | | | Royal Bank of Canada | | | 328,082 | |
| | 14,750 | | | TCF Financial Corp. | | | 234,378 | |
| | 6,250 | | | Toronto-Dominion Bank/The | | | 298,625 | |
| | 3,000 | | | Travelers Cos., Inc./The | | | 317,550 | |
| | 8,500 | | | U.S. Bancorp | | | 382,075 | |
| | 10,500 | | | Unum Group | | | 366,240 | |
| | 7,250 | | | Waddell & Reed Financial, Inc., Class A | | | 361,195 | |
| | 7,584 | | | Wells Fargo & Co. | | | 415,755 | |
| | | | | | | | |
| | | | | | | 5,426,101 | |
| | | | | | | | |
| | | | Health Care — 6.7% | | | | |
| | 3,450 | | | AbbVie, Inc. | | | 225,768 | |
| | 5,750 | | | Baxter International, Inc. | | | 421,417 | |
| | 750 | | | Becton, Dickinson and Co. | | | 104,370 | |
| | 4,750 | | | GlaxoSmithKline PLC ADR | | | 203,015 | |
| | 2,350 | | | Johnson & Johnson | | | 245,740 | |
| | 2,500 | | | Medtronic, Inc. | | | 180,500 | |
(See notes which are an integral part of the Financial Statements)
Huntington VA Dividend Capture Fund
Portfolio of Investments (continued)
December 31, 2014
| | | | | | | | |
| Shares | | | | | Fair Value | |
| | | | | | | | |
| | | | Common Stocks — (continued) | | | | |
| | | | Health Care — (continued) | | | | |
| | 7,250 | | | Merck & Co., Inc. | | $ | 411,727 | |
| | 18,700 | | | Pfizer, Inc. | | | 582,505 | |
| | | | | | | | |
| | | | | | | 2,375,042 | |
| | | | | | | | |
| | | | Industrials — 4.6% | | | | |
| | 7,750 | | | ADT Corp./The (a) | | | 280,783 | |
| | 2,350 | | | CSX Corp. | | | 85,141 | |
| | 34,750 | | | General Electric Co. | | | 878,132 | |
| | 3,500 | | | United Parcel Service, Inc., Class B | | | 389,095 | |
| | | | | | | | |
| | | | | | | 1,633,151 | |
| | | | | | | | |
| | | | Information Technology — 7.0% | | | | |
| | 2,250 | | | Accenture PLC, Class A | | | 200,948 | |
| | 8,500 | | | CA, Inc. | | | 258,825 | |
| | 14,500 | | | Cisco Systems, Inc. | | | 403,317 | |
| | 12,700 | | | Intel Corp. | | | 460,883 | |
| | 1,750 | | | International Business Machines Corp. | | | 280,770 | |
| | 7,000 | | | Microchip Technology, Inc. | | | 315,770 | |
| | 3,750 | | | Paychex, Inc. | | | 173,138 | |
| | 8,750 | | | Symantec Corp. | | | 224,481 | |
| | 3,750 | | | Xilinx, Inc. | | | 162,338 | |
| | | | | | | | |
| | | | | | | 2,480,470 | |
| | | | | | | | |
| | | | Materials — 2.0% | | | | |
| | 9,000 | | | Bemis Co., Inc. | | | 406,890 | |
| | 6,750 | | | Sonoco Products Co. | | | 294,975 | |
| | | | | | | | |
| | | | | | | 701,865 | |
| | | | | | | | |
| | | | Real Estate Investment Trusts — 9.6% | |
| | 5,250 | | | Camden Property Trust | | | 387,660 | |
| | 9,500 | | | Equity One, Inc. | | | 240,920 | |
| | 9,000 | | | HCP, Inc. | | | 396,270 | |
| | 7,000 | | | Highwoods Properties, Inc. | | | 309,960 | |
| | 9,250 | | | Kimco Realty Corp. | | | 232,545 | |
| | 33,750 | | | Lexington Realty Trust | | | 370,575 | |
| | 34,242 | | | Medical Properties Trust, Inc. | | | 471,855 | |
| | 28,250 | | | Piedmont Office Realty Trust, Inc. (a) | | | 532,230 | |
| | 20,250 | | | Retail Properties of America, Inc. | | | 337,972 | |
| | 2,750 | | | UDR, Inc. | | | 84,755 | |
| | | | | | | | |
| | | | | | | 3,364,742 | |
| | | | | | | | |
| | | | Telecommunication Services — 2.1% | | | | |
| | 12,250 | | | AT&T, Inc. | | | 411,477 | |
| | 7,140 | | | Verizon Communications, Inc. | | | 334,009 | |
| | | | | | | | |
| | | | | | | 745,486 | |
| | | | | | | | |
| | | | Utilities — 4.0% | | | | |
| | 13,250 | | | CenterPoint Energy, Inc. | | | 310,447 | |
| | 15,000 | | | Hawaiian Electric Industries, Inc. | | | 502,200 | |
| | 21,250 | | | Questar Corp. | | | 537,200 | |
| | 1,000 | | | TransCanada Corp. | | | 49,100 | |
| | | | | | | | |
| | | | | | | 1,398,947 | |
| | | | | | | | |
| | | | Total Common Stocks
(Cost $21,963,613) | | | 24,280,558 | |
| | | | | | | | |
| | | | Preferred Stocks — 24.3% | | | | |
| | | | Financials — 17.2% | | | | |
| | 15,000 | | | Allstate Corp./The, 5.100% | | | 379,950 | |
| | 12,500 | | | American Financial Group,
Inc., 7.000% | | | 324,375 | |
| | 24,331 | | | Axis Capital Holdings Ltd.,
Series C, 6.875% | | | 650,124 | |
| | | | | | | | |
| Shares | | | | | Fair Value | |
| | | | | | | | |
| | | | Financials — (continued) | | | | |
| | 20,000 | | | BB&T Corp., 5.850% | | $ | 501,000 | |
| | 21,500 | | | Charles Schwab Corp./The,
Series B, 6.000% | | | 550,400 | |
| | 30,500 | | | JPMorgan Chase Capital
XXIX, 6.700% | | | 774,700 | |
| | 15,500 | | | KKR Financial Holdings LLC, 8.375% | | | 430,280 | |
| | 17,500 | | | PartnerRe Ltd., Series E, 7.250% | | | 466,200 | |
| | 6,000 | | | Prudential Financial, Inc., 5.700% | | | 149,880 | |
| | 18,000 | | | Raymond James Financial,
Inc., 6.900% | | | 491,220 | |
| | 17,000 | | | State Street Corp., Series C, 5.250% | | | 389,810 | |
| | 32,500 | | | Wells Fargo & Co., Series J, 8.000% | | | 948,025 | |
| | | | | | | | |
| | | | | | | 6,055,964 | |
| | | | | | | | |
| | | | Industrials — 1.6% | | | | |
| | 23,000 | | | Stanley Black & Decker, Inc., 5.750% | | | 580,980 | |
| | | | | | | | |
| | | | Real Estate Investment Trusts — 5.1% | |
| | 18,493 | | | Kimco Realty Corp., Series H, 6.900% | | | 474,715 | |
| | 16,000 | | | PS Business Parks, Inc.,
Series S, 6.450% | | | 410,240 | |
| | 9,500 | | | Public Storage, Inc., Series V, 5.375% | | | 223,060 | |
| | 22,500 | | | Realty Income Corp., Series F, 6.625% | | | 589,950 | |
| | 3,854 | | | Senior Housing Properties Trust, 5.625% | | | 92,843 | |
| | | | | | | | |
| | | | | | | 1,790,808 | |
| | | | | | | | |
| | | | Telecommunication Services — 0.4% | | | | |
| | 5,000 | | | Verizon Communications, Inc., 5.900% | | | 130,900 | |
| | | | | | | | |
| | | | Total Preferred Stocks
(Cost $8,473,684) | | | 8,558,652 | |
| | | | | | | | |
| | | | Exchange-Traded Funds — 3.9% | | | | |
| | | | | | | | |
| | 17,250 | | | SPDR S&P Dividend ETF | | | 1,359,300 | |
| | | | | | | | |
| | | | Total Exchange-Traded Funds
(Cost $1,306,269) | | | 1,359,300 | |
| | | | | | | | |
| | | | Cash Equivalents — 2.9% | | | | |
| | 1,005,371 | | | Huntington Money Market Fund, Institutional Shares, 0.040% (c) (d) | | | 1,005,371 | |
| | | | | | | | |
| | | | Total Cash Equivalents
( Cost $1,005,371) | | | 1,005,371 | |
| | | | | | | | |
| | | | Short-Term Securities Held as Collateral for Securities
Lending — 1.4% | | | | |
| | | | | | | | |
| | 496,352 | | | Fidelity Institutional Money Market Portfolio, Institutional
Class, 0.110% (d) | | | 496,352 | |
| | | | | | | | |
| | | | Total Short-Term Securities Held as Collateral for Securities Lending
(Cost $496,352) | | | 496,352 | |
| | | | | | | | |
| | | | Total Investments
(Cost $33,245,289) — 101.4% | | | 35,700,233 | |
| | | | | | | | |
| | | | Liabilities in Excess of
Other Assets — (1.4)% | | | (485,243 | ) |
| | | | | | | | |
| | | | Net Assets — 100.0% | | $ | 35,214,990 | |
| | | | | | | | |
H U N T I N G T O N F U N D S
(See notes which are an integral part of the Financial Statements)
Huntington VA Dividend Capture Fund
Portfolio of Investments (continued)
December 31, 2014
| (a) | All or a portion of the security was on loan as of December 31, 2014. The total value of securities on loan as of December 31, 2014 was $482,936. |
| (b) | Business Development Company |
| (c) | Investment in affiliate. |
| (d) | Rate disclosed is the seven day yield as of December 31, 2014. |
| | |
| ADR | | —American Depositary Receipt |
| | |
| ETF | | —Exchange-Traded Fund |
| | |
| SPDR | | —Standard & Poor’s Depositary Receipts |
(See notes which are an integral part of the Financial Statements)
Huntington VA International Equity Fund
Portfolio of Investments Summary Table (Unaudited)
December 31, 2014
| | | | |
| Asset Allocation | | Percentage of
Market Value | |
Japan | | | 22.4 | % |
United Kingdom | | | 17.4 | % |
Switzerland | | | 12.4 | % |
Germany | | | 10.7 | % |
France | | | 8.9 | % |
Sweden | | | 5.3 | % |
Canada | | | 4.0 | % |
United States | | | 2.8 | % |
Belgium | | | 2.5 | % |
Australia | | | 2.3 | % |
Spain | | | 2.2 | % |
Hong Kong | | | 2.1 | % |
Cash(a) | | | 1.9 | % |
Denmark | | | 1.8 | % |
Singapore | | | 1.7 | % |
Italy | | | 1.6 | % |
| | | | |
Total | | | 100.0 | % |
| (a) | Investments in an affiliated money market fund. |
Portfolio holdings and allocations are subject to change. As of December 31, 2014, percentages in the table above are based on total investments. Such total investments may differ from the percentage set forth below in the Portfolio of Investments which are computed using the Fund’s net assets.
The Portfolio of Investments are broken down by sectors, and these sectors do not represent industry categories for purposes of identifying “industry concentration” as described in the Investment Company Act of 1940, as amended.
Portfolio of Investments
December 31, 2014
| | | | | | | | |
| Shares | | | | | Fair Value | |
| | | | | | | | |
| | | | Common Stocks — 98.0% | | | | |
| | | | Australia — 2.3% | | | | |
| | | | Financials — 2.3% | | | | |
| | 26,000 | | | Suncorp Group Ltd. | | $ | 297,053 | |
| | 10,000 | | | Westpac Banking Corp. | | | 268,989 | |
| | | | | | | | |
| | | | | | | 566,042 | |
| | | | | | | | |
| | | | Belgium — 2.5% | | | | |
| | | | Consumer Staples — 2.5% | | | | |
| | 5,400 | | | Anheuser-Busch InBev NV | | | 607,769 | |
| | | | | | | | |
| | | | Canada — 4.0% | | | | |
| | | | Consumer Discretionary — 2.1% | | | | |
| | 10,000 | | | Dollarama, Inc. | | | 511,276 | |
| | | | | | | | |
| | | | Industrial — 1.9% | | | | |
| | 6,600 | | | Canadian National Railway Co. | | | 454,581 | |
| | | | | | | | |
| | | | | | | 965,857 | |
| | | | | | | | |
| | | | Denmark — 1.8% | | | | |
| | | | Health Care — 1.8% | | | | |
| | 10,500 | | | Novo-Nordisk A/S ADR | | | 444,360 | |
| | | | | | | | |
| | | | France — 8.9% | | | | |
| | | | Energy — 0.5% | | | | |
| | 2,400 | | | Total SA | | | 122,966 | |
| | | | | | | | |
| | | | Financials — 4.0% | | | | |
| | 24,509 | | | AXA SA ADR | | | 561,011 | |
| | 32,000 | | | Credit Agricole SA | | | 413,104 | |
| | | | | | | | |
| | | | | | | 974,115 | |
| | | | | | | | |
| | | | | | | | |
| Shares | | | | | Fair Value | |
| | | | | | | | |
| | | | Health Care — 1.9% | | | | |
| | 5,000 | | | Sanofi-Aventis | | $ | 455,887 | |
| | | | | | | | |
| | | | Industrials — 2.5% | | | | |
| | 9,700 | | | Safran SA | | | 598,486 | |
| | | | | | | | |
| | | | | | | 2,151,454 | |
| | | | | | | | |
| | | | Germany — 10.7% | | | | |
| | | | Financials — 2.3% | | | | |
| | 3,400 | | | Allianz SE | | | 563,171 | |
| | | | | | | | |
| | | | Health Care — 3.8% | | | | |
| | 4,300 | | | Bayer AG | | | 586,170 | |
| | 11,000 | | | Stada Arzneimittel AG | | | 333,795 | |
| | | | | | | | |
| | | | | | | 919,965 | |
| | | | | | | | |
| | | | Industrials — 4.6% | | | | |
| | 17,200 | | | GEA Group AG | | | 756,275 | |
| | 300 | | | OSRAM Licht AG | | | 11,779 | |
| | 3,000 | | | Siemens AG | | | 336,637 | |
| | | | | | | | |
| | | | | | | 1,104,691 | |
| | | | | | | | |
| | | | | | | 2,587,827 | |
| | | | | | | | |
| | | | Hong Kong — 2.1% | | | | |
| | | | Industrials — 2.1% | | | | |
| | 45,000 | | | Hutchison Whampoa Ltd. | | | 514,424 | |
| | | | | | | | |
| | | | Italy — 1.6% | | | | |
| | | | Energy — 1.6% | | | | |
| | 22,200 | | | Eni SpA | | | 388,895 | |
| | | | | | | | |
|
| (See notes which are an integral part of the Financial Statements) |
H U N T I N G T O N F U N D S
Huntington VA International Equity Fund
Portfolio of Investments (continued)
December 31, 2014
| | | | | | | | |
| Shares | | | | | Fair Value | |
| | | | | | | | |
| | | | Common Stocks — (continued) | | | | |
| | | | Japan — 22.3% | | | | |
| | | | Consumer Staples — 2.7% | | | | |
| | 18,000 | | | Unicharm Corp. | | $ | 431,498 | |
| | 7,400 | | | Welcia Holdings Co. Ltd. | | | 219,129 | |
| | | | | | | | |
| | | | | | | 650,627 | |
| | | | | | | | |
| | | | Financials — 2.7% | | | | |
| | 18,000 | | | Mitsubishi Estate Co. Ltd. | | | 379,323 | |
| | 7,700 | | | Sumitomo Mitsui Financial Group, Inc. | | | 278,411 | |
| | | | | | | | |
| | | | | | | 657,734 | |
| | | | | | | | |
| | | | Industrials — 7.4% | | | | |
| | 46,000 | | | KUBOTA Corp. | | | 667,763 | |
| | 12,500 | | | Makita Corp. | | | 563,345 | |
| | 130,000 | | | NTN Corp. | | | 574,178 | |
| | | | | | | | |
| | | | | | | 1,805,286 | |
| | | | | | | | |
| | | | Information Technology — 7.3% | | | | |
| | 1,870 | | | KEYENCE Corp. | | | 833,367 | |
| | 8,600 | | | Murata Manufacturing Co. Ltd. | | | 938,558 | |
| | | | | | | | |
| | | | | | | 1,771,925 | |
| | | | | | | | |
| | | | Telecommunication Services — 2.2% | |
| | 8,800 | | | Softbank Corp. | | | 523,871 | |
| | | | | | | | |
| | | | | | | 5,409,443 | |
| | | | | | | | |
| | | | Singapore — 1.7% | | | | |
| | | | Industrials — 1.6% | | | | |
| | 60,300 | | | Keppel Corp Ltd. | | | 401,898 | |
| | | | | | | | |
| | | | Real Estate Investment Trusts — 0.1% | | | | |
| | 16,884 | | | Keppel REIT | | | 15,506 | |
| | | | | | | | |
| | | | | | | 417,404 | |
| | | | | | | | |
| | | | Spain — 2.2% | | | | |
| | | | Financials — 2.2% | | | | |
| | 55,873 | | | Banco Bilbao Vizcaya SA | | | 527,727 | |
| | 28 | | | Banco Santander SA ADR | | | 233 | |
| | | | | | | | |
| | | | | | | 527,960 | |
| | | | | | | | |
| | | | Sweden — 5.3% | | | | |
| | | | Consumer Discretionary — 2.8% | | | | |
| | 16,600 | | | Hennes & Mauritz AB | | | 689,627 | |
| | | | | | | | |
| | | | Materials — 2.5% | | | | |
| | 27,700 | | | Svenska Cellulosa AB | | | 597,158 | |
| | | | | | | | |
| | | | | | | 1,286,785 | |
| | | | | | | | |
| | | | Switzerland — 12.4% | | | | |
| | | | Financials — 5.1% | | | | |
| | 5,600 | | | ACE Ltd. | | | 643,328 | |
| | 23,780 | | | Credit Suisse Group AG | | | 597,443 | |
| | | | | | | | |
| | | | | | | 1,240,771 | |
| | | | | | | | |
| | | | Health Care — 7.3% | | | | |
| | 9,000 | | | Novartis AG | | | 834,775 | |
| | 6,000 | | | Novartis AG ADR | | | 555,960 | |
| | 1,400 | | | Roche Holding AG | | | 379,357 | |
| | | | | | | 1,770,092 | |
| | | | | | | | |
| | | | | | | 3,010,863 | |
| | | | | | | | |
| | | | | | | | |
| Shares | | | | | Fair Value | |
| | | | | | | | |
| | | | United Kingdom — 17.4% | | | | |
| | | | Consumer Discretionary — 4.1% | | | | |
| | 44,200 | | | Greene King PLC | | $ | 511,022 | |
| | 5,000 | | | Liberty Global PLC, Class A * | | | 251,025 | |
| | 5,000 | | | Liberty Global PLC, Class C * | | | 241,550 | |
| | | | | | | | |
| | | | | | | 1,003,597 | |
| | | | | | | | |
| | | | Consumer Staples — 1.6% | | | | |
| | 4,660 | | | Reckitt Benckiser Group PLC | | | 377,462 | |
| | | | | | | | |
| | | | Health Care — 3.4% | | | | |
| | 5,200 | | | AstraZeneca PLC ADR | | | 365,976 | |
| | 10,645 | | | GlaxoSmithKline PLC ADR | | | 454,967 | |
| | 4,660 | | | Indivior PLC * | | | 10,852 | |
| | | | | | | | |
| | | | | | | 831,795 | |
| | | | | | | | |
| | | | Industrials — 2.4% | | | | |
| | 41,900 | | | Rolls-Royce Holdings PLC | | | 562,923 | |
| | 3,771,000 | | | Rolls-Royce Holdings PLC, Class C | | | 5,878 | |
| | | | | | | | |
| | | | | | | 568,801 | |
| | | | | | | | |
| | | | Telecommunication Services — 4.2% | | | | |
| | 107,000 | | | BT Group PLC | | | 665,600 | |
| | 105,818 | | | Vodafone Group PLC | | | 362,840 | |
| | | | | | | | |
| | | | | | | 1,028,440 | |
| | | | | | | | |
| | | | Utilities — 1.7% | | | | |
| | 16,100 | | | SSE PLC | | | 406,833 | |
| | | | | | | | |
| | | | | | | 4,216,928 | |
| | | | | | | | |
| | | | United States — 2.8% | | | | |
| | | | Health Care — 1.8% | | | | |
| | 3,900 | | | Celgene Corp. * | | | 436,254 | |
| | | | | | | | |
| | | | Telecommunication Services — 1.0% | | | | |
| | 5,102 | | | Verizon Communications, Inc. | | | 239,896 | |
| | | | | | | | |
| | | | | | | 676,150 | |
| | | | Total Common Stocks
(Cost $19,129,824) | | | 23,772,161 | |
| | | | | | | | |
| | | | Cash Equivalents — 1.9% | | | | |
| | 462,587 | | | Huntington Money Market Fund, Institutional Shares, 0.040% (a) (b) | | | 462,587 | |
| | | | | | | | |
| | | | Total Cash Equivalents
(Cost $462,587) | | | 462,587 | |
| | | | | | | | |
| | | | Total Investments
(Cost $19,592,411) — 99.9% | | | 24,234,748 | |
| | | | | | | | |
| | | | Other Assets in Excess of
Liabilities — 0.1% | | | 27,783 | |
| | | | | | | | |
| | | | Net Assets — 100.0% | | $ | 24,262,531 | |
| | | | | | | | |
| (a) | Investment in affiliate. |
| (b) | Rate disclosed is the seven day yield as of December 31, 2014. |
| * | Non-income producing security. |
| | |
| ADR | | —American Depositary Receipt |
|
| (See notes which are an integral part of the Financial Statements) |
Huntington VA Situs Fund
Portfolio of Investments Summary Table (Unaudited)
December 31, 2014
| | | | |
| Asset Allocation | | Percentage of
Market Value | |
Short-Term Securities Held as Collateral for Securities Lending | | | 19.4 | % |
Industrials | | | 19.0 | % |
Information Technology | | | 18.0 | % |
Financials | | | 11.1 | % |
Health Care | | | 10.2 | % |
Consumer Discretionary | | | 8.9 | % |
Materials | | | 4.7 | % |
Consumer Staples | | | 3.3 | % |
Energy | | | 2.0 | % |
Utilities | | | 1.3 | % |
Exchange-Traded Funds | | | 0.9 | % |
Real Estate Investment Trusts | | | 0.8 | % |
Telecommunication Services | | | 0.3 | % |
Cash(a) | | | 0.1 | % |
| | | | |
Total | | | 100.0 | % |
| (a) | Investments in an affiliated money market fund. |
Portfolio holdings and allocations are subject to change. As of December 31, 2014, percentages in the table above are based on total investments. Such total investments may differ from the percentage set forth below in the Portfolio of Investments which are computed using the Fund’s net assets.
The Portfolio of Investments Summary Table and the Portfolio of Investments are broken down by sectors, and these sectors do not represent industry categories for purposes of identifying “industry concentration” as described in the Investment Company Act of 1940, as amended.
Portfolio of Investments
December 31, 2014
| | | | | | | | |
| Shares | | | | | Fair Value | |
| | | | | | | | |
| | | | Common Stocks — 98.6% | | | | |
| | | | Bermuda — 2.4% | | | | |
| | | | Financials — 2.4% | | | | |
| | 25,000 | | | Arch Capital Group Ltd. * | | $ | 1,477,500 | |
| | | | | | | | |
| | | | Chile — 0.0% | | | | |
| | | | Materials — 0.0% | | | | |
| | 800 | | | Sociedad Quimica y Minera de Chile SA ADR | | | 19,104 | |
| | | | | | | | |
| | | | Finland — 0.7% | | | | |
| | | | Industrials — 0.7% | | | | |
| | 2,000 | | | Cargotec Oyj | | | 61,393 | |
| | 8,400 | | | Kone Oyj (a) | | | 382,462 | |
| | | | | | | | |
| | | | | | | 443,855 | |
| | | | | | | | |
| | | | Germany — 0.1% | | | | |
| | | | Health Care — 0.1% | | | | |
| | 1,900 | | | Stada Arzneimittel AG | | | 57,656 | |
| | | | | | | | |
| | | | Hong Kong — 0.1% | | | | |
| | | | Consumer Discretionary — 0.1% | | | | |
| | 13,000 | | | Television Broadcasts Ltd. | | | 75,656 | |
| | | | | | | | |
| | | | Japan — 0.3% | | | | |
| | | | Industrials — 0.1% | | | | |
| | 3,500 | | | Sato Corp. | | | 79,569 | |
| | | | | | | | |
| | | | Information Technology — 0.2% | | | | |
| | 14,800 | | | Furuno Electric Co. Ltd. | | | 118,831 | |
| | | | | | | | |
| | | | | | | 198,400 | |
| | | | | | | | |
| | | | | | | | |
| Shares | | | | | Fair Value | |
| | | | | | | | |
| | | | Sweden — 0.1% | | | | |
| | | | Consumer Discretionary — 0.1% | | | | |
| | 4,800 | | | Haldex AB | | $ | 62,211 | |
| | | | | | | | |
| | | | Switzerland — 0.3% | | | | |
| | | | Consumer Discretionary — 0.3% | | | | |
| | 3,500 | | | Garmin Ltd. (a) | | | 184,905 | |
| | | | | | | | |
| | | | United Kingdom — 0.6% | | | | |
| | | | Industrials — 0.6% | | | | |
| | 4,800 | | | Concentric AB | | | 56,911 | |
| | 26,424 | | | Halma PLC | | | 281,489 | |
| | | | | | | | |
| | | | | | | 338,400 | |
| | | | | | | | |
| | | | United States — 94.0% | | | | |
| | | | Consumer Discretionary — 10.5% | | | | |
| | 40,300 | | | Cabela’s, Inc., Class A (a) * | | | 2,124,213 | |
| | 1,200 | | | EZCORP, Inc., Class A * | | | 14,100 | |
| | 7,000 | | | Papa John’s International, Inc. | | | 390,600 | |
| | 30,000 | | | Sonic Corp. | | | 816,900 | |
| | 40,000 | | | Tractor Supply Co. | | | 3,152,800 | |
| | | | | | | | |
| | | | | | | 6,498,613 | |
| | | | | | | | |
| | | | Consumer Staples — 4.1% | | | | |
| | 10,700 | | | Darling Ingredients, Inc. (a) * | | | 194,312 | |
| | 15,100 | | | Fresh Del Monte Produce, Inc. | | | 506,605 | |
| | 22,000 | | | Sanderson Farms, Inc. | | | 1,848,550 | |
| | | | | | | | |
| | | | | | | 2,549,467 | |
| | | | | | | | |
| | | | Energy — 2.5% | | | | |
| | 25,000 | | | CARBO Ceramics, Inc. (a) | | | 1,001,250 | |
| | 7,000 | | | Denbury Resources, Inc. | | | 56,910 | |
|
| (See notes which are an integral part of the Financial Statements) |
H U N T I N G T O N F U N D S
Huntington VA Situs Fund
Portfolio of Investments (continued)
December 31, 2014
| | | | | | | | |
| Shares | | | | | Fair Value | |
| | | | | | | | |
| | | | Common Stocks — (continued) | | | | |
| | | | Energy — (continued) | | | | |
| | 3,500 | | | Dril-Quip, Inc. * | | $ | 268,555 | |
| | 1,000 | | | Matrix Service Co. * | | | 22,320 | |
| | 5,000 | | | SM Energy Co. | | | 192,900 | |
| | | | | | | | |
| | | | | | | 1,541,935 | |
| | | | | | | | |
| | | | Financials — 11.4% | | | | |
| | 25,000 | | | Cullen/Frost Bankers, Inc. | | | 1,766,000 | |
| | 40,000 | | | Evercore Partners, Inc. | | | 2,094,800 | |
| | 22,000 | | | International Bancshares Corp. | | | 583,880 | |
| | 27,250 | | | Raymond James Financial, Inc. | | | 1,561,152 | |
| | 13,000 | | | South State Corp. | | | 872,040 | |
| | 10,000 | | �� | Umpqua Holdings Corp. | | | 170,100 | |
| | | | | | | | |
| | | | | | | 7,047,972 | |
| | | | | | | | |
| | | | Health Care — 12.6% | | | | |
| | 15,000 | | | Abaxis, Inc. (a) | | | 852,450 | |
| | 30,000 | | | AmSurg Corp. * | | | 1,641,900 | |
| | 650 | | | Bio-Rad Laboratories, Inc., Class A * | | | 78,364 | |
| | 20,000 | | | Cerner Corp. * | | | 1,293,200 | |
| | 10,000 | | | Edwards LifeSciences Corp. * | | | 1,273,800 | |
| | 8,000 | | | Luminex Corp. * | | | 150,080 | |
| | 70,000 | | | Myriad Genetics, Inc. (a) * | | | 2,384,200 | |
| | 7,000 | | | Osiris Therapeutics, Inc. (a) * | | | 111,930 | |
| | 1 | | | PharMerica Corp. * | | | 21 | |
| | | | | | | | |
| | | | | | | 7,785,945 | |
| | | | | | | | |
| | | | Industrials — 22.1% | | | | |
| | 6,000 | | | B/E Aerospace, Inc. * | | | 348,120 | |
| | 17,000 | | | EnPro Industries, Inc. (a) * | | | 1,066,920 | |
| | 19,600 | | | Flowserve Corp. | | | 1,172,668 | |
| | 3,000 | | | KLX, Inc. * | | | 123,750 | |
| | 20,000 | | | Lindsay Corp. (a) | | | 1,714,800 | |
| | 4,500 | | | Old Dominion Freight Line, Inc. * | | | 349,380 | |
| | 12,000 | | | Quanta Services, Inc. * | | | 340,680 | |
| | 1,000 | | | Ryder System, Inc. | | | 92,850 | |
| | 230,000 | | | TASER International, Inc. (a) * | | | 6,090,400 | |
| | 34,000 | | | Trinity Industries, Inc. | | | 952,340 | |
| | 20,000 | | | Watts Water Technologies, Inc., Class A | | | 1,268,800 | |
| | 5,000 | | | Werner Enterprises, Inc. | | | 155,750 | |
| | | | | | | | |
| | | | | | | 13,676,458 | |
| | | | | | | | |
| | | | Information Technology — 22.1% | | | | |
| | 85,000 | | | ACI Worldwide, Inc. * | | | 1,714,450 | |
| | 9,500 | | | Anixter International, Inc. * | | | 840,370 | |
| | 20,000 | | | Cardtronics, Inc. * | | | 771,600 | |
| | 40,000 | | | Diodes, Inc. * | | | 1,102,800 | |
| | 3,000 | | | Exlservice Holdings, Inc. * | | | 86,130 | |
| | 5,000 | | | Fiserv, Inc. * | | | 354,850 | |
| | 95,000 | | | Geospace Technologies Corp. * | | | 2,517,500 | |
| | 33,000 | | | Jabil Circuit, Inc. | | | 720,390 | |
| | 8,600 | | | NVIDIA Corp. | | | 172,430 | |
| | 21,000 | | | Red Hat, Inc. * | | | 1,451,940 | |
| | 15,000 | | | ScanSource, Inc. * | | | 602,400 | |
| | 9,300 | | | Synopsys, Inc. * | | | 404,271 | |
| | | | | | | | |
| Shares | | | | | Fair Value | |
| | | | | | | | |
| | | | Information Technology — (continued) | |
| | 50,000 | | | Trimble Navigation Ltd. * | | $ | 1,327,000 | |
| | 15,000 | | | Tyler Technologies, Inc. * | | | 1,641,600 | |
| | | | | | | | |
| | | | | | | 13,707,731 | |
| | | | | | | | |
| | | | Materials — 5.8% | | | | |
| | 12,000 | | | Albemarle Corp. (a) | | | 721,560 | |
| | 8,500 | | | Eagle Materials, Inc. | | | 646,255 | |
| | 10,000 | | | Quaker Chemical Corp. | | | 920,400 | |
| | 10,800 | | | Scotts Miracle-Gro Co./The, Class A | | | 673,056 | |
| | 8,500 | | | United States Lime & Minerals, Inc. | | | 619,310 | |
| | | | | | | | |
| | | | | | | 3,580,581 | |
| | | | | | | | |
| | | | Real Estate Investment Trusts — 1.0% | |
| | 3,500 | | | Camden Property Trust | | | 258,440 | |
| | 8,500 | | | Equity One, Inc. | | | 215,560 | |
| | 5,000 | | | Weingarten Realty Investors (a) | | | 174,600 | |
| | | | | | | | |
| | | | | | | 648,600 | |
| | | | | | | | |
| | | | Telecommunication Services — 0.3% | |
| | 15,000 | | | General Communication, Inc.,
Class A * | | | 206,250 | |
| | | | | | | | |
| | | | Utilities — 1.6% | | | | |
| | 15,900 | | | Portland General Electric Co. | | | 601,497 | |
| | 11,250 | | | UGI Corp. | | | 427,275 | |
| | | | | | | | |
| | | | | | | 1,028,772 | |
| | | | | | | | |
| | | | | | | 58,272,324 | |
| | | | | | | | |
| | | | Total Common Stocks
(Cost $43,926,244) | | | 61,130,011 | |
| | | | | | | | |
| | | | Exchange-Traded Funds — 1.1% | | | | |
| | 3,500 | | | iShares China Large-Cap ETF | | | 145,670 | |
| | 9,040 | | | RevenueShares Small Cap Fund (a) | | | 515,822 | |
| | | | | | | | |
| | | | Total Exchange-Traded Funds (Cost $588,748) | | | 661,492 | |
| | | | | | | | |
| | | | Cash Equivalents — 0.1% | | | | |
| | 81,083 | | | Huntington Money Market Fund, Institutional Shares, 0.040% (b) (c) | | | 81,083 | |
| | | | | | | | |
| | | | Total Cash Equivalents
(Cost $81,083) | | | 81,083 | |
| | | | | | | | |
| | | | Short-Term Securities Held as Collateral for Securities Lending — 23.9% | | | | |
| | 14,805,531 | | | Fidelity Institutional Money Market Portfolio, Institutional
Class, 0.110% (c) | | | 14,805,531 | |
| | | | | | | | |
| | | | Total Short-Term Securities Held as Collateral for Securities Lending (Cost $14,805,531) | | | 14,805,531 | |
| | | | | | | | |
| | | | Total Investments
(Cost $59,401,606) — 123.7% | | | 76,678,117 | |
| | | | | | | | |
| | | | Liabilities in Excess of Other Assets — (23.7)% | | | (14,706,012 | ) |
| | | | | | | | |
| | | | Net Assets — 100.0% | | $ | 61,972,105 | |
| | | | | | | | |
(See notes which are an integral part of the Financial Statements)
Huntington VA Situs Fund
Portfolio of Investments (continued)
December 31, 2014
| (a) | All or a portion of the security was on loan as of December 31, 2014. The total value of securities on loan as of December 31, 2014 was $14,350,288. |
| (b) | Investment in affiliate. |
| (c) | Rate disclosed is the seven day yield as of December 31, 2014. |
| * | Non-income producing security. |
| | |
| ADR | | —American Depositary Receipt |
| | |
| ETF | | —Exchange-Traded Fund |
H U N T I N G T O N F U N D S
|
| (See notes which are an integral part of the Financial Statements) |
Huntington Funds
Statements of Assets and Liabilities
December 31, 2014
| | | | | | | | | | | | |
| | | Huntington VA
Dividend
Capture Fund | | | Huntington VA
International
Equity Fund | | | Huntington VA
Situs Fund | |
Assets: | | | | | | | | | | | | |
Investments, at cost | | $ | 33,245,289 | | | $ | 19,592,411 | | | $ | 59,401,606 | |
| | | | | | | | | | | | |
Investments, at value | | $ | 34,694,862 | | | $ | 23,772,161 | | | $ | 76,597,034 | |
Investments in affiliated securities, at value | | | 1,005,371 | | | | 462,587 | | | | 81,083 | |
| | | | | | | | | | | | |
Total investments | | | 35,700,233 | | | | 24,234,748 | | | | 76,678,117 | |
Foreign currencies, at value (Cost $-, $22 and $-) | | | — | | | | 27 | | | | — | |
Dividends receivable | | | 108,872 | | | | 28,958 | | | | 38,618 | |
Receivable for investments sold | | | — | | | | — | | | | 354,807 | |
Receivable for shares sold | | | — | | | | 135 | | | | — | |
Receivable from affiliate | | | — | | | | 5,087 | | | | — | |
Tax reclaims receivable | | | 2,912 | | | | 36,433 | | | | 905 | |
Prepaid expenses and other assets | | | 4,441 | | | | 4,174 | | | | 5,441 | |
| | | | | | | | | | | | |
Total assets | | | 35,816,458 | | | | 24,309,562 | | | | 77,077,888 | |
Liabilities: | | | | | | | | | | | | |
Payable for return of collateral on loaned securities | | | 496,352 | | | | — | | | | 14,805,531 | |
Payable for return of short-term borrowings | | | — | | | | — | | | | 117,110 | |
Payable for shares redeemed | | | 54,109 | | | | 7,908 | | | | 107,754 | |
Accrued expenses and other payables: | | | | | | | | | | | | |
Investment advisory | | | 13,428 | | | | 7,562 | | | | 28,236 | |
Administration | | | 5,480 | | | | 3,865 | | | | 9,543 | |
Custodian | | | 1,651 | | | | 2,653 | | | | 3,402 | |
Professional | | | 18,963 | | | | 14,210 | | | | 17,765 | |
Printing and postage | | | 3,089 | | | | 2,094 | | | | 8,901 | |
Transfer and dividend disbursing agent | | | 3,338 | | | | 2,591 | | | | 3,147 | |
Compliance services | | | 538 | | | | 290 | | | | 923 | |
Other | | | 4,520 | | | | 5,858 | | | | 3,471 | |
| | | | | | | | | | | | |
Total Liabilities | | | 601,468 | | | | 47,031 | | | | 15,105,783 | |
| | | | | | | | | | | | |
Net Assets | | $ | 35,214,990 | | | $ | 24,262,531 | | | $ | 61,972,105 | |
| | | | | | | | | | | | |
Net Assets consist of: | | | | | | | | | | | | |
Paid in capital | | $ | 33,080,826 | | | $ | 19,633,015 | | | $ | 38,786,039 | |
Net unrealized appreciation of investments and translations of assets and liabilities in foreign currency | | | 2,454,944 | | | | 4,637,679 | | | | 17,276,403 | |
Accumulated net realized gain (loss) on investments and foreign
currency transactions | | | (1,430,678 | ) | | | (438,624 | ) | | | 5,778,338 | |
Accumulated net investment income | | | 1,109,898 | | | | 430,461 | | | | 131,325 | |
| | | | | | | | | | | | |
Net Assets | | $ | 35,214,990 | | | $ | 24,262,531 | | | $ | 61,972,105 | |
| | | | | | | | | | | | |
Shares Outstanding (unlimited number of shares authorized, no par value) | | | 2,682,527 | | | | 1,537,983 | | | | 2,799,817 | |
| | | | | | | | | | | | |
Net Asset Value, Redemption Price and
Offering Price Per Share | | $ | 13.13 | | | $ | 15.78 | | | $ | 22.13 | |
| | | | | | | | | | | | |
(See notes which are an integral part of the Financial Statements)
Huntington Funds
Statements of Operations
Year Ended December 31, 2014
| | | | | | | | | | | | |
| | | Huntington VA
Dividend Capture
Fund | | | Huntington VA
International Equity
Fund | | | Huntington VA
Situs Fund | |
Investment Income: | | | | | | | | | | | | |
Dividend income | | $ | 1,444,954 | | | $ | 898,071 | | | $ | 583,920 | |
Dividend income from affiliated securities | | | 219 | | | | 268 | | | | 380 | |
Income from securities lending, net(a) | | | 24,593 | | | | 3,499 | | | | 173,791 | |
Foreign dividend taxes withheld | | | (7,996 | ) | | | (124,518 | ) | | | (1,365 | ) |
| | | | | | | | | | | | |
Total investment income | | | 1,461,770 | | | | 777,320 | | | | 756,726 | |
| | | | | | | | | | | | |
Expenses: | | | | | | | | | | | | |
Investment advisory | | | 220,420 | | | | 178,172 | | | | 369,697 | |
Administration | | | 67,120 | | | | 54,156 | | | | 112,353 | |
Custodian | | | 8,648 | | | | 15,438 | | | | 20,262 | |
Transfer and dividend disbursing agent | | | 11,773 | | | | 11,312 | | | | 12,825 | |
Trustee | | | 3,315 | | | | 2,796 | | | | 5,675 | |
Professional | | | 34,674 | | | | 16,921 | | | | 30,166 | |
Printing and postage | | | 20,355 | | | | 9,660 | | | | 57,318 | |
Insurance premiums | | | 3,075 | | | | 3,492 | | | | 4,199 | |
Compliance services | | | 1,609 | | | | 1,216 | | | | 2,789 | |
Line of credit | | | 836 | | | | 629 | | | | 1,273 | |
Interest expense | | | 74 | | | | 54 | | | | 417 | |
Other | | | 13,480 | | | | 19,803 | | | | 15,330 | |
| | | | | | | | | | | | |
Total expenses | | | 385,379 | | | | 313,649 | | | | 632,304 | |
| | | | | | | | | | | | |
Investment advisory fees waived | | | (25,787 | ) | | | (23,256 | ) | | | (23,917 | ) |
| | | | | | | | | | | | |
Net expenses | | | 359,592 | | | | 290,393 | | | | 608,387 | |
| | | | | | | | | | | | |
Net investment income | | | 1,102,178 | | | | 486,927 | | | | 148,339 | |
| | | | | | | | | | | | |
Net Realized/Unrealized Gain (Loss) on Investments, Options and Foreign Currency Transactions: | | | | | | | | | | | | |
Long term capital gain dividends from investment companies | | | 19,582 | | | | — | | | | — | |
Net realized gain on investment transactions | | | 3,520,768 | | | | 1,261,979 | | | | 6,343,941 | |
Net realized loss on foreign currency transactions | | | (2,913 | ) | | | (7,603 | ) | | | (873 | ) |
| | | | | | | | | | | | |
Net realized gain on investments and translation of assets and liabilities in foreign currency transactions | | | 3,537,437 | | | | 1,254,376 | | | | 6,343,068 | |
| | | | | | | | | | | | |
Net change in unrealized depreciation of investments, options and translation of assets and liabilities in foreign currency | | | (1,338,293 | ) | | | (3,756,619 | ) | | | (8,314,538 | ) |
| | | | | | | | | | | | |
Net realized and unrealized gain (loss) on investments, options and foreign currency transactions | | | 2,199,144 | | | | (2,502,243 | ) | | | (1,971,470 | ) |
| | | | | | | | | | | | |
Change in net assets resulting from operations | | $ | 3,301,322 | | | $ | (2,015,316 | ) | | $ | (1,823,131 | ) |
| | | | | | | | | | | | |
(a) Income from securities lending is net of ($23,667, $2,300 and $50,916) expenses paid to Huntington National Bank.
H U N T I N G T O N F U N D S
(See notes which are an integral part of the Financial Statements)
Huntington Funds
Statements of Changes in Net Assets
| | | | | | | | | | | | | | | | | | | | | | | | |
| | | Huntington VA
Dividend Capture Fund | | | Huntington VA
International Equity Fund | | | Huntington VA
Situs Fund | |
| | | Year Ended
Dec. 31, 2014 | | | Year Ended
Dec. 31, 2013 | | | Year Ended
Dec. 31, 2014 | | | Year Ended
Dec. 31, 2013 | | | Year Ended
Dec. 31, 2014 | | | Year Ended
Dec. 31, 2013 | |
Increase (Decrease) in Net Assets: | | | | | | | | | | | | | | | | | | | | | | | | |
Operations: | | | | | | | | | | | | | | | | | | | | | | | | |
Net investment income | | $ | 1,102,178 | | | $ | 1,462,687 | | | $ | 486,927 | | | $ | 543,059 | | | $ | 148,339 | | | $ | 233,572 | |
Long term capital gain dividends from investment companies | | | 19,582 | | | | — | | | | — | | | | — | | | | — | | | | — | |
Net realized gain on investments, options and foreign
currency transactions | | | 3,517,855 | | | | 6,505,851 | | | | 1,254,376 | | | | 2,240,355 | | | | 6,343,068 | | | | 3,788,12643 | |
Net change in unrealized appreciation/depreciation of investments, options and foreign currency transactions | | | (1,338,293 | ) | | | (1,055,802 | ) | | | (3,756,619 | ) | | | 4,212,464 | | | | (8,314,538 | ) | | | 11,282,454 | |
| | | | | | | | | | | | | | | | | | | | | | | | |
Change in net assets resulting
from operations | | | 3,301,322 | | | | 6,912,736 | | | | (2,015,316 | ) | | | 6,995,878 | | | | (1,823,131 | ) | | | 15,304,152 | |
| | | | | | | | | | | | | | | | | | | | | | | | |
Distributions to Shareholders: | | | | | | | | | | | | | | | | | | | | | | | | |
From net investment income | | | (1,450,837 | ) | | | (1,203,200 | ) | | | (551,930 | ) | | | (490,901 | ) | | | (273,158 | ) | | | (186,069 | ) |
From net realized gain
on investments | | | — | | | | — | | | | — | | | | — | | | | (2,815,787 | ) | | | — | |
| | | | | | | | | | | | | | | | | | | | | | | | |
Change in net assets resulting from distributions to shareholders | | | (1,450,837 | ) | | | (1,203,200 | ) | | | (551,930 | ) | | | (490,901 | ) | | | (3,088,945 | ) | | | (186,069 | ) |
| | | | | | | | | | | | | | | | | | | | | | | | |
Change in net assets resulting from capital transactions | | | (7,744,648 | ) | | | 2,623,976 | | | | (9,930,362 | ) | | | (815,638 | ) | | | 4,656,690 | | | | 1,707,110 | |
| | | | | | | | | | | | | | | | | | | | | | | | |
Change in net assets | | | (5,894,163 | ) | | | 8,333,512 | | | | (12,497,608 | ) | | | 5,689,339 | | | | (255,386 | ) | | | 16,825,193 | |
Net Assets: | | | | | | | | | | | | | | | | | | | | | | | | |
Beginning of year | | | 41,109,153 | | | | 32,775,641 | | | | 36,760,139 | | | | 31,070,800 | | | | 62,227,491 | | | | 45,402,298 | |
| | | | | | | | | | | | | | | | | | | | | | | | |
End of year | | $ | 35,214,990 | | | $ | 41,109,153 | | | $ | 24,262,531 | | | $ | 36,760,139 | | | $ | 61,972,105 | | | $ | 62,227,491 | |
| | | | | | | | | | | | | | | | | | | | | | | | |
Accumulated net investment income included in net assets at end
of year | | $ | 1,109,898 | | | $ | 1,378,508 | | | $ | 430,461 | | | $ | 503,067 | | | $ | 131,325 | | | $ | 269,009 | |
| | | | | | | | | | | | | | | | | | | | | | | | |
Capital Transactions: | | | | | | | | | | | | | | | | | | | | | | | | |
Fund Shares sold | | $ | 2,704,460 | | | $ | 3,169,584 | | | $ | 3,834,962 | | | $ | 5,566,334 | | | $ | 8,414,032 | | | $ | 17,670,048 | |
Shares issued in connection
with merger | | | 11,894,194 | | | | 8,124,507 | | | | — | | | | — | | | | 16,321,997 | | | | — | |
Dividends reinvested | | | 1,450,837 | | | | 1,203,200 | | | | 551,930 | | | | 490,901 | | | | 3,088,945 | | | | 186,069 | |
Shares redeemed | | | (23,794,139 | ) | | | (9,873,315 | ) | | | (14,317,254 | ) | | | (6,872,873 | ) | | | (23,168,284 | ) | | | (16,149,007 | ) |
| | | | | | | | | | | | | | | | | | | | | | | | |
Net change resulting from
capital transactions | | $ | (7,744,648 | ) | | $ | 2,623,976 | | | $ | (9,930,362 | ) | | $ | (815,638 | ) | | $ | 4,656,690 | | | $ | 1,707,110 | |
| | | | | | | | | | | | | | | | | | | | | | | | |
Share Transactions: | | | | | | | | | | | | | | | | | | | | | | | | |
Shares sold | | | 209,536 | | | | 268,467 | | | | 228,028 | | | | 356,756 | | | | 374,374 | | | | 875,054 | |
Shares issued in connection
with merger | | | 922,746 | | | | 688,657 | | | | — | | | | — | | | | 714,623 | | | | — | |
Dividends reinvested | | | 112,906 | | | | 97,425 | | | | 32,736 | | | | 29,290 | | | | 135,302 | | | | 7,901 | |
Shares redeemed | | | (1,838,368 | ) | | | (819,446 | ) | | | (854,282 | ) | | | (438,619 | ) | | | (1,022,652 | ) | | | (777,770 | ) |
| | | | | | | | | | | | | | | | | | | | | | | | |
Net change resulting from
share transactions | | | (593,180 | ) | | | 235,103 | | | | (593,518 | ) | | | (52,573 | ) | | | 201,647 | | | | 105,185 | |
| | | | | | | | | | | | | | | | | | | | | | | | |
(See notes which are an integral part of the Financial Statements)
[THIS PAGE INTENTIONALLY LEFT BLANK]
H U N T I N G T O N F U N D S
Huntington Funds
Financial Highlights
(For a share outstanding throughout each year ended December 31)
| | | | | | | | | | | | | | | | | | | | | | | | | | | | |
| | | Net Asset
Value,
Beginning
of Year | | | Net
Investment
Income
(Loss) | | | Net Realized
and Unrealized
Gain (Loss) on
Investments | | | Total From
Investment
Operations | | |
Distributions
from Net
Investment
Income | | | Distributions
from Net
Realized Gain
on Investment
Transactions | | | Total
Distributions | |
Huntington VA Dividend Capture Fund | |
2010 | | $ | 8.87 | | | | 0.38 | | | | 0.91 | | | | 1.29 | | | | (0.41 | ) | | | — | | | | (0.41 | ) |
2011 | | $ | 9.75 | | | | 0.44 | | | | 0.25 | | | | 0.69 | | | | (0.38 | ) | | | — | | | | (0.38 | ) |
2012 | | $ | 10.06 | | | | 0.45 | | | | 0.70 | | | | 1.15 | | | | (0.43 | ) | | | — | | | | (0.43 | ) |
2013 | | $ | 10.78 | | | | 0.43 | | | | 1.72 | | | | 2.15 | | | | (0.38 | ) | | | — | | | | (0.38 | ) |
2014 | | $ | 12.55 | | | | 0.39 | (c) | | | 0.87 | | | | 1.26 | | | | (0.68 | ) | | | — | | | | (0.68 | ) |
Huntington VA International Equity Fund | |
2010 | | $ | 13.42 | | | | 0.14 | | | | 1.06 | | | | 1.20 | | | | (0.16 | ) | | | — | | | | (0.16 | ) |
2011 | | $ | 14.46 | | | | 0.17 | | | | (1.84 | ) | | | (1.67 | ) | | | (0.16 | ) | | | — | | | | (0.16 | ) |
2012 | | $ | 12.63 | | | | 0.23 | | | | 1.54 | | | | 1.77 | | | | (0.17 | ) | | | — | | | | (0.17 | ) |
2013 | | $ | 14.23 | | | | 0.26 | | | | 2.99 | | | | 3.25 | | | | (0.23 | ) | | | — | | | | (0.23 | ) |
2014 | | $ | 17.25 | | | | 0.28 | (c) | | | (1.40 | ) | | | (1.12 | ) | | | (0.35 | ) | | | — | | | | (0.35 | ) |
Huntington VA Situs Fund | |
2010 | | $ | 11.62 | | | | 0.01 | | | | 3.41 | | | | 3.42 | | | | (0.05 | ) | | | — | | | | (0.05 | ) |
2011 | | $ | 14.99 | | | | (0.01 | ) | | | (0.13 | ) | | | (0.14 | ) | | | — | (d) | | | — | | | | — | (d) |
2012 | | $ | 14.85 | | | | 0.09 | | | | 3.27 | | | | 3.36 | | | | — | | | | — | | | | — | |
2013 | | $ | 18.21 | | | | 0.08 | | | | 5.73 | | | | 5.81 | | | | (0.07 | ) | | | — | | | | (0.07 | ) |
2014 | | $ | 23.95 | | | | 0.07 | | | | (0.52 | ) | | | (0.45 | ) | | | (0.12 | ) | | | (1.25 | ) | | | (1.37 | ) |
| | | | | | | | | | | | | | | | | | | | | | | | | | | | | |
| (a) | Total returns do not include any insurance, sales or administrative charges of variable annuity or life insurance contracts. If these were included, the returns would be lower. |
| (b) | If applicable, certain fees were waived and/or reimbursed. If such waivers/reimbursements had not occurred, the ratios would have been as indicated. |
| (c) | Calculated using average shares for the year. |
| (d) | Amount is less than $0.005. |
| (e) | Rounds to less than 0.005%. |
(See notes which are an integral part of the Financial Statements)
| | | | | | | | | | | | | | | | | | | | | | | | | | |
Net Asset
Value,
End of
Year | | | Total
Return(a) | | | Ratio of Net
Expenses
to Average
Net Assets | | | Ratio of Net
Investment
Income (Loss)
to Average
Net Assets | | | Ratio of
Expenses
(Prior to
Reimbursements)
to Average
Net Assets(b) | | | Net Assets,
End of Year
(000 Omitted) | | | Portfolio
Turnover
Rate | |
| | | | | | | | | | | | | | | | | | | | | | | | | | |
| $ | 9.75 | | | | 15.12 | % | | | 0.98 | % | | | 3.54 | % | | | 0.98 | % | | $ | 33,625 | | | | 120 | % |
| $ | 10.06 | | | | 7.07 | % | | | 0.97 | % | | | 3.74 | % | | | 0.97 | % | | $ | 31,826 | | | | 142 | % |
| $ | 10.78 | | | | 11.47 | % | | | 0.95 | % | | | 3.85 | % | | | 0.95 | % | | $ | 32,776 | | | | 110 | % |
| $ | 12.55 | | | | 19.96 | % | | | 0.98 | % | | | 3.63 | % | | | 0.98 | % | | $ | 41,109 | | | | 118 | % |
| $ | 13.13 | | | | 10.16 | % | | | 0.98 | % | | | 3.00 | % | | | 1.05 | % | | $ | 35,215 | | | | 103 | % |
| | | | | | | | | | | | | | | | | | | | | | | | | | |
| $ | 14.46 | | | | 9.18 | % | | | 1.10 | % | | | 1.42 | % | | | 1.10 | % | | $ | 22,648 | | | | 35 | % |
| $ | 12.63 | | | | (11.55 | )% | | | 1.03 | % | | | 1.77 | % | | | 1.03 | % | | $ | 26,085 | | | | 36 | % |
| $ | 14.23 | | | | 14.04 | % | | | 1.00 | % | | | 1.79 | % | | | 1.00 | % | | $ | 31,071 | | | | 25 | % |
| $ | 17.25 | | | | 22.90 | % | | | 0.99 | % | | | 1.62 | % | | | 1.01 | % | | $ | 36,760 | | | | 57 | % |
| $ | 15.78 | | | | (6.63 | )% | | | 0.98 | % | | | 1.64 | % | | | 1.06 | % | | $ | 24,263 | | | | 9 | % |
| | | | | | | | | | | | | | | | | | | | | | | | | | |
| $ | 14.99 | | | | 29.61 | % | | | 1.02 | % | | | 0.13 | % | | | 1.02 | % | | $ | 23,683 | | | | 19 | % |
| $ | 14.85 | | | | (0.91 | )% | | | 0.99 | % | | | — | (e) | | | 0.99 | % | | $ | 35,271 | | | | 14 | % |
| $ | 18.21 | | | | 22.63 | % | | | 0.96 | % | | | 0.55 | % | | | 0.96 | % | | $ | 45,402 | | | | 10 | % |
| $ | 23.95 | | | | 31.92 | % | | | 0.94 | % | | | 0.42 | % | | | 0.94 | % | | $ | 62,227 | | | | 26 | % |
| $ | 22.13 | | | | (2.06 | )% | | | 0.99 | % | | | 0.24 | % | | | 1.03 | % | | $ | 61,972 | | | | 21 | % |
| | | | | | | | | | | | | | | | | | | | | | | | | | | |
H U N T I N G T O N F U N D S
Huntington Funds
Notes to Financial Statements
December 31, 2014
The Huntington Funds (the “Trust”) was organized as a Delaware statutory trust on June 23, 2006. The Trust is registered under the Investment Company Act of 1940, as amended (the “1940 Act”), as an open-end management investment company. As of December 31, 2014, the Trust operated 12 separate series, or mutual funds, each with its own investment objective and strategy. This report contains financial statements and financial highlights of the funds listed below (individually referred to as a “Fund”, or collectively as the “Funds”):
Huntington VA Dividend Capture Fund (“VA Dividend Capture Fund”)
Huntington VA International Equity Fund (“VA International Equity Fund”)
Huntington VA Situs Fund (“VA Situs Fund”)
The prospectus provides a description of each Fund’s investment objectives, policies and strategies along with information on the classes of shares currently being offered. The price at which the Funds will offer or redeem shares is the net asset value (“NAV”) per share next determined after the order is considered received. The assets of each Fund are segregated and a shareholder’s interest is limited to the Fund in which shares are held.
The Trust accounts for the assets, liabilities and operations of each Fund separately. Shares of the Funds are not offered directly to the public, but pursuant to an exemptive order granted by the Securities and Exchange Commission and procedures adopted by the Trust’s Board of Trustees (the “Trustees”), the Funds were sold during the year only to separate accounts of Hartford Life Insurance Company, Hartford Life and Annuity Insurance Company, Lincoln Insurance Company, Nationwide Insurance Company, Delaware Life Insurance Company, Forethought Life Insurance Company, and Transamerica Life Insurance Company for use with their respective variable insurance contracts and policies.
Under the Trust’s organizational documents, its officers and Trustees are indemnified against certain liabilities arising out of the performance of their duties to the Funds. In addition, in the normal course of business, the Trust may enter into contracts with vendors and others that provide for general indemnifications. The Trust’s maximum exposure under these arrangements is unknown, as this would involve future claims that may be made against the Trust. However, based on experience, the Trust expects that risk of loss to be remote.
On June 20, 2014, the VA Dividend Capture Fund acquired all of the assets and assumed all of the liabilities of the Huntington VA Income Equity Fund (“VA Income Equity Fund”), and the VA Situs Fund acquired all of the assets and assumed all of the liabilities of the Huntington VA Mid Corp America Fund (“VA Mid Corp America Fund”), pursuant to an agreement and plan of reorganization approved by the Trustees on January 30, 2014. The reorganization provides shareholders of the VA Income Equity Fund and VA Mid Corp America Fund access to a larger and more diversified portfolio with a similar investment strategy and lower expenses. The reorganizations qualified as tax-free reorganizations for federal income tax purposes with no gain or loss recognized to the funds or their shareholders.
With respect to the VA Dividend Capture Fund and VA Income Equity Fund merger, the acquisition was accomplished by a tax-free exchange of 922,746 shares of the VA Dividend Capture Fund (valued at $11,894,194) for 1,090,350 shares of the VA Income Equity Fund outstanding on June 20, 2014. The investment portfolio of the VA Income Equity Fund, with a fair value of $11,491,112 and identified cost of $10,018,073, was the principal asset acquired by the VA Dividend Capture Fund. For financial reporting purposes, assets received and shares issued by the VA Dividend Capture Fund were recorded at fair value; however, the identified cost of the investments received from the VA Income Equity Fund was carried forward to align ongoing reporting of the VA Dividend Capture Fund’s realized and unrealized gains and losses with amounts distributable to shareholders for tax purposes. The aggregate net assets of the VA Dividend Capture Fund immediately before the acquisition were $28,867,249. The net assets of the VA Income Equity Fund at that date of $11,894,194, including $1,473,039 of unrealized appreciation, were combined with those of the VA Dividend Capture Fund, resulting in combined net assets of $40,761,443.
Assuming the acquisition had been completed on January 1, 2014, the beginning of the annual reporting period of the VA Dividend Capture Fund, the VA Dividend Capture Fund’s pro forma results of operations for the year ended December 31, 2014, are as follows:
| | | | |
Net Investment Income(a) | | $ | 1,440,834 | |
Net Realized and Unrealized Gain on Investments | | | 2,778,239 | |
Net Increase in Net Assets Resulting From Operations | | | 4,219,073 | |
| | (a) | Net Investment Income includes $16,800 of pro forma additional merger expenses. |
Huntington Funds
Notes to Financial Statements (continued)
December 31, 2014
With respect to the VA Situs Fund and VA Mid Corp America Fund merger, the acquisition was accomplished by a tax-free exchange of 714,623 shares of the VA Situs Fund (valued at $16,321,997) for 1,952,602 shares of the VA Mid Corp America Fund outstanding on June 20, 2014. The investment portfolio of the VA Mid Corp America Fund, with a fair value of $15,896,411 and identified cost of $12,865,034, was the principal asset acquired by the VA Situs Fund. For financial reporting purposes, assets received and shares issued by the VA Situs Fund were recorded at fair value; however, the identified cost of the investments received from the VA Mid Corp America Fund was carried forward to align ongoing reporting of the VA Situs Fund’s realized and unrealized gains and losses with amounts distributable to shareholders for tax purposes. The aggregate net assets of the VA Situs Fund immediately before the acquisition were $54,403,068. The net assets of the VA Mid Corp America Fund at that date of $16,321,997, including $3,031,377 of unrealized appreciation, were combined with those of the VA Situs Fund, resulting in combined net assets of $70,725,065.
Assuming the acquisition had been completed on January 1, 2014, the beginning of the annual reporting period of the VA Situs Fund, the VA Situs Fund’s pro forma results of operations for the year ended December 31, 2014, are as follows:
| | | | |
Net Investment Income(a) | | $ | 178,639 | |
Net Realized and Unrealized Loss on Investments | | | (1,512,182 | ) |
Net Decrease in Net Assets Resulting From Operations | | | (1,333,543 | ) |
| | (a) | Net Investment Income includes $16,800 of pro forma additional merger expenses. |
Because the investment portfolios of VA Dividend Capture Fund and VA Situs Fund have each been managed as single portfolios since their respective acquisitions were completed, it is not practicable to separate the amounts of revenue and earnings of the VA Income Equity Fund and VA Mid Corp America Fund that have been included in the accompanying relevant Statements of Operations since June 20, 2014.
| (2) | Significant Accounting Policies |
The Funds are each an investment company and each follows accounting and reporting guidance under Financial Accounting Standards Board (“FASB”) Accounting Standards Codification (“ASC”) Topic 946, “Financial Services-Investment Companies”. The following is a summary of significant accounting policies consistently followed by the Funds in the preparation of their financial statements. The policies are in conformity with accounting principles generally accepted in the United States of America (“GAAP”).
The preparation of financial statements in conformity with GAAP requires management to make estimates and assumptions that affect the amounts of assets, liabilities, and disclosure of contingent assets and liabilities at the date of the financial statements and the reported amounts of income and expenses for the period. Actual results could differ from those estimates.
The Trust calculates the NAV for each of the Funds by valuing securities held based on fair value. Fair value is defined as the price that would be received to sell an asset or paid to transfer a liability in an orderly transaction between market participants at the measurement date.
The valuation techniques described below maximize the use of observable inputs and minimize the use of unobservable inputs in determining fair value. The inputs used for valuing the Funds’ investments are summarized in the three broad levels listed below:
| | |
| |
• Level 1 | | - quoted prices in active markets for identical assets. |
| |
• Level 2 | | - other significant observable inputs (including quoted prices for similar securities, interest rates, prepayment speeds, credit risk, etc.). |
| |
• Level 3 | | - significant unobservable inputs (including the Funds’ own assumptions in determining the fair value of investments). |
Changes in valuation techniques may result in transfers in or out of an assigned level within the disclosure hierarchy. The Trust recognizes transfers between fair value hierarchy levels at the reporting period end. The inputs or methodology used for valuing investments is not necessarily an indication of the risk associated with investing in those investments.
In computing the NAV of the Funds, fair value is based on market valuations with respect to portfolio securities for which market quotations are readily available. Pursuant to Trustee-approved policies, the Trust relies on certain security pricing services to provide the current market value of securities. Those security pricing services value equity securities (including foreign equity securities, exchange-traded funds and closed-end funds) traded on a securities exchange at the last reported sales price on the principal exchange. Equity securities quoted by NASDAQ are valued at the NASDAQ official closing price. If there is no
H U N T I N G T O N F U N D S
Huntington Funds
Notes to Financial Statements (continued)
December 31, 2014
reported sale on the principal exchange, and in the case of over-the counter securities, equity securities are valued at a bid price estimated by the security pricing service. In each of these situations, valuations are typically categorized as Level 1 in the fair value hierarchy. Investments in open-end investment companies are valued at their respective net asset value as reported by such companies and are typically categorized as Level 1 in the fair value hierarchy.
Option contracts are generally valued using the closing price based on quote data from the six major U.S. options exchanges on which such options are traded which are typically categorized as Level 1 in the fair value hierarchy.
Securities for which market quotations are not readily available are valued at fair value under Trust procedures approved by the Trustees. In these cases, a Pricing Committee established and appointed by the Trustees determines in good faith, subject to Trust procedures, the fair value of portfolio securities held by a Fund (“good faith fair valuation”). When a good faith fair valuation of a security is required, consideration is generally given to a number of factors including, but not limited to the following: dealer quotes, published analyses by dealers or analysts regarding the security, transactions which provide implicit valuation of the security (such as a merger or tender offer transaction), the value of other securities or contracts which derive their value from the security at issue, and the implications of any other circumstances which have caused trading in the security to halt. With respect to certain categories of securities, the procedures utilized by the Pricing Committee detail specific valuation methodologies to be applied in lieu of considering the aforementioned list of factors. Depending on the source and relative significance of valuation inputs, these instruments may be classified as Level 2 or Level 3 in the fair value hierarchy.
Fair valuation procedures are also used when a significant event affecting the value of a portfolio security is determined to have occurred between the time when the price of the portfolio security is determined and the close of trading on the NYSE, which is when each Fund’s NAV is computed. An event is considered significant if there is both an affirmative expectation that the security’s value will change in response to the event and a reasonable basis for quantifying the resulting change in value. Significant events include significant securities market movements occurring between the time the price of the portfolio security is determined and the close of trading on the NYSE. For domestic fixed income securities, such events may occur where the cut-off time for the market information used by the independent pricing service is earlier than the end of regular trading on the NYSE. For securities normally priced at their last sale price in a foreign market, such events can occur between the close of trading in the foreign market and the close of trading on the NYSE.
In some cases, events affecting the issuer of a portfolio security may be considered significant events. Examples of potentially significant events include announcements concerning earnings, acquisitions, new products, management changes, litigation developments, a strike or natural disaster affecting the company’s operations or regulatory changes or market developments affecting the issuer’s industry occurring between the time when the price of the portfolio security is determined and the close of trading on the NYSE. For securities of foreign issuers, such events could also include political or other developments affecting the economy or markets in which the issuer conducts its operations or its securities are traded.
There can be no assurance that a Fund could purchase or sell a portfolio security at the price used to calculate the Fund’s NAV. In the case of good faith fair valued portfolio securities, lack of information and uncertainty as to the significance of information may lead to a conclusion that a prior valuation is the best indication of a portfolio security’s present value. Good faith fair valuations generally remain unchanged until new information becomes available. Consequently, changes in good faith fair valuation of portfolio securities may be less frequent and of greater magnitude than changes in the price of portfolio securities valued at their last sale price, by an independent pricing service, or based on market quotations.
The Funds’ Trustees have authorized the use of an independent fair valuation service. If the movement in a designated U.S. market index, after foreign markets close, is greater than predetermined levels, the Funds may use a systematic valuation model provided from that independent third party to fair value its international equity securities. Securities which are fair value according to this model are then typically categorized as Level 2 in the fair value hierarchy.
Huntington Funds
Notes to Financial Statements (continued)
December 31, 2014
The following is a summary of the inputs used to value the Funds’ investments as of December 31, 2014 based on the three levels defined previously:
| | | | | | | | | | | | | | | | |
| | | LEVEL 1 | | | LEVEL 2 | | | LEVEL 3 | | | Total | |
VA Dividend Capture Fund | | | | | | | | | | | | | | | | |
Investment Securities: | | | | | | | | | | | | | | | | |
Common Stocks | | $ | 24,280,558 | | | $ | — | | | $ | — | | | $ | 24,280,558 | |
Preferred Stocks | | | 8,558,652 | | | | — | | | | — | | | | 8,558,652 | |
Exchange-Traded Funds | | | 1,359,300 | | | | — | | | | — | | | | 1,359,300 | |
Cash Equivalents | | | 1,005,371 | | | | — | | | | — | | | | 1,005,371 | |
Short-Term Securities Held as Collateral for Securities Lending | | | 496,352 | | | | — | | | | — | | | | 496,352 | |
| | | | | | | | | | | | | | | | |
Total Investment Securities | | | 35,700,233 | | | | — | | | | — | | | | 35,700,233 | |
| | | | | | | | | | | | | | | | |
VA International Equity Fund | | | | | | | | | | | | | | | | |
Investment Securities: | | | | | | | | | | | | | | | | |
Common Stocks | | | 5,177,147 | | | | 18,595,014 | | | | — | | | | 23,772,161 | |
Cash Equivalents | | | 462,587 | | | | — | | | | — | | | | 462,587 | |
| | | | | | | | | | | | | | | | |
Total Investment Securities | | | 24,234,748 | | | | 18,595,014 | | | | — | | | | 24,234,748 | |
| | | | | | | | | | | | | | | | |
VA Situs Fund | | | | | | | | | | | | | | | | |
Investment Securities: | | | | | | | | | | | | | | | | |
Common Stocks | | | 59,953,833 | | | | 1,176,178 | | | | — | | | | 61,130,011 | |
Exchange-Traded Funds | | | 661,492 | | | | — | | | | — | | | | 661,492 | |
Cash Equivalents | | | 81,083 | | | | — | | | | — | | | | 81,083 | |
Short-Term Securities Held as Collateral for Securities Lending | | | 14,805,531 | | | | — | | | | — | | | | 14,805,531 | |
| | | | | | | | | | | | | | | | |
Total Investment Securities | | | 75,501,939 | | | | 1,176,178 | | | | — | | | | 76,678,117 | |
| | | | | | | | | | | | | | | | |
Transfers from Level 1 to Level 2 are due to significant movement of a designated U.S. market index, triggering a systematic valuation model provided by an independent third party to fair value the international equity securities at reporting period end. Transfers from Level 2 to Level 1 indicate that the fair value of international equity securities used at the previous reporting period end did not occur as of the current reporting period end.
For the year ended December 31, 2014, there were no Level 3 investments for which significant unobservable inputs were used to determine fair value. The Trust recognizes significant transfers between fair value hierarchy levels at the reporting period end. The following is a summary of the transfers between Level 1 and Level 2 of the fair value hierarchy for the year ended December 31, 2014:
| | | | | | | | |
| | | Transfers from
Level 1 to Level 2 | | | Transfers from
Level 2 to Level 1 | |
VA International Equity Fund | | | | | | | | |
Investment Securities: | | | | | | | | |
Common Stocks | | $ | 17,506,413 | | | $ | — | |
VA Situs Fund | | | | | | | | |
Investment Securities: | | | | | | | | |
Common Stocks | | | 1,176,178 | | | | — | |
| B. | Foreign Currency Translation |
The accounting records of the Funds are maintained in U.S. dollars. Foreign currency amounts are translated into U.S. dollars at the current rate of exchange each business day to determine the value of investments, and other assets and liabilities. Purchases and sales of foreign securities, and income and expenses, are translated at the prevailing rate of exchange on the respective date of these transactions. The Funds do not isolate that portion of the results of operations resulting from changes in foreign exchange rates on investments from fluctuation arising from changes in market prices of securities held. These fluctuations are included with the net realized and unrealized gain or loss from investments and foreign currency transactions.
Certain of the Funds may be subject to equity price risk and foreign currency exchange risk in the normal course of pursuing their investment objectives. Certain of the Funds may invest in various financial instruments including positions in foreign currency contracts and written option contracts to gain exposure to or hedge against changes in the value of equities or foreign currencies.
H U N T I N G T O N F U N D S
Huntington Funds
Notes to Financial Statements (continued)
December 31, 2014
The following is a description of the derivative instruments utilized by the Funds, including the primary underlying risk exposure related to each instrument type.
Foreign Exchange Contracts—VA International Equity Fund and VA Situs Fund may enter into forward foreign exchange contracts. A forward foreign exchange contract involves an obligation to purchase or sell a specific currency at a future date at a price set at the time of the contract. Such contracts are used to sell unwanted currency exposure that comes with holding securities in a market, or to buy currency exposure where the exposure from holding securities is insufficient to provide the desired currency exposure. The contracts are marked-to-market daily and the change in market value is recorded as unrealized appreciation or depreciation. When a forward foreign currency contract is closed, a Fund records a realized gain or loss equal to the difference between the value at the time it was opened and the value at the time it was closed. These unrealized and realized gains and losses are reported on the Statement of Operations. The Funds could be exposed to risks if the counterparties to the contracts are unable to meet the terms of their contracts and from unanticipated movements in exchange rates. As of December 31, 2014, VA International Equity Fund and VA Situs Fund did not have any forward foreign exchange contracts outstanding.
Written Options Contracts—Certain of the Funds may write options contracts for which premiums received are recorded as liabilities and are subsequently adjusted to the current value of the options written. Premiums received from writing options which expire are treated as realized gains. Premiums received from writing options which are either exercised or closed are offset against the proceeds received or amount paid on the transaction to determine realized gains or losses. Investing in written options contracts exposes a Fund to equity price risk.
The following is a summary of VA Situs Fund’s written option activity for the year ended December 31, 2014:
| | | | | | | | |
Contracts | | Number of Contracts | | | Premium | |
Outstanding at 12/31/2013 | | | 350 | | | $ | 81,954 | |
Options exercised | | | (350 | ) | | | (81,954 | ) |
| | | | | | | | |
Outstanding at 12/31/2014 | | | — | | | $ | — | |
| | | | | | | | |
The following tables identify the location and fair value of derivative instruments on the Statements of Assets and Liabilities as of December 31, 2014, and the effect of derivative instruments on the Statements of Operations for the year ended December 31, 2014.
The effect of Derivative Instruments on the Statements of Operations for the year ended December 31, 2014 was as follows:
| | | | | | | | | | | | |
Primary Risk Exposure | | Location of Gain (Loss)
on Derivatives
Recognized in Income | | Fund | | Realized
Gain (Loss)
on Derivatives
Recognized from
Operations | | | Change in
Unrealized
Appreciation
(Depreciation)
on Derivatives
Recognized from
Operations | |
Option Contracts | | Net realized gain (loss) on written option transactions/net change in unrealized appreciation (depreciation) of investments and written options | | VA Situs Fund | | $ | — | | | $ | 117,921 | |
Huntington Funds
Notes to Financial Statements (continued)
December 31, 2014
Balance Sheet Offsetting Information
The following tables provide a summary of offsetting financial liabilities and derivatives and the effect of derivative instruments on the Statements of Assets and Liabilities as of December 31, 2014.
Securities Loaned
| | | | | | | | | | | | | | | | | | | | | | | | |
| | | | | | | | | | | | Gross Amounts Not Offset in
Statements of Assets and
Liabilities | | | | |
Fund | | Gross Amounts of
Recognized
Liabilities | | | Gross Amounts
Offset in Statements
of Assets and
Liabilities | | | Net Amounts of
Liabilities Presented in
Statements of
Assets and
Liabilities | | | Financial
Instruments | | | Cash Collateral
Pledged | | | Net Amount
(not less than 0) | |
VA Dividend Capture Fund | | $ | 496,352 | | | $ | — | | | $ | 496,352 | | | $ | (496,352 | ) | | $ | — | | | $ | — | |
VA Situs Fund | | | 14,805,531 | | | | — | | | | 14,805,531 | | | | (14,805,531 | ) | | | — | | | | — | |
The notional value of the written options contracts outstanding as of December 31, 2014 and the month-end average notional amount for the year ended December 31, 2014 are detailed in the table below:
| | | | | | | | |
Fund | | Average Month-End
Notional Amount | | | December 31, 2014
Notional Amount | |
VA Situs Fund | | $ | 116,667 | | | $ | — | |
Derivative positions open during the period and at period end are reflected for each Fund in the previous tables. The volume of these positions relative to each Fund’s net assets at the close of the reporting period is generally higher than the volume of such positions at the beginning of the reporting period. The Funds value derivative instruments at fair value and recognize changes in fair value currently in the results on operations.
Netting Agreements—During the ordinary course of business, the Funds may enter into transactions subject to enforceable netting agreements or other similar arrangements (��netting agreements”). Generally, the right to offset in netting agreements allows a Fund to offset any exposure to a specific counterparty with any collateral received or delivered to that counterparty based on the terms of the agreement. Generally, a Fund manages its cash collateral and securities collateral on a counterparty basis. As of December 31, 2014, the Funds were not invested in any portfolio securities or derivatives that could be netted subject to the netting agreements.
To generate additional income, the Funds may lend a certain percentage of their total assets, to the extent permitted by the 1940 Act or the rules or regulations thereunder, on a short-term basis to certain brokers, dealers or other financial institutions pursuant to a securities lending agreement with Morgan Stanley & Co. LLC. In determining whether to lend to a particular broker, dealer or financial institution, Huntington Asset Advisors, Inc. (the “Advisor”) will consider all relevant facts and circumstances, including the size, creditworthiness and reputation of the borrower. Any loans made will be continuously secured by collateral in cash at least equal to 100% of the value of the securities on loan for the Funds, based on the prior day’s closing price. When the collateral falls below specified amounts the lending agent will use its best effort to obtain additional collateral on the next business day to meet required amounts under the security lending agreement. The Funds receive payments from the borrowers equivalent to the dividends and interest that would have been earned on securities on loan. In addition, the Funds lending securities receive an annual minimum securities lending fee and retain a portion of the interest, dividends and other distributions received on investment of cash collateral. Collateral is marked-to market daily. One of the risks in lending portfolio securities, as with other extensions of credit, is the possible delay in recovery of the securities or possible loss of rights in the collateral should the borrower fail financially. Although the loan is fully collateralized, if a borrower defaults, a Fund could lose money. There is also the risk that, when lending portfolio securities, the securities may not be available to a Fund on a timely basis and a Fund may, therefore, lose the opportunity to sell the securities at a desirable price. In addition, in the event that a borrower of securities would file for bankruptcy or become insolvent, disposition of the securities may be delayed pending court action. Loans are subject to termination by the Funds or the borrower at any time and, therefore, are not considered to be illiquid investments. Huntington National Bank (“Huntington”) serves as the custodian for related collateral and receives an annual securities lending fee for collateral monitoring and recordkeeping services.
H U N T I N G T O N F U N D S
Huntington Funds
Notes to Financial Statements (continued)
December 31, 2014
As of December 31, 2014, the following Funds had securities with the following market values on loan and related activity for the year ended December 31, 2014:
| | | | | | | | | | | | | | | | | | | | |
Fund | | Value of Loaned
Securities | | | Value of Collateral | | | Average Loan
Outstanding During
the Year | | | Securities Lending
Income Received by
the Funds | | | Fees Paid by the Funds
to Huntington from
Securities Lending | |
VA Dividend Capture Fund | | $ | 482,936 | | | $ | 496,352 | | | $ | 2,048,983 | | | $ | 48,260 | | | $ | 23,667 | |
VA International Equity Fund | | | — | | | | — | | | | 1,138,188 | | | | 5,799 | | | | 2,300 | |
VA Situs Fund | | | 14,350,288 | | | | 14,805,531 | | | | 14,636,698 | | | | 224,707 | | | | 50,916 | |
| E. | Security Transactions and Related Income |
During the period, investment transactions are accounted for no later than the first calculation of the NAV on the business day following the trade date. For financial reporting purposes, however, security transactions are accounted for on trade date on the last business day of the reporting period. Discounts and premiums on securities purchased are amortized over the lives of the respective securities. Securities gains and losses are calculated on the identified cost basis. Interest income and expenses are accrued daily. Dividends, less foreign tax withholding (if any), are recorded on the ex-dividend date.
| F. | Dividends and Distributions to Shareholders |
Dividends from net investment income, if any, are declared and paid annually by the Funds. Net realized capital gains, if any, are distributed at least annually. The amount of dividends from net investment income and net realized gains are determined in accordance with the federal income tax regulations, which may differ from GAAP. These “book/tax” differences are either considered temporary or permanent in nature. To the extent these differences are permanent in nature (e.g. tax treatment of foreign currency gain/loss, distributions and income received from pass through investments and net investment loss adjustments), such amounts are reclassified within the capital accounts based on their nature for federal income tax purposes; temporary differences do not require reclassification. Temporary differences are primarily attributable to losses deferred due to wash sales and straddles, capital loss carryfowards, non-taxable distributions from underlying investments and the tax treatment of passive foreign investment companies.
The Funds may own shares of real estate investments trusts (“REITs”) which report information on the source of their distributions annually. Distributions received from investments in REITs in excess of income from underlying investments are recorded as realized gain and/or as a reduction to the cost of the individual REIT.
The Funds may invest in Master Limited Partnerships (“MLPs”), which generally are treated as partnerships for Federal income tax purposes. As a limited partner in the MLPs, the Fund includes its allocable share of the MLPs’ taxable income in computing its own taxable income.
Expenses directly attributable to a Fund are charged to that Fund. Expenses not directly attributable to a Fund are allocated proportionally among various Funds or all Funds within the Trust in relation to the net assets of each Fund or on another reasonable basis.
It is the policy of each Fund to qualify or continue to qualify as a regulated investment company by complying with the provisions available to certain investment companies, as defined in applicable sections of the Internal Revenue Code, and to make distributions of net investment income and net realized capital gains sufficient to relieve it from all, or substantially all, federal income taxes. In addition to complying with the federal tax requirements applicable to regulated investment companies, the Funds also plan to comply with certain diversification standards applicable to underlying assets of variable annuity contracts in order to avoid taxation on the variable contract owners with respect to earnings allocable to the contract from investments in the Funds.
Withholding taxes on foreign interest, dividends and capital gains with respect to the Funds have been provided for in accordance with each applicable country’s tax rules and rates.
Huntington Funds
Notes to Financial Statements (continued)
December 31, 2014
As of December 31, 2014, the tax cost of securities and the breakdown of unrealized appreciation (depreciation) for each Fund was as follows:
| | | | | | | | | | | | | | | | |
Fund | | Tax Cost of
Securities | | | Unrealized
Appreciation | | | Unrealized
Depreciation | | | Net Unrealized
Appreciation/
(Depreciation)(a) | |
VA Dividend Capture Fund | | $ | 33,350,070 | | | $ | 3,068,698 | | | $ | (718,535 | ) | | $ | 2,350,163 | |
VA International Equity Fund | | | 19,611,466 | | | | 5,511,580 | | | | (888,298 | ) | | | 4,623,282 | |
VA Situs Fund | | | 59,454,414 | | | | 20,675,870 | | | | (3,452,167 | ) | | | 17,223,703 | |
| | (a) | The differences between the book-basis unrealized appreciation/(depreciation) are attributable primarily to: tax deferral of losses on wash sales, the tax treatment of Trust Preferred securities, hybrid securities and Grantor trusts, differences related to partnership investments, the realization for tax purposes of unrealized gains/losses on investments in passive foreign investment companies and the return of capital adjustments from real estate investment trusts. |
The tax character of distributions paid during the fiscal year ended December 31, 2014, was as follows:
| | | | | | | | | | | | |
| | | Distributions Paid From(a) | | | | |
Fund | | Ordinary
Income | | | Net Long Term
Capital Gains | | | Total Taxable
Distributions | |
VA Dividend Capture Fund | | $ | 1,450,837 | | | $ | — | | | $ | 1,450,837 | |
VA International Equity Fund | | | 551,930 | | | | — | | | | 551,930 | |
VA Situs Fund | | | 273,158 | | | | 2,815,787 | | | | 3,088,945 | |
| | (a) | The tax character of distributions paid may differ from the character of distributions shown on the statements of changes in net assets due to short-term capital gains being treated as ordinary income for tax purposes. |
The tax character of distributions paid during the fiscal year ended December 31, 2013, was as follows:
| | | | | | | | | | | | |
| | | Distributions Paid From(a) | | | | |
Fund | | Ordinary
Income | | | Net Long Term
Capital Gains | | | Total Taxable
Distributions | |
VA Dividend Capture Fund | | $ | 1,203,200 | | | $ | — | | | $ | 1,203,200 | |
VA International Equity Fund | | | 490,901 | | | | — | | | | 490,901 | |
VA Situs Fund | | | 186,069 | | | | — | | | | 186,069 | |
| | (a) | The tax character of distributions paid may differ from the character of distributions shown on the statements of changes in net assets due to short-term capital gains being treated as ordinary income for tax purposes. |
As of December 31, 2014, the components of accumulated earnings (deficit) on a tax basis were as follows:
| | | | | | | | | | | | | | | | | | | | | | | | |
Fund | | Undistributed
Ordinary Income | | | Undistributed
Long-Term
Capital Gains | | | Accumulated
Earnings | | | Accumulated
Capital and
Other Losses | | | Unrealized
Appreciation
(Depreciation) | | | Total
Accumulated
Earnings
(Deficit) | |
VA Dividend Capture Fund | | $ | 1,152,597 | | | $ | — | | | $ | 1,152,597 | | | $ | (1,368,596 | ) | | $ | 2,350,163 | | | $ | 2,134,164 | |
VA International Equity Fund | | | 449,516 | | | | — | | | | 449,516 | | | | (438,624 | ) | | | 4,618,624 | | | | 4,629,516 | |
VA Situs Fund | | | 555,453 | | | | 5,766,948 | | | | 6,322,401 | | | | (359,930 | ) | | | 17,223,595 | | | | 23,186,066 | |
As of December 31, 2014, for federal income tax purposes and the treatment of distributions payable, the following Funds had capital loss carryforwards available to offset future gains, if any, to the extent provided by the Treasury regulations:
| | | | | | | | | | | | | | | | | | | | | | | | |
Fund | | 2015 | | | 2017 | | | 2018 | | | No Expiration
Short-Term(a) | | | No Expiration
Long-Term(b) | | | Total | |
VA Dividend Capture Fund | | $ | — | | | $ | 1,070,854 | | | $ | — | | | $ | — | | | $ | — | | | $ | 1,070,854 | |
VA International Equity Fund | | | — | | | | — | | | | 438,624 | | | | — | | | | — | | | | 438,624 | |
VA Situs Fund | | | 359,930 | | | | — | | | | — | | | | — | | | | — | | | | 359,930 | |
| | (a) | The Regulated Investment Company Modernization Act of 2010 (the “Act”) was enacted on December 22, 2010. The Act makes changes to several tax rules impacting the Funds. The provisions of the Act were effective for the Funds’ fiscal year ending December 31, 2012. Although the Act provides several benefits, including the unlimited carryover of future capital losses, there may be a greater likelihood that all or a portion of each Fund’s pre-enactment capital loss carryovers may expire without being utilized due to the fact that post-enactment capital losses must be utilized before pre-enactment capital loss carryovers may be utilized. Under the Act, new capital losses may now be carried forward indefinitely, and retain the character of the original loss as compared with pre-enactment law, where capital losses could be carried forward for up to eight years, and carried forward as short-term capital losses, irrespective of the character of the original loss. |
| | (b) | Future utilization is limited under current tax law. |
As of December 31, 2014, the following Funds had capital loss carryforwards subject to expiration that are limited as a result of changes in Fund ownership during the year and in prior years:
| | |
Fund | | 2017 |
VA Dividend Capture Fund | | $297,742 |
H U N T I N G T O N F U N D S
Huntington Funds
Notes to Financial Statements (continued)
December 31, 2014
During the fiscal year ended December 31, 2014, the following Funds utilized capital loss carryforwards:
| | | | |
Fund | | Utilized
Amount | |
VA Dividend Capture Fund | | $ | 3,534,715 | |
VA International Equity Fund | | | 1,261,974 | |
VA Situs Fund | | | 191,305 | |
Management of the Funds has reviewed tax positions taken in tax years that remain subject to examination by all major tax jurisdictions, including federal (i.e., the last four tax year ends and the interim tax period since then). Management believes there is no tax liability resulting from unrecognized tax benefits related to uncertain tax positions taken.
| (3) | Investment Advisory Fee and Other Transactions with Affiliates |
Investment Advisory Fee—Huntington Asset Advisors, Inc. (the “Advisor”), a subsidiary of The Huntington National Bank (“Huntington”), serves as the Funds’ investment advisor. The Advisor receives a fee for its services, computed daily and paid monthly, at an annual rate of 0.60% of the average daily net assets of each Fund.
The Advisor has agreed to contractually waive all or a portion of its investment advisory fee for the following funds (based on average daily net assets) to which it is otherwise entitled to receive and/or to reimburse certain operating expenses in order to limit each Fund’s total annual fund expenses (after fee waivers, and/or expense reimbursements, and exclusive of acquired fund fees and expenses, brokerage costs, interest, taxes and dividends, and extraordinary expenses) (“Expense Cap”) to the following:
| | | | | | | | | | | | |
Fund | | Expense Cap | | | Expense Cap
Effective Date | | | Expense Cap
Expiration Date | |
VA Dividend Capture Fund | | | 0.99 | % | | | April 30, 2014 | | | | April 30, 2015 | |
VA International Equity Fund(a) | | | 0.98 | % | | | April 30, 2014 | | | | April 30, 2015 | |
VA Situs Fund | | | 1.00 | % | | | April 30, 2014 | | | | April 30, 2015 | |
| | (a) | Prior to April 30, 2014, the Advisor had agreed to contractually waive all or a portion of its investment advisory fee for the VA International Equity Fund (based on average daily net assets) to which it is otherwise entitled to receive and/or to reimburse certain operating expenses in order to limit the total direct net annual operating expenses and acquired (underlying) fund operating expenses to not more than 1.00% through April 30, 2014. |
Amounts waived or reimbursed in the contractual period may be recouped by the Advisor within three years of the waiver and/or reimbursement. As of December 31, 2014, the following amounts have been waived or reimbursed by the Advisor and are subject to repayment by the respective Fund:
| | | | | | | | |
Fund | | Amount Waived
or Reimbursed | | | Expires
December 31, | |
VA Dividend Capture Fund | | $ | 25,787 | | | | 2017 | |
VA International Equity Fund | | | 9,266 | | | | 2016 | |
| | | 23,256 | | | | 2017 | |
VA Situs Fund | | | 23,917 | | | | 2017 | |
Administrative Fees—Huntington Asset Services, Inc. (“HASI”), a wholly owned subsidiary of Huntington Bancshares, Incorporated, serves as Administrator to the Trust. The fees paid for administrative services are based on the level of average net assets of each Fund for the period, subject to minimum fees in certain circumstances.
| | |
Maximum Administrative Fee | | Average Daily Net Assets of the Trust |
0.1822% | | On the first $4 billion |
0.1650% | | On the next $2 billion |
0.1575% | | On the next $2 billion |
0.1450% | | On assets in excess of $8 billion |
There is no minimum annual fee per fund or class of shares.
Transfer and Dividend Disbursing Agent Fees and Expenses—HASI is the transfer and dividend disbursing agent for the Funds. For its services, HASI receives a yearly fixed amount per shareholder account, subject to a yearly minimum of $6,000 for each of the Funds. HASI is also entitled to receive additional amounts that may be activity or time-based charges, plus reimbursement for out-of-pocket expenses.
Huntington Funds
Notes to Financial Statements (continued)
December 31, 2014
Custodian Fees—Huntington serves as custodian for each of the Funds. Brown Brothers Harriman serves as sub-custodian for the foreign assets of VA International Equity Fund and VA Situs Fund. Huntington and Brown Brothers Harriman receive fees based on the level of a Fund’s average daily net assets for the period, plus out-of-pocket expenses.
General—Certain officers of the Trust are Officers and/or Directors or Trustees of the above companies.
Each Trustee who is not an “interested person” of the Trust, as such term is defined in the 1940 Act, receives a $25,000 annual retainer plus $2,500 per regular Board meeting. The Audit Committee Chairman receives $33,000 annual retainer plus $2,500 per regular Board meeting. The Independent Chairman of the Board receives a $50,000 annual retainer plus $2,500 per regular Board meeting. The Board or a committee may establish ad hoc committees or sub-committees. Any committee or sub-committee member may be compensated by the Funds for incremental work outside of the regular meeting process based on the value added to the Funds. In addition, the Funds reimburse Trustees for out-of-pocket expenses incurred in conjunction with attendance at meetings. For the year ended December 31, 2014, actual Trustee compensation was $299,000 in aggregate from the Trust.
Affiliated Funds—Pursuant to an exemptive order issued by the Securities and Exchange Commission, the Funds may invest in certain affiliated money market funds which are managed by the Advisor. Income distributions earned from investments in these funds are recorded as income from affiliates in the accompanying financial statements. A summary of each Fund’s investment in such affiliated money market funds is set forth below:
| | | | | | | | | | | | | | | | | | | | |
Money Market Fund | | 12/31/13
Market Value | | | Purchases | | | Sales | | | 12/31/14
Market Value | | | Income | |
VA Dividend Capture Fund | | $ | — | | | $ | 1,625,863 | | | $ | (620,492 | ) | | $ | 1,005,371 | | | $ | 43 | |
VA International Equity Fund | | | — | | | | 1,019,142 | | | | (556,555 | ) | | | 462,587 | | | | 13 | |
VA Situs Fund | | | — | | | | 1,871,538 | | | | (1,790,455 | ) | | | 81,083 | | | | 9 | |
| | | | | | | | | | | | | | | | | | | | |
U.S. Treasury Money Market Fund | | 12/31/13
Market Value | | | Purchases | | | Sales | | | 12/31/14
Market Value | | | Income | |
VA Dividend Capture Fund | | $ | 152,351 | | | $ | 17,989,288 | | | $ | (18,141,639 | ) | | $ | — | | | $ | 176 | |
VA International Equity Fund | | | 1,564,721 | | | | 10,436,171 | | | | (12,000,892 | ) | | | — | | | | 255 | |
VA Situs Fund | | | 2,628,213 | | | | 20,960,231 | | | | (23,588,444 | ) | | | — | | | | 371 | |
| (4) | Investment Transactions |
Purchases and sales of investments, excluding short-term securities, for the year ended December 31, 2014, were as follows:
| | | | | | | | |
Fund | | Purchases | | | Sales | |
VA Dividend Capture Fund | | $ | 37,013,258 | | | $ | 56,964,819 | |
VA International Equity Fund | | | 2,513,673 | | | | 11,351,263 | |
VA Situs Fund | | | 12,545,722 | | | | 24,915,955 | |
There were no purchases or sales of long-term U.S. government obligations during the year ended December 31, 2014.
| (5) | Foreign Investment Risk |
Compared with investing in the United States, investing in foreign markets involves a greater degree and variety of risk. Investors in international or foreign markets may face delayed settlements, currency controls and adverse economic developments as well as higher overall transaction costs. In addition, fluctuations in the U.S. dollar’s value versus other currencies may erode or reverse gains from investments denominated in foreign currencies or widen losses. Foreign governments may expropriate assets, impose capital or currency controls, impose punitive taxes, impose limits on ownership or nationalize a company or industry. Any of these actions could have severe effect on security prices and impair the Fund’s ability to bring its capital or income back to the U.S. Exchange rate. Fluctuations also may impair an issuer’s ability to repay U.S. dollar denominated debt, thereby increasing credit risk of such debt. Finally, the value of foreign securities may be affected by incomplete, less frequent or inaccurate financial information about their issuers, social upheavals or political actions ranging from tax code changes to government collapse. Foreign companies may also receive less coverage than U.S. companies by market analysts, and financial reporting standards or regulatory requirements may not be comparable to those applicable to U.S. companies.
The Trust participates in a short-term credit agreement (“Line of Credit”) with Huntington. Prior to December 18, 2014, the Trust’s short-term credit agreement was with Citibank, N.A.. Under the terms of the agreement, the Funds may borrow up to
H U N T I N G T O N F U N D S
Huntington Funds
Notes to Financial Statements (continued)
December 31, 2014
$30 million at an interest rate of LIBOR plus 135 basis points. The purpose of the agreement is to meet temporary or emergency cash needs, including redemption requests that might otherwise require the untimely disposition of securities. Huntington receives an annual facility fee of 0.125% on $30 million as well as an additional annual fee of 0.125% on any unused portion of the credit facility for providing the Line of Credit. Each Fund in the Trust pays a pro-rata portion of this facility fee, and unused fee, plus any interest on amounts borrowed. For the year ended December 31, 2014, the following Funds had borrowings under this, and the previous agreement with Citibank, N.A., Line of Credit.
| | | | | | | | | | | | | | | | | | | | |
Fund | | Average Loan
Balance | | | Weighted Average
Interest Rate | | | Number of Days
Outstanding(a) | | | Interest Expense
Accrued | | | Maximum Loan
Outstanding | |
VA Dividend Capture Fund | | $ | 378,057 | | | | 1.41 | % | | | 5 | | | $ | 74 | | | $ | 1,232,304 | |
VA International Equity Fund | | | 347,466 | | | | 1.41 | | | | 4 | | | | 54 | | | | 1,000,000 | |
VA Situs Fund | | | 373,697 | | | | 1.43 | | | | 33 | | | | 417 | | | | 1,767,697 | |
| | (a) | Number of Days Outstanding represents the total days during the year ended December 31, 2014 that each Fund utilized the Line of Credit. |
As of December 31, 2014, the VA Situs Fund had $117,110 in outstanding borrowings at an interest rate of 1.51% under this Line of Credit.
At a meeting of the Board of Trustees of the Trust held on October 30, 2014, the Trustees considered and approved the recommendation of the Advisor to dissolve and liquidate the VA International Equity Fund on or about the close of business on March 6, 2015. Accordingly, the Advisor will prepare a Plan of Liquidation for execution by the Trust.
Huntington Funds
Report of Independent Registered Public Accounting Firm
The Board of Trustees and Shareholders
of the Huntington Funds:
We have audited the accompanying statements of assets and liabilities of the Huntington VA Dividend Capture Fund, Huntington VA International Equity Fund and Huntington VA Situs Fund (three of the portfolios constituting The Huntington Funds, collectively referred to as the “Funds”), including the portfolios of investments, as of December 31, 2014 and the related statements of operations for the year then ended, the statements of changes in net assets for each of the two years in the period then ended, and the financial highlights for each of the periods indicated therein. These financial statements and financial highlights are the responsibility of the Funds’ management. Our responsibility is to express an opinion on these financial statements and financial highlights based on our audits.
We conducted our audits in accordance with the standards of the Public Company Accounting Oversight Board (United States). Those standards require that we plan and perform the audits to obtain reasonable assurance about whether the financial statements and financial highlights are free of material misstatement. We were not engaged to perform an audit of the Funds’ internal control over financial reporting. Our audits included consideration of internal control over financial reporting as a basis for designing audit procedures that are appropriate in the circumstances, but not for the purpose of expressing an opinion on the effectiveness of the Funds’ internal control over financial reporting. Accordingly, we express no such opinion. An audit also includes examining, on a test basis, evidence supporting the amounts and disclosures in the financial statements and financial highlights, assessing the accounting principles used and significant estimates made by management, and evaluating the overall financial statement presentation. Our procedures included confirmation of securities owned as of December 31, 2014, by correspondence with the custodians and brokers. We believe that our audits provide a reasonable basis for our opinion.
In our opinion, the financial statements and financial highlights referred to above present fairly, in all material respects, the financial position of each of the Huntington Funds referred to above at December 31, 2014, the results of their operations for the year then ended, the changes in their net assets for each of two years in the period then ended, and financial highlights for each of the periods indicated therein, in conformity with U.S. generally accepted accounting principles.

Columbus, Ohio
February 16, 2015
H U N T I N G T O N F U N D S
Huntington Funds
Supplemental Information (Unaudited)
Shareholder Expense Examples
Fund Expenses. As a shareholder of a Fund, you incur ongoing costs, including management fees and other Fund expenses. These examples are intended to help you understand your ongoing costs (in dollars) of investing in the Funds and to compare these costs with the ongoing costs of investing in other mutual funds.
These examples are based on an investment of $1,000.00 invested at the beginning of the period and held for the entire six-month period from July 1, 2014 to December 31, 2014.
Actual Expenses. The “Actual” lines of the table provide information about actual account values and actual expenses. You may use the information on this line together with the amount you invested to estimate the expense that you paid over the period. Simply divide your account value by $1,000.00 (for example, an $8,600.00 account value divided by $1,000.00 = 8.60), then multiply the result by the number in the “Actual” line under the heading entitled “Expenses Paid During Period” to estimate the expenses you paid on your account during this period.
Hypothetical Example for Comparison Purposes. The “Hypothetical” lines of the table provide information about hypothetical account values and hypothetical expenses based on the Funds’ actual expense ratios and an assumed rate of return of 5% per year before expenses, which are not the Funds’ actual returns. The hypothetical account values and expenses may not be used to estimate the actual ending account balance or expenses you paid for the period. You may use this information to compare the ongoing costs of investing in the Funds and other funds. To do so, compare the 5% hypothetical examples with the 5% hypothetical examples that appear in the shareholder reports of other funds.
Please note that the expenses shown in the table are meant to highlight your ongoing costs only and do not reflect any transactional costs, such as withdrawal charges, mortality and expense risk fees and other charges that may be assessed by participating insurance companies under the separate accounts, variable annuity contracts or variable life insurance policies. Therefore, the “Actual” and “Hypothetical” lines of the table are useful in comparing ongoing costs only, and will not help you determine the relative total costs of owning different funds. In addition, if these transactional costs were included, your costs would have been higher.
| | | | | | | | | | | | | | | | |
| | | Beginning
Account
Value,
July 1, 2014 | | | Ending
Account
Value,
December 31, 2014 | | | Expenses
Paid
During
Period(a) | | | Annualized
Expense
Ratio | |
VA Dividend Capture Fund | | | | | | | | | | | | | | | | |
Actual | | $ | 1,000.00 | | | $ | 1,017.00 | | | $ | 5.05 | | | | 0.99 | % |
Hypothetical(b) | | $ | 1,000.00 | | | $ | 1,020.19 | | | $ | 5.06 | | | | 0.99 | % |
VA International Equity Fund | | | | | | | | | | | | | | | | |
Actual | | $ | 1,000.00 | | | $ | 926.20 | | | $ | 4.77 | | | | 0.98 | % |
Hypothetical(b) | | $ | 1,000.00 | | | $ | 1,020.25 | | | $ | 5.00 | | | | 0.98 | % |
VA Situs Fund | | | | | | | | | | | | | | | | |
Actual | | $ | 1,000.00 | | | $ | 965.10 | | | $ | 5.01 | | | | 1.01 | % |
Hypothetical(b) | | $ | 1,000.00 | | | $ | 1,020.11 | | | $ | 5.15 | | | | 1.01 | % |
| (a) | Expenses are equal to the Fund’s annualized expense ratios, multiplied by the average account value over the period, multiplied by 184/365 (to reflect the one-half year period). The annualized expense ratios reflect reimbursement of expenses by the Fund’s Advisor for the period beginning July 1, 2014 to December 31, 2014. The “Financial Highlights” tables in the Fund’s financial statements, included in the report, also show the gross expense ratios, without such reimbursements. |
| (b) | Hypothetical assumes 5% annual return before expenses. |
Huntington Funds
Board of Trustees and Trust Officers (Unaudited)
INDEPENDENT TRUSTEES BACKGROUND
| | |
Name
Age
Positions Held with Trust
Date Service Began with Huntington
Complex | | Principal Occupation(s) During Past Five Years, Previous Position(s) and Other Directorships Held |
Thomas J. Westerfield Age: 59 CHAIRMAN OF THE BOARD and TRUSTEE Began Serving: January 2001 and Chairman since February 2013 | | Principal Occupation(s): Chairman of the Board and Of Counsel, Dinsmore & Shohl LLP (law firm) (August 2005 to present). Previous Position(s): Of Counsel, Cors & Bassett LLC (law firm) (1993-2005). Other Directorships Held: Board Member, Huntington Strategy Shares. |
Mark D. Shary Age: 54 TRUSTEE Began Serving: November 2010 | | Principal Occupation(s): Managing Director, ET Partner (consulting) (2008 to present); Private investor (2007 to present). Previous Position(s): Chief Executive Officer and President, BestTransport.com, Inc. (2003 to 2007); President, Bostech Corporation (2000 to 2002). Other Directorships Held: Board Member, Huntington Strategy Shares; Director, SafeWhite, hc1.com, Updox, MBA Focus, InnerApps, and Vantage Point Logistics (all private companies); Trustee, TechColumbus (non-profit); Director, Healthcare.com (1998-2000) (public company). |
William H. Zimmer, III Age: 61 TRUSTEE Began Serving: December 2006 | | Principal Occupation(s): Chief Executive Officer, Cintel Federal Credit Union, (January 2011 to present); Consultant, WHZIII, LLC (January 2014 to present). Previous Position(s): Consultant, WHZIII, LLC (March 2009 to January 2011); Assistant Treasurer, Dana Holding Corp. (September 2006 to February 2009) (manufacturing); Vice President and Manager, Global Treasury Management, National City Bank (January 2004 to March 2006); Vice President, Treasury Management Operations, Provident Bank (June 2003 to January 2004); Financial Consultant (April 2001 to June 2003). Other Directorships Held: Board Member, Huntington Strategy Shares. |
Officers(a)
| | |
Name
Age
Positions Held with Trust
Address
Date Service Began with Huntington
Complex | | Principal Occupation(s) and Previous Position(s) |
Joseph L. Rezabek Age: 45 PRESIDENT 37 West Broad Street Columbus, OH 43215 Began Serving: February 2013 | | Principal Occupation(s): President, Huntington Asset Services, Inc. (“HASI”) (March 2012 to present); President, Huntington Strategy Shares (February 2013 to present). Previous Position(s): Managing Director and Head of Fund Services, Citi (2006 to 2012); Chief Operating Officer (Milan, Italy), State Street Corporation (1999 to 2006). |
R. Jeffrey Young Age: 50 CHIEF EXECUTIVE OFFICER 37 West Broad Street Columbus, OH 43215 Began Serving: February 2010 | | Principal Occupation(s): Senior Vice President, HASI (January 2010 to present); Chief Executive Officer, Huntington Strategy Shares (November 2010 to present); Chairman of the Board, Valued Advisers Trust (June 2010 to present); Chief Executive Officer and President, Valued Advisers Trust (January 2010 to present); Chairman of the Board, Capitol Series Trust (September 2013 to present). Previous Position(s): President and Chief Executive Officer, Dreman Contrarian Funds (March 2011 to February 2013); Independent Chair, Valued Advisers Trust (August 2008 to January 2010); Managing Director, WealthStone (2007 to 2009); Senior Vice President, Operations, BISYS Fund Services (2006 to 2007); Senior Vice President/Vice President, Client Services, BISYS Fund Services (1994 to 2006). |
H U N T I N G T O N F U N D S
Huntington Funds
Board of Trustees and Trust Officers (continued)
| | |
Name
Age
Positions Held with Trust
Address
Date Service Began with Huntington
Complex | | Principal Occupation(s) and Previous Position(s) |
Martin R. Dean Age: 51 ANTI-MONEY LAUNDERING OFFICER AND CHIEF COMPLIANCE OFFICER 37 West Broad Street Columbus, OH 43215 Began Serving: July 2013 | | Principal Occupation(s): Senior Vice President and Compliance Group Manager, HASI (July 2013 to present); Anti-Money Laundering Officer and Chief Compliance Officer, Huntington Strategy Shares (July 2013 to present). Previous Position(s): Director and Fund Accounting and Fund Administration Product Manager, Citi (2008 to June 2013); Senior Vice President/Vice President, Fund Administration, Citi (formerly, BISYS Fund Services) (May 1994 to 2008). |
Matthew J. Miller Age: 38 VICE PRESIDENT 2960 N. Meridian St., Ste 300 Indianapolis, IN 46208 Began Serving: February 2010 | | Principal Occupation(s): Vice President, Relationship Management, HASI (2008 to present). Previous Position(s): Vice President, Transfer Agency Operations, HASI (2002 to 2008). |
Bryan W. Ashmus Age: 42 TREASURER 37 West Broad Street Columbus, OH 43215 Began Serving: November 2013 | | Principal Occupation(s): Vice President, Financial Administration, HASI (September 2013 to present); Principal Financial Officer and Treasurer, Valued Advisers Trust (December 2013 to present); Treasurer, Huntington Strategy Shares (November 2013 to present). Previous Position(s): Vice President, Fund Administration, Citi Fund Services, Ohio, Inc. (May 2005 to September 2013). |
Jay S. Fitton Age: 44 SECRETARY 3805 Edwards Road Cincinnati, OH 45209 Began Serving: February 2012 | | Principal Occupation(s): Vice President of Legal Administration, HASI (November 2011 to present); Secretary, Huntington Strategy Shares (October 2012 to present). Previous Position(s): Vice President and Senior Counsel, J.P. Morgan Chase (April 2007 to November 2011). |
| (a) | Officers do not receive any compensation from the Trust. |
Huntington Funds
Board of Trustees’ Consideration of Investment Advisory Agreement for the
Huntington VA Funds (the “Funds”) (Unaudited)
The Board of Trustees is responsible for determining whether to approve the Funds’ investment advisory agreements. At a meeting held on August 19, 2014, the Board unanimously approved the investment advisory agreements (the “Advisory Agreements”) between Huntington Asset Advisors, Inc. (the “Advisor”) and the Funds. Pursuant to the Advisory Agreements between the Advisor and the Funds, the Advisor provides advisory services to the Funds.
During the review process, the Board received assistance and advice from, and met separately with, independent legal counsel. In approving each of the Advisory Agreements, the Board, including a majority of the independent Trustees, considered many factors, among the most significant of which are: (1) the nature of the services provided to the Funds by the Advisor in relation to the advisory fees; (2) the individual performance of the Funds; (3) the Advisor’s costs and the profits realized through providing the Funds with advisory services; (4) whether the Advisor has realized or may realize economies of scale in providing services to the Funds and, if so, whether these economies are shared with the Funds; and (5) a comparison of the fees and performance of comparable funds.
Nature, Extent and Quality of Services in Relation to the Advisory Fee. In considering the nature, extent and quality of the services provided by the Advisor, the Board reviewed information relating to the Advisor’s operations and personnel. Among other things, the Advisor provided descriptions of its organizational and management structure, biographical information on its supervisory and portfolio management staff on a fund-by-fund basis, and financial information. The Trustees also took into account the financial condition of the Advisor with respect to its ability to provide the services required under the Advisory Agreements. The Board determined that the nature, extent and quality of the services provided by the Advisor in relation to the advisory fees were acceptable.
Individual Performance of the Funds. The Board reviewed the Funds’ performance record and the Advisor’s management styles in relation to comparable funds and appropriate benchmarks. The Board noted that the Board reviews on a quarterly basis detailed information about each Funds’ performance. The Board also reviewed various comparative data for each of the Funds provided to them in connection with their consideration of the renewal of the Advisory Agreements, including, among other information, each Fund’s performance compared to similar funds based on information provided by Strategic Insight Inc. (“Strategic Insight”) for the one-, three-, five- and ten-year periods ending March 31, 2014, as applicable, as well as each Fund’s performance compared to its benchmark index for the one-, three-, five-, and ten-year and since-inception periods ending March 31, 2014, as applicable.
Advisor’s Costs and the Profits Realized Through Providing the Funds With Advisory Services. In considering the reasonableness of the advisory fees, the Board reviewed information provided by the Advisor setting forth all revenues and other benefits, both direct and indirect, received by the Advisor and its affiliates attributable to managing each of the Funds individually, the cost of providing such services and the resulting profitability to the Advisor and its affiliates from these relationships. The Board also took into account the Advisor’s agreement to limit the total direct net annual operating expenses of the VA Dividend Capture Fund to not more than 0.99% of its average daily net assets through April 30, 2015. The Board also took into account the Advisor’s agreement to limit the total direct net annual operating expenses of the VA International Equity Fund to not more than 0.98% of its average daily net assets through April 30, 2015(a). The Board also took into account the Advisor’s agreement to limit the total direct net annual operating expenses of the VA Situs Fund to not more than 1.00% of its average daily net assets through April 30, 2015. The Trustees determined that the profitability of the Advisor was acceptable in relation to the nature and quality of services provided to the Funds.
Economies of Scale in Providing Services to the Funds and Whether These Economies are Shared With the Funds. The Board also considered the effect of the Funds’ growth and size on their performance and fees. The Board considered the fees under the Advisory Agreements for each Fund and possible economies of scale that may be realized as the assets of the Funds grow. The Board noted that none of the Funds was currently large enough to have realized economies of scale. However, the Board noted that the administrative fee charged to the Funds included fee breakpoints, which allowed the Funds to realize economies of scale as the assets of the Funds increased over time.
Comparison of the Fees and Performance of Comparable Funds. With respect to the Funds’ performance and fees, the Board considered comparisons to other mutual funds with comparable investment programs to be particularly useful, given the high degree of competition in the mutual fund business. The Board used peer group information provided by Strategic Insight with respect to its comparable fee and performance analysis for the Funds. The data for the fee and performance analysis was generated on an aggregate portfolio level since not all Funds offer the same types of share classes. The Board noted that the Advisor does not provide services to other accounts. The Board also took into account updated fee and expense information from management which reflected the impact of certain waivers and reimbursements.
Other Considerations. The Board also requests and receives substantial and detailed information about the Funds and the Advisor on a regular basis. The Advisor provides much of this information at each regular meeting of the Board and furnishes additional reports in connection with the Board’s formal review of the Advisory Agreements. The Board may also receive information between regular meetings relating to particular matters as the need arises. The Board’s evaluation of the Advisory Agreements is informed by reports covering such matters as the Advisor’s investment philosophy, personnel, and processes; operating strategies; each Fund’s short- and
H U N T I N G T O N F U N D S
Huntington Funds
long-term performance (in absolute terms, both on a gross basis and net of expenses, as well as in relationship to its particular investment program and certain competitive funds and/or other benchmarks, as appropriate) and comments on reasons for performance; the Funds’ expenses (including the advisory fee itself and the overall expense structure of the Funds, both in absolute terms and relative to similar and/or competing funds, with due regard for contractual or voluntary expense limitations); the use and allocation of brokerage commissions derived from trading the Funds’ portfolio securities; the nature and extent of the advisory and other services provided to the Funds by the Advisor and its affiliates; compliance and audit reports concerning the Funds (including communications from regulatory agencies), as well as the Advisor’s responses to any issues raised therein; and relevant developments in the mutual fund industry and how the Funds and the Advisor are responding to them. In the course of their deliberations regarding the Advisory Agreements, the Board also evaluated, among other things, the Advisor’s ability to supervise each of the Fund’s other service providers and their compliance programs.
The Board based its decision to approve the Advisory Agreements on the totality of the circumstances and relevant factors and with a view to past and future long-term considerations. Not all of the factors and considerations identified above are relevant to each of the Funds, nor does the Board consider any one of them to be determinative. With respect to the factors that are relevant, the Board’s decision to approve the Advisory Agreements reflects its determination that the Advisor’s performance and actions provide an acceptable basis to support the decision to continue the existing arrangements.
While attention was given to all information furnished, the following discusses the primary factors relevant to the Board’s decisions. In each case, the Board concluded that the Funds’ performance was acceptable and that the Funds’ advisory fee and total expenses, which included the administrative fee, were reasonable in light of the quality and nature of services provided by the Advisor and its affiliates.
Huntington VA Dividend Capture Fund
Among other data considered, the Board noted that the Fund underperformed the average and median of its peer group for the one-, three- and ten-year periods ended March 31, 2014, and the Fund outperformed the average and median of its peer group for the five-year period ended March 31, 2014. The Board also noted that the Fund underperformed its benchmark index for the one-, three-, five- and ten-year periods ended March 31, 2014, and outperformed its benchmark index for the since-inception period ended March 31, 2014. The Board also considered the Fund’s advisory fee and total expenses, which included the administrative fee. The Board noted that the Fund’s combined advisory/administrative fee and total net expenses were above the average and median of its peer group, respectively. The Board took into consideration the Advisor’s discussion regarding the Fund’s performance, including the impact of market conditions on the Fund’s performance, and management’s continued close monitoring of the Fund’s performance.
Huntington VA International Equity Fund(a)
Among other data considered, the Board noted that the Fund underperformed the average and median of its peer group for the one-, three- and five-year periods ended March 31, 2014. The Board also noted that the Fund underperformed its benchmark index for the one-, three- and five- year periods ended March 31, 2014, and outperformed its benchmark index for the since-inception period ended March 31, 2014. The Board also considered the Fund’s advisory fee and total expenses, which included the administrative fee. The Board noted that the Fund’s combined advisory/administrative fee was below the average and at the median of its peer group and total net expenses were above the average and median of its peer group.
Huntington VA Situs Fund
Among other data considered, the Board noted that the Fund outperformed the average and median of its peer group for the three- and five-year periods ended March 31, 2014. The Board also noted that the Fund underperformed the average and median of its peer group for the one-year period ended March 31, 2014. The Board also noted that the Fund underperformed its benchmark index for the one-, three- and five-year and since-inception periods ended March 31, 2014. The Board also considered the Fund’s advisory fee and total expenses, which included the administrative fee. The Board noted that the Fund’s combined advisory/administrative fee was above the average and below the median of its peer group and total net expenses were above the average and median of its peer group.
| (a) | The VA International Equity Fund is scheduled for liquidation on March 6, 2015. |
Variable investment options are not bank deposits or obligations, are not guaranteed by any bank, and are not insured or guaranteed by the U.S. government, the Federal Deposit Insurance Corporation, the Federal Reserve Board or any other government agency. Investment in variable investment options involves investment risk, including the possible loss of principal.
This report is authorized for distribution to prospective investors only when preceded or accompanied by the Funds’ prospectus, which contains facts concerning each Fund’s objective and policies, management fees, expenses and other information.
A copy of the policies and procedures that the Funds use to determine how to vote proxies relating to securities held in the Funds’ portfolios, as well as a record of how the Funds voted any such proxies during the most recent 12-month period ended June 30, is available without charge and upon request by calling 1-800-253-0412 or at www.huntingtonvafunds.com. This information is also available from the EDGAR database on the SEC’s website at www.sec.gov.
The Funds file with the SEC a complete schedule of their portfolio holdings, as of the first and third quarters of their fiscal year, on “Form N-Q”. These filings are available on the SEC’s website at www.sec.gov and may be reviewed and copied at the SEC’s Public Reference Room in Washington, D.C. (call 1-202-551-8090 for information on the operation of the Public Reference Room.) You may also access this information at www.huntingtonvafunds.com by selecting “Form N-Q.” The Huntington National Bank, a subsidiary of Huntington Bancshares, Inc., is the Custodian of The Huntington Funds. Huntington Asset Services, Inc. serves as the Administrator, Transfer Agent and Fund Accountant and is affiliated with the Huntington National Bank. Additionally, Brown Brothers Harriman & Co. is the Sub-Custodian of certain of the Funds. Huntington Asset Advisors, Inc., a subsidiary of the Huntington National Bank, serves as Investment Advisor to the Funds. Unified Financial Securities, Inc. serves as the Distributor of The Huntington Funds and is affiliated with the Huntington National Bank.
The S&P 500 Index®, S&P 500 Value Index®, S&P SmallCap 600 Index® and S&P MidCap 400 Index® are products of S&P Dow Jones Indices LLX (“SPDJI”), and have been licensed for use by Huntington Asset Advisors, Inc. Standard and Poor’s® and S&P® are registered trademarks of Standard and Poor’s Financial Services LLC (“S&P”); Dow Jones® is a registered trademark of Dow Jones Trademark Holdings LLC (“Dow Jones”). Huntington Funds are not sponsored, endorsed, sold or promoted by SPDJI, Dow Jones, S&P, their respective affiliates and none of such parties make any representations regarding the advisability of investing in Huntington Funds nor do they have any liability for any errors, omissions, or interruptions of the S&P 500 Index®, S&P 500 Value Index®, S&P SmallCap 600 Index® and S&P MidCap 400 Index®.
Huntington Shareholder Services: 800-253-0412
Item 2. Code of Ethics.
(a) As of the end of the period covered by the report, the registrant has adopted a code of ethics that applies to the registrant’s Principal Executive Officer and Principal Financial Officer.
(c) During the period covered by the report, with respect to the registrant’s code of ethics that applies to its Principal Executive Officer and Principal Financial Officer: there have been no amendments to a provision that relates to any element of the code of ethics definition enumerated in paragraph (b) of this Item 2.
(d) During the period covered by the report, with respect to the registrant’s code of ethics that applies to its Principal Executive Officer and Principal Financial Officer: there have been no waivers granted from a provision that relates to any element of the code of ethics definition enumerated in paragraph (b) of this Item 2.
Item 3. Audit Committee Financial Expert.
3(a)(1) The registrant’s Board of Trustees has determined that the registrant has at least one audit committee financial expert serving on its audit committee.
3(a)(2) The audit committee financial expert is Mark D. Shary, who is “independent” for purposes of this Item 3 of Form N-CSR.
Item 4. Principal Accountant Fees and Services.
(a) Audit Fees billed to the registrant by its principal accountants for the two most recent fiscal years:
Fiscal year ended 2014: $284,344
Fiscal year ended 2013: $436,815
(b) Audit-Related Fees billed to the registrant by its principal accountants for the two most recent fiscal years:
Fiscal year ended 2014: $0
Fiscal year ended 2013: $6,630
Fees for 2014 and 2013 related to the agreed-upon review of items within the Management’s Discussion of Fund Performance sections of the Funds’ Form N-CSR filing. Amount requiring approval of the registrant’s audit committee pursuant to paragraph (c)(7)(ii) of Rule 2-01 of Regulation S-X, $0 and $0 respectively.
(c) Tax Fees billed to the registrant by its principal accountants for the two most recent fiscal years:
Fiscal year ended 2014: $223,360
Fiscal year ended 2013: $197,117
Fees for 2014 and 2013 related to the review of the registrant’s tax returns. Amount requiring approval of the registrant’s audit committee pursuant to paragraph (c)(7)(ii) of Rule 2-01 of Regulation S-X, $0 and $0 respectively.
(d) All other fees billed to the registrant by its principal accountants for the two most recent fiscal years:
Fiscal year ended 2014: $0
Fiscal year ended 2013: $0
Amount requiring approval of the registrant’s audit committee pursuant to paragraph (c)(7)(ii) of Rule 2-01 of Regulation S-X, $0 and $0 respectively.
(e)(1) Audit and Non-Audit Services Pre-Approval Policies and Procedures
I. Purpose
Under the Sarbanes-Oxley Act of 2002 (the “Act”), the Audit Committees of the Board of Trustees of The Huntington Funds and Huntington Strategy Shares (each a “Trust” and collectively, the “Trusts”) is responsible for the appointment, compensation and oversight of the work of the Trust’s independent auditor. As part of this responsibility, the Audit Committee is required to grant approval for audit and non-audit services performed by the independent auditor for the Trust in order assure that they do not impair the auditor’s independence from the Trust. In addition, the Audit Committee also must pre-approve its independent auditor’s engagement for non-audit services with the Trust’s investment adviser (not including a sub-adviser whose role is primarily portfolio management and is sub-contracted or overseen by another investment adviser) and any entity controlling, controlled by, or under common control with the investment adviser that provides ongoing services to the Trust, if the engagement relates directly to the operations and/or financial reporting of the Trust.
To implement these provisions of the Act, the Securities and Exchange Commission (the “SEC”) has issued rules specifying the types of services that the Trust’s independent auditor may not provide to the Trust, as well as the Audit Committee’s administration of the engagement of the independent auditor. Under these rules, the SEC has provided that a permissible approval of audit and non-audit services can take the form of either (i) a general pre-approval, or (ii) a specific pre-approval (where a specific type
of service is authorized, generally subject to a fee maximum). General pre-approvals are authorized by SEC rules only subject to detailed policies and procedures. Unless a type of service has received general pre-approval, it will require specific pre-approval by the Audit Committee if it is to be provided by the independent auditor. Accordingly, the Audit Committee has adopted these Audit and Non-Audit Services Pre-Approval Policies and Procedures, which set forth the procedures and the conditions pursuant to which services for the Trust may be performed by the independent auditor under pre-approvals.
II. General Pre-Approval Policies
It is the policy of the Audit Committee that audit and non-audit services to be performed by the Trust’s independent auditor be pre-approved only when in the best interests of the Trust’s shareholders and fully consistent with applicable law and, particularly, the maintenance of the auditor’s independence. In granting any pre-approval, consideration shall be given to:
| | 1. | the qualifications of the auditor to perform the services involved; |
| | 2. | the proposed costs (which may be presented as an estimate or based on professional time charges subject to a ceiling) of the services and the reasonableness thereof; |
| | 3. | the permissibility of the services under applicable rules and guidance of the SEC; |
| | 4. | the effect, if any, of the performance of the proposed services on the auditor’s independence; |
| | 5. | the effect of the compensation for the proposed services on the auditor’s independence; and |
| | 6. | the effect, if any, of the proposed services on the Trust’s ability to manage or control risk or to improve audit quality. |
In accordance with SEC rules, non-audit services performed by the Trust’s independent auditor may not include the following:
| | 1. | Bookkeeping or other services related to the accounting records or financial statements of the audit client; |
| | 2. | Financial information systems design and implementation; |
| | 3. | Appraisal or valuation services, fairness opinions or contribution-in-kind reports; |
| | 5. | Internal audit outsourcing services; |
| | 6. | Management functions or human resources; |
| | 7. | Broker-dealer, investment adviser or investment banking services; and |
| | 8. | Legal services and expert services unrelated to the audit. |
III. Procedures for Pre-Approval by the Audit Committee
| | 1. | Requests for pre-approval shall be in writing and may be made by either the independent auditors or by management of the Trust. |
| | 2. | All requests for pre-approval shall be made to the full Audit Committee at regularly scheduled meetings thereof (or at a special meeting of the Audit Committee set to coincide with regular meetings of the Trust’s Board of Trustees) whenever practicable. |
| | 3. | Under normal circumstances, requests for pre-approval should be presented at least 7 days prior (and in no event later than 48 hours prior) to the proposed commencement of the engagement. |
| | 4. | If consideration of a request for pre-approval on the dates identified in Section III(2) would not be timely, the requesting party shall notify the Chairman of the Audit Committee. The Chairman of the Audit Committee shall then determine whether to schedule a special meeting of the Audit Committee (which may be conducted telephonically) on an alternative date or whether the request may appropriately be presented to a delegate of the Audit Committee under procedures set forth in Section IV below. |
| | 5. | Requests for pre-approval may include, but are not limited to, the following services: |
| | a. | audit engagement, particularly for interim periods; |
| | b. | tax compliance, tax planning, and tax advice; |
| | c. | review and consents with respect to use of reports in post-effective amendments to the registration statements of the Trust; |
| | d. | review of IRS shareholder materials; |
| | e. | review and validation of Trust procedures (e.g., valuation, interTrust lending, etc.), and |
| | f. | market research and strategic insights. |
| | 6. | Requests for pre-approval should identify the nature of the services to be provided in a manner sufficiently specific to allow evaluation of the considerations identified above in Section II. |
| | 7. | In accordance with PCAOB Rule 3524, requests for pre-approval of permissible tax services by the independent auditor must have the following items described in writing for the audit committee: |
| | a. | the scope of the proposed tax service, |
| | b. | the fee structure for the engagement, |
| | c. | any side letters, amendments to the engagement letter or any other agreements, whether oral, written, or otherwise, relating to the service between the audit firm and the Trusts, and |
| | d. | any compensation arrangements or other agreements between the audit firm and any third party with respect to promoting, marketing, or recommending a transaction covered by the proposed tax service. |
The audit firm should discuss with the Audit Committee the potential effect of the proposed tax service(s) on the audit firm’s independence.
| | 8. | Requests for pre-approval must include an assessment by the independent auditor of its independence should the request be granted and the proposed services rendered. |
| | 9. | The Audit Committee’s action on a request for pre-approval shall be recorded in the Audit Committee’s minutes. |
| | 10. | The Audit Committee’s action on a request for pre-approval shall be communicated in writing to the independent auditor and, under normal circumstances, a copy of this communication shall be provided to the Trust’s management. |
| | 11. | The Audit Committee’s action on a request for pre-approval shall be reported to the full Board of Trustees. |
| | 12. | Pre-approvals will be granted for a period of no more than one year. |
IV. Procedures for Pre-Approval by a Delegate of the Audit Committee
| | 1. | Where it has been determined by the Chairman of the Audit Committee that consideration of a request for pre-approval by the full Audit Committee would not be timely, the Chairman may determine that the request be presented to a member(s) of the Audit Committee appointed by the Audit Committee as its delegate (the “Delegate”) for this purpose. (As of the date of the adoption of these guidelines and procedures, the Chairman of the Audit Committee has been so appointed, and such appointment may be revoked or modified by the Audit Committee at any time.) |
| | 2. | Requests for pre-approval shall be in writing and may be made by either the independent auditors or by management of the Trust. |
| | 3. | Under normal circumstances, requests for pre-approval should be presented at least 7 days prior (and in no event later than 48 hours prior) to the proposed commencement of the engagement. |
| | 4. | Requests for pre-approval may include, but are not limited to, the following services: |
| | a. | audit engagement, particularly for interim periods; |
| | b. | tax compliance, tax planning, and tax advice; |
| | c. | review and consents with respect to use of reports in post-effective amendments to the registration statements of the Trust; |
| | d. | review of IRS shareholder materials; |
| | e. | review and validation of Trust procedures (e.g., valuation, interfund lending, etc.); and |
| | f. | market research and strategic insights. |
| | 5. | Requests for pre-approval should identify the nature of the services to be provided in a manner sufficiently specific to allow evaluation of the considerations identified above in Section II. |
| | 6. | Requests for pre-approval must include an assessment by the independent auditor of its independence should the request be granted and the proposed services rendered. |
| | 7. | The Delegate’s action on a request for pre-approval shall be communicated in writing to the independent auditor, with a copy to each other member of the Audit Committee and, under normal circumstances, to the Trust’s management. |
| | 8. | Pre-approvals by the Delegate shall be reviewed by the Audit Committee at a meeting held no later than the next scheduled meeting of the Board of Trustees or the Audit Committee, whichever occurs sooner. An earlier review shall be conducted upon the written request of one or more Audit Committee members addressed to the Chairman of the Audit Committee. |
| | 9. | Pre-approvals by the Delegate may be modified or revoked by the Audit Committee, but will not absolve the Trust of its responsibility to compensate the independent auditor for services rendered prior to such modification or revocation. |
| | 10. | The results of the Audit Committee’s review of the Delegate’s action on a request for pre-approval shall be recorded in the Audit Committee’s minutes and reported to the full Board of Trustees. |
| | 11. | Pre-approvals will be granted by the Delegate for a period of no more than one year. |
V. Procedures for Monitoring Engagements Authorized Under Pre-Approval Procedures
The independent auditor shall inform the Audit Committee in writing upon the commencement of services rendered under a pre-approval. The independent auditor shall thereafter provide the Audit Committee with written quarterly progress reports within one month of the close of each calendar quarter detailing the work done and fees and other charges incurred during said calendar quarter. Should fees and expenses exceed those specified in a pre-approval (or appear likely to do so prior to completion of the work), the independent auditor or management shall so apprise the Audit Committee and an additional express approval or pre-approval must be obtained.
VI. Amendment
These Policies and Procedures may be amended or revoked at any time by the Audit Committee and shall be reviewed at least annually in conjunction with review of the Audit Committee Charter.
Adopted October 23, 2007 (The Huntington Funds)
November 11, 2010 (Huntington Strategy Shares)
Revised February 14, 2014
(e)(2) Percentage of services described in each of paragraphs (b) through (d) of this Item that were approved by the audit committee pursuant to paragraph (C)(7)(i)(C) of Rule 2-01 of Regulation S-X.
Fiscal year ended 2014- 100%
Fiscal year ended 2013- 100%
Percentage of services provided to the registrant’s investment adviser and any entity controlling, controlled by, or under common control with the investment adviser that provides ongoing services to the registrant that were approved by the registrant’s audit committee pursuant to paragraph (C)(7)(i)(C) of Rule 2-01 of Regulation S-X, 100% and 100% respectively.
(f) Not applicable.
(g) The aggregate non-audit fees billed by Ernst and Young LLP for the Funds and certain entities (including the adviser (excluding sub-adviser) and any entity controlling, controlled by or under common control with the advisor that provides ongoing services to the registrant (Funds)), totaled $248,360 and $260,550 in 2014 and 2013, respectively.
(h) The registrant’s Audit Committee has considered whether the provision of non audit services that were rendered to registrant’s investment adviser (not including any sub adviser whose role is primarily portfolio management and is subcontracted with or overseen by another investment adviser), and any entity controlling, controlled by, or under common control with the investment adviser that provide ongoing services to the registrant that were not pre-approved pursuant to paragraph (c)(7)(ii) of Rule 2-01 of Regulation S-X is compatible with maintaining the principal account’s independence.
| Item 5. | Audit Committee of Listed Registrants. |
Not applicable.
Item 6. Schedule of Investments.
(a) Not applicable.
(b) Not applicable.
Item 7. Disclosure of Proxy Voting Policies and Procedures for Closed-End Management Investment Companies.
Not applicable.
Item 8. Portfolio Managers of Closed-End Management Investment Companies.
Not applicable.
Item 9. Purchases of Equity Securities by Closed-End Management Investment Company and Affiliated Purchasers.
Not applicable.
Item 10. Submission of Matters to a Vote of Security Holders.
Not applicable.
Item 11. Controls and Procedures.
(a) The registrant’s Principal Executive Officer and Principal Financial Officer have concluded that the registrant’s disclosure controls and procedures (as defined in Rule 30a-3(c) under the Act) are effective in design and operation and are sufficient to form the basis of the certifications required by Rule 30a-2 under the Act, based on their evaluation of these disclosure controls and procedures within 90 days of the filing of this report on Form N-CSR.
(b) There were no changes in the registrant’s internal control over financial reporting (as defined in Rule 30a-3(d) under the Act (17 CFR 270.30a-3(d)) that occurred during the second fiscal quarter of the period covered by this report that have materially affected or are reasonably likely to materially affect, the registrant’s internal control over financial reporting.
Item 12. Exhibits.
(a)(1) The Not applicable.
(a)(2) Certifications pursuant to Rule 30a-2(a) are attached hereto.
(a)(3) Not applicable.
(b) Certifications pursuant to Rule 30a-2(b) are furnished herewith.
SIGNATURES
Pursuant to the requirements of the Securities Exchange Act of 1934 and the Investment Company Act of 1940, the registrant has duly caused this report to be signed on its behalf by the undersigned, thereunto duly authorized.
(Registrant) The Huntington Funds
| | | | |
| |
| By (Signature and Title) | | /s/ Jeffrey Young |
| | R. Jeffrey Young, Chief Executive Officer and Principal Executive Officer |
Pursuant to the requirements of the Securities Exchange Act of 1934 and the Investment Company Act of 1940, this report has been signed below by the following persons on behalf of the registrant and in the capacities and on the dates indicated.
| | | | |
| By (Signature and Title) | | /s/ Jeffrey Young |
| | R. Jeffrey Young, Chief Executive Officer and Principal Executive Officer |
| | | | |
| By (Signature and Title) | | /s/ Bryan W. Ashmus |
| | Bryan W. Ashmus, Treasurer and Principal Financial Officer |