UNITED STATES
SECURITIES AND EXCHANGE COMMISSION
Washington, D.C. 20549
FORM N-CSR
CERTIFIED SHAREHOLDER REPORT OF REGISTERED
MANAGEMENT INVESTMENT COMPANIES
Investment Company Act file number 811-05010
Mutual Fund and Variable Insurance Trust
(Exact name of registrant as specified in charter)
2960 North Meridian Street, Suite 300
Attn: Mutual Fund and Variable Insurance Trust Officer
Indianapolis, IN 46208
(Address of principal executive offices) (Zip code)
Martin R. Dean
The Huntington National Bank
37 West Broad Street, 6th Floor
Columbus, OH 43215
(Name and address of agent for service)
Copies to:
Andrew Davalla
Thompson Hine LLP
41 South High Street
Suite 1700
Columbus, Oh 43215
Registrant’s telephone number, including area code: 1-800-253-0412
Date of fiscal year end: December 31
Date of reporting period: December 31, 2015
| Item 1. | Reports to Stockholders. |

Annual Shareholder Report
DECEMBER 31, 2015
CLASS A SHARES
CLASS C SHARES
INSTITUTIONAL SHARES
Annual Shareholder Report
EQUITY FUNDS
Rational Dividend Capture Fund (formerly Huntington Dividend Capture Fund)
Rational Risk Managed Emerging Markets Fund (formerly Huntington Global Select Markets Fund)
Rational Real Strategies Fund (formerly Huntington Real Strategies Fund)
Rational Defensive Growth Fund (formerly Huntington Situs Fund)
ASSET ALLOCATION FUNDS
Rational Strategic Allocation Fund (formerly Huntington Balanced Allocation Fund)
| | |
| Rational Dividend Capture Fund | | As of December 31, 2015 |
| | |
| (formerly Huntington Dividend Capture Fund) | | |
Management’s Discussion of Fund Performance
Portfolio Managers:
Kirk Mentzer, MBA
Director of Fund Research
Peter Sorrentino, CFA
Senior Vice President
PERFORMANCE SUMMARY
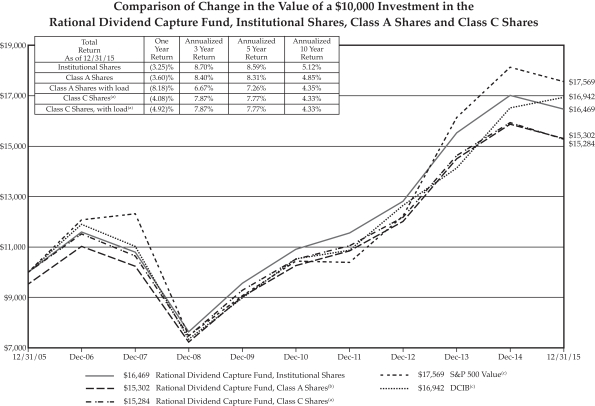
For the fiscal year ended December 31, 2015, the Rational Dividend Capture Fund’s (the “Fund”) Institutional Shares, Class A Shares and Class C Shares produced total returns (not including the deduction of applicable sales charges) of -3.25%, -3.60% and -4.08%, respectively, based on net asset value. The Fund underperformed relative to the -3.15% total return of the Standard & Poor’s 500 Value Index® (“S&P 500 Value”)(a), its benchmark by -0.45% (A Shares). The Fund underperformed relative to the +2.53% total return of the Dividend Capture Indices Blend (“DCIB”)(b) for the same period.
RECENT FUND ACTION
With valuations at extended levels, profit weakness, sluggish global economic growth trends, and uncertain Federal Reserve (“Fed”) action, we continued to advocate muted cyclical exposure within portfolios. Corporations in aggregate issued a tremendous amount of debt in 2015 and corporate bond risk spreads have widened to reflect the higher risk of default as profit margins, growth, and economic growth have slowed. Continuing a theme that began last year, attempting to de-risk portfolios while maintaining allocations was the balance we struck as a theme for 2015. Sluggish global economic growth did not offer much hope of a robust rebound in activity on the horizon. Below are three recent industry changes:
| | • | | Leisure Products was an area that had severely underperformed over the past year. The industry is domestically focused, which dodges the currency issues negatively impacting so many other groups. Input prices were favorable and translating into improving margins. Valuation was fair, but could allow for upside surprises due to depressed earnings expectations. Balance sheet quality was good as debt levels have been contained. A recession or rising input costs are the two largest potential detractors from the performance of this area. We raised the group to attractive. |
| | • | | Banks vs Real Estate Investment Trusts (“REITs”): While banks have been major beneficiaries of the anticipated Fed tightening, REITs shares have conversely suffered. In the medium term, economic conditions are expected to weaken due to a stronger dollar and slower world growth, and will ultimately weigh on Commercial & Industrial loan quality. Thus, the banks are put on downgrade watch. Following the Fed rate increase in December 2015, REIT shares rebounded thanks to relief that the adjustment was made and additional Fed increases were expected to be mild. This improving monetary environment for REIT shares could result in positive earnings and multiple expansions. |
| | • | | Restaurants had reasonable profit growth expectations and performance has been excellent. However, the outlook was getting less appealing. Market turmoil and weak wage growth may result in weaker sales trends in the future. Trade surveys already signal a trend change. Surprisingly, about half of the industry sales are international. Currency trends continue to work against multinationals, especially for those with emerging markets exposure. We moved the restaurant group from attractive to neutral. |
ATTRIBUTION HIGHLIGHTS
The Fund was managed using our top-down style and portfolio construction techniques, which are aimed at producing a high level of stable income and low volatility by investing in three distinct asset classes: common stocks, REITs, and preferred stocks.
| | • | | Value-style common stocks: Domestic equity market returns were range bound for much of the year as weak earnings growth and uncertainty regarding the direction of Fed monetary policy took their toll on |
Annual Shareholder Report
1
Rational Dividend Capture Fund (Continued)
| | investor confidence. Stocks as measured by the S&P 500 Value ended the year with a -3.15% total return. The Fund was overweight common stocks for the entire period versus the DCIB unmanaged custom index. Within this class, sector allocation subtracted 48 basis points and security selection detracted 200 basis points. As a result, the common stocks in the Fund underperformed the overall market. The Fund’s common stock total return for 2015 was -5.17% compared to the S&P 500 Value of -3.15%. The five largest positive contributors to performance were: General Electric Company (+0.86%), Coca-Cola Enterprises (+0.38%), McDonald’s Corporation (+0.33%), Halliburton Company (+0.28%), and Old Republic International Corporation (+0.25%). The five largest detractors were: Waddell & Reed Financial (-1.00%), Tyco International PLC (-0.57%), Noble Corporation plc (-0.58%), Bank of Nova Scotia (-0.53%) and ConocoPhillips (-0.51%). |
| | • | | REIT’s(c): Flat interest rate trends and mild inflation pressures helped propel REIT markets in 2015. However, the Fund’s REIT holdings produced a total return of -6.67%, which compared unfavorably to the benchmark Standard & Poor’s Supercomposite 1500 Real Estate Investment Trusts Industry Index® (“S&P REIT”)(C) total return of +3.80%. The five largest positive contributors to performance were: Camden Property Trust (+1.09%), Medical Properties Trust (+0.77%), Realty Income Corporation (+0.61%), Kimco Realty (+0.49%), and Piedmont Office Realty Trust (+0.33%). The five largest detractors were: Host Hotels & Resorts (-5.12%), Lexington Realty Trust (-3.28%), Hospitality Properties Trust (-2.13%), HCP, Inc. (-1.14%), and Weyerhaeuser Company (-0.61%). |
| | • | | Preferred Stock(d): A largely range-bound bond market and investors’ search for yield gave preferred stocks a tail wind for the year, making them the best performing asset class of the Fund. The Fund’s preferred share holdings produced a total return of 5.81% which underperformed the benchmark BofA Merrill Lynch U.S. Preferred Stock Fixed Rate Index total return of +7.58%. The five largest positive contributors to performance were: Northern Trust Corp 5.85 % Non-Cumulative Perpetual Preferred (+9.95%), Realty Income Corp 6.63% Preferred Series F (+7.87%), PS Business Parks 6.45 % Preferred Shares Series S (+7.75%), PartnerRe Ltd 7.25% Preferred Shares Series E (+7.19%), and Axis Capital Holdings Ltd 6.88% Preferred Shares Series C (+6.96%). The five largest underperforming issues were: Aegon NV 8% Notes (+2.44%), Senior Housing Properties Trust 5.63% Notes (+1.79%), American Financial Group 7% Notes (+1.36%), Goldman Sachs Group 6.2% Series B (+0.14%), and JPMorgan Chase Capital XXIX 6.7% Capital Series CC (+0.00%). |
| (a) | The S&P 500 Value Index® is an unmanaged market-capitalization-weighted index consisting of those stocks within the S&P 500 Index® that exhibit strong value characteristics. It uses a numerical ranking system based on four value factors and three growth factors to determine the constituents and their weightings. The index is unmanaged and, unlike the Fund, is not affected by cash flows. It is not possible to invest directly in an Index. |
| (b) | The DCIB is a custom, blended index comprised of the following three indices with their noted respective weightings: S&P 500 Value Index (40%), Merrill Lynch Fixed Rate Preferred Index (40%) and S&P REIT (20%). This custom, blended index and its respective weightings are reflective of the Fund’s sector diversification. Indices are unmanaged and, unlike the Fund, are not affected by cash flows. It is not possible to invest directly in an Index. |
| (c) | REIT returns represented by the S&P REIT. The S&P REIT is a capitalization-weighted index of the 91 REIT stocks within the S&P 1500 Composite Index®. The index is unmanaged and, unlike the Fund, is not affected by cash flows. It is not possible to invest directly in an Index. |
| (d) | Preferred returns represented by BofA Merrill Lynch U.S. Preferred Stock Fixed Rate Index. The BofA Merrill Lynch Fixed Rate Preferred Securities Index is a capitalization-weighted index that tracks the performance of fixed rate U.S. dollar denominated preferred securities issued in the U.S. domestic market. The index is unmanaged and, unlike the Fund, is not affected by cash flows. It is not possible to invest directly in an Index. |
This commentary may include statements that constitute “forward looking statements” under the U.S. securities laws. Forward-looking statements include, among other things, projections, estimates, and information about possible or future results related to the Fund, market or regulatory developments. The views expressed above are not guarantees of future performance or economic results and involve certain risks, uncertainties and assumptions that could cause actual outcomes and results to differ materially from the views expressed herein. The views expressed above are those of the Huntington Asset Advisors, Inc. (the “Advisor”) as of December 31, 2015 and are subject to change at any time based upon economic, market, or other conditions and the Advisor undertakes no obligation to update the views expressed herein. Any discussions of specific securities should not be considered a recommendation to buy or sell those securities. The views expressed above (including any forward-looking statement) may not be relied upon as investment advice or as an indication of the Fund’s trading intent. Information about the Fund’s holdings, asset allocation or country diversification is historical and is not an indication of future Fund composition, which may vary.
The performance of any index mentioned in this commentary has not been adjusted for ongoing management, distribution and operating expenses, and sales charges applicable to mutual fund investments. If these additional fees were reflected, performance would have been lower.
There are no guarantees that dividend paying stocks will continue to pay dividends. In addition, dividend paying stocks may not experience the same capital appreciation potential as non-dividend paying stocks.
Annual Shareholder Report
2
Rational Dividend Capture Fund (Continued)
The Fund’s past performance does not guarantee future results. The investment return and principal value of an investment in the Fund will fluctuate so that an investor’s shares, when redeemed, may be worth more or less than their original cost. Current performance of the Fund may be lower or higher than the performance quoted. Performance data current to the most recent month end or after-tax returns may be obtained by calling 1-800-253-0412. Returns shown do not reflect the deduction of taxes that a shareholder would pay on Fund distributions or the redemption of Fund shares. Mutual funds are not obligations of or guaranteed by any bank and are not federally insured. Total returns, with load, include the 4.75% maximum sales charge for the Class A Shares or the 1.00% maximum deferred sales charge for the Class C Shares.
| | | | | | | | |
| Class | | Gross
Expense Ratios | | | Net Expense Ratios | |
| Institutional Shares | | | 1.46% | | | | 0.96% | |
| Class A Shares | | | 1.71% | | | | 1.21% | |
| Class C Shares | | | 2.21% | | | | 1.71% | |
The above expense ratios are from the Fund’s prospectus dated April 30, 2015. Additional information pertaining to the Fund’s expense ratios as of December 31, 2015 can be found in the financial highlights.
The Fund’s performance assumes the reinvestment of all dividends and distributions on securities. The performance above reflects any fee reductions during the applicable periods. If such fee reductions had not occurred, the quoted performance would have been lower. The S&P 500 Value and DCIB have been adjusted to reflect reinvestment of dividends on securities in the indices.
Investments in real estate investment trusts (“REITs”) and real-estate related securities involves special risks associated with an investment in real estate, such as limited liquidity and interest rate risks and may be more volatile than other securities. In addition, the value of REITs and other real estate-related investments is sensitive to changes in real estate values, extended vacancies of properties and other environmental and economic factors.
There are no guarantees that dividend paying stocks will continue to pay dividends. In addition, dividend paying stocks may not experience the same capital appreciation potential as non-dividend paying stocks.
Up through December 31, 2015 the Fund was distributed by Unified Financial Securities, LLC (Member FINRA).
| (a) | Class C Shares commenced operations on January 3, 2014. Prior to January 3, 2014, performance is based on the performance of Class A Shares adjusted for the Class C Shares 12b-1 fees and contingent deferred sales charge. |
| (b) | Represents a hypothetical investment of $10,000 in the Fund after deducting the maximum sales load of 4.75% ($10,000 investment minus $475 sales load = $9,525). |
| (c) | The S&P 500 Value and DCIB are not adjusted to reflect sales charges, expenses, or other fees that are reflected in the Fund’s performance. The indices are unmanaged and, unlike the Fund, are not affected by cash flows. It is not possible to invest directly in an index. |
Annual Shareholder Report
3
| | |
| Rational Risk Managed Emerging Markets Fund | | As of December 31, 2015 |
| | |
| (formerly Huntington Global Select Markets Fund) | | |
Management’s Discussion of Fund Performance
Portfolio Manager:
Paul W. Attwood, CFA
Senior Vice President
PERFORMANCE SUMMARY
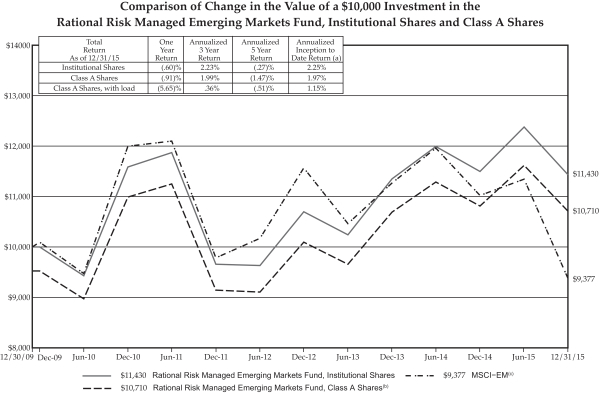
For the fiscal year ended December 31, 2015, the Rational Risk Managed Emerging Markets Fund’s (the “Fund”) Institutional Shares and Class A Shares produced total returns (not including the deduction of applicable sales charges) of -0.60% and -0.91%, respectively, based on net asset value. The Fund outperformed relative to the -14.92% total return of the Morgan Stanley Capital International Emerging Markets Index (“MSCI-EM”)(a), its benchmark for the same time period. The Fund’s Class A Shares outperformed its benchmark by +14.01%.
ATTRIBUTION HIGHLIGHTS
The MSCI-EM Index had a weak showing in 2015. Some of the index members, such as Brazil, had enormous declines in both their equity and currency markets. China started the year on a strong note with the Shanghai composite rallying over 40% by June. However, as the concern over an economic downturn increased, equity prices sold off and, while still positive, they have lost a significant amount of value during the third and fourth quarter. The overweight in India and underweight in the above mentioned areas assisted with the funds relative performance.
Due to the decline in commodity prices, specifically Materials and Energy, these stocks were the weakest performing areas. The fund was significantly underweight these areas during 2015. The Fund’s relative overweighted positions were in Technology and Healthcare. Stock selection added to the relative outperformance of the Fund.
The holdings that had the largest positive contribution to the Fund’s performance were KCE Electronics, a manufacturing company in Thailand and the Fund’s holdings in Japan. Specifically, Welcia Holdings, a company involved in the management of drug store chains; and Keyence Corp., a manufacturing company involved in factory automation and programmable logic controllers; performed well.
| (a) | The MSCI-EM is a market-capitalization weighted equity index comprising 21 of the 48 countries in the MSCI universe. Each MSCI country index is created separately, then aggregated, without change, into MSCI indices. The index is unmanaged and, unlike the Fund, is not affected by cash flows. It is not possible to invest directly in an Index. |
This commentary may include statements that constitute “forward looking statements” under the U.S. securities laws. Forward-looking statements include, among other things, projections, estimates, and information about possible or future results related to the Portfolio, market or regulatory developments. The views expressed above are not guarantees of future performance or economic results and involve certain risks, uncertainties and assumptions that could cause actual outcomes and results to differ materially from the views expressed herein. The views expressed above are those of the Advisor as of December 31, 2015 and are subject to change at any time based upon economic, market, or other conditions and the Advisor undertakes no obligation to update the views expressed herein. Any discussions of specific securities should not be considered a recommendation to buy or sell those securities. The views expressed above (including any forward-looking statement) may not be relied upon as investment advice or as an indication of the Fund’s trading intent. Information about the Fund’s holdings, asset allocation or country diversification is historical and is not an indication of future Fund composition, which may vary.
The performance of any index mentioned in this commentary has not been adjusted for ongoing management, distribution and operating expenses, and sales charges applicable to mutual fund investments. If these additional fees were reflected, performance would have been lower.
Annual Shareholder Report
4
Rational Risk Managed Emerging Markets Fund (Continued)
The Fund’s past performance does not guarantee future results. The investment return and principal value of an investment in the Fund will fluctuate so that an investor’s shares, when redeemed, may be worth more or less than their original cost. Current performance of the Fund may be lower or higher than the performance quoted. Performance data current to the most recent month end or after-tax returns may be obtained by calling 1-800-253-0412. Returns shown do not reflect the deduction of taxes that a shareholder would pay on Fund distributions or the redemption of Fund shares. Mutual funds are not obligations of or guaranteed by any bank and are not federally insured. Total returns, with load, include the 4.75% maximum sales charge for the Class A Shares.
| | | | | | | | |
| Class | | Gross
Expense Ratios | | | Net Expense Ratios | |
| Institutional Shares | | | 2.26% | | | | 0.91% | |
| Class A Shares | | | 2.51% | | | | 1.16% | |
The above expense ratios are from the Fund’s prospectus dated April 30, 2015. Additional information pertaining to the Fund’s expense ratios as of December 31, 2015 can be found in the financial highlights.
The Fund’s performance assumes the reinvestment of all dividends and distributions on securities. The performance above reflects any fee reductions during the applicable periods. If such fee reductions had not occurred, the quoted performance would have been lower. The MSCI-EM has been adjusted to reflect reinvestment of dividends on securities in the index.
International investing involves special risks including currency risk, political risk, increased volatility of foreign securities, and differences in auditing and other financial standards. In addition, prices of emerging markets securities can be significantly more volatile than the prices of securities in developed countries.
Up through December 31, 2015 the Fund was distributed by Unified Financial Securities, LLC (Member FINRA).
| (a) | The Fund commenced operations for all share classes on December 30, 2009. |
| (b) | Represents a hypothetical investment of $10,000 in the Fund after deducting the maximum sales load of 4.75% ($10,000 investment minus $475 sales load = $9,525). |
| (c) | The MSCI-EM is not adjusted to reflect sales charges, expenses, or other fees that are reflected in the Fund’s performance. The index is unmanaged and, unlike the Fund, is not affected by cash flows. It is not possible to invest directly in an index. |
Annual Shareholder Report
5
| | |
| Rational Real Strategies Fund | | As of December 31, 2015 |
| | |
| (formerly Huntington Real Strategies Fund) | | |
Management’s Discussion of Fund Performance
Portfolio Managers:
Peter Sorrentino, CFA
Senior Vice President
Paul Attwood, CFA
Senior Vice President
PERFORMANCE SUMMARY
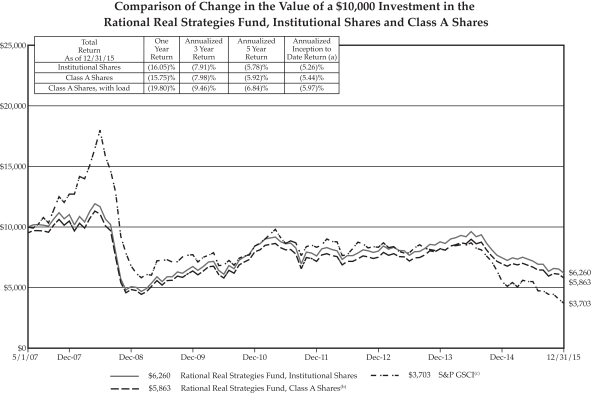
For the fiscal year ended December 31, 2015, the Rational Real Strategies Fund’s (the “Fund”) Institutional Shares and Class A Shares produced total returns (not including the deduction of applicable sales charges) of -16.05% and -15.75%, respectively, based on net asset value. This compares to the -32.86% return of the Standard and Poor’s Goldman Sachs Commodity Index® (“S&P GSCI”)(a), the Fund’s benchmark, for the same period. The Fund’s Class A Shares outperformed the benchmark by +17.11%. The Fund outperformed its benchmark primarily due to defensive return generated through the use of covered call options and the positive return from protective put options purchased on the S&P 500 Index® and the MSCI Emerging Market ETF, along with the call options on the CBOE Volatility Index®.
RECENT FUND ACTION
The Fund reduced its exposure to Industrial Service producers during the year. The Fund also continued the shift in emphasis in the Energy sector during the year from North America energy production to pipelines and other energy transportation. Additionally, the Fund increased downside hedging during the period as indications of potential price instability continued to accumulate, and valuations appeared stretched relative to underlying commodity prices.
ATTRIBUTION HIGHLIGHTS
The Fund’s investments in listed options, including defensive hedges, delivered the strongest performance during the period. This performance came throughout the year as market conditions for energy and basic materials deteriorated. The net effective contribution for both the covered call options and defensive hedges was a positive 26.68% for the period. Investments in oil refiner Valero Energy and independent energy producer SM Energy were the largest contributors to the Fund’s performance with a net positive impact of +3.18%. These holdings represented an average weight of 5.96% of the Fund’s net assets during the year. Investments in energy service providers Kinder Morgan and Cheniere Energy were the largest detractors from the Fund’s performance with negative impacts of -3.61% and -2.78% respectively. These holdings represented an average weight of 8.63% of the Fund’s net assets during the year.
| (a) | The S&P GSCI measures general price movements and inflation in the world economy. The Index is calculated primarily on a world production-weighted basis and is comprised of the principal physical commodities that are the subject of active, liquid futures markets. The index is unmanaged and, unlike the Fund, is not affected by cash flows. It is not possible to invest directly in an Index. |
This commentary may include statements that constitute “forward looking statements” under the U.S. securities laws. Forward-looking statements include, among other things, projections, estimates, and information about possible or future results related to the Portfolio, market or regulatory developments. The views expressed above are not guarantees of future performance or economic results and involve certain risks, uncertainties and assumptions that could cause actual outcomes and results to differ materially from the views expressed herein. The views expressed above are those of the Advisor as of December 31, 2015 and are subject to change at any time based upon economic, market, or other conditions and the Advisor undertakes no obligation to update the views expressed herein. Any discussions of specific securities should not be considered a recommendation to buy or sell those securities. The views expressed above (including any forward-looking statement) may not be relied upon as investment advice or as an indication of the Fund’s trading intent. Information about the Fund’s holdings, asset allocation or country diversification is historical and is not an indication of future Fund composition, which may vary.
The performance of any index mentioned in this commentary has not been adjusted for ongoing management, distribution and operating expenses, and sales charges applicable to mutual fund investments. If these additional fees were reflected, performance would have been lower.
Annual Shareholder Report
6
Rational Real Strategies Fund (Continued)
The Fund’s past performance does not guarantee future results. The investment return and principal value of an investment in the Fund will fluctuate so that an investor’s shares, when redeemed, may be worth more or less than their original cost. Current performance of the Fund may be lower or higher than the performance quoted. Performance data current to the most recent month end or after-tax returns may be obtained by calling 1-800-253-0412. Returns shown do not reflect the deduction of taxes that a shareholder would pay on Fund distributions or the redemption of Fund shares. Mutual funds are not obligations of or guaranteed by any bank and are not federally insured. Total returns, at load, include the 4.75% maximum sales charge for the Class A Shares.
| | | | | | | | |
| Class | | Gross
Expense Ratios | | | Net Expense Ratios | |
| Institutional Shares | | | 1.63% | | | | 1.15% | |
| Class A Shares | | | 1.88% | | | | 1.40% | |
The above expense ratios are from the Fund’s prospectus dated April 30, 2015. Additional information pertaining to the Fund’s expense ratios as of December 31, 2015 can be found in the financial highlights.
The Fund’s performance assumes the reinvestment of all dividends and distributions. The performance above reflects any fee reductions during the applicable periods. If such fee reductions had not occurred, the quoted performance would have been lower. The S&P GSCI has been adjusted to reflect reinvestment of dividends on securities in the indices.
Investments in real estate investment trusts (“REITs”) and real-estate related securities involve special risks associated with an investment in real estate, such as limited liquidity and interest rate risks and may be more volatile than other securities. In addition, the value of REITs and other real estate-related investments is sensitive to changes in real estate values, extended vacancies of properties and other environmental and economic factors.
Commodities-related investments are subject to the same risks as direct investments in commodities and prices may rise and fall in response to many factors such as economic, political and regulatory developments.
Funds whose investments are concentrated in a specific industry or sector may be subject to a higher degree of market risk than funds whose investments are diversified.
Up through December 31, 2015 the Fund was distributed by Unified Financial Securities, LLC (Member FINRA).
| (a) | The Fund commenced operations for all share classes on May 2, 2007. |
| (b) | Represents a hypothetical investment of $10,000 in the Fund after deducting the maximum sales load of 4.75% ($10,000 investment minus $475 sales load = $9,525). |
| (c) | The S&P GSCI is not adjusted to reflect sales charges, expenses, or other fees are reflected in the Fund’s performance. The index is unmanaged and, unlike the Fund, is not affected by cash flows. It is not possible to invest directly in an index. |
Annual Shareholder Report
7
| | |
| Rational Defensive Growth Fund | | As of December 31, 2015 |
| | |
| (formerly Huntington Situs Fund) | | |
Management’s Discussion of Fund Performance
Portfolio Managers:
Kirk Mentzer, MBA
Director of Fund Research
Peter Sorrentino, CFA
Senior Vice President
PERFORMANCE SUMMARY
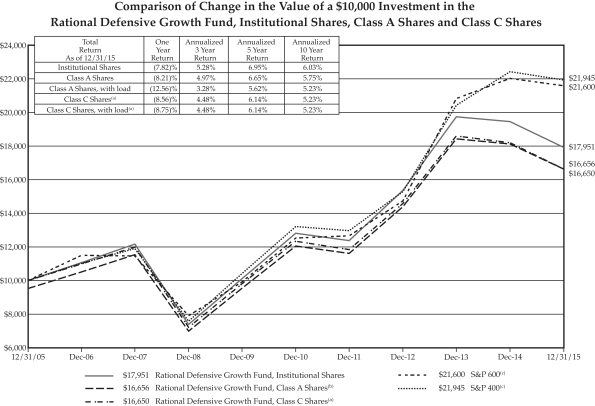
For the fiscal year ended December 31, 2015, the Rational Defensive Growth Fund’s (“Fund”) Institutional Shares, Class A Shares and Class C Shares produced total returns (not including the deduction of applicable sales charges) of -7.82%, -8.21% and -8.56%, respectively, based on net asset value. This compares to the -1.97% return of the Standard and Poor’s SmallCap 600 Index® (“S&P 600”)(a), the Fund’s benchmark, and the -2.18% total return of the Standard and Poor’s MidCap 400 Index® (“S&P 400”)(b), for the same period. The Fund’s Class A Shares underperformed the benchmark by 6.24%.
RECENT FUND ACTION
With valuations at extended levels, profit weakness, sluggish global economic growth trends and uncertain Federal Reserve (“Fed”) action, we continued to advocate muted cyclical exposure within portfolios. Corporations in aggregate have issued a tremendous amount of debt in 2015 and corporate bond risk spreads have widened to reflect the higher risk of default as profit margins, growth and economic growth have slowed. Continuing a theme that began last year, attempting to de-risk portfolios while maintaining allocations was the balance we struck as a theme for 2015. Sluggish global economic growth did not offer much hope of a robust rebound in activity on the horizon. Below are three recent industry changes:
| | • | | Leisure Products was an area that had severely underperformed over the past year. The industry is domestically focused, which dodges the currency issues that negatively impacted so many other groups. Input prices were favorable and translated into improved margins. Valuation was fair, but could allow for upside surprises due to depressed earnings expectations. Quality was good as debt levels have been contained. A recession or rising input costs are the two largest negatives. We raised the group to attractive. |
| | • | | Bank vs Real Estate Investment Trusts (“REITs”): While banks have been major beneficiaries of the anticipated Fed tightening, REIT shares have conversely suffered. In the medium term, economic conditions are expected to weaken due to a stronger dollar, slower world growth and will ultimately weigh on Commercial & Industrial loan quality. Thus, the banks were put on downgrade watch. Following the Fed rate increase in December 2015, REIT shares rebounded thanks to relief that the adjustment was made and additional increases were expected to be mild. This improving monetary environment for REIT shares could result in positive earnings and multiple expansions. |
| | • | | Restaurants had reasonable profit growth expectations and performance had been excellent, however, the outlook was getting less appealing. Market turmoil and weak wage growth may result in weaker sales trends in the future. Trade surveys already signal a trend change. Surprisingly, about half of the industry sales are international. Currency trends continue to work against multinationals, especially for those with emerging markets exposure. We moved the restaurant group from attractive to neutral. |
Annual Shareholder Report
8
Rational Defensive Growth Fund (Continued)
ATTRIBUTION HIGHLIGHTS
Domestic small cap equity markets experienced a sharp decline in late summer, followed by a rebound in the fourth quarter that produced a +0.27% total return for the year as measured by the S&P 600. The Fund underperformed due to sector allocation and security selection. Specifically, sector allocation detracted 0.85% and security selection subtracted -1.56%. The best relative performing sectors were Financials, Health Care and Materials. The worst relative performing sectors were Energy, Industrials and Technology.
The five largest positive contributors to performance were: Myriad Genetics +1.08%, Tyler Technologies +0.90%, Amsurg Corp. +0.71%, Arch Capital Group Ltd. +0.52%, and Tractor Supply Company +0.48%. The five largest detractors were: Geospace Technologies Corporation -2.20%, United States Lime & Minerals -1.16%, Companhia Brasileira de Distribuicao Sponsored ADR -0.84%, Osiris Therapeutics -0.73%, and Flowserve Corporation -0.66%.
Portfolio Risk:
During the year, overall portfolio risk was lowered significantly as measured by the Northfield system. Average market capitalization declined from $5.1 billion to $2.6 billion. Price-to-earnings and price-to-book improved (fell) over 31% and 23%, respectively. Total- and benchmark-risk were both lowered 12.2%. Predicted tracking error fell nearly 25% to 3.77. These adjustments were made to guard against increased market volatility.
| (a) | The S&P 600 is a capitalization-weighted index representing all major industries in the small-cap range of the U.S. stock market. The index is unmanaged and, unlike the Fund, is not affected by cash flows. It is not possible to invest directly in an Index. |
| (b) | The S&P 400 is a capitalization-weighted index comprised of common stocks representing all major industries in the mid-range of the U.S. stock market. The index is unmanaged and, unlike the Fund, is not affected by cash flows. It is not possible to invest directly in an Index. |
This commentary may include statements that constitute “forward looking statements” under the U.S. securities laws. Forward-looking statements include, among other things, projections, estimates, and information about possible or future results related to the Fund, market or regulatory developments. The views expressed above are not guarantees of future performance or economic results and involve certain risks, uncertainties and assumptions that could cause actual outcomes and results to differ materially from the views expressed herein. The views expressed above are those of the Advisor as of December 31, 2015 and are subject to change at any time based upon economic, market, or other conditions and the Advisor undertakes no obligation to update the views expressed herein. Any discussions of specific securities should not be considered a recommendation to buy or sell those securities. The views expressed above (including any forward-looking statement) may not be relied upon as investment advice or as an indication of the Fund’s trading intent. Information about the Fund’s holdings, asset allocation or country diversification is historical and is not an indication of future Fund composition, which may vary.
The performance of any index mentioned in this commentary has not been adjusted for ongoing management, distribution and operating expenses, and sales charges applicable to mutual fund investments. If these additional fees were reflected, performance would have been lower.
Annual Shareholder Report
9
Rational Defensive Growth Fund (Continued)
The Fund’s past performance does not guarantee future results. The investment return and principal value of an investment in the Fund will fluctuate so that an investor’s shares, when redeemed, may be worth more or less than their original cost. Current performance of the Fund may be lower or higher than the performance quoted. Performance data current to the most recent month end or after-tax returns may be obtained by calling 1-800-253-0412. Returns shown do not reflect the deduction of taxes that a shareholder would pay on Fund distributions or the redemption of Fund shares. Mutual funds are not obligations of or guaranteed by any bank and are not federally insured. Total returns, with load, include the 4.75% maximum sales charge for the Class A Shares or the 1.00% maximum deferred sales charge for the Class C Shares.
| | | | | | | | |
| Class | | Gross
Expense Ratios | | | Net Expense Ratios | |
| Institutional Shares | | | 1.37% | | | | 1.03% | |
| Class A Shares | | | 1.62% | | | | 1.28% | |
| Class C Shares | | | 2.12% | | | | 1.78% | |
The above expense ratios are from the Fund’s prospectus dated April 30, 2015. Additional information pertaining to the Fund’s expense ratios as of December 31, 2015 can be found in the financial highlights.
The Fund’s performance assumes the reinvestment of all dividends and distributions. The performance above reflects any fee reductions during the applicable periods. If such fee reductions had not occurred, the quoted performance would have been lower. The S&P 600 and S&P 400 have been adjusted to reflect reinvestment of dividends on securities in the indices.
Small company stocks may be less liquid and subject to greater price volatility than large capitalization stocks.
Funds whose investments are concentrated in a specific industry or sector may be subject to a higher degree of market risk than funds whose investments are diversified. In addition, the Fund may be subject to specific risks of the information technology sector, such as obsolescence.
Up through December 31, 2015 the Fund was distributed by Unified Financial Securities, LLC (Member FINRA).
| (a) | Class C Shares commenced operations on January 3, 2014. Prior to January 3, 2014, performance is based on the performance of Class A Shares adjusted for the Class C Shares’ 12b-1 fees and contingent deferred sales charge. |
| (b) | Represents a hypothetical investment of $10,000 in the Fund after deducting the maximum sales load of 4.75% ($10,000 investment minus $475 sales load = $9,525). |
| (c) | The S&P 600 and S&P 400 are not adjusted to reflect sales charges, expenses, or other fees that are reflected in the Fund’s performance. The indices are unmanaged and, unlike the Fund, are not affected by cash flows. It is not possible to invest directly in an index. |
Annual Shareholder Report
10
| | |
| Rational Strategic Allocation Fund | | As of December 31, 2015 |
| | |
| (formerly Huntington Balanced Allocation Fund) | | |
Management’s Discussion of Fund Performance
Portfolio Managers:
Kirk Mentzer, MBA
Director of Fund Research
Peter Sorrentino, CFA
Senior Vice President
PERFORMANCE SUMMARY
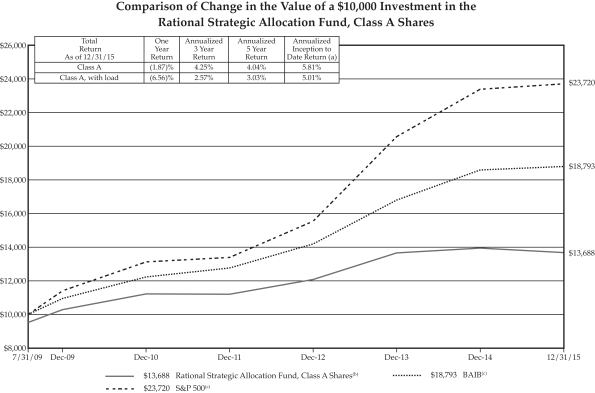
For the fiscal year ended December 31, 2015, the Rational Strategic Allocation Fund’s (the “Fund”) Class A Shares reported a total return (not including the deduction of applicable sales charges) of -1.87% based on net asset value. The Fund underperformed relative to the +1.38% return of the Standard & Poor’s 500® Index (“S&P 500”), its benchmark. The Fund’s Class A Shares underperformed its benchmark by 3.25%. The Fund underperformed relative to the +1.05% total return of the Balanced Allocation Indices Blend (“BAIB”) for the same period. Contributing to the underperformance was the allocation of the Fund’s net assets of 60% in equity funds, 33% in fixed income funds and 7% in money market fund assets.
FUND ALLOCATION
Overall, the Fund was extremely diversified across asset classes and reflected the market expectations of Huntington Asset Advisors, Inc. During the fourth quarter, we attempted to reduce risk exposure away from equity markets towards fixed income in light of our views for the economic environment for the remainder of 2015 and looking ahead to 2016.
Despite the Federal Reserve (the “Fed”) rate hike in December, we believe concerns about global economic growth will likely slow further tightening episodes. Weak growth in Chinese and emerging market economies have resulted in a strong U.S. dollar, commodity price declines, and weakening profit growth trends. Unless there is an upturn in the emerging markets business cycle that serves to reverse these trajectories, we do not expect the Fed to tighten monetary policy significantly 2016.
What are the implications for financial markets? The era of unprecedented monetary accommodation on a global scale has been a major driver of higher stock prices yet economic growth remains sluggish. Removing excess monetary stimulus in the future will be challenging. Furthermore, global sales per share have collapsed for all but the U.S., which has been supported by relatively better GDP growth and share repurchases. However, the U.S. is not an economic island. In a world of too much debt and over capacity, a sudden reversal upward is highly unlikely. Rising corporate bond spreads and volatility measures further confirm the earnings concerns. Downward pressure on earnings remains a major risk for corporate valuations (both bonds and stocks).
Protecting asset values has been a prevalent theme all year. We sought to maintain conservative domestic equity asset allocation in large market capitalized funds that favor defensive sector/industry allocation, lower beta, and high quality bias. Defensive groups are now clearly emphasized in our strategy due to market risks and stretched valuation levels. In terms of fixed income fund emphasis, our allocations shifted towards lower interest rate and credit risk during the fourth quarter which was consistent with our overall market views.
Annual Shareholder Report
11
Rational Strategic Allocation Fund (Continued)
ATTRIBUTION HIGHLIGHTS
| | • | | The Rational Dividend Capture, the Fund’s largest equity holding (13.3% of the Fund’s net assets at the end of the year) reported a total return of -3.25% and underperformed the +1.38% return of the S&P 500. |
| | • | | The second largest equity fund holding, the U.S. Equity Rotation Strategy ETF gained +2.49%. The remaining fund performances included: EcoLogical Strategy ETF gained +0.96%; the Rational Risk Managed Emerging Markets Fund lost -0.60%; and finally, the Rational Defensive Growth Fund lost -7.82%. These holdings represented 12.4%(c), 12.2%(c), 12.1%(c) and 10.2%(c) of the Fund’s net assets at the end of the year, respectively. |
| | • | | The Fund’s fixed income allocation included the Federated Short & Intermediate Bond Fund, the Federated Total Return Bond Fund and the Federated Mortgage Fund (16.0%(c), 9.0%(c) and 8.0%(c) of the Fund’s net assets at the end of the year, respectively). All three gained in performance as interest rates stayed range bound for much of the year. |
| | • | | The largest detractor to the Fund’s performance was its holding in the Rational Defensive Growth Fund, which declined by -7.82% as small cap markets adjusted to lower expected growth and higher anticipated interest rates. However, we believe this Fund provides a significant upside potential in the equity markets in the event that the investment environment changes in the near future. |
| (a) | The S&P 500 is a capitalization-weighted index comprised of 500 stocks and designed to measure performance of the broad domestic economy through changes in the aggregate market value of 500 stocks representing all major industries. The index is unmanaged and, unlike the Fund, is not affected by cash flows. It is not possible to invest directly in an Index. |
| (b) | The Balanced Allocation Indices Blended Benchmark is a custom blended index comprised of the following two indices with their noted respective weightings: S&P 500 (60%) and the Barclays U.S. Aggregate Bond Index (40%). The Barclays U.S. Aggregate Bond Index is comprised of securities from the Barclays Government/Corporate Bond Index, Mortgage Securities Index and the Asset Based Index. Total return comprises price appreciation/depreciation and income as a percentage of the original investment. Indices are rebalanced monthly by market capitalization. The index is unmanaged and, unlike the Fund, is not affected by cash flows. It is not possible to invest directly in an Index. |
| (c) | Percentage of holdings based on Fund’s net assets as of 12/31/2015. The composition of the Fund’s holdings is subject to change. |
This commentary may include statements that constitute “forward looking statements” under the U.S. securities laws. Forward-looking statements include, among other things, projections, estimates, and information about possible or future results related to the Fund, market or regulatory developments. The views expressed above are not guarantees of future performance or economic results and involve certain risks, uncertainties and assumptions that could cause actual outcomes and results to differ materially from the views expressed herein. The views expressed above are those of the Advisor as of December 31, 2015 and are subject to change at any time based upon economic, market, or other conditions and the Advisor undertakes no obligation to update the views expressed herein. Any discussions of specific securities should not be considered a recommendation to buy or sell those securities. The views expressed above (including any forward-looking statement) may not be relied upon as investment advice or as an indication of the Fund’s trading intent. Information about the Fund’s holdings, asset allocation or country diversification is historical and is not an indication of future Fund composition, which may vary.
The performance of any index mentioned in this commentary has not been adjusted for ongoing management, distribution and operating expenses, and sales charges applicable to mutual fund investments. If these additional fees were reflected, performance would have been lower.
Annual Shareholder Report
12
Rational Strategic Allocation Fund (Continued)
The Fund’s past performance does not guarantee future results. The investment return and principal value of an investment in the Fund will fluctuate so that an investor’s shares, when redeemed, may be worth more or less than their original cost. Current performance of the Fund may be lower or higher than the performance quoted. Performance data current to the most recent month end or after-tax returns may be obtained by calling 1-800-253-0412. Returns shown do not reflect the deduction of taxes that a shareholder would pay on Fund distributions or the redemption of Fund shares. Mutual funds are not obligations of or guaranteed by any bank and are not federally insured. Total returns, at load, include the 4.75% maximum sales charge for the Class A Shares.
| | | | | | | | |
| Class | | Gross
Expense Ratio | | | Net Expense Ratio | |
| Class A Shares | | | 1.82% | | | | 1.56% | |
The above expense ratio is from the Fund’s prospectus dated April 30, 2015. Additional information pertaining to the Fund’s expense ratio as of December 31, 2015 can be found in the financial highlights.
The Fund’s performance assumes the reinvestment of all dividends and distributions on securities. The performance above reflects any fee reductions during the applicable periods. If such fee reductions had not occurred, the quoted performance would have been lower. The S&P 500 and BAIB have been adjusted to reflect reinvestment of dividends on securities in the indices.
Up through December 31, 2015 the Fund was distributed by Unified Financial Securities, LLC (Member FINRA).
| (a) | The Fund commenced operations on July 31, 2009. |
| (b) | Represents a hypothetical investment of $10,000 in the Fund after deducting the maximum sales load of 4.75% ($10,000 investment minus $475 sales load = $9,525). |
| (c) | The S&P 500 and BAIB are not adjusted to reflect sales charges, expenses, or other fees that are reflected in the Fund’s performance. The indices are unmanaged and, unlike the Fund, are not affected by cash flows. It is not possible to invest directly in an index. |
Annual Shareholder Report
13
| | |
| Rational Dividend Capture Fund | | December 31, 2015 |
| | |
| Portfolio of Investments Summary Table | | (unaudited) |
| | | | |
| Asset Allocation | | Percentage of
Market Value | |
Financials | | | 32.8% | |
Real Estate Investment Trusts | | | 13.7% | |
Health Care | | | 7.8% | |
Energy | | | 7.5% | |
Short-Term Securities Held as Collateral for Securities Lending | | | 7.2% | |
Consumer Staples | | | 6.8% | |
Industrials | | | 5.7% | |
Information Technology | | | 4.7% | |
Utilities | | | 3.8% | |
Consumer Discretionary | | | 2.9% | |
Telecommunication Services | | | 2.3% | |
Cash | | | 2.3% | |
Materials | | | 1.7% | |
Exchange-Traded Funds | | | 0.8% | |
Total | | | 100.0% | |
Portfolio holdings and allocations are subject to change. As of December 31, 2015, percentages in the table above are based on total investments. Such total investments may differ from the percentages set forth below in the Portfolio of Investments which are computed using the Fund’s net assets.
The Portfolio of Investments Summary Table and the Portfolio of Investments are broken down by sectors, and these sectors do not represent industry categories for purposes of identifying “industry concentration” as described in the Investment Company Act of 1940, as amended.
Portfolio of Investments
| | | | | | | | | | |
| Shares | | | | | Fair Value | | | |
| | | | | | | | | | |
| Common Stocks — 73.4% | | | | | | |
| Consumer Discretionary — 3.1% | | | | | | |
| | 22,000 | | | General Motors Co. | | $ | 748,220 | | | |
| | 18,000 | | | Johnson Controls, Inc. | | | 710,820 | | | |
| | 14,250 | | | Polaris Industries, Inc. | | | 1,224,787 | | | |
| | 6,250 | | | Starwood Hotels & Resorts Worldwide, Inc. | | | 433,000 | | | |
| | | | | | | | 3,116,827 | | | |
| Consumer Staples — 7.5% | | | | | | |
| | 31,500 | | | Coca-Cola Co./The | | | 1,353,240 | | | |
| | 20,000 | | | Colgate-Palmolive Co. | | | 1,332,400 | | | |
| | 9,000 | | | Kellogg Co. | | | 650,430 | | | |
| | 5,500 | | | Kimberly-Clark Corp. | | | 700,150 | | | |
| | 15,000 | | | PepsiCo, Inc. | | | 1,498,800 | | | |
| | 7,750 | | | Philip Morris International, Inc. | | | 681,303 | | | |
| | 20,000 | | | Wal-Mart Stores, Inc. | | | 1,226,000 | | | |
| | | | | | | | 7,442,323 | | | |
| Energy — 8.2% | | | | | | |
| | 16,750 | | | Chevron Corp. | | | 1,506,830 | | | |
| | 23,250 | | | ConocoPhillips | | | 1,085,543 | | | |
| | 39,750 | | | Exxon Mobil Corp. | | | 3,098,512 | | | |
| | 10,000 | | | Helmerich & Payne, Inc. (a) | | | 535,500 | | | |
| | 15,250 | | | Murphy Oil Corp. | | | 342,363 | | | |
| | 105,000 | | | Noble Corp. PLC (a) | | | 1,107,750 | | | |
| | | | | | | | | | |
| Shares | | | | | Fair Value | | | |
| | | | | | | | | | |
| Common Stocks — (Continued) | | | | | | |
| Energy — (Continued) | | | | | | |
| | 7,000 | | | Occidental Petroleum Corp. | | $ | 473,270 | | | |
| | | | | | | | 8,149,768 | | | |
| Financials — 16.9% | | | | | | |
| | 274,500 | | | Apollo Investment Corp. (b) | | | 1,432,890 | | | |
| | 32,000 | | | Ares Capital Corp. (b) | | | 456,000 | | | |
| | 29,000 | | | Bank of Nova Scotia/The (a) | | | 1,172,760 | | | |
| | 7,250 | | | Cullen/Frost Bankers, Inc. | | | 435,000 | | | |
| | 37,500 | | | Eaton Vance Corp. (a) | | | 1,216,125 | | | |
| | 36,250 | | | Fifth Third Bancorp | | | 728,625 | | | |
| | 23,750 | | | JPMorgan Chase & Co. | | | 1,568,212 | | | |
| | 132,000 | | | KeyCorp. | | | 1,741,080 | | | |
| | 8,500 | | | PNC Financial Services Group, Inc./The | | | 810,135 | | | |
| | 1,029 | | | RMR Group, Inc./The, Class A * | | | 14,831 | | | |
| | 22,000 | | | Royal Bank of Canada | | | 1,178,760 | | | |
| | 14,500 | | | SunTrust Banks, Inc. | | | 621,180 | | | |
| | 5,250 | | | Travelers Cos., Inc./The | | | 592,515 | | | |
| | 36,100 | | | U.S. Bancorp. | | | 1,540,387 | | | |
| | 24,000 | | | Umpqua Holdings Corp. | | | 381,600 | | | |
| | 38,250 | | | Waddell & Reed Financial, Inc., Class A | | | 1,096,245 | | | |
(See notes which are an integral part of the Financial Statements)
Annual Shareholder Report
14
| | |
| Rational Dividend Capture Fund | | (Continued) |
| | | | | | | | | | |
| Shares | | | | | Fair Value | | | |
| | | | | | | | | | |
| Common Stocks — (Continued) | | | | | | |
| Financials — (Continued) | | | | | | |
| | 33,850 | | | Wells Fargo & Co. | | $ | 1,840,086 | | | |
| | | | | | | | 16,826,431 | | | |
| Health Care — 8.5% | | | | | | |
| | 9,000 | | | Abbott Laboratories | | | 404,190 | | | |
| | 11,000 | | | AbbVie, Inc. | | | 651,640 | | | |
| | 18,250 | | | GlaxoSmithKline PLC ADR | | | 736,388 | | | |
| | 7,750 | | | Johnson & Johnson | | | 796,080 | | | |
| | 38,250 | | | Merck & Co., Inc. | | | 2,020,365 | | | |
| | 74,000 | | | Pfizer, Inc. | | | 2,388,720 | | | |
| | 14,500 | | | St. Jude Medical, Inc. | | | 895,665 | | | |
| | 6,000 | | | Stryker Corp. | | | 557,640 | | | |
| | | | | | | | 8,450,688 | | | |
| Industrials — 6.2% | | | | | | |
| | 2,500 | | | 3M Co. | | | 376,600 | | | |
| | 19,000 | | | ADT Corp./The (a) | | | 626,620 | | | |
| | 44,250 | | | CSX Corp. | | | 1,148,287 | | | |
| | 18,250 | | | Deluxe Corp. | | | 995,355 | | | |
| | 42,000 | | | General Electric Co. | | | 1,308,300 | | | |
| | 15,000 | | | Hillenbrand, Inc. | | | 444,450 | | | |
| | 40,750 | | | Tyco International PLC | | | 1,299,517 | | | |
| | | | | | | | 6,199,129 | | | |
| Information Technology — 5.1% | | | | | | |
| | 9,000 | | | CA, Inc. | | | 257,040 | | | |
| | 30,000 | | | Cisco Systems, Inc. | | | 814,650 | | | |
| | 23,250 | | | Intel Corp. | | | 800,963 | | | |
| | 7,500 | | | International Business Machines Corp. | | | 1,032,150 | | | |
| | 1,750 | | | Microchip Technology, Inc. (a) | | | 81,445 | | | |
| | 7,500 | | | Paychex, Inc. | | | 396,675 | | | |
| | 37,250 | | | Symantec Corp. | | | 782,250 | | | |
| | 92,000 | | | Xerox Corp. | | | 977,960 | | | |
| | | | | | | | 5,143,133 | | | |
| Materials — 1.9% | | | | | | |
| | 10,500 | | | Packaging Corporation of America | | | 662,025 | | | |
| | 29,250 | | | Sonoco Products Co. | | | 1,195,447 | | | |
| | | | | | | | 1,857,472 | | | |
| Real Estate Investment Trusts — 9.4% | | | | | | |
| | 20,750 | | | Camden Property Trust (a) | | | 1,592,770 | | | |
| | 48,000 | | | HCP, Inc. | | | 1,835,520 | | | |
| | 4,000 | | | Highwoods Properties, Inc. | | | 174,400 | | | |
| | 43,000 | | | Hospitality Properties Trust | | | 1,124,450 | | | |
| | 111,750 | | | Host Hotels & Resorts, Inc. | | | 1,714,245 | | | |
| | 194,000 | | | Lexington Realty Trust | | | 1,552,000 | | | |
| | 7,500 | | | Realty Income Corp. (a) | | | 387,225 | | | |
| | 9,000 | | | Tanger Factory Outlet Centers, Inc. | | | 294,300 | | | |
| | 12,250 | | | Ventas, Inc. | | | 691,268 | | | |
| | | | | | | | 9,366,178 | | | |
| | | | | | | | | | |
| Shares | | | | | Fair Value | | | |
| | | | | | | | | | |
| Common Stocks — (Continued) | | | | | | |
| Telecommunication Services — 2.5% | | | | | | |
| | 31,000 | | | AT&T, Inc. | | $ | 1,066,710 | | | |
| | 32,000 | | | Verizon Communications, Inc. | | | 1,479,040 | | | |
| | | | | | | | 2,545,750 | | | |
| Utilities — 4.1% | | | | | | |
| | 62,000 | | | CenterPoint Energy, Inc. | | | 1,138,320 | | | |
| | 7,250 | | | Entergy Corp. | | | 495,610 | | | |
| | 45,250 | | | Exelon Corp. | | | 1,256,592 | | | |
| | 11,000 | | | National Fuel Gas Co. | | | 470,250 | | | |
| | 22,000 | | | TransCanada Corp. | | | 716,980 | | | |
| | | | | | | | 4,077,752 | | | |
| Total Common Stocks (Cost $77,313,818) | | | 73,175,451 | | | |
| Preferred Stocks — 24.5% | | | | | | |
| Financials — 19.0% | | | | | | |
| | 61,000 | | | Aegon NV, 8.00% | | | 1,679,940 | | | |
| | 95,000 | | | Allstate Corp./The, 5.10% | | | 2,345,550 | | | |
| | 113,129 | | | Axis Capital Holdings Ltd.,
Series C, 6.88% | | | 3,034,120 | | | |
| | 135,000 | | | KKR Financial Holdings LLC, 8.38% | | | 3,573,450 | | | |
| | 100,000 | | | Raymond James Financial, Inc., 6.90% | | | 2,666,000 | | | |
| | 80,000 | | | U.S. Bancorp,
Series F, 6.50% | | | 2,296,000 | | | |
| | 118,000 | | | Wells Fargo & Co.,
Series J, 8.00% | | | 3,313,440 | | | |
| | | | | | | | 18,908,500 | | | |
| Real Estate Investment Trusts — 5.5% | | | | | | |
| | 10,000 | | | National Retail Properties, Inc., Series D, 6.63% | | | 260,600 | | | |
| | 80,000 | | | PS Business Parks, Inc.,
Series S, 6.45% | | | 2,106,400 | | | |
| | 60,000 | | | Public Storage, Inc.,
Series Q, 6.50% | | | 1,524,600 | | | |
| | 60,000 | | | Realty Income Corp.,
Series F, 6.63% | | | 1,589,400 | | | |
| | | | | | | | 5,481,000 | | | |
| Total Preferred Stocks (Cost $24,229,772) | | | 24,389,500 | | | |
| Exchange-Traded Funds — 0.9% | | | | | | |
| | 12,000 | | | iShares U.S. Real Estate ETF (a) | | | 901,320 | | | |
| Total Exchange-Traded Funds (Cost $912,940) | | | 901,320 | | | |
| Cash Equivalents — 2.5% | | | | | | |
| | 2,475,488 | | | Federated Treasury Obligations Fund, Institutional Class, 0.07% (c) | | | 2,475,488 | | | |
| Total Cash Equivalents (Cost $2,475,488) | | | 2,475,488 | | | |
(See notes which are an integral part of the Financial Statements)
Annual Shareholder Report
15
| | |
| Rational Dividend Capture Fund | | (Continued) |
| | | | | | | | | | |
| Shares | | | | | Fair Value | | | |
| | | | | | | | | | |
| Short-Term Securities Held as Collateral for
Securities Lending — 7.8% | | | | | | |
| | 7,799,288 | | | Fidelity Institutional Money Market Portfolio, Institutional Class,
0.32% (c) | | $ | 7,799,288 | | | |
| Total Short-Term Securities Held as Collateral
for Securities Lending (Cost $7,799,288) | | | 7,799,288 | | | |
| Total Investments
(Cost $112,731,306) — 109.1% | | | 108,741,047 | | | |
| Liabilities in Excess of Other Assets — (9.1)% | | | (9,044,339) | | | |
| Net Assets — 100.0% | | $ | 99,696,708 | | | |
| (a) | All or a portion of the security was on loan as of December 31, 2015. The total value of securities on loan as of December 31, 2015 was $7,565,415. |
| (b) | Business Development Company. |
| (c) | Rate disclosed is the seven day yield as of December 31, 2015. |
| * | Non-income producing security. |
ADR — American Depositary Receipt
ETF — Exchange Traded Fund
The sectors shown on the portfolio of investments are based on the Global Industry Classification Standard, or GICS® (“GICS”). The GICS was developed and/or is the exclusive property of MSCI, Inc. and Standard & Poor Financial Services LLC (“S&P”). GICS is a service mark of MSCI, Inc. and S&P and has been licensed for use by Ultimus Asset Services, LLC.
(See notes which are an integral part of the Financial Statements)
Annual Shareholder Report
16
| | |
| Rational Risk Managed Emerging Markets Fund | | December 31, 2015 |
| | |
| Portfolio of Investments Summary Table | | (unaudited) |
| | | | |
| Asset Allocation | | Percentage of
Market Value | |
Japan | | | 17.6% | |
China | | | 14.3% | |
Taiwan | | | 11.1% | |
Republic of South Korea | | | 10.2% | |
Cash | | | 7.9% | |
India | | | 7.1% | |
Malaysia | | | 6.4% | |
Indonesia | | | 6.2% | |
Hong Kong | | | 3.7% | |
United Kingdom | | | 3.4% | |
Belgium | | | 3.4% | |
France | | | 3.1% | |
Thailand | | | 2.4% | |
Mexico | | | 2.1% | |
Brazil | | | 1.1% | |
Total | | | 100.0% | |
Portfolio holdings and allocations are subject to change. As of December 31, 2015, percentages in the table above are based on total investments. Such total investments may differ from the percentages set forth below in the Portfolio of Investments which are computed using the Fund’s net assets.
The Portfolio of Investments are broken down by sectors, and these sectors do not represent industry categories for purposes of identifying “industry concentration” as described in the Investment Company Act of 1940, as amended.
Portfolio of Investments
| | | | | | | | | | |
| Shares | | | | | Fair Value | | | |
| | | | | | | | | | |
| Common Stocks — 83.5% | | | | | | |
| Belgium — 3.1% | | | | | | |
| Consumer Staples — 3.1% | | | | | | |
| | 2,500 | | | Anheuser-Busch InBev SA/NV | | $ | 310,785 | | | |
| Brazil — 1.0% | | | | | | |
| Information Technology — 1.0% | | | | | | |
| | 12,000 | | | Cielo SA | | | 101,736 | | | |
| China — 13.2% | | | | | | |
| Financials — 1.8% | | | | | | |
| | 210,000 | | | Colour Life Services Group Co. Ltd. | | | 179,650 | | | |
| Industrials — 3.2% | | | | | | |
| | 960,000 | | | CT Environmental Group Ltd. | | | 314,629 | | | |
| Information Technology — 8.2% | | | | | | |
| | 3,000 | | | Alibaba Group Holding Ltd. ADR * | | | 243,810 | | | |
| | 4,000 | | | Qihoo 360 Technology Co. Ltd. ADR * | | | 291,240 | | | |
| | 14,500 | | | Tencent Holdings Ltd. | | | 285,320 | | | |
| | | | | | | | 820,370 | | | |
| | | | | | | | 1,314,649 | | | |
| France — 2.9% | | | | | | |
| Industrials — 2.9% | | | | | | |
| | 4,200 | | | Safran SA | | | 289,219 | | | |
| | | | | | | | | | |
| Shares | | | | | Fair Value | | | |
| | | | | | | | | | |
| Common Stocks — (Continued) | | | | | | |
| Hong Kong — 3.5% | | | | | | |
| Health Care — 3.5% | | | | | | |
| | 378,000 | | | Sino Biopharmaceutical Ltd. | | $ | 344,343 | | | |
| India — 6.2% | | | | | | |
| Financials — 1.2% | | | | | | |
| | 7,200 | | | HDFC Bank Ltd. | | | 117,289 | | | |
| Health Care — 1.8% | | | | | | |
| | 15,000 | | | Sun Pharmaceutical Industries Ltd. | | | 185,191 | | | |
| Information Technology — 3.2% | | | | | | |
| | 3,300 | | | Tata Consultancy Services Ltd. | | | 121,054 | | | |
| | 24,800 | | | Tech Mahindra Ltd. | | | 194,745 | | | |
| | | | | | | | 315,799 | | | |
| | | | | | | | 618,279 | | | |
| Indonesia — 4.5% | | | | | | |
| Consumer Discretionary — 2.7% | | | | | | |
| | 209,000 | | | Matahari Department Store Tbk PT | | | 266,841 | | | |
| Telecommunication Services — 1.8% | | | | | | |
| | 430,000 | | | Tower Bersama Infrastructure Tbk PT | | | 183,261 | | | |
| | | | | | | | 450,102 | | | |
(See notes which are an integral part of the Financial Statements)
Annual Shareholder Report
17
| | |
| Rational Risk Managed Emerging Markets Fund | | (Continued) |
| | | | | | | | | | |
| Shares | | | | | Fair Value | | | |
| | | | | | | | | | |
| Common Stocks — (Continued) | | | | | | |
| Japan — 16.2% | | | | | | |
| Consumer Staples — 6.9% | | | | | | |
| | 7,100 | | | Seven & i Holdings Co. Ltd. | | $ | 327,829 | | | |
| | 6,400 | | | Welcia Holdings Co. Ltd. | | | 357,804 | | | |
| | | | | | | | 685,633 | | | |
| Health Care — 2.9% | | | | | | |
| | 20,000 | | | Astellas Pharma, Inc. | | | 288,103 | | | |
| Information Technology — 6.4% | | | | | | |
| | 580 | | | KEYENCE Corp. | | | 323,680 | | | |
| | 2,200 | | | Murata Manufacturing Co. Ltd. | | | 321,581 | | | |
| | | | | | | | 645,261 | | | |
| | | | | | | | 1,618,997 | | | |
| Malaysia — 5.9% | | | | | | |
| Consumer Discretionary — 1.0% | | | | | | |
| | 210,000 | | | Berjaya Auto Bhd. | | | 104,572 | | | |
| Health Care — 2.2% | | | | | | |
| | 102,000 | | | Kossan Rubber Industries Bhd. | | | 220,733 | | | |
| Information Technology — 2.7% | | | | | | |
| | 177,000 | | | Globetronics Technology Bhd. | | | 267,714 | | | |
| | | | | | | | 593,019 | | | |
| Mexico — 1.9% | | | | | | |
| Financials — 0.7% | | | | | | |
| | 12,100 | | | Grupo Financiero Interacciones SA de CV | | | 73,376 | | | |
| Utilities — 1.2% | | | | | | |
| | 28,000 | | | Infraestructura Energetica Nova SAB de CV | | | 117,507 | | | |
| | | | | 190,883 | | | |
| Republic of South Korea — 9.4% | | | | | | |
| Consumer Staples — 3.7% | | | | | | |
| | 1,200 | | | Cosmax, Inc. | | | 187,516 | | | |
| | 200 | | | LG Household & Health Care Ltd. | | | 178,344 | | | |
| | | | | 365,860 | | | |
| Health Care — 3.1% | | | | | | |
| | 6,300 | | | InBody Co. Ltd. | | | 310,318 | | | |
| Information Technology — 2.6% | | | |
| | 3,600 | | | Koh Young Technology, Inc. | | | 118,166 | | | |
| | 5,000 | | | KONA I Co. Ltd. | | | 145,648 | | | |
| | | | | | | | 263,814 | | | |
| | | | | | | | 939,992 | | | |
| Taiwan — 10.3% | | | | | | |
| Consumer Discretionary — 4.6% | | | | | | |
| | 70,000 | | | Hota Industrial Manufacturing Co. Ltd. | | | 256,861 | | | |
| | 20,048 | | | PChome Online, Inc. | | | 200,024 | | | |
| | | | | 456,885 | | | |
| | | | | | | | | | |
| Shares | | | | | Fair Value | | | |
| | | | | | | | | | |
| Common Stocks — (Continued) | | | | | | |
| Taiwan — (Continued) | | | | | | |
| Industrials — 2.3% | | | | | | |
| | 15,750 | | | Voltronic Power Technology Corp. | | $ | 233,802 | | | |
| Information Technology — 3.4% | | | | | | |
| | 59,955 | | | Adlink Technology, Inc. | | | 138,183 | | | |
| | 17,500 | | | Ennoconn Corp. | | | 197,422 | | | |
| | | | | | | | 335,605 | | | |
| | | | | | | | 1,026,292 | | | |
| Thailand — 2.2% | | | | | | |
| Information Technology — 2.2% | | | | | | |
| | 115,000 | | | KCE Electronics PCL | | | 223,425 | | | |
| United Kingdom — 3.2% | | | | | | |
| Consumer Staples — 3.2% | | | | | | |
| | 3,400 | | | Reckitt Benckiser Group PLC | | | 314,814 | | | |
| Total Common Stocks (Cost $7,065,148) | | | 8,336,535 | | | |
| Preferred Stocks — 0.4% | | | | | | |
| India — 0.4% | | | | | | |
| Consumer Discretionary — 0.4% | | | | | | |
| | 2,730,000 | | | Zee Entertainment Enterprises Ltd., 6.00% | | | 36,986 | | | |
| Total Preferred Stocks (Cost $44,695) | | | 36,986 | | | |
| Foreign Government Bonds — 1.2% | | | | | | |
| Indonesia — 1.2% | | | | | | |
| | 1,700,000,000 | | | Indonesia Treasury Bond, Series FR55,
7.38%, 9/15/16 (a) | | | 122,841 | | | |
| Total Foreign Government Bonds
(Cost $200,219) | | | 122,841 | | | |
| Cash Equivalents — 7.3% | | | | | | |
| | 724,746 | | | Federated Treasury Obligations Fund, Institutional Class,
0.07% (b) | | | 724,746 | | | |
| Total Cash Equivalents (Cost $724,746) | | | 724,746 | | | |
| Rights — 0.0% | | | | | | |
| Taiwan — 0.0% | | | | | | |
| Information Technology — 0.0% | | | | | | |
| | 3,343 | | | Adlink Technology, Inc. | | | 1,217 | | | |
| Total Rights (Cost $1,564) | | | 1,217 | | | |
| Total Investments
(Cost $8,036,372) — 92.4% | | | 9,222,325 | | | |
| Other Assets in Excess of Liabilities — 7.6% | | | 761,291 | | | |
| Net Assets — 100.0% | | $ | 9,983,616 | | | |
| (a) | Foreign-denominated security. Principal amount is reported in applicable country’s currency. |
| (b) | Rate disclosed is the seven day yield as of December 31, 2015. |
(See notes which are an integral part of the Financial Statements)
Annual Shareholder Report
18
| | |
| Rational Risk Managed Emerging Markets Fund | | (Continued) |
| * | Non-income producing security. |
ADR — American Depositary Receipt
The sectors shown on the portfolio of investments are based on the Global Industry Classification Standard, or GICS® (“GICS”). The GICS was developed and/or is the exclusive property of MSCI, Inc. and Standard & Poor Financial Services LLC (“S&P”). GICS is a service mark of MSCI, Inc. and S&P and has been licensed for use by Ultimus Asset Services, LLC.
(See notes which are an integral part of the Financial Statements)
Annual Shareholder Report
19
| | |
| Rational Real Strategies Fund | | December 31, 2015 |
| | |
| Portfolio of Investments Summary Table | | (unaudited) |
| | | | |
| Asset Allocation | | Percentage of
Market Value | |
Energy | | | 35.3% | |
Materials | | | 10.9% | |
Industrials | | | 11.3% | |
Cash | | | 16.0% | |
Real Estate Investments | | | 21.3% | |
Exchange-Traded Funds | | | 1.4% | |
Financials | | | 1.4% | |
Short-Term Securities Held as Collateral for Securities Lending | | | 2.4% | |
Total | | | 100.0% | |
Portfolio holdings and allocations are subject to change. As of December 31, 2015, percentages in the table above are based on total investments. Such total investments may differ from the percentages set forth below in the Portfolio of Investments which are computed using the Fund’s net assets.
The Portfolio of Investments Summary Table and the Portfolio of Investments are broken down by sectors, and these sectors do not represent industry categories for purposes of identifying “industry concentration” as described in the Investment Company Act of 1940, as amended.
Portfolio of Investments
| | | | | | | | | | |
| Shares | | | | | Fair Value | | | |
| | | | | | | | | | |
| Common Stocks — 59.8% | | | | | | |
| Energy — 35.8% | | | | | | |
| | 10,100 | | | Canadian Natural Resources Ltd. | | $ | 220,483 | | | |
| | 3,800 | | | Carrizo Oil & Gas, Inc. | | | 112,404 | | | |
| | 4,800 | | | Cheniere Energy, Inc. | | | 178,800 | | | |
| | 16,510 | | | Chesapeake Energy Corp. (a) | | | 74,295 | | | |
| | 9,400 | | | Enterprise Products Partners LP | | | 240,452 | | | |
| | 6,000 | | | Halliburton Co. | | | 204,240 | | | |
| | 800 | | | Helmerich & Payne, Inc. | | | 42,840 | | | |
| | 6,200 | | | Kinder Morgan, Inc. | | | 92,504 | | | |
| | 6,000 | | | Magellan Midstream Partners LP | | | 407,520 | | | |
| | 5,600 | | | National Oilwell Varco, Inc. | | | 187,544 | | | |
| | 2,400 | | | Schlumberger Ltd. | | | 167,400 | | | |
| | 8,100 | | | Spectra Energy Corp. | | | 193,914 | | | |
| | 11,700 | | | Suncor Energy, Inc. (a) | | | 301,860 | | | |
| | 1,200 | | | Valero Energy Corp. | | | 84,852 | | | |
| | | | | 2,509,108 | | | |
| Financials — 1.4% | | | | | | |
| | 7,600 | | | Cresud SACIF y A ADR * | | | 98,040 | | | |
| Industrials — 11.5% | | | | | | |
| | 4,650 | | | AGCO Corp. | | | 211,063 | | | |
| | 6,000 | | | Chicago Bridge & Iron Co. NV (a) | | | 233,940 | | | |
| | 300 | | | Copa Holdings SA (a) | | | 14,478 | | | |
| | 5,700 | | | GATX Corp. | | | 242,535 | | | |
| | 7,600 | | | Navigator Holdings Ltd. * | | | 103,740 | | | |
| | | | | 805,756 | | | |
| Materials — 11.1% | | | | | | |
| | 1,700 | | | Agrium, Inc. | | | 151,878 | | | |
| | 600 | | | Albemarle Corp. | | | 33,606 | | | |
| | 3,800 | | | BHP Billiton Ltd. ADR (a) | | | 97,888 | | | |
| | 7,300 | | | Potash Corp of Saskatchewan, Inc. | | | 124,976 | | | |
| | 3,900 | | | Rio Tinto PLC ADR | | | 113,568 | | | |
| | | | | | | | | | |
| Shares | | | | | Fair Value | | | |
| | | | | | | | | | |
| Common Stocks — (Continued) | | | | | | |
| Materials — (Continued) | | | | | | |
| | 9,800 | | | Southern Copper Corp. (a) | | $ | 255,976 | | | |
| | | | | | | | 777,892 | | | |
| Total Common Stocks (Cost $4,651,872) | | | 4,190,796 | | | |
| Exchange-Traded Funds — 1.4% | | | | | | |
| | 7,500 | | | iShares Silver Trust * | | | 98,925 | | | |
| Total Exchange-Traded Funds (Cost $116,475) | | | 98,925 | | | |
| Real Estate Investments — 21.7% (b) (c) (d) | | | | | | |
| | | | Grocery & Pharmacy DST | | | 823,108 | | | |
| | | | | New York Power DST (e) | | | 695,985 | | | |
| Total Real Estate Investments (Cost $1,791,705) | | | 1,519,093 | | | |
| Cash Equivalents — 16.3% | | | | | | |
| | 1,141,603 | | | Federated Treasury Obligations Fund, Institutional Class, 0.07% (e) | | | 1,141,603 | | | |
| Total Cash Equivalents (Cost $1,141,603) | | | 1,141,603 | | | |
| Short-Term Securities Held as Collateral for
Securities Lending — 2.4% | | | | | | |
| | 171,255 | | | Fidelity Institutional Money Market Portfolio, Institutional Class, 0.32% (f) | | | 171,255 | | | |
| Total Short-Term Securities Held as Collateral for
Securities Lending (Cost $171,255) | | | 171,255 | | | |
| Total Investments
(Cost $7,872,910) — 101.6% | | | 7,121,672 | | | |
| Liabilities in Excess of Other Assets — (1.6)% | | | (110,215) | | | |
| Net Assets — 100.0% | | $ | 7,011,457 | | | |
(See notes which are an integral part of the Financial Statements)
Annual Shareholder Report
20
| | |
| Rational Real Strategies Fund | | (Continued) |
| (a) | All or a portion of the security was on loan as of December 31, 2015. The total value of securities on loan as of December 31, 2015 was $167,548. |
| (c) | Investments do not offer shares. Fair value represents direct ownership of Real Estate. |
| (d) | Security is currently being valued by the Pricing Committee according to the fair value procedures approved by the Board of Trustees. |
| (e) | Investment in affiliate. |
| (f) | Rate disclosed is the seven day yield as of December 31, 2015. |
| * | Non-income producing security. |
ADR — American Depositary Receipt
DST — Delaware Statutory Trust
The sectors shown on the portfolio of investments are based on the Global Industry Classification Standard, or GICS® (“GICS”). The GICS was developed and/or is the exclusive property of MSCI, Inc. and Standard & Poor Financial Services LLC (“S&P”). GICS is a service mark of MSCI, Inc. and S&P and has been licensed for use by Ultimus Asset Services, LLC.
(See notes which are an integral part of the Financial Statements)
Annual Shareholder Report
21
| | |
| Rational Defensive Growth Fund | | December 31, 2015 |
| | |
| Portfolio of Investments Summary Table | | (unaudited) |
| | | | |
| Asset Allocation | | Percentage of
Market Value | |
Financials | | | 17.3% | |
Information Technology | | | 13.3% | |
Short-Term Securities Held as Collateral for Securities Lending | | | 12.6% | |
Industrials | | | 11.9% | |
Health Care | | | 11.5% | |
Exchange-Traded Funds | | | 7.6% | |
Consumer Discretionary | | | 7.1% | |
Cash | | | 5.8% | |
Utilities | | | 4.0% | |
Materials | | | 2.8% | |
Consumer Staples | | | 2.6% | |
Energy | | | 1.9% | |
Real Estate Investment Trusts | | | 1.3% | |
Telecommunication Services | | | 0.3% | |
Total | | | 100.0% | |
Portfolio holdings and allocations are subject to change. As of December 31, 2015, percentages in the table above are based on total investments. Such total investments may differ from the percentages set forth below in the Portfolio of Investments which are computed using the Fund’s net assets.
The Portfolio of Investments Summary Table and the Portfolio of Investments are broken down by sectors, and these sectors do not represent industry categories for purposes of identifying “industry concentration” as described in the Investment Company Act of 1940, as amended.
Portfolio of Investments
| | | | | | | | | | |
| Shares | | | | | Fair Value | | | |
| | | | | | | | | | |
| Common Stocks — 85.7% | | | | | | |
| Consumer Discretionary — 8.2% | | | | | | |
| | 13,000 | | | Dorman Products, Inc. * | | $ | 617,110 | | | |
| | 15,500 | | | Gentherm, Inc. * | | | 734,700 | | | |
| | 23,000 | | | La-Z-Boy, Inc. | | | 561,660 | | | |
| | 5,500 | | | Papa John’s International, Inc. | | | 307,285 | | | |
| | 7,500 | | | Pinnacle Entertainment, Inc. * | | | 233,400 | | | |
| | 12,500 | | | Texas Roadhouse, Inc. | | | 447,125 | | | |
| | | | | 2,901,280 | | | |
| Consumer Staples — 3.0% | | | | | | |
| | 14,000 | | | Cal-Maine Foods, Inc. (a) | | | 648,760 | | | |
| | 5,250 | | | Sanderson Farms, Inc. (a) | | | 406,980 | | | |
| | | | | 1,055,740 | | | |
| Energy — 2.1% | | | | | | |
| | 21,000 | | | Archrock, Inc. | | | 157,920 | | | |
| | 28,500 | | | Atwood Oceanics, Inc. (a) | | | 291,555 | | | |
| | 10,500 | | | Exterran Corp. * | | | 168,525 | | | |
| | 7,000 | | | SM Energy Co. | | | 137,620 | | | |
| | | | | 755,620 | | | |
| Financials — 20.2% | | | | | | |
| | 30,000 | | | American Equity Investment Life Holding Co. | | | 720,900 | | | |
| | 18,750 | | | Community Bank System, Inc. | | | 748,875 | | | |
| | 6,000 | | | Evercore Partners, Inc. | | | 324,420 | | | |
| | | | | | | | | | |
| Shares | | | | | Fair Value | | | |
| | | | | | | | | | |
| Common Stocks — (Continued) | | | | | | |
| Financials — (Continued) | | | | | | |
| | 57,500 | | | F.N.B. Corp. | | $ | 767,050 | | | |
| | 23,000 | | | International Bancshares Corp. | | | 591,100 | | | |
| | 9,000 | | | PRA Group, Inc.* | | | 312,210 | | | |
| | 20,500 | | | PrivateBancorp, Inc. | | | 840,910 | | | |
| | 13,750 | | | RLI Corp. | | | 849,062 | | | |
| | 10,000 | | | South State Corp. | | | 719,500 | | | |
| | 43,000 | | | Umpqua Holdings Corp. | | | 683,700 | | | |
| | 11,000 | | | Wintrust Financial Corp. | | | 533,720 | | | |
| | | | | 7,091,447 | | | |
| Health Care — 13.3% | | | | | | |
| | 18,750 | | | Abaxis, Inc. | | | 1,044,000 | | | |
| | 8,750 | | | AmSurg Corp. | | | 665,000 | | | |
| | 3,000 | | | Greatbatch, Inc. * | | | 157,500 | | | |
| | 14,000 | | | Luminex Corp. * | | | 299,460 | | | |
| | 12,500 | | | Masimo Corp. * | | | 518,875 | | | |
| | 13,000 | | | Myriad Genetics, Inc. (a) * | | | 561,080 | | | |
| | 17,000 | | | Neogen Corp. * | | | 960,840 | | | |
| | 44,000 | | | Osiris Therapeutics, Inc. (a) * | | | 456,720 | | | |
| | | | | 4,663,475 | | | |
| Industrials — 13.8% | | | | | | |
| | 19,000 | | | Aerojet Rocketdyne Holdings, Inc. * | | | 297,540 | | | |
| | 7,750 | | | Apogee Enterprises, Inc. | | | 337,203 | | | |
(See notes which are an integral part of the Financial Statements)
Annual Shareholder Report
22
| | |
| Rational Defensive Growth Fund | | (Continued) |
| | | | | | | | | | |
| Shares | | | | | Fair Value | | | |
| | | | | | | | | | |
| Common Stocks — (Continued) | | | | | | |
| Industrials — (Continued) | | | | | | |
| | 11,500 | | | Barnes Group, Inc. | | $ | 406,985 | | | |
| | 7,500 | | | Curtiss-Wright Corp. | | | 513,750 | | | |
| | 32,000 | | | Hillenbrand, Inc. | | | 948,160 | | | |
| | 14,250 | | | Korn/Ferry International | | | 472,815 | | | |
| | 18,000 | | | TASER International, Inc. (a) * | | | 311,220 | | | |
| | 27,000 | | | Tetra Tech, Inc. | | | 702,540 | | | |
| | 36,000 | | | Trinity Industries, Inc. | | | 864,720 | | | |
| | | | | 4,854,933 | | | |
| Information Technology — 15.5% | | | | | | |
| | 7,500 | | | ACI Worldwide, Inc. * | | | 160,500 | | | |
| | 25,000 | | | Cardtronics, Inc. * | | | 841,250 | | | |
| | 42,000 | | | Diodes, Inc. * | | | 965,160 | | | |
| | 18,000 | | | Ebix, Inc. (a) | | | 590,220 | | | |
| | 8,000 | | | Integrated Device Technology, Inc. * | | | 210,800 | | | |
| | 11,250 | | | LogMeIn, Inc.* | | | 754,875 | | | |
| | 12,000 | | | Plexus Corp. * | | | 419,040 | | | |
| | 30,500 | | | Sanmina Corp. * | | | 627,690 | | | |
| | 13,500 | | | Synchronoss Technologies, Inc.* | | | 475,605 | | | |
| | 2,250 | | | Tyler Technologies, Inc. * | | | 392,220 | | | |
| | | | | 5,437,360 | | | |
| Materials — 3.2% | | | | | | |
| | 2,000 | | | Albemarle Corp. | | | 112,020 | | | |
| | 25,000 | | | KapStone Paper and Packaging Corp. | | | 564,750 | | | |
| | 11,000 | | | Sonoco Products Co. | | | 449,570 | | | |
| | | | | 1,126,340 | | | |
| Real Estate Investment Trusts — 1.5% | | | | | | |
| | 19,000 | | | Equity One, Inc. | | | 515,850 | | | |
| Telecommunication Services — 0.3% | | | | | | |
| | 10,000 | | | 8x8, Inc. * | | | 114,500 | | | |
| Utilities — 4.6% | | | | | | |
| | 12,500 | | | American States Water Co. | | | 524,375 | | | |
| | 9,000 | | | National Fuel Gas Co. | | | 384,750 | | | |
| | 16,500 | | | Vectren Corp. | | | 699,930 | | | |
| | | | | | | | 1,609,055 | | | |
| Total Common Stocks (Cost $26,044,355) | | | 30,125,600 | | | |
| Exchange-Traded Funds — 8.8% | | | | | | |
| | 9,000 | | | iShares Core S&P Small-Cap EFT (a) | | | 990,990 | | | |
| | 12,500 | | | iShares U.S. Real Estate ETF (a) | | | 938,875 | | | |
| | 9,000 | | | SPDR S&P 600 Small Cap ETF | | | 889,920 | | | |
| | 1,500 | | | SPDR S&P 600 Small Cap Growth ETF | | | 259,170 | | | |
| Total Exchange-Traded Funds (Cost $3,064,420) | | | 3,078,955 | | | |
| | | | | | | | | | |
| Shares | | | | | Fair Value | | | |
| | | | | | | | | | |
| Cash Equivalents — 6.7% | | | | | | |
| | 2,368,648 | | | Federated Treasury Obligations Fund, Institutional Class, 0.07% (b) | | $ | 2,368,648 | | | |
| Total Cash Equivalents (Cost $2,368,648) | | | 2,368,648 | | | |
| Short-Term Securities Held as Collateral for
Securities Lending — 14.6% | | | | | | |
| | 5,134,745 | | | Fidelity Institutional Money Market Portfolio, Institutional Class, 0.32% (b) | | | 5,134,745 | | | |
| Total Short-Term Securities Held as Collateral
for Securities Lending (Cost $5,134,745) | | | 5,134,745 | | | |
| Total Investments
(Cost $36,612,168) — 115.8% | | | 40,707,948 | | | |
| Liabilities in Excess of Other Assets — (15.8)% | | | (5,541,753) | | | |
| Net Assets — 100.0% | | $ | 35,166,195 | | | |
| (a) | All or a portion of the security was on loan as of December 31, 2015. The total value of securities on loan as of December 31, 2015 was $4,956,674. |
| (b) | Rate disclosed is the seven day yield as of December 31, 2015. |
| * | Non-income producing security. |
ETF — Exchange Traded Fund
SPDR — Standard & Poor’s Depository Receipts
The sectors shown on the portfolio of investments are based on the Global Industry Classification Standard, or GICS® (“GICS”). The GICS was developed and/or is the exclusive property of MSCI, Inc. and Standard & Poor Financial Services LLC (“S&P”). GICS is a service mark of MSCI, Inc. and S&P and has been licensed for use by Ultimus Asset Services, LLC.
(See notes which are an integral part of the Financial Statements)
Annual Shareholder Report
23
| | |
| Rational Strategic Allocation Fund | | December 31, 2015 |
| | |
| Portfolio of Investments Summary Table | | (unaudited) |
| | | | |
| Asset Allocation | | Percentage of
Market Value | |
Equity Mutual Funds(a) | | | 35.8% | |
Fixed Income Mutual Funds | | | 33.3% | |
Exchange-Traded Funds(a) | | | 24.6% | |
Cash | | | 6.3% | |
Total | | | 100.0% | |
| (a) | Investments in affiliated funds. |
Portfolio holdings and allocations are subject to change. As of December 31, 2015, percentages in the table above are based on total investments. Such total investments may differ from the percentages set forth below in the Portfolio of Investments which are computed using the Fund’s net assets.
Portfolio of Investments
| | | | | | | | | | |
| Shares | | | | | Fair Value | | | |
| | | | | | | | | | |
| Mutual Funds — 68.7% | | | | | | |
| | 142,817 | | | Federated Mortgage Fund, Institutional Shares | | $ | 1,369,618 | | | |
| | 268,576 | | | Federated Short-Intermediate Total Return Bond Fund, Institutional Shares | | | 2,739,471 | | | |
| | 141,637 | | | Federated Total Return Government Bond Fund, Institutional Shares | | | 1,538,181 | | | |
| | 268,879 | | | Rational Dividend Capture Fund, Institutional Shares (a) | | | 2,261,270 | | | |
| | 308,846 | | | Rational Risk Managed Emerging Markets Fund, Institutional Shares (a) | | | 2,087,797 | | | |
| | 367,022 | | | Rational Defensive Growth Fund, Institutional Shares (a) | | | 1,721,335 | | | |
| Total Mutual Funds (Cost $13,507,161) | | | 11,717,672 | | | |
| Exchange-Traded Funds — 24.4% | | | | | | |
| | 58,183 | | | EcoLogical Strategy ETF (a) (b) | | | 2,074,172 | | | |
| | 56,069 | | | US Equity Rotation Strategy ETF (a) (c) | | | 2,092,495 | | | |
| Total Exchange-Traded Funds (Cost $3,200,801) | | | 4,166,667 | | | |
| | | | | | | | | | |
| Shares | | | | | Fair Value | | | |
| | | | | | | | | | |
| Cash Equivalents — 6.2% | | | | | | |
| | 1,065,181 | | | Federated Treasury Obligations Fund, Institutional Class, 0.07% (d) | | $ | 1,065,181 | | | |
| Total Cash Equivalents(Cost $1,065,181) | | | 1,065,181 | | | |
| Total Investments
(Cost $17,773,143) — 99.3% | | | 16,949,520 | | | |
| Other Assets in Excess of Liabilities — 0.7% | | | 111,280 | | | |
| Net Assets — 100.0% | | $ | 17,060,800 | | | |
| (a) | Investment in affiliate. |
| (b) | Prior to February 12, 2016, the fund was known as the Huntington EcoLogical Strategy ETF. |
| (c) | Prior to February 12, 2016, the fund was known as the Huntington US Equity Rotation Strategy ETF. |
| (d) | Rate disclosed is the seven day yield as of December 31, 2015. |
ETF — Exchange-Traded Fund
(See notes which are an integral part of the Financial Statements)
Annual Shareholder Report
24
| | |
| Statements of Assets and Liabilities | | December 31, 2015 |
| | | | | | | | | | | | | | | | | | | | |
| | | Rational Dividend
Capture
Fund | | | Rational Risk
Managed
Emerging
Markets
Fund | | | Rational
Real
Strategies
Fund | | | Rational
Defensive
Growth
Fund | | | Rational
Strategic
Allocation
Fund | |
| Assets: | | | | | | | | | | | | | | | | | | | | |
Investments, at cost | | $ | 112,731,306 | | | $ | 8,036,372 | | | $ | 7,872,910 | | | $ | 36,612,168 | | | $ | 17,773,143 | |
Investments, in unaffiliated securities, at fair value | | $ | 108,741,047 | | | $ | 9,222,325 | | | $ | 6,425,687 | | | $ | 40,707,948 | | | $ | 6,712,451 | |
Investments in affiliated securities, at fair value | | | — | | | | — | | | | 695,985 | | | | — | | | | 10,237,069 | |
Total investments | | | 108,741,047 | | | | 9,222,325 | | | | 7,121,672 | | | | 40,707,948 | | | | 16,949,520 | |
Cash | | | — | | | | — | | | | 1,673 | | | | — | | | | — | |
Foreign currencies, at value (Cost $-, $910, $-, $- and $-) | | | — | | | | 819 | | | | — | | | | — | | | | — | |
Dividends and interest receivable | | | 433,823 | | | | 3,516 | | | | 3,950 | | | | 67,359 | | | | 157,070 | |
Receivable for shares sold | | | 61,738 | | | | 356,268 | | | | 5,876 | | | | 2,105 | | | | 2,668 | |
Receivable from Advisor | | | 24,683 | | | | 6,884 | | | | 100,696 | | | | 7,142 | | | | 10,556 | |
Tax reclaims receivable | | | — | | | | 501,882 | | | | — | | | | 15,325 | | | | — | |
Prepaid expenses and other assets | | | 13,551 | | | | 14,939 | | | | 7,141 | | | | 16,200 | | | | 3,892 | |
Total assets | | | 109,274,842 | | | | 10,106,633 | | | | 7,241,008 | | | | 40,816,079 | | | | 17,123,706 | |
| Liabilities: | | | | | | | | | | | | | | | | | | | | |
Payable for return of collateral on loaned securities | | | 7,799,288 | | | | — | | | | 171,255 | | | | 5,134,745 | | | | — | |
Payable to custodian | | | — | | | | — | | | | — | | | | 1,920 | | | | — | |
Payable for shares redeemed | | | 1,660,081 | | | | 83,800 | | | | 33,269 | | | | 447,054 | | | | 40,110 | |
Accrued expenses and other payables: | | | | | | | | | | | | | | | | | | | | |
Administration | | | 17,313 | | | | 1,618 | | | | 1,152 | | | | 5,921 | | | | 2,694 | |
Custodian | | | 5,709 | | | | 1,918 | | | | 555 | | | | 3,699 | | | | 316 | |
Distribution (12b-1) | | | 10,344 | | | | 954 | | | | 222 | | | | 5,326 | | | | 3,696 | |
Shareholder services | | | 23,755 | | | | 2,220 | | | | 1,581 | | | | 8,124 | | | | — | |
Transfer and dividend disbursing agent | | | 12,784 | | | | 3,000 | | | | 2,641 | | | | 11,547 | | | | 3,830 | |
Trustee | | | 207 | | | | 7 | | | | 13 | | | | 109 | | | | 27 | |
Professional | | | 29,850 | | | | 20,189 | | | | 15,831 | | | | 19,710 | | | | 9,053 | |
Printing and postage | | | 13,599 | | | | 3,208 | | | | 1,189 | | | | 7,777 | | | | 2,390 | |
Compliance services | | | — | | | | 1,084 | | | | 129 | | | | 267 | | | | — | |
Other | | | 5,204 | | | | 5,019 | | | | 1,714 | | | | 3,685 | | | | 790 | |
Total Liabilities | | | 9,578,134 | | | | 123,017 | | | | 229,551 | | | | 5,649,884 | | | | 62,906 | |
Net Assets | | $ | 99,696,708 | | | $ | 9,983,616 | | | $ | 7,011,457 | | | $ | 35,166,195 | | | $ | 17,060,800 | |
| | | | | | | | | | | | | | | | | | | | | |
| Net Assets consist of: | | | | | | | | | | | | | | | | | | | | |
Paid in capital | | $ | 101,743,503 | | | $ | 9,143,564 | | | $ | 23,967,442 | | | $ | 26,841,889 | | | $ | 17,008,283 | |
Net unrealized appreciation (depreciation) of investments, options and translations of assets and liabilities in foreign currency | | | (3,990,259 | ) | | | 1,109,214 | | | | (751,238 | ) | |
| 4,092,107
|
| | | (823,623 | ) |
Accumulated net realized gain (loss) on investments, options and foreign currency transactions | | | 1,984,408 | | | | (269,162 | ) | | | (16,517,734 | ) | |
| 4,232,199
|
| | | 756,163 | |
Accumulated net investment income (loss) | | | (40,944 | ) | | | — | | | | 312,987 | | | | — | | | | 119,977 | |
Net Assets | | $ | 99,696,708 | | | $ | 9,983,616 | | | $ | 7,011,457 | | | $ | 35,166,195 | | | $ | 17,060,800 | |
| | | | | | | | | | | | | | | | | | | | | |
| Net Assets: | | | | | | | | | | | | | | | | | | | | |
Institutional Shares | | $ | 57,752,166 | | | $ | 5,482,594 | | | $ | 6,032,344 | | | $ | 13,456,232 | | | | | |
Class A Shares | | $ | 39,609,732 | | | $ | 4,501,022 | | | $ | 979,113 | | | $ | 20,944,157 | | | $ | 17,060,800 | |
Class C Shares | | $ | 2,334,810 | | | | | | | | | | | $ | 765,806 | | | | | |
| Shares Outstanding (unlimited number of shares authorized, no par value): | | | | | | | | | | | | | | | | | | | | |
Institutional Shares | | | 6,870,968 | | | | 810,825 | | | | 1,119,959 | | | | 2,871,751 | | | | | |
Class A Shares | | | 4,716,079 | | | | 668,323 | | | | 180,402 | | | | 5,424,058 | | | | 1,744,429 | |
Class C Shares | | | 278,651 | | | | | | | | | | | | 207,598 | | | | | |
| Net Asset Value, Redemption Price and Offering Price Per Share: | | | | | | | | | | | | | | | | | | | | |
Institutional Shares | | $ | 8.41 | | | $ | 6.76 | | | $ | 5.39 | | | $ | 4.69 | | | | | |
Class A Shares | | $ | 8.40 | | | $ | 6.73 | | | $ | 5.43 | | | $ | 3.86 | | | $ | 9.78 | |
Class C Shares(a) | | $ | 8.38 | | | | | | | | | | | $ | 3.69 | | | | | |
| Offering Price Per Share (100%/(100%-maximum sales charge) of net asset value adjusted to the nearest cent) per share: | | | | | | | | | | | | | | | | | | | | |
Class A Shares | | $ | 8.82 | | | $ | 7.07 | | | $ | 5.70 | | | $ | 4.05 | | | $ | 10.27 | |
| Maximum Sales Charge: | | | | | | | | | | | | | | | | | | | | |
Class A Shares | | | 4.75 | % | | | 4.75 | % | | | 4.75 | % | | | 4.75 | % | | | 4.75 | % |
| | | | | | | | | | | | | | | | | | | | | |
| (a) | A contingent deferred sales charge (“CDSC”) of 1.00% may be charged on shares held less than 12 months. |
(See notes which are an integral part of the Financial Statements)
Annual Shareholder Report
25
| | |
| Statements of Operations | | Year Ended December 31, 2015 |
| | | | | | | | | | | | | | | | | | | | |
| | | Rational
Dividend
Capture
Fund | | | Rational Risk
Managed
Emerging
Markets
Fund | | | Rational
Real
Strategies
Fund | | | Rational
Defensive
Growth
Fund | | | Rational
Strategic
Allocation
Fund | |
| Investment Income: | | | | | | | | | | | | | | | | | | | | |
Dividend income from unaffiliated securities | | $ | 7,009,243 | | | $ | 280,370 | | | $ | 532,927 | | | $ | 1,155,716 | | | $ | 128,826 | |
Dividend income from affiliated securities | | | 718 | | | | 246 | | | | 73,701 | | | | 530 | | | | 220,806 | |
Interest income | | | — | | | | 8,793 | | | | — | | | | — | | | | — | |
Income from securities lending, net(a) | | | 18,980 | | | | 8,960 | | | | 19,066 | | | | 590,998 | | | | — | |
Foreign dividend taxes withheld | | | (64,989 | ) | | | (97,224 | ) | | | (21,234 | ) | | | (28,723 | ) | | | — | |
Total investment income | | | 6,963,952 | | | | 201,145 | | | | 604,460 | | | | 1,718,521 | | | | 349,632 | |
| Expenses: | | | | | | | | | | | | | | | | | | | | |
Investment advisory | | | 1,227,227 | | | | 160,131 | | | | 110,984 | | | | 796,393 | | | | 19,378 | |
Administration | | | 298,136 | | | | 29,176 | | | | 26,962 | | | | 193,472 | | | | 35,308 | |
Custodian | | | 40,156 | | | | 13,713 | | | | 3,260 | | | | 26,380 | | | | 1,943 | |
Pricing | | | 5,308 | | | | 15,502 | | | | 66,031 | | | | 7,290 | | | | 1,103 | |
Transfer and dividend disbursing agent | | | 152,890 | | | | 37,619 | | | | 33,001 | | | | 150,243 | | | | 43,138 | |
Trustee | | | 34,900 | | | | 3,042 | | | | 2,737 | | | | 18,522 | | | | 4,642 | |
Professional | | | 107,980 | | | | 42,395 | | | | 38,087 | | | | 68,264 | | | | 24,673 | |
Distribution (12b-1)—Class A Shares | | | 138,282 | | | | 14,297 | | | | 3,761 | | | | 84,330 | | | | 48,446 | |
Distribution (12b-1)—Class C Shares | | | 26,153 | | | | — | | | | — | | | | 9,562 | | | | — | |
Shareholder services—Institutional Shares | | | 262,076 | | | | 25,736 | | | | 33,233 | | | | 177,947 | | | | — | |
Shareholder services—Class A Shares | | | 138,282 | | | | 14,297 | | | | 3,761 | | | | 84,330 | | | | — | |
Shareholder services—Class C Shares | | | 8,718 | | | | — | | | | — | | | | 3,187 | | | | — | |
State registration costs | | | 38,929 | | | | 27,332 | | | | 28,521 | | | | 43,022 | | | | 5,268 | |
Printing and postage | | | 25,766 | | | | 3,323 | | | | 3,936 | | | | 12,051 | | | | 6,548 | |
Insurance premiums | | | 12,416 | | | | 11,346 | | | | 6,111 | | | | 12,704 | | | | 5,710 | |
Compliance services | | | 10,808 | | | | 419 | | | | 551 | | | | 6,460 | | | | 1,281 | |
Line of credit | | | 10,462 | | | | 2,004 | | | | 2,591 | | | | 18,711 | | | | 576 | |
Interest expense | | | 472 | | | | 2,048 | | | | 2,216 | | | | 14,617 | | | | — | |
Other | | | 24,444 | | | | 14,694 | | | | 5,346 | | | | 16,997 | | | | 4,000 | |
Total expenses | | | 2,563,405 | | | | 417,074 | | | | 371,089 | | | | 1,744,482 | | | | 202,014 | |
Investment advisory fees waived | | | (950,747 | ) | | | (160,131 | ) | | | (110,984 | ) | | | (528,144 | ) | | | (19,378 | ) |
Reimbursement from Advisor | | | — | | | | (99,726 | ) | | | (98,326 | ) | | | — | | | | (46,483 | ) |
Net expenses | | | 1,612,658 | | | | 157,217 | | | | 161,779 | | | | 1,216,338 | | | | 136,153 | |
Net investment income | | | 5,351,294 | | | | 43,928 | | | | 442,681 | | | | 502,183 | | | | 213,479 | |
| Net Realized/Unrealized Gain (Loss) on Investments, Options and Foreign Currency Transactions: | | | | | | | | | | | | | | | | | | | | |
Long-term capital gain dividends from investment companies | | | — | | | | — | | | | — | | | | 26,422 | | | | 14,672 | |
Long-term capital gain dividends from affiliated investment companies | | | — | | | | — | | | | — | | | | — | | | | 2,131,449 | |
Net realized gain (loss) on investment transactions | | | 8,986,067 | | | | 4,495,823 | | | | (3,983,132 | ) | | | 77,074,674 | | | | (931,840 | ) |
Net realized gain on written option transactions | | | — | | | | — | | | | 1,560,862 | | | | 537,050 | | | | — | |
Net realized gain on foreign currency transactions | | | 1,126 | | | | 202,329 | | | | 17 | | | | 2,986 | | | | — | |
Net realized gain (loss) on investments, options and translation of assets and liabilities in foreign currency transactions | | | 8,987,193 | | | | 4,698,152 | | | | (2,422,253 | ) | | | 77,641,132 | | | | 1,214,281 | |
Net change in unrealized depreciation of investments, options and translation of assets and liabilities in foreign currency | | | (19,598,188 | ) | | | (4,186,717 | ) | | | (270,985 | ) | | | (81,881,649 | ) | | | (1,745,386 | ) |
Net realized and unrealized gain (loss) on investments, options and foreign currency transactions | | | (10,610,995 | ) | | | 511,435 | | | | (2,693,238 | ) | | | (4,240,517 | ) | | | (531,105 | ) |
Change in net assets resulting from operations | | $ | (5,259,701 | ) | | $ | 555,363 | | | $ | (2,250,557 | ) | | $ | (3,738,334 | ) | | $ | (317,626 | ) |
| | | | | | | | | | | | | | | | | | | | | |
| (a) | Income from securities lending is net of ($4,745, $940, $4,767, $147,752 and $-) expenses paid to Huntington National Bank. |
(See notes which are an integral part of the Financial Statements)
Annual Shareholder Report
26
[THIS PAGE INTENTIONALLY LEFT BLANK]
| | |
| Statements of Changes in Net Assets | | |
| | | | | | | | | | | | | | | | |
| | | Rational Dividend
Capture Fund | | | Rational Risk Managed
Emerging Markets Fund | |
| | | Year Ended
December 31,
2015 | | | Year Ended
December 31,
2014 | | | Year Ended
December 31,
2015 | | | Year Ended
December 31,
2014 | |
| Increase (Decrease) in Net Assets: | | | | | | | | | | | | | | | | |
| Operations— | | | | | | | | | | | | | | | | |
Net investment income (loss) | | $ | 5,351,294 | | | $ | 8,468,990 | | | $ | 43,928 | | | $ | (49,935 | ) |
Long-term capital gain dividends from investment companies | | | — | | | | 41,717 | | | | — | | | | — | |
Net realized gain (loss) on investments, options and foreign currency transactions | | | 8,987,193 | | | | 28,788,842 | | | | 4,698,152 | | | | 4,436,937 | |
Net change in unrealized appreciation/depreciation of investments, options and foreign currency transactions | | | (19,598,188 | ) | | | (12,285,350 | ) | | | (4,186,717 | ) | | | (3,783,033 | ) |
Net increase (decrease) in net assets resulting from operations | | | (5,259,701 | ) | | | 25,014,199 | | | | 555,363 | | | | 603,969 | |
| Distributions to Shareholders— | | | | | | | | | | | | | | | | |
From and/or excess of net investment income: | | | | | | | | | | | | | | | | |
Institutional Shares | | | (3,572,228 | ) | | | (7,115,979 | ) | | | (221,355 | ) | | | — | |
Class A Shares | | | (1,793,365 | ) | | | (2,381,600 | ) | | | (148,228 | ) | | | — | |
Class C Shares | | | (96,312 | ) | | | (63,718 | )(a) | | | — | | | | — | |
From net realized gain on investments: | | | | | | | | | | | | | | | | |
Institutional Shares | | | (6,390,065 | ) | | | (17,240,460 | ) | | | (1,445,789 | ) | | | (1,125,901 | ) |
Class A Shares | | | (4,069,559 | ) | | | (7,984,544 | ) | | | (1,058,208 | ) | | | (46,166 | ) |
Class C Shares | | | (242,641 | ) | | | (502,676 | )(a) | | | — | | | | — | |
Change in net assets resulting from distributions to shareholders | | | (16,164,170 | ) | | | (35,288,977 | ) | | | (2,873,580 | ) | | | (1,172,067 | ) |
Change in net assets resulting from capital transactions | | | (81,655,328 | ) | | | (137,124,546 | ) | | | (15,050,423 | ) | | | 476,136 | |
Change in net assets | | | (103,079,199 | ) | | | (147,399,324 | ) | | | (17,368,640 | ) | | | (91,962 | ) |
| Net Assets | | | | | | | | | | | | | | | | |
Beginning of year | | | 202,775,907 | | | | 350,175,231 | | | | 27,352,256 | | | | 27,444,218 | |
End of year | | $ | 99,696,708 | | | $ | 202,775,907 | | | $ | 9,983,616 | | | $ | 27,352,256 | |
| | | | | | | | | | | | | | | | | |
Accumulated net investment income (loss) included in net assets at end of year | | $ | (40,944 | ) | | $ | 293,912 | | | $ | — | | | $ | 116,876 | |
| Capital Transactions: | | | | | | | | | | | | | | | | |
Institutional Shares | | | | | | | | | | | | | | | | |
Shares sold | | $ | 7,754,112 | | | $ | 14,686,823 | | | $ | 2,940,494 | | | $ | 1,515,649 | |
Shares issued in connection with merger | | | — | | | | — | | | | — | | | | 24,958,498 | |
Contribution from Advisor | | | — | | | | — | | | | — | | | | — | |
Dividends reinvested | | | 4,469,092 | | | | 8,406,713 | | | | 1,085,331 | | | | 285,210 | |
Shares redeemed | | | (73,426,985 | ) | | | (164,006,532 | ) | | | (17,915,875 | ) | | | (32,711,164 | ) |
Total Institutional Shares | | | (61,203,781 | ) | | | (140,912,996 | ) | | | (13,890,050 | ) | | | (5,951,807 | ) |
Class A Shares | | | | | | | | | | | | | | | | |
Shares sold | | | 4,554,863 | | | | 12,966,113 | | | | 3,611,499 | | | | 1,479,342 | |
Shares issued in connection with merger | | | — | | | | — | | | | — | | | | 6,560,828 | |
Contribution from Advisor | | | — | | | | — | | | | — | | | | — | |
Dividends reinvested | | | 5,123,016 | | | | 9,036,272 | | | | 1,126,444 | | | | 45,716 | |
Shares redeemed | | | (28,792,432 | ) | | | (22,800,567 | ) | | | (5,898,316 | ) | | | (1,657,943 | ) |
Total Class A Shares | | | (19,114,553 | ) | | | (798,182 | ) | | | (1,160,373 | ) | | | 6,427,943 | |
Class C Shares | | | | | | | | | | | | | | | | |
Shares sold | | | 255,610 | | | | 4,253,748 | (a) | | | — | | | | — | |
Dividends reinvested | | | 265,727 | | | | 440,688 | (a) | | | — | | | | — | |
Shares redeemed | | | (1,858,331 | ) | | | (107,804 | )(a) | | | — | | | | — | |
Total Class C Shares | | | (1,336,994 | ) | | | 4,586,632 | | | | — | | | | — | |
Net change resulting from capital transactions | | $ | (81,655,328 | ) | | $ | (137,124,546 | ) | | $ | (15,050,423 | ) | | $ | 476,136 | |
| Share Transactions: | | | | | | | | | | | | | | | | |
Institutional Shares | | | | | | | | | | | | | | | | |
Shares sold | | | 793,366 | | | | 1,320,335 | | | | 335,566 | | | | 168,445 | |
Shares issued in connection with merger | | | — | | | | — | | | | — | | | | 2,618,940 | |
Dividends reinvested | | | 510,061 | | | | 806,136 | | | | 164,444 | | | | 30,569 | |
Shares redeemed | | | (7,631,172 | ) | | | (14,899,961 | ) | | | (1,882,710 | ) | | | (3,140,586 | ) |
Total Institutional Shares | | | (6,327,745 | ) | | | (12,773,490 | ) | | | (1,382,700 | ) | | | (322,632 | ) |
Class A Shares | | | | | | | | | | | | | | | | |
Shares sold | | | 462,199 | | | | 1,167,654 | | | | 411,292 | | | | 137,123 | |
Shares issued in connection with merger | | | — | | | | — | | | | — | | | | 690,613 | |
Dividends reinvested | | | 583,317 | | | | 878,981 | | | | 171,453 | | | | 4,916 | |
Shares redeemed | | | (2,969,332 | ) | | | (2,046,154 | ) | | | (638,798 | ) | | | (148,275 | ) |
Total Class A Shares | | | (1,923,816 | ) | | | 481 | | | | (56,053 | ) | | | 684,377 | |
Class C Shares | | | | | | | | | | | | | | | | |
Shares sold | | | 26,123 | | | | 382,321 | (a) | | | — | | | | — | |
Dividends reinvested | | | 30,349 | | | | 43,343 | (a) | | | — | | | | — | |
Shares redeemed | | | (193,746 | ) | | | (9,739 | )(a) | | | — | | | | — | |
Total Class C Shares | | | (137,274 | ) | | | 415,925 | | | | — | | | | — | |
Net change resulting from share transactions | | | (8,388,835 | ) | | | (12,357,084 | ) | | | (1,438,753 | ) | | | 361,745 | |
| | | | | | | | | | | | | | | | | |
| (a) | For the period January 3, 2014 (commencement of operations) to December 31, 2014. |
(See notes which are an integral part of the Financial Statements)
Annual Shareholder Report
28
| | | | | | | | | | | | | | | | | | | | | | |
Rational Real
Strategies Fund | | | Rational Defensive Growth Fund | | | Rational Strategic
Allocation Fund | |
Year Ended
December 31,
2015 | | | Year Ended
December 31,
2014 | | | Year Ended
December 31,
2015 | | | Year Ended
December 31,
2014 | | | Year Ended
December 31,
2015 | | | Year Ended
December 31,
2014 | |
| | | | | | | | | | | | | | | | | | | | | | |
| | | | | | | | | | | | | | | | | | | | | | |
| $ | 442,681 | | | $ | 903,276 | | | $ | 502,183 | | | $ | 573,548 | | | $ | 213,479 | | | $ | 291,675 | |
| | — | | | | — | | | | 26,422 | | | | — | | | | 2,146,121 | | | | — | |
| (2,422,253 | ) | | | 5,650,043 | | | | 77,614,710 | | | | 94,415,953 | | | | (931,840 | ) | | | 2,026,163 | |
| (270,985 | ) | | | (9,831,968 | ) | | | (81,881,649 | ) | | | (103,449,180 | ) | | | (1,745,386 | ) | | | (1,897,780 | ) |
| (2,250,557 | ) | | | (3,278,649 | ) | | | (3,738,334 | ) | | | (8,459,679 | ) | | | (317,626 | ) | | | 420,058 | |
| | | | | | | | | | | | | | | | | | | | | | |
| | | | | | | | | | | | | | | | | | | | | | |
| | (294,587 | ) | | | (477,697 | ) | | | (244,761 | ) | | | (110,029 | ) | | | — | | | | — | |
| | (43,812 | ) | | | (21,852 | ) | | | (368,959 | ) | | | — | | | | (186,964 | ) | | | (426,585 | ) |
| | — | | | | — | | | | (8,323 | ) | | | — | | | | — | | | | — | |
| | | | | | | | | | | | | | | | | | | | | | |
| | — | | | | — | | | | (22,491,969 | ) | | | (49,484,679 | ) | | | — | | | | — | |
| | — | | | | — | | | | (21,407,056 | ) | | | (12,530,796 | ) | | | (1,944,437 | ) | | | (725,138 | ) |
| | — | | | | — | | | | (841,929 | ) | | | (430,286 | )(a) | | | — | | | | — | |
| (338,399 | ) | | | (499,549 | ) | | | (45,362,997 | ) | | | (62,555,790 | ) | | | (2,131,401 | ) | | | (1,151,723 | ) |
| | (21,508,779 | ) | | | (57,049,407 | ) | | | (114,713,533 | ) | | | (144,119,064 | ) | | | (1,498,396 | ) | | | 674,722 | |
| | (24,097,735 | ) | | | (60,827,605 | ) | | | (163,814,864 | ) | | | (215,134,533 | ) | | | (3,947,423 | ) | | | (56,943 | ) |
| | | | | | | | | | | | | | | | | | | | | | |
| | 31,109,192 | | | | 91,936,797 | | | | 198,981,059 | | | | 414,115,592 | | | | 21,008,223 | | | | 21,065,166 | |
| $ | 7,011,457 | | | $ | 31,109,192 | | | $ | 35,166,195 | | | $ | 198,981,059 | | | $ | 17,060,800 | | | $ | 21,008,223 | |
| | | | | | | | | | | | | | | | | | | | | | | |
$ | 312,987 | | | $ | 487,344 | | | $ | — | | | $ | 141,202 | | | $ | 119,977 | | | $ | 1,463 | |
| | | | | | | | | | | | | | | | | | | | | | |
| | | | | | | | | | | | | | | | | | | | | | |
| $ | 10,628,392 | | | $ | 9,556,192 | | | $ | 5,437,095 | | | $ | 25,316,955 | | | $ | — | | | $ | — | |
| | — | | | | — | | | | — | | | | — | | | | — | | | | — | |
| | 60,989 | | | | — | | | | — | | | | — | | | | — | | | | — | |
| | 231,235 | | | | 51,918 | | | | 11,979,899 | | | | 22,195,877 | | | | — | | | | — | |
| | (32,049,885 | ) | | | (66,329,891 | ) | | | (132,632,327 | ) | | | (178,626,049 | ) | | | — | | | | — | |
| | (21,129,269 | ) | | | (56,721,781 | ) | | | (115,215,333 | ) | | | (131,113,217 | ) | | | — | | | | — | |
| | | | | | | | | | | | | | | | | | | | | | |
| | 513,202 | | | | 600,959 | | | | 2,094,914 | | | | 14,940,892 | | | | 1,430,438 | | | | 4,231,795 | |
| | — | | | | — | | | | — | | | | — | | | | — | | | | — | |
| | 9,899 | | | | — | | | | — | | | | — | | | | — | | | | — | |
| | 39,488 | | | | 21,091 | | | | 20,819,069 | | | | 11,853,239 | | | | 2,023,696 | | | | 1,100,024 | |
| | (942,099 | ) | | | (949,676 | ) | | | (22,581,388 | ) | | | (41,789,298 | ) | | | (4,952,530 | ) | | | (4,657,097 | ) |
| | (379,510 | ) | | | (327,626 | ) | | | 332,595 | | | | (14,995,167 | ) | | | (1,498,396 | ) | | | 674,722 | |
| | | | | | | | | | | | | | | | | | | | | | |
| | — | | | | — | | | | 62,887 | | | | 1,674,862 | (a) | | | — | | | | — | |
| | — | | | | — | | | | 830,989 | | | | 408,639 | (a) | | | — | | | | — | |
| | — | | | | — | | | | (724,671 | ) | | | (94,181 | )(a) | | | — | | | | — | |
| | — | | | | — | | | | 169,205 | | | | 1,989,320 | | | | — | | | | — | |
| $ | (21,508,779 | ) | | $ | (57,049,407 | ) | | $ | (114,713,533 | ) | | $ | (144,119,064 | ) | | $ | (1,498,394 | ) | | $ | 674,722 | |
| | | | | | | | | | | | | | | | | | | | | | |
| | | | | | | | | | | | | | | | | | | | | | |
| | 1,631,536 | | | | 1,331,576 | | | | 302,656 | | | | 892,581 | | | | — | | | | — | |
| | — | | | | — | | | | — | | | | — | | | | — | | | | — | |
| | 42,980 | | | | 8,176 | | | | 2,366,203 | | | | 1,081,670 | | | | — | | | | — | |
| | (4,933,477 | ) | | | (8,093,407 | ) | | | (7,162,765 | ) | | | (6,432,257 | ) | | | — | | | | — | |
| | (3,258,961 | ) | | | (6,753,655 | ) | | | (4,493,906 | ) | | | (4,458,006 | ) | | | — | | | | — | |
| | | | | | | | | | | | | | | | | | | | | | |
| | 77,273 | | | | 70,129 | | | | 157,162 | | | | 537,752 | | | | 125,398 | | | | 356,685 | |
| | — | | | | — | | | | — | | | | — | | | | — | | | | — | |
| | 7,286 | | | | 3,316 | | | | 4,987,319 | | | | 602,605 | | | | 205,237 | | | | 95,856 | |
| | (150,168 | ) | | | (121,313 | ) | | | (1,962,664 | ) | | | (1,553,228 | ) | | | (436,219 | ) | | | (391,846 | ) |
| | (65,609 | ) | | | (47,868 | ) | | | 3,181,817 | | | | (412,871 | ) | | | (105,584 | ) | | | 60,695 | |
| | | | | | | | | | | | | | | | | | | | | | |
| | — | | | | — | | | | 3,281 | | | | 60,966 | (a) | | | — | | | | — | |
| | — | | | | — | | | | 209,461 | | | | 20,913 | (a) | | | — | | | | — | |
| | — | | | | — | | | | (83,369 | ) | | | (3,654 | )(a) | | | — | | | | — | |
| | — | | | | — | | | | 129,373 | | | | 78,225 | | | | — | | | | — | |
| | (3,324,570 | ) | | | (6,801,523 | ) | | | (1,182,716 | ) | | | (4,792,652 | ) | | | (105,584 | ) | | | 60,695 | |
| | | | | | | | | | | | | | | | | | | | | | | |
Annual Shareholder Report
29
| | |
| Financial Highlights | | |
| (For a share outstanding throughout each period ended December 31) | | |
| | | | | | | | | | | | | | | | | | | | | | | | | | | | |
| | | Net Asset
Value,
beginning
of period | | | Net
investment
income (loss) | | | Net realized
and unrealized
gain (loss) on
investments | | | Total from
investment
operations | | | Distributions
from net
investment
income | | | Distributions
from net
realized gain
on investment
transactions | | | Total
distributions | |
| RATIONAL DIVIDEND CAPTURE FUND | | | | | | | | | | | | | | | | | |
| Institutional Shares | | | | | | | | | | | | | | | | | | | | | | | | | | | | |
2011 | | $ | 8.69 | | | | 0.30 | | | | 0.22 | | | | 0.52 | | | | (0.30 | ) | | | — | | | | (0.30 | ) |
2012 | | $ | 8.91 | | | | 0.33 | | | | 0.63 | | | | 0.96 | | | | (0.38 | ) | | | — | | | | (0.38 | ) |
2013 | | $ | 9.49 | | | | 0.36 | | | | 1.60 | | | | 1.96 | | | | (0.32 | ) | | | (0.39 | ) | | | (0.71 | ) |
2014 | | $ | 10.74 | | | | 0.39 | | | | 0.64 | | | | 1.03 | | | | (0.41 | ) | | | (1.35 | ) | | | (1.76 | ) |
2015 | | $ | 10.01 | | | | 0.36 | | | | (0.67 | ) | | | (0.31 | ) | | | (0.35 | ) | | | (0.94 | ) | | | (1.29 | ) |
| Class A Shares | | | | | | | | | | | | | | | | | | | | | | | | | | | | |
2011 | | $ | 8.69 | | | | 0.28 | | | | 0.21 | | | | 0.49 | | | | (0.28 | ) | | | — | | | | (0.28 | ) |
2012 | | $ | 8.90 | | | | 0.30 | | | | 0.65 | | | | 0.95 | | | | (0.36 | ) | | | — | | | | (0.36 | ) |
2013 | | $ | 9.49 | | | | 0.34 | | | | 1.59 | | | | 1.93 | | | | (0.30 | ) | | | (0.39 | ) | | | (0.69 | ) |
2014 | | $ | 10.73 | | | | 0.34 | | | | 0.67 | | | | 1.01 | | | | (0.38 | ) | | | (1.35 | ) | | | (1.73 | ) |
2015 | | $ | 10.01 | | | | 0.31 | | | | (0.66 | ) | | | (0.35 | ) | | | (0.32 | ) | | | (0.94 | ) | | | (1.26 | ) |
| Class C Shares | | | | | | | | | | | | | | | | | | | | | | | | | | | | |
2014(d) | | $ | 10.67 | | | | 0.32 | | | | 0.70 | | | | 1.02 | | | | (0.35 | ) | | | (1.35 | ) | | | (1.70 | ) |
2015 | | $ | 9.99 | | | | 0.27 | | | | (0.66 | ) | | | (0.39 | ) | | | (0.28 | ) | | | (0.94 | ) | | | (1.22 | ) |
| RATIONAL RISK MANAGED EMERGING MARKETS FUND | | | | | | | | | | | | | | | | | |
| Institutional Shares | | | | | | | | | | | | | | | | | | | | | | | | | | | | |
2011 | | $ | 11.46 | | | | 0.08 | | | | (1.99 | ) | | | (1.91 | ) | | | (0.05 | ) | | | (0.14 | ) | | | (0.19 | ) |
2012 | | $ | 9.36 | | | | 0.04 | | | | 0.97 | | | | 1.01 | | | | (0.04 | ) | | | — | | | | (0.04 | ) |
2013 | | $ | 10.33 | | | | 0.04 | | | | 0.58 | | | | 0.62 | | | | (0.21 | ) | | | — | | | | (0.21 | ) |
2014 | | $ | 10.74 | | | | (0.03 | )(g) | | | 0.16 | | | | 0.13 | | | | — | | | | (1.49 | ) | | | (1.49 | ) |
2015 | | $ | 9.38 | | | | 0.03 | (g) | | | (0.15 | ) | | | (0.12 | ) | | | (0.33 | ) | | | (2.17 | ) | | | (2.50 | ) |
| Class A Shares | | | | | | | | | | | | | | | | | | | | | | | | | | | | |
2011 | | $ | 11.43 | | | | 0.04 | | | | (1.97 | ) | | | (1.93 | ) | | | — | (h) | | | (0.14 | ) | | | (0.14 | ) |
2012 | | $ | 9.36 | | | | 0.01 | | | | 0.97 | | | | 0.98 | | | | (0.02 | ) | | | — | | | | (0.02 | ) |
2013 | | $ | 10.32 | | | | 0.01 | | | | 0.59 | | | | 0.60 | | | | (0.19 | ) | | | — | | | | (0.19 | ) |
2014 | | $ | 10.73 | | | | (0.02 | )(g) | | | 0.13 | | | | 0.11 | | | | — | | | | (1.49 | ) | | | (1.49 | ) |
2015 | | $ | 9.35 | | | | 0.02 | (g) | | | (0.17 | ) | | | (0.15 | ) | | | (0.30 | ) | | | (2.17 | ) | | | (2.47 | ) |
| (a) | Based on net asset value, which does not reflect a sales charge or contingent deferred sales charge, if applicable. |
| (b) | If applicable, certain fees were waived and/or reimbursed. If such waivers/reimbursements had not occurred, the ratios would have been as indicated. |
| (c) | Portfolio Turnover is calculated on the basis of the Fund as a whole without distinguishing among the classes of shares. |
| (d) | Reflects operations for the period from January 3, 2014 (commencement of operations) to December 31, 2014. |
| (f) | Computed on an annualized basis. |
| (g) | Calculated using average shares outstanding for the period. |
| (h) | Amount is less than $0.005. |
(See notes which are an integral part of the Financial Statements)
Annual Shareholder Report
30
| | | | | | | | | | | | | | | | | | | | | | | | | | |
Net Asset
Value, end
of period | | | Total
return(a) | | | Ratio of net
expenses to
average net
assets | | | Ratio of net
investment
income (loss)
to average
net assets | | | Ratio of expenses
(prior to
reimbursements)
to average
net assets(b) | | | Net Assets,
end of
period
(000 omitted) | | | Portfolio
turnover
rate(c) | |
| | | | | | | | | | | | | | | | | | | | | | | | | | |
| | | | | | | | | | | | | | | | | | | | | | | | | | |
| $ | 8.91 | | | | 6.03 | % | | | 1.36 | % | | | 3.40 | % | | | 1.36 | % | | $ | 117,798 | | | | 143 | % |
| $ | 9.49 | | | | 10.87 | % | | | 1.21 | % | | | 3.55 | % | | | 1.36 | % | | $ | 145,946 | | | | 109 | % |
| $ | 10.74 | | | | 21.14 | % | | | 0.89 | % | | | 3.59 | % | | | 1.33 | % | | $ | 278,917 | | | | 130 | % |
| $ | 10.01 | | | | 9.59 | % | | | 0.88 | % | | | 3.22 | % | | | 1.38 | % | | $ | 132,177 | | | | 92 | % |
| $ | 8.41 | | | | (3.25 | )% | | | 0.89 | % | | | 3.37 | % | | | 1.47 | % | | $ | 57,752 | | | | 92 | % |
| | | | | | | | | | | | | | | | | | | | | | | | | | |
| $ | 8.90 | | | | 5.65 | % | | | 1.61 | % | | | 3.19 | % | | | 1.61 | % | | $ | 26,843 | | | | 143 | % |
| $ | 9.49 | | | | 10.72 | % | | | 1.46 | % | | | 3.37 | % | | | 1.61 | % | | $ | 46,343 | | | | 109 | % |
| $ | 10.73 | | | | 20.74 | % | | | 1.14 | % | | | 3.32 | % | | | 1.58 | % | | $ | 71,258 | | | | 130 | % |
| $ | 10.01 | | | | 9.45 | % | | | 1.13 | % | | | 3.01 | % | | | 1.63 | % | | $ | 66,445 | | | | 92 | % |
| $ | 8.40 | | | | (3.60 | )% | | | 1.14 | % | | | 3.14 | % | | | 1.72 | % | | $ | 39,610 | | | | 92 | % |
| | | | | | | | | | | | | | | | | | | | | | | | | | |
| $ | 9.99 | | | | 9.54 | %(e) | | | 1.63 | %(f) | | | 2.69 | %(f) | | | 2.16 | %(f) | | $ | 4,154 | | | | 92 | %(e) |
| $ | 8.38 | | | | (4.08 | )% | | | 1.64 | % | | | 2.64 | % | | | 2.22 | % | | $ | 2,335 | | | | 92 | % |
| | | | | | | | | | | | | | | | | | | | | | | | | | |
| | | | | | | | | | | | | | | | | | | | | | | | | | |
| $ | 9.36 | | | | (16.67 | )% | | | 1.79 | % | | | 0.71 | % | | | 1.79 | % | | $ | 38,871 | | | | 110 | % |
| $ | 10.33 | | | | 10.82 | % | | | 1.90 | % | | | 0.40 | % | | | 1.90 | % | | $ | 38,696 | | | | 97 | % |
| $ | 10.74 | | | | 6.08 | % | | | 1.87 | % | | | 0.40 | % | | | 2.01 | % | | $ | 27,015 | | | | 156 | % |
| $ | 9.38 | | | | 1.31 | % | | | 1.63 | % | | | (0.29 | )% | | | 2.22 | % | | $ | 20,578 | | | | 88 | % |
| $ | 6.76 | | | | (0.60 | )% | | | 0.90 | % | | | 0.32 | % | | | 2.52 | % | | $ | 5,483 | | | | 86 | % |
| | | | | | | | | | | | | | | | | | | | | | | | | | |
| $ | 9.36 | | | | (16.80 | )% | | | 2.04 | % | | | 0.48 | % | | | 2.04 | % | | $ | 541 | | | | 110 | % |
| $ | 10.32 | | | | 10.43 | % | | | 2.15 | % | | | 0.09 | % | | | 2.15 | % | | $ | 416 | | | | 97 | % |
| $ | 10.73 | | | | 5.87 | % | | | 2.12 | % | | | 0.06 | % | | | 2.26 | % | | $ | 429 | | | | 156 | % |
| $ | 9.35 | | | | 1.13 | % | | | 1.88 | % | | | (0.15 | )% | | | 2.47 | % | | $ | 6,774 | | | | 88 | % |
| $ | 6.73 | | | | (0.91 | )% | | | 1.15 | % | | | 0.19 | % | | | 2.77 | % | | $ | 4,501 | | | | 86 | % |
Annual Shareholder Report
31
| | |
| Financial Highlights (Continued) | | |
| (For a share outstanding throughout each period ended December 31) | | |
| | | | | | | | | | | | | | | | | | | | | | | | | | | | |
| | | Net Asset Value, beginning of period | | | Net investment income (loss) | | | Net realized and unrealized
gain (loss) on investments | | | Total from investment operations | | | Distributions from net investment income | | | Distributions
from net
realized gain on investment transactions | | | Total distributions | |
| RATIONAL REAL STRATEGIES FUND | | | | | | | | | | | | | | | | | |
| Institutional Shares | | | | | | | | | | | | | | | | | |
2011 | | $ | 7.99 | | | | 0.05 | | | | (0.82 | ) | | | (0.77 | ) | | | (0.07 | ) | | | — | | | | (0.07 | ) |
2012 | | $ | 7.15 | | | | 0.11 | | | | 0.26 | | | | 0.37 | | | | (0.10 | ) | | | — | | | | (0.10 | ) |
2013 | | $ | 7.42 | | | | 0.15 | | | | 0.55 | | | | 0.70 | | | | (0.07 | ) | | | — | | | | (0.07 | ) |
2014 | | $ | 8.05 | | | | 0.13 | (d) | | | (1.35 | ) | | | (1.22 | ) | | | (0.10 | ) | | | — | | | | (0.10 | ) |
2015 | | $ | 6.73 | | | | 0.19 | (d) | | | (1.32 | ) | | | (1.13 | ) | | | (0.26 | ) | | | — | | | | (0.26 | ) |
| Class A Shares | | | | | | | | | | | | | | | | | |
2011 | | $ | 8.00 | | | | 0.03 | | | | (0.82 | ) | | | (0.79 | ) | | | (0.05 | ) | | | — | | | | (0.05 | ) |
2012 | | $ | 7.16 | | | | 0.09 | | | | 0.26 | | | | 0.35 | | | | (0.08 | ) | | | — | | | | (0.08 | ) |
2013 | | $ | 7.43 | | | | 0.13 | | | | 0.54 | | | | 0.67 | | | | (0.05 | ) | | | — | | | | (0.05 | ) |
2014 | | $ | 8.05 | | | | 0.10 | (d) | | | (1.33 | ) | | | (1.23 | ) | | | (0.09 | ) | | | — | | | | (0.09 | ) |
2015 | | $ | 6.73 | | | | 0.19 | (d) | | | (1.30 | ) | | | (1.11 | ) | | | (0.24 | ) | | | — | | | | (0.24 | ) |
| RATIONAL DEFENSIVE GROWTH FUND | | | | | | | | | | | | | |
| Institutional Shares | | | | | | | | | | | | | | | | | |
2011 | | $ | 20.21 | | | | (0.05 | ) | | | (0.63 | ) | | | (0.68 | ) | | | — | | | | — | | | | — | |
2012 | | $ | 19.53 | | | | 0.09 | | | | 4.60 | | | | 4.69 | | | | (0.04 | ) | | | (0.74 | ) | | | (0.78 | ) |
2013 | | $ | 23.44 | | | | (0.01 | ) | | | 6.60 | | | | 6.59 | | | | (0.01 | ) | | | (1.27 | ) | | | (1.28 | ) |
2014 | | $ | 28.75 | | | | 0.09 | | | | (0.58 | ) | | | (0.49 | ) | | | (0.02 | ) | | | (7.49 | ) | | | (7.51 | ) |
2015 | | $ | 20.75 | | | | 0.09 | (d) | | | (0.81 | ) | | | (0.72 | ) | | | (0.08 | ) | | | (15.26 | ) | | | (15.34 | ) |
| Class A Shares | | | | | | | | | | | | | | | | | |
2011 | | $ | 19.78 | | | | (0.10 | ) | | | (0.62 | ) | | | (0.72 | ) | | | — | | | | — | | | | — | |
2012 | | $ | 19.06 | | | | 0.04 | | | | 4.48 | | | | 4.52 | | | | — | | | | (0.74 | ) | | | (0.74 | ) |
2013 | | $ | 22.84 | | | | (0.07 | ) | | | 6.42 | | | | 6.35 | | | | — | | | | (1.27 | ) | | | (1.27 | ) |
2014 | | $ | 27.92 | | | | 0.01 | | | | (0.55 | ) | | | (0.54 | ) | | | — | | | | (7.49 | ) | | | (7.49 | ) |
2015 | | $ | 19.89 | | | | 0.07 | (d) | | | (0.77 | ) | | | (0.70 | ) | | | (0.07 | ) | | | (15.26 | ) | | | (15.33 | ) |
| Class C Shares | | | | | | | | | | | | | | | | | |
2014(e) | | $ | 27.60 | | | | (0.07 | ) | | | (0.29 | ) | | | (0.36 | ) | | | — | | | | (7.49 | ) | | | (7.49 | ) |
2015 | | $ | 19.75 | | | | — | (d)(h) | | | (0.76 | ) | | | (0.76 | ) | | | (0.04 | ) | | | (15.26 | ) | | | (15.30 | ) |
| (a) | Based on net asset value, which does not reflect a sales charge or contingent deferred sales charge, if applicable. |
| (b) | If applicable, certain fees were waived and/or reimbursed. If such waivers/reimbursements had not occurred, the ratios would have been as indicated. |
| (c) | Portfolio Turnover is calculated on the basis of the Fund as a whole without distinguishing among the classes of shares. |
| (d) | Calculated using average shares outstanding for the period. |
| (e) | Reflects operations for the period from January 3, 2014 (commencement of operations) to December 31, 2014. |
| (g) | Computed on an annualized basis. |
| (h) | Amount is less than $0.005. |
| (i) | Includes the impact of a contribution from the Advisor. Without such contribution, the returns would have been -16.98% for Institutional Shares and -16.68% for Class A Shares. |
(See notes which are an integral part of the Financial Statements)
Annual Shareholder Report
32
| | | | | | | | | | | | | | | | | | | | | | | | | | | | | | |
Contributions
from Advisor | | | Net asset
value, end
of period | | | Total
return(a) | | | Ratio of net
expenses to
average net
assets | | | Ratio of net
investment
income (loss)
to average
net assets | | | Ratio of expenses
(prior to
reimbursements)
to average
net assets(b) | | | Net assets,
end of
period
(000 omitted) | | | Portfolio
turnover
rate(c) | |
| | | | | | | | | | | | | | | | | | | | | | | | | | | | | | |
| | | | | | | | | | | | | | | | | | | | | | | | | | | | | | |
| | — | | | $ | 7.15 | | | | (9.64 | )% | | | 1.35 | % | | | 0.66 | % | | | 1.35 | % | | $ | 92,475 | | | | 60 | % |
| | — | | | $ | 7.42 | | | | 5.20 | % | | | 1.35 | % | | | 1.54 | % | | | 1.35 | % | | $ | 96,292 | | | | 30 | % |
| | — | | | $ | 8.05 | | | | 9.49 | % | | | 1.34 | % | | | 1.93 | % | | | 1.36 | % | | $ | 89,571 | | | | 43 | % |
| | — | | | $ | 6.73 | | | | (15.03 | )% | | | 1.04 | % | | | 1.53 | % | | | 1.52 | % | | $ | 29,453 | | | | 31 | % |
| | 0.05 | | | $ | 5.39 | | | | (16.05 | )%(i) | | | 1.07 | % | | | 2.99 | % | | | 2.49 | % | | $ | 6,032 | | | | 13 | % |
| | | | | | | | | | | | | | | | | | | | | | | | | | | | | | |
| | — | | | $ | 7.16 | | | | (9.88 | )% | | | 1.60 | % | | | 0.39 | % | | | 1.60 | % | | $ | 2,004 | | | | 60 | % |
| | — | | | $ | 7.43 | | | | 4.96 | % | | | 1.60 | % | | | 1.30 | % | | | 1.60 | % | | $ | 2,173 | | | | 30 | % |
| | — | | | $ | 8.05 | | | | 9.09 | % | | | 1.59 | % | | | 1.68 | % | | | 1.61 | % | | $ | 2,366 | | | | 43 | % |
| | — | | | $ | 6.73 | | | | (15.23 | )% | | | 1.29 | % | | | 1.21 | % | | | 1.77 | % | | $ | 1,656 | | | | 31 | % |
| | 0.05 | | | $ | 5.43 | | | | (15.75 | )%(i) | | | 1.32 | % | | | 3.10 | % | | | 2.74 | % | | $ | 979 | | | | 13 | % |
| | | | | | | | | | | | | | | | | | | | | | | | | | | | | | |
| | | | | | | | | | | | | | | | | | | | | | | | | | | | | | |
| | — | | | $ | 19.53 | | | | (3.36 | )% | | | 1.32 | % | | | (0.25 | )% | | | 1.32 | % | | $ | 166,134 | | | | 18 | % |
| | — | | | $ | 23.44 | | | | 24.11 | % | | | 1.35 | % | | | 0.41 | % | | | 1.35 | % | | $ | 192,757 | | | | 11 | % |
| | — | | | $ | 28.75 | | | | 28.38 | % | | | 1.30 | % | | | 0.05 | % | | | 1.33 | % | | $ | 339,983 | | | | 22 | % |
| | — | | | $ | 20.75 | | | | (1.41 | )% | | | 1.03 | % | | | 0.23 | % | | | 1.37 | % | | $ | 152,846 | | | | 12 | % |
| | — | | | $ | 4.69 | | | | (7.82 | )% | | | 1.06 | % | | | 0.46 | % | | | 1.56 | % | | $ | 13,456 | | | | 35 | % |
| | | | | | | | | | | | | | | | | | | | | | | | | | | | | | |
| | — | | | $ | 19.06 | | | | (3.64 | )% | | | 1.57 | % | | | (0.50 | )% | | | 1.57 | % | | $ | 22,409 | | | | 18 | % |
| | — | | | $ | 22.84 | | | | 23.82 | % | | | 1.60 | % | | | 0.17 | % | | | 1.60 | % | | $ | 28,485 | | | | 11 | % |
| | — | | | $ | 27.92 | | | | 28.09 | % | | | 1.55 | % | | | (0.27 | )% | | | 1.58 | % | | $ | 74,132 | | | | 22 | % |
| | — | | | $ | 19.89 | | | | (1.62 | )% | | | 1.28 | % | | | 0.01 | % | | | 1.62 | % | | $ | 44,589 | | | | 12 | % |
| | — | | | $ | 3.86 | | | | (8.21 | )% | | | 1.31 | % | | | 0.52 | % | | | 1.81 | % | | $ | 20,944 | | | | 35 | % |
| | | | | | | | | | | | | | | | | | | | | | | | | | | | | | |
| | — | | | $ | 19.75 | | | | (1.00 | )%(f) | | | 1.79 | %(g) | | | (0.54 | )%(g) | | | 2.15 | %(g) | | $ | 1,545 | | | | 12 | %(f) |
| | — | | | $ | 3.69 | | | | (8.56 | )% | | | 1.81 | % | | | 0.04 | % | | | 2.31 | % | | $ | 766 | | | | 35 | % |
Annual Shareholder Report
33
| | |
| Financial Highlights (Continued) | | |
| (For a share outstanding throughout each year ended December 31) | | |
| | | | | | | | | | | | | | | | | | | | | | | | | | | | |
| | | Net Asset
Value,
beginning
of year | | | Net
investment income (loss) | | | Net realized
and unrealized
gain (loss) on
investments | | | Total from
investment
operations | | | Distributions
from net
investment
income | | | Distributions from net
realized gain
on investment
transactions | | | Total
distributions | |
| RATIONAL STRATEGIC ALLOCATION FUND | | | | | | | | | | | | | | | | | |
| Class A Shares | | | | | | | | | | | | | | | | | | | | | | | | | | | | |
2011 | | $ | 11.57 | | | | 0.10 | | | | (0.13 | ) | | | (0.03 | ) | | | (0.10 | ) | | | (0.11 | ) | | | (0.21 | ) |
2012 | | $ | 11.33 | | | | 0.12 | | | | 0.75 | | | | 0.87 | | | | (0.12 | ) | | | (1.09 | ) | | | (1.21 | ) |
2013 | | $ | 10.99 | | | | 0.09 | | | | 1.34 | | | | 1.43 | | | | (0.24 | ) | | | (0.41 | ) | | | (0.65 | ) |
2014 | | $ | 11.77 | | | | 0.17 | | | | 0.07 | | | | 0.24 | | | | (0.24 | ) | | | (0.41 | ) | | | (0.65 | ) |
2015 | | $ | 11.36 | | | | 0.14 | | | | (0.34 | ) | | | (0.20 | ) | | | (0.12 | ) | | | (1.26 | ) | | | (1.38 | ) |
| (a) | Based on net asset value, which does not reflect a sales charge or contingent deferred sales charge, if applicable. |
| (b) | Does not include the effect of expenses of underlying funds. |
| (c) | If applicable, certain fees were waived and/or reimbursed. If such waivers/reimbursements had not occurred, the ratios would have been as indicated. |
(See notes which are an integral part of the Financial Statements)
Annual Shareholder Report
34
| | | | | | | | | | | | | | | | | | | | | | | | | | |
Net Asset
Value, end
of year | | | Total
return(a) | | | Ratio of net
expenses to
average net
assets(b) | | | Ratio of net
investment
income (loss)
to average
net assets | | | Ratio of expenses
(prior to
reimbursements)
to average
net assets(b)(c) | | | Net Assets,
end of
year
(000 omitted) | | | Portfolio
turnover
rate | |
| | | | | | | | | | | | | | | | | | | | | | | | | | |
| | | | | | | | | | | | | | | | | | | | | | | | | | |
| $ | 11.33 | | | | (0.18 | )% | | | 0.67 | % | | | 0.90 | % | | | 0.80 | % | | $ | 27,642 | | | | 23 | % |
| $ | 10.99 | | | | 7.79 | % | | | 0.68 | % | | | 0.98 | % | | | 0.89 | % | | $ | 18,192 | | | | 74 | % |
| $ | 11.77 | | | | 13.14 | % | | | 0.74 | % | | | 0.72 | % | | | 0.93 | % | | $ | 21,065 | | | | 44 | % |
| $ | 11.36 | | | | 2.05 | % | | | 0.73 | % | | | 1.38 | % | | | 0.96 | % | | $ | 21,008 | | | | 52 | % |
| $ | 9.78 | | | | (1.87 | )% | | | 0.70 | % | | | 1.10 | % | | | 1.04 | % | | $ | 17,061 | | | | 44 | % |
Annual Shareholder Report
35
Notes to Financial Statements
December 31, 2015
The Mutual Fund and Variable Insurance Trust (the “Trust”) (formerly the Huntington Funds) was organized as a single Delaware statutory trust on June 23, 2006. The Trust is registered under the Investment Company Act of 1940, as amended (the “1940 Act”), as an open-end management investment company. As of December 31, 2015, the Trust operated 7 separate series, or mutual funds, each with its own investment objective and strategy. This report contains financial statements and financial highlights of the retail funds listed below (individually referred to as a “Fund,” or collectively as the “Funds”):
| | |
| Funds | | Investment Share
Classes Offered* |
Rational Dividend Capture Fund (“Dividend Capture Fund”), formerly Huntington Dividend Capture Fund | | Institutional, A & C |
Rational Risk Managed Emerging Markets Fund (“Risk Managed Emerging Markets Fund”), formerly Huntington Global Select Markets Fund | | Institutional & A |
Rational Real Strategies Fund (“Real Strategies Fund”), formerly Huntington Real Strategies Fund | | Institutional & A |
Rational Defensive Growth Fund (“Defensive Growth Fund”), formerly Huntington Situs Fund | | Institutional, A & C |
Rational Strategic Allocation Fund (“Strategic Allocation Fund”), formerly Huntington Balanced Allocation Fund | | A |
| * | Each class of shares for each Fund has identical rights and privileges except with respect to distribution (12b-1) and service fees, voting rights on matters affecting a single class of shares, exchange privileges of each class of shares and sales charges. The price at which the Funds will offer or redeem shares is the net asset value (“NAV”) per share next determined after the order is considered received, subject to any applicable front end or contingent deferred sales charges. Class A shares have a maximum sales charge on purchases of 4.75% as a percentage of the original purchase price. Class C shares have a contingent deferred sales charge of 1.00% on shares sold within one year of purchase. |
The prospectus provides a description of each Fund’s investment objectives, policies and strategies along with information on the classes of shares currently being offered.
Under the Trust’s organizational documents, its officers and Trustees are indemnified against certain liabilities arising out of the performance of their duties to the Funds. In addition, in the normal course of business, the Trust may enter into contracts with vendors and others that provide for general indemnifications. The Trust’s maximum exposure under these arrangements is unknown, as this would involve future claims that may be
made against the Trust. However, based on experience, the Trust expects that risk of loss to be remote.
On December 19, 2014, the Risk Managed Emerging Markets Fund acquired all of the assets and assumed all of the liabilities of the Huntington International Equity Fund (“International Equity Fund”) pursuant to an agreement and plan of reorganization approved by the Board of Trustees (“Trustees”) on September 22, 2014. The reorganization provides shareholders of the International Equity Fund access to a larger and more diversified portfolio with a similar investment strategy and lower expenses. The reorganization qualified as a tax-free reorganization for federal income tax purposes with no gain or loss recognized to the funds or their shareholders.
The acquisition was accomplished by a tax-free exchange of 2,618,940 Institutional Class shares of the Risk Managed Emerging Markets Fund (valued at $24,958,498) for 3,641,716 Institutional Class shares of the International Equity Fund and 690,613 Class A shares of the Risk Managed Emerging Markets Fund (valued at $6,560,828) for 980,223 Class A shares of the International Equity Fund, each outstanding on December 19, 2014. The investment portfolio of the International Equity Fund, with a fair value of $27,128,665 and identified cost of $21,876,394 was the principal asset acquired by the Risk Managed Emerging Markets Fund. For financial reporting purposes, assets received and shares issued by the Risk Managed Emerging Markets Fund were recorded at fair value; however, the identified cost of the investments received from the International Equity Fund was carried forward to align ongoing reporting of the Risk Managed Emerging Markets Fund’s realized and unrealized gains and losses with amounts distributable to shareholders for tax purposes. The aggregate net assets of the Risk Managed Emerging Markets Fund immediately before the acquisition were $7,795,589. The aggregate net assets of the International Equity Fund at that date of $31,519,326, including $5,199,907 of unrealized appreciation, were combined with those of the Risk Managed Emerging Markets Fund, resulting in combined aggregate net assets of $39,314,915.
Assuming the acquisition had been completed on January 1, 2014, the beginning of the annual reporting period of the Risk Managed Emerging Markets Fund, the Risk Managed Emerging Markets Fund’s pro forma results of operations for the year ended December 31, 2014, are as follows:
| | | | |
Net Investment Income | | $ | 2,611,201 | |
Net Realized and Unrealized Loss on Investments | | ($ | 13,305,478 | ) |
Net Decrease in Net Assets Resulting From Operations | | ($ | 10,694,277 | ) |
Annual Shareholder Report
36
| (2) | Significant Accounting Policies |
Each Fund is an investment company and each follow accounting and reporting guidance under Financial Accounting Standards Board (“FASB”) Accounting Standards Codification (“ASC”) Topic 946, “Financial Services-Investment Companies”. The following is a summary of significant accounting policies consistently followed by the Funds in the preparation of their financial statements. The policies are in conformity with accounting principles generally accepted in the United States of America (“GAAP”).
The preparation of financial statements in conformity with GAAP requires management to make estimates and assumptions that affect the amounts of assets, liabilities, and disclosure of contingent assets and liabilities at the date of the financial statements and the reported amounts of income and expenses for the period. Actual results could differ from those estimates.
The Trust calculates the NAV for each of the Funds by valuing securities held based on fair value. Fair value is defined as the price that would be received to sell an asset or paid to transfer a liability in an orderly transaction between market participants at the measurement date.
The valuation techniques described below maximize the use of observable inputs and minimize the use of unobservable inputs in determining fair value. The inputs used for valuing the Funds’ investments are summarized in the three broad levels listed below:
| • | | Level 1—unadjusted quoted prices in active markets for identical investments and/or registered investment companies where the value per share is determined and published and is the basis for current transactions for identical assets or liabilities at the valuation date. |
| • | | Level 2—other significant observable inputs (including quoted prices for similar securities, interest rates, prepayment speeds, credit risk, etc.). |
| • | | Level 3—significant unobservable inputs (including the Funds’ own assumptions in determining the fair value of investments). |
Changes in valuation techniques may result in transfers in or out of an assigned level within the disclosure hierarchy. The Trust recognizes transfers between fair value hierarchy levels at the reporting period end. The inputs or methodology used for valuing investments is not necessarily an indication of the risk associated with investing in those investments.
In computing the NAV of the Funds fair value is based on market valuations with respect to portfolio securities for which market quotations are readily available. Pursuant to Trustee-approved policies, the Trust relies on certain security pricing services to provide the current market value of securities. Those security pricing services value equity securities (including foreign equity securities,
exchange-traded funds and closed-end funds) traded on a securities exchange at the last reported sales price on the principal exchange. Equity securities quoted by NASDAQ are valued at the NASDAQ official closing price. If there is no reported sale on the principal exchange, and in the case of over-the-counter securities, equity securities are valued at a bid price estimated by the security pricing service. In each of these situations, valuations are typically categorized as Level 1 in the fair value hierarchy. Investments in open-end investment companies are valued at their respective net asset value as reported by such companies and are typically categorized as Level 1 in the fair value hierarchy.
Option contracts are generally valued using the closing price based on quote data from the six major U.S. options exchanges on which such options are traded and are typically categorized as Level 1 in the fair value hierarchy.
Debt securities traded on a national securities exchange or in the over-the-counter market are valued at the last reported sales price on the principal exchange. If there is no reported sale on the principal exchange, and for all other debt securities, debt securities are valued at a bid price estimated by the security pricing service. Foreign securities quoted in foreign currencies are translated in U.S. dollars at the foreign exchange rate in effect as of the close of the New York Stock Exchange (NYSE) (generally 4:00 p.m. Eastern Time), on the day the value of the foreign security is determined. Short-term investments with remaining maturities of 60 days or less at the time of purchase may be valued at amortized cost. In each of these situations, valuations are typically categorized as Level 2 in the fair value hierarchy.
Securities for which market quotations are not readily available are valued at fair value under Trust procedures approved by the Trustees. In these cases, a Pricing Committee, established and appointed by the Trustees, determines in good faith, subject to Trust procedures, the fair value of portfolio securities held by a Fund (“good faith fair valuation”). When a good faith fair valuation of a security is required, consideration is generally given to a number of factors including, but not limited to the following: dealer quotes, published analyses by dealers or analysts regarding the security, transactions which provide implicit valuation of the security (such as a merger or tender offer transaction), the value of other securities or contracts which derive their value from the security at issue, and the implications of any other circumstances which have caused trading in the security to halt. With respect to certain categories of securities, the procedures utilized by the Pricing Committee detail specific valuation methodologies to be applied in lieu of considering the aforementioned list of factors. Depending on the source and relative significance of valuation inputs, these instruments may be classified as Level 2 or Level 3 in the fair value hierarchy.
Annual Shareholder Report
37
Notes to Financial Statements (Continued)
Fair valuation procedures are also used when a significant event affecting the value of a portfolio security is determined to have occurred between the time when the price of the portfolio security is determined and the close of trading on the NYSE, which is when each Fund’s NAV is computed. An event is considered significant if there is both an affirmative expectation that the security’s value will change in response to the event and a reasonable basis for quantifying the resulting change in value. Significant events include significant securities market movements occurring between the time the price of the portfolio security is determined and the close of trading on the NYSE. For domestic fixed income securities, such events may occur where the cut-off time for the market information used by the independent pricing service is earlier than the end of regular trading on the NYSE. For securities normally priced at their last sale price in a foreign market, such events can occur between the close of trading in the foreign market and the close of trading on the NYSE.
In some cases, events affecting the issuer of a portfolio security may be considered significant events. Examples of potentially significant events include announcements concerning earnings, acquisitions, new products, management changes, litigation developments, a strike or natural disaster affecting the company’s operations or regulatory changes or market developments affecting the issuer’s industry occurring between the time when the price of the portfolio security is determined and the close of trading on the NYSE. For securities of foreign issuers, such events could also include political or other developments affecting the economy or markets in which the issuer conducts its operations or its securities are traded.
There can be no assurance that a Fund could purchase or sell a portfolio security at the price used to calculate the Fund’s NAV. In the case of good faith fair valued portfolio securities, lack of information and uncertainty as to the significance of information may lead to a conclusion that a prior valuation is the best indication of a portfolio security’s present value. Good faith fair valuations generally remain unchanged until new information becomes available. Consequently, changes in good faith fair valuation of portfolio securities may be less frequent and of greater magnitude than changes in the price of portfolio securities valued at their last sale price, by an independent pricing service, or based on market quotations.
The Trustees have authorized the use of an independent fair valuation service. If the movement in a designated U.S. market index, after foreign markets close, is greater than predetermined levels, the Funds may use a systematic valuation model provided from that independent third party to fair value its international equity securities. Securities which are fair valued according to this model are then typically categorized as Level 2 in the fair value hierarchy.
In accordance with the valuation procedures adopted by the Trustees, real estate investments are fair valued using the results of an appraisal conducted by an independent valuation agent on the property(ies) underlying investment, as adjusted by any outstanding debt related to the property(ies). The Trustees deem this to be indicative of the fair value of the real estate investments. Such valuations are categorized as Level 3 in the fair value hierarchy.
The following is a summary of the inputs used to value the Funds’ investments as of December 31, 2015 based on the three levels defined previously:
| | | | | | | | | | | | | | | | |
| | | LEVEL 1 | | | LEVEL 2 | | | LEVEL 3 | | | Total | |
Dividend Capture Fund | | | | | | | | | | | | | | | | |
Investment Securities: | | | | | | | | | | | | | | | | |
Common Stocks | | $ | 73,175,451 | | | $ | — | | | $ | — | | | $ | 73,175,451 | |
Preferred Stocks | | | 24,389,500 | | | | — | | | | — | | | | 24,389,500 | |
Exchange-Traded Funds | | | 901,320 | | | | — | | | | — | | | | 901,320 | |
Cash Equivalents | | | 2,475,488 | | | | — | | | | — | | | | 2,475,488 | |
Short-Term Securities Held as Collateral for Securities Lending | | | 7,799,288 | | | | — | | | | — | | | | 7,799,288 | |
| | | | | | | | | | | | | | | | |
Total Investment Securities | | $ | 108,741,047 | | | $ | — | | | $ | — | | | $ | 108,741,047 | |
| | | | | | | | | | | | | | | | |
Risk Managed Emerging Markets Fund | | | | | | | | | | | | | | | | |
Investment Securities: | | | | | | | | | | | | | | | | |
Common Stocks | | $ | 8,336,535 | | | $ | — | | | $ | — | | | $ | 8,336,535 | |
Preferred Stocks | | | 36,986 | | | | — | | | | — | | | | 36,986 | |
Foreign Government Bonds | | | — | | | | 122,841 | | | | — | | | | 122,841 | |
Cash Equivalents | | | 724,746 | | | | — | | | | — | | | | 724,746 | |
Rights | | | — | | | | 1,217 | | | | — | | | | 1,217 | |
| | | | | | | | | | | | | | | | |
Total Investment Securities | | $ | 9,098,267 | | | $ | 124,058 | | | $ | — | | | $ | 9,222,325 | |
| | | | | | | | | | | | | | | | |
Annual Shareholder Report
38
| | | | | | | | | | | | | | | | |
| | | LEVEL 1 | | | LEVEL 2 | | | LEVEL 3 | | | Total | |
Real Strategies Fund | | | | | | | | | | | | | | | | |
Investment Securities: | | | | | | | | | | | | | | | | |
Common Stocks | | $ | 4,190,796 | | | $ | — | | | $ | — | | | $ | 4,190,796 | |
Exchange-Traded Funds | | | 98,925 | | | | — | | | | — | | | | 98,925 | |
Real Estate Investments | | | — | | | | — | | | | 1,519,093 | | | | 1,519,093 | |
Cash Equivalents | | | 1,141,603 | | | | — | | | | — | | | | 1,141,603 | |
Short-Term Securities Held as Collateral for Securities Lending | | | 171,255 | | | | — | | | | — | | | | 171,255 | |
| | | | | | | | | | | | | | | | |
Total Investment Securities | | $ | 5,602,579 | | | $ | — | | | $ | 1,519,093 | | | $ | 7,121,672 | |
| | | | | | | | | | | | | | | | |
Defensive Growth Fund | | | | | | | | | | | | | | | | |
Investment Securities: | | | | | | | | | | | | | | | | |
Common Stock | | $ | 30,125,600 | | | $ | — | | | $ | — | | | $ | 30,125,600 | |
Exchange-Traded Funds | | | 3,078,955 | | | | — | | | | — | | | | 3,078,955 | |
Cash Equivalents | | | 2,368,648 | | | | — | | | | — | | | | 2,368,648 | |
Short-Term Securities Held as Collateral for Securities Lending | | | 5,134,745 | | | | — | | | | — | | | | 5,134,745 | |
| | | | | | | | | | | | | | | | |
Total Investment Securities | | $ | 40,707,948 | | | $ | — | | | $ | — | | | $ | 40,707,948 | |
| | | | | | | | | | | | | | | | |
Strategic Allocation Fund | | | | | | | | | | | | | | | | |
Investment Securities: | | | | | | | | | | | | | | | | |
Mutual Funds | | $ | 11,717,672 | | | $ | — | | | $ | — | | | $ | 11,717,672 | |
Exchange-Traded Funds | | | 4,166,667 | | | | — | | | | — | | | | 4,166,667 | |
Cash Equivalents | | | 1,065,181 | | | | — | | | | — | | | | 1,065,181 | |
| | | | | | | | | | | | | | | | |
Total Investment Securities | | $ | 16,949,520 | | | $ | — | | | $ | — | | | $ | 16,949,520 | |
| | | | | | | | | | | | | | | | |
Transfers from Level 2 to Level 1 indicate that the fair valuation of international equity securities used at the previous reporting period end did not occur as of the current reporting period end. The Trust recognizes significant transfers between fair value hierarchy levels at the reporting period end. The following is a summary of the transfers between Level 1 and Level 2 of the fair value hierarchy for the year ended December 31, 2015:
| | | | | | | | |
| | | Transfers from
Level 1 to Level 2 | | | Transfers from
Level 2 to Level 1 | |
Risk Managed Emerging Markets Fund | | | | | | | | |
Investment Securities: | | | | | | | | |
Common Stocks | | $ | — | | | $ | 19,392,152 | |
Defensive Growth Fund | | | | | | | | |
Investment Securities: | | | | | | | | |
Common Stocks | | $ | — | | | $ | 9,320,920 | |
The following is a summary of the inputs used to value the Real Strategies Fund’s Level 3 investments as of December 31, 2015:
| | | | | | | | | | | | |
| Type of Assets | | Fair Value
at 12/31/2015 | | | Valuation Techniques | | Unobservable Input(s) | | Range
(Weighted Average) | |
Real Estate Investments | | $ | 1,519,093 | | | Independent Valuation | | Sales Comparison Approach | | | N/A | |
| | | | | | | | Income Approach | | | N/A | |
| | | | | | | | Market Cap Rate | | | 5.30%-13.60%(7.00%) | |
As noted previously, the Real Strategies Fund’s investments in real estate investments are valued by using the results of an independent valuation appraisal. The independent valuation agent will utilize either an income approach, a sales comparison approach, or a combination thereof to arrive at the valuation. The significant unobservable inputs used in the income approach include the net cash flow from each underlying property and the related discount and market cap rates. An increase in the cash flows and/or market cap rates or decreases in the discount rate used would increase the value of the real estate. A decrease in the cash flows and/or market cap rate or increases in the discount rate used would decrease the value of the real estate. The significant unobservable inputs used in the sales comparison approach include measurable units of comparison (such as price per acre, price per unit, price per square foot, or gross rent multiplier), as adjusted for each comparable property’s location, physical condition or other economic characteristics.
Annual Shareholder Report
39
Notes to Financial Statements (Continued)
Following is a reconciliation of assets in which significant unobservable inputs (Level 3) were used in determining fair value:
| | | | |
| Real Strategies Fund | | Real Estate
Investments | |
Balance as of December 31, 2014 | | $ | 1,713,390 | |
Transfers into Level 3 | | | — | |
Transfers out of Level 3 | | | — | |
Purchases | | | — | |
Sales | | | (161,276 | ) |
Realized Gain/(Loss) | | | 11,276 | |
Change in unrealized appreciation/(depreciation) | | | (44,297 | ) |
| | | | |
Balance as of December 31, 2015 | | $ | 1,519,093 | |
| | | | |
| B. | Foreign Currency Translation |
The accounting records of the Funds are maintained in U.S. dollars. Foreign currency amounts are translated into U.S. dollars at the current rate of exchange each business day to determine the value of investments, and other assets and liabilities. Purchases and sales of foreign securities, and income and expenses, are translated at the prevailing rate of exchange on the respective date of these transactions. The Funds do not isolate that portion of the results of operations resulting from changes in foreign exchange rates on investments from fluctuation arising from changes in market prices of securities held. These fluctuations are included with the net realized and unrealized gain or loss from investments and foreign currency transactions.
Certain of the Funds may be subject to equity price risk and foreign currency exchange risk in the normal course of pursuing their investment objectives. Certain of the Funds may invest in various financial instruments including positions in foreign currency contracts and written option contracts to gain exposure to or hedge against changes in the value of equities or foreign currencies. The following is a description of the derivative instruments utilized by the Funds, including the primary underlying risk exposure related to each instrument type.
Foreign Exchange Contracts—Certain of the Funds may enter into forward foreign exchange contracts. A forward
foreign exchange contract involves an obligation to purchase or sell a specific currency at a future date at a price set at the time of the contract. Such contracts are used to sell unwanted currency exposure that comes with holding securities in a market, or to buy currency exposure where the exposure from holding securities is insufficient to provide the desired currency exposure. The contracts are marked-to-market daily and the change in market value is recorded as unrealized appreciation or depreciation. When a forward foreign currency contract is closed, a Fund records a realized gain or loss equal to the difference between the value at the time it was opened and the value at the time it was closed. The Funds could be exposed to risks if the counterparties to the contracts are unable to meet the terms of their contracts and from unanticipated movements in exchange rates. As of December 31, 2015, the Funds did not have any forward foreign exchange contracts outstanding.
Written Options Contracts—Certain of the Funds may write options contracts for which premiums received are recorded as liabilities and are subsequently adjusted to the current value of the options written. Premiums received from writing options which expire are treated as realized gains. Premiums received from writing options which are either exercised or closed are offset against the proceeds received or the amount paid on the transaction to determine realized gains or losses. Investing in written options contracts exposes a Fund to equity price risk.
The following is a summary of Real Strategies Fund’s written option activity for the year ended December 31, 2015:
| | | | | | | | |
| Contracts | | Number of
Contracts | | | Premium | |
Outstanding at 12/31/2014 | | | 9,218 | | | $ | 671,989 | |
Options written | | | 97,565 | | | | 12,019,736 | |
Options expired | | | (3,844 | ) | | | (207,962 | ) |
Options closed | | | (102,718 | ) | | | (12,406,855 | ) |
Options exercised | | | (221 | ) | | | (76,908 | ) |
Outstanding at 12/31/2015 | | | — | | | $ | — | |
Annual Shareholder Report
40
As of December 31, 2015, Real Strategies Fund had no outstanding written option contracts.
The following is a summary of Defensive Growth Fund’s written option activity for the year ended December 31, 2015:
| | | | | | | | |
| Contracts | | Number of
Contracts | | | Premium | |
Outstanding at 12/31/2014 | | | 300 | | | $ | 131,176 | |
Options written | | | 5,600 | | | | 1,264,002 | |
Options expired | | | (2,500 | ) | | | (395,353 | ) |
Options closed | | | (1,200 | ) | | | (326,740 | ) |
Options exercised | | | (2,200 | ) | | | (673,085 | ) |
Outstanding at 12/31/2015 | | | — | | | $ | — | |
As of December 31, 2015, Defensive Growth Fund had no outstanding written option contracts.
The effect of derivative instruments on the Statements of Operations for the year ended December 31, 2015:
| | | | | | | | | | | | |
| Primary Risk Exposure | | Location of Gain/(Loss)
on Derivatives
Recognized from Operations | | Fund | | Realized Gain/(Loss) on
Derivatives Recognized
from Operations | | | Change in Unrealized
Appreciation/(Depreciation)
on Derivatives Recognized
from Operations | |
Written Option Contracts | | Net realized gain/(loss) on written option transactions/net change in unrealized appreciation/(depreciation) of investments and written options | | Real Strategies Fund Defensive Growth Fund | | $
| 1,560,862
537,050 |
| | $
| (223,650
824 | )
|
| Balance | Sheet Offsetting Information |
Netting Agreements—During the ordinary course of business, the Funds may enter into transactions subject to enforceable netting agreements or other similar arrangements (“netting agreements”). Generally, the right to offset in netting agreements allows a Fund to offset any exposure to a specific counterparty with any collateral received or delivered to that counterparty based on the terms of the agreement. Generally, a Fund manages its cash collateral and securities collateral on a counterparty basis. As of December 31, 2015, the Funds were not invested in any portfolio securities or derivatives that could be netted subject to the netting agreements.
The following tables provide a summary of offsetting financial liabilities and derivatives and the effect of derivative instruments on the Statements of Assets and Liabilities as of December 31, 2015.
| | | | | | | | | | | | | | | | | | | | | | | | |
| Securities Loaned | | | | | | | | | | | Gross Amounts Not Offset in
Statements of Assets and
Liabilities | | | | |
| Fund | | Gross Amounts
of Recognized
Liabilities | | | Gross Amounts
Offset in
Statements of
Assets and
Liabilities | | | Net Amounts of
Liabilities Presented
in Statements of
Assets and Liabilities | | | Financial
Instruments | | | Cash
Collateral
Pledged | | | Net Amount
(not less than 0) | |
Dividend Capture Fund | | $ | 7,799,288 | | | $ | — | | | $ | 7,799,288 | | | $ | (7,799,288 | ) | | $ | — | | | $ | — | |
Real Strategies Fund | | | 171,255 | | | | — | | | | 171,255 | | | | (171,255 | ) | | | — | | | | — | |
Defensive Growth Fund | | | 5,134,745 | | | | — | | | | 5,134,745 | | | | (5,134,745 | ) | | | — | | | | — | |
The notional value of the written options contracts outstanding as of December 31, 2015 and the month-end average notional amount for the year ended December 31, 2015 are detailed in the table below:
| | | | | | | | |
| Portfolio | | Average
Month-End
Notional Amount | | | December 31, 2015
Notional Amount | |
Real Strategies Fund | | $ | 24,835,223 | | | $ | — | |
Defensive Growth Fund | | | 3,872,692 | | | | — | |
Annual Shareholder Report
41
Notes to Financial Statements (Continued)
Derivative positions open during the year and at year end, if any, are reflected for each Fund in the previous tables. The volume of these positions relative to each Fund’s net assets at the close of the reporting period is generally higher than the volume of such positions at the beginning of the reporting period. The Funds value derivative instruments at fair value and recognize changes in fair value currently in the results on operations.
To generate additional income, the Funds may lend a certain percentage of their total assets, to the extent permitted by the 1940 Act or the rules or regulations thereunder, on a short-term basis to certain brokers, dealers or other financial institutions pursuant to a securities lending agreement with Morgan Stanley & Co. LLC. In determining whether to lend to a particular broker, dealer or financial institution the Huntington Asset Advisors, Inc. (the “Advisor”) will consider all relevant facts and circumstances, including the size, creditworthiness and reputation of the borrower. Any loans made will be continuously secured by collateral in cash at least equal to 100% of the value of the securities on loan for the Funds, based on the prior day’s closing price. When the collateral falls below specified amounts, the lending agent will use its best effort to obtain additional collateral on the next
business day to meet required amounts under the securities lending agreement. The Funds receive payments from the borrowers equivalent to the dividends and interest that would have been earned on securities on loan. In addition, the Funds lending securities receive an annual minimum securities lending fee and retain a portion of the interest, dividends and other distributions received on investment of cash collateral. Collateral is marked-to-market daily. One of the risks in lending portfolio securities, as with other extensions of credit, is the possible delay in recovery of the securities or possible loss of rights in the collateral should the borrower fail financially. Although the loan is fully collateralized, if a borrower defaults, a Fund could lose money. There is also the risk that, when lending portfolio securities, the securities may not be available to a Fund on a timely basis and a Fund may, therefore, lose the opportunity to sell the securities at a desirable price. In addition, in the event that a borrower of securities would file for bankruptcy or become insolvent, disposition of the securities may be delayed pending court action. Loans are subject to termination by the Funds or the borrower at any time and, therefore, are not considered to be illiquid investments. Huntington National Bank (“Huntington”) serves as the custodian and receives an annual securities lending fee for collateral monitoring and recordkeeping services.
As of December 31, 2015, the following Funds had securities with the following market values on loan and related activity for the year ended December 31, 2015:
| | | | | | | | | | | | | | | | | | | | |
| Fund | | Value of
Loaned
Securities | | | Value of
Collateral | | | Average Loan
Outstanding
During
the Year | | | Securities Lending
Income Received
by the Funds | | | Fees Paid by
the Funds to
Huntington from
Securities Lending | |
Dividend Capture Fund | | $ | 7,565,415 | | | $ | 7,799,288 | | | $ | 12,172,097 | | | $ | 23,725 | | | $ | 4,745 | |
Risk Managed Emerging Markets Fund | | | — | | | | — | | | | 102,732 | | | | 9,900 | | | | 940 | |
Real Strategies Fund | | | 167,548 | | | | 171,255 | | | | 188,623 | | | | 23,833 | | | | 4,767 | |
Defensive Growth Fund | | | 4,956,674 | | | | 5,134,745 | | | | 21,819,467 | | | | 738,750 | | | | 147,752 | |
The amount of securities lending transactions accounted for as secured borrowings in accordance with ASU 2014-11 “Repurchase-to-Maturity Transactions, Repurchase Financings, and Disclosures” as listed below:
| | | | | | | | |
| Fund | | Overnight and
Continuous | | | Recorded Liabilities
for the Return of
Collateral on
Loaned Securities | |
Dividend Caputure Fund | | $ | 7,565,415 | | | $ | 7,799,288 | |
Real Strategies Fund | | | 167,548 | | | | 171,255 | |
Defensive Growth Fund | | | 4,956,674 | | | | 5,134,745 | |
Restricted securities are securities that may only be resold upon registration under federal securities laws or in transactions exempt from such registration. In some cases, the issuer of restricted securities has agreed to register such securities for resale, at the issuer’s expense, either upon demand by the Funds or in connection with another registered offering of the securities. Many restricted securities may be resold in the secondary market in transactions exempt from registration. Such restricted securities may be determined to be liquid. The Funds will not incur any registration costs upon such resale. The Funds’ restricted securities are valued at the price provided by dealers in the secondary market or,
Annual Shareholder Report
42
if no market prices are available, at the fair value price as determined by the Trust’s Pricing Committee. As of December 31, 2015, the Real Strategies Fund held restricted securities representing 21.7% of net assets as listed below:
| | | | | | | | | | | | | | | | |
| Issuer Description | | Acquisition Date | | | Principal Amount | | | Cost | | | Value | |
Real Strategies Fund: | | | | | | | | | | | | | | | | |
Grocery & Pharmacy DST | | | 8/26/11, 5/15/14 | | | | N/A | | | $ | 991,705 | | | $ | 823,108 | |
New York Power DST | | | 7/21/11 | | | | N/A | | | | 800,000 | | | | 695,985 | |
| F. | Security Transactions and Related Income |
During the period, investment transactions are accounted for no later than the first calculation of the NAV on the business day following the trade date. For financial reporting purposes, however, security transactions are accounted for on the trade date on the last business day of the reporting period. Discounts and premiums on securities purchased are amortized over the lives of the respective securities. Securities gains and losses are calculated on the identified cost basis. Interest income and expenses are accrued daily. Dividends, less foreign tax withholding (if any), are recorded on the ex-dividend date.
| G. | Dividends and Distributions to Shareholders |
Dividends from net investment income are declared and paid annually by the Risk Managed Emerging Markets Fund, Real Strategies Fund and Defensive Growth Fund. Dividends from net investment income are declared and paid quarterly by the Strategic Allocation Fund. Dividends from net investment income are declared and paid monthly by the Dividend Capture Fund.
The amount of dividends from net investment income and net realized gains are determined in accordance with the federal income tax regulations, which may differ from GAAP. These “book/tax” differences are either considered temporary or permanent in nature. To the extent these differences are permanent in nature (e.g. tax treatment of foreign currency gain/loss, non-deductible stock issuance costs, distributions and income received from pass through investments and net investment loss adjustments), such amounts are reclassified within the capital accounts based on their nature for federal income tax purposes; temporary differences do not require reclassification. Temporary differences are primarily due to market discounts, capital loss carryforwards and losses deferred due to wash sales, straddles and return of capital from investments.
Dividends are declared separately for each class. No class has preferential rights; differences in per share dividend rates are generally due to differences in separate class
expenses. Net realized capital gains, if any, are distributed at least annually.
Certain of the Funds may own shares of real estate investments trusts (“REITs”) which report information on the source of their distributions annually. Distributions received from investments in REITs in excess of income from underlying investments are recorded as realized gain and/or as a reduction to the cost of the individual REIT.
Certain of the Funds may invest in Master Limited Partnerships (“MLPs”), which generally are treated as partnerships for Federal income tax purposes. As a limited partner in the MLPs, the Fund includes its allocable share of the MLPs’ taxable income in computing its own taxable income.
| H. | Allocation of Expenses, Income, and Gains and Losses |
Expenses directly attributable to a Fund are charged to that Fund. Expenses specific to a class are charged to that class. Except for the daily dividend Funds, expenses not directly attributable to a Fund are allocated proportionally among various Funds or all Funds within the Trust in relation to the net assets of each Fund or on another reasonable basis. For the daily dividend Funds, expenses not directly attributable to a Fund are allocated pursuant to the “settled shares method.” Income and realized and unrealized gains or losses on investments are allocated to each class of shares based on its relative net assets.
It is the policy of each Fund to qualify or continue to qualify as a regulated investment company by complying with the provisions available to certain investment companies, as defined in applicable sections of the Internal Revenue Code, and to make distributions of net investment income and net realized capital gains sufficient to relieve it from all, or substantially all, federal income taxes.
Withholding taxes on foreign interest, dividends and capital gains with respect to the Funds have been provided for in accordance with each applicable country’s tax rules and rates.
Annual Shareholder Report
43
Notes to Financial Statements (Continued)
As of December 31, 2015, the tax cost of securities and the breakdown of unrealized appreciation (depreciation) for each Fund were as follows:
| | | | | | | | | | | | | | | | |
| Fund | | Tax Cost of
Securities | | | Unrealized
Appreciation | | | Unrealized
Depreciation | | | Net Unrealized
Appreciation/
(Depreciation)(a) | |
Dividend Capture Fund | | $ | 113,072,615 | | | $ | 7,107,182 | | | $ | (11,438,750 | ) | | $ | (4,331,568 | ) |
Risk Managed Emerging Markets Fund | | | 8,036,372 | | | | 1,841,228 | | | | (655,275 | ) | | | 1,185,953 | |
Real Strategies Fund | | | 7,655,893 | | | | 780,241 | | | | (1,314,462 | ) | | | (534,221 | ) |
Defensive Growth Fund | | | 36,668,749 | | | | 5,608,509 | | | | (1,569,310 | ) | | | 4,039,199 | |
Strategic Allocation Fund | | | 18,414,641 | | | | 501,832 | | | | (1,966,953 | ) | | | (1,465,121 | ) |
| (a) | The differences between the book-basis unrealized appreciation (depreciation) are attributable primarily to: tax deferral of losses on wash sales, the tax treatment of Trust Preferred securities, hybrid securities and Grantor trusts, differences related to partnership investments and the return of capital adjustments from real estate investment trusts. |
The tax character of distributions paid during the fiscal year ended December 31, 2015, were as follows:
| | | | | | | | | | | | | | | | |
| | | Distributions Paid From(a) | | | | | | | |
| Fund | | Ordinary
Income | | | Net Long-Term
Capital Gains | | | Total Taxable
Distributions | | | Total
Distributions
Paid | |
Dividend Capture Fund | | $ | 8,008,639 | | | $ | 8,155,530 | | | $ | 16,164,169 | | | $ | 16,164,169 | |
Risk Managed Emerging Markets Fund | | | 533,123 | | | | 2,340,458 | | | | 2,873,581 | | | | 2,873,581 | |
Real Strategies Fund | | | 338,399 | | | | — | | | | 338,399 | | | | 338,399 | |
Defensive Growth Fund | | | 622,043 | | | | 44,740,954 | | | | 45,362,997 | | | | 45,362,997 | |
Strategic Allocation Fund | | | 186,964 | | | | 1,944,437 | | | | 2,131,401 | | | | 2,131,401 | |
| (a) | The tax character of distributions paid may differ from the character of distributions shown on the statements of changes in net assets due to short-term capital gains being treated as ordinary income for tax purposes. |
The tax character of distributions paid during the fiscal year ended December 31, 2014, were as follows:
| | | | | | | | | | | | | | | | |
| | | Distributions Paid From(a) | | | | | | | |
| Fund | | Ordinary
Income | | | Net Long-Term
Capital Gains | | | Total Taxable
Distributions | | | Total
Distributions
Paid | |
Dividend Capture Fund | | $ | 18,570,793 | | | $ | 16,718,184 | | | $ | 35,288,977 | | | $ | 35,288,977 | |
Risk Managed Emerging Markets Fund | | | — | | | | 1,172,067 | | | | 1,172,067 | | | | 1,172,067 | |
Real Strategies Fund | | | 499,549 | | | | — | | | | 499,549 | | | | 499,549 | |
Defensive Growth Fund | | | 1,251,429 | | | | 61,304,361 | | | | 62,555,790 | | | | 62,555,790 | |
Strategic Allocation Fund | | | 502,779 | | | | 648,944 | | | | 1,151,723 | | | | 1,151,723 | |
| (a) | The tax character of distributions paid may differ from the character of distributions shown on the statements of changes in net assets due to short-term capital gains being treated as ordinary income for tax purposes. |
As of December 31, 2015, the components of accumulated earnings (deficit) were as follows:
| | | | | | | | | | | | | | | | | | | | | | | | | | | | |
| Fund | | Undistributed
Ordinary
Income | | | Undistributed
Long-Term
Capital Gains | | | Accumulated
Earnings | | | Accumulated
Capital and
Other Losses | | | Other
Temporary
Differences | | | Unrealized
Appreciation
(Depreciation) | | | Total
Accumulated
Earnings
(Deficit) | |
Dividend Capture Fund | | $ | 1,159,945 | | | $ | 1,197,882 | | | $ | 2,357,827 | | | $ | — | | | $ | (73,053 | ) | | $ | (4,331,568 | ) | | $ | (2,046,794 | ) |
Risk Managed Emerging Markets Fund | | | — | | | | — | | | | — | | | | (269,162 | ) | | | — | | | | 1,109,214 | | | | 840,052 | |
Real Strategies Fund | | | 341,786 | | | | — | | | | 341,786 | | | | (16,645,408 | ) | | | (118,142 | ) | | | (534,221 | ) | | | (16,955,985 | ) |
Defensive Growth Fund | | | 766,678 | | | | 3,522,102 | | | | 4,288,780 | | | | — | | | | — | | | | 4,035,526 | | | | 8,324,306 | |
Strategic Allocation Fund | | | 118,514 | | | | 1,399,124 | | | | 1,517,638 | | | | — | | | | — | | | | (1,465,121 | ) | | | 52,517 | |
Annual Shareholder Report
44
As of December 31, 2015, for federal income tax purposes and the treatment of distributions payable, the following Funds had capital loss carryforwards available to offset future gains, if any, to the extent provided by the Treasury regulations:
| | | | | | | | | | | | | | | | | | | | |
| Fund | | 2017 | | | 2018 | | | No Expiration Short-Term(a) | | | No Expiration Long-Term(a) | | | Total | |
Real Strategies Fund | | $ | 12,599,554 | | | $ | 2,136,294 | | | $ | 935,308 | | | $ | 974,252 | | | $ | 1,909,560 | |
| (a) | The provisions of the Regulated Investment Company Modernization Act of 2010 (the “Act”), which was enacted on December 22, 2010, were effective for the Funds’ fiscal year ending December 31, 2012. Although the Act provided several benefits, including the unlimited carryover of future capital losses, there may be a greater likelihood that all or a portion of each Fund’s pre-enactment capital loss carryovers may expire without being utilized due to the fact that post-enactment capital losses must be utilized before pre-enactment capital loss carryovers may be utilized. Under the Act, new capital losses may now be carried forward indefinitely, and retain the character of the original loss as compared with pre-enactment law, where capital losses could be carried forward for up to eight years, and carried forward as short-term capital losses, irrespective of the character of the original loss. |
During the year ended December 31, 2015, the following Funds utilized capital loss carryforwards and had capital loss carryforwards expire:
| | | | | | | | |
| Fund | | Utilized
Amount | | | Expired
Amount | |
Defensive Growth Fund | | $ | 550,102 | | | $ | — | |
Certain capital and qualified late year losses incurred after October 31 and within the current taxable year are deemed to arise on the first business day of the Funds’ following taxable year. For the tax year ended December 31, 2015, the Funds deferred post October capital and late year ordinary losses as follows:
| | | | | | | | |
| Fund | | Capital
Losses | | | Late Year
Ordinary
Losses | |
Risk Managed Emerging Markets Fund | | $ | 269,162 | | | $ | — | |
Management of the Funds has reviewed tax positions taken in tax years that remain subject to examination by all major tax jurisdictions, including federal (i.e., the last three tax year ends and the interim tax period since then). Management believes there is no tax liability resulting from unrecognized tax benefits related to uncertain tax positions taken.
| (3) | Fees and Other Transactions with Affiliates and Other Service Providers |
Investment Advisory Fee—During 2015, the Advisor, served as the Funds’ investment advisor. For the year ended December 31, 2015, the Advisor received a fee for its services, computed daily and paid monthly, based on a percentage of each Fund’s average daily net assets on a tiered basis, according to the table below:
| | | | | | | | | | | | |
| | | Tiered Annual Rate: | |
| Fund | | Up to $500 million | | | On the next $500 million | | | In excess of $1 billion | |
Dividend Capture Fund | | | 0.75 | % | | | 0.70 | % | | | 0.65 | % |
Risk Managed Emerging Markets Fund | | | 1.00 | % | | | 0.95 | % | | | 0.90 | % |
Real Strategies Fund | | | 0.75 | % | | | 0.70 | % | | | 0.65 | % |
Defensive Growth Fund | | | 0.75 | % | | | 0.70 | % | | | 0.65 | % |
The Strategic Allocation Fund paid the Advisor a fee of 0.10% of its average daily net assets, computed daily and paid monthly.
Huntington and the Advisor may have also paid out of their reasonable profits and other resources (including those of their affiliates) advertising, marketing, and other expenses for the benefit of the Funds.
The Advisor had agreed to contractually waive all or a portion of its investment advisory fee for the following funds (based on average daily net assets) to which it is otherwise entitled to receive and/or to reimburse certain operating expenses in order to limit each Fund’s total annual fund expenses (after fee waivers, and/or expense reimbursements, and exclusive of acquired fund fees and expenses, brokerage costs, interest, taxes and dividends, and extraordinary expenses)
Annual Shareholder Report
45
Notes to Financial Statements (Continued)
(“Expense Cap”) for the fiscal year ended December 31, 2015, to the following (prior to April 30, 2014, each Fund’s Expense Cap included the acquired fund fees and expenses):
| | | | | | | | | | | | | | | | |
| | | Expense Cap | |
| Fund | | Institutional Shares | | | Class A Shares | | | Class C Shares | | | Expense Cap Effective Date | |
Dividend Capture Fund | | | 0.88 | % | | | 1.13 | % | | | 1.63 | % | | | April 30, 2014 | |
Risk Managed Emerging Markets Fund | | | 0.87 | % | | | 1.12 | % | | | — | | | | October 1, 2014 | |
Real Strategies Fund | | | 1.04 | % | | | 1.29 | % | | | — | | | | April 30, 2014 | |
Defensive Growth Fund | | | 1.03 | % | | | 1.28 | % | | | 1.78 | % | | | December 13, 2013 | |
Strategic Allocation Fund | | | — | | | | 0.70 | % | | | — | | | | April 30, 2014 | |
The Advisor has contractually agreed to waive all or a portion of its investment advisory fee (based on average daily net assets) and/or reimburse certain operating expenses of each Fund to the extent necessary in order to limit each Fund’s total annual fund operating expenses (after the fee waivers and/or expense reimbursements, and exclusive of acquired fund fees and expenses, brokerage costs, interest, taxes and dividends, and extraordinary expenses) as listed below:
| | | | | | | | | | | | | | | | | | | | |
| | | Expense Cap | |
| Fund | | Institutional Shares | | | Class A Shares | | | Class C Shares | | | Expense Cap
Effective Date | | | Expense Cap
Expiration Date | |
Dividend Capture Fund | | | 1.00 | % | | | 1.25 | % | | | 1.75 | % | | | January 1, 2016 | | | | April 30, 2017 | |
Risk Managed Emerging Markets Fund | | | 1.25 | % | | | 1.50 | % | | | — | | | | January 1, 2016 | | | | April 30, 2017 | |
Real Strategies Fund | | | 1.00 | % | | | 1.25 | % | | | — | | | | January 1, 2016 | | | | April 30, 2017 | |
Defensive Growth Fund | | | 1.00 | % | | | 1.25 | % | | | 1.75 | % | | | January 1, 2016 | | | | April 30, 2017 | |
Strategic Allocation Fund | | | — | | | | 0.70 | % | | | — | | | | January 1, 2016 | | | | April 30, 2017 | |
Amounts waived or reimbursed in the contractual period may be recouped by the Advisor within three years of the waiver and/or reimbursement. As of December 31, 2015, the following amounts have been waived or reimbursed by the Advisor and are subject to repayment by the respective Fund:
| | | | | | | | |
| Fund | | Amount
Waived or
Reimbursed | | | Expiring
Beginning
December 31, | |
Dividend Capture Fund | | $ | 1,004,031 | | | | 2016 | |
| | | | 1,313,835 | | | | 2017 | |
| | | | 950,747 | | | | 2018 | |
Risk Managed Emerging Markets Fund | | | 43,287 | | | | 2016 | |
| | | | 96,711 | | | | 2017 | |
| | | | 259,857 | | | | 2018 | |
Real Strategies Fund | | | 14,797 | | | | 2016 | |
| | | | 282,469 | | | | 2017 | |
| | | | 209,310 | | | | 2018 | |
Defensive Growth Fund | | | 73,283 | | | | 2016 | |
| | | | 1,097,463 | | | | 2017 | |
| | | | 528,144 | | | | 2018 | |
Strategic Allocation Fund | | | 37,483 | | | | 2016 | |
| | | | 48,026 | | | | 2017 | |
| | | | 65,861 | | | | 2018 | |
Effective December 31, 2015, Huntington sold the Advisor to Rational Capital LLC, who subsequently changed the name of the Advisor to Rational Advisors, Inc.
Administrative and Financial Administration Fees—During 2015, Huntington Asset Services, Inc. (“HASI”), a wholly owned subsidiary of Huntington Bancshares, Inc. (“HBI”), served as Administrator to the Trust. The fees paid for administrative services were based on the level of average net assets of each Fund for the period, subject to minimum fees in certain circumstances.
| | |
Maximum
Administrative Fee | | Average Daily Net Assets
of the Trust |
0.1822% | | On the first $4 billion |
0.1650% | | On the next $2 billion |
0.1575% | | On the next $2 billion |
0.1450% | | On assets in excess of $8 billion |
There was no minimum annual fee per fund or class of shares.
On December 31, 2015, HBI sold HASI to an unrelated party.
Distribution and Shareholder Services Fees—The Funds have adopted a Distribution Plan (the “Plan”) pursuant to Rule 12b-1 under the 1940 Act. Under the terms of the Plan, the Funds will compensate qualified intermediaries for distribution services in connection with Class A Shares not to exceed 0.25% of the daily net assets of each Fund’s Class A Shares and not to exceed 1.00% of the daily net assets of each Fund’s Class C Shares. Institutional Shares are not subject to Rule 12b-1 fees. Class A Shares (except for the Strategic Allocation Fund) and Institutional Shares are also subject to a shareholder services fee not to exceed 0.25% of the daily net assets of such shares. For the year ended December 31, 2015, Huntington and its affiliates received $238,559 in 12b-1
Annual Shareholder Report
46
fees from the Funds. For the year ended December 31, 2015, Huntington and its affiliates received $624,499 in shareholder service fees from the Funds. For the year ended December 31, 2015, Unified Financial Securities, LLC (the “Distributor”) received commissions of $131,647 earned on sales of Class A Shares of the Funds. For the year ended December 31, 2015, the Distributor paid out commissions earned on Class A Shares on behalf of the Funds of $13,132 to affiliated broker-dealers of the Funds.
Transfer and Dividend Disbursing Agent Fees and Expense—During 2015, HASI was the transfer and dividend disbursing agent for the Funds. For its services, HASI received a yearly fixed amount per shareholder account, subject to a yearly minimum fee of $12,000 for each of the Funds. HASI was also entitled to receive additional amounts that may have been activity or time-based charges, plus reimbursement for out-of-pocket expenses.
Custodian Fees—Huntington serves as custodian for each of the Funds. Brown Brothers Harriman received as sub-custodian for each Fund’s foreign assets. Huntington and
Brown Brothers Harriman received fees based on the level of each Fund’s average daily net assets for the period, plus out-of-pocket expenses.
General—Certain officers of the Trust are officers, directors and/or trustees of the Distributor.
Each Trustee who is not an “interested person” of the Trust, as such term is defined in the 1940 Act, received a $25,000 annual retainer plus $2,500 per regular Board meeting. The Audit Committee Chairman received $33,000 annual retainer plus $2,500 per regular Board meeting. The Independent Chairman of the Board received a $50,000 annual retainer plus $2,500 per regular Board meeting. The Board or a committee may establish ad hoc committees or sub-committees. Any committee or sub-committee member may be compensated by the Funds for incremental work outside of the regular meeting process based on the value added to the Funds. In addition, the Funds reimbursed Trustees for out-of-pocket expenses incurred in conjunction with attendance at meetings. For the year ended December 31, 2015, actual Trustee compensation was $251,500 in aggregate from the Trust.
Affiliated Funds—Pursuant to an exemptive order issued by the Securities and Exchange Commission, the Funds invested in certain, formerly affiliated, money market funds which were managed by the Advisor. Income distributions earned from investments in these funds are recorded as income from affiliates in the accompanying financial statements. A summary of each Fund’s investment in such affiliated money market funds is set forth below:
| | | | | | | | | | | | | | | | | | | | |
| Huntington Money Market Fund | | 12/31/2014
Fair Value | | | Purchases | | | Sales | | | 12/31/2015
Fair Value | | | Income | |
Dividend Capture Fund | | $ | 9,104,401 | | | $ | 45,495,744 | | | $ | (54,600,145 | ) | | $ | — | | | $ | 678 | |
Risk Managed Emerging Markets Fund | | | 7,588 | | | | 19,976,985 | | | | (19,984,573 | ) | | | — | | | | 164 | |
Real Strategies Fund | | | 2,571,738 | | | | 15,051,885 | | | | (17,623,623 | ) | | | — | | | | 114 | |
Defensive Growth Fund | | | — | | | | 54,129,704 | | | | (54,129,704 | ) | | | — | | | | 154 | |
| | | | | |
| Huntington U.S. Treasury Money Market Fund | | 12/31/2014
Fair Value | | | Purchases | | | Sales | | | 12/31/2015
Fair Value | | | Income | |
Dividend Capture Fund | | $ | — | | | $ | 15,077,035 | | | $ | (15,077,035 | ) | | $ | — | | | $ | 40 | |
Risk Managed Emerging Markets Fund | | | — | | | | 2,671,060 | | | | (2,671,060 | ) | | | — | | | | 82 | |
Real Strategies Fund | | | — | | | | 2,505,129 | | | | (2,505,129 | ) | | | — | | | | 137 | |
Defensive Growth Fund | | | — | | | | 24,384,268 | | | | (24,384,268 | ) | | | — | | | | 376 | |
Additionally, Strategic Allocation Fund invested in other Funds within the Trust and the Strategy Shares. A summary of these investments in affiliated funds is set forth below:
| | | | | | | | | | | | | | | | | | | | |
| Balanced Allocation Fund | | 12/31/2014
Fair Value | | | Purchases | | | Sales | | | 12/31/2015
Fair Value | | | Income | |
Huntington Money Market Fund | | $ | 4,673,951 | | | $ | 2,791,137 | | | $ | (7,465,088 | ) | | $ | — | | | $ | 532 | |
Huntington U.S. Treasury Money Market Fund | | | — | | | | 1,932,703 | | | | (1,932,703 | ) | | | — | | | | 140 | |
Dividend Capture Fund | | | 2,000,680 | | | | 1,630,126 | | | | (1,194,661 | ) | | | 2,261,270 | | | | 89,543 | |
Risk Managed Emerging Markets Fund | | | 3,156,426 | | | | 1,159,306 | | | | (2,129,503 | ) | | | 2,087,797 | | | | 76,245 | |
Defensive Growth Fund | | | 1,777,421 | | | | 2,415,395 | | | | (2,283,842 | ) | | | 1,721,335 | | | | 28,954 | |
EcoLogical Strategy ETF | | | 2,661,872 | | | | 554,861 | | | | (1,121,975 | ) | | | 2,074,172 | | | | 1,950 | |
US Equity Rotation Strategy ETF | | | 2,434,297 | | | | 822,243 | | | | (1,233,320 | ) | | | 2,092,495 | | | | 23,443 | |
Annual Shareholder Report
47
Notes to Financial Statements (Continued)
Affiliated issuers, as defined under the Investment Company Act of 1940, are those in which a Fund’s holdings of an issuer represent 5% or more of the outstanding voting securities of the issuer. A summary of the Real Strategies Fund’s investment in New York Power DST, representing approximately 6.96% of the issuer, is set forth below:
| | | | | | | | | | | | | | | | | | | | | | | | | | | | |
| | | 12/31/2014
Fair Value | | | Change in
Unrealized
Appreciation
(Depreciation) | | | Purchases | | | Sales | | | Realized
Gain/(Loss) | | | 12/31/2015
Fair Value | | | Income | |
New York Power DST | | $ | 826,482 | | | $ | 19,503 | | | $ | — | | | $ | (161,276 | ) | | $ | 11,276 | | | $ | 695,985 | | | $ | 73,450 | |
| (5) | Strategic Allocation Fund Structure |
Strategic Allocation Fund, in accordance with its prospectus, seeks to achieve its investment objective by investing in other investment companies (“Underlying Funds”) with similar investment objectives. As a result, investors in the Strategic Allocation Fund incur expenses of both the Investing Fund and Underlying Funds, including transaction costs related to the purchases and sales of Underlying Fund shares.
| (6) | Investment Transactions |
Purchases and sales of investments, excluding short-term securities, for the year ended December 31, 2015, were as follows:
| | | | | | | | |
| Fund | | Purchases | | | Sales | |
Dividend Capture Fund | | $ | 145,521,903 | | | $ | 229,457,951 | |
Risk Managed Emerging Markets Fund | | | 12,954,843 | | | | 33,613,055 | |
Real Strategies Fund | | | 1,901,212 | | | | 21,364,512 | |
Defensive Growth Fund | | | 37,525,638 | | | | 197,740,927 | |
Strategic Allocation Fund | | | 10,035,735 | | | | 7,505,731 | |
There were no purchases or sales of long-term U.S. government obligations during the year ended December 31, 2015.
| (7) | Foreign Investment Risk |
Compared with investing in the United States, investing in foreign markets involves a greater degree and variety of risk. Investors in international or foreign markets may face delayed settlements, currency controls and adverse economic developments as well as higher overall transaction costs. In addition, fluctuations in the U.S. dollar’s value versus other currencies may erode or reverse gains from investments denominated in foreign currencies or widen losses. Foreign governments may expropriate assets, impose capital or currency controls, impose punitive taxes, impose limits on ownership or nationalize a company or industry. Any of these actions could have severe effect on security prices and impair the Fund’s ability to bring its capital or income back to the U.S. Exchange rate. Fluctuations also may impair an issuer’s ability to repay U.S. dollar denominated debt, thereby increasing credit risk of such debt. Finally, the value of foreign securities may be affected by incomplete, less frequent, or inaccurate financial information about their issuers, social upheavals or political actions ranging from tax code changes to government collapse. Foreign companies may also receive less coverage than U.S. companies by market analysts, and financial reporting standards or regulatory requirements may not be comparable to those applicable to U.S. companies.
The Trust participated in a short-term credit agreement (“Line of Credit”) with Huntington during the year ended December 31, 2015. Under the terms of the agreement, the Funds could borrow up to $30 million at an interest rate of LIBOR plus 135 basis points. The purpose of the agreement was to meet temporary or emergency cash needs, including redemption requests that might otherwise require the untimely disposition of securities. Huntington received an annual facility fee of 0.125% on $30 million as well as an additional annual fee of 0.125% on any unused portion of the credit facility for providing the Line of Credit. Each Fund in the Trust paid a pro-rata portion of this facility fee, and unused fee, plus any interest on amounts borrowed. For the year ended December 31, 2015, the following Funds had borrowings under this Line of Credit.
| | | | | | | | | | | | | | | | | | | | |
| Fund | | Average Loan Balance | | | Weighted Average Interest Rate | | | Number of Days Outstanding(a) | | | Interest Expense Incurred | | | Maximum Loan Outstanding | |
Dividend Capture Fund | | $ | 988,124 | | | | 1.56 | % | | | 8 | | | $ | 472 | | | $ | 1,737,899 | |
Risk Managed Emerging Markets Fund | | | 1,801,698 | | | | 1.52 | % | | | 25 | | | | 2,048 | | | | 4,241,250 | |
Real Strategies Fund | | | 526,228 | | | | 1.53 | % | | | 80 | | | | 2,216 | | | | 3,794,037 | |
Defensive Growth Fund | | | 2,073,127 | | | | 1.52 | % | | | 140 | | | | 14,617 | | | | 11,717,841 | |
| (a) | Number of Days Outstanding represents the total days during the year ended December 31, 2015 that each Fund utilized the Line of Credit. |
Annual Shareholder Report
48
On December 30, 2015, a special meeting of the shareholders of the Funds of the Trust was held at the offices of the Trust for the following purposes:
To elect three Trustees to serve on the Board of Trustees until the next meeting of shareholders at which Trustees are elected:
| | | | | | | | | | | | |
| | | For | | | Against | | | Abstain | |
Funds: | | | | | | | | | | | | |
Tobias Caldwell | | | 19,760,291 | | | | — | | | | 224,146 | |
Stephen P. Lachenauer | | | 19,760,291 | | | | — | | | | 224,146 | |
Donald McIntosh | | | 19,760,291 | | | | — | | | | 224,146 | |
To approve an advisory agreement between the Trust and the Advisor with regard to each Fund:
| | | | | | | | | | | | |
| | | For | | | Against | | | Abstain | |
Dividend Capture Fund | | | 9,378,596 | | | | 8,936 | | | | 54,099 | |
Risk Managed Emerging Markets Fund | | | 753,511 | | | | 3,849 | | | | 8,853 | |
Real Strategies Fund | | | 1,217,369 | | | | 3,682 | | | | 0 | |
Defensive Growth Fund | | | 1,491,483 | | | | 14,212 | | | | 12,079 | |
Strategic Allocation Fund | | | 841,021 | | | | 22,876 | | | | 10,850 | |
To approve a proposal to permit the Advisor as the investment adviser to the Funds, to hire and replace subadvisors or to modify sub advisory agreements without shareholder approval:
| | | | | | | | | | | | |
| | | For | | | Against | | | Abstain | |
Dividend Capture Fund | | | 9,304,954 | | | | 80,835 | | | | 55,842 | |
Risk Managed Emerging Markets Fund | | | 753,154 | | | | 4,561 | | | | 8,498 | |
Real Strategies Fund | | | 1,215,602 | | | | 5,449 | | | | 0 | |
Defensive Growth Fund | | | 1,478,277 | | | | 26,845 | | | | 12,652 | |
Strategic Allocation Fund | | | 806,799 | | | | 55,184 | | | | 12,764 | |
To approve a sub-advisory agreement between the Advisor and The Cambridge Strategy (Asset Management) Limited with regard to the Risk Managed Emerging Markets Fund:
| | | | | | | | | | | | |
| | | For | | | Against | | | Abstain | |
Risk Managed Emerging Markets Fund | | | 753,511 | | | | 3,566 | | | | 9,136 | |
Management of the Funds has evaluated the need for disclosure and/or adjustments resulting from subsequent events through the date these financial statements were issued. On January 12, 2016, the Trust terminated its Line of Credit agreement with Huntington. On February 12, 2016, the Huntington Dividend Capture Fund, Huntington Global Select Fund, Huntington Real Strategies Fund, Huntington Situs Fund and the Huntington Balanced Allocation Fund were renamed the Rational Dividend Capture Fund, Rational Risk Managed Emerging Markets Fund, Rational Real Strategies Fund, Rational Defensive Growth Fund, and the Rational Strategic Allocation Fund, respectively. There were no other additional items requiring adjustment of the financial statements or additional disclosure.
| (11) | Other Tax Information (Unaudited) |
For the year ended December 31, 2015, certain dividends paid by the Funds may be subject to a maximum tax rate of 15% as provided by the Jobs and Growth Tax Relief Reconciliation Act of 2003. The Funds intend to designate the maximum amount allowable as taxed at a maximum rate of 15%. Complete information will be reported in conjunction with your 2015 Form 1099-DIV.
For the year ended December 31, 2015, the following Funds paid qualified dividend income:
| | | | |
| Fund | | Qualified
Dividend
Income | |
Dividend Capture Fund | | | 45.2 | % |
Risk Managed Emerging Markets Fund | | | 34.3 | % |
Real Strategies Fund | | | 84.7 | % |
Defensive Growth Fund | | | 100.0 | % |
Strategic Allocation Fund | | | 15.2 | % |
Annual Shareholder Report
49
Notes to Financial Statements (Continued)
For the taxable year ended December 31, 2015, the following percentage of ordinary income dividends paid by the Funds qualify for the dividends received deduction available to corporations:
| | | | |
| Fund | | Dividends
Received
Deduction | |
Dividend Capture Fund | | | 49.9 | % |
Real Strategies Fund | | | 6.1 | % |
Defensive Growth Fund | | | 100.0 | % |
Strategic Allocation Fund | | | 100.0 | % |
The Funds designate the following amounts as long-term capital gains distributions. The amounts designated may not agree with long term capital gains in the tax character of distribution table due to utilization of earnings and profits distributed to shareholders on redemption of shares.
| | | | |
| Fund | | Long-Term Capital Gains Paid Amount | |
Dividend Capture Fund | | $ | 8,155,530 | |
Risk Managed Emerging Markets Fund | | | 4,796,161 | |
Defensive Growth Fund | | | 87,642,240 | |
Strategic Allocation Fund | | | 1,944,437 | |
The Risk Managed Emerging Markets Fund intends to pass through to shareholders the income tax credit for taxes paid to foreign countries. The Risk Managed Emerging Markets Fund foreign source income per share was $0.17 and the foreign tax expense per share was $0.06. The pass-through of the foreign tax credit will only affect those persons who are shareholders on the dividend record date in December 2015. These shareholders will receive more detailed information along with the 2015 Form 1099-DIV.
| (12) | Changes in Independent Auditors (Unaudited) |
On February 26, 2016, the Board of Trustees of the Trust, upon the recommendation of the Trust’s audit committee, decided to engage Cohen Fund Audit Services, Ltd. as independent auditors for the Funds’ fiscal year ending December 31, 2016. For the prior fiscal years ended December 31, 2014 and 2015, Ernst & Young LLP (“EY”) audited the Funds’ financial statements. EY’s audit reports contained no adverse opinion or disclaimer of opinion; nor were its reports qualified or modified as to uncertainty, audit scope, or accounting principles. Further, there were no disagreements between the Trust and EY on accounting principles or practices, financial statement disclosure or audit scope or procedure, which if not resolved to the satisfaction of EY would have caused it to make reference to the disagreement in its report.
Annual Shareholder Report
50
Report of Independent Registered Public Accounting Firm
The Board of Trustees and Shareholders of
The Mutual Fund and Variable Insurance Trust (formerly, the Huntington Funds):
We have audited the accompanying statements of assets and liabilities of the Rational Dividend Capture Fund (formerly, Huntington Dividend Capture Fund), Rational Risk Managed Emerging Markets Fund (formerly, Huntington Global Select Markets Fund), Rational Real Strategies Fund (formerly, Huntington Real Strategies Fund), Rational Defensive Growth Fund (formerly, Huntington Situs Fund), and Rational Strategic Allocation Fund (formerly, Huntington Balanced Allocation Fund) (five of the portfolios constituting The Mutual Fund and Variable Insurance Trust, formerly, the Huntington Funds, collectively referred to as the “Funds”), including the portfolios of investments, as of December 31, 2015 and the related statements of operations for the year then ended, the statements of changes in net assets for each of the two years in the period then ended, and the financial highlights for each of the periods indicated therein. These financial statements and financial highlights are the responsibility of the Funds’ management. Our responsibility is to express an opinion on these financial statements and financial highlights based on our audits.
We conducted our audits in accordance with the standards of the Public Company Accounting Oversight Board (United States). Those standards require that we plan and perform the audits to obtain reasonable assurance about whether the financial statements and financial highlights are free of material misstatement. We were not engaged to perform an audit of the Funds’ internal control over financial reporting. Our audits included consideration of internal control over financial reporting as a basis for designing audit procedures that are appropriate in the circumstances, but not for the purpose of expressing an opinion on the effectiveness of the Funds’ internal control over financial reporting. Accordingly, we express no such opinion. An audit also includes examining, on a test basis, evidence supporting the amounts and disclosures in the financial statements and financial highlights, assessing the accounting principles used and significant estimates made by management, and evaluating the overall financial statement presentation. Our procedures included confirmation of securities owned as of December 31, 2015, by correspondence with the custodians. We believe that our audits provide a reasonable basis for our opinion.
In our opinion, the financial statements and financial highlights referred to above present fairly, in all material respects, the financial position of each of The Mutual Fund and Variable Insurance Trust Funds referred to above at December 31, 2015, the results of their operations for the year then ended, the changes in their net assets for each of two years in the period then ended, and financial highlights for each of the periods indicated therein, in conformity with U.S. generally accepted accounting principles.

Columbus, Ohio
February 29, 2016
Annual Shareholder Report
51
Supplemental Information (Unaudited)
Shareholder Expense Examples
Fund Expenses. As a shareholder of a Fund, you incur two types of costs: (1) transaction costs, which may include sales charges (loads) on purchase payments, contingent deferred sales charges on redemptions; and (2) ongoing cost, including management fees, distribution and service fees; and other Fund expenses. These examples are intended to help you understand your ongoing costs (in dollars) of investing in the Funds and to compare these costs with the ongoing costs of investing in other mutual funds.
These examples are based on an investment of $1,000 invested at the beginning of the period and held for the entire six-month period from July 1, 2015 to December 31, 2015.
Actual Expenses. The “Actual” lines of the table provide information about actual account values and actual expenses. You may use the information on this line together with the amount you invested to estimate the expense that you paid over the period. Simply divide your account value by $1,000 (for example, an $8,600 account value divided by $1,000 = 8.60), then multiply the result by the number in the “Actual” line under the heading entitled “Expenses Paid During Period” to estimate the expenses you paid on your account during this period.
Hypothetical Example for Comparison Purposes. The “Hypothetical” lines of the table provide information about hypothetical account values and hypothetical expenses based on the Fund’s actual expense ratios and an assumed rate of return of 5% per year before expenses, which are not the Funds’ actual returns. The hypothetical account values and expenses may not be used to estimate the actual ending account balance or expenses you paid for the period. You may use this information to compare the ongoing costs of investing in the Fund and other funds. To do so, compare the 5% hypothetical examples with the 5% hypothetical examples that appear in the shareholder reports of other funds.
Please note that the expenses shown in the table are meant to highlight your ongoing costs only and do not reflect any transactional costs. Therefore, the “Actual” and “Hypothetical” lines of the table are useful in comparing ongoing costs only, and will not help you determine the relative total costs of owning different funds. In addition, if these transactional costs were included, your costs would have been higher.
| | | | | | | | | | | | | | | | | | |
| | | | | Beginning
Account
Value,
July 1, 2015 | | | Ending
Account Value,
December 31, 2015 | | | Expenses Paid During Period(a) | | | Annualized
Expense Ratio | |
Dividend Capture Fund | | | | | | | | | | | | | | | | | | |
Institutional Shares | | Actual | | $ | 1,000.00 | | | $ | 982.90 | | | $ | 4.45 | | | | 0.89 | % |
| | | Hypothetical (b) | | $ | 1,000.00 | | | $ | 1,020.72 | | | $ | 4.53 | | | | 0.89 | % |
Class A Shares | | Actual | | $ | 1,000.00 | | | $ | 981.60 | | | $ | 5.69 | | | | 1.14 | % |
| | | Hypothetical (b) | | $ | 1,000.00 | | | $ | 1,019.46 | | | $ | 5.80 | | | | 1.14 | % |
Class C Shares | | Actual | | $ | 1,000.00 | | | $ | 979.00 | | | $ | 8.18 | | | | 1.64 | % |
| | | Hypothetical (b) | | $ | 1,000.00 | | | $ | 1,016.94 | | | $ | 8.34 | | | | 1.64 | % |
Risk Managed Emerging Markets Fund | | | | | | | | | | | | | | | | |
Institutional Shares | | Actual | | $ | 1,000.00 | | | $ | 923.20 | | | $ | 4.27 | | | | 0.88 | % |
| | | Hypothetical (b) | | $ | 1,000.00 | | | $ | 1,020.77 | | | $ | 4.48 | | | | 0.88 | % |
Class A Shares | | Actual | | $ | 1,000.00 | | | $ | 921.90 | | | $ | 5.47 | | | | 1.13 | % |
| | | Hypothetical (b) | | $ | 1,000.00 | | | $ | 1,019.51 | | | $ | 5.75 | | | | 1.13 | % |
Real Strategies Fund | | | | | | | | | | | | | | | | | | |
Institutional Shares | | Actual | | $ | 1,000.00 | | | $ | 860.90 | | | $ | 5.02 | | | | 1.07 | % |
| | | Hypothetical (b) | | $ | 1,000.00 | | | $ | 1,019.81 | | | $ | 5.45 | | | | 1.07 | % |
Class A Shares | | Actual | | $ | 1,000.00 | | | $ | 865.30 | | | $ | 6.21 | | | | 1.32 | % |
| | | Hypothetical (b) | | $ | 1,000.00 | | | $ | 1,018.55 | | | $ | 6.72 | | | | 1.32 | % |
Annual Shareholder Report
52
| | | | | | | | | | | | | | | | | | |
| | | | | Beginning
Account
Value,
July 1, 2015 | | | Ending
Account Value,
December 31, 2015 | | | Expenses Paid During Period(a) | | | Annualized
Expense Ratio | |
Defensive Growth Fund | | | | | | | | | | | | | | | | |
Institutional Shares | | Actual | | $ | 1,000.00 | | | $ | 905.70 | | | $ | 5.09 | | | | 1.06 | % |
| | | Hypothetical (b) | | $ | 1,000.00 | | | $ | 1,019.86 | | | $ | 5.40 | | | | 1.06 | % |
Class A Shares | | Actual | | $ | 1,000.00 | | | $ | 903.40 | | | $ | 6.28 | | | | 1.31 | % |
| | | Hypothetical (b) | | $ | 1,000.00 | | | $ | 1,018.60 | | | $ | 6.67 | | | | 1.31 | % |
Class C Shares | | Actual | | $ | 1,000.00 | | | $ | 901.60 | | | $ | 8.68 | | | | 1.81 | % |
| | | Hypothetical (b) | | $ | 1,000.00 | | | $ | 1,016.08 | | | $ | 9.20 | | | | 1.81 | % |
Strategic Allocation Fund | | | | | | | | | | | | | | | | |
Class A Shares | | Actual | | $ | 1,000.00 | | | $ | 981.45 | | | $ | 3.50 | | | | 0.70 | % |
| | | Hypothetical (b) | | $ | 1,000.00 | | | $ | 1,021.68 | | | $ | 3.57 | | | | 0.70 | % |
| (1) | Expenses are equal to the Fund’s annualized expense ratios, multiplied by the average account value over the period, multiplied by 184/365 (to reflect the one-half year period). The annualized expense ratios reflect reimbursement of expenses by the Funds’ Adviser for the period beginning July 1, 2015 through December 31, 2015. The “Financial Highlights” tables in the Funds’ financial statements, included in the report, also show the gross expense ratios, without such reimbursements. |
| (2) | Hypothetical assumes 5% annual return before expenses. |
Annual Shareholder Report
53
Board of Trustees and Trust Officers (Unaudited)
The following tables provide information about Board of Trustees and the senior officers of the Trust. Each of the Trustees is deemed to be an Independent Trustee of the Trust. Each Trustee oversees all portfolios of the Trust and serves for an indefinite term (subject to mandatory retirement provisions). Information about each Trustee is provided below and includes each person’s: name, address, age (as of the date of the Funds’ most recent fiscal year end), present position(s) held with the Trust, principal occupations for the past five years. Unless otherwise noted, each officer is elected annually by the Board. Each Trustee and officer also serves in the same capacity for Strategy Shares, another open-end investment company whose series are managed by the Advisor. Collectively, The Rational Funds and Strategy Shares comprise the “Fund Complex” which is comprised of 9 separate series.
As of December 31, 2015, the Trustees and Officers as a group owned less than 1% of the shares of each Fund.
Independent Trustees Background
| | | | | | | | | | |
| Name, Address and Age | | Position with
the Trust | | Term of Office
and Length of
Time Served* | | Principal
Occupation(s)
During Past 5 Years | | Number of
Portfolios in
Fund Complex
Overseen by
Trustee | | Other Directorships
Held by Trustee |
Tobias Caldwell 36 N. New York Avenue Huntington, NY 11743 48 | | Chairman of the Board and Trustee | | Since January 2016 | | Managing member, Bear Properties, LLC (2006 – present) (real estate firm); Managing member, PTL Real Estate, LLC (2000 – present) (real estate/investment firm); Managing member, Genovese Family Enterprises, LLC (1999 – present) (real estate firm). | | 9 | | Lead independent trustee and Chair of Audit Committee, Strategy Shares (January 2016 – present). Lead independent trustee and Chair of Audit Committee, Mutual Fund Series Trust, 45 funds (2006 – present). |
Stephen P. Lachenauer 36 N. New York Avenue Huntington, NY 11743 48 | | Trustee | | Since January 2016 | | Attorney, private practice. | | 9 | | Board Member, Strategy Shares (January 2016 – present); Trustee, TCG Financial Series Trusts I-X, 10 funds (2015 – present). |
Donald McIntosh 36 N. New York Avenue Huntington, NY 11743 47 | | Trustee | | Since January 2016 | | Credit risk review analyst, Santander Holdings USA (May 2015 – present); Governance analyst, Santander Bank (2011 – April 2015). | | 9 | | Board Member, Strategy Shares (January 2016 – present); Trustee, TCG Financial Series Trusts I-X, 10 funds (2015 – present). |
| * | The term of office of each Trustee is indefinite. |
Annual Shareholder Report
54
Officers*
| | |
Name Age Positions Held with Trust Address Date Service Began with The Trust | | Principal Occupation(s) and Previous Position(s) |
Lisa K. Householder Age: 50 PRESIDENT and CHIEF EXECUTIVE OFFICER 37 West Broad Street Columbus, OH 43215 Began Serving: December 2015 | | Principal Occupation(s): Assistant Vice President, Relationship Management, Ultimus Fund Solutions, LLC (“Ultimus”) (December 2015 to present); President and Chief Executive Officer, Strategy Shares (December 2015 to present). Previous Position(s): Vice President, Relationship Management, Huntington Asset Services, Inc. (n/k/a Ultimus Asset Services, LLC) (January 2015 to December 2015); Senior Vice President, Client Executive, Citi Fund Services (2007 to 2014). |
Martin R. Dean Age: 52 ANTI-MONEY LAUNDERING OFFICER AND CHIEF COMPLIANCE OFFICER 37 West Broad Street Columbus, OH 43215 Began Serving: July 2013 | | Principal Occupation(s): Vice President and Director of Fund Compliance, Ultimus Fund Solutions, LLC (“Ultimus”) (December 2015 to present); Anti-Money Laundering Officer and Chief Compliance Officer, Strategy Shares (July 2013 to present); Assistant Chief Compliance Officer, Ultimus Managers Trust (January 2016 to present); Assistant Chief Compliance Officer, Unified Series Trust (January 2016 to present). Previous Position(s): Senior Vice President and Compliance Manager, Huntington Asset Services, Inc. (n/k/a Ultimus Asset Services, LLC) (July 2013 to December 2015); Director and Fund Accounting and Fund Administration Product Manager, Citi Fund Services (2008 to June 2013) |
Bryan W. Ashmus Age: 43 TREASURER 37 West Broad Street Columbus, OH 43215 Began Serving: November 2013 | | Principal Occupation(s): Vice President and Director of Financial Administration, Ultimus Fund Solutions, LLC (“Ultimus”) (December 2015 to present); Principal Financial Officer and Treasurer, Valued Advisers Trust (December 2013 to present); Treasurer, Strategy Shares (November 2013 to present). Previous Position(s): Vice President and Manager of Financial Administration, Huntington Asset Services, Inc. (n/k/a Ultimus Asset Services, LLC) (September 2013 to December 2015); Vice President, Fund Administration, Citi Fund Services (May 2005 to September 2013). |
Tiffany R. Franklin Age: 40 SECRETARY 2960 N. Meridian Street, Suite 300 Indianapolis, IN 46208 Began Serving: December 2015 | | Principal Occupation(s): Senior Paralegal, Ultimus Fund Solutions, LLC (“Ultimus”) (December 2015 to present); Secretary, Huntington Strategy Shares (December 2015 to present); Secretary, Capitol Series Trust (December 2015 to present). Previous Position(s): Paralegal, Huntington Asset Services, Inc. (n/k/a Ultimus Asset Services, LLC) (April 2012 to December 2015); Assistant Secretary, The Huntington Funds, (November 2012 to December 2015); Assistant Secretary, Strategy Shares (November 2012 to December 2015); Assistant Secretary, Capitol Series Trust (September 2013 to December 2015); Florida Registered Paralegal, Anton Legal Group (February 2007 to June 2011). |
Jennifer A. Bailey Age: 47 ASSISTANT SECRETARY 36 N. New York Avenue Huntington, NY 11743 Began Serving: December 2015 | | Principal Occupation: Director of Legal Services, MFund Services LLC (2012 to present). Previous Position(s): Attorney, Weiss & Associates (December 2008 to June 2010). |
| * | Officers do not receive any compensation from the Trust. |
Annual Shareholder Report
55
BOARD OF TRUSTEES’ CONSIDERATION OF INVESTMENT ADVISORY AGREEMENT FOR THE HUNTINGTON FUNDS (the “Funds”) AND SUB-ADVISORY AGREEMENT FOR THE HUNTINGTON GLOBAL SELECT MARKETS FUND (the “Global Select Markets Fund”) (Unaudited)
MEETING OF AUGUST 20, 2015
The Board of Trustees (the “Board”) is responsible for determining whether to approve the Funds’ investment advisory agreements. At a meeting held on August 20, 2015, the Board unanimously approved the investment advisory agreements (the “Advisory Agreements”) between Huntington Asset Advisors, Inc. (the “Advisor”) and the Funds. Pursuant to the Advisory Agreements between the Advisor and the Funds, the Advisor provides advisory services to the Funds.
During the review process, the Board received assistance and advice from, and met separately with, independent legal counsel. In approving each of the Advisory Agreements, the Board, including a majority of the independent Trustees, considered many factors, the most significant of which were: (1) the nature of the services provided to the Funds by the Advisor in relation to the advisory fees; (2) the individual performance of the Funds; (3) the Advisor’s costs and the profits realized through providing the Funds with advisory services; (4) whether the Advisor has realized or may realize economies of scale in providing services to the Funds and, if so, whether these economies are shared with the Funds; and (5) a comparison of the fees and performance of comparable funds.
Nature, Extent and Quality of Services in Relation to the Advisory Fees. In considering the nature, extent and quality of the services provided by the Advisor, the Board reviewed information relating to the Advisor’s operations and personnel. Among other things, the Advisor provided descriptions of its organizational and management structure, biographical information on its supervisory and portfolio management staff on a fund-by-fund basis, and financial information. The Trustees also took into account the financial condition of the Advisor with respect to its ability to provide the services required under the Advisory Agreements. The Board determined that the nature, extent and quality of the services provided by the Advisor, in relation to the advisory fees, were acceptable.
Individual Performance of the Funds. The Board reviewed the Funds’ short-term and long-term performance records and the Advisor’s management styles in relation to comparable funds and appropriate benchmarks. The Board noted that it reviews detailed information about the Funds’ performance on a quarterly basis. The Board also reviewed various comparative data for each of the Funds provided to them in connection with their consideration of the renewal of the Advisory Agreements, including, among other information, each Fund’s performance compared to similar funds based on Lipper peer group information provided by Strategic Insight, Inc. for the one-, three-, five and ten-year periods, as applicable, ending May 31, 2015, as well as each Fund’s performance compared to its benchmark index for the one-, three-, five-, and ten-year periods, as applicable, ending May 31, 2015.
Advisor’s Costs and the Profits Realized Through Providing the Funds With Advisory Services. In considering the reasonableness of the advisory fees, the Board reviewed information provided by the Advisor setting forth all revenues and other benefits, both direct and indirect, received by the Advisor and its affiliates attributable to managing each of the Funds individually, the cost of providing such services and the resulting profitability to the Advisor and its affiliates from these relationships. The Trustees determined that the profitability of the Advisor was acceptable in relation to the nature and quality of services provided to the Funds. The Board took into consideration the Advisor’s agreement with the Trust with respect to the Huntington Balanced Allocation Fund, Huntington Dividend Capture Fund, Huntington Real Strategies Fund and Huntington Situs Fund, whereby the Advisor agreed to waive all or a portion of its advisory fee in order to limit each Fund’s total annual fund operating expenses through April 30, 2016. The Board also
Annual Shareholder Report
56
considered the Advisor’s agreement with the Trust with respect to the Huntington Global Select Markets Fund, whereby the Advisor agreed to waive all or a portion of its advisory fee in order to limit the Fund’s total annual fund operating expenses through April 30, 2017.
Economies of Scale in Providing Services to the Funds and Whether These Economies Are Shared With the Funds. The Board also considered the effect of the Funds’ growth and size on their performance and fees. The Board noted that, with the exception of the Balanced Allocation Fund, all of the Funds’ Advisory Agreements reflect the implementation of investment advisory fee breakpoints for the Funds. The Board further noted that the administration fee charged to all Funds included fee breakpoints, which allowed the Funds to realize economies of scale as the assets of the Funds increased over time.
Comparison of the Fees and Performance of Comparable Funds. With respect to the Funds’ performance and fees, the Board considered comparisons to other mutual funds with comparable investment programs to be particularly useful, given the high degree of competition in the mutual fund business. The Board used Lipper peer group information provided by Strategic Insight, Inc. with respect to its comparable fee and performance analysis for the Funds. The Board considered that the data for the fee and performance analysis was generated on an aggregate portfolio level since not all Funds offer the same types of share classes. The Board noted that the Advisor does not provide services to other accounts. The Board also considered updated fee and expense information from management which reflected the impact of certain waivers and reimbursements.
Other Considerations. The Board also requests and receives substantial and detailed information about the Funds and the Advisor on a regular basis. The Advisor provides much of this information at each regular meeting of the Board and furnishes additional reports in connection with the Board’s formal review of the Advisory Agreements. The Board may also receive information between regular meetings relating to particular matters as the need arises. The Board’s evaluation of the Advisory Agreements is informed by reports covering such matters as: the Advisor’s investment philosophy, personnel, and processes; operating strategies; the Funds’ short- and long term performance (in absolute terms, both on a gross basis and net of expenses, as well as in relationship to its particular investment program and certain competitive funds and/or other benchmarks, as appropriate) and comments on reasons for performance. The Board also considered reports concerning the Funds’ expenses (including the advisory fee itself and the overall expense structure of the Funds, both in absolute terms and relative to similar and/or competing funds, with due regard for contractual or voluntary expense limitations); the use and allocation of brokerage commissions derived from trading the Funds’ portfolio securities; the nature and extent of the advisory and other services provided to the Funds by the Advisor and its affiliates; compliance and audit reports concerning the Funds (including communications from regulatory agencies), as well as the Advisor’s responses to any issues raised therein; and relevant developments in the mutual fund industry and how the Funds and the Advisor are responding to them. In the course of their deliberations regarding the Advisory Agreements, the Board also evaluated, among other things, the Advisor’s ability to supervise each of the Fund’s other service providers and its compliance program.
The Board based its decision to approve the Advisory Agreements on the totality of the circumstances and relevant factors and with a view to past and future long-term considerations. Not all of the factors and considerations identified above are relevant to each of the Funds, nor does the Board consider any one of them to be determinative. With respect to the factors that are relevant, the Board’s decision to approve the
Annual Shareholder Report
57
BOARD OF TRUSTEES’ CONSIDERATION OF INVESTMENT ADVISORY AGREEMENT FOR THE HUNTINGTON FUNDS (the “Funds”) AND SUB-ADVISORY AGREEMENT FOR THE HUNTINGTON GLOBAL SELECT MARKETS FUND (the “Global Select Markets Fund”) (Unaudited) (Continued)
Advisory Agreements reflects its determination that the Advisor’s performance and actions provide an acceptable basis to support the decision to continue the existing arrangements.
While attention was given to all information furnished, the following discusses the primary factors relevant to the Board’s decisions. In each case, the Board concluded that the Funds’ performance was acceptable and expenses were reasonable in light of the quality and nature of services provided by the Advisor and its affiliates.
Huntington Dividend Capture Fund
Among other data considered, the Board noted that the Fund underperformed the median and average of its Lipper peer group for the one-, three- and ten-year periods ended May 31, 2015, and was equal to the median and underperformed the average of its Lipper peer group for the five-year period ended May 31, 2015. The Board also noted that the Fund underperformed its benchmark index for the one-, three-, five- and ten-year periods ended May 31, 2015. The Board also considered the Fund’s advisory fee and total expenses, which included the administrative fee. The Board took into consideration the Advisor’s agreement to waive all or a portion of its advisory fee and/or reimburse operating expenses of the Fund, and noted that the Fund’s combined advisory/administrative fee were above the average and median of its Lipper peer group. The Board also noted that total net expenses were below the average and median of its Lipper peer group. The Board took into account the Advisor’s discussion of the Fund’s performance, including the impact of market conditions on the Fund’s performance, management’s plans with respect to the Fund, and management’s continued close monitoring of the Fund’s performance.
Huntington Global Select Markets Fund
Among other data considered, the Board noted that the Fund outperformed the average and median of its Lipper peer group for the one-, three- and five-year periods ended May 31, 2015. The Board noted that the Fund outperformed its benchmark index for the one-, three- and five-year periods ended May 31, 2015. The Board also considered the Fund’s advisory fee and total expenses, which included the administrative fee. The Board took into consideration the Advisor’s agreement to waive all or a portion of its advisory fee and/or reimburse operating expenses of the Fund and noted that the Fund’s combined advisory/administrative fee was below the average and above the median of its Lipper peer group. The Board noted that total net expenses were above the average and median of its Lipper peer group.
Huntington Real Strategies Fund
Among other data considered, the Board noted that the Fund underperformed the average and median of its Lipper peer group for the one- and three-year periods ended May 31, 2015, and outperformed the average and was equal to the median of its Lipper peer group for the five- year period ended May 31, 2015. The Board also noted that the Fund outperformed its benchmark index for the one-, three- and five-year periods ended May 31, 2015. The Board also considered the Fund’s advisory fee and total expenses, which included the administrative fee. The Board took into consideration the Advisor’s agreement to waive all or a portion of its advisory fee and/or reimburse operating expenses of the Fund and noted that the Fund’s combined advisory/administrative fee was below the average and at the median of its Lipper peer group. The Board noted that the Fund’s total net expenses were below the average and median of its Lipper peer group. The Board took into account the Advisor’s discussion of the Fund’s performance, including the impact of market conditions on the Fund’s performance, management’s plans with respect to the Fund, and management’s continued close monitoring of the Fund’s performance.
Annual Shareholder Report
58
Huntington Situs Fund
Among other data considered, the Board noted that the Fund underperformed the average and median of its Lipper peer group for the one-, three- and five-year periods ended May 31, 2015, and outperformed the average and median of its Lipper peer group for the ten-year period ended May 31, 2015. The Board also noted that the Fund underperformed its benchmark index for the one-, three-, five- and ten-year periods ended May 31, 2015. The Board also considered the Fund’s advisory fee and total expenses, which included the administrative fee. The Board took into consideration the Advisor’s agreement to waive all or a portion of its advisory fee and/or reimburse operating expenses of the Fund and noted that the Fund’s combined advisory/administrative fee and total net expenses were each above the average and median of the Lipper peer group. The Board took into account the Advisor’s discussion of the Fund’s performance, including the impact of market conditions on the Fund’s performance, management’s plans with respect to the Fund, and management’s continued close monitoring of the Fund’s performance.
Huntington Balanced Allocation Fund
Among other data considered, the Board noted that the Fund underperformed the average and median of its Lipper peer group for the one-, three- and five-year periods ended May 31, 2015. The Board also noted that the Fund underperformed its benchmark index for the one-, three- and five-year periods ended May 31, 2015. The Board also considered the Fund’s advisory fee and total expenses, which included the administrative fee. The Board took into consideration the Advisor’s agreement to waive all or a portion of its advisory fee and/or reimburse operating expenses of the Fund and noted that the Fund’s combined advisory/administrative fee was below the average and median of its Lipper peer group. The Board noted that total net expenses were below the average and above the median of its Lipper peer group. The Board took into account the Advisor’s discussion of the Fund’s performance, including the impact of market conditions on the Fund’s performance, management’s plans with respect to the Fund, and management’s continued close monitoring of the Fund’s performance.
MEETING OF OCTOBER 27, 2015
The Board of Trustees is responsible for determining whether to approve the Funds’ investment advisory agreements. The Board met on several occasions and considered that, as a result of a proposed change of control transaction, Rational Capital, LLC (“Rational Capital”), an affiliate of Catalyst Capital Advisors, LLC (“Catalyst”), would acquire the outstanding shares of Huntington Asset Advisors, Inc. (“HAA”), the current Advisor to the Funds, and HAA would be renamed Rational Advisors, Inc. (“Rational Advisors”). At a meeting held on October 27, 2015, the Board, including a majority of the Trustees who are not interested persons as defined in Section 2(a)(19) of the Investment Company Act of 1940, unanimously approved, and recommended for shareholder approval, the investment advisory agreement (the “Advisory Agreement”) between Rational Advisors and the Funds. Pursuant to the Advisory Agreement between Rational Advisors and the Funds, Rational Advisors would provide advisory services to the Funds.
The Board of Trustees is also responsible for determining whether to approve the Funds’ investment sub-advisory agreements. The Board met on several occasions regarding the proposed sub-advisory relationship with The Cambridge Strategy Ltd. (“Cambridge”) on behalf of the Global Select Markets Fund and, at a meeting held on October 27, 2015, the Board, including a majority of the Trustees who are not interested persons as defined in Section 2(a)(19) of the Investment Company Act of 1940, unanimously approved, and recommended for shareholder approval, the investment sub-advisory agreement
Annual Shareholder Report
59
BOARD OF TRUSTEES’ CONSIDERATION OF INVESTMENT ADVISORY AGREEMENT FOR THE HUNTINGTON FUNDS (the “Funds”) AND SUB-ADVISORY AGREEMENT FOR THE HUNTINGTON GLOBAL SELECT MARKETS FUND (the “Global Select Markets Fund”) (Unaudited) (Continued)
(the “Sub-Advisory Agreement”) between Rational Advisors and Cambridge on behalf of the Global Select Markets Fund. Pursuant to the Sub-Advisory Agreement, Cambridge would provide sub-advisory services to the Global Select Markets Fund.
During the review process for the approvals of the Advisory Agreement and Sub-Advisory Agreement, the Board received assistance and advice from, and met separately with, independent legal counsel. The Trustees also had the benefit of several presentations made by management personnel of Rational Advisors and Cambridge, during which a number of topics, including each firm’s investment process, investment strategies, diversification, assets under management, personnel and resources, compliance policies, procedures and systems, and risk management were reviewed and discussed. Catalyst’s and the firm’s personnel’s overall performance were also reviewed and discussed. In approving the Advisory Agreement and Sub-Advisory Agreement, the Board, including a majority of the independent Trustees, considered many factors, among the most significant of which are: (1) the nature, extent and quality of services to be provided by Rational Advisors and Cambridge, respectively; (2) the investment performance of funds managed by an affiliate of Rational Advisors and Cambridge; (3) the cost of services to be provided and the profits to be realized by Rational Advisors (and its affiliates) and Cambridge (and its affiliates) from their respective relationships with the Funds; (4) any economies of scale that would be realized due to Fund growth; (5) whether proposed fee levels reflect such possible economies of scale for the benefit of investors; and (6) comparisons of services to be rendered to and fees to be paid by the Funds with the services provided to and the fees paid by other clients of Rational Advisors’ portfolio management team and Catalyst.
ADVISORY AGREEMENT
In considering the nature, extent and quality of the services provided by Rational Advisors, the Board reviewed information relating to Rational Advisors’ and Catalyst’s operations and personnel. Among other things, Rational Advisors provided information regarding its proposed services, compliance policies, procedures and systems, organizational and management structure, biographical information of its supervisory and portfolio management staff on a fund-by-fund basis, risk management and financial information. Rational Advisors also provided information regarding resources that would be provided to Rational Advisors by Catalyst. The Trustees also took into account the financial condition of Rational Advisors, its parent company, Rational Capital, and Catalyst, with respect to its ability to provide the services required under the Advisory Agreement. The Board determined that the nature, extent and quality of the services provided by Rational Advisors in relation to the advisory fees were expected to be acceptable.
The Trustees noted that the prior performance of other registered funds managed by members of the Rational Advisors’ portfolio management team was considered satisfactory when compared to the performance of their respective peer groups and relevant indexes. The Board believes that the Funds’ shareholders can benefit from the management of the Funds’ assets by Rational Advisors. The Board reviewed the Funds’ historical performance record, and Rational Advisors’ and Catalyst’s management styles in relation to other funds managed by the Rational Advisors portfolio managers and appropriate benchmarks. The Board also reviewed various comparative data for each of the Funds provided to them in connection with their consideration of the renewal of the Advisory Agreement, including, among other information, each Fund’s performance compared to similar funds based on Lipper peer group information provided by Strategic Insight Inc. (“Strategic Insight”) for the one-, three-, five- and ten-year periods ending July 31, 2015, as applicable, as well as each Fund’s performance compared to its benchmark index for the one-, three-, five-, and ten-year periods ending July 31, 2015, as applicable.
Annual Shareholder Report
60
In considering the reasonableness of the advisory fees, the Board considered information provided by Rational Advisors setting forth all expected revenues and other benefits, both direct and indirect, received by Rational Advisors and its affiliates attributable to managing each of the Funds individually, the cost of providing such services and the resulting expected profitability to Rational Advisors and its affiliates from these relationships. The Board took into account that the advisory fee for the Funds under the Advisory Agreement with Rational Advisors would be identical to the existing advisory fees pursuant to the Advisory Agreement in place between the Funds and HAA.
The Board also took into account Rational Advisors’ agreement to limit the total direct net annual operating expenses of the Dividend Capture Fund and Situs Fund to not more than 1.00%, 1.25% and 1.75% of the Institutional Shares, Class A Shares and Class C Shares daily net assets of each Fund, respectively, through April 30, 2017. The Board also took into account Rational Advisors’ agreement to limit the total direct net annual operating expenses of the Global Select Markets Fund to 1.25% and 1.50% of the Institutional Shares and Class A Shares daily net assets, respectively, and, with respect to the Real Strategies Fund, to not more than 1.00% and 1.25% of the Institutional Shares and Class A Shares daily net assets of each Fund, respectively, through April 30, 2017. The Board also took into account Rational Advisors’ agreement to limit the total direct net annual operating expenses of the Balanced Allocation Fund to not more than 0.70% of the Class A Shares daily net assets through April 30, 2017. In addition, the Board noted that the total direct net annual operating expenses after waivers was higher than the total direct net annual operating expenses after waivers currently in effect for the Funds, with the exception of the Balanced Allocation Fund which remained the same. The Trustees noted that the advisory fees under the Advisory Agreement were consistent with the advisory fees charged to the other funds managed by Rational/Catalyst. The Board noted that certain service provider fees were expected to decrease as a result of the renegotiation of service provider arrangements in connection with the change of control transaction. The Trustees determined that the expected profitability of Rational Advisors was acceptable in relation to the nature and quality of services provided to the Funds.
The Board also considered the effect of the Funds’ growth and size on their performance and fees. The Board considered the fees under the Advisory Agreement for each Fund and possible economies of scale that may be realized as the assets of the Funds grow. The Board noted that none of the Funds was currently large enough to have realized economies of scale. However, the Board noted that the administrative fee charged to the Funds included fee breakpoints, which allowed the Funds to realize economies of scale as the assets of the Funds increased over time.
With respect to the Funds’ performance and fees, the Board considered comparisons to other mutual funds to be particularly useful, given the high degree of competition in the mutual fund business. The Board used Lipper peer group information provided by Strategic Insight with respect to its comparable fee and performance analysis for the Funds. The data for the fee and performance analysis was generated on an aggregate portfolio level since not all Funds offer the same types of share classes. The Board also took into account pro forma fee and expense information presented by Rational Advisors with respect to the change in various fees and expenses as a result of the Advisory Agreement.
With respect to its consideration of Rational Advisors’ and Catalyst’s compliance program, policies and systems and risk management, the Board considered information provided by Rational Advisors and discussed these matters with Rational Advisors management personnel.
Annual Shareholder Report
61
BOARD OF TRUSTEES’ CONSIDERATION OF INVESTMENT ADVISORY AGREEMENT FOR THE HUNTINGTON FUNDS (the “Funds”) AND SUB-ADVISORY AGREEMENT FOR THE HUNTINGTON GLOBAL SELECT MARKETS FUND (the “Global Select Markets Fund”) (Unaudited) (Continued)
In the course of their deliberations regarding the Advisory Agreement, the Board also evaluated, among other things, Rational Advisors’ ability to supervise each of the Fund’s other service providers, their ability to supervise sub-advisors and their compliance programs. The Board also considered the Rational Advisors’ plans for the Funds, including its plans to expand distribution capabilities. The Board considered Rational Advisors’ management’s success in growing the assets of Catalyst-affiliated funds. The Board also considered that Catalyst would provide resources to Rational Advisors in connection with the services provided to the Funds.
SUB-ADVISORY AGREEMENT
In considering the nature, extent and quality of the services provided by Cambridge, the Board reviewed information concerning a number of topics, including, among other things, its investment philosophy, resources, operations and compliance structure. The Board noted that Cambridge would provide portfolio management in compliance with the Fund’s investment policies and procedures and applicable securities laws. The Board reviewed biographical information for each portfolio manager of Cambridge who would be providing services under the Sub-Advisory Agreement and noted the experience of the team. In considering the approval of the Sub-Advisory Agreement, the Trustees considered Cambridge’s investment management process, including (a) the experience, expertise, resources and capability of Cambridge’s management and other personnel committed by Cambridge to the Global Select Markets Fund; (b) the quality and commitment of Cambridge’s regulatory and legal compliance policies, procedures and systems and the Advisor’s comfort with such policies and procedures; and (c) Cambridge’s brokerage and trading practices. The Trustees also took into account the financial condition of Cambridge and its affiliates, with respect to its ability to provide the services required under the Sub-Advisory Agreement. The Board determined that the nature, extent and quality of the services provided in relation to the sub-advisory fees were expected to be acceptable.
The Board took into account that, under the Sub-Advisory Agreement, the rate of the investment sub-advisory fee that would be paid by the Advisor (and not the Fund) would be consisting of a monthly fee computed at the rate of 50% of the net advisory fee based upon the net asset value of the Global Select Markets Fund. The Board also noted that the advisory fee paid by the Global Select Markets Fund under the Advisory Agreement would not change due to the Sub-Advisory Agreement. The Board also noted that the Advisor negotiated the sub-advisory fee with Cambridge at arm’s length. For these reasons, the profitability to Cambridge of its relationship with the Global Select Markets Fund was not a material factor in the Board’s deliberations at this time. For similar reasons, the Board did not consider the potential economies of scale in Cambridge’s management of the Fund to be a material factor in its consideration at this time.
The Board also took into account the performance of accounts with a similar strategy as the Global Select Markets Fund managed by Cambridge. The Trustees noted that the prior performance of other registered funds managed by members of the Cambridge portfolio management team was considered satisfactory when compared to the performance of their respective peer groups and relevant indexes. The Board believes that the Funds’ shareholders can benefit from management of the Funds’ assets by Cambridge which has demonstrated consistent performance for its global emerging markets equities strategy. The Trustees noted that the strategy had outperformed the index since its inception in 2009.
The Board also took into account the fact that there are no other tangible benefits to Cambridge in providing investment advisory services to the Fund, other than the fee to be earned under the Sub-Advisory
Annual Shareholder Report
62
Agreement. The Board considered that there may be certain intangible benefits gained to the extent that managing the Fund could enhance Cambridge’s reputation in the marketplace, and, therefore, would enable Cambridge to attract additional client relationships.
The Board reached the following conclusions regarding the Advisory Agreement with respect to each of the Funds and the Sub-Advisory Agreement, with respect to the Global Select Markets Fund, among others: (a) the Advisor possesses the capability and resources to perform the duties required of it under the proposed Advisory Agreement; (b) the Sub-Advisor is qualified to manage the Global Select Markets Fund’s assets in accordance with the Fund’s investment objective and policies; (c) the Advisor and Sub-Advisor maintain appropriate compliance programs; (d) the Adviser and Sub-Advisor, as applicable, are likely to execute their investment strategies consistently over time; and (e) the advisory and sub-advisory fees are reasonable in view of the quality of services received by the Funds and Global Select Markets Fund, respectively, from the Advisor and Sub-Advisor, as applicable. Based on its conclusions, the Board determined that approval of the Advisory Agreement for the Funds and the Sub-Advisory Agreement with respect to the Global Select Markets Fund would be in the best interests of the Funds and the Global Select Markets Fund, respectively, and their shareholders. The Board based its decision to approve the Advisory Agreement and Sub-Advisory Agreement on the totality of the circumstances and relevant factors and with a view to past and future long-term considerations. In approving the Advisory Agreement and the Sub-Advisory Agreement, the Board, including the disinterested Trustees, did not identify any single factor as controlling, and each Trustee may have attributed different weight to various factors.
Annual Shareholder Report
63
A copy of the policies and procedures that the Funds use to determine how to vote proxies relating to securities held in the Funds’ portfolios, as well as a record of how the Funds voted any such proxies during the most recent 12-month period ended June 30, is available without charge and upon request by calling 800-253-0412 or at www.huntingtonfunds.com. This information is also available from the EDGAR database on the SEC’s website at www.sec.gov.
The Funds file with the SEC a complete schedule of their portfolio holdings, as of the close of the first and third quarters of their fiscal year, on “Form N-Q.” These filings are available on the SEC’s website at www.sec.gov and may be reviewed and copied at the SEC’s Public Reference Room in Washington, DC. (call 202-551-8090 for information on the operation of the Public Reference Room.) You may also access this information at www.huntingtonfunds.com by selecting “Form N-Q.”
The Huntington National Bank, a subsidiary of Huntington Bancshares, Inc., is the Custodian of The Funds. Ultimus Asset Services, LLC serves as the Administrator, Transfer Agent and Fund Accountant. Additionally, Brown Brothers Harriman & Co. is the Sub-Custodian of certain of the Funds. Rational Advisors, Inc., serves as Investment Advisor to the Funds. Unified Financial Securities, LLC serves as the Distributor of The Funds.
This report is authorized for distribution to prospective investors only when preceded or accompanied by a prospectus which contains facts concerning the Funds’ objectives and policies, management fees, expenses and other information.
The S&P 500 Index®, S&P GSCI®, S&P SmallCap 600 Index®, S&P MidCap 400 Index® and S&P 1500 Index® are products of S&P Dow Jones Indices LLX (“SPDJI”), and have been licensed for use by the Advisor Standard and Poor’s® and S&P® are registered trademarks of Standard and Poor’s Financial Services LLC (“S&P”); Dow Jones® is a registered trademark of Dow Jones Trademark Holdings LLC (“Dow Jones”). The Funds are not sponsored, endorsed, sold or promoted by SPDJI, Dow Jones, S&P, their respective affiliates and none of such parties make any representations regarding the advisability of investing in the Funds nor do they have any liability for any errors, omissions, or interruptions of the S&P 500 Index®, S&P GSCI®, S&P SmallCap 600 Index®, S&P MidCap 400 Index® and S&P 1500 Index®.
| | |
| Shareholder Services: 800-253-0412 | | 27057 12/15 |
Huntington Shareholder Services: 800-253-0412 27057 12/15

Annual Shareholder Report
DECEMBER 31, 2015
Catalyst Dividend Capture VA Fund (formerly Huntington VA Dividend Capture Fund)
Catalyst Insider Buying VA Fund (formerly Huntington VA Situs Fund)
Catalyst Dividend Capture VA Fund
(formerly Huntington VA Dividend Capture Fund)
Management’s Discussion of Fund Performance
Portfolio Managers:
| | |
Kirk Mentzer, MBA Director of Fund Research | | Peter Sorrentino, CFA Senior Vice President |
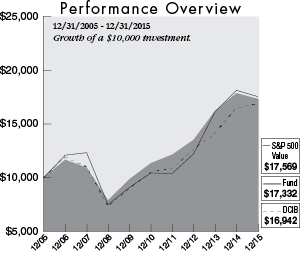
| | | | |
| | | Average Annual
Total Return for
the Period Ended
12/31/15 | |
1 Year | | | (3.06 | )% |
3 Year | | | 8.61 | % |
5 Year | | | 8.86 | % |
10 Year | | | 5.65 | % |
The above expense ratio is from the Fund’s prospectus dated April 30, 2015. Huntington Asset Advisors, Inc. (the “Advisor”) contractually agreed to waive all or a portion of its investment advisory fee (based on average daily net assets) and/or reimburse certain operating expenses of the Fund to the extent necessary in order to limit the Fund’s total annual fund operating expenses (after the fee waivers and/or expense reimbursements, and exclusive of acquired fund fees and expenses, brokerage costs, interest, taxes and dividends, and extraordinary expenses) to not more than 0.99% of the Fund’s daily net assets through December 31, 2015.
The graph above illustrates the hypothetical investment of $10,000(a) in the Catalyst Dividend Capture VA Fund from December 31, 2005 to December 31, 2015, compared to the S&P 500 Value and DCIB.
The performance information does not include the charges and expenses imposed by the insurance company separate accounts or charges and expenses under the variable insurance product contracts. The inclusion of such charges would lower performance. Please refer to the variable insurance product prospectus for a complete listing of these expenses. Additional information pertaining to the Fund’s expense ratio as of December 31, 2015 can be found in the financial highlights. For the fiscal year ended December 31, 2015, Fund shares were available only through variable annuity contracts or variable life insurance policies offered by participating insurance companies. Variable investment options are not obligations of or guaranteed by any bank and are not federally insured.
PERFORMANCE SUMMARY
For the fiscal year ended December 31, 2015, the Catalyst Dividend Capture VA Fund (the “Fund”) produced total returns (not including the deduction of applicable sales charges) of -3.06% based on net asset value. The Fund outperformed relative to the -3.15% total return of the Standard & Poor’s 500 Value Index® (the “S&P 500 Value”)(b), its benchmark, by 0.09%. The Fund underperformed relative to the 2.53% total return of the Dividend Capture Indices Blend (the “DCIB”)(c) for the same period.
RECENT FUND ACTION
With valuations at extended levels, profit weakness, sluggish global economic growth trends, and uncertain Fed action, we continued to advocate muted cyclical exposure within portfolios. Corporations in aggregate have issued a tremendous amount of debt in 2015 and corporate bond risk spreads have widened to reflect the higher risk of default as profit margins, growth, and economic growth have slowed. Continuing a theme that began last year, de-risking portfolios while maintaining allocations was the balance we struck as a theme for 2015. Sluggish global economic growth did not offer much hope of a robust rebound in activity on the horizon. Below are three recent industry changes:
| ¢ | | Leisure Products was an area that had severely underperformed over the past year. The industry is domestically focused, which dodges the currency issues negatively impacting so many other groups. Input prices were favorable and translated into improving margins. Valuation was fair, but could allow for upside surprises due to depressed earnings expectations. Quality was good as debt levels have been contained. A recession or rising input costs are the two largest negatives. We raised the group to attractive. |
| ¢ | | Banks vs REITs: While banks have been major beneficiaries of the anticipated Fed tightening, Real Estate Investment Trust (“REIT’s”) shares have conversely suffered. In the medium term, economic conditions are expected to weaken due to a stronger dollar, slower world growth and will ultimately weigh on Commercial & Industrial loan quality. Thus, the banks are put on downgrade watch. Following the Federal Reserve (the “Fed”) rate increase in December, REIT shares rebounded thanks to relief that the adjustment was made and additional Fed increases were expected to be mild. It is possible that this improving monetary environment for REIT shares could result in positive earnings and multiple expansions. |
| ¢ | | Restaurants had reasonable profit growth expectations and performance has been excellent. However, the outlook was getting less appealing. Market turmoil and weak wage growth will probably result in weaker sales trends in the future. Trade surveys already signal a trend change. Surprisingly, about half of the industry sales are international. Currency trends continue to work against multinationals, especially for those with emerging markets exposure. We moved the restaurant group from attractive to neutral. |
ATTRIBUTION HIGHLIGHTS
The Fund was managed using our top-down style and portfolio construction techniques, which are aimed at producing a high level of stable income and low volatility by investing in three distinct asset classes: common stocks, REITs, and preferred stocks.
| ¢ | | Value-style common stocks: Domestic equity market returns were range bound for much of the year as weak earnings growth and uncertainty regarding the direction of Federal Reserve monetary policy took their toll on investor confidence. Stocks as measured by the S&P 500 Value index ended the year with a -1.65% total return. The Fund was overweight common stocks for the entire period versus the DCIB unmanaged custom index. Within this class, sector allocation subtracted 45 basis points and security selection detracted 176 basis points. As a result, the common stocks in the Fund underperformed the overall market. The Fund’s common stock total return for 2015 was -3.39% compared to the S&P 500 Value Index of -1.65%. The five largest positive contributors to performance were: General Electric Company (+0.82%), McDonald’s Corporation (+0.38%), and Old Republic International Corporation (+0.37%), Coca-Cola Enterprises (+0.35%), and Halliburton Company (+0.29%). The largest detractors included: Waddell & Reed Financial (-0.87%), ConocoPhillips (-0.54%), and Tyco International PLC (-0.52%). |
C A T A L Y S T F U N D S
Catalyst Dividend Capture VA Fund
(formerly Huntington VA Dividend Capture Fund)
| ¢ | | REITs(d): Flat interest rate trends and mild inflation pressures helped propel REIT markets in 2015. However, the Fund’s REIT holdings produced a total return of -6.93%, which compared unfavorably to the benchmark S&P Supercomposite Real Estate Industry Group index total return of +5.21%. The five largest positive contributors to performance were: Camden Property Trust (+1.18%), Medical Properties Trust, Inc. (+0.77%), Realty Income Corporation (+0.60%), Kimco Realty Corporation (+0.44%), and Equity One (+0.34%). The five largest detractors were Host Hotels & Resorts (-4.08%), Lexington Realty Trust (-3.14%), Hospitality Properties Trust (-1.44%), HCP (-1.24%), and Weyerhaeuser Company (-1.02%). |
| ¢ | | Preferred Stock(e): A largely range-bound bond market and investors’ search for yield gave preferred stocks a tail wind for the year, making them the best performing asset class of the Fund. The Fund’s preferred share holdings produced a total return of 6.08% which underperformed the benchmark BofA Merrill Lynch U.S. Preferred Stock Fixed Rate Index total return of +7.39%. The five largest positive contributors to performance were: Northern Trust Corp 5.85% Non-Cumulative Perpetual Preferred (+13.1%), PS Business Parks 6.45% Preferred Shares Series S (+8.29%), Realty Income Corp 6.63% Preferred Shares Series F (+7.75%), PartnerRe Ltd 7.25% Preferred Shares Series E (+7.19%), and Axis Capital Holdings Ltd 6.88% Preferred Shares Series C (+7.04%). The five largest underperforming issues were: Aegon NV 8.00% Notes (+2.33%), Senior Housing Properties Trust 5.63% Notes (+1.79%), American Financial Group 7.00% Notes (+1.36%), Goldman Sachs Group 6.20% Series B (+0.14%), and JPMorgan Chase Capital XXIX 6.70% Capital Series CC (+0.01%). |
Performance data quoted represents past performance which is no guarantee of future results. Investment return and principal value will fluctuate so that an investor’s shares, when redeemed, may be worth more or less than their original cost. Performance for a variable investment option changes over time and current performance may be lower or higher than what is stated. For current to the most recent month end performance, contact your insurance company.
| The | composition of the Fund’s holdings is subject to change. |
| (a) | The Fund’s performance assumes the reinvestment of all dividends and distributions. The S&P 500 Value and DCIB have been adjusted to reflect reinvestment of dividends on securities in the indices. |
| (b) | The S&P 500 Value Index® is an unmanaged market-capitalization-weighted index consisting of those stocks within the S&P 500 Index® that exhibit strong value characteristics. It uses a numerical ranking system based on four value factors and three growth factors to determine the constituents and their weightings. Investments cannot be made in an index. |
| (c) | The DCIB is a custom, blended index comprised of the following three indices with their noted respective weightings: S&P 500 Value Index® (40%), Merrill Lynch Fixed Rate Preferred Index (40%) and NAREIT Index (20%). This custom, blended index and its respective weightings are reflective of the Fund’s sector diversification. Indices are unmanaged and, unlike the Fund, are not affected by cash flows. It is not possible to invest directly in an Index. |
| (d) | REIT returns represented by the NAREIT Index. The NAREIT Index represents returns for the National Association of Real Estate Investment Trust Equity Index. The Index is unmanaged and, unlike the Fund, is not affected by cash flows. It is not possible to invest directly in an Index. |
| (e) | Preferred returns represented by BofA Merrill Lynch U.S. Preferred Stock Fixed Rate Index. There are no guarantees that dividend paying stocks will continue to pay dividends. In addition, dividend paying stocks may not experience the same capital appreciation potential as non-dividend paying stocks. For a full discussion of the principal investment risks of investing in this fund, please see the Fund’s prospectus. |
Catalyst Insider Buying VA Fund
(formerly Huntington VA Situs Fund)
Management’s Discussion of Fund Performance
Portfolio Managers:
Kirk Mentzer, MBA
Director of Fund Research
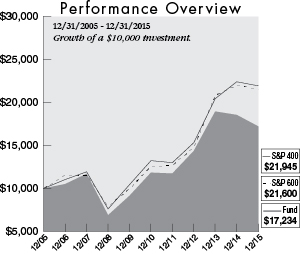
| | | | |
| | | Average Annual
Total Return for
the Period Ended
12/31/15 | |
1 Year | | | (7.17 | )% |
3 Year | | | 6.25 | % |
5 Year | | | 7.82 | % |
10 Year | | | 5.59 | % |
The above expense ratio is from the Fund’s prospectus dated April 30, 2015. Huntington Asset Advisors, Inc. (the “Advisor”) contractually agreed to waive all or a portion of its investment advisory fee (based on average daily net assets) and/or reimburse certain operating expenses of the Fund to the extent necessary in order to limit the Fund’s total annual fund operating expenses (after the fee waivers and/or expense reimbursements, and exclusive of acquired fund fees and expenses, brokerage costs, interest, taxes and dividends, and extraordinary expenses) to not more than 1.00% of the Fund’s daily net assets through December 31, 2015.
The graph above illustrates the hypothetical investment of $10,000(a) in the Catalyst Insider Buying VA Fund from December 31, 2005 to December 31, 2015, compared to the S&P 600 and the S&P 400.
The performance information does not include the charges and expenses imposed by the insurance company separate accounts or charges and expenses under the variable insurance product contracts. The inclusion of such charges would lower performance. Please refer to the variable insurance product prospectus for a complete listing of these expenses. Additional information pertaining to the Fund’s expense ratio as of December 31, 2015 can be found in the financial highlights. For the fiscal year ended December 31, 2015, Fund shares were available only through variable annuity contracts or variable life insurance policies offered by participating insurance companies. Variable investment options are not obligations of or guaranteed by any bank and are not federally insured.
| (a) | The Fund’s performance assumes the reinvestment of all dividends and distributions. The S&P 600 and S&P 400 have been adjusted to reflect reinvestment of all dividends on securities in the index. |
PERFORMANCE SUMMARY
For the fiscal year ended December 31, 2015, the Catalyst Insider Buying VA Fund (“Fund”) produced a total return (not including the deduction of applicable sales charges) of -7.17% based on net asset value. This compares to the -1.97% return of the Standard and Poor’s SmallCap 600 Index® (“S&P 600”)(b), the Fund’s benchmark and the -2.18% return of the Standard and Poor’s MidCap 400 Index® (“S&P 400”)(b), for the same period. The Fund underperformed the benchmark by 5.20%.
RECENT FUND ACTION
With valuations at extended levels, profit weakness, sluggish global economic growth trends, and uncertain Federal Reserve (the “Fed”) action, we continued to advocate muted cyclical exposure within portfolios. Corporations in aggregate issued a tremendous amount of debt in 2015 and corporate bond risk spreads have widened to reflect the higher risk of default as profit margins, growth, and economic growth have slowed. Continuing a theme that began last year, de-risking portfolios while maintaining allocations was the balance we struck as a theme for 2015. Sluggish global economic growth did not offer much hope of a robust rebound in activity on the horizon. Below are three recent industry changes:
| ¢ | | Leisure Products was an area that had severely underperformed over the past year. The industry is domestically focused, which dodges the currency issues negatively impacting so many other groups. Input prices were favorable and translated into improving margins. Valuation was fair, but could allow for upside surprises due to depressed earnings expectations. Quality was good as debt levels have been contained. A recession or rising input costs are the two largest negatives. We raised the group to attractive. |
| ¢ | | Banks vs REITs: While banks have been major beneficiaries of the anticipated Fed tightening, Real Estate Investment Trust (“REIT”) shares have conversely suffered. In the medium term, economic conditions are expected to weaken due to a stronger dollar, slower world growth, and will ultimately weigh on Commercial and Industrial loan quality. Thus, the banks were put on downgrade watch. Following the Federal Reserve rate increase in December, REIT shares rebounded thanks to relief the adjustment that was made and additional increases are expected to be mild. This improving monetary environment for REIT shares could result in positive earnings and multiple expansions. |
| ¢ | | Restaurants had reasonable profit growth expectations, and performance has been excellent. However, the outlook was getting less appealing. Market turmoil and weak wage growth will probably result in weaker sales trends in the future. Trade surveys already signal a trend change. Surprisingly, about half of the industry sales are international. Currency trends continue to work against multinationals, especially for those with emerging markets exposure. We moved the restaurant group from attractive to neutral. |
ATTRIBUTION HIGHLIGHTS
Domestic equity market returns were range bound for much of the year as weak earnings growth and uncertainty regarding the direction of Federal Reserve monetary policy took their toll on investor confidence. Stocks as ended the year with a -2.01% total return for the year as measured by the S&P 600. The Fund under performed due to sector allocation and security selection. Specifically, sector allocation detracted -0.64% and security selection subtracted -0.81%. The best relative performing sectors were Financials, Health Care, and Materials. The worst relative performing sectors were Energy, Industrials, and Utilities.
The five largest positive contributors to performance were: Tyler Technologies (+1.41%), Myriad Genetics (+1.27%), AmSurg Corp. (+0.91%), Tractor Supply Company (+0.70%), and Arch Capital Group (+0.62%). The five largest detractors were: Geospace Technologies (-2.46%), United States Lime & Minerals (-0.77%), PRA Group (0.67%), Lindsay Corporation (-0.64%), and CARBO Ceramics (-0.60%).
| The | composition of the Fund’s holdings is subject to change. |
| (b) | The S&P 600 is a capitalization-weighted index representing all major industries in the small-cap range of the U.S. stock market. The S&P 400 is a capitalization-weighted index comprised of common stocks representing all mayor industries in the mid-range of the U.S. stock market. The indices are unmanaged and, unlike the Fund, is not affected by cash flows. It is not possible to invest directly in an index. |
C A T A L Y S T F U N D S
Catalyst Insider Buying VA Fund
(formerly Huntington VA Situs Fund)
Portfolio Risk:
During the year, overall risk was lowered significantly. Average market capitalization declined from $5.1 billion to $3.1 billion. Price-to-earnings and price-to-book improved (fell) over 22% and 17%, respectively. Total- and benchmark-risk were both lowered 12.2%. Predicted tracking error fell nearly 25% to 3.47. The portfolio dividend yield was increased 37% to 1.09%. These adjustments were made to guard against increased market volatility.
Performance data quoted represents past performance which is no guarantee of future results. Investment return and principal value will fluctuate so that an investor’s shares, when redeemed, may be worth more or less than their original cost. Performance for a variable investment option changes over time and current performance may be lower or higher than what is stated. For current to the most recent month end performance, contact your insurance company.
Small company stocks may be less liquid and subject to greater price volatility than large company stocks.
Funds whose investments are concentrated in a specific industry or sector may be subject to a higher degree of market risk than funds whose investments are diversified. In addition, the Fund may be subject to specific risks of the information technology sector, such as obsolescence.
For a full discussion of the principal investment risks of investing in this fund, please see the Fund’s prospectus.
Catalyst Dividend Capture VA Fund
Portfolio of Investments Summary Table (Unaudited)
December 31, 2015
| | | | |
| Asset Allocation | | Percentage of
Fair Value | |
Financials | | | 30.8 | % |
Real Estate Investment Trusts | | | 12.6 | % |
Energy | | | 7.6 | % |
Health Care | | | 7.5 | % |
Consumer Staples | | | 7.0 | % |
Industrials | | | 5.8 | % |
Exchange-Traded Funds | | | 5.4 | % |
Information Technology | | | 4.7 | % |
Short-Term Securities Held as Collateral for Securities Lending | | | 4.6 | % |
Utilities | | | 3.9 | % |
Cash | | | 3.2 | % |
Consumer Discretionary | | | 2.8 | % |
Telecommunication Services | | | 2.4 | % |
Materials | | | 1.7 | % |
| | | | |
Total | | | 100.0 | % |
Portfolio holdings and allocations are subject to change. As of December 31, 2015, percentages in the table above are based on total investments. Such total investments may differ from the percentages set forth below in the Portfolio of Investments which are computed using the Fund’s net assets.
The Portfolio of Investments Summary Table and the Portfolio of Investments are broken down by sectors, and these sectors do not represent industry categories for purposes of identifying “industry concentration” as described in the Investment Company Act of 1940, as amended.
Portfolio of Investments
December 31, 2015
| | | | | | | | |
| Shares | | | | | Fair Value | |
| | | | | | | | |
| | | | Common Stocks — 70.3% | | | | |
| | | | Consumer Discretionary — 3.0% | |
| | 6,000 | | | General Motors Co. | | $ | 204,060 | |
| | 4,750 | | | Johnson Controls, Inc. | | | 187,578 | |
| | 2,750 | | | Polaris Industries, Inc. | | | 236,362 | |
| | 1,000 | | | Starwood Hotels & Resorts Worldwide, Inc. | | | 69,280 | |
| | | | | | | | |
| | | | | | | 697,280 | |
| | | | | | | | |
| | | | Consumer Staples — 7.3% | | | | |
| | 7,000 | | | Coca-Cola Co./The | | | 300,720 | |
| | 4,500 | | | Colgate-Palmolive Co. | | | 299,790 | |
| | 3,000 | | | Kellogg Co. | | | 216,810 | |
| | 2,000 | | | Kimberly-Clark Corp. | | | 254,600 | |
| | 2,500 | | | PepsiCo, Inc. | | | 249,800 | |
| | 1,750 | | | Philip Morris International, Inc. | | | 153,843 | |
| | 4,000 | | | Wal-Mart Stores, Inc. | | | 245,200 | |
| | | | | | | | |
| | | | | | | 1,720,763 | |
| | | | | | | | |
| | | | Energy — 8.0% | | | | |
| | 4,250 | | | Chevron Corp. | | | 382,330 | |
| | 5,500 | | | ConocoPhillips | | | 256,795 | |
| | 8,500 | | | Exxon Mobil Corp. | | | 662,575 | |
| | 2,500 | | | Helmerich & Payne, Inc. (a) | | | 133,875 | |
| | 2,950 | | | Murphy Oil Corp. | | | 66,228 | |
| | 15,000 | | | Noble Corp. PLC (a) | | | 158,250 | |
| | 3,250 | | | Occidental Petroleum Corp. | | | 219,732 | |
| | | | | | | | |
| | | | | | | 1,879,785 | |
| | | | | | | | |
| | | | Financials — 16.4% | | | | |
| | 40,000 | | | Apollo Investment Corp. (b) | | | 208,800 | |
| | 17,500 | | | Ares Capital Corp. (b) | | | 249,375 | |
| | | | | | | | |
| Shares | | | | | Fair Value | |
| | | | | | | | |
| | | | Financials — (continued) | | | | |
| | 5,250 | | | Bank of Nova Scotia/The | | $ | 212,310 | |
| | 2,000 | | | Cullen/Frost Bankers, Inc. | | | 120,000 | |
| | 7,500 | | | Eaton Vance Corp.(a) | | | 243,225 | |
| | 7,000 | | | Fifth Third Bancorp | | | 140,700 | |
| | 5,750 | | | JPMorgan Chase & Co. | | | 379,672 | |
| | 23,500 | | | KeyCorp | | | 309,965 | |
| | 14,000 | | | Old Republic International Corp. | | | 260,820 | |
| | 2,500 | | | PNC Financial Services Group, Inc./The | | | 238,275 | |
| | 145 | | | RMR Group, Inc./The, Class A * | | | 2,093 | |
| | 4,500 | | | Royal Bank of Canada | | | 241,110 | |
| | 3,750 | | | SunTrust Banks, Inc. | | | 160,650 | |
| | 1,000 | | | Travelers Cos., Inc./The | | | 112,860 | |
| | 6,500 | | | U.S. Bancorp | | | 277,355 | |
| | 6,250 | | | Umpqua Holdings Corp. | | | 99,375 | |
| | 7,250 | | | Waddell & Reed Financial, Inc., Class A | | | 207,785 | |
| | 7,500 | | | Wells Fargo & Co. | | | 407,700 | |
| | | | | | | | |
| | | | | | | 3,872,070 | |
| | | | | | | | |
| | | | Health Care — 7.8% | | | | |
| | 1,500 | | | Abbott Laboratories | | | 67,365 | |
| | 2,000 | | | AbbVie, Inc. | | | 118,480 | |
| | 4,000 | | | GlaxoSmithKline PLC ADR | | | 161,400 | |
| | 2,000 | | | Johnson & Johnson | | | 205,440 | |
| | 6,750 | | | Merck & Co., Inc. | | | 356,535 | |
| | 15,700 | | | Pfizer, Inc. | | | 506,796 | |
| | 3,500 | | | St. Jude Medical, Inc. | | | 216,195 | |
| | 2,250 | | | Stryker Corp. | | | 209,115 | |
| | | | | | | | |
| | | | | | | 1,841,326 | |
| | | | | | | | |
C A T A L Y S T F U N D S
See notes which are an integral part of the Financial Statements.
Catalyst Dividend Capture VA Fund
Portfolio of Investments (continued)
December 31, 2015
| | | | | | | | |
| Shares | | | | | Fair Value | |
| | | | | | | | |
| | | | Common Stocks — (continued) | | | | |
| | | | Industrials — 6.1% | | | | |
| | 1,000 | | | 3M Co. | | $ | 150,640 | |
| | 5,250 | | | ADT Corp./The (a) | | | 173,145 | |
| | 8,500 | | | CSX Corp. | | | 220,575 | |
| | 4,000 | | | Deluxe Corp. | | | 218,160 | |
| | 9,750 | | | General Electric Co. | | | 303,712 | |
| | 3,500 | | | Hillenbrand, Inc. | | | 103,705 | |
| | 8,250 | | | Tyco International PLC | | | 263,092 | |
| | | | | | | | |
| | | | | | | 1,433,029 | |
| | | | | | | | |
| | | | Information Technology — 5.0% | | | | |
| | 3,000 | | | CA, Inc. | | | 85,680 | |
| | 7,500 | | | Cisco Systems, Inc. | | | 203,663 | |
| | 5,000 | | | Intel Corp. | | | 172,250 | |
| | 1,250 | | | International Business Machines Corp. | | | 172,025 | |
| | 1,500 | | | Microchip Technology, Inc. (a) | | | 69,810 | |
| | 2,250 | | | Paychex, Inc. | | | 119,003 | |
| | 8,750 | | | Symantec Corp. | | | 183,750 | |
| | 15,500 | | | Xerox Corp. | | | 164,765 | |
| | | | | | | | |
| | | | | | | 1,170,946 | |
| | | | | | | | |
| | | | Materials — 1.7% | | | | |
| | 2,250 | | | Packaging Corporation of America | | | 141,863 | |
| | 6,500 | | | Sonoco Products Co. | | | 265,655 | |
| | | | | | | | |
| | | | | | | 407,518 | |
| | | | | | | | |
| | | | Real Estate Investment
Trusts — 8.5% | | | | |
| | 3,500 | | | Camden Property Trust | | | 268,660 | |
| | 9,000 | | | HCP, Inc. | | | 344,160 | |
| | 3,000 | | | Highwoods Properties, Inc. | | | 130,800 | |
| | 8,750 | | | Hospitality Properties Trust | | | 228,812 | |
| | 17,000 | | | Host Hotels & Resorts, Inc. | | | 260,780 | |
| | 33,750 | | | Lexington Realty Trust | | | 270,000 | |
| | 2,500 | | | Realty Income Corp. (a) | | | 129,075 | |
| | 7,500 | | | Tanger Factory Outlet Centers, Inc. | | | 245,250 | |
| | 2,000 | | | Ventas, Inc. | | | 112,860 | |
| | | | | | | | |
| | | | | | | 1,990,397 | |
| | | | | | | | |
| | | | Telecommunication
Services — 2.5% | | | | |
| | 6,750 | | | AT&T, Inc. | | | 232,267 | |
| | 7,750 | | | Verizon Communications, Inc. | | | 358,205 | |
| | | | | | | | |
| | | | | | | 590,472 | |
| | | | | | | | |
| | | | Utilities — 4.0% | | | | |
| | 4,250 | | | Aqua America, Inc. | | | 126,650 | |
| | 11,500 | | | CenterPoint Energy, Inc. | | | 211,140 | |
| | 1,750 | | | Entergy Corp. | | | 119,630 | |
| | 6,500 | | | Exelon Corp. | | | 180,505 | |
| | 4,500 | | | National Fuel Gas Co. | | | 192,375 | |
| | 3,750 | | | TransCanada Corp. | | | 122,213 | |
| | | | | | | | |
| | | | | | | 952,513 | |
| | | | | | | | |
| | | | Total Common Stocks
(Cost $17,219,293) | | | 16,556,099 | |
| | | | | | | | |
| | | | | | | | |
| Shares | | | | | Fair Value | |
| | | | | | | | |
| | | | Preferred Stocks — 20.5% | | | | |
| | | | Financials — 15.8% | | | | |
| | 11,000 | | | Aegon NV, 8.00% | | $ | 302,940 | |
| | 12,000 | | | Allstate Corp./The, 5.10% | | | 296,280 | |
| | 22,624 | | | Axis Capital Holdings Ltd.,
Series C, 6.88% | | | 606,776 | |
| | 17,500 | | | KKR Financial Holdings LLC, 8.38% | | | 463,225 | |
| | 10,000 | | | Northern Trust Corp., Series C, 5.85% | | | 267,600 | |
| | 23,000 | | | Raymond James Financial, Inc., 6.90% | | | 613,180 | |
| | 21,000 | | | U.S. Bancorp., Series F, 6.50% | | | 602,700 | |
| | 20,500 | | | Wells Fargo & Co., Series J, 8.00% | | | 575,640 | |
| | | | | | | | |
| | | | | | | 3,728,341 | |
| | | | | | | | |
| | | | Real Estate Investment
Trusts — 4.7% | | | | |
| | 2,000 | | | National Retail Properties, Inc., Series D, 6.63% | | | 52,120 | |
| | 14,000 | | | PS Business Parks, Inc.,
Series S, 6.45% | | | 368,620 | |
| | 17,000 | | | Public Storage, Inc., Series Q, 6.50% | | | 431,970 | |
| | 9,500 | | | Realty Income Corp., Series F, 6.63% | | | 251,655 | |
| | | | | | | | |
| | | | | | | 1,104,365 | |
| | | | | | | | |
| | | | Total Preferred Stocks
(Cost $4,837,119) | | | 4,832,706 | |
| | | | | | | | |
| | | | Exchange-Traded
Funds — 5.7% | | | | |
| | 5,500 | | | iShares U.S. Real Estate ETF (a) | | | 413,105 | |
| | 62,000 | | | PowerShares Preferred Portfolio | | | 926,900 | |
| | | | | | | | |
| | | | Total Exchange-Traded Funds
(Cost $1,326,350) | | | 1,340,005 | |
| | | | | | | | |
| | | | Cash Equivalents — 3.3% | | | | |
| | 789,034 | | | Federated Treasury Obligations Fund, Institutional Class, 0.07% (c) | | | 789,034 | |
| | | | | | | | |
| | | | Total Cash Equivalents
(Cost $789,034) | | | 789,034 | |
| | | | | | | | |
| | | | Short-Term Securities Held as Collateral for Securities Lending — 4.8% | | | | |
| | 1,134,508 | | | Fidelity Institutional Money Market Portfolio, Institutional Class, 0.32% (c) | | | 1,134,508 | |
| | | | | | | | |
| | | | Total Short-Term Securities Held as Collateral for Securities Lending
(Cost $1,134,508) | | | 1,134,508 | |
| | | | | | | | |
| | | | Total Investments
(Cost $25,306,304) — 104.6% | | | 24,652,352 | |
| | | | | | | | |
| | | | Liabilities in Excess of Other Assets — (4.6)% | | | (1,091,170 | ) |
| | | | | | | | |
| | | | Net Assets — 100.0% | | $ | 23,561,182 | |
| | | | | | | | |
| (a) | All or a portion of the security was on loan as of December 31, 2015. The total value of securities on loan as of December 31, 2015 was $1,100,976. |
| (b) | Business Development Company |
See notes which are an integral part of the Financial Statements.
Catalyst Dividend Capture VA Fund
Portfolio of Investments (continued)
December 31, 2015
| (c) | Rate disclosed is the seven day yield as of December 31, 2015. |
| * | Non-income producing security. |
| | |
| ADR | | —American Depositary Receipt |
| ETF | | —Exchange-Traded Fund |
The sectors shown on the portfolio of investments are based on the Global Industry Classification Standard, or GICS® (“GICS”). The GICS was developed and/or is the exclusive property of MSCI, Inc. and Standard & Poor Financial Services LLC (“S&P”). GICS is a service mark of MSCI, Inc. and S&P and has been licensed for use by Ultimus Asset Services, LLC
C A T A L Y S T F U N D S
See notes which are an integral part of the Financial Statements.
Catalyst Insider Buying VA Fund
Portfolio of Investments Summary Table (Unaudited)
December 31, 2015
| | | | |
| Asset Allocation | | Percentage of
Fair Value | |
Financials | | | 17.2 | % |
Information Technology | | | 12.6 | % |
Short-Term Securities Held as Collateral for Securities Lending | | | 12.1 | % |
Health Care | | | 11.1 | % |
Industrials | | | 11.1 | % |
Cash | | | 9.9 | % |
Exchange-Traded Funds | | | 8.4 | % |
Consumer Discretionary | | | 6.6 | % |
Utilities | | | 3.3 | % |
Materials | | | 2.4 | % |
Consumer Staples | | | 2.3 | % |
Energy | | | 1.7 | % |
Real Estate Investment Trusts | | | 0.8 | % |
Telecommunication Services | | | 0.5 | % |
| | | | |
Total | | | 100.0 | % |
Portfolio holdings and allocations are subject to change. As of December 31, 2015, percentages in the table above are based on total investments. Such total investments may differ from the percentages set forth below in the Portfolio of Investments which are computed using the Fund’s net assets.
The Portfolio of Investments Summary Table and the Portfolio of Investments are broken down by sectors, and these sectors do not represent industry categories for purposes of identifying “industry concentration” as described in the Investment Company Act of 1940, as amended.
Portfolio of Investments
December 31, 2015
| | | | | | | | |
| Shares | | | | | Fair Value | |
| | | | | | | | |
| | | | Common Stocks — 79.3% | | | | |
| | | | Consumer Discretionary — 7.5% | | | | |
| | 14,250 | | | Dorman Products, Inc. * | | $ | 676,447 | |
| | 14,000 | | | Gentherm, Inc. * | | | 663,600 | |
| | 23,250 | | | La-Z-Boy, Inc. | | | 567,765 | |
| | 4,750 | | | Papa John’s International, Inc. | | | 265,383 | |
| | 10,500 | | | Pinnacle Entertainment, Inc. * | | | 326,760 | |
| | 10,500 | | | Texas Roadhouse, Inc. | | | 375,585 | |
| | | | | | | | |
| | | | | | | 2,875,540 | |
| | | | | | | | |
| | | | Consumer Staples — 2.8% | | | | |
| | 6,000 | | | Cal-Maine Foods, Inc. (a) | | | 278,040 | |
| | 10,000 | | | Sanderson Farms, Inc. (a) | | | 775,200 | |
| | | | | | | | |
| | | | | | | 1,053,240 | |
| | | | | | | | |
| | | | Energy — 1.9% | | | | |
| | 15,000 | | | Archrock, Inc. | | | 112,800 | |
| | 20,000 | | | Atwood Oceanics, Inc. (a) | | | 204,600 | |
| | 3,500 | | | Dril-Quip, Inc. * | | | 207,305 | |
| | 7,500 | | | Exterran Corp. * | | | 120,375 | |
| | 5,000 | | | SM Energy Co. | | | 98,300 | |
| | | | | | | | |
| | | | | | | 743,380 | |
| | | | | | | | |
| | | | Financials — 19.6% | | | | |
| | 27,000 | | | American Equity Investment Life Holding Co. | | | 648,810 | |
| | 17,000 | | | Community Bank System, Inc. | | | 678,980 | |
| | 6,500 | | | Cullen/Frost Bankers, Inc. | | | 390,000 | |
| | 7,000 | | | Evercore Partners, Inc. | | | 378,490 | |
| | 62,000 | | | F.N.B. Corp. | | | 827,080 | |
| | 25,000 | | | International Bancshares Corp. | | | 642,500 | |
| | | | | | | | |
| Shares | | | | | Fair Value | |
| | | | | | | | |
| | | | Financials — (continued) | | | | |
| | 12,500 | | | PRA Group, Inc. * | | $ | 433,625 | |
| | 17,500 | | | PrivateBancorp, Inc. | | | 717,850 | |
| | 13,000 | | | RLI Corp. | | | 802,750 | |
| | 9,500 | | | South State Corp. | | | 683,525 | |
| | 41,000 | | | Umpqua Holdings Corp. | | | 651,900 | |
| | 13,000 | | | Wintrust Financial Corp. | | | 630,760 | |
| | | | | | | | |
| | | | | | | 7,486,270 | |
| | | | | | | | |
| | | | Health Care — 12.6% | | | | |
| | 17,000 | | | Abaxis, Inc. (a) | | | 946,560 | |
| | 8,000 | | | AmSurg Corp. | | | 608,000 | |
| | 14,000 | | | Cerner Corp. * | | | 842,380 | |
| | 7,000 | | | Greatbatch, Inc. * | | | 367,500 | |
| | 10,000 | | | Luminex Corp. * | | | 213,900 | |
| | 12,250 | | | Masimo Corp. * | | | 508,497 | |
| | 11,000 | | | Myriad Genetics, Inc. (a) * | | | 474,760 | |
| | 14,250 | | | Neogen Corp. * | | | 805,410 | |
| | 5,000 | | | Osiris Therapeutics, Inc. (a) * | | | 51,900 | |
| | 1 | | | PharMerica Corp. | | | 35 | |
| | | | | | | | |
| | | | | | | 4,818,942 | |
| | | | | | | | |
| | | | Industrials — 12.6% | | | | |
| | 18,000 | | | Aerojet Rocketdyne Holdings, Inc. * | | | 281,880 | |
| | 15,000 | | | Apogee Enterprises, Inc. | | | 652,650 | |
| | 8,500 | | | Barnes Group, Inc. | | | 300,815 | |
| | 10,750 | | | Curtiss-Wright Corp. | | | 736,375 | |
| | 24,000 | | | Hillenbrand, Inc. | | | 711,120 | |
| | 19,250 | | | Korn/Ferry International | | | 638,715 | |
| | 17,000 | | | TASER International, Inc. (a) * | | | 293,930 | |
See notes which are an integral part of the Financial Statements.
Catalyst Insider Buying VA Fund
Portfolio of Investments (continued)
December 31, 2015
| | | | | | | | |
| Shares | | | | | Fair Value | |
| | | | | | | | |
| | | | Common Stocks — (continued) | | | | |
| | | | Industrials — (continued) | | | | |
| | 19,000 | | | Tetra Tech, Inc. | | $ | 494,380 | |
| | 29,500 | | | Trinity Industries, Inc. | | | 708,590 | |
| | | | | | | | |
| | | | | | | 4,818,455 | |
| | | | | | | | |
| | | | Information Technology — 14.3% | | | | |
| | 11,000 | | | ACI Worldwide, Inc. * | | | 235,400 | |
| | 5,000 | | | Anixter International, Inc. * | | | 301,950 | |
| | 20,000 | | | Cardtronics, Inc. * | | | 673,000 | |
| | 25,500 | | | Diodes, Inc. * | | | 585,990 | |
| | 12,000 | | | Ebix, Inc. (a) | | | 393,480 | |
| | 5,000 | | | Integrated Device Technology, Inc. * | | | 131,750 | |
| | 13,000 | | | LogMeIn, Inc. * | | | 872,300 | |
| | 8,250 | | | Plexus Corp. * | | | 288,090 | |
| | 28,000 | | | Sanmina Corp. * | | | 576,240 | |
| | 13,000 | | | ScanSource, Inc. * | | | 418,860 | |
| | 13,250 | | | Synchronoss
Technologies, Inc.* | | | 466,797 | |
| | 3,000 | | | Tyler Technologies, Inc. * | | | 522,960 | |
| | | | | | | | |
| | | | | | | 5,466,817 | |
| | | | | | | | |
| | | | Materials — 2.7% | | | | |
| | 3,250 | | | Albemarle Corp. | | | 182,033 | |
| | 17,500 | | | KapStone Paper and Packaging Corp. | | | 395,325 | |
| | 11,000 | | | Sonoco Products Co. | | | 449,570 | |
| | | | | | | | |
| | | | | | | 1,026,928 | |
| | | | | | | | |
| | | | Real Estate Investment
Trusts — 0.9% | | | | |
| | 13,250 | | | Equity One, Inc. | | | 359,738 | |
| | | | | | | | |
| | | | Telecommunication
Services — 0.6% | | | | |
| | 2,000 | | | 8x8, Inc. * | | | 22,900 | |
| | 10,000 | | | General Communication, Inc., Class A * | | | 197,800 | |
| | | | | | | | |
| | | | | | | 220,700 | |
| | | | | | | | |
| | | | Utilities — 3.8% | | | | |
| | 12,500 | | | American States Water Co. | | | 524,375 | |
| | 6,500 | | | National Fuel Gas Co. | | | 277,875 | |
| | 15,000 | | | Vectren Corp. | | | 636,300 | |
| | | | | | | | |
| | | | | | | 1,438,550 | |
| | | | | | | | |
| | | | Total Common Stocks
(Cost $26,958,204) | | | 30,308,560 | |
| | | | | | | | |
| | | | | | | | |
| Shares | | | | | Fair Value | |
| | | | | | | | |
| | | | Exchange-Traded
Funds — 9.5% | | | | |
| | 10,500 | | | iShares Core S&P Small-Cap ETF (a) | | $ | 1,156,155 | |
| | 9,000 | | | iShares U.S. Real Estate ETF (a) | | | 675,990 | |
| | 16,000 | | | SPDR S&P 600 Small Cap ETF | | | 1,582,080 | |
| | 1,250 | | | SPDR S&P 600 Small Cap Growth ETF | | | 215,975 | |
| | | | | | | | |
| | | | Total Exchange-Traded Funds
(Cost $3,696,304) | | | 3,630,200 | |
| | | | | | | | |
| | | | Cash Equivalents — 11.2% | | | | |
| | 4,284,017 | | | Federated Treasury Obligations Fund, Institutional Class, 0.07% (b) | | | 4,284,017 | |
| | | | | | | | |
| | | | Total Cash Equivalents
(Cost $4,284,017) | | | 4,284,017 | |
| | | | | | | | |
| | | | Short-Term Securities Held as Collateral for Securities Lending — 13.8% | | | | |
| | 5,252,640 | | | Fidelity Institutional Money Market Portfolio, Institutional
Class, 0.32% (b) | | | 5,252,640 | |
| | | | | | | | |
| | | | Total Short-Term Securities Held as Collateral for Securities Lending
(Cost $5,252,640) | | | 5,252,640 | |
| | | | | | | | |
| | | | Total Investments (Cost $40,191,165) — 113.8% | | | 43,475,417 | |
| | | | | | | | |
| | | | Liabilities in Excess of Other
Assets — (13.8)% | | | (5,257,772 | ) |
| | | | | | | | |
| | | | Net Assets — 100.0% | | $ | 38,217,645 | |
| | | | | | | | |
| (a) | All or a portion of the security was on loan as of December 31, 2015. The total value of securities on loan as of December 31, 2015 was $5,042,941. |
| (b) | Rate disclosed is the seven day yield as of December 31, 2015. |
| * | Non-income producing security. |
| | |
| ETF | | —Exchange-Traded Fund |
| SPDR | | —Standard & Poor’s Depository Receipts |
The sectors shown on the portfolio of investments are based on the Global Industry Classification Standard, or GICS® (“GICS”). The GICS was developed and/or is the exclusive property of MSCI, Inc. and Standard & Poor Financial Services LLC (“S&P”). GICS is a service mark of MSCI, Inc. and S&P and has been licensed for use by Ultimus Asset Services, LLC
C A T A L Y S T F U N D S
See notes which are an integral part of the Financial Statements.
Catalyst Funds
Statements of Assets and Liabilities
December 31, 2015
| | | | | | | | |
| | | Catalyst Dividend
Capture VA Fund | | | Catalyst Insider
Buying VA Fund | |
Assets: | | | | | | | | |
Investments, at cost | | $ | 25,306,304 | | | $ | 40,191,165 | |
| | | | | | | | |
Investments, at value | | | 24,652,352 | | | | 43,475,417 | |
Dividends receivable | | | 88,445 | | | | 47,640 | |
Tax reclaims receivable | | | — | | | | 830 | |
Prepaid expenses and other assets | | | 442 | | | | 746 | |
| | | | | | | | |
Total assets | | | 24,741,239 | | | | 43,524,633 | |
Liabilities: | | | | | | | | |
Payable for return of collateral on loaned securities | | | 1,134,508 | | | | 5,252,640 | |
Payable for shares redeemed | | | 14,238 | | | | 14,606 | |
Accrued expenses and other payables: | | | | | | | | |
Investment advisory | | | 6,365 | | | | 5,835 | |
Administration | | | 3,709 | | | | 6,092 | |
Custodian | | | 1,080 | | | | 2,751 | |
Professional | | | 13,061 | | | | 12,891 | |
Printing and postage | | | 3,149 | | | | 6,854 | |
Transfer and dividend disbursing agent | | | 1,418 | | | | 1,785 | |
Trustee | | | 36 | | | | 54 | |
Other | | | 2,493 | | | | 3,480 | |
| | | | | | | | |
Total Liabilities | | | 1,180,057 | | | | 5,306,988 | |
| | | | | | | | |
Net Assets | | $ | 23,561,182 | | | $ | 38,217,645 | |
| | | | | | | | |
Net Assets consist of: | | | | | | | | |
Paid in capital | | $ | 23,304,021 | | | $ | 24,522,310 | |
Net unrealized appreciation (depreciation) of investments and translations of assets and liabilities in foreign currency | | | (653,952 | ) | | | 3,284,060 | |
Accumulated net realized gain (loss) on investments, options and foreign currency transactions | | | (6,617 | ) | | | 10,191,413 | |
Accumulated net investment income | | | 917,730 | | | | 219,862 | |
| | | | | | | | |
Net Assets | | $ | 23,561,182 | | | $ | 38,217,645 | |
| | | | | | | | |
Shares Outstanding (unlimited number of shares authorized, no par value) | | | 1,937,011 | | | | 2,204,496 | |
| | | | | | | | |
Net Asset Value, Redemption Price and Offering Price Per Share: | | $ | 12.16 | | | $ | 17.34 | |
| | | | | | | | |
See Notes which are an integral part of the Financial Statements.
Catalyst Funds
Statements of Operations
December 31, 2015
| | | | | | | | |
| | | Catalyst Dividend
Capture VA Fund | | | Catalyst Insider
Buying VA Fund | |
Investment Income: | | | | | | | | |
Dividend income | | $ | 1,253,398 | | | $ | 433,791 | |
Dividend income from affiliated securities | | | 143 | | | | 603 | |
Income from securities lending, net (a) | | | 6,240 | | | | 260,714 | |
Foreign dividend taxes withheld | | | (10,861 | ) | | | (3,173 | ) |
| | | | | | | | |
Total investment income | | | 1,248,920 | | | | 691,935 | |
| | | | | | | | |
Expenses: | | | | | | | | |
Investment advisory | | | 170,814 | | | | 280,202 | |
Administration | | | 51,870 | | | | 85,088 | |
Custodian | | | 7,174 | | | | 15,995 | |
Transfer and dividend disbursing agent | | | 13,855 | | | | 16,773 | |
Trustee | | | 6,607 | | | | 10,834 | |
Professional | | | 35,839 | | | | 39,260 | |
Printing and postage | | | 12,657 | | | | 30,197 | |
Insurance premiums | | | 6,159 | | | | 6,928 | |
Compliance services | | | 1,711 | | | | 2,795 | |
Line of credit | | | 798 | | | | 6,633 | |
Interest expense | | | — | | | | 2,244 | |
Other | | | 12,079 | | | | 18,239 | |
| | | | | | | | |
Total expenses | | | 319,563 | | | | 515,188 | |
| | | | | | | | |
Investment advisory fees waived | | | (37,235 | ) | | | (39,947 | ) |
| | | | | | | | |
Net expenses | | | 282,328 | | | | 475,241 | |
| | | | | | | | |
Net investment income | | | 966,592 | | | | 216,694 | |
| | | | | | | | |
Net Realized/Unrealized Gain (Loss) on Investments, Options and Foreign Currency Transactions: | | | | | | | | |
Long-term capital gain dividends from investment companies | | | — | | | | 38,281 | |
Net realized gain on investment transactions | | | 1,356,862 | | | | 10,421,693 | |
Net realized gain on written option transactions | | | — | | | | 148,989 | |
Net realized loss on foreign currency transactions | | | (173 | ) | | | (1,488 | ) |
| | | | | | | | |
Net realized gain on investments, options and translation of assets and liabilities in foreign currency | | | 1,356,689 | | | | 10,607,475 | |
| | | | | | | | |
Net change in unrealized appreciation/depreciation of investments and translation of assets and liabilities in foreign currency | | | (3,108,896 | ) | | | (13,992,343 | ) |
| | | | | | | | |
Net realized and unrealized loss on investments, options and foreign currency transactions | | | (1,752,207 | ) | | | (3,384,868 | ) |
| | | | | | | | |
Change in net assets resulting from operations | | $ | (785,615 | ) | | $ | (3,168,174 | ) |
| | | | | | | | |
| (a) | Income from securities lending is net of ($1,560 and $65,178) expenses paid to Huntington National Bank. |
C A T A L Y S T F U N D S
See Notes which are an integral part of the Financial Statements.
Catalyst Funds
Statement of Changes in Net Assets
| | | | | | | | | | | | | | | | |
| | | Catalyst Dividend
Capture VA Fund | | | Catalyst Insider
Buying VA Fund | |
| | | Year Ended
December 31, 2015 | | | Year Ended
December 31, 2014 | | | Year Ended
December 31, 2015 | | | Year Ended
December 31, 2014 | |
Increase (Decrease) in Net Assets: | | | | | | | | | | | | | | | | |
Operations: | | | | | | | | | | | | | | | | |
Net investment income | | $ | 966,592 | | | $ | 1,102,178 | | | $ | 216,694 | | | $ | 148,339 | |
Long-term capital gain dividends from investment companies | | | — | | | | 19,582 | | | | 38,281 | | | | — | |
Net realized gain on investments, options and foreign currency transactions | | | 1,356,689 | | | | 3,517,855 | | | | 10,569,194 | | | | 6,343,068 | |
Net change in unrealized appreciation/depreciation of investments, options and foreign currency transactions | | | (3,108,896 | ) | | | (1,338,293 | ) | | | (13,992,343 | ) | | | (8,314,538 | ) |
| | | | | | | | | | | | | | | | |
Change in net assets resulting from operations | | | (785,615 | ) | | | 3,301,322 | | | | (3,168,174 | ) | | | (1,823,131 | ) |
| | | | | | | | | | | | | | | | |
Distributions to Shareholders: | | | | | | | | | | | | | | | | |
From net investment income | | | (1,122,139 | ) | | | (1,450,837 | ) | | | (242,057 | ) | | | (273,158 | ) |
From net realized gain on investments | | | — | | | | — | | | | (6,080,507 | ) | | | (2,815,787 | ) |
| | | | | | | | | | | | | | | | |
Change in net assets resulting from distributions to shareholders | | | (1,122,139 | ) | | | (1,450,837 | ) | | | (6,322,564 | ) | | | (3,088,945 | ) |
| | | | | | | | | | | | | | | | |
Change in net assets resulting from capital transactions | | | (9,746,054 | ) | | | (7,744,648 | ) | | | (14,263,722 | ) | | | 4,656,690 | |
| | | | | | | | | | | | | | | | |
Change in net assets | | | (11,653,808 | ) | | | (5,894,163 | ) | | | (23,754,460 | ) | | | (255,386 | ) |
Net Assets: | | | | | | | | | | | | | | | | |
Beginning of year | | | 35,214,990 | | | | 41,109,153 | | | | 61,972,105 | | | | 62,227,491 | |
| | | | | | | | | | | | | | | | |
End of year | | $ | 23,561,182 | | | $ | 35,214,990 | | | $ | 38,217,645 | | | $ | 61,972,105 | |
| | | | | | | | | | | | | | | | |
Accumulated net investment income included in net assets at end of year | | $ | 917,730 | | | $ | 1,109,898 | | | $ | 219,862 | | | $ | 131,325 | |
| | | | | | | | | | | | | | | | |
Capital Transactions: | | | | | | | | | | | | | | | | |
Shares sold | | $ | 611,791 | | | $ | 2,704,460 | | | $ | 3,069,986 | | | $ | 8,414,032 | |
Shares issued in connection with merger | | | — | | | | 11,894,194 | | | | — | | | | 16,321,997 | |
Dividends reinvested | | | 1,122,139 | | | | 1,450,837 | | | | 6,322,564 | | | | 3,088,945 | |
Shares redeemed | | | (11,479,984 | ) | | | (23,794,139 | ) | | | (23,656,272 | ) | | | (23,168,284 | ) |
| | | | | | | | | | | | | | | | |
Net change resulting from capital transactions | | $ | (9,746,054 | ) | | $ | (7,744,648 | ) | | $ | (14,263,722 | ) | | $ | 4,656,690 | |
| | | | | | | | | | | | | | | | |
Share Transactions: | | | | | | | | | | | | | | | | |
Shares sold | | | 48,040 | | | | 209,536 | | | | 152,090 | | | | 374,374 | |
Shares issued in connection with merger | | | — | | | | 922,746 | | | | — | | | | 714,623 | |
Dividends reinvested | | | 95,339 | | | | 112,906 | | | | 359,033 | | | | 135,302 | |
Shares redeemed | | | (888,895 | ) | | | (1,838,368 | ) | | | (1,106,444 | ) | | | (1,022,652 | ) |
| | | | | | | | | | | | | | | | |
Net change resulting from share transactions | | | (745,516 | ) | | | (593,180 | ) | | | (595,321 | ) | | | 201,647 | |
| | | | | | | | | | | | | | | | |
See Notes which are an integral part of the Financial Statements.
[THIS PAGE INTENTIONALLY LEFT BLANK]
C A T A L Y S T F U N D S
Catalyst Funds
Financial Highlights
(For a share outstanding throughout each year ended December 31)
| | | | | | | | | | | | | | | | | | | | | | | | | | | | |
| | | Net Asset
Value,
Beginning
of Year | | | Net
Investment
Income (loss) | | | Net Realized
and Unrealized
Gain (loss) on
Investments | | | Total from
Investment
Operations | | | Distributions
from Net
Investment
Income | | |
Distributions
from Net
Realized gain
on Investment
Transactions | | | Total
Distributions | |
Catalyst Dividend Capture VA Fund | |
2011 | | $ | 9.75 | | | | 0.44 | | | | 0.25 | | | | 0.69 | | | | (0.38 | ) | | | — | | | | (0.38 | ) |
2012 | | $ | 10.06 | | | | 0.45 | | | | 0.70 | | | | 1.15 | | | | (0.43 | ) | | | — | | | | (0.43 | ) |
2013 | | $ | 10.78 | | | | 0.43 | | | | 1.72 | | | | 2.15 | | | | (0.38 | ) | | | — | | | | (0.38 | ) |
2014 | | $ | 12.55 | | | | 0.39 | (c) | | | 0.87 | | | | 1.26 | | | | (0.68 | ) | | | — | | | | (0.68 | ) |
2015 | | $ | 13.13 | | | | 0.44 | (c) | | | (0.86 | ) | | | (0.42 | ) | | | (0.55 | ) | | | — | | | | (0.55 | ) |
Catalyst Insider Buying VA Fund | |
2011 | | $ | 14.99 | | | | (0.01 | ) | | | (0.13 | ) | | | (0.14 | ) | | | — | (d) | | | — | | | | — | (d) |
2012 | | $ | 14.85 | | | | 0.09 | | | | 3.27 | | | | 3.36 | | | | — | | | | — | | | | — | |
2013 | | $ | 18.21 | | | | 0.08 | | | | 5.73 | | | | 5.81 | | | | (0.07 | ) | | | — | | | | (0.07 | ) |
2014 | | $ | 23.95 | | | | 0.07 | | | | (0.52 | ) | | | (0.45 | ) | | | (0.12 | ) | | | (1.25 | ) | | | (1.37 | ) |
2015 | | $ | 22.13 | | | | 0.12 | | | | (1.66 | ) | | | (1.54 | ) | | | (0.12 | ) | | | (3.13 | ) | | | (3.25 | ) |
| | | | | | | | | | | | | | | | | | | | | | | | | | | | | |
| (a) | Total returns do not include any insurance, sales or administrative charges of variable annuity or life insurance contracts. If these were included, the returns would be lower. |
| (b) | If applicable, certain fees were waived and/or reimbursed. If such waivers/reimbursements had not occurred, the ratios would have been as indicated. |
| (c) | Calculated using average shares for the year. |
| (d) | Amount is less than $0.005. |
| (e) | Rounds to less than 0.005%. |
See Notes which are an integral part of the Financial Statements.
| | | | | | | | | | | | | | | | | | | | | | | | | | |
Net Asset
Value,
End of
Year | | | Total
Return(a) | | | Ratio of Net
Expenses
to Average
Net assets | | | Ratio of Net
Investment
Income (loss)
to Average
Net Assets | | | Ratio of
Expenses
(prior to
Reimbursements)
to Average
Net Assets(b) | | | Net Assets,
End of Year
(000 omitted) | | | Portfolio
Turnover
Rate | |
| | | | | | | | | | | | | | | | | | | | | | | | | | |
| $ | 10.06 | | | | 7.07 | % | | | 0.97 | % | | | 3.74 | % | | | 0.97 | % | | $ | 31,826 | | | | 142 | % |
| $ | 10.78 | | | | 11.47 | % | | | 0.95 | % | | | 3.85 | % | | | 0.95 | % | | $ | 32,776 | | | | 110 | % |
| $ | 12.55 | | | | 19.96 | % | | | 0.98 | % | | | 3.63 | % | | | 0.98 | % | | $ | 41,109 | | | | 118 | % |
| $ | 13.13 | | | | 10.16 | % | | | 0.98 | % | | | 3.00 | % | | | 1.05 | % | | $ | 35,215 | | | | 103 | % |
| $ | 12.16 | | | | (3.06 | )% | | | 0.99 | % | | | 3.40 | % | | | 1.12 | % | | $ | 23,561 | | | | 94 | % |
| | | | | | | | | | | | | | | | | | | | | | | | | | |
| $ | 14.85 | | | | (0.91 | )% | | | 0.99 | % | | | — | (e) | | | 0.99 | % | | $ | 35,271 | | | | 14 | % |
| $ | 18.21 | �� | | | 22.63 | % | | | 0.96 | % | | | 0.55 | % | | | 0.96 | % | | $ | 45,402 | | | | 10 | % |
| $ | 23.95 | | | | 31.92 | % | | | 0.94 | % | | | 0.42 | % | | | 0.94 | % | | $ | 62,227 | | | | 26 | % |
| $ | 22.13 | | | | (2.06 | )% | | | 0.99 | % | | | 0.24 | % | | | 1.03 | % | | $ | 61,972 | | | | 21 | % |
| $ | 17.34 | | | | (7.17 | )% | | | 1.02 | % | | | 0.46 | % | | | 1.10 | % | | $ | 38,218 | | | | 68 | % |
| | | | | | | | | | | | | | | | | | | | | | | | | | | |
C A T A L Y S T F U N D S
Catalyst Funds
Notes to Financial Statements
December 31, 2015
The Huntington Funds (the “Trust”) was organized as a Delaware statutory trust on June 23, 2006. The Trust is registered under the Investment Company Act of 1940, as amended (the “1940 Act”), as an open-end management investment company. As of December 31, 2015, the Trust operated 7 separate series, or mutual funds, each with its own investment objective and strategy. This report contains financial statements and financial highlights of the funds listed below (individually referred to as a “Fund”, or collectively as the “Funds”):
Catalyst Dividend Capture VA Fund (“Dividend Capture VA Fund”), formerly the Huntington VA Dividend Capture Fund
Catalyst Insider Buying VA Fund (“Insider Buying VA Fund”), formerly the Huntington VA Situs Fund
The prospectus provides a description of each Fund’s investment objectives, policies and strategies along with information on the classes of shares currently being offered. The price at which the Funds will offer or redeem shares is the net asset value (“NAV”) per share next determined after the order is considered received. The assets of each Fund are segregated and a shareholder’s interest is limited to the Fund in which shares are held.
The Trust accounts for the assets, liabilities and operations of each Fund separately. Shares of the Funds are not offered directly to the public, but pursuant to an exemptive order granted by the Securities and Exchange Commission and procedures adopted by the Trust’s Board of Trustees (the “Trustees”), the Funds were sold during the year only to separate accounts of Hartford Life Insurance Company, Hartford Life and Annuity Insurance Company, Lincoln Insurance Company, Nationwide Insurance Company, Delaware Life Insurance Company, Forethought Life Insurance Company, and Transamerica Life Insurance Company for use with their respective variable insurance contracts and policies.
Under the Trust’s organizational documents, its officers and Trustees are indemnified against certain liabilities arising out of the performance of their duties to the Funds. In addition, in the normal course of business, the Trust may enter into contracts with vendors and others that provide for general indemnifications. The Trust’s maximum exposure under these arrangements is unknown, as this would involve future claims that may be made against the Trust. However, based on experience, the Trust expects that risk of loss to be remote.
On June 20, 2014, the Dividend Capture VA Fund acquired all of the assets and assumed all of the liabilities of the Huntington VA Income Equity Fund (“VA Income Equity Fund”), and the Insider Buying VA Fund acquired all of the assets and assumed all of the liabilities of the Huntington VA Mid Corp America Fund (“VA Mid Corp America Fund”), pursuant to an agreement and plan of reorganization approved by the Trustees on January 30, 2014. The reorganization provides shareholders of the VA Income Equity Fund and VA Mid Corp America Fund access to a larger and more diversified portfolio with a similar investment strategy and lower expenses. The reorganizations qualified as tax-free reorganizations for federal income tax purposes with no gain or loss recognized to the funds or their shareholders.
With respect to the Dividend Capture VA Fund and VA Income Equity Fund merger, the acquisition was accomplished by a tax-free exchange of 922,746 shares of the Dividend Capture VA Fund (valued at $11,894,194) for 1,090,350 shares of the VA Income Equity Fund outstanding on June 20, 2014. The investment portfolio of the VA Income Equity Fund, with a fair value of $11,491,112 and identified cost of $10,018,073, was the principal asset acquired by the Dividend Capture VA Fund. For financial reporting purposes, assets received and shares issued by the Dividend Capture VA Fund were recorded at fair value; however, the identified cost of the investments received from the VA Income Equity Fund was carried forward to align ongoing reporting of the Dividend Capture VA Fund’s realized and unrealized gains and losses with amounts distributable to shareholders for tax purposes. The aggregate net assets of the Dividend Capture VA Fund immediately before the acquisition were $28,867,249. The net assets of the VA Income Equity Fund at that date of $11,894,194, including $1,473,039 of unrealized appreciation, were combined with those of the Dividend Capture VA Fund, resulting in combined net assets of $40,761,443.
Assuming the acquisition had been completed on January 1, 2014, the beginning of the annual reporting period of the Dividend Capture VA Fund, the Dividend Capture VA Fund’s pro forma results of operations for the year ended December 31, 2014, are as follows:
| | | | |
Net Investment Income(a) | | $ | 1,440,834 | |
Net Realized and Unrealized Gain on Investments | | | 2,778,239 | |
Net Increase in Net Assets Resulting From Operations | | | 4,219,073 | |
| | (a) | Net Investment Income includes $16,800 of pro forma additional merger expenses. |
Catalyst Funds
Notes to Financial Statements (continued)
December 31, 2015
With respect to the Insider Buying VA Fund and VA Mid Corp America Fund merger, the acquisition was accomplished by a tax-free exchange of 714,623 shares of the Insider Buying VA Fund (valued at $16,321,997) for 1,952,602 shares of the VA Mid Corp America Fund outstanding on June 20, 2014. The investment portfolio of the VA Mid Corp America Fund, with a fair value of $15,896,411 and identified cost of $12,865,034, was the principal asset acquired by the Insider Buying VA Fund. For financial reporting purposes, assets received and shares issued by the Insider Buying VA Fund were recorded at fair value; however, the identified cost of the investments received from the VA Mid Corp America Fund was carried forward to align ongoing reporting of the Insider Buying VA Fund’s realized and unrealized gains and losses with amounts distributable to shareholders for tax purposes. The aggregate net assets of the Insider Buying VA Fund immediately before the acquisition were $54,403,068. The net assets of the VA Mid Corp America Fund at that date of $16,321,997, including $3,031,377 of unrealized appreciation, were combined with those of the Insider Buying VA Fund, resulting in combined net assets of $70,725,065.
Assuming the acquisition had been completed on January 1, 2014, the beginning of the annual reporting period of the Insider Buying VA Fund, the Insider Buying VA Fund’s pro forma results of operations for the year ended December 31, 2014, are as follows:
| | | | |
Net Investment Income(a) | | $ | 178,639 | |
Net Realized and Unrealized Loss on Investments | | | (1,512,182 | ) |
Net Decrease in Net Assets Resulting From Operations | | | (1,333,543 | ) |
| | (a) | Net Investment Income includes $16,800 of pro forma additional merger expenses. |
Because the investment portfolios of Dividend Capture VA Fund and Insider Buying VA Fund have each been managed as single portfolios since their respective acquisitions were completed, it is not practicable to separate the amounts of revenue and earnings of the VA Income Equity Fund and VA Mid Corp America Fund that have been included in the accompanying relevant Statements of Operations since June 20, 2014.
(2) Significant Accounting Policies
The Funds are each an investment company and each follows accounting and reporting guidance under Financial Accounting Standards Board (“FASB”) Accounting Standards Codification (“ASC”) Topic 946, “Financial Services-Investment Companies”. The following is a summary of significant accounting policies consistently followed by the Funds in the preparation of their financial statements. The policies are in conformity with accounting principles generally accepted in the United States of America (“GAAP”).
The preparation of financial statements in conformity with GAAP requires management to make estimates and assumptions that affect the amounts of assets, liabilities, and disclosure of contingent assets and liabilities at the date of the financial statements and the reported amounts of income and expenses for the period. Actual results could differ from those estimates.
The Trust calculates the NAV for each of the Funds by valuing securities held based on fair value. Fair value is defined as the price that would be received to sell an asset or paid to transfer a liability in an orderly transaction between market participants at the measurement date.
The valuation techniques described below maximize the use of observable inputs and minimize the use of unobservable inputs in determining fair value. The inputs used for valuing the Funds’ investments are summarized in the three broad levels listed below:
| | |
| |
• Level 1 | | - unadjusted quoted prices in active markets for identical investments and/or registered investment companies where the value per share is determined and published and is the basis for current transactions for identical assets or liabilities at the valuation date. |
| |
• Level 2 | | - other significant observable inputs (including quoted prices for similar securities, interest rates, prepayment speeds, credit risk, etc.). |
| |
• Level 3 | | - significant unobservable inputs (including the Funds’ own assumptions in determining the fair value of investments). |
Changes in valuation techniques may result in transfers in or out of an assigned level within the disclosure hierarchy. The Trust recognizes transfers between fair value hierarchy levels at the reporting period end. The inputs or methodology used for valuing investments is not necessarily an indication of the risk associated with investing in those investments.
C A T A L Y S T F U N D S
Catalyst Funds
Notes to Financial Statements (continued)
December 31, 2015
In computing the NAV of the Funds, fair value is based on market valuations with respect to portfolio securities for which market quotations are readily available. Pursuant to Trustee-approved policies, the Trust relies on certain security pricing services to provide the current market value of securities. Those security pricing services value equity securities (including foreign equity securities, exchange-traded funds and closed-end funds) traded on a securities exchange at the last reported sales price on the principal exchange. Equity securities quoted by NASDAQ are valued at the NASDAQ official closing price. If there is no reported sale on the principal exchange, and in the case of over-the counter securities, equity securities are valued at a bid price estimated by the security pricing service. In each of these situations, valuations are typically categorized as Level 1 in the fair value hierarchy. Investments in open-end investment companies are valued at their respective net asset value as reported by such companies and are typically categorized as Level 1 in the fair value hierarchy.
Option contracts are generally valued using the closing price based on quote data from the six major U.S. options exchanges on which such options are traded and are typically categorized as Level 1 in the fair value hierarchy.
Securities for which market quotations are not readily available are valued at fair value under Trust procedures approved by the Trustees. In these cases, a Pricing Committee, established and appointed by the Trustees, determines in good faith, subject to Trust procedures, the fair value of portfolio securities held by a Fund (“good faith fair valuation”). When a good faith fair valuation of a security is required, consideration is generally given to a number of factors including, but not limited to the following: dealer quotes, published analyses by dealers or analysts regarding the security, transactions which provide implicit valuation of the security (such as a merger or tender offer transaction), the value of other securities or contracts which derive their value from the security at issue, and the implications of any other circumstances which have caused trading in the security to halt. With respect to certain categories of securities, the procedures utilized by the Pricing Committee detail specific valuation methodologies to be applied in lieu of considering the aforementioned list of factors. Depending on the source and relative significance of valuation inputs, these instruments may be classified as Level 2 or Level 3 in the fair value hierarchy.
Fair valuation procedures are also used when a significant event affecting the value of a portfolio security is determined to have occurred between the time when the price of the portfolio security is determined and the close of trading on the NYSE, which is when each Fund’s NAV is computed. An event is considered significant if there is both an affirmative expectation that the security’s value will change in response to the event and a reasonable basis for quantifying the resulting change in value. Significant events include significant securities market movements occurring between the time the price of the portfolio security is determined and the close of trading on the NYSE. For securities normally priced at their last sale price in a foreign market, such events can occur between the close of trading in the foreign market and the close of trading on the NYSE.
In some cases, events affecting the issuer of a portfolio security may be considered significant events. Examples of potentially significant events include announcements concerning earnings, acquisitions, new products, management changes, litigation developments, a strike or natural disaster affecting the company’s operations or regulatory changes or market developments affecting the issuer’s industry occurring between the time when the price of the portfolio security is determined and the close of trading on the NYSE. For securities of foreign issuers, such events could also include political or other developments affecting the economy or markets in which the issuer conducts its operations or its securities are traded.
There can be no assurance that a Fund could purchase or sell a portfolio security at the price used to calculate the Fund’s NAV. In the case of good faith fair valued portfolio securities, lack of information and uncertainty as to the significance of information may lead to a conclusion that a prior valuation is the best indication of a portfolio security’s present value. Good faith fair valuations generally remain unchanged until new information becomes available. Consequently, changes in good faith fair valuation of portfolio securities may be less frequent and of greater magnitude than changes in the price of portfolio securities valued at their last sale price, by an independent pricing service, or based on market quotations.
The Trustees have authorized the use of an independent fair valuation service. If the movement in a designated U.S. market index, after foreign markets close, is greater than predetermined levels, the Funds may use a systematic valuation model provided from that independent third party to fair value its international equity securities. Securities which are fair valued according to this model are then typically categorized as Level 2 in the fair value hierarchy.
Catalyst Funds
Notes to Financial Statements (continued)
December 31, 2015
The following is a summary of the inputs used to value the Funds’ investments as of December 31, 2015 based on the three levels defined previously:
| | | | | | | | | | | | | | | | |
| | | LEVEL 1 | | | LEVEL 2 | | | LEVEL 3 | | | Total | |
Dividend Capture VA Fund | | | | | | | | | | | | | | | | |
Investment Securities: | | | | | | | | | | | | |
Common Stocks | | $ | 16,556,099 | | | $ | — | | | $ | — | | | $ | 16,556,099 | |
Preferred Stocks | | | 4,832,706 | | | | — | | | | — | | | | 4,832,706 | |
Exchange-Traded Funds | | | 1,340,005 | | | | — | | | | — | | | | 1,340,005 | |
Cash Equivalents | | | 789,034 | | | | — | | | | — | | | | 789,034 | |
Short-Term Securities Held as Collateral for Securities Lending | | | 1,134,508 | | | | — | | | | — | | | | 1,134,508 | |
| | | | | | | | | | | | | | | | |
Total Investment Securities | | $ | 24,652,352 | | | $ | — | | | $ | — | | | $ | 24,652,352 | |
| | | | | | | | | | | | | | | | |
Insider Buying VA Fund | | | | | | | | | | | | | | | | |
Investment Securities: | | | | | | | | | | | | |
Common Stocks | | $ | 30,308,560 | | | $ | — | | | $ | — | | | $ | 30,308,560 | |
Exchange-Traded Funds | | | 3,630,200 | | | | — | | | | — | | | | 3,630,200 | |
Cash Equivalents | | | 4,284,017 | | | | — | | | | — | | | | 4,284,017 | |
Short-Term Securities Held as Collateral for Securities Lending | | | 5,252,640 | | | | — | | | | — | | | | 5,252,640 | |
| | | | | | | | | | | | | | | | |
Total Investment Securities | | $ | 43,475,417 | | | $ | — | | | $ | — | | | $ | 43,475,417 | |
| | | | | | | | | | | | | | | | |
For the year ended December 31, 2015, there were no Level 3 investments for which significant unobservable inputs were used to determine fair value. Transfers from Level 2 to Level 1 indicate that the fair value of international equity securities used at the previous reporting period end did not occur as of the current reporting period end. The Trust recognizes significant transfers between fair value hierarchy levels at the reporting period end. The following is a summary of the transfers between Level 1 and Level 2 of the fair value hierarchy for the year ended December 31, 2015:
| | | | | | | | |
| | | Transfers from
Level 1 to Level 2 | | | Transfers from
Level 2 to Level 1 | |
Insider Buying VA Fund | | | | | | | | |
Investment Securities: | | | | | | | | |
Common Stocks | | $ | — | | | $ | 1,176,178 | |
| B. | Foreign Currency Translation |
The accounting records of the Funds are maintained in U.S. dollars. Foreign currency amounts are translated into U.S. dollars at the current rate of exchange each business day to determine the value of investments, and other assets and liabilities. Purchases and sales of foreign securities, and income and expenses, are translated at the prevailing rate of exchange on the respective date of these transactions. The Funds do not isolate that portion of the results of operations resulting from changes in foreign exchange rates on investments from fluctuation arising from changes in market prices of securities held. These fluctuations are included with the net realized and unrealized gain or loss from investments and foreign currency transactions.
Certain of the Funds may be subject to equity price risk and foreign currency exchange risk in the normal course of pursuing their investment objectives. Certain of the Funds may invest in various financial instruments including positions in foreign currency contracts and written option contracts to gain exposure to or hedge against changes in the value of equities or foreign currencies.
The following is a description of the derivative instruments utilized by the Funds, including the primary underlying risk exposure related to each instrument type.
Foreign Exchange Contracts—Insider Buying VA Fund may enter into forward foreign exchange contracts. A forward foreign exchange contract involves an obligation to purchase or sell a specific currency at a future date at a price set at the time of the contract. Such contracts are used to sell unwanted currency exposure that comes with holding securities in a market, or to buy currency exposure where the exposure from holding securities is insufficient to provide the desired currency exposure. The contracts are marked-to-market daily and the change in market value is recorded as unrealized appreciation or depreciation. When a forward foreign currency contract is closed, a Fund records a realized gain or loss equal to the difference between the value at the time it was opened and the value at the time it was closed. These unrealized and realized gains and losses are reported on the Statement of Operations. The Fund could be exposed to risks if the counterparties to the contracts are unable to meet the terms of their contracts and from unanticipated movements in exchange rates. As of December 31, 2015, Insider Buying VA Fund did not have any forward foreign exchange contracts outstanding.
C A T A L Y S T F U N D S
Catalyst Funds
Notes to Financial Statements (continued)
December 31, 2015
Written Options Contracts—The Funds may write options contracts for which premiums received are recorded as liabilities and are subsequently adjusted to the current value of the options written. Premiums received from writing options which expire are treated as realized gains. Premiums received from writing options which are either exercised or closed are offset against the proceeds received or amount paid on the transaction to determine realized gains or losses. Investing in written options contracts exposes a Fund to equity price risk.
The following is a summary of Insider Buying VA Fund’s written option activity for the year ended December 31, 2015:
| | | | | | | | |
Contracts | | Number of Contracts | | | Premium | |
Outstanding at 12/31/2014 | | | — | | | $ | — | |
Options written | | | 550 | | | | 159,830 | |
Options expired | | | (500 | ) | | | (148,989 | ) |
Options exercised | | | (50 | ) | | | (10,841 | ) |
| | | | | | | | |
Outstanding at 12/31/2015 | | | — | | | $ | — | |
| | | | | | | | |
The effect of derivative instruments on the Statements of Operations for the year ended December 31, 2015 was as follows:
| | | | | | | | | | | | |
Primary Risk Exposure | | Location of Gain (Loss)
on Derivatives
Recognized in Income | | Fund | | Realized
Gain (Loss)
on Derivatives
Recognized from
Operations | | | Change in
Unrealized
Appreciation
(Depreciation)
on Derivatives
Recognized from
Operations | |
Written Option Contracts | | Net realized gain on written option transactions | | Insider Buying VA Fund | | $ | 148,989 | | | $ | — | |
| Balance | Sheet Offsetting Information |
Netting Agreements—During the ordinary course of business, the Funds may enter into transactions subject to enforceable netting agreements or other similar arrangements (“netting agreements”). Generally, the right to offset in netting agreements allows a Fund to offset any exposure to a specific counterparty with any collateral received or delivered to that counterparty based on the terms of the agreement. Generally, a Fund manages its cash collateral and securities collateral on a counterparty basis. As of December 31, 2015, the Funds were not invested in any portfolio securities or derivatives that could be netted subject to the netting agreements.
The following tables provide a summary of offsetting financial liabilities and derivatives and the effect of derivative instruments on the Statements of Assets and Liabilities as of December 31, 2015.
| | | | | | | | | | | | | | | | | | | | | | | | |
| | | | | | | | | | | | Gross Amounts Not Offset in
Statements of Assets and
Liabilities | | | | |
Fund | | Gross Amounts of
Recognized
Liabilities | | | Gross Amounts
Offset in Statements
of Assets and
Liabilities | | | Net Amounts of
Liabilities Presented in
Statements of
Assets and
Liabilities | | | Financial
Instruments | | | Cash Collateral
Pledged | | | Net Amount
(not less than 0) | |
Dividend Capture VA Fund | | $ | 1,134,508 | | | $ | — | | | $ | 1,134,508 | | | $ | (1,134,508 | ) | | $ | — | | | $ | — | |
Insider Buying VA Fund | | | 5,252,640 | | | | — | | | | 5,252,640 | | | | (5,252,640 | ) | | | — | | | | — | |
The notional value of the written options contracts outstanding as of December 31, 2015 and the month-end average notional amount for the year ended December 31, 2015 are detailed in the table below:
| | | | | | | | |
Fund | | Average Month-End
Notional Amount | | | December 31, 2015
Notional Amount | |
Insider Buying VA Fund | | $ | 497,692 | | | $ | — | |
Derivative positions open during the year and at year end, if any, are reflected for each Fund in the previous tables. The volume of these positions relative to each Fund’s net assets at the close of the reporting period is generally higher than the volume of such
Catalyst Funds
Notes to Financial Statements (continued)
December 31, 2015
positions at the beginning of the reporting period. The Funds value derivative instruments at fair value and recognize changes in fair value currently in the results on operations.
To generate additional income, the Funds may lend a certain percentage of their total assets, to the extent permitted by the 1940 Act or the rules or regulations thereunder, on a short-term basis to certain brokers, dealers or other financial institutions pursuant to a securities lending agreement with Morgan Stanley & Co. LLC. In determining whether to lend to a particular broker, dealer or financial institution, the Advisor will consider all relevant facts and circumstances, including the size, creditworthiness and reputation of the borrower. Any loans made will be continuously secured by collateral in cash at least equal to 100% of the value of the securities on loan for the Funds, based on the prior day’s closing price. When the collateral falls below specified amounts the lending agent will use its best effort to obtain additional collateral on the next business day to meet required amounts under the security lending agreement. The Funds receive payments from the borrowers equivalent to the dividends and interest that would have been earned on securities on loan. In addition, the Funds lending securities receive an annual minimum securities lending fee and retain a portion of the interest, dividends and other distributions received on investment of cash collateral. Collateral is marked-to market daily. One of the risks in lending portfolio securities, as with other extensions of credit, is the possible delay in recovery of the securities or possible loss of rights in the collateral should the borrower fail financially. Although the loan is fully collateralized, if a borrower defaults, a Fund could lose money. There is also the risk that, when lending portfolio securities, the securities may not be available to a Fund on a timely basis and a Fund may, therefore, lose the opportunity to sell the securities at a desirable price. In addition, in the event that a borrower of securities would file for bankruptcy or become insolvent, disposition of the securities may be delayed pending court action. Loans are subject to termination by the Funds or the borrower at any time and, therefore, are not considered to be illiquid investments. Huntington National Bank serves as the custodian for related collateral and receives an annual securities lending fee for collateral monitoring and recordkeeping services.
As of December 31, 2015, the following Funds had securities with the following market values on loan and related activity for the year ended December 31, 2015:
| | | | | | | | | | | | | | | | | | | | |
Fund | | Value of Loaned
Securities | | | Value of
Collateral | | | Average Loan
Outstanding During
the Year | | | Securities Lending
Income Received by
the Funds | | | Fees Paid by the Funds
to Huntington from
Securities Lending | |
Dividend Capture VA Fund | | $ | 1,100,976 | | | $ | 1,134,508 | | | $ | 1,425,163 | | | $ | 7,800 | | | $ | 1,560 | |
Insider Buying VA Fund | | | 5,042,941 | | | | 5,252,640 | | | | 10,798,419 | | | | 325,892 | | | | 65,178 | |
The amount of securities lending transactions accounted for as secured borrowings in accordance with ASU 2014-11 “Repurchase-to-Maturity Transactions, Repurchase Financings, and Disclosures” for the Dividend Capture VA Fund and the Insider Buying VA Fund at December 31, 2015 classified as Overnight and Continuous were $1,100,976 and $5,042,941, respectively. The Dividend Capture VA Fund and the Insider Buying VA Fund recorded liabilities for the return of collateral on loaned securities of $1,134,508 and $5,252,640, respectively.
| E. | Security Transactions and Related Income |
During the period, investment transactions are accounted for no later than the first calculation of the NAV on the business day following the trade date. For financial reporting purposes, however, security transactions are accounted for on trade date on the last business day of the reporting period. Securities gains and losses are calculated on the identified cost basis. Interest income and expenses are accrued daily. Dividends, less foreign tax withholding (if any), are recorded on the ex-dividend date.
| F. | Dividends and Distributions to Shareholders |
Dividends from net investment income, if any, are declared and paid annually by the Funds. Net realized capital gains, if any, are distributed at least annually. The amount of dividends from net investment income and net realized gains are determined in accordance with the federal income tax regulations, which may differ from GAAP. These “book/tax” differences are either considered temporary or permanent in nature. To the extent these differences are permanent in nature (e.g. tax treatment of foreign currency gain/loss, distributions and income received from pass through investments and net investment loss adjustments), such amounts are reclassified within the capital accounts based on their nature for federal income tax purposes; temporary differences do not require reclassification. Temporary differences are primarily attributable to losses deferred due to wash sales and straddles, capital loss carryfowards, non-taxable distributions from underlying investments and the tax treatment of passive foreign investment companies.
C A T A L Y S T F U N D S
Catalyst Funds
Notes to Financial Statements (continued)
December 31, 2015
The Funds may own shares of real estate investments trusts (“REITs”) which report information on the source of their distributions annually. Distributions received from investments in REITs in excess of income from underlying investments are recorded as realized gain and/or as a reduction to the cost of the individual REIT.
The Funds may invest in Master Limited Partnerships (“MLPs”), which generally are treated as partnerships for Federal income tax purposes. As a limited partner in the MLPs, the Fund includes its allocable share of the MLPs’ taxable income in computing its own taxable income.
Expenses directly attributable to a Fund are charged to that Fund. Expenses not directly attributable to a Fund are allocated proportionally among various Funds or all Funds within the Trust in relation to the net assets of each Fund or on another reasonable basis.
It is the policy of each Fund to qualify or continue to qualify as a regulated investment company by complying with the provisions available to certain investment companies, as defined in applicable sections of the Internal Revenue Code, and to make distributions of net investment income and net realized capital gains sufficient to relieve it from all, or substantially all, federal income taxes. In addition to complying with the federal tax requirements applicable to regulated investment companies, the Funds also plan to comply with certain diversification standards applicable to underlying assets of variable annuity contracts in order to avoid taxation on the variable contract owners with respect to earnings allocable to the contract from investments in the Funds.
Withholding taxes on foreign interest, dividends and capital gains with respect to the Funds have been provided for in accordance with each applicable country’s tax rules and rates.
As of December 31, 2015, the tax cost of securities and the breakdown of unrealized appreciation (depreciation) for each Fund was as follows:
| | | | | | | | | | | | | | | | |
Fund | | Tax Cost of
Securities | | | Unrealized
Appreciation | | | Unrealized
Depreciation | | | Net Unrealized
Appreciation/
(Depreciation)(a) | |
Dividend Capture VA Fund | | $ | 25,397,538 | | | $ | 1,393,586 | | | $ | (2,138,772 | ) | | $ | (745,186 | ) |
Insider Buying VA Fund | | | 40,191,705 | | | | 4,958,780 | | | | (1,675,068 | ) | | | 3,283,712 | |
| | (a) | The differences between the book-basis unrealized appreciation (depreciation) are attributable primarily to: tax deferral of losses on wash sales, the tax treatment of Trust Preferred securities, hybrid securities and Grantor trusts, differences related to partnership investments, the realization for tax purposes of unrealized gains/losses on investments in passive foreign investment companies and the return of capital adjustments from real estate investment trusts. |
The tax character of distributions paid during the fiscal year ended December 31, 2015, was as follows:
| | | | | | | | | | | | |
| | | Distributions Paid From(a) | | | | |
Fund | | Ordinary
Income | | | Net Long-Term
Capital Gains | | | Total Taxable
Distributions | |
Dividend Capture VA Fund | | $ | 1,122,139 | | | $ | — | | | $ | 1,122,139 | |
Insider Buying VA Fund | | | 675,424 | | | | 5,647,140 | | | | 6,322,564 | |
| | (a) | The tax character of distributions paid may differ from the character of distributions shown on the statements of changes in net assets due to short-term capital gains being treated as ordinary income for tax purposes. |
The tax character of distributions paid during the fiscal year ended December 31, 2014, was as follows:
| | | | | | | | | | | | |
| | | Distributions Paid From(a) | | | | |
Fund | | Ordinary
Income | | | Net Long-Term
Capital Gains | | | Total Taxable
Distributions | |
Dividend Capture VA Fund | | $ | 1,450,837 | | | $ | — | | | $ | 1,450,837 | |
Insider Buying VA Fund | | | 273,158 | | | | 2,815,787 | | | | 3,088,945 | |
| | (a) | The tax character of distributions paid may differ from the character of distributions shown on the statements of changes in net assets due to short-term capital gains being treated as ordinary income for tax purposes. |
Catalyst Funds
Notes to Financial Statements (continued)
December 31, 2015
As of December 31, 2015, the components of accumulated earnings (deficit) on a tax basis were as follows:
| | | | | | | | | | | | | | | | | | | | | | | | |
Fund | | Undistributed
Ordinary Income | | | Undistributed
Long-Term
Capital Gains | | | Accumulated
Earnings | | | Accumulated
Capital and
Other Losses | | | Unrealized
Appreciation
(Depreciation) | | | Total
Accumulated
Earnings
(Deficit) | |
Dividend Capture VA Fund | | $ | 979,538 | | | $ | 22,809 | | | $ | 1,002,347 | | | $ | — | | | $ | (745,186 | ) | | $ | 257,161 | |
Insider Buying VA Fund | | | 962,866 | | | | 9,448,950 | | | | 10,411,816 | | | | — | | | | 3,283,519 | | | | 13,695,335 | |
As of December 31, 2015, for federal income tax purposes and the treatment of distributions payable, the Funds had no capital loss carryforwards available to offset future gains.
During the fiscal year ended December 31, 2015, the following Funds utilized capital loss carryforwards:
| | | | |
Fund | | Utilized
Amount | |
Dividend Capture VA Fund | | $ | 1,351,828 | |
Insider Buying VA Fund | | | 359,930 | |
Management of the Funds has reviewed tax positions taken in tax years that remain subject to examination by all major tax jurisdictions, including federal (i.e., the last three tax year ends and the interim tax period since then). Management believes there is no tax liability resulting from unrecognized tax benefits related to uncertain tax positions taken.
(3) Fees and Other Transactions with Affiliates and Other Service Providers
Investment Advisory Fee—During 2015, Huntington Asset Advisors, Inc. (the “Advisor”) served as the Funds’ investment adviser. For the year ended December 31, 2015, the Advisor received a fee for its services, computed daily and paid monthly, at an annual rate of 0.60% of the average daily net assets of each Fund.
The Advisor had agreed to contractually waive all or a portion of its investment advisory fee for the following funds (based on average daily net assets) to which it is otherwise entitled to receive and/or to reimburse certain operating expenses in order to limit each Fund’s total annual fund expenses (after fee waivers, and/or expense reimbursements, and exclusive of acquired fund fees and expenses, brokerage costs, interest, taxes and dividends, and extraordinary expenses) (“Expense Cap”) for the fiscal year ended December 31, 2015, to the following:
| | | | | | | | |
Fund | | Expense Cap(a) | | | Expense Cap
Effective Date | |
VA Dividend Capture Fund | | | 0.99 | % | | | April 30, 2014 | |
VA Situs Fund | | | 1.00 | % | | | April 30, 2014 | |
| | (a) | Effective January 1, 2016, the Advisor has contractually agreed to waive all or a portion of its investment advisory fee (based on average daily net assets) and/or reimburse certain operating expenses of each Fund to the extent necessary in order to limit each Fund’s total annual fund operating expenses (after the fee waivers and/or expense reimbursements, and exclusive of acquired fund fees and expenses, brokerage costs, interest, taxes and dividends, and extraordinary expenses) to not more than 1.25% of each Fund���s daily net assets through April 30, 2017. |
C A T A L Y S T F U N D S
Catalyst Funds
Notes to Financial Statements (continued)
December 31, 2015
Amounts waived or reimbursed in the contractual period may be recouped by the Advisor within three years of the waiver and/or reimbursement. As of December 31, 2015, the following amounts have been waived or reimbursed by the Advisor and are subject to repayment by the respective Fund:
| | | | | | | | |
Fund | | Amount Waived
or Reimbursed | | | Expires
December 31, | |
Dividend Capture VA Fund | | $ | 37,235 | | | | 2018 | |
| | | 25,787 | | | | 2017 | |
| | |
Inside Buyer VA Fund | | | 39,947 | | | | 2018 | |
| | | 23,917 | | | | 2017 | |
Effective December 31, 2015, Huntington National Bank (“Huntington”) sold the Advisor to Rational Capital LLC, who subsequently changed the name of the Advisor to Rational Advisors, Inc.
Administrative Fees—During 2015, Huntington Asset Services, Inc. (“HASI”), a wholly-owned subsidiary of Huntington Bancshares, Inc. (“HBI”), served as Administrator to the Trust. The fees paid for administrative services, for the year ended December 31, 2015, were based on the level of average net assets of each Fund for the period, subject to minimum fees in certain circumstances.
| | |
Maximum Administrative Fee | | Average Daily Net Assets of the Trust |
0.1822% | | On the first $4 billion |
0.1650% | | On the next $2 billion |
0.1575% | | On the next $2 billion |
0.1450% | | On assets in excess of $8 billion |
There was no minimum annual fee per fund or class of shares.
On December 31, 2015, HBI sold HASI to an unrelated party.
Transfer and Dividend Disbursing Agent Fees and Expenses—HASI was the transfer and dividend disbursing agent for the Funds through December 31, 2015. For its services, HASI received a yearly fixed amount per shareholder account, subject to a yearly minimum of $6,000 for each of the Funds. HASI was also entitled to receive additional amounts that may be activity or time-based charges, plus reimbursement for out-of-pocket expenses.
Custodian Fees—Huntington serves as custodian for each of the Funds. Brown Brothers Harriman served as sub-custodian for the foreign assets of the Insider Buying VA Fund. Huntington and Brown Brothers Harriman received fees based on the level of a Fund’s average daily net assets for the period, plus out-of-pocket expenses.
General—Certain officers of the Trust are Officers and/or Directors or Trustees of the above companies.
Each Trustee who is not an “interested person” of the Trust, as such term is defined in the 1940 Act, received a $25,000 annual retainer plus $2,500 per regular Board meeting. The Audit Committee Chairman received $33,000 annual retainer plus $2,500 per regular Board meeting. The Independent Chairman of the Board received a $50,000 annual retainer plus $2,500 per regular Board meeting. The Board or a committee may establish ad hoc committees or sub-committees. Any committee or sub-committee member may be compensated by the Funds for incremental work outside of the regular meeting process based on the value added to the Funds. In addition, the Funds reimbursed Trustees for out-of-pocket expenses incurred in conjunction with attendance at meetings. For the year ended December 31, 2015, actual Trustee compensation was $251,500 in aggregate from the Trust.
Affiliated Funds—Pursuant to an exemptive order issued by the Securities and Exchange Commission, the Funds invested in certain, formerly affiliated, money market funds which were managed by the Advisor. Income distributions earned from investments in these funds are recorded as income from affiliates in the accompanying financial statements. A summary of each Fund’s investment in such affiliated money market funds is set forth below:
| | | | | | | | | | | | | | | | | | | | |
Huntington Money Market Fund | | 12/31/14
Market Value | | | Purchases | | | Sales | | | 12/31/15
Market Value | | | Income | |
Dividend Capture VA Fund | | $ | 1,005,371 | | | $ | 8,335,198 | | | $ | (9,340,569 | ) | | $ | — | | | $ | 108 | |
Inside Buyer VA Fund | | | 81,083 | | | | 14,563,271 | | | | (14,644,354 | ) | | | — | | | | 105 | |
| | | | | |
Huntington U.S. Treasury Money Market Fund | | 12/31/14
Market Value | | | Purchases | | | Sales | | | 12/31/15
Market Value | | | Income | |
Dividend Capture VA Fund | | $ | — | | | $ | 2,363,637 | | | $ | (2,363,637 | ) | | $ | — | | | $ | 35 | |
Inside Buyer VA Fund | | | — | | | | 8,577,553 | | | | (8,577,553 | ) | | | — | | | | 498 | |
Catalyst Funds
Notes to Financial Statements (continued)
December 31, 2015
(4) Investment Transactions
Purchases and sales of investments, excluding short-term securities, for the year ended December 31, 2015, were as follows:
| | | | | | | | |
Fund | | Purchases | | | Sales | |
Dividend Capture VA Fund | | $ | 26,138,523 | | | $ | 35,782,920 | |
Insider Buying VA Fund | | | 30,730,617 | | | | 54,982,489 | |
There were no purchases or sales of long-term U.S. government obligations during the year ended December 31, 2015.
(5) Foreign Investment Risk
Compared with investing in the United States, investing in foreign markets involves a greater degree and variety of risk. Investors in international or foreign markets may face delayed settlements, currency controls and adverse economic developments as well as higher overall transaction costs. In addition, fluctuations in the U.S. dollar’s value versus other currencies may erode or reverse gains from investments denominated in foreign currencies or widen losses. Foreign governments may expropriate assets, impose capital or currency controls, impose punitive taxes, impose limits on ownership or nationalize a company or industry. Any of these actions could have severe effect on security prices and impair the Fund’s ability to bring its capital or income back to the U.S. Exchange rate. Fluctuations also may impair an issuer’s ability to repay U.S. dollar denominated debt, thereby increasing credit risk of such debt. Finally, the value of foreign securities may be affected by incomplete, less frequent or inaccurate financial information about their issuers, social upheavals or political actions ranging from tax code changes to government collapse. Foreign companies may also receive less coverage than U.S. companies by market analysts, and financial reporting standards or regulatory requirements may not be comparable to those applicable to U.S. companies.
The Trust participated in a short-term credit agreement (“Line of Credit”) with Huntington during the year ended December 31, 2015. Under the terms of the agreement, the Funds could borrow up to $30 million at an interest rate of LIBOR plus 135 basis points. The purpose of the agreement was to meet temporary or emergency cash needs, including redemption requests that might otherwise require the untimely disposition of securities. Huntington received an annual facility fee of 0.125% on $30 million as well as an additional annual fee of 0.125% on any unused portion of the credit facility for providing the Line of Credit. Each Fund in the Trust paid a pro-rata portion of this facility fee, and unused fee, plus any interest on amounts borrowed. For the year ended December 31, 2015, the following Funds had borrowings under this Line of Credit.
| | | | | | | | | | | | | | | | | | | | |
Fund | | Average Loan
Balance | | | Weighted Average
Interest Rate | | | Number of Days
Outstanding(a) | | | Interest Expense
Accrued | | | Maximum Loan
Outstanding | |
Insider Buying VA Fund | | $ | 502,394 | | | | 1.52 | % | | | 104 | | | $ | 2,244 | | | $ | 1,819,774 | |
| | (a) | Number of Days Outstanding represents the total days during the year ended December 31, 2015 that each Fund utilized the Line of Credit. |
As of December 31, 2015, the Funds had no outstanding borrowings under this Line of Credit.
On December 30, 2015, a special meeting of the shareholders of the Funds of the Trust was held at the offices of the Trust for the following purposes:
To elect three Trustees to serve on the Board of Trustees until the next meeting of shareholders at which Trustees are elected:
| | | | | | | | | | | | |
| | | For | | | Against | | | Abstain | |
Dividend Capture VA Fund & Insider Buying VA Fund: | | | | | | | | | | | | |
Tobias Caldwell | | | 4,104,458 | | | | 0 | | | | 166,299 | |
Stephen P. Lachenauer | | | 4,099,772 | | | | 0 | | | | 170,985 | |
Donald McIntosh | | | 4,106,334 | | | | 0 | | | | 164,423 | |
To approve an advisory agreement between the Trust and the Advisor with regard to each Fund:
| | | | | | | | | | | | |
| | | For | | | Against | | | Abstain | |
Dividend Capture VA Fund | | | 1,740,594 | | | | 31,776 | | | | 222,753 | |
Insider Buying VA Fund | | | 2,016,153 | | | | 101,784 | | | | 157,694 | |
C A T A L Y S T F U N D S
Catalyst Funds
Notes to Financial Statements (continued)
December 31, 2015
To approve a distribution plan under Rule 12b-1 with regard to each Fund:
| | | | | | | | | | | | |
| | | For | | | Against | | | Abstain | |
Dividend Capture VA Fund | | | 1,723,112 | | | | 35,046 | | | | 236,966 | |
Insider Buying VA Fund | | | 1,972,863 | | | | 101,784 | | | | 157,694 | |
To approve a proposal to permit the Advisor as the investment adviser to the Funds, to hire and replace sub-advisors or to modify sub-advisory agreements without shareholder approval:
| | | | | | | | | | | | |
| | | For | | | Against | | | Abstain | |
Dividend Capture VA Fund | | | 1,671,605 | | | | 70,139 | | | | 253,380 | |
Insider Buying VA Fund | | | 1,970,009 | | | | 134,129 | | | | 171,492 | |
(8) Subsequent Events
Management of the Funds has evaluated the need for disclosure and/or adjustments resulting from subsequent events through the date these financial statements were issued. On January 12, 2016, the Trust terminated its Line of Credit agreement with Huntington. On February 12, 2016, the Huntington VA Dividend Capture Fund and the Huntington VA Situs Fund were renamed the Catalyst Dividend Capture VA Fund and the Catalyst Insider Buying VA Fund, respectively. On, or about, February 22, 2016, the Trust will be renamed the Mutual Fund and Variable Insurance Trust. There were no other additional items requiring adjustment of the financial statements or additional disclosure.
Catalyst Funds
Report of Independent Registered Public Accounting Firm
The Board of Trustees and Shareholders of
the Huntington Funds:
We have audited the accompanying statements of assets and liabilities of the Catalyst Dividend Capture VA Fund (formerly, Huntington VA Dividend Capture Fund) and Catalyst Insider Buying VA Fund (formerly, Huntington VA Situs Fund) (two of the portfolios constituting the Huntington Funds, collectively referred to as the “Funds”), including the portfolios of investments, as of December 31, 2015 and the related statements of operations for the year then ended, the statements of changes in net assets for each of the two years in the period then ended, and the financial highlights for each of the periods indicated therein. These financial statements and financial highlights are the responsibility of the Funds’ management. Our responsibility is to express an opinion on these financial statements and financial highlights based on our audits.
We conducted our audits in accordance with the standards of the Public Company Accounting Oversight Board (United States). Those standards require that we plan and perform the audits to obtain reasonable assurance about whether the financial statements and financial highlights are free of material misstatement. We were not engaged to perform an audit of the Funds’ internal control over financial reporting. Our audits included consideration of internal control over financial reporting as a basis for designing audit procedures that are appropriate in the circumstances, but not for the purpose of expressing an opinion on the effectiveness of the Funds’ internal control over financial reporting. Accordingly, we express no such opinion. An audit also includes examining, on a test basis, evidence supporting the amounts and disclosures in the financial statements and financial highlights, assessing the accounting principles used and significant estimates made by management, and evaluating the overall financial statement presentation. Our procedures included confirmation of securities owned as of December 31, 2015, by correspondence with the custodians. We believe that our audits provide a reasonable basis for our opinion.
In our opinion, the financial statements and financial highlights referred to above present fairly, in all material respects, the financial position of each of the Huntington Funds referred to above at December 31, 2015, the results of their operations for the year then ended, the changes in their net assets for each of two years in the period then ended, and financial highlights for each of the periods indicated therein, in conformity with U.S. generally accepted accounting principles.

Columbus, Ohio
February 18, 2016
C A T A L Y S T F U N D S
Catalyst Funds
Supplemental Information (Unaudited)
Shareholder Expense Examples
Fund Expenses. As a shareholder of a Fund, you incur ongoing costs, including management fees and other Fund expenses. These examples are intended to help you understand your ongoing costs (in dollars) of investing in the Funds and to compare these costs with the ongoing costs of investing in other mutual funds.
These examples are based on an investment of $1,000.00 invested at the beginning of the period and held for the entire six-month period from July 1, 2015 to December 31, 2015.
Actual Expenses. The “Actual” lines of the table provide information about actual account values and actual expenses. You may use the information on this line together with the amount you invested to estimate the expense that you paid over the period. Simply divide your account value by $1,000.00 (for example, an $8,600.00 account value divided by $1,000.00 = 8.60), then multiply the result by the number in the “Actual” line under the heading entitled “Expenses Paid During Period” to estimate the expenses you paid on your account during this period.
Hypothetical Example for Comparison Purposes. The “Hypothetical” lines of the table provide information about hypothetical account values and hypothetical expenses based on the Funds’ actual expense ratios and an assumed rate of return of 5% per year before expenses, which are not the Funds’ actual returns. The hypothetical account values and expenses may not be used to estimate the actual ending account balance or expenses you paid for the period. You may use this information to compare the ongoing costs of investing in the Funds and other funds. To do so, compare the 5% hypothetical examples with the 5% hypothetical examples that appear in the shareholder reports of other funds.
Please note that the expenses shown in the table are meant to highlight your ongoing costs only and do not reflect any transactional costs, such as withdrawal charges, mortality and expense risk fees and other charges that may be assessed by participating insurance companies under the separate accounts, variable annuity contracts or variable life insurance policies. Therefore, the “Actual” and “Hypothetical” lines of the table are useful in comparing ongoing costs only, and will not help you determine the relative total costs of owning different funds. In addition, if these transactional costs were included, your costs would have been higher.
| | | | | | | | | | | | | | | | |
| | | Beginning
Account
Value,
July 1, 2015 | | | Ending
Account
Value,
December 31, 2015 | | | Expenses
Paid
During
Period(a) | | | Annualized
Expense
Ratio | |
Dividend Capture VA Fund | | | | | | | | | | | | | | | | |
Actual | | $ | 1,000.00 | | | $ | 985.20 | | | $ | 4.96 | | | | 0.99 | % |
Hypothetical(b) | | $ | 1,000.00 | | | $ | 1,020.20 | | | $ | 5.05 | | | | 0.99 | % |
Insider Buying VA Fund | | | | | | | | | | | | | | | | |
Actual | | $ | 1,000.00 | | | $ | 899.50 | | | $ | 4.88 | | | | 1.02 | % |
Hypothetical(b) | | $ | 1,000.00 | | | $ | 1,020.07 | | | $ | 5.19 | | | | 1.02 | % |
| (a) | Expenses are equal to the Fund’s annualized expense ratios, multiplied by the average account value over the period, multiplied by 184/365 (to reflect the one-half year period). The annualized expense ratios reflect reimbursement of expenses by the Fund's Advisor for the period beginning July 1, 2015 to December 31, 2015. The “Financial Highlights” tables in the Fund's financial statements, included in the report, also show the gross expense ratios, without such reimbursements. |
| (b) | Hypothetical assumes 5% annual return before expenses. |
Catalyst Funds
Board of Trustees and Trust Officers (Unaudited)
WHO MANAGES AND PROVIDES SERVICES TO THE FUNDS
Trustees and Officers
The following tables provide information about Board of Trustees and the senior officers of the Trust. Each of the Trustees is deemed to be an Independent Trustee of the Trust. Each Trustee oversees all portfolios of the Trust and serves for an indefinite term (subject to mandatory retirement provisions). Information about each Trustee is provided below and includes each person’s: name, address, age (as of the date of the Funds’ most recent fiscal year end), present position(s) held with the Trust, principal occupations for the past five years. Unless otherwise noted, each officer is elected annually by the Board. Each Trustee and officer also serves in the same capacity for Strategy Shares, another open-end investment company whose series are managed by the Advisor. Collectively, The Catalyst Funds and Strategy Shares comprise the “Fund Complex” which is comprised of 9 separate series.
As of December 31, 2015, the Trustees and Officers as a group owned less than 1% of the shares of each Fund.
INDEPENDENT TRUSTEES BACKGROUND
| | | | | | | | | | |
Name, Address and Age | | Position
with the
Trust | | Term of
Office
and
Length
of Time
Served* | | Principal Occupation(s) During
Past 5 Years | | Number of
Portfolios in
Fund Complex
Overseen by
Trustee | | Other Directorships
Held by Trustee |
Tobias Caldwell 36 N. New York Avenue Huntington, NY 11743 48 | | Chairman of the Board and Trustee | | Since January 2016 | | Managing member, Bear Properties, LLC (2006 - present) (real estate firm); Managing member, PTL Real Estate, LLC (2000 - present) (real estate/investment firm); Managing member, Genovese Family Enterprises, LLC (1999 - present) (real estate firm). | | 9 | | Lead independent trustee and Chair of Audit Committee, Strategy Shares (January 2016 - present). Lead independent trustee and Chair of Audit Committee, Mutual Fund Series Trust, 45 funds (2006 - present). |
Stephen P. Lachenauer 36 N. New York Avenue Huntington, NY 11743 48 | | Trustee | | Since January 2016 | | Attorney, private practice. | | 9 | | Board Member, Strategy Shares (January 2016 - present); Trustee, TCG Financial Series Trusts I-X, 10 funds (2015 - present). |
Donald McIntosh 36 N. New York Avenue Huntington, NY 11743 47 | | Trustee | | Since January 2016 | | Credit risk review analyst, Santander Holdings USA (May 2015 - present); Governance analyst, Santander Bank (2011 - April 2015). | | 9 | | Board Member, Strategy Shares (January 2016 - present); Trustee, TCG Financial Series Trusts I-X, 10 funds (2015 - present). |
| * | The term of office of each Trustee is indefinite. |
C A T A L Y S T F U N D S
Catalyst Funds
Board of Trustees and Trust Officers (continued)
Officers*
| | |
Name Age Positions Held with Trust Address Date Service Began with The Trust | | Principal Occupation(s) and Previous Position(s) |
Lisa K. Householder Age: 50 PRESIDENT and CHIEF EXECUTIVE OFFICER 37 West Broad Street Columbus, OH 43215 Began Serving: December 2015 | | Principal Occupation(s): Assistant Vice President, Relationship Management, Ultimus Fund Solutions, LLC (“Ultimus”) (December 2015 to present); President and Chief Executive Officer, Strategy Shares (December 2015 to present). Previous Position(s): Vice President, Relationship Management, Huntington Asset Services, Inc. (n/k/a Ultimus Asset Services, LLC) (January 2015 to December 2015); Senior Vice President, Client Executive, Citi Fund Services (2007 to 2014). |
Martin R. Dean Age: 52 ANTI-MONEY LAUNDERING OFFICER AND CHIEF COMPLIANCE OFFICER 37 West Broad Street Columbus, OH 43215 Began Serving: July 2013 | | Principal Occupation(s): Vice President and Director of Fund Compliance, Ultimus Fund Solutions, LLC (“Ultimus”) (December 2015 to present); Anti-Money Laundering Officer and Chief Compliance Officer, Strategy Shares (July 2013 to present); Assistant Chief Compliance Officer, Ultimus Managers Trust (January 2016 to present); Assistant Chief Compliance Officer, Unified Series Trust (January 2016 to present). Previous Position(s): Senior Vice President and Compliance Manager, Huntington Asset Services, Inc. (n/k/a Ultimus Asset Services, LLC) (July 2013 to December 2015); Director and Fund Accounting and Fund Administration Product Manager, Citi Fund Services (2008 to June 2013) |
Bryan W. Ashmus Age: 43 TREASURER 37 West Broad Street Columbus, OH 43215 Began Serving: November 2013 | | Principal Occupation(s): Vice President and Director of Financial Administration, Ultimus Fund Solutions, LLC (“Ultimus”) (December 2015 to present); Principal Financial Officer and Treasurer, Valued Advisers Trust (December 2013 to present); Treasurer, Strategy Shares (November 2013 to present). Previous Position(s): Vice President and Manager of Financial Administration, Huntington Asset Services, Inc. (n/k/a Ultimus Asset Services, LLC) (September 2013 to December 2015); Vice President, Fund Administration, Citi Fund Services (May 2005 to September 2013). |
Tiffany R. Franklin Age: 40 SECRETARY 2960 N. Meridian Street, Suite 300 Indianapolis, IN 46208 Began Serving: December 2015 | | Principal Occupation(s): Senior Paralegal, Ultimus Fund Solutions, LLC (“Ultimus”) (December 2015 to present); Secretary, Strategy Shares (December 2015 to present); Secretary, Capitol Series Trust (December 2015 to present). Previous Position(s): Paralegal, Huntington Asset Services, Inc. (n/k/a Ultimus Asset Services, LLC) (April 2012 to December 2015); Assistant Secretary, The Huntington Funds, (November 2012 to December 2015); Assistant Secretary, Strategy Shares (November 2012 to December 2015); Assistant Secretary, Capitol Series Trust (September 2013 to December 2015); Florida Registered Paralegal, Anton Legal Group (February 2007 to June 2011). |
Jennifer A. Bailey Age: 47 ASSISTANT SECRETARY 36 N. New York Avenue Huntington, NY 11743 Began Serving: December 2015 | | Principal Occupation: Director of Legal Services, MFund Services LLC (2012 to present). Previous Position(s): Attorney, Weiss & Associates (December 2008 to June 2010). |
| * | Officers do not receive any compensation from the Trust. |
Catalyst Funds
BOARD OF TRUSTEES’ CONSIDERATION OF INVESTMENT ADVISORY AGREEMENT FOR
THE HUNTINGTON VA FUNDS (the “Funds”) (Unaudited)
MEETING OF AUGUST 20, 2015
The Board of Trustees is responsible for determining whether to approve the Funds’ investment advisory agreements. At a meeting held on August 20, 2015, the Board unanimously approved the investment advisory agreements (the “Advisory Agreements”) between Huntington Asset Advisors, Inc. (the “Advisor”) and the Funds. Pursuant to the Advisory Agreements between the Advisor and the Funds, the Advisor provides advisory services to the Funds.
During the review process, the Board received assistance and advice from, and met separately with, independent legal counsel. In approving each of the Advisory Agreements, the Board, including a majority of the independent Trustees, considered many factors, among the most significant of which are: (1) the nature of the services provided to the Funds by the Advisor in relation to the advisory fees; (2) the individual performance of the Funds; (3) the Advisor’s costs and the profits realized through providing the Funds with advisory services; (4) whether the Advisor has realized or may realize economies of scale in providing services to the Funds and, if so, whether these economies are shared with the Funds; and (5) a comparison of the fees and performance of comparable funds.
Nature, Extent and Quality of Services in Relation to the Advisory Fee. In considering the nature, extent and quality of the services provided by the Advisor, the Board reviewed information relating to the Advisor’s operations and personnel. Among other things, the Advisor provided descriptions of its organizational and management structure, biographical information on its supervisory and portfolio management staff on a fund-by-fund basis, and financial information. The Trustees also took into account the financial condition of the Advisor with respect to its ability to provide the services required under the Advisory Agreements. The Board determined that the nature, extent and quality of the services provided by the Advisor in relation to the advisory fees were acceptable.
Individual Performance of the Funds. The Board reviewed the Funds’ performance record and the Advisor’s management styles in relation to comparable funds and appropriate benchmarks. The Board noted that the Board reviews on a quarterly basis detailed information about each Funds’ performance. The Board also reviewed various comparative data for each of the Funds, including, among other information, each Fund’s performance compared to similar funds based on information provided by Strategic Insight Inc. (“Strategic Insight”) for the one-, three-, five- and ten-year periods ending May 31, 2015, as applicable, as well as each Fund’s performance compared to its benchmark index for the one-, three-, five-, and ten-year periods ending May 31, 2015, as applicable.
Advisor’s Costs and the Profits Realized Through Providing the Funds With Advisory Services. In considering the reasonableness of the advisory fees, the Board reviewed information provided by the Advisor setting forth all revenues and other benefits, both direct and indirect, received by the Advisor and its affiliates attributable to managing each of the Funds individually, the cost of providing such services and the resulting profitability to the Advisor and its affiliates from these relationships. The Board also took into account the Advisor’s agreement to limit the total direct net annual operating expenses of the VA Dividend Capture Fund to not more than 0.99% of its average daily net assets through April 30, 2016. The Board also took into account the Advisor’s agreement to limit the total direct net annual operating expenses of the VA Situs Fund to not more than 1.00% of its average daily net assets through April 30, 2016. The Trustees determined that the profitability of the Advisor was acceptable in relation to the nature and quality of services provided to the Funds.
Economies of Scale in Providing Services to the Funds and Whether These Economies are Shared With the Funds. The Board also considered the effect of the Funds’ growth and size on their performance and fees. The Board considered the fees under the Advisory Agreements for each Fund and possible economies of scale that may be realized as the assets of the Funds grow. The Board noted that none of the Funds was currently large enough to have realized economies of scale. However, the Board noted that the administrative fee charged to the Funds included fee breakpoints, which allowed the Funds to realize economies of scale as the assets of the Funds increased over time.
Comparison of the Fees and Performance of Comparable Funds. With respect to the Funds’ performance and fees, the Board considered comparisons to other mutual funds with comparable investment programs to be particularly useful, given the high degree of competition in the mutual fund business. The Board used peer group information provided by Strategic Insight with respect to its comparable fee and performance analysis for the Funds. The data for the fee and performance analysis was generated on an aggregate portfolio level since not all Funds offer the same types of share classes. The Board noted that the Advisor does not provide services to other accounts. The Board also took into account updated fee and expense information from management which reflected the impact of certain waivers and reimbursements.
Other Considerations. The Board also requests and receives substantial and detailed information about the Funds and the Advisor on a regular basis. The Advisor provides much of this information at each regular meeting of the Board and furnishes additional reports in connection with the Board’s formal review of the Advisory Agreements. The Board may also receive information between regular meetings relating to particular matters as the need arises. The Board’s evaluation of the Advisory Agreements is informed by reports covering such matters as the Advisor’s investment philosophy, personnel, and processes; operating strategies; each Fund’s short- and long-term performance (in absolute terms, both on a gross basis and net of expenses, as well as in relationship to its particular
C A T A L Y S T F U N D S
Catalyst Funds
BOARD OF TRUSTEES’ CONSIDERATION OF INVESTMENT ADVISORY AGREEMENT FOR
THE HUNTINGTON VA FUNDS (the “Funds”) (Unaudited) (continued)
investment program and certain competitive funds and/or other benchmarks, as appropriate) and comments on reasons for performance; the Funds’ expenses (including the advisory fee itself and the overall expense structure of the Funds, both in absolute terms and relative to similar and/or competing funds, with due regard for contractual or voluntary expense limitations); the use and allocation of brokerage commissions derived from trading the Funds’ portfolio securities; the nature and extent of the advisory and other services provided to the Funds by the Advisor and its affiliates; compliance and audit reports concerning the Funds (including communications from regulatory agencies), as well as the Advisor’s responses to any issues raised therein; and relevant developments in the mutual fund industry and how the Funds and the Advisor are responding to them. In the course of their deliberations regarding the Advisory Agreements, the Board also evaluated, among other things, the Advisor’s ability to supervise each of the Fund’s other service providers and their compliance programs.
The Board based its decision to approve the Advisory Agreements on the totality of the circumstances and relevant factors and with a view to past and future long-term considerations. Not all of the factors and considerations identified above are relevant to each of the Funds, nor does the Board consider any one of them to be determinative. With respect to the factors that are relevant, the Board’s decision to approve the Advisory Agreements reflects its determination that the Advisor’s performance and actions provide an acceptable basis to support the decision to continue the existing arrangements.
While attention was given to all information furnished, the following discusses the primary factors relevant to the Board’s decisions. In each case, the Board concluded that the Funds’ performance was acceptable and that the Funds’ advisory fee and total expenses, which included the administrative fee, were reasonable in light of the quality and nature of services provided by the Advisor and its affiliates.
Huntington VA Dividend Capture Fund
Among other data considered, the Board noted that the Fund underperformed the average and median of its peer group for the one-, three-, five-year periods ended May 31, 2015, and the Fund outperformed the median and underperformed the average of its peer group for the ten-year period ended May 31, 2015. The Board also noted that the Fund underperformed its benchmark index for the one-, three-, five- and ten-year periods ended May 31, 2015. The Board also considered the Fund’s advisory fee and total expenses, which included the administrative fee. The Board noted that the Fund’s combined advisory/administrative fee and total net expenses were above the average and median of its peer group, respectively. The Board took into consideration the Advisor’s discussion regarding the Fund’s performance, including the impact of market conditions on the Fund’s performance, management’s plans for the Fund, and management’s continued close monitoring of the Fund’s performance.
Huntington VA Situs Fund
Among other data considered, the Board noted that the Fund underperformed the average and median of its peer group for the one, three-, five and ten-year periods ended May 31, 2015. The Board also noted that the Fund underperformed its benchmark index for the one-, three-, five-and ten-year periods ended May 31, 2015. The Board also considered the Fund’s advisory fee and total expenses, which included the administrative fee. The Board noted that the Fund’s combined advisory/administrative fee was above the average and below the median of its peer group and total net expenses were above the average and median of its peer group. The Board took into consideration the Advisor’s discussion regarding the Fund’s performance, including the impact of market conditions on the Fund’s performance, and management’s continued close monitoring of the Fund’s performance.
MEETING OF OCTOBER 27, 2015
The Board of Trustees is responsible for determining whether to approve the Funds’ investment advisory agreements. The Board met on several occasions and considered that, as a result of a proposed change of control transaction, Rational Capital, LLC (“Rational Capital”), an affiliate of Catalyst Capital Advisors, LLC (“Catalyst”), would acquire the outstanding shares of Huntington Asset Advisors, Inc. (“HAA”), the current Advisor to the Funds, and HAA would be renamed Rational Advisors, Inc. (“Rational Advisors”). At a meeting held on October 27, 2015, the Board, including a majority of the Trustees who are not interested persons as defined in Section 2(a)(19) of the Investment Company Act of 1940, unanimously approved, and recommended for shareholder approval, the investment advisory agreement (the “Advisory Agreement”) between Rational Advisors and the Funds. Pursuant to the Advisory Agreement between Rational Advisors and the Funds, Rational Advisors would provide advisory services to the Funds.
During the review process, the Board received assistance and advice from, and met separately with, independent legal counsel. The Trustees also had the benefit of several presentations made by Rational Advisors’, management personnel, during which a number of topics, including Rational Advisors’ investment process, investment strategies, diversification, assets under management, personnel and resources, compliance policies, procedures and systems, risk management and Catalyst’s and the firm’s personnel’s overall performance were reviewed and discussed. In approving the Advisory Agreement, the Board, including a majority of the independent Trustees, considered many factors, among the most significant of which are: (1) the nature, extent and quality of services to be
Catalyst Funds
BOARD OF TRUSTEES’ CONSIDERATION OF INVESTMENT ADVISORY AGREEMENT FOR
THE HUNTINGTON VA FUNDS (the “Funds”) (Unaudited) (continued)
provided by Rational Advisors; (2) the investment performance of funds managed by an affiliate of Rational Advisors; (3) the cost of services to be provided and the profits to be realized by Rational Advisors and its affiliates from their relationships with the Funds; (4) any economies of scale that would be realized due to the Funds’ growth; (5) whether fee levels reflect such possible economies of scale for the benefit of investors; and (6) comparisons of services to be rendered to and fees to be paid by the Funds with the services provided to and the fees paid by other clients of Rational Advisors’ portfolio management team and Catalyst.
In considering the nature, extent and quality of the services provided by Rational Advisors, the Board reviewed information relating to Rational Advisors’ and Catalyst’s operations and personnel. Among other things, Rational Advisors provided information regarding its proposed services, compliance policies, procedures and systems, organizational and management structure, biographical information of its supervisory and portfolio management staff on a fund-by-fund basis, risk management and financial information. Rational Advisors also provided information regarding resources that would be provided to Rational Advisors by Catalyst. The Trustees also took into account the financial condition of Rational Advisors, its parent company, Rational Capital, and Catalyst, with respect to its ability to provide the services required under the Advisory Agreement. The Board determined that the nature, extent and quality of the services provided by Rational Advisors in relation to the advisory fees were expected to be acceptable.
The Trustees noted that the prior performance of other registered funds managed by members of the Rational Advisors’ portfolio management team was considered satisfactory when compared to the performance of their respective peer groups and relevant indexes. The Board believes that the Funds’ shareholders can benefit from management of the Funds’ assets by Rational Advisors. The Board reviewed the Funds’ historical performance record, and Rational Advisors’ and Catalyst’s management styles in relation to other funds managed by the Rational Advisors portfolio managers and appropriate benchmarks. The Board also reviewed various comparative data for each of the Funds provided to them in connection with their consideration of the renewal of the HAA Advisory Agreement, including, among other information, each Fund’s performance compared to similar funds based on information provided by Strategic Insight Inc. (“Strategic Insight”) for the one-, three-, five- and ten-year periods ending May 31, 2015, as applicable, as well as each Fund’s performance compared to its benchmark index for the one-, three-, five-, and ten-year periods ending May 31, 2015, as applicable.
In considering the reasonableness of the advisory fees, the Board considered information provided by Rational Advisors setting forth all expected revenues and other benefits, both direct and indirect, received by Rational Advisors and its affiliates attributable to managing each of the Funds individually, the cost of providing such services and the resulting expected profitability to Rational Advisors and its affiliates from these relationships. The Board took into account that the advisory fee of 0.75% for the Funds under the Advisory Agreement with Rational Advisors would be higher than the existing advisory fees of 0.60% pursuant to the Advisory Agreement in place between the Funds and HAA. The Board also took into account Rational Advisors’ agreement to limit the total direct net annual operating expenses of the VA Dividend Capture Fund and VA Situs Fund to not more than 1.00% of each Fund’s average daily net assets through April 30, 2017 (excluding the 0.25% 12b-1 fee which was approved by the Board at a subsequent meeting), and noted that the total direct net annual operating expenses after waivers was higher than the total direct net annual operating expenses after waivers currently in effect for the Funds. The Trustees noted that the advisory fees under the Advisory Agreement were consistent with the advisory fees charged to the other funds managed by Rational Advisors and Catalyst. The Board noted that certain service provider fees were expected to decrease as a result of the renegotiation of service provider arrangements in connection with the change of control transaction. The Trustees determined that the expected profitability of Rational Advisors was acceptable in relation to the nature and quality of services provided to the Funds.
The Board also considered the effect of the Funds’ growth and size on their performance and fees. The Board considered the fees under the Advisory Agreement for each Fund and possible economies of scale that may be realized as the assets of the Funds grow. The Board noted that none of the Funds was currently large enough to have realized economies of scale. However, the Board noted that the administrative fee charged to the Funds included fee breakpoints, which allowed the Funds to realize economies of scale as the assets of the Funds increased over time.
With respect to the Funds’ performance and fees, the Board considered comparisons to other mutual funds to be particularly useful, given the high degree of competition in the mutual fund business. The Board used peer group information provided by Strategic Insight with respect to its comparable fee and performance analysis for the Funds. The data for the fee and performance analysis was generated on an aggregate portfolio level since not all Funds offer the same types of share classes. The Board also took into account pro forma fee and expense information presented by Rational Advisors with respect to the change in various fees and expenses as a result of the Advisory Agreement.
With respect to its consideration of Rational Advisors’ and Catalyst’s compliance program, policies and systems and risk management, the Board considered information provided by Rational Advisors and discussed these matters with Rational Advisors management personnel.
C A T A L Y S T F U N D S
Catalyst Funds
BOARD OF TRUSTEES’ CONSIDERATION OF INVESTMENT ADVISORY AGREEMENT FOR
THE HUNTINGTON VA FUNDS (the “Funds”) (Unaudited) (continued)
In the course of their deliberations regarding the Advisory Agreement, the Board also evaluated, among other things, Rational Advisors’ ability to supervise each of the Fund’s other service providers and their compliance programs. The Board also considered the Rational Advisors’ plans for the Funds, including its plans to expand the Funds’ insurance company relationships and distribution capabilities. The Board considered Rational Advisors’ management’s success in growing the assets of Catalyst-affiliated funds. The Board also considered that Catalyst would provide resources to Rational Advisors to support the services provided to the Funds.
The Board reached the following conclusions regarding the Investment Advisory Agreement, among others: (a) the Advisor possesses the capability and resources to perform the duties required of it under the proposed Investment Advisory Agreement; (b) the Advisor is qualified to manage the Funds’ assets in accordance with the Funds’ respective investment objectives and policies; (c) the Advisor maintains appropriate compliance programs; (d) the Advisor is likely to execute its investment strategies consistently over time; and (e) the proposed advisory fees are reasonable in view of the quality of services to be received by the Funds from the Advisor and the other factors considered. Based on its conclusions, the Board determined that approval of the Advisory Agreement would be in the best interests of the Funds and their shareholders.
The Board based its decision to approve the Advisory Agreement on the totality of the circumstances and relevant factors and with a view to past and future long-term considerations. In approving the Advisory Agreement, the Board, including the disinterested Trustees, did not identify any single factor as controlling, and each Trustee may have attributed different weight to various factors.
Variable investment options are not bank deposits or obligations, are not guaranteed by any bank, and are not insured or guaranteed by the U.S. government, the Federal Deposit Insurance Corporation, the Federal Reserve Board or any other government agency. Investment in variable investment options involves investment risk, including the possible loss of principal.
A copy of the policies and procedures that the Funds use to determine how to vote proxies relating to securities held in the Funds’ portfolios, as well as a record of how the Funds voted any such proxies during the most recent 12-month period ended June 30, is available without charge and upon request by calling 1-800-253-0412 or at www.huntingtonvafunds.com. This information is also available from the EDGAR database on the SEC’s website at www.sec.gov.
The Funds file with the SEC a complete schedule of their portfolio holdings, as of the first and third quarters of their fiscal year, on “Form N-Q”. These filings are available on the SEC’s website at www.sec.gov and may be reviewed and copied at the SEC’s Public Reference Room in Washington, D.C. (call 1-202-551-8090 for information on the operation of the Public Reference Room.) You may also access this information at www.huntingtonvafunds.com by selecting “Form N-Q.”
The Huntington National Bank, a subsidiary of Huntington Bancshares, Inc., is the Custodian of The Funds. Ultimus Asset Services, LLC serves as the Administrator, Transfer Agent and Fund Accountant. Additionally, Brown Brothers Harriman & Co. is the Sub-Custodian of certain of the Funds. Rational Advisors, Inc., serves as Investment Advisor to the Funds. Unified Financial Securities, Inc. serves as the Distributor of The Funds.
This report is authorized for distribution to prospective investors only when preceded or accompanied by the Funds’ prospectus, which contains facts concerning each Fund’s objective and policies, management fees, expenses and other information.
The S&P 500 Value Index®, S&P SmallCap 600 Index® and S&P MidCap 400 Index® are products of S&P Dow Jones Indices LLX (“SPDJI”), and have been licensed for use by the Advisor. Standard and Poor’s® and S&P® are registered trademarks of Standard and Poor’s Financial Services LLC (“S&P”); Dow Jones® is a registered trademark of Dow Jones Trademark Holdings LLC (“Dow Jones”). The Funds are not sponsored, endorsed, sold or promoted by SPDJI, Dow Jones, S&P, their respective affiliates and none of such parties make any representations regarding the advisability of investing in the Funds nor do they have any liability for any errors, omissions, or interruptions of the S&P 500 Value Index®, S&P SmallCap 600 Index® and S&P MidCap 400 Index®.
Shareholder Services: 800-253-0412
(a) As of the end of the period covered by the report, the registrant has adopted a code of ethics that applies to the registrant’s Principal Executive Officer and Principal Financial Officer.
(b) Not applicable.
(c) During the period covered by the report, with respect to the registrant’s code of ethics that applies to its Principal Executive Officer and Principal Financial Officer: there have been no amendments to a provision that relates to any element of the code of ethics definition enumerated in paragraph (b) of this Item 2.
(d) During the period covered by the report, with respect to the registrant’s code of ethics that applies to its Principal Executive Officer and Principal Financial Officer: there have been no waivers granted from a provision that relates to any element of the code of ethics definition enumerated in paragraph (b) of this Item 2.
(e) Not applicable.
| Item 3. | Audit Committee Financial Expert. |
3(a) The registrant’s board of trustees has determined that the registrant does not have an audit committee financial expert. The audit committee determined that, although none of its members meet the technical definition of an audit committee financial expert, the committee has sufficient financial expertise to adequately perform its duties under the Audit Committee Charter without the addition of a qualified expert.
| Item 4. | Principal Accountant Fees and Services. |
(a) Audit Fees billed to the registrant by its principal accountants for the two most recent fiscal years:
Fiscal year ended 2015: $177,300
Fiscal year ended 2014: $284,344
(b) Audit-Related Fees billed to the registrant by its principal accountants for the two most recent fiscal years:
Fiscal year ended 2015: $23,450
Fiscal year ended 2014: $0
Fees for 2015 and 2014 related to the agreed-upon review of items within the Management’s Discussion of Fund Performance sections of the Funds’ Form N-CSR filing. Amount requiring approval of the registrant’s audit committee pursuant to paragraph (c)(7)(ii) of Rule 2-01 of Regulation S-X, $0 and $0 respectively.
(c) Tax Fees billed to the registrant by its principal accountants for the two most recent fiscal years:
Fiscal year ended 2015: $114,700
Fiscal year ended 2014: $223,360
Fees for 2015 and 2014 related to the review of the registrant’s tax returns. Amount requiring approval of the registrant’s audit committee pursuant to paragraph (c)(7)(ii) of Rule 2-01 of Regulation S-X, $0 and $0 respectively.
(d) All other fees billed to the registrant by its principal accountants for the two most recent fiscal years:
Fiscal year ended 2015: $0
Fiscal year ended 2014: $0
Amount requiring approval of the registrant’s audit committee pursuant to paragraph (c)(7)(ii) of Rule 2-01 of Regulation S-X, $0 and $0 respectively.
(e)(1) Audit and Non-Audit Services Pre-Approval Policies and Procedures
I. Purpose
Under the Sarbanes-Oxley Act of 2002 (the “Act”), the Audit Committees of the Board of Trustees of the Mutual Fund and Variable Insurance Trust and Huntington Strategy Shares (each a “Trust” and collectively, the “Trusts”) is responsible for the appointment, compensation and oversight of the work of the Trust’s independent auditor. As part of this responsibility, the Audit Committee is required to grant approval for audit and non-audit services performed by the independent auditor for the Trust in order assure that they do not impair the auditor’s independence from the Trust. In addition, the Audit Committee also must pre-approve its independent auditor’s engagement for non-audit services with the Trust’s investment adviser (not including a sub-adviser whose role is primarily portfolio management and is sub-contracted or overseen by another investment adviser) and any entity controlling, controlled by, or under common control with the investment adviser that provides ongoing services to the Trust, if the engagement relates directly to the operations and/or financial reporting of the Trust.
To implement these provisions of the Act, the Securities and Exchange Commission (the “SEC”) has issued rules specifying the types of services that the Trust’s independent auditor may not provide to the Trust, as well as the Audit Committee’s administration of the engagement of the independent auditor. Under these rules, the SEC has provided that a permissible approval of audit and non-audit services can take the form of either (i) a general pre-approval, or (ii) a specific pre-approval (where a specific type
of service is authorized, generally subject to a fee maximum). General pre-approvals are authorized by SEC rules only subject to detailed policies and procedures. Unless a type of service has received general pre-approval, it will require specific pre-approval by the Audit Committee if it is to be provided by the independent auditor. Accordingly, the Audit Committee has adopted these Audit and Non-Audit Services Pre-Approval Policies and Procedures, which set forth the procedures and the conditions pursuant to which services for the Trust may be performed by the independent auditor under pre-approvals.
II. General Pre-Approval Policies
It is the policy of the Audit Committee that audit and non-audit services to be performed by the Trust’s independent auditor be pre-approved only when in the best interests of the Trust’s shareholders and fully consistent with applicable law and, particularly, the maintenance of the auditor’s independence. In granting any pre-approval, consideration shall be given to:
| | 1. | the qualifications of the auditor to perform the services involved; |
| | 2. | the proposed costs (which may be presented as an estimate or based on professional time charges subject to a ceiling) of the services and the reasonableness thereof; |
| | 3. | the permissibility of the services under applicable rules and guidance of the SEC; |
| | 4. | the effect, if any, of the performance of the proposed services on the auditor’s independence; |
| | 5. | the effect of the compensation for the proposed services on the auditor’s independence; and |
| | 6. | the effect, if any, of the proposed services on the Trust’s ability to manage or control risk or to improve audit quality. |
In accordance with SEC rules, non-audit services performed by the Trust’s independent auditor may not include the following:
| | 1. | Bookkeeping or other services related to the accounting records or financial statements of the audit client; |
| | 2. | Financial information systems design and implementation; |
| | 3. | Appraisal or valuation services, fairness opinions or contribution-in-kind reports; |
| | 5. | Internal audit outsourcing services; |
| | 6. | Management functions or human resources; |
| | 7. | Broker-dealer, investment adviser or investment banking services; and |
| | 8. | Legal services and expert services unrelated to the audit. |
III. Procedures for Pre-Approval by the Audit Committee
| | 1. | Requests for pre-approval shall be in writing and may be made by either the independent auditors or by management of the Trust. |
| | 2. | All requests for pre-approval shall be made to the full Audit Committee at regularly scheduled meetings thereof (or at a special meeting of the Audit Committee set to coincide with regular meetings of the Trust’s Board of Trustees) whenever practicable. |
| | 3. | Under normal circumstances, requests for pre-approval should be presented at least 7 days prior (and in no event later than 48 hours prior) to the proposed commencement of the engagement. |
| | 4. | If consideration of a request for pre-approval on the dates identified in Section III(2) would not be timely, the requesting party shall notify the Chairman of the Audit Committee. The Chairman of the Audit Committee shall then determine whether to schedule a special meeting of the Audit Committee (which may be conducted telephonically) on an alternative date or whether the request may appropriately be presented to a delegate of the Audit Committee under procedures set forth in Section IV below. |
| | 5. | Requests for pre-approval may include, but are not limited to, the following services: |
| | a. | audit engagement, particularly for interim periods; |
| | b. | tax compliance, tax planning, and tax advice; |
| | c. | review and consents with respect to use of reports in post-effective amendments to the registration statements of the Trust; |
| | d. | review of IRS shareholder materials; |
| | e. | review and validation of Trust procedures (e.g., valuation, interTrust lending, etc.), and |
| | f. | market research and strategic insights. |
| | 6. | Requests for pre-approval should identify the nature of the services to be provided in a manner sufficiently specific to allow evaluation of the considerations identified above in Section II. |
| | 7. | In accordance with PCAOB Rule 3524, requests for pre-approval of permissible tax services by the independent auditor must have the following items described in writing for the audit committee: |
| | a. | the scope of the proposed tax service, |
| | b. | the fee structure for the engagement, |
| | c. | any side letters, amendments to the engagement letter or any other agreements, whether oral, written, or otherwise, relating to the service between the audit firm and the Trusts, and |
| | d. | any compensation arrangements or other agreements between the audit firm and any third party with respect to promoting, marketing, or recommending a transaction covered by the proposed tax service. |
The audit firm should discuss with the Audit Committee the potential effect of the proposed tax service(s) on the audit firm’s independence.
| | 8. | Requests for pre-approval must include an assessment by the independent auditor of its independence should the request be granted and the proposed services rendered. |
| | 9. | The Audit Committee’s action on a request for pre-approval shall be recorded in the Audit Committee’s minutes. |
| | 10. | The Audit Committee’s action on a request for pre-approval shall be communicated in writing to the independent auditor and, under normal circumstances, a copy of this communication shall be provided to the Trust’s management. |
| | 11. | The Audit Committee’s action on a request for pre-approval shall be reported to the full Board of Trustees. |
| | 12. | Pre-approvals will be granted for a period of no more than one year. |
IV. Procedures for Pre-Approval by a Delegate of the Audit Committee
| | 1. | Where it has been determined by the Chairman of the Audit Committee that consideration of a request for pre-approval by the full Audit Committee would not be timely, the Chairman may determine that the request be presented to a member(s) of the Audit Committee appointed by the Audit Committee as its delegate (the “Delegate”) for this purpose. (As of the date of the adoption of these guidelines and procedures, the Chairman of the Audit Committee has been so appointed, and such appointment may be revoked or modified by the Audit Committee at any time.) |
| | 2. | Requests for pre-approval shall be in writing and may be made by either the independent auditors or by management of the Trust. |
| | 3. | Under normal circumstances, requests for pre-approval should be presented at least 7 days prior (and in no event later than 48 hours prior) to the proposed commencement of the engagement. |
| | 4. | Requests for pre-approval may include, but are not limited to, the following services: |
| | a. | audit engagement, particularly for interim periods; |
| | b. | tax compliance, tax planning, and tax advice; |
| | c. | review and consents with respect to use of reports in post-effective amendments to the registration statements of the Trust; |
| | d. | review of IRS shareholder materials; |
| | e. | review and validation of Trust procedures (e.g., valuation, interfund lending, etc.); and |
| | f. | market research and strategic insights. |
| | 5. | Requests for pre-approval should identify the nature of the services to be provided in a manner sufficiently specific to allow evaluation of the considerations identified above in Section II. |
| | 6. | Requests for pre-approval must include an assessment by the independent auditor of its independence should the request be granted and the proposed services rendered. |
| | 7. | The Delegate’s action on a request for pre-approval shall be communicated in writing to the independent auditor, with a copy to each other member of the Audit Committee and, under normal circumstances, to the Trust’s management. |
| | 8. | Pre-approvals by the Delegate shall be reviewed by the Audit Committee at a meeting held no later than the next scheduled meeting of the Board of Trustees or the Audit Committee, whichever occurs sooner. An earlier review shall be conducted upon the written request of one or more Audit Committee members addressed to the Chairman of the Audit Committee. |
| | 9. | Pre-approvals by the Delegate may be modified or revoked by the Audit Committee, but will not absolve the Trust of its responsibility to compensate the independent auditor for services rendered prior to such modification or revocation. |
| | 10. | The results of the Audit Committee’s review of the Delegate’s action on a request for pre-approval shall be recorded in the Audit Committee’s minutes and reported to the full Board of Trustees. |
| | 11. | Pre-approvals will be granted by the Delegate for a period of no more than one year. |
V. Procedures for Monitoring Engagements Authorized Under Pre-Approval Procedures
The independent auditor shall inform the Audit Committee in writing upon the commencement of services rendered under a pre-approval. The independent auditor shall thereafter provide the Audit Committee with written quarterly progress reports within one month of the close of each calendar quarter detailing the work done and fees and other charges incurred during said calendar quarter. Should fees and expenses exceed those specified in a pre-approval (or appear likely to do so prior to completion of the work), the independent auditor or management shall so apprise the Audit Committee and an additional express approval or pre-approval must be obtained.
VI. Amendment
These Policies and Procedures may be amended or revoked at any time by the Audit Committee and shall be reviewed at least annually in conjunction with review of the Audit Committee Charter.
Adopted October 23, 2007 (the Mutual Fund and Variable Insurance Trust)
November 11, 2010 (Huntington Strategy Shares)
Revised February 14, 2014
(e)(2) Percentage of services described in each of paragraphs (b) through (d) of this Item that were approved by the audit committee pursuant to paragraph (C)(7)(i)(C) of Rule 2-01 of Regulation S-X.
Fiscal year ended 2015- 100%
Fiscal year ended 2014- 100%
Percentage of services provided to the registrant’s investment adviser and any entity controlling, controlled by, or under common control with the investment adviser that provides ongoing services to the registrant that were approved by the registrant’s audit committee pursuant to paragraph (C)(7)(i)(C) of Rule 2-01 of Regulation S-X, 100% and 100% respectively.
(f) Not applicable.
(g) The aggregate non-audit fees billed by Ernst and Young LLP for the Funds and certain entities (including the adviser (excluding sub-adviser) and any entity controlling, controlled by or under common control with the advisor that provides ongoing services to the registrant (Funds)), totaled $163,150 and $248,360 in 2015 and 2014, respectively.
(h) The registrant’s Audit Committee has considered whether the provision of non audit services that were rendered to registrant’s investment adviser (not including any sub adviser whose role is primarily portfolio management and is subcontracted with or overseen by another investment adviser), and any entity controlling, controlled by, or under common control with the investment adviser that provide ongoing services to the registrant that were not pre-approved pursuant to paragraph (c)(7)(ii) of Rule 2-01 of Regulation S-X is compatible with maintaining the principal account’s independence.
| Item 5. | Audit Committee of Listed Registrants. |
Not applicable.
| Item 6. | Schedule of Investments. |
(a) Not applicable.
(b) Not applicable.
| Item 7. | Disclosure of Proxy Voting Policies and Procedures for Closed-End Management Investment Companies. |
Not applicable.
| Item 8. | Portfolio Managers of Closed-End Management Investment Companies. |
Not applicable.
| Item 9. | Purchases of Equity Securities by Closed-End Management Investment Company and Affiliated Purchasers. |
Not applicable.
| Item 10. | Submission of Matters to a Vote of Security Holders. |
Not applicable.
| Item 11. | Controls and Procedures. |
(a) The registrant’s Principal Executive Officer and Principal Financial Officer have concluded that the registrant’s disclosure controls and procedures (as defined in Rule 30a-3(c) under the Act) are effective in design and operation and are sufficient to form the basis of the certifications required by Rule 30a-2 under the Act, based on their evaluation of these disclosure controls and procedures within 90 days of the filing of this report on Form N-CSR.
(b) There were no changes in the registrant’s internal control over financial reporting (as defined in Rule 30a-3(d) under the Act (17 CFR 270.30a-3(d)) that occurred during the second fiscal quarter of the period covered by this report that have materially affected or are reasonably likely to materially affect, the registrant’s internal control over financial reporting.
(a)(1) The Not applicable.
(a)(2) Certifications pursuant to Rule 30a-2(a) are attached hereto.
(a)(3) Not applicable.
(b) Certifications pursuant to Rule 30a-2(b) are furnished herewith.
SIGNATURES
Pursuant to the requirements of the Securities Exchange Act of 1934 and the Investment Company Act of 1940, the registrant has duly caused this report to be signed on its behalf by the undersigned, thereunto duly authorized.
(Registrant) Mutual Fund and Variable Insurance Trust
| | |
| By (Signature and Title) | | /s/ Lisa Householder |
| | Lisa Householder, President |
Pursuant to the requirements of the Securities Exchange Act of 1934 and the Investment Company Act of 1940, this report has been signed below by the following persons on behalf of the registrant and in the capacities and on the dates indicated.
| | |
By (Signature and Title) | | /s/ Lisa Householder |
| | Lisa Householder, President |
| | |
| By (Signature and Title) | | /s/ Bryan W. Ashmus |
| | Bryan W. Ashmus, Treasurer and Principal Financial Officer |