UNITED STATES
SECURITIES AND EXCHANGE COMMISSION
Washington, D.C. 20549
FORM N-CSR
CERTIFIED SHAREHOLDER REPORT OF REGISTERED
MANAGEMENT INVESTMENT COMPANIES
Investment Company Act file number 811-05010
Mutual Fund and Variable Insurance Trust
(Exact name of registrant as specified in charter)
36 North New York Avenue
Huntington, NY 11743
(Address of principal executive offices) (Zip code)
The Corporation Trust Company
Corporate Trust Center
1209 Orange Street
Wilmington, DE 19801
(Name and address of agent for service)
Registrant’s telephone number, including area code: 1-631-629-4237
Date of fiscal year end: December 31
Date of reporting period: December 31, 2016
| Item 1. | Reports to Shareholders. |

Annual Shareholder Report
December 31, 2016

February 2, 2017
Catalyst Dividend Capture VA Fund
The Catalyst Dividend Capture VA Fund (the “Fund”) seeks total return on investment, with dividend income an important component of that return. The Fund focuses on high dividend, low volatility stocks of mid and large capitalization U.S. companies. During 2016, the Catalyst Dividend Capture VA Fund had a strong first half, generating a 9.13% return versus a 3.84% return for its S&P 500 Total Return Index (1) benchmark. However, the Fund ended up trailing the benchmark by the end of the year with a 6.97% return versus 11.96% for the benchmark. This was a result of the nature of the Fund’s investment strategy, focusing on income-oriented, lower volatility stocks, which significantly trailed high beta stocks during the second half of the year. We are confident in the long-term potential of the Fund and strategy, as exhibited by the Fund outperforming its benchmark since inception.
Investment Strategy
The Fund normally invests at least 80% of its net assets in dividend paying stocks, including preferred stocks and real estate investment trusts (“REITs”).
The Fund uses a quantitative methodology to identify high quality, dividend paying stocks. The quantitative models focus on dividend yield, historical volatility of the stock and the company’s dividend policy. We seek stocks that rank the most highly based on the combination of these characteristics. Positions are sold when they no longer rank favorably or when they no longer provide the targeted risk adjusted returns.
As part of the investment process, the Fund invests in both preferred stocks and common stocks. For 2016, the Fund was invested approximately 20% in preferred stocks and 80% in common stocks.
Fund Performance
The Catalyst Dividend Capture VA Fund had a strong start to the year, significantly outperforming its S&P 500 Total Return Index benchmark with a 9.13% return versus 3.84% for the benchmark. After a rough start in January and concerns about monetary policy and geopolitical events, such as Brexit, the market favored more defensive stocks. This is observed by the 12.32% performance of the S&P 500 Low Volatility Total Return Index (SP5LVIT Index; measures the performance of the 100 least volatile stocks of the S&P 500 Index) versus the 0.73% return for the S&P 500 High Beta Total Return Index (SP5HBIT Index; measures the performance of the 100 S&P 500 constituents that are most sensitive to market returns). The Fund benefited from its overweight allocation to the Utilities and Consumer Staples sectors.
However, during the second half of 2016, the market quickly shrugged off the intermittent volatility events, including the U.S. presidential election. High volatility stocks were favored as the market sold off income-oriented securities, including preferred stocks and high dividend stocks. During the second half of 2016, the S&P 500 Low Volatility Total Return Index dropped 1.73% while the S&P 500 High Beta Total Return Index gained 25.57%. The S&P Preferred Stock Total Return Index (SPTREFTR Index; includes all preferred stocks issued by U.S. corporations and those trading on major exchanges) dropped 3.01%. Some of the Fund’s core sector allocations dropped more than 4% each, including Consumer Staples, Utilities and Real Estate.
The Fund’s total annualized returns through 12/31/16 as compared to the S&P 500 Total Return Index were as follows:
| | | | | | | | | Since Inception |
| | | 1 Year | | 5 Years | | 10 Years | | (10/15/01) |
| Catalyst Dividend Capture VA Fund | | 6.97% | | 8.84% | | 4.75% | | 6.79% |
| S&P 500 Total Return Index | | 11.96% | | 14.66% | | 6.95% | | 6.98% |
Performance is historic and does not guarantee future results. Investment return and principal value will fluctuate with changing market conditions so that when redeemed, shares may be worth more or less than their original cost. Current performance may be lower or higher than the performance data quoted. To obtain the most recent month- end performance information or the Fund’s prospectus please call the Fund, toll free at 1-800-253-0412. You can also obtain a prospectus at www.CatalystVAFunds.com.
Summary
Despite our investment style working well during the first half of 2016 and then going significantly out of favor during the second half of 2016, we are confident in the long-term success of the strategy. Successful investing requires a long-term outlook focused on objective criteria that create value. We have adopted this outlook for the Catalyst Dividend Capture VA Fund, and we are glad that you have decided to share in our vision.
Sincerely,
David Miller and Michael Schoonover
Portfolio Managers
This report is intended for the Fund’s shareholders. It may not be distributed to prospective investors unless it is preceded or accompanied by the current Fund prospectus. To obtain a prospectus or other information about the Fund, please visit www.CatalystVAFunds.com or call 1-800-253-0412. Please read the prospectus carefully before investing.
| (1) | The S&P 500 Total Return Index by Standard & Poor’s Corp. is a capitalization-weighted index comprising 500 issues listed on various exchanges, representing the performance of the stock market generally. Please note that indices do not take into account any fees and expenses of investing in the individual securities that they track, and individuals cannot invest directly in any index, although individuals may invest in exchange traded funds or other investment vehicles that attempt to track the performance of an index. The Catalyst Dividend Capture VA Fund may or may not purchase the types of securities represented by the S&P 500 Total Return Index. |
4154-NLD-2/3/2017
| Catalyst Dividend Capture VA Fund |
| PORTFOLIO REVIEW (Unaudited) |
| December 31, 2016 |
The Fund’s performance figures* for each of the periods ended December 31, 2016, compared to its benchmarks:
| | | 1 Year Return | | 3 Year Return | | 5 Year Return | | 10 Year Return | | Since Inception** |
| Catalyst Dividend Capture VA Fund | | 6.97% | | 4.54% | | 8.84% | | 4.75% | | 6.79% |
| S&P 500 Value Index (a) | | 17.40% | | 8.51% | | 14.69% | | 5.50% | | 6.85% |
| S&P 500 Total Return Index (b) | | 11.96% | | 8.87% | | 14.66% | | 6.95% | | 6.98% |
| * | The performance data quoted here represents past performance. Current performance may be lower or higher than the performance data quoted above. Investment return and principal value will fluctuate, so that shares, when redeemed, may be worth more or less than their original cost. The returns shown do not reflect the deduction of taxes that a shareholder would pay on Fund distributions or on the redemptions of Fund shares. Past performance is no guarantee of future results. See the financial highlights for the current expense ratios. Performance figures for periods greater than 1 year are annualized. Per the fee table in the Fund’s April 5, 2016 prospectus, the total annual operating expense are 1.68% before fee waivers. For performance information current to the most recent month-end, please call toll-free 1-800-253-0412. |
| ** | Inception date is October 15, 2001. |
| (a) | The S&P 500 Value Index, The S&P 500 Value is an unmanaged market-capitalization weighted index consisting of those stocks within the S&P 500 that exhibit strong value characteristics. It uses a numerical ranking system based on four value factors and three growth factors to determine the constituents and their weightings. Investors cannot invest directly in an Index. |
| (b) | Effective April 5, 2016, the S&P 500 Total Return Index is the primary benchmark; it is an unmanaged index generally representing the performance of the broad domestic economy through changes in the aggregate market value of 500 stocks representing all major industries. The S&P 500 Total Return Index does not include fees and expenses, and investors may not invest directly in an index. |
Comparison of the Change in Value of a $10,000 Investment

| Top 10 Holdings by Industry | | % of Net Assets | |
| REITS | | | 12.4 | % |
| Banks | | | 11.9 | % |
| Insurance | | | 8.6 | % |
| Retail | | | 8.2 | % |
| Miscellaneous Manufacturing | | | 6.0 | % |
| Food | | | 4.9 | % |
| Beverages | | | 4.7 | % |
| Software | | | 4.7 | % |
| Diversified Financial Services | | | 4.2 | % |
| Telecommunications | | | 3.4 | % |
| Other/Cash & Equivalents | | | 31.0 | % |
| | | | 100.0 | % |
Please refer to the Portfolio of Investments for a more detailed breakdown of the Fund’s assets.
February 2, 2017
Catalyst Insider Buying VA Fund
The Catalyst Insider Buying VA Fund (the “Fund”) invests in large capitalization U.S. companies that are experiencing significant corporate insider buying. During 2016, the Fund generated comparable returns to its S&P 500 Total Return Index (1) benchmark with a 11.00% return versus 11.96% for the benchmark. The Fund had a strong fourth quarter, generating a 7.57% return versus 3.82% for the benchmark. The Fund benefited from its overweight exposure to the Financials sector. However, underweight exposure to the Information Technology and Energy sectors detracted from Fund performance. We have positioned the Fund in the best signals of the large-cap insider buying strategy and are confident in the long-term potential of the Fund.
Investment Strategy
The Fund uses a quantitative methodology that ranks insider activity based on the strength of the signals that insiders are generating relative to how many executives are buying and how many shares they are purchasing. We believe that corporate insiders understand their own firm better than any outside investor possibly could.
The Fund uses public information that is filed with the Securities and Exchange Commission (“SEC”) on corporate insider and large shareholder buying and selling activity for its investment decisions. Numerous academic studies and our own research of insider trading data over long periods of time has resulted in the development of a proprietary method of analyzing activity that we believe can provide long-term capital appreciation. When looking at SEC filings, we focus on the insider identity (position in the company), potential motivations for buying, insider trading trends, trading volumes, firm size and other factors to select stocks for the portfolio. We sell stocks when the relevant insider trading trends reverse or when portfolio positions achieve or no longer provide targeted risk-adjusted return.
Fund Performance
The Catalyst Insider Buying VA Fund trailed its benchmark during the first part of the year due to limited exposure to the Information Technology sector and the Energy sector, both of which had neutral to negative insider sentiment during most of the year. The Fund recovered with strong performance in the fourth quarter as a result of its exposure to the Financials and Consumer Discretionary sectors.
The first three quarters of 2016 were characterized by relatively narrow leadership. Monetary policy normalization was the largest headline influence on domestic market direction, and geopolitical events such as Brexit produced intermittent volatility that was quickly shrugged off by the markets as they marched higher. One of the biggest influencers on market leadership was the massive and consistent outflows from active equity strategies into passive equity strategies. The inflows into index tracking strategies continued to contribute to the narrow market leadership environment as the passive strategies allocated according to the weightings of the major indexes that they track.
The frequency of corporate insider buying is often higher at companies with stock prices that reflect low valuation multiples. During the middle of the year, the Fund struggled to outperform the narrow leadership group because it was taking positions in companies with lower valuation multiples that did not significantly benefit from the narrow leadership environment.
As the year progressed, the Fund steadily increased its holdings in the Financials sector where corporate insider buying was significant. A precursor to this rotation was the quantitative overlay’s identification of value in certain Financials companies.
Leading up to and following the U.S. presidential election, the market began to reprice stocks that it believed would be beneficiaries of the new policies of the incoming administration. The narrow leadership of the market experienced a changing of the guard, and some of the year’s previous favorites were replaced by the new “Trump Trade.” As market sentiment shifted, active money began looking for places to rotate into, and much of it found its way into undervalued and overlooked companies. Many of these companies have experienced meaningful insider buying in the recent past, and as a result, the Fund was a beneficiary of swift upward price movements in some of its holdings, some of which were the Financials that it purchased earlier in the year.
The Fund’s total annualized returns through 12/31/16 as compared to the S&P 500 Total Return Index were as follows:
| | | | | | | | | Since Inception |
| | | 1 Year | | 5 Years | | 10 Years | | (05/02/04) |
| Catalyst Insider Buying VA Fund | | 11.00% | | 10.30% | | 6.20% | | 8.10% |
| S&P 500 Total Return Index | | 11.96% | | 14.66% | | 6.95% | | 7.95% |
Performance is historic and does not guarantee future results. Investment return and principal value will fluctuate with changing market conditions so that when redeemed, shares may be worth more or less than their original cost. Current performance may be lower or higher than the performance data quoted. To obtain the most recent month- end performance information or the Fund’s prospectus please call the Fund, toll free at 1-800-253-0412. You can also obtain a prospectus at www.CatalystVAFunds.com.
Summary
We hold a relatively concentrated portfolio of large-capitalization U.S. companies experiencing significant insider buying – situations where those that know the most about the company are taking their own money and putting it back in the company through open market purchases. By reviewing numerous academic studies and performing our own historical research, we’ve found that this strategy can outperform the S&P 500 Total Return Index over the long run. Successful investing requires a long-term outlook focused on objective criteria that create value. We have adopted this outlook for the Catalyst Insider Buying VA Fund, and we are glad that you have decided to share in our vision.
Sincerely,
David Miller and Michael Schoonover
Portfolio Managers
This report is intended for the Fund’s shareholders. It may not be distributed to prospective investors unless it is preceded or accompanied by the current Fund prospectus. To obtain a prospectus or other information about the Fund, please visit www.CatalystVAFunds.com or call 1-800-253-0412. Please read the prospectus carefully before investing.
| (1) | The S&P 500 Total Return Index by Standard & Poor’s Corp. is a capitalization-weighted index comprising 500 issues listed on various exchanges, representing the performance of the stock market generally. Please note that indices do not take into account any fees and expenses of investing in the individual securities that they track, and individuals cannot invest directly in any index, although individuals may invest in exchange traded funds or other investment vehicles that attempt to track the performance of an index. The Catalyst Insider Buying VA Fund may or may not purchase the types of securities represented by the S&P 500 Total Return Index. |
4152-NLD-2/3/2017
| Catalyst Insider Buying VA Fund |
| PORTFOLIO REVIEW (Unaudited) |
| December 31, 2016 |
The Fund’s performance figures* for each of the periods ended December 31, 2016, compared to its benchmarks:
| | | 1 Year Return | | 3 Year Return | | 5 Year Return | | 10 Year Return | | Since Inception** |
| Catalyst Insider Buying VA Fund | | 11.00% | | 0.31% | | 10.30% | | 6.20% | | 8.10% |
| S&P Mid-Cap 400 Total Return Index(a) | | 20.74% | | 9.04% | | 15.33% | | 9.16% | | 10.19% |
| S&P SmallCap 600 Index(b) | | 26.56% | | 9.47% | | 16.62% | | 9.03% | | 10.43% |
| S&P 500 Total Return Index(c) | | 11.96% | | 8.87% | | 14.66% | | 6.95% | | 7.95% |
| * | The performance data quoted here represents past performance. Current performance may be lower or higher than the performance data quoted above. Investment return and principal value will fluctuate, so that shares, when redeemed, may be worth more or less than their original cost. The returns shown do not reflect the deduction of taxes that a shareholder would pay on Fund distributions or on the redemptions of Fund shares. Past performance is no guarantee of future results. See the financial highlights for the current expense ratios. Performance figures for periods greater than 1 year are annualized. Per the fee table in the Fund’s April 5, 2016 prospectus, the total annual operating expense are 1.69% before fee waivers. For performance information current to the most recent month-end, please call toll-free 1-800-253-0412. |
| ** | Inception date is May 2, 2004. |
| (a) | The “S&P Mid-Cap 400 Total Return Index,” a registered trademark of McGraw-Hill Co., Inc., seeks to remain an accurate measure of mid-sized companies, reflecting the risk and return characteristics of the broader mid-cap universe on an on-going basis. Investors cannot invest directly in an Index. |
| (b) | The “S&P SmallCap 600 Index,” a registered trademark of McGraw-Hill Co., Inc., is a capitalization-weighted index representing all major industries in the small-cap range of the U.S. stock market. Investors cannot invest directly in an Index. |
| (c) | Effective April 5, 2016, the S&P 500 Total Return Index is the primary benchmark; it is an unmanaged index generally representing the performance of the broad domestic economy through changes in the aggregate market value of 500 stocks representing all major industries. The S&P 500 Total Return Index does not include fees and expenses, and investors may not invest directly in an index. |
Comparison of the Change in Value of a $10,000 Investment
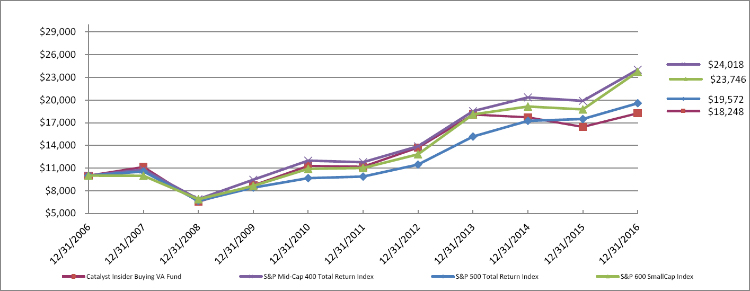
| Top 10 Holdings by Industry | | % of Net Assets | |
| Retail | | | 15.9 | % |
| Banks | | | 15.9 | % |
| REITs | | | 12.5 | % |
| Insurance | | | 6.2 | % |
| Pipelines | | | 5.9 | % |
| Media | | | 4.5 | % |
| Food | | | 4.3 | % |
| Diversified Financial Services | | | 4.2 | % |
| Miscellaneous Manufacturing | | | 4.0 | % |
| Lodging | | | 2.2 | % |
| Other/Cash & Equivalents | | | 24.4 | % |
| | | | 100.0 | % |
Please refer to the Portfolio of Investments for a more detailed breakdown of the Fund’s assets.
| CATALYST DIVIDEND CAPTURE VA FUND |
| PORTFOLIO OF INVESTMENTS |
| December 31, 2016 |
| Shares | | | | | Value | |
| | | | | COMMON STOCK - 80.2% | | | | |
| | | | | AEROSPACE/DEFENSE - 1.5% | | | | |
| | 1,300 | | | Northrop Grumman Corp. | | $ | 302,354 | |
| | | | | | | | | |
| | | | | AGRICULTURE - 3.2% | | | | |
| | 5,500 | | | Altria Group, Inc. | | | 371,910 | |
| | 3,300 | | | Philip Morrs International, Inc. | | | 301,917 | |
| | | | | | | | 673,827 | |
| | | | | BANKS - 5.2% | | | | |
| | 5,500 | | | Commerce Bancshares, Inc. | | | 317,955 | |
| | 5,000 | | | JPMorgan Chase & Co. | | | 431,450 | |
| | 17,000 | | | TCF Financial Corp. | | | 333,030 | |
| | | | | | | | 1,082,435 | |
| | | | | BEVERAGES - 4.7% | | | | |
| | 7,900 | | | Coca-Cola Co. | | | 327,534 | |
| | 3,500 | | | Dr. Pepper Snapple Group, Inc. | | | 317,345 | |
| | 3,150 | | | PepsiCo, Inc. | | | 329,585 | |
| | | | | | | | 974,464 | |
| | | | | COMMERCIAL SERVICES - 1.5% | | | | |
| | 8,600 | | | Booz Allen Hamilton Holding Corp. | | | 310,202 | |
| | | | | | | | | |
| | | | | COMPUTERS - 1.6% | | | | |
| | 2,800 | | | Accenture PLC | | | 327,964 | |
| | | | | | | | | |
| | | | | COSMETICS/PERSONAL CARE - 3.1% | | | | |
| | 5,000 | | | Colgate-Palmolvie Co. | | | 327,200 | |
| | 3,850 | | | Procter & Gamble Co. | | | 323,708 | |
| | | | | | | | 650,908 | |
| | | | | DIVERSIFIED FINANCIAL SERVICES - 1.4% | | | | |
| | 2,500 | | | CME Group, Inc. | | | 288,375 | |
| | | | | | | | | |
| | | | | ELECTRIC - 1.6% | | | | |
| | 10,100 | | | OGE Energy Corp. | | | 337,845 | |
| | | | | | | | | |
| | | | | ELECTRICAL COMPONENTS & EQUIPMENT - 1.8% | | | | |
| | 6,900 | | | Emerson Electric Co. | | | 384,675 | |
| | | | | | | | | |
| | | | | ENTERTAINMENT - 2.1% | | | | |
| | 6,875 | | | Cedar Fair LP | | | 441,375 | |
| | | | | | | | | |
| | | | | ENVIRONMENTAL CONTROL - 1.9% | | | | |
| | 5,500 | | | Waste Management, Inc. | | | 390,005 | |
| | | | | | | | | |
| | | | | FOOD - 4.9% | | | | |
| | 5,300 | | | General Mills, Inc. | | | 327,381 | |
| | 2,500 | | | Ingredion, Inc. | | | 312,400 | |
| | 6,900 | | | Sysco Corp. | | | 382,053 | |
| | | | | | | | 1,021,834 | |
| | | | | HOUSEHOLD PRODUCTS/WARES- 1.5% | | | | |
| | 2,700 | | | Kimberly-Clark Corp. | | | 308,124 | |
| | | | | | | | | |
| | | | | INSURANCE - 3.0% | | | | |
| | 4,500 | | | Aflac, Inc. | | | 313,200 | |
| | 6,500 | | | Hartford Financial Services Group, Inc. | | | 309,725 | |
| | | | | | | | 622,925 | |
| | | | | IRON/STEEL- 1.4% | | | | |
| | 5,000 | | | Nucor Corp. | | | 297,600 | |
See Notes which are an integral part of the Financial Statements.
| CATALYST DIVIDEND CAPTURE VA FUND |
| PORTFOLIO OF INVESTMENTS (Continued) |
| December 31, 2016 |
| Shares | | | | | Value | |
| | | | | COMMON STOCK - 80.2% (Continued) | | | | |
| | | | | MISCELLANEOUS MANUFACTURING - 6.0% | | | | |
| | 1,900 | | | 3M Co. | | $ | 339,283 | |
| | 7,000 | | | Donaldson Co., Inc. | | | 294,560 | |
| | 2,500 | | | Illinois Tool Works, Inc. | | | 306,150 | |
| | 4,000 | | | Ingersoll-Rand PLC | | | 300,160 | |
| | | | | | | | 1,240,153 | |
| | | | | PHARMACEUTICALS - 1.5% | | | | |
| | 5,400 | | | Merck & Co., Inc. | | | 317,898 | |
| | | | | | | | | |
| | | | | PIPELINES - 1.7% | | | | |
| | 9,000 | | | DCP Midstream Partners LP | | | 345,420 | |
| | | | | | | | | |
| | | | | REITS - 9.3% | | | | |
| | 10,500 | | | Blackstone Mortgage Trust, Inc. | | | 315,735 | |
| | 11,500 | | | Brixmor Property Group, Inc. | | | 280,830 | |
| | 12,100 | | | Duke Realty Corp. | | | 321,376 | |
| | 11,100 | | | Kimco Realty Corp. | | | 279,276 | |
| | 6,100 | | | Prologis, Inc. | | | 322,019 | |
| | 26,500 | | | Sunstone Hotel Investors, Inc. | | | 404,125 | |
| | | | | | | | 1,923,361 | |
| | | | | RETAIL - 8.2% | | | | |
| | 8,700 | | | Best Buy Co., Inc. | | | 371,229 | |
| | 2,500 | | | Home Depot, Inc. | | | 335,200 | |
| | 3,000 | | | McDonald’s Corp. | | | 365,160 | |
| | 4,300 | | | Target Corp. | | | 310,589 | |
| | 4,600 | | | Wal-Mart Stores, Inc. | | | 317,952 | |
| | | | | | | | 1,700,130 | |
| | | | | SEMICONDUCTORS - 1.7% | | | | |
| | 4,800 | | | Texas Instruments, Inc. | | | 350,256 | |
| | | | | | | | | |
| | | | | SOFTWARE - 4.7% | | | | |
| | 10,200 | | | CA, Inc. | | | 324,054 | |
| | 10,600 | | | Paychex, Inc. | | | 645,328 | |
| | | | | | | | 969,382 | |
| | | | | TELECOMMUNICATIONS - 3.4% | | | | |
| | 8,250 | | | AT&T, Inc. | | | 350,872 | |
| | 6,500 | | | Verizon Communications, Inc. | | | 346,970 | |
| | | | | | | | 697,842 | |
| | | | | TOYS/GAMES/HOBBIES - 1.6% | | | | |
| | 4,200 | | | Hasbro, Inc. | | | 326,718 | |
| | | | | | | | | |
| | | | | TRANSPORTATION - 1.7% | | | | |
| | 3,100 | | | United Parcel Service, Inc. | | | 355,384 | |
| | | | | | | | | |
| | | | | TOTAL COMMON STOCK (Cost - $16,011,077) | | | 16,641,456 | |
| | | | | | | | | |
| | | | | PREFERRED STOCK - 18.2% | | | | |
| | | | | BANKS - 6.7% | | | | |
| | 10,000 | | | Northern Trust Corp., 5.85% | | | 250,600 | |
| | 21,000 | | | US Bancorp, 6.50% | | | 594,090 | |
| | 20,500 | | | Wells Fargo & Co., 8.00% | | | 541,815 | |
| | | | | | | | 1,386,505 | |
| | | | | DIVERSIFIED FINANCIAL SERVICES - 2.8% | | | | |
| | 23,000 | | | Raymond James Financial, Inc., 6.90% | | | 583,970 | |
See Notes which are an integral part of the Financial Statements.
| CATALYST DIVIDEND CAPTURE VA FUND |
| PORTFOLIO OF INVESTMENTS (Continued) |
| December 31, 2016 |
| Shares | | | | | Value | |
| | | | | PREFERRED STOCK - 18.2% (Continued) | | | | |
| | | | | INSURANCE - 5.6% | | | | |
| | 11,000 | | | Aegon NV, 8.00% | | $ | 286,550 | |
| | 12,000 | | | Allstate Corp., 5.10% | | | 302,040 | |
| | 22,624 | | | Axis Capital Holdings Ltd., 6.88% | | | 570,351 | |
| | | | | | | | 1,158,941 | |
| | | | | | | | | |
| | | | | REITS - 3.1% | | | | |
| | 2,000 | | | National Retail Properties, Inc., 6.63% | | | 50,220 | |
| | 14,000 | | | PS Business Parks, Inc., 6.45% | | | 351,120 | |
| | 9,500 | | | Realty Income Corp., 6.63% | | | 238,925 | |
| | | | | | | | 640,265 | |
| | | | | | | | | |
| | | | | TOTAL PREFERRED STOCK (Cost - $3,916,561) | | | 3,769,681 | |
| | | | | | | | | |
| | | | | SHORT-TERM INVESTMENTS - 1.5% | | | | |
| | 313,495 | | | Federated Treasury Obligations Fund, Institutional Class, 0.36% * | | | 313,495 | |
| | | | | TOTAL SHORT-TERM INVESTMENTS (Cost - $313,495) | | | 313,495 | |
| | | | | | | | | |
| | | | | TOTAL INVESTMENTS - 99.9% (Cost - $20,241,133) (a) | | $ | 20,724,632 | |
| | | | | OTHER ASSETS IN EXCESS OF LIABILITIES - 0.1% | | | 11,221 | |
| | | | | NET ASSETS - 100.0% | | $ | 20,735,853 | |
LP - Limited Partnership.
PLC - Public Limited Company.
REIT - Real Estate Investment Trust.
| * | Rate shown represents the rate at December 31, 2016; it is subject to change and resets daily. |
| (a) | Represents cost for financial reporting purposes. Aggregate cost for federal tax purposes is $20,264,536 and differs from fair value by net unrealized appreciation (depreciation) of securities as follows: |
| Unrealized appreciation: | | $ | 1,093,526 | |
| Unrealized depreciation: | | | (633,430 | ) |
| Net unrealized appreciation: | | $ | 460,096 | |
See Notes which are an integral part of the Financial Statements.
| CATALYST INSIDER BUYING VA FUND |
| PORTFOLIO OF INVESTMENTS |
| December 31, 2016 |
| Shares | | | | | Value | |
| | | | | COMMON STOCK - 97.3% | | | | |
| | | | | AGRICULTURE - 2.1% | | | | |
| | 11,500 | | | Altria Group, Inc. | | $ | 777,630 | |
| | | | | | | | | |
| | | | | BANKS - 15.9% | | | | |
| | 36,700 | | | Bank of America Corp. | | | 811,070 | |
| | 13,800 | | | Citigroup, Inc. | | | 820,134 | |
| | 23,300 | | | Citizens Financial Group, Inc. | | | 830,179 | |
| | 9,700 | | | JPMorgan Chase & Co. | | | 837,013 | |
| | 7,100 | | | PNC Financial Services Group, Inc. | | | 830,416 | |
| | 57,300 | | | Regions Financial Corp. | | | 822,828 | |
| | 14,950 | | | SunTrust Banks, Inc. | | | 820,008 | |
| | | | | | | | 5,771,648 | |
| | | | | BEVERAGES - 2.0% | | | | |
| | 8,000 | | | Dr. Pepper Snapple Group, Inc. | | | 725,360 | |
| | | | | | | | | |
| | | | | CHEMICALS - 1.9% | | | | |
| | 4,700 | | | Air Products & Chemicals, Inc. | | | 675,954 | |
| | | | | | | | | |
| | | | | COMPUTERS - 2.0% | | | | |
| | 30,800 | | | Hewlett Packard Enterprise Co. | | | 712,712 | |
| | | | | | | | | |
| | | | | DIVERSIFIED FINANCIAL SERVICES - 4.2% | | | | |
| | 36,600 | | | Ally Financial, Inc. | | | 696,132 | |
| | 11,000 | | | American Express Co. | | | 814,880 | |
| | | | | | | | 1,511,012 | |
| | | | | ELECTRIC - 1.9% | | | | |
| | 9,600 | | | Edison International | | | 691,104 | |
| | | | | | | | | |
| | | | | FOOD - 4.3% | | | | |
| | 16,800 | | | Mondelez International, Inc. | | | 744,744 | |
| | 14,500 | | | Sysco Corp. | | | 802,865 | |
| | | | | | | | 1,547,609 | |
| | | | | HAND/MACHINE TOOLS - 1.8% | | | | |
| | 5,700 | | | Stanley Black & Decker, Inc. | | | 653,733 | |
| | | | | | | | | |
| | | | | HEALTHCARE-PRODUCTS - 1.8% | | | | |
| | 14,800 | | | Baxter International, Inc. | | | 656,232 | |
| | | | | | | | | |
| | | | | HEALTHCARE-SERVICES - 1.9% | | | | |
| | 9,400 | | | HCA Holdings, Inc. * | | | 695,788 | |
| | | | | | | | | |
| | | | | INSURANCE - 6.2% | | | | |
| | 9,800 | | | Aflac, Inc. | | | 682,080 | |
| | 16,500 | | | Hartford Financial Services Group, Inc. | | | 786,225 | |
| | 13,800 | | | Principal Financial Group, Inc. | | | 798,468 | |
| | | | | | | | 2,266,773 | |
| | | | | LODGING - 2.2% | | | | |
| | 9,800 | | | Marriott International, Inc. | | | 810,264 | |
| | | | | | | | | |
| | | | | MEDIA - 4.5% | | | | |
| | 8,700 | | | Time Warner, Inc. | | | 839,811 | |
| | 7,700 | | | Walt Disney Co. | | | 802,494 | |
| | | | | | | | 1,642,305 | |
| | | | | MISCELLANEOUS MANUFACTURING - 4.0% | | | | |
| | 4,000 | | | 3M Co. | | | 714,280 | |
| | 23,800 | | | General Electric Co. | | | 752,080 | |
| | | | | | | | 1,466,360 | |
See Notes which are an integral part of the Financial Statements.
| CATALYST INSIDER BUYING VA FUND |
| PORTFOLIO OF INVESTMENTS (Continued) |
| December 31, 2016 |
| Shares | | | | | Value | |
| | | | | COMMON STOCK - 97.3% (Continued) | | | | |
| | | | | PIPELINES - 5.9% | | | | |
| | 9,900 | | | Buckeye Partners LP | | $ | 654,984 | |
| | 25,800 | | | Enterprise Products Partners LP | | | 697,632 | |
| | 18,100 | | | ONEOK Partners LP | | | 778,481 | |
| | | | | | | | 2,131,097 | |
| | | | | REITS - 12.5% | | | | |
| | 5,100 | | | Boston Properties, Inc. | | | 641,478 | |
| | 23,700 | | | Kimco Realty Corp. | | | 596,292 | |
| | 3,100 | | | Public Storage | | | 692,850 | |
| | 3,300 | | | Simon Property Group, Inc. | | | 586,311 | |
| | 19,200 | | | UDR, Inc. | | | 700,416 | |
| | 6,800 | | | Vornado Realty Trust | | | 709,716 | |
| | 9,300 | | | Welltower, Inc. | | | 622,449 | |
| | | | | | | | 4,549,512 | |
| | | | | RETAIL - 15.9% | | | | |
| | 10,900 | | | Darden Restaurants, Inc. | | | 792,648 | |
| | 7,000 | | | Genuine Parts Co. | | | 668,780 | |
| | 5,425 | | | Home Depot, Inc. | | | 727,384 | |
| | 9,900 | | | Lowe’s Cos., Inc. | | | 704,088 | |
| | 6,100 | | | McDonald’s Corp. | | | 742,492 | |
| | 2,550 | | | O’Reilly Automotive, Inc. * | | | 709,946 | |
| | 10,500 | | | Target Corp. | | | 758,415 | |
| | 9,900 | | | Wal-Mart Stores, Inc. | | | 684,288 | |
| | | | | | | | 5,788,041 | |
| | | | | SOFTWARE - 2.1% | | | | |
| | 7,100 | | | Fiserv, Inc. * | | | 754,588 | |
| | | | | | | | | |
| | | | | TELECOMMUNICATIONS - 2.1% | | | | |
| | 14,000 | | | Verizon Communications, Inc. | | | 747,320 | |
| | | | | | | | | |
| | | | | TRANSPORTATION - 2.1% | | | | |
| | 7,300 | | | Union Pacific Corp. | | | 756,864 | |
| | | | | | | | | |
| | | | | TOTAL COMMON STOCK (Cost - $32,923,232) | | | 35,331,906 | |
| | | | | | | | | |
| | | | | SHORT-TERM INVESTMENTS - 2.8% | | | | |
| | 1,007,528 | | | Federated Treasury Obligations Fund, Institutional Class, 0.36% ** | | | 1,007,528 | |
| | | | | TOTAL SHORT-TERM INVESTMENTS (Cost - $1,007,528) | | | 1,007,528 | |
| | | | | | | | | |
| | | | | TOTAL INVESTMENTS - 100.1% (Cost - $33,930,760) (a) | | $ | 36,339,434 | |
| | | | | LIABILITIES IN EXCESS OF OTHER ASSETS - (0.1)% | | | (18,044 | ) |
| | | | | NET ASSETS - 100.0% | | $ | 36,321,390 | |
LP - Limited Partnership.
REIT - Real Estate Investment Trust.
| * | Non-income producing security. |
| ** | Rate shown represents the rate at December 31, 2016; it is subject to change and resets daily. |
| (a) | Represents cost for financial reporting purposes. Aggregate cost for federal tax purposes is $33,893,884 and differs from value by net unrealized appreciation (depreciation) of securities as follows: |
| Unrealized appreciation: | | $ | 3,116,164 | |
| Unrealized depreciation: | | | (670,614 | ) |
| Net unrealized appreciation: | | $ | 2,445,550 | |
See Notes which are an integral part of the Financial Statements.
| CATALYST VA FUNDS |
| Statements of Assets and Liabilities |
| December 31, 2016 |
| | | Catalyst | | | Catalyst | |
| | | Dividend Capture VA | | | Insider Buying VA | |
| | | Fund | | | Fund | |
| | | | | | | | | |
| ASSETS: | | | | | | | | |
| Investments in securities, at cost | | $ | 20,241,133 | | | $ | 33,930,760 | |
| Investments, at value | | $ | 20,724,632 | | | $ | 36,339,434 | |
| Receivable for Fund shares sold | | | 661 | | | | — | |
| Dividends and interest receivable | | | 84,147 | | | | 69,181 | |
| Cash | | | 5,301 | | | | 3,150 | |
| Prepaid expenses and other assets | | | 770 | | | | 746 | |
| Total Assets | | | 20,815,511 | | | | 36,412,511 | |
| | | | | | | | | |
| LIABILITIES: | | | | | | | | |
| Management fees payable | | | 3,043 | | | | 9,172 | |
| Payable for Fund shares redeemed | | | 4,215 | | | | 8,065 | |
| Fees payable to affiliate | | | 3,137 | | | | 5,510 | |
| Accrued 12b-1 fees | | | 40,932 | | | | 38,878 | |
| Accrued expenses and other liabilities | | | 28,331 | | | | 29,496 | |
| Total Liabilities | | | 79,658 | | | | 91,121 | |
| | | | | | | | | |
| Net Assets | | $ | 20,735,853 | | | $ | 36,321,390 | |
| | | | | | | | | |
| NET ASSETS CONSIST OF: | | | | | | | | |
| Paid in capital | | $ | 19,997,738 | | | $ | 29,387,914 | |
| Undistributed net investment income | | | 561,551 | | | | 228,866 | |
| Accumulated net realized gain (loss) on investments and foreign currency transactions | | | (306,935 | ) | | | 4,296,364 | |
| Net unrealized appreciation (depreciation) on investments and foreign currency translation | | | 483,499 | | | | 2,408,246 | |
| Net Assets | | $ | 20,735,853 | | | $ | 36,321,390 | |
| | | | | | | | | |
| Net Assets | | $ | 20,735,853 | | | $ | 36,321,390 | |
| Shares of beneficial interest outstanding (a) | | | 1,672,424 | | | | 2,690,305 | |
| Net asset value, redemption price and offering price per share | | $ | 12.40 | | | $ | 13.50 | |
| (a) | Unlimited number of shares of no par value beneficial interest authorized. |
See Notes which are an integral part of the Financial Statements.
| CATALYST VA FUNDS |
| Statements of Operations |
| For the Year Ended December 31, 2016 |
| | | Catalyst | | | Catalyst | |
| | | Dividend Capture VA | | | Insider Buying VA | |
| | | Fund | | | Fund | |
| Investment Income: | | | | | | | | |
| Dividend income | | $ | 915,278 | | | $ | 642,180 | |
| Interest income | | | 778 | | | | 2,511 | |
| Securities lending - net | | | 356 | | | | 29,163 | |
| Foreign tax withheld | | | (2,787 | ) | | | — | |
| Total Investment Income | | | 913,625 | | | | 673,854 | |
| | | | | | | | | |
| Operating Expenses: | | | | | | | | |
| Investment management fees | | | 165,889 | | | | 266,837 | |
| 12b-1 Fees | | | 55,296 | | | | 88,946 | |
| Shareholder servicing fees | | | 55,296 | | | | 88,946 | |
| Administration fees | | | 34,419 | | | | 49,506 | |
| MFund services fees | | | 19,845 | | | | 28,631 | |
| Legal fees | | | 19,303 | | | | 27,141 | |
| Audit fees | | | 10,878 | | | | 12,440 | |
| Printing expense | | | 10,476 | | | | 15,171 | |
| Trustees’ fees | | | 8,397 | | | | 8,391 | |
| Insurance expense | | | 5,902 | | | | 7,814 | |
| Compliance officer fees | | | 5,314 | | | | 5,596 | |
| Custody fees | | | 4,527 | | | | 3,660 | |
| Interest expense | | | 442 | | | | 747 | |
| Miscellaneous expense | | | 1,998 | | | | 958 | |
| Total Operating Expenses | | | 397,982 | | | | 604,784 | |
| Less: Expenses waived by Advisor | | | (121,175 | ) | | | (159,746 | ) |
| Net Operating Expenses | | | 276,807 | | | | 445,038 | |
| | | | | | | | | |
| Net Investment Income | | | 636,818 | | | | 228,816 | |
| | | | | | | | | |
| Realized and Unrealized Gain (Loss) on Investments: | | | | | | | | |
| Net realized gain (loss) from: | | | | | | | | |
| Investments and foreign currency translations | | | (287,836 | ) | | | 4,297,271 | |
| | | | | | | | | |
| Net change in unrealized appreciation (depreciation) on: | | | | | | | | |
| Investments and foreign currency translations | | | 1,137,451 | | | | (875,814 | ) |
| | | | | | | | | |
| Net Realized and Unrealized Gain on Investments | | | 849,615 | | | | 3,421,457 | |
| | | | | | | | | |
| Net Increase in Net Assets Resulting From Operations | | $ | 1,486,433 | | | $ | 3,650,273 | |
See Notes which are an integral part of the Financial Statements.
| CATALYST VA FUNDS |
| Statements of Changes in Net Assets |
| | | Catalyst Dividend Capture VA Fund | | | Catalyst Insider Buying VA Fund | |
| | | | | | | | | | | | | |
| | | Year Ended | | | Year Ended | | | Year Ended | | | Year Ended | |
| | | December 31, 2016 | | | December 31, 2015 | | | December 31, 2016 | | | December 31, 2015 | |
| Operations: | | | | | | | | | | | | | | | | |
| Net investment income | | $ | 636,818 | | | $ | 966,592 | | | $ | 228,816 | | | $ | 216,694 | |
| Long-term capital gain dividends from investment companies | | | — | | | | — | | | | — | | | | 38,281 | |
| Net realized gain (loss) on investments, options and foreign currency translation | | | (287,836 | ) | | | 1,356,689 | | | | 4,297,271 | | | | 10,569,194 | |
| Net change in unrealized appreciation (depreciation) on investments, options and foreign currency translation | | | 1,137,451 | | | | (3,108,896 | ) | | | (875,814 | ) | | | (13,992,343 | ) |
| Net increase (decrease) in net assets resulting from operations | | | 1,486,433 | | | | (785,615 | ) | | | 3,650,273 | | | | (3,168,174 | ) |
| | | | | | | | | | | | | | | | | |
| Distributions to Shareholders from: | | | | | | | | | | | | | | | | |
| Net investment income | | | (1,005,479 | ) | | | (1,122,139 | ) | | | (219,930 | ) | | | (242,057 | ) |
| Net realized gains | | | — | | | | — | | | | (10,192,203 | ) | | | (6,080,507 | ) |
| | | | | | | | | | | | | | | | | |
| Total distributions to shareholders | | | (1,005,479 | ) | | | (1,122,139 | ) | | | (10,412,133 | ) | | | (6,322,564 | ) |
| | | | | | | | | | | | | | | | | |
| Share Transactions of Beneficial Interest: | | | | | | | | | | | | | | | | |
| Net proceeds from shares sold | | | 928,461 | | | | 611,791 | | | | 1,368,134 | | | | 3,069,986 | |
| Reinvestment of distributions | | | 1,005,479 | | | | 1,122,139 | | | | 10,412,133 | | | | 6,322,564 | |
| Cost of shares redeemed | | | (5,240,223 | ) | | | (11,479,984 | ) | | | (6,914,662 | ) | | | (23,656,272 | ) |
| Net increase (decrease) in net assets from share transactions of beneficial interest | | | (3,306,283 | ) | | | (9,746,054 | ) | | | 4,865,605 | | | | (14,263,722 | ) |
| | | | | | | | | | | | | | | | | |
| Total (Decrease) in Net Assets | | | (2,825,329 | ) | | | (11,653,808 | ) | | | (1,896,255 | ) | | | (23,754,460 | ) |
| | | | | | | | | | | | | | | | | |
| Net Assets: | | | | | | | | | | | | | | | | |
| Beginning of year | | | 23,561,182 | | | | 35,214,990 | | | | 38,217,645 | | | | 61,972,105 | |
| End of year* | | $ | 20,735,853 | | | $ | 23,561,182 | | | $ | 36,321,390 | | | $ | 38,217,645 | |
| | | | | | | | | | | | | | | | |
| * Includes undistributed net investment income at end of year: | | $ | 561,551 | | | $ | 917,730 | | | $ | 228,866 | | | $ | 219,862 | |
| | | | | | | | | | | | | | | | | |
| Share Activity: | | | | | | | | | | | | | | | | |
| Shares Sold | | | 74,752 | | | | 48,040 | | | | 91,427 | | | | 152,090 | |
| Shares Reinvested | | | 82,756 | | | | 95,339 | | | | 838,336 | | | | 359,033 | |
| Shares Redeemed | | | (422,095 | ) | | | (888,895 | ) | | | (443,954 | ) | | | (1,106,444 | ) |
| Net increase (decrease) in shares of Beneficial interest | | | (264,587 | ) | | | (745,516 | ) | | | 485,809 | | | | (595,321 | ) |
See Notes which are an integral part of the Financial Statements.
| CATALYST VA FUNDS |
| Financial Highlights |
| For a Share Outstanding Throughout Each Year |
| | | Catalyst Dividend Capture VA Fund | |
| | | For the | | | For the | | | For the | | | For the | | | For the | |
| | | Year Ended | | | Year Ended | | | Year Ended | | | Year Ended | | | Year Ended | |
| | | December 31, | | | December 31, | | | December 31, | | | December 31, | | | December 31, | |
| | | 2016 | | | 2015 | | | 2014 | | | 2013 | | | 2012 | |
| | | | | | | | | | | | | | | | |
| Net asset value, beginning of year | | $ | 12.16 | | | $ | 13.13 | | | $ | 12.55 | | | $ | 10.78 | | | $ | 10.06 | |
| INCOME (LOSS) FROM INVESTMENT OPERATIONS: | | | | | | | | | | | | | | | | | | | | |
| Net investment income | | | 0.36 | (B) | | | 0.44 | (B) | | | 0.39 | (B) | | | 0.43 | | | | 0.45 | |
| Net realized and unrealized gain (loss) on investments | | | 0.48 | | | | (0.86 | ) | | | 0.87 | | | | 1.72 | | | | 0.70 | |
| Total from investment operations | | | 0.84 | | | | (0.42 | ) | | | 1.26 | | | | 2.15 | | | | 1.15 | |
| LESS DISTRIBUTIONS: | | | | | | | | | | | | | | | | | | | | |
| From net investment income | | | (0.60 | ) | | | (0.55 | ) | | | (0.68 | ) | | | (0.38 | ) | | | (0.43 | ) |
| Total distributions | | | (0.60 | ) | | | (0.55 | ) | | | (0.68 | ) | | | (0.38 | ) | | | (0.43 | ) |
| Net asset value, end of year | | $ | 12.40 | | | $ | 12.16 | | | $ | 13.13 | | | $ | 12.55 | | | $ | 10.78 | |
| Total return (A) | | | 6.97 | % | | | (3.06 | )% | | | 10.16 | % | | | 19.96 | % | | | 11.47 | % |
| RATIOS/SUPPLEMENTAL DATA: | | | | | | | | | | | | | | | | | | | | |
| Net assets, end of year (in 000’s) | | $ | 20,736 | | | $ | 23,561 | | | $ | 35,215 | | | $ | 41,109 | | | $ | 32,776 | |
| Expenses, before waiver and reimbursement | | | 1.80 | % | | | 1.12 | % | | | 1.05 | % | | | 0.98 | % | | | 0.95 | % |
| Expenses, net waiver and reimbursement | | | 1.25 | % | | | 0.99 | % | | | 0.98 | % | | | 0.98 | % | | | 0.95 | % |
| Ratios of net investment income | | | 2.87 | % | | | 3.40 | % | | | 3.00 | % | | | 3.63 | % | | | 3.85 | % |
| Portfolio turnover rate | | | 166 | % | | | 94 | % | | | 103 | % | | | 118 | % | | | 110 | % |
| (A) | Total returns do not include any insurance, sales or administrative charges of variable annuity or life insurance contracts. If these were included, the returns would be lower. |
| (B) | Calculated using average shares for the year. |
See Notes which are an integral part of the Financial Statements.
| CATALYST VA FUNDS |
| Financial Highlights |
| For a Share Outstanding Throughout Each Year |
| | | Catalyst Insider Buying VA Fund | |
| | | For the | | | For the | | | For the | | | For the | | | For the | |
| | | Year Ended | | | Year Ended | | | Year Ended | | | Year Ended | | | Year Ended | |
| | | December 31, | | | December 31, | | | December 31, | | | December 31, | | | December 31, | |
| | | 2016 | | | 2015 | | | 2014 | | | 2013 | | | 2012 | |
| | | | | | | | | | | | | | | | |
| Net asset value, beginning of year | | $ | 17.34 | | | $ | 22.13 | | | $ | 23.95 | | | $ | 18.21 | | | $ | 14.85 | |
| INCOME (LOSS) FROM INVESTMENT OPERATIONS: | | | | | | | | | | | | | | | | | | | | |
| Net investment income | | | 0.10 | (B) | | | 0.12 | | | | 0.07 | | | | 0.08 | | | | 0.09 | |
| Net realized and unrealized gain (loss) on investments | | | 1.35 | | | | (1.66 | ) | | | (0.52 | ) | | | 5.73 | | | | 3.27 | |
| Total from investment operations | | | 1.45 | | | | (1.54 | ) | | | (0.45 | ) | | | 5.81 | | | | 3.36 | |
| LESS DISTRIBUTIONS: | | | | | | | | | | | | | | | | | | | | |
| From net investment income | | | (0.11 | ) | | | (0.12 | ) | | | (0.12 | ) | | | (0.07 | ) | | | — | |
| From net realized gains on investments | | | (5.18 | ) | | | (3.13 | ) | | | (1.25 | ) | | | — | | | | — | |
| Total distributions | | | (5.29 | ) | | | (3.25 | ) | | | (1.37 | ) | | | (0.07 | ) | | | — | |
| Net asset value, end of year | | $ | 13.50 | | | $ | 17.34 | | | $ | 22.13 | | | $ | 23.95 | | | $ | 18.21 | |
| Total return (A) | | | 11.00 | % | | | (7.17 | )% | | | (2.06 | )% | | | 31.92 | % | | | 22.63 | % |
| RATIOS/SUPPLEMENTAL DATA: | | | | | | | | | | | | | | | | | | | | |
| Net assets, end of year (in 000’s) | | $ | 36,321 | | | $ | 38,218 | | | $ | 61,972 | | | $ | 62,227 | | | $ | 45,402 | |
| Expenses, before waiver and reimbursement | | | 1.70 | % | | | 1.10 | % | | | 1.03 | % | | | 0.94 | % | | | 0.96 | % |
| Expenses, net waiver and reimbursement | | | 1.25 | % | | | 1.02 | % | | | 0.99 | % | | | 0.94 | % | | | 0.96 | % |
| Ratios of net investment income (loss) | | | 0.64 | % | | | 0.46 | % | | | 0.24 | % | | | 0.42 | % | | | 0.55 | % |
| Portfolio turnover rate | | | 166 | % | | | 68 | % | | | 21 | % | | | 26 | % | | | 10 | % |
| (A) | Total returns do not include any insurance, sales or administrative charges of variable annuity or life insurance contracts. If these were included, the returns would be lower. |
| (B) | Calculated using average shares for the year. |
See Notes which are an integral part of the Financial Statements.
| CATALYST VA FUNDS | |
| NOTES TO FINANCIAL STATEMENTS | |
| December 31, 2016 | ANNUAL REPORT |
| (1) | ORGANIZATION AND SIGNIFICANT ACCOUNTING POLICIES |
The Mutual Fund and Variable Insurance Trust (the “Trust”) was organized as a Delaware statutory trust on June 23, 2006. The Trust is registered under the Investment Company Act of 1940, as amended (the “1940 Act”), as an open-end management investment company. As of December 31, 2016, the Trust operated 8 separate series, or mutual funds, each with its own investment objective and strategy. The Trust was renamed effective February 22, 2016; it was formerly the Huntington Funds. This report contains financial statements and financial highlights of the funds listed below (individually referred to as a “Fund”, or collectively as the “Funds”):
| ● | Catalyst Dividend Capture VA Fund (“Dividend Capture VA Fund”) |
| ● | Catalyst Insider Buying VA Fund (“Insider Buying VA Fund”) |
The prospectus provides a description of each Fund’s investment objectives, policies and strategies along with information on the classes of shares currently being offered. The Funds redeem shares on any business day when the NYSE is open. The price at which the Funds will offer or redeem shares will be the net asset value (“NAV”) per share next determined after the order is considered received. The assets of each Fund are segregated and a shareholder’s interest is limited to the Fund in which shares are held.
The Trust accounts for the assets, liabilities and operations of each Fund separately. Shares of the Funds are not offered directly to the public, but pursuant to an exemptive order granted by the Securities and Exchange Commission and procedures adopted by the Trust’s Board of Trustees (the “Trustees”). The Funds were sold during the year only to separate accounts of Hartford Life Insurance Company, Lincoln Life Insurance Company, Nationwide Insurance Company, Delaware Life Insurance Company, Forethought Life Insurance Company, and Transamerica Life Insurance Company for use with variable insurance contracts and policies.
Under the Trust’s organizational documents, its officers and Trustees are indemnified against certain liabilities arising out of the performance of their duties to the Funds. In addition, in the normal course of business, the Trust may enter into contracts with vendors and others that provide for general indemnifications. The Trust’s maximum exposure under these arrangements is unknown, as this would involve future claims that may be made against the Trust. However, based on experience, the Trust expects that risk of loss to be remote.
| (2) | SIGNIFICANT ACCOUNTING POLICIES |
The Funds are each an investment company and each follow investment company accounting and reporting guidance under Financial Accounting Standards Board (“FASB”) Accounting Standards Codification (“ASC”) Topic 946, “Financial Services-Investment Companies” including FASB Accounting Standard Update ASU 2013-08. The following is a summary of significant accounting policies consistently followed by the Funds in the preparation of their financial statements. The policies are in conformity with accounting principles generally accepted in the United States of America (“GAAP”).
The preparation of financial statements in conformity with GAAP requires management to make estimates and assumptions that affect the amounts of assets, liabilities, and disclosure of contingent assets and liabilities at the date of the financial statements and the reported amounts of income and expenses for the period. Actual results could differ from those estimates.
In computing the NAV of the Funds, fair value is based on market valuations with respect to portfolio securities for which market quotations are readily available. Pursuant to Trustee-approved policies, the Trust relies on certain security pricing services to provide the current market value of securities. Those security pricing services value equity securities (including foreign equity securities, exchange-traded funds and closed-end funds) traded on a securities exchange at the last reported sales price on the principal exchange. Equity securities quoted by NASDAQ are valued at the NASDAQ official closing price. If there is no reported sale on the principal exchange, and in the case of over-the counter securities, equity securities are valued at a bid price estimated by the security pricing service. Investments in open-end investment companies are valued at their respective net asset value as reported by such companies and are typically categorized as Level 1 in the fair value hierarchy. Short-term debt obligations having 60 days or less remaining until maturity, at time of purchase, may be valued at amortized cost.
Securities for which market quotations are not readily available are valued at fair value under Trust procedures approved by the Trustees. In these cases, a Pricing Committee, established and appointed by the Trustees, determines in good faith, subject to Trust
| CATALYST VA FUNDS | |
| NOTES TO FINANCIAL STATEMENTS (Continued) | |
| December 31, 2016 | ANNUAL REPORT |
procedures, the fair value of portfolio securities held by a Fund (“good faith fair valuation”). When a good faith fair valuation of a security is required, consideration is generally given to a number of factors including, but not limited to the following: dealer quotes, published analyses by dealers or analysts regarding the security, transactions which provide implicit valuation of the security (such as a merger or tender offer transaction), the value of other securities or contracts which derive their value from the security at issue, and the implications of any other circumstances which have caused trading in the security to halt. With respect to certain categories of securities, the procedures utilized by the Pricing Committee detail specific valuation methodologies to be applied in lieu of considering the aforementioned list of factors.
Fair valuation procedures are also used when a significant event affecting the value of a portfolio security is determined to have occurred between the time when the price of the portfolio security is determined and the close of trading on the NYSE, which is when each Fund’s NAV is computed. An event is considered significant if there is both an affirmative expectation that the security’s value will change in response to the event and a reasonable basis for quantifying the resulting change in value. Significant events include significant securities market movements occurring between the time the price of the portfolio security is determined and the close of trading on the NYSE. For securities normally priced at their last sale price in a foreign market, such events can occur between the close of trading in the foreign market and the close of trading on the NYSE.
In some cases, events affecting the issuer of a portfolio security may be considered significant events. Examples of potentially significant events include announcements concerning earnings, acquisitions, new products, management changes, litigation developments, a strike or natural disaster affecting the company’s operations or regulatory changes or market developments affecting the issuer’s industry occurring between the time when the price of the portfolio security is determined and the close of trading on the NYSE. For securities of foreign issuers, such events could also include political or other developments affecting the economy or markets in which the issuer conducts its operations or its securities are traded.
There can be no assurance that a Fund could purchase or sell a portfolio security at the price used to calculate the Fund’s NAV. In the case of good faith fair valued portfolio securities, lack of information and uncertainty as to the significance of information may lead to a conclusion that a prior valuation is the best indication of a portfolio security’s present value. Good faith fair valuations generally remain unchanged until new information becomes available. Consequently, changes in good faith fair valuation of portfolio securities may be less frequent and of greater magnitude than changes in the price of portfolio securities valued at their last sale price, by an independent pricing service, or based on market quotations.
The Trust calculates the NAV for each of the Funds by valuing securities held based on fair value. Fair value is defined as the price that would be received to sell an asset or paid to transfer a liability in an orderly transaction between market participants at the measurement date. The valuation techniques described below maximize the use of observable inputs and minimize the use of unobservable inputs in determining fair value. The inputs used for valuing the Funds’ investments are summarized in the three broad levels listed below:
| ● | Level 1 – unadjusted quoted prices in active markets for identical investments and/or registered investment companies where the value per share is determined and published and is the basis for current transactions for identical assets or liabilities at the valuation date. |
| ● | Level 2 – other significant observable inputs (including quoted prices for similar securities, interest rates, prepayment speeds, credit risk, etc.). |
| ● | Level 3 – significant unobservable inputs (including the Funds’ own assumptions in determining the fair value of investments). |
Changes in valuation techniques may result in transfers in or out of an assigned level within the disclosure hierarchy. The inputs or methodology used for valuing investments is not necessarily an indication of the risk associated with investing in those investments.
The Trustees have authorized the use of an independent fair valuation service. If the movement in a designated U.S. market index, after foreign markets close, is greater than predetermined levels, the Funds may use a systematic valuation model provided from that independent third party to fair value its international equity securities.
| CATALYST VA FUNDS | |
| NOTES TO FINANCIAL STATEMENTS (Continued) | |
| December 31, 2016 | ANNUAL REPORT |
The inputs or methodology used for valuing securities are not necessarily an indication of the risk associated with investing in those securities. The following tables summarize the inputs used as of December 31, 2016, for each Fund’s assets measured at fair value:
| Dividend Capture VA Fund* | | | | | | | | | | | | |
| | | | | | | | | | | | | |
| Assets | | Level 1 | | | Level 2 | | | Level 3 | | | Total | |
| Common Stock | | $ | 16,641,456 | | | $ | — | | | $ | — | | | $ | 16,641,456 | |
| Preferred Stock | | | 3,769,681 | | | | — | | | | — | | | | 3,769,681 | |
| Short-Term Investments | | | 313,495 | | | | — | | | | — | | | | 313,495 | |
| Total Assets | | $ | 20,724,632 | | | $ | — | | | $ | — | | | $ | 20,724,632 | |
| Insider Buying VA Fund* | | | | | | | | | | | | |
| | | | | | | | | | | | | |
| Assets | | Level 1 | | | Level 2 | | | Level 3 | | | Total | |
| Common Stock | | $ | 35,331,906 | | | $ | — | | | $ | — | | | $ | 35,331,906 | |
| Short-Term Investments | | | 1,007,528 | | | | — | | | | — | | | | 1,007,528 | |
| Total Assets | | $ | 36,339,434 | | | $ | — | | | $ | — | | | $ | 36,339,434 | |
| * | Refer to the Portfolios of Investments for industry classifications. |
For the year ended December 31, 2016, there were no Level 3 investments for which significant unobservable inputs were used to determine fair value. There were no transfers into or out of Level 1 and Level 2 during the year ended December 31, 2016. The Trust recognizes significant transfers between fair value hierarchy levels at the reporting period end.
| B. | Foreign Currency Translation |
The accounting records of the Funds are maintained in U.S. dollars. Foreign currency amounts are translated into U.S. dollars at the current rate of exchange each business day to determine the value of investments, and other assets and liabilities. Purchases and sales of foreign securities, and income and expenses, are translated at the prevailing rate of exchange on the respective date of these transactions. The Funds do not isolate that portion of the results of operations resulting from changes in foreign exchange rates on investments from fluctuation arising from changes in market prices of securities held. These fluctuations are included with the net realized and unrealized gain or loss from investments and foreign currency transactions.
Reported net realized foreign exchange gains or losses arise from sales of portfolio securities; sales and maturities of short term securities; sales of foreign currencies; currency gains or losses realized between the trade and settlement dates on securities transactions; and the difference between the amounts of dividends, interest, and foreign withholding taxes recorded on the Fund’s books and the U.S. dollar equivalent of the amounts actually received or paid. Net unrealized foreign exchange gains and losses arise from changes in the values of assets and liabilities, including investments in securities at fiscal period-end, resulting from changes in the exchange rate.
Certain of the Funds may be subject to equity price risk and foreign currency exchange risk in the normal course of pursuing their investment objectives. Certain of the Funds may invest in various financial instruments including positions in foreign currency contracts and written option contracts to gain exposure to or hedge against changes in the value of equities or foreign currencies. The following is a description of the derivative instruments utilized by the Funds, including the primary underlying risk exposure related to each instrument type.
Foreign Exchange Contracts – Insider Buying VA Fund may enter into forward foreign exchange contracts. A forward foreign exchange contract involves an obligation to purchase or sell a specific currency at a future date at a price set at the time of the contract. Such contracts are used to sell unwanted currency exposure that comes with holding securities in a market, or to buy currency exposure where the exposure from holding securities is insufficient to provide the desired currency exposure. The contracts are marked-to-market daily and the change in market value is recorded as unrealized appreciation or depreciation. When a forward foreign currency contract is closed, a Fund records a realized gain or loss equal to the difference between the value at the time it was opened and the value at the time it was closed. These unrealized and realized gains and losses are reported on the Statement of Operations. The Fund could be exposed to risks if the counterparties to the contracts are unable to meet the terms of their contracts and from unanticipated
| CATALYST VA FUNDS | |
| NOTES TO FINANCIAL STATEMENTS (Continued) | |
| December 31, 2016 | ANNUAL REPORT |
movements in exchange rates. As of December 31, 2016, Insider Buying VA Fund did not have any forward foreign exchange contracts outstanding.
Prior to February 18, 2016, the Funds had entered into securities lending agreements with Morgan Stanley & Co., LLC. The Funds receive compensation in the form of fees, and retain a portion of interest on the investment of any cash received as collateral. The Funds also continue to receive interest or dividends on the securities loaned. The loans are secured by collateral at least equal, at all times, to 102% of the market value of loaned securities. Gain or loss in the fair value of the securities loaned that may occur during the term of the loan will be for the account of each Fund. Each Fund has the right under the lending agreement to recover the securities from the borrower on demand. If the market value of the collateral falls below 102% plus accrued interest of the loaned securities, the lender’s agent shall request additional collateral from the borrowers to bring the collateralization back to 102%. The risks to a Fund of securities lending are that the borrower may not provide additional collateral when required or return the securities when due resulting in a loss. Under the terms of the Securities Lending Agreement, each Fund is indemnified for such losses by the securities lending agent. Huntington National Bank served as custodian for related collateral and received an annual securities lending fee for collateral monitoring and record keeping services.
| E. | Security Transactions and Related Income |
During the period, investment transactions are accounted for no later than the first calculation of the NAV on the business day following the trade date. For financial reporting purposes, however, security transactions are accounted for on trade date on the last business day of the reporting period. Securities gains and losses are calculated on the identified cost basis. Interest income and expenses are accrued daily. Dividends, less foreign tax withholding (if any), are recorded on the ex-dividend date.
| F. | Dividends and Distributions to Shareholders |
Dividends from net investment income, if any, are declared and paid annually by the Funds. Net realized capital gains, if any, are distributed at least annually. The amount of dividends from net investment income and net realized gains are determined in accordance with the federal income tax regulations, which may differ from GAAP and are recorded on ex-date. These “book/tax” differences are either considered temporary or permanent in nature. To the extent these differences are permanent in nature (e.g. tax treatment of foreign currency gain/loss, distributions and income received from pass through investments and net investment loss adjustments), such amounts are reclassified within the capital accounts based on their nature for federal income tax purposes; temporary differences do not require reclassification. Temporary differences are primarily attributable to losses deferred due to wash sales, capital loss carryfowards, non-taxable distributions from underlying investments and the tax treatment of passive foreign investment companies.
The Funds may own shares of real estate investments trusts (“REITs”) which report information on the source of their distributions annually. Distributions received from investments in REITs in excess of income from underlying investments are recorded as realized gain and/or as a reduction to the cost of the individual REIT.
The Funds may invest in Master Limited Partnerships (“MLPs”), which generally are treated as partnerships for Federal income tax purposes. As a limited partner in the MLPs, the Funds include its allocable share of the MLPs’ taxable income in computing its own taxable income.
Expenses directly attributable to a Fund are charged to that Fund. Expenses not directly attributable to a Fund are allocated proportionally among various Funds or all Funds within the Trust in relation to the net assets of each Fund or on another reasonable basis.
It is the policy of each Fund to qualify or continue to qualify as a regulated investment company by complying with the provisions available to certain investment companies, as defined in applicable sections of the Internal Revenue Code, and to make distributions of net investment income and net realized capital gains sufficient to relieve it from all, or substantially all, federal income taxes. In addition
| CATALYST VA FUNDS | |
| NOTES TO FINANCIAL STATEMENTS (Continued) | |
| December 31, 2016 | ANNUAL REPORT |
to complying with the federal tax requirements applicable to regulated investment companies, the Funds also plan to comply with certain diversification standards applicable to underlying assets of variable annuity contracts in order to avoid taxation on the variable contract owners with respect to earnings allocable to the contract from investments in the Funds.
Withholding taxes on foreign interest, dividends and capital gains with respect to the Funds have been provided for in accordance with each applicable country’s tax rules and rates.
| (3) | FEES AND OTHER TRANSACTIONS WITH AFFILIATES AND OTHER SERVICE PROVIDERS |
Investment Advisory Fee – Rational Advisors, Inc., (the “Advisor”) serves as the Funds’ investment adviser. For the year ended December 31, 2016, the Advisor received a fee for its services, computed daily and paid monthly, at an annual rate of 0.75% of the average daily net assets of each Fund.
The Advisor had agreed to contractually waive all or a portion of its investment advisory fee for the following funds (based on average daily net assets) to which it is otherwise entitled to receive and/or to reimburse certain operating expenses in order to limit each Fund’s total annual fund expenses (after fee waivers, and/or expense reimbursements, and exclusive of acquired fund fees and expenses, brokerage costs, interest, taxes and dividends, and extraordinary expenses) (“Expense Cap”) for the year ended December 31, 2016, to the following:
| | | | | Expense Cap |
| Fund | | Expense Cap | | Effective Date |
| Dividend Capture VA Fund | | 1.25% | | April 30, 2017 |
| Insider Buying VA Fund | | 1.25% | | April 30, 2017 |
Amounts waived or reimbursed in the contractual period may be recouped by the Advisor within three years of the waiver and/or reimbursement. As of December 31, 2016, the following amounts have been waived or reimbursed by the Advisor and are subject to repayment by the respective Fund:
| | | Repayment Expires December 31, | |
| Fund | | 2017 | | | 2018 | | | 2019 | |
| Dividend Capture VA Fund | | $ | 25,787 | | | $ | 37,235 | | | $ | 121,175 | |
| Insider Buying VA Fund | | | 23,917 | | | | 39,947 | | | | 159,746 | |
The Independent Trustees are paid a quarterly retainer, and receive compensation for each committee meeting, telephonic Board meeting, and special in-person Board meeting attended. Officers receive no compensation from the Trust. The Trust reimburses each of the Independent Trustees for travel and other expenses incurred in connection with attendance at such meetings. The Trust has no retirement or pension plans. Additional information regarding the Trust’s Trustees is available in the Funds’ Statement of Additional Information.
The Board has adopted the Trust’s Distribution Plan (the “12b-1 plan”) which allows each Fund to pay fees up to 0.25% of the Fund’s average daily net assets to financial intermediaries (which may be paid through the Funds’ distributor) for the sale and distribution of these Shares. Pursuant to the Funds’ 12b-1 Plan, the Funds may finance from their assets certain activities or expenses that are intended primarily to result in the sale of Fund shares and to reimburse Northern Lights Distributors, LLC. (the “Distributor”) and Advisor for distribution related expenses. 12b-1 fees incurred for the year ended December 31, 2016 were $55,296 and $88,946 for the Dividend Capture VA Fund and Insider Buying VA Fund, respectively. For the period January 1, 2016 to April 15, 2016, Unified Financial Securities, LLC, served as distributor of the Funds. The 12b-1 Plan was implemented effective January 1, 2016.
Shareholder Servicing Fees - The Trust has adopted a Shareholder Servicing Plan pursuant to which the Funds may pay Shareholder Services Fees up to 0.25% of the average daily net assets to financial intermediaries for providing shareholder assistance, maintaining shareholder accounts and communicating or facilitating purchases and redemptions of Shares. The Shareholder Servicing Plan was activated effective January 1, 2016.
| CATALYST VA FUNDS | |
| NOTES TO FINANCIAL STATEMENTS (Continued) | |
| December 31, 2016 | ANNUAL REPORT |
In addition, certain affiliates of the Distributor provide services to the Funds as follows:
Gemini Fund Services, LLC (“GFS”) – GFS an affiliate of the Distributor, provides administrative, fund accounting, and transfer agency services to the Funds pursuant to agreements with the Trust, for which it receives from each Fund the greater of an annual minimum fee or an asset based fee, which scales downward based upon net assets for fund administration, fund accounting and transfer agency services. The Fund also pays GFS for any out-of-pocket expenses. Officers of the Trust are also employees of GFS, and are not paid any fees directly by the Trust for serving in such capacity. For the period January 1, 2016 to April 15, 2016, Ultimus Fund Solutions, LLC (“Ultimus”), served as Administrator to the Trust; certain officers of the Trust were also employees of Ultimus when Ultimus served in such capacity.
Blu Giant, LLC (“Blu Giant”) – Blu Giant, an affiliate of GFS and the Distributor, provides EDGAR conversion and filing services as well as print management services for the Funds on an ad-hoc basis. For the provision of these services, Blu Giant receives customary fees from the Funds.
Pursuant to the Management Services Agreement between the Trust and MFund Services LLC (“MFund”), MFund, an affiliate of the Advisor, provides the Funds with various management and administrative services. For these services, the Funds pay MFund an annual base fee plus an annual asset-based fee which scales downward based upon net assets. In addition, the Funds reimburse MFund for any reasonable out- of- pocket expenses incurred in the performance of its duties under the Management Services Agreement.
Pursuant to the Management Services Agreements, MFund provides chief compliance officer services to the Funds. For these services, the Funds pay MFund an annual base fee plus an annual asset-based fee based upon net assets. In addition, the Funds reimburse MFund for any reasonable out- of- pocket expenses incurred in the performance of its duties under the Management Services Agreement. The amounts due to MFund at December 31, 2016 for management and chief compliance officer services are listed in the Statements of Assets and Liabilities under “Fees Payable to Affiliate.” For the period January 1, 2016 to April 15, 2016, Ultimus provided chief compliance officer services to the Funds; certain officers of the Trust were also employees of Ultimus when Ultimus served in such capacity.
A Trustee and Officer of the Trust is also the controlling member of MFund and the Advisor, and is not paid any fees directly by the Trust for serving in such capacities.
| (4) | INVESTMENT TRANSACTIONS |
Purchases and sales of investments, excluding short-term securities, for the year ended December 31, 2016, were as follows:
| Fund | | Purchases | | | Sales | |
| Dividend Capture VA Fund | | $ | 35,887,240 | | | $ | 39,044,911 | |
| Insider Buying VA Fund | | | 56,720,445 | | | | 58,737,149 | |
There were no purchases or sales of long-term U.S. government obligations during the year ended December 31, 2016.
| (5) | DISTRIBUTIONS TO SHAREHOLDERS AND TAX COMPONENTS OF CAPITAL |
The tax character of distributions paid during the years ended December 31, 2016 and December 31, 2015 was as follows:
| | | Ordinary | | | Long-Term | | | Return of | | | | |
| | | Income | | | Capital Gains | | | Capital | | | Total | |
| Dividend Capture VA Fund | | $ | 1,005,479 | | | $ | — | | | $ | — | | | $ | 1,005,479 | |
| Insider Buying VA Fund | | | 963,007 | | | | 9,449,126 | | | | — | | | | 10,412,133 | |
| | | Ordinary | | | Long-Term | | | Return of | | | | |
| | | Income | | | Capital Gains | | | Capital | | | Total | |
| Dividend Capture VA Fund | | $ | 1,122,139 | | | $ | — | | | $ | — | | | $ | 1,122,139 | |
| Insider Buying VA Fund | | | 675,424 | | | | 5,647,140 | | | | — | | | | 6,322,564 | |
| CATALYST VA FUNDS | |
| NOTES TO FINANCIAL STATEMENTS (Continued) | |
| December 31, 2016 | ANNUAL REPORT |
As of December 31, 2016, the components of accumulated earnings/(deficit) on a tax basis were as follows:
| | | Undistributed | | | Undistributed | | | Post October Loss | | | Capital Loss | | | Other | | | Unrealized | | | Total | |
| | | Ordinary | | | Long-Term | | | and | | | Carry | | | Book/Tax | | | Appreciation/ | | | Accumulated | |
| | | Income | | | Capital Gains | | | Late Year Loss | | | Forwards | | | Differences | | | (Depreciation) | | | Earnings/(Deficits) | |
| Dividend Capture VA Fund | | $ | 577,311 | | | $ | — | | | $ | — | | | $ | (299,292 | ) | | $ | — | | | $ | 460,096 | | | $ | 738,115 | |
| Insider Buying VA Fund | | | 763,523 | | | | 3,724,831 | | | | — | | | | — | | | | — | | | | 2,445,122 | | | | 6,933,476 | |
The difference between book basis and tax basis unrealized appreciation (depreciation), undistributed ordinary income (loss) and accumulated net realized gain (loss) from investments is primarily attributable to the tax deferral of losses on wash sales and adjustments for partnerships and trust preferred securities.
At December 31, 2016, the Funds had capital loss carry forwards for federal income tax purposes available to offset future capital gains as follows:
| | | Expiring | | | Non-Expiring | | | | |
| | | 12/31/17 | | | Short-Term | | | Long-Term | | | Total | |
| Dividend Capture VA Fund | | $ | 7,597 | | | $ | — | | | $ | 291,695 | | | $ | 299,292 | |
| Insider Buying VA Fund | | | — | | | | — | | | | — | | | | — | |
Permanent book and tax differences, primarily attributable to the book/ tax basis treatment of foreign currency gains (losses), and adjustments related to partnerships, C-Corporation return of capital distributions and trust preferred securities, resulted in reclassification for the following Funds for the year ended December 31, 2016 as follows:
| | | Paid | | | Undistributed | | | Undistributed | |
| | | In | | | Ordinary | | | Net Realized | |
| | | Capital | | | Income (Loss) | | | Gains (Loss) | |
| Dividend Capture VA Fund | | $ | — | | | $ | 12,482 | | | $ | (12,482 | ) |
| Insider Buying VA Fund | | | (1 | ) | | | 118 | | | | (117 | ) |
| (6) | FOREIGN INVESTMENT RISK |
Compared with investing in the United States, investing in foreign markets involves a greater degree and variety of risk. Investors in international or foreign markets may face delayed settlements, currency controls and adverse economic developments as well as higher overall transaction costs. In addition, fluctuations in the U.S. dollar’s value versus other currencies may erode or reverse gains from investments denominated in foreign currencies or widen losses. Foreign governments may expropriate assets, impose capital or currency controls, impose punitive taxes, impose limits on ownership or nationalize a company or industry. Any of these actions could have severe effect on security prices and impair the Fund’s ability to bring its capital or income back to the U.S. Exchange rate. Fluctuations also may impair an issuer’s ability to repay U.S. dollar denominated debt, thereby increasing credit risk of such debt. Finally, the value of foreign securities may be affected by incomplete, less frequent or inaccurate financial information about their issuers, social upheavals or political actions ranging from tax code changes to government collapse. Foreign companies may also receive less coverage than U.S. companies by market analysts, and financial reporting standards or regulatory requirements may not be comparable to those applicable to U.S. companies.
The Trust participated in a short-term credit agreement (“Line of Credit”) with Huntington National Bank for the period January 1, 2016 through January 12, 2016 when the agreement was terminated. Under the terms of the agreement, the Funds could borrow up to $30 million at an interest rate of LIBOR plus 135 basis points. The purpose of the agreement was to meet temporary or emergency cash needs, including redemption requests that might otherwise require the untimely disposition of securities. Huntington received an annual facility fee of 0.125% on $30 million as well as an additional annual fee of 0.125% on any unused portion of the credit facility for providing the Line of Credit. Each Fund in the Trust paid a pro-rata portion of this facility fee, and unused fee, plus any interest on amounts borrowed. For the period January 1, 2016 through January 12, 2016 the Funds did not utilize the Line of Credit.
| CATALYST VA FUNDS | |
| NOTES TO FINANCIAL STATEMENTS (Continued) | |
| December 31, 2016 | ANNUAL REPORT |
| (8) | NEW ACCOUNTING PRONOUNCEMENTS |
On October 13, 2016 the Securities and Exchange Commission amended existing rules intended to modernize reporting and disclosure of information. These amendments relate to Regulation S-X which sets forth the form and content of financial statements. At this time, management is evaluating the implications of adopting these amendments and their impact on the financial statements and accompanying notes.
Management of the Funds has evaluated the need for disclosure and/or adjustments resulting from subsequent events through the date these financial statements were issued. There were no other additional items requiring adjustment of the financial statements or additional disclosure. Effective January 25, 2017, PVG Asset Management Corporation (“PVG”) serves as the sub-advisor to the Dividend Capture VA Fund. As compensation for the sub-advisory services it provides to the Fund, the Advisor will pay PVG out of the net advisory fees.
REPORT OF INDEPENDENT REGISTERED PUBLIC ACCOUNTING FIRM
To the Shareholders of Catalyst Dividend Capture VA Fund and Catalyst Insider Buying VA Fund
and Board of Trustees of Mutual Fund and Variable Insurance Trust
We have audited the accompanying statements of assets and liabilities, including the portfolios of investments, of Catalyst Dividend Capture VA Fund and Catalyst Insider Buying VA Fund (the “Funds”), each a series of Mutual Fund and Variable Insurance Trust, as of December 31, 2016, and the related statements of operations and changes in net assets, and the financial highlights for the year then ended. These financial statements and financial highlights are the responsibility of the Funds’ management. Our responsibility is to express an opinion on these financial statements and financial highlights based on our audit. The Funds’ financial statements and financial highlights for the periods ended on or prior to December 31, 2015, were audited by other auditors, whose report dated February 18, 2016, expressed an unqualified opinion on those statements and financial highlights.
We conducted our audit in accordance with the standards of the Public Company Accounting Oversight Board (United States). Those standards require that we plan and perform the audit to obtain reasonable assurance about whether the financial statements and financial highlights are free of material misstatement. An audit includes examining, on a test basis, evidence supporting the amounts and disclosures in the financial statements. Our procedures included confirmation of securities owned as of December 31, 2016, by correspondence with the custodian. An audit also includes assessing the accounting principles used and significant estimates made by management, as well as evaluating the overall financial statement presentation. We believe that our audit provides a reasonable basis for our opinion.
In our opinion, the financial statements and financial highlights referred to above present fairly, in all material respects, the financial position of Catalyst Dividend Capture VA Fund and Catalyst Insider Buying VA Fund as of December 31, 2016, the results of their operations, changes in their net assets and the financial highlights for the year then ended, in conformity with accounting principles generally accepted in the United States of America.
COHEN & COMPANY, LTD.
Cleveland, Ohio
February 27, 2017
| CATALYST FUNDS |
| Supplemental Information (Unaudited) |
| |
| Shareholder Expense Examples |
Fund Expenses. As a shareholder of a Fund, you incur ongoing costs, including management fees and other Fund expenses. These examples are intended to help you understand your ongoing costs (in dollars) of investing in the Funds and to compare these costs with the ongoing costs of investing in other mutual funds.
These examples are based on an investment of $1,000.00 invested at the beginning of the period and held for the entire six-month period from July 1, 2016 to December 31, 2016.
Actual Expenses. The “Actual” lines of the table provide information about actual account values and actual expenses. You may use the information on this line together with the amount you invested to estimate the expense that you paid over the period. Simply divide your account value by $1,000.00 (for example, an $8,600.00 account value divided by $1,000.00 = 8.60), then multiply the result by the number in the “Actual” line under the heading entitled “Expenses Paid During Period” to estimate the expenses you paid on your account during this period.
Hypothetical Example for Comparison Purposes. The “Hypothetical” lines of the table provide information about hypothetical account values and hypothetical expenses based on the Funds’ actual expense ratios and an assumed rate of return of 5% per year before expenses, which are not the Funds’ actual returns. The hypothetical account values and expenses may not be used to estimate the actual ending account balance or expenses you paid for the period. You may use this information to compare the ongoing costs of investing in the Funds and other funds. To do so, compare the 5% hypothetical examples with the 5% hypothetical examples that appear in the shareholder reports of other funds.
Please note that the expenses shown in the table are meant to highlight your ongoing costs only and do not reflect any transactional costs, such as withdrawal charges, mortality and expense risk fees and other charges that may be assessed by participating insurance companies under the separate accounts, variable annuity contracts or variable life insurance policies. Therefore, the “Actual” and “Hypothetical” lines of the table are useful in comparing ongoing costs only, and will not help you determine the relative total costs of owning different funds. In addition, if these transactional costs were included, your costs would have been higher.
| | | Beginning | | | Annualized | | | Ending | | | Expenses | |
| | | Account | | | Expense Ratio | | | Account | | | Paid During | |
| | | Value 07/01/16 | | | For the period | | | Value 12/31/16 | | | the Period* | |
| Dividend Capture VA Fund | | | | | | | | | | | | | | | | |
| Actual | | $ | 1,000.00 | | | | 1.25 | % | | $ | 1,009.00 | | | $ | 6.31 | |
| Hypothetical | | | 1,000.00 | | | | 1.25 | % | | | 1,018.85 | | | | 6.34 | |
| Insider Buying VA Fund | | | | | | | | | | | | | | | | |
| Actual | | $ | 1,000.00 | | | | 1.25 | % | | $ | 1,094.90 | | | $ | 6.58 | |
| Hypothetical | | | 1,000.00 | | | | 1.25 | % | | | 1,018.65 | | | | 6.27 | |
| | | | | | | | | | | | | | | | | |
| * | Expenses are equal to the Fund’s annualized expense ratio multiplied by the average account value over the period, multiplied by 184/366. |
| CATALYST VA FUNDS | |
| Boards of Trustees and Trust Officers (Unaudited) (Continued) | |
| December 31, 2016 | ANNUAL REPORT |
The Trustees and officers of the Trust, together with information as to their principal business occupations during the past five years and other information, are shown below. Unless otherwise noted, the address of each Trustee and Officer is 36 N. New York Avenue, Huntington, NY 11743. Each Trustee and officer also serves in the same capacity for the Strategy Shares, another open-end investment company whose series are managed by the Advisor. Collectively, the Funds, Strategy Shares, Mutual Fund Series Trust and TCG Financial Trusts I-X comprise the “Fund Complex.
Independent Trustees Background
Name, Address
and Age | Position(s)
with Trust | Term
and
Length
Served* | Principal Occupation(s)
During Past 5 Years | Number of
Portfolios
in Fund
Complex
Overseen
by Trustee | Other Directorships
Held by Trustees |
Tobias Caldwell
Age: 48 | Chairman of the Board and Trustee | Since January 2016 | Managing member, Bear Properties, LLC (2006 - present) (real estate firm); Managing member, PTL Real Estate, LLC (2000 – present) (real estate/investment firm); Managing member, Genovese Family Enterprises, LLC (1999 – present) (real estate firm). | 50 | Chairman of the Board Strategy Shares, (2016 to present); Board Member of Variable Insurance Trust (2010 to present); Board Member, Lead Independent Trustee and Chair of Audit Committee, Mutual Fund Series Trust, 40 funds (2006-present). |
Stephen P.
Lachenauer
Age: 48 | Trustee | Since January 2016 | Attorney, private practice. | 20 | Board Member and Chair of the Audit Committee, Strategy Shares (January 2016 – present); Trustee, TCG Financial Series Trusts I- X, each Trust is comprised of 1 fund (2015-present). |
Donald
McIntosh
Age: 47 | Trustee | Since January 2016 | Credit risk review analyst, Santander Holdings USA (May 2015 – present); Governance analyst, Santander Bank (2011 – April 2015). | 20 | Board Member, Strategy Shares (January 2016– present); Trustee and Chair of the Audit Committee, TCG Financial Series Trusts I- X, each Trust is comprised of 1 fund (2015-present). |
| CATALYST VA FUNDS | |
| Boards of Trustees and Trust Officers (Unaudited) (Continued) | |
| December 31, 2016 | ANNUAL REPORT |
Officers**
Name, Address
and Age | Position(s)
with Trust | Term
and
Length
Served | Principal Occupation(s) During Past 5
Years | Number of
Portfolios in Fund
Complex
Overseen by
Trustee |
Jerry Szilagyi
Age: 54 | President | Since April 2016 | President, Rational Advisors, Inc., 1/2016 - present; Chief Executive Officer, Catalyst Capital Advisors LLC, 1/2006- present; Member, AlphaCentric Advisors LLC, 2/2014 to Present; Chief Executive Officer, Catalyst Mutuals Fund Distributors LLC, 12/2014-present; Managing Member, MFund Distributors LLC, 10/2012-present; Managing Member, MFund Services LLC, 1/2012 – Present; President, Abbington Capital Group LLC, 1998- present; President, Cross Sound Capital LLC, 6/2011 to 10/2013; President, USA Mutuals, Inc., 3/2011 to July 2016. | 50 |
Erik Naviloff
80 Arkay Drive,
Hauppauge, New
York 11788
Age: 48 | Treasurer | Since April 2016 | Vice President – Fund Administration, Gemini Fund Services, LLC, since 2012; Assistant Vice President, Gemini Fund Services, 2007 - 2012. | N/A |
Aaron Smith
80 Arkay Drive,
Hauppauge, New
York 11788
Age: 42 | Assistant Treasurer | Since April 2016 | Manager - Fund Administration, Gemini Fund Services, LLC, since 2012; Authorized Officer, UBS Global Asset Management, a business division of UBS AG, 2010-2012. | N/A |
Frederick J.
Schmidt
Age: 57 | Chief Compliance Officer | Since April 2016 | Director, MFund Services LLC since 5/2015; Director & Chief Compliance Officer, Citi Fund Services, 2010-2015; Senior Vice President & Chief Compliance Officer, Citi Fund Services, 2004-2010. | N/A |
Jennifer A. Bailey
Age: 48 | Secretary | Since April 2016 | Director of Legal Services, MFund Services LLC, 2/2012 to present. | N/A |
| * | The term of office of each Trustee is indefinite. |
| ** | Officers do not receive any compensation from the Trust. |
The Fund’s Statement of Additional Information (“SAI”) includes additional information about the Trustees and is available free of charge, upon request, by calling toll-free at 1-800-253-0412.
PRIVACY NOTICE
Mutual Fund and Variable Insurance Trust
Rev. June 2011
| FACTS | WHAT DOES MUTUAL FUND AND VARIABLE INSURANCE TRUST DO WITH YOUR PERSONAL INFORMATION? |
| Why? | Financial companies choose how they share your personal information. Federal law gives consumers the right to limit some, but not all sharing. Federal law also requires us to tell you how we collect, share, and protect your personal information. Please read this notice carefully to understand what we do. |
| What? | The types of personal information we collect and share depends on the product or service that you have with us. This information can include: ● Social Security number and wire transfer instructions ● account transactions and transaction history ● investment experience and purchase history When you are no longer our customer, we continue to share your information as described in this notice. |
| How? | All financial companies need to share customers’ personal information to run their everyday business. In the section below, we list the reasons financial companies can share their customers’ personal information; the reasons Mutual Fund Series Trust chooses to share; and whether you can limit this sharing. |
Reasons we can share your
personal information: | Does Mutual Fund Series
Trust share information? | Can you limit this sharing? |
| For our everyday business purposes - such as to process your transactions, maintain your account(s), respond to court orders and legal investigations, or report to credit bureaus. | YES | NO |
| For our marketing purposes - to offer our products and services to you. | NO | We don’t share |
| For joint marketing with other financial companies. | NO | We don’t share |
| For our affiliates’ everyday business purposes - information about your transactions and records. | NO | We don’t share |
| For our affiliates’ everyday business purposes - information about your credit worthiness. | NO | We don’t share |
| For our affiliates to market to you | NO | We don’t share |
| For non-affiliates to market to you | NO | We don’t share |
| QUESTIONS? | Call 1-800-253-0412 |
PRIVACY NOTICE
Mutual Fund and Variable Insurance Trust
| What we do: |
How does Mutual Fund and Variable Insurance Trust protect my personal information? | To protect your personal information from unauthorized access and use, we use security measures that comply with federal law. These measures include computer safeguards and secured files and buildings. Our service providers are held accountable for adhering to strict policies and procedures to prevent any misuse of your nonpublic personal information. |
How does Mutual Fund and Variable Insurance Trust collect my personal information? | We collect your personal information, for example, when you ● open an account or deposit money ● direct us to buy securities or direct us to sell your securities ● seek advice about your investments We also collect your personal information from others, such as credit bureaus, affiliates, or other companies. |
Why can’t I limit all sharing? | Federal law gives you the right to limit only: ● sharing for affiliates’ everyday business purposes – information about your creditworthiness. ● affiliates from using your information to market to you. ● sharing for nonaffiliates to market to you. State laws and individual companies may give you additional rights to limit sharing. |
| Definitions |
| Affiliates | Companies related by common ownership or control. They can be financial and non-financial companies. ● Mutual Fund and Variable Insurance Trust has no affiliates. |
| Non-affiliates | Companies not related by common ownership or control. They can be financial and non-financial companies. ● Mutual Fund and Variable Insurance Trust doesn’t share with non-affiliates so they can market to you. |
| Joint marketing | A formal agreement between nonaffiliated financial companies that together market financial products or services to you. ● Mutual Fund and Variable Insurance Trust doesn’t jointly market. |
Variable investment options are not bank deposits or obligations, are not guaranteed by any bank, and are not insured or guaranteed by the U.S. government, the Federal Deposit Insurance Corporation, the Federal Reserve Board or any other government agency. Investment in variable investment options involves investment risk, including the possible loss of principal.
A copy of the policies and procedures that the Funds use to determine how to vote proxies relating to securities held in the Funds’ portfolios, as well as a record of how the Funds voted any such proxies during the most recent 12-month period ended June 30, is available without charge and upon request by calling 1-800-253-0412. This information is also available from the EDGAR database on the SEC’s website at www.sec.gov.
The Funds file with the SEC a complete schedule of their portfolio holdings, as of the first and third quarters of their fiscal year, on “Form N-Q”. These filings are available on the SEC’s website at www.sec.gov and may be reviewed and copied at the SEC’s Public Reference Room in Washington, D.C. (call 1-202-551-8090 for information on the operation of the Public Reference Room.)
The Huntington National Bank, is the Custodian of The Funds. Gemini Fund Services, LLC serves as the Administrator, Transfer Agent and Fund Accountant. Rational Advisors, Inc., serves as Investment Advisor to the Funds.
This report is authorized for distribution to prospective investors only when preceded or accompanied by the Funds’ prospectus, which contains facts concerning each Fund’s objective and policies, management fees, expenses and other information.
Shareholder Services: 800-253-0412
(a) The Registrant has, as of the end of the period covered by this report, adopted a code of ethics that applies to the Registrant's principal executive officer, principal financial officer, and principal accounting officer or controller, or persons performing similar functions, regardless of whether these individuals are employed by the Registrant or a third party.
(b) During the period covered by this report, there were no amendments to any provision of the code of ethics.
(c) During the period covered by the report, with respect to the registrant’s code of ethics that applies to its Principal Executive Officer and Principal Financial Officer: there have been no amendments to a provision that relates to any element of the code of ethics definition enumerated in paragraph (b) of this Item 2.
| Item 3. | Audit Committee Financial Expert. |
3(a) The registrant’s board of trustees has determined that the registrant does not have an audit committee financial expert. The audit committee determined that, although none of its members meet the technical definition of an audit committee financial expert, the committee has sufficient financial expertise to adequately perform its duties under the Audit Committee Charter without the addition of a qualified expert.
| Item 4. | Principal Accountant Fees and Services. |
(a) Audit Fees. The aggregate fees billed for each of the last two fiscal years for professional services rendered by the registrant's principal accountant for the audit of the registrant's annual financial statements or services that are normally provided by the accountant in connection with statutory and regulatory filings or engagements for those fiscal years are as follows:
Fiscal year ended 2016: $72,500
Fiscal year ended 2015: $177,300
(b) Audit-Related Fees. There were no fees billed in each of the last two fiscal years for assurances and related services by the principal accountant that are reasonably related to the performance of the audit of the registrant’s financial statements and are not reported under paragraph (a) of this item.
Fiscal year ended 2016: $0
Fiscal year ended 2015: $23,450
(c) Tax Fees. The aggregate fees billed in each of the last two fiscal years for professional services rendered by the principal accountant for tax compliance are as follows:
Fiscal year ended 2016: $19,000
Fiscal year ended 2015: $114,700
(d) All other fees billed to the registrant by its principal accountants for the two most recent fiscal years:
Fiscal year ended 2016: $0
Fiscal year ended 2015: $0
(e)(1) The audit committee does not have pre-approval policies and procedures. Instead, the audit committee or audit committee chairman approves on a case-by-case basis each audit or non-audit service before the principal accountant is engaged by the Registrant.
(e)(2) There were no services described in each of paragraphs (b) through (d) of this Item that were approved by the audit committee pursuant to paragraph (c)(7)(i)(C) of Rule 2-01 of Regulation S-X. |
| (f) Not applicable. The percentage of hours expended on the principal accountant's engagement to audit the Registrant's financial statements for the most recent fiscal year that were attributed to work performed by persons other than the principal accountant's full-time, permanent employees was zero percent (0%). |
(g) All non-audit fees billed by the Registrant's principal accountant for services rendered to the Registrant for the fiscal years ended June 30, 2016 and 2015, respectively, are disclosed in (b)-(d) above. There were no audit or non-audit services performed by the Registrant's principal accountant for the Registrant's adviser.
Item 5. | Audit Committee of Listed Registrants.
|
Not applicable.
| Item 6. | Schedule of Investments. |
Included in annual report to shareholders filed under item 1 of this form.
| Item 7. | Disclosure of Proxy Voting Policies and Procedures for Closed-End Management Investment Companies. |
Not applicable.
| Item 8. | Portfolio Managers of Closed-End Management Investment Companies. |
Not applicable.
| Item 9. | Purchases of Equity Securities by Closed-End Management Investment Company and Affiliated Purchasers. |
Not applicable.
| Item 10. | Submission of Matters to a Vote of Security Holders. |
Not applicable.
| Item 11. | Controls and Procedures. |
(a) The registrant’s Principal Executive Officer and Principal Financial Officer, or persons performing similar functions, have concluded that the registrant’s disclosure controls and procedures (as defined in Rule 30a-3(c) under the Act) are effective in design and operation and are sufficient to form the basis of the certifications required by Rule 30a-2 under the Act, based on their evaluation of these disclosure controls and procedures within 90 days of the filing of this report on Form N-CSR.
(b) There were no changes in the registrant’s internal control over financial reporting (as defined in Rule 30a-3(d) under the Act (17 CFR 270.30a-3(d)) that occurred during the second fiscal quarter of the period covered by this report that have materially affected or are reasonably likely to materially affect, the registrant’s internal control over financial reporting.
(1) Code of Ethics for Principal Executive and Senior Financial Officers is attached hereto.
(2) Certifications pursuant to Section 302 of the Sarbanes-Oxley Act of 2002 are filed herewith.
(3) Certifications pursuant to Section 906 of the Sarbanes-Oxley Act of 2002 are filed herewith.
SIGNATURES
Pursuant to the requirements of the Securities Exchange Act of 1934 and the Investment Company Act of 1940, the registrant has duly caused this report to be signed on its behalf by the undersigned, thereunto duly authorized.
(Registrant) Mutual Fund and Variable Insurance Trust
| | | |
| By (Signature and Title) | | /s/ Jerry Szilagyi |
| | | Jerry Szilagyi, President and Principal Executive Officer |
| | | |
| Date | | 3/9/17 |
Pursuant to the requirements of the Securities Exchange Act of 1934 and the Investment Company Act of 1940, this report has been signed below by the following persons on behalf of the registrant and in the capacities and on the dates indicated.
| | | |
| By (Signature and Title) | | /s/ Jerry Szilagyi |
| | | Jerry Szilagyi, President and Principal Executive Officer |
| | | |
| By (Signature and Title) | | /s/ Erik Naviloff |
| | | Erik Naviloff, Treasurer and Principal Financial Officer |
| | | |
| Date | | 3/9/17 |