UNITED STATES
SECURITIES AND EXCHANGE COMMISSION
Washington, D.C. 20549
FORM N-CSR
CERTIFIED SHAREHOLDER REPORT OF REGISTERED
MANAGEMENT INVESTMENT COMPANIES
Investment Company Act file number 811-05010
Mutual Fund and Variable Insurance Trust
(Exact name of registrant as specified in charter)
36 North New York Avenue
Huntington, NY 11743
(Address of principal executive offices) (Zip code)
Gemini Fund Services, LLC
17605 Wright Street
Omaha, Nebraska 68130
(Name and address of agent for service)
Registrant’s telephone number, including area code: 1-631-629-4237
Date of fiscal year end: December 31
Date of reporting period: December 31, 2017
| Item 1. | Reports to Shareholders. |

Annual Shareholder Report
| December 31, 2017 |
| CLASS A SHARES |
| CLASS C SHARES |
| INSTITUTIONAL SHARES |
| |
| |
| |
| |
| |
| |
| |
| |
| |
| |
| |
| |
| |
| |
| |
| |
| |
| |
| |
| |
| |
| |
| |
| |
| |
| |
| |
| |

January 31, 2018
Rational Dividend Capture Fund
Dear Fellow Shareholders,
The Rational Dividend Capture Fund (the “Fund”) seeks total return on investment, with dividend income an important component of that return. The Fund focuses on high dividend paying stocks that also are attractively valued to provide an attractive return over a full market cycle. We define a full market cycle as both a bear market and a bull market. It is expected that this strategy will underperform when such sectors like technology are very strong, but outperform when the more aggressive sectors of the market are weak. The dividend yield provides a nice consistent stream of income and stability to the long-term returns. An appropriate benchmark for this strategy is not a simple question, it has characteristics of both an equity portfolio but also the yield more resembling the bond market historically. Many of the higher yielding sectors of the market had very negative returns in 2017, such as the energy sectors and telecommunications. Business Development Companies and REITs also underperformed significantly. Lastly, value-oriented stocks, also significantly underperformed growth stocks, and in fact have done so 3 of the last four years. We believe the value stocks and yield oriented stocks are very attractive on a historical basis relative to the market and in particular the growth or the momentum sectors. We are confident in the long-term potential of the Fund and strategy, particularly relative to more aggressive types of investments given where the markets are versus their long-term norms.
Investment Strategy
The Fund normally invests at least 80% of its net assets in dividend paying stocks, including preferred stocks and real estate investment trusts (“REITs”).
The Fund uses a value approach to identify attractive, dividend paying stocks. The discipline focuses on cash flows or earnings of companies, their growth rate, and the valuation of their stock prices. As an example, the manager likes to buy REITs below their real estate value or operating companies below their intrinsic value, to gain from the appreciation of the stock overtime and collect an attractive dividend yield. Stocks are sold when the fundamentals deteriorate, become too highly valued, or when there may be a better alternative including cash.
As part of the investment process, the Fund invests in both preferred stocks and common stocks.
Fund Performance
The Rational Dividend Capture Fund had a tough year, significantly underperforming its S&P 500 Total Return Index benchmark with a -1.99% (Institutional Class) return versus 21.83% for the benchmark. As we mentioned, the sectors- in which the Fund invests, in order to get an attractive dividend yield and appreciation, performed poorly in 2017. The technology sector was an extremely strong performer in 2017, driven by securities that do not fit the investment criteria of the Fund. What typically happens in the late stage of a market cycle is the momentum or speculative stocks perform very strongly and the value and income stocks lag considerably relative to the market. This is exactly what happened in 2017. It is the expectation of management that the volatility of the markets is going to rise significantly in 2018, having an attractive dividend yield and having a cash reserve will help cushion the potential downside. Additionally, the cash can be invested opportunistically. Bear markets are always difficult to predict. Bear markets occur due to recessions, or in the case of the 1987 crash it was due to rising interest rates, high valuations, too much bullish sentiment, too much margin debt, and a weak dollar, we have similar conditions currently. This strategy maybe a nice way of weathering the storm or benefitting from a resumption of value stocks due to stronger economic growth.
The Fund’s total annualized returns through 12/31/17 as compared to the S&P 500 Total Return Index were as follows:
| | | | | Since Inception |
| | 1 Year | 5 Years | 10 Years | (02/28/01) |
| Class A | -2.24% | 5.69% | 4.46% | 5.57% |
| Institutional | -1.99% | 5.97% | 4.72% | 5.82% |
| Class A with Sales Charge | -6.88% | 4.67% | 3.96% | 5.26% |
| S&P 500 Total Return Index1 | 21.83% | 15.79% | 8.50% | 6.77% |
| | | | | |
The Fund’s maximum sales charge for Class “A” shares is 4.75%. Investments in mutual funds involve risks. Performance is historic and does not guarantee future results. Investment return and principal value will fluctuate with changing market conditions so that when redeemed, shares may be worth more or less than their original cost. Current performance may be lower or higher than the performance data quoted. To obtain the most recent month- end performance information or the Fund’s prospectus please call the Fund, toll free at 1-800-253-0412. You can also obtain a prospectus at www.RationalMF.com.
Summary
We are much encouraged by the recent fiscal stimulus to accelerate the growth of the U.S. Economy improving the fundamentals of the sectors in which the Fund typically focuses. We are confident in the long-term success of the strategy. Successful investing requires a long-term outlook focused on objective criteria that create value. We have adopted this outlook for the Fund, and we are glad that you have decided to share in our vision.
Sincerely,
Patrick Adams and Rick Garcia
Portfolio Managers
This report is intended for the Fund’s shareholders. It may not be distributed to prospective investors unless it is preceded or accompanied by the current Fund prospectus. To obtain a prospectus or other information about the Fund, please visit www.RationalMF.com or call 1-800-253-0412. Please read the prospectus carefully before investing.
| (1) | The S&P 500 Total Return Index by Standard & Poor’s Corp. is a capitalization-weighted index comprising 500 issues listed on various exchanges, representing the performance of the stock market generally. Please note that indices do not take into account any fees and expenses of investing in the individual securities that they track, and individuals cannot invest directly in any index, although individuals may invest in exchange traded funds or other investment vehicles that attempt to track the performance of an index. The Rational Dividend Capture Fund may or may not purchase the types of securities represented by the S&P 500 Total Return Index. |
4210-NLD-2/14/2018
| Rational Dividend Capture Fund |
| PORTFOLIO REVIEW |
| December 31, 2017 |
| |
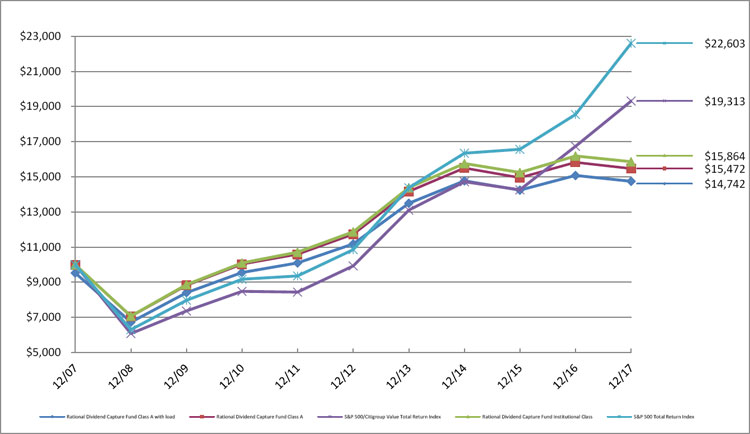
The Fund’s performance figures* for each of the periods ended December 31, 2017, compared to its benchmarks:
| | | Annualized | Annualized | Annualized |
| | 1 Year Return | 5 Year Return | 10 Year Return | Since 1/2/2014(a) |
| Class A | -2.24% | 5.69% | 4.46% | N/A |
| Class A with load | -6.88% | 4.67% | 3.96% | N/A |
| Class C | -2.68% | N/A | N/A | 1.88% |
| Institutional Class | -1.99% | 5.97% | 4.72% | N/A |
| S&P 500 Total Return Index (b) | 21.83% | 15.79% | 8.50% | 12.24% |
| S&P 500/Citigroup Value Total Return Index (c) | 15.36% | 14.24% | 6.80% | 10.44% |
| | | | | |
| * | The performance data quoted here represents past performance. Current performance may be lower or higher than the performance data quoted above. Investment return and principal value will fluctuate, so that shares, when redeemed, may be worth more or less than their original cost. The returns shown do not reflect the deduction of taxes that a shareholder would pay on Fund distributions or on the redemptions of Fund shares. Past performance is no guarantee of future results. Performance figures for periods greater than 1 year are annualized. Per the fee table in the Fund’s May 1, 2017 prospectus, the total annual operating expense are 1.43% for Institutional Class shares, 1.68% for A shares and 2.18% for C shares before fee waivers. See the financial highlights for current expense ratios. For performance information current to the most recent month-end, please call toll-free 1-800-253-0412. Class A shares are subject to a maximum load of 4.75%. |
| (a) | Inception date is January 2, 2014 for Class C and the Benchmarks. |
| (b) | The “S&P 500 Total Return Index”, a registered trademark of McGraw-Hill Co., Inc., is a market capitalization-weighted index of 500 widely held common stocks. Investors cannot invest directly in an Index. |
| (c) | The S&P 500/Citigroup Value Total Return Index uses a numerical ranking system based on four value factors and three growth factors to determine the constituents and their weightings. Investors cannot invest directly in an Index. |
Comparison of the Change in Value of a $10,000 Investment
| Top 10 Holdings by Industry | | % of Net Assets | |
| REITs | | | 18.7 | % |
| Business Development Companies | | | 13.9 | % |
| Oil & Gas | | | 9.6 | % |
| Exchange Traded Funds | | | 8.2 | % |
| Pharmaceuticals | | | 7.9 | % |
| Retail | | | 7.7 | % |
| Diversified Financial Services | | | 5.4 | % |
| Telecommunications | | | 5.4 | % |
| Semiconductors | | | 3.6 | % |
| Food | | | 3.4 | % |
| Other/Short-Term Investments | | | 16.2 | % |
| | | | 100.0 | % |
| | | | | |
Please refer to the Portfolio of Investments for a more detailed breakdown of the Fund’s assets.
January 31, 2018
Rational Risk Managed Emerging Markets Fund
Dear Fellow Shareholders,
The Rational Risk Managed Emerging Markets Fund (the “Fund”) seeks to offer investors a compelling opportunity to exploit the potential excess returns over the MSCI Emerging Markets Total Return Index through using a combination of fundamental top-down macro analysis, fundamental and quantitative stock selection and currency hedging (which is generally done using an algorithmic model). This seeks to allow investors to take emerging markets exposure while potentially hedging against currency risk.
Fund Performance
During 2017, the Fund underperformed relative to the index. This was mainly due to our FX hedging overlay that in a strong trending market got whipsawed, which cost performance. The Fund’s pure equity exposure outperformed the market. The Fund’s holding in Chinese Tech and Consumer did very well during the year, as did the holdings in commodity related themes, including Sberbank, the largest bank in Russia. Global growth continued to inch higher and in combination with low inflation and a weak US dollar, set the stage for strong emerging market performance.
The Fund’s total annualized returns through 12/31/17 as compared to the S&P 500 Total Return Index were as follows:
| | | | Since Inception |
| | 1 Year | 5 Years | (12/30/2009) |
| Class A | 33.38% | 6.37% | 4.69% |
| Institutional | 33.79% | 6.61% | 4.96% |
| Class A with Sales Charge | 27.13% | 5.35% | 4.06% |
| MSCI Emerging Markets TR Index1 | 37.28% | 4.35% | 4.58% |
| | | | |
The Fund’s maximum sales charge for Class “A” shares is 4.75%. Investments in mutual funds involve risks. Performance is historic and does not guarantee future results. Investment return and principal value will fluctuate with changing market conditions so that when redeemed, shares may be worth more or less than their original cost. Current performance may be lower or higher than the performance data quoted. To obtain the most recent month- end performance information or the Fund’s prospectus please call the Fund, toll free at 1-800-253-0412. You can also obtain a prospectus at www.RationalMF.com.
Summary
We believe that the Fund is currently positioned to do very well versus the market and the peer group. We have identified exciting long-term macro and structural themes in consumption trends, business cycle and specific country reform stories. Our stock selection has positioned the Fund to withstand the expected future volatility due to favorable valuations, quality factors and structural trends that are not dependent on the global cycle.
Sincerely,
The Cambridge Strategy (Asset Management) Limited
This report is intended for the Fund’s shareholders. It may not be distributed to prospective investors unless it is preceded or accompanied by the current Fund prospectus. To obtain a prospectus or other information about
the Fund, please visit www.RationalMF.com or call 1-800-253-0412. Please read the prospectus carefully before investing.
| (1) | The MSCI Emerging Markets Index captures large and mid-cap representation across 24 Emerging Markets (EM) countries. With 846 constituents, the index covers approximately 85% of the free float-adjusted market capitalization in each country. |
4212-NLD-2/14/2018
| Rational Risk Managed Emerging Markets Fund |
| PORTFOLIO REVIEW |
| December 31, 2017 |
| |
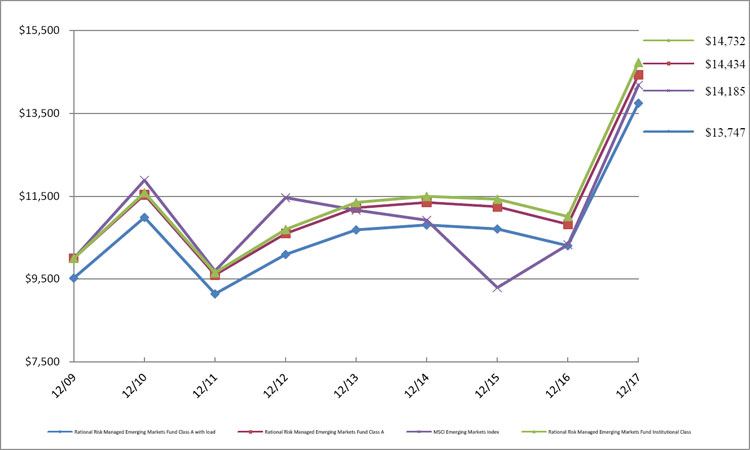
The Fund’s performance figures* for each of the periods ended December 31, 2017, compared to its benchmark:
| | | Annualized | Annualized | Annualized |
| | 1 Year Return | 5 Year Return | Since 12/30/2009(a) | Since 5/31/2016(b) |
| Class A | 33.38% | 6.37% | 4.69% | N/A |
| Class A with load | 27.13% | 5.35% | 4.06% | N/A |
| Class C | 32.43% | N/A | N/A | 17.59% |
| Institutional Class | 33.79% | 6.61% | 4.96% | N/A |
| MSCI Emerging Markets Index (c) | 37.28% | 4.35% | 4.58% | 28.68% |
| | | | | |
| * | The performance data quoted here represents past performance. Current performance may be lower or higher than the performance data quoted above. Investment return and principal value will fluctuate, so that shares, when redeemed, may be worth more or less than their original cost. The returns shown do not reflect the deduction of taxes that a shareholder would pay on Fund distributions or on the redemptions of Fund shares. Past performance is no guarantee of future results. Performance figures for periods greater than 1 year are annualized. Per the fee table in the Fund’s May 1, 2017 prospectus, the total annual operating expense are 3.13% for Institutional Class shares, 3.38% for A shares and 3.88% for C shares before fee waivers. See the financial highlights for current expense ratios. For performance information current to the most recent month-end, please call toll-free 1-800-253-0412. Class A shares are subject to a maximum load of 4.75%. |
| (a) | Inception date is December 30, 2009 for Class A, Institutional Class and the Benchmark. |
| (b) | Inception date is May 31, 2016 for Class C and the Benchmark. |
| (c) | The MSCI Emerging Markets Index consists of 23 countries representing 10% of world market capitalization. The Index is available for a number of regions, market segments/sizes and covers approximately 85% of the free float-adjusted market capitalization in each of the 23 countries. |
Comparison of the Change in Value of a $10,000 Investment
| Top 10 Holdings by Industry | | % of Net Assets | |
| Banks | | | 18.1 | % |
| Internet | | | 14.8 | % |
| Semiconductors | | | 10.4 | % |
| Insurance | | | 7.5 | % |
| Retail | | | 3.9 | % |
| Oil & Gas | | | 3.7 | % |
| Auto Parts & Equipment | | | 3.4 | % |
| Media | | | 3.4 | % |
| Gas | | | 3.2 | % |
| Equity - Exchange Traded Funds | | | 3.1 | % |
| Other/Short-Term Investments | | | 28.5 | % |
| | | | 100.0 | % |
| | | | | |
Please refer to the Portfolio of Investments for a more detailed breakdown of the Fund’s assets.
January 31, 2018
Rational Hedged Return Fund
Dear Fellow Shareholders,
The Rational Hedged Return Fund (the “Fund”) seeks total returns consisting of capital appreciation and income by making investments in long and short call and put options on futures contracts on the S&P 500 Index, as well as cash, and cash equivalents. From the start of 2017 through December 4th, the Fund’s prior managers used a different strategy to manage the Fund and performed in-line with its category. On December 5th, Warrington Asset Management LLC was engaged as the Fund’s Sub-Advisor. From then until the end of the year, the Fund outperformed the IQ Hedge Long/ Short Beta Total Return Index, but lagged slightly behind the S&P 500.
Investment Strategy
The new Sub Advisor’s strategy seeks to achieve its investment objective in three ways: (1) Premium Collection – the Fund collects premiums on options it sells; (2) Volatility Trading – the Fund may enter into positions designed to hedge or profit from either an increase or a decrease in Index volatility; and (3) Trend Following – the Fund may increase or decrease the balance of puts and calls based on trending market direction. The Fund is designed to produce returns that are not correlated with equity market returns. The Fund employs strict risk management procedures, supported by both technical and fundamental analysis, that are intended to provide consistency of returns and to mitigate the extent of losses.
Fund Performance
The Hedged Return Fund generated a 2017 return of 3.59% in Class A (after new Sub-Advisor assumed management, the Fund returned 0.70%), versus 5.77% for its S&P GSCI benchmark and 11.96% for its IQ Hedge Long/ Short Beta Total Return Index benchmark.
The Fund performed in-line with its category until the strategy change in December. After the change, the returns were also in-line with the new benchmarks, and helped the Fund to end the year with good overall performance. After some weakness at the start of December, the S&P Index resumed its relentless climb higher. Warrington chose to limit the call option exposure in the Fund as the prices did not accurately account for the substantial risk we perceived of the market continuing to rise. We held a standard allocation of put options as the prices of those positions fairly compensated for the risks they presented. The Fund’s worst monthly return (which occurred prior to the new Sub Advisor’s engagement) for the year was -12.18% whereas the S&P was +0.12% and the IQ Hedge Long/ Short Beta Total Return Index was +0.28%.
The Fund’s total annualized returns through 12/31/17 as compared to the S&P GSCI TR Index were as follows:
| | | | | | Since Inception |
| | 1 Year | 3 Years | 5 Years | 10 Years | (05/01/07) |
| Class A | 3.59% | -2.25% | -2.92% | -4.69% | -3.53% |
| Institutional | 3.50% | -2.34% | -2.83% | -4.53% | -3.36% |
| Class A with Sales Charge | -1.41% | -3.85% | -3.86% | -5.16% | -3.97% |
| S&P GSCI1 | 5.77% | -7.52% | -12.16% | -10.16% | -7.48% |
| | | | | | |
The Fund’s maximum sales charge for Class “A” shares is 4.75%. Investments in mutual funds involve risks. Performance is historic and does not guarantee future results. Investment return and principal value will fluctuate with changing market conditions so that when redeemed, shares may be worth more or less than their original cost. Current performance may be lower or higher than the performance data quoted. To obtain the most recent month-
end performance information or the Fund’s prospectus please call the Fund, toll free at 1-800-253-0412. You can also obtain a prospectus at www.RationalMF.com.
Summary
After performing in-line with the Fund’s category through December 4th, the Fund altered its strategy and hired a new Sub-Advisor on December 5th. The new Sub-Advisor, Warrington Asset Management, LLC, brings extensive experience, with over 20 years of successfully trading options for clients throughout a variety of market conditions. Warrington’s options-focused investment management provides diversification and non-correlation for traditional portfolios. Warrington will look to continue its many years of investment success in this new arena. The results from December were encouraging, as the transition was seamless and the Sub-Advisor was able to quickly implement its trading strategies into the Fund.
Sincerely,
Scott Kimple and Mark Adams
Portfolio Managers
This report is intended for the Fund’s shareholders. It may not be distributed to prospective investors unless it is preceded or accompanied by the current Fund prospectus. To obtain a prospectus or other information about the Fund, please visit www.RationalMF.com or call 1-800-253-0412. Please read the prospectus carefully before investing.
| (1) | The S&P GSCI (Goldman Sachs Commodity Index) Total Return Index by Standard & Poor’s Corp. measures general price movements and inflation in the world economy. The S&P GSCI is calculated primarily on a world production-weighted basis and is comprised of the principal physical commodities that are the subject of active, liquid futures markets. The Rational Hedged Return Fund may or may not purchase the types of securities represented by the S&P GSCI Total Return Index. |
3219-NLD-2/14/2018
| Rational Hedged Return Fund (Formerly, Rational Real Strategies Fund) |
| PORTFOLIO REVIEW |
| December 31, 2017 |
| |
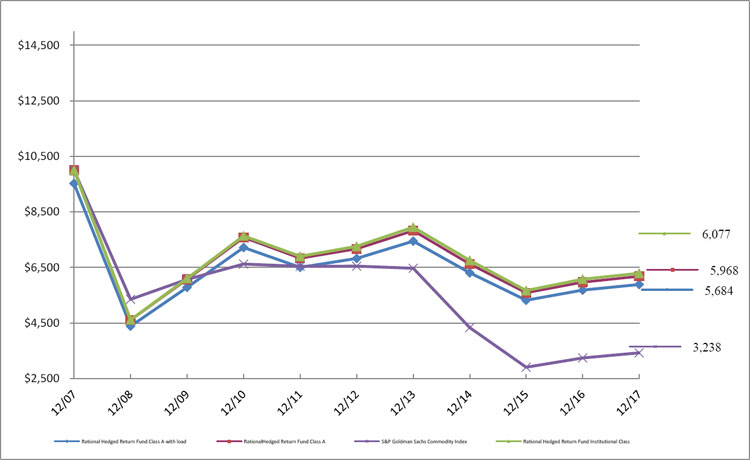
The Fund’s performance figures* for each of the periods ended December 31, 2017, compared to its benchmark:
| | | Annualized | Annualized | Annualized |
| | 1 Year Return | 5 Year Return | 10 Year Return | Since 5/31/2016(a) |
| Class A | 3.59% | -2.92% | -4.69% | N/A |
| Class A with load | -1.41% | -3.86% | -5.16% | N/A |
| Class C | 3.02% | N/A | N/A | 5.40% |
| Institutional Class | 3.50% | -2.83% | -4.53% | N/A |
| S&P Goldman Sachs Commodity Index (b) | 5.77% | -12.16% | -10.16% | 4.54% |
| | | | | |
| * | The performance data quoted here represents past performance. Current performance may be lower or higher than the performance data quoted above. Investment return and principal value will fluctuate, so that shares, when redeemed, may be worth more or less than their original cost. The returns shown do not reflect the deduction of taxes that a shareholder would pay on Fund distributions or on the redemptions of Fund shares. Past performance is no guarantee of future results. Performance figures for periods greater than 1 year are annualized. Per the fee table in the Fund’s December 5, 2017 prospectus, the total annual operating expense are 3.61% for Institutional Class shares, 3.86% for A shares and 4.36% for C shares before fee waivers. See the financial highlights for current expense ratios. For performance information current to the most recent month-end, please call toll-free 1-800-253-0412. Class A shares are subject to a maximum load of 4.75%. |
| (a) | Inception date is May 31, 2016 for Class C and the Benchmark. |
| (b) | The S&P Goldman Sachs Commodity Index® (“S&P GSCI”) measures general price movements and inflation in the world economy. The S&P GSCI is calculated primarily on a world production-weighted basis and is comprised of the principal physical commodities that are the subject of active, liquid futures markets. The index is unmanaged and, unlike the Fund, is not affected by cash flows. It is not possible to invest directly in an Index. |
Comparison of the Change in Value of a $10,000 Investment
| Top 10 Holdings by Industry ^ | | % of Net Assets | |
| Short-Term Investments | | | 48.2 | % |
| Other/Short-term Investments | | | 51.8 | % |
| | | | 100.0 | % |
| | | | | |
^ Does not include derivatives in which the Fund invests.
Please refer to the Portfolio of Investments for a more detailed breakdown of the Fund’s assets.
January 31, 2018
Rational Dynamic Brands Fund
Dear Fellow Shareholders,
The Rational Dynamic Brands Fund (the “Fund”) seeks long-term capital appreciation by investing in a focused group (25-50 holdings) of the most attractive & relevant brands contained in the Alpha Brands Consumer Spending Index (the “Index”). Security selection is driven by a combination of fundamental and technical factors. In times of economic turmoil or unusually high equity valuations where equity risk is deemed high, the Fund may also invest in cash and cash equivalents and in asset classes that have historically been safe havens when equities were experiencing drawdowns. De-risking decisions are driven by: current equity trend, economic growth profile, consumer health, equity valuations, technical analysis, FED policy, interest rates, credit spreads, and asset class volatility trends.
Investment Strategy
The Fund normally pursues its investment objective by investing primarily in equity securities contained in the Alpha Brands Consumer Spending Index. The Index contains 200 leading and relevant Brands across all sectors and approximately 70 consumption-focused sub-industries. The Fund expects to be invested primarily in U.S. companies with market capitalizations above $1 billion, although it may invest without limit in companies of any market capitalization so long as the companies are included in the Brands Index. The Fund may invest in non-U.S. equities so long as those equities are included in the Index.
The Fund is managed as a Core + Tactical approach where Core brands will typically hold higher portfolio weights than tactical brands. Core brands can be identified as the most attractive brands from a secular growth perspective and using 3 multi-factor screens to identify the top ranked Growth (operating kings), Value & Dividend (sustainable yielders) and Price Momentum opportunities from the 200 index constituents. The companies chosen from the core screens will often be the leading brand(s) navigating through large, sustainable secular growth markets with large total addressable market opportunities. Tactical brands will typically hold smaller portfolio weights and are more thematic in nature. Tactical buys are often driven by attractive technical set-ups that appear to offer short-term upside from out of favor brands from within the index. Tactical opportunities are often contrarian in nature and complement Core ideas well. They are often follow-on ideas from within attractive industries where the Investment Committee has determined greater exposure is warranted. The final part of the investment process determines how exposed to equities the Investment Committee believes is prudent. Exposures are determined by such factors as: current equity trend, economic growth profile, consumer health, equity valuations, technical analysis, FED policy, interest rates, credit spreads, and asset class volatility trends.
Fund Performance
On 10/17/17, the Rational Defensive Growth Fund was converted and renamed the Rational Dynamic Brands Fund. Since Accuvest took over as the sub-advisor for the fund, performance has been strong on a relative and absolute basis. Consumer stocks have performed well driven by the wealth effect as well as enthusiasm over personal and corporate tax reform. The Rational Dynamic Brands Fund gained +5.71% since being converted to the Brands
portfolio. Over the same timeframe, the S&P 500 index was up +4.89%. Outperformance was driven mostly by overweight position in Technology and Consumer Discretionary sectors.
The Fund is currently overweight growth Brands and the top sector holdings are Technology, Consumer Discretionary and Consumer Staples. These allocations were driven by the fundamental and technical work done via the investment process highlighted in this document.
The Fund will typically be overweight the leading consumer discretionary and staples brands given its focus on consumer spending but has no mandate to do so on an ongoing basis.
The Fund’s total annualized returns through 12/31/17 as compared to the S&P 500 Total Return Index were as follows:
| | | | | Since Inception |
| | 1 Year | 5 Years | 10 Years | (09/29/02) |
| Class A | 14.30% | 7.16% | 5.83% | 10.02% |
| Institutional | 14.66% | 7.48% | 6.13% | 10.32% |
| Class A with Sales Charge | 9.01% | 6.12% | 5.32% | 9.67% |
| S&P 500 Total Return Index1 | 21.83% | 15.79% | 8.50% | 10.23% |
| | | | | |
The Fund’s maximum sales charge for Class “A” shares is 4.75%. Investments in mutual funds involve risks. Performance is historic and does not guarantee future results. Investment return and principal value will fluctuate with changing market conditions so that when redeemed, shares may be worth more or less than their original cost. Current performance may be lower or higher than the performance data quoted. To obtain the most recent month- end performance information or the Fund’s prospectus please call the Fund, toll free at 1-800-253-0412. You can also obtain a prospectus at www.RationalMF.com.
Summary
Consumer spending is the key driver of U.S. economic growth as well as global growth. Investing in the most relevant and powerful brands offers investors a dedicated allocation to American Consumerism through a well-researched list of the leading brands. Our goal is to track a lifetime of spending via the leading brands winning our mind and wallet-share. As we enter 2018, our view of the consumer sector is positive and economic growth appears on strong footing. As the economic data changes, so too will our allocations to the leading brands. We have many tools at our disposal to help protect capital when we see evidence of an economic slowdown. Successful investing requires a long-term outlook focused on objective criteria that creates value. We have adopted this outlook for the Rational Dynamic Brands Fund, and we are glad that you have decided to share in our vision.
Sincerely,
David Garff, Eric Clark, and James Calhoun
Portfolio Managers
This report is intended for the Fund’s shareholders. It may not be distributed to prospective investors unless it is preceded or accompanied by the current Fund prospectus. To obtain a prospectus or other information about the Fund, please visit www.RationalMF.com or call 1-800-253-0412. Please read the prospectus carefully before investing.
| (1) | The S&P 500 Total Return Index® (“S&P 500 TR”) is an unmanaged index generally representing the performance of the broad domestic economy through changes in the aggregate market value of 500 stocks representing all major industries. Indices are unmanaged and, unlike the Fund, are not affected by cash flows. It is not possible to invest directly in an Index. For additional disclosure relating to the S&P 500 TR, please see “Additional Disclaimers” in the Fund’s Prospectus. |
4216-NLD-2/15/2018
| Rational Dynamic Brands Fund (Formerly, Rational Defensive Growth Fund) |
| PORTFOLIO REVIEW |
| December 31, 2017 |
| |
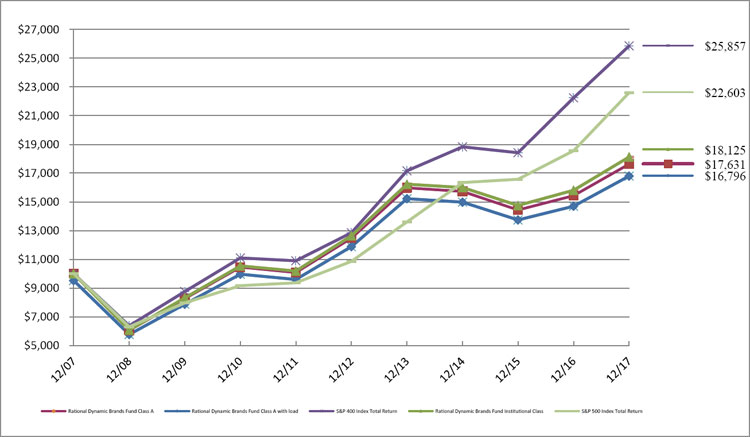
The Fund’s performance figures* for each of the periods ended December 31, 2017, compared to its benchmark:
| | | Annualized | Annualized | Annualized |
| | 1 Year Return | 5 Year Return | 10 Year Return | Since 1/2/2014(a) |
| Class A | 14.30% | 7.16% | 5.83% | N/A |
| Class A with load | 9.01% | 6.12% | 5.32% | N/A |
| Class C | 14.03% | N/A | N/A | 2.32% |
| Institutional Class | 14.66% | 7.48% | 6.13% | N/A |
| S&P 400 Index Total Return (b) | 16.24% | 15.01% | 9.97% | 11.11% |
| S&P 500 Index Total Return (c) | 21.83% | 15.79% | 8.50% | 12.24% |
| | | | | |
| * | The performance data quoted here represents past performance. Current performance may be lower or higher than the performance data quoted above. Investment return and principal value will fluctuate, so that shares, when redeemed, may be worth more or less than their original cost. The returns shown do not reflect the deduction of taxes that a shareholder would pay on Fund distributions or on the redemptions of Fund shares. Past performance is no guarantee of future results. Performance figures for periods greater than 1 year are annualized. Per the fee table in the Fund’s October 17, 2017 prospectus, the total annual operating expense are 1.76% for Institutional Class shares, 2.01% for A shares and 2.51% for C shares before fee waivers. See the financial highlights for current expense ratios. For performance information current to the most recent month-end, please call toll-free 1-800-253-0412. |
| (a) | Inception date is January 2, 2014 for Class C and corresponding Benchmark. |
| (b) | The S&P 400 is a capitalization-weighted index comprised of common stocks representing major industries in the mid-range of the U.S. stock market. The index is unmanaged and, unlike the Fund, is not affected by cash flows. It is not possible to invest directly in an Index. |
| (c) | The “S&P 500 Total Return Index”, a registered trademark of McGraw-Hill Co., Inc., is a market capitalization-weighted index of 500 widely held common stocks. Investors cannot invest directly in an Index. |
Comparison of the Change in Value of a $10,000 Investment
| Top 10 Holdings by Industry | | % of Net Assets | |
| Internet | | | 17.5 | % |
| Retail | | | 17.4 | % |
| Software | | | 9.0 | % |
| Beverages | | | 8.9 | % |
| Telecommunications | | | 6.0 | % |
| Banks | | | 5.0 | % |
| Pharmaceuticals | | | 5.0 | % |
| Semiconductors | | | 4.0 | % |
| Computers | | | 3.9 | % |
| Media | | | 3.9 | % |
| Other/Short-Term Investments | | | 19.4 | % |
| | | | 100.0 | % |
| | | | | |
Please refer to the Portfolio of Investments for a more detailed breakdown of the Fund’s assets.
January 31, 2018
Rational Strategic Allocation Fund
Dear Fellow Shareholders,
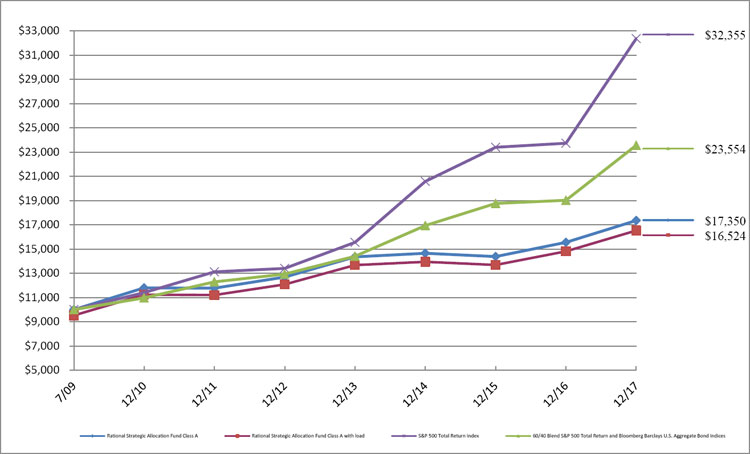
The Rational Strategic Allocation Fund (the “Fund”) seeks current income and moderate appreciation of capital by investing in a combination of mutual funds and exchange-traded funds (“ETFs”). During 2017, the Fund achieved strong gains, but underperformed its Balanced Allocation Indices Blend (“BAIB”) benchmark with a 11.61% return (Class A) versus 14.25% for the benchmark. The Fund benefited from its allocation to emerging markets equity and from our expansion into equity ETF strategies. The Fund underperformed its benchmark due its allocation to MLP (Master Limited Partnership) equity.
Investment Strategy
The Fund seeks to achieve its objective by investing in a combination of underlying mutual funds and ETFs. We invest in equity, income and uncorrelated investment strategies. We select underlying funds using a fundamental research process, including a top-down analysis of market conditions and investment category historical performance during various market conditions. We also perform a bottom-up analysis of each potential fund for investment, including investment allocations, investment valuations and characteristics, positioning, historical performance during various market conditions and that Fund’s portfolio manager’s outlook.
Fund Performance
During 2017, the Fund returned 11.61%, trailing its BAIB benchmark’s return of 14.25%. The Fund benefited from its allocation to emerging markets equity as this was one of the best performing global asset classes in 2017 due to steady global economic expansion and relatively low levels of geo-political volatility. The Fund also benefited from increased allocations to equity ETF strategies. The Fund’s exposure to MLP equity detracted from performance. Energy was one of two S&P 500 Index sectors that had a negative return in 2017. Stocks in the energy sector sold off during the first half of 2017 as OPEC production cuts kept the price of WTI crude under pressure. Despite a rally in energy prices in the second half of 2017, stocks in the energy sector still finished the year negative.
The Fund’s total annualized returns through 12/31/17 as compared to the Balanced Allocation Indices Blend and the S&P 500 Total Return Index were as follows:
| | | | | Since Inception |
| | 1 Year | 3 Years | 5 Years | (07/30/09) |
| Class A | 11.61% | 5.81% | 6.46% | 6.76% |
| Class A with Sales Charge | 6.30% | 4.10% | 5.43% | 6.14% |
| Balanced Allocation Indices Blend | 14.25% | 7.89% | 10.33% | 10.71% |
| S&P 500 Total Return Index | 21.83% | 11.41% | 15.79% | 14.96% |
| | | | | |
The Fund’s maximum sales charge for Class “A” shares is 4.75%. Investments in mutual funds involve risks. Performance is historic and does not guarantee future results. Investment return and principal value will fluctuate with changing market conditions so that when redeemed, shares may be worth more or less than their original cost. Current performance may be lower or higher than the performance data quoted. To obtain the most recent month- end performance information or the Fund’s prospectus please call the Fund, toll free at 1-800-253-0412. You can also obtain a prospectus at www.RationalMF.com.
Summary
The Fund achieved strong gains in 2017 consistent with our investment objective. The majority of the holdings performed to our expectations and the Fund benefited from our increased allocations to equity ETF strategies. Successful investing requires a long-term outlook focused on objective criteria that create value. We have adopted this outlook for the Fund, and we are glad that you have decided to share in our vision.
Sincerely,
David Miller and Michael Schoonover
Portfolio Managers
This report is intended for the Fund’s shareholders. It may not be distributed to prospective investors unless it is preceded or accompanied by the current Fund prospectus. To obtain a prospectus or other information about the Fund, please visit www.RationalMF.com or call 1-800-253-0412. Please read the prospectus carefully before investing.
The S&P 500 Total Return Index by Standard & Poor’s Corp. is a capitalization-weighted index comprising 500 issues listed on various exchanges, representing the performance of the stock market generally. Please note that indices do not take into account any fees and expenses of investing in the individual securities that they track, and individuals cannot invest directly in any index, although individuals may invest in exchange traded funds or other investment vehicles that attempt to track the performance of an index. The Rational Strategic Allocation Fund may or may not purchase the types of securities represented by the S&P 500 Total Return Index.
The Balanced Allocation Indices Blend (“BAIB”) is a custom blended index comprised of the following two indices with their noted respective weightings: Standard & Poor’s 500 Index® (“S&P 500”) (60%) and the Bloomberg Barclays U.S. Aggregate Bond Index (40%). The Barclays U.S. Aggregate Index is comprised of securities from the Barclays Government/Corporate Bond Index, Mortgage Securities Index and the Asset Based Index. Total return comprises price appreciation/depreciation and income as a percentage of the original investment. Indices are rebalanced monthly by market capitalization. The index is unmanaged and, unlike the Fund, is not affected by cash flows. The S&P 500 is an unmanaged index generally representing the performance of the broad domestic economy through changes in the aggregate market value of 500 stocks representing all major industries. Investments cannot be made in an index. For additional disclosure relating to the S&P 500, please see “Additional Disclaimers” in this Prospectus.
3201-NLD-2/13/2018
| Rational Strategic Allocation Fund |
| PORTFOLIO REVIEW |
| December 31, 2017 |
| |
The Fund’s performance figures* for each of the periods ended December 31, 2017, compared to its benchmarks:
| | | Annualized | Annualized | Annualized |
| | 1 Year Return | 5 Year Return | Since 7/30/2009(a) | Since 5/31/2016(b) |
| Class A | 11.61% | 6.46% | 6.76% | N/A |
| Class A with load | 6.30% | 5.43% | 6.14% | N/A |
| Class C | 10.80% | N/A | N/A | 9.72% |
| Institutional Class | 11.95% | N/A | N/A | 10.80% |
| S&P 500 Total Return Index (c) | 21.83% | 15.79% | 14.96% | 18.96% |
| BAIB Index (d) | 14.25% | 10.33% | 10.71% | 11.86% |
| | | | | |
| * | The performance data quoted here represents past performance. Current performance may be lower or higher than the performance data quoted above. Investment return and principal value will fluctuate, so that shares, when redeemed, may be worth more or less than their original cost. The returns shown do not reflect the deduction of taxes that a shareholder would pay on Fund distributions or on the redemptions of Fund shares. Past performance is no guarantee of future results. Performance figures for periods greater than 1 year are annualized. Per the fee table in the Fund’s May 1, 2017 prospectus, the total annual operating expense are 2.00% for Institutional Class shares, 2.25% for A shares and 2.75% for C shares before fee waivers. See the financial highlights for current expense ratios. For performance information current to the most recent month-end, please call toll-free 1-800-253-0412. Class A shares are subject to a maximum load of 4.75%. |
| (a) | Inception date is July 30, 2009 for Class A and the Benchmarks. |
| (b) | Inception date is May 31, 2016 for Class C, Institutional Class and the Benchmarks. |
| (c) | The “S&P 500 Total Return Index”, a registered trademark of McGraw-Hill Co., Inc., is a market capitalization-weighted index of 500 widely held common stocks. Investors cannot invest directly in an Index. |
| (d) | The Balanced Allocation Indices Blend (“BAIB”) is a custom blended index comprised of the following two indices with their noted respective weightings: Standard & Poor’s 500 Index® (“S&P 500”) (60%) and the Bloomberg Barclays U.S. Aggregate Bond Index (40%). The Barclays U.S. Aggregate Index is comprised of securities from the Barclays Government/Corporate Bond Index, Mortgage Securities Index and the Asset Based Index. Total return comprises price appreciation/depreciation and income as a percentage of the original investment. Indices are rebalanced monthly by market capitalization. The index is unmanaged and, unlike the Fund, is not affected by cash flows. The S&P 500 is an unmanaged index generally representing the performance of the broad domestic economy through changes in the aggregate market value of 500 stocks representing all major industries. Investments cannot be made in an index. For additional disclosure relating to the S&P 500, please see “Additional Disclaimers” in this Prospectus. |
Comparison of the Change in Value of a $10,000 Investment
| Top Holdings | | % of Net Assets | |
| Equity Funds - Mutual Funds | | | 30.1 | % |
| Debt Funds - Mutual Funds | | | 29.2 | % |
| Equity Funds - Exchange Traded Funds | | | 23.6 | % |
| Asset Allocation Funds - Mutual Funds | | | 15.2 | % |
| Other/Short-Term Investments | | | 1.9 | % |
| | | | 100.0 | % |
| | | | | |
Please refer to the Portfolio of Investments for a more detailed breakdown of the Fund’s assets.
January 31, 2018
Rational Dynamic Momentum Fund
Dear Fellow Shareholders,
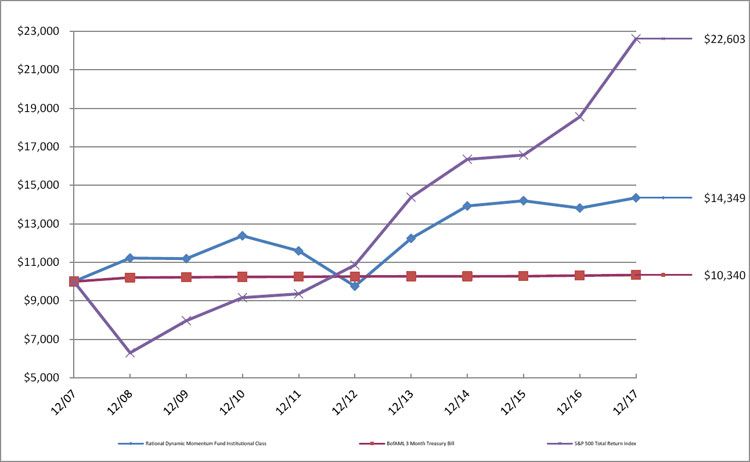
The Rational Dynamic Momentum Fund (“the Fund”) commenced trading in October 2016 after conversion from its predecessor Chesapeake Fund LLC which opened in 1994. The Fund seeks to provide investors capital appreciation uncorrelated to global equity markets.
The Fund’s total annualized returns through 12/31/17 as compared to the S&P 500 Total Return Index and BarclayHedge CTA Index were as follows:
| | 1 Year | 5 Years | 10 Years | Inception1 |
| Institutional Class | 3.85 | 8.01 | 3.68 | 6.32 |
| BarclayHedge CTA Index2 | 0.69 | 0.77 | 1.91 | 4.49 |
| S&P 500 Total Return Index3 | 21.83 | 15.79 | 8.50 | 9.71 |
| Class A | 3.57 | n/a | n/a | 0.53 |
| Class C | 2.83 | n/a | n/a | -0.07 |
| BarclayHedge CTA Index2 | 0.69 | n/a | n/a | -0.38 |
| S&P 500 Total Return Index3 | 21.83 | n/a | n/a | -0.38 |
| Class A w/ Sales Charge | -1.34 | n/a | n/a | -3.31 |
| | | | | |
The Fund’s maximum sales charge for Class “A” shares is 4.75%. Investments in mutual funds involve risks. Performance is historic and does not guarantee future results. Investment return and principal value will fluctuate with changing market conditions so that when redeemed, shares may be worth more or less than their original cost. Current performance may be lower or higher than the performance data quoted. To obtain the most recent month- end performance information or the Fund’s prospectus please call the Fund, toll free at 1-800-253-0412. You can also obtain a prospectus at www.RationalMF.com.
Summary
Below, please find the yearly summary broken down by month:
January
Performance in January was positive led by a strong showing in commodities. In metals, increased demand from China along with a sagging US dollar offered support to our long copper, lead and zinc positions. Softs were also profitable backed by gains in coffee and sugar. Dry weather in Brazil lead to higher coffee prices while a fall in India’s sugar production boosted sugar prices.
Financials contributed to the month’s gains as well with the Dow Jones Industrial Average finally eclipsing the twenty thousand-mark intra month. While in currencies, profits were attributed to our short euro positions against the Canadian dollar, Australian dollar and Norwegian krone.
February
Performance was positive in February, supported by significant moves in foreign exchange and equity markets. In currencies, the possible unraveling of the European Union (EU) proved beneficial to our portfolio, with sterling cross rates pressured by Britain’s exit of the EU. Meanwhile, the euro moved lower due to France’s upcoming presidential election uncertainty. Marine La Pen, the right-wing candidate has been climbing in the polls recently and has stated she wants France to leave the EU and return to the franc.
In equities, the rally was seen across the board as investors continued to focus on President Trump’s proposed tax reform and infrastructure stimulus plans. While most commodities had a relatively flat month, we did experience losses in some of the grains. Wheat prices rallied during the month due to a USDA report which called for lower wheat stockpiles. Poor weather was also forecast which would negatively impact the harvest and was detrimental to our short position.
March
March 2017 was an interesting month. There was some speculation as to what the Fed may do in March’s meeting, with the consensus being that there would be a rate hike. The world was not disappointed as the Fed raised interest rates by 25 basis points. The Fed further stated that the markets should only expect two further interest rate hikes in 2017 which added to the weakness of the dollar in March. After experiencing months of downward pressure, the Mexican Peso rallied in March. This had a negative impact on the portfolio. Rumors for this rally centered around the US not planning to impose tariffs on Mexican exports.
Commodities also did not perform well in March. Long exposure in soybeans came under pressure due to heavy competition from Brazil. They had a very large crop and were active sellers. Losses also came from the cocoa and cattle markets. Gains in silver and palladium were not able to offset much of these losses.
April
Performance in April was relatively flat. There appeared to be some global activity this month including US President Trump advocating for a weaker dollar and the state of the French elections. As a result of this, the dollar was weak against most currencies in April which had negative implications on the portfolio. The rally in bond prices also had a negative impact on performance.
Gains in meats, softs, and stocks were able to offset most of the losses. Cattle and cocoa were the month’s best performers. The June 2017 cattle futures contract closed near its contract high’s primarily due to stronger-than-expected demand for beef. Cocoa prices slipped in April mostly due to disappointing demand, and thus our short positions benefited from this.
May
Performance in May was subdued. Similar to April, US dollar weakness was one of the main themes. Many of the major global currencies hit yearly highs against the US dollar. The commodities had a negative impact on performance. However, some interesting movements in soybeans and cattle helped to lessen the loss. Weakness in grains, particularly in soybeans, continued in May. Uncertainty in Brazil and weather seem to be two contributors to the soybean sell-off. Cattle prices continue to rally mostly due to increased demand.
The sector that performed the best in May was the stock sector. Stocks, both domestic and overseas, continued to rally. As we approach summer, it will be interesting to see how the markets will adjust to various world events.
June
Performance in June 2017 was slightly negative. The currency and the grain sectors had the greatest negative impacts on the portfolio. With currencies, gains from our New Zealand Dollar/USD and USD/Swedish Krona positions were not great enough to offset the losses in the Ruble/USD and Canadian dollar/USD positions. In the grains, losses primarily came from the wheat and soybean markets. Dry weather concerns in the US North plains pushed soybean prices higher. Weather coupled with a drop-in crop rating seem to be fueling the rally in wheat.
The softs and metals sectors proved to be profitable in June. Cocoa, coffee and sugar prices have been falling all year, and the trend continued in June. The leader of the metals sector was copper. Supply concerns in Chile along with
increased demand from China has pushed copper prices higher.
July
Performance was lower in July. Commodities had the greatest negative impact on performance. Crude oil prices rallied due to various factors such as renewed production-curb commitments from OPEC members as well as Venezuela’s uncertainty, a weaker U.S. dollar, and declining US inventories. Cocoa prices rallied due to increased demand. Growing concerns of a supply deficit in the coffee market pushed prices higher. Positive performance resulting from higher prices in copper and palladium did help offset some of the losses in the commodity sector.
Gains in the currency sector helped to offset most of the losses in commodities. The falling US dollar seem to be a central theme in July. Low inflation as well as political risk in the US seem to be weighing heavy on the Greenback
August
August proved to be a profitable month. The markets were somewhat volatile due to the events of North Korea, and thus, holding a diversified portfolio proved beneficial to our holdings. Continued weakness in the US dollar also benefited the portfolio, while some small losses from our fixed income positions were offset by profits from the stock sector.
Overall, the commodities were profitable. The biggest losses came the meats sector led by our long positions in cattle and hogs. However, these losses were more than offset by the gains in the metals and softs sectors. In the metals, our long positions in high grade copper and palladium led the way. In the softs sector, weaker prices in coffee and cocoa benefited our short positions. We continue to believe that our long-term trend-following approach coupled with our trading a diversified portfolio helped to successfully navigate the volatility of August.
September
Performance in September was lower. The weakness in the dollar in recent months did not continue in September as the Fed’s desire to continue raising interest rates fueled a rally, hurting performance. Even though we did profit in our Ruble and British Pound positions, their gains could not offset the losses incurred in our USD/Swedish Krona, Australian Dollar, and Mexican Peso positions.
The Fund had profits from the fixed income sector led by our short position in the three-month Canadian Bankers Acceptances. In commodities, the metals proved to be the most challenging. Gains in our short positions in platinum and silver could not overcome the losses in our long gold and copper positions.
October
October’s performance was very strong as the stock and commodity sectors led the way and more than offset the slight losses experienced by the currency sector. The dollar rally continued in October as a myriad of events in October helped to sustain the rally. Optimism from the likelihood of tax cuts, an interest rate hike in December and better than expected GDP data were some reasons.
Much of the stock rally was led by tech sector. In the commodities, most of the positive performance came from metals. Increased demand in the US and China helped push copper prices higher. Palladium prices continued its multi-month climb higher, partly due to rising auto sales in China and also by added demand in the US by those replacing their automobiles lose in the recent hurricanes. In the meats sector, soaring cattle prices in October also benefited the portfolio.
November
November was a profitable month led mostly by currencies and stocks. The commodities had a negative impact, but losses in this sector were more than offset by the profits in the other sectors. With the currencies, the strength in the British Pound, Euro and Mexican Peso against the US dollar helped the portfolio.
The surging stock market continued in November partially fueled by the strong prospects of a major tax overhaul. In fixed income, the notion of higher interest rates helped our short positions. In November, three of the four major sectors benefited the portfolio which led to this month’s positive performance.
December
The year ended on a solid note in December. All major sectors exhibited positive performance, led by currencies and the commodities. In the currencies, the dollar’s continued weakness seemed to be the trend. Expectations that the European economy will continue to expand coupled with the tapering of the economic stimulus pushed the Euro higher.
In the commodities, the metals and energy prices continued to climb in December. The positive performance in the metals was led by aluminum and copper, while long positions in heating oil also benefited the portfolio.
In the fixed income sector, higher interest rate was again the theme, as the Fed raised rates by 25 basis points. Stocks also contributed to the month’s gains.
Sincerely,
Jerry Parker, Jr and Michael Ivie
Portfolio Managers
This report is intended for the Fund’s shareholders. It may not be distributed to prospective investors unless it is preceded or accompanied by the current Fund prospectus. To obtain a prospectus or other information about the Fund, please visit www.RationalMF.com or call 1-800-253-0412. Please read the prospectus carefully before investing.
| 1 | Inception: Institutional 02/01/1994, Class A & C 09/30/2016. Performance shown before 09/30/2016 is for the Fund’s predecessor, the Chesapeake Diversified Program. |
| 2 | Barclay CTA Index is a leading industry benchmark of representative performance of commodity trading advisors. There are currently 522 programs included in the calculation of the Barclay CTA Index for 2017. The Index is equally weighted and rebalanced at the beginning of each year. |
| 3 | The S&P 500 Total Return Index® (“S&P 500 TR”) is an unmanaged index generally representing the performance of the broad domestic economy through changes in the aggregate market value of 500 stocks representing all major industries. Indices are unmanaged and, unlike the Fund, are not affected by cash flows. It is not possible to invest directly in an Index. For additional disclosure relating to the S&P 500 TR, please see “Additional Disclaimers” in the Fund’s Prospectus. |
3211-NLD-2/13/2018
| Rational Dynamic Momentum Fund |
| PORTFOLIO REVIEW |
| December 31, 2017 |
| |
The Fund’s performance figures* for each of the periods ended December 31, 2017, compared to its benchmarks:
| | | Annualized | Annualized | Annualized |
| | 1 Year Return | 5 Year Return | 10 Year Return | Since 9/30/2016(a) |
| Class A | 3.57% | N/A | N/A | 0.53% |
| Class A with load | -1.34% | N/A | N/A | -3.31% |
| Class C | 2.83% | N/A | N/A | -0.07% |
| Institutional Class | 3.85% | 8.01% | 3.68% | N/A% |
| BofAML 3 Month Treasury Bill (b) | 0.85% | 0.27% | 0.39% | 0.75% |
| S&P 500 Total Return Index (c) | 21.83% | 15.79% | 8.50% | 20.65% |
| | | | | |
| * | The performance data quoted here represents past performance. Current performance may be lower or higher than the performance data quoted above. Investment return and principal value will fluctuate, so that shares, when redeemed, may be worth more or less than their original cost. The returns shown do not reflect the deduction of taxes that a shareholder would pay on Fund distributions or on the redemptions of Fund shares. Past performance is no guarantee of future results. Performance figures for periods greater than 1 year are annualized. Per the fee table in the Fund’s May 1, 2017 prospectus, the total annual operating expense are 2.39% for Institutional Class shares, 2.64% for A shares and 3.14% for C shares before fee waivers. See the financial highlights for current expense ratios. For performance information current to the most recent month-end, please call toll-free 1-800-253-0412. Class A shares are subject to a maximum load of 5.75%. |
| (a) | Inception date is May 31, 2016 for Class A, Class C and the Benchmarks. |
| (b) | BofA Merrill Lynch 3-Month U.S. Treasury Bill Index “BofAML 3-Month T-Bill,” is an index of short-term U.S. Government securities maturing in 90 days. Investors cannot invest directly in an Index. |
| (c) | The “S&P 500 Total Return Index”, a registered trademark of McGraw-Hill Co., Inc., is a market capitalization-weighted index of 500 widely held common stocks. Investors cannot invest directly in an Index. |
Comparison of the Change in Value of a $10,000 Investment
| Holdings by Asset Type ^ | | % of Net Assets | |
| Short-Term Investments | | | 82.0 | % |
| Other/Cash & Equivalents | | | 18.0 | % |
| | | | 100.0 | % |
| | | | | |
^ Does not include derivatives in which the Fund invests.
Please refer to the Consolidated Portfolio of Investments for a more detailed breakdown of the Fund’s assets.
January 31, 2018
Rational Iron Horse Fund
Dear Fellow Shareholders,
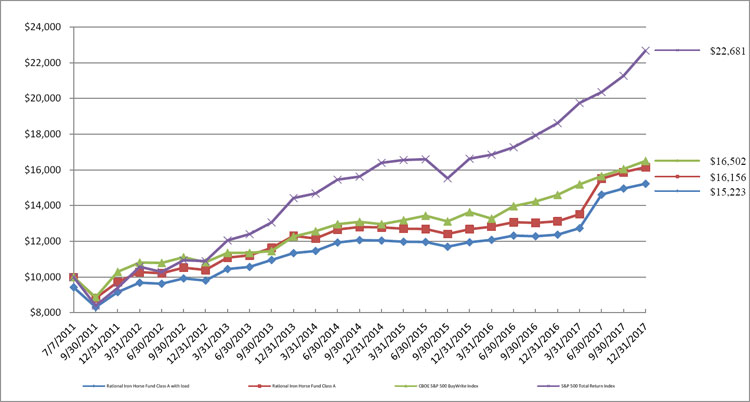
The Rational Iron Horse (the “Fund”) was up 8.61% for Class A during the last fiscal year ended December 31, 2017. During that same period the S&P 500 was up 21.83% and the CBOE S&P 500 BuyWrite Index (BXM) was up 13.00%. The Fund could not keep pace with both indexes because of the lack of volatility and the fact that the Fund is individual stock picking over passive indexing.
Fund Performance
In a rapid market rise covered calls tend to lag general market indexes. Volatility compression was also a major explanation for this period’s performance. We believe that the volatility could increase in the coming quarters, and potentially that would be beneficial for our single stock option strategy, as we seek more income.
During the last 12 months, the Fund was mostly equal weighted relative to the S&P 500 sector. The covered call strategies the Fund utilizes seek to do well in a sideways to lower trending market. This is what the Fund managers’ long-term experience in managing covered call strategies has taught.
The Fund’s total annualized returns through 12/31/17 as compared to the S&P 500 Total Return Index were as follows:
| | 1 Year | 5 Years | Since Inception1 |
| Class A | 8.61% | 6.51% | 5.62% |
| Institutional | 8.84% | 6.81% | 7.30% |
| Class A with Sales Charge | 2.40% | 5.25% | 4.66% |
| S&P 500 Total Return Index2 | 21.83% | 15.79% | 13.46% |
| | | | |
The Fund’s maximum sales charge for Class “A” shares is 4.75%. Investments in mutual funds involve risks. Performance is historic and does not guarantee future results. Investment return and principal value will fluctuate with changing market conditions so that when redeemed, shares may be worth more or less than their original cost. Current performance may be lower or higher than the performance data quoted. To obtain the most recent month- end performance information or the Fund’s prospectus please call the Fund, toll free at 1-800-253-0412. You can also obtain a prospectus at www.RationalMF.com.
Summary
Our covered call strategy on average seeks to run at 50-60% of the market risk. When the market trends upward like it has over the last year, a covered call strategy can tend to underperform a long only strategy. The goal of the strategy is not to outperform the market on every market interval, but to seek a good total return with less risk than the market.
Sincerely,
The Iron Horse Fund Team
This report is intended for the Fund’s shareholders. It may not be distributed to prospective investors unless it is preceded or accompanied by the current Fund prospectus. To obtain a prospectus or other information about the Fund, please visit www.RationalMF.com or call 1-800-253-0412. Please read the prospectus carefully before investing.
| (1) | Inception date A Share: 7/7/2011. Inception date Institutional Share: 11/16/2011. |
| (2) | The S&P 500 Total Return Index by Standard & Poor’s Corp. is a capitalization-weighted index comprising 500 issues listed on various exchanges, representing the performance of the stock market generally. Please note that indices do not take into account any fees and expenses of investing in the individual securities that they track, and individuals cannot invest directly in any index, although individuals may invest in exchange traded funds or other investment vehicles that attempt to track the performance of an index. |
4211-NLD-2/14/2018
| Rational Iron Horse Fund |
| PORTFOLIO REVIEW |
| December 31, 2017 |
| |
The Fund’s performance figures* for the periods ended December 31, 2017, as compared to its benchmarks:
| | | | Annualized | Annualized | Annualized | |
| | 9 Month Return | One Year Return | Five Year Return | Since 7/7/2011(a) | Since 11/16/2011(b) | Since 4/10/2017 (c) |
| Class A | 5.47% | 8.61% | 6.51% | 5.62% | N/A | N/A |
| Class A with Load | (0.58)% | 2.40% | 5.25% | 4.66% | N/A | N/A |
| Institutional Class | 5.69% | 8.84% | 6.81% | N/A | 7.30% | N/A |
| Class C | N/A | N/A | N/A | N/A | N/A | 4.89% |
| S&P 500 Total Return Index (d) | 14.86% | 21.83% | 15.79% | 13.46% | 15.85% | 15.06% |
| CBOE S&P Buy Write Index (e) | 8.64% | 13.00% | 8.78% | 8.03% | 8.79% | 8.58% |
| | | | | | | |
| * | The performance data quoted here represents past performance. Current performance may be lower or higher than the performance data quoted above. Investment return and principal value will fluctuate, so that shares, when redeemed, may be worth more or less than their original cost. The returns shown do not reflect the deduction of taxes that a shareholder would pay on Fund distributions or on the redemptions of Fund shares. Past performance is no guarantee of future results. Performance figures for periods greater than 1 year are annualized. Per the fee table in the Fund’s August 1, 2017 prospectus, the total annual operating expense are 1.95% for Institutional Class shares, 2.20% for A shares and 2.70% for C shares before fee waivers. See the financial highlights for current expense ratios. For performance information current to the most recent month-end, please call toll-free 1-800-253-0412. Class A shares are subject to a maximum load of 4.75%. Class A shares are subject to a maximum load of 5.75%. |
| (a) | Inception date is July 7, 2011. |
| (b) | Inception date is November 16, 2011. |
| (c) | Inception date is April 10, 2017 |
| (d) | The S&P 500 Total Return Index is an unmanaged free-float capitalization-weighted index which measures the performance of 500 large-cap common stocks actively traded in the United States. Index returns assume reinvestment of dividends. Investors may not invest in the index directly; unlike the Fund’s returns, the index does not reflect any fees or expenses. |
| (e) | The CBOE S&P 500 BuyWrite Index (BXM) is a benchmark index designed to track the performance of a hypothetical buy-write strategy on the S&P 500 Index. The BXM is a passive total return index based on (1) buying an S&P 500 stock index portfolio, and (2) “writing” (or selling) the near-term S&P 500 Index “covered” call option, generally on the third Friday of each month. Index returns assume the reinvestment of dividends. Investors may not invest in the index directly; unlike the Fund’s returns, the index does not reflect any fees or expenses. |
Comparison of the Change in Value of a $10,000 Investment
| Top Ten Holdings by Industry ^ | | % of Net Assets | |
| Banks | | | 12.0 | % |
| Computers | | | 8.5 | % |
| Pharmaceuticals | | | 8.5 | % |
| Oil & Gas | | | 8.2 | % |
| Internet | | | 7.0 | % |
| Telecommunications | | | 4.5 | % |
| Apparel | | | 3.8 | % |
| Retail | | | 3.6 | % |
| Food | | | 3.5 | % |
| Aerospace/Defense | | | 3.1 | % |
| Other/Short-Term Investments | | | 37.3 | % |
| | | | 100.0 | % |
| | | | | |
^ Does not include derivatives in which the Fund invests.
Please refer to the Portfolio of Investments in this shareholder report for a detailed analysis of the Fund’s holdings.
| RATIONAL DIVIDEND CAPTURE FUND |
| PORTFOLIO OF INVESTMENTS |
| December 31, 2017 |
| Shares | | | | | Value | |
| | | | | COMMON STOCKS - 88.8% | | | | |
| | | | | BANKS - 2.1% | | | | |
| | 13,000 | | | Bank of America Corp. | | $ | 383,760 | |
| | 3,410 | | | JPMorgan Chase & Co. | | | 364,665 | |
| | | | | | | | 748,425 | |
| | | | | BUSINESS DEVELOPMENT COMPANIES - 13.9% | | | | |
| | 124,200 | | | Apollo Investment Corp. | | | 702,972 | |
| | 93,700 | | | FS Investment Corp. | | | 688,695 | |
| | 313,500 | | | Medley Capital Corp. | | | 1,636,470 | |
| | 101,400 | | | Oaktree Speciality Lending Corp. | | | 495,846 | |
| | 99,800 | | | PennantPark Investment Corp. | | | 689,618 | |
| | 33,600 | | | Solar Capital Ltd. | | | 679,056 | |
| | | | | | | | 4,892,657 | |
| | | | | COMPUTERS - 1.0% | | | | |
| | 2,400 | | | International Business Machines Corp. | | | 368,208 | |
| | | | | | | | | |
| | | | | DIVERSIFIED FINANCIAL SERVICES - 5.4% | | | | |
| | 65,334 | | | Arlington Asset Investment Corp. | | | 769,635 | |
| | 96,700 | | | Five Oaks Investment Corp. | | | 386,800 | |
| | 113,213 | | | Medley Management, Inc. | | | 735,884 | |
| | | | | | | | 1,892,319 | |
| | | | | ENTERTAINMENT - 3.0% | | | | |
| | 71,765 | | | AMC Entertainment Holdings, Inc. | | | 1,083,652 | |
| | | | | | | | | |
| | | | | FOOD - 3.4% | | | | |
| | 6,140 | | | JM Smucker Co. | | | 762,834 | |
| | 6,200 | | | Kellogg Co. | | | 421,476 | |
| | | | | | | | 1,184,310 | |
| | | | | IRON/STEEL - 1.1% | | | | |
| | 6,140 | | | Nucor Corp. | | | 390,381 | |
| | | | | | | | | |
| | | | | MEDIA - 1.4% | | | | |
| | 4,600 | | | Walt Disney Co. | | | 494,546 | |
| | | | | | | | | |
| | | | | MISCELLANEOUS MANUFACTURING - 2.5% | | | | |
| | 51,270 | | | General Electric Co. | | | 894,661 | |
| | | | | | | | | |
| | | | | OIL & GAS - 9.6% | | | | |
| | 62,700 | | | Alliance Resource Partners LP | | | 1,235,190 | |
| | 11,710 | | | Anadarko Petroleum Corp. | | | 628,124 | |
| | 26,590 | | | BP PLC | | | 1,117,578 | |
| | 62,325 | | | Nabors Industries Ltd. | | | 425,680 | |
| | | | | | | | 3,406,572 | |
| | | | | PHARMACEUTICALS - 7.9% | | | | |
| | 44,440 | | | GlaxoSmithKline PLC | | | 1,576,287 | |
| | 21,300 | | | Merck & Co, Inc. | | | 1,198,551 | |
| | | | | | | | 2,774,838 | |
| | | | | PIPELINES- 2.1% | | | | |
| | 18,000 | | | Plains All American Pipeline LP | | | 371,520 | |
| | 7,600 | | | Western Gas Partners LP | | | 365,484 | |
| | | | | | | | 737,004 | |
| | | | | REITS - 18.7% | | | | |
| | 44,340 | | | CBL & Associates Properties, Inc. | | | 250,964 | |
| | 138,330 | | | CYS Investments, Inc. | | | 1,110,790 | |
| | 56,830 | | | Global Medical REIT,Inc. | | | 466,006 | |
| | 66,880 | | | Independence Realty Trust, Inc. | | | 674,819 | |
| | 202,630 | | | New Senior Investment Group, Inc. | | | 1,531,883 | |
| | 12,700 | | | Omega Healthcare Investors, Inc. | | | 349,758 | |
| | 17,910 | | | Senior Housing Properties Trust | | | 342,976 | |
| | 64,342 | | | Uniti Group, Inc. | | | 1,144,644 | |
| | 50,015 | | | Whitestone REIT | | | 720,716 | |
| | | | | | | | 6,592,556 | |
See accompanying notes to consolidated financial statements.
| RATIONAL DIVIDEND CAPTURE FUND |
| PORTFOLIO OF INVESTMENTS (Continued) |
| December 31, 2017 |
| Shares | | | | | Value | |
| | | | | COMMON STOCKS - 88.8% (Continued) | | | | |
| | | | | RETAIL - 7.7% | | | | |
| | 5,140 | | | CVS Health Corp. | | $ | 372,650 | |
| | 7,600 | | | Kohl’s Corp. | | | 412,148 | |
| | 14,490 | | | Macy’s, Inc. | | | 365,003 | |
| | 114,100 | | | Office Depot, Inc. | | | 403,914 | |
| | 6,025 | | | Target Corp. | | | 393,131 | |
| | 10,600 | | | Walgreens Boots Alliance, Inc. | | | 769,772 | |
| | | | | | | | 2,716,618 | |
| | | | | SEMICONDUCTORS - 3.6% | | | | |
| | 8,050 | | | Intel Corp. | | | 371,588 | |
| | 14,205 | | | Qualcomm, Inc. | | | 909,404 | |
| | | | | | | | 1,280,992 | |
| | | | | TELECOMMUNICATIONS - 5.4% | | | | |
| | 40,400 | | | CenturyLink, Inc. | | | 673,873 | |
| | 26,000 | | | Frontier Communications Corp. | | | 175,760 | |
| | 108,500 | | | Telefonica SA | | | 1,050,280 | |
| | | | | | | | 1,899,913 | |
| | | | | | | | | |
| | | | | TOTAL COMMON STOCKS (Cost $30,824,973) | | | 31,357,652 | |
| | | | | | | | | |
| | | | | EXCHANGE TRADED FUNDS - 8.2% | | | | |
| | | | | EQUITY FUNDS - 8.2% | | | | |
| | 67,400 | | | Proshares UltraPro Short QQQ | | | 1,449,774 | |
| | 125,800 | | | Proshares UltraPro Short S&P 500 | | | 1,430,346 | |
| | | | | TOTAL EXCHANGE TRADED FUNDS (Cost - $3,099,905) | | | 2,880,120 | |
| | | | | | Coupon | | Maturity | | | |
| | | | | PREFERRED STOCKS - 2.1% | | | | | | | | |
| | | | | FINANCIAL SERVICES - 1.0% | | | | | | | | |
| | 14,400 | | | Ladenburg Thalmann Financial Services, Inc. | | 6.500% | | 11/30/2027 | | | 354,802 | |
| | | | | | | | | | | | | |
| | | | | REAL ESTATE - 1.1% | | | | | | | | |
| | 13,800 | | | Innovative Industrial Properties, Inc. | | 9.000% | | Perpetual | | | 385,572 | |
| | | | | TOTAL PREFERRED STOCKS (Cost -$705,000) | | | | | | | 740,374 | |
| | | | | | | | | | | | | |
| | | | | SHORT-TERM INVESTMENTS - 1.0% | | | | | | | | |
| | 362,219 | | | Federated Treasury Obligations Fund, Institutional Class, 1.15% * | | | | 362,219 | |
| | | | | TOTAL SHORT-TERM INVESTMENTS (Cost $362,219) | | | | | 362,219 | |
| | | | | | | | | | | | | |
| | | | | TOTAL INVESTMENTS (Cost $34,992,097) - 100.1% (a) | | | | $ | 35,340,365 | |
| | | | | LIABILITIES IN EXCESS OF OTHER ASSETS - (0.1)% | | | | | (25,838 | ) |
| | | | | NET ASSETS - 100.0% | | | | | | $ | 35,314,527 | |
PLC - Public Limited Company.
REIT - Real Estate Investment Trust
| * | Rate shown represents the rate at December 31, 2017, and is subject to change and resets daily. |
| (a) | Represents cost for financial reporting purposes. Aggregate cost for federal tax purposes is $35,180,279 and differs from fair value by net unrealized appreciation (depreciation) of securities as follows: |
| Unrealized appreciation: | | $ | 2,049,700 | |
| Unrealized depreciation: | | | (1,889,614 | ) |
| Net unrealized appreciation: | | $ | 160,086 | |
See accompanying notes to consolidated financial statements.
| RATIONAL RISK MANAGED EMERGING MARKETS FUND |
| PORTFOLIO OF INVESTMENTS |
| December 31, 2017 |
| Shares | | | | | Value | |
| | | | | COMMON STOCKS - 93.7% | | | | |
| | | | | ADVERTISING - 1.8% | | | | |
| | 8,200 | | | Smiles SA | | $ | 187,628 | |
| | | | | | | | | |
| | | | | AUTO PARTS & EQUIPMENT - 3.4% | | | | |
| | 801 | | | Mando Corp. | | | 230,824 | |
| | 49,000 | | | Nexteer Automotive Group Ltd. | | | 116,779 | |
| | | | | | | | 347,603 | |
| | | | | BANKS - 18.1% | | | | |
| | 11,300 | | | Banco do Brasil SA * | | | 108,398 | |
| | 3,000 | | | Banco Macro SA | | | 347,640 | |
| | 1,834 | | | Bancolombia SA | | | 72,736 | |
| | 16,000 | | | BOC Hong Kong Holdings Ltd. | | | 81,097 | |
| | 19,759 | | | Commercial International Bank Egypt SAE | | | 85,853 | |
| | 24,158 | | | FirstRand Ltd. * | | | 131,309 | |
| | 17,700 | | | Grupo Financiero Banorte SAB de CV | | | 97,158 | |
| | 1,700 | | | HDFC Bank Ltd. | | | 172,839 | |
| | 2,690 | | | OTP Bank PLC | | | 111,357 | |
| | 25,337 | | | Sberbank of Russia PJSC * | | | 428,955 | |
| | 39,000 | | | Yes Bank Ltd | | | 192,564 | |
| | | | | | | | 1,829,906 | |
| | | | | DIVERSIFIED FINANCIAL SERVICES - 1.9% | | | | |
| | 43,500 | | | CITIC Securities Co Ltd. | | | 89,752 | |
| | 2,232 | | | Hana Financial Group, Inc. | | | 103,829 | |
| | | | | | | | 193,581 | |
| | | | | ELECTRONICS - 0.8% | | | | |
| | 24,700 | | | Hon Hai Precision Industry Co. Ltd. | | | 79,017 | |
| | | | | | | | | |
| | | | | FOOD - 3.0% | | | | |
| | 8,868 | | | Gruma SAB de CV | | | 112,460 | |
| | 5,000 | | | X5 Retail Group NV * | | | 188,850 | |
| | | | | | | | 301,310 | |
| | | | | FOREST PRODUCTS & PAPER - 1.2% | | | | |
| | 21,600 | | | Suzano Papel e Celulose SA | | | 121,509 | |
| | | | | | | | | |
| | | | | GAS - 3.2% | | | | |
| | 53,000 | | | China Resources Gas Group Limited | | | 192,318 | |
| | 19,000 | | | ENN Energy Holdings Ltd. | | | 135,578 | |
| | | | | | | | 327,896 | |
| | | | | HEALTHCARE-PRODUCTS - 0.9% | | | | |
| | 4,300 | | | Aspen Pharmacare Holdings Ltd. | | | 96,444 | |
| | | | | | | | | |
| | | | | INSURANCE - 7.5% | | | | |
| | 28,000 | | | China Life Insurance Co. Ltd. | | | 87,983 | |
| | 39,000 | | | Ping An Insurance Group Co of China Ltd. | | | 406,081 | |
| | 8,467 | | | Vienna Insurance Group AG Wiener Versicherung | | | 261,750 | |
| | | | | | | | 755,814 | |
| | | | | INTERNET - 14.8% | | | | |
| | 2,630 | | | Alibaba Group Holding Ltd. - ADR * | | | 453,491 | |
| | 400 | | | Baozun, Inc *. | | | 93,684 | |
| | 8 | | | China Literature Limited * | | | 85 | |
| | 2,100 | | | Ctrip.com International Ltd. * | | | 92,610 | |
| | 6,600 | | | JD.com, Inc. * | | | 273,372 | |
| | 224 | | | NCSoft Corp. | | | 93,634 | |
| | 9,384 | | | Tencent Holdings, Ltd. | | | 487,646 | |
| | | | | | | | 1,494,522 | |
| | | | | IRON/STEEL - 3.0% | | | | |
| | 200 | | | Angang Steel Co Ltd. | | | 183 | |
| | 47,740 | | | Eregli Demir ve Celik Fabrikalari TAS | | | 126,198 | |
| | 10,000 | | | Vale SA | | | 122,300 | |
| | 4,951 | | | Vale SA * | | | 60,064 | |
| | | | | | | | 308,745 | |
See accompanying notes for consolidated financial statements.
| RATIONAL RISK MANAGED EMERGING MARKETS FUND |
| PORTFOLIO OF INVESTMENTS (Continued) |
| December 31, 2017 |
| Shares | | | | | Value | |
| | | | | COMMON STOCKS - 93.7% (Continued) | | | | |
| | | | | LEISURE TIME - 1.2% | | | | |
| | 2,100 | | | Hero MotoCorp Ltd. * | | $ | 124,536 | |
| | | | | | | | | |
| | | | | MEDIA - 3.4% | | | | |
| | 1,233 | | | Naspers Ltd., Class N | | | 343,915 | |
| | | | | | | | | |
| | | | | MINING - 1.9% | | | | |
| | 15,773 | | | KAZ Minerals PLC * | | | 190,492 | |
| | | | | | | | | |
| | | | | MISCELLANEOUS MANUFACTURING - 1.5% | | | | |
| | 285 | | | Largan Precision Co. Ltd. * | | | 38,500 | |
| | 8,700 | | | Sunny Optical Technology Group Co. Ltd. | | | 111,244 | |
| | | | | | | | 149,744 | |
| | | | | OIL & GAS - 3.7% | | | | |
| | 655 | | | SK Innovation Co. Ltd. | | | 125,120 | |
| | 10,700 | | | YPF SA | | | 245,137 | |
| | | | | | | | 370,257 | |
| | | | | PHARMACEUTICALS - 0.5% | | | | |
| | 700 | | | China Biologic Products Holdings, Inc. * | | | 55,139 | |
| | | | | | | | | |
| | | | | REAL ESTATE - 3.0% | | | | |
| | 116,700 | | | Ayala Land, Inc. | | | 104,263 | |
| | 24,100 | | | Global Logistic Properties Ltd. | | | 60,725 | |
| | 56,000 | | | Longfor Properties Co Ltd. | | | 140,343 | |
| | | | | | | | 305,331 | |
| | | | | RETAIL - 3.9% | | | | |
| | 40,000 | | | ANTA Sports Products Ltd. | | | 181,495 | |
| | 2,590 | | | CCC S.A. * | | | 212,054 | |
| | | | | | | | 393,549 | |
| | | | | SEMICONDUCTORS - 10.4% | | | | |
| | 209 | | | Samsung Electronics Co Ltd. | | | 497,437 | |
| | 2,995 | | | SK Hynix, Inc. | | | 214,019 | |
| | 44,000 | | | Taiwan Semiconductor Manufacturing Co Ltd. * | | | 339,332 | |
| | | | | | | | 1,050,788 | |
| | | | | SOFTWARE - 1.2% | | | | |
| | 4,800 | | | Momo, Inc. * | | | 117,504 | |
| | | | | | | | | |
| | | | | TELECOMMUNICATIONS - 1.5% | | | | |
| | 5,400 | | | SK Telecom Co Ltd. | | | 150,714 | |
| | | | | | | | | |
| | | | | TEXTILES - 0.9% | | | | |
| | 166,000 | | | Texwinca Holdings Ltd. | | | 91,362 | |
| | | | | | | | | |
| | | | | WATER - 1.0% | | | | |
| | 10,000 | | | Cia de Saneamento Basico do Estado de Sao Paulo * | | | 103,494 | |
| | | | | | | | | |
| | | | | TOTAL COMMON STOCKS (Cost - $7,404,581) | | | 9,490,800 | |
| | | | | | | | | |
| | | | | EXCHANGE TRADED FUNDS - 2.8% | | | | |
| | | | | EQUITY FUNDS - 2.8% | | | | |
| | 13,900 | | | Global X MSCI Greece ETF | | $ | 142,892 | |
| | 11,300 | | | Global X MSCI Pakistan ETF | | | 139,894 | |
| | | | | TOTAL EXCHANGE TRADED FUNDS (Cost - $292,376) | | | 282,786 | |
| | | | | | | | | |
| | | | | SHORT-TERM INVESTMENTS - 1.3% | | | | |
| | 131,350 | | | Federated Treasury Obligations, Institutional Class, 1.15% ** | | | 131,350 | |
| | | | | TOTAL SHORT-TERM INVESTMENTS (Cost - $131,350) | | | 131,350 | |
| | | | | | | | | |
| | | | | TOTAL INVESTMENTS - 97.8% (Cost - $7,828,307) (a) | | $ | 9,904,936 | |
| | | | | OTHER ASSETS LESS LIABILITIES - 2.2% | | | 220,664 | |
| | | | | NET ASSETS - 100.0% | | $ | 10,125,600 | |
See accompanying notes for consolidated financial statements.
| RATIONAL RISK MANAGED EMERGING MARKETS FUND |
| PORTFOLIO OF INVESTMENTS (Continued) |
| December 31, 2017 |
ADR - American Depositary Receipt.
ETF - Exchange Traded Fund.
PLC - Public Liability Company.
| * | Non-income producing security. |
| ** | Rate shown represents the rate at December 31, 2017 and is subject to change and resets daily. |
| (a) | Represents cost for financial reporting purposes. Aggregate cost for federal tax purposes is $7,848,372 and differs from fair value by net unrealized appreciation (depreciation) of securities as follows: |
| Unrealized appreciation: | | $ | 2,208,327 | |
| Unrealized depreciation: | | | (151,764 | ) |
| Net unrealized appreciation: | | $ | 2,056,563 | |
As of December 31, 2017, the Fund’s long-term holdings were divided among countries as follows:
| Country | | Percentage | |
| China | | | 27.0 | % |
| South Korea | | | 14.0 | % |
| Brazil | | | 6.9 | % |
| Russia | | | 6.2 | % |
| Argentina | | | 5.9 | % |
| South Africa | | | 5.6 | % |
| India | | | 4.8 | % |
| Taiwan | | | 4.5 | % |
| United States | | | 3.9 | % |
| Hong Kong | | | 3.6 | % |
| Austria | | | 2.6 | % |
| Poland | | | 2.1 | % |
| Mexico | | | 2.1 | % |
| Britian | | | 1.9 | % |
| Turkey | | | 1.2 | % |
| Hungary | | | 1.1 | % |
| Philippines | | | 1.0 | % |
| Egypt | | | 0.8 | % |
| Columbia | | | 0.7 | % |
| Singapore | | | 0.6 | % |
| Total Long-Term Holdings: | | | 96.5 | % |
Percentages in the above table are based on net assets of the Fund as of December 31, 2017.
See accompanying notes for consolidated financial statements.
| RATIONAL HEDGED RETURN FUND (Formerly, RATIONAL REAL STRATEGIES FUND) |
| PORTFOLIO OF INVESTMENTS |
| December 31, 2017 |
| Shares | | | | | Value | |
| | | | | SHORT-TERM INVESTMENTS - 48.2% | | | | |
| | 2,842,037 | | | Federated Treasury Obligations Fund, Institutional Class, 1.15% * | | $ | 2,842,037 | |
| | | | | TOTAL SHORT-TERM INVESTMENTS (Cost - $2,842,037) | | | 2,842,037 | |
| | | | | | | | | |
| | | | | TOTAL INVESTMENTS - 48.2% (Cost - $2,842,037) (a) | | $ | 2,842,037 | |
| | | | | OTHER ASSETS LESS LIABILITIES - 51.8% | | | 3,058,994 | |
| | | | | NET ASSETS - 100.0% | | $ | 5,901,031 | |
| * | Rate shown represents the rate at December 31, 2017 and is subject to change and resets daily. |
| (a) | Represents cost for financial reporting purposes. Aggregate cost for federal tax purposes is $2,842,037 and differs from fair value by net unrealized appreciation (depreciation) of securities as follows: |
| Unrealized appreciation: | | $ | — | |
| Unrealized depreciation: | | | — | |
| Net unrealized appreciation: | | $ | — | |
| | | | | | Notional | | Expiration | | | | | |
| Contracts ^ | | | | | Amount | | Date | | Exercise Price | | Value | |
| | | | | | | | | | | | | | | |
| | | | | CALL OPTIONS WRITTEN * - 0.0% | | | | | | | | |
| | 49 | | | S&P 500 Future Index 1st Week Option | | 33,748,750 | | 1/8/2018 | | 2,755 | | | 613 | |
| | | | | TOTAL CALL OPTIONS WRITTEN (Premiums Received - $1,225) | | $ | 613 | |
| ^ | Each contract is equivalent to one futures contract. |
| * | Non-income producing security. |
See accompanying notes to consolidated financial statements.
| RATIONAL DYNAMIC BRANDS FUND (Formerly, RATIONAL DEFENSIVE GROWTH FUND) |
| PORTFOLIO OF INVESTMENTS |
| December 31, 2017 |
| Shares | | | | | Value | |
| | | | | COMMON STOCKS - 99.5% | | | | |
| | | | | AIRLINES - 2.0% | | | | |
| | 5,005 | | | Southwest Airlines Co. | | $ | 327,577 | |
| | | | | | | | | |
| | | | | APPAREL - 3.0% | | | | |
| | 7,878 | | | Nike, Inc. | | | 492,769 | |
| | | | | | | | | |
| | | | | AUTO MANUFACTURERS- 3.8% | | | | |
| | 5,901 | | | Ferrari NV | | | 618,661 | |
| | | | | | | | | |
| | | | | BANKS - 5.0% | | | | |
| | 1,911 | | | Goldman Sachs Group, Inc. | | | 486,846 | |
| | 3,059 | | | JPMorgan Chase & Co. | | | 327,129 | |
| | | | | | | | 813,975 | |
| | | | | BEVERAGES - 8.9% | | | | |
| | 2,203 | | | Constellation Brands, Inc. | | | 503,540 | |
| | 3,657 | | | Molson Coors Brewing Co. | | | 300,130 | |
| | 10,338 | | | Monster Beverage Corp. * | | | 654,292 | |
| | | | | | | | 1,457,962 | |
| | | | | COMMERCIAL SERVICES - 2.0% | | | | |
| | 4,456 | | | PayPal Holdings, Inc. * | | | 328,051 | |
| | | | | | | | | |
| | | | | COMPUTERS - 3.9% | | | | |
| | 3,750 | | | Apple, Inc. | | | 634,612 | |
| | | | | | | | | |
| | | | | DIVERSIFIED FINANCIAL SERVICES - 2.0% | | | | |
| | 2,934 | | | Visa, Inc. | | | 334,535 | |
| | | | | | | | | |
| | | | | HEALTHCARE-SERVICES - 3.1% | | | | |
| | 2,282 | | | UnitedHealth Group, Inc. | | | 503,090 | |
| | | | | | | | | |
| | | | | INTERNET - 17.5% | | | | |
| | 938 | | | Alibaba Group Holding Ltd. * | | | 161,739 | |
| | 601 | | | Alphabet, Inc. * | | | 633,093 | |
| | 648 | | | Amazon.com, Inc. * | | | 757,817 | |
| | 3,911 | | | JD.com, Inc. * | | | 161,994 | |
| | 1,749 | | | Netflix, Inc. * | | | 335,738 | |
| | 186 | | | Priceline Group, Inc. * | | | 323,220 | |
| | 3,179 | | | Tencent Holdings Ltd. | | | 165,054 | |
| | 13,485 | | | Twitter, Inc. * | | | 323,775 | |
| | | | | | | | 2,862,430 | |
| | | | | MEDIA - 3.9% | | | | |
| | 6,021 | | | Walt Disney Co. | | | 647,318 | |
| | | | | | | | | |
| | | | | PHARMACEUTICALS - 5.0% | | | | |
| | 2,338 | | | Johnson & Johnson | | | 326,665 | |
| | 13,705 | | | Pfizer, Inc. | | | 496,395 | |
| | | | | | | | 823,060 | |
| | | | | RETAIL - 17.4% | | | | |
| | 2,228 | | | Costco Wholsale Corp. | | | 414,675 | |
| | 3,507 | | | Home Depot, Inc. | | | 664,682 | |
| | 4,223 | | | Lululemon Athletica, Inc. * | | | 331,886 | |
| | 3,551 | | | McDonald’s Corp. | | | 611,198 | |
| | 11,176 | | | Tapestry, Inc. | | | 494,314 | |
| | 3,359 | | | Wal-Mart Stores, Inc. | | | 331,701 | |
| | | | | | | | 2,848,456 | |
| | | | | SEMICONDUCTORS - 4.0% | | | | |
| | 14,108 | | | Intel Corp. | | | 651,225 | |
See accompanying notes to consolidated financial statements.
| RATIONAL DYNAMIC BRANDS FUND (Formerly, RATIONAL DEFENSIVE GROWTH FUND) |
| PORTFOLIO OF INVESTMENTS (Continued) |
| December 31, 2017 |
| Shares | | | | | Value | |
| | | | | COMMON STOCKS - 99.5% (Continued) | | | | |
| | | | | SOFTWARE - 9.0% | | | | |
| | 7,656 | | | Activision Blizzard, Inc. | | $ | 484,778 | |
| | 2,834 | | | Adobe Systems, Inc. * | | | 496,630 | |
| | 5,787 | | | Microsoft Corp. | | | 495,020 | |
| | | | | | | | 1,476,428 | |
| | | | | TELECOMMUNICATIONS - 6.0% | | | | |
| | 17,121 | | | Cisco Systems, Inc. | | | 655,734 | |
| | 6,184 | | | Verizon Communications, Inc. | | | 327,319 | |
| | | | | | | | 983,053 | |
| | | | | TRANSPORTATION - 3.0% | | | | |
| | 1,978 | | | FedEx Corp. | | | 493,590 | |
| | | | | | | | | |
| | | | | TOTAL COMMON STOCKS (Cost $15,476,035) | | | 16,296,792 | |
| | | | | | | | | |
| | | | | SHORT-TERM INVESTMENTS - 0.3% | | | | |
| | 47,873 | | | Federated Treasury Obligations Fund, Institutional Class, 1.15% ** | | $ | 47,873 | |
| | | | | TOTAL SHORT-TERM INVESTMENTS (Cost $47,873) | | | 47,873 | |
| | | | | | | | | |
| | | | | TOTAL INVESTMENTS (Cost $15,523,908) - 99.8% (a) | | | 16,344,665 | |
| | | | | OTHER ASSETS LESS LIABILITIES - 0.2% | | | 24,943 | |
| | | | | NET ASSETS - 100.0% | | $ | 16,369,608 | |
| * | Non-income producing security. |
| ** | Rate shown represents the rate at December 31, 2017, and is subject to change and resets daily. |
| (a) | Represents cost for financial reporting purposes. Aggregate cost for federal tax purposes is $15,535,839 and differs from fair value by net unrealized appreciation (depreciation) of securities as follows: |
| Unrealized appreciation: | | $ | 909,695 | |
| Unrealized depreciation: | | | (100,869 | ) |
| Net unrealized appreciation: | | $ | 808,826 | |
See accompanying notes to consolidated financial statements.
RATIONAL STRATEGIC ALLOCATION FUND PORTFOLIO OF INVESTMENTS |
| December 31, 2017 |
| Shares | | | | | Value | |
| | | | | MUTUAL FUNDS - 74.6% | | | | |
| | | | | ASSET ALLOCATION FUNDS - 15.2% | | | | |
| | 278,214 | | | Rational Risk Managed Emerging Markets Fund, Institutional Class + | | $ | 2,022,614 | |
| | | | | | | | | |
| | | | | DEBT FUNDS - 29.3% | | | | |
| | 89,680 | | | AlphaCentric Income Opportunities Fund, Institutional Class + | | | 1,098,578 | |
| | 162,746 | | | Catalyst/Stone Beach Income Opportunity Fund, Institutional Class + | | | 1,565,613 | |
| | 65,370 | | | Catalyst Insider Income Fund, Institutional Class + | | | 605,982 | |
| | 65,744 | | | Catalyst Floating Rate Income Fund, Institutional Class + | | | 630,488 | |
| | | | | | | | 3,900,661 | |
| | | | | EQUITY FUNDS - 30.1% | | | | |
| | 47,960 | | | Catalyst Dynamic Alpha Fund, Institutional Class + | | | 1,062,316 | |
| | 152,852 | | | Catalyst MLP & Infrastructure Fund, Institutional Class + | | | 886,541 | |
| | 299,944 | | | Rational Dynamic Brands Fund, Institutional Class + | | | 1,046,804 | |
| | 126,703 | | | Rational Dividend Capture Fund, Institutional Class + | | | 1,016,157 | |
| | | | | | | | 4,011,818 | |
| | | | | | | | | |
| | | | | TOTAL MUTUAL FUNDS (Cost - $9,532,830) | | | 9,935,093 | |
| | | | | | | | | |
| | | | | EXCHANGE TRADED FUNDS - 23.6% | | | | |
| | | | | EQUITY FUNDS - 23.6% | | | | |
| | 39,183 | | | Ecological Strategy ETF + | | | 1,623,743 | |
| | 39,569 | | | US Equity Rotation Strategy ETF + | | | 1,517,471 | |
| | | | | TOTAL EXCHANGE TRADED FUNDS (Cost - $2,194,619) | | | 3,141,214 | |
| | | | | | | | | |
| | | | | SHORT-TERM INVESTMENTS - 0.8% | | | | |
| | 106,509 | | | Federated Treasury Obligations Fund, Institutional Class, 1.15% ** | | | 106,509 | |
| | | | | TOTAL SHORT-TERM INVESTMENTS (Cost - $106,509) | | | 106,509 | |
| | | | | | | | | |
| | | | | TOTAL INVESTMENTS - 99.0% (Cost - $11,833,958) (a) | | $ | 13,182,816 | |
| | | | | OTHER ASSETS IN EXCESS OF LIABILITIES - 1.0% | | | 129,382 | |
| | | | | NET ASSETS - 100.0% | | $ | 13,312,198 | |
ETF - Exchange Traded Fund.
| + | Investment in affiliate. |
| * | Rate shown represents the rate at December 31, 2017, and is subject to change and resets daily. |
| (a) | Represents cost for financial reporting purposes. Aggregate cost for tax purposes is $12,048,517 and differs from fair value by net unrealized appreciation (depreciation) of securities as follows: |
| Unrealized appreciation: | | $ | 1,820,700 | |
| Unrealized depreciation: | | | (686,401 | ) |
| Net unrealized appreciation: | | $ | 1,134,299 | |
See accomanying notes to consolidated financial statements.
| RATIONAL DYNAMIC MOMENTUM FUND |
| CONSOLIDATED PORTFOLIO OF INVESTMENTS |
| December 31, 2017 |
| Shares | | | | | Value | |
| | | | | SHORT-TERM INVESTMENTS - 82.0% | | | | |
| | 5,235,023 | | | Fidelity Institutional Government Portfolio , Institutional Class, 1.19% * + (Cost - $5,235,023) | | $ | 5,235,023 | |
| | | | | | | | | |
| | | | | | | | | |
| | | | | TOTAL INVESTMENTS - 82.0% (Cost - $5,235,023) (a) | | $ | 5,235,023 | |
| | | | | OTHER ASSETS LESS LIABILITIES - 19.0% | | | 1,148,846 | |
| | | | | NET ASSETS - 100.0% | | $ | 6,383,869 | |
| * | Rate shown represents the rate at December 31, 2017, and is subject to change and resets daily. |
| + | All or a portion of this investment is a holding of the RDMF Fund Limited. |
| (a) | Represents cost for financial reporting purposes. Aggregate cost for federal tax purposes, including futures, is $5,410,233 and differs from fair value by net unrealized appreciation (depreciation) of securities as follows: |
| Unrealized appreciation: | | $ | 109,397 | |
| Unrealized depreciation: | | | (77,565 | ) |
| Net unrealized appreciation: | | $ | 31,832 | |
| | | | | | | | | | Unrealized | |
| | | | | | | | | | Appreciaion / | |
| Long Contracts | | | | | Notional Amount ($) | | Maturity | | (Depreciation) | |
| | | | | OPEN LONG FUTURES CONTRACTS - 2.6% | | | | | | |
| | 12 | | | 3M Co. | | 283,188 | | March-18 | | $ | (6,740 | ) |
| | 32 | | | Abbott Laboratories | | 183,104 | | March-18 | | | 4,293 | |
| | 1 | | | Alphabet, Inc. | | 105,617 | | March-18 | | | 3,036 | |
| | 1 | | | Amazon.Com, Inc. | | 117,225 | | March-18 | | | 2,125 | |
| | 14 | | | Apple, Inc. | | 237,552 | | March-18 | | | (3,626 | ) |
| | 4 | | | Australian Dollar Currency Future | | 312,440 | | March-18 | | | 11,281 | |
| | 42 | | | Bank Of America Corp. | | 124,320 | | March-18 | | | 822 | |
| | 1 | | | Biogen, Inc. | | 31,941 | | March-18 | | | 53 | |
| | 10 | | | BP Currency Future | | 847,313 | | March-18 | | | 9,375 | |
| | 13 | | | Brazil Real Future | | 391,755 | | March-18 | | | 1,430 | |
| | 21 | | | Bristol-Myers Squibb Co. | | 129,024 | | March-18 | | | (4,544 | ) |
| | 11 | | | C$ Currency Future | | 878,900 | | March-18 | | | 22,605 | |
| | 11 | | | Chevron Corp. | | 138,072 | | March-18 | | | 2,704 | |
| | 32 | | | Cisco Systems, Inc. | | 122,880 | | March-18 | | | 1,397 | |
| | 20 | | | Citigroup, Inc. | | 149,220 | | March-18 | | | (6,111 | ) |
| | 40 | | | Coca-Cola Co. | | 184,000 | | March-18 | | | (1,579 | ) |
| | 19 | | | Conocophillips | | 104,557 | | March-18 | | | 2,717 | |
| | 7 | | | Copper Future + | | 577,588 | | March-18 | | | 21,263 | |
| | 2 | | | Cotton No. 2 Future + | | 78,630 | | March-18 | | | 840 | |
| | 6 | | | Euro FX Currency Future | | 905,663 | | March-18 | | | 16,462 | |
| | 7 | | | Fedex Corp. | | 175,077 | | March-18 | | | 6,560 | |
| | 16 | | | Ford Motor Co. | | 20,032 | | March-18 | | | (148 | ) |
| | 2 | | | Gasoline RBOB Fuure + | | 150,847 | | March-18 | | | 10,500 | |
| | 14 | | | Home Depot, Inc. | | 266,042 | | March-18 | | | 5,417 | |
| | 30 | | | Intel Corp. | | 138,840 | | March-18 | | | 4,581 | |
| | 21 | | | JPMorgan Chase & Co. | | 225,162 | | March-18 | | | (1,285 | ) |
| | 5 | | | Live Cattle Future + | | 243,100 | | February-18 | | | (16,400 | ) |
| | 4 | | | LME Aluminum Forward + | | 226,675 | | February-18 | | | 9,825 | |
| | 1 | | | LME Nickel Forward + | | 76,428 | | February-18 | | | (66 | ) |
| | 1 | | | LME Zinc Forward + | | 83,213 | | February-18 | | | 2,287 | |
| | 20 | | | McDonalds Corp. | | 345,140 | | March-18 | | | 618 | |
| | 6 | | | Mexican Peso Future | | 150,240 | | March-18 | | | (6,120 | ) |
| | 19 | | | Microsoft Corp. | | 162,963 | | March-18 | | | 6,513 | |
| | 21 | | | Nike, Inc. | | 131,691 | | March-18 | | | (945 | ) |
| | 3 | | | NY Harbor ULSD Future + | | 260,581 | | February-18 | | | 20,538 | |
| | 34 | | | Oracle Corp. | | 161,160 | | March-18 | | | (6,192 | ) |
| | 4 | | | Palladium Future + | | 424,400 | | March-18 | | | 26,500 | |
| | 10 | | | PepsiCo, Inc. | | 120,240 | | March-18 | | | 3,157 | |
| | 40 | | | Pfizer, Inc. | | 145,280 | | March-18 | | | (1,702 | ) |
See accompanying notes to consolidated financial statements.
| RATIONAL DYNAMIC MOMENTUM FUND |
| CONSOLIDATED PORTFOLIO OF INVESTMENTS (Continued) |
| December 31, 2017 |
| | | | | | | | | | Unrealized | |
| Long / (Short) | | | | | | | | | Appreciaion / | |
| Contracts | | | | | Notional Amount ($) | | Maturity | | (Depreciation) | |
| | | | | OPEN LONG FUTURES CONTRACTS - 2.6% (Continued) | | | | | | | | |
| | 12 | | | Russian Ruble Future | | 516,750 | | March-18 | | | 17,100 | |
| | 14 | | | Southern Co. | | 67,508 | | March-18 | | | (4,309 | ) |
| | 3 | | | Verizon Comm Div | | 15,921 | | March-18 | | | (108 | ) |
| | 23 | | | Wal-Mart Stores, Inc. | | 227,723 | | March-18 | | | 5,219 | |
| | 2 | | | WTI Crude Future + | | 120,840 | | February-18 | | | 3,850 | |
| | | | | Net Unrealized Appreciation From Open Long Futures Contracts | | $ | 163,193 | |
| | | | | | | | | | | | | |
| | | | | OPEN SHORT FUTURES CONTRACTS - (0.7)% | | | | | | |
| | (20 | ) | | 90Day Euro Future | | (4,887,000) | | June-19 | | $ | 688 | |
| | (15 | ) | | AT&T, Inc. | | (58,470) | | March-18 | | | (2,041 | ) |
| | (16 | ) | | Bank Accept Future | | (3,125,903) | | September-18 | | | 6,708 | |
| | (6 | ) | | Coffee ‘C’ Future + | | (283,950) | | March-18 | | | 3,825 | |
| | (10 | ) | | Corn Future + | | (175,375) | | March-18 | | | 250 | |
| | (2 | ) | | Japanese Yen Currency Future | | (222,850) | | March-18 | | | (1,363 | ) |
| | (12 | ) | | Mill Wheat Euro + | | (114,556) | | March-18 | | | 2,510 | |
| | (2 | ) | | New Zealand Future | | (141,740) | | March-18 | | | (5,140 | ) |
| | (4 | ) | | Platinum Future + | | (187,660) | | April-18 | | | (3,880 | ) |
| | (1 | ) | | Silver Future + | | (85,725) | | March-18 | | | (125 | ) |
| | (15 | ) | | Sugar #11 (World) + | | (254,698) | | March-18 | | | (21,505 | ) |
| | (28 | ) | | US 2YR Note (CBT) | | (5,995,063) | | March-18 | | | 14,437 | |
| | (5 | ) | | US 5YR Note (CBT) | | (580,820) | | March-18 | | | (703 | ) |
| | (23 | ) | | USD/CNH PH Future | | (2,309,801) | | March-18 | | | 43,836 | |
| | (4 | ) | | USD/SEK Currency Future | | (397,777) | | March-18 | | | 14,343 | |
| | (1 | ) | | USD/ZAR Currency Future | | (101,151) | | March-18 | | | (566 | ) |
| | (12 | ) | | Wheat Future (CBT) + | | (256,200) | | March-18 | | | (7,425 | ) |
| | | | | Net Unrealized Appreciation From Open Short Futures Contracts | | $ | 43,849 | |
| | | | | Total Unrealized Appreciation/Depreciation from Open Futures Contracts | | $ | 207,042 | |
| + | All or a portion of this investment is a holding of the RDMF Fund, Ltd. |
See accompanying notes to consolidated financial statements.
| RATIONAL IRON HORSE FUND |
| PORTFOLIO OF INVESTMENTS |
| December 31, 2017 |
| Shares | | | | | Value | |
| | | | | COMMON STOCKS - 90.9% | | | | |
| | | | | AEROSPACE/DEFENSE - 3.1% | | | | |
| | 600 | | | Northrop Grumman Corp. | | $ | 184,146 | |
| | 2,800 | | | United Technologies Corp. | | | 357,196 | |
| | | | | | | | 541,342 | |
| | | | | AGRICULTURE - 1.0% | | | | |
| | 1,700 | | | Phillip Morris International, Inc. | | | 179,605 | |
| | | | | | | | | |
| | | | | APPAREL - 3.8% | | | | |
| | 13,800 | | | Hanesbrands, Inc. + | | | 288,558 | |
| | 6,000 | | | NIKE, Inc. + | | | 375,300 | |
| | | | | | | | 663,858 | |
| | | | | AUTO MANUFACTURERS - 0.5% | | | | |
| | 2,300 | | | General Motors Co. + | | | 94,277 | |
| | | | | | | | | |
| | | | | BANKS - 12.0% | | | | |
| | 1,000 | | | First Republic Bank | | | 86,640 | |
| | 900 | | | Goldman Sachs Group, Inc.+ | | | 229,284 | |
| | 4,500 | | | KeyCorp, Inc. | | | 90,765 | |
| | 2,600 | | | Northern Trust Corp. | | | 259,714 | |
| | 5,300 | | | Regions Financial Corp. | | | 91,584 | |
| | 2,700 | | | State Street Corp. | | | 263,547 | |
| | 6,200 | | | SunTrust Banks, Inc. | | | 400,458 | |
| | 6,900 | | | US Bancorp | | | 369,702 | |
| | 5,500 | | | Wells Fargo & Co. | | | 333,685 | |
| | | | | | | | 2,125,379 | |
| | | | | BEVERAGES - 1.0% | | | | |
| | 1,400 | | | PepsiCo, Inc. | | | 167,888 | |
| | | | | | | | | |
| | | | | CHEMICALS - 1.6% | | | | |
| | 2,000 | | | Eastman Chemical Co. | | | 185,280 | |
| | 800 | | | PPG Industries, Inc. | | | 93,456 | |
| | | | | | | | 278,736 | |
| | | | | COMPUTERS - 8.5% | | | | |
| | 2,400 | | | Apple, Inc. + | | | 406,152 | |
| | 900 | | | Check Point Software Technologies Ltd. | | | 93,258 | |
| | 2,500 | | | Cognizant Technology Solutions Corp. | | | 177,550 | |
| | 5,400 | | | International Business Machines Corp. | | | 828,468 | |
| | | | | | | | 1,505,428 | |
| | | | | COSMETICS/PERSONAL CARE - 1.7% | | | | |
| | 4,100 | | | Colgate-Palmolive Co. + | | | 309,345 | |
| | | | | | | | | |
| | | | | DIVERSIFIED FINANCIAL SERVICES - 0.6% | | | | |
| | 1,800 | | | Fastenal, Co. | | | 98,442 | |
| | | | | | | | | |
| | | | | DIVERSIFIED FINANCIAL SERVICES - 1.1% | | | | |
| | 4,900 | | | Synchrony Financial | | | 189,189 | |
| | | | | | | | | |
| | | | | ELECTRIC - 3.1% | | | | |
| | 2,500 | | | Dominion Resources, Inc. + | | | 202,650 | |
| | 7,200 | | | Southern Co. + | | | 346,248 | |
| | | | | | | | 548,898 | |
| | | | | FOOD - 3.5% | | | | |
| | 1,600 | | | Hershey Co. | | | 181,616 | |
| | 2,500 | | | Kellogg Co. | | | 169,950 | |
| | 1,500 | | | Kraft Heinz Co. | | | 116,640 | |
| | 3,400 | | | Mondelez International, Inc. + | | | 145,520 | |
| | | | | | | | 613,726 | |
| | | | | GAS - 1.5% | | | | |
| | 2,400 | | | Sempra Energy | | | 256,608 | |
See accompanying notes to consolidated financial statements.
| RATIONAL IRON HORSE FUND |
| PORTFOLIO OF INVESTMENTS (Continued) |
| December 31, 2017 |
| Shares | | | | | Value | |
| | | | | COMMON STOCK S - 90.9% (Continued) | | | | |
| | | | | HEALTHCARE-PRODUCTS - 1.8% | | | | |
| | 1,000 | | | Danaher Corp. + | | $ | 92,820 | |
| | 2,800 | | | Medtronic PLC + | | | 226,100 | |
| | | | | | | | 318,920 | |
| | | | | HEALTHCARE-SERVICES - 0.5% | | | | |
| | 900 | | | Centene Corp. * | | | 90,792 | |
| | | | | | | | | |
| | | | | HOUSEHOLD PRODUCTS/WARES - 2.1% | | | | |
| | 3,100 | | | Kimberly-Clark Corp. + | | | 374,046 | |
| | | | | | | | | |
| | | | | INSURANCE - 1.5% | | | | |
| | 1,200 | | | Allstate Corp. | | | 125,652 | |
| | 2,500 | | | American International Group, Inc. + | | | 148,950 | |
| | | | | | | | 274,602 | |
| | | | | INTERNET - 7.0% | | | | |
| | 500 | | | Alphabet, Inc. * + | | | 526,700 | |
| | 2,200 | | | Amazon.com, Inc. * + | | | 388,212 | |
| | 200 | | | Facebook, Inc. - Cl. A * + | | | 233,894 | |
| | 700 | | | F5 Networks, Inc. *+ | | | 91,854 | |
| | | | | | | | 1,240,660 | |
| | | | | MEDIA - 3.0% | | | | |
| | 8,000 | | | Comcast Corp. | | | 320,400 | |
| | 2,000 | | | Walt Disney Co. + | | | 215,020 | |
| | | | | | | | 535,420 | |
| | | | | MISCELLANEOUS MANUFACTURING - 1.5% | | | | |
| | 900 | | | Dover Corp. | | | 90,891 | |
| | 2,200 | | | Eaton Corp. PLC + | | | 173,822 | |
| | | | | | | | 264,713 | |
| | | | | OIL & GAS - 8.2% | | | | |
| | 2,500 | | | Chevron Corp. + | | | 312,975 | |
| | 5,900 | | | Exxon Mobil Corp. + | | | 493,476 | |
| | 3,100 | | | Marathon Petroleum Corp. + | | | 204,538 | |
| | 5,900 | | | Occidental Petroleum Corp. + | | | 434,594 | |
| | | | | | | | 1,445,583 | |
| | | | | OIL & GAS SERVICES - 0.6% | | | | |
| | 1,600 | | | Schlumberger Ltd. | | | 107,824 | |
| | | | | | | | | |
| | | | | PHARMACEUTICALS - 8.5% | | | | |
| | 3,000 | | | Eli Lilly & Co. + | | | 253,380 | |
| | 3,800 | | | Johnson & Johnson | | | 530,936 | |
| | 6,400 | | | Merk & Co, Inc. | | | 360,128 | |
| | 4,500 | | | Mylan NV | | | 190,395 | |
| | 4,800 | | | Pfizer, Inc. | | | 173,856 | |
| | | | | | | | 1,508,695 | |
| | | | | REIT - 0.8% | | | | |
| | 2,300 | | | Welltower, Inc. | | | 146,671 | |
| | | | | | | | | |
| | | | | RETAIL - 3.6% | | | | |
| | 2,900 | | | Genuine Parts Co. | | | 275,529 | |
| | 2,000 | | | Lowe’s Cos, Inc. + | | | 185,880 | |
| | 3,300 | | | Williams-Sonoma, Inc. | | | 170,610 | |
| | | | | | | | 632,019 | |
| | | | | SEMICONDUCTORS - 0.7% | | | | |
| | 2,800 | | | Intel Corp. + | | | 129,248 | |
| | | | | | | | | |
| | | | | SOFTWARE - 1.5% | | | | |
| | 2,200 | | | Citrix Systems, Inc. * | | | 193,600 | |
| | 1,700 | | | Oracle Corp. | | | 80,376 | |
| | | | | | | | 273,976 | |
| | | | | TELECOMMUNICATIONS - 4.5% | | | | |
| | 14,300 | | | Cisco Systems, Inc. + | | | 547,690 | |
| | 4,600 | | | Verizon Communications, Inc. + | | | 243,478 | |
| | | | | | | | 791,168 | |
See accompanying notes to consolidated financial statements.
| RATIONAL IRON HORSE FUND |
| PORTFOLIO OF INVESTMENTS (Continued) |
| December 31, 2017 |
| Shares | | | | | Value | |
| | | | | COMMON STOCK - 90.9% (Continued) | | | | |
| | | | | TOYS & GAMES - 1.0% | | | | |
| | 1,900 | | | Hasbro, Inc. | | $ | 172,691 | |
| | | | | | | | | |
| | | | | TRANSPORTATION - 1.1% | | | | |
| | 400 | | | FedEx Corp. | | | 99,816 | |
| | 800 | | | United Parcel Service, Inc. + | | | 95,320 | |
| | | | | | | | 195,136 | |
| | | | | | | | | |
| | | | | TOTAL COMMON STOCKS (Cost - $15,555,712) | | | 16,074,885 | |
| | | | | | | | | |
| | | | | EXCHANGE TRADED NOTE - 0.6% | | | | |
| | 10,000 | | | VelocityShares 3x Long Gold ETN linked to the S&P GSCI Gold Index | | | 111,400 | |
| | | | | TOTAL EXCHANGE TRADED NOTE (Cost - $102,073) | | | | |
| | | | | | Notional | | Expiration | | Exercise Price | | | |
| Contracts ^ | | | | | Amount ($) | | Date | | ($) | | | |
| | | | | PUT OPTIONS PURCHASED - 0.8% | | | | | | | | | | |
| | 100 | | | iShares Russell 2000 ETF | | 3,700,000 | | 3/16/2018 | | 148.00 | | | 24,800 | |
| | 100 | | | S&P 500 Index | | 61,250,000 | | 3/16/2018 | | 2,450.00 | | | 116,000 | |
| | | | | TOTAL PUT OPTIONS PURCHASED (Premiums Received - $235,965) (a) | | | 140,800 | |
| | | | | | | | | |
| Shares | | | | | | | | | | | | | |
| | | | | SHORT TERM INVESTMENT - 9.1% | | | | | | | | |
| | 1,605,853 | | | Fidelity Institutional Government Portfolio - Institutional Class, 1.19% ** (Cost - $1,605,853) | | $ | 1,605,853 | |
| | | | | | | | | | | | | | | |
| | | | | TOTAL INVESTMENTS - 101.4% (Cost - $17,499,603) (a) | | $ | 17,932,938 | |
| | | | | LIABILITIES LESS OTHER ASSETS - (1.4)% | | | (251,677 | ) |
| | | | | NET ASSETS - 100.0% | | | | | | $ | 17,681,261 | |
| | | | | | Notional | | Expiration | | Exercise Price | | | |
| Contracts ^ | | | | | Amount (S) | | Date | | ($) | | Value | |
| | | | | CALL OPTIONS WRITTEN * - (4.1)% | | | | | | | | |
| | 12 | | | Allstate Corp. | | 120,000 | | 04/20/18 | | 100.00 | | $ | (8,244 | ) |
| | 1 | | | Alphabet, Inc. | | 108,500 | | 01/19/18 | | 1,085.00 | | | (447 | ) |
| | 2 | | | Alphabet, Inc. | | 210,000 | | 03/16/18 | | 1,050.00 | | | (8,800 | ) |
| | 2 | | | Alphabet, Inc. | | 213,000 | | 03/16/18 | | 1,065.00 | | | (6,960 | ) |
| | 1 | | | Amazon.com, Inc. | | 119,000 | | 01/19/18 | | 1,190.00 | | | (1,125 | ) |
| | 1 | | | Amazon.com, Inc. | | 114,000 | | 04/20/18 | | 1,140.00 | | | (8,290 | ) |
| | 13 | | | American International Group, Inc. | | 81,250 | | 05/18/18 | | 62.50 | | | (1,976 | ) |
| | 12 | | | American International Group, Inc. | | 78,000 | | 05/18/18 | | 65.00 | | | (996 | ) |
| | 5 | | | Apple, Inc. | | 87,500 | | 01/19/18 | | 175.00 | | | (400 | ) |
| | 6 | | | Apple, Inc. | | 105,000 | | 02/16/18 | | 175.00 | | | (2,100 | ) |
| | 13 | | | Apple, Inc. | | 227,500 | | 06/15/18 | | 175.00 | | | (10,816 | ) |
| | 9 | | | Centene Corp. | | 87,750 | | 01/19/18 | | 97.50 | | | (4,779 | ) |
| | 9 | | | Check Point Software Technology | | 99,000 | | 02/16/18 | | 110.00 | | | (1,350 | ) |
| | 25 | | | Chevron Corp. | | 300,000 | | 01/19/18 | | 120.00 | | | (14,375 | ) |
| | 41 | | | Cisco Systems, Inc. | | 147,600 | | 03/16/18 | | 36.00 | | | (11,234 | ) |
| | 19 | | | Cisco Systems, Inc. | | 70,300 | | 03/16/18 | | 37.00 | | | (3,838 | ) |
| | 83 | | | Cisco Systems, Inc. | | 315,400 | | 04/20/18 | | 38.00 | | | (13,363 | ) |
| | 22 | | | Citrix Systems, Inc. | | 198,000 | | 01/19/18 | | 90.00 | | | (1,760 | ) |
| | 14 | | | Cognizant Technology Solutions | | 101,500 | | 01/19/18 | | 72.50 | | | (756 | ) |
| | 11 | | | Cognizant Technology Solutions | | 82,500 | | 04/20/18 | | 75.00 | | | (1,606 | ) |
| | 41 | | | Colgate-Palmolive Co. | | 307,500 | | 05/18/18 | | 75.00 | | | (13,735 | ) |
| | 30 | | | Comcast Corp. | | 120,000 | | 01/19/18 | | 40.00 | | | (2,430 | ) |
| | 25 | | | Comcast Corp. | | 103,125 | | 01/19/18 | | 41.25 | | | (975 | ) |
| | 25 | | | Comcast Corp. | | 106,250 | | 04/20/18 | | 42.50 | | | (2,750 | ) |
| | 10 | | | Danaher Corp. | | 92,500 | | 01/19/18 | | 92.50 | | | (1,500 | ) |
| | 13 | | | Dominion Energy | | 107,250 | | 01/19/18 | | 82.50 | | | (650 | ) |
| | 12 | | | Dominion Energy | | 99,000 | | 04/20/18 | | 82.50 | | | (2,004 | ) |
| | 9 | | | Dover Corp. | | 85,500 | | 03/16/18 | | 95.00 | | | (8,460 | ) |
| | 10 | | | Eastman Chemical Co. | | 95,000 | | 01/19/18 | | 95.00 | | | (7,400 | ) |
| | 10 | | | Eatstman Chemical Co. | | 92,500 | | 01/19/18 | | 92.50 | | | (1,575 | ) |
| | 22 | | | Eaton Corp. PLC | | 176,000 | | 01/19/18 | | 80.00 | | | (13,640 | ) |
See accompanying notes to consolidated financial statements.
| RATIONAL IRON HORSE FUND |
| PORTFOLIO OF INVESTMENTS (Continued) |
| December 31, 2017 |
| | | | | | Notional | | Expiration | | Exercise Price | | | |
| Contracts ^ | | | | | Amount (S) | | Date | | ($) | | Value | |
| | | | | CALL OPTIONS WRITTEN * - (4.1)% (Continued) | | | | | | | | |
| | 15 | | | Eli Lilly & Co. | | 127,500 | | 01/19/18 | | 85.00 | | $ | (1,410 | ) |
| | 15 | | | Eli Lilly & Co. | | 131,250 | | 04/20/18 | | 87.50 | | | (2,595 | ) |
| | 59 | | | Exxon Mobil Corp. | | 501,500 | | 01/19/18 | | 85.00 | | | (2,301 | ) |
| | 2 | | | F5 Networks, Inc. | | 25,000 | | 01/19/18 | | 125.00 | | | (1,485 | ) |
| | 5 | | | F5 Networks, Inc. | | 62,500 | | 04/20/18 | | 125.00 | | | (5,725 | ) |
| | 11 | | | Facebook, Inc. | | 192,500 | | 01/19/18 | | 175.00 | | | (4,510 | ) |
| | 11 | | | Facebook, Inc. | | 198,000 | | 03/16/18 | | 180.00 | | | (7,370 | ) |
| | 18 | | | Fastenal Co. | | 86,400 | | 05/18/18 | | 48.00 | | | (13,860 | ) |
| | 4 | | | FedEx Corp. | | 88,000 | | 04/20/18 | | 220.00 | | | (13,100 | ) |
| | 10 | | | First Republic Bank | | 90,000 | | 01/19/18 | | 90.00 | | | (850 | ) |
| | 23 | | | General Motors Co. | | 98,900 | | 01/19/18 | | 43.00 | | | (529 | ) |
| | 29 | | | Genuine Parts Co, | | 268,250 | | 05/18/18 | | 92.50 | | | (16,385 | ) |
| | 9 | | | Goldman Sachs Group, Inc. | | 220,500 | | 04/20/18 | | 245.00 | | | (17,145 | ) |
| | 69 | | | Hanesbrands, Inc. | | 151,800 | | 04/20/18 | | 22.00 | | | (7,797 | ) |
| | 69 | | | Hanesbrands, Inc. | | 158,700 | | 04/20/18 | | 23.00 | | | (4,830 | ) |
| | 19 | | | Hasbro, Inc. | | 185,250 | | 01/19/18 | | 97.50 | | | (532 | ) |
| | 16 | | | Hershey Co. | | 184,000 | | 01/19/18 | | 115.00 | | | (1,616 | ) |
| | 28 | | | Intel Corp. | | 128,800 | | 03/16/18 | | 46.00 | | | (5,740 | ) |
| | 18 | | | International Business Machine | | 288,000 | | 01/19/18 | | 160.00 | | | (1,674 | ) |
| | 18 | | | International Business Machine | | 288,000 | | 03/16/18 | | 160.00 | | | (3,708 | ) |
| | 18 | | | International Business Machine | | 288,000 | | 04/20/18 | | 160.00 | | | (5,796 | ) |
| | 11 | | | Johnson & Johnson | | 154,000 | | 01/19/18 | | 140.00 | | | (1,452 | ) |
| | 7 | | | Johnson & Johnson | | 101,500 | | 01/19/18 | | 145.00 | | | (133 | ) |
| | 14 | | | Johnson & Johnson | | 203,000 | | 03/16/18 | | 145.00 | | | (1,890 | ) |
| | 6 | | | Johnson & Johnson | | 84,000 | | 04/20/18 | | 140.00 | | | (2,520 | ) |
| | 19 | | | Kellogg Co. | | 123,500 | | 03/16/18 | | 65.00 | | | (8,550 | ) |
| | 6 | | | Kellogg Co. | | 40,500 | | 03/16/18 | | 67.50 | | | (1,650 | ) |
| | 45 | | | KeyCorp KEY | | 85,500 | | 03/16/18 | | 19.00 | | | (7,740 | ) |
| | 12 | | | Kimberly Clark Corp. | | 144,000 | | 01/19/18 | | 120.00 | | | (2,820 | ) |
| | 19 | | | Kimberly Clark Corp. | | 218,500 | | 04/20/18 | | 115.00 | | | (15,865 | ) |
| | 15 | | | Kraft Heinz Co. | | 123,750 | | 04/20/18 | | 82.50 | | | (1,800 | ) |
| | 11 | | | Lowe’s Cos, Inc. | | 96,250 | | 01/19/18 | | 87.50 | | | (6,798 | ) |
| | 9 | | | Lowe’s Cos, Inc. | | 74,250 | | 03/16/18 | | 82.50 | | | (10,566 | ) |
| | 15 | | | Marathon Petroleum Corp. | | 90,000 | | 01/19/18 | | 60.00 | | | (9,630 | ) |
| | 16 | | | Marathon Petroleum Corp. | | 100,000 | | 04/20/18 | | 62.50 | | | (8,864 | ) |
| | 8 | | | Medtronic PLC | | 66,000 | | 03/16/18 | | 82.50 | | | (1,560 | ) |
| | 10 | | | Medtronic PLC | | 85,000 | | 05/18/18 | | 85.00 | | | (960 | ) |
| | 10 | | | Medtronic PLC | | 85,000 | | 03/18/18 | | 85.00 | | | (1,650 | ) |
| | 14 | | | Merck & Co. | | 77,000 | | 03/16/18 | | 55.00 | | | (3,780 | ) |
| | 50 | | | Merck & Co. | | 287,500 | | 04/20/18 | | 57.50 | | | (8,900 | ) |
| | 34 | | | Mondelez International, Inc. | | 149,600 | | 03/16/18 | | 44.00 | | | (3,094 | ) |
| | 45 | | | Mylan NV | | 180,000 | | 04/20/18 | | 40.00 | | | (18,945 | ) |
| | 23 | | | Nike, Inc. | | 132,250 | | 01/19/18 | | 57.50 | | | (12,190 | ) |
| | 37 | | | Nike, Inc. | | 212,750 | | 04/20/18 | | 57.50 | | | (24,827 | ) |
| | 8 | | | Northern Trust Corp. | | 76,000 | | 01/19/18 | | 95.00 | | | (4,400 | ) |
| | 18 | | | Northern Trust Corp. | | 175,500 | | 04/20/18 | | 97.50 | | | (10,800 | ) |
| | 3 | | | Northrop Grumman Corp. | | 90,000 | | 01/19/18 | | 300.00 | | | (9,270 | ) |
| | 3 | | | Northrop Grumman Corp. | | 93,000 | | 01/19/18 | | 310.00 | | | (885 | ) |
| | 39 | | | Occidental Petroleum Corp. | | 263,250 | | 01/19/18 | | 67.50 | | | (24,960 | ) |
| | 20 | | | Occidental Petroleum Corp. | | 140,000 | | 05/18/18 | | 70.00 | | | (11,180 | ) |
| | 17 | | | Oracle Corp. | | 85,000 | | 03/16/18 | | 50.00 | | | (1,020 | ) |
| | 7 | | | Pepisco, Inc. | | 80,500 | | 01/19/18 | | 115.00 | | | (3,780 | ) |
| | 7 | | | Pepisco, Inc. | | 84,000 | | 01/19/18 | | 120.00 | | | (1,120 | ) |
| | 48 | | | Pfizer, Inc. | | 177,600 | | 03/16/18 | | 37.00 | | | (2,784 | ) |
| | 17 | | | Phillip Morris International | | 185,300 | | 01/19/18 | | 109.00 | | | (765 | ) |
| | 8 | | | PPG Industries, Inc. | | 96,000 | | 05/18/18 | | 120.00 | | | (3,040 | ) |
| | 53 | | | Regionals Financial Corp. | | 84,800 | | 05/18/18 | | 16.00 | | | (9,964 | ) |
| | 16 | | | Schlumberger Ltd. | | 104,000 | | 01/19/18 | | 65.00 | | | (4,960 | ) |
| | 24 | | | Sempra Energy | | 288,000 | | 01/19/18 | | 120.00 | | | (24 | ) |
| | 36 | | | Southern Co. | | 189,000 | | 06/15/18 | | 52.50 | | | (1,080 | ) |
| | 36 | | | Southern Co. | | 198,000 | | 06/15/18 | | 55.00 | | | (540 | ) |
See accompanying notes to consolidated financial statements.
| RATIONAL IRON HORSE FUND |
| PORTFOLIO OF INVESTMENTS (Continued) |
| December 31, 2017 |
| | | | | | Notional | | Expiration | | Exercise Price | | | |
| Contracts ^ | | | | | Amount (S) | | Date | | ($) | | Value | |
| | | | | CALL OPTIONS WRITTEN * - (4.1)% (Continued) | | | | | | | |
| | 18 | | | State Street Corp. | | 180,000 | | 01/19/18 | | 100.00 | | $ | (1,080 | ) |
| | 9 | | | State Street Corp. | | 87,750 | | 01/19/18 | | 97.50 | | | (1,674 | ) |
| | 62 | | | SunTrust Banks, Inc. | | 403,000 | | 01/19/18 | | 65.00 | | | (36,270 | ) |
| | 49 | | | Synchrony Financial | | 161,700 | | 03/16/18 | | 33.00 | | | (30,380 | ) |
| | 8 | | | United Parcel Service, Inc. | | 96,000 | | 01/19/18 | | 120.00 | | | (1,136 | ) |
| | 10 | | | United Technologies Corp. | | 125,000 | | 05/18/18 | | 125.00 | | | (6,620 | ) |
| | 18 | | | United Technologies Corp. | | 216,000 | | 06/15/18 | | 120.00 | | | (18,720 | ) |
| | 35 | | | US Bancorp | | 183,750 | | 02/16/18 | | 52.50 | | | (8,610 | ) |
| | 34 | | | US Bancorp | | 195,500 | | 09/21/18 | | 57.50 | | | (5,610 | ) |
| | 28 | | | Verizon Communications, Inc. | | 140,000 | | 01/19/18 | | 50.00 | | | (13,916 | ) |
| | 18 | | | Verizon Communications, Inc. | | 88,200 | | 01/19/18 | | 49.00 | | | (7,416 | ) |
| | 20 | | | Walt Disney Co. | | 200,000 | | 03/16/18 | | 100.00 | | | (18,800 | ) |
| | 15 | | | Wells Fargo & Co. | | 82,500 | | 01/19/18 | | 55.00 | | | (9,075 | ) |
| | 25 | | | Wells Fargo & Co. | | 137,500 | | 03/16/18 | | 55.00 | | | (15,688 | ) |
| | 15 | | | Wells Fargo & Co. | | 86,250 | | 03/16/18 | | 57.50 | | | (6,750 | ) |
| | 23 | | | Welltower, Inc. | | 166,750 | | 01/19/18 | | 72.50 | | | (230 | ) |
| | 25 | | | Williams - Sonoma, Inc. | | 131,250 | | 05/18/18 | | 52.50 | | | (9,750 | ) |
| | 8 | | | Williams - Sonoma, Inc. | | 46,000 | | 05/18/18 | | 57.50 | | | (1,360 | ) |
| | | | | TOTAL CALL OPTIONS WRITTEN (Premiums Received - $492,314) (a) | | $ | (717,133 | ) |
PLC - Public Limited Company
| + | All or a portion of the security is held as collateral for call options. |
| * | Non-income producing securities. |
| ** | Rate shown represents the rate at December 31, 2017, and is subject to change and resets daily. |
| ^ | Each option contract allows the holder of the option to purchase or sell 100 shares of the underlying security. |
| (a) | Represents cost for financial reporting purposes. Aggregate cost for federal tax purposes (including call options written) is $16,999,839 and differs from fair value by net unrealized appreciation (depreciation) of securities as follows: |
| Unrealized appreciation: | | $ | 829,349 | |
| Unrealized depreciation: | | | (613,383 | ) |
| Net unrealized appreciation: | | $ | 215,966 | |
See accompanying notes to consolidated financial statements.
| RATIONAL FUNDS |
| Statements of Assets and Liabilities |
| December 31, 2017 |
| | | Rational | | | Rational Risk | | | Rational | | | Rational | | | Rational | | | Rational | | | Rational | |
| | | Dividend Capture | | | Managed Emerging | | | Hedged Return | | | Dynamic Brands | | | Strategic Allocation | | | Dynamic Momentum | | | Iron Horse | |
| | | Fund | | | Markets Fund | | | Fund | | | Fund | | | Fund | | | Fund | | | Fund | |
| | | | | | | | | | | | | | | | | | | | | | | (Consolidated) | | | | | |
| ASSETS: | | | | | | | | | | | | | | | | | | | | | | | | | | | | |
| Investments in Unaffiliated securities, at cost | | $ | 34,992,097 | | | $ | 7,828,307 | | | $ | 2,842,037 | | | $ | 15,523,908 | | | $ | 106,509 | | | $ | 5,235,023 | | | $ | 17,499,603 | |
| Investments in Affiliated securities, at cost | | | — | | | | — | | | | — | | | | — | | | | 11,727,449 | | | | — | | | | — | |
| Total Securities at Cost | | | 34,992,097 | | | | 7,828,307 | | | | 2,842,037 | | | | 15,523,908 | | | | 11,833,958 | | | | 5,235,023 | | | | 17,499,603 | |
| | | | | | | | | | | | | | | | | | | | | | | | | | | | | |
| Investments in Unaffiliated securities, at value | | $ | 35,340,365 | | | $ | 9,904,936 | | | $ | 2,842,037 | | | $ | 16,344,665 | | | $ | 106,509 | | | $ | 5,235,023 | | | $ | 17,932,938 | |
| Investments in Affiliated securities, at value | | | — | | | | — | | | | — | | | | — | | | | 13,076,307 | | | | — | | | | — | |
| Total Securities at Value | | $ | 35,340,365 | | | $ | 9,904,936 | | | $ | 2,842,037 | | | $ | 16,344,665 | | | $ | 13,182,816 | | | $ | 5,235,023 | | | $ | 17,932,938 | |
| Cash | | | 7,403 | | | | — | | | | — | | | | — | | | | — | | | | — | | | | — | |
| Receivable for securities sold | | | — | | | | — | | | | — | | | | — | | | | — | | | | — | | | | 257,866 | |
| Receivable for Fund shares sold | | | 187 | | | | 303 | | | | 10,169 | | | | 2,616 | | | | — | | | | — | | | | — | |
| Dividends and interest receivable | | | 255,153 | | | | 31,228 | | | | 2,502 | | | | 7,482 | | | | 205,340 | | | | 5,973 | | | | 31,074 | |
| Foreign Cash (Cost - $0, $343, $0, $0, $0, $0, $0) | | | — | | | | 343 | | | | — | | | | — | | | | — | | | | — | | | | — | |
| Net unrealized appreciation from open futures contracts | | | — | | | | — | | | | — | | | | — | | | | — | | | | 309,665 | | | | — | |
| Deposits with Brokers | | | 62 | | | | — | | | | 3,057,505 | | | | — | | | | — | | | | 988,291 | | | | 227,772 | |
| Tax reclaims receivable | | | 1,293 | | | | 211,693 | | | | — | | | | 40,888 | | | | — | | | | — | | | | 846 | |
| Prepaid expenses and other assets | | | 47,599 | | | | 28,493 | | | | 28,596 | | | | 48,593 | | | | 6,056 | | | | 24,431 | | | | 6,131 | |
| Total Assets | | | 35,652,062 | | | | 10,176,996 | | | | 5,940,809 | | | | 16,444,244 | | | | 13,394,212 | | | | 6,563,383 | | | | 18,456,627 | |
| | | | | | | | | | | | | | | | | | | | | | | | | | | | | |
| LIABILITIES: | | | | | | | | | | | | | | | | | | | | | | | | | | | | |
| Options written | | | | | | | | | | | | | | | | | | | | | | | | | | | | |
| (premiums received $0, $0, $1,225, $0, $0, $0, $492,314) | | | — | | | | — | | | | 613 | | | | — | | | | — | | | | — | | | | 717,133 | |
| Management fees payable | | | 122,867 | | | | 2,780 | | | | 3,045 | | | | 30,396 | | | | 19,207 | | | | 52,548 | | | | 29,536 | |
| Net unrealized depreciation from open futures contracts | | | — | | | | — | | | | — | | | | — | | | | — | | | | 102,623 | | | | — | |
| Trustee fees payable | | | 1,627 | | | | 1,906 | | | | 1,769 | | | | 1,718 | | | | 1,934 | | | | 1,556 | | | | 1,728 | |
| Payable for securities purchased | | | 73,024 | | | | — | | | | — | | | | — | | | | 4,042 | | | | — | | | | — | |
| Payable for Fund shares redeemed | | | 33,156 | | | | 5,084 | | | | — | | | | 7,911 | | | | 29,579 | | | | — | | | | — | |
| Payable to related parties | | | 13,414 | | | | 4,564 | | | | 1,068 | | | | 3,735 | | | | 3,243 | | | | 64 | | | | 4,012 | |
| Shareholder services fees payable | | | 79,304 | | | | 9,343 | | | | 17,028 | | | | 10,749 | | | | 3,716 | | | | 3,832 | | | | 4,109 | |
| Accrued 12b-1 fees | | | 1,114 | | | | 670 | | | | 76 | | | | 9,136 | | | | 6,380 | | | | 680 | | | | 482 | |
| Accrued expenses and other liabilities | | | 13,029 | | | | 27,049 | | | | 16,179 | | | | 10,991 | | | | 13,913 | | | | 18,211 | | | | 18,366 | |
| Total Liabilities | | | 337,535 | | | | 51,396 | | | | 39,778 | | | | 74,636 | | | | 82,014 | | | | 179,514 | | | | 775,366 | |
| | | | | | | | | | | | | | | | | | | | | | | | | | | | | |
| Net Assets | | $ | 35,314,527 | | | $ | 10,125,600 | | | $ | 5,901,031 | | | $ | 16,369,608 | | | $ | 13,312,198 | | | $ | 6,383,869 | | | $ | 17,681,261 | |
| | | | | | | | | | | | | | | | | | | | | | | | | | | | | |
| NET ASSETS CONSIST OF: | | | | | | | | | | | | | | | | | | | | | | | | | | | | |
| Paid in capital | | $ | 38,781,326 | | | $ | 8,016,431 | | | $ | 10,467,353 | | | $ | 14,867,416 | | | $ | 12,680,877 | | | $ | 6,064,752 | | | $ | 17,534,036 | |
| Undistributed net investment income (loss) | | | 1,556,565 | | | | (10,503 | ) | | | — | | | | 11 | | | | — | | | | — | | | | 2,488 | |
| Accumulated net realized gain (loss) on investments, foreign currency contracts, futures and options written | | | (5,371,632 | ) | | | 67,022 | | | | (4,566,934 | ) | | | 686,531 | | | | (717,537 | ) | | | 149,155 | | | | (63,779 | ) |
| Net unrealized appreciation (depreciation) on investments, foreign currency contracts, futures and options written | | | 348,268 | | | | 2,052,650 | | | | 612 | | | | 815,650 | | | | 1,348,858 | | | | 169,962 | | | | 208,516 | |
| Net Assets | | $ | 35,314,527 | | | $ | 10,125,600 | | | $ | 5,901,031 | | | $ | 16,369,608 | | | $ | 13,312,198 | | | $ | 6,383,869 | | | $ | 17,681,261 | |
| | | | | | | | | | | | | | | | | | | | | | | | | | | | | |
| Institutional Shares | | | | | | | | | | | | | | | | | | | | | | | | | | | | |
| Net Assets | | $ | 12,188,331 | | | $ | 5,506,030 | | | $ | 5,450,575 | | | $ | 3,269,166 | | | $ | 277,884 | | | $ | 5,882,616 | | | $ | 10,912,963 | |
| Shares of beneficial interest outstanding (a) | | | 1,520,226 | | | | 757,504 | | | | 1,092,844 | | | | 938,046 | | | | 27,734 | | | | 232,964 | | | | 1,031,868 | |
| Net asset value per share | | $ | 8.02 | | | $ | 7.27 | | | $ | 4.99 | | | $ | 3.49 | | | $ | 10.02 | | | $ | 25.25 | | | $ | 10.58 | |
| | | | | | | | | | | | | | | | | | | | | | | | | | | | | |
| Class A shares | | | | | | | | | | | | | | | | | | | | | | | | | | | | |
| Net Assets | | $ | 20,327,298 | | | $ | 4,548,594 | | | $ | 449,416 | | | $ | 12,869,883 | | | $ | 13,033,197 | | | $ | 129,980 | | | $ | 6,767,281 | |
| Shares of beneficial interest outstanding (a) | | | 2,538,903 | | | | 630,282 | | | | 89,208 | | | | 5,210,048 | | | | 1,296,606 | | | | 5,167 | | | | 640,561 | |
| Net asset value and redemption price per share | | $ | 8.01 | | | $ | 7.22 | | | $ | 5.04 | | | $ | 2.47 | | | $ | 10.05 | | | $ | 25.16 | | | $ | 10.56 | |
| Maximum offering price per share (b) | | $ | 8.41 | | | $ | 7.58 | | | $ | 5.29 | | | $ | 2.59 | | | $ | 10.55 | | | $ | 26.69 | | | $ | 11.21 | |
| | | | | | | | | | | | | | | | | | | | | | | | | | | | | |
| Class C shares | | | | | | | | | | | | | | | | | | | | | | | | | | | | |
| Net Assets | | $ | 2,798,898 | | | $ | 70,976 | | | $ | 1,040 | | | $ | 230,559 | | | | 1,117 | | | $ | 371,273 | | | $ | 1,017 | |
| Shares of beneficial interest outstanding (a) | | | 350,502 | | | | 9,942 | | | | 206 | | | | 102,165 | | | | 111 | | | | 14,874 | | | | 97 | |
| Net asset value, offering price and redemption price per share (c) | | $ | 7.99 | | | $ | 7.14 | | | $ | 5.06 | (d) | | $ | 2.26 | | | $ | 10.03 | (d) | | $ | 24.96 | | | $ | 10.54 | (d) |
| | | | | | | | | | | | | | | | | | | | | | | | | | | | | |
| (a) | Unlimited number of shares of no par value beneficial interest authorized. |
| (b) | There is a maximum front-end sales charge (load) of 4.75% imposed on purchases of Class A shares for each Fund, excluding Rational Dynamic Momentum and Iron Horse Funds which imposes 5.75%. |
| (c) | A contingent deferred sales charge (“CDSC”) of 1.00% may be charged on shares held less than 12 months. |
| (d) | Does not calculate due to rounding. |
See accompanying notes to consolidated financial statements.
| RATIONAL FUNDS |
| Statements of Operations |
| For the Year Ended December 31, 2017 |
| | | Rational | | | Rational Risk | | | Rational | | | Rational | | | Rational | | | Rational | |
| | | Dividend Capture | | | Managed Emerging | | | Hedged Return | | | Dynamic Brands | | | Strategic Allocation | | | Dynamic Momentum | |
| | | Fund | | | Markets Fund | | | Fund | | | Fund | | | Fund | | | Fund | |
| Investment Income: | | | | | | | | | | | | | | | | | | | | | | (Consolidated) | |
| Dividend income | | $ | 2,494,002 | | | | 211,116 | | | $ | 41,572 | | | $ | 274,089 | | | $ | 103 | | | $ | — | |
| Interest income | | | 30,326 | | | | 1,394 | | | | 5,457 | | | | 3,549 | | | | 7,885 | | | | 146,261 | |
| Dividend income - affiliated companies (Note 3) | | | — | | | | — | | | | — | | | | — | | | | 461,610 | | | | — | |
| Foreign tax withheld | | | (3,561 | ) | | | (45,853 | ) | | | — | | | | — | | | | — | | | | — | |
| Total Investment Income | | | 2,520,767 | | | | 166,657 | | | | 47,029 | | | | 277,638 | | | | 469,598 | | | | 146,261 | |
| | | | | | | | | | | | | | | | | | | | | | | | | |
| Operating Expenses: | | | | | | | | | | | | | | | | | | | | | | | | |
| Investment management fees | | | 404,268 | | | | 96,871 | | | | 29,210 | | | | 130,123 | | | | 14,139 | | | | 396,386 | |
| 12b-1 Fees - Class A Shares | | | 70,402 | | | | 11,258 | | | | 1,606 | | | | 35,428 | | | | 34,855 | | | | 281 | |
| 12b-1 Fees - Class C Shares | | | 22,929 | | | | 426 | | | | 13 | | | | 2,844 | | | | 11 | | | | 2,479 | |
| Shareholder Services Fees - Institutional Shares | | | 3,622 | | | | 2,953 | | | | 6,711 | | | | 1,235 | | | | 84 | | | | 2,225 | |
| Shareholder Services Fees - Class A Shares | | | 3,402 | | | | 4,358 | | | | 1,604 | | | | 5,428 | | | | 10,855 | | | | 91 | |
| Administration fees | | | 90,475 | | | | 30,023 | | | | 13,202 | | | | 35,561 | | | | 29,947 | | | | 44,647 | |
| Mfund Services Fees | | | 41,990 | | | | 11,583 | | | | 7,129 | | | | 16,874 | | | | 14,674 | | | | 20,905 | |
| Compliance officer fees | | | 10,463 | | | | 12,069 | | | | 6,976 | | | | 8,554 | | | | 6,877 | | | | 12,794 | |
| Registration fees | | | 65,232 | | | | 40,630 | | | | 32,700 | | | | 46,968 | | | | 8,130 | | | | 24,990 | |
| Audit & Tax fees | | | 10,512 | | | | 21,826 | | | | 13,131 | | | | 11,007 | | | | 10,541 | | | | 13,255 | |
| Custody fees | | | 7,509 | | | | 38,132 | | | | 5,477 | | | | 4,844 | | | | 4,729 | | | | 5,001 | |
| Printing expense | | | 23,508 | | | | 5,528 | | | | 3,511 | | | | 9,034 | | | | 6,169 | | | | 14,897 | |
| Trustees’ fees | | | 7,392 | | | | 10,689 | | | | 14,526 | | | | 7,476 | | | | 7,725 | | | | 7,251 | |
| Legal fees | | | 11,923 | | | | 9,291 | | | | 8,517 | | | | 10,001 | | | | 8,028 | | | | 16,264 | |
| Insurance expense | | | 15,006 | | | | 2,711 | | | | 1,128 | | | | 3,798 | | | | 3,034 | | | | 2,697 | |
| Miscellaneous expense | | | 208 | | | | 3,800 | | | | 169 | | | | 2,011 | | | | 1,417 | | | | 2,011 | |
| Total Operating Expenses | | | 788,841 | | | | 302,148 | | | | 145,610 | | | | 331,186 | | | | 161,215 | | | | 566,174 | |
| Less: Expenses waived/reimbursed by Advisor | | | (161,810 | ) | | | (167,321 | ) | | | (105,599 | ) | | | (120,009 | ) | | | (62,598 | ) | | | (117,608 | ) |
| Net Operating Expenses | | | 627,031 | | | | 134,827 | | | | 40,011 | | | | 211,177 | | | | 98,617 | | | | 448,566 | |
| | | | | | | | | | | | | | | | | | | | | | | | | |
| Net Investment Income (Loss) | | | 1,893,736 | | | | 31,830 | | | | 7,018 | | | | 66,461 | | | | 370,981 | | | | (302,305 | ) |
| | | | | | | | | | | | | | | | | | | | | | | | | |
| Realized and Unrealized Gain (Loss) on Investments: | | | | | | | | | | | | | | | | | | | | | | | | |
| Net realized gain (loss) from: | | | | | | | | | | | | | | | | | | | | | | | | |
| Investments | | | 1,295,462 | | | | 1,108,402 | | | | (574,042 | ) | | | 3,948,403 | | | | (9,017 | ) | | | — | |
| Affiliated companies | | | — | | | | — | | | | — | | | | — | | | | 193,995 | | | | — | |
| Distributions of realized gains by underlying Affiliated investment companies | | | — | | | | — | | | | — | | | | — | | | | 239,126 | | | | — | |
| Options written | | | — | | | | — | | | | 127,290 | | | | — | | | | — | | | | — | |
| Futures | | | (2,486,607 | ) | | | — | | | | — | | | | — | | | | — | | | | 318,947 | |
| Foreign currency transactions | | | — | | | | 72,470 | | | | — | | | | — | | | | — | | | | (4,764 | ) |
| Foreign currency exchange contracts | | | — | | | | (552,007 | ) | | | | | | | | | | | | | | | | |
| Net Realized Gain (Loss) | | | (1,191,145 | ) | | | 628,865 | | | | (446,752 | ) | | | 3,948,403 | | | | 424,104 | | | | 314,183 | |
| | | | | | | | | | | | | | | | | | | | | | | | | |
| Net change in unrealized appreciation (depreciation) on: | | | | | | | | | | | | | | | | | | | | | | | | |
| Investments | | | (1,767,167 | ) | | | 1,938,398 | | | | 510,280 | | | | (1,818,675 | ) | | | 13,486 | | | | — | |
| Affiliated companies | | | — | | | | — | | | | — | | | | — | | | | 742,556 | | | | — | |
| Options purchased | | | — | | | | — | | | | — | | | | — | | | | — | | | | — | |
| Options written | | | — | | | | — | | | | (8,310 | ) | | | — | | | | — | | | | — | |
| Futures | | | — | | | | — | | | | — | | | | — | | | | — | | | | 358,502 | |
| Foreign currency translations | | | — | | | | 137,675 | | | | — | | | | 3,843 | | | | — | | | | (5,124 | ) |
| Net Change in Unrealized Appreciation (Depreciation) | | | (1,767,167 | ) | | | 2,076,073 | | | | 501,970 | | | | (1,814,832 | ) | | | 756,042 | | | | 353,378 | |
| | | | | | | | | | | | | | | | | | | | | | | | | |
| Net Realized and Unrealized Gain (Loss) on Investments | | | (2,958,312 | ) | | | 2,704,938 | | | | 55,218 | | | | 2,133,571 | | | | 1,180,146 | | | | 667,561 | |
| | | | | | | | | | | | | | | | | | | | | | | | | |
| Net Increase (Decrease) in Net Assets Resulting From Operations | | $ | (1,064,576 | ) | | $ | 2,736,768 | | | $ | 62,236 | | | $ | 2,200,032 | | | $ | 1,551,127 | | | $ | 365,256 | |
| | | | | | | | | | | | | | | | | | | | | | | | | |
See accompanying notes to consolidated financial statements.
| Rational Funds |
| Statements of Operations (Continued) |
| For the Periods Ended December 31, 2017 and March 31, 2017 |
| | | Rational Iron Horse Fund | |
| | | For the Period Ended | | | For the Year Ended | |
| | | December 31, 2017 (a) | | | March 31, 2017 | |
| Investment Income: | | | | | | | | |
| Dividends | | $ | 305,440 | | | $ | 309,944 | |
| Interest | | | 12,487 | | | | 2,639 | |
| Total Investment Income | | | 317,927 | | | | 312,583 | |
| | | | | | | | | |
| Operating Expenses: | | | | | | | | |
| Investment management fees | | | 178,880 | | | | 178,516 | |
| 12b-1 Fees - Class A Shares | | | 18,219 | | | | 14,210 | |
| 12b-1 Fees - Class C Shares | | | 7 | | | | | |
| Shareholder Services Fees - Institutional Shares | | | 5,525 | | | | | |
| Shareholder Services Fees - Class A Shares | | | 6,381 | | | | | |
| Administrative fees | | | 38,075 | | | | 49,506 | |
| Mfund Services | | | 13,629 | | | | | |
| Registration fees | | | 16,146 | | | | 45,138 | |
| Transfer agent fees | | | — | | | | 41,886 | |
| Accounting services fees | | | — | | | | 25,845 | |
| Printing expenses | | | 14,021 | | | | 18,638 | |
| Compliance officer fees | | | 11,531 | | | | 17,184 | |
| Legal fees | | | 5,746 | | | | 16,963 | |
| Audit & Tax fees | | | 15,084 | | | | 16,501 | |
| Trustees’ fees | | | 5,425 | | | | 12,057 | |
| Custody fees | | | 7,270 | | | | 11,001 | |
| Miscellaneous expense | | | 1,281 | | | | 8,135 | |
| Total Operating Expenses | | | 337,220 | | | | 455,580 | |
| Fees waived/reimbursed by the Advisor | | | (75,447 | ) | | | (171,089 | ) |
| Fees voluntarily waived by the Advisor | | | — | | | | (28,248 | ) |
| | | | (75,447 | ) | | | (199,337 | ) |
| | | | | | | | | |
| Net Operating Expenses | | | 261,773 | | | | 256,243 | |
| | | | | | | | | |
| Net Investment Income (Loss) | | | 56,154 | | | | 56,340 | |
| | | | | | | | | |
| Realized and Unrealized Gain (Loss) on Investments: | | | | | | | | |
| Net realized gain (loss) on: | | | | | | | | |
| Investments | | | 1,361,310 | | | | 1,279,217 | |
| Options purchased | | | 54,456 | | | | (283,867 | ) |
| Options written | | | (595,924 | ) | | | 161,429 | |
| Net realized gain (Loss) | | | 819,842 | | | | 1,156,779 | |
| | | | | | | | | |
| Net change in unrealized appreciation (depreciation) on: | | | | | | | | |
| Investments | | | 454,132 | | | | (629,068 | ) |
| Options purchased | | | (95,165 | ) | | | 39,763 | |
| Options written | | | (232,636 | ) | | | 162,369 | |
| Net change in unrealized Appreciation (Depreciation) | | | 126,331 | | | | (426,936 | ) |
| | | | | | | | | |
| Net Realized and Unrealized Gain (Loss) on Investments | | | 946,173 | | | | 729,843 | |
| | | | | | | | | |
| Net Increase in Net Assets Resulting From Operations | | $ | 1,002,327 | | | $ | 786,183 | |
| (a) | The Rational Iron Horse Fund changed its fiscal year end from March 31 to December 31. |
See accompanying notes to consolidated financial statements.
| RATIONAL FUNDS |
| Statements of Changes in Net Assets |
| | | Rational Dividend Capture Fund | | | Rational Risk Managed Emerging Markets Fund | | | Rational Hedged Return Fund | |
| | | | | | | | | | | | | | | | | | | |
| | | Year Ended | | | Year Ended | | | Year Ended | | | Year Ended | | | Year Ended | | | Year Ended | |
| | | December 31, 2017 | | | December 31, 2016 | | | December 31, 2017 | | | December 31, 2016 | | | December 31, 2017 | | | December 31, 2016 | |
| Operations: | | | | | | | | | | | | | | | | | | | | | | | | |
| Net investment income (loss) | | $ | 1,893,736 | | | $ | 2,830,356 | | | $ | 31,830 | | | $ | (212,492 | ) | | $ | 7,018 | | | $ | 81,842 | |
| Net realized gain (loss) on investments, futures foreign currency transactions and options | | | (1,191,145 | ) | | | (4,187,141 | ) | | | 628,865 | | | | 968,146 | | | | (446,752 | ) | | | 381,192 | |
| Net change in unrealized appreciation (depreciation) on investments, foreign currency and options | | | (1,767,167 | ) | | | 6,105,694 | | | | 2,076,073 | | | | (1,132,637 | ) | | | 501,970 | | | | 249,880 | |
| Net increase (decrease) in net assets resulting from operations | | | (1,064,576 | ) | | | 4,748,909 | | | | 2,736,768 | | | | (376,983 | ) | | | 62,236 | | | | 712,914 | |
| | | | | | | | | | | | | | | | | | | | | | | | | |
| Distributions to Shareholders from: | | | | | | | | | | | | | | | | | | | | | | | | |
| Net investment income Institutional Class | | | (989,645 | ) | | | (1,497,848 | ) | | | — | | | | — | | | | (288,135 | ) | | | (577,528 | ) |
| Class A | | | (1,285,544 | ) | | | (950,449 | ) | | | — | | | | — | | | | (23,635 | ) | | | (117,123 | ) |
| Class C | | | (121,375 | ) | | | (42,493 | ) | | | — | | | | — | | | | (46 | ) | | | (123 | ) |
| Net realized gains Institutional Class | | | — | | | | (126,654 | ) | | | (269,542 | ) | | | (640,409 | ) | | | — | | | | — | |
| Class A | | | — | | | | (85,917 | ) | | | (227,922 | ) | | | (478,604 | ) | | | — | | | | — | |
| Class C | | | — | | | | (4,420 | ) | | | (3,718 | ) | | | (111 | ) | | | — | | | | — | |
| Return of Capital Institutional Class | | | — | | | | — | | | | | | | | (64,921 | ) | | | — | | | | — | |
| Class A | | | — | | | | — | | | | — | | | | (37,642 | ) | | | — | | | | — | |
| Class C | | | — | | | | — | | | | — | | | | (7 | ) | | | — | | | | — | |
| | | | | | | | | | | | | | | | | | | | | | | | | |
| Total distributions to shareholders | | | (2,396,564 | ) | | | (2,707,781 | ) | | | (501,182 | ) | | | (1,221,694 | ) | | | (311,816 | ) | | | (694,774 | ) |
| | | | | | | | | | | | | | | | | | | | | | | | | |
| Share Transactions of Beneficial Interest: | | | | | | | | | | | | | | | | | | | | | | | | |
| Net proceeds from shares sold Institutional Class | | | 7,772,041 | | | | 6,871,847 | | | | 1,076,031 | | | | 2,792,999 | | | | 3,600,531 | | | | 3,774,656 | |
| Class A | | | 5,502,989 | | | | 3,237,766 | | | | 1,595,908 | | | | 1,774,709 | | | | 37,746 | | | | 193,120 | |
| Class C | | | 2,294,150 | | | | 336,667 | | | | 63,487 | | | | 1,000 | | | | — | | | | 1,000 | |
| Reinvestment of distributions Institutional Class | | | 526,395 | | | | 1,039,675 | | | | 229,011 | | | | 578,407 | | | | 267,858 | | | | 522,301 | |
| Class A | | | 1,093,282 | | | | 892,461 | | | | 209,599 | | | | 470,194 | | | | 22,544 | | | | 97,912 | |
| Class C | | | 79,162 | | | | 33,636 | | | | 617 | | | | 118 | | | | — | | | | 123 | |
| Cost of shares redeemed Institutional Class | | | (42,489,103 | ) | | | (19,180,606 | ) | | | (2,236,917 | ) | | | (2,681,735 | ) | | | (2,968,575 | ) | | | (5,647,237 | ) |
| Class A | | | (16,438,040 | ) | | | (12,403,856 | ) | | | (2,454,431 | ) | | | (1,913,922 | ) | | | (521,604 | ) | | | (259,361 | ) |
| Class C | | | (1,032,458 | ) | | | (1,098,177 | ) | | | — | | | | — | | | | — | | | | — | |
| Net increase (decrease) in net assets from share transactions of beneficial interest | | | (42,691,582 | ) | | | (20,270,587 | ) | | | (1,516,695 | ) | | | 1,021,770 | | | | 438,500 | | | | (1,317,486 | ) |
| | | | | | | | | | | | | | | | | | | | | | | | | |
| Total Increase (Decrease) in Net Assets | | | (46,152,722 | ) | | | (18,229,459 | ) | | | 718,891 | | | | (576,907 | ) | | | 188,920 | | | | (1,299,346 | ) |
| | | | | | | | | | | | | | | | | | | | | | | | | |
| Net Assets: | | | | | | | | | | | | | | | | | | | | | | | | |
| Beginning of year | | | 81,467,249 | | | | 99,696,708 | | | | 9,406,709 | | | | 9,983,616 | | | | 5,712,111 | | | | 7,011,457 | |
| End of year | | $ | 35,314,527 | | | $ | 81,467,249 | | | $ | 10,125,600 | | | $ | 9,406,709 | | | $ | 5,901,031 | | | $ | 5,712,111 | |
| Includes undistributed net investment income (loss) at end of year of: | | $ | 1,556,565 | | | $ | 2,243,417 | | | $ | (10,503 | ) | | $ | (43,405 | ) | | $ | — | | | $ | 61,329 | |
| | | | | | | | | | | | | | | | | | | | | | | | | |
| Share Activity: | | | | | | | | | | | | | | | | | | | | | | | | |
| Institutional Class | | | | | | | | | | | | | | | | | | | | | | | | |
| Shares Sold | | | 916,685 | | | | 793,726 | | | | 152,841 | | | | 418,492 | | | | 701,403 | | | | 727,005 | |
| Shares Reinvested | | | 62,732 | | | | 120,448 | | | | 31,940 | | | | 99,042 | | | | 53,814 | | | | 100,442 | |
| Shares Redeemed | | | (4,964,276 | ) | | | (2,280,057 | ) | | | (341,544 | ) | | | (414,092 | ) | | | (590,442 | ) | | | (1,019,337 | ) |
| Net increase (decrease) in shares of Beneficial interest | | | (3,984,859 | ) | | | (1,365,883 | ) | | | (156,763 | ) | | | 103,442 | | | | 164,775 | | | | (191,890 | ) |
| | | | | | | | | | | | | | | | | | | | | | | | | |
| Class A | | | | | | | | | | | | | | | | | | | | | | | | |
| Shares Sold | | | 638,578 | | | | 373,110 | | | | 227,636 | | | | 272,218 | | | | 7,934 | | | | 35,105 | |
| Shares Reinvested | | | 132,459 | | | | 103,521 | | | | 29,438 | | | | 80,789 | | | | 4,491 | | | | 18,650 | |
| Shares Redeemed | | | (1,971,952 | ) | | | (1,452,892 | ) | | | (359,378 | ) | | | (288,744 | ) | | | (109,905 | ) | | | (47,469 | ) |
| Net increase (decrease) in shares of Beneficial interest | | | (1,200,915 | ) | | | (976,261 | ) | | | (102,304 | ) | | | 64,263 | | | | (97,480 | ) | | | 6,286 | |
| | | | | | | | | | | | | | | | | | | | | | | | | |
| Class C | | | | | | | | | | | | | | | | | | | | | | | | |
| Shares Sold | | | 272,289 | | | | 38,470 | | | | 9,682 | | | | 152 | | | | — | | | | 182 | |
| Shares Reinvested | | | 9,709 | | | | 3,908 | | | | 88 | | | | 20 | | | | — | | | | 24 | |
| Shares Redeemed | | | (123,559 | ) | | | (128,966 | ) | | | — | | | | — | | | | — | | | | — | |
| Net increase (decrease) in shares of Beneficial interest | | | 158,439 | | | | (86,588 | ) | | | 9,770 | | | | 172 | | | | — | | | | 206 | |
| | | | | | | | | | | | | | | | | | | | | | | | | |
See accompanying notes to consolidated financial statements.
| RATIONAL FUNDS |
| Statements of Changes in Net Assets (Continued) |
| | | | | | | | | | | | | | | Rational Dynamic | |
| | | Rational Dynamic Brands Fund | | | Rational Strategic Allocation Fund | | | Momentum Fund | |
| | | | | | | | | | | | | | | (Consolidated) | |
| | | | | | | | | | | | | | | | | | | |
| | | Year Ended | | | Year Ended | | | Year Ended | | | Year Ended | | | Year Ended | | | Period Ended | |
| | | December 31, 2017 | | | December 31, 2016 | | | December 31, 2017 | | | December 31, 2016 | | | December 31, 2017 | | | December 31, 2016 (a) | |
| Operations: | | | | | | | | | | | | | | | | | | | | | | | | |
| Net investment income (loss) | | $ | 66,461 | | | $ | 223,099 | | | $ | 370,981 | | | $ | 292,382 | | | $ | (302,305 | ) | | $ | (66,745 | ) |
| Net realized gain (loss) on investments, affiliated companies foreign currency transactions and futures | | | 3,948,403 | | | | 2,076,026 | | | | 424,104 | | | | (498,680 | ) | | | 314,183 | | | | (203,392 | ) |
| Net change in unrealized appreciation (depreciation) on investments, affiliated companies, foreign currency transactions and futures | | | (1,814,832 | ) | | | (1,461,625 | ) | | | 756,042 | | | | 1,416,439 | | | | 353,378 | | | | (145,184 | ) |
| Net increase (decrease) in net assets resulting from operations | | | 2,200,032 | | | | 837,500 | | | | 1,551,127 | | | | 1,210,141 | | | | 365,256 | | | | (415,321 | ) |
| | | | | | | | | | | | | | | | | | | | | | | | | |
| Distributions to Shareholders: | | | | | | | | | | | | | | | | | | | | | | | | |
| Net investment income Institutional Class | | | (12,183 | ) | | | (39,452 | ) | | | (12,888 | ) | | | (3,057 | ) | | | — | | | | — | |
| Class A | | | (23,935 | ) | | | (173,451 | ) | | | (558,213 | ) | | | (316,957 | ) | | | — | | | | — | |
| Class C | | | — | | | | (1,853 | ) | | | (41 | ) | | | (9 | ) | | | — | | | | — | |
| Net realized gains Institutional Class | | | (672,729 | ) | | | (846,843 | ) | | | — | | | | (19,536 | ) | | | (3,940 | ) | | | — | |
| Class A | | | (3,271,572 | ) | | | (4,627,281 | ) | | | — | | | | (1,379,546 | ) | | | (88 | ) | | | — | |
| Class C | | | (63,118 | ) | | | (127,229 | ) | | | — | | | | (98 | ) | | | (253 | ) | | | — | |
| | | | | | | | | | | | | | | | | | | | | | | | | |
| Total distributions to shareholders | | | (4,043,537 | ) | | | (5,816,109 | ) | | | (571,142 | ) | | | (1,719,203 | ) | | | (4,281 | ) | | | — | |
| | | | | | | | | | | | | | | | | | | | | | | | | |
| Share Transactions of Beneficial Interest: | | | | | | | | | | | | | | | | | | | | | | | | |
| Net proceeds from shares sold Institutional Class | | | 1,582,646 | | | | 783,633 | | | | — | | | | 253,444 | | | | 13,429,916 | | | | 15,498,489 | |
| Class A | | | 1,077,384 | | | | 1,115,072 | | | | 268,744 | | | | 610,909 | | | | 190,591 | | | | 1,000 | |
| Class C | | | 26,885 | | | | 17,563 | | | | — | | | | 1,000 | | | | 366,650 | | | | 21,000 | |
| Reinvestment of distributions Institutional Class | | | 449,117 | | | | 782,223 | | | | — | | | | 22,594 | | | | 3,584 | | | | — | |
| Class A | | | 3,257,155 | | | | 4,733,911 | | | | 537,573 | | | | 1,645,210 | | | | 88 | | | | — | |
| Class C | | | 60,077 | | | | 128,295 | | | | — | | | | 107 | | | | 249 | | | | — | |
| Cost of shares redeemed Institutional Class | | | (1,908,622 | ) | | | (10,655,676 | ) | | | — | | | | — | | | | (22,982,145 | ) | | | — | |
| Class A | | | (6,131,976 | ) | | | (6,668,849 | ) | | | (3,557,145 | ) | | | (4,001,961 | ) | | | (62,720 | ) | | | — | |
| Class C | | | (218,898 | ) | | | (404,413 | ) | | | — | | | | — | | | | (28,487 | ) | | | — | |
| Net increase (decrease) in net assets from share transactions of beneficial interest | | | (1,806,232 | ) | | | (10,168,241 | ) | | | (2,750,828 | ) | | | (1,468,697 | ) | | | (9,082,274 | ) | | | 15,520,489 | |
| | | | | | | | | | | | | | | | | | | | | | | | | |
| Total Increase (Decrease) in Net Assets | | | (3,649,737 | ) | | | (15,146,850 | ) | | | (1,770,843 | ) | | | (1,977,759 | ) | | | (8,721,299 | ) | | | 15,105,168 | |
| | | | | | | | | | | | | | | | | | | | | | | | | |
| Net Assets: | | | | | | | | | | | | | | | | | | | | | | | | |
| Beginning of year/period | | | 20,019,345 | | | | 35,166,195 | | | | 15,083,041 | | | | 17,060,800 | | | | 15,105,168 | | | | — | |
| End of year/period* | | $ | 16,369,608 | | | $ | 20,019,345 | | | $ | 13,312,198 | | | $ | 15,083,041 | | | $ | 6,383,869 | | | $ | 15,105,168 | |
| Includes undistributed net investment income (loss) at end of year/period of: | | $ | 11 | | | $ | 10,749 | | | $ | — | | | $ | 92,280 | | | $ | — | | | $ | (90,792 | ) |
| | | | | | | | | | | | | | | | | | | | | | | | | |
| Share Activity: | | | | | | | | | | | | | | | | | | | | | | | | |
| Institutional Class | | | | | | | | | | | | | | | | | | | | | | | | |
| Shares Sold | | | 381,274 | | | | 167,578 | | | | — | | | | 25,350 | | | | 558,352 | | | | 619,976 | |
| Shares Reinvested | | | 127,954 | | | | 204,236 | | | | — | | | | 2,384 | | | | 144 | | | | — | |
| Shares Redeemed | | | (483,308 | ) | | | (2,331,440 | ) | | | — | | | | — | | | | (945,508 | ) | | | — | |
| | | | | | | | | | | | | | | | | | | | | | | | | |
| Net increase (decrease) in shares of Beneficial interest | | | 25,920 | | | | (1,959,626 | ) | | | — | | | | 27,734 | | | | (387,012 | ) | | | 619,976 | |
| | | | | | | | | | | | | | | | | | | | | | | | | |
| Class A | | | | | | | | | | | | | | | | | | | | | | | | |
| Shares Sold | | | 370,173 | | | | 331,437 | | | | 27,400 | | | | 62,088 | | | | 7,741 | | | | 40 | |
| Shares Reinvested | | | 1,308,094 | | | | 1,615,669 | | | | 53,572 | | | | 172,682 | | | | 4 | | | | — | |
| Shares Redeemed | | | (2,068,271 | ) | | | (1,771,112 | ) | | | (360,962 | ) | | | (402,603 | ) | | | (2,618 | ) | | | — | |
| | | | | | | | | | | | | | | | | | | | | | | | | |
| Net increase (decrease) in shares of Beneficial interest | | | (390,004 | ) | | | 175,994 | | | | (279,990 | ) | | | (167,833 | ) | | | 5,127 | | | | 40 | |
| | | | | | | | | | | | | | | | | | | | | | | | | |
| Class C | | | | | | | | | | | | | | | | | | | | | | | | |
| Shares Sold | | | 9,605 | | | | 4,709 | | | | — | | | | 100 | | | | 15,226 | | | | 856 | |
| Shares Reinvested | | | 26,465 | | | | 46,653 | | | | — | | | | 11 | | | | 10 | | | | — | |
| Shares Redeemed | | | (79,109 | ) | | | (113,756 | ) | | | — | | | | — | | | | (1,218 | ) | | | — | |
| | | | | | | | | | | | | | | | | | | | | | | | | |
| Net increase (decrease) in shares of Beneficial interest | | | (43,039 | ) | | | (62,394 | ) | | | — | | | | 111 | | | | 14,018 | | | | 856 | |
| | | | | | | | | | | | | | | | | | | | | | | | | |
| (a) | The Rational Dynamic Momentum Fund commenced operations on September 30, 2016. |
See accompanying notes to consolidated financial statements.
| RATIONAL FUNDS |
| Statements of Changes in Net Assets (Continued) |
| | | Rational Iron Horse Fund | |
| | | | | | | | | | |
| | | Period Ended | | | Year Ended | | | Year Ended | |
| | | December 31, 2017 | | | March 31, 2017 | | | March 31, 2016 | |
| Operations: | | | | | | | | | |
| Net investment income | | $ | 56,154 | | | $ | 56,340 | | | $ | 156,630 | |
| Net realized gain (loss) on investments and options | | | 819,842 | | | | 1,156,779 | | | | (1,245,415 | ) |
| Net change in unrealized appreciation (depreciation) on investments and options | | | 126,331 | | | | (426,936 | ) | | | 1,025,992 | |
| Net increase (decrease) in net assets resulting from operations | | | 1,002,327 | | | | 786,183 | | | | (62,793 | ) |
| | | | | | | | | | | | | |
| Distributions to Shareholders: | | | | | | | | | | | | |
| Net investment income Institutional Class | | | (36,807 | ) | | | (24,918 | ) | | | (705,230 | ) |
| Class A | | | (13,428 | ) | | | (22,982 | ) | | | (284,752 | ) |
| Net realized gains Institutional Class | | | — | | | | (18,085 | ) | | | (132,732 | ) |
| Class A | | | — | | | | (4,175 | ) | | | (40,314 | ) |
| Class C | | | — | | | | — | | | | — | |
| From return of capital: | | | | | | | | | | | | |
| Institutional Class | | | (336,601 | ) | | | (105,653 | ) | | | — | |
| Class A | | | (280,475 | ) | | | (97,445 | ) | | | — | |
| Class C | | | (32 | ) | | | — | | | | — | |
| | | | | | | | | | | | | |
| Total distributions to shareholders | | | (667,343 | ) | | | (273,258 | ) | | | (1,163,028 | ) |
| | | | | | | | | | | | | |
| Share Transactions of Beneficial Interest: | | | | | | | | | | | | |
| Net proceeds from shares sold Institutional Class | | | 4,935,940 | | | | 3,171,859 | | | | 4,920,676 | |
| Class A | | | 8,662,420 | | | | 1,028,585 | | | | 1,377,025 | |
| Class C (a) | | | 1,000 | | | | — | | | | | |
| Reinvestment of distributions Institutional Class | | | 344,052 | | | | 145,704 | | | | 792,606 | |
| Class A | | | 294,399 | | | | 122,367 | | | | 317,470 | |
| Cost of shares redeemed Institutional Class | | | (3,111,465 | ) | | | (4,481,169 | ) | | | (23,520,458 | ) |
| Class A | | | (6,107,098 | ) | | | (5,688,374 | ) | | | (5,560,568 | ) |
| Net increase (decrease) in net assets from share transactions of beneficial interest | | | 5,019,248 | | | | (5,701,028 | ) | | | (21,673,249 | ) |
| | | | | | | | | | | | | |
| Total Increase (Decrease) in Net Assets | | | 5,354,232 | | | | (5,188,103 | ) | | | (22,899,070 | ) |
| | | | | | | | | | | | | |
| Net Assets: | | | | | | | | | | | | |
| Beginning of year/period | | | 12,327,029 | | | | 17,515,132 | | | | 40,414,202 | |
| End of year/period* | | $ | 17,681,261 | | | $ | 12,327,029 | | | $ | 17,515,132 | |
| Includes undistributed net investment income (loss) at end of year/period of: | | $ | 2,488 | | | $ | 480 | | | $ | 15,766 | |
| | | | | | | | | | | | | |
| Share Activity: | | | | | | | | | | | | |
| Institutional Class | | | | | | | | | | | | |
| Shares Sold | | | 466,405 | | | | 313,182 | | | | 490,528 | |
| Shares Reinvested | | | 32,642 | | | | 14,601 | | | | 80,378 | |
| Shares Redeemed | | | (295,816 | ) | | | (442,582 | ) | | | (2,393,014 | ) |
| Net increase (decrease) in shares of Beneficial interest | | | 203,231 | | | | (114,799 | ) | | | (1,822,108 | ) |
| | | | | | | | | | | | | |
| Class A | | | | | | | | | | | | |
| Shares Sold | | | 832,098 | | | | 101,646 | | | | 137,045 | |
| Shares Reinvested | | | 27,975 | | | | 12,274 | | | | 32,125 | |
| Shares Redeemed | | | (579,845 | ) | | | (565,216 | ) | | | (554,710 | ) |
| Net increase (decrease) in shares of Beneficial interest | | | 280,228 | | | | (451,296 | ) | | | (385,540 | ) |
| | | | | | | | | | | | | |
| Class C (a) | | | | | | | | | | | | |
| Shares Sold | | | 97 | | | | — | | | | — | |
| Shares Reinvested | | | — | | | | — | | | | — | |
| Shares Redeemed | | | — | | | | — | | | | — | |
| Net increase in shares of Beneficial interest | | | 97 | | | | — | | | | — | |
| (a) | Class C launched April 7, 2017 |
See accompanying notes to consolidated financial statements.
| RATIONAL FUNDS |
| Rational Dividend Capture Fund |
| Financial Highlights |
For a Share Outstanding Throughout Each Period
| | | Institutional Class | |
| | | For the | | | For the | | | For the | | | For the | | | For the | |
| | | Year Ended | | | Year Ended | | | Year Ended | | | Year Ended | | | Year Ended | |
| | | December 31, | | | December 31, | | | December 31, | | | December 31, | | | December 31, | |
| | | 2017 | | | 2016 | | | 2015 | | | 2014 | | | 2013 | |
| | | | | | | | | | | | | | | | |
| Net asset value, beginning of period | | $ | 8.64 | | | $ | 8.41 | | | $ | 10.01 | | | $ | 10.74 | | | $ | 9.49 | |
| | | | | | | | | | | | | | | | | | | | | |
| INCOME (LOSS) FROM INVESTMENT OPERATIONS: | | | | | | | | | | | | | | | | | | | | |
| Net investment income | | | 0.30 | (A) | | | 0.29 | (A) | | | 0.36 | | | | 0.39 | | | | 0.36 | |
| Net realized and unrealized gain (loss) on investments | | | (0.47 | ) | | | 0.22 | | | | (0.67 | ) | | | 0.64 | | | | 1.60 | |
| Total from investment operations | | | (0.17 | ) | | | 0.51 | | | | (0.31 | ) | | | 1.03 | | | | 1.96 | |
| | | | | | | | | | | | | | | | | | | | | |
| LESS DISTRIBUTIONS: | | | | | | | | | | | | | | | | | | | | |
| From net investment income | | | (0.45 | ) | | | (0.26 | ) | | | (0.35 | ) | | | (0.41 | ) | | | (0.32 | ) |
| From net realized gains on investments | | | — | | | | (0.02 | ) | | | (0.94 | ) | | | (1.35 | ) | | | (0.39 | ) |
| Total distributions | | | (0.45 | ) | | | (0.28 | ) | | | (1.29 | ) | | | (1.76 | ) | | | (0.71 | ) |
| | | | | | | | | | | | | | | | | | | | | |
| Net asset value, end of period | | $ | 8.02 | | | $ | 8.64 | | | $ | 8.41 | | | $ | 10.01 | | | $ | 10.74 | |
| | | | | | | | | | | | | | | | | | | | | |
| Total return (B) | | | (1.99 | )% | | | 6.15 | % | | | (3.25 | )% | | | 9.59 | % | | | 21.14 | % |
| | | | | | | | | | | | | | | | | | | | | |
| RATIOS/SUPPLEMENTAL DATA: | | | | | | | | | | | | | | | | | | | | |
| Net assets, end of period (in 000’s) | | $ | 12,188 | | | $ | 47,544 | | | $ | 57,752 | | | $ | 132,177 | | | $ | 278,917 | |
| Ratios to average net assets | | | | | | | | | | | | | | | | | | | | |
| Expenses, before waiver and reimbursement | | | 1.33 | % | | | 1.42 | % | | | 1.47 | % | | | 1.38 | % | | | 1.33 | % |
| Expenses, net waiver and reimbursement | | | 1.00 | % | | | 1.00 | % | | | 0.89 | % | | | 0.88 | % | | | 0.89 | % |
| Net investment income | | | 3.53 | % | | | 3.37 | % | | | 3.37 | % | | | 3.22 | % | | | 3.59 | % |
| Portfolio turnover rate | | | 224 | % | | | 159 | % | | | 92 | % | | | 92 | % | | | 130 | % |
| | | | | | | | | | | | | | | | | | | | | |
| | | | | | | | | | | | | | | | | | | | | |
| | | Class A | |
| | | For the | | | For the | | | For the | | | For the | | | For the | |
| | | Year Ended | | | Year Ended | | | Year Ended | | | Year Ended | | | Year Ended | |
| | | December 31, | | | December 31, | | | December 31, | | | December 31, | | | December 31, | |
| | | 2017 | | | 2016 | | | 2015 | | | 2014 | | | 2013 | |
| | | | | | | | | | | | | | | | |
| Net asset value, beginning of period | | $ | 8.63 | | | $ | 8.40 | | | $ | 10.01 | | | $ | 10.73 | | | $ | 9.49 | |
| | | | | | | | | | | | | | | | | | | | | |
| INCOME (LOSS) FROM INVESTMENT OPERATIONS: | | | | | | | | | | | | | | | | | | | | |
| Net investment income | | | 0.30 | (A) | | | 0.27 | (A) | | | 0.31 | | | | 0.34 | | | | 0.34 | |
| Net realized and unrealized gain (loss) on investments | | | (0.49 | ) | | | 0.22 | | | | (0.66 | ) | | | 0.67 | | | | 1.59 | |
| Total from investment operations | | | (0.19 | ) | | | 0.49 | | | | (0.35 | ) | | | 1.01 | | | | 1.93 | |
| | | | | | | | | | | | | | | | | | | | | |
| LESS DISTRIBUTIONS: | | | | | | | | | | | | | | | | | | | | |
| From net investment income | | | (0.43 | ) | | | (0.24 | ) | | | (0.32 | ) | | | (0.38 | ) | | | (0.30 | ) |
| From net realized gains on investments | | | — | | | | (0.02 | ) | | | (0.94 | ) | | | (1.35 | ) | | | (0.39 | ) |
| Total distributions | | | (0.43 | ) | | | (0.26 | ) | | | (1.26 | ) | | | (1.73 | ) | | | (0.69 | ) |
| | | | | | | | | | | | | | | | | | | | | |
| Net asset value, end of period | | $ | 8.01 | | | $ | 8.63 | | | $ | 8.40 | | | $ | 10.01 | | | $ | 10.73 | |
| | | | | | | | | | | | | | | | | | | | | |
| Total return (B) | | | (2.24 | )% | | | 5.89 | % | | | (3.60 | )% | | | 9.45 | % | | | 20.74 | % |
| | | | | | | | | | | | | | | | | | | | | |
| RATIOS/SUPPLEMENTAL DATA: | | | | | | | | | | | | | | | | | | | | |
| Net assets, end of period (in 000’s) | | $ | 20,327 | | | $ | 32,269 | | | $ | 39,610 | | | $ | 66,445 | | | $ | 71,258 | |
| Ratios to average net assets | | | | | | | | | | | | | | | | | | | | |
| Expenses, before waiver and reimbursement | | | 1.57 | % | | | 1.67 | % | | | 1.72 | % | | | 1.63 | % | | | 1.58 | % |
| Expenses, net waiver and reimbursement | | | 1.25 | % | | | 1.25 | % | | | 1.14 | % | | | 1.13 | % | | | 1.14 | % |
| Net investment income | | | 3.52 | % | | | 3.12 | % | | | 3.14 | % | | | 3.01 | % | | | 3.32 | % |
| Portfolio turnover rate | | | 224 | % | | | 159 | % | | | 92 | % | | | 92 | % | | | 130 | % |
| (A) | Per share amounts calculated using average shares method, which more appropriately presents the per share data for the period. |
| (B) | Total return in the above table represents the rate that the investor would have earned or lost on an investment in the Fund assuming reinvestment of dividends and does not reflect the impact of sales charges. Had the not waived its fees and reimbursed expenses, total return would have been lower. |
See accompanying notes to consolidated financial statements.
| RATIONAL FUNDS |
| Rational Dividend Capture Fund (Continued) |
| Financial Highlights |
For a Share Outstanding Throughout Each Period
| | | Class C | |
| | | For the | | | For the | | | For the | | | For the | |
| | | Year Ended | | | Year Ended | | | Year Ended | | | Period Ended | |
| | | December 31, | | | December 31, | | | December 31, | | | December 31, | |
| | | 2017 | | | 2016 | | | 2015 | | | 2014 (A) | |
| | | | | | | | | | | | | |
| Net asset value, beginning of period | | $ | 8.61 | | | $ | 8.38 | | | $ | 9.99 | | | $ | 10.67 | |
| | | | | | | | | | | | | | | | | |
| INCOME (LOSS) FROM INVESTMENT OPERATIONS: | | | | | | | | | | | | | | | | |
| Net investment income | | | 0.29 | (B) | | | 0.22 | (B) | | | 0.27 | | | | 0.32 | |
| Net realized and unrealized gain (loss) on investments | | | (0.52 | ) | | | 0.22 | | | | (0.66 | ) | | | 0.70 | |
| Total from investment operations | | | (0.23 | ) | | | 0.44 | | | | (0.39 | ) | | | 1.02 | |
| | | | | | | | | | | | | | | | | |
| LESS DISTRIBUTIONS: | | | | | | | | | | | | | | | | |
| From net investment income | | | (0.39 | ) | | | (0.19 | ) | | | (0.28 | ) | | | (0.35 | ) |
| From net realized gains on investments | | | — | | | | (0.02 | ) | | | (0.94 | ) | | | (1.35 | ) |
| Total distributions | | | (0.39 | ) | | | (0.21 | ) | | | (1.22 | ) | | | (1.70 | ) |
| | | | | | | | | | | | | | | | | |
| Net asset value, end of period | | $ | 7.99 | | | $ | 8.61 | | | $ | 8.38 | | | $ | 9.99 | |
| | | | | | | | | | | | | | | | | |
| Total return (C) | | | (2.68 | )% | | | 5.34 | % | | | (4.08 | )% | | | 9.54 | % (D) |
| | | | | | | | | | | | | | | | | |
| RATIOS/SUPPLEMENTAL DATA: | | | | | | | | | | | | | | | | |
| Net assets, end of period (in 000’s) | | $ | 2,799 | | | $ | 1,654 | | | $ | 2,335 | | | $ | 4,154 | |
| Ratios to average net assets | | | | | | | | | | | | | | | | |
| Expenses, before waiver and reimbursement | | | 2.31 | % | | | 2.17 | % | | | 2.22 | % | | | 2.16 | % (E) |
| Expenses, net waiver and reimbursement | | | 1.75 | % | | | 1.75 | % | | | 1.64 | % | | | 1.63 | % (E) |
| Net investment income | | | 3.50 | % | | | 2.61 | % | | | 2.64 | % | | | 2.69 | % (E) |
| Portfolio turnover rate | | | 224 | % | | | 159 | % | | | 92 | % | | | 92 | % (D) |
| (A) | The Rational Dividend Capture Fund Class C shares commenced operations on January 3, 2014. |
| (B) | Per share amounts calculated using average shares method, which more appropriately presents the per share data for the period. |
| (C) | Total return in the above table represents the rate that the investor would have earned or lost on an investment in the Fund assuming reinvestment of dividends. Had the Advisor not waived its fees and reimbursed expenses, total return would have been lower. |
See accompanying notes to consolidated financial statements.
| RATIONAL FUNDS |
| Rational Risk Managed Emerging Markets Fund |
| Financial Highlights |
For a Share Outstanding Throughout Each Period
| | | Institutional Class | |
| | | For the | | | For the | | | For the | | | For the | | | For the | |
| | | Year Ended | | | Year Ended | | | Year Ended | | | Year Ended | | | Year Ended | |
| | | December 31, | | | December 31, | | | December 31, | | | December 31, | | | December 31, | |
| | | 2017 | | | 2016 | | | 2015 | | | 2014 | | | 2013 | |
| | | | | | | | | | | | | | | | |
| Net asset value, beginning of period | | $ | 5.72 | | | $ | 6.76 | | | $ | 9.38 | | | $ | 10.74 | | | $ | 10.33 | |
| | | | | | | | | | | | | | | | | | | | | |
| INCOME (LOSS) FROM INVESTMENT OPERATIONS: | | | | | | | | | | | | | | | | | | | | |
| Net investment income (loss) | | | 0.03 | (A) | | | (0.14 | ) (A) | | | 0.03 | | | | (0.03 | ) | | | 0.04 | |
| Net realized and unrealized gain (loss) on investments | | | 1.90 | | | | (0.10 | ) | | | (0.15 | ) | | | 0.16 | | | | 0.58 | |
| Total from investment operations | | | 1.93 | | | | (0.24 | ) | | | (0.12 | ) | | | 0.13 | | | | 0.62 | |
| | | | | | | | | | | | | | | | | | | | | |
| LESS DISTRIBUTIONS: | | | | | | | | | | | | | | | | | | | | |
| From net investment income | | | — | | | | — | | | | (0.33 | ) | | | — | | | | (0.21 | ) |
| From net realized gains on investments | | | (0.38 | ) | | | (0.73 | ) | | | (2.17 | ) | | | (1.49 | ) | | | — | |
| From paid in capital | | | — | | | | (0.07 | ) | | | — | | | | — | | | | — | |
| Total distributions | | | (0.38 | ) | | | (0.80 | ) | | | (2.50 | ) | | | (1.49 | ) | | | (0.21 | ) |
| | | | | | | | | | | | | | | | | | | | | |
| Net asset value, end of period | | $ | 7.27 | | | $ | 5.72 | | | $ | 6.76 | | | $ | 9.38 | | | $ | 10.74 | |
| | | | | | | | | | | | | | | | | | | | | |
| Total return (B) | | | 33.79 | % | | | (3.66 | )% | | | (0.60 | )% | | | 1.31 | % | | | 6.08 | % |
| | | | | | | | | | | | | | | | | | | | | |
| RATIOS/SUPPLEMENTAL DATA: | | | | | | | | | | | | | | | | | | | | |
| Net assets, end of period (in 000’s) | | $ | 5,506 | | | $ | 5,232 | | | $ | 5,483 | | | $ | 20,578 | | | $ | 27,015 | |
| Ratios to average net assets | | | | | | | | | | | | | | | | | | | | |
| Expenses, before waiver and reimbursement (C) | | | 2.98 | % | | | 3.10 | % | | | 2.52 | % | | | 2.22 | % | | | 2.01 | % |
| Expenses, net waiver and reimbursement (C) | | | 1.25 | % | | | 1.25 | % | | | 0.90 | % | | | 1.63 | % | | | 1.87 | % |
| Net investment income (loss) (C,D) | | | 0.48 | % | | | (2.07 | )% | | | 0.32 | % | | | (0.29 | )% | | | 0.40 | % |
| Portfolio turnover rate | | | 99 | % | | | 361 | % | | | 86 | % | | | 88 | % | | | 156 | % |
| | | | | | | | | | | | | | | | | | | | | |
| | | | | | | | | | | | | | | | | | | | | |
| | | Class A | |
| | | For the | | | For the | | | For the | | | For the | | | For the | |
| | | Year Ended | | | Year Ended | | | Year Ended | | | Year Ended | | | Year Ended | |
| | | December 31, | | | December 31, | | | December 31, | | | December 31, | | | December 31, | |
| | | 2017 | | | 2016 | | | 2015 | | | 2014 | | | 2013 | |
| | | | | | | | | | | | | | | | |
| Net asset value, beginning of period | | $ | 5.70 | | | $ | 6.73 | | | $ | 9.35 | | | $ | 10.73 | | | $ | 10.32 | |
| | | | | | | | | | | | | | | | | | | | | |
| INCOME (LOSS) FROM INVESTMENT OPERATIONS: | | | | | | | | | | | | | | | | | | | | |
| Net investment income (loss) | | | 0.01 | (A) | | | (0.14 | ) (A) | | | 0.02 | | | | (0.02 | ) | | | 0.01 | |
| Net realized and unrealized gain (loss) on investments | | | 1.89 | | | | (0.10 | ) | | | (0.17 | ) | | | 0.13 | | | | 0.59 | |
| Total from investment operations | | | 1.90 | | | | (0.24 | ) | | | (0.15 | ) | | | 0.11 | | | | 0.60 | |
| | | | | | | | | | | | | | | | | | | | | |
| LESS DISTRIBUTIONS: | | | | | | | | | | | | | | | | | | | | |
| From net investment income | | | — | | | | — | | | | (0.30 | ) | | | — | | | | (0.19 | ) |
| From net realized gains on investments | | | (0.38 | ) | | | (0.73 | ) | | | (2.17 | ) | | | (1.49 | ) | | | — | |
| From paid in capital | | | — | | | | (0.06 | ) | | | — | | | | — | | | | — | |
| Total distributions | | | (0.38 | ) | | | (0.79 | ) | | | (2.47 | ) | | | (1.49 | ) | | | (0.19 | ) |
| | | | | | | | | | | | | | | | | | | | | |
| Net asset value, end of period | | $ | 7.22 | | | $ | 5.70 | | | $ | 6.73 | | | $ | 9.35 | | | $ | 10.73 | |
| | | | | | | | | | | | | | | | | | | | | |
| Total return (B) | | | 33.38 | % | | | (3.77 | )% | | | (0.91 | )% | | | 1.13 | % | | | 5.87 | % |
| | | | | | | | | | | | | | | | | | | | | |
| RATIOS/SUPPLEMENTAL DATA: | | | | | | | | | | | | | | | | | | | | |
| Net assets, end of period (in 000’s) | | $ | 4,549 | | | $ | 4,174 | | | $ | 4,501 | | | $ | 6,774 | | | $ | 429 | |
| Ratios to average net assets | | | | | | | | | | | | | | | | | | | | |
| Expenses, before waiver and reimbursement (C) | | | 3.27 | % | | | 3.35 | % | | | 2.77 | % | | | 2.47 | % | | | 2.26 | % |
| Expenses, net waiver and reimbursement (C) | | | 1.50 | % | | | 1.50 | % | | | 1.15 | % | | | 1.88 | % | | | 2.12 | % |
| Net investment income (loss) (C,D) | | | 0.20 | % | | | (2.15 | )% | | | 0.19 | % | | | (0.15 | )% | | | 0.06 | % |
| Portfolio turnover rate | | | 99 | % | | | 361 | % | | | 86 | % | | | 88 | % | | | 156 | % |
| (A) | Per share amounts calculated using average shares method, which more appropriately presents the per share data for the period. |
| (B) | Total return in the above table represents the rate that the investor would have earned or lost on an investment in the Fund assuming reinvestment of dividends and does not reflect the impact of sales charges. Had the Advisor not waived its fees and reimbursed expenses, total return would have been lower. |
| (C) | Does not include expenses of the underlying investment companies in which the Fund invests. |
| (D) | Recognition of net investment income (loss) is affected by the timing and declaration of dividends by the underlying investment companies in which the Fund invests. |
See accompanying notes to consolidated financial statements.
| RATIONAL FUNDS |
| Rational Risk Managed Emerging Markets Fund (Continued) |
| Financial Highlights |
For a Share Outstanding Throughout Each Period
| | | Class C (A) | |
| | | For the | | | For the | |
| | | Year Ended | | | Period Ended | |
| | | December 31, | | | December 31, | |
| | | 2017 | | | 2016 | |
| | | | | | | |
| Net asset value, beginning of period | | $ | 5.68 | | | $ | 6.60 | |
| | | | | | | | | |
| INCOME FROM INVESTMENT OPERATIONS: | | | | | | | | |
| Net investment income (loss) (B) | | | (0.05 | ) | | | (0.15 | ) |
| Net realized and unrealized gain on investments | | | 1.89 | | | | 0.01 | (H) |
| Total from investment operations | | | 1.84 | | | | (0.14 | ) |
| | | | | | | | | |
| LESS DISTRIBUTIONS: | | | | | | | | |
| From net investment income | | | — | | | | — | |
| From net realized gains on investments | | | (0.38 | ) | | | (0.73 | ) |
| From paid in capital | | | — | | | | (0.05 | ) |
| Total distributions | | | (0.38 | ) | | | (0.78 | ) |
| | | | | | | | | |
| Net asset value, end of period | | $ | 7.14 | | | $ | 5.68 | |
| | | | | | | | | |
| Total return (C) | | | 32.43 | % | | | (2.36 | )% (D) |
| | | | | | | | | |
| RATIOS/SUPPLEMENTAL DATA: | | | | | | | | |
| Net assets, end of period (in 000’s) | | $ | 71 | | | $ | 1 | |
| Ratios to average net assets | | | | | | | | |
| Expenses, before waiver and reimbursement (F) | | | 3.92 | % | | | 4.10 | % (E) |
| Expenses, net waiver and reimbursement (F) | | | 2.25 | % | | | 2.25 | % (E) |
| Net investment income (loss) (F,G) | | | (0.79 | )% | | | (3.72 | )% (E) |
| Portfolio turnover rate | | | 99 | % | | | 361 | % (D) |
| (A) | The Rational Risk Managed Emerging Markets Fund Class C Shares commenced operations on May 31, 2016 |
| (B) | Per share amounts calculated using average shares method, which more appropriately presents the per share data for the period. |
| (C) | Total return in the above table represents the rate that the investor would have earned or lost on an investment in the Fund assuming reinvestment of dividends. Had the Advisor not waived its fees and reimbursed expenses, total return would have been lower. |
| (F) | Does not include expenses of the underlying investment companies in which the Fund invests. |
| (G) | Recognition of net investment income is affected by the timing and declaration of dividends by the underlying investment companies in which the Fund invests. |
| (H) | As required by SEC standard per share data calculation methodology, this represents a balancing figure derived from the other amounts in the financial highlights tables that captures all other changes affecting net asset value per share. This per share gain amount does not correlate to the aggregate of the net realized and unrealized loss in the Statement of Operations for the period ended December 31, 2016, primarily due to the timing of sales and repurchases of the Fund’s shares in relation to fluctuating market values of the Fund’s portfolio. |
See accompanying notes to consolidated financial statements.
| RATIONAL FUNDS |
| Rational Hedged Return Fund (Formerly, Rational Real Strategies Fund) |
| Financial Highlights |
For a Share Outstanding Throughout Each Period
| | | Institutional Class | |
| | | For the | | | For the | | | For the | | | For the | | | For the | |
| | | Year Ended | | | Year Ended | | | Year Ended | | | Year Ended | | | Year Ended | |
| | | December 31, | | | December 31, | | | December 31, | | | December 31, | | | December 31, | |
| | | 2017 | | | 2016 | | | 2015 | | | 2014 | | | 2013 | |
| | | | | | | | | | | | | | | | |
| Net asset value, beginning of period | | $ | 5.12 | | | $ | 5.39 | | | $ | 6.73 | | | $ | 8.05 | | | $ | 7.42 | |
| | | | | | | | | | | | | | | | | | | | | |
| INCOME (LOSS) FROM INVESTMENT OPERATIONS: | | | | | | | | | | | | | | | | | | | | |
| Net investment income | | | 0.01 | (A) | | | 0.06 | (A) | | | 0.19 | | | | 0.13 | | | | 0.15 | |
| Net realized and unrealized gain (loss) on investments | | | 0.14 | | | | 0.37 | | | | (1.32 | ) | | | (1.35 | ) | | | 0.55 | |
| Total from investment operations | | | 0.15 | | | | 0.43 | | | | (1.13 | ) | | | (1.22 | ) | | | 0.70 | |
| | | | | | | | | | | | | | | | | | | | | |
| LESS DISTRIBUTIONS: | | | | | | | | | | | | | | | | | | | | |
| From net investment income | | | (0.28 | ) | | | (0.70 | ) | | | (0.26 | ) | | | (0.10 | ) | | | (0.07 | ) |
| Total distributions | | | (0.28 | ) | | | (0.70 | ) | | | (0.26 | ) | | | (0.10 | ) | | | (0.07 | ) |
| | | | | | | | | | | | | | | | | | | | | |
| From capital contributions from Advisor | | | — | | | | — | | | | 0.05 | | | | — | | | | — | |
| | | | | | | | | | | | | | | | | | | | | |
| Net asset value, end of period | | $ | 4.99 | | | $ | 5.12 | | | $ | 5.39 | | | $ | 6.73 | | | $ | 8.05 | |
| | | | | | | | | | | | | | | | | | | | | |
| Total return (B) | | | 2.89 | % (D) | | | 7.82 | % (D) | | | (16.05 | )% (C) | | | (15.03 | )% | | | 9.49 | % |
| | | | | | | | | | | | | | | | | | | | | |
| RATIOS/SUPPLEMENTAL DATA: | | | | | | | | | | | | | | | | | | | | |
| Net assets, end of period (in 000’s) | | $ | 5,451 | | | $ | 4,747 | | | $ | 6,032 | | | $ | 29,453 | | | $ | 89,571 | |
| Ratios to average net assets | | | | | | | | | | | | | | | | | | | | |
| Expenses, before wavier and reimbursement | | | 4.29 | % | | | 2.61 | % | | | 2.49 | % | | | 1.52 | % | | | 1.36 | % |
| Expenses, net waiver and reimbursement | | | 1.17 | % | | | 1.00 | % | | | 1.07 | % | | | 1.04 | % | | | 1.34 | % |
| Net investment income | | | 0.22 | % | | | 1.07 | % | | | 2.99 | % | | | 1.53 | % | | | 1.93 | % |
| Portfolio turnover rate | | | 199 | % | | | 246 | % | | | 13 | % | | | 31 | | | | 43 | |
| | | | | | | | | | | | | | | | | | | | | |
| | | | | | | | | | | | | | | | | | | | | |
| | | Class A | |
| | | For the | | | For the | | | For the | | | For the | | | For the | |
| | | Year Ended | | | Year Ended | | | Year Ended | | | Year Ended | | | Year Ended | |
| | | December 31, | | | December 31, | | | December 31, | | | December 31, | | | December 31, | |
| | | 2017 | | | 2016 | | | 2015 | | | 2014 | | | 2013 | |
| | | | | | | | | | | | | | | | |
| Net asset value, beginning of period | | $ | 5.16 | | | $ | 5.43 | | | $ | 6.73 | | | $ | 8.05 | | | $ | 7.43 | |
| | | | | | | | | | | | | | | | | | | | | |
| INCOME (LOSS) FROM INVESTMENT OPERATIONS: | | | | | | | | | | | | | | | | | | | | |
| Net investment income | | | 0.01 | (A) | | | 0.05 | (A) | | | 0.19 | | | | 0.10 | | | | 0.13 | |
| Net realized and unrealized gain (loss) on investments | | | 0.14 | | | | 0.37 | | | | (1.30 | ) | | | (1.33 | ) | | | 0.54 | |
| Total from investment operations | | | 0.15 | | | | 0.42 | | | | (1.11 | ) | | | (1.23 | ) | | | 0.67 | |
| | | | | | | | | | | | | | | | | | | | | |
| LESS DISTRIBUTIONS: | | | | | | | | | | | | | | | | | | | | |
| From net investment income | | | (0.27 | ) | | | (0.69 | ) | | | (0.24 | ) | | | (0.09 | ) | | | (0.05 | ) |
| Total distributions | | | (0.27 | ) | | | (0.69 | ) | | | (0.24 | ) | | | (0.09 | ) | | | (0.05 | ) |
| | | | | | | | | | | | | | | | | | | | | |
| From capital contributions from Advisor | | | — | | | | — | | | | 0.05 | | | | — | | | | — | |
| | | | | | | | | | | | | | | | | | | | | |
| Net asset value, end of period | | $ | 5.04 | | | $ | 5.16 | | | $ | 5.43 | | | $ | 6.73 | | | $ | 8.05 | |
| | | | | | | | | | | | | | | | | | | | | |
| Total return (B) | | | 2.98 | % (D) | | | 7.48 | % (D) | | | (15.75 | )% (C) | | | (15.23 | )% | | | 9.09 | % |
| | | | | | | | | | | | | | | | | | | | | |
| RATIOS/SUPPLEMENTAL DATA: | | | | | | | | | | | | | | | | | | | | |
| Net assets, end of period (in 000’s) | | $ | 449 | | | $ | 964 | | | $ | 979 | | | $ | 1,656 | | | $ | 2,366 | |
| Ratios to average net assets | | | | | | | | | | | | | | | | | | | | |
| Expenses, before wavier and reimbursement | | | 4.54 | % | | | 2.86 | % | | | 2.74 | % | | | 1.77 | % | | | 1.61 | % |
| Expenses, net waiver and reimbursement | | | 1.35 | % | | | 1.25 | % | | | 1.32 | % | | | 1.29 | % | | | 1.59 | % |
| Net investment income | | | 0.19 | % | | | 0.92 | % | | | 3.10 | % | | | 1.21 | % | | | 1.68 | % |
| Portfolio turnover rate | | | 199 | % | | | 246 | % | | | 13 | % | | | 31 | % | | | 43 | % |
| (A) | Per share amounts calculated using average shares method, which more appropriately presents the per share data for the period. |
| (B) | Total return in the above table represents the rate that the investor would have earned or lost on an investment in the Fund assuming reinvestment of dividends and does not reflect the impact of sales charges. Had the Advisor not waived its fees and reimbursed expenses, total return would have been lower. |
| (C) | Includes the impact of a contribution from the Advisor. Without such contribution, the returns would have been (16.98)% for Institutional Shares and (16.68)% for Class A Shares. |
| (D) | Includes adjustments in accordance with accounting principles generally accepted in the United States and, consequently, the net asset value for financial reporting purposes and the returns based upon those net asset values may differ from the net asset values and returns for shareholder transactions. |
See accompanying notes to consolidated financial statements.
| RATIONAL FUNDS |
| Rational Hedged Return Fund (Formerly, Rational Real Strategies Fund) (Continued) |
| Financial Highlights |
For a Share Outstanding Throughout Each Period
| | | Class C (A) | |
| | | For the | | | For the | |
| | | Year Ended | | | Period Ended | |
| | | December 31, | | | December 31, | |
| | | 2017 | | | 2016 | |
| | | | | | | |
| Net asset value, beginning of period | | $ | 5.16 | | | $ | 5.49 | |
| | | | | | | | | |
| LOSS FROM INVESTMENT OPERATIONS: | | | | | | | | |
| Net investment income (B) Class I | | | (0.03 | ) (F) | | | 0.00 | (F) |
| Net realized and unrealized gain on investments | | | 0.15 | | | | 0.35 | |
| Total from investment operations | | | 0.12 | | | | 0.35 | |
| | | | | | | | | |
| LESS DISTRIBUTIONS: | | | | | | | | |
| From net investment income | | | (0.22 | ) | | | (0.68 | ) |
| Total distributions | | | (0.22 | ) | | | (0.68 | ) |
| | | | | | | | | |
| Net asset value, end of period | | $ | 5.06 | | | $ | 5.16 | |
| | | | | | | | | |
| Total return (C) | | | 2.42 | % (G) | | | 6.13 | % (D,G) |
| | | | | | | | | |
| RATIOS/SUPPLEMENTAL DATA: | | | | | | | | |
| Net assets, end of period (in 000’s) | | $ | 1 | | | $ | 1 | |
| Ratios to average net assets | | | | | | | | |
| Expenses, before waiver and reimbursement | | | 5.29 | % | | | 3.61 | % (E) |
| Expenses, net waiver and reimbursement | | | 2.17 | % | | | 2.00 | % (E) |
| Net investment Income, Class I | | | (0.53 | )% | | | (0.14 | )% (E) |
| Portfolio turnover rate | | | 199 | % | | | 246 | % (D) |
| (A) | The Rational Hedged Return Fund Class C shares commenced operations on May 31, 2016. |
| (B) | Per share amounts calculated using average shares method, which more appropriately presents the per share data for the period. |
| (C) | Total return in the above table represents the rate that the investor would have earned or lost on an investment in the Fund assuming reinvestment of dividends. Had the Advisor not waived its fees and reimbursed expenses, total return would have been lower. |
| (F) | Amount is less than $0.005. |
| (G) | Includes adjustments in accordance with accounting principles generally accepted in the United States and, consequently, the net asset value for financial reporting purposes and the returns based upon those net asset values may differ from the net asset values and returns for shareholder transactions. |
See accompanying notes to consolidated financial statements.
| RATIONAL FUNDS |
| Rational Dynamic Brands Fund (Formerly, Rational Defensive Growth Fund) |
| Financial Highlights |
For a Share Outstanding Throughout Each Period
| | | Institutional Class | |
| | | For the | | | For the | | | For the | | | For the | | | For the | |
| | | Year Ended | | | Year Ended | | | Year Ended | | | Year Ended | | | Year Ended | |
| | | December 31, | | | December 31, | | | December 31, | | | December 31, | | | December 31, | |
| | | 2017 | | | 2016 | | | 2015 | | | 2014 | | | 2013 | |
| | | | | | | | | | | | | | | | |
| Net asset value, beginning of period | | $ | 3.78 | | | $ | 4.69 | | | $ | 20.75 | | | $ | 28.75 | | | $ | 23.44 | |
| | | | | | | | | | | | | | | | | | | | | |
| INCOME (LOSS) FROM INVESTMENT OPERATIONS: | | | | | | | | | | | | | | | | | | | | |
| Net investment income (loss) | | | 0.02 | (A) | | | 0.05 | (A) | | | 0.09 | | | | 0.09 | | | | (0.01 | ) |
| Net realized and unrealized gain (loss) on investments | | | 0.54 | | | | 0.31 | | | | (0.81 | ) | | | (0.58 | ) | | | 6.60 | |
| Total from investment operations | | | 0.56 | | | | 0.36 | | | | (0.72 | ) | | | (0.49 | ) | | | 6.59 | |
| | | | | | | | | | | | | | | | | | | | | |
| LESS DISTRIBUTIONS: | | | | | | | | | | | | | | | | | | | | |
| From net investment income | | | (0.02 | ) | | | (0.06 | ) | | | (0.08 | ) | | | (0.02 | ) | | | (0.01 | ) |
| From net realized gains on investments | | | (0.83 | ) | | | (1.21 | ) | | | (15.26 | ) | | | (7.49 | ) | | | (1.27 | ) |
| Total distributions | | | (0.85 | ) | | | (1.27 | ) | | | (15.34 | ) | | | (7.51 | ) | | | (1.28 | ) |
| | | | | | | | | | | | | | | | | | | | | |
| Net asset value, end of period | | $ | 3.49 | | | $ | 3.78 | | | $ | 4.69 | | | $ | 20.75 | | | $ | 28.75 | |
| | | | | | | | | | | | | | | | | | | | | |
| Total return (B) | | | 14.66 | % | | | 7.21 | % | | | (7.82 | )% | | | (1.41 | )% | | | 28.38 | % |
| | | | | | | | | | | | | | | | | | | | | |
| RATIOS/SUPPLEMENTAL DATA: | | | | | | | | | | | | | | | | | | | | |
| Net assets, end of period (in 000’s) | | $ | 3,269 | | | $ | 3,445 | | | $ | 13,456 | | | $ | 152,846 | | | $ | 339,983 | |
| Ratios to average net assets | | | | | | | | | | | | | | | | | | | | |
| Expenses, before waiver and reimbursement | | | 1.69 | % | | | 1.76 | % | | | 1.56 | % | | | 1.37 | % | | | 1.33 | % |
| Expenses, net waiver and reimbursement | | | 1.00 | % | | | 1.00 | % | | | 1.06 | % | | | 1.03 | % | | | 1.30 | % |
| Net investment income | | | 0.60 | % | | | 1.17 | % | | | 0.46 | % | | | 0.23 | % | | | 0.05 | % |
| Portfolio turnover rate | | | 305 | % | | | 178 | % | | | 35 | % | | | 12 | % | | | 22 | % |
| | | | | | | | | | | | | | | | | | | | | |
| | | | | | | | | | | | | | | | | | | | | |
| | | Class A | |
| | | | | | For the | | | For the | | | For the | | | For the | |
| | | Year Ended | | | Year Ended | | | Year Ended | | | Year Ended | | | Year Ended | |
| | | December 31, | | | December 31, | | | December 31, | | | December 31, | | | December 31, | |
| | | 2017 | | | 2016 | | | 2015 | | | 2014 | | | 2013 | |
| | | (Unaudited) | | | | | | | | | | | | | |
| Net asset value, beginning of period | | $ | 2.89 | | | $ | 3.86 | | | $ | 19.89 | | | $ | 27.92 | | | $ | 22.84 | |
| | | | | | | | | | | | | | | | | | | | | |
| INCOME (LOSS) FROM INVESTMENT OPERATIONS: | | | | | | | | | | | | | | | | | | | | |
| Net investment income (loss) | | | 0.01 | (A) | | | 0.03 | (A) | | | 0.07 | | | | 0.01 | | | | (0.07 | ) |
| Net realized and unrealized gain (loss) on investments | | | 0.41 | | | | 0.26 | | | | (0.77 | ) | | | (0.55 | ) | | | 6.42 | |
| Total from investment operations | | | 0.42 | | | | 0.29 | | | | (0.70 | ) | | | (0.54 | ) | | | 6.35 | |
| | | | | | | | | | | | | | | | | | | | | |
| LESS DISTRIBUTIONS: | | | | | | | | | | | | | | | | | | | | |
| From net investment income | | | (0.01 | ) | | | (0.05 | ) | | | (0.07 | ) | | | — | | | | — | |
| From net realized gains on investments | | | (0.83 | ) | | | (1.21 | ) | | | (15.26 | ) | | | (7.49 | ) | | | (1.27 | ) |
| Total distributions | | | (0.84 | ) | | | (1.26 | ) | | | (15.33 | ) | | | (7.49 | ) | | | (1.27 | ) |
| | | | | | | | | | | | | | | | | | | | | |
| Net asset value, end of period | | $ | 2.47 | | | $ | 2.89 | | | $ | 3.86 | | | $ | 19.89 | | | $ | 27.92 | |
| | | | | | | | | | | | | | | | | | | | | |
| Total return (B) | | | 14.30 | % | | | 6.91 | % | | | (8.21 | )% | | | (1.62 | )% | | | 28.09 | % |
| | | | | | | | | | | | | | | | | | | | | |
| RATIOS/SUPPLEMENTAL DATA: | | | | | | | | | | | | | | | | | | | | |
| Net assets, end of period (in 000’s) | | $ | 12,870 | | | $ | 16,180 | | | $ | 20,944 | | | $ | 44,589 | | | $ | 74,132 | |
| Ratios to average net assets | | | | | | | | | | | | | | | | | | | | |
| Expenses, before waiver and reimbursement | | | 1.94 | % | | | 2.01 | % | | | 1.81 | % | | | 1.62 | % | | | 1.58 | % |
| Expenses, net waiver and reimbursement | | | 1.25 | % | | | 1.25 | % | | | 1.31 | % | | | 1.28 | % | | | 1.55 | % |
| Net investment income | | | 0.35 | % | | | 0.86 | % | | | 0.52 | % | | | 0.01 | % | | | (0.27 | )% |
| Portfolio turnover rate | | | 305 | % | | | 178 | % | | | 35 | % | | | 12 | % | | | 22 | % |
| (A) | Per share amounts calculated using average shares method, which more appropriately presents the per share data for the period. |
| (B) | Total return in the above table represents the rate that the investor would have earned or lost on an investment in the Fund assuming reinvestment of dividends and does not reflect the impact of sales charges. |
See accompanying notes to consolidated financial statements.
| RATIONAL FUNDS |
| Rational Dynamic Brands Fund (Formerly, Rational Defensive Growth Fund) (Continued) |
| Financial Highlights |
For a Share Outstanding Throughout Each Period
| | | Class C (A) | |
| | | For the | | | For the | | | For the | | | For the | |
| | | Year Ended | | | Year Ended | | | Year Ended | | | Period Ended | |
| | | December 31, | | | December 31, | | | December 31, | | | December 31, | |
| | | 2017 | | | 2016 | | | 2015 | | | 2014 | |
| | | | | | | | | | | | | |
| Net asset value, beginning of period | | $ | 2.71 | | | $ | 3.69 | | | $ | 19.75 | | | $ | 27.60 | |
| INCOME (LOSS) FROM INVESTMENT OPERATIONS: | | | | | | | | | | | | | | | | |
| Net investment income (loss) | | | (0.00 | ) (B,F) | | | 0.01 | (B) | | | 0.00 | (F) | | | (0.07 | ) |
| Net realized and unrealized gain (loss) on investments | | | 0.38 | | | | 0.24 | | | | (0.76 | ) | | | (0.29 | ) |
| Total from investment operations | | | 0.38 | | | | 0.25 | | | | (0.76 | ) | | | (0.36 | ) |
| | | | | | | | | | | | | | | | | |
| LESS DISTRIBUTIONS: | | | | | | | | | | | | | | | | |
| From net investment income | | | — | | | | (0.02 | ) | | | (0.04 | ) | | | — | |
| From net realized gains on investments | | | (0.83 | ) | | | (1.21 | ) | | | (15.26 | ) | | | (7.49 | ) |
| Total distributions | | | (0.83 | ) | | | (1.23 | ) | | | (15.30 | ) | | | (7.49 | ) |
| | | | | | | | | | | | | | | | | |
| Net asset value, end of period | | $ | 2.26 | | | $ | 2.71 | | | $ | 3.69 | | | $ | 19.75 | |
| | | | | | | | | | | | | | | | | |
| Total return (C) | | | 14.03 | % | | | 6.19 | % | | | (8.56 | )% | | | (1.00 | )% (D) |
| | | | | | | | | | | | | | | | | |
| RATIOS/SUPPLEMENTAL DATA: | | | | | | | | | | | | | | | | |
| Net assets, end of period (in 000’s) | | $ | 231 | | | $ | 394 | | | $ | 766 | | | $ | 1,545 | |
| Ratios to average net assets | | | | | | | | | | | | | | | | |
| Expenses, before waiver and reimbursement | | | 2.65 | % | | | 2.51 | % | | | 2.31 | % | | | 2.15 | % (E) |
| Expenses, net waiver and reimbursement | | | 1.75 | % | | | 1.75 | % | | | 1.81 | % | | | 1.79 | % (E) |
| Net investment income (loss) | | | (0.14 | )% | | | 0.28 | % | | | 0.04 | % | | | (0.54 | )% (E) |
| Portfolio turnover rate | | | 305 | % | | | 178 | % | | | 35 | % | | | 12 | % (D) |
| (A) | The Rational Dynamic Brands Fund Class C shares commenced operations on January 3, 2014. |
| (B) | Per share amounts calculated using average shares method, which more appropriately presents the per share data for the period. |
| (C) | Total return in the above table represents the rate that the investor would have earned or lost on an investment in the Fund assuming reinvestment of dividends and does not reflect the impact of sales charges. |
| (F) | Amount is less than $0.005. |
See accompanying notes to consolidated financial statements.
| RATIONAL FUNDS |
| Rational Strategic Allocation Fund |
| Financial Highlights |
For a Share Outstanding Throughout Each Period
| | | Institutional Class (A) | |
| | | For the | | | For the | | | | | | | | | | | | | |
| | | Year Ended | | | Period Ended | | | | | | | | | | | | | |
| | | December 31, | | | December 31, | | | | | | | | | | | | | |
| | | 2017 | | | 2016 | | | | | | | | | | | | | |
| | | | | | | | | | | | | | | | | | | |
| Net asset value, beginning of period | | $ | 9.37 | | | $ | 9.99 | | | | | | | | | | | | | |
| | | | | | | | | | | | | | | | | | | | | |
| INCOME (LOSS) FROM INVESTMENT OPERATIONS: | | | | | | | | | | | | | | | | | | | | |
| Net investment income (B) | | | 0.33 | | | | 0.43 | | | | | | | | | | | | | |
| Net realized and unrealized gain on investments | | | 0.78 | | | | 0.09 | (H) | | | | | | | | | | | | |
| Total from investment operations | | | 1.11 | | | | 0.52 | | | | | | | | | | | | | |
| | | | | | | | | | | | | | | | | | | | | |
| LESS DISTRIBUTIONS: | | | | | | | | | | | | | | | | | | | | |
| From net investment income | | | (0.46 | ) | | | (0.17 | ) | | | | | | | | | | | | |
| From net realized gains on investments | | | — | | | | (0.97 | ) | | | | | | | | | | | | |
| Total distributions | | | (0.46 | ) | | | (1.14 | ) | | | | | | | | | | | | |
| | | | | | | | | | | | | | | | | | | | | |
| Net asset value, end of period | | $ | 10.02 | | | $ | 9.37 | | | | | | | | | | | | | |
| | | | | | | | | | | | | | | | | | | | | |
| Total return (C) | | | 11.95 | % | | | 5.11 | % (D) | | | | | | | | | | | | |
| | | | | | | | | | | | | | | | | | | | | |
| RATIOS/SUPPLEMENTAL DATA: | | | | | | | | | | | | | | | | | | | | |
| Net assets, end of period (in 000’s) | | $ | 278 | | | $ | 260 | | | | | | | | | | | | | |
| Ratios to average net assets | | | | | | | | | | | | | | | | | | | | |
| Expenses, before waiver and reimbursement (F) | | | 0.85 | % | | | 1.36 | % (E) | | | | | | | | | | | | |
| Expenses, net waiver and reimbursement (F) | | | 0.45 | % | | | 0.45 | % (E) | | | | | | | | | | | | |
| Net investment income (F,G) | | | 3.35 | % | | | 6.98 | % (E) | | | | | | | | | | | | |
| Portfolio turnover rate | | | 17 | % | | | 27 | % (D) | | | | | | | | | | | | |
| | | | | | | | | | | | | | | | | | | | | |
| | | | | | | | | | | | | | | | | | | | | |
| | | Class A | |
| | | For the | | | For the | | | For the | | | For the | | | For the | |
| | | Year Ended | | | Year Ended | | | Year Ended | | | Year Ended | | | Year Ended | |
| | | December 31, | | | December 31, | | | December 31, | | | December 31, | | | December 31, | |
| | | 2017 | | | 2016 | | | 2015 | | | 2014 | | | 2013 | |
| | | | | | | | | | | | | | | | |
| Net asset value, beginning of period | | $ | 9.40 | | | $ | 9.78 | | | $ | 11.36 | | | $ | 11.77 | | | $ | 10.99 | |
| | | | | | | | | | | | | | | | | | | | | |
| INCOME (LOSS) FROM INVESTMENT OPERATIONS: | | | | | | | | | | | | | | | | | | | | |
| Net investment income | | | 0.26 | (B) | | | 0.18 | (B) | | | 0.14 | | | | 0.17 | | | | 0.09 | |
| Net realized and unrealized gain (loss) on investments | | | 0.83 | | | | 0.62 | | | | (0.34 | ) | | | 0.07 | | | | 1.34 | |
| Total from investment operations | | | 1.09 | | | | 0.80 | | | | (0.20 | ) | | | 0.24 | | | | 1.43 | |
| | | | | | | | | | | | | | | | | | | | | |
| LESS DISTRIBUTIONS: | | | | | | | | | | | | | | | | | | | | |
| From net investment income | | | (0.44 | ) | | | (0.21 | ) | | | (0.12 | ) | | | (0.24 | ) | | | (0.24 | ) |
| From net realized gains on investments | | | — | | | | (0.97 | ) | | | (1.26 | ) | | | (0.41 | ) | | | (0.41 | ) |
| Total distributions | | | (0.44 | ) | | | (1.18 | ) | | | (1.38 | ) | | | (0.65 | ) | | | (0.65 | ) |
| | | | | | | | | | | | | | | | | | | | | |
| Net asset value, end of period | | $ | 10.05 | | | $ | 9.40 | | | $ | 9.78 | | | $ | 11.36 | | | $ | 11.77 | |
| | | | | | | | | | | | | | | | | | | | | |
| Total return (C) | | | 11.61 | % | | | 8.16 | % | | | (1.87 | )% | | | 2.05 | % | | | 13.14 | % |
| | | | | | | | | | | | | | | | | | | | | |
| RATIOS/SUPPLEMENTAL DATA: | | | | | | | | | | | | | | | | | | | | |
| Net assets, end of period (in 000’s) | | $ | 13,033 | | | $ | 14,822 | | | $ | 17,061 | | | $ | 21,008 | | | $ | 21,065 | |
| Ratios to average net assets | | | | | | | | | | | | | | | | | | | | |
| Expenses, before waiver and reimbursement (F) | | | 1.14 | % | | | 1.30 | % | | | 1.04 | % | | | 0.96 | % | | | 0.93 | % |
| Expenses, net waiver and reimbursement (F) | | | 0.70 | % | | | 0.70 | % | | | 0.70 | % | | | 0.73 | % | | | 0.74 | % |
| Net Investment income (F,G) | | | 2.60 | % | | | 1.82 | % | | | 1.10 | % | | | 1.38 | % | | | 0.72 | % |
| Portfolio turnover rate | | | 17 | % | | | 27 | % | | | 44 | % | | | 52 | % | | | 44 | % |
| (A) | The Rational Strategic Allocation Fund Institutional Class shares commenced operations on May 31, 2016. |
| (B) | Per share amounts calculated using average shares method, which more appropriately presents the per share data for the period. |
| (C) | Total return in the above table represents the rate that the investor would have earned or lost on an investment in the Fund assuming reinvestment of dividends and does not reflect the impact of sales charges. Had the Advisor not waived its fees and reimbursed expenses, total return would have been lower. |
| (F) | The ratios of expenses to average net assets and net investment income (loss) to average net assets do not reflect the expenses of the underlying investment companies in which the Fund invests. |
| (G) | Recognition of net investment income (loss) is affected by the timing and declaration of dividends by the underlying investment companies in which the Fund invests. |
| (H) | As required by SEC standard per share data calculation methodology, this represents a balancing figure derived from the other amounts in the financial highlights tables that captures all other changes affecting net asset value per share. This per share gain amount does not correlate to the aggregate of the net realized and unrealized loss in the Statement of Operations for the period ended December 31, 2016, primarily due to the timing of sales and repurchases of the Fund’s shares in relation to fluctuating market values of the Fund’s portfolio. |
See accompanying notes to consolidated financial statements.
| RATIONAL FUNDS |
| Rational Strategic Allocation Fund (Continued) |
| Financial Highlights |
For a Share Outstanding Throughout Each Period
| | | Class C (A) | |
| | | For the | | | For the | |
| | | Year Ended | | | Period Ended | |
| | | December 31, | | | December 31, | |
| | | 2017 | | | 2016 | |
| | | | | | | |
| Net asset value, beginning of period | | $ | 9.39 | | | $ | 9.99 | |
| | | | | | | | | |
| INCOME (LOSS) FROM INVESTMENT OPERATIONS: | | | | | | | | |
| Net investment income (B) | | | 0.23 | | | | 0.24 | |
| Net realized and unrealized gain on investments | | | 0.78 | | | | 0.22 | (H) |
| Total from investment operations | | | 1.01 | | | | 0.46 | |
| | | | | | | | | |
| LESS DISTRIBUTIONS: | | | | | | | | |
| From net investment income | | | (0.37 | ) | | | (0.09 | ) |
| From net realized gains on investments | | | — | | | | (0.97 | ) |
| Total distributions | | | (0.37 | ) | | | (1.06 | ) |
| | | | | | | | | |
| Net asset value, end of period | | $ | 10.03 | | | $ | 9.39 | |
| | | | | | | | | |
| Total return (C) | | | 10.80 | % | | | 4.56 | % (D) |
| | | | | | | | | |
| RATIOS/SUPPLEMENTAL DATA: | | | | | | | | |
| Net assets, end of period (in 000’s) | | $ | 1 | | | $ | 1 | |
| Ratios to average net assets (including interest expense) | | | | | | | | |
| Expenses, before waiver and reimbursement (F) | | | 1.82 | % | | | 1.89 | % (E) |
| Expenses, net waiver and reimbursement (F) | | | 1.45 | % | | | 1.45 | % (E) |
| Net investment income (F,G) | | | 2.31 | % | | | 3.92 | % (E) |
| Portfolio turnover rate | | | 17 | % | | | 27 | % (D) |
| (A) | The Rational Strategic Allocation Fund Class C shares commenced operations on May 31, 2016. |
| (B) | Per share amounts calculated using average shares method, which more appropriately presents the per share data for the period. |
| (C) | Total return in the above table represents the rate that the investor would have earned or lost on an investment in the Fund assuming reinvestment of dividends and does not reflect the impact of sales charges. Had the Advisor not waived its fees and reimbursed expenses, total return would have been lower. |
| (F) | The ratios of expenses to average net assets and net investment income (loss) to average net assets do not reflect the expenses of the underlying investment companies in which the Fund invests. |
| (G) | Recognition of net investment income (loss) is affected by the timing and declaration of dividends by the underlying investment companies in which the Fund invests. |
| (H) | As required by SEC standard per share data calculation methodology, this represents a balancing figure derived from the other amounts in the financial highlights tables that captures all other changes affecting net asset value per share. This per share gain amount does not correlate to the aggregate of the net realized and unrealized loss in the Statement of Operations for the period ended December 31, 2016, primarily due to the timing of sales and repurchases of the Fund’s shares in relation to fluctuating market values of the Fund’s portfolio. |
See accompanying notes to consolidated financial statements.
| RATIONAL FUNDS |
| Rational Dynamic Momentum Fund |
| Financial Highlights (Consolidated) |
For a Share Outstanding Throughout Each Period
| | | Institutional Class (A) | |
| | | For the | | | For the | |
| | | Year Ended | | | Period Ended | |
| | | December 31, | | | December 31, | |
| | | 2017 | | | 2016 | |
| | | | | | | |
| Net asset value, beginning of period | | $ | 24.33 | | | $ | 25.00 | |
| | | | | | | | | |
| INCOME (LOSS) FROM INVESTMENT OPERATIONS: | | | | | | | | |
| Net investment (loss) (B) | | | (0.32 | ) | | | (0.12 | ) |
| Net realized and unrealized (loss) on investments | | | 1.26 | | | | (0.55 | ) |
| Total from investment operations | | | 0.94 | | | | (0.67 | ) |
| | | | | | | | | |
| LESS DISTRIBUTIONS: | | | | | | | | |
| From net realized gains on investments | | | (0.02 | ) | | | — | |
| Total distributions | | | (0.02 | ) | | | — | |
| | | | | | | | | |
| Net asset value, end of period | | $ | 25.25 | | | $ | 24.33 | |
| | | | | | | | | |
| Total return (C,D) | | | 3.85 | % | | | (2.68 | )% (D) |
| | | | | | | | | |
| RATIOS/SUPPLEMENTAL DATA: | | | | | | | | |
| Net assets, end of period (in 000’s) | | $ | 5,883 | | | $ | 15,083 | |
| Ratios to average net assets | | | | | | | | |
| Expenses, before waiver and reimbursement | | | 2.49 | % | | | 3.27 | % (E) |
| Expenses, net waiver and reimbursement | | | 1.97 | % | | | 1.99 | % (E) |
| Net investment (loss) | | | (1.33 | )% | | | (1.74 | )% (E) |
| Portfolio turnover rate | | | 0 | % | | | 0 | % (D) |
| | | | | | | | | |
| | | | | | | | | |
| | | Class A (A) | |
| | | For the | | | For the | |
| | | Year Ended | | | Period Ended | |
| | | December 31, | | | December 31, | |
| | | 2017 | | | 2016 | |
| | | | | | | |
| Net asset value, beginning of period | | $ | 24.30 | | | $ | 25.00 | |
| | | | | | | | | |
| INCOME (LOSS) FROM INVESTMENT OPERATIONS: | | | | | | | | |
| Net investment (loss) (B) | | | (0.21 | ) | | | (0.13 | ) |
| Net realized and unrealized (loss) on investments | | | 1.09 | | | | (0.57 | ) |
| Total from investment operations | | | 0.88 | | | | (0.70 | ) |
| | | | | | | | | |
| LESS DISTRIBUTIONS: | | | | | | | | |
| From net realized gains on investments | | | (0.02 | ) | | | — | |
| Total distributions | | | (0.02 | ) | | | — | |
| | | | | | | | | |
| Net asset value, end of period | | $ | 25.16 | | | $ | 24.30 | |
| | | | | | | | | |
| Total return (C) | | | 3.57 | % | | | (2.80 | )% (D) |
| | | | | | | | | |
| RATIOS/SUPPLEMENTAL DATA: | | | | | | | | |
| Net assets, end of period (in 000’s) | | $ | 130 | | | $ | 1 | |
| Ratios to average net assets | | | | | | | | |
| Expenses, before waiver and reimbursement | | | 2.90 | % | | | 3.52 | % (E) |
| Expenses, net waiver and reimbursement | | | 2.22 | % | | | 2.24 | % (E) |
| Net investment (loss) | | | (0.88 | )% | | | (2.09 | )% (E) |
| Portfolio turnover rate | | | 0 | % | | | 0 | % (D) |
| (A) | The Rational Dynamic Momentum Fund Institutional Class and Class A shares commenced operations on September 30, 2016. |
| (B) | Per share amounts calculated using average shares method, which more appropriately presents the per share data for the period. |
| (C) | Total return in the above table represents the rate that the investor would have earned or lost on an investment in the Fund assuming reinvestment of dividends and does not reflect the impact of sales charges. Had the Advisor not waived its fees and reimbursed expenses, total return would have been lower. |
See accompanying notes to consolidated financial statements.
| RATIONAL FUNDS |
| Rational Dynamic Momentum Fund (Continued) |
| Financial Highlights (Consolidated) |
For a Share Outstanding Throughout Each Period
| | | Class C (A) | |
| | | For the | | | For the | |
| | | Year Ended | | | Period Ended | |
| | | December 31, | | | December 31, | |
| | | 2017 | | | 2016 | |
| | | | | | | |
| Net asset value, beginning of period | | $ | 24.29 | | | $ | 25.00 | |
| | | | | | | | | |
| INCOME (LOSS) FROM INVESTMENT OPERATIONS: | | | | | | | | |
| Net investment (loss) (B) | | | (0.54 | ) | | | (0.17 | ) |
| Net realized and unrealized (loss) on investments | | | 1.23 | | | | (0.54 | ) |
| Total from investment operations | | | 0.69 | | | | (0.71 | ) |
| | | | | | | | | |
| LESS DISTRIBUTIONS: | | | | | | | | |
| From net realized gains on investments | | | (0.02 | ) | | | — | |
| Total distributions | | | (0.02 | ) | | | — | |
| | | | | | | | | |
| Net asset value, end of period | | $ | 24.96 | | | $ | 24.29 | |
| | | | | | | | | |
| Total return (C) | | | 2.83 | % | | | (2.84 | )% (D) |
| | | | | | | | | |
| RATIOS/SUPPLEMENTAL DATA: | | | | | | | | |
| Net assets, end of period (in 000’s) | | $ | 371 | | | $ | 21 | |
| Ratios to average net assets | | | | | | | | |
| Expenses, before waiver and reimbursement | | | 3.60 | % | | | 4.27 | % (E) |
| Expenses, net waiver and reimbursement | | | 2.97 | % | | | 2.99 | % (E) |
| Net investment (loss) | | | (2.26 | )% | | | (2.69 | )% (E) |
| Portfolio turnover rate | | | 0 | % | | | 0 | % (D) |
| (A) | The Rational Dynamic Momentum Fund Class C shares commenced operations on September 30, 2016. |
| (B) | Per share amounts calculated using average shares method, which more appropriately presents the per share data for the period. |
| (C) | Total return in the above table represents the rate that the investor would have earned or lost on an investment in the Fund assuming reinvestment of dividends and does not reflect the impact of sales charges. Had the Advisor not waived its fees and reimbursed expenses, total return would have been lower. |
See accompanying notes to consolidated financial statements.
| RATIONAL FUNDS |
| Rational Iron Horse Fund |
| Financial Highlights |
For a Share Outstanding Throughout Each Period
| | | Institutional Class | |
| | | For the | | | | | | | | | | | | | | | | |
| | | Period Ended | | | For the | | | For the | | | For the | | | For the | | | For the | |
| | | December 31, | | | Year Ended | | | Year Ended | | | Year Ended | | | Year Ended | | | Year Ended | |
| | | 2017 | | | March 31, 2017 | | | March 31, 2016 | | | March 31, 2015 | | | March 31, 2014 | | | March 31, 2013 | |
| | | | | | | | | | | | | | | | | | | |
| Net asset value, beginning of period | | $ | 10.37 | | | $ | 9.98 | | | $ | 10.19 | | | $ | 11.35 | | | $ | 10.58 | | | $ | 10.21 | |
| | | | | | | | | | | | | | | | | | | | | | | | | |
| INCOME (LOSS) FROM INVESTMENT OPERATIONS: | | | | | | | | | | | | | | | | | | | | | | | | |
| Net investment income (A) | | | 0.04 | | | | 0.05 | | | | 0.06 | | | | 0.09 | | | | 0.10 | | | | 0.14 | |
| Net realized and unrealized gain (loss) on investments | | | 0.54 | | | | 0.51 | | | | 0.05 | | | | 0.44 | | | | 0.94 | | | | 0.67 | |
| Total from investment operations | | | 0.58 | | | | 0.56 | | | | 0.11 | | | | 0.53 | | | | 1.04 | | | | 0.81 | |
| | | | | | | | | | | | | | | | | | | | | | | | | |
| LESS DISTRIBUTIONS: | | | | | | | | | | | | | | | | | | | | | | | | |
| From net investment income | | | (0.04 | ) | | | (0.02 | ) | | | (0.05 | ) | | | (0.08 | ) | | | (0.11 | ) | | | (0.15 | ) |
| From net realized gains on investments | | | — | | | | (0.03 | ) | | | (0.27 | ) | | | (1.61 | ) | | | (0.16 | ) | | | (0.29 | ) |
| From Return of capital | | | (0.33 | ) | | | (0.12 | ) | | | — | | | | — | | | | — | | | | — | |
| Total distributions | | | (0.37 | ) | | | (0.17 | ) | | | (0.32 | ) | | | (1.69 | ) | | | (0.27 | ) | | | (0.44 | ) |
| | | | | | | | | | | | | | | | | | | | | | | | | |
| Net asset value, end of period | | $ | 10.58 | | | $ | 10.37 | | | $ | 9.98 | | | $ | 10.19 | | | $ | 11.35 | | | $ | 10.58 | |
| | | | | | | | | | | | | | | | | | | | | | | | | |
| Total return (B) | | | 5.69 | % | | | 5.70 | % | | | 1.24 | % | | | 4.78 | % | | | 9.91 | % | | | 8.17 | % |
| | | | | | | | | | | | | | | | | | | | | | | | | |
| RATIOS/SUPPLEMENTAL DATA: | | | | | | | | | | | | | | | | | | | | | | | | |
| Net assets, end of period (in 000’s) | | $ | 10,913 | | | $ | 8,595 | | | $ | 9,417 | | | $ | 28,191 | | | $ | 19,062 | | | $ | 10,825 | |
| Ratios to average net assets | | | | | | | | | | | | | | | | | | | | | | | | |
| Expenses, before waiver and reimbursement | | | 2.30 | % | | | 3.15 | % | | | 1.50 | % | | | 1.32 | % | | | 1.60 | % | | | 2.26 | % |
| Expenses, net waiver and reimbursement | | | 1.70 | % | | | 1.70 | % | | | 1.56 | % | | | 1.60 | % | | | 1.60 | % | | | 1.70 | % |
| Net investment income | | | 0.54 | % | | | 0.51 | % | | | 0.63 | % | | | 0.73 | % | | | 0.93 | % | | | 1.37 | % |
| Portfolio turnover rate | | | 252 | % | | | 323 | % | | | 279 | % | | | 265 | % | | | 114 | % | | | 77 | % |
| | | | | | | | | | | | | | | | | | | | | | | | | |
| | | | | | | | | | | | | | | | | | | | | | | | | |
| | | Class A | |
| | | For the | | | | | | | | | | | | | | | | |
| | | Period Ended | | | For the | | | For the | | | For the | | | For the | | | For the | |
| | | December 31, | | | Year Ended | | | Year Ended | | | Year Ended | | | Year Ended | | | Year Ended | |
| | | 2017 | | | March 31, 2017 | | | March 31, 2016 | | | March 31, 2015 | | | March 31, 2014 | | | March 31, 2013 | |
| | | | | | | | | | | | | | | | | | | |
| Net asset value, beginning of period | | $ | 10.36 | | | $ | 9.98 | | | $ | 10.21 | | | $ | 11.37 | | | $ | 10.60 | | | $ | 10.22 | |
| | | | | | | | | | | | | | | | | | | | | | | | | |
| INCOME (LOSS) FROM INVESTMENT OPERATIONS: | | | | | | | | | | | | | | | | | | | | | | | | |
| Net investment income (A) | | | 0.02 | | | | 0.02 | | | | 0.02 | | | | 0.06 | | | | 0.08 | | | | 0.11 | |
| Net realized and unrealized gain (loss) on investments | | | 0.53 | | | | 0.52 | | | | 0.06 | | | | 0.45 | | | | 0.93 | | | | 0.67 | |
| Total from investment operations | | | 0.55 | | | | 0.54 | | | | 0.08 | | | | 0.51 | | | | 1.01 | | | | 0.78 | |
| | | | | | | | | | | | | | | | | | | | | | | | | |
| LESS DISTRIBUTIONS: | | | | | | | | | | | | | | | | | | | | | | | | |
| From net investment income | | | (0.02 | ) | | | (0.01 | ) | | | (0.04 | ) | | | (0.06 | ) | | | (0.08 | ) | | | (0.11 | ) |
| From net realized gains on investments | | | — | | | | (0.03 | ) | | | (0.27 | ) | | | (1.61 | ) | | | (0.16 | ) | | | (0.29 | ) |
| From Return of capital | | | (0.33 | ) | | | (0.12 | ) | | | — | | | | — | | | | — | | | | — | |
| Total distributions | | | (0.35 | ) | | | (0.16 | ) | | | (0.31 | ) | | | (1.67 | ) | | | (0.24 | ) | | | (0.40 | ) |
| | | | | | | | | | | | | | | | | | | | | | | | | |
| Net asset value, end of period | | $ | 10.56 | | | $ | 10.36 | | | $ | 9.98 | | | $ | 10.21 | | | $ | 11.37 | | | $ | 10.60 | |
| | | | | | | | | | | | | | | | | | | | | | | | | |
| Total return (B) | | | 5.37 | % (C) | | | 5.42 | % | | | 0.90 | % | | | 4.51 | % | | | 9.63 | % | | | 7.90 | % |
| | | | | | | | | | | | | | | | | | | | | | | | | |
| RATIOS/SUPPLEMENTAL DATA: | | | | | | | | | | | | | | | | | | | | | | | | |
| Net assets, end of period (in 000’s) | | $ | 6,767 | | | $ | 3,732 | | | $ | 8,098 | | | $ | 12,223 | | | $ | 11,842 | | | $ | 10,044 | |
| Ratios to average net assets | | | | | | | | | | | | | | | | | | | | | | | | |
| Expenses, before waiver and reimbursement | | | 2.41 | % | | | 3.26 | % | | | 1.86 | % | | | 1.57 | % | | | 1.85 | % | | | 2.51 | % |
| Expenses, net waiver and reimbursement | | | 1.95 | % | | | 1.95 | % | | | 1.95 | % | | | 1.85 | % | | | 1.85 | % | | | 1.95 | % |
| Net investment income | | | 0.25 | % | | | 0.22 | % | | | 0.22 | % | | | 0.49 | % | | | 0.68 | % | | | 1.11 | % |
| Portfolio turnover rate | | | 252 | % | | | 323 | % | | | 279 | % | | | 265 | % | | | 114 | % | | | 77 | % |
| (A) | Per share amounts calculated using the average shares method, which more appropriately presents the per share data for the period. |
| (B) | Total return in the above table represents the rate that the investor would have earned or lost on an investment in the Fund assuming reinvestment of dividends and does not reflect the impact of sales charges. Had the Advisor not waived its fees and reimbursed expenses, total return would have been lower. |
| (C) | Includes adjustments in accordance with accounting principles generally accepted in the United States and, consequently, the net asset value for financial reporting purposes and the returns based upon those net |
See accompanying notes to consolidated financial statements.
| RATIONAL FUNDS |
| Rational Iron Horse Fund (Continued) |
| Financial Highlights |
For a Share Outstanding Throughout the Period
| | | Class C (A) | |
| | | Period Ended | |
| | | December 31, | |
| | | 2017 | |
| | | | |
| Net asset value, beginning of period | | $ | 10.37 | |
| | | | | |
| INCOME (LOSS) FROM INVESTMENT OPERATIONS: | | | | |
| Net investment (loss) (B) | | | (0.03 | ) |
| Net realized and unrealized (loss) on investments | | | 0.53 | |
| Total from investment operations | | | 0.50 | |
| | | | | |
| LESS DISTRIBUTIONS: | | | | |
| From net investment income | | | — | |
| From Return of capital | | | (0.33 | ) |
| Total distributions | | | (0.33 | ) |
| | | | | |
| Net asset value, end of period | | $ | 10.54 | |
| | | | | |
| Total return (C) | | | 4.89 | % (D) |
| | | | | |
| RATIOS/SUPPLEMENTAL DATA: | | | | |
| Net assets, end of period (in 000’s) | | $ | 1 | |
| Ratios to average net assets | | | | |
| Expenses, before waiver and reimbursement | | | 3.04 | % (E) |
| Expenses, net waiver and reimbursement | | | 2.70 | % (E) |
| Net investment (loss) | | | (0.44 | )% (E) |
| Portfolio turnover rate | | | 252 | % (D) |
| (A) | The Rational Iron Horse Fund Class C shares commenced operations on April 7, 2017. |
| (B) | Per share amounts calculated using the average shares method, which more appropriately presents the per share data for the period. |
| (C) | Total return in the above table represents the rate that the investor would have earned or lost on an investment in the Fund assuming reinvestment of dividends and does not reflect the impact of sales charges. Had the Advisor not waived its fees and reimbursed expenses, total return would have been lower. |
See accompanying notes to consolidated financial statements.
| RATIONAL FUNDS | |
| CONSOLIDATED NOTES TO FINANCIAL STATEMENTS |
| December 31, 2017 | ANNUAL REPORT |
| (1) | ORGANIZATION AND SIGNIFICANT ACCOUNTING POLICIES |
The Mutual Fund and Variable Insurance Trust (the “Trust”) was organized as a Delaware statutory trust on June 23, 2006. The Trust is registered under the Investment Company Act of 1940, as amended (the “1940 Act”), as an open-end management investment company. As of December 31, 2017, the Trust operated 10 separate series, or mutual funds, each with its own investment objective and strategy. The Trust was renamed effective February 22, 2016; it was formerly the Huntington Funds. This report contains financial statements and financial highlights of the funds listed below (individually referred to as a “Fund”, or collectively as the “Funds”):
| Fund | | Sub-Advisor | | Primary Objective |
Rational Dividend Capture Fund
(“Dividend Capture Fund”) | | PVG Asset Management Corporation | | Total return on investment, with dividend income an important component of that return. |
Rational Risk Managed Emerging Markets Fund
(“Emerging Markets Fund”) | | The Cambridge Strategy Limited | | Total return. |
Rational Hedged Return Fund
(“Hedged Return Fund”) | | Warrington Asset Management, LLC | | Total return consisting of long-term capital appreciation and Income. |
Rational Dynamic Brands Fund
(“Dynamic Brands Fund”) | | Accuvest Global Advisors | | Long-term capital appreciation. |
Rational Strategic Allocation Fund
(“Strategic Allocation Fund”) | | | | Current income and moderate appreciation of capital. |
Rational Dynamic Momentum Fund
(“Dynamic Momentum Fund”) | | Chesapeake Capital Corporation | | Capital appreciation uncorrelated to global equity markets. |
Rational Iron Horse Fund
(“Iron Horse Fund”) | | Van Hulzen Asset Management, LLC | | Total Return with less volatility than equity markets in general. |
The Funds are registered as diversified, except Dynamic Momentum, which is non-diversified.
Currently, all Funds offer Class A, Class C and Institutional Class shares. Each class of shares for each Fund has identical rights and privileges except with respect to distribution (12b-1) and service fees, voting rights on matters affecting a single class of shares, exchange privileges of each class of shares and sales charges. The price at which the Funds will offer or redeem shares is the net asset value (“NAV”) per share next determined after the order is considered received, subject to any applicable front end or contingent deferred sales charges. Class A shares have a maximum sales charge on purchases of 5.75% for the Dynamic Momentum Fund and the Iron Horse Fund and 4.75% for all other Funds as a percentage of the original purchase price. Class C shares have a contingent deferred sales charge of 1.00% on shares sold within one year of purchase. Each Fund’s prospectus provides a description of each Fund’s investment objectives, policies and strategies along with information on the classes of shares currently being offered.
Rational Dynamic Momentum Fund was organized originally as a limited liability company, the Chesapeake Fund LLC, on February 28, 1994. Effective as of the close of business on September 30, 2016, all of the assets, subject to liabilities of Chesapeake Fund LLC, were transferred to the Dynamic Momentum Fund in exchange for Institutional Class shares of the Dynamic Momentum Fund. The net asset value of the Dynamic Momentum Fund’s shares on the close of business September 30, 2016, after the reorganization, was $25.00 for Institutional Class shares and received in-kind capital contributions of cash valued at $15,163,528 in exchange for 606,541 Institutional Class shares. Class A shares and Class C shares commenced operations on September 30, 2016.
At the close of business of April 7, 2017, pursuant to a Plan of Reorganization, the Predecessor Iron Horse Fund transferred all of its assets and liabilities into the Rational Iron Horse Fund. The Predecessor Iron Horse Fund transferred its net assets of $3,738,544 and $8,903,888 to the Rational Iron Horse Fund for Class A and Institutional Class respectively. The Rational Iron Horse Fund received 361,235 and 859,011 shares from the Predecessor Iron Horse Fund Class A and Institutional Class respectively.
| (2) | SIGNIFICANT ACCOUNTING POLICIES |
The following is a summary of significant accounting policies consistently followed by the Funds and are in accordance with accounting principles generally accepted in the United States of America (“GAAP”). Each Fund is an investment company
| RATIONAL FUNDS | |
| CONSOLIDATED NOTES TO FINANCIAL STATEMENTS (Continued) |
| December 31, 2017 | ANNUAL REPORT |
and accordingly follow the investment company accounting and reporting guidance of the Financial Accounting Standards Board (FASB) Accounting Standard Codification Topic 946 “Financial Services – Investment Companies” including FASB Accounting Standard Update ASU 2013-08.
The preparation of financial statements in conformity with GAAP requires management to make estimates and assumptions that affect the amounts of assets, liabilities, and disclosure of contingent assets and liabilities at the date of the financial statements and the reported amounts of income and expenses for the period. Actual results could differ from those estimates.
In computing the NAV of the Funds, fair value is based on market valuations with respect to portfolio securities for which market quotations are readily available. Pursuant to Trustee-approved policies, the Trust relies on certain security pricing services to provide the current market value of securities. Those security pricing services value equity securities (including foreign equity securities, exchange-traded funds and closed-end funds) traded on a securities exchange at the last reported sales price on the principal exchange. Equity securities quoted by NASDAQ are valued at the NASDAQ official closing price. If there is no reported sale on the principal exchange, and in the case of over-the counter securities, equity securities are valued at a bid price estimated by the security pricing service. Option contracts are generally valued at the close. If the close price is outside the bid and the ask price; the quote closest to the close is used. When there is no trading volume the mean of the bid and ask is used. Foreign securities quoted in foreign currencies are translated into U.S. dollars at the foreign exchange rate in effect as of the close of the NYSE. Forward currency exchange contracts are valued daily at the forward foreign exchange rate in effect as of the close of the NYSE. Investments in open-end investment companies are valued at their respective net asset value as reported by such companies. Futures, which are traded on an exchange, are valued at the settlement price determined by the exchange. Short-term debt obligations having 60 days or less remaining until maturity, at time of purchase, may be valued at amortized cost.
Securities for which market quotations are not readily available are valued at fair value under Trust procedures approved by the Board of Trustees (the “Board”). In these cases, a Pricing Committee, established and appointed by the Trustees, determines in good faith, subject to Trust procedures, the fair value of portfolio securities held by a Fund (“good faith fair valuation”). When a good faith fair valuation of a security is required, consideration is generally given to a number of factors including, but not limited to the following: dealer quotes, published analyses by dealers or analysts regarding the security, transactions which provide implicit valuation of the security (such as a merger or tender offer transaction), the value of other securities or contracts which derive their value from the security at issue, and the implications of any other circumstances which have caused trading in the security to halt. With respect to certain categories of securities, the procedures utilized by the Pricing Committee detail specific valuation methodologies to be applied in lieu of considering the aforementioned list of factors.
Fair valuation procedures are also used when a significant event affecting the value of a portfolio security is determined to have occurred between the time when the price of the portfolio security is determined and the close of trading on the NYSE, which is when each Fund’s NAV is computed. An event is considered significant if there is both an affirmative expectation that the security’s value will change in response to the event and a reasonable basis for quantifying the resulting change in value. Significant events include significant securities’ market movements occurring between the time the price of the portfolio security is determined and the close of trading on the NYSE. For securities normally priced at their last sale price in a foreign market, such events can occur between the close of trading in the foreign market and the close of trading on the NYSE.
In some cases, events affecting the issuer of a portfolio security may be considered significant events. Examples of potentially significant events include announcements concerning earnings, acquisitions, new products, management changes, litigation developments, a strike or natural disaster affecting the company’s operations or regulatory changes or market developments affecting the issuer’s industry occurring between the time when the price of the portfolio security is determined and the close of trading on the NYSE. For securities of foreign issuers, such events could also include political or
| RATIONAL FUNDS | |
| CONSOLIDATED NOTES TO FINANCIAL STATEMENTS (Continued) |
| December 31, 2017 | ANNUAL REPORT |
other developments affecting the economy or markets in which the issuer conducts its operations or its securities are traded.
There can be no assurance that a Fund could purchase or sell a portfolio security at the price used to calculate the Fund’s NAV. In the case of good faith fair valued portfolio securities, lack of information and uncertainty as to the significance of information may lead to a conclusion that a prior valuation is the best indication of a portfolio security’s present value. Good faith fair valuations generally remain unchanged until new information becomes available. Consequently, changes in good faith fair valuation of portfolio securities may be less frequent and of greater magnitude than changes in the price of portfolio securities valued at their last sale price, by an independent pricing service, or based on market quotations.
Valuation of Fund of Funds – The Strategic Allocation Fund invests in portfolios of open-end or closed-end investment companies (the “Underlying Funds”). The Underlying Funds value securities in their portfolios for which market quotations are readily available at their market values (generally the last reported sale price) and all other securities and assets at their fair value based upon the methods established by the board of directors of the Underlying Funds.
Open-end investment companies are valued at their respective net asset values as reported by such investment companies. The shares of many closed-end investment companies, after their initial public offering, frequently trade at a price per share, which is different than the net asset value per share. The difference represents a market premium or market discount of such shares. There can be no assurances that the market discount or market premium on shares of any closed-end investment company purchased by the Funds will not change.
The Trust calculates the NAV for each of the Funds by valuing securities held based on fair value. Fair value is defined as the price that would be received to sell an asset or paid to transfer a liability in an orderly transaction between market participants at the measurement date. The valuation techniques described below maximize the use of observable inputs and minimize the use of unobservable inputs in determining fair value. The inputs used for valuing the Funds’ investments are summarized in the three broad levels listed below:
| ● | Level 1 – unadjusted quoted prices in active markets for identical investments and/or registered investment companies where the value per share is determined and published and is the basis for current transactions for identical assets or liabilities at the valuation date. |
| ● | Level 2 – other significant observable inputs (including quoted prices for similar securities, interest rates, prepayment speeds, credit risk, etc.). |
| ● | Level 3 – significant unobservable inputs (including the Funds’ own assumptions in determining the fair value of investments). |
Changes in valuation techniques may result in transfers in or out of an assigned level within the disclosure hierarchy. The inputs or methodology used for valuing investments is not necessarily an indication of the risk associated with investing in those investments.
The Trustees have authorized the use of an independent fair valuation service. If the movement in a designated U.S. market index, after foreign markets close, is greater than predetermined levels, the Funds may use a systematic valuation model provided from that independent third party to fair value its international equity securities.
The inputs or methodology used for valuing securities are not necessarily an indication of the risk associated with investing in those securities. The following tables summarize the inputs used as of December 31, 2017, for each Fund’s assets and liabilities measured at fair value:
| RATIONAL FUNDS | |
| CONSOLIDATED NOTES TO FINANCIAL STATEMENTS (Continued) |
| December 31, 2017 | ANNUAL REPORT |
| Dividend Capture Fund | | | | | | | | | | | | |
| | | | | | | | | | | | | |
| Assets* | | Level 1 | | | Level 2 | | | Level 3 | | | Total | |
| Common Stocks | | $ | 31,357,652 | | | $ | — | | | $ | — | | | $ | 31,357,652 | |
| Exchange Traded Funds | | | 2,880,120 | | | | — | | | | — | | | | 2,880,120 | |
| Preferred Stocks | | | 740,374 | | | | — | | | | — | | | | 740,374 | |
| Short-Term Investments | | | 362,219 | | | | — | | | | — | | | | 362,219 | |
| Total Assets | | $ | 35,340,365 | | | $ | — | | | $ | — | | | $ | 35,340,365 | |
| | | | | | | | | | | | | | | | | |
| Emerging Markets Fund | | | | | | | | | | | | | | | | |
| | | | | | | | | | | | | | | | | |
| Assets* | | Level 1 | | | Level 2 | | | Level 3 | | | Total | |
| Common Stocks | | $ | 9,490,800 | | | $ | — | | | $ | — | | | $ | 9,490,800 | |
| Exchange Traded Funds | | | 282,786 | | | | — | | | | — | | | | 282,786 | |
| Short-Term Investments | | | 131,350 | | | | — | | | | — | | | | 131,350 | |
| Total Assets | | $ | 9,904,936 | | | $ | — | | | $ | — | | | $ | 9,904,936 | |
| | | | | | | | | | | | | | | | | |
| Hedged Return Fund | | | | | | | | | | | | | | | | |
| | | | | | | | | | | | | | | | | |
| Assets* | | Level 1 | | | Level 2 | | | Level 3 | | | Total | |
| Short-Term Investments | | $ | 2,842,037 | | | | — | | | | — | | | $ | 2,842,037 | |
| Total Assets | | $ | 2,842,037 | | | $ | — | | | $ | — | | | $ | 2,842,037 | |
| Liabilities* | | | | | | | | | | | | | | | | |
| Derivatives | | | | | | | | | | | | | | | | |
| Written Options | | $ | 613 | | | $ | — | | | $ | — | | | $ | 613 | |
| Total Liabilities | | $ | 613 | | | $ | — | | | $ | — | | | $ | 613 | |
| | | | | | | | | | | | | | | | | |
| Dynamic Brands Fund | | | | | | | | | | | | | | | | |
| | | | | | | | | | | | | | | | | |
| Assets* | | Level 1 | | | Level 2 | | | Level 3 | | | Total | |
| Common Stocks | | $ | 16,296,792 | | | $ | — | | | $ | — | | | $ | 16,296,792 | |
| Short-Term Investments | | | 47,873 | | | | — | | | | — | | | | 47,873 | |
| Total Assets | | $ | 16,344,665 | | | $ | — | | | $ | — | | | $ | 16,344,665 | |
| | | | | | | | | | | | | | | | | |
| Strategic Allocation Fund | | | | | | | | | | | | | | | | |
| | | | | | | | | | | | | | | | | |
| Assets* | | Level 1 | | | Level 2 | | | Level 3 | | | Total | |
| Mutual Funds | | $ | 9,935,093 | | | $ | — | | | $ | — | | | $ | 9,935,093 | |
| Exchange Traded Funds | | | 3,141,214 | | | | — | | | | — | | | | 3,141,214 | |
| Short-Term Investments | | | 106,509 | | | | — | | | | — | | | | 106,509 | |
| Total Assets | | $ | 13,182,816 | | | $ | — | | | $ | — | | | $ | 13,182,816 | |
| RATIONAL FUNDS | |
| CONSOLIDATED NOTES TO FINANCIAL STATEMENTS (Continued) |
| December 31, 2017 | ANNUAL REPORT |
Dynamic Momentum Fund
| Assets* | | Level 1 | | | Level 2 | | | Level 3 | | | Total | |
| Short-Term Investments | | $ | 5,235,023 | | | $ | — | | | $ | — | | | $ | 5,235,023 | |
| Derivatives | | | | | | | | | | | | | | | | |
| Futures Contracts | | $ | 309,665 | | | $ | — | | | $ | — | | | $ | 309,665 | |
| Total Assets | | $ | 5,544,688 | | | $ | — | | | $ | — | | | $ | 5,544,688 | |
| Liabilities* | | | | | | | | | | | | | | | | |
| Derivatives | | | | | | | | | | | | | | | | |
| Futures Contracts | | $ | 102,623 | | | $ | — | | | $ | — | | | $ | 102,623 | |
| Total Liabilities | | $ | 102,623 | | | $ | — | | | $ | — | | | $ | 102,623 | |
| | | | | | | | | | | | | | | | | |
| Iron Horse Fund | | | | | | | | | | | | | | | | |
| | | | | | | | | | | | | | | | | |
| Assets* | | Level 1 | | | Level 2 | | | Level 3 | | | Total | |
| Common Stocks | | $ | 16,074,885 | | | $ | — | | | $ | — | | | $ | 16,074,885 | |
| Exchanged Traded Note | | | 111,400 | | | | — | | | | — | | | | 111,400 | |
| Put Options Purchased | | | 140,800 | | | | — | | | | — | | | | 140,800 | |
| Short-Term Investments | | | 1,605,853 | | | | — | | | | — | | | | 1,605,853 | |
| Total Assets | | $ | 17,932,938 | | | $ | — | | | $ | — | | | $ | 17,932,938 | |
| Liabilities* | | | | | | | | | | | | | | | | |
| Derivatives | | | | | | | | | | | | | | | | |
| Call Options Written | | $ | 716,879 | | | $ | 254 | | | $ | — | | | $ | 717,133 | |
| Total Liabilities | | $ | 716,879 | | | $ | 254 | | | $ | — | | | $ | 717,133 | |
| * | Refer to the Portfolios of Investments for industry classifications. |
There were no transfers into or out of Level 1 and Level 2 during the year or period ended December 31, 2017. The Trust recognizes significant transfers between fair value hierarchy levels at the reporting period end.
During the year ended December 31, 2017 the Hedged Return Fund held level 3 securities. The following is a reconciliation of assets in which significant unobservable inputs (Level 3) were used in determining fair value:
| | | Real Estate | |
| Hedged Return Fund | | Investments | |
| Balance as of December 31, 2016 | | $ | 1,228,001 | |
| Sales | | | (718,450 | ) |
| Realized Gain (Loss) | | | (660,933 | ) |
| Change in unrealized appreciation (depreciation) | | | 151,382 | |
| Balance as of December 31, 2017 | | $ | — | |
There were no Level 3 securities held by the remaining Funds during the year or period ended December 31, 2017.
Consolidation of Subsidiaries – The consolidated financial statements of the Dynamic Momentum Fund include the accounts of RDMF Fund Ltd. (“RDMF” or “CFC”), a wholly-owned and controlled foreign subsidiary. All inter-company accounts and transactions have been eliminated in consolidation.
The Fund may invest up to 25% of its total assets in a controlled foreign corporation, which acts as an investment vehicle in order to affect certain investments consistent with the Dynamic Momentum Fund’s investment objectives and policies.
| RATIONAL FUNDS | |
| CONSOLIDATED NOTES TO FINANCIAL STATEMENTS (Continued) |
| December 31, 2017 | ANNUAL REPORT |
| | Inception Date of | CFC Net Assets as of | % of Net Assets as of |
| | CFC | December 31, 2017 | December 31, 2017 |
| RDMF Fund Ltd. | 8/5/2016 | $ 710,729 | 11.1% |
For tax purposes, the CFC is an exempted Cayman investment company. The CFC has received an undertaking from the Government of the Cayman Islands exempting it from all local income, profits and capital gains taxes. No such taxes are levied in the Cayman Islands at the present time. For U.S. income tax purposes, a CFC is a Controlled Foreign Corporation which generates and is allocated no income which is considered effectively connected with U.S. trade or business and as such is not subject to U.S. income tax. However, as a wholly-owned Controlled Foreign Corporation, RDMF’s net income and capital gain, to the extent of its earnings and profits, will be included each year in the Dynamic Momentum Fund’s investment company taxable income.
| B. | Foreign Currency Translation |
The accounting records of the Funds are maintained in U.S. dollars. Foreign currency amounts are translated into U.S. dollars at the current rate of exchange each business day to determine the value of investments, and other assets and liabilities. Purchases and sales of foreign securities, and income and expenses, are translated at the prevailing rate of exchange on the respective date of these transactions. The Funds do not isolate that portion of the results of operations resulting from changes in foreign exchange rates on investments from fluctuation arising from changes in market prices of securities held. These fluctuations are included with the net realized and unrealized gain or loss from investments and foreign currency transactions.
Reported net realized foreign exchange gains or losses arise from sales of portfolio securities; sales and maturities of short term securities; sales of foreign currencies; currency gains or losses realized between the trade and settlement dates on securities transactions; and the difference between the amounts of dividends, interest, and foreign withholding taxes recorded on the Funds’ books and the U.S. dollar equivalent of the amounts actually received or paid. Net unrealized foreign exchange gains and losses arise from changes in the values of assets and liabilities, including investments in securities at fiscal period-end, resulting from changes in the exchange rate.
Certain of the Funds may be subject to equity price risk, commodity risk, interest rate risk and foreign currency exchange risk in the normal course of pursuing their investment objectives. Certain of the Funds may invest in various financial instruments including positions in foreign currency contracts, written option contracts and futures contracts to gain exposure to or hedge against changes in the value of equities or foreign currencies. The following is a description of the derivative instruments utilized by the Funds, including the primary underlying risk exposure related to each instrument type.
Futures Contracts – Certain of the Funds may purchase and sell futures contracts. A Fund may use futures contracts to gain exposure to, or hedge against changes in the value of equities, interest rates, commodities prices or foreign currencies. Upon entering into a contract, the Fund deposits and maintains as collateral such initial margin as required by the exchange on which the transaction is affected. Pursuant to the contract, the Fund agrees to receive from or pay to the broker an amount of cash equal to the daily fluctuation in value of the contract. Such receipts or payments are known as “variation margin” and are recorded by the Fund as unrealized gains and losses. When the contract is closed, the Fund records a realized gain or loss equal to the difference between the value of the contract at the time it was opened and the value at the time it was closed. As collateral for futures contracts, the Fund is required under the 1940 Act to maintain assets consisting of cash, cash equivalents or liquid securities. This collateral is required to be adjusted daily to reflect the market value of the purchase obligation for long futures contracts or the market value of the instrument underlying the contract, but not less than the market price at which the futures contract was established, for short futures contracts.
Foreign Exchange Contracts – Certain Funds may enter into forward foreign exchange contracts. A forward foreign exchange contract involves an obligation to purchase or sell a specific currency at a future date at a price set at the time of
| RATIONAL FUNDS | |
| CONSOLIDATED NOTES TO FINANCIAL STATEMENTS (Continued) |
| December 31, 2017 | ANNUAL REPORT |
the contract. Such contracts are used to sell unwanted currency exposure that comes with holding securities in a market, or to buy currency exposure where the exposure from holding securities is insufficient to provide the desired currency exposure. The contracts are marked-to-market daily and the change in market value is recorded as unrealized appreciation or depreciation. When a forward foreign currency contract is closed, a Fund records a realized gain or loss equal to the difference between the value at the time it was opened and the value at the time it was closed. The Funds could be exposed to risks if the counterparties to the contracts are unable to meet the terms of their contracts and from unanticipated movements in exchange rates.
Options Contracts – Iron Horse does and certain Funds may purchase put and call options and write put and call options. The premium paid for a purchased put or call option plus any transaction costs will reduce the benefit, if any, realized by a Fund upon exercise of the option, and, unless the price of the underlying security rises or declines sufficiently, the option may expire worthless to the Funds. In addition, in the event that the price of the security in connection with which an option was purchased moves in a direction favorable to the Funds, the benefits realized by the Funds as a result of such favorable movement will be reduced by the amount of the premium paid for the option and related transaction costs.
When a Fund writes an option, an amount equal to the premium received by the Funds is recorded as a liability and is subsequently adjusted to the current fair value of the option written. Premiums received from writing options that expire unexercised are treated by the Funds on the expiration date as realized gains from investments. The difference between the premium and the amount paid on effecting a closing purchase transaction, including brokerage commissions, is also treated as a realized gain, or, if the premium is less than the amount paid for the closing purchase transaction, as a realized loss. If a call option is exercised, the premium is added to the proceeds from the sale of the underlying security or currency in determining whether the Funds have realized gains or losses. If a put option is exercised, the premium reduces the cost basis of the securities purchased by the Funds.
Written and purchased options are non-income producing securities. With options, there is minimal counterparty risk to the Funds since these options are exchange traded and the exchange’s clearinghouse acts as counterparty to all exchange traded options and guarantees against a possible default. Initial margin deposits required upon entering into options contracts are satisfied by the deposits of cash as collateral for the account of the broker (the Fund’s agent in acquiring the options)
The derivatives are not accounted for as hedging instruments under GAAP. The effect of derivative instruments on the Statements of Assets and Liabilities and Consolidated Statements of Assets and Liabilities at December 31, 2017, were as follows:
| | | | | | | Location of derivatives on Statements | | Fair value of asset/liability | |
| Fund | | Derivative | | Risk Type | | of Assets and Liabilities | | derivatives | |
| Hedged Return Fund | | | | | | | | |
| | | Written Options | | Equity | | Options Written | | $ | (613 | ) |
| | | | | | | | | | | |
| Dynamic Momentum Fund | | | | | | | | |
| | | Futures | | Equity | | Futures unrealized appreciation | | $ | 49,212 | |
| | | | | | | Futures unrealized depreciation | | | (39,331 | ) |
| | | | | Commodity | | Futures unrealized appreciation | | | 102,188 | |
| | | | | | | Futures unrealized depreciation | | | (49,400 | ) |
| | | | | Currency | | Futures unrealized appreciation | | | 136,432 | |
| | | | | | | Futures unrealized depreciation | | | (13,188 | ) |
| | | | | Interest | | Futures unrealized appreciation | | | 21,832 | |
| | | | | | | Futures unrealized depreciation | | | (703 | ) |
| | | | | | | Totals | | $ | 207,042 | |
| Iron Horse Fund | | | | | | | | |
| | | Purchased Options | | Equity | | Investments in Unaffiliated | | | | |
| | | | | | | Securities, at Value | | $ | 140,800 | |
| | | | | | | | | | | |
| | | Written Options | | Equity | | Options Written | | $ | (717,133 | ) |
| RATIONAL FUNDS | |
| CONSOLIDATED NOTES TO FINANCIAL STATEMENTS (Continued) |
| December 31, 2017 | ANNUAL REPORT |
The effect of derivative instruments on the Statements of Operations and Consolidated Statements of Operations for the Funds, for the year or period ended December 31, 2017, were as follows:
| | | | | | | | | Realized and unrealized | |
| Fund | | Derivative | | Risk Type | | Location of gain (loss) on derivatives | | gain (loss) on derivatives | |
| Dividend Capture Fund | | | | | | | | |
| | | Futures | | Interest Rate | | Net realized gain/loss from futures | | $ | (2,486,607 | ) |
| | | | | | | | | | | |
| Emerging Markets Fund | | | | | | |
| | | Forward Currency Contracts | | Currency | | Net realized loss from forward currency transactions | | $ | (552,007 | ) |
| | | | | | | | | | | |
| | | | | Currency | | Net change in unrealized appreciation on forward currency contacts | | $ | 137,675 | |
| | | | | | | | | | | |
| Hedged Return Fund | | | | | | | | |
| | | Options Written | | Equity | | Net realized gain from options written | | $ | 127,290 | |
| | | | | | | | | | | |
| | | Options Written | | Equity | | Net change in unrealized appreciation on options written | | $ | (8,310 | ) |
| | | | | | | | | | | |
| Dynamic Momentum Fund | | | | | | | | |
| | | Futures | | Equity | | Net realized gain/loss from futures | | $ | 1,555,055 | |
| | | | | Commodity | | Net realized gain/loss from futures | | | (235,645 | ) |
| | | | | Currency | | Net realized gain/loss from futures | | | (780,712 | ) |
| | | | | Interest | | Net realized gain/loss from futures | | | (219,751 | ) |
| | | | | | | Totals | | $ | 318,947 | |
| | | | | | | | | | | |
| | | | | | | | | | | |
| | | Futures | | Equity | | Net change in unrealized appreciation on futures | | $ | 80,903 | |
| | | | | Commodity | | Net change in unrealized appreciation on futures | | | 95,191 | |
| | | | | Currency | | Net change in unrealized appreciation on futures | | | 142,615 | |
| | | | | Interest | | Net change in unrealized appreciation on futures | | | 39,793 | |
| | | | | | | Totals | | $ | 358,502 | |
| Iron Horse Fund | | | | | | | | |
| | | Options Purchased | | Equity | | Net realized loss from options purchased | | | 54,456 | |
| | | Options Written | | Equity | | Net realized loss from options written | | | (595,924 | ) |
| | | | | | | | | $ | (541,468 | ) |
| | | | | | | | | | | |
| | | Options Purchased | | Equity | | Net change in unrealized depreciation on options purchased | | $ | (95,165 | ) |
| | | Options Written | | Equity | | Net change in unrealized depreciation on options written | | $ | (232,636 | ) |
| | | | | | | Totals | | $ | (327,801 | ) |
The value of derivative instruments outstanding as of December 31, 2017 as disclosed in the Portfolios of Investments and the amounts realized and changes in unrealized gains and losses on derivative instruments during the period as disclosed above and within the Statements of Operations (Consolidated Statements of Operations for Dynamic Momentum Fund) serve as indicators of the volume of derivative activity for the Funds.
| RATIONAL FUNDS | |
| CONSOLIDATED NOTES TO FINANCIAL STATEMENTS (Continued) |
| December 31, 2017 | ANNUAL REPORT |
Balance Sheet Offsetting Information
The following table provides a summary of offsetting financial liabilities derivatives and the effect of the derivative instruments on the Statements of Assets and Liabilities as of December 31, 2017:
| | | | | | | | | | | | Gross Amounts of Assets Presented in the
(Consolidated) Statement of Assets &
Liabilities | | | | |
| | | Gross Amounts
Recognized in the
(Consolidated)
Statements of
Assets and
Liabilities | | | Gross Amounts
Offset in the
(Consolidated)
Statements of
Assets and
Liabilities | | | Net Amounts
Presented in the
(Consolidated)
Statements of
Assets and
Liabilities | | | Financial
Instruments
Pledged | | | Cash Collateral
Pledged/Received | | | Net Amount | |
| Hedged Return Fund | | | | | | | | | | | | | | | | | | | | | | | | |
| Description of Liability: | | | | | | | | | | | | | | | | | | | | | | | | |
| Written Option | | $ | 613 | | | $ | — | | | $ | 613 | | | $ | 613 | | | $ | — | | | $ | — | |
| Dynamic Momentum Fund | | | | | | | | | | | | | | | | | | | | | | | | |
| Description of Asset: | | | | | | | | | | | | | | | | | | | | | | | | |
| Futures Contracts | | $ | 309,665 | | | $ | — | | | $ | 309,665 | | | $ | (102,623 | ) | | $ | — | | | $ | 207,042 | |
| Description of Liability: | | | | | | | | | | | | | | | | | | | | | | | | |
| Futures Contracts | | $ | 102,623 | | | $ | — | | | $ | 102,623 | | | $ | 102,623 | | | $ | — | | | $ | — | |
| Iron Horse Fund: | | | | | | | | | | | | | | | | | | | | | | | | |
| Description of Asset: | | | | | | | | | | | | | | | | | | | | | | | | |
| Purchased Option | | $ | 140,800 | | | $ | — | | | $ | 140,800 | | | $ | (140,800 | ) | | $ | — | | | $ | — | |
| Description of Liability: | | | | | | | | | | | | | | | | | | | | | | | | |
| Written Option | | $ | 717,133 | | | $ | — | | | $ | 717,133 | | | $ | 717,133 | (1) | | $ | — | | | $ | — | |
| (1) | The amount is limited to the derivative liability balance and accordingly does not include excess collateral pledged. |
| D. | Security Transactions and Related Income |
During the period, investment transactions are accounted for no later than the first calculation of the NAV on the business day following the trade date. For financial reporting purposes, however, security transactions are accounted for on the trade date on the last business day of the reporting period. Discounts and premiums on securities purchased are accreted and amortized over the lives of the respective securities using the effective interest method. Securities gains and losses are calculated on the identified cost basis. Interest income and expenses are accrued daily. Dividends, less foreign tax withholding (if any), are recorded on the ex-dividend date. Withholding taxes and capital gains on foreign dividends have been provided for in accordance with the Funds’ understanding of the applicable country’s tax rules and rates.
| E. | Dividends and Distributions to Shareholders |
Dividends from net investment income are declared and paid annually by the Emerging Markets Fund, Hedged Return Fund, Dynamic Brands Fund, Dynamic Momentum Fund and Iron Horse Fund. Dividends from net investment income are declared and paid quarterly by the Strategic Allocation Fund. Dividends from net investment income are declared and paid monthly by the Dividend Capture Fund. Net realized capital gains, if any, are distributed at least annually.
The amount of dividends from net investment income and net realized gains recorded on the ex-dividend date are determined in accordance with the federal income tax regulations, which may differ from GAAP and are recorded on ex-date. These “book/tax” differences are either considered temporary or permanent in nature. To the extent these differences are permanent in nature (e.g. tax treatment of foreign currency gain/loss, non-deductible stock issuance costs, distributions and income received from pass through investments and net investment loss adjustments), such amounts are reclassified within the capital accounts based on their nature for federal income tax purposes; temporary differences do not require reclassification. Temporary differences are primarily due to market discounts, capital loss carryforwards and losses deferred due to wash sales, straddles and return of capital from investments.
| RATIONAL FUNDS | |
| CONSOLIDATED NOTES TO FINANCIAL STATEMENTS (Continued) |
| December 31, 2017 | ANNUAL REPORT |
Dividends are declared separately for each class. No class has preferential rights; differences in per share dividend rates are generally due to differences in separate class expenses.
Certain Funds may own shares of real estate investments trusts (“REITs”) which report information on the source of their distributions annually. Distributions received from investments in REITs in excess of income from underlying investments are recorded as realized gain and/or as a reduction to the cost of the individual REIT.
Certain of the Funds may invest in Master Limited Partnerships (“MLPs”), which generally are treated as partnerships for Federal income tax purposes. As a limited partner in the MLPs, the Funds include their allocable share of the MLPs’ taxable income in computing its own taxable income.
| F. | Allocation of Expenses, Income, and Gains and Losses |
Expenses directly attributable to a Fund are charged to that Fund. Expenses not directly attributable to a Fund are allocated proportionally among various Funds or all Funds within the Trust in relation to the net assets of each Fund or on another reasonable basis. Income, non-class specific expenses and realized/unrealized gains or losses are allocated to each class based on relative net assets. Distribution fees are charged to each respective share class in accordance with the distribution plan.
It is the policy of each Fund to qualify or continue to qualify as a regulated investment company by complying with the provisions available to certain investment companies, as defined in applicable sections of the Internal Revenue Code, and to make distributions of net investment income and net realized capital gains sufficient to relieve it from all, or substantially all, federal income taxes.
The Funds recognize the tax benefits of uncertain tax positions only where the position is “more likely than not” to be sustained assuming examination by tax authorities. Management has analyzed each Fund’s tax positions and has concluded that no liability for unrecognized tax benefits should be recorded related to uncertain tax positions taken on returns filed for open tax years ended December 31, 2014 to December 31, 2016, or expected to be taken in the Funds’ December 31, 2017 year end tax returns. Each Fund identifies its major tax jurisdictions as U.S. Federal, and foreign jurisdictions where the Funds make significant investments; however the Funds are not aware of any tax positions for which it is reasonably possible that the total amounts of unrecognized tax benefits will change materially in the next twelve months.
The Trust indemnifies its Officers and Trustees for certain liabilities that may arise from the performance of their duties to the Trust. Additionally, in the normal course of business, the Funds enter into contracts that contain a variety of representations and warranties and which provide general indemnities. The Funds’ maximum exposure under these arrangements is unknown, as this would involve future claims that may be made against the Funds that have not yet occurred. However, based on experience, the risk of loss due to these warranties and indemnities appears to be remote.
| (3) | FEES AND OTHER TRANSACTIONS WITH AFFILIATES AND OTHER SERVICE PROVIDERS |
Investment Advisory Fee— Rational Advisors, Inc., (the “Advisor”) serves as the Funds’ investment adviser. Under the terms of the Advisory Agreement, the Advisor manages the investment operations of the Funds in accordance with each Fund’s respective investment policies and restrictions. The Funds sub-advisors are responsible for the day-to-day management of their Fund’s portfolios. The Advisor provides the Funds with investment advice and supervision and furnishes an investment program for the Funds. For its investment management services, the Funds pay to the Advisor, as of the last day of each month, an annualized fee as shown in the below table, such fees to be computed daily based upon daily average net assets of the Funds. The Funds’ sub-advisors are paid by the Advisor, not the Funds.
| RATIONAL FUNDS | |
| CONSOLIDATED NOTES TO FINANCIAL STATEMENTS (Continued) |
| December 31, 2017 | ANNUAL REPORT |
| Fund | | Advisory Fee Tiered Annual Rate |
| | | Rate for the First $500 Million | | Rate for the Next $500 Million | | Rate for Excess Over $1 Billion |
| Dividend Capture Fund | | 0.75% | | 0.70% | | 0.65% |
| Emerging Markets Fund | | 1.00% | | 0.95% | | 0.90% |
| Dynamic Brands Fund | | 0.75% | | 0.70% | | 0.65% |
| | | | | | | |
| | | Advisory Fee Annual Rate | | | | |
| Strategic Allocation Fund | | 0.10% | | | | |
| Dynamic Momentum Fund | | 1.75% | | | | |
| Hedged Return Fund* | | 1.75% | | | | |
| Iron Horse Fund | | 1.25% | | | | |
| * | Prior to 12/5/17 the Fund charged an Advisory fee rate of 0.75%, 0.70% and 0.65% for the Tiered amounts shown above. |
The Advisor has contractually agreed to waive all or a portion of its investment advisory fee (based on average daily net assets) and/or reimburse certain operating expenses of each Fund to the extent necessary in order to limit each Fund’s total annual fund operating expenses (after the fee waivers and/or expense reimbursements, and exclusive of acquired fund fees and expenses, brokerage costs, interest, taxes and dividends, and extraordinary expenses) as listed below:
| | | Expense Caps |
| Fund | | Institutional Class Shares | | Class A Shares | | Class C Shares | | |
| Dividend Capture Fund | | 1.00% | | 1.25% | | 1.75% | | April 30, 2019 |
| Emerging Markets Fund | | 1.25% | | 1.50% | | 2.25% | | April 30, 2019 |
| Hedged Return Fund (1) | | 1.99% | | 2.24% | | 2.99% | | April 30, 2019 |
| Dynamic Brands Fund | | 1.00% | | 1.25% | | 1.75% | | April 30, 2019 |
| Strategic Allocation Fund | | 0.45% | | 0.70% | | 1.45% | | April 30, 2019 |
| Dynamic Momentum Fund (2) | | 1.97% | | 2.22% | | 2.97% | | April 30, 2019 |
| Iron Horse Fund | | 1.70% | | 1.95% | | 2.70% | | July 31, 2018 |
| (1) | Prior to December 5, 2017 the Expense Caps were 1.00%, 1.25% and 2.00% for Institutional, A, and C shares, respectively. |
| (2) | Prior to May 11, 2017, the Expense Caps were 1.99%, 2.24% and 2.99% for Institutional, A, and C shares, respectively. |
Amounts waived or reimbursed in the contractual period may be recouped by the Advisor within three years of the waiver and/or reimbursement. As of December 31, 2017, the following amounts have been waived or reimbursed by the Advisor and are subject to repayment by the respective Fund:
| | | Amount Waived or | | | Expiring Beginning | |
| Fund | | Reimbursed | | | December 31, | |
| Dividend Capture Fund | | $ | 950,747 | | | | 2018 | |
| | | | 358,384 | | | | 2019 | |
| | | | 161,810 | | | | 2020 | |
| Emerging Markets Fund | | | 259,857 | | | | 2018 | |
| | | | 184,174 | | | | 2019 | |
| | | | 167,321 | | | | 2020 | |
| Hedged Return Fund | | | 209,310 | | | | 2018 | |
| | | | 125,307 | | | | 2019 | |
| | | | 105,599 | | | | 2020 | |
| Dynamic Brands Fund | | | 528,144 | | | | 2018 | |
| | | | 180,941 | | | | 2019 | |
| | | | 120,009 | | | | 2020 | |
| Strategic Allocation Fund | | | 65,861 | | | | 2018 | |
| | | | 94,726 | | | | 2019 | |
| | | | 62,598 | | | | 2020 | |
| Dynamic Momentum Fund | | | 49,241 | | | | 2019 | |
| | | | 117,608 | | | | 2020 | |
| Iron Horse Fund | | | 171,089 | | | | 2019 | |
| | | | 75,447 | | | | 2020 | |
| RATIONAL FUNDS | |
| CONSOLIDATED NOTES TO FINANCIAL STATEMENTS (Continued) |
| December 31, 2017 | ANNUAL REPORT |
The Independent Trustees are paid a quarterly retainer, and receive compensation for each committee meeting, telephonic Board meeting, and special in-person Board meeting attended. Officers receive no compensation from the Trust. The Trust reimburses each of the Independent Trustees for travel and other expenses incurred in connection with attendance at such meetings. The Trust has no retirement or pension plans. Additional information regarding the Trust’s Trustees is available in the Funds’ Statement of Additional Information.
The Board has adopted the Trust’s Distribution Plan (the “12b-1 Plan”) which allows each Fund to pay fees up to 0.25% for the A shares and up to 1.00% for the C shares based on average daily net assets of each class to financial intermediaries (which may be paid through the Funds’ distributor) for the sale and distribution of these shares. Pursuant to the 12b-1 Plan, the Funds may finance from their assets certain activities or expenses that are intended primarily to result in the sale of Fund shares and to reimburse Northern Lights Distributors, LLC. (the “Distributor”) and Advisor for distribution related expenses. For the year or period ended December 31, 2017, the amounts accrued by the Funds were as follows:
| | | 12b-1 Fees | |
| Fund | | Class A | | | Class C | |
| Dividend Capture Fund | | $ | 70,402 | | | $ | 22,929 | |
| Emerging Markets Fund | | | 11,258 | | | | 426 | |
| Hedged Return Fund | | | 1,606 | | | | 13 | |
| Dynamic Brands Fund | | | 35,428 | | | | 2,844 | |
| Strategic Allocation Fund | | | 34,855 | | | | 11 | |
| Dynamic Momentum Fund | | | 281 | | | | 2,479 | |
| Iron Horse Fund | | | 18,219 | | | | 7 | |
Shareholder Servicing Fees – The Trust has adopted a Shareholder Servicing Plan pursuant to which the Funds may pay Shareholder Services Fees up to 0.25% of the average daily net assets to financial intermediaries for providing shareholder assistance, maintaining shareholder accounts and communicating or facilitating purchases and redemptions of shares for Institutional Class and Class A Shares.
In addition, certain affiliates of the Distributor provide services to the Funds as follows:
Gemini Fund Services, LLC (“GFS”) – GFS an affiliate of the Distributor, provides administrative, fund accounting, and transfer agency services to the Funds pursuant to agreements with the Trust, for which it receives from each Fund the greater of an annual minimum fee or an asset based fee, which scales downward based upon net assets for fund administration, fund accounting and transfer agency services. The Fund also pays GFS for any out-of-pocket expenses. Officers of the Trust are also employees of GFS, and are not paid any fees directly by the Trust for serving in such capacity.
Blu Giant, LLC (“Blu Giant”) – Blu Giant, an affiliate of GFS and the Distributor, provides EDGAR conversion and filing services as well as print management services for the Funds on an ad-hoc basis. For the provision of these services, Blu Giant receives customary fees from the Funds.
Pursuant to the Management Services Agreement between the Trust and MFund Services LLC (“MFund”), an affiliate of the Advisor, MFund provides the Funds with various management and administrative services. For these services, the Funds pay MFund an annual base fee plus an annual asset-based fee, which scales downward based upon net assets. In addition, the Funds reimburse MFund for any reasonable out- of- pocket expenses incurred in the performance of its duties under the Management Services Agreement.
Pursuant to the Compliance Services Agreements, MFund provides chief compliance officer services to the Funds. For these services, the Funds pay MFund an annual base fee plus an annual asset-based fee based upon net assets. In addition, the Funds reimburse MFund for any reasonable out- of- pocket expenses incurred in the performance of its duties under the Compliance Services Agreement. The amounts due to MFund at December 31, 2017 for management and chief compliance officer services are listed in the Statements of Assets and Liabilities under “Fees Payable to Affiliate.”
| RATIONAL FUNDS | |
| CONSOLIDATED NOTES TO FINANCIAL STATEMENTS (Continued) |
| December 31, 2017 | ANNUAL REPORT |
A Trustee and Officer of the Trust is also the controlling member of MFund and the Advisor, and is not paid any fees directly by the Trust for serving in such capacities.
Affiliated Funds — Affiliated companies are mutual funds that are advised by Catalyst Capital Advisors or Rational Advisors, Inc. Companies that are affiliates of the Funds’ at December 31, 2017, are noted in the Strategic Allocation Fund’s Portfolios of Investments. A summary of these investments in affiliated funds is set forth below:
| | | Balance | | | | | | | | | Balance | | | | | | Dividends | | | Amount of Gain | |
| | | December 31, | | | | | | | | | December 31, | | | | | | Credited to | | | (Loss) Realized on | |
| Fund | | 2016 | | | Purchases | | | Sales | | | 2017 | | | Fair Value | | | Income | | | Sale of Shares | |
| Rational Dividend Capture Fund, Inst. Sh. | | | 213,408 | | | | 7,972 | | | | 94,677 | | | | 126,703 | | | | 1,016,157 | | | | 64,655 | | | | 63,987 | |
| Rational Risk Managed Emerging Markets Fund, Inst. Sh. | | | 351,650 | | | | 13,908 | | | | 87,344 | | | | 278,214 | | | | 2,022,614 | | | | 29,205 | | | | (200,839 | ) |
| Rational Dynamic Brands Fund, Inst. Sh. | | | 333,187 | | | | 58,414 | | | | 91,657 | | | | 299,944 | | | | 1,046,804 | | | | 63,643 | | | | 26,688 | |
| Catalyst Dynamic Alpha Fund, Inst. Sh. | | | 66,979 | | | | 1,092 | | | | 20,111 | | | | 47,960 | | | | 1,062,316 | | | | 193 | | | | 123,596 | |
| Catalyst MLP & Infrastructure Fund, Inst, Sh. | | | 137,689 | | | | 15,163 | | | | — | | | | 152,852 | | | | 886,541 | | | | 14,023 | | | | — | |
| Catalyst/Stone Beach Income Opportunity Fund, Inst. Sh. | | | 156,858 | | | | 5,888 | | | | — | | | | 162,746 | | | | 1,565,613 | | | | 29,763 | | | | — | |
| Catalyst Insider Income Fund Inst. Sh. | | | — | | | | 65,370 | | | | — | | | | 65,370 | | | | 605,982 | | | | 7,933 | | | | — | |
| Catalyst Floating Rate Income Fund, Inst. Sh. | | | — | | | | 65,744 | | | | — | | | | 65,744 | | | | 630,488 | | | | 15,828 | | | | — | |
| Ecological Strategy ETF | | | 58,183 | | | | — | | | | 19,000 | | | | 39,183 | | | | 1,623,743 | | | | 93,620 | | | | 230,683 | |
| US Market Rotation Strategy ETF | | | 56,069 | | | | — | | | | 16,500 | | | | 39,569 | | | | 1,517,471 | | | | 104,820 | | | | 189,006 | |
| AlphaCentric Income Opportunities Fund, Inst. Sh. | | | 35,507 | | | | 54,173 | | | | — | | | | 89,680 | | | | 1,098,578 | | | | 37,927 | | | | — | |
| (4) | INVESTMENT TRANSACTIONS |
For the year or period ended December 31, 2017, aggregate purchases and proceeds from sales of investment securities (excluding short-term investments) for the Funds were as follows:
| | | | | | | | | U.S. Government | |
| Fund | | Purchases | | | Sales | | | Purchases | | | Sales | |
| Dividend Capture Fund | | $ | 108,889,721 | | | $ | 152,620,175 | | | $ | 3,198,345 | | | $ | 3,200,000 | |
| Emerging Markets Fund | | | 9,039,876 | | | | 11,438,372 | | | | — | | | | — | |
| Hedged Return Fund | | | 4,972,681 | | | | 10,110,434 | | | | — | | | | — | |
| Dynamic Brands Fund | | | 51,521,574 | | | | 56,114,048 | | | | — | | | | — | |
| Strategic Allocation Fund | | | 2,380,391 | | | | 4,452,353 | | | | — | | | | — | |
| Dynamic Momentum Fund | | | — | | | | — | | | | — | | | | — | |
| Iron Horse Fund | | | 46,928,001 | | | | 43,944,681 | | | | — | | | | — | |
| (5) | FOREIGN INVESTMENT RISK |
Compared with investing in the United States, investing in foreign markets involves a greater degree and variety of risk. Investors in international or foreign markets may face delayed settlements, currency controls and adverse economic developments as well as higher overall transaction costs. In addition, fluctuations in the U.S. dollar’s value versus other currencies may erode or reverse gains from investments denominated in foreign currencies or widen losses. Foreign governments may expropriate assets, impose capital or currency controls, impose punitive taxes, impose limits on ownership or nationalize a company or industry. Any of these actions could have severe effect on security prices and impair the Funds’ ability to bring its capital or income back to the U.S. Exchange rate. Fluctuations also may impair an issuer’s ability to repay U.S. dollar denominated debt, thereby increasing credit risk of such debt. Finally, the value of foreign securities may be affected by incomplete, less frequent or inaccurate financial information about their issuers, social upheavals or political actions ranging from tax code changes to government collapse. Foreign companies may also receive less coverage than U.S. companies by market analysts, and financial reporting standards or regulatory requirements may not be comparable to those applicable to U.S. companies.
In accordance with its investment objectives and through its exposure to the managed futures programs, the Dynamic Momentum Fund may have increased or decreased exposure to one or more of the following risk factors defined below:
| RATIONAL FUNDS | |
| CONSOLIDATED NOTES TO FINANCIAL STATEMENTS (Continued) |
| December 31, 2017 | ANNUAL REPORT |
Commodity Risk – Commodity risk relates to the change in value of commodities or commodity indexes as they relate to increases or decreases in the commodities market. Commodities are physical assets that have tangible properties. Examples of these types of assets are crude oil, heating oil, metals, livestock, and agricultural products.
Foreign Exchange Rate Risk – Foreign exchange rate risk relates to the change in the U.S. dollar value of a security held that is denominated in a foreign currency. The U.S. dollar value of a foreign currency denominated security will decrease as the dollar appreciates against the currency, while the U.S. dollar value will increase as the dollar depreciates against the currency.
Interest Rate Risk – Interest rate risk refers to the fluctuations in value of fixed-income securities resulting from the inverse relationship between price and yield. For example, an increase in general interest rates will tend to reduce the market value of already issued fixed-income investments, and a decline in general interest rates will tend to increase their value. In addition, debt securities with longer maturities, which tend to have higher yields, are subject to potentially greater fluctuations in value from changes in interest rates than obligations with shorter maturities.
Volatility Risk – Volatility risk refers to the magnitude of the movement, but not the direction of the movement, in a financial instrument’s price over a defined time period. Large increases or decreases in a financial instrument’s price over a relative time period typically indicate greater volatility risk, while small increases or decreases in its price typically indicate lower volatility risk.
In accordance with its investment objectives and through its exposure to options, the Iron Horse Fund and Hedged Return Fund may have increased or decreased exposure to Option Risk factors defined below:
Options Risk – The Iron Horse Fund and Hedged Return Fund are subject to equity price risks in the normal course of pursuing their investment objective and may purchase or sell options. The seller (writer) of a call option which is covered (e.g., the writer holds the underlying security) assumes the risk of a decline in the market price of an underlying security below the purchase price of an underlying security less the premium received, and gives up the opportunity for gain on the underlying security above the exercise price of the option. The seller of an uncovered call option assumes the risk of a theoretical unlimited increase in the market price of an underlying security above the exercise price of the option. The securities necessary to satisfy the exercise of the call option may be unavailable for purchase except at much higher prices. Purchasing securities to satisfy the exercise of the call option can itself cause the price of securities to rise further, sometimes by a significant amount, thereby exacerbating the loss. The buyer of a call option assumes the risk of losing its entire premium invested in the call option. The seller (writer) of a put option which is covered (e.g., the writer has a short position in the underlying security) assumes the risk of an increase in the market price of the underlying security above the sales price (in establishing the short position) of the underlying security plus the premium received, and gives up the opportunity for gain on the underlying security below the exercise price of the option. The seller of an uncovered put option assumes the risk of a decline in the market price of the underlying security below the exercise price of the option. The buyer of a put option assumes the risk of losing his entire premium invested in the put option.
Please refer to the Funds’ prospectus for a full listing of risks associated with these investments.
| RATIONAL FUNDS | |
| CONSOLIDATED NOTES TO FINANCIAL STATEMENTS (Continued) |
| December 31, 2017 | ANNUAL REPORT |
| (6) | DISTRIBUTIONS TO SHAREHOLDERS AND TAX COMPONENTS OF CAPITAL |
The tax character of distributions paid during the years or periods ended December 31, 2017 and December 31, 2016 was as follows:
| For fiscal year or period ended | | Ordinary | | | Long-Term | | | Return of | | | | |
| 12/31/2017 | | Income | | | Capital Gains | | | Capital | | | Total | |
| Dividend Capture Fund | | $ | 2,396,564 | | | $ | — | | | $ | — | | | $ | 2,396,564 | |
| Emerging Markets Fund | | | 77,972 | | | | 423,210 | | | | — | | | | 501,182 | |
| Hedged Return Fund | | | 311,816 | | | | — | | | | — | | | | 311,816 | |
| Dynamic Brands Fund | | | 1,231,156 | | | | 2,812,381 | | | | — | | | | 4,043,537 | |
| Strategic Allocation Fund | | | 463,261 | | | | — | | | | 107,881 | | | | 571,142 | |
| Dynamic Momentum Fund | | | 37 | | | | 4,244 | | | | — | | | | 4,281 | |
| Iron Horse Fund | | | 50,235 | | | | — | | | | 617,108 | | | | 667,343 | |
| | | | | | | | | | | | | | | | | |
| For fiscal year or period ended | | Ordinary | | | Long-Term | | | Return of | | | | |
| 12/31/2016 | | Income | | | Capital Gains | | | Capital | | | Total | |
| Dividend Capture Fund | | $ | 1,554,447 | | | $ | 1,153,334 | | | $ | — | | | $ | 2,707,781 | |
| Emerging Markets Fund | | | — | | | | 1,119,093 | | | | 102,601 | | | | 1,221,694 | |
| Hedged Return Fund | | | 694,774 | | | | — | | | | — | | | | 694,774 | |
| Dynamic Brands Fund | | | 981,842 | | | | 4,834,267 | | | | — | | | | 5,816,109 | |
| Strategic Allocation Fund | | | 320,079 | | | | 1,399,124 | | | | — | | | | 1,719,203 | |
| Dynamic Momentum Fund | | | — | | | | — | | | | — | | | | — | |
| For fiscal year ended | | Ordinary | | | Long-Term | | | Return of | | | | |
| 3/31/2017 | | Income | | | Capital Gains | | | Capital | | | Total | |
| Iron Horse Fund | | $ | 70,160 | | | $ | — | | | $ | 203,098 | | | $ | 273,258 | |
| | | | | | | | | | | | | | | | | |
As of December 31, 2017, the components of accumulated earnings/(deficit) on a tax basis were as follows:
| | | Undistributed | | | Undistributed | | | Post October Loss | | | Capital Loss | | | Other | | | Unrealized | | | Total | |
| | | Ordinary | | | Long-Term | | | and | | | Carry | | | Book/Tax | | | Appreciation/ | | | Accumulated | |
| | | Income | | | Capital Gains | | | Late Year Loss | | | Forwards | | | Differences | | | (Depreciation) | | | Earnings/(Deficits) | |
| Dividend Capture Fund | | $ | 1,456,800 | | | $ | — | | | $ | — | | | $ | (5,083,685 | ) | | $ | — | | | $ | 160,086 | | | $ | (3,466,799 | ) |
| Emerging Markets Fund | | | — | | | | 76,584 | | | | — | | | | — | | | | — | | | | 2,032,585 | | | | 2,109,169 | |
| Hedged Return Fund | | | — | | | | — | | | | — | | | | (4,566,322 | ) | | | — | | | | — | | | | (4,566,322 | ) |
| Dynamic Brands Fund | | | 698,473 | | | | — | | | | — | | | | — | | | | — | | | | 803,719 | | | | 1,502,192 | |
| Strategic Allocation Fund | | | — | | | | — | | | | — | | | | (502,978 | ) | | | — | | | | 1,134,299 | | | | 631,321 | |
| Dynamic Momentum Fund | | | 286,133 | | | | — | | | | — | | | | — | | | | — | | | | 32,984 | | | | 319,117 | |
| Iron Horse Fund | | | — | | | | — | | | | — | | | | (25,071 | ) | | | (43,670 | ) | | | 215,966 | | | | 147,225 | |
The difference between book basis and tax basis unrealized appreciation (depreciation), undistributed ordinary income (loss) and accumulated net realized gain (loss) from investments is primarily attributable to the tax deferral of losses on wash sales and straddles, mark-to-market on open futures and options contracts, and passive foreign investment companies, and adjustments for partnerships, real estate investment trusts, C-Corporation return of capital distributions,
| RATIONAL FUNDS | |
| CONSOLIDATED NOTES TO FINANCIAL STATEMENTS (Continued) |
| December 31, 2017 | ANNUAL REPORT |
and trust preferred securities. The unrealized appreciation (depreciation) in the table above includes unrealized foreign currency losses of $(5,107), $(23,978) and $1,152 for the Dynamic Brands Fund, Emerging Markets Fund and Dynamic Momentum Fund, respectively. In addition, the amount listed under other book/tax differences for the Iron Horse Fund is primarily attributable to the tax deferral of losses on straddles.
The Regulated Investment Company Modernization Act of 2010 which was enacted on December 22, 2010 requires the Fund to utilize post-enactment (non-expiring) capital losses prior to pre-enactment capital loss carryovers for fiscal year ends beginning after the date of enactment. As a result, there may be greater likelihood that all or a portion of the Fund’s pre-enactment capital loss carryovers may expire without being utilized. At December 31, 2017, the Funds had capital loss carry forwards for federal income tax purposes available to offset future capital gains along with capital loss carry forwards utilized and expired in the current year as follows:
| | | | | | | | | | | | | | | Capital Loss | | | Capital Loss | |
| | | | | | Non-Expiring | | | Non-Expiring | | | | | | Carry Forwards | | | Carry Forwards | |
| | | Expiring 2018 | | | Short-Term | | | Long-Term | | | Total | | | Utilized | | | Expired | |
| Dividend Capture Fund | | $ | — | | | $ | 2,120,204 | | | $ | 2,963,481 | | | $ | 5,083,685 | | | $ | — | | | $ | — | |
| Emerging Markets Fund | | | — | | | | — | | | | — | | | | — | | | | — | | | | — | |
| Hedged Return Fund * | | | 2,136,294 | | | | 512,306 | | | | 1,917,722 | | | | 4,566,322 | | | | 55,514 | | | | 12,599,554 | |
| Dynamic Brands Fund | | | — | | | | — | | | | — | | | | — | | | | — | | | | — | |
| Strategic Allocation Fund | | | — | | | | 262,121 | | | | 240,857 | | | | 502,978 | | | | 114,472 | | | | — | |
| Dynamic Momentum Fund | | | — | | | | — | | | | — | | | | — | | | | — | | | | — | |
| Iron Horse Fund | | | — | | | | 25,071 | | | | — | | | | 25,071 | | | | 752,224 | | | | — | |
| * | The Rational Hedged Return Fund experienced a shareholder change in ownership resulting in an annual limitation on the amount of pre-change capital loss carry-forwards available to be recognized in each year. Due to IRC Section 382 limitations, utilization of these carry forwards is limited to a maximum of $92,691 per year. |
Permanent book and tax differences, primarily attributable to the book/ tax basis treatment of net operating losses and short-term capital gains, foreign currency gains (losses), non-deductible expenses, the expiration of capital loss carry forwards, the reclassification of Fund distributions, and adjustments related to real estate investment trusts, partnerships, passive foreign investment companies, C-Corporation return of capital distributions, statutory trusts, trust preferred securities, and adjustments for the Dynamic Momentum Fund’s wholly owned subsidiary resulted in reclassification for the following Funds for the year or period ended December 31, 2017 as follows:
| | | Paid | | | Undistributed | | | Accumulated | | | | |
| | | In | | | Ordinary | | | Net Realized | | | Net Unrealized | |
| | | Capital | | | Income (Loss) | | | Gains (Loss) | | | Gains (Loss) | |
| Dividend Capture Fund | | $ | — | | | $ | (184,024 | ) | | $ | 184,024 | | | $ | — | |
| Emerging Markets Fund | | | — | | | | 1,072 | | | | (1,072 | ) | | | — | |
| Hedged Return Fund | | | (12,608,941 | ) | | | 243,469 | | | | 12,365,472 | | | | — | |
| Dynamic Brands Fund | | | — | | | | (41,081 | ) | | | 41,081 | | | | — | |
| Strategic Allocation Fund | | | (107,881 | ) | | | 107,881 | | | | — | | | | — | |
| Dynamic Momentum Fund | | | (137,101 | ) | | | 393,097 | | | | (158,924 | ) | | | (97,072 | ) |
| Iron Horse Fund | | | — | | | | (3,911 | ) | | | 3,911 | | | | — | |
| (7) | UNDERLYING INVESTMENTS IN OTHER INVESTMENT COMPANIES |
Each underlying fund, including each exchange-traded fund (“ETF”), is subject to specific risks, depending on the nature of the underlying fund. These risks could include liquidity risk, sector risk, foreign and related currency risk, as well as risks associated with real estate investments and commodities. Investors in the Funds will indirectly bear fees and expenses charged by the underlying investment companies in which the Funds invest in addition to the Funds’ direct fees and expenses.
| RATIONAL FUNDS | |
| CONSOLIDATED NOTES TO FINANCIAL STATEMENTS (Continued) |
| December 31, 2017 | ANNUAL REPORT |
The performance of the Funds may be directly affected by the performance of the Fidelity Institutional Government Portfolio, Institutional Class. The Fidelity Institutional Government Portfolio normally invests at least 95% of its assets in U.S. Government securities and repurchase agreements for those securities. The financial statements of the Fidelity Institutional Government Portfolio, including the portfolio of investments, can be found at the Securities and Exchange Commission’s (“SEC”) website www.sec.gov and should be read in conjunction with the Fund’s financial statements. As of December 31, 2017, the percentage of the Dynamic Momentum Fund’s net assets invested in the Fidelity Institutional Government Portfolio was 82.0%.
The performance of the Funds may be directly affected by the performance of the Federated Treasury Obligations Fund, Institutional Class. The Federated Treasury Obligations Fund normally invests at least 99.5% of its assets in U.S. Government securities, repurchase agreements for those securities and cash. The financial statements of the Federated Treasury Obligations Fund, including the portfolio of investments, can be found at the Securities and Exchange Commission’s (“SEC”) website www.sec.gov and should be read in conjunction with the Fund’s financial statements. As of December 31, 2017, the percentage of the Hedged Return Fund’s net assets invested in the Federated Treasury Obligations Fund was 48.2%.
The beneficial ownership, either directly or indirectly, of more than 25% of the voting securities of a fund creates a presumption of control of the fund, under Section 2(a)(9) of the 1940 Act. As of December 31, 2017, the companies that held more than 25% of the voting securities of the Funds, and may be deemed to control each respective Fund, are as follows:
| | | | | | | | | | | | | | | | | | Dynamic | | | | |
| | | Dividend | | | Emerging | | | Hedged Return | | | Dynamic | | | Strategic | | | Momentum | | | Iron | |
| | | Capture Fund | | | Markets Fund | | | Fund | | | Brands Fund | | | Allocation Fund | | | Fund | | | Horse Fund | |
| NFS LLC (1) | | | 61.68 | % | | | 60.80 | % | | | 35.38 | % | | | 74.41 | % | | | 97.80 | % | | | — | | | | 31.20 | % |
| Scott Kimple | | | — | | | | — | | | | 52.13 | % | | | — | | | | — | | | | — | | | | — | |
| Ralph Parker | | | — | | | | — | | | | — | | | | — | | | | — | | | | 70.57 | % | | | — | |
| Charles Schwab (1) | | | — | | | | — | | | | — | | | | — | | | | — | | | | — | | | | 26.97 | % |
| (1) | This owner is comprised of multiple investors and accounts. |
Management of the Funds has evaluated the need for disclosure and/or adjustments resulting from subsequent events through the date these financial statements were issued.
Effective February 27, 2018 the Rational Dynamic Momentum Fund changed its name to Rational/Resolve Adaptive Asset Allocation Fund. The Fund’s investment strategy changed and a new Sub-Advisor replaced the prior sub-advisor.
REPORT OF INDEPENDENT REGISTERED PUBLIC ACCOUNTING FIRM
To the Shareholders of Rational Dividend Capture Fund, Rational Risk Managed Emerging Markets Fund, Rational Hedged Return Fund (formerly, Rational Real Strategies Fund), Rational Dynamic Brands Fund (formerly, Rational Defensive Growth Fund), Rational Strategic Allocation Fund, Rational Iron Horse Fund, and Rational Dynamic Momentum Fund and
Board of Trustees of Mutual Fund and Variable Insurance Trust
Opinion on the Financial Statements
We have audited the accompanying statements of assets and liabilities, including the portfolios of investments, of Rational Dividend Capture Fund, Rational Risk Managed Emerging Markets Fund, Rational Hedged Return Fund (formerly, Rational Real Strategies Fund), Rational Dynamic Brands Fund (formerly, Rational Defensive Growth Fund), Rational Strategic Allocation Fund, Rational Iron Horse Fund, and the accompanying consolidated statement of assets and liabilities, including the consolidated portfolio of investments, of Rational Dynamic Momentum Fund, each a series of Mutual Fund and Variable Insurance Trust (the “Funds”) as of December 31, 2017, and the related statements of operations for the year or period then ended, the statements of changes in net assets for each of the two years or periods in the year or period then ended, including the related notes, and the financial highlights for each of the two periods in the period then ended for the Rational Dividend Capture Fund, Rational Risk Managed Emerging Markets Fund, Rational Hedged Return Fund, Rational Dynamic Brands Fund, and Rational Strategic Allocation Fund, and the related statements of operations for the two periods in the period then ended, the statements of changes in net assets for each of the three periods in the period then ended, including the related notes, and the financial highlights for each of the six periods in the period then ended for the Rational Iron Horse Fund, and the related consolidated statement of operations for the year then ended, and the consolidated statements of changes in net assets and the consolidated financial highlights for each of the two periods in the period then ended for the Rational Dynamic Momentum Fund (collectively referred to as the “financial statements”). In our opinion, the financial statements present fairly, in all material respects, the financial position of each of the Funds as of December 31, 2017, the results of their operations for the year or periods then ended, and the changes in their net assets and the financial highlights for the periods indicated above, in conformity with accounting principles generally accepted in the United States of America.
The Funds’ financial statements and financial highlights for the periods ended December 2015 and prior, with the exception of the Rational Iron Horse Fund, were audited by other auditors, whose report dated February 29, 2016, expressed an unqualified opinion on those financial statements and financial highlights.
Basis for Opinion
These financial statements are the responsibility of the Funds’ management. Our responsibility is to express an opinion on the Funds’ financial statements based on our audits. We are a public accounting firm registered with the Public Company Accounting Oversight Board (United States) (“PCAOB”) and are required to be independent with respect to the Funds in accordance with the U.S. federal securities laws
and the applicable rules and regulations of the Securities and Exchange Commission and the PCAOB.
We conducted our audits in accordance with the standards of the PCAOB. Those standards require that we plan and perform the audit to obtain reasonable assurance about whether the financial statements are free of material misstatement, whether due to error or fraud.
Our audits include performing procedures to assess the risks of material misstatement of the financial statements, whether due to error or fraud, and performing procedures that respond to those risks. Such procedures include examining, on a test basis, evidence regarding the amounts and disclosures in the financial statements and confirmation of securities owned as of December 31, 2017, by correspondence with the custodian and brokers. Our audits also included evaluating the accounting principles used and significant estimates made by management, as well as evaluating the overall presentation of the financial statements. We believe that our audits provide a reasonable basis for our opinion.
We have served as the Funds’ auditor since 2016, with the exception of the Rational Iron Horse Fund, which we have served as the Fund’s auditor since 2011.
COHEN & COMPANY, LTD.
Cleveland, Ohio
March 1, 2018
| RATIONAL FUNDS |
| INFORMATION ABOUT YOUR FUNDS’ EXPENSES (Unaudited) |
As a shareholder of the Fund(s), you incur two types of costs: (1) transaction costs, including sales charges (loads) on purchase payments; and (2) ongoing costs, including management fees, distribution and/or service (12b-1) fees; and other Fund expenses. The example below is intended to help you understand your ongoing costs (in dollars) of investing in the Funds and to compare these costs with the ongoing costs of investing in other mutual funds.
The example below illustrates an investment of $1,000 invested at the beginning of the period (07/01/17) and held for the entire period through 12/31/17.
Actual Expenses
The first section of each table below provides information about actual account values and actual expenses. You may use the information in these sections, together with the amount you invested, to estimate the expenses that you paid over the period. Simply divide your account value by $1,000 (for example, an $8,600 account value divided by $1,000 = 8.6), then multiply the result by the number in the first row under the heading entitled “Expenses Paid During the Period” to estimate the expenses you paid on your account during this period.
Hypothetical Example for Comparison Purposes
The second section of each table provides information about the hypothetical account values and hypothetical expenses based on each Fund’s actual expense ratio and an assumed rate of return of 5% per year before expenses, which is not the Funds’ actual return. The hypothetical account values and expenses may not be used to estimate the actual ending account balance or expenses you paid for the period. You may use this information to compare the ongoing costs of investing in the Funds and other funds. To do so, compare this 5% hypothetical example with the 5% hypothetical examples that appear in the shareholder reports of the other funds.
Please note that the expenses shown in the table are meant to highlight your ongoing costs only and do not reflect any transactional costs, such as sales charges (loads) or exchange fees. Therefore, the second section of the table is useful in comparing ongoing costs only, and will not help you determine the relative total costs of owning different funds. In addition, if these transactional costs were included, your costs would have been higher. For more information on transactional costs, please refer to the Funds’ prospectus.
| | | | | | | | | | | | Hypothetical | |
| | | | | | | | | Actual | | | (5% return before expenses) | |
| | | Fund’s | | | Beginning | | | Ending | | | Expenses Paid | | | Ending | | | | |
| | | Annualized | | | Account Value | | | Account Value | | | During Period | | | Account Value | | | Expenses Paid | |
| | | Expense Ratio | | | 07/01/2017 | | | 12/31/2017 | | | * | | | 12/31/2017 | | | During Period * | |
| Rational Dividend Capture Fund - Class A | | | 1.25 | % | | $ | 1,000.00 | | | $ | 986.50 | | | $ | 6.26 | | | $ | 1,018.90 | | | $ | 6.36 | |
| Rational Dividend Capture Fund - Class C | | | 1.75 | % | | | 1,000.00 | | | | 984.10 | | | | 8.75 | | | | 1,016.38 | | | | 8.89 | |
| Rational Dividend Capture Fund - Institutional Class | | | 1.00 | % | | | 1,000.00 | | | | 987.80 | | | | 5.01 | | | | 1,020.16 | | | | 5.09 | |
| Rational Risk Managed Emerging Markets Fund - Class A | | | 1.50 | % | | | 1,000.00 | | | | 1,133.00 | | | | 8.06 | | | | 1,017.64 | | | | 7.63 | |
| Rational Risk Managed Emerging Markets Fund - Class C | | | 2.25 | % | | | 1,000.00 | | | | 1,129.40 | | | | 12.08 | | | | 1,013.86 | | | | 11.42 | |
| Rational Risk Managed Emerging Markets Fund - Institutional Class | | | 1.25 | % | | | 1,000.00 | | | | 1,133.70 | | | | 6.72 | | | | 1,018.90 | | | | 6.36 | |
| Rational Hedged Return Fund - Class A | | | 1.14 | % | | | 1,000.00 | | | | 1,133.00 | | | | 6.13 | | | | 1,019.46 | | | | 5.80 | |
| Rational Hedged Return Fund - Class C | | | 1.39 | % | | | 1,000.00 | | | | 1,131.70 | | | | 7.47 | | | | 1,018.20 | | | | 7.07 | |
| Rational Hedged Return Fund - Institutional Class | | | 2.14 | % | | | 1,000.00 | | | | 1,135.30 | | | | 11.52 | | | | 1,014.42 | | | | 10.87 | |
| Rational Dynamic Brands Fund - Class A | | | 1.25 | % | | | 1,000.00 | | | | 1,135.10 | | | | 6.73 | | | | 1,018.90 | | | | 6.36 | |
| Rational Dynamic Brands Fund - Class C | | | 1.75 | % | | | 1,000.00 | | | | 1,131.90 | | | | 9.40 | | | | 1,016.38 | | | | 8.89 | |
| Rational Dynamic Brands Fund - Institutional Class | | | 1.00 | % | | | 1,000.00 | | | | 1,137.50 | | | | 5.39 | | | | 1,020.16 | | | | 5.09 | |
| Rational Strategic Allocation Fund - Class A | | | 0.70 | % | | | 1,000.00 | | | | 1,066.60 | | | | 3.65 | | | | 1,021.68 | | | | 3.57 | |
| Rational Strategic Allocation Fund - Class C | | | 1.45 | % | | | 1,000.00 | | | | 1,062.70 | | | | 7.54 | | | | 1,017.90 | | | | 7.37 | |
| Rational Strategic Allocation Fund - Insitutional Class | | | 0.45 | % | | | 1,000.00 | | | | 1,068.30 | | | | 2.35 | | | | 1,022.94 | | | | 2.29 | |
| Rational Dynamic Momentum Fund - Class A | | | 2.24 | % | | | 1,000.00 | | | | 1,061.00 | | | | 11.64 | | | | 1,013.91 | | | | 11.37 | |
| Rational Dynamic Momentum Fund - Class C | | | 2.99 | % | | | 1,000.00 | | | | 1,057.50 | | | | 15.51 | | | | 1,010.13 | | | | 15.15 | |
| Rational Dynamic Momentum Fund - Institutional Class | | | 1.99 | % | | | 1,000.00 | | | | 1,062.50 | | | | 10.35 | | | | 1,015.17 | | | | 10.11 | |
| Rational Iron Horse - Class A | | | 1.95 | % | | | 1,000.00 | | | | 1,041.60 | | | | 10.03 | | | | 1,015.38 | | | | 9.91 | |
| Rational Iron Horse - Class C | | | 2.70 | % | | | 1,000.00 | | | | 1,038.80 | | | | 13.88 | | | | 1,011.59 | | | | 13.69 | |
| Rational Iron Horse - Institutional Class | | | 1.70 | % | | | 1,000.00 | | | | 1,042.80 | | | | 8.75 | | | | 1,016.64 | | | | 8.64 | |
| * | Expenses are equal to the Funds’ annualized expense ratios multiplied by the average account value over the period, multiplied by 184/365 to reflect the one-half year period. |
| ** | Annualized expense ratio does not include interest expenses or dividend expenses. |
For more information on Fund expenses, please refer to the Funds’ prospectus, which can be obtained from your investment representative or by calling 1-866-447-4228. Please read it carefully before you invest or send money.
| RATIONAL FUNDS | |
| SUPPLEMENTAL INFORMATION (Unaudited) |
| December 31, 2017 | ANNUAL REPORT |
Consideration and Renewal of Management Agreement between Rational Advisors, Inc. and Mutual Fund and Variable Insurance Trust with respect to Rational Dividend Capture Fund, Rational Risk Managed Emerging Markets Fund, Rational Hedged Return Fund, Rational Dynamic Brands Fund, and Rational Strategic Allocation Fund.
In connection with a regular meeting held on December 15, 2017, the Board of Trustees (the “Board” or the “Trustees”) of Mutual Fund and Variable Insurance Trust (the “Trust”), including a majority of the Trustees who are not “interested persons” as that term is defined in the Investment Company Act of 1940, as amended (the “1940 Act”), discussed the renewal of the management agreement between the Trust and Rational Advisors, Inc. (“Rational” or “Advisor”), with respect to Rational Dividend Capture Fund, Rational Risk Managed Emerging Markets Fund, Rational Hedged Return Fund, Rational Dynamic Brands Fund, and Rational Strategic Allocation Fund, (each a “Fund” collectively the “Renewal Funds”) (the “Management Agreement”).
Counsel assisted the Trustees in reviewing Rational’s responses to a series of questions regarding, among other things, the investment performance of each Rational Renewal Funds, Rational’s services to each Renewal Fund, comparative fee and expense limitation information, and Rational’s profitability from advising each Renewable Fund (the “Rational 15c Response.) The Trustees relied upon the advice of counsel and their own business judgment in evaluating and weighting each of the factors to be considered. The conclusions reached by the Trustees were based upon a comprehensive evaluation and discussion of all the information provided in the Rational 15c Response for each Fund with respect to the approval of the Management Agreement.
Nature and Extent of Services. The Trustees discussed the background and experience of senior personnel at the firm. The Trustees then discussed the nature of Rational’s operations and the quality of its compliance program. They considered that the Advisor is responsible for monitoring eachsub-advisor’s performance and compliance and risk management with legal standards as well as compliance in trading within the Rational Funds’ investment strategy. The Trust’s CCO confirmed that Rational has a compliance program designed to prevent violations of applicable laws. They noted their satisfaction with Rational’s commentary on performance and insight as to each sub-advisor’s management. After further discussion and review of the Rational 15(c) Response; the Trustees concluded that the Advisor will continue to provide an acceptable level of services to the Renewal Funds.
Performance. The Trustees reviewed the performance of each Renewal Fund relative to some or all of one or more benchmark indices, a peer group and its respective Morningstar category or categories.
Dividend Capture Fund. The Trustees noted the Fund underperformed its peer group and the Morningstar category, Large Value, while also lagging the S&P 500 Total Return Index and the S&P 500 Value Total Return Index for the 1, 5 and 10 year periods and, where comparison data was available, since inception period. They recalled their discussions with a representative of Rational earlier in the meeting, noting that the underperformance of the Fund was the result of a focus on dividend yield and the manager’s risk management process over the past few years which resulted in reducing equity
| RATIONAL FUNDS | |
| SUPPLEMENTAL INFORMATION (Unaudited)(Continued) |
| December 31, 2017 | ANNUAL REPORT |
exposure during a strong equity rally. They further noted that adjustments were made to the hedging strategy and the Fund’s performance had improved in the months since September 30, 2017. Based on the Board’s discussion with Rational regarding the Fund’s hedging strategy, the Board was satisfied that each Fund’s performance should improve.
Risk Managed Emerging Markets Fund. The Trustees noted the Risk Managed Emerging Markets Fund lagged its peer group average benchmark and Morningstar category for the 1 year period, and its benchmark and Morningstar category for the 5 year period but had outperformed its peer group for the 5 year and since inception periods. The Trustees considered the Advisor’s explanation that the Fund’s underperformance compared to each metric for the one year period was a result of the Fund’s risk managed approach in a rapidly rising market environment. The Board concluded that the Fund’s performance was acceptable.
Hedged Return Fund. The Trustees noted for the one year period, the Fund outperformed its peer group and the Morningstar Managed Futures category, while trailing the Morningstar Options Based category and the S&P 500 TR Index. For the 5 year and 10 year and since inception periods, the Trustees noted the Hedged Return Fund underperformed the peer group average, Morningstar Options-based and Managed Futures, and the S&P 500 TR Index. The Trustees discussed the change in investment strategy and the addition of a new sub-adviser effective December 2, 2017, and Rational’s expectation for the future performance of the Fund. The Board determined that it was satisfied that the Fund’s performance could improve in the future.
Dynamic Brands Fund. The Trustees noted the Dynamic Brands Fund underperformed its peer group and the Morningstar Large Blend category, for the 1, 5, and 10 year periods, while slightly outperforming its peer group and the Morningstar category since inception. The Board noted the Advisor’s explanation that the Fund’s recent underperformance is the result of its sector allocations and noted that the Dynamic Brands Fund operated under a different strategy prior to November 2017. While the Fund’s performance trailed the peer group average, Morningstar category and benchmarks for all periods except for the peer group and Morningstar category for the since inception period, the performance of the Fund was within the range of its peer group for the one year period. After further discussion regarding the Fund’s change in strategy and the appointment of a new sub-adviser, the Board was satisfied that the Fund’s performance would improve.
Strategic Allocation Fund. The Trustees noted that the Strategic Allocation Fund lagged the peer group, Morningstar Strategic Allocation Index and the S&P TR Index for all periods shown. They noted Rational’s representation that the Strategic Allocation Fund has underperformed in the short term due to its allocations to the Dividend Capture Fund and the Catalyst MLP & Infrastructure Fund and that for the longer-term, the Fund was managed by different investment advisor personnel. The Trustees concluded that performance of the Strategy Allocation Fund was nonetheless acceptable.
| RATIONAL FUNDS | |
| SUPPLEMENTAL INFORMATION (Unaudited)(Continued) |
| December 31, 2017 | ANNUAL REPORT |
Fees and Expenses. The Trustees reviewed the advisory fees for each Renewal Fund as compared to its respective peer group and respective Morningstar category.
With respect to the Dividend Capture Fund, the Trustees noted that the advisory fee of 0.75% for the Fund was slightly higher that the average for both the peer group and the Morningstar category, Large Value, and within the range of fees for the categories. In reviewing the overall expense ratios, the Trustees noted it was slightly higher than the averages, but within the high and low range its peer group and Morningstar category.
As to the Risk Managed Emerging Markets Fund, the advisory fee of 1.00% was found to be inline with the average advisory fee for its peer group and Morningstar category, Diversified Emerging Markets. The Trustees noted the expense ratio of 1.53% was in-line with the peer group and Morningstar category, and well within the high and low range of its peer group and Morningstar category.
In their review of Hedged Return Fund, the Trustees noted the 1.75% advisory fee was slightly above the peer group average and Morningstar Options Based category average, and Managed Futures category average, while lower than the high end of the range for advisory fees. The Board further noted that the Fund’s expense ratio of 2.24%, was slightly higher than the average for both peer group and Morningstar categories; while mid-range as measured by net expense ratios.
With respect to the Dynamic Brands Fund, the Trustees noted the advisory fee of 0.75% was below the average for the peer group, while slightly higher than the Morningstar Large Blend category average. The Board further noted that the advisory fee was below the high for both the peer group and Morningstar category. The Dynamic Brands Fund expense ratio of 1.25% was below the average of the peer group and within the range of the Morningstar category.
In regards to the Strategic Allocation Fund, the Trustees noted that advisory fee of 0.10% was lower than both the peer group and Morningstar category, Allocation 50% - 70% Equity, and near the low range of advisory fees for both groups. Overall, the Board noted the expense ratio for Strategic Allocation Fund of 1.65% was slightly above the average expense ratio for both the peer group and the Morningstar category, while being mid-range in both categories.
The Trustees discussed the allocation of fees between Rational and each Rational Renewable Fund’s sub-advisor relative to its respective duties and other factors, and agreed that the allocation of fees between Rational and the sub-advisor of Dividend Capture Fund, Risk Managed Emerging Markets Fund, Dynamic Brands Fund and Hedged Return Fund, respectively, was appropriate. In considering the investment strategy, range of fees within each category, the size of the Rational Renewal Funds, and in recognition of the unique strategies offered by many of the Rational Renewal Funds, the Board determined that the advisory fees in each case were not unreasonable.
| RATIONAL FUNDS | |
| SUPPLEMENTAL INFORMATION (Unaudited)(Continued) |
| December 31, 2017 | ANNUAL REPORT |
Profitability. The Trustees reviewed a profitability analysis provided for each Rational Renewal Fund. With regards to the Dynamic Brands Fund and the Hedged Return Fund, due to the addition of a sub-advisor and changes in the investment strategy during the fourth quarter 2017, the Adviser estimated no to modest profitability for the first or second year of operations with respect to advisory services and no profits based on the totality of the relationship.
The Trustees noted that the Advisor realized a modest profit or outright loss in connection with respect to advisory services and no profits based on the totality of its relations with each of the Rational Renewable Funds. They considered that for each Fund, no compensation for the Advisor’s principals and primary portfolio management team was allocated or included in the per Fund analysis because those persons received a share of profits rather than salary. After further discussion, the Trustees concluded that excessive Advisor profitability was not currently a concern for any of the Rational Renewal Funds and that Rational’s access to additional capital provided a satisfactory financial cushion in spite of losses.
Economies of Scale. The Advisor anticipates that each Fund would benefit from economies of scale when it reaches approximately $200 millionin net assets. At that point the total expenses of a Fund would start to fall below any expense limitation agreement and the Advisor would no longer need to waive advisory fees and/or reimburse expenses. The Trustees noted that the Management Agreement does not contain breakpoints that reduce the fee rate on assets above specified levels. The Independent Trustees agreed that breakpoints may be an appropriate way for Rational to share its economies of scale as assets of the Rational Renewable Funds continue to increase. The Advisor currently does not believe that breakpoints in the advisory fee are appropriate. The Trustees determined, after further discussion, that economies of scale have not been reached at this time and agreed that the matter of economies of scale would be revisited as assets of the Rational Renewable Funds materially increase.
Conclusion. Having reviewed and discussed in depth such information from the Advisor as the Trustees believed to be reasonably necessary to evaluate the terms of the Management Agreement, and as assisted by the advice of legal counsel, the Trustees concluded that renewal of the Management Agreement was in the best interest of the shareholders of Dividend Capture Fund, Risk Managed Emerging Markets Fund, Hedged Return Fund, Dynamic Brands Fund, and Strategic Allocation Fund.
| RATIONAL FUNDS | |
| SUPPLEMENTAL INFORMATION (Unaudited)(Continued) |
| December 31, 2017 | ANNUAL REPORT |
Consideration and Approval of Sub-Advisory Agreement between Rational Advisors, Inc. and Accuvest Global Advisors, Inc. with respect to the Rational Dynamic Brands Fund (formerly, the Rational Defensive Growth Fund.
In connection with a regular meeting held on June 23, 2017, the Board of Trustees (the “Board” or the “Trustees”) of Mutual Fund & Variable Insurance Trust (the “Trust”), including a majority of the Trustees who are not “interested persons” as that term is defined in the Investment Company Act of 1940, as amended, discussed the approval of a sub-advisory agreement between Rational Advisors, Inc. (‘Rational”) and Accuvest Global Advisors, Inc. (“Accuvest”), (the “Sub-Advisory Agreement”), with respect to the Rational Dynamic Brands Fund (Dynamic Brands Fund”).
The Trustees were assisted by legal counsel throughout the review process. The Trustees relied upon the advice of legal counsel and their own business judgment in determining the material factors to be considered in evaluating the Sub-Advisory Agreement and the weight to be given to each factor considered. The conclusions reached by the Trustees were based on a comprehensive evaluation of all of the information provided and were not the result of any one factor. Moreover, each Trustee may have afforded different weight to the various factors in reaching his conclusions with respect to the approval of the Sub-Advisory Agreement. In connection with their deliberations regarding approval of the Sub-Advisory Agreement, the Trustees reviewed materials prepared by Accuvest (“Accuvest 15c Response”).
Nature, Extent and Quality of Services. The Trustees reviewed the overview of the services to be provided, as well as information on the firm’s personnel and the compliance and litigation record of Accuvest, contained in the Accuvest 15(c) Response. The Trustees noted that Accuvest was the sub adviser from 2012 to 2015 for two actively managed ETFs. The Trustees next considered that Accuvest will be responsible for day to day investment activities of the Fund, as well as for monitoring the Fund’s compliance both with legal standards and trading within the Fund’s investment strategy. After further discussion, the Trustees concluded that it is not unreasonable to expect that the sub-advisor will provide a level of service consistent with the Advisor’s and the Board’s expectations.
Performance. The Trustees then considered Accuvest’s past performance as well as other factors relating to Accuvest’s track record. The Board noted that the Dynamic Brands SMA outperformed its benchmarks since inception (9/8/16). After further discussion, the Trustees concluded that it is not unreasonable to expect that the sub-advisor’s performance in managing the Defensive Growth Fund will be positive for its shareholders.
Fees and Expenses. As to the costs of the services to be provided by Accuvest, the Board discussed the sub-advisory fee payable to Accuvest relative to the advisory fee noting that Accuvest will be paid a sub-advisory of 0.50% of the net management fee (maximum of 0.375%), and that Rational, not Defensive Growth Fund, would be responsible for the payment of such fee. The Trustees further noted that the management fee currently charged by Accuvest for Accuvest Alpha Brands (offshore Fund) is 0.90%, and the advisory fees on its SMAs range from 0.75%1.00%, which are above the sub-advisory fee it will earn as sub-advisor to the Defensive Growth Fund. The Trustees
| RATIONAL FUNDS | |
| SUPPLEMENTAL INFORMATION (Unaudited)(Continued) |
| December 31, 2017 | ANNUAL REPORT |
acknowledged that the proposed sub-advisory fee to be charged is significantly lower than the management fee currently received by Accuvest. The Trustees were pleased that the Advisor had negotiated a competitive sub-advisory fee for the Defensive Growth Fund, which would benefit its shareholders. The Trustees concluded that the proposed sub-advisory fee was not unreasonable.
Profitability. As to profitability, the Trustees discussed the total fees expected to be paid to Accuvest, and noted that Accuvest will receive no other compensation from the Defensive Growth Fund or Rational except the sub-advisory fee earned pursuant to the proposed Sub Advisory Agreement. The Trustees reviewed a profitability analysis that was provided and noted that Accuvest projects a loss from its services to Defensive Growth Fund over the first twelve months, and a slight profit during the second year, if there is a growth in assets. The Trustees concluded that excessive profitability from the sub-advisor’s relationship with the Defensive Growth Fund is not a concern at this time.
Economies of Scale. The Trustees considered whether there will be economies of scale with respect to the management of the Defensive Growth Fund. The Trustees discussed and agreed this was an advisor level issue with respect to the overall Advisory Agreement, taking into consideration the impact of the sub-advisory expense. The Trustees further noted that economies of scale were not anticipated to be reached during the initial period of the Sub-Advisory Agreement, and agreed that the matter of economies of scale would be revisited as the size of the Defensive Growth Fund materially increases.
Conclusion. Having requested and received such information from the sub-advisor as the Trustees believed to be reasonably necessary to evaluate the terms of the Sub-Advisory Agreement, and as assisted by the advice of Counsel, the Trustees concluded that approval of the Sub-Advisory Agreement was in the best interests of the Defensive Growth Fund and its shareholders.
| RATIONAL FUNDS | |
| SUPPLEMENTAL INFORMATION (Unaudited)(Continued) | |
| December 31, 2017 | ANNUAL REPORT |
Consideration and Approval of Sub-Advisory Agreement between Rational Advisors, Inc. and Warrington Asset Management, LLC with respect to the Rational Hedged Return Fund (formerly, the Rational Real Strategies Fund).
In connection with a regular meeting held on August 25, 2017, the Board of Trustees (the “Board” or the “Trustees”) of Mutual Fund & Variable Insurance Trust (the “Trust”), including a majority of the Trustees who are not “interested persons” as that term is defined in the Investment Company Act of 1940, as amended, discussed the approval of a sub-advisory agreement between Rational Advisors, Inc. (‘Rational”) and Warrington Asset Management, LLC (“Warrington”), (the “Sub-Advisory Agreement”), with respect to the Rational Hedged Return Fund (“Hedged Return Fund”).
The Trustees were assisted by legal counsel throughout the review process. The Trustees relied upon the advice of legal counsel and their own business judgment in determining the material factors to be considered in evaluating the Sub-Advisory Agreement and the weight to be given to each factor considered. The conclusions reached by the Trustees were based on a comprehensive evaluation of all of the information provided and were not the result of any one factor. Moreover, each Trustee may have afforded different weight to the various factors in reaching his conclusions with respect to the approval of the Sub-Advisory Agreement. In connection with their deliberations regarding approval of the Sub-Advisory Agreement, the Trustees reviewed materials prepared by Warrington (“Warrington 15c Response”).
Nature, Extent and Quality of Services. The Trustees next considered that Warrington will be responsible for day to day investment activities of the Fund, as well as for monitoring the Fund’s compliance both with legal standards and trading within the Fund’s investment strategy. The Board considered the extensive option trading experience of Warrington personnel servicing the Fund and the strong qualifications of Warrington’s chief compliance officer. After further discussion, the Trustees concluded that it is not unreasonable to expect that the sub-advisor will provide a level of service consistent with the Advisor’s and the Board’s expectations.
Performance. The Trustees then considered Warrington’s performance for other accounts it manages as compared to Barclay CTA Index for the 1, 5 and since inception periods. The Board noted that the accounts managed by Warrington outperformed the Barclay CTA index for each of the periods reported. After further discussion, the Trustees concluded that it is not unreasonable to expect that the sub-advisor’s performance in managing the Real Strategies Fund will be positive for its shareholders.
Fees and Expenses. As to the costs of the services to be provided by Warrington, the Board discussed the sub-advisory fee payable to Warrington relative to the advisory fee noting that Warrington will be paid a sub-advisory of 0.50% of the net management fee, and that Rational, not Real Strategies Fund, would be responsible for the payment of such fee. The Trustees further noted that the management fees currently charged by Warrington for other accounts range from 1.5% plus 15% performance allocation, up to 2% management fee plus 20% performance allocation, and that such fees are well above the sub-advisory fee it will earn as sub-advisor to the
| RATIONAL FUNDS | |
| SUPPLEMENTAL INFORMATION (Unaudited)(Continued) |
| December 31, 2017 | ANNUAL REPORT |
Real Strategies Fund. The Trustees were pleased that the Advisor had negotiated a competitive sub-advisory fee for the Real Strategies Fund, which would benefit its shareholders. The Trustees concluded that the proposed sub-advisory fee was not unreasonable.
Profitability. As to profitability, the Trustees discussed the total fees expected to be paid to Warrington. The Trustees reviewed a profitability analysis that was provided and noted that Warrington projects a loss from its services to Real Strategies Fund over the first twelve months, and during the second year depending on growth in assets. The Trustees concluded that excessive profitability from the sub-advisor’s relationship with the Real Strategies Fund is not a concern at this time.
Economies of Scale. The Trustees considered whether there will be economies of scale with respect to the management of the New Fund. The Trustees agreed that this was primarily an advisor level issue and should be considered with respect to the overall management agreement, taking into consideration the impact of the sub-advisory expense.
Conclusion. Having requested and received such information from the sub-advisor as the Trustees believed to be reasonably necessary to evaluate the terms of the Sub-Advisory Agreement, and as assisted by the advice of Counsel, the Trustees concluded that approval of the Sub-Advisory Agreement was in the best interests of the Real Strategies Fund and its shareholders.
| RATIONAL FUNDS | |
| Boards of Trustees and Trust Officers (Unaudited) (Continued) |
| December 31, 2017 | ANNUAL REPORT |
The Trustees and officers of the Trust, together with information as to their principal business occupations during the past five years and other information, are shown below. Unless otherwise noted, the address of each Trustee and Officer is 36 N. New York Avenue, Huntington, NY 11743. Each Trustee and officer also serves in the same capacity for the Strategy Shares, another open-end investment company whose series are managed by the Advisor. Collectively, the Funds, Strategy Shares, Mutual Fund Series Trust and TCG Financial Trusts I-X comprise the “Fund Complex.
Independent Trustees Background
Name, Address
and Age | Position(s)
with Trust | Term
and
Length
Served* | Principal Occupation(s)
During Past 5 Years | Number of
Portfolios
in Fund
Complex
Overseen
by Trustee | Other Directorships
Held by Trustees |
Tobias Caldwell
Age: 48 | Chairman
of the
Board and
Trustee | Since
January
2016 | Managing member, Bear Properties, LLC (2006 - present) (real estate firm); Managing member, PTL Real Estate, LLC (2000 – present) (real estate/investment firm); Managing member, Genovese Family Enterprises, LLC (1999 – present) (real estate firm). | 52 | Chairman of the Board, Strategy Shares, comprised of 3 funds (January 2016-present); Lead independent trustee and Chairman of the Audit Committee, Mutual Fund Series Trust, comprised of 41funds (2006-present) Trustee, M3Sixty Funds Trust comprised of 3 funds (2016 - present). |
Stephen P.
Lachenauer
Age: 48 | Trustee | Since
January
2016 | Attorney, private practice (2006-present). | 23 | Board Member, Strategy Shares, comprised of 3 funds (January 2016 – present); Trustee, TCG Financial Series Trusts I- X, each Trust is comprised of 1 fund (2015-present). |
Donald
McIntosh
Age: 47 | Trustee | Since
January
2016 | Credit risk review analyst, Santander Holdings USA (May 2015 – present); Governance analyst, Santander Bank (2011 – April 2015). | 23 | Board Member, Strategy Shares, comprised of 3 funds (January 2016– present); Trustee, TCG Financial Series Trusts I- X, each Trust is comprised of 1 fund (2015-present). |
| RATIONAL FUNDS | |
| Boards of Trustees and Trust Officers (Unaudited) (Continued) |
| December 31, 2017 | ANNUAL REPORT |
Officers**
Name, Address
and Age | Position(s)
with Trust | Term
and
Length
Served | Principal Occupation(s) During Past 5
Years | Number of
Portfolios in Fund
Complex
Overseen by
Trustee |
Jerry Szilagyi
Age: 54 | President | Since
April
2016 | President, Rational Advisors, Inc., 1/2016 - present; Chief Executive Officer, Catalyst Capital Advisors LLC, 1/2006- present; Member, AlphaCentric Advisors LLC, 2/2014 to Present; Managing Member, MFund Distributors LLC, 10/2012-present; Managing Member, MFund Services LLC, 1/2012 – Present; President, Abbington Capital Group LLC, 1998- present; President, Cross Sound Capital LLC, 6/2011 to 10/2013; President, USA Mutuals, Inc., 3/2011 to 7/2016. | 52 |
Erik Naviloff
80 Arkay Drive,
Hauppauge, New
York 11788
Age: 48 | Treasurer | Since
April
2016 | Vice President – Fund Administration, Gemini Fund Services, LLC, since 2012; Assistant Vice President, Gemini Fund Services, 2007 - 2012. | N/A |
Aaron Smith
80 Arkay Drive,
Hauppauge, New
York 11788
Age: 42 | Assistant
Treasurer | Since
April
2016 | Manager - Fund Administration, Gemini Fund Services, LLC, since 2012; Authorized Officer, UBS Global Asset Management, a business division of UBS AG, 2010-2012. | N/A |
Frederick J.
Schmidt
Age: 57 | Chief
Compliance
Officer | Since
April
2016 | Director, MFund Services LLC since 5/2015; Director & Chief Compliance Officer, Citi Fund Services, 2010-2015; Senior Vice President & Chief Compliance Officer, Citi Fund Services, 2004-2010. | N/A |
Jennifer A. Bailey
Age: 48 | Secretary | Since
April
2016 | Director of Legal Services, MFund Services LLC, 2/2012 to present | N/A |
| * | The term of office of each Trustee is indefinite. |
| ** | Officers do not receive any compensation from the Trust. |
The Fund’s Statement of Additional Information (“SAI”) includes additional information about the Trustees and is available free of charge, upon request, by calling toll-free at 1-800-253-0412.
PRIVACY NOTICE
Mutual Fund and variable insurance Trust
Rev. June 2011
| FACTS | WHAT DOES MUTUAL FUND AND VARIABLE INSURANCE TRUST DO WITH YOUR PERSONAL INFORMATION? |
| Why? | Financial companies choose how they share your personal information. Federal law gives consumers the right to limit some, but not all sharing. Federal law also requires us to tell you how we collect, share, and protect your personal information. Please read this notice carefully to understand what we do. |
| What? | The types of personal information we collect and share depends on the product or service that you have with us. This information can include: ● Social Security number and wire transfer instructions ● account transactions and transaction history ● investment experience and purchase history When you are no longer our customer, we continue to share your information as described in this notice. |
| How? | All financial companies need to share customers’ personal information to run their everyday business. In the section below, we list the reasons financial companies can share their customers’ personal information; the reasons Mutual Fund Series Trust chooses to share; and whether you can limit this sharing. |
Reasons we can share your
personal information: | Does Mutual Fund Series
Trust share information? | Can you limit this sharing? |
| For our everyday business purposes - such as to process your transactions, maintain your account(s), respond to court orders and legal investigations, or report to credit bureaus. | YES | NO |
| For our marketing purposes - to offer our products and services to you. | NO | We don’t share |
| For joint marketing with other financial companies. | NO | We don’t share |
| For our affiliates’ everyday business purposes - information about your transactions and records. | NO | We don’t share |
| For our affiliates’ everyday business purposes - information about your credit worthiness. | NO | We don’t share |
| For our affiliates to market to you | NO | We don’t share |
| For non-affiliates to market to you | NO | We don’t share |
| QUESTIONS? | Call 1-800-253-0412 |
PRIVACY NOTICE
Mutual Fund and variable insurance Trust
| What we do: |
How does Mutual Fund and Variable Insurance Trust protect my personal information? | To protect your personal information from unauthorized access and use, we use security measures that comply with federal law. These measures include computer safeguards and secured files and buildings. Our service providers are held accountable for adhering to strict policies and procedures to prevent any misuse of your nonpublic personal information. |
How does Mutual Fund and Variable Insurance Trust collect my personal information? | We collect your personal information, for example, when you ● open an account or deposit money ● direct us to buy securities or direct us to sell your securities ● seek advice about your investments We also collect your personal information from others, such as credit bureaus, affiliates, or other companies. |
Why can’t I limit all sharing? | Federal law gives you the right to limit only: ● sharing for affiliates’ everyday business purposes – information about your creditworthiness. ● affiliates from using your information to market to you. ● sharing for nonaffiliates to market to you. State laws and individual companies may give you additional rights to limit sharing. |
| Definitions |
| Affiliates | Companies related by common ownership or control. They can be financial and non-financial companies. ● Mutual Fund and Variable Insurance Trust has no affiliates. |
| Non-affiliates | Companies not related by common ownership or control. They can be financial and non-financial companies. ● Mutual Fund and Variable Insurance Trust doesn’t share with non-affiliates so they can market to you. |
| Joint marketing | A formal agreement between nonaffiliated financial companies that together market financial products or services to you. ● Mutual Fund and Variable Insurance Trust doesn’t jointly market. |
A copy of the policies and procedures that the Funds use to determine how to vote proxies relating to securities held in the Funds’ portfolios, as well as a record of how the Funds voted any such proxies during the most recent 12-month period ended June 30, is available without charge and upon request by calling 800-253-0412. This information is also available from the EDGAR database on the SEC’s website at www.sec.gov.
The Funds file with the SEC a complete schedule of their portfolio holdings, as of the close of the first and third quarters of their fiscal year, on “Form N-Q.” These filings are available on the SEC’s website at www.sec.gov and may be reviewed and copied at the SEC’s Public Reference Room in Washington, DC. (call 202-551-8090 for information on the operation of the Public Reference Room.).
Rational Advisors, Inc., serves as Investment Advisor to the Funds.
This report is authorized for distribution to prospective investors only when preceded or accompanied by a prospectus which contains facts concerning the Funds’ objectives and policies, management fees, expenses and other information.
Shareholder Services: 800-253-0412
(a) The Registrant has, as of the end of the period covered by this report, adopted a code of ethics that applies to the Registrant's principal executive officer, principal financial officer, and principal accounting officer or controller, or persons performing similar functions, regardless of whether these individuals are employed by the Registrant or a third party.
(b) During the period covered by this report, there were no amendments to any provision of the code of ethics.
(c) During the period covered by the report, with respect to the registrant’s code of ethics that applies to its Principal Executive Officer and Principal Financial Officer: there have been no amendments to a provision that relates to any element of the code of ethics definition enumerated in paragraph (b) of this Item 2.
| Item 3. | Audit Committee Financial Expert. |
3(a) The registrant’s board of trustees has determined that the registrant does not have an audit committee financial expert. The audit committee determined that, although none of its members meet the technical definition of an audit committee financial expert, the committee has sufficient financial expertise to adequately perform its duties under the Audit Committee Charter without the addition of a qualified expert.
| Item 4. | Principal Accountant Fees and Services. |
(a) Audit Fees. The aggregate fees billed for each of the last two fiscal years for professional services rendered by the registrant's principal accountant for the audit of the registrant's annual financial statements or services that are normally provided by the accountant in connection with statutory and regulatory filings or engagements for those fiscal years are as follows:
Fiscal year ended 2017: $66,500
Fiscal year ended 2016: $72,500
(b) Audit-Related Fees. There were no fees billed in each of the last two fiscal years for assurances and related services by the principal accountant that are reasonably related to the performance of the audit of the registrant’s financial statements and are not reported under paragraph (a) of this item.
Fiscal year ended 2017: $0
Fiscal year ended 2016: $0
(c) Tax Fees. The aggregate fees billed in each of the last two fiscal years for professional services rendered by the principal accountant for tax compliance are as follows:
Fiscal year ended 2017: $17,500
Fiscal year ended 2016: $19,000
(d) All other fees billed to the registrant by its principal accountants for the two most recent fiscal years:
Fiscal year ended 2017: $0
Fiscal year ended 2016: $0
(e)(1) The audit committee does not have pre-approval policies and procedures. Instead, the audit committee or audit committee chairman approves on a case-by-case basis each audit or non-audit service before the principal accountant is engaged by the Registrant.
(e)(2) There were no services described in each of paragraphs (b) through (d) of this Item that were approved by the audit committee pursuant to paragraph (c)(7)(i)(C) of Rule 2-01 of Regulation S-X. |
| (f) Not applicable. The percentage of hours expended on the principal accountant's engagement to audit the Registrant's financial statements for the most recent fiscal year that were attributed to work performed by persons other than the principal accountant's full-time, permanent employees was zero percent (0%). |
(g) All non-audit fees billed by the Registrant's principal accountant for services rendered to the Registrant for the fiscal years ended June 30, 2016 and 2015, respectively, are disclosed in (b)-(d) above. There were no audit or non-audit services performed by the Registrant's principal accountant for the Registrant's adviser.
Item 5. | Audit Committee of Listed Registrants.
|
Not applicable.
| Item 6. | Schedule of Investments. |
Included in annual report to shareholders filed under item 1 of this form.
| Item 7. | Disclosure of Proxy Voting Policies and Procedures for Closed-End Management Investment Companies. |
Not applicable.
| Item 8. | Portfolio Managers of Closed-End Management Investment Companies. |
Not applicable.
| Item 9. | Purchases of Equity Securities by Closed-End Management Investment Company and Affiliated Purchasers. |
Not applicable.
| Item 10. | Submission of Matters to a Vote of Security Holders. |
Not applicable.
| Item 11. | Controls and Procedures. |
(a) The registrant’s Principal Executive Officer and Principal Financial Officer, or persons performing similar functions, have concluded that the registrant’s disclosure controls and procedures (as defined in Rule 30a-3(c) under the Act) are effective in design and operation and are sufficient to form the basis of the certifications required by Rule 30a-2 under the Act, based on their evaluation of these disclosure controls and procedures within 90 days of the filing of this report on Form N-CSR.
(b) There were no changes in the registrant’s internal control over financial reporting (as defined in Rule 30a-3(d) under the Act (17 CFR 270.30a-3(d)) that occurred during the second fiscal quarter of the period covered by this report that have materially affected or are reasonably likely to materially affect, the registrant’s internal control over financial reporting.
(1) Code of Ethics for Principal Executive and Senior Financial Officers is attached hereto.
(2) Certifications pursuant to Section 302 of the Sarbanes-Oxley Act of 2002 are filed herewith.
(3) Certifications pursuant to Section 906 of the Sarbanes-Oxley Act of 2002 are filed herewith.
SIGNATURES
Pursuant to the requirements of the Securities Exchange Act of 1934 and the Investment Company Act of 1940, the registrant has duly caused this report to be signed on its behalf by the undersigned, thereunto duly authorized.
(Registrant) Mutual Fund and Variable Insurance Trust
| | | |
| By (Signature and Title) | | /s/ Jerry Szilagyi |
| | | Jerry Szilagyi, President and Principal Executive Officer |
| | | | |
| Date | | 3/8/18 | |
| | | | | | |
Pursuant to the requirements of the Securities Exchange Act of 1934 and the Investment Company Act of 1940, this report has been signed below by the following persons on behalf of the registrant and in the capacities and on the dates indicated.
| | | |
| By (Signature and Title) | | /s/ Jerry Szilagyi |
| | | Jerry Szilagyi, President and Principal Executive Officer |
| | | | |
| Date | | 3/8/18 | |
| | | | | | |
| | | |
| By (Signature and Title) | | /s/ Erik Naviloff |
| | | Erik Naviloff, Treasurer and Principal Financial Officer |
| | | | |
| Date | | 3/8/18 | |
| | | | | | |