UNITED STATES
SECURITIES AND EXCHANGE COMMISSION
Washington, D.C. 20549
FORM N-CSR
CERTIFIED SHAREHOLDER REPORT OF REGISTERED
MANAGEMENT INVESTMENT COMPANIES
Investment Company Act file number 811-05010
Mutual Fund and Variable Insurance Trust
(Exact name of registrant as specified in charter)
36 North New York Avenue
Huntington, NY 11743
(Address of principal executive offices) (Zip code)
The Corporation Trust Company
Corporate Trust Center
1209 Orange Street
Wilmington, DE 19801
(Name and address of agent for service)
Registrant’s telephone number, including area code: 1-631-629-4237
Date of fiscal year end: December 31
Date of reporting period: December 31, 2018
| Item 1. | Reports to Shareholders. |

Annual Shareholder Report
December 31, 2018
CLASS A SHARES
CLASS C SHARES
INSTITUTIONAL SHARES
Beginning on January 1, 2021, as permitted by regulations adopted by the Securities and Exchange Commission, paper copies of the Funds’ shareholder reports like this one will no longer be sent by mail, unless you specifically request paper copies of the reports. Instead, the reports will be made available on the Funds’ website www.rationalmf.com, and you will be notified by mail each time a report is posted and provided with a website link to access the report.
If you already elected to receive shareholder reports electronically, you will not be affected by this change and you need not take any action. You may elect to receive shareholder reports and other communications from the Funds electronically by contacting your financial intermediary (such as a broker-dealer or bank) or, if you are a direct investor, by following the instructions included with paper Fund documents that have been mailed to you.

January 31, 2019
Rational Dividend Capture Fund
Dear Fellow Shareholders,
The Rational Dividend Capture Fund (the “Fund”) seeks total return on investment, with dividend income an important component of that return. The Fund focuses on high dividend paying stocks that also are attractively valued to provide an attractive return over a full market cycle. We define a full market cycle as both a bear market and a bull market. It is expected that this strategy will underperform when such sectors like technology are very strong but outperform when the more aggressive sectors of the market are weak. The dividend yield provides a nice consistent stream of income and stability to the long-term returns. An appropriate benchmark for this strategy is not a simple question, it has characteristics of both an equity portfolio but also the yield more resembling the bond market historically. Many of the higher yielding sectors of the market had very negative returns in 2018, such as the energy sectors and telecommunications. Business Development Companies and REITs also underperformed significantly. Lastly, value-oriented stocks also significantly underperformed growth stocks, and in fact have done so four of the last five years. The value stocks and yield oriented stocks are very attractive on a historical basis relative to the market and, in particular, the growth and momentum sectors. We were able to take advantage of the market downturn last year purchasing many high-quality undervalued dividend paying stocks. As a result, the fund currently has a very attractive dividend yield. We are confident in the long-term potential of the Fund and strategy, particularly relative to more aggressive types of investments given where the markets are versus their long-term norms.
Investment Strategy
The Fund normally invests at least 80% of its net assets in dividend paying stocks, including preferred stocks and real estate investment trusts (“REITs”).
The Fund uses a value approach to identify attractive, dividend paying stocks. The discipline focuses on cash flows and earnings of companies, their growth rate, and the valuation of their stock prices. As an example, the manager likes to buy REITs below their real estate value or operating companies below their intrinsic value, to gain from the appreciation of the stock overtime while collecting an attractive dividend yield. Stocks are sold when the fundamentals deteriorate; become too highly valued; or when there may be a better alternative including cash.
As part of the investment process, the Fund invests in both preferred stocks and common stocks.
Fund Performance
The Rational Dividend Capture Fund underperformed its S&P 500 Total Return Index benchmark in 2018. The fund performed in line or better in two quarters and underperformed in two quarters. During the third quarter of 2018, technology and momentum stocks were very strong, however, many of these stocks do not meet our discipline, and as a result, we did not have a significant weighting in technology. As we mentioned, the sectors the fund invests in to get an attractive dividend yield and long-term appreciation performed poorly in 2018. What typically happens in the late stage of a market cycle is momentum and speculative stocks perform very strongly and the value and income stocks lag considerably relative to the market. This is what happened again in 2018, although it seems the stocks the fund invests in seemed to be starting to improve on a relative basis at different times during the worse parts of the market’s decline in 2018. It is the expectation of management that the volatility of the markets is going to continue in 2019, and that having an attractive dividend yield and a cash reserve will help cushion the potential downside. Additionally, the cash can be invested opportunistically. As global economic growth slows, and central banks become
less accommodative, equity markets are likely to start to become more normal. In that environment, the Blue Chip and dividend-oriented stocks in the Fund could perform very well on a relative basis.
The Fund’s total annualized returns through 12/31/18 as compared to the S&P 500 Total Return Index were as follows:
| | | | | Since Inception |
| | 1 Year | 5 Years | 10 Years | (03/01/2001) |
| Class A | -12.22% | -0.84% | 6.76% | 4.48% |
| Class I | -11.96% | -0.58% | 7.04% | 4.74% |
| Class A with Sales Charge | -16.39% | -1.81% | 6.24% | 4.20% |
| S&P 500 Total Return Index(1) | -4.38% | 8.49% | 13.12% | 6.11% |
| S&P 500 Value TR Index(2) | -8.95% | 6.06% | 11.21% | 5.30% |
The Fund’s maximum sales charge for Class “A” shares is 4.75%. Investments in mutual funds involve risks. Performance is historic and does not guarantee future results. Investment return and principal value will fluctuate with changing market conditions so that when redeemed, shares may be worth more or less than their original cost. Current performance may be lower or higher than the performance data quoted. To obtain the most recent month- end performance information or the Fund’s prospectus please call the Fund, toll free at 1-800-253-0412. You can also obtain a prospectus at www.RationalMF.com.
Summary
Given the market downturn in 2018, we are pleased to see attractive valuations for some of the securities that fit our investment criteria of low price to earnings multiples and attractive dividends. We are confident in the long-term success of the strategy. Successful investing requires a long-term outlook focused on objective criteria that create value. We have adopted this outlook for the Rational Dividend Capture Fund, and we are glad that you have decided to share in our vision.
Sincerely,
Patrick Adams and Rick Garcia
Portfolio Managers
This report is intended for the Fund’s shareholders. It may not be distributed to prospective investors unless it is preceded or accompanied by the current Fund prospectus. To obtain a prospectus or other information about the Fund, please visit www.RationalMF.com or call 1-800-253-0412. Please read the prospectus carefully before investing.
| (1) | The S&P 500 Total Return Index by Standard & Poor’s Corp. is a capitalization-weighted index comprising 500 issues listed on various exchanges, representing the performance of the stock market generally. Please note that indices do not take into account any fees and expenses of investing in the individual securities that they track, and individuals cannot invest directly in any index, although individuals may invest in exchange traded funds or other investment vehicles that attempt to track the performance of an index. The Rational Dividend Capture Fund may or may not purchase the types of securities represented by the S&P 500 Total Return Index. |
| (2) | The S&P 500 Value Total Return Index® (“S&P 500 Value TR”) is an unmanaged market-capitalization weighted index consisting of those stocks within the S&P 500 that exhibit strong value characteristics. It uses a numerical ranking system based on four value factors and three growth factors to determine the constituents and their weightings. |
4227-NLD-2/1/2019
Rational Dividend Capture Fund
PORTFOLIO REVIEW (Unaudited)
December 31, 2018
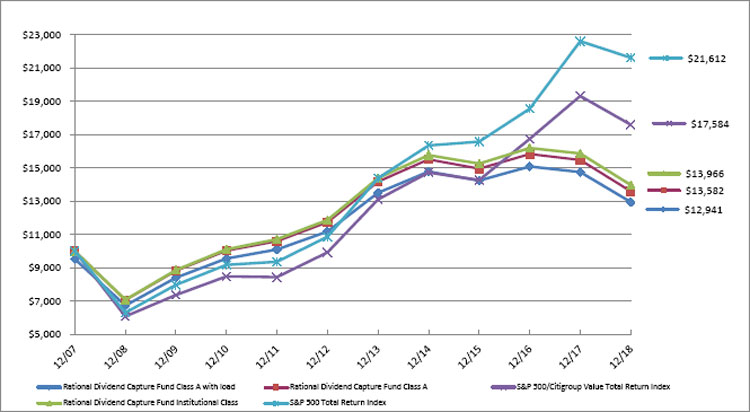
The Fund’s performance figures* for each of the periods ended December 31, 2018, compared to its benchmarks:
| | | Annualized | Annualized | Annualized |
| | 1 Year Return | 5 Year Return | 10 Year Return | Since Inception(a) |
| Class A | (12.22)% | (0.84)% | 6.76% | N/A |
| Class A with load | (16.39)% | (1.81)% | 6.24% | N/A |
| Class C | (12.66)% | N/A | N/A | (1.27)% |
| Institutional Class | (11.96)% | (0.58)% | 7.04% | N/A |
| S&P 500 Total Return Index(b) | (4.38)% | 8.49% | 13.12% | 8.71% |
| S&P 500/Citigroup Value Total Return Index(c) | (8.95)% | 6.06% | 11.21% | 6.23% |
| * | The performance data quoted here represents past performance. Current performance may be lower or higher than the performance data quoted above. Investment return and principal value will fluctuate, so that shares, when redeemed, may be worth more or less than their original cost. The returns shown do not reflect the deduction of taxes that a shareholder would pay on Fund distributions or on the redemptions of Fund shares. Past performance is no guarantee of future results. Performance figures for periods greater than 1 year are annualized. Per the fee table in the Fund’s May 1, 2018 prospectus, the total annual operating expense are 1.40% for Institutional Class shares, 1.64% for A shares and 2.40% for C shares before fee waivers. See the financial highlights for current expense ratios. For performance information current to the most recent month-end, please call toll-free 1-800-253-0412. Class A shares are subject to a maximum load of 4.75%. |
| (a) | Inception date is February 28, 2001 for Class A, Institutional Class and the Benchmarks. |
| (a) | Inception date is January 2, 2014 for Class C and the Benchmarks. |
| (b) | The “S&P 500 Total Return Index”, a registered trademark of McGraw-Hill Co., Inc., is a market capitalization-weighted index of 500 widely held common stocks. Investors cannot invest directly in an Index. |
| (c) | The S&P 500/Citigroup Value Total Return Index uses a numerical ranking system based on four value factors and three growth factors to determine the constituents and their weightings. Investors cannot invest directly in an Index. |
Comparison of the Change in Value of a $10,000 Investment
| Top 10 Holdings by Industry | | % of Net Assets | |
| REITs | | | 14.5 | % |
| Telecommunications | | | 11.2 | % |
| Investment Companies | | | 8.4 | % |
| Banks | | | 7.2 | % |
| Exchange Traded Funds | | | 7.2 | % |
| Diversified Financial Services | | | 6.1 | % |
| Retail | | | 5.1 | % |
| Food | | | 4.7 | % |
| Media | | | 4.7 | % |
| Pharmaceuticals | | | 4.6 | % |
| Other/Short-Term Investments | | | 26.3 | % |
| | | | 100.0 | % |
Please refer to the Portfolio of Investments for a more detailed breakdown of the Fund’s assets.
January 31, 2019
Rational Tactical Return Fund
Dear Fellow Shareholders,
The Rational Tactical Return Fund (the “Fund”) seeks total returns consisting of capital appreciation and income by making investments in long and short call and put options on futures contracts on the S&P 500 Index, as well as cash, and cash equivalents. 2018 was the first full year for Warrington to be the Sub Advisor for the Rational Tactical Return Fund. For the year, the Fund outperformed the S&P by a significant margin, posting a +9.66% (Class I) return versus the -4.38% for its S&P 500 TR Index (S&P).
Investment Strategy
The Sub Advisor’s strategy seeks to achieve its investment objective in three ways: (1) Premium Collection – the Fund collects premiums on options it sells; (2) Volatility Trading – the Fund may enter into positions designed to hedge or profit from either an increase or a decrease in Index volatility; and (3) Trend Following – the Fund may increase or decrease the balance of puts and calls based on trending market direction. The Fund is designed to produce returns that are not correlated with equity market returns. The Fund employs strict risk management procedures, supported by both technical and fundamental analysis, that are intended to provide consistency of returns and to mitigate the extent of losses.
Fund Performance
The Tactical Return Fund generated a 2018 return of +9.66%, versus -4.38% for its S&P 500 TR Index (S&P) benchmark and -13.82% return for the S&P GSCI TR Index.
The Fund outperformed its Morningstar category as heightened volatility hurt many other managers in the option trading space. Using both quantitative and fundamental indicators to ascertain near-term market movements, Warrington was able to navigate the markets and minimized losses during volatile periods due to stringent risk management, while concurrently seeking profit opportunities. This balance helped to generate a category-leading return for the year. The Fund’s worst monthly return for the year was +0.02% whereas the S&P was -9.03.
The Fund’s total annualized returns through 12/31/18 as compared to the S&P GSCI TR Index were as follows:
| | | | | Since Inception |
| | 1 Year | 3 Years | 5 Years | (05/02/07) |
| Class A | 9.45% | 6.61% | -2.85% | -2.48% |
| Class I | 9.66% | 6.75% | -2.80% | -2.31% |
| Class A with Sales Charge | 4.28% | 4.89% | -3.79% | -2.89% |
| S&P 500 Total Return Index(1) | -4.38% | 9.26% | 8.49% | 6.84% |
| S&P GSCI TR Index(2) | -13.82% | 0.50% | -14.52% | -8.04% |
The Fund’s maximum sales charge for Class “A” shares is 4.75%. Investments in mutual funds involve risks. Performance is historic and does not guarantee future results. Investment return and principal value will fluctuate with changing market conditions so that when redeemed, shares may be worth more or less than their original cost. Current performance may be lower or higher than the performance data quoted. To obtain the most recent month- end performance information or the Fund’s prospectus please call the Fund, toll free at 1-800-253-0412. You can also obtain a prospectus at www.RationalMF.com.
Summary
In its first full year as the Fund’s Sub Advisor, Warrington continued to provide strong absolute and relative returns, while consistently managing market risks. The Fund’s assets grew significantly in 2018, and we seek to continue that growth as equity markets have become more volatile in recent months. In such volatile markets, Warrington ensures that risk management is paramount, while concurrently evaluating the risk / reward relationship of the opportunities presented by those volatile markets.
Sincerely,
Scott Kimple and Mark Adams
Portfolio Managers
This report is intended for the Fund’s shareholders. It may not be distributed to prospective investors unless it is preceded or accompanied by the current Fund prospectus. To obtain a prospectus or other information about the Fund, please visit www.RationalMF.com or call 1-800-253-0412. Please read the prospectus carefully before investing.
| (1) | The S&P 500 Total Return Index by Standard & Poor’s Corp. is a capitalization-weighted index comprising 500 issues listed on various exchanges, representing the performance of the stock market generally. Please note that indices do not take into account any fees and expenses of investing in the individual securities that they track, and individuals cannot invest directly in any index, although individuals may invest in exchange traded funds or other investment vehicles that attempt to track the performance of an index. The Rational Strategic Allocation Fund may or may not purchase the types of securities represented by the S&P 500 Total Return Index. |
| (2) | The S&P GSCI Total Return Index by Standard & Poor’s Corp. measures general price movements and inflation in the world economy. The S&P GSCI is calculated primarily on a world production-weighted basis and is comprised of the principal physical commodities that are the subject of active, liquid futures markets. The Rational Tactical Return Fund may or may not purchase the types of securities represented by the S&P GSCI Total Return Index. |
4219-NLD-1/31/2019
Rational Hedged Return Fund
PORTFOLIO REVIEW (Unaudited)
December 31, 2018
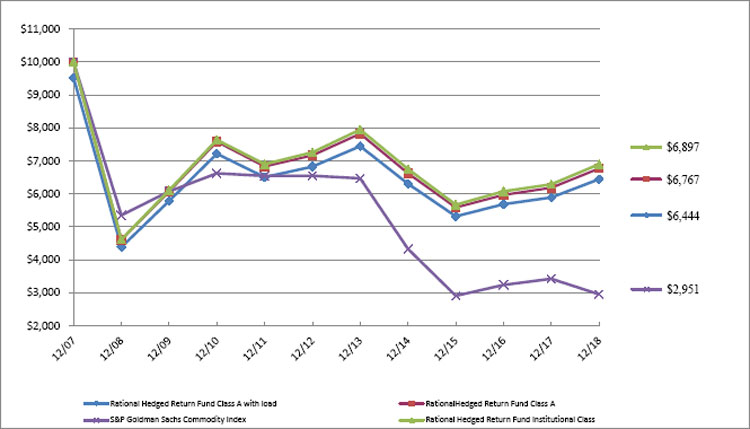
The Fund’s performance figures* for each of the periods ended December 31, 2018, compared to its benchmarks:
| | | Annualized | Annualized | Annualized |
| | 1 Year Return | 5 Year Return | 10 Year Return | Since Inception(a) |
| Class A | 9.45% | (2.85)% | 3.92% | N/A |
| Class A with load | 4.28% | (3.79)% | 3.41% | N/A |
| Class C | 8.62% | N/A | N/A | 6.63% |
| Institutional Class | 9.66% | (2.80)% | 4.10% | N/A |
| S&P 500 Total Return Index(b) | (4.38)% | 8.49% | 13.12% | 9.32% |
| S&P Goldman Sachs Commodity Index(c) | (13.82)% | (14.52)% | (5.78)% | (2.98)% |
| * | The performance data quoted here represents past performance. Current performance may be lower or higher than the performance data quoted above. Investment return and principal value will fluctuate, so that shares, when redeemed, may be worth more or less than their original cost. The returns shown do not reflect the deduction of taxes that a shareholder would pay on Fund distributions or on the redemptions of Fund shares. Past performance is no guarantee of future results. Performance figures for periods greater than 1 year are annualized. Per the fee table in the Fund’s May 1, 2018 prospectus, the total annual operating expense are 5.20% for Institutional Class shares, 5.45% for A shares and 6.20% for C shares before fee waivers. See the financial highlights for current expense ratios. For performance information current to the most recent month-end, please call toll-free 1-800-253-0412. Class A shares are subject to a maximum load of 4.75%. |
| (a) | Inception date is May 31, 2016 for Class C and the Benchmark. |
| (b) | The “S&P 500 Total Return Index”, a registered trademark of McGraw-Hill Co., Inc., is a market capitalization-weighted index of 500 widely held common stocks. Investors cannot invest directly in an Index. |
| (c) | The S&P Goldman Sachs Commodity Index® (“S&P GSCI”) measures general price movements and inflation in the world economy. The S&P GSCI is calculated primarily on a world production-weighted basis and is comprised of the principal physical commodities that are the subject of active, liquid futures markets. The index is unmanaged and, unlike the Fund, is not affected by cash flows. It is not possible to invest directly in an Index. |
Comparison of the Change in Value of a $10,000 Investment
| Top Holdings by Industry ^ | | % of Net Assets | |
| Short-Term Investments | | | 55.4 | % |
| Other/Short-term Investments | | | 44.6 | % |
| | | | 100.0 | % |
| | | | | |
| ^ Does not include derivatives in which the Fund invests. |
Please refer to the Portfolio of Investments for a more detailed breakdown of the Fund’s assets.
January 31, 2019
Rational Dynamic Brands Fund
Dear Fellow Shareholders,
The Rational Dynamic Brands Fund (the “Fund”) seeks long-term capital appreciation by investing in a focused group (25-50 holdings) of the most attractive & relevant brands contained in the Alpha Brands Consumer Spending Index (the “Index”) which has 200 constituents. Security selection is driven by a combination of fundamental and technical factors. In times of economic turmoil or unusually high equity valuations where equity risk is deemed high, the Fund may also invest in cash and cash equivalents and in asset classes that have historically been safe havens when equities were experiencing drawdowns. De-risking is designed to happen in stages. Risk decisions are guided by: relative strength leadership, economic growth trajectory, the Fund management team’s assessment of the dominant equity trend, economic growth profile, consumer health, equity valuations, technical analysis, FED policy, investor sentiment, and changes in interest rates, credit spreads, and asset class volatility trends.
Investment Strategy
The Fund normally pursues its investment objective by investing primarily in equity securities contained in the Alpha Brands Consumer Spending Index. The Index contains 200 leading and relevant Brands across all sectors but focuses on 70+ consumption-focused sub-industries. The Fund invests primarily in U.S. companies with market capitalizations above $1 billion, although it may invest without limit in companies of any market capitalization so long as the companies are included in the Brands Index.
The Fund may invest in non-U.S. equities so long as those equities are included in the Index. The Fund is managed with a Core + Tactical approach where Core brands will typically hold higher portfolio weights than tactical brands. Core brands exhibit secular growth tailwinds and exhibit top ranked Growth (operating kings), Value & Dividend (sustainable yielders) and Price Momentum relative to the Brands Index universe. Core brands are often the leading brand(s) in large, sustainable secular growth markets with large total addressable market opportunities. Tactical brands exhibit attractive technical set-ups and/or have near-term catalysts that could offer investment opportunities in out-of-favor brands (or sub-industries) from within the Brands Index universe. Tactical brands are often contrarian in nature and complement or diversify Core brands. Tactical allocations are often follow-on ideas from within attractive industries where the Investment Committee has determined greater exposure is warranted. The Fund management team may also, at times, choose to add tactical exposure on oversold conditions using highly liquid index and/or sector ETF’s as a supplement to the leading brands in the portfolio. The final part of the investment process determines the tactical target for exposure to equities. Target equity exposure, and portfolio risk, are updated in real-time based on Economic, Household Consumption, Corporate, Technical, and Sentiment investment factors.
Fund Performance
On 10/17/17, the Rational Defensive Growth Fund was converted and renamed the Rational Dynamic Brands Fund. Since Accuvest took over as the sub-advisor for the fund, performance has been strong on a relative and absolute basis. Consumer stocks have performed well driven by the wealth effect as well as enthusiasm over personal and corporate tax reform. As of 12/31/18, the Rational Dynamic Brands Fund gained +6.47% (Class I) since being converted to the Brands portfolio on 10/17/17. Over the same timeframe, the S&P 500 TR Index was up +0.30%. Outperformance was driven mostly by the active decisions to overweight growth versus value, cyclicals versus defensives, and domestic versus international stocks. The Fund management team significantly reduced the exposure to growth brands beginning in late summer 2018 and increased its exposure to out-of-favor value and quality dividend aristocrat brands. The active decision to raise the level of cash as a defensive allocation decision also added value to the overall positive results.
The Fund’s top 3 over-weights relative to the S&P 500 are Consumer Discretionary, Consumer Staples, and Communication Services. The Funds top 3 under-weights relative to the S&P 500 are Financials, Industrials, and Energy. As of 12/31/2018, cash is a large overweight at roughly 30% and is being used as a defensive measure.
These allocations were driven by the fundamental and technical work done via the investment process highlighted in this document.
The Fund will typically be overweight the leading consumer discretionary and staples brands given its focus on consumer spending but has no mandate to do so on an ongoing basis.
The Fund’s total annualized returns through 12/31/18 as compared to the S&P 500 Total Return Index were as follows:
| | | | | Since Inception |
| | 1 Year | 5 Years | 10 Years | (09/27/02) |
| Class A | 0.63% | 2.12% | 11.35% | 9.42% |
| Class I | 0.72% | 2.39% | 11.63% | 9.70% |
| Class A with Sales Charge | -4.03% | 1.13% | 10.81% | 9.09% |
| S&P 500 Total Return Index(1) | -4.38% | 8.49% | 13.12% | 9.27% |
The Fund’s maximum sales charge for Class “A” shares is 4.75%. Investments in mutual funds involve risks. Performance is historic and does not guarantee future results. Investment return and principal value will fluctuate with changing market conditions so that when redeemed, shares may be worth more or less than their original cost. Current performance may be lower or higher than the performance data quoted. To obtain the most recent month- end performance information or the Fund’s prospectus please call the Fund, toll free at 1-800-253-0412. You can also obtain a prospectus at www.RationalMF.com.
Summary
Consumer spending is the key driver of U.S. economic growth as well as global growth. An intelligently constructed and risk aware portfolio of the most relevant and powerful brands offers investors precise and thoughtful exposure to the engine of global economic growth and American Consumerism. Our goal is to construct portfolios that track “lifetime consumption” patterns via the leading brands winning our hearts and wallets. As we enter 2019, our view of the consumer sector is positive even as the macro-economic environment has softened year-over-year. Wages are rising, household debt to disposable income is low and consumer sentiment is positive. At the tail end of the economic cycle, consumer spending tends to shift from price insensitivity to price conscious. The Dynamic Brands portfolio currently reflects a focus on the brands that exhibit pricing power and resiliency in a slower overall economy. The Fund currently holds a combination of iconic brands across important spending categories like: telecom, food & beverage staples, media & entertainment, luxury & athleisure apparel, discount apparel and discount merchandise, e-commerce, consumer electronics, energy production, warehouse shopping, home improvement, video gaming, auto parts, pharmaceuticals, medical devices, credit card processing & mobile payments, household products, personal products, specialty restaurants, and brands vital to the consumption supply chain.
The Fund offers a dedicated allocation to the primary driver of U.S. economic growth, consumer spending. Our dynamic process identifies attractive brands serving a broad range of consumer spending categories and focuses on lifetime spending across all demographic groups. As demographics and spending patterns evolve and/or the economic data changes, so too will our allocations to the leading brands.
In times of uncertainty or high market stress, the Fund can reduce equity exposure. As of 12/31/2018, the Fund is holding a comfortable cash cushion of roughly 30%. Our cash allocation helped the Fund protect capital in Q4 2018 and particularly in December 2018. We have many tools at our disposal to help protect capital when we see evidence of a prolonged economic slowdown.
Successful investing requires a long-term outlook focused on objective criteria that creates value. We anticipate being opportunistic with the above average cash allocation and buying key brands as we see attractive entry points. We have adopted this outlook for the Rational Dynamic Brands Fund, and we are glad that you have decided to share in our vision.
Sincerely,
David Garff, Eric Clark, and James Calhoun
Portfolio Managers
This report is intended for the Fund’s shareholders. It may not be distributed to prospective investors unless it is preceded or accompanied by the current Fund prospectus. To obtain a prospectus or other information about the Fund, please visit www.RationalMF.com or call 1-800-253-0412. Please read the prospectus carefully before investing.
| (1) | The S&P 500 Value Total Return Index® (“S&P 500 Value TR”) is an unmanaged market-capitalization weighted index consisting of those stocks within the S&P 500 that exhibit strong value characteristics. It uses a numerical ranking system based on four value factors and three growth factors to determine the constituents and their weightings. The S&P 500 Total Return Index® (“S&P 500 TR”) is an unmanaged index generally representing the performance of the broad domestic economy through changes in the aggregate market value of 500 stocks representing all major industries. Indices are unmanaged and, unlike the Fund, are not affected by cash flows. It is not possible to invest directly in an Index. For additional disclosure relating to the S&P 500 Value TR and S&P 500 TR, please see “Additional Disclaimers” in the Fund’s Prospectus. |
4216-NLD-1/31/2019
Rational Dynamic Brands Fund
PORTFOLIO REVIEW (Unaudited)
December 31, 2018
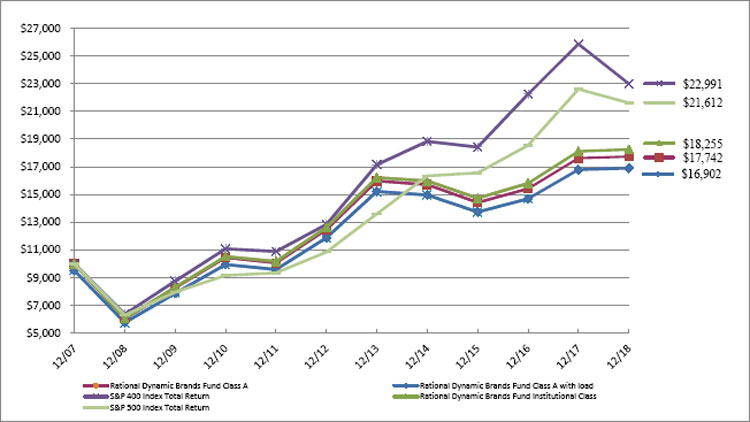
The Fund’s performance figures* for each of the periods ended December 31, 2018, compared to its benchmarks:
| | | Annualized | Annualized | Annualized |
| | 1 Year Return | 5 Year Return | 10 Year Return | Since Inception(a) |
| Class A | 0.63% | 2.12% | 11.35% | N/A |
| Class A with load | (4.03)% | 1.13% | 10.81% | N/A |
| Class C | (0.02)% | N/A | N/A | 1.80% |
| Institutional Class | 0.72% | 2.39% | 11.63% | N/A |
| S&P 500 Index Total Return(b) | (4.38)% | 8.49% | 13.12% | 8.71% |
| S&P 400 Index Total Return(c) | (11.08)% | 6.03% | 13.68% | 6.18% |
| * | The performance data quoted here represents past performance. Current performance may be lower or higher than the performance data quoted above. Investment return and principal value will fluctuate, so that shares, when redeemed, may be worth more or less than their original cost. The returns shown do not reflect the deduction of taxes that a shareholder would pay on Fund distributions or on the redemptions of Fund shares. Past performance is no guarantee of future results. Performance figures for periods greater than 1 year are annualized. Per the fee table in the Fund’s May 1, 2018 prospectus, the total annual operating expense are 1.69% for Institutional Class shares, 1.94% for A shares and 2.69% for C shares before fee waivers. See the financial highlights for current expense ratios. For performance information current to the most recent month-end, please call toll-free 1-800-253-0412. Class A shares are subject to a maximum load of 4.75%. |
| (a) | Inception date is January 2, 2014 for Class C and corresponding Benchmark. |
| (b) | The “S&P 500 Total Return Index”, a registered trademark of McGraw-Hill Co., Inc., is a market capitalization-weighted index of 500 widely held common stocks. Investors cannot invest directly in an Index. |
| (c) | The S&P 400 is a capitalization-weighted index comprised of common stocks representing major industries in the mid-range of the U.S. stock market. The index is unmanaged and, unlike the Fund, is not affected by cash flows. It is not possible to invest directly in an Index. |
Comparison of the Change in Value of a $10,000 Investment
| Top 10 Holdings by Industry | | % of Net Assets | |
| Retail | | | 19.3 | % |
| Pharmaceuticals | | | 7.7 | % |
| Beverages | | | 4.4 | % |
| Internet | | | 4.4 | % |
| Cosmetics / Personal Care | | | 3.7 | % |
| Telecommunications | | | 3.6 | % |
| Apparel | | | 3.4 | % |
| Diversified Financial Services | | | 3.3 | % |
| Software | | | 3.0 | % |
| Media | | | 2.5 | % |
| Other/Short-Term Investments | | | 44.7 | % |
| | | | 100.0 | % |
Please refer to the Portfolio of Investments for a more detailed breakdown of the Fund’s assets.
January 31, 2019
Rational Strategic Allocation Fund
Dear Fellow Shareholders,
The Rational Strategic Allocation Fund (the “Fund”) seeks current income and moderate appreciation of capital by investing in a combination of mutual funds and exchange-traded funds (“ETFs”). During 2018, the Fund outperformed the S&P 500 Total Return Index(1) but underperformed its Strategic Allocation Indices Blend (“BAIB”)(2)benchmark with a -3.05% (Class A) return versus -4.38% for the S&P 500 Total Return Index and -2.28% for the BAIB benchmark. The Fund benefited from its allocations to fixed income funds. The Fund underperformed its benchmark, however, due its allocations to Emerging Markets and MLP (Master Limited Partnership) equity.
Investment Strategy
The Fund seeks to achieve its objective by investing in a combination of underlying mutual funds and ETFs. We invest in equity, income and uncorrelated investment strategies. We select underlying funds using a fundamental research process, including a top-down analysis of market conditions and investment category historical performance during various market conditions. We also perform a bottom-up analysis of each potential fund for investment, including investment allocations, investment valuations and characteristics, positioning, historical performance during various market conditions and that fund’s portfolio manager’s outlook.
Fund Performance
During 2018, the Fund returned -3.05% (Class A), outperforming the S&P 500 Total Return Index by 133 basis points. The Fund benefited from its allocations to fixed income and US equity funds. The Fund’s fixed income allocations performed strongly during the year, returning 2.17% in a rising rate environment driven by Federal Reserve rate hikes. The Fund’s allocations to US equity funds also added modestly to performance, adding 0.29% despite a 4Q sell-off in the US equity market.
The Fund’s exposure to Emerging Markets equity and MLP equity detracted from performance, causing the Fund to trail its BAIB benchmark by 77 basis points. Emerging markets equities were under significant pressure in 2018 due to macroeconomic and geopolitical uncertainty. Additionally, the impact of slowing global growth combined with a rising US Dollar caused the price of crude oil to decline, pressuring energy stocks. The Fund’s Emerging Markets and MLP allocations were down 2.79% and 2.22% respectively for the year.
The Fund’s total annualized returns through 12/31/18 as compared to the Strategic Allocation Indices Blend and the S&P 500 Total Return Index were as follows:
| | | | | Since Inception |
| | 1 Year | 3 Years | 5 Years | (07/30/09) |
| Class A | -3.05% | 5.38% | 3.23% | 5.67% |
| Class A with Sales Charge | -7.64% | 3.68% | 2.22% | 5.13% |
| Strategic Allocation Indices Blend(2) | -2.28% | 6.57% | 6.33% | 9.25% |
| S&P 500 Total Return Index(1) | -4.38% | 9.26% | 8.49% | 12.73% |
The Fund’s maximum sales charge for Class “A” shares is 4.75%. Investments in mutual funds involve risks. Performance is historic and does not guarantee future results. Investment return and principal value will fluctuate with changing market conditions so that when redeemed, shares may be worth more or less than their original cost. Current performance may be lower or higher than the performance data quoted. To obtain the most recent month- end performance information or the Fund’s prospectus please call the Fund, toll free at 1-800-253-0412. You can also obtain a prospectus at www.RationalMF.com.
Summary
The Rational Strategic Allocation Fund outperformed the S&P 500 Total Return Index by 133 basis points during 2018. The majority of the holdings performed to our expectations and the Fund benefited from the balanced allocation to fixed income funds. Successful investing requires a long-term outlook focused on objective criteria that create value. We have adopted this outlook for the Rational Strategic Allocation Fund, and we are glad that you have decided to share in our vision.
Sincerely,
David Miller
Portfolio Manager
This report is intended for the Fund’s shareholders. It may not be distributed to prospective investors unless it is preceded or accompanied by the current Fund prospectus. To obtain a prospectus or other information about the Fund, please visit www.RationalMF.com or call 1-800-253-0412. Please read the prospectus carefully before investing.
| (1) | The S&P 500 Total Return Index by Standard & Poor’s Corp. is a capitalization-weighted index comprising 500 issues listed on various exchanges, representing the performance of the stock market generally. Please note that indices do not take into account any fees and expenses of investing in the individual securities that they track, and individuals cannot invest directly in any index, although individuals may invest in exchange traded funds or other investment vehicles that attempt to track the performance of an index. The Rational Strategic Allocation Fund may or may not purchase the types of securities represented by the S&P 500 Total Return Index. |
| (2) | The Strategic Allocation Indices Blend (“BAIB”) is a custom blended index comprised of the following two indices with their noted respective weightings: Standard & Poor’s 500 Index® (“S&P 500”) (60%) and the Barclays U.S. Aggregate Bond Index (40%). The Barclays U.S. Aggregate Index is comprised of securities from the Barclays Government/Corporate Bond Index, Mortgage Securities Index and the Asset Based Index. Total return comprises price appreciation/depreciation and income as a percentage of the original investment. Indices are rebalanced monthly by market capitalization. The index is unmanaged and, unlike the Fund, is not affected by cash flows. The S&P 500 is an unmanaged index generally representing the performance of the broad domestic economy through changes in the aggregate market value of 500 stocks representing all major industries. Investments cannot be made in an index. For additional disclosure relating to the S&P 500, please see “Additional Disclaimers” in this Prospectus. |
4217-NLD-1/31/2019
Rational Strategic Allocation Fund
PORTFOLIO REVIEW (Unaudited)
December 31, 2018
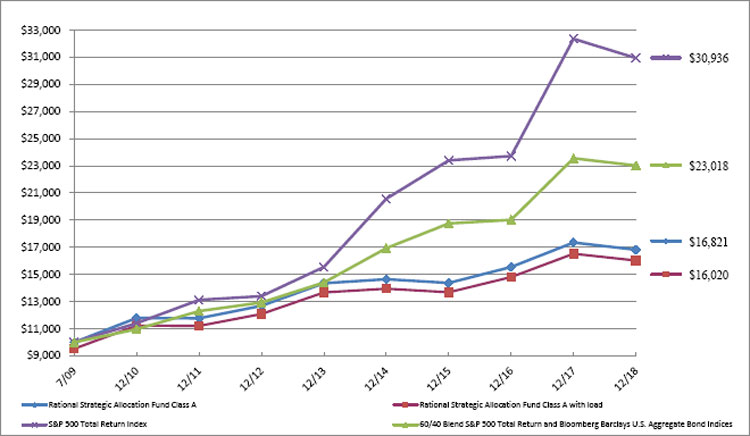
The Fund’s performance figures* for each of the periods ended December 31, 2018, compared to its benchmarks:
| | | Annualized | Annualized | Annualized |
| | 1 Year Return | 5 Year Return | Since Inception(a) | Since Inception(b) |
| Class A | (3.05)% | 3.23% | 5.67% | N/A |
| Class A with load | (7.64)% | 2.22% | 5.13% | N/A |
| Class C | (3.83)% | N/A | N/A | 4.27% |
| Institutional Class | (2.81)% | N/A | N/A | 5.32% |
| S&P 500 Total Return Index(c) | (4.38)% | 8.49% | 12.73% | 9.32% |
| Balanced Allocation Indices Blend Index(d) | (2.28)% | 6.33% | 9.25% | 6.17% |
| * | The performance data quoted here represents past performance. Current performance may be lower or higher than the performance data quoted above. Investment return and principal value will fluctuate, so that shares, when redeemed, may be worth more or less than their original cost. The returns shown do not reflect the deduction of taxes that a shareholder would pay on Fund distributions or on the redemptions of Fund shares. Past performance is no guarantee of future results. Performance figures for periods greater than 1 year are annualized. Per the fee table in the Fund’s May 1, 2018 prospectus, the total annual operating expense are 1.94% for Institutional Class shares, 2.23% for A shares and 2.94% for C shares before fee waivers. See the financial highlights for current expense ratios. For performance information current to the most recent month-end, please call toll-free 1-800-253-0412. Class A shares are subject to a maximum load of 4.75%. |
| (a) | Inception date is July 30, 2009 for Class A and the Benchmarks. |
| (b) | Inception date is May 31, 2016 for Class C, Institutional Class and the Benchmarks. |
| (c) | The “S&P 500 Total Return Index”, a registered trademark of McGraw-Hill Co., Inc., is a market capitalization-weighted index of 500 widely held common stocks. Investors cannot invest directly in an Index. |
| (d) | The Balanced Allocation Indices Blend (“BAIB”) is a custom blended index comprised of the following two indices with their noted respective weightings: Standard & Poor’s 500 Index® (“S&P 500”) (60%) and the Bloomberg Barclays U.S. Aggregate Bond Index (40%). The Barclays U.S. Aggregate Index is comprised of securities from the Barclays Government/Corporate Bond Index, Mortgage Securities Index and the Asset Based Index. Total return comprises price appreciation/depreciation and income as a percentage of the original investment. Indices are rebalanced monthly by market capitalization. The index is unmanaged and, unlike the Fund, is not affected by cash flows. The S&P 500 is an unmanaged index generally representing the performance of the broad domestic economy through changes in the aggregate market value of 500 stocks representing all major industries. Investments cannot be made in an index. |
Comparison of the Change in Value of a $10,000 Investment
| Top Holdings | | % of Net Assets | |
| Debt Funds - Mutual Funds | | | 42.4 | % |
| Equity Funds - Mutual Funds | | | 34.3 | % |
| Equity Funds - Exchange Traded Funds | | | 19.3 | % |
| Other/Short-Term Investments | | | 4.0 | % |
| | | | 100.0 | % |
Please refer to the Portfolio of Investments for a more detailed breakdown of the Fund’s assets.
January 31, 2019
Rational ReSolve Adaptive Asset Allocation Fund
Dear Fellow Shareholders,
The Rational ReSolve Adaptive Asset Allocation Fund (“the Fund”) commenced trading on March 16, 2018, when ReSolve officially became the Fund’s sub-advisor, replacing the previous manager. ReSolve Asset Management is a quantitative, systematic investment firm that relies on in-depth, academically backed and empirically proven practices for strategy construction.
Our Adaptive Asset Allocation1 methodology used in the Fund combines the strong historical return character of the momentum factor with global diversification and risk management, seeking to maximize both risk-adjusted returns and the compounding of positive rolling periods, with controlled maximum losses. The goal is to deliver an absolute-return strategy designed to thrive in most economic and market environments.
Investment Strategy
The Fund invests in futures contracts and occasionally in exchange traded funds to gain dynamic exposure to global market opportunities across country equity indexes, fixed income, tradeable real estate, currencies, and commodities.
Portfolios are formed using proprietary quantitative innovations to systematically emphasize global assets with strong and persistent trend and momentum characteristics, while maximizing diversification and minimizing total portfolio volatility. As portfolio weights and estimates of volatility and correlations change through time, the Fund will increase and decrease the gross exposure in an effort to maintain its target level of 12% annualized portfolio volatility.
Global Markets are in constant flux, from periods of strong growth, to inflationary regimes, to momentary deflationary busts. This reality means investors need to access strategies that can go anywhere in the world with agility. Adaptive Asset Allocation (AAA) fulfills this role by creating dynamic portfolios using proprietary quantitative innovations that systematically emphasize global assets with strong and persistent trend and momentum characteristics, while maximizing diversification and minimizing total portfolio volatility.
General Market Review
After a year of stellar performance, steady trends and muted volatility, global asset classes experienced a diametrically opposite 2018, with choppy markets riddled with volatility spikes, led by geopolitical skirmishes and policy shocks across the globe. This reversal of fortunes wasn’t driven by one dominant cause (unlike the Global Financial Crisis of 2008), but rather the sum of several factors that compounded into a steep sell-off in the last quarter of the year. It is, however, hard to deny the overwhelming impact that one country’s monetary and trade policies have had in leading virtually every major global asset class into negative territory for the year.
In an effort to re-align its relationship with its main trade partners, the US government used the threat of tariffs to secure more favorable terms from Canada, Mexico, and the European Union. But when it came to China, the world’s biggest economy and largest trade partner to the US, threats became actual tariffs (on both sides), and continued to escalate into an all-out trade war that has yet to be resolved. Meanwhile, the Fed continued to raise interest rates and unwind its balance sheet, both of which were largely expected by investors. But it was the tone and choice of words in its communications, especially those coming from the new chairman, that caused the two policy shocks (in February and October) that have rattled markets.
| 1 | For our 6-year track record, please visit:https://investresolve.com/ca/adaptive-asset-allocation-growth-cad/ |
The narrative emanating from other major economies has hardly been more reassuring. Europe faced an economic slowdown, further uncertainty surrounding Brexit, a budget showdown between Italy and the European Commission, as well as political crises in several countries including France and Spain. Asia’s two largest economies, Japan and China, experienced slowdowns of their own, with the latter suffering additionally from measures aimed at clamping down on the shadow banking sector and the pervasive excessive leverage in the system. Emerging market economies have had a few positive stories (notably Brazil’s recovery and the continued rise of India), but the steep losses in commodities, particularly in the energy complex, and the global risk off mood have drained liquidity and posed a significant headwind.
Figure 1. A Choppy Year for Global Asset Classes
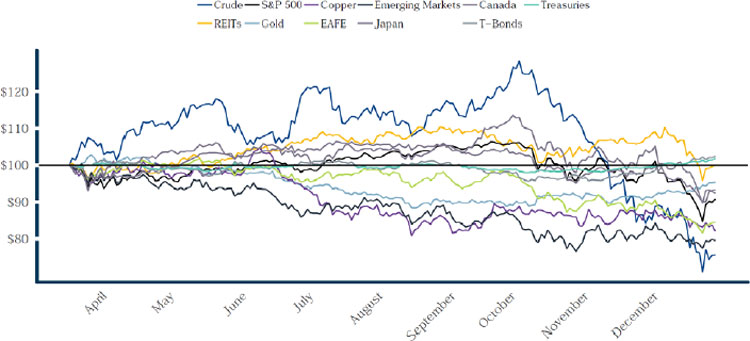
*Source: ReSolve Asset Management. Data from CSI.
Fund Performance
It was certainly the most tumultuous period for multi-asset momentum strategies since 1994, leading the Fund to end its first (and incomplete) calendar year down –7.64% (Class I).
Where Adaptive Asset Allocation produced spectacular returns last year, it struggled this year. Where all markets were up in 2017, they were ALL down in 2018. In fact, the worst performing major market in 2017 outperformed the best performing market in 2018, and they were both the same market (US Treasuries)! Cash beat everything else, which hadn’t happened in living memory, and there was much greater volatility across all markets punctuated by several mini-crashes. What’s worse, two of the three crashes originated at or near long-term high prices, and manifested as acute reversals from highly constructive intermediate-term trends.
The shocks sustained by markets, which drove virtually every asset class (with the exception of a few meagerly positive sovereign bonds) down for the year, are the type of non-diversifiable risk that investors must necessarily incur if they wish to earn a return above cash. Growth shocks (such as the 2008 Great Financial Crisis, or 2016’s Brexit decision) cause capital to flow away from risky assets and towards the safety of Treasuries and gold, which still allows
diversification to thrive and produce positive returns. Policy shocks2, on the other hand, while are much rarer in nature, have the distinct characteristic of causing almost everything to fall at the same time, due to the repricing of short-term interest rates (and “cash becomes king”, as the famous saying goes).
Few and far between, this was one of the rare years when diversification (as well as investment factors) failed, as can be seen in the chart above. Our 10-Year Treasury exposure was the only major positive contributor to the portfolio, especially during the recovery of late November and early December (as the Fund rose by almost 4% from its lows). Canadian Equities and 30-Year Treasuries also provided the Fund with modest gains. There were detractors aplenty, led by US Stocks, Crude Oil and Real-Estate.
While October was the worst month for the strategy (-9.9%), the consequent rebalancing that occurred led the portfolio to be well-positioned to benefit from the risk-off capital flows, leading to a recovery in December (+1.5%).
The Fund’s total annualized returns through 12/31/18 as compared to the BarclayHedge CTA Index and the S&P 500 Total Return Index were as follows:
| | 1 Year | 3 Years | 5 Years | Since Inception(3) |
| Class I | -7.64% | -2.27% | 1.61% | 5.72% |
| BarclayHedge CTA Index(2) | -2.79% | -1.12% | 0.49% | 4.19% |
| S&P 500 Total Return Index(1) | -4.38% | 9.26% | 8.49% | 9.11% |
| Class A | -7.83% | n/a | n/a | -3.27% |
| Class C | -8.53% | n/a | n/a | -3.92% |
| BarclayHedge CTA Index(2) | -2.79% | n/a | n/a | -1.46% |
| S&P 500 Total Return Index(1) | -4.38% | n/a | n/a | 8.81% |
| Class A w/ Sales Charge | -13.12% | n/a | n/a | -5.49% |
The Fund’s maximum sales charge for Class “A” shares is 5.75%. Investments in mutual funds involve risks. Performance is historic and does not guarantee future results. Investment return and principal value will fluctuate with changing market conditions so that when redeemed, shares may be worth more or less than their original cost. Current performance may be lower or higher than the performance data quoted. To obtain the most recent month- end performance information or the Fund’s prospectus please call the Fund, toll free at 1-800-253-0412. You can also obtain a prospectus atwww.RationalMF.com.
The Fund acquired all of the assets and liabilities of Chesapeake Fund, LLC (the “Predecessor Fund”) in a tax free reorganization on December 31, 2016. In connection with this acquisition, shares of the Predecessor Fund were exchanged for Institutional Shares of the Fund. At the time of the reorganization, the Predecessor Fund had an investment objective and strategies that were, in all material respects, the same as those of the Fund, and was managed in a manner that, in all material respects, complied with the investment guidelines and restrictions of the Fund. Effective February 27, 2018, the Fund’s investment strategy changed, and a new Sub Advisor replaced the prior sub-advisor. Consequently, prior performance may not reflect the Fund’s current operations.
Outlook
As investors prepare their portfolios to navigate the murky waters that lie ahead, it is important to remember the exceptional circumstances seen in global markets during the last 10 years. With monetary policy normalizing in the US and beyond, markets may once again be allowed to function on their own. Choppiness may cease, clear trends may re-emerge, and global leadership may shift away from the past decade’s clear leader – U.S. equities. Nimble and adaptive strategies could be ready to harness the next bull market, in whatever asset or region it may be.
Sincerely,
| 2 | We define a Policy Shock as the issuance of information by a central bank that is, to a significant degree, misaligned with investors’ expectations, leading to an abrupt adjustment in global asset prices. That information can be objective, such as unexpected changes in short-term policy rates or in expected future interest rate levels (the so-called “Dot Plot” provided by the US Federal Reserve’s Open Market Committee), or subjective, such as large deviations in the word choice or tone, in written, verbal or other communication form, when contrasted with previous communications. |
ReSolve Asset Management
Strategy Sub-Advisors
This report is intended for the Fund’s shareholders. It may not be distributed to prospective investors unless it is preceded or accompanied by the current Fund prospectus. To obtain a prospectus or other information about the Fund, please visit www.RationalMF.com or call 1-800-253-0412. Please read the prospectus carefully before investing.
| (1) | The S&P 500 Total Return Index by Standard & Poor’s Corp. is a capitalization-weighted index comprising 500 issues listed on various exchanges, representing the performance of the stock market generally. Please note that indices do not take into account any fees and expenses of investing in the individual securities that they track, and individuals cannot invest directly in any index, although individuals may invest in exchange traded funds or other investment vehicles that attempt to track the performance of an index. The Rational Strategic Allocation Fund may or may not purchase the types of securities represented by the S&P 500 Total Return Index. |
| (2) | The Barclay CTA Index is a leading industry benchmark of representative performance of commodity trading advisors. There are currently 0 programs included in the calculation of the Barclay CTA Index for 2018. The Index is equally weighted and rebalanced at the beginning of each year. |
| (3) | Inception: Institutional 02/01/1994, Class A & C 09/30/2016. Performance shown before 09/30/2016 is for the Fund’s predecessor, theRational Dynamic Momentum Fund. . |
4221-NLD-1/31/2019
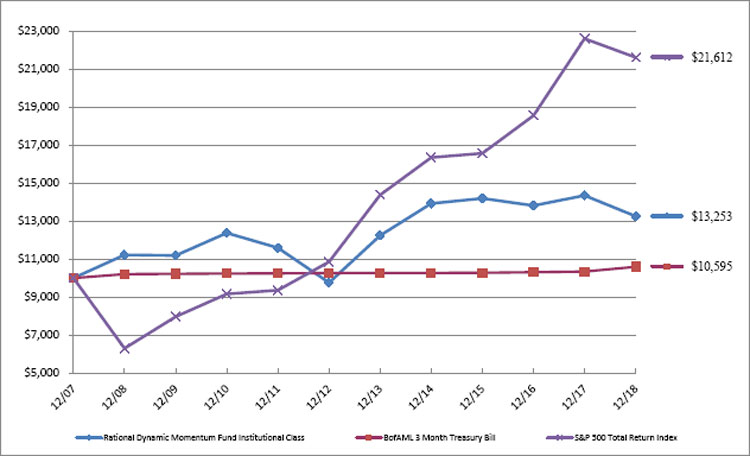
Rational/Resolve Adaptive Asset Allocation Fund (Formerly Rational Dynamic Momentum Fund)
PORTFOLIO REVIEW (Unaudited)
December 31, 2018
The Fund’s performance figures* for each of the periods ended December 31, 2018, compared to its benchmarks:
| | | Annualized | Annualized | Annualized |
| | 1 Year Return | 5 Year Return | 10 Year Return | Since Inception(a) |
| Class A | (7.83)% | N/A | N/A | (3.27)% |
| Class A with load | (13.12)% | N/A | N/A | (5.79)% |
| Class C | (8.53)% | N/A | N/A | (3.92)% |
| Institutional Class | (7.64)% | 1.61% | 1.68% | N/A |
| BofAML 3 Month Treasury Bill(b) | 1.88% | 0.63% | 0.37% | 1.25% |
| S&P 500 Total Return Index(c) | (4.38)% | 8.49% | 13.12% | 8.81% |
| * | The performance data quoted here represents past performance. Current performance may be lower or higher than the performance data quoted above. Investment return and principal value will fluctuate, so that shares, when redeemed, may be worth more or less than their original cost. The returns shown do not reflect the deduction of taxes that a shareholder would pay on Fund distributions or on the redemptions of Fund shares. Past performance is no guarantee of future results. Performance figures for periods greater than 1 year are annualized. Per the fee table in the Fund’s May 1, 2018 prospectus, the total annual operating expense are 2.54% for Institutional Class shares, 2.95% for A shares and 3.70% for C shares before fee waivers. See the financial highlights for current expense ratios. For performance information current to the most recent month-end, please call toll-free 1-800-253-0412. Class A shares are subject to a maximum load of 5.75%. |
| (a) | Inception date is May 31, 2016 for Class A, Class C and the Benchmarks. |
| (b) | BofA Merrill Lynch 3-Month U.S. Treasury Bill Index “BofAML 3-Month T-Bill,” is an index of short-term U.S. Government securities maturing in 90 days. Investors cannot invest directly in an Index. |
| (c) | The “S&P 500 Total Return Index”, a registered trademark of McGraw-Hill Co., Inc., is a market capitalization-weighted index of 500 widely held common stocks. Investors cannot invest directly in an Index. |
Comparison of the Change in Value of a $10,000 Investment
| Holdings by Asset Type ^ | | % of Net Assets | |
| Short-Term Investments | | | 95.2 | % |
| Other/Cash & Equivalents | | | 4.8 | % |
| | | | 100.0 | % |
^ Does not include derivatives in which the Fund invests.
Please refer to the Consolidated Portfolio of Investments for a more detailed breakdown of the Fund’s assets.
January 31, 2019
Rational Iron Horse Fund
Dear Fellow Shareholders,
The Rational Iron Horse (the “Fund”) was down 1.08% (Class I) during the last fiscal year ended December 31, 2018. During that same period the S&P 500 was down 4.38% and the CBOE S&P 500 BuyWrite Index (BXM) was down 4.77%. The fund had an excellent year due to increased volatility and effective risk management.
Investment Strategy
The Fund seeks to achieve its investment objective by investing primarily in:
| ● | dividend-paying common stocks, and |
| ● | by writing call options on common stocks and common stock indices. |
The Fund selects common stocks of domestic and foreign issuers with market capitalizations of at least $2 billion that are traded on a U.S. stock exchange. We combine (1) fundamental analysis, (2) technical analysis and (3) proprietary risk management techniques to seek total returns with less volatility than equity markets in general.
Fund Performance
In a high volatile market, our covered calls fund tends to do very well. Uncertainty about the economic outlook and concern over rising interest rates led to higher volatility. We believe that volatility will stay higher in the coming quarters, and potentially that would be beneficial for our single stock option strategy, as we seek more income.
During the last 12 months, the Fund was mostly equal weighted relative to the S&P 500 sector. The covered call strategies the Fund utilizes seek to do well in a sideways to lower trending market. This is what the Fund managers’ long-term experience in managing covered call strategies has taught.
The Fund’s total annualized returns through 12/31/18 as compared to the CBOE BuyWrite Index were as follows:
| | 1 Year | 3 Years | 5 Years | Since Inception(1) |
| Class A | -1.30% | 3.53% | 3.17% | 4.67% |
| S&P 500 Total Return Index(2) | -4.38% | 9.26% | 8.49% | 10.90% |
| CBOE BuyWrite Index (BXM)(3) | -4.77% | 4.84% | 5.08% | 6.23% |
| Class A with Sales Charge | -6.93% | 1.51% | 1.95% | 3.84% |
| Class I | -1.08% | 3.73% | 3.43% | 6.09% |
| S&P 500 Total Return Index(2) | -4.38% | 9.26% | 8.49% | 12.77% |
| CBOE BuyWrite Index (BXM)(3) | -4.77% | 4.84% | 5.08% | 6.78% |
The Fund’s maximum sales charge for Class “A” shares is 5.75%. Investments in mutual funds involve risks. Performance is historic and does not guarantee future results. Investment return and principal value will fluctuate with changing market conditions so that when redeemed, shares may be worth more or less than their original cost. Current performance may be lower or higher than the performance data quoted. To obtain the most recent month- end performance information or the Fund’s prospectus please call the Fund, toll free at 1-800-253-0412. You can also obtain a prospectus at www.RationalMF.com.
Our covered call strategy on average seeks to run at 50-60% of the market volatility. When the market goes sideways to down like it has over the last year, a covered call strategy can tend to do well versus a long only strategy. The goal of the strategy is not to outperform the market on every market interval, but to seek a good total return with less volatility than the market.
Sincerely,
The Iron Horse Fund Team
This report is intended for the Fund’s shareholders. It may not be distributed to prospective investors unless it is preceded or accompanied by the current Fund prospectus. To obtain a prospectus or other information about the Fund, please visit www.RationalMF.com or call 1-800-253-0412. Please read the prospectus carefully before investing.
| (1) | Inception date A Share: 7/7/2011. Returns greater than 1 year are annualized. Inception date I Share: 11/16/2011. Returns greater than 1 year are annualized. Class C Share launch date 4/06/2017. |
| (2) | The S&P 500 Total Return Index by Standard & Poor’s Corp. is a capitalization-weighted index comprising 500 issues listed on various exchanges, representing the performance of the stock market generally. Please note that indices do not take into account any fees and expenses of investing in the individual securities that they track, and individuals cannot invest directly in any index, although individuals may invest in exchange traded funds or other investment vehicles that attempt to track the performance of an index. The Rational Strategic Allocation Fund may or may not purchase the types of securities represented by the S&P 500 Total Return Index. |
| (3) | The CBOE S&P 500 BuyWrite Index (BXM) is a benchmark index designed to track the performance of a hypothetical buy-write strategy on the S&P 500 Index. The BXM is a passive total return index based on (1) buying an S&P 500 stock index portfolio, and (2) “writing” (or selling) the near-term S&P 500 Index (SPXSM) “covered” call option, generally on the third Friday of each month. |
4228-NLD-2/1/2019
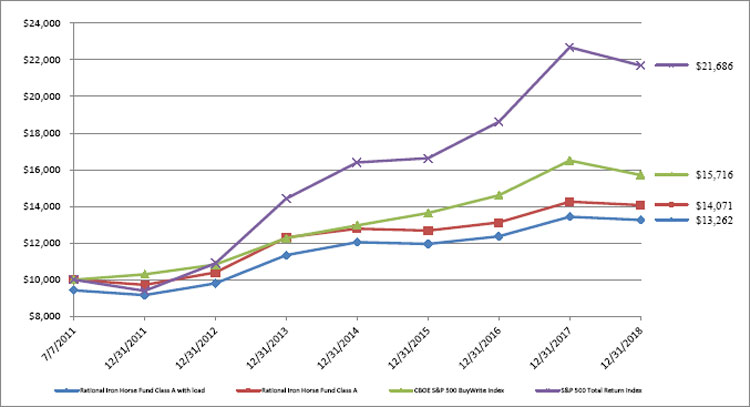
Rational Iron Horse Fund
PORTFOLIO REVIEW (Unaudited)
December 31, 2018
The Fund’s performance figures* for each of the periods ended December 31, 2018, compared to its benchmarks:
| | | Annualized | Annualized | Annualized | Annualized |
| | 1 Year Return | 5 Year Return | Since Inception(a) | Since Inception(b) | Since Inception(c) |
| Class A | (1.30)% | 3.17% | 4.67% | N/A | N/A |
| Class A with Load | (6.93)% | 1.95% | 3.84% | N/A | N/A |
| Class C | (1.71)% | N/A | N/A | N/A | 1.77% |
| Institutional Class | (1.08)% | 3.43% | N/A | 6.09% | N/A |
| S&P 500 Total Return Index (d) | (4.38)% | 8.49% | 10.90% | 12.77% | 5.70% |
| CBOE S&P Buy Write Index (e) | (4.77)% | 5.08% | 6.23% | 6.78% | 2.01% |
| * | The performance data quoted here represents past performance. Current performance may be lower or higher than the performance data quoted above. Investment return and principal value will fluctuate, so that shares, when redeemed, may be worth more or less than their original cost. The returns shown do not reflect the deduction of taxes that a shareholder would pay on Fund distributions or on the redemptions of Fund shares. Past performance is no guarantee of future results. Performance figures for periods greater than 1 year are annualized. Per the fee table in the Fund’s May 1, 2018 prospectus, the total annual operating expense are 2.32% for Institutional Class shares, 2.43% for A shares and 3.18% for C shares before fee waivers. See the financial highlights for current expense ratios. For performance information current to the most recent month-end, please call toll-free 1-800-253-0412. Class A shares are subject to a maximum load of 5.75%. |
| (a) | Inception date is July 7, 2011. |
| (b) | Inception date is November 16, 2011. |
| (c) | Inception date is April 7, 2017 |
| (d) | The “S&P 500 Total Return Index”, a registered trademark of McGraw-Hill Co., Inc., is a market capitalization-weighted index of 500 widely held common stocks. Investors cannot invest directly in an Index. |
| (e) | The CBOE S&P 500 BuyWrite Index (BXM) is a benchmark index designed to track the performance of a hypothetical buy-write strategy on the S&P 500 Index. The BXM is a passive total return index based on (1) buying an S&P 500 stock index portfolio, and (2) “writing” (or selling) the near-term S&P 500 Index “covered” call option, generally on the third Friday of each month. Index returns assume the reinvestment of dividends. Investors may not invest in the index directly; unlike the Fund’s returns, the index does not reflect any fees or expenses. |
Comparison of the Change in Value of a $10,000 Investment
| Top 10 Holdings by Industry ^ | | % of Net Assets | |
| Pharmaceuticals | | | 8.8 | % |
| Computers | | | 8.1 | % |
| Banks | | | 7.8 | % |
| Oil & Gas | | | 6.0 | % |
| Media | | | 5.8 | % |
| Electric | | | 5.4 | % |
| Mining | | | 4.2 | % |
| Miscellaneous Manufacturing | | | 3.5 | % |
| Semiconductors | | | 3.4 | % |
| Household Products/Wares | | | 3.2 | % |
| Other/Short-Term Investments | | | 43.8 | % |
| | | | 100.0 | % |
^ Does not include derivatives in which the Fund invests.
Please refer to the Portfolio of Investments in this shareholder report for a detailed analysis of the Fund’s holdings.
January 31, 2019
Rational Income Opportunities Fund
Dear Fellow Shareholders,
The Rational Income Opportunities Fund (the “Fund”) seeks to combine stable monthly fixed coupon yields with price appreciation to generate a favorable rate of return for fixed income investors. Since inception, on April 23, 2018, the Fund achieved relatively strong gains, outperforming its Barclays US Agg. Benchmark with a 2.72% (Class I) return versus 2.46% for the benchmark.
Investment Strategy
The Fund seeks to achieve the investment objective by investing primarily in U.S. agency and non-agency CMBS and other commercial real estate related securities. The Fund’s investment strategy relies on rigorous credit analysis. We employ a comprehensive due diligence process on each investment, including, but not limited to, analysis of bond cash flows and analysis of property cash flows, sub-market vacancy and rental rates, potential lease rollovers and potential capital expenditures on underlying collateral properties.
Fund Performance
Since inception, the Fund returned 2.72% (Class I), leading its Barclays US Agg. benchmark’s return of 2.46%. The Fund benefitted from the receipt of monthly fixed coupon yields, partially offset by price depreciation in the mark-to-market of the portfolio. As of year-end, the Fund’s portfolio earned a weighted average coupon of 4.8%. Moderate mark-to-market price declines in our portfolio’s securities were a result of spread widening across all tranches of CMBS, amid overall market volatility. Spread widening was more extreme in subordinate classes. Spreads in BBB- widened 105bps from inception to year end, compared to spreads in A-rated securities, which widening 83bps over the same period. We successfully managed spread risk by targeting senior bonds. At year end, our portfolio had a composite rating of A+, on an equally weighted basis.
| | | | | Since Inception |
| | 6 Mos | YTD | 1 Year | (4/23/18) |
| Class I | 1.60% | n/a | n/a | 2.72% |
| Class A | 1.49% | n/a | n/a | 2.56% |
| Class C | 1.03% | n/a | n/a | 1.93% |
| Barclays US Agg. Bond TR Index(1) | 1.65% | n/a | n/a | 2.46% |
| Class A w/ Sales Charge | -4.38% | n/a | n/a | -3.34% |
The Fund’s maximum sales charge for Class “A” shares is 5.75%. Investments in mutual funds involve risks. Performance is historic and does not guarantee future results. Investment return and principal value will fluctuate with changing market conditions so that when redeemed, shares may be worth more or less than their original cost. Current performance may be lower or higher than the performance data quoted. To obtain the most recent month- end performance information or the Fund’s prospectus please call the Fund, toll free at 1-800-253-0412. You can also obtain a prospectus at www.RationalMF.com.
Summary
The Rational Income Opportunities Fund achieved strong relative gains in 2018, consistent with our investment objective: Generate current income while mitigating risks and market volatility. On the backdrop of a volatile market, the majority of the Fund’s holding performed to our expectations, while generating current income to the benefit of our shareholders.
Sincerely,
Robert Neighoff and Evan Kurtz
Portfolio Managers
This report is intended for the Fund’s shareholders. It may not be distributed to prospective investors unless it is preceded or accompanied by the current Fund prospectus. To obtain a prospectus or other information about the Fund, please visit www.RationalMF.com or call 1-800-253-0412. Please read the prospectus carefully before investing.
| (1) | The Barclays US Agg. Bond TR Index is a broad-based flagship benchmark that measures the investment grade, US dollar-denominated, fixed-rate taxable bond market. The index includes Treasuries, government-related and corporate securities, MBS (agency fixed-rate and hybrid ARM pass-throughs), ABS and CMBS (agency and nonagency. |
4229-NLD-2/1/2019
Rational Income Opportunities Fund
PORTFOLIO REVIEW (Unaudited)
December 31, 2018
The Fund’s performance figures* for each of the periods ended December 31, 2018, compared to its benchmarks:
| | Since Inception(a) |
| Class A | 2.56% |
| Class A with load | (3.34)% |
| Class C | 1.93% |
| Institutional Class | 2.72% |
| Barclays US Intermediate Aggregate Bond Index(b) | 2.46% |
| * | The performance data quoted here represents past performance. Current performance may be lower or higher than the performance data quoted above. Investment return and principal value will fluctuate, so that shares, when redeemed, may be worth more or less than their original cost. The returns shown do not reflect the deduction of taxes that a shareholder would pay on Fund distributions or on the redemptions of Fund shares. Past performance is no guarantee of future results. Performance figures for periods greater than 1 year are annualized. Per the fee table in the Fund’s April 20, 2018 prospectus, the total annual operating expense are 2.26% for Institutional Class shares, 2.51% for A shares and 3.26% for C shares before fee waivers. See the financial highlights for current expense ratios. For performance information current to the most recent month-end, please call toll-free 1-800-253-0412. Class A shares are subject to a maximum load of 5.75%. |
| (a) | Inception date is April 23, 2018. |
| (b) | Barclays US Intermediate Aggregate Bond Index measures the performance of the U.S. investment grade bond market. The index invests in a wide spectrum of public, investment-grade, taxable, fixed income, securities in the United States - including government, corporate, and international dollar-denominated bonds, as well as mortgage-backed and asset-backed securities, all with maturities of more than 1 year. Investors may not invest directly in an index. Unlike the Fund’s returns, the Index does not reflect any fees or expenses. |
Comparison of the Change in Value of a $10,000 Investment

| Top Holdings | | % of Net Assets | |
| Asset Backed Securities | | | 86.4 | % |
| Commercial Mortgage Obligations | | | 8.4 | % |
| Exchange Traded Funds | | | 2.0 | % |
| REIT | | | 1.3 | % |
| Other/Short-Term Investments | | | 1.9 | % |
| | | | 100.0 | % |
Please refer to the Portfolio of Investments for a more detailed breakdown of the Fund’s assets.
January 31, 2019
Rational NuWave Enhanced Market Opportunity Fund
Dear Fellow Shareholders,
The Rational NuWave Enhanced Market Opportunity Fund (the “Fund”) seeks long-term capital appreciation (with the goal of generating superior risk-adjusted returns compared with a typical long-only, non-leveraged equity portfolio) by investing in a combination of equity securities and diversified managed futures. During 2018, the Fund posted a positive return of 3.00% (Class I), significantly outperforming both the SG CTA Mutual Fund Index and the S&P 500 Total Return Index (which generated a negative return of 5.23% and 4.38%, respectively). Since its conversion on February 28, 2018 through December 31, 2018, the Fund suffered losses (posted a negative return of 2.87%) that were largely in-line with those experienced by the S&P 500 Total Return Index, the Fund generated offsetting gains from its long and short exposures to both financial futures and commodity futures.
Investment Strategy
The Fund seeks to achieve its objective by investing in an actively managed equity portfolio (the “Equity Component”) and a broadly diversified managed futures portfolio (the “Futures Component”).
The Equity Component is comprised primarily of common stocks and exchange-traded funds invested in equity securities of US companies. Although the Fund may invest in companies of any market capitalization without limit, the Fund invests predominantly in companies with market capitalizations of $5 billion or more. The Equity Component employs a systematic process to identify repetitive patterns of price behavior that are indicative of prevailing market sentiment and/or institutional money flows into or out of individual securities and sectors. These factors are often indicative of large-scale asset allocation shifts, sector rotation opportunities and/or shifting sentiment indicators. Individual stocks that are expected to outperform the benchmark index are targeted for inclusion in the portfolio, while those that are expected to underperform are either liquidated or excluded. The systematic portfolio selection process is further constrained real-time with respect to individual positions size and sector exposures in order to ensure a meaningful variety of market exposures. Holding periods typically range from intraday to several weeks in length (depending upon the persistence of trending price behaviors).
The Futures Component holds long and short positions on futures contracts and maintains cash and cash equivalents to be utilized as margin or collateral. The Futures Component is allocated among various asset classes, including exposure to both financial futures (stock indices, fixed income and currencies) and commodity futures (energies, metals, grains, softs and meats). Investments may be made in domestic and foreign markets, either directly or indirectly by investing through a subsidiary. The Futures Component employs a multi-model approach and seeks to identify price trends through the application of hundreds of individual trading models, which collectively provide exposure to short-, intermediate- and long-term trading opportunities.
The combined portfolio is structured to be broadly diversified across markets, time horizons and trading styles, and the Fund hopes to achieve a substantial degree of non-correlation between the Equity Component and the Futures Component.
Fund Performance
During 2018, the Fund posted a positive return of 3.00% (Class I), significantly outperforming both the SG CTA Mutual Fund Index and the S&P 500 Total Return Index (which generated a negative return of 5.23% and 4.38%, respectively). Despite a marked increase in two-sided price volatility across the U.S. equity markets – owing in large part to persistent uncertainty tied to U.S. trade policy, changing rate expectations, shrinking growth forecasts and intermittent geopolitical concerns – the Fund deftly navigated the shifting cross-currents to finish the year with gains. For the year, the Fund’s actively managed equity portfolio suffered losses that were generally on par with the S&P 500 Total Return Index, as the major U.S. equity indices firmly entered correction territory during the fourth quarter; however, the Fund’s trend-based managed futures models recorded offsetting gains from two-sided directional
exposures to a wide variety of commodities markets (including gold, silver, platinum, natural gas, crude oil, gasoline, cotton, sugar, coffee, cattle and hogs).
The Fund’s total annualized returns through 12/31/18 as compared to the S&P 500 Total Return Index and the SG CTA Mutual Fund Index were as follows:
| | QTD | 1 Year | 5 Years | Since Inception(1) |
| Class I | -5.65% | 3.00% | 8.12% | 8.19% |
| S&P 500 Total Return Index(2) | -13.52% | -4.38% | 8.49% | 10.75% |
| SG CTA Mutual Fund Index(3) | -1.27% | -5.23% | -0.26% | -0.18% |
| Class A | -5.71% | n/a | n/a | 9.70% |
| Class C | -5.86% | n/a | n/a | 9.08% |
| S&P 500 Total Return Index(2) | -13.52% | n/a | n/a | -6.10% |
| SG CTA Mutual Fund Index(3) | -1.27% | n/a | n/a | -2.72% |
| Class A with Sales Charge | -11.11% | n/a | n/a | 3.36% |
The Fund’s maximum sales charge for Class “A” shares is 5.75%. Investments in mutual funds involve risks. Performance is historic and does not guarantee future results. Investment return and principal value will fluctuate with changing market conditions so that when redeemed, shares may be worth more or less than their original cost. Current performance may be lower or higher than the performance data quoted. To obtain the most recent month- end performance information or the Fund’s prospectus please call the Fund, toll free at 1-800-253-0412. You can also obtain a prospectus atwww.RationalMF.com.
The Fund acquired all of the assets and liabilities of NuWave Equity Enhanced Fund, LP (the “Predecessor Fund”) in a tax-free reorganization on March 1, 2018. In connection with this acquisition, shares of the Predecessor Fund were exchanged for Institutional Shares of the Fund. The Fund’s investment objectives, policies, restrictions and guidelines are, in all material respects, equivalent to the Predecessor Fund’s investment, objectives, policies, restrictions and guidelines. The Fund’s sub-adviser was the adviser to the Predecessor Fund. The financial statements for the Predecessor Fund can be found in the Fund’s Statement of Additional Information. The performance information set forth above reflects the historical performance of the Predecessor Fund shares. From its inception date, the Predecessor Fund was not subject to certain investment restrictions, diversification requirements and other restrictions of the Investment Company Act of 1940; if such requirements and restrictions had been applicable, it might have adversely affected performance. In addition, the Predecessor Fund was not subject to sales loads that would have adversely affected performance. Performance of the Predecessor Fund is not an indicator of future results.
Summary
The Rational NuWave Enhanced Market Opportunity Fund achieved positive gains in 2018 consistent with its investment objective, significantly outperforming both the S&P 500 Total Return Index and the SG CTA Mutual Fund Index. While the performance of the Fund’s actively managed equity portfolio generally kept pace with that of the S&P 500 Total Return Index, the Fund benefitted from the performance of its diversified managed futures portfolio, which is emblematic of the distinct correlation benefits and unique return profile we hope to deliver over the long-term.
Sincerely,
Troy W. Buckner
Portfolio Manager
This report is intended for the Fund’s shareholders. It may not be distributed to prospective investors unless it is preceded or accompanied by the current Fund prospectus. To obtain a prospectus or other information about the Fund, please visit www.RationalMF.com or call 1-800-253-0412. Please read the prospectus carefully before investing.
| (1) | Inception date A and C Share: 02/28/2018. Inception date I Share: 03/31/2013. |
| (2) | The S&P 500 Total Return Index by Standard & Poor’s Corp. is a capitalization-weighted index comprising 500 issues listed on various exchanges, representing the performance of the stock market generally. Please note that indices do not take into account any fees and expenses of investing in the individual securities that they track, and individuals cannot invest directly in any index, although individuals may invest in exchange traded funds or other investment vehicles that attempt to track the performance of an index. The Rational Strategic Allocation Fund may or may not purchase the types of securities represented by the S&P 500 Total Return Index. |
| (3) | The SG CTA Mutual Fund Index calculates the net daily rate of return for a group of the largest 10 CTA mutual funds. The SG CTA Mutual Fund Index is a key managed futures performance benchmark, selecting from the largest CTA mutual funds open to new investment; it is designed to track the largest CTAs in U.S. single manager mutual fund format and is believed to be representative of the managed futures mutual fund space generally. The Index is equally-weighted and rebalanced and reconstituted annually. Investments cannot be made in an index. |
4220-NLD-1/31/2019
Rational NuWave Enhanced Market Opportunity Fund
PORTFOLIO REVIEW (Unaudited)
December 31, 2018
The Fund’s performance figures* for each of the periods ended December 31, 2018, compared to its benchmarks:
| | | Annualized | Annualized | |
| | 1 Year Return | 5 Year Return | Since Inception(a) | Since Inception(b) |
| Class A | N/A | N/A | N/A | 9.70% |
| Class A with load | N/A | N/A | N/A | 3.36% |
| Class C | N/A | N/A | N/A | 9.08% |
| Institutional Class(c) | 3.00% | 8.12% | 8.19% | N/A |
| S&P 500 Total Return Index(d) | (4.38)% | 8.49% | 10.75% | (6.10)% |
| * | The performance data quoted here represents past performance. Current performance may be lower or higher than the performance data quoted above. Investment return and principal value will fluctuate, so that shares, when redeemed, may be worth more or less than their original cost. The returns shown do not reflect the deduction of taxes that a shareholder would pay on Fund distributions or on the redemptions of Fund shares. Past performance is no guarantee of future results. Performance figures for periods greater than 1 year are annualized. Per the fee table in the Fund’s March 1, 2018 prospectus, the total annual operating expense are 2.88% for Institutional Class shares, 3.13% for A shares and 3.88% for C shares before fee waivers. See the financial highlights for current expense ratios. For performance information current to the most recent month-end, please call toll-free 1-800-253-0412. Class A shares are subject to a maximum load of 5.75%. |
| (a) | Inception date is March 31, 2013 for Institutional Class and the Benchmark. |
| (b) | Inception date is February 28, 2018 for Class A, Class C and the Benchmark. |
| (c) | The Fund acquired all of the assets and liabilities of the “NuWave Equity Enhanced Fund LP” (the “Predecessor Fund”) in a tax free reorganization on February 28, 2018. In connection with this acquisition, shares of the Predecessor Fund were exchanged for Institutional Class shares of the Fund, so the Predecessor Fund became the Institutional Class shares of the Fund. The Fund’s investment objective, policies and guidelines are, in all material respects, equivalent to the Predecessor Fund’s investment objectives, policies and guidelines. The Predecessor Fund commenced operations on March 31, 2013. Updated performance information will be available at no cost by calling 1-800-253-0412 or visiting the Fund’s website at www.RationalMF.com. |
| (d) | The “S&P 500 Total Return Index”, a registered trademark of McGraw-Hill Co., Inc., is a market capitalization-weighted index of 500 widely held common stocks. Investors cannot invest directly in an Index. |
Comparison of the Change in Value of a $10,000 Investment
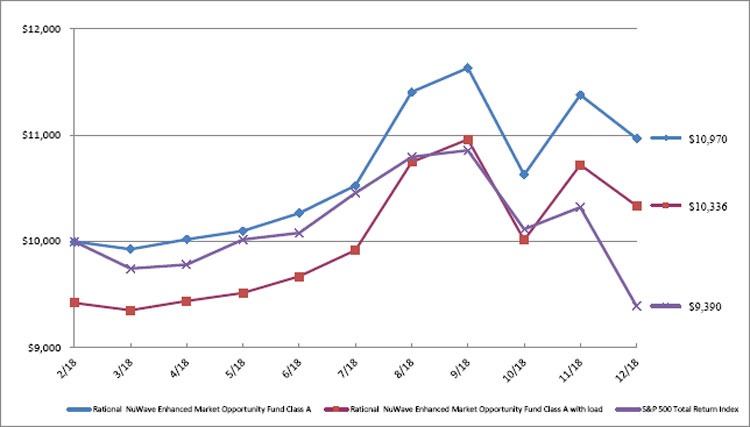
| Top 10 Holdings by Industry ^ | | % of Net Assets | |
| Software | | | 5.5 | % |
| Retail | | | 5.4 | % |
| Healthcare-Products | | | 4.3 | % |
| Electric | | | 4.0 | % |
| REIT | | | 3.9 | % |
| Insurance | | | 3.9 | % |
| Oil & Gas | | | 3.4 | % |
| Diversified Financial Services | | | 3.4 | % |
| Food | | | 3.4 | % |
| Commercial Services | | | 3.1 | % |
| Other/Short-Term Investments | | | 59.7 | % |
| | | | 100.0 | % |
^ Does not include derivatives in which the Fund Invests.
Please refer to the Portfolio of Investments for a more detailed breakdown of the Fund’s assets.
| RATIONAL DIVIDEND CAPTURE FUND |
| PORTFOLIO OF INVESTMENTS |
| December 31, 2018 |
| Shares | | | | | Value | |
| | | | | COMMON STOCKS - 76.2% | | | | |
| | | | | BANKS - 7.2% | | | | |
| | 16,490 | | | Bank of America Corp. | | $ | 406,313 | |
| | 7,500 | | | Citigroup, Inc. | | | 390,450 | |
| | 5,710 | | | PacWest Bancorp | | | 190,029 | |
| | 8,770 | | | Wells Fargo & Co. | | | 404,122 | |
| | | | | | | | 1,390,914 | |
| | | | | CHEMICALS - 0.5% | | | | |
| | 5,175 | | | Olin Corp. | | | 104,069 | |
| | | | | | | | | |
| | | | | COMPUTERS - 2.1% | | | | |
| | 3,525 | | | International Business Machines Corp. | | | 400,687 | |
| | | | | | | | | �� |
| | | | | DIVERSIFIED FINANCIAL SERVICES - 6.1% | | | | |
| | 65,464 | | | Arlington Asset Investment Corp. | | | 473,959 | |
| | 179,983 | | | Medley Management, Inc. | | | 694,735 | |
| | | | | | | | 1,168,694 | |
| | | | | FOOD - 4.7% | | | | |
| | 10,090 | | | General Mills, Inc. | | | 392,905 | |
| | 11,665 | | | Kraft Heinz Co. | | | 502,061 | |
| | | | | | | | 894,966 | |
| | | | | FOREST PRODUCTS & PAPER - 1.2% | | | | |
| | 5,665 | | | International Paper Co. | | | 228,640 | |
| | | | | | | | | |
| | | | | HOLDING COMPANIES - DIVERSIFIED - 1.3% | | | | |
| | 25,000 | | | Chardan Healthcare Acquisition Corp. * | | | 251,750 | |
| | | | | | | | | |
| | | | | HOUSEWARES - 2.1% | | | | |
| | 21,130 | | | Newell Brands, Inc. | | | 392,807 | |
| | | | | | | | | |
| | | | | INVESTMENT COMPANIES - 6.0% | | | | |
| | 29,296 | | | Apollo Investment Corp. | | | 363,271 | |
| | 26,045 | | | Ares Capital Corp. | | | 405,781 | |
| | 73,435 | | | FS KKR Capital Corp. | | | 380,394 | |
| | | | | | | | 1,149,446 | |
| | | | | MACHINERY - CONSTRUCTION & MINING - 0.5% | | | | |
| | 820 | | | Caterpillar, Inc. | | | 104,197 | |
| | | | | | | | | |
| | | | | MEDIA - 4.7% | | | | |
| | 8,770 | | | CBS Corp. | | | 383,424 | |
| | 4,720 | | | Walt Disney Co. | | | 517,548 | |
| | | | | | | | 900,972 | |
| | | | | OIL & GAS - 0.5% | | | | |
| | 1,780 | | | Royal Dutch Shell PLC | | | 103,721 | |
| | | | | | | | | |
| | | | | PHARMACEUTICALS - 4.6% | | | | |
| | 8,740 | | | CVS Health Corp. | | | 572,645 | |
| | 5,725 | | | GlaxoSmithKline PLC | | | 218,752 | |
| | 745 | | | Johnson & Johnson | | | 96,142 | |
| | | | | | | | 887,539 | |
| | | | | REITS - 14.5% | | | | |
| | 62,560 | | | Cedar Realty Trust, Inc. | | | 196,439 | |
| | 71,280 | | | Dynex Capital, Inc. | | | 407,722 | |
| | 20,000 | | | Global Net Lease, Inc. | | | 352,400 | |
| | 146,910 | | | New Senior Investment Group, Inc. | | | 605,269 | |
| | 14,700 | | | Preferred Apartment Communities, Inc. | | | 206,682 | |
| | 36,260 | | | Senior Housing Properties Trust | | | 424,967 | |
| | 66,500 | | | Tremont Mortgage Trust * | | | 601,825 | |
| | | | | | | | 2,795,304 | |
See accompanying notes to financial statements.
| RATIONAL DIVIDEND CAPTURE FUND |
| PORTFOLIO OF INVESTMENTS (Continued) |
| December 31, 2018 |
| Shares | | | | | Value | |
| | | | | COMMON STOCKS - 76.2% (Continued) | | | | |
| | | | | RETAIL - 5.1% | | | | |
| | 2,625 | | | Home Depot, Inc. | | $ | 451,028 | |
| | 3,490 | | | Macy’s, Inc. | | | 103,932 | |
| | 6,470 | | | Target Corp. | | | 427,602 | |
| | | | | | | | 982,562 | |
| | | | | SAVINGS & LOAN - 1.0% | | | | |
| | 21,330 | | | New York Community Bancorp, Inc. | | | 200,715 | |
| | | | | | | | | |
| | | | | SEMICONDUCTORS - 1.8% | | | | |
| | 2,360 | | | Intel Corp. | | | 110,755 | |
| | 14,940 | | | Marvell Technology Group Ltd. | | | 241,878 | |
| | | | | | | | 352,633 | |
| | | | | TELECOMMUNICATIONS - 11.2% | | | | |
| | 31,435 | | | AT&T, Inc. | | | 897,155 | |
| | 36,240 | | | CenturyLink, Inc. | | | 549,036 | |
| | 102,975 | | | Nokia OYJ - ADR | | | 599,314 | |
| | 9,060 | | | Telefonica Brasil SA - ADR | | | 108,086 | |
| | | | | | | | 2,153,591 | |
| | | | | TRANSPORTATION - 1.1% | | | | |
| | 4,200 | | | Ryder System, Inc. | | | 202,230 | |
| | | | | | | | | |
| | | | | TOTAL COMMON STOCKS (Cost $17,079,682) | | | 14,665,437 | |
| | | | | | | | | |
| | | | | EXCHANGE TRADED FUNDS - 10.4% | | | | |
| | | | | EQUITY FUNDS - 7.2% | | | | |
| | 68,850 | | | Alerian MLP ETF | | | 601,060 | |
| | 2,570 | | | Invesco QQQ Trust Series 1 | | | 396,448 | |
| | 3,550 | | | iShares S&P 100 ETF | | | 395,932 | |
| | | | | | | | 1,393,440 | |
| | | | | FIXED INCOME FUND - 3.2% | | | | |
| | 29,960 | | | Invesco CEF Income Composite ETF | | | 606,091 | |
| | | | | | | | | |
| | | | | TOTAL EXCHANGE TRADED FUNDS (Cost - $2,048,625) | | | 1,999,531 | |
| | | | | | Variable Rates | | Coupon | | Maturity | | | |
| | | | | PREFERRED STOCKS - 5.6% | | | | | | | | |
| | | | | ELECTRIC - 1.3% | | | | | | | | | | |
| | 12,900 | | | Spark Energy, Inc. ** | | US 3M + 6.578% | | 8.750% | | Perpetual | | | 246,003 | |
| | | | | | | | | | | | | | | |
| | | | | GAS - 1.6% | | | | | | | | | | |
| | 12,500 | | | Global Partners LP ** | | US 3M + 6.774% | | 9.750% | | Perpetual | | | 299,362 | |
| | | | | | | | | | | | | | | |
| | | | | INVESTMENT COMPANIES - 2.4% | | | | | | | | |
| | 13,000 | | | B Riley Financial, Inc. | | | | 7.375% | | 5/31/2023 | | | 316,030 | |
| | 6,406 | | | Great Elm Capital Corp. | | | | 6.750% | | 1/31/2025 | | | 155,474 | |
| | | | | | | | | | | | | | 471,504 | |
| | | | | REAL ESTATE - 0.3% | | | | | | | | | | |
| | 5,900 | | | Wheeler REIT, Inc. | | | | 8.750% | | Perpetual | | | 56,935 | |
| | | | | | | | | | | | | | | |
| | | | | TOTAL PREFERRED STOCKS (Cost - $1,220,725) | | | | | 1,073,804 | |
| | | | | | | | | | | | | | | |
| | | | | SHORT-TERM INVESTMENTS - 6.9% | | | | | | | |
| | 1,320,587 | | | Federated Treasury Obligations Fund, Institutional Class, 2.31% *** | | | | 1,320,587 | |
| | | | | TOTAL SHORT-TERM INVESTMENTS (Cost $1,320,587) | | | | | 1,320,587 | |
| | | | | | | | | | | | | | | |
| | | | | TOTAL INVESTMENTS (Cost $21,669,619) - 99.1% | | | | $ | 19,059,359 | |
| | | | | OTHER ASSETS LESS LIABILITIES - 0.9% | | | | | | 173,789 | |
| | | | | NET ASSETS - 100.0% | | | | | | | | $ | 19,233,148 | |
ADR - American Depositary Receipt.
ETF - Exchange Traded Fund.
LP - Limited Partnership.
PLC - Public Limited Company.
REIT - Real Estate Investment Trust.
US 3M - Three Month US Dollar LIBOR Interest Rate
| * | Non-Income Producing Security. |
| ** | Rate shown represents the rate at December 31, 2018 and is subject to change and resets quarterly. |
| *** | Rate shown represents the rate at December 31, 2018 and is subject to change and resets daily. |
See accompanying notes to financial statements.
| RATIONAL HEDGED RETURN FUND |
| PORTFOLIO OF INVESTMENTS |
| December 31, 2018 |
| Shares | | | | | Value | |
| | | | | SHORT-TERM INVESTMENTS - 55.4% | | | | |
| | 20,303,578 | | | Federated Treasury Obligations Fund, Institutional Class, 2.31% * | | $ | 20,303,578 | |
| | | | | TOTAL SHORT-TERM INVESTMENTS (Cost - $20,303,578) | | | 20,303,578 | |
| | | | | | | | | |
| | | | | TOTAL INVESTMENTS - 55.4% (Cost - $20,303,578) | | $ | 20,303,578 | |
| | | | | OTHER ASSETS LESS LIABILITIES - 44.6% | | | 16,357,469 | |
| | | | | NET ASSETS - 100.0% | | $ | 36,661,047 | |
| | | | | | | | Notional | | Expiration | | Exercise Price | | | |
| Contracts ^ | | | | | Counterparty | | Amount ($) | | Date | | ($) | | Value | |
| | | | | OPTIONS WRITTEN ** - (0.0)% | | | | | | | | | | |
| | | | | CALL OPTIONS WRITTEN - (0.0)% | | | | | | | | | |
| | 121 | | | S&P 500 Future Index | | Wedbush | | 81,523,750 | | 1/7/2019 | | 2,695 | | $ | 3,025 | |
| | 272 | | | S&P 500 Future Index | | Wedbush | | 183,600,000 | | 1/7/2019 | | 2,700 | | | 6,800 | |
| | | | | TOTAL CALL OPTIONS WRITTEN (Premiums Received - $9,825) | | | | $ | 9,825 | |
| | | | | | | | | | | | | | | | | |
| | | | | TOTAL OPTIONS WRITTEN (Premiums Received - $9,825) | | | | $ | 9,825 | |
| ^ | Each contract is equivalent to one futures contract. |
| * | Rate shown represents the rate at December 31, 2018 and is subject to change and resets daily. |
| ** | Non-income producing security. |
See accompanying notes to financial statements.
| RATIONAL DYNAMIC BRANDS FUND |
| PORTFOLIO OF INVESTMENTS |
| December 31, 2018 |
| Shares | | | | | Value | |
| | | | | COMMON STOCKS - 67.9% | | | | |
| | | | | APPAREL - 3.4% | | | | |
| | 2,602 | | | adidas AG - ADR | | $ | 271,493 | |
| | 3,072 | | | Canada Goose Holdings, Inc. * | | | 134,308 | |
| | 1,053 | | | Deckers Outdoor Corp. * | | | 134,731 | |
| | 2,339 | | | LVMH Moet Hennessy Louis Vuitton SE - ADR | | | 136,738 | |
| | 3,867 | | | NIKE, Inc. | | | 286,699 | |
| | | | | | | | 963,969 | |
| | | | | BEVERAGES - 4.4% | | | | |
| | 9,237 | | | Coca-Cola Co. | | | 437,372 | |
| | 4,555 | | | Molson Coors Brewing Co. | | | 255,809 | |
| | 4,878 | | | PepsiCo, Inc. | | | 538,921 | |
| | | | | | | | 1,232,102 | |
| | | | | COMMERCIAL SERVICES - 2.2% | | | | |
| | 7,256 | | | PayPal Holdings, Inc. * | | | 610,157 | |
| | | | | | | | | |
| | | | | COMPUTERS - 1.5% | | | | |
| | 2,606 | | | Apple, Inc. | | | 411,070 | |
| | | | | | | | | |
| | | | | COSMETICS / PERSONAL CARE - 3.7% | | | | |
| | 11,296 | | | Procter & Gamble Co. | | | 1,038,328 | |
| | | | | | | | | |
| | | | | DIVERSIFIED FINANCIAL SERVICES - 3.3% | | | | |
| | 2,740 | | | Mastercard, Inc. | | | 516,901 | |
| | 3,199 | | | Visa, Inc. | | | 422,076 | |
| | | | | | | | 938,977 | |
| | | | | ENTERTAINMENT - 0.9% | | | | |
| | 5,335 | | | Live Nation Entertainment, Inc. * | | | 262,749 | |
| | | | | | | | | |
| | | | | ENVIRONMENTAL CONTROL - 0.5% | | | | |
| | 1,529 | | | Waste Management, Inc. | | | 136,066 | |
| | | | | | | | | |
| | | | | HEALTHCARE-SERVICES - 1.0% | | | | |
| | 2,155 | | | Laboratory Corp of America Holdings * | | | 272,306 | |
| | | | | | | | | |
| | | | | HOUSEHOLD PRODUCTS/WARES - 1.0% | | | | |
| | 4,292 | | | Church & Dwight Co, Inc. | | | 282,242 | |
| | | | | | | | | |
| | | | | INTERNET - 4.4% | | | | |
| | 962 | | | Alibaba Group Holding Ltd. - ADR * | | | 131,861 | |
| | 363 | | | Amazon.com, Inc. * | | | 545,215 | |
| | 1,012 | | | Netflix, Inc. * | | | 270,872 | |
| | 1,196 | | | Spotify Technology SA * | | | 135,746 | |
| | 3,921 | | | Tencent Holdings Ltd. - ADR | | | 154,762 | |
| | | | | | | | 1,238,456 | |
| | | | | MEDIA - 2.5% | | | | |
| | 6,331 | | | Walt Disney Co. | | | 694,194 | |
| | | | | | | | | |
| | | | | OIL & GAS - 1.0% | | | | |
| | 2,498 | | | Chevron Corp. | | | 271,758 | |
| | | | | | | | | |
| | | | | PHARMACEUTICALS - 7.7% | | | | |
| | 2,979 | | | AbbVie, Inc. | | | 274,634 | |
| | 9,616 | | | Johnson & Johnson | | | 1,240,945 | |
| | 14,831 | | | Pfizer, Inc. | | | 647,373 | |
| | | | | | | | 2,162,952 | |
See accompanying notes to financial statements.
| RATIONAL DYNAMIC BRANDS FUND |
| PORTFOLIO OF INVESTMENTS (Continued) |
| December 31, 2018 |
| Shares | | | | | Value | |
| | | | | COMMON STOCKS - 67.9% (Continued) | | | | |
| | | | | REITS - 2.0% | | | | |
| | 3,497 | | | American Tower Corp. | | $ | 553,190 | |
| | | | | | | | | |
| | | | | RETAIL - 19.3% | | | | |
| | 862 | | | Advance Auto Parts, Inc. | | | 135,730 | |
| | 614 | | | Chipotle Mexican Grill, Inc. * | | | 265,119 | |
| | 2,526 | | | Costco Wholesale Corp. | | | 514,571 | |
| | 12,192 | | | Dollar Tree, Inc. * | | | 1,101,181 | |
| | 1,330 | | | Five Below, Inc. * | | | 136,086 | |
| | 1,482 | | | Genuine Parts Co. | | | 142,302 | |
| | 1,630 | | | Home Depot, Inc. | | | 280,067 | |
| | 2,228 | | | Lululemon Athletica, Inc. * | | | 270,947 | |
| | 3,077 | | | McDonald’s Corp. | | | 546,383 | |
| | 420 | | | O’Reilly Automotive, Inc. * | | | 144,619 | |
| | 2,552 | | | RH * | | | 305,781 | |
| | 1,663 | | | Ross Stores, Inc. | | | 138,362 | |
| | 7,657 | | | Starbucks Corp. | | | 493,111 | |
| | 4,014 | | | Tapestry, Inc. | | | 135,472 | |
| | 6,100 | | | TJX Cos, Inc. | | | 272,914 | |
| | 5,910 | | | Walmart, Inc. | | | 550,516 | |
| | | | | | | | 5,433,161 | |
| | | | | SEMICONDUCTORS - 1.0% | | | | |
| | 6,079 | | | Intel Corp. | | | 285,289 | |
| | | | | | | | | |
| | | | | SOFTWARE - 3.0% | | | | |
| | 3,511 | | | Electronic Arts, Inc. * | | | 277,053 | |
| | 2,705 | | | Microsoft Corp. | | | 274,747 | |
| | 2,811 | | | Take-Two Interactive Software, Inc. * | | | 289,364 | |
| | | | | | | | 841,164 | |
| | | | | TELECOMMUNICATIONS - 3.6% | | | | |
| | 18,153 | | | Verizon Communications, Inc. | | | 1,020,562 | |
| | | | | | | | | |
| | | | | TEXTILES - 1.0% | | | | |
| | 2,399 | | | Mohawk Industries, Inc. * | | | 280,587 | |
| | | | | | | | | |
| | | | | WATER - 0.5% | | | | |
| | 1,507 | | | American Water Works Co, Inc. | | | 136,790 | |
| | | | | | | | | |
| | | | | TOTAL COMMON STOCKS (Cost $18,638,853) | | | 19,066,069 | |
| | | | | | | | | |
| | | | | SHORT-TERM INVESTMENTS - 24.7% | | | | |
| | 6,949,234 | | | Federated Treasury Obligations Fund, Institutional Class, 2.31% ** | | | 6,949,234 | |
| | | | | TOTAL SHORT-TERM INVESTMENTS (Cost $6,949,234) | | | 6,949,234 | |
| | | | | | | | | |
| | | | | TOTAL INVESTMENTS (Cost $25,588,087) - 92.6% | | $ | 26,015,303 | |
| | | | | OTHER ASSETS LESS LIABILITIES - 7.4% | | | 2,077,450 | |
| | | | | NET ASSETS - 100.0% | | $ | 28,092,753 | |
| * | Non-income producing security. |
| ** | Rate shown represents the rate at December 31, 2018, and is subject to change and resets daily. |
See accompanying notes to financial statements.
| RATIONAL STRATEGIC ALLOCATION FUND |
| PORTFOLIO OF INVESTMENTS |
| December 31, 2018 |
| Shares | | | | | Value | |
| | | | | MUTUAL FUNDS - 76.7% | | | | |
| | | | | DEBT FUNDS - 42.4% | | | | |
| | 77,924 | | | Catalyst Insider Income Fund, Institutional Class + | | $ | 727,813 | |
| | 159,574 | | | Catalyst/Stone Beach Income Opportunity Fund, Institutional Class + | | | 1,496,805 | |
| | 204,208 | | | Rational Income Opportunities Fund, Institutional Class + | | | 2,052,265 | |
| | | | | | | | 4,276,883 | |
| | | | | EQUITY FUNDS - 34.3% | | | | |
| | 22,903 | | | Catalyst Buyback Strategy Fund, Institutional Class + | | | 222,844 | |
| | 12,960 | | | Catalyst Insider Buying Fund, Institutional Class + | | | 214,230 | |
| | 18,826 | | | Catalyst IPOx Allocation Fund, Institutional Class + | | | 218,946 | |
| | 158,642 | | | Catalyst MLP & Infrastructure Fund, Institutional Class + | | | 661,415 | |
| | 10,884 | | | Catalyst/MAP Global Equity Fund, Institutional Class + | | | 142,317 | |
| | 17,772 | | | Rational Dynamic Brands Fund, Institutional Class + | | | 607,792 | |
| | 95,849 | | | Rational NuWave Enhanced Market Opportunity Fund, Institutional Class + | | | 1,396,518 | |
| | | | | | | | 3,464,062 | |
| | | | | | | | | |
| | | | | TOTAL MUTUAL FUNDS (Cost - $8,062,828) | | | 7,740,945 | |
| | | | | | | | | |
| | | | | EXCHANGE TRADED FUNDS - 19.3% | | | | |
| | | | | EQUITY FUNDS - 19.3% | | | | |
| | 20,968 | | | Strategy Shares Ecological Strategy ETF + | | | 822,784 | |
| | 43,000 | | | Strategy Shares NASDAQ 7 Handl Index ETF + | | | 952,450 | |
| | 5,069 | | | Strategy Shares US Market Rotation Strategy ETF + | | | 169,964 | |
| | | | | TOTAL EXCHANGE TRADED FUNDS (Cost - $1,823,718) | | | 1,945,198 | |
| | | | | | | | | |
| | | | | SHORT-TERM INVESTMENTS - 0.5% | | | | |
| | 50,875 | | | Federated Treasury Obligations Fund, Institutional Class, 2.31% * | | | 50,875 | |
| | | | | TOTAL SHORT-TERM INVESTMENTS (Cost - $50,875) | | | 50,875 | |
| | | | | | | | | |
| | | | | TOTAL INVESTMENTS - 96.5% (Cost - $9,937,421) | | $ | 9,737,018 | |
| | | | | OTHER ASSETS LESS LIABILITIES - 3.5% | | | 359,426 | |
| | | | | NET ASSETS - 100.0% | | $ | 10,096,444 | |
ETF - Exchange Traded Fund.
| + | Investment in affiliate. |
| * | Rate shown represents the rate at December 31, 2018, and is subject to change and resets daily. |
See accompanying notes to financial statements.
| RATIONAL/ RESOLVE ADAPTIVE ASSET ALLOCATION FUND (Formerly, RATIONAL DYNAMIC MOMENTUM FUND) |
| CONSOLIDATED PORTFOLIO OF INVESTMENTS |
| December 31, 2018 |
| Shares | | | | | Value | |
| | | | | SHORT-TERM INVESTMENTS - 95.2% | | | | |
| | 28,525,426 | | | Fidelity Institutional Government Portfolio , Institutional Class, 2.29% * + | | | | |
| | | | | TOTAL SHORT-TERM INVESTMENTS (Cost - $28,525,426) | | $ | 28,525,426 | |
| | | | | | | | | |
| | | | | TOTAL INVESTMENTS - 95.2% (Cost - $28,525,426) | | $ | 28,525,426 | |
| | | | | OTHER ASSETS LESS LIABILITIES - 4.8% | | | 1,425,767 | |
| | | | | NET ASSETS - 100.0% | | $ | 29,951,193 | |
| * | Rate shown represents the rate at December 31, 2018, and is subject to change and resets daily. |
| + | All or a portion of this investment is a holding of the RDMF Fund, Ltd. |
| | | | | | | | | | Unrealized | |
| | | | | | | | | | Appreciaion / | |
| Long Contracts | | | | | Notional Amount ($) | | Maturity | | (Depreciation) | |
| | | | | OPEN LONG FUTURES CONTRACTS - 3.2% | | | | | | |
| | 109 | | | DJ US Real Estate | | 3,226,400 | | March-19 | | | (124,310 | ) |
| | 5 | | | S&P 500 Emini Future | | 626,300 | | March-19 | | | (8,103 | ) |
| | 360 | | | US 10 YR Note (CBT) | | 43,925,625 | | March-19 | | | 785,281 | |
| | 85 | | | US Long Bond (CBT) | | 12,410,000 | | March-19 | | | 307,813 | |
| | | | | Total Unrealized Appreciation/Depreciation from Open Futures Contracts | | $ | 960,681 | |
See accompanying notes to consolidated financial statements.
| RATIONAL IRON HORSE FUND |
| PORTFOLIO OF INVESTMENTS |
| December 31, 2018 |
| Shares | | | | | Value | |
| | | | | COMMON STOCKS - 87.5% | | | | |
| | | | | AEROSPACE/DEFENSE - 0.4% | | | | |
| | 300 | | | United Technologies Corp. + | | $ | 31,944 | |
| | | | | | | | | |
| | | | | AGRICULTURE - 1.3% | | | | |
| | 2,400 | | | Altria Group, Inc. + | | | 118,536 | |
| | | | | | | | | |
| | | | | AIRLINES - 0.6% | | | | |
| | 1,000 | | | Delta Air Lines, Inc. + | | | 49,900 | |
| | | | | | | | | |
| | | | | AUTO MANUFACTURERS - 0.9% | | | | |
| | 1,400 | | | PACCAR, Inc. + | | | 79,996 | |
| | | | | | | | | |
| | | | | AUTO PARTS & EQUIPMENT - 0.5% | | | | |
| | 400 | | | Lear Corp. + | | | 49,144 | |
| | | | | | | | | |
| | | | | BANKS - 7.8% | | | | |
| | 500 | | | First Republic Bank + | | | 43,450 | |
| | 2,000 | | | JP Morgan Chase & Co. + | | | 195,240 | |
| | 1,800 | | | Northern Trust Corp. + | | | 150,462 | |
| | 2,700 | | | Toronto-Dominion Bank + | | | 134,244 | |
| | 3,700 | | | US Bancorp + | | | 169,090 | |
| | | | | | | | 692,486 | |
| | | | | BIOTECHNOLOGY - 1.5% | | | | |
| | 700 | | | Amgen, Inc. + | | | 136,269 | |
| | | | | | | | | |
| | | | | CHEMICALS - 2.4% | | | | |
| | 300 | | | International Flavors & Fragrances, Inc. + | | | 40,281 | |
| | 2,100 | | | LyondellBasell Industries NV + | | | 174,636 | |
| | | | | | | | 214,917 | |
| | | | | COMMERCIAL SERVICES - 0.4% | | | | |
| | 200 | | | FleetCor Technologies, Inc. + * | | | 37,144 | |
| | | | | | | | | |
| | | | | COMPUTERS - 8.1% | | | | |
| | 1,100 | | | Accenture PLC + | | | 155,111 | |
| | 1,300 | | | Apple, Inc. + | | | 205,062 | |
| | 3,200 | | | International Business Machines Corp. + | | | 363,744 | |
| | | | | | | | 723,917 | |
| | | | | COSMETICS/PERSONAL CARE - 2.9% | | | | |
| | 4,300 | | | Colgate-Palmolive Co. + | | | 255,936 | |
| | | | | | | | | |
| | | | | DIVERSIFIED FINANCIAL SERVICES - 0.6% | | | | |
| | 700 | | | Intercontinental Exchange, Inc. + | | | 52,731 | |
| | | | | | | | | |
| | | | | ELECTRIC - 5.4% | | | | |
| | 4,400 | | | PPL Corp. + | | | 124,652 | |
| | 1,500 | | | Sempra Energy + | | | 162,285 | |
| | 4,400 | | | Southern Co. + | | | 193,248 | |
| | | | | | | | 480,185 | |
| | | | | ELECTRONICS - 0.4% | | | | |
| | 500 | | | TE Connectivity Ltd. + | | | 37,815 | |
| | | | | | | | | |
| | | | | FOOD - 2.8% | | | | |
| | 2,300 | | | General Mills, Inc. + | | | 89,562 | |
| | 700 | | | Kellogg Co. + | | | 39,907 | |
| | 2,900 | | | Mondelez International, Inc. + | | | 116,087 | |
| | | | | | | | 245,556 | |
| | | | | HEALTHCARE-PRODUCTS - 2.2% | | | | |
| | 1,100 | | | Danaher Corp. + | | | 113,432 | |
| | 900 | | | Medtronic PLC + | | | 81,864 | |
| | | | | | | | 195,296 | |
| | | | | HEALTHCARE-SERVICES - 1.8% | | | | |
| | 1,400 | | | Universal Health Services, Inc. + | | | 163,184 | |
See accompanying notes to financial statements.
| RATIONAL IRON HORSE FUND |
| PORTFOLIO OF INVESTMENTS (Continued) |
| December 31, 2018 |
| Shares | | | | | Value | |
| | | | | COMMON STOCK S- 87.5% (Continued) | | | | |
| | | | | HOME BUILDERS - 1.1% | | | | |
| | 2,900 | | | DR Horton, Inc. + | | $ | 100,514 | |
| | | | | | | | | |
| | | | | HOUSEHOLD PRODUCTS/WARES - 3.2% | | | | |
| | 2,500 | | | Kimberly-Clark Corp. + | | | 284,850 | |
| | | | | | | | | |
| | | | | INSURANCE - 0.6% | | | | |
| | 600 | | | Allstate Corp. + | | | 49,578 | |
| | | | | | | | | |
| | | | | INTERNET - 1.6% | | | | |
| | 300 | | | Alibaba Group Holding Ltd. - ADR * + | | | 41,121 | |
| | 100 | | | Alphabet, Inc. * + | | | 104,496 | |
| | | | | | | | 145,617 | |
| | | | | MACHINERY - DIVERSIFIED - 1.1% | | | | |
| | 300 | | | Rockwell Automation, Inc. + | | | 45,144 | |
| | 200 | | | Roper Technologies, Inc. + | | | 53,304 | |
| | | | | | | | 98,448 | |
| | | | | MEDIA - 5.8% | | | | |
| | 5,300 | | | Comcast Corp. + | | | 180,465 | |
| | 3,100 | | | Walt Disney Co. + | | | 339,915 | |
| | | | | | | | 520,380 | |
| | | | | MINING - 4.2% | | | | |
| | 10,900 | | | Newmont Mining Corp. + | | | 377,685 | |
| | | | | | | | | |
| | | | | MISCELLANEOUS MANUFACTURING - 3.5% | | | | |
| | 1,500 | | | Eaton Corp. PLC + | | | 102,990 | |
| | 2,300 | | | Ingersoll-Rand PLC + | | | 209,829 | |
| | | | | | | | 312,819 | |
| | | | | OIL & GAS - 6.0% | | | | |
| | 1,300 | | | Chevron Corp. + | | | 141,427 | |
| | 4,000 | | | Exxon Mobil Corp. + | | | 272,760 | |
| | 2,000 | | | Marathon Petroleum Corp. + | | | 118,020 | |
| | | | | | | | 532,207 | |
| | | | | PHARMACEUTICALS - 8.8% | | | | |
| | 1,900 | | | CVS Health Corp. + | | | 124,488 | |
| | 3,500 | | | Johnson & Johnson + | | | 451,675 | |
| | 2,700 | | | Merck & Co., Inc. + | | | 206,307 | |
| | | | | | | | 782,470 | |
| | | | | REITS - 0.3% | | | | |
| | 400 | | | Realty Income Corp. + | | | 25,216 | |
| | | | | | | | | |
| | | | | RETAIL - 2.3% | | | | |
| | 1,200 | | | Home Depot, Inc. + | | | 206,184 | |
| | | | | | | | | |
| | | | | SEMICONDUCTORS - 3.4% | | | | |
| | 700 | | | Broadcom, Inc. + | | | 177,996 | |
| | 2,700 | | | Intel Corp. + | | | 126,711 | |
| | | | | | | | 304,707 | |
| | | | | SOFTWARE - 1.6% | | | | |
| | 500 | | | Fidelity National Information Services, Inc. + | | | 51,275 | |
| | 900 | | | Microsoft Corp. + | | | 91,413 | |
| | | | | | | | 142,688 | |
| | | | | TELECOMMUNICATIONS - 1.5% | | | | |
| | 2,100 | | | T-Mobile US, Inc. * + | | | 133,581 | |
| | | | | | | | | |
| | | | | TOYS & GAMES - 2.5% | | | | |
| | 2,700 | | | Hasbro, Inc. + | | | 219,375 | |
| | | | | | | | | |
| | | | | TOTAL COMMON STOCKS (Cost - $8,444,081) | | | 7,801,275 | |
See accompanying notes to financial statements.
| RATIONAL IRON HORSE FUND |
| PORTFOLIO OF INVESTMENTS (Continued) |
| December 31, 2018 |
| | | | EXCHANGE TRADED FUNDS - 2.8% | | | |
| | 1,000 | | | SPDR S&P 500 ETF Trust + | | $ | 249,920 | |
| | | | | TOTAL EXCHANGE TRADED FUNDS (Cost - $242,920) | | | 249,920 | |
| | | | | | | | | |
| Shares | | | | | | | |
| | | | | SHORT TERM INVESTMENTS - 7.5% | | | | |
| | 673,802 | | | Fidelity Institutional Government Portfolio - Institutional Class, 2.29% ** | | | 673,802 | |
| | | | | TOTAL SHORT-TERM INVESTMENTS (Cost - $673,802) | | $ | 673,802 | |
| | | | | | | | | |
| | | | | TOTAL INVESTMENTS - 97.8% (Cost - $9,360,803) | | $ | 8,724,997 | |
| | | | | OTHER ASSETS LESS LIABILITIES - 2.2% | | | 194,576 | |
| | | | | NET ASSETS - 100.0% | | $ | 8,919,573 | |
| | | | | | | | Notional | | Expiration | | Exercise Price | | | |
| Contracts ^ | | | | | Counter party | | Amount (S) | | Date | | ($) | | Value | |
| | | | | CALL OPTIONS WRITTEN * - (4.7)% | | | | | | | | | | |
| | 5 | | | Accenture PLC | | Credit Suisse | | 75,000 | | 1/17/2020 | | 150.00 | | $ | 5,150 | |
| | 6 | | | Accenture PLC | | Credit Suisse | | 93,000 | | 1/17/2020 | | 155.00 | | | 4,860 | |
| | 3 | | | Alibaba Group Holding Ltd. | | Credit Suisse | | 45,000 | | 1/18/2019 | | 150.00 | | | 240 | |
| | 6 | | | Allstate Corp. | | Credit Suisse | | 54,000 | | 7/19/2019 | | 90.00 | | | 1,650 | |
| | 1 | | | Alphabet, Inc. | | Credit Suisse | | 110,000 | | 6/21/2019 | | 1,100.00 | | | 6,510 | |
| | 7 | | | Altria Group, Inc. | | Credit Suisse | | 42,000 | | 1/18/2019 | | 60.00 | | | 35 | |
| | 8 | | | Altria Group, Inc. | | Credit Suisse | | 50,000 | | 3/15/2019 | | 62.50 | | | 292 | |
| | 9 | | | Altria Group, Inc. | | Credit Suisse | | 51,750 | | 6/21/2019 | | 57.50 | | | 729 | |
| | 5 | | | Amgen, Inc. | | Credit Suisse | | 97,500 | | 1/17/2020 | | 195.00 | | | 9,645 | |
| | 2 | | | Amgen, Inc. | | Credit Suisse | | 40,000 | | 1/17/2020 | | 200.00 | | | 3,340 | |
| | 11 | | | Apple, Inc. | | Credit Suisse | | 192,500 | | 3/15/2019 | | 175.00 | | | 3,828 | |
| | 2 | | | Apple, Inc. | | Credit Suisse | | 38,000 | | 6/21/2019 | | 190.00 | | | 696 | |
| | 7 | | | Broadcom, Inc. | | Credit Suisse | | 168,000 | | 6/21/2019 | | 240.00 | | | 22,540 | |
| | 13 | | | Chevron Corp. | | Credit Suisse | | 156,000 | | 3/15/2019 | | 120.00 | | | 1,430 | |
| | 10 | | | Colgate-Palmolive Co. | | Credit Suisse | | 67,500 | | 1/17/2020 | | 67.50 | | | 2,535 | |
| | 33 | | | Colgate-Palmolive Co. | | Credit Suisse | | 222,750 | | 5/17/2019 | | 67.50 | | | 3,663 | |
| | 20 | | | Comcast Corp. | | Credit Suisse | | 75,000 | | 3/15/2019 | | 37.50 | | | 1,140 | |
| | 33 | | | Comcast Corp. | | Credit Suisse | | 123,750 | | 6/21/2019 | | 37.50 | | | 4,224 | |
| | 3 | | | CVS Health Corp. | | Credit Suisse | | 22,500 | | 1/17/2020 | | 75.00 | | | 1,191 | |
| | 7 | | | CVS Health Corp. | | Credit Suisse | | 50,750 | | 1/18/2019 | | 72.50 | | | 91 | |
| | 9 | | | CVS Health Corp. | | Credit Suisse | | 69,750 | | 5/17/2019 | | 77.50 | | | 1,017 | |
| | 8 | | | Danaher Corp. | | Credit Suisse | | 78,000 | | 3/15/2019 | | 97.50 | | | 7,120 | |
| | 3 | | | Danaher Corp. | | Credit Suisse | | 31,500 | | 6/21/2019 | | 105.00 | | | 1,845 | |
| | 10 | | | Delta Air Lines, Inc. | | Credit Suisse | | 55,000 | | 6/21/2019 | | 55.00 | | | 2,290 | |
| | 29 | | | DR Horton, Inc. | | Credit Suisse | | 107,300 | | 2/15/2019 | | 37.00 | | | 2,784 | |
| | 15 | | | Eaton Corp. PLC | | Credit Suisse | | 112,500 | | 1/17/2020 | | 75.00 | | | 5,850 | |
| | 40 | | | Exxon Mobil Corp. | | Credit Suisse | | 310,000 | | 1/17/2020 | | 77.50 | | | 9,840 | |
| | 5 | | | Fidelity National Information Services, Inc. | | Credit Suisse | | 52,500 | | 1/18/2019 | | 105.00 | | | 570 | |
| | 5 | | | First Republic Bank | | Credit Suisse | | 47,500 | | 5/17/2019 | | 95.00 | | | 1,525 | |
| | 2 | | | FleetCor Technologies, Inc. | | Credit Suisse | | 42,000 | | 5/17/2019 | | 210.00 | | | 1,210 | |
| | 11 | | | General Mills, Inc. | | Credit Suisse | | 44,000 | | 1/18/2019 | | 40.00 | | | 429 | |
| | 12 | | | General Mills, Inc. | | Credit Suisse | | 48,000 | | 4/18/2019 | | 40.00 | | | 1,812 | |
| | 27 | | | Hasbro, Inc. | | Credit Suisse | | 229,500 | | 7/19/2019 | | 85.00 | | | 15,741 | |
| | 12 | | | Home Depot, Inc. | | Credit Suisse | | 210,000 | | 1/17/2020 | | 175.00 | | | 19,260 | |
| | 23 | | | Ingersoll-Rand PLC | | Credit Suisse | | 224,250 | | 6/21/2019 | | 97.50 | | | 9,200 | |
| | 27 | | | Intel Corp. | | Credit Suisse | | 135,000 | | 4/18/2019 | | 50.00 | | | 5,265 | |
| | 7 | | | Intercontinental Exchange, Inc. | | Credit Suisse | | 52,500 | | 1/17/2020 | | 75.00 | | | 5,481 | |
| | 32 | | | International Business Machines Corp. | | Credit Suisse | | 384,000 | | 6/21/2019 | | 120.00 | | | 15,616 | |
| | 3 | | | International Flavors & Fragrances, Inc. | | Credit Suisse | | 43,500 | | 2/15/2019 | | 145.00 | | | 458 | |
| | 16 | | | Johnson & Johnson | | Credit Suisse | | 208,000 | | 1/17/2020 | | 130.00 | | | 17,440 | |
| | 19 | | | Johnson & Johnson | | Credit Suisse | | 247,000 | | 6/21/2019 | | 130.00 | | | 14,440 | |
| | 20 | | | JPMorgan Chase & Co. | | Credit Suisse | | 220,000 | | 6/21/2019 | | 110.00 | | | 3,800 | |
See accompanying notes to financial statements.
| RATIONAL IRON HORSE FUND |
| PORTFOLIO OF INVESTMENTS (Continued) |
| December 31, 2018 |
| | | | | | | | Notional | | Expiration | | Exercise Price | | | |
| Contracts ^ | | | | | Counter party | | Amount (S) | | Date | | ($) | | Value | |
| | | | | CALL OPTIONS WRITTEN * - (4.7)% (Continued) | | | | | | | | |
| | 7 | | | Kellogg Co. | | Credit Suisse | | 45,500 | | 6/21/2019 | | 65.00 | | $ | 826 | |
| | 15 | | | Kimberly-Clark Corp. | | Credit Suisse | | 165,000 | | 1/17/2020 | | 110.00 | | | 17,550 | |
| | 10 | | | Kimberly-Clark Corp. | | Credit Suisse | | 115,000 | | 1/17/2020 | | 115.00 | | | 9,300 | |
| | 4 | | | Lear Corp. | | Credit Suisse | | 50,000 | | 1/18/2019 | | 125.00 | | | 1,480 | |
| | 21 | | | LyondellBasell Industries NV | | Credit Suisse | | 189,000 | | 1/17/2020 | | 90.00 | | | 12,075 | |
| | 20 | | | Marathon Petroleum Corp. | | Credit Suisse | | 130,000 | | 1/17/2020 | | 65.00 | | | 10,540 | |
| | 9 | | | Medtronic PLC | | Credit Suisse | | 81,000 | | 1/18/2019 | | 90.00 | | | 2,340 | |
| | 27 | | | Merck & Co, Inc. | | Credit Suisse | | 175,500 | | 6/21/2019 | | 65.00 | | | 33,615 | |
| | 9 | | | Microsoft Corp. | | Credit Suisse | | 99,000 | | 6/21/2019 | | 110.00 | | | 4,500 | |
| | 29 | | | Mondelez International, Inc. | | Credit Suisse | | 127,600 | | 6/21/2019 | | 44.00 | | | 2,523 | |
| | 109 | | | Newmont Mining Corp. | | Credit Suisse | | 403,300 | | 6/21/2019 | | 37.00 | | | 22,236 | |
| | 15 | | | Northern Trust Corp. | | Credit Suisse | | 135,000 | | 7/19/2019 | | 90.00 | | | 6,375 | |
| | 3 | | | Northern Trust Corp. | | Credit Suisse | | 28,500 | | 7/19/2019 | | 95.00 | | | 847 | |
| | 14 | | | PACCAR, Inc. | | Credit Suisse | | 88,200 | | 5/17/2019 | | 63.00 | | | 2,940 | |
| | 44 | | | PPL Corp. | | Credit Suisse | | 136,400 | | 7/19/2019 | | 31.00 | | | 2,970 | |
| | 4 | | | Realty Income Corp. | | Credit Suisse | | 24,000 | | 3/15/2019 | | 60.00 | | | 1,708 | |
| | 3 | | | Rockwell Automation Inc. | | Credit Suisse | | 51,000 | | 4/18/2019 | | 170.00 | | | 960 | |
| | 2 | | | Roper Technologies, Inc. | | Credit Suisse | | 58,000 | | 5/17/2019 | | 290.00 | | | 1,910 | |
| | 15 | | | Sempra Energy | | Credit Suisse | | 180,000 | | 7/19/2019 | | 120.00 | | | 3,712 | |
| | 44 | | | Southern Co. | | Credit Suisse | | 202,400 | | 2/15/2019 | | 46.00 | | | 2,332 | |
| | 10 | | | SPDR S&P 500 ETF Trust | | Credit Suisse | | 238,000 | | 1/4/2019 | | 238.00 | | | 11,670 | |
| | 5 | | | TE Connectivity Ltd. | | Credit Suisse | | 42,500 | | 4/18/2019 | | 85.00 | | | 500 | |
| | 21 | | | T-Mobile US, Inc. | | Credit Suisse | | 141,750 | | 1/17/2020 | | 67.50 | | | 14,438 | |
| | 27 | | | Toronto-Dominion Bank | | Credit Suisse | | 141,750 | | 7/19/2019 | | 52.50 | | | 3,645 | |
| | 3 | | | United Technologies Corp. | | Credit Suisse | | 37,500 | | 1/17/2020 | | 125.00 | | | 1,275 | |
| | 3 | | | Universal Health Services, Inc. | | Credit Suisse | | 40,500 | | 4/18/2019 | | 135.00 | | | 615 | |
| | 4 | | | Universal Health Services, Inc. | | Credit Suisse | | 52,000 | | 7/19/2019 | | 130.00 | | | 1,920 | |
| | 7 | | | Universal Health Services, Inc. | | Credit Suisse | | 94,500 | | 7/19/2019 | | 135.00 | | | 2,590 | |
| | 37 | | | US Bancorp | | Credit Suisse | | 194,250 | | 1/17/2020 | | 52.50 | | | 5,550 | |
| | 6 | | | Walt Disney Co. | | Credit Suisse | | 69,000 | | 1/17/2020 | | 115.00 | | | 5,040 | |
| | 12 | | | Walt Disney Co. | | Credit Suisse | | 138,000 | | 6/21/2019 | | 115.00 | | | 6,180 | |
| | 13 | | | Walt Disney Co. | | Credit Suisse | | 156,000 | | 6/21/2019 | | 120.00 | | | 4,459 | |
| | | | | TOTAL CALL OPTIONS WRITTEN (Premiums Received - $450,911) | | | | $ | 415,403 | |
PLC - Public Limited Company
| + | All or a portion of the security is held as collateral for call options. |
| * | Non-income producing securities. |
| ** | Rate shown represents the rate at December 31, 2018, and is subject to change and resets daily. |
| ^ | Each option contract allows the holder of the option to purchase or sell 100 shares of the underlying security. |
See accompanying notes to financial statements.
| RATIONAL INCOME OPPORTUNITIES FUND |
| PORTFOLIO OF INVESTMENTS |
| December 31, 2018 |
| Principal Amount $ | | | | | Variable Rate | | Coupon Rate (%) | | Maturity | | Value | |
| | | | | BONDS & NOTES - 94.8% | | | | | | | | | | |
| | | | | ASSET BACKED SECURITIES - 86.4% | | | | | | | | | | |
| | 100,000 | | | Bear Sterns Commercial Mortgage Securities Trust 2005-TOP20 (a) ^ | | | | 5.0927 | | 10/12/2042 | | $ | 83,269 | |
| | 45,741 | | | CD Commercial Mortgage Trust 2017-CD3 (a) | | | | 4.5616 | | 2/10/2050 | | | 45,193 | |
| | 100,000 | | | CFCRE Commercial Mortgage Trust 2016-C3 (b) ^ | | | | 2.8020 | | 1/10/2048 | | | 54,420 | |
| | 123,000 | | | CGGS Commercial Mortgage Trust 2018-WSS (b,c) | | 1 Month LIBOR + 2.30% | | 4.7551 | | 2/15/2020 | | | 120,995 | |
| | 175,000 | | | Commercial Mortgage Trust 2012-CR1 B | | | | 4.6120 | | 5/15/2045 | | | 179,223 | |
| | 790,198 | | | Commercial Mortgage Trust 2012-CR1 XA (a) | | | | 1.8676 | | 5/15/2045 | | | 41,228 | |
| | 20,000 | | | Commercial Mortgage Trust 2012-CR2 A4 | | | | 3.1470 | | 8/15/2045 | | | 19,948 | |
| | 147,032 | | | Commercial Mortgage Trust 2012-CR3 A3 | | | | 2.8220 | | 10/15/2045 | | | 144,847 | |
| | 17,506 | | | Commercial Mortgage Trust 2012-CR4 A2 | | | | 1.8010 | | 10/15/2045 | | | 16,991 | |
| | 80,000 | | | Commercial Mortgage Trust 2012-CR4 AM | | | | 3.2510 | | 10/15/2045 | | | 78,844 | |
| | 200,000 | | | Commercial Mortgage Trust 2012-CR4 B (b) | | | | 3.7030 | | 10/15/2045 | | | 192,127 | |
| | 1,032,204 | | | Commercial Mortgage Trust 2013-CR7 XA (a) | | | | 1.2369 | | 4/10/2023 | | | 40,658 | |
| | 153,000 | | | Commercial Mortgage Trust 2013-LC13 D (a,b) | | | | 5.2714 | | 8/10/2046 | | | 146,613 | |
| | 54,000 | | | Commercial Mortgage Trust 2014-CR20 A3 | | | | 3.3260 | | 11/10/2047 | | | 53,819 | |
| | 150,000 | | | GS Mortgage Securities Trust 2010-C1 (a,b) | | | | 5.6350 | | 8/10/2043 | | | 153,342 | |
| | 250,000 | | | GS Mortgage Securities Trust 2012-GCJ7 (a,b) | | | | 5.0000 | | 5/10/2045 | | | 170,035 | |
| | 20,000 | | | GS Mortgage Securities Trust 2013-GC16 (a) | | | | 5.1610 | | 11/10/2046 | | | 21,179 | |
| | 167,764 | | | GS Mortgage Securities Trust 2014-GC18 (a,b) | | | | 4.9959 | | 1/10/2047 | | | 146,472 | |
| | 240,000 | | | GS Mortgage Securities Trust 2014-GC22 (a) | | | | 4.6893 | | 6/10/2047 | | | 240,021 | |
| | 100,000 | | | GS Mortgage Securities Trust 2014-GC24 (a,b) | | | | 4.5293 | | 9/10/2047 | | | 86,143 | |
| | 261,000 | | | GS Mortgage Securities Trust 2014-GC26 (a,b) | | | | 4.5104 | | 11/10/2047 | | | 225,827 | |
| | 170,000 | | | GS Mortgage Securities Trust 2015-GC34 | | | | 2.9790 | | 10/10/2048 | | | 135,312 | |
| | 500,000 | | | JP Morgan Chase Commercial Mortgage Securities Trust 2011-C5 (a,b) ^ | | | | 4.0000 | | 8/15/2046 | | | 310,556 | |
| | 200,000 | | | JP Morgan Chase Commercial Mortgage Securities Trust 2012-C6 (a,b) | | | | 5.1401 | | 5/15/2045 | | | 182,400 | |
| | 121,161 | | | JP Morgan Chase Commercial Mortgage Securities Trust 2012-CIBX (a,b) | | | | 5.1909 | | 6/15/2045 | | | 111,743 | |
| | 100,000 | | | JPMBB Commercial Mortgage Securities Trust 2013-C17 (a,b) | | | | 4.8914 | | 1/15/2047 | | | 97,682 | |
| | 1,777,143 | | | JPMBB Commercial Mortgage Securities Trust 2014-C19 (a) | | | | 1.1175 | | 4/15/2047 | | | 29,234 | |
| | 10,000 | | | Morgan Stanley Bank of America Merrill Lynch Trust 2012-C5 | | | | 3.1760 | | 8/15/2045 | | | 9,964 | |
| | 155,000 | | | Morgan Stanley Bank of America Merrill Lynch Trust 2013-C8 (a) | | | | 4.0821 | | 7/15/2046 | | | 160,218 | |
| | 1,058,118 | | | Morgan Stanley Bank of America Merrill Lynch Trust 2012-C10 (a) | | | | 0.9943 | | 12/15/2048 | | | 34,465 | |
| | 118,636 | | | Starwood Retail Property Trust 2014-STAR (b,c) ^ | | 1 Month LIBOR + 3.25% | | 5.7051 | | 11/15/2027 | | | 101,731 | |
| | 100,000 | | | Wells Fargo Commercial Mortgage Trust 2015-C29 (a) | | | | 4.2242 | | 6/15/2048 | | | 86,192 | |
| | 130,000 | | | Wells Fargo Commercial Mortgage Trust 2015-LC22 (a) | | | | 4.5425 | | 9/15/2058 | | | 129,670 | |
| | 200,000 | | | Wells Fargo Commercial Mortgage Trust 2016-C33 (b) | | | | 3.1230 | | 3/15/2059 | | | 164,866 | |
| | 15,000 | | | WF-RBS Commercial Mortgage Trust 2013-C12 (b) | | | | 4.4188 | | 3/15/2048 | | | 13,795 | |
| | 93,658 | | | WF-RBS Commercial Mortgage Trust 2014-C20 | | | | 3.0360 | | 5/15/2047 | | | 93,519 | |
| | | | | | | | | | | | | | 3,922,541 | |
| | | | | | | | | | | | | | | |
| | | | | COMMERCIAL MORTGAGE OBLIGATIONS - 8.4% | | | | | | | | | | |
| | 230,000 | | | FREMF 2015-K50 Mortgage Trust (a,b) | | | | 3.7790 | | 10/25/2048 | | | 219,816 | |
| | 170,000 | | | FREMF 2016-K52 Mortgage Trust (a,b) | | | | 3.9233 | | 1/25/2049 | | | 163,012 | |
| | | | | | | | | | | | | | 382,828 | |
| | | | | | | | | | | | | | | |
| | | | | TOTAL BONDS & NOTES (Cost - $4,295,943) | | | | | | | | | 4,305,369 | |
| | | | | | | | | | | | | | | |
| Shares | | | | | | | | | | | | | |
| | | | | EXCHANGE TRADED FUND - 2.0% | | | | | | | | | | |
| | 2,500 | | | ProShares UltraShort 20+ Year Treasury | | | | | | 87,825 | |
| | | | | TOTAL EXCHANGE TRADED FUND (Cost - $95,608) | | | | | | 87,825 | |
| | | | | | | | | | | | | | | |
| | | | | REITS- 1.3% | | | | | | | | | | |
| | 2,250 | | | AGNC Investment Corp. | | | | | | | | | 39,465 | |
| | 1,500 | | | Armada Hoffler Properties, Inc. | | | | | | | 21,090 | |
| | | | | TOTAL REITS (Cost - $64,240) | | | | | | | 60,555 | |
| | | | | | | | | | | | | | | |
| | | | | SHORT-TERM INVESTMENTS -1.7% | | | | | | | | |
| | 78,384 | | | Federated Treasury Obligations Fund, Institutional Class, 2.31% * | | | | | 78,384 | |
| | | | | TOTAL SHORT-TERM INVESTMENTS (Cost - $78,384) | | | | | | |
| | | | | | | | | | | | | | | |
| | | | | TOTAL INVESTMENTS (Cost $4,534,175) - 99.8% | | | | | $ | 4,532,133 | |
| | | | | OTHER ASSETS LESS LIABILITIES - 0.2% | | | | | | 9,517 | |
| | | | | NET ASSETS - 100.0% | | | | | $ | 4,541,650 | |
REIT - Real Estate Investment Trust
| * | Rate shown represents the rate at December 31, 2018, and is subject to change and resets daily. |
| (a) | Variable or floating rate security, the interest rate of which adjusts periodically based on changes in current interest rates and prepayments on the underlying pool of assets. |
| (b) | Securities exempt from registration under Rule 144A of Securities Act of 1933. These securities may be resold in transactions exempt from registration to qualified institutional buyers. At December 31, 2018, these securities amounted to $2,661,575 or 58.60% of net assets. |
| (c) | Variable rate security; the rate shown represents the rate on December 31, 2018. |
| ^ | The Advisor determined these securities are illiquid; total illiquid securities represent 12.11% of net assets. |
See accompanying notes to financial statements.
| RATIONAL NUWAVE ENHANCED MARKET OPPORTUNITY FUND |
| CONSOLIDATED PORTFOLIO OF INVESTMENTS |
| December 31, 2018 |
| Shares | | | | | Value | |
| | | | | COMMON STOCKS - 76.5% | | | | |
| | | | | ADVERTISING - 0.1% | | | | |
| | 130 | | | Interpublic Group of Cos., Inc. | | $ | 2,682 | |
| | 66 | | | Omnicom Group, Inc. | | | 4,834 | |
| | | | | | | | 7,516 | |
| | | | | AEROSPACE/DEFENSE - 2.2% | | | | |
| | 94 | | | Arconic, Inc. | | | 1,585 | |
| | 3 | | | Boeing Co. | | | 968 | |
| | 354 | | | General Dynamics Corp. | | | 55,652 | |
| | 174 | | | Lockheed Martin Corp. | | | 45,560 | |
| | 251 | | | Northrop Grumman Corp. | | | 61,470 | |
| | 758 | | | Raytheon Co. | | | 116,239 | |
| | 744 | | | United Technologies Corp. | | | 79,221 | |
| | | | | | | | 360,695 | |
| | | | | AGRICULTURE - 1.9% | | | | |
| | 326 | | | Altria Group, Inc. | | | 16,101 | |
| | 5,021 | | | Archer-Daniels-Midland Co. | | | 205,710 | |
| | 2,180 | | | British American Tobacco PLC - ADR | | | 69,455 | |
| | 197 | | | Philip Morris International, Inc. | | | 13,152 | |
| | | | | | | | 304,418 | |
| | | | | AIRLINES - 0.4% | | | | |
| | 26 | | | Alaska Air Group, Inc. | | | 1,582 | |
| | 248 | | | American Airlines Group, Inc. | | | 7,963 | |
| | 44 | | | Delta Air Lines, Inc. | | | 2,196 | |
| | 26 | | | JetBlue Airways Corp.* | | | 418 | |
| | 503 | | | Southwest Airlines Co. | | | 23,379 | |
| | 404 | | | United Continental Holdings, Inc. * | | | 33,827 | |
| | | | | | | | 69,365 | |
| | | | | APPAREL - 0.6% | | | | |
| | 447 | | | Hanesbrands, Inc. | | | 5,601 | |
| | 1,143 | | | Michael Kors Holdings Ltd. * | | | 43,343 | |
| | 35 | | | PVH Corp. | | | 3,253 | |
| | 64 | | | Ralph Lauren Corp. | | | 6,621 | |
| | 184 | | | Skechers U.S.A., Inc. * | | | 4,212 | |
| | 592 | | | VF Corp. | | | 42,233 | |
| | | | | | | | 105,263 | |
| | | | | AUTO MANUFACTURERS - 0.3% | | | | |
| | 6,880 | | | Ford Motor Co. | | | 52,632 | |
| | 81 | | | General Motors Co. | | | 2,709 | |
| | | | | | | | 55,341 | |
| | | | | AUTO PARTS & EQUIPMENT - 0.3% | | | | |
| | 645 | | | APTIV PLC | | | 39,713 | |
| | 41 | | | BorgWarner, Inc. | | | 1,424 | |
| | 52 | | | Goodyear Tire & Rubber Co. | | | 1,061 | |
| | | | | | | | 42,198 | |
| | | | | BANKS - 1.3% | | | | |
| | 106 | | | Bank of America Corp. | | | 2,612 | |
| | 305 | | | Bank of New York Mellon Corp. | | | 14,356 | |
| | 296 | | | BB&T Corp. | | | 12,823 | |
| | 89 | | | Citigroup, Inc. | | | 4,633 | |
| | 56 | | | Citizens Financial Group, Inc. | | | 1,665 | |
| | 48 | | | Comerica, Inc. | | | 3,297 | |
| | 69 | | | Fifth Third Bancorp | | | 1,624 | |
| | 122 | | | Goldman Sachs Group, Inc. | | | 20,380 | |
| | 223 | | | Huntington Bancshares, Inc. | | | 2,658 | |
| | 548 | | | JPMorgan Chase & Co. | | | 53,496 | |
| | 37 | | | M&T Bank Corp. | | | 5,296 | |
| | 276 | | | Morgan Stanley | | | 10,943 | |
| | 22 | | | PNC Financial Services Group, Inc. | | | 2,572 | |
| | 151 | | | Regions Financial Corp. | | | 2,020 | |
See accompanying notes to consolidated financial statements.
| RATIONAL NUWAVE ENHANCED MARKET OPPORTUNITY FUND |
| CONSOLIDATED PORTFOLIO OF INVESTMENTS (Continued) |
| December 31, 2018 |
| Shares | | | | | Value | |
| | | | | COMMON STOCKS - 76.5% (Continued) | | | | |
| | | | | BANKS - 1.3% (Continued) | | | | |
| | 15 | | | State Street Corp. | | $ | 946 | |
| | 1,680 | | | US Bancorp | | | 76,776 | |
| | 61 | | | Wells Fargo & Co. | | | 2,811 | |
| | 40 | | | Zions Bancorporation | | | 1,630 | |
| | | | | | | | 220,538 | |
| | | | | BEVERAGES - 2.2% | | | | |
| | 4,306 | | | Coca-Cola Co. | | | 203,889 | |
| | 613 | | | Constellation Brands, Inc. | | | 98,583 | |
| | 1,835 | | | Keurig Dr Pepper, Inc. | | | 47,049 | |
| | 14 | | | Molson Coors Brewing Co. | | | 786 | |
| | 30 | | | Monster Beverage Corp. * | | | 1,477 | |
| | 164 | | | PepsiCo, Inc. | | | 18,119 | |
| | | | | | | | 369,903 | |
| | | | | BIOTECHNOLOGY - 0.8% | | | | |
| | 39 | | | Alexion Pharmaceuticals, Inc. * | | | 3,797 | |
| | 86 | | | Amgen, Inc. | | | 16,742 | |
| | 9 | | | BioMarin Pharmaceutical, Inc. * | | | 766 | |
| | 244 | | | Bluebird Bio, Inc. * | | | 24,205 | |
| | 916 | | | Celgene Corp. * | | | 58,706 | |
| | 196 | | | Gilead Sciences, Inc. | | | 12,260 | |
| | 6 | | | Illumina, Inc. * | | | 1,800 | |
| | 27 | | | Incyte Corp. * | | | 1,717 | |
| | 24 | | | Regeneron Pharmaceuticals, Inc. * | | | 8,964 | |
| | 7 | | | United Therapeutics Corp. * | | | 762 | |
| | | | | | | | 129,719 | |
| | | | | BUILDING MATERIALS - 0.1% | | | | |
| | 92 | | | Johnson Controls International PLC | | | 2,728 | |
| | 17 | | | Martin Marietta Materials, Inc. | | | 2,922 | |
| | 200 | | | Masco Corp. | | | 5,848 | |
| | 9 | | | Vulcan Materials Co. | | | 889 | |
| | | | | | | | 12,387 | |
| | | | | CHEMICALS - 0.8% | | | | |
| | 278 | | | Air Products & Chemicals, Inc. | | | 44,494 | |
| | 73 | | | CF Industries Holdings, Inc. | | | 3,176 | |
| | 23 | | | DowDuPont, Inc. | | | 1,230 | |
| | 48 | | | Eastman Chemical Co. | | | 3,509 | |
| | 411 | | | Linde PLC | | | 64,133 | |
| | 43 | | | LyondellBasell Industries NV | | | 3,576 | |
| | 54 | | | Mosaic Co. | | | 1,577 | |
| | 8 | | | PPG Industries, Inc. | | | 818 | |
| | 26 | | | Sherwin-Williams Co. | | | 10,230 | |
| | | | | | | | 132,743 | |
| | | | | COMMERCIAL SERVICES - 3.1% | | | | |
| | 92 | | | Automatic Data Processing, Inc. | | | 12,063 | |
| | 818 | | | Ecolab, Inc. | | | 120,532 | |
| | 700 | | | Equifax, Inc. | | | 65,191 | |
| | 28 | | | FleetCor Technologies, Inc. * | | | 5,200 | |
| | 16 | | | H&R Block, Inc. | | | 406 | |
| | 161 | | | Moody’s Corp. | | | 22,546 | |
| | 84 | | | Nielsen Holdings PLC | | | 1,960 | |
| | 791 | | | S&P Global, Inc. | | | 134,422 | |
| | 368 | | | United Rentals, Inc. * | | | 37,731 | |
| | 568 | | | Verisk Analytics, Inc. * | | | 61,935 | |
| | 3,011 | | | Western Union Co. | | | 51,368 | |
| | | | | | | | 513,354 | |
See accompanying notes to consolidated financial statements.
| RATIONAL NUWAVE ENHANCED MARKET OPPORTUNITY FUND |
| CONSOLIDATED PORTFOLIO OF INVESTMENTS (Continued) |
| December 31, 2018 |
| Shares | | | | | Value | |
| | | | | COMMON STOCKS - 76.5% (Continued) | | | | |
| | | | | COMPUTERS - 3.1% | | | | |
| | 389 | | | Accenture PLC | | $ | 54,853 | |
| | 568 | | | Apple, Inc. | | | 89,596 | |
| | 795 | | | Check Point Software Technologies Ltd. * | | | 81,607 | |
| | 222 | | | Cognizant Technology Solutions Corp. | | | 14,093 | |
| | 695 | | | DXC Technology Co. | | | 36,953 | |
| | 101 | | | Hewlett Packard Enterprise Co. | | | 1,334 | |
| | 116 | | | HP, Inc. | | | 2,373 | |
| | 2,441 | | | Infosys Ltd. - ADR | | | 23,238 | |
| | 1,044 | | | International Business Machines Corp. | | | 118,672 | |
| | 206 | | | NetApp, Inc. | | | 12,292 | |
| | 77 | | | Seagate Technology PLC | | | 2,972 | |
| | 1,990 | | | Western Digital Corp. | | | 73,570 | |
| | | | | | | | 511,553 | |
| | | | | COSMETICS/PERSONAL CARE - 0.8% | | | | |
| | 176 | | | Colgate-Palmolive Co. | | | 10,475 | |
| | 31 | | | Estee Lauder Cos., Inc. | | | 4,033 | |
| | 801 | | | Procter & Gamble Co. | | | 73,628 | |
| | 876 | | | Unilever NV | | | 47,129 | |
| | | | | | | | 135,265 | |
| | | | | DISTRIBUTION/WHOLESALE - 0.2% | | | | |
| | 12 | | | Fastenal Co. | | | 627 | |
| | 88 | | | WW Grainger, Inc. | | | 24,848 | |
| | | | | | | | 25,475 | |
| | | | | DIVERSIFIED FINANCIAL SERVICES - 3.4% | | | | |
| | 33 | | | Alliance Data Systems Corp. | | | 4,953 | |
| | 731 | | | American Express Co. | | | 69,679 | |
| | 113 | | | Ameriprise Financial, Inc. | | | 11,794 | |
| | 25 | | | BlackRock, Inc. | | | 9,820 | |
| | 48 | | | Capital One Financial Corp. | | | 3,628 | |
| | 442 | | | Charles Schwab Corp. | | | 18,356 | |
| | 1,021 | | | CME Group, Inc. | | | 192,071 | |
| | 35 | | | E*TRADE Financial Corp. | | | 1,536 | |
| | 78 | | | Franklin Resources, Inc. | | | 2,313 | |
| | 1,467 | | | Intercontinental Exchange, Inc. | | | 110,509 | |
| | 2,536 | | | Invesco Ltd. | | | 42,453 | |
| | 52 | | | Mastercard, Inc. | | | 9,810 | |
| | 261 | | | Nasdaq, Inc. | | | 21,290 | |
| | 366 | | | T Rowe Price Group, Inc. | | | 33,789 | |
| | 16 | | | TD Ameritrade Holding Corp. | | | 783 | |
| | 166 | | | Visa, Inc. | | | 21,902 | |
| | | | | | | | 554,686 | |
| | | | | ELECTRIC - 4.0% | | | | |
| | 154 | | | American Electric Power Co., Inc. | | | 11,510 | |
| | 536 | | | CenterPoint Energy, Inc. | | | 15,131 | |
| | 152 | | | CMS Energy Corp. | | | 7,547 | |
| | 537 | | | Dominion Energy, Inc. | | | 38,374 | |
| | 678 | | | Duke Energy Corp. | | | 58,511 | |
| | 120 | | | Edison International | | | 6,812 | |
| | 93 | | | Entergy Corp. | | | 8,005 | |
| | 813 | | | Eversource Energy | | | 52,878 | |
| | 2,212 | | | Exelon Corp. | | | 99,761 | |
| | 466 | | | FirstEnergy Corp. | | | 17,498 | |
| | 725 | | | NextEra Energy, Inc. | | | 126,019 | |
| | 555 | | | NRG Energy, Inc. | | | 21,978 | |
| | 2,517 | | | PG&E Corp. * | | | 59,779 | |
| | 189 | | | PPL Corp. | | | 5,354 | |
| | 237 | | | Public Service Enterprise Group, Inc. | | | 12,336 | |
| | 43 | | | Southern Co. | | | 1,889 | |
| | 464 | | | WEC Energy Group, Inc. | | | 32,137 | |
| | 1,491 | | | Xcel Energy, Inc. | | | 73,462 | |
| | | | | | | | 648,981 | |
See accompanying notes to consolidated financial statements.
| RATIONAL NUWAVE ENHANCED MARKET OPPORTUNITY FUND |
| CONSOLIDATED PORTFOLIO OF INVESTMENTS (Continued) |
| December 31, 2018 |
| Shares | | | | | Value | |
| | | | | COMMON STOCKS - 76.5% (Continued) | | | | |
| | | | | ELECTRICAL COMPONENTS & EQUIPMENT - 0.1% | | | | |
| | 204 | | | Universal Display Corp. | | $ | 19,088 | |
| | | | | | | | | |
| | | | | ELECTRONICS - 2.3% | | | | |
| | 64 | | | Agilent Technologies, Inc. | | | 4,317 | |
| | 906 | | | Amphenol Corp. | | | 73,404 | |
| | 235 | | | Corning, Inc. | | | 7,099 | |
| | 1,938 | | | Honeywell International, Inc. | | | 256,049 | |
| | 533 | | | TE Connectivity Ltd. | | | 40,311 | |
| | | | | | | | 381,180 | |
| | | | | ENERGY-ALTERNATIVE SOURCES- 0.0% | | | | |
| | 72 | | | First Solar, Inc. * | | | 3,057 | |
| | | | | | | | | |
| | | | | ENGINEERING & CONSTRUCTION - 0.1% | | | | |
| | 317 | | | Fluor Corp. | | | 10,207 | |
| | | | | | | | | |
| | | | | ENVIRONMENTAL CONTROL - 1.2% | | | | |
| | 1,185 | | | Republic Services, Inc. | | | 85,427 | |
| | 1,181 | | | Waste Management, Inc. | | | 105,097 | |
| | | | | | | | 190,524 | |
| | | | | FOOD - 3.4% | | | | |
| | 3,332 | | | Conagra Brands, Inc. | | | 71,172 | |
| | 91 | | | General Mills, Inc. | | | 3,544 | |
| | 49 | | | Hershey Co. | | | 5,252 | |
| | 105 | | | JM Smucker Co. | | | 9,816 | |
| | 1,074 | | | Kellogg Co. | | | 61,229 | |
| | 2,760 | | | Kraft Heinz Co. | | | 118,790 | |
| | 1,671 | | | Kroger Co. | | | 45,953 | |
| | 2,077 | | | Mondelez International, Inc. | | | 83,142 | |
| | 2,302 | | | Sysco Corp. | | | 144,243 | |
| | 151 | | | Tyson Foods, Inc. | | | 8,063 | |
| | | | | | | | 551,204 | |
| | | | | FOREST PRODUCTS & PAPER - 0.0% | | | | |
| | 166 | | | International Paper, Co. | | | 6,700 | |
| | | | | | | | | |
| | | | | HAND/MACHINE TOOLS - 0.0% | | | | |
| | 6 | | | Stanley Black & Decker, Inc. | | | 718 | |
| | | | | | | | | |
| | | | | HEALTHCARE-PRODUCTS - 4.3% | | | | |
| | 1,281 | | | Abbott Laboratories | | | 92,655 | |
| | 1,149 | | | Baxter International, Inc. | | | 75,627 | |
| | 255 | | | Becton Dickinson and Co. | | | 57,456 | |
| | 147 | | | Boston Scientific Corp. * | | | 5,195 | |
| | 798 | | | Danaher Corp. | | | 82,290 | |
| | 213 | | | DENTSPLY SIRONA, Inc. | | | 7,926 | |
| | 131 | | | Edwards Lifesciences Corp. * | | | 20,065 | |
| | 65 | | | Henry Schein, Inc. * | | | 5,104 | |
| | 25 | | | Hologic, Inc. * | | | 1,027 | |
| | 14 | | | Intuitive Surgical, Inc. * | | | 6,705 | |
| | 2,309 | | | Medtronic PLC | | | 210,027 | |
| | 141 | | | Stryker Corp. | | | 22,102 | |
| | 392 | | | Thermo Fisher Scientific, Inc. | | | 87,726 | |
| | 309 | | | Zimmer Biomet Holdings, Inc. | | | 32,049 | |
| | | | | | | | 705,954 | |
| | | | | HEALTHCARE-SERVICES - 0.9% | | | | |
| | 90 | | | Anthem, Inc. | | | 23,637 | |
| | 150 | | | Centene Corp. * | | | 17,295 | |
| | 293 | | | DaVita, Inc. * | | | 15,078 | |
| | 11 | | | HCA Healthcare, Inc. | | | 1,369 | |
| | 15 | | | Humana, Inc. | | | 4,297 | |
| | 52 | | | Laboratory Corp. of America Holdings * | | | 6,571 | |
| | 401 | | | Quest Diagnostics, Inc. | | | 33,391 | |
| | 160 | | | UnitedHealth Group, Inc. | | | 39,859 | |
| | 17 | | | Universal Health Services, Inc. | | | 1,981 | |
| | | | | | | | 143,478 | |
See accompanying notes to consolidated financial statements.
| RATIONAL NUWAVE ENHANCED MARKET OPPORTUNITY FUND |
| CONSOLIDATED PORTFOLIO OF INVESTMENTS (Continued) |
| December 31, 2018 |
| Shares | | | | | Value | |
| | | | | COMMON STOCKS - 76.5% (Continued) | | | | |
| | | | | HOME BUILDERS - 0.2% | | | | |
| | 414 | | | DR Horton, Inc. | | $ | 14,349 | |
| | 498 | | | Lennar Corp. | | | 19,497 | |
| | 20 | | | PulteGroup, Inc. | | | 520 | |
| | | | | | | | 34,366 | |
| | | | | HOME FURNISHINGS - 0.0% | | | | |
| | 25 | | | Whirlpool Corp. | | | 2,672 | |
| | | | | | | | | |
| | | | | HOUSEHOLD PRODUCTS/WARES - 0.2% | | | | |
| | 173 | | | Clorox Co. | | | 26,666 | |
| | 19 | | | Kimberly-Clark Corp. | | | 2,165 | |
| | | | | | | | 28,831 | |
| | | | | HOUSEWARES - 0.0% | | | | |
| | 375 | | | Newell Brands, Inc. | | | 6,971 | |
| | | | | | | | | |
| | | | | INSURANCE - 3.9% | | | | |
| | 483 | | | Aflac, Inc. | | | 22,006 | |
| | 466 | | | Allstate Corp. | | | 38,506 | |
| | 661 | | | Aon PLC | | | 96,083 | |
| | 540 | | | Berkshire Hathaway, Inc. * | | | 110,257 | |
| | 458 | | | Chubb Ltd. | | | 59,164 | |
| | 875 | | | Hartford Financial Services Group, Inc. | | | 38,894 | |
| | 64 | | | Lincoln National Corp. | | | 3,284 | |
| | 1,020 | | | Marsh & McLennan Cos., Inc. | | | 81,345 | |
| | 123 | | | MetLife, Inc. | | | 5,050 | |
| | 101 | | | Principal Financial Group, Inc. | | | 4,461 | |
| | 1,457 | | | Progressive Corp. | | | 87,901 | |
| | 79 | | | Prudential Financial, Inc. | | | 6,442 | |
| | 681 | | | Travelers Cos., Inc. | | | 81,550 | |
| | | | | | | | 634,943 | |
| | | | | INTERNET - 1.8% | | | | |
| | 4 | | | Alibaba Group Holding Ltd. - ADR * | | | 548 | |
| | 17 | | | Alphabet, Inc. * | | | 17,605 | |
| | 7 | | | Amazon.com, Inc. * | | | 10,514 | |
| | 210 | | | Baidu, Inc. - ADR * | | | 33,306 | |
| | 3 | | | Booking Holdings, Inc. * | | | 5,167 | |
| | 683 | | | eBay, Inc. * | | | 19,172 | |
| | 335 | | | Expedia Group, Inc. | | | 37,738 | |
| | 232 | | | F5 Networks, Inc. * | | | 37,591 | |
| | 294 | | | Facebook, Inc. * | | | 38,541 | |
| | 114 | | | Netflix, Inc. * | | | 30,513 | |
| | 8 | | | Palo Alto Networks, Inc. * | | | 1,507 | |
| | 140 | | | Symantec Corp. | | | 2,645 | |
| | 631 | | | TripAdvisor, Inc. * | | | 34,036 | |
| | 218 | | | Twitter, Inc. * | | | 6,265 | |
| | 124 | | | VeriSign, Inc. * | | | 18,388 | |
| | | | | | | | 293,536 | |
| | | | | IRON/STEEL - 0.5% | | | | |
| | 390 | | | Nucor Corp. | | | 20,206 | |
| | 3,453 | | | United States Steel Corp. | | | 62,983 | |
| | | | | | | | 83,189 | |
| | | | | LEISURE TIME - 0.1% | | | | |
| | 400 | | | Carnival Corp. | | | 19,720 | |
| | 9 | | | Harley-Davidson, Inc. | | | 307 | |
| | 5 | | | Polaris Industries, Inc. | | | 383 | |
| | 20 | | | Royal Caribbean Cruises Ltd. | | | 1,956 | |
| | | | | | | | 22,366 | |
| | | | | LODGING - 0.4% | | | | |
| | 33 | | | Marriott International, Inc. | | | 3,583 | |
| | 109 | | | MGM Resorts International | | | 2,644 | |
| | 70 | | | Wyndham Worldwide Corp. | | | 2,509 | |
| | 622 | | | Wynn Resorts Ltd. | | | 61,522 | |
| | | | | | | | 70,258 | |
See accompanying notes to consolidated financial statements.
| RATIONAL NUWAVE ENHANCED MARKET OPPORTUNITY FUND |
| CONSOLIDATED PORTFOLIO OF INVESTMENTS (Continued) |
| December 31, 2018 |
| Shares | | | | | Value | |
| | | | | COMMON STOCKS - 76.5% (Continued) | | | | |
| | | | | MACHINERY- CONSTRUCTION & MINING- 0.0% | | | | |
| | 26 | | | Caterpillar, Inc. | | $ | 3,304 | |
| | | | | | | | | |
| | | | | MACHINERY-DIVERSIFIED - 0.1% | | | | |
| | 17 | | | Cummins, Inc. | | | 2,272 | |
| | 59 | | | Deere & Co. | | | 8,801 | |
| | 22 | | | Dover Corp. | | | 1,561 | |
| | | | | | | | 12,634 | |
| | | | | MEDIA - 2.3% | | | | |
| | 123 | | | CBS Corp. | | | 5,378 | |
| | 33 | | | Charter Communications, Inc. * | | | 9,404 | |
| | 46 | | | Comcast Corp. | | | 1,566 | |
| | 2,018 | | | Discovery, Inc. * | | | 49,925 | |
| | 30 | | | DISH Network Corp. * | | | 749 | |
| | 258 | | | Liberty Global PLC * | | | 5,506 | |
| | 2,541 | | | Twenty-First Century Fox, Inc. | | | 122,273 | |
| | 126 | | | Viacom, Inc. | | | 3,238 | |
| | 1,614 | | | Walt Disney Co. | | | 176,975 | |
| | | | | | | | 375,014 | |
| | | | | MINING - 0.2% | | | | |
| | 2,479 | | | Freeport-McMoRan, Inc. | | | 25,558 | |
| | 103 | | | Newmont Mining Corp. | | | 3,569 | |
| | | | | | | | 29,127 | |
| | | | | MISCELLANEOUS MANUFACTURING - 1.0% | | | | |
| | 110 | | | 3M Co. | | | 20,959 | |
| | 393 | | | Eaton Corp PLC | | | 26,983 | |
| | 6,016 | | | General Electric Co. | | | 45,541 | |
| | 207 | | | Illinois Tool Works, Inc. | | | 26,225 | |
| | 217 | | | Ingersoll-Rand PLC | | | 19,797 | |
| | 20 | | | Parker-Hannifin Corp. | | | 2,983 | |
| | 422 | | | Textron, Inc. | | | 19,408 | |
| | | | | | | | 161,896 | |
| | | | | OFFICE/BUSINESS EQUIPMENT - 0.0% | | | | |
| | 281 | | | Xerox Corp. | | | 5,553 | |
| | | | | | | | | |
| | | | | OIL & GAS - 3.4% | | | | |
| | 1,206 | | | Anadarko Petroleum Corp. | | | 52,871 | |
| | 1,557 | | | Apache Corp. | | | 40,871 | |
| | 89 | | | Cabot Oil & Gas Corp. | | | 1,989 | |
| | 152 | | | Cimarex Energy Co. | | | 9,371 | |
| | 47 | | | Concho Resources, Inc. * | | | 4,831 | |
| | 55 | | | ConocoPhillips | | | 3,429 | |
| | 674 | | | Continental Resources, Inc. * | | | 27,088 | |
| | 3,001 | | | Devon Energy Corp. | | | 67,643 | |
| | 195 | | | EOG Resources, Inc. | | | 17,006 | |
| | 391 | | | EQT Corp. | | | 7,386 | |
| | 380 | | | Exxon Mobil Corp. | | | 25,912 | |
| | 10 | | | Helmerich & Payne, Inc. | | | 479 | |
| | 832 | | | Hess Corp. | | | 33,696 | |
| | 455 | | | HollyFrontier Corp. | | | 23,260 | |
| | 1,016 | | | Marathon Oil Corp. | | | 14,570 | |
| | 518 | | | Marathon Petroleum Corp. | | | 30,567 | |
| | 170 | | | Murphy Oil Corp. | | | 3,976 | |
| | 1,827 | | | Newfield Exploration Co. * | | | 26,784 | |
| | 1,684 | | | Noble Energy, Inc. | | | 31,592 | |
| | 555 | | | Occidental Petroleum Corp. | | | 34,066 | |
| | 174 | | | Phillips 66 | | | 14,990 | |
| | 53 | | | Pioneer Natural Resources Co. | | | 6,971 | |
| | 3,020 | | | Range Resources Corp. | | | 28,901 | |
| | 2,658 | | | Transocean Ltd. * | | | 18,447 | |
| | 125 | | | Valero Energy Corp. | | | 9,371 | |
| | 1,335 | | | Whiting Petroleum Corp. * | | | 30,291 | |
| | | | | | | | 566,358 | |
See accompanying notes to consolidated financial statements.
| RATIONAL NUWAVE ENHANCED MARKET OPPORTUNITY FUND |
| CONSOLIDATED PORTFOLIO OF INVESTMENTS (Continued) |
| December 31, 2018 |
| Shares | | | | | Value | |
| | | | | COMMON STOCKS - 76.5% (Continued) | | | | |
| | | | | OIL & GAS SERVICES - 1.0% | | | | |
| | 184 | | | Baker Hughes a GE Co. | | $ | 3,956 | |
| | 3,471 | | | Halliburton Co. | | | 92,259 | |
| | 615 | | | National Oilwell Varco, Inc. | | | 15,806 | |
| | 1,522 | | | Schlumberger Ltd. | | | 54,914 | |
| | 225 | | | TechnipFMC PLC | | | 4,405 | |
| | | | | | | | 171,340 | |
| | | | | PACKAGING & CONTAINERS - 0.5% | | | | |
| | 1,581 | | | Ball Corp. | | | 72,694 | |
| | 51 | | | Sealed Air Corp. | | | 1,777 | |
| | | | | | | | 74,471 | |
| | | | | PHARMACEUTICALS - 2.8% | | | | |
| | 270 | | | Allergan PLC | | | 36,088 | |
| | 22 | | | AmerisourceBergen Corp. | | | 1,637 | |
| | 797 | | | Bristol-Myers Squibb Co. | | | 41,428 | |
| | 129 | | | Cardinal Health, Inc. | | | 5,753 | |
| | 204 | | | Eli Lilly & Co. | | | 23,607 | |
| | 99 | | | Johnson & Johnson | | | 12,776 | |
| | 1,187 | | | Merck & Co., Inc. | | | 90,699 | |
| | 773 | | | Mylan NV * | | | 21,180 | |
| | 149 | | | Perrigo Co PLC | | | 5,774 | |
| | 3,953 | | | Pfizer, Inc. | | | 172,549 | |
| | 3,203 | | | Teva Pharmaceutical Industries Ltd. * | | | 49,390 | |
| | | | | | | | 460,881 | |
| | | | | PIPELINES - 0.7% | | | | |
| | 103 | | | Enbridge, Inc. | | | 3,201 | |
| | 370 | | | Energy Transfer Partners LP | | | 4,888 | |
| | 3,591 | | | Kinder Morgan, Inc. | | | 55,229 | |
| | 987 | | | ONEOK, Inc. | | | 53,249 | |
| | 304 | | | Williams Cos., Inc. | | | 6,703 | |
| | | | | | | | 123,270 | |
| | | | | REAL ESTATE - 0.0% | | | | |
| | 143 | | | CBRE Group, Inc. * | | | 5,726 | |
| | | | | | | | | |
| | | | | REITS - 3.9% | | | | |
| | 888 | | | American Tower Corp. | | | 140,473 | |
| | 6,446 | | | Annaly Capital Management, Inc. | | | 63,300 | |
| | 75 | | | AvalonBay Communities, Inc. | | | 13,054 | |
| | 122 | | | Boston Properties, Inc. | | | 13,731 | |
| | 247 | | | Crown Castle International Corp. | | | 26,832 | |
| | 11 | | | Equinix, Inc. | | | 3,878 | |
| | 474 | | | Equity Residential | | | 31,289 | |
| | 1,262 | | | HCP, Inc. | | | 35,248 | |
| | 1,720 | | | Host Hotels & Resorts, Inc. | | | 28,672 | |
| | 382 | | | Prologis, Inc. | | | 22,431 | |
| | 334 | | | Public Storage | | | 67,605 | |
| | 236 | | | SBA Communications Corp. * | | | 38,206 | |
| | 106 | | | Simon Property Group, Inc. | | | 17,807 | |
| | 583 | | | Ventas, Inc. | | | 34,158 | |
| | 151 | | | Vornado Realty Trust | | | 9,366 | |
| | 878 | | | Welltower, Inc. | | | 60,942 | |
| | 1,440 | | | Weyerhaeuser Co. | | | 31,478 | |
| | | | | | | | 638,470 | |
| | | | | RETAIL - 5.4% | | | | |
| | 464 | | | Advance Auto Parts, Inc. | | | 73,061 | |
| | 117 | | | AutoZone, Inc. * | | | 98,086 | |
| | 2,189 | | | Bed Bath & Beyond, Inc. | | | 24,779 | |
| | 15 | | | CarMax, Inc. * | | | 941 | |
| | 8 | | | Chipotle Mexican Grill, Inc. * | | | 3,454 | |
| | 7 | | | Darden Restaurants, Inc. | | | 699 | |
| | 111 | | | Dollar General Corp. | | | 11,997 | |
| | 12 | | | Foot Locker, Inc. | | | 638 | |
| | 20 | | | Gap, Inc. | | | 515 | |
See accompanying notes to consolidated financial statements.
| RATIONAL NUWAVE ENHANCED MARKET OPPORTUNITY FUND |
| CONSOLIDATED PORTFOLIO OF INVESTMENTS (Continued) |
| December 31, 2018 |
| Shares | | | | | Value | |
| | | | | COMMON STOCKS - 76.5% (Continued) | | | | |
| | | | | RETAIL - 5.4% (Continued) | | | | |
| | 137 | | | Home Depot, Inc. | | $ | 23,539 | |
| | 307 | | | L Brands, Inc. | | | 7,881 | |
| | 167 | | | Lowe’s Cos., Inc. | | | 15,424 | |
| | 214 | | | Macy’s, Inc. | | | 6,373 | |
| | 733 | | | McDonald’s Corp. | | | 130,159 | |
| | 288 | | | Nordstrom, Inc. | | | 13,424 | |
| | 151 | | | O’Reilly Automotive, Inc. * | | | 51,994 | |
| | 15 | | | Ross Stores, Inc. | | | 1,248 | |
| | 189 | | | Signet Jewelers Ltd. | | | 6,005 | |
| | 1,844 | | | Starbucks Corp. | | | 118,754 | |
| | 871 | | | Tapestry, Inc. | | | 29,396 | |
| | 19 | | | Target Corp. | | | 1,256 | |
| | 462 | | | Tiffany & Co. | | | 37,196 | |
| | 1,024 | | | TJX Cos., Inc. | | | 45,814 | |
| | 369 | | | Tractor Supply Co. | | | 30,789 | |
| | 52 | | | Urban Outfitters, Inc. * | | | 1,726 | |
| | 290 | | | Walgreens Boots Alliance, Inc. | | | 19,816 | |
| | 1,013 | | | Walmart, Inc. | | | 94,361 | |
| | 381 | | | Yum! Brands, Inc. | | | 35,021 | |
| | | | | | | | 884,346 | |
| | | | | SEMICONDUCTORS - 1.5% | | | | |
| | 2,222 | | | Advanced Micro Devices, Inc. * | | | 41,018 | |
| | 108 | | | Analog Devices, Inc. | | | 9,270 | |
| | 4 | | | Broadcom, Inc. | | | 1,017 | |
| | 166 | | | Intel Corp. | | | 7,790 | |
| | 21 | | | Lam Research Corp. | | | 2,860 | |
| | 217 | | | Marvell Technology Group Ltd. | | | 3,513 | |
| | 1,135 | | | Micron Technology, Inc. * | | | 36,013 | |
| | 460 | | | NVIDIA Corp. | | | 61,410 | |
| | 40 | | | Qorvo, Inc. * | | | 2,429 | |
| | 169 | | | QUALCOMM, Inc. | | | 9,618 | |
| | 869 | | | Xilinx, Inc. | | | 74,013 | |
| | | | | | | | 248,951 | |
| | | | | SOFTWARE - 5.5% | | | | |
| | 1,779 | | | Activision Blizzard, Inc. | | | 82,848 | |
| | 4 | | | Adobe Systems, Inc. * | | | 905 | |
| | 28 | | | Akamai Technologies, Inc. * | | | 1,710 | |
| | 5 | | | Autodesk, Inc. * | | | 643 | |
| | 177 | | | Cerner Corp. * | | | 9,282 | |
| | 843 | | | Citrix Systems, Inc. | | | 86,374 | |
| | 905 | | | Electronic Arts, Inc. * | | | 71,413 | |
| | 1,047 | | | Fidelity National Information Services, Inc. | | | 107,370 | |
| | 1,400 | | | Fiserv, Inc. * | | | 102,886 | |
| | 53 | | | Intuit, Inc. | | | 10,433 | |
| | 493 | | | Microsoft Corp. | | | 50,074 | |
| | 1,739 | | | Oracle Corp. | | | 78,516 | |
| | 614 | | | Paychex, Inc. | | | 40,002 | |
| | 1,089 | | | Red Hat, Inc. * | | | 191,272 | |
| | 12 | | | salesforce.com, Inc. * | | | 1,644 | |
| | 16 | | | ServiceNow, Inc. * | | | 2,849 | |
| | 46 | | | Splunk, Inc. * | | | 4,823 | |
| | 308 | | | Vmware, Inc. | | | 42,236 | |
| | 51 | | | Workday, Inc. * | | | 8,144 | |
| | | | | | | | 893,424 | |
See accompanying notes to consolidated financial statements.
| RATIONAL NUWAVE ENHANCED MARKET OPPORTUNITY FUND |
| CONSOLIDATED PORTFOLIO OF INVESTMENTS (Continued) |
| December 31, 2018 |
| Shares | | | | | Value | |
| | | | | COMMON STOCKS - 76.5% (Continued) | | | | |
| | | | | TELECOMMUNICATIONS - 2.2% | | | | |
| | 1,409 | | | AT&T, Inc. | | $ | 40,213 | |
| | 3,863 | | | CenturyLink, Inc. | | | 58,524 | |
| | 142 | | | Cisco Systems, Inc. | | | 6,153 | |
| | 119 | | | Juniper Networks Inc | | | 3,202 | |
| | 130 | | | Motorola Solutions, Inc. | | | 14,955 | |
| | 845 | | | Sprint Corp. * | | | 4,918 | |
| | 2,029 | | | T-Mobile US, Inc. * | | | 129,065 | |
| | 1,446 | | | Verizon Communications, Inc. | | | 81,294 | |
| | 809 | | | Vodafone Group PLC | | | 15,598 | |
| | | | | | | | 353,922 | |
| | | | | TEXTILES - 0.4% | | | | |
| | 508 | | | Mohawk Industries, Inc. * | | | 59,416 | |
| | | | | | | | | |
| | | | | TOYS & GAMES - 0.0% | | | | |
| | 13 | | | Hasbro, Inc. | | | 1,056 | |
| | 153 | | | Mattel, Inc. * | | | 1,529 | |
| | | | | | | | 2,585 | |
| | | | | TRANSPORTATION - 0.6% | | | | |
| | 568 | | | CSX Corp. | | | 35,290 | |
| | 125 | | | FedEx Corp. | | | 20,166 | |
| | 211 | | | Kansas City Southern | | | 20,140 | |
| | 21 | | | Norfolk Southern Corp. | | | 3,141 | |
| | 88 | | | Union Pacific Corp. | | | 12,164 | |
| | | | | | | | 90,901 | |
| | | | | | | | | |
| | | | | TOTAL COMMON STOCKS (Cost - $12,898,219) | | | 12,550,231 | |
| | | | | | | | | |
| | | | | EXCHANGE TRADED FUNDS - 2.2% | | | | |
| | 644 | | | Invesco QQQ Trust Series 1 | | | 99,343 | |
| | 36 | | | iShares Russell 2000 ETF | | | 4,820 | |
| | 1,004 | | | SPDR S&P 500 ETF Trust | | | 250,920 | |
| | | | | TOTAL EXCHANGE TRADED FUNDS (Cost - $355,267) | | | 355,083 | |
| | | | | | | | | |
| | | | | SHORT-TERM INVESTMENTS - 11.0% | | | | |
| | 1,806,881 | | | Federated Treasury Obligations, Institutional Class, 2.31% ** | | | 1,806,881 | |
| | | | | TOTAL SHORT-TERM INVESTMENTS (Cost - $1,806,881) | | | | |
| | | | | | | | | |
| | | | | TOTAL INVESTMENTS - 89.7% (Cost - $15,060,367) | | $ | 14,712,195 | |
| | | | | OTHER ASSETS LESS LIABILITIES - 10.3% | | | 1,684,019 | |
| | | | | NET ASSETS - 100.0% | | $ | 16,396,214 | |
ADR - American Depositary Receipt
ETF - Exchange Traded Fund
PLC - Public Limited Company
| * | Non-income producing securities. |
| ** | Rate shown represents the rate at December 31, 2018, and is subject to change and resets daily. |
See accompanying notes to consolidated financial statements.
| RATIONAL NUWAVE ENHANCED MARKET OPPORTUNITY FUND |
| CONSOLIDATED PORTFOLIO OF INVESTMENTS (Continued) |
| December 31, 2018 |
| | | | | | | | | | | | | Unrealized | |
| | | | | | | | Underlying Face | | | | | Appreciation / | |
| Long Contracts | | | | | Counterparty | | Amount at Value ($) | | | Maturity | | (Depreciation) | |
| | | | | OPEN LONG FUTURES CONTRACTS - 0.5% | | | | | | | |
| | 34 | | | 90 Day Sterling Future | | ADM | | | 5,355,698 | | | September-19 | | $ | (1,887 | ) |
| | 15 | | | Australian 10Y Bond Future | | ADM | | | 1,401,048 | | | March-19 | | | 10,658 | |
| | 5 | | | CAC40 10 Euro Future | | ADM | | | 270,269 | | | January-19 | | | 1,190 | |
| | 1 | | | E-Mini Russell 2000 Future | | ADM | | | 67,450 | | | March-19 | | | 3,387 | |
| | 5 | | | Japanese 10 Year Bond (OSE) | | ADM | | | 6,948,913 | | | March-19 | | | 12,378 | |
| | 8 | | | Live Cattle Future + | | ADM | | | 404,000 | | | April-19 | | | 9,067 | |
| | 14 | | | Long Guilt Future | | ADM | | | 2,196,171 | | | March-19 | | | 4,633 | |
| | 33 | | | Natural Gas Future + | | ADM | | | 970,200 | | | February-19 | | | (240,805 | ) |
| | 5 | | | Nikkei 225 (SGX) Future | | ADM | | | 454,245 | | | March-19 | | | 6,182 | |
| | 3 | | | S&P/TSX 60 IX Future | | ADM | | | 376,614 | | | March-19 | | | 1,215 | |
| | 10 | | | Sugar #11 (WORLD) Future + | | ADM | | | 135,520 | | | May-19 | | | (7,472 | ) |
| | 96 | | | US 10 Year Note (CBT) Future | | ADM | | | 11,713,500 | | | March-19 | | | 261,511 | |
| | 15 | | | WTI Crude Future + | | ADM | | | 681,150 | | | February-19 | | | 22,592 | |
| | | | | Net Unrealized Appreciation From Open Long Futures Contracts | | | $ | 82,649 | |
| | | | | | | | | | |
| | | | | | | | | | | | | Unrealized | |
| | | | | | | | Underlying Face | | | | | Appreciation / | |
| Short Contracts | | | | | Counterparty | | Amount at Value ($) | | | Maturity | | (Depreciation) | |
| | | | | OPEN SHORT FUTURES CONTRACTS - (0.6)% | | | | | | | |
| | (2 | ) | | 3 Month Euro Future | | ADM | | | (573,147 | ) | | September-19 | | $ | (57 | ) |
| | (5 | ) | | 90 Day Euro Future | | ADM | | | (1,216,750 | ) | | September-19 | | | (1,562 | ) |
| | (15 | ) | | AUD/USD Currency Future | | ADM | | | (1,057,800 | ) | | March-19 | | | 4,201 | |
| | (6 | ) | | BP Currency Future | | ADM | | | (479,625 | ) | | March-19 | | | (4,440 | ) |
| | (8 | ) | | C$ Currency Future | | ADM | | | (588,080 | ) | | March-19 | | | 2,821 | |
| | (6 | ) | | Coffee Future + | | ADM | | | (229,163 | ) | | March-19 | | | 5,756 | |
| | (1 | ) | | Copper Future + | | ADM | | | (65,775 | ) | | March-19 | | | 1,175 | |
| | (10 | ) | | Corn Future + | | ADM | | | (187,500 | ) | | March-19 | | | 1,319 | |
| | (16 | ) | | Euro FX Currency Future | | ADM | | | (2,304,500 | ) | | March-19 | | | (5,500 | ) |
| | (74 | ) | | Euro-Bund Future | | ADM | | | (13,834,361 | ) | | March-19 | | | (75,532 | ) |
| | (2 | ) | | FTSE 100 Future | | ADM | | | (169,618 | ) | | March-19 | | | (1,643 | ) |
| | (1 | ) | | FTSE/MIB Future | | ADM | | | (104,061 | ) | | March-19 | | | 2,102 | |
| | (3 | ) | | Gasoline Future + | | ADM | | | (164,065 | ) | | February-19 | | | 15,018 | |
| | (7 | ) | | Gold 100 Oz Future + | | ADM | | | (896,910 | ) | | February-19 | | | (27,099 | ) |
| | (2 | ) | | Hang Seng Future | | ADM | | | (330,219 | ) | | January-19 | | | (1,853 | ) |
| | (4 | ) | | Japanese Yen Future | | ADM | | | (458,550 | ) | | March-19 | | | (10,018 | ) |
| | (1 | ) | | LME Aluminum Future + | | ADM | | | (46,026 | ) | | March-19 | | | 3,493 | |
| | (1 | ) | | LME Aluminum Future + | | ADM | | | (46,189 | ) | | March-19 | | | 2,020 | |
| | (1 | ) | | LME Copper Future + | | ADM | | | (149,125 | ) | | March-19 | | | 396 | |
| | (15 | ) | | Mexican Peso Future | | ADM | | | (376,950 | ) | | March-19 | | | (3,501 | ) |
| | (20 | ) | | Platinum Future + | | ADM | | | (800,600 | ) | | April-19 | | | 1,957 | |
| | (2 | ) | | S&P500 E-mini Future | | ADM | | | (250,520 | ) | | March-19 | | | (571 | ) |
| | (1 | ) | | Silver Future + | | ADM | | | (77,700 | ) | | March-19 | | | (3,709 | ) |
| | (2 | ) | | Soybean Future + | | ADM | | | (89,500 | ) | | March-19 | | | (827 | ) |
| | (3 | ) | | Wheat Future + | | ADM | | | (75,488 | ) | | March-19 | | | 802 | |
| | | | | Net Unrealized Depreciation From Open Short Futures Contracts | | | $ | (95,252 | ) |
| | | | | Total Unrealized Depreciation from Open Futures Contracts | | $ | (12,603 | ) |
| + | All or a portion of this investment is a holding of the RNW Fund, Ltd. |
See accompanying notes to consolidated financial statements.
| RATIONAL FUNDS |
| Statements of Assets and Liabilities |
| December 31, 2018 |
| | | Rational | | | Rational | | | Rational | | | Rational | |
| | | Dividend Capture | | | Hedged Return | | | Dynamic Brands | | | Strategic Allocation | |
| | | Fund | | | Fund | | | Fund | | | Fund | |
| | | | | | | | | | | | | | | | | |
| ASSETS: | | | | | | | | | | | | | | | | |
| Investments in Unaffiliated securities, at cost | | $ | 21,669,619 | | | $ | 20,303,578 | | | $ | 25,588,087 | | | $ | 50,875 | |
| Investments in Affiliated securities, at cost | | | — | | | | — | | | | — | | | | 9,886,546 | |
| Total Securities at Cost | | | 21,669,619 | | | | 20,303,578 | | | | 25,588,087 | | | | 9,937,421 | |
| | | | | | | | | | | | | | | | | |
| Investments in Unaffiliated securities, at value | | $ | 19,059,359 | | | $ | 20,303,578 | | | $ | 26,015,303 | | | $ | 50,875 | |
| Investments in Affiliated securities, at value | | | — | | | | — | | | | — | | | | 9,686,143 | |
| Total Securities at Value | | $ | 19,059,359 | | | $ | 20,303,578 | | | $ | 26,015,303 | | | $ | 9,737,018 | |
| Deposits with Brokers for options | | | 62 | | | | 16,458,888 | | | | — | | | | — | |
| Due from custodian | | | — | | | | — | | | | 110,663 | | | | — | |
| Receivable for securities sold | | | 312,138 | | | | — | | | | 4,246,282 | | | | 383,899 | |
| Receivable for Fund shares sold | | | 3,371 | | | | 72,198 | | | | 745,195 | | | | — | |
| Dividends and interest receivable | | | 80,486 | | | | 30,251 | | | | 40,466 | | | | 40,771 | |
| Tax reclaims receivable | | | 6,851 | | | | — | | | | 24,336 | | | | — | |
| Due from Advisor | | | — | | | | — | | | | — | | | | 1,520 | |
| Prepaid expenses and other assets | | | 44,573 | | | | 18,245 | | | | 43,216 | | | | 6,633 | |
| Total Assets | | | 19,506,840 | | | | 36,883,160 | | | | 31,225,461 | | | | 10,169,841 | |
| | | | | | | | | | | | | | | | | |
| LIABILITIES: | | | | | | | | | | | | | | | | |
| Options written (premiums received $0, $9,825, $0, $0) | | | — | | | | 9,825 | | | | — | | | | — | |
| Payable for securities purchased | | | — | | | | — | | | | 2,956,203 | | | | 40,690 | |
| Payable for Fund shares redeemed | | | 146,280 | | | | 34,582 | | | | 133,168 | | | | 871 | |
| Shareholder services fees payable | | | 8,503 | | | | 16,808 | | | | 4,660 | | | | 2,108 | |
| Management fees payable | | | 58,346 | | | | 39,495 | | | | 4,378 | | | | — | |
| Payable to related parties | | | 7,151 | | | | 9,483 | | | | 8,970 | | | | 3,883 | |
| Accrued 12b-1 fees | | | 4,441 | | | | 7,274 | | | | 3,429 | | | | 6,162 | |
| Trustee fees payable | | | 1,914 | | | | 2,095 | | | | 2,020 | | | | 2,050 | |
| Due to custodian | | | 27,196 | | | | 83,466 | | | | — | | | | — | |
| Accrued expenses and other liabilities | | | 19,861 | | | | 19,085 | | | | 19,880 | | | | 17,633 | |
| Total Liabilities | | | 273,692 | | | | 222,113 | | | | 3,132,708 | | | | 73,397 | |
| | | | | | | | | | | | | | | | | |
| Net Assets | | $ | 19,233,148 | | | $ | 36,661,047 | | | $ | 28,092,753 | | | $ | 10,096,444 | |
| | | | | | | | | | | | | | | | | |
| NET ASSETS CONSIST OF: | | | | | | | | | | | | | | | | |
| Paid in capital | | $ | 27,103,844 | | | $ | 38,741,551 | | | $ | 28,092,841 | | | $ | 10,397,994 | |
| Accumulated loss | | | (7,870,696 | ) | | | (2,080,504 | ) | | | (88 | ) | | | (301,550 | ) |
| Net Assets | | $ | 19,233,148 | | | $ | 36,661,047 | | | $ | 28,092,753 | | | $ | 10,096,444 | |
| | | | | | | | | | | | | | | | | |
| Institutional Shares | | | | | | | | | | | | | | | | |
| Net Assets | | $ | 4,940,298 | | | $ | 18,332,525 | | | $ | 16,724,779 | | | $ | 252,941 | |
| Shares of beneficial interest outstanding (a) | | | 751,267 | | | | 3,395,697 | | | | 489,080 | | | | 27,734 | |
| Net asset value per share | | $ | 6.58 | | | $ | 5.40 | | | $ | 34.20 | | | $ | 9.12 | |
| | | | | | | | | | | | | | | | | |
| Class A Shares | | | | | | | | | | | | | | | | |
| Net Assets | | $ | 12,628,899 | | | $ | 18,327,406 | | | $ | 11,154,238 | | | $ | 9,842,488 | |
| Shares of beneficial interest outstanding (a) | | | 1,922,773 | | | | 3,363,348 | | | | 464,755 | | | | 1,075,451 | |
| Net asset value and redemption price per share | | $ | 6.57 | | | $ | 5.45 | | | $ | 24.00 | | | $ | 9.15 | |
| Maximum offering price per share (b) | | $ | 6.90 | | | $ | 5.72 | | | $ | 25.20 | | | $ | 9.61 | |
| | | | | | | | | | | | | | | | | |
| Class C Shares | | | | | | | | | | | | | | | | |
| Net Assets | | $ | 1,663,951 | | | $ | 1,116 | | | $ | 213,736 | | | | 1,015 | |
| Shares of beneficial interest outstanding (a) | | | 253,884 | | | | 206 | | | | 9,850 | | | | 111 | |
| Net asset value, offering price and redemption price per share (c) | | $ | 6.55 | | | $ | 5.43 | (d) | | $ | 21.70 | | | $ | 9.11 | (d) |
| (a) | Unlimited number of shares of no par value beneficial interest authorized. |
| (b) | There is a maximum front-end sales charge (load) of 4.75% imposed on purchases of Class A shares for each Fund. |
| (c) | A contingent deferred sales charge (“CDSC”) of 1.00% may be charged on shares held less than 12 months. |
| (d) | Does not calculate due to rounding. |
See accompanying notes to consolidated financial statements.
| RATIONAL FUNDS |
| Statements of Assets and Liabilities |
| December 31, 2018 |
| | | Rational/ | | | Rational | | | Rational | | | Rational | |
| | | Resolve Adaptive | | | Iron Horse | | | Income Opportunities | | | NuWave Enhanced | |
| | | Asset Allocation Fund | | | Fund | | | Fund | | | Market Opportunity Fund | |
| | | (Consolidated) | | | | | | | | | | | (Consolidated) | |
| ASSETS: | | | | | | | | | | | | | | | | |
| Investments in securities, at cost | | $ | 28,525,426 | | | $ | 9,360,803 | | | $ | 4,534,175 | | | $ | 15,060,367 | |
| Total Securities at Value | | $ | 28,525,426 | | | $ | 8,724,997 | | | $ | 4,532,133 | | | $ | 14,712,195 | |
| Cash | | | 27,711 | | | | — | | | | — | | | | — | |
| Deposits with Brokers for futures and options | | | 52,488 | | | | 624,992 | | | | — | | | | 1,719,323 | |
| Due from custodian | | | 288,779 | | | | — | | | | — | | | | — | |
| Receivable for securities sold | | | — | | | | — | | | | — | | | | 2,239,848 | |
| Unrealized appreciation from open futures contracts | | | 1,093,094 | | | | — | | | | — | | | | 373,872 | |
| Receivable for Fund shares sold | | | 94,771 | | | | 222 | | | | — | | | | 900 | |
| Dividends and interest receivable | | | 49,386 | | | | 20,706 | | | | 22,418 | | | | 22,300 | |
| Due from Broker, Foreign Currency, at value (Cost - $2,416, $0, $0, $0) | | | 2,416 | | | | — | | | | — | | | | — | |
| Due from Advisor | | | — | | | | — | | | | 10,224 | | | | — | |
| Prepaid expenses and other assets | | | 19,239 | | | | 4,002 | | | | 3,502 | | | | 7,520 | |
| Total Assets | | | 30,153,310 | | | | 9,374,919 | | | | 4,568,277 | | | | 19,075,958 | |
| | | | | | | | | | | | | | | | | |
| LIABILITIES: | | | | | | | | | | | | | | | | |
| Options written (premiums received $0, $450,911, $0 and $0) | | | — | | | | 415,403 | | | | — | | | | — | |
| Payable for securities purchased | | | — | | | | — | | | | — | | | | 2,151,557 | |
| Unrealized depreciation from open futures contracts | | | 132,413 | | | | — | | | | — | | | | 386,475 | |
| Management fees payable | | | 35,043 | | | | 11,177 | | | | — | | | | 18,268 | |
| Payable to related parties | | | 8,120 | | | | 16,842 | | | | 2,700 | | | | 6,387 | |
| Trustee fees payable | | | 2,188 | | | | 2,030 | | | | 4,175 | | | | 2,215 | |
| Shareholder services fees payable | | | 3,096 | | | | 1,421 | | | | 341 | | | | 795 | |
| Accrued 12b-1 fees | | | 847 | | | | 2,130 | | | | 15 | | | | 2,763 | |
| Payable for Fund shares redeemed | | | 770 | | | | — | | | | — | | | | — | |
| Due to Broker, Foreign Currency, at value (cost $0, $0, $0 and $91,745) | | | — | | | | — | | | | — | | | | 91,627 | |
| Accrued expenses and other liabilities | | | 19,640 | | | | 6,343 | | | | 19,396 | | | | 19,657 | |
| Total Liabilities | | | 202,117 | | | | 455,346 | | | | 26,627 | | | | 2,679,744 | |
| | | | | | | | | | | | | | | | | |
| Net Assets | | $ | 29,951,193 | | | $ | 8,919,573 | | | $ | 4,541,650 | | | $ | 16,396,214 | |
| | | | | | | | | | | | | | | | | |
| NET ASSETS CONSIST OF: | | | | | | | | | | | | | | | | |
| Paid in capital | | $ | 30,538,081 | | | $ | 9,545,048 | | | $ | 4,550,202 | | | $ | 18,022,860 | |
| Accumulated Loss | | | (586,888 | ) | | | (625,475 | ) | | | (8,552 | ) | | | (1,626,646 | ) |
| Net Assets | | $ | 29,951,193 | | | $ | 8,919,573 | | | $ | 4,541,650 | | | $ | 16,396,214 | |
| | | | | | | | | | | | | | | | | |
| Institutional Shares | | | | | | | | | | | | | | | | |
| Net Assets | | $ | 27,460,395 | | | $ | 7,075,962 | | | $ | 4,530,643 | | | $ | 10,293,513 | |
| Shares of beneficial interest outstanding (a) | | | 1,188,818 | | | | 725,709 | | | | 450,894 | | | | 706,575 | |
| Net asset value per share | | $ | 23.10 | | | $ | 9.75 | | | $ | 10.05 | | | $ | 14.57 | |
| | | | | | | | | | | | | | | | | |
| Class A Shares | | | | | | | | | | | | | | | | |
| Net Assets | | $ | 2,168,911 | | | $ | 1,842,677 | | | $ | 10,004 | | | $ | 6,014,354 | |
| Shares of beneficial interest outstanding (a) | | | 94,468 | | | | 189,160 | | | | 996 | | | | 413,554 | |
| Net asset value and redemption price per share | | $ | 22.96 | | | $ | 9.74 | | | $ | 10.05 | (d) | | $ | 14.54 | |
| Maximum offering price per share (b) | | $ | 24.36 | | | $ | 10.33 | | | $ | 10.66 | | | $ | 15.43 | |
| | | | | | | | | | | | | | | | | |
| Class C Shares | | | | | | | | | | | | | | | | |
| Net Assets | | $ | 321,887 | | | $ | 934 | | | $ | 1,003 | | | $ | 88,347 | |
| Shares of beneficial interest outstanding (a) | | | 14,239 | | | | 97 | | | | 100 | | | | 6,108 | |
| Net asset value, offering price and redemption price per share (c) | | $ | 22.61 | | | $ | 9.68 | | | $ | 10.03 | | | $ | 14.47 | (d) |
| (a) | Unlimited number of shares of no par value beneficial interest authorized. |
| (b) | There is a maximum front-end sales charge (load) of 5.75% imposed on purchases of Class A shares for each Fund. |
| (c) | A contingent deferred sales charge (“CDSC”) of 1.00% may be charged on shares held less than 12 months. |
| (d) | Does not calculate due to rounding. |
See accompanying notes to consolidated financial statements.
| RATIONAL FUNDS |
| Statements of Operations |
| For the Year Ended December 31, 2018 |
| | | Rational | | | Rational | | | Rational | | | Rational | |
| | | Dividend Capture | | | Hedged Return | | | Dynamic Brands | | | Strategic Allocation | |
| | | Fund | | | Fund | | | Fund | | | Fund | |
| Investment Income: | | | | | | | | | | | | | | | | |
| Dividend income | | $ | 1,446,310 | | | $ | — | | | $ | 303,848 | | | $ | — | |
| Interest income | | | 23,624 | | | | 110,284 | | | | 36,239 | | | | 1,854 | |
| Dividend income - affiliated companies (Note 3) | | | — | | | | — | | | | — | | | | 465,287 | |
| Foreign tax withheld | | | (7,784 | ) | | | — | | | | (15,245 | ) | | | — | |
| Total Investment Income | | | 1,462,150 | | | | 110,284 | | | | 324,842 | | | | 467,141 | |
| | | | | | | | | | | | | | | | | |
| Operating Expenses: | | | | | | | | | | | | | | | | |
| Investment management fees | | | 203,731 | | | | 213,475 | | | | 177,898 | | | | 11,759 | |
| Administration fees | | | 81,999 | | | | 38,625 | | | | 72,263 | | | | 38,965 | |
| Registration fees | | | 52,414 | | | | 45,244 | | | | 56,510 | | | | 9,967 | |
| 12b-1 Fees - Class A Shares | | | 41,344 | | | | 13,379 | | | | 31,505 | | | | 28,777 | |
| 12b-1 Fees - Class C Shares | | | 22,689 | | | | 11 | | | | 2,479 | | | | 11 | |
| Mfund Services Fees | | | 23,988 | | | | 13,250 | | | | 21,441 | | | | 13,250 | |
| Legal fees | | | 8,130 | | | | 27,988 | | | | 9,089 | | | | 7,801 | |
| Audit & Tax fees | | | 10,501 | | | | 13,001 | | | | 10,526 | | | | 10,501 | |
| Compliance officer fees | | | 10,007 | | | | 11,461 | | | | 12,007 | | | | 6,767 | |
| Printing expense | | | 7,873 | | | | 7,262 | | | | 17,039 | | | | 5,447 | |
| Trustees’ fees | | | 8,439 | | | | 8,439 | | | | 8,439 | | | | 8,241 | |
| Custody fees | | | 4,980 | | | | 4,964 | | | | 4,964 | | | | 5,193 | |
| Insurance expense | | | 9,938 | | | | 1,500 | | | | 4,300 | | | | 3,402 | |
| Shareholder Services Fees - Institutional Shares | | | 36 | | | | 85 | | | | 2,187 | | | | — | |
| Shareholder Services Fees - Class A Shares | | | 1,854 | | | | 4,887 | | | | 13,238 | | | | 9,462 | |
| Shareholder Services Fees - Class C Shares | | | 700 | | | | — | | | | 100 | | | | — | |
| Miscellaneous expense | | | 1,000 | | | | 3,100 | | | | 2,960 | | | | 1,512 | |
| Total Operating Expenses | | | 489,623 | | | | 406,671 | | | | 446,945 | | | | 161,055 | |
| Less: Expenses waived/reimbursed by Advisor | | | (156,337 | ) | | | (148,732 | ) | | | (175,690 | ) | | | (79,043 | ) |
| Net Operating Expenses | | | 333,286 | | | | 257,939 | | | | 271,255 | | | | 82,012 | |
| | | | | | | | | | | | | | | | | |
| Net Investment Income (Loss) | | | 1,128,864 | | | | (147,655 | ) | | | 53,587 | | | | 385,129 | |
| | | | | | | | | | | | | | | | | |
| Realized and Unrealized Gain (Loss) on Investments: | | | | | | | | | | | | | | | | |
| Net realized gain (loss) from: | | | | | | | | | | | | | | | | |
| Investments | | | (987,579 | ) | | | 46,157 | | | | (345,508 | ) | | | — | |
| Affiliated companies | | | — | | | | — | | | | — | | | | 875,519 | |
| Options written | | | — | | | | 892,902 | | | | — | | | | — | |
| Foreign currency transactions | | | — | | | | — | | | | (3,406 | ) | | | — | |
| Net Realized Gain (Loss) | | | (987,579 | ) | | | 939,059 | | | | (348,914 | ) | | | 875,519 | |
| | | | | | | | | | | | | | | | | |
| Net change in unrealized appreciation (depreciation) on: | | | | | | | | | | | | | | | | |
| Investments | | | (2,958,528 | ) | | | — | | | | (393,541 | ) | | | — | |
| Affiliated companies | | | — | | | | — | | | | — | | | | (1,549,261 | ) |
| Options written | | | — | | | | (612 | ) | | | — | | | | — | |
| Foreign currency translations | | | — | | | | — | | | | 1,304 | | | | — | |
| Net Change in Unrealized Appreciation (Depreciation) | | | (2,958,528 | ) | | | (612 | ) | | | (392,237 | ) | | | (1,549,261 | ) |
| | | | | | | | | | | | | | | | | |
| Net Realized and Unrealized Gain (Loss) on Investments | | | (3,946,107 | ) | | | 938,447 | | | | (741,151 | ) | | | (673,742 | ) |
| | | | | | | | | | | | | | | | | |
| Net Increase (Decrease) in Net Assets Resulting From Operations | | $ | (2,817,243 | ) | | $ | 790,792 | | | $ | (687,564 | ) | | $ | (288,613 | ) |
| | | | | | | | | | | | | | | | | |
See accompanying notes to consolidated financial statements.
| Rational Funds |
| Statements of Operations (Continued) |
| For the Year or Period Ended December 31, 2018 |
| | | Rational/ | | | Rational | | | Rational | | | Rational | |
| | | Resolve Adaptive | | | Iron Horse | | | Income Opportunities | | | NuWave Enhanced | |
| | | Asset Allocation Fund | | | Fund | | | Fund (a) | | | Market Opportunity Fund (b) | |
| Investment Income: | | (Consolidated) | | | | | | | | | (Consolidated) | |
| Dividends | | $ | — | | | $ | 314,534 | | | $ | 2,137 | | | $ | 158,278 | |
| Interest | | | 281,647 | | | | 15,629 | | | | 119,657 | | | | 16,905 | |
| Foreign tax withheld | | | — | | | | (1,086 | ) | | | — | | | | (300 | ) |
| Total Investment Income | | | 281,647 | | | | 329,077 | | | | 121,794 | | | | 174,883 | |
| | | | | | | | | | | | | | | | | |
| Operating Expenses: | | | | | | | | | | | | | | | | |
| Investment management fees | | | 272,932 | | | | 160,416 | | | | 37,096 | | | | 157,366 | |
| Administrative fees | | | 52,016 | | | | 47,058 | | | | 16,197 | | | | 39,828 | |
| Legal fees | | | 24,205 | | | | 9,955 | | | | 35,917 | | | | 33,985 | |
| Audit & Tax fees | | | 13,001 | | | | 12,952 | | | | 12,935 | | | | 12,856 | |
| Registration fees | | | 32,584 | | | | 8,755 | | | | 1,340 | | | | 4,620 | |
| Mfund Services | | | 15,674 | | | | 13,603 | | | | 4,808 | | | | 10,553 | |
| Compliance officer fees | | | 11,590 | | | | 11,735 | | | | 9,009 | | | | 9,420 | |
| Printing expenses | | | 7,484 | | | | 5,992 | | | | 11,632 | | | | 9,408 | |
| Trustees’ fees | | | 8,739 | | | | 8,433 | | | | 6,364 | | | | 8,152 | |
| Custody fees | | | 5,052 | | | | 5,008 | | | | 3,455 | | | | 4,268 | |
| Shareholder Services Fees - Institutional Shares | | | 7,190 | | | | 6,051 | | | | 3,138 | | | | 174 | |
| Shareholder Services Fees - Class A Shares | | | 1,598 | | | | 2,731 | | | | 3 | | | | 1,886 | |
| Shareholder Services Fees - Class C Shares | | | — | | | | — | | | | — | | | | 19 | |
| 12b-1 Fees - Class A Shares | | | 3,817 | | | | 9,042 | | | | 7 | | | | 4,715 | |
| 12b-1 Fees - Class C Shares | | | 3,528 | | | | 15 | | | | 8 | | | | 192 | |
| Insurance Expense | | | 1,901 | | | | 4,574 | | | | — | | | | — | |
| Interest expense | | | — | | | | 838 | | | | — | | | | — | |
| Miscellaneous expense | | | 2,900 | | | | 3,300 | | | | 4,887 | | | | 4,005 | |
| Total Operating Expenses | | | 464,211 | | | | 310,458 | | | | 146,796 | | | | 301,447 | |
| Less: Expenses waived/reimbursed by Advisor | | | (148,267 | ) | | | (82,832 | ) | | | (103,260 | ) | | | (116,911 | ) |
| Net Operating Expenses | | | 315,944 | | | | 227,626 | | | | 43,536 | | | | 184,536 | |
| | | | | | | | | | | | | | | | | |
| Net Investment Income (Loss) | | | (34,297 | ) | | | 101,451 | | | | 78,258 | | | | (9,653 | ) |
| | | | | | | | | | | | | | | | | |
| Realized and Unrealized Gain (Loss) on Investments: | | | | | | | | | | | | | | | | |
| Net realized gain (loss) on: | | | | | | | | | | | | | | | | |
| Investments | | | — | | | | 268,098 | | | | 6,885 | | | | (942,995 | ) |
| Options purchased | | | — | | | | 6,446 | | | | — | | | | — | |
| Options written | | | — | | | | 104,629 | | | | — | | | | — | |
| Futures | | | (3,170,104 | ) | | | — | | | | — | | | | 1,658,834 | |
| Foreign currency translations | | | 2,187 | | | | (19 | ) | | | — | | | | 3,997 | |
| Net realized gain (Loss) on Investments | | | (3,167,917 | ) | | | 379,154 | | | | 6,885 | | | | 719,836 | |
| | | | | | | | | | | | | | | | | |
| Net change in unrealized appreciation (depreciation) on: | | | | | | | | | | | | | | | | |
| Investments | | | — | | | | (1,164,306 | ) | | | (2,042 | ) | | | (348,290 | ) |
| Options purchased | | | — | | | | 95,165 | | | | — | | | | — | |
| Options written | | | — | | | | 260,327 | | | | — | | | | — | |
| Futures | | | 753,639 | | | | — | | | | — | | | | (12,603 | ) |
| Foreign currency translations | | | (1,258 | ) | | | — | | | | — | | | | — | |
| Net change in unrealized Appreciation (Depreciation) on Investments | | | 752,381 | | | | (808,814 | ) | | | (2,042 | ) | | | (360,893 | ) |
| | | | | | | | | | | | | | | | | |
| Net Realized and Unrealized Gain (Loss) on Investments | | | (2,415,536 | ) | | | (429,660 | ) | | | 4,843 | | | | 358,943 | |
| | | | | | | | | | | | | | | | | |
| Net Increase (Decrease) in Net Assets Resulting From Operations | | $ | (2,449,833 | ) | | $ | (328,209 | ) | | $ | 83,101 | | | $ | 349,290 | |
| | | | | | | | | | | | | | | | | |
| (a) | The Rational Income Opportunities Fund commenced operations on April 23, 2018. |
| (b) | The Rational NuWave Enhanced Market Opportunity Fund commenced operations on February 28, 2018. |
See accompanying notes to consolidated financial statements.
| RATIONAL FUNDS |
| Statements of Changes in Net Assets |
| | | Rational Dividend Capture Fund | | | Rational Hedged Return Fund | | | Rational Dynamic Brands Fund | |
| | | | | | | | | | | | | | | | | | | |
| | | Year Ended | | | Year Ended | | | Year Ended | | | Year Ended | | | Year Ended | | | Year Ended | |
| | | December 31, 2018 | | | December 31, 2017 | | | December 31, 2018 | | | December 31, 2017 | | | December 31, 2018 (a) | | | December 31, 2017 | |
| Operations: | | | | | | | | | | | | | | | | | | | | | | | | |
| Net investment income (loss) | | $ | 1,128,864 | | | $ | 1,893,736 | | | $ | (147,655 | ) | | $ | 7,018 | | | $ | 53,587 | | | $ | 66,461 | |
| Net realized gain (loss) on investments, foreign currency transactions and options | | | (987,579 | ) | | | (1,191,145 | ) | | | 939,059 | | | | (446,752 | ) | | | (348,914 | ) | | | 3,948,403 | |
| Net change in unrealized appreciation (depreciation) on investments, foreign currency and options | | | (2,958,528 | ) | | | (1,767,167 | ) | | | (612 | ) | | | 501,970 | | | | (392,237 | ) | | | (1,814,832 | ) |
| Net increase (decrease) in net assets resulting from operations | | | (2,817,243 | ) | | | (1,064,576 | ) | | | 790,792 | | | | 62,236 | | | | (687,564 | ) | | | 2,200,032 | |
| | | | | | | | | | | | | | | | | | | | | | | | | |
| Distributions to Shareholders from: | | | | | | | | | | | | | | | | | | | | | | | | |
| Net investment income Institutional Class | | | — | | | | (989,645 | ) | | | — | | | | (288,135 | ) | | | — | | | | (12,183 | ) |
| Class A | | | — | | | | (1,285,544 | ) | | | — | | | | (23,635 | ) | | | — | | | | (23,935 | ) |
| Class C | | | — | | | | (121,375 | ) | | | — | | | | (46 | ) | | | — | | | | — | |
| Net realized gains Institutional Class | | | — | | | | — | | | | — | | | | — | | | | — | | | | (672,729 | ) |
| Class A | | | — | | | | — | | | | — | | | | — | | | | — | | | | (3,271,572 | ) |
| Class C | | | — | | | | — | | | | — | | | | — | | | | — | | | | (63,118 | ) |
| Total Distirbutions *: | | | | | | | | | | | | | | | | | | | | | | | | |
| Institutional Class | | | (478,049 | ) | | | — | | | | (203,124 | ) | | | — | | | | (428,009 | ) | | | — | |
| Class A | | | (991,169 | ) | | | — | | | | (221,955 | ) | | | — | | | | (378,713 | ) | | | — | |
| Class C | | | (117,415 | ) | | | — | | | | (13 | ) | | | — | | | | (7,994 | ) | | | — | |
| | | | | | | | | | | | | | | | | | | | | | | | | |
| Total distributions to shareholders | | | (1,586,633 | ) | | | (2,396,564 | ) | | | (425,092 | ) | | | (311,816 | ) | | | (814,716 | ) | | | (4,043,537 | ) |
| | | | | | | | | | | | | | | | | | | | | | | | | |
| Share Transactions of Beneficial Interest: | | | | | | | | | | | | | | | | | | | | | | | | |
| Net proceeds from shares sold | | | | | | | | | | | | | | | | | | | | | | | | |
| Institutional Class | | | 1,287,897 | | | | 7,772,041 | | | | 14,224,526 | | | | 3,600,531 | | | | 19,605,155 | | | | 1,582,646 | |
| Class A | | | 441,806 | | | | 5,502,989 | | | | 18,523,548 | | | | 37,746 | | | | 408,109 | | | | 1,077,384 | |
| Class C | | | 317,852 | | | | 2,294,150 | | | | — | | | | — | | | | 43,000 | | | | 26,885 | |
| Reinvestment of distributions | | | | | | | | | | | | | | | | | | | | | | | | |
| Institutional Class | | | 249,413 | | | | 526,395 | | | | 169,557 | | | | 267,858 | | | | 397,841 | | | | 449,117 | |
| Class A | | | 872,796 | | | | 1,093,282 | | | | 221,434 | | | | 22,544 | | | | 375,993 | | | | 3,257,155 | |
| Class C | | | 59,109 | | | | 79,162 | | | | — | | | | — | | | | 7,648 | | | | 60,077 | |
| Cost of shares redeemed | | | | | | | | | | | | | | | | | | | | | | | | |
| Institutional Class | | | (7,597,638 | ) | | | (42,489,103 | ) | | | (1,822,645 | ) | | | (2,968,575 | ) | | | (5,242,384 | ) | | | (1,908,622 | ) |
| Class A | | | (6,192,482 | ) | | | (16,438,040 | ) | | | (922,104 | ) | | | (521,604 | ) | | | (2,310,114 | ) | | | (6,131,976 | ) |
| Class C | | | (1,116,256 | ) | | | (1,032,458 | ) | | | — | | | | — | | | | (59,823 | ) | | | (218,898 | ) |
| Net increase (decrease) in net assets from share transactions of beneficial interest | | | (11,677,503 | ) | | | (42,691,582 | ) | | | 30,394,316 | | | | 438,500 | | | | 13,225,425 | | | | (1,806,232 | ) |
| | | | | | | | | | | | | | | | | | | | | | | | | |
| Total Increase (Decrease) in Net Assets | | | (16,081,379 | ) | | | (46,152,722 | ) | | | 30,760,016 | | | | 188,920 | | | | 11,723,145 | | | | (3,649,737 | ) |
| | | | | | | | | | | | | | | | | | | | | | | | | |
| Net Assets: | | | | | | | | | | | | | | | | | | | | | | | | |
| Beginning of year | | | 35,314,527 | | | | 81,467,249 | | | | 5,901,031 | | | | 5,712,111 | | | | 16,369,608 | | | | 20,019,345 | |
| End of year ** | | $ | 19,233,148 | | | $ | 35,314,527 | | | $ | 36,661,047 | | | $ | 5,901,031 | | | $ | 28,092,753 | | | $ | 16,369,608 | |
| | | | | | | | | | | | | | | | | | | | | | | | | |
| Share Activity: | | | | | | | | | | | | | | | | | | | | | | | | |
| Institutional Class | | | | | | | | | | | | | | | | | | | | | | | | |
| Shares Sold | | | 164,059 | | | | 916,685 | | | | 2,624,414 | | | | 701,403 | | | | 3,513,532 | | | | 381,274 | |
| Shares Reinvested | | | 34,067 | | | | 62,732 | | | | 31,516 | | | | 53,814 | | | | 11,823 | | | | 127,954 | |
| Shares Redeemed | | | (967,085 | ) | | | (4,964,276 | ) | | | (353,077 | ) | | | (590,442 | ) | | | (392,577 | ) | | | (483,308 | ) |
| Net increase (decrease) in shares of Beneficial interest | | | (768,959 | ) | | | (3,984,859 | ) | | | 2,302,853 | | | | 164,775 | | | | 3,132,778 | | | | 25,920 | |
| | | | | | | | | | | | | | | | | | | | | | | | | |
| Class A | | | | | | | | | | | | | | | | | | | | | | | | |
| Shares Sold | | | 56,650 | | | | 638,578 | | | | 3,402,641 | | | | 7,934 | | | | 86,604 | | | | 370,173 | |
| Shares Reinvested | | | 119,832 | | | | 132,459 | | | | 40,780 | | | | 4,491 | | | | 15,918 | | | | 1,308,094 | |
| Shares Redeemed | | | (792,612 | ) | | | (1,971,952 | ) | | | (169,281 | ) | | | (109,905 | ) | | | (716,629 | ) | | | (2,068,271 | ) |
| Net increase (decrease) in shares of Beneficial interest | | | (616,130 | ) | | | (1,200,915 | ) | | | 3,274,140 | | | | (97,480 | ) | | | (614,107 | ) | | | (390,004 | ) |
| | | | | | | | | | | | | | | | | | | | | | | | | |
| Class C | | | | | | | | | | | | | | | | | | | | | | | | |
| Shares Sold | | | 39,694 | | | | 272,289 | | | | — | | | | — | | | | 17,703 | | | | 9,605 | |
| Shares Reinvested | | | 8,148 | | | | 9,709 | | | | — | | | | — | | | | 357 | | | | 26,465 | |
| Shares Redeemed | | | (144,460 | ) | | | (123,559 | ) | | | — | | | | — | | | | (20,908 | ) | | | (79,109 | ) |
| Net increase (decrease) in shares of Beneficial interest | | | (96,618 | ) | | | 158,439 | | | | — | | | | — | | | | (2,848 | ) | | | (43,039 | ) |
| (a) | Effective September 21, 2018, the Fund had a one-for-ten reverse stock split. Per share amount for the periods have been adjusted to give effect to the one-for-ten stock split. This transaction did not change the net assets of the Fund or the value of a shareholders investment. |
| * | Distributions from net investment income and net realized gains are combined for the year ended December 31, 2018. See “New Accounting Pronouncements” in the Notes to Financial Statements for more information. The dividends and distributions to shareholders for the year ended December 31, 2017 have not been reclassified to conform to the current year presentation. |
| ** | Net Assets - End of Year includes distributions in excess of net investment income of $1,556,565 for Dividend Capture, $0 for Hedged Return and $11 for Dynamic Brands as of December 31, 2017. |
See accompanying notes to consolidated financial statements.
| RATIONAL FUNDS |
| Statements of Changes in Net Assets (Continued) |
| | | | | | | | | Rational/Resolve Adaptive | |
| | | Rational Strategic Allocation Fund | | | Asset Allocation Fund | |
| | | | | | | | | (Consolidated) | |
| | | | | | | | | | | | | |
| | | Year Ended | | | Year Ended | | | Year Ended | | | Year Ended | |
| | | December 31, 2018 | | | December 31 ,2017 | | | December 31, 2018 | | | December 31, 2017 | |
| Operations: | | | | | | | | | | | | | | | | |
| Net investment income (loss) | | $ | 385,129 | | | $ | 370,981 | | | $ | (34,297 | ) | | $ | (302,305 | ) |
| Net realized gain (loss) on investments, affiliated companies foreign currency transactions and futures | | | 875,519 | | | | 424,104 | | | | (3,167,917 | ) | | | 314,183 | |
| Net change in unrealized appreciation (depreciation) on investments, affiliated companies, foreign currency transactions and futures | | | (1,549,261 | ) | | | 756,042 | | | | 752,381 | | | | 353,378 | |
| Net increase (decrease) in net assets resulting from operations | | | (288,613 | ) | | | 1,551,127 | | | | (2,449,833 | ) | | | 365,256 | |
| | | | | | | | | | | | | | | | | |
| Distributions to Shareholders: | | | | | | | | | | | | | | | | |
| Net investment income | | | | | | | | | | | | | | | | |
| Institutional Class | | | — | | | | (12,888 | ) | | | — | | | | — | |
| Class A | | | — | | | | (558,213 | ) | | | — | | | | — | |
| Class C | | | — | | | | (41 | ) | | | — | | | | — | |
| Net realized gains | | | | | | | | | | | | | | | | |
| Institutional Class | | | — | | | | — | | | | — | | | | (3,940 | ) |
| Class A | | | — | | | | — | | | | — | | | | (88 | ) |
| Class C | | | — | | | | — | | | | — | | | | (253 | ) |
| Total Distributions Paid *: | | | | | | | | | | | | | | | | |
| Institutional Class | | | (17,203 | ) | | | — | | | | (259,063 | ) | | | — | |
| Class A | | | (626,995 | ) | | | — | | | | (24,070 | ) | | | — | |
| Class C | | | (60 | ) | | | — | | | | (3,052 | ) | | | — | |
| | | | | | | | | | | | | | | | | |
| Total distributions to shareholders | | | (644,258 | ) | | | (571,142 | ) | | | (286,185 | ) | | | (4,281 | ) |
| | | | | | | | | | | | | | | | | |
| Share Transactions of Beneficial Interest: | | | | | | | | | | | | | | | | |
| Net proceeds from shares sold | | | | | | | | | | | | | | | | |
| Institutional Class | | | — | | | | — | | | | 32,052,345 | | | | 13,429,916 | |
| Class A | | | 87,663 | | | | 268,744 | | | | 3,063,423 | | | | 190,591 | |
| Class C | | | — | | | | — | | | | 13,300 | | | | 366,650 | |
| Reinvestment of distributions | | | | | | | | | | | | | | | | |
| Institutional Class | | | — | | | | — | | | | 227,156 | | | | 3,584 | |
| Class A | | | 612,488 | | | | 537,573 | | | | 18,336 | | | | 88 | |
| Class C | | | — | | | | — | | | | 1,459 | | | | 249 | |
| Cost of shares redeemed | | | | | | | | | | | | | | | | |
| Institutional Class | | | — | | | | — | | | | (8,292,969 | ) | | | (22,982,145 | ) |
| Class A | | | (2,983,034 | ) | | | (3,557,145 | ) | | | (747,477 | ) | | | (62,720 | ) |
| Class C | | | — | | | | — | | | | (32,231 | ) | | | (28,487 | ) |
| Net increase (decrease) in net assets from share transactions of beneficial interest | | | (2,282,883 | ) | | | (2,750,828 | ) | | | 26,303,342 | | | | (9,082,274 | ) |
| | | | | | | | | | | | | | | | | |
| Total Increase (Decrease) in Net Assets | | | (3,215,754 | ) | | | (1,770,843 | ) | | | 23,567,324 | | | | (8,721,299 | ) |
| | | | | | | | | | | | | | | | | |
| Net Assets: | | | | | | | | | | | | | | | | |
| Beginning of year/period | | | 13,312,198 | | | | 15,083,041 | | | | 6,383,869 | | | | 15,105,168 | |
| End of year/period** | | $ | 10,096,444 | | | $ | 13,312,198 | | | $ | 29,951,193 | | | $ | 6,383,869 | |
| | | | | | | | | | | | | | | | | |
| Share Activity: | | | | | | | | | | | | | | | | |
| Institutional Class | | | | | | | | | | | | | | | | |
| Shares Sold | | | — | | | | — | | | | 1,279,419 | | | | 558,352 | |
| Shares Reinvested | | | — | | | | — | | | | 9,972 | | | | 144 | |
| Shares Redeemed | | | — | | | | — | | | | (333,537 | ) | | | (945,508 | ) |
| | | | | | | | | | | | | | | | | |
| Net increase (decrease) in shares of Beneficial interest | | | — | | | | — | | | | 955,854 | | | | (387,012 | ) |
| | | | | | | | | | | | | | | | | |
| Class A | | | | | | | | | | | | | | | | |
| Shares Sold | | | 8,684 | | | | 27,400 | | | | 120,292 | | | | 7,741 | |
| Shares Reinvested | | | 65,358 | | | | 53,572 | | | | 810 | | | | 4 | |
| Shares Redeemed | | | (295,197 | ) | | | (360,962 | ) | | | (31,801 | ) | | | (2,618 | ) |
| | | | | | | | | | | | | | | | | |
| Net increase (decrease) in shares of Beneficial interest | | | (221,155 | ) | | | (279,990 | ) | | | 89,301 | | | | 5,127 | |
| | | | | | | | | | | | | | | | | |
| Class C | | | | | | | | | | | | | | | | |
| Shares Sold | | | — | | | | — | | | | 545 | | | | 15,226 | |
| Shares Reinvested | | | — | | | | — | | | | 65 | | | | 10 | |
| Shares Redeemed | | | — | | | | — | | | | (1,245 | ) | | | (1,218 | ) |
| | | | | | | | | | | | | | | | | |
| Net increase (decrease) in shares of Beneficial interest | | | — | | | | — | | | | (635 | ) | | | 14,018 | |
| * | Distributions from net investment income and net realized gains are combined for the year ended December 31, 2018. See “New Accounting Pronouncements” in the Notes to Financial Statements for more information. The dividends and distributions to shareholders for the year ended December 31, 2017 have not been reclassified to conform to the current year presentation. |
| ** | Net Assets - End of Year includes distributions in excess of net investment income of $0 for Strategic Allocation and $0 for Resolve/Adaptive Asset Allocation as of December 31, 2017. |
See accompanying notes to consolidated financial statements.
| RATIONAL FUNDS |
| Statements of Changes in Net Assets (Continued) |
| | | | | | | | | | | | | | | Rational NuWave | |
| | | | | | | | | | | | Rational Income | | | Enhanced Market | |
| | | Rational Iron Horse Fund | | | Opportunities Fund | | | Opportunity Fund | |
| | | | | | | | | | | | | | | (Consolidated) | |
| | | | | | | | | | | | | | | | |
| | | Year Ended | | | Period Ended | | | Year Ended | | | Period Ended | | | Period Ended | |
| | | December 31, 2018 | | | December 31, 2017 (a) | | | March 31, 2017 | | | December 31, 2018 (b) | | | December 31, 2018 (c) | |
| Operations: | | | | | | | | | | | | | | | | | | | | |
| Net investment income (loss) | | $ | 101,451 | | | $ | 56,154 | | | $ | 56,340 | | | $ | 78,258 | | | $ | (9,653 | ) |
| Net realized gain on investments, options and futures | | | 379,154 | | | | 819,842 | | | | 1,156,779 | | | | 6,885 | | | | 719,836 | |
| Net change in unrealized appreciation (depreciation) on investments, options and futures and foreign currency translations | | | (808,814 | ) | | | 126,331 | | | | (426,936 | ) | | | (2,042 | ) | | | (360,893 | ) |
| Net increase (decrease) in net assets resulting from operations | | | (328,209 | ) | | | 1,002,327 | | | | 786,183 | | | | 83,101 | | | | 349,290 | |
| | | | | | | | | | | | | | | | | | | | | |
| Distributions to Shareholders: | | | | | | | | | | | | | | | | | | | | |
| Net investment income | | | | | | | | | | | | | | | | | | | | |
| Institutional Class | | | — | | | | (36,807 | ) | | | (24,918 | ) | | | — | | | | — | |
| Class A | | | — | | | | (13,428 | ) | | | (22,982 | ) | | | — | | | | — | |
| Net realized gains | | | | | | | | | | | | | | | | | | | | |
| Institutional Class | | | — | | | | — | | | | (18,085 | ) | | | — | | | | — | |
| Class A | | | — | | | | — | | | | (4,175 | ) | | | — | | | | — | |
| From return of capital: | | | | | | | | | | | | | | | | | | | — | |
| Institutional Class | | | (310,714 | ) | | | (336,601 | ) | | | (105,653 | ) | | | — | | | | — | |
| Class A | | | (81,022 | ) | | | (280,475 | ) | | | (97,445 | ) | | | — | | | | — | |
| Class C | | | (37 | ) | | | (32 | ) | | | — | | | | — | | | | — | |
| Total Distributions *: | | | | | | | | | | | | | | | | | | | — | |
| Institutional Class | | | (306,098 | ) | | | — | | | | — | | | | (96,702 | ) | | | (1,204,517 | ) |
| Class A | | | (138,365 | ) | | | — | | | | — | | | | (139 | ) | | | (781,059 | ) |
| Class C | | | (28 | ) | | | — | | | | — | | | | (16 | ) | | | (10,124 | ) |
| | | | | | | | | | | | | | | | | | | | | |
| Total distributions to shareholders | | | (836,264 | ) | | | (667,343 | ) | | | (273,258 | ) | | | (96,857 | ) | | | (1,995,700 | ) |
| | | | | | | | | | | | | | | | | | | | | |
| Share Transactions of Beneficial Interest: | | | | | | | | | | | | | | | | | | | | |
| Net proceeds from shares sold | | | | | | | | | | | | | | | | | | | | |
| Institutional Class | | | 2,832,137 | | | | 4,935,940 | | | | 3,171,859 | | | | 5,059,349 | | | | 9,773,875 | |
| Class A | | | 376,818 | | | | 8,662,420 | | | | 1,028,585 | | | | 11,008 | | | | 86,000 | |
| Class C | | | — | | | | 1,000 | | | | — | | | | 1,000 | | | | 7,451,437 | |
| Reinvestment of distributions | | | | | | | | | | | | | | | | | | | | |
| Institutional Class | | | 588,134 | | | | 344,052 | | | | 145,704 | | | | 68,219 | | | | 1,058,291 | |
| Class A | | | 208,983 | | | | 294,399 | | | | 122,367 | | | | 71 | | | | 781,058 | |
| Class C | | | — | | | | — | | | | — | | | | — | | | | 9,999 | |
| Cost of shares redeemed | | | | | | | | | | | | | | | | | | | | |
| Institutional Class | | | (6,463,987 | ) | | | (3,111,465 | ) | | | (4,481,169 | ) | | | (583,225 | ) | | | (28,816 | ) |
| Class A | | | (5,139,300 | ) | | | (6,107,098 | ) | | | (5,688,374 | ) | | | (1,016 | ) | | | (1,089,220 | ) |
| Class C | | | — | | | | — | | | | — | | | | — | | | | — | |
| Net increase (decrease) in net assets from share transactions of beneficial interest | | | (7,597,215 | ) | | | 5,019,248 | | | | (5,701,028 | ) | | | 4,555,406 | | | | 18,042,624 | |
| | | | | | | | | | | | | | | | | | | | | |
| Total Increase (Decrease) in Net Assets | | | (8,761,688 | ) | | | 5,354,232 | | | | (5,188,103 | ) | | | 4,541,650 | | | | 16,396,214 | |
| | | | | | | | | | | | | | | | | | | | | |
| Net Assets: | | | | | | | | | | | | | | | | | | | | |
| Beginning of year/period | | | 17,681,261 | | | | 12,327,029 | | | | 17,515,132 | | | | — | | | | — | |
| End of year/period** | | $ | 8,919,573 | | | $ | 17,681,261 | | | $ | 12,327,029 | | | $ | 4,541,650 | | | $ | 16,396,214 | |
| | | | | | | | | | | | | | | | | | | | | |
| Share Activity: | | | | | | | | | | | | | | | | | | | | |
| Institutional Class | | | | | | | | | | | | | | | | | | | | |
| Shares Sold | | | 281,109 | | | | 466,405 | | | | 313,182 | | | | 501,666 | | | | 635,024 | |
| Shares Reinvested | | | 59,599 | | | | 32,642 | | | | 14,601 | | | | 6,743 | | | | 73,390 | |
| Shares Redeemed | | | (646,867 | ) | | | (295,816 | ) | | | (442,582 | ) | | | (57,515 | ) | | | (1,839 | ) |
| Net increase (decrease) in shares of Beneficial interest | | | (306,159 | ) | | | 203,231 | | | | (114,799 | ) | | | 450,894 | | | | 706,575 | |
| | | | | | | | | | | | | | | | | | | | | |
| Class A | | | | | | | | | | | | | | | | | | | | |
| Shares Sold | | | 36,212 | | | | 832,098 | | | | 101,646 | | | | 1,090 | | | | 431,998 | |
| Shares Reinvested | | | 21,020 | | | | 27,975 | | | | 12,274 | | | | 6 | | | | 54,278 | |
| Shares Redeemed | | | (508,633 | ) | | | (579,845 | ) | | | (565,216 | ) | | | (100 | ) | | | (72,722 | ) |
| Net increase (decrease) in shares of Beneficial interest | | | (451,401 | ) | | | 280,228 | | | | (451,296 | ) | | | 996 | | | | 413,554 | |
| | | | | | | | | | | | | | | | | | | | | |
| Class C | | | | | | | | | | | | | | | | | | | | |
| Shares Sold | | | — | | | | 97 | | | | — | | | | 100 | | | | 5,409 | |
| Shares Reinvested | | | — | | | | — | | | | — | | | | — | | | | 699 | |
| Shares Redeemed | | | — | | | | — | | | | — | | | | — | | | | — | |
| Net increase in shares of Beneficial interest | | | — | | | | 97 | | | | — | | | | 100 | | | | 6,108 | |
| (a) | Class C launched April 7, 2017 |
| (b) | The Rational Income Opportunities Fund launced April 23, 2018. |
| (c) | The Rational NuWave Enhanced Market Opportunity Fund launched February 28, 2018. |
| * | Distributions from net investment income and net realized gains are combined for the year or period ended December 31, 2018. See “New Accounting Pronouncements” in the Notes to Financial Statements for more information. The dividends and distributions to shareholders for the year ended December 31, 2017 have not been reclassified to conform to the current year presentation. |
| ** | Net Assets - End of Year includes distributions in excess of net investment income of $2,488 and $480 for Iron Horse as of December 31, 2017 and March 31, 2017. |
See accompanying notes to consolidated financial statements.
| RATIONAL FUNDS |
| Rational Dividend Capture Fund |
| Financial Highlights |
For a Share Outstanding Throughout Each Year
| | | Institutional Class | |
| | | For the | | | For the | | | For the | | | For the | | | For the | |
| | | Year Ended | | | Year Ended | | | Year Ended | | | Year Ended | | | Year Ended | |
| | | December 31, | | | December 31, | | | December 31, | | | December 31, | | | December 31, | |
| | | 2018 | | | 2017 | | | 2016 | | | 2015 | | | 2014 | |
| | | | | | | | | | | | | | | | | | | | | |
| Net asset value, beginning of year | | $ | 8.02 | | | $ | 8.64 | | | $ | 8.41 | | | $ | 10.01 | | | $ | 10.74 | |
| INCOME (LOSS) FROM INVESTMENT OPERATIONS: | | | | | | | | | | | | | | | | | | | | |
| Net investment income | | | 0.34 | (A) | | | 0.30 | (A) | | | 0.29 | (A) | | | 0.36 | | | | 0.39 | |
| Net realized and unrealized gain (loss) on investments | | | (1.26 | ) | | | (0.47 | ) | | | 0.22 | | | | (0.67 | ) | | | 0.64 | |
| Total from investment operations | | | (0.92 | ) | | | (0.17 | ) | | | 0.51 | | | | (0.31 | ) | | | 1.03 | |
| LESS DISTRIBUTIONS: | | | | | | | | | | | | | | | | | | | | |
| From net investment income | | | (0.52 | ) | | | (0.45 | ) | | | (0.26 | ) | | | (0.35 | ) | | | (0.41 | ) |
| From net realized gains on investments | | | — | | | | — | | | | (0.02 | ) | | | (0.94 | ) | | | (1.35 | ) |
| Total distributions | | | (0.52 | ) | | | (0.45 | ) | | | (0.28 | ) | | | (1.29 | ) | | | (1.76 | ) |
| Net asset value, end of year | | $ | 6.58 | | | $ | 8.02 | | | $ | 8.64 | | | $ | 8.41 | | | $ | 10.01 | |
| Total return (B) | | | (11.96 | )% | | | (1.99 | )% | | | 6.15 | % | | | (3.25 | )% | | | 9.59 | % |
| RATIOS/SUPPLEMENTAL DATA: | | | | | | | | | | | | | | | | | | | | |
| Net assets, end of year (in 000’s) | | $ | 4,940 | | | $ | 12,188 | | | $ | 47,544 | | | $ | 57,752 | | | $ | 132,177 | |
| Ratios to average net assets | | | | | | | | | | | | | | | | | | | | |
| Expenses, before waiver and reimbursement | | | 1.58 | % | | | 1.33 | % | | | 1.42 | % | | | 1.47 | % | | | 1.38 | % |
| Expenses, net waiver and reimbursement | | | 1.00 | % | | | 1.00 | % | | | 1.00 | % | | | 0.89 | % | | | 0.88 | % |
| Net investment income | | | 4.32 | % | | | 3.53 | % | | | 3.37 | % | | | 3.37 | % | | | 3.22 | % |
| Portfolio turnover rate | | | 307 | % | | | 224 | % | | | 159 | % | | | 92 | % | | | 92 | % |
| | | | | | | | | | | | | | | | | | | | | |
| | | | | | | | | | | | | | | | | | | | | |
| | | Class A | |
| | | For the | | | For the | | | For the | | | For the | | | For the | |
| | | Year Ended | | | Year Ended | | | Year Ended | | | Year Ended | | | Year Ended | |
| | | December 31, | | | December 31, | | | December 31, | | | December 31, | | | December 31, | |
| | | 2018 | | | 2017 | | | 2016 | | | 2015 | | | 2014 | |
| | | | | | | | | | | | | | | | |
| Net asset value, beginning of year | | $ | 8.01 | | | $ | 8.63 | | | $ | 8.40 | | | $ | 10.01 | | | $ | 10.73 | |
| INCOME (LOSS) FROM INVESTMENT OPERATIONS: | | | | | | | | | | | | | | | | | | | | |
| Net investment income | | | 0.32 | (A) | | | 0.30 | (A) | | | 0.27 | (A) | | | 0.31 | | | | 0.34 | |
| Net realized and unrealized gain (loss) on investments | | | (1.26 | ) | | | (0.49 | ) | | | 0.22 | | | | (0.66 | ) | | | 0.67 | |
| Total from investment operations | | | (0.94 | ) | | | (0.19 | ) | | | 0.49 | | | | (0.35 | ) | | | 1.01 | |
| LESS DISTRIBUTIONS: | | | | | | | | | | | | | | | | | | | | |
| From net investment income | | | (0.50 | ) | | | (0.43 | ) | | | (0.24 | ) | | | (0.32 | ) | | | (0.38 | ) |
| From net realized gains on investments | | | — | | | | — | | | | (0.02 | ) | | | (0.94 | ) | | | (1.35 | ) |
| Total distributions | | | (0.50 | ) | | | (0.43 | ) | | | (0.26 | ) | | | (1.26 | ) | | | (1.73 | ) |
| Net asset value, end of year | | $ | 6.57 | | | $ | 8.01 | | | $ | 8.63 | | | $ | 8.40 | | | $ | 10.01 | |
| Total return (B) | | | (12.22 | )% | | | (2.24 | )% | | | 5.89 | % | | | (3.60 | )% | | | 9.45 | % |
| RATIOS/SUPPLEMENTAL DATA: | | | | | | | | | | | | | | | | | | | | |
| Net assets, end of year (in 000’s) | | $ | 12,629 | | | $ | 20,327 | | | $ | 32,269 | | | $ | 39,610 | | | $ | 66,445 | |
| Ratios to average net assets | | | | | | | | | | | | | | | | | | | | |
| Expenses, before waiver and reimbursement | | | 1.82 | % | | | 1.57 | % | | | 1.67 | % | | | 1.72 | % | | | 1.63 | % |
| Expenses, net waiver and reimbursement | | | 1.25 | % | | | 1.25 | % | | | 1.25 | % | | | 1.14 | % | | | 1.13 | % |
| Net investment income | | | 4.17 | % | | | 3.52 | % | | | 3.12 | % | | | 3.14 | % | | | 3.01 | % |
| Portfolio turnover rate | | | 307 | % | | | 224 | % | | | 159 | % | | | 92 | % | | | 92 | % |
| (A) | Per share amounts calculated using average shares method, which more appropriately presents the per share data for the year. |
| (B) | Total return in the above table represents the rate that the investor would have earned or lost on an investment in the Fund assuming reinvestment of dividends and does not reflect the impact of sales charges. Had the Advisor not waived its fees and reimbursed expenses, total return would have been lower. |
See accompanying notes to financial statements.
| RATIONAL FUNDS |
| Rational Dividend Capture Fund (Continued) |
| Financial Highlights |
For a Share Outstanding Throughout Each Year/Period
| | | Class C | |
| | | For the | | | For the | | | For the | | | For the | | | For the | |
| | | Year Ended | | | Year Ended | | | Year Ended | | | Year Ended | | | Period Ended | |
| | | December 31, | | | December 31, | | | December 31, | | | December 31, | | | December 31, | |
| | | 2018 | | | 2017 | | | 2016 | | | 2015 | | | 2014 (A) | |
| | | | | | | | | | | | | | | | | | | | | |
| Net asset value, beginning of year/period | | $ | 7.99 | | | $ | 8.61 | | | $ | 8.38 | | | $ | 9.99 | | | $ | 10.67 | |
| INCOME (LOSS) FROM INVESTMENT OPERATIONS: | | | | | | | | | | | | | | | | | | | | |
| Net investment income | | | 0.27 | (B) | | | 0.29 | (B) | | | 0.22 | (B) | | | 0.27 | | | | 0.32 | |
| Net realized and unrealized gain (loss) on investments | | | (1.27 | ) | | | (0.52 | ) | | | 0.22 | | | | (0.66 | ) | | | 0.70 | |
| Total from investment operations | | | (1.00 | ) | | | (0.23 | ) | | | 0.44 | | | | (0.39 | ) | | | 1.02 | |
| LESS DISTRIBUTIONS: | | | | | | | | | | | | | | | | | | | | |
| From net investment income | | | (0.44 | ) | | | (0.39 | ) | | | (0.19 | ) | | | (0.28 | ) | | | (0.35 | ) |
| From net realized gains on investments | | | — | | | | — | | | | (0.02 | ) | | | (0.94 | ) | | | (1.35 | ) |
| Total distributions | | | (0.44 | ) | | | (0.39 | ) | | | (0.21 | ) | | | (1.22 | ) | | | (1.70 | ) |
| Net asset value, end of year/period | | $ | 6.55 | | | $ | 7.99 | | | $ | 8.61 | | | $ | 8.38 | | | $ | 9.99 | |
| Total return (C) | | | (12.92 | )% (D) | | | (2.68 | )% | | | 5.34 | % | | | (4.08 | )% | | | 9.54 | % (E) |
| RATIOS/SUPPLEMENTAL DATA: | | | | | | | | | | | | | | | | | | | | |
| Net assets, end of period (in 000’s) | | $ | 1,664 | | | $ | 2,799 | | | $ | 1,654 | | | $ | 2,335 | | | $ | 4,154 | |
| Ratios to average net assets | | | | | | | | | | | | | | | | | | | | |
| Expenses, before waiver and reimbursement | | | 2.59 | % | | | 2.31 | % | | | 2.17 | % | | | 2.22 | % | | | 2.16 | % (F) |
| Expenses, net waiver and reimbursement | | | 1.90 | % | | | 1.75 | % | | | 1.75 | % | | | 1.64 | % | | | 1.63 | % (F) |
| Net investment income | | | 3.52 | % | | | 3.50 | % | | | 2.61 | % | | | 2.64 | % | | | 2.69 | % (F) |
| Portfolio turnover rate | | | 307 | % | | | 224 | % | | | 159 | % | | | 92 | % | | | 92 | % (E) |
| (A) | The Rational Dividend Capture Fund Class C shares commenced operations on January 3, 2014. |
| (B) | Per share amounts calculated using average shares method, which more appropriately presents the per share data for the year/period. |
| (C) | Total return in the above table represents the rate that the investor would have earned or lost on an investment in the Fund assuming reinvestment of dividends. Had the Advisor not waived its fees and reimbursed expenses, total return would have been lower. |
| (D) | Includes adjustments in accordance with accounting principles generally accepted in the United States and, consequently, the net asset value for financial reporting purposes and the returns based upon those net asset values may differ from the net asset values and returns for shareholder transactions. |
See accompanying notes to financial statements.
| RATIONAL FUNDS |
| Rational Hedged Return Fund |
| Financial Highlights |
For a Share Outstanding Throughout Each Year
| | | Institutional Class | |
| | | For the | | | For the | | | For the | | | For the | | | For the | |
| | | Year Ended | | | Year Ended | | | Year Ended | | | Year Ended | | | Year Ended | |
| | | December 31, | | | December 31, | | | December 31, | | | December 31, | | | December 31, | |
| | | 2018 | | | 2017 | | | 2016 | | | 2015 | | | 2014 | |
| | | | | | | | | | | | | | | | | | | | | |
| Net asset value, beginning of year | | $ | 4.99 | | | $ | 5.12 | | | $ | 5.39 | | | $ | 6.73 | | | $ | 8.05 | |
| INCOME (LOSS) FROM INVESTMENT OPERATIONS: | | | | | | | | | | | | | | | | | | | | |
| Net investment income (loss) | | | (0.06 | ) (A) | | | 0.01 | (A) | | | 0.06 | (A) | | | 0.19 | | | | 0.13 | |
| Net realized and unrealized gain (loss) on investments | | | 0.55 | | | | 0.14 | | | | 0.37 | | | | (1.32 | ) | | | (1.35 | ) |
| Total from investment operations | | | 0.49 | | | | 0.15 | | | | 0.43 | | | | (1.13 | ) | | | (1.22 | ) |
| LESS DISTRIBUTIONS: | | | | | | | | | | | | | | | | | | | | |
| From net investment income | | | (0.01 | ) | | | (0.28 | ) | | | (0.70 | ) | | | (0.26 | ) | | | (0.10 | ) |
| From net realized gains on investments | | | (0.07 | ) | | | — | | | | — | | | | — | | | | — | |
| Total distributions | | | (0.08 | ) | | | (0.28 | ) | | | (0.70 | ) | | | (0.26 | ) | | | (0.10 | ) |
| From capital contributions from Advisor | | | — | | | | — | | | | — | | | | 0.05 | | | | — | |
| Net asset value, end of year | | $ | 5.40 | | | $ | 4.99 | | | $ | 5.12 | | | $ | 5.39 | | | $ | 6.73 | |
| Total return (B) | | | 9.66 | % | | | 2.89 | % (D) | | | 7.82 | % (D) | | | (16.05 | )% (C) | | | (15.03 | )% |
| RATIOS/SUPPLEMENTAL DATA: | | | | | | | | | | | | | | | | | | | | |
| Net assets, end of year (in 000’s) | | $ | 18,333 | | | $ | 5,451 | | | $ | 4,747 | | | $ | 6,032 | | | $ | 29,453 | |
| Ratios to average net assets | | | | | | | | | | | | | | | | | | | | |
| Expenses, before wavier and reimbursement | | | 3.16 | % | | | 4.29 | % | | | 2.61 | % | | | 2.49 | % | | | 1.52 | % |
| Expenses, net waiver and reimbursement | | | 1.99 | % | | | 1.17 | % | | | 1.00 | % | | | 1.07 | % | | | 1.04 | % |
| Net investment income (loss) | | | (1.20 | )% | | | 0.22 | % | | | 1.07 | % | | | 2.99 | % | | | 1.53 | % |
| Portfolio turnover rate | | | 0 | % | | | 199 | % | | | 246 | % | | | 13 | % | | | 31 | % |
| | | | | | | | | | | | | | | | | | | | | |
| | | | | | | | | | | | | | | | | | | | | |
| | | Class A | |
| | | For the | | | For the | | | For the | | | For the | | | For the | |
| | | Year Ended | | | Year Ended | | | Year Ended | | | Year Ended | | | Year Ended | |
| | | December 31, | | | December 31, | | | December 31, | | | December 31, | | | December 31, | |
| | | 2018 | | | 2017 | | | 2016 | | | 2015 | | | 2014 | |
| | | | | | | | | | | | | | | | | | | | | |
| Net asset value, beginning of year | | $ | 5.04 | | | $ | 5.16 | | | $ | 5.43 | | | $ | 6.73 | | | $ | 8.05 | |
| INCOME (LOSS) FROM INVESTMENT OPERATIONS: | | | | | | | | | | | | | | | | | | | | |
| Net investment income (loss) | | | (0.07 | ) (A) | | | 0.01 | (A) | | | 0.05 | (A) | | | 0.19 | | | | 0.10 | |
| Net realized and unrealized gain (loss) on investments | | | 0.55 | | | | 0.14 | | | | 0.37 | | | | (1.30 | ) | | | (1.33 | ) |
| Total from investment operations | | | 0.48 | | | | 0.15 | | | | 0.42 | | | | (1.11 | ) | | | (1.23 | ) |
| LESS DISTRIBUTIONS: | | | | | | | | | | | | | | | | | | | | |
| From net investment income | | | (0.00 | ) (E) | | | (0.27 | ) | | | (0.69 | ) | | | (0.24 | ) | | | (0.09 | ) |
| From net realized gains on investments | | | (0.07 | ) | | | — | | | | — | | | | — | | | | — | |
| Total distributions | | | (0.07 | ) | | | (0.27 | ) | | | (0.69 | ) | | | (0.24 | ) | | | (0.09 | ) |
| From capital contributions from Advisor | | | — | | | | — | | | | — | | | | 0.05 | | | | — | |
| Net asset value, end of year | | $ | 5.45 | | | $ | 5.04 | | | $ | 5.16 | | | $ | 5.43 | | | $ | 6.73 | |
| Total return (B) | | | 9.45 | % | | | 2.98 | % (D) | | | 7.48 | % (D) | | | (15.75 | )% (C) | | | (15.23 | )% |
| RATIOS/SUPPLEMENTAL DATA: | | | | | | | | | | | | | | | | | | | | |
| Net assets, end of year (in 000’s) | | $ | 18,327 | | | $ | 449 | | | $ | 964 | | | $ | 979 | | | $ | 1,656 | |
| Ratios to average net assets | | | | | | | | | | | | | | | | | | | | |
| Expenses, before wavier and reimbursement | | | 3.50 | % | | | 4.54 | % | | | 2.86 | % | | | 2.74 | % | | | 1.77 | % |
| Expenses, net waiver and reimbursement | | | 2.24 | % | | | 1.35 | % | | | 1.25 | % | | | 1.32 | % | | | 1.29 | % |
| Net investment income (loss) | | | (1.20 | )% | | | 0.19 | % | | | 0.92 | % | | | 3.10 | % | | | 1.21 | % |
| Portfolio turnover rate | | | 0 | % | | | 199 | % | | | 246 | % | | | 13 | % | | | 31 | % |
| (A) | Per share amounts calculated using average shares method, which more appropriately presents the per share data for the year. |
| (B) | Total return in the above table represents the rate that the investor would have earned or lost on an investment in the Fund assuming reinvestment of dividends and does not reflect the impact of sales charges. Had the Advisor not waived its fees and reimbursed expenses, total return would have been lower. |
| (C) | Includes the impact of a contribution from the Advisor. Without such contribution, the returns would have been (16.98)% for Institutional Shares and (16.68)% for Class A Shares. |
| (D) | Includes adjustments in accordance with accounting principles generally accepted in the United States and, consequently, the net asset value for financial reporting purposes and the returns based upon those net asset values m asset values and returns for shareholder transactions. |
| (E) | Amount is less than $0.005. |
See accompanying notes to financial statements.
| RATIONAL FUNDS |
| Rational Hedged Return Fund (Continued) |
| Financial Highlights |
For a Share Outstanding Throughout Each Year/Period
| | | Class C | |
| | | For the | | | For the | | | For the | |
| | | Year Ended | | | Year Ended | | | Period Ended | |
| | | December 31, | | | December 31, | | | December 31, | |
| | | 2018 | | | 2017 | | | 2016(A) | |
| | | | | | | | | | | | | |
| Net asset value, beginning of year/period | | $ | 5.06 | | | $ | 5.16 | | | $ | 5.49 | |
| LOSS FROM INVESTMENT OPERATIONS: | | | | | | | | | | | | |
| Net investment income (loss) (B) | | | (0.12 | ) | | | (0.03 | ) | | | 0.00 | (C) |
| Net realized and unrealized gain on investments | | | 0.56 | | | | 0.15 | | | | 0.35 | |
| Total from investment operations | | | 0.44 | | | | 0.12 | | | | 0.35 | |
| LESS DISTRIBUTIONS: | | | | | | | | | | | | |
| From net investment income | | | — | | | | (0.22 | ) | | | (0.68 | ) |
| From net realized gains on investments | | | (0.07 | ) | | | — | | | | — | |
| Total distributions | | | (0.07 | ) | | | (0.22 | ) | | | (0.68 | ) |
| Net asset value, end of year/period | | $ | 5.43 | | | $ | 5.06 | | | $ | 5.16 | |
| Total return (D) | | | 8.62 | % | | | 2.42 | % (F) | | | 6.13 | % (E, F) |
| RATIOS/SUPPLEMENTAL DATA: | | | | | | | | | | | | |
| Net assets, end of year/period (in 000’s) | | $ | 1 | | | $ | 1 | | | $ | 1 | |
| Ratios to average net assets | | | | | | | | | | | | |
| Expenses, before waiver and reimbursement | | | 4.16 | % | | | 5.29 | % | | | 3.61 | % (G) |
| Expenses, net waiver and reimbursement | | | 2.99 | % | | | 2.17 | % | | | 2.00 | % (G) |
| Net investment Income (loss) | | | (2.34 | )% | | | (0.53 | )% | | | (0.14 | )% (G) |
| Portfolio turnover rate | | | 0 | % | | | 199 | % | | | 246 | % (E) |
| (A) | The Rational Hedged Return Fund Class C shares commenced operations on May 31, 2016. |
| (B) | Per share amounts calculated using average shares method, which more appropriately presents the per share data for the year/period. |
| (C) | Amount is less than $0.005. |
| (D) | Total return in the above table represents the rate that the investor would have earned or lost on an investment in the Fund assuming reinvestment of dividends. Had the Advisor not waived its fees and reimbursed expenses, total return would have been lower. |
| (F) | Includes adjustments in accordance with accounting principles generally accepted in the United States and, consequently, the net asset value for financial reporting purposes and the returns based upon those net asset values may differ from the net asset values and returns for shareholder transactions. |
See accompanying notes to financial statements.
| RATIONAL FUNDS |
| Rational Dynamic Brands Fund |
| Financial Highlights |
For a Share Outstanding Throughout Each Year
| | | Institutional Class | |
| | | For the | | | For the | | | For the | | | For the | | | For the | |
| | | Year Ended | | | Year Ended | | | Year Ended | | | Year Ended | | | Year Ended | |
| | | December 31, | | | December 31, | | | December 31, | | | December 31, | | | December 31, | |
| | | 2018 (A) | | | 2017 (A) | | | 2016 (A) | | | 2015 (A) | | | 2014 (A) | |
| | | | | | | | | | | | | | | | | | | | | |
| Net asset value, beginning of year | | $ | 34.90 | | | $ | 37.80 | | | $ | 46.90 | | | $ | 207.50 | | | $ | 287.50 | |
| INCOME (LOSS) FROM INVESTMENT OPERATIONS: | | | | | | | | | | | | | | | | | | | | |
| Net investment income | | | 0.16 | (B) | | | 0.20 | (B) | | | 0.50 | (B) | | | 0.90 | | | | 0.90 | |
| Net realized and unrealized gain (loss) on investments | | | 0.07 | (D) | | | 5.40 | | | | 3.10 | | | | (8.10 | ) | | | (5.80 | ) |
| Total from investment operations | | | 0.23 | | | | 5.60 | | | | 3.60 | | | | (7.20 | ) | | | (4.90 | ) |
| LESS DISTRIBUTIONS: | | | | | | | | | | | | | | | | | | | | |
| From net investment income | | | (0.09 | ) | | | (0.20 | ) | | | (0.60 | ) | | | (0.80 | ) | | | (0.20 | ) |
| From net realized gains on investments | | | (0.84 | ) | | | (8.30 | ) | | | (12.10 | ) | | | (152.60 | ) | | | (74.90 | ) |
| Total distributions | | | (0.93 | ) | | | (8.50 | ) | | | (12.70 | ) | | | (153.40 | ) | | | (75.10 | ) |
| Net asset value, end of year | | $ | 34.20 | | | $ | 34.90 | | | $ | 37.80 | | | $ | 46.90 | | | $ | 207.50 | |
| Total return (C) | | | 0.72 | % | | | 14.66 | % | | | 7.21 | % | | | (7.82 | )% | | | (1.41 | )% |
| RATIOS/SUPPLEMENTAL DATA: | | | | | | | | | | | | | | | | | | | | |
| Net assets, end of year (in 000’s) | | $ | 16,725 | | | $ | 3,269 | | | $ | 3,445 | | | $ | 13,456 | | | $ | 152,846 | |
| Ratios to average net assets | | | | | | | | | | | | | | | | | | | | |
| Expenses, before waiver and reimbursement | | | 1.67 | % | | | 1.69 | % | | | 1.76 | % | | | 1.56 | % | | | 1.37 | % |
| Expenses, net waiver and reimbursement | | | 1.00 | % | | | 1.00 | % | | | 1.00 | % | | | 1.06 | % | | | 1.03 | % |
| Net investment income | | | 0.42 | % | | | 0.60 | % | | | 1.17 | % | | | 0.46 | % | | | 0.23 | % |
| Portfolio turnover rate | | | 411 | % | | | 305 | % | | | 178 | % | | | 35 | % | | | 12 | % |
| | | | | | | | | | | | | | | | | | | | | |
| | | | | | | | | | | | | | | | | | | | | |
| | | Class A | |
| | | For the | | | For the | | | For the | | | For the | | | For the | |
| | | Year Ended | | | Year Ended | | | Year Ended | | | Year Ended | | | Year Ended | |
| | | December 31, | | | December 31, | | | December 31, | | | December 31, | | | December 31, | |
| | | 2018 (A) | | | 2017 (A) | | | 2016 (A) | | | 2015 (A) | | | 2014 (A) | |
| | | | | | | | | | | | | | | | | | | | | |
| Net asset value, beginning of year | | $ | 24.70 | | | $ | 28.90 | | | $ | 38.60 | | | $ | 198.90 | | | $ | 279.20 | |
| INCOME (LOSS) FROM INVESTMENT OPERATIONS: | | | | | | | | | | | | | | | | | | | | |
| Net investment income | | | 0.02 | (B) | | | 0.10 | (B) | | | 0.30 | (B) | | | 0.70 | | | | 0.10 | |
| Net realized and unrealized gain (loss) on investments | | | 0.12 | (D) | | | 4.10 | | | | 2.60 | | | | (7.70 | ) | | | (5.50 | ) |
| Total from investment operations | | | 0.14 | | | | 4.20 | | | | 2.90 | | | | (7.00 | ) | | | (5.40 | ) |
| LESS DISTRIBUTIONS: | | | | | | | | | | | | | | | | | | | | |
| From net investment income | | | — | | | | (0.10 | ) | | | (0.50 | ) | | | (0.70 | ) | | | — | |
| From net realized gains on investments | | | (0.84 | ) | | | (8.30 | ) | | | (12.10 | ) | | | (152.60 | ) | | | (74.90 | ) |
| Total distributions | | | (0.84 | ) | | | (8.40 | ) | | | (12.60 | ) | | | (153.30 | ) | | | (74.90 | ) |
| Net asset value, end of year | | $ | 24.00 | | | $ | 24.70 | | | $ | 28.90 | | | $ | 38.60 | | | $ | 198.90 | |
| Total return (C) | | | 0.63 | % | | | 14.30 | % | | | 6.91 | % | | | (8.21 | )% | | | (1.62 | )% |
| RATIOS/SUPPLEMENTAL DATA: | | | | | | | | | | | | | | | | | | | | |
| Net assets, end of year (in 000’s) | | $ | 11,154 | | | $ | 12,870 | | | $ | 16,180 | | | $ | 20,944 | | | $ | 44,589 | |
| Ratios to average net assets | | | | | | | | | | | | | | | | | | | | |
| Expenses, before waiver and reimbursement | | | 2.05 | % | | | 1.94 | % | | | 2.01 | % | | | 1.81 | % | | | 1.62 | % |
| Expenses, net waiver and reimbursement | | | 1.25 | % | | | 1.25 | % | | | 1.25 | % | | | 1.31 | % | | | 1.28 | % |
| Net investment income | | | 0.08 | % | | | 0.35 | % | | | 0.86 | % | | | 0.52 | % | | | 0.01 | % |
| Portfolio turnover rate | | | 411 | % | | | 305 | % | | | 178 | % | | | 35 | % | | | 12 | % |
| (A) | Effective September 21, 2018, the Fund had a one-to-ten reverse stock split. Per Share amounts for the periods have been adjusted to give effect to the one-to-ten stock split. |
| (B) | Per share amounts calculated using average shares method, which more appropriately presents the per share data for the year. |
| (C) | Total return in the above table represents the rate that the investor would have earned or lost on an investment in the Fund assuming reinvestment of dividends and does not reflect the impact of sales charges. |
| (D) | As required by SEC standard per share data calculation methodology, this represents a balancing figure derived from the other amounts in the financial highlights tables that captures all other changes affecting net asset value per share. This per share gain amount does not correlate to the aggregate of the net realized and unrealized loss in the Statement of Operations for the period ended December 31, 2018, primarily due to the timing of sales and repurchases of the Fund’s shares in relation to fluctuating market values of the Fund’s portfolio. |
See accompanying notes to financial statements.
| RATIONAL FUNDS |
| Rational Dynamic Brands Fund (Continued) |
| Financial Highlights |
For a Share Outstanding Throughout Each Year/Period
| | | Class C | |
| | | For the | | | For the | | | For the | | | For the | | | For the | |
| | | Year Ended | | | Year Ended | | | Year Ended | | | Year Ended | | | Period Ended | |
| | | December 31, | | | December 31, | | | December 31, | | | December 31, | | | December 31, | |
| | | 2018 (B) | | | 2017 (B) | | | 2016 (B) | | | 2015 (B) | | | 2014 (A,B) | |
| | | | | | | | | | | | | | | | | | | | | |
| Net asset value, beginning of year/period | | $ | 22.60 | | | $ | 27.10 | | | $ | 36.90 | | | $ | 197.50 | | | $ | 276.00 | |
| INCOME (LOSS) FROM INVESTMENT OPERATIONS: | | | | | | | | | | | | | | | | | | | | |
| Net investment income (loss) | | | (0.14 | ) (C) | | | (0.00 | ) (C, D) | | | 0.10 | (C) | | | 0.00 | (D) | | | (0.70 | ) |
| Net realized and unrealized gain (loss) on investments | | | 0.08 | (I) | | | 3.80 | | | | 2.40 | | | | (7.60 | ) | | | (2.90 | ) |
| Total from investment operations | | | (0.06 | ) | | | 3.80 | | | | 2.50 | | | | (7.60 | ) | | | (3.60 | ) |
| LESS DISTRIBUTIONS: | | | | | | | | | | | | | | | | | | | | |
| From net investment income | | | — | | | | — | | | | (0.20 | ) | | | (0.40 | ) | | | — | |
| From net realized gains on investments | | | (0.84 | ) | | | (8.30 | ) | | | (12.10 | ) | | | (152.60 | ) | | | (74.90 | ) |
| Total distributions | | | (0.84 | ) | | | (8.30 | ) | | | (12.30 | ) | | | (153.00 | ) | | | (74.90 | ) |
| Net asset value, end of year/period | | $ | 21.70 | | | $ | 22.60 | | | $ | 27.10 | | | $ | 36.90 | | | $ | 197.50 | |
| Total return (E) | | | (0.20 | )% (F) | | | 14.03 | % | | | 6.19 | % | | | (8.56 | )% | | | (1.00 | )% (G) |
| RATIOS/SUPPLEMENTAL DATA: | | | | | | | | | | | | | | | | | | | | |
| Net assets, end of year/period (in 000’s) | | $ | 214 | | | $ | 231 | | | $ | 394 | | | $ | 766 | | | $ | 1,545 | |
| Ratios to average net assets | | | | | | | | | | | | | | | | | | | | |
| Expenses, before waiver and reimbursement | | | 2.73 | % | | | 2.65 | % | | | 2.51 | % | | | 2.31 | % | | | 2.15 | % (H) |
| Expenses, net waiver and reimbursement | | | 1.91 | % | | | 1.75 | % | | | 1.75 | % | | | 1.81 | % | | | 1.79 | % (H) |
| Net investment income (loss) | | | (0.59 | )% | | | (0.14 | )% | | | 0.28 | % | | | 0.04 | % | | | (0.54 | )% (H) |
| Portfolio turnover rate | | | 411 | % | | | 305 | % | | | 178 | % | | | 35 | % | | | 12 | % (G) |
| (A) | The Rational Dynamic Brands Fund Class C shares commenced operations on January 3, 2014. |
| (B) | Effective September 21, 2018, the Fund had a one-to-ten reverse stock split. Per Share amounts for the periods have been adjusted to give effect to the one-to-ten stock split. |
| (C) | Per share amounts calculated using average shares method, which more appropriately presents the per share data for the year/period. |
| (D) | Amount is less than $0.005. |
| (E) | Total return in the above table represents the rate that the investor would have earned or lost on an investment in the Fund assuming reinvestment of dividends and does not reflect the impact of sales charges. |
| (F) | Includes adjustments in accordance with accounting principles generally accepted in the United States and, consequently, the net asset value for financial reporting purposes and the returns based upon those net asset values may differ from the net asset values and returns for shareholder transactions. |
| (I) | As required by SEC standard per share data calculation methodology, this represents a balancing figure derived from the other amounts in the financial highlights tables that captures all other changes affecting net asset value per share. This per share gain amount does not correlate to the aggregate of the net realized and unrealized loss in the Statement of Operations for the period ended December 31, 2018, primarily due to the timing of sales and repurchases of the Fund’s shares in relation to fluctuating market values of the Fund’s portfolio. |
See accompanying notes to financial statements.
| RATIONAL FUNDS |
| Rational Strategic Allocation Fund |
| Financial Highlights |
For a Share Outstanding Throughout Each Year/Period
| | | Institutional Class | |
| | | For the | | | For the | | | For the | |
| | | Year Ended | | | Year Ended | | | Period Ended | |
| | | December 31, | | | December 31, | | | December 31, | |
| | | 2018 | | | 2017 | | | 2016 (A) | |
| | | | | | | | | | | | | |
| Net asset value, beginning of year/period | | $ | 10.02 | | | $ | 9.37 | | | $ | 9.99 | |
| INCOME (LOSS) FROM INVESTMENT OPERATIONS: | | | | | | | | | | | | |
| Net investment income (B) | | | 0.39 | | | | 0.33 | | | | 0.43 | |
| Net realized and unrealized gain (loss) on investments | | | (0.67 | ) | | | 0.78 | | | | 0.09 | (C) |
| Total from investment operations | | | (0.28 | ) | | | 1.11 | | | | 0.52 | |
| LESS DISTRIBUTIONS: | | | | | | | | | | | | |
| From net investment income | | | (0.36 | ) | | | (0.46 | ) | | | (0.17 | ) |
| From net realized gains on investments | | | (0.26 | ) | | | — | | | | (0.97 | ) |
| Total distributions | | | (0.62 | ) | | | (0.46 | ) | | | (1.14 | ) |
| Net asset value, end of year/period | | $ | 9.12 | | | $ | 10.02 | | | $ | 9.37 | |
| Total return (D) | | | (2.81 | )% | | | 11.95 | % | | | 5.11 | % (E) |
| RATIOS/SUPPLEMENTAL DATA: | | | | | | | | | | | | |
| Net assets, end of year/period (in 000’s) | | $ | 253 | | | $ | 278 | | | $ | 260 | |
| Ratios to average net assets | | | | | | | | | | | | |
| Expenses, before waiver and reimbursement (F) | | | 1.04 | % | | | 0.85 | % | | | 1.36 | % (G) |
| Expenses, net waiver and reimbursement (F) | | | 0.45 | % | | | 0.45 | % | | | 0.45 | % (G) |
| Net investment income (F,H) | | | 3.91 | % | | | 3.35 | % | | | 6.98 | % (G) |
| Portfolio turnover rate | | | 53 | % | | | 17 | % | | | 27 | % (E) |
| | | | |
| | | Class A | |
| | | For the | | | For the | | | For the | | | For the | | | For the | |
| | | Year Ended | | | Year Ended | | | Year Ended | | | Year Ended | | | Year Ended | |
| | | December 31, | | | December 31, | | | December 31, | | | December 31, | | | December 31, | |
| | | 2018 | | | 2017 | | | 2016 | | | 2015 | | | 2014 | |
| | | | | | | | | | | | | | | | | | | | | |
| Net asset value, beginning of year | | $ | 10.05 | | | $ | 9.40 | | | $ | 9.78 | | | $ | 11.36 | | | $ | 11.77 | |
| INCOME (LOSS) FROM INVESTMENT OPERATIONS: | | | | | | | | | | | | | | | | | | | | |
| Net investment income | | | 0.33 | (B) | | | 0.26 | (B) | | | 0.18 | (B) | | | 0.14 | | | | 0.17 | |
| Net realized and unrealized gain (loss) on investments | | | (0.63 | ) | | | 0.83 | | | | 0.62 | | | | (0.34 | ) | | | 0.07 | |
| Total from investment operations | | | (0.30 | ) | | | 1.09 | | | | 0.80 | | | | (0.20 | ) | | | 0.24 | |
| LESS DISTRIBUTIONS: | | | | | | | | | | | | | | | | | | | | |
| From net investment income | | | (0.34 | ) | | | (0.44 | ) | | | (0.21 | ) | | | (0.12 | ) | | | (0.24 | ) |
| From net realized gains on investments | | | (0.26 | ) | | | — | | | | (0.97 | ) | | | (1.26 | ) | | | (0.41 | ) |
| Total distributions | | | (0.60 | ) | | | (0.44 | ) | | | (1.18 | ) | | | (1.38 | ) | | | (0.65 | ) |
| Net asset value, end of year | | $ | 9.15 | | | $ | 10.05 | | | $ | 9.40 | | | $ | 9.78 | | | $ | 11.36 | |
| Total return (D) | | | (3.05 | )% | | | 11.61 | % | | | 8.16 | % | | | (1.87 | )% | | | 2.05 | % |
| RATIOS/SUPPLEMENTAL DATA: | | | | | | | | | | | | | | | | | | | | |
| Net assets, end of year (in 000’s) | | $ | 9,842 | | | $ | 13,033 | | | $ | 14,822 | | | $ | 17,061 | | | $ | 21,008 | |
| Ratios to average net assets | | | | | | | | | | | | | | | | | | | | |
| Expenses, before waiver and reimbursement (F) | | | 1.37 | % | | | 1.14 | % | | | 1.30 | % | | | 1.04 | % | | | 0.96 | % |
| Expenses, net waiver and reimbursement (F) | | | 0.70 | % | | | 0.70 | % | | | 0.70 | % | | | 0.70 | % | | | 0.73 | % |
| Net Investment income (F,H) | | | 3.25 | % | | | 2.60 | % | | | 1.82 | % | | | 1.10 | % | | | 1.38 | % |
| Portfolio turnover rate | | | 53 | % | | | 17 | % | | | 27 | % | | | 44 | % | | | 52 | % |
| (A) | The Rational Strategic Allocation Fund Institutional Class shares commenced operations on May 31, 2016. |
| (B) | Per share amounts calculated using average shares method, which more appropriately presents the per share data for the year/period. |
| (C) | As required by SEC standard per share data calculation methodology, this represents a balancing figure derived from the other amounts in the financial highlights tables that captures all other changes affecting net asset value per share. This per share gain amount does not correlate to the aggregate of the net realized and unrealized loss in the Statement of Operations for the period ended December 31, 2016, primarily due to the timing of sales and repurchases of the Fund’s shares in relation to fluctuating market values of the Fund’s portfolio. |
| (D) | Total return in the above table represents the rate that the investor would have earned or lost on an investment in the Fund assuming reinvestment of dividends and does not reflect the impact of sales charges. Had the Advisor not waived its fees and reimbursed expenses, total return would have been lower. |
| (F) | The ratios of expenses to average net assets and net investment income (loss) to average net assets do not reflect the expenses of the underlying investment companies in which the Fund invests. |
| (H) | Recognition of net investment income (loss) is affected by the timing and declaration of dividends by the underlying investment companies in which the Fund invests. |
See accompanying notes to financial statements.
| RATIONAL FUNDS |
| Rational Strategic Allocation Fund (Continued) |
| Financial Highlights |
For a Share Outstanding Throughout Each Year/Period
| | | Class C | |
| | | For the | | | For the | | | For the | |
| | | Year Ended | | | Year Ended | | | Period Ended | |
| | | December 31, | | | December 31, | | | December 31, | |
| | | 2018 | | | 2017 | | | 2016 (A) | |
| | | | | | | | | | | | | |
| Net asset value, beginning of year/period | | $ | 10.03 | | | $ | 9.39 | | | $ | 9.99 | |
| INCOME (LOSS) FROM INVESTMENT OPERATIONS: | | | | | | | | | | | | |
| Net investment income (B) | | | 0.29 | | | | 0.23 | | | | 0.24 | |
| Net realized and unrealized gain (loss) on investments | | | (0.67 | ) | | | 0.78 | | | | 0.22 | (C) |
| Total from investment operations | | | (0.38 | ) | | | 1.01 | | | | 0.46 | |
| LESS DISTRIBUTIONS: | | | | | | | | | | | | |
| From net investment income | | | (0.28 | ) | | | (0.37 | ) | | | (0.09 | ) |
| From net realized gains on investments | | | (0.26 | ) | | | — | | | | (0.97 | ) |
| Total distributions | | | (0.54 | ) | | | (0.37 | ) | | | (1.06 | ) |
| Net asset value, end of year/period | | $ | 9.11 | | | $ | 10.03 | | | $ | 9.39 | |
| Total return (D) | | | (3.83 | )% | | | 10.80 | % | | | 4.56 | % (E) |
| RATIOS/SUPPLEMENTAL DATA: | | | | | | | | | | | | |
| Net assets, end of year/period (in 000’s) | | $ | 1 | | | $ | 1 | | | $ | 1 | |
| Ratios to average net assets | | | | | | | | | | | | |
| Expenses, before waiver and reimbursement (F) | | | 1.92 | % | | | 1.82 | % | | | 1.89 | % (G) |
| Expenses, net waiver and reimbursement (F) | | | 1.45 | % | | | 1.45 | % | | | 1.45 | % (G) |
| Net investment income (F,H) | | | 2.89 | % | | | 2.31 | % | | | 3.92 | % (G) |
| Portfolio turnover rate | | | 53 | % | | | 17 | % | | | 27 | % (E) |
| (A) | The Rational Strategic Allocation Fund Class C shares commenced operations on May 31, 2016. |
| (B) | Per share amounts calculated using average shares method, which more appropriately presents the per share data for the year/period. |
| (C) | As required by SEC standard per share data calculation methodology, this represents a balancing figure derived from the other amounts in the financial highlights tables that captures all other changes affecting net asset value per share. This per share gain amount does not correlate to the aggregate of the net realized and unrealized loss in the Statement of Operations for the period ended December 31, 2016, primarily due to the timing of sales and repurchases of the Fund’s shares in relation to fluctuating market values of the Fund’s portfolio. |
| (D) | Total return in the above table represents the rate that the investor would have earned or lost on an investment in the Fund assuming reinvestment of dividends and does not reflect the impact of sales charges. Had the Advisor not waived its fees and reimbursed expenses, total return would have been lower. |
| (F) | The ratios of expenses to average net assets and net investment income (loss) to average net assets do not reflect the expenses of the underlying investment companies in which the Fund invests. |
| (H) | Recognition of net investment income (loss) is affected by the timing and declaration of dividends by the underlying investment companies in which the Fund invests. |
See accompanying notes to financial statements.
| RATIONAL FUNDS |
| Rational/Resolve Adaptive Asset Allocation Fund (Formerly, Rational Dynamic Momentum Fund) |
| Financial Highlights (Consolidated) |
For a Share Outstanding Throughout Each Year/Period
| | | Institutional Class | |
| | | For the | | | For the | | | For the | |
| | | Year Ended | | | Year Ended | | | Period Ended | |
| | | December 31, | | | December 31, | | | December 31, | |
| | | 2018 | | | 2017 | | | 2016 (A) | |
| | | | | | | | | | | | | |
| Net asset value, beginning of year/period | | $ | 25.25 | | | $ | 24.33 | | | $ | 25.00 | |
| INCOME (LOSS) FROM INVESTMENT OPERATIONS: | | | | | | | | | | | | |
| Net investment (loss) (B) | | | (0.04 | ) | | | (0.32 | ) | | | (0.12 | ) |
| Net realized and unrealized gain (loss) on investments | | | (1.89 | ) | | | 1.26 | | | | (0.55 | ) |
| Total from investment operations | | | (1.93 | ) | | | 0.94 | | | | (0.67 | ) |
| LESS DISTRIBUTIONS: | | | | | | | | | | | | |
| From net realized gains on investments | | | (0.22 | ) | | | (0.02 | ) | | | — | |
| Total distributions | | | (0.22 | ) | | | (0.02 | ) | | | — | |
| Net asset value, end of year/period | | $ | 23.10 | | | $ | 25.25 | | | $ | 24.33 | |
| Total return (C) | | | (7.64 | )% | | | 3.85 | % | | | (2.68 | )% (D) |
| RATIOS/SUPPLEMENTAL DATA: | | | | | | | | | | | | |
| Net assets, end of year/period (in 000’s) | | $ | 27,460 | | | $ | 5,883 | | | $ | 15,083 | |
| Ratios to average net assets | | | | | | | | | | | | |
| Expenses, before waiver and reimbursement | | | 2.90 | % | | | 2.49 | % | | | 3.27 | % (E) |
| Expenses, net waiver and reimbursement | | | 1.97 | % | | | 1.97 | % | | | 1.99 | % (E) |
| Net investment (loss) | | | (0.17 | )% | | | (1.33 | )% | | | (1.74 | )% (E) |
| Portfolio turnover rate | | | 0 | % | | | 0 | % | | | 0 | % (D) |
| | | Class A | |
| | | For the | | | For the | | | For the | |
| | | Year Ended | | | Year Ended | | | Period Ended | |
| | | December 31, | | | December 31, | | | December 31, | |
| | | 2018 | | | 2017 | | | 2016 (A) | |
| | | | | | | | | | | | | |
| Net asset value, beginning of year/period | | $ | 25.16 | | | $ | 24.30 | | | $ | 25.00 | |
| INCOME (LOSS) FROM INVESTMENT OPERATIONS: | | | | | | | | | | | | |
| Net investment (loss) (B) | | | (0.11 | ) | | | (0.21 | ) | | | (0.13 | ) |
| Net realized and unrealized gain (loss) on investments | | | (1.87 | ) | | | 1.09 | | | | (0.57 | ) |
| Total from investment operations | | | (1.98 | ) | | | 0.88 | | | | (0.70 | ) |
| LESS DISTRIBUTIONS: | | | | | | | | | | | | |
| From net realized gains on investments | | | (0.22 | ) | | | (0.02 | ) | | | — | |
| Total distributions | | | (0.22 | ) | | | (0.02 | ) | | | — | |
| Net asset value, end of year/period | | $ | 22.96 | | | $ | 25.16 | | | $ | 24.30 | |
| Total return (C) | | | (7.87 | )% (F) | | | 3.57 | % | | | (2.80 | )% (D) |
| RATIOS/SUPPLEMENTAL DATA: | | | | | | | | | | | | |
| Net assets, end of year/period (in 000’s) | | $ | 2,169 | | | $ | 130 | | | $ | 1 | |
| Ratios to average net assets | | | | | | | | | | | | |
| Expenses, before waiver and reimbursement | | | 3.14 | % | | | 2.90 | % | | | 3.52 | % (E) |
| Expenses, net waiver and reimbursement | | | 2.22 | % | | | 2.22 | % | | | 2.24 | % (E) |
| Net investment (loss) | | | (0.45 | )% | | | (0.88 | )% | | | (2.09 | )% (E) |
| Portfolio turnover rate | | | 0 | % | | | 0 | % | | | 0 | % (D) |
| (A) | The Rational Resolve/Adaptive Asset Allocation Fund Institutional Class and Class A shares commenced operations on September 30, 2016. |
| (B) | Per share amounts calculated using average shares method, which more appropriately presents the per share data for the year/period. |
| (C) | Total return in the above table represents the rate that the investor would have earned or lost on an investment in the Fund assuming reinvestment of dividends and does not reflect the impact of sales charges. Had the Advisor not waived its fees and reimbursed expenses, total return would have been lower. |
| (F) | Includes adjustments in accordance with accounting principles generally accepted in the United States and, consequently, the net asset value for financial reporting purposes and the returns based upon those net asset values may differ from the net asset values and returns for shareholder transactions. |
See accompanying notes to consolidated financial statements.
| RATIONAL FUNDS |
| Rational/Resolve Adaptive Asset Allocation Fund (Formerly, Rational Dynamic Momentum Fund) (Continued) |
| Financial Highlights (Consolidated) |
For a Share Outstanding Throughout Each Year/Period
| | | Class C | |
| | | For the | | | For the | | | For the | |
| | | Year Ended | | | Year Ended | | | Period Ended | |
| | | December 31, | | | December 31, | | | December 31, | |
| | | 2018 | | | 2017 | | | 2016 (A) | |
| | | | | | | | | | | | | |
| Net asset value, beginning of year/period | | $ | 24.96 | | | $ | 24.29 | | | $ | 25.00 | |
| INCOME (LOSS) FROM INVESTMENT OPERATIONS: | | | | | | | | | | | | |
| Net investment (loss) (B) | | | (0.31 | ) | | | (0.54 | ) | | | (0.17 | ) |
| Net realized and unrealized gain (loss) on investments | | | (1.82 | ) | | | 1.23 | | | | (0.54 | ) |
| Total from investment operations | | | (2.13 | ) | | | 0.69 | | | | (0.71 | ) |
| LESS DISTRIBUTIONS: | | | | | | | | | | | | |
| From net realized gains on investments | | | (0.22 | ) | | | (0.02 | ) | | | — | |
| Total distributions | | | (0.22 | ) | | | (0.02 | ) | | | — | |
| Net asset value, end of year/period | | $ | 22.61 | | | $ | 24.96 | | | $ | 24.29 | |
| Total return (C) | | | (8.53 | )% | | | 2.83 | % | | | (2.84 | )% (D) |
| RATIOS/SUPPLEMENTAL DATA: | | | | | | | | | | | | |
| Net assets, end of year/period (in 000’s) | | $ | 322 | | | $ | 371 | | | $ | 21 | |
| Ratios to average net assets | | | | | | | | | | | | |
| Expenses, before waiver and reimbursement | | | 4.65 | % | | | 3.60 | % | | | 4.27 | % (E) |
| Expenses, net waiver and reimbursement | | | 2.97 | % | | | 2.97 | % | | | 2.99 | % (E) |
| Net investment (loss) | | | (1.24 | )% | | | (2.26 | )% | | | (2.69 | )% (E) |
| Portfolio turnover rate | | | 0 | % | | | 0 | % | | | 0 | % (D) |
| (A) | The Rational Resolve/Adaptive Asset Allocation Fund Class C shares commenced operations on September 30, 2016. |
| (B) | Per share amounts calculated using average shares method, which more appropriately presents the per share data for the year/period. |
| (C) | Total return in the above table represents the rate that the investor would have earned or lost on an investment in the Fund assuming reinvestment of dividends and does not reflect the impact of sales charges. Had the Advisor not waived its fees and reimbursed expenses, total return would have been lower. |
See accompanying notes to consolidated financial statements.
| RATIONAL FUNDS |
| Rational Iron Horse Fund |
| Financial Highlights |
For a Share Outstanding Throughout Each Year/Period
| | | Institutional Class | |
| | | For the | | | For the | | | For the | | | For the | | | For the | | | For the | |
| | | Year Ended | | | Period Ended | | | Year Ended | | | Year Ended | | | Year Ended | | | Year Ended | |
| | | December 31, | | | December 31, | | | March 31, | | | March 31, | | | March 31, | | | March 31, | |
| | | 2018 | | | 2017 | | | 2017 | | | 2016 | | | 2015 | | | 2014 | |
| | | | | | | | | | | | | | | | | | | | | | | | | |
| Net asset value, beginning of year | | $ | 10.58 | | | $ | 10.37 | | | $ | 9.98 | | | $ | 10.19 | | | $ | 11.35 | | | $ | 10.58 | |
| INCOME (LOSS) FROM INVESTMENT OPERATIONS: | | | | | | | | | | | | | | | | | | | | | | | | |
| Net investment income (A) | | | 0.09 | | | | 0.04 | | | | 0.05 | | | | 0.06 | | | | 0.09 | | | | 0.10 | |
| Net realized and unrealized gain (loss) on investments | | | (0.22 | ) | | | 0.54 | | | | 0.51 | | | | 0.05 | | | | 0.44 | | | | 0.94 | |
| Total from investment operations | | | (0.13 | ) | | | 0.58 | | | | 0.56 | | | | 0.11 | | | | 0.53 | | | | 1.04 | |
| LESS DISTRIBUTIONS: | | | | | | | | | | | | | | | | | | | | | | | | |
| From net investment income | | | (0.04 | ) | | | (0.04 | ) | | | (0.02 | ) | | | (0.05 | ) | | | (0.08 | ) | | | (0.11 | ) |
| From net realized gains on investments | | | (0.27 | ) | | | — | | | | (0.03 | ) | | | (0.27 | ) | | | (1.61 | ) | | | (0.16 | ) |
| From Return of capital | | | (0.39 | ) | | | (0.33 | ) | | | (0.12 | ) | | | — | | | | — | | | | — | |
| Total distributions | | | (0.70 | ) | | | (0.37 | ) | | | (0.17 | ) | | | (0.32 | ) | | | (1.69 | ) | | | (0.27 | ) |
| Net asset value, end of year/period | | $ | 9.75 | | | $ | 10.58 | | | $ | 10.37 | | | $ | 9.98 | | | $ | 10.19 | | | $ | 11.35 | |
| Total return (B) | | | (1.08 | )% | | | 5.69 | % | | | 5.70 | % | | | 1.24 | % | | | 4.78 | % | | | 9.91 | % |
| RATIOS/SUPPLEMENTAL DATA: | | | | | | | | | | | | | | | | | | | | | | | | |
| Net assets, end of year/period (in 000’s) | | $ | 7,076 | | | $ | 10,913 | | | $ | 8,595 | | | $ | 9,417 | | | $ | 28,191 | | | $ | 19,062 | |
| Ratios to average net assets (including interest expense) | | | | | | | | | | | | | | | | | | | | | | | | |
| Expenses, before waiver and reimbursement | | | 2.34 | % | | | 2.30 | % | | | 3.15 | % | | | 1.50 | % | | | 1.32 | % | | | 1.60 | % |
| Expenses, net waiver and reimbursement | | | 1.71 | % | | | 1.70 | % | | | 1.70 | % | | | 1.56 | % | | | 1.60 | % | | | 1.60 | % |
| Ratios to average net assets (excluding interest expense) | | | | | | | | | | | | | | | | | | | | | | | | |
| Expenses, before waiver and reimbursement | | | 2.36 | % | | | 2.30 | % | | | 3.15 | % | | | 1.50 | % | | | 1.32 | % | | | 1.60 | % |
| Expenses, net waiver and reimbursement | | | 1.70 | % | | | 1.70 | % | | | 1.70 | % | | | 1.56 | % | | | 1.60 | % | | | 1.60 | % |
| Net investment income | | | 0.90 | % | | | 0.54 | % | | | 0.51 | % | | | 0.63 | % | | | 0.73 | % | | | 0.93 | % |
| Portfolio turnover rate | | | 162 | % | | | 252 | % | | | 323 | % | | | 279 | % | | | 265 | % | | | 114 | % |
| | | | | | | | | | | | | | | | | | | | | | | | | |
| | | | | | | | | | | | | | | | | | | | | | | | | |
| | | Class A | |
| | | For the | | | For the | | | For the | | | For the | | | For the | | | For the | |
| | | Year Ended | | | Period Ended | | | Year Ended | | | Year Ended | | | Year Ended | | | Year Ended | |
| | | December 31, | | | December 31, | | | March 31, | | | March 31, | | | March 31, | | | March 31, | |
| | | 2018 | | | 2017 | | | 2017 | | | 2016 | | | 2015 | | | 2014 | |
| | | | | | | | | | | | | | | | | | | | | | | | | |
| Net asset value, beginning of year/period | | $ | 10.56 | | | $ | 10.36 | | | $ | 9.98 | | | $ | 10.21 | | | $ | 11.37 | | | $ | 10.60 | |
| INCOME (LOSS) FROM INVESTMENT OPERATIONS: | | | | | | | | | | | | | | | | | | | | | | | | |
| Net investment income (A) | | | 0.05 | | | | 0.02 | | | | 0.02 | | | | 0.02 | | | | 0.06 | | | | 0.08 | |
| Net realized and unrealized gain (loss) on investments | | | (0.19 | ) | | | 0.53 | | | | 0.52 | | | | 0.06 | | | | 0.45 | | | | 0.93 | |
| Total from investment operations | | | (0.14 | ) | | | 0.55 | | | | 0.54 | | | | 0.08 | | | | 0.51 | | | | 1.01 | |
| LESS DISTRIBUTIONS: | | | | | | | | | | | | | | | | | | | | | | | | |
| From net investment income | | | (0.02 | ) | | | (0.02 | ) | | | (0.01 | ) | | | (0.04 | ) | | | (0.06 | ) | | | (0.08 | ) |
| From net realized gains on investments | | | (0.27 | ) | | | — | | | | (0.03 | ) | | | (0.27 | ) | | | (1.61 | ) | | | (0.16 | ) |
| From Return of capital | | | (0.39 | ) | | | (0.33 | ) | | | (0.12 | ) | | | — | | | | — | | | | — | |
| Total distributions | | | (0.68 | ) | | | (0.35 | ) | | | (0.16 | ) | | | (0.31 | ) | | | (1.67 | ) | | | (0.24 | ) |
| Net asset value, end of year/period | | $ | 9.74 | | | $ | 10.56 | | | $ | 10.36 | | | $ | 9.98 | | | $ | 10.21 | | | $ | 11.37 | |
| Total return (B) | | | (1.20 | )% (C) | | | 5.37 | % (C) | | | 5.42 | % | | | 0.90 | % | | | 4.51 | % | | | 9.63 | % |
| RATIOS/SUPPLEMENTAL DATA: | | | | | | | | | | | | | | | | | | | | | | | | |
| Net assets, end of year/period (in 000’s) | | $ | 1,843 | | | $ | 6,767 | | | $ | 3,732 | | | $ | 8,098 | | | $ | 12,223 | | | $ | 11,842 | |
| Ratios to average net assets (including interest expense) | | | | | | | | | | | | | | | | | | | | | | | | |
| Expenses, before waiver and reimbursement | | | 2.60 | % | | | 2.41 | % | | | 3.26 | % | | | 1.86 | % | | | 1.57 | % | | | 1.85 | % |
| Expenses, net waiver and reimbursement | | | 1.96 | % | | | 1.95 | % | | | 1.95 | % | | | 1.95 | % | | | 1.85 | % | | | 1.85 | % |
| Ratios to average net assets (excluding interest expense) | | | | | | | | | | | | | | | | | | | | | | | | |
| Expenses, before waiver and reimbursement | | | 2.56 | % | | | 2.41 | % | | | 3.26 | % | | | 1.86 | % | | | 1.57 | % | | | 1.85 | % |
| Expenses, net waiver and reimbursement | | | 1.95 | % | | | 1.95 | % | | | 1.95 | % | | | 1.95 | % | | | 1.85 | % | | | 1.85 | % |
| Net investment income | | | 0.51 | % | | | 0.25 | % | | | 0.22 | % | | | 0.22 | % | | | 0.49 | % | | | 0.68 | % |
| Portfolio turnover rate | | | 162 | % | | | 252 | % | | | 323 | % | | | 279 | % | | | 265 | % | | | 114 | % |
| (A) | Per share amounts calculated using the average shares method, which more appropriately presents the per share data for the year/period. |
| (B) | Total return in the above table represents the rate that the investor would have earned or lost on an investment in the Fund assuming reinvestment of dividends and does not reflect the impact of sales charges. Had the Advisor not waived its fees and reimbursed expenses, total return would have been lower. |
| (C) | Includes adjustments in accordance with accounting principles generally accepted in the United States and, consequently, the net asset value for financial reporting purposes and the returns based upon those net asset values may differ from the net asset values and returns for shareholder transactions. |
See accompanying notes to financial statements.
| RATIONAL FUNDS |
| Rational Iron Horse Fund (Continued) |
| Financial Highlights |
For a Share Outstanding Throughout the Year/Period
| | | Class C | |
| | | For the | | | For the | |
| | | Year Ended | | | Period Ended | |
| | | December 31, | | | December 31, | |
| | | 2018 | | | 2017 (A) | |
| | | | | | | |
| Net asset value, beginning of year/period | | $ | 10.54 | | | $ | 10.37 | |
| INCOME (LOSS) FROM INVESTMENT OPERATIONS: | | | | | | | | |
| Net investment income (loss) (B) | | | (0.01 | ) | | | (0.03 | ) |
| Net realized and unrealized gain (loss) on investments | | | (0.18 | ) | | | 0.53 | |
| Total from investment operations | | | (0.19 | ) | | | 0.50 | |
| LESS DISTRIBUTIONS: | | | | | | | | |
| From net investment income | | | (0.02 | ) | | | — | |
| From net realized gains on investments | | | (0.27 | ) | | | | |
| From Return of capital | | | (0.38 | ) | | | (0.33 | ) |
| Total distributions | | | (0.67 | ) | | | (0.33 | ) |
| Net asset value, end of year/period | | $ | 9.68 | | | $ | 10.54 | |
| Total return (C) | | | (1.71 | )% | �� | | 4.89 | % (D) |
| RATIOS/SUPPLEMENTAL DATA: | | | | | | | | |
| Net assets, end of year/period (in 000’s) | | $ | 1 | | | $ | 1 | |
| Ratios to average net assets (including interest expense) | | | | | | | | |
| Expenses, before waiver and reimbursement | | | 3.28 | % | | | 3.04 | % (E) |
| Expenses, net waiver and reimbursement | | | 2.71 | % | | | 2.70 | % (E) |
| Ratios to average net assets (excluding interest expense) | | | | | | | | |
| Expenses, before waiver and reimbursement | | | 3.82 | % | | | 3.04 | % (E) |
| Expenses, net waiver and reimbursement | | | 2.70 | % | | | 2.70 | % (E) |
| Net investment income (loss) | | | (0.08 | )% | | | (0.44 | )% (E) |
| Portfolio turnover rate | | | 162 | % | | | 252 | % (D) |
| (A) | The Rational Iron Horse Fund Class C shares commenced operations on April 7, 2017. |
| (B) | Per share amounts calculated using the average shares method, which more appropriately presents the per share data for the year/period. |
| (C) | Total return in the above table represents the rate that the investor would have earned or lost on an investment in the Fund assuming reinvestment of dividends and does not reflect the impact of sales charges. Had the Advisor not waived its fees and reimbursed expenses, total return would have been lower. |
See accompanying notes to financial statements.
| RATIONAL FUNDS |
| Rational Income Opportunities Fund |
| Financial Highlights |
For a Share Outstanding Throughout Each Period
| | | For the Period Ended December 31, 2018(A) | |
| | | Institutional | | | | | | | |
| | | Class | | | Class A | | | Class C | |
| | | | | | | | | | |
| Net asset value, beginning of period | | $ | 10.00 | | | $ | 10.00 | | | $ | 10.00 | |
| INCOME (LOSS) FROM INVESTMENT OPERATIONS: | | | | | | | | | | | | |
| Net investment income (B) | | | 0.22 | | | | 0.19 | | | | 0.13 | |
| Net realized and unrealized gain on investments | | | 0.05 | | | | 0.07 | | | | 0.06 | |
| Total from investment operations | | | 0.27 | | | | 0.26 | | | | 0.19 | |
| LESS DISTRIBUTIONS: | | | | | | | | | | | | |
| From net investment income | | | (0.19 | ) | | | (0.18 | ) | | | (0.13 | ) |
| From net realized gains on investments | | | (0.03 | ) | | | (0.03 | ) | | | (0.03 | ) |
| Total distributions | | | (0.22 | ) | | | (0.21 | ) | | | (0.16 | ) |
| Net asset value, end of period | | $ | 10.05 | | | $ | 10.05 | | | $ | 10.03 | |
| Total return (C, D) | | | 2.72 | % | | | 2.56 | % | | | 1.93 | % |
| RATIOS/SUPPLEMENTAL DATA: | | | | | | | | | | | | |
| Net assets, end of period (in 000’s) | | $ | 4,531 | | | $ | 10 | | | $ | 1 | |
| Ratios to average net assets | | | | | | | | | | | | |
| Expenses, before waiver and reimbursement (E) | | | 5.91 | % | | | 6.15 | % | | | 6.78 | % |
| Expenses, net waiver and reimbursement (E) | | | 1.75 | % | | | 2.00 | % | | | 2.75 | % |
| Net investment income (E) | | | 3.15 | % | | | 2.68 | % | | | 1.80 | % |
| Portfolio turnover rate (D) | | | 43 | % | | | 43 | % | | | 43 | % |
| (A) | The Rational Income Opportunities Fund Institutional Class, Class A and Class C Shares commenced operations April 23, 2018. |
| (B) | Per share amounts calculated using average shares method, which more appropriately presents the per share data for the period. |
| (C) | Total return in the above table represents the rate that the investor would have earned or lost on an investment in the Fund assuming reinvestment of dividends and does not reflect the impact of sales charges. |
See accompanying notes to financial statements.
| RATIONAL FUNDS |
| Rational/NuWave Enhanced Market Opportunity Fund |
| Financial Highlights (Consolidated) |
For a Share Outstanding Throughout Each Period
| | | For the Period Ended December 31, 2018(A) | |
| | | Institutional | | | | | | | |
| | | Class | | | Class A | | | Class C | |
| | | | | | | | | | |
| Net asset value, beginning of period | | $ | 15.00 | | | $ | 15.00 | | | $ | 15.00 | |
| INCOME (LOSS) FROM INVESTMENT OPERATIONS: | | | | | | | | | | | | |
| Net investment income (loss) (B) | | | 0.00 | (C) | | | (0.06 | ) | | | (0.12 | ) |
| Net realized and unrealized gain on investments | | | 1.47 | | | | 1.49 | | | | 1.46 | |
| Total from investment operations | | | 1.47 | | | | 1.43 | | | | 1.34 | |
| LESS DISTRIBUTIONS: | | | | | | | | | | | | |
| From net investment income | | | (1.40 | ) | | | (1.39 | ) | | | (1.37 | ) |
| From net realized gains on investments | | | (0.50 | ) | | | (0.50 | ) | | | (0.50 | ) |
| Total distributions | | | (1.90 | ) | | | (1.89 | ) | | | (1.87 | ) |
| Net asset value, end of period | | $ | 14.57 | | | $ | 14.54 | | | $ | 14.47 | |
| Total return (D,E) | | | 9.95 | % | | | 9.70 | % | | | 9.08 | % |
| RATIOS/SUPPLEMENTAL DATA: | | | | | | | | | | | | |
| Net assets, end of period (in 000’s) | | $ | 10,294 | | | $ | 6,014 | | | $ | 88 | |
| Ratios to average net assets | | | | | | | | | | | | |
| Expenses, before waiver and reimbursement (F) | | | 3.34 | % | | | 3.68 | % | | | 4.43 | % |
| Expenses, net waiver and reimbursement (F) | | | 1.99 | % | | | 2.24 | % | | | 2.99 | % |
| Net investment income (loss) (F) | | | (0.02 | )% | | | (0.43 | )% | | | (0.91 | )% |
| Portfolio turnover rate (E) | | | 1449 | % | | | 1449 | % | | | 1449 | % |
| (A) | The Rational NuWave Enhanced Market Opportunity Fund Institutional Class, Class A and Class C commenced operations February 28, 2018. |
| (B) | Per share amounts calculated using average shares method, which more appropriately presents the per share data for the period. |
| (C) | Amount is less than $0.005. |
| (D) | Total return in the above table represents the rate that the investor would have earned or lost on an investment in the Fund assuming reinvestment of dividends and does not reflect the impact of sales charges. |
See accompanying notes to consolidated financial statements.
| RATIONAL FUNDS | |
| CONSOLIDATED NOTES TO FINANCIAL STATEMENTS |
| December 31, 2018 | ANNUAL REPORT |
| | |
| (1) | ORGANIZATION AND SIGNIFICANT ACCOUNTING POLICIES |
The Mutual Fund and Variable Insurance Trust (the “Trust”) was organized as a Delaware statutory trust on June 23, 2006. The Trust is registered under the Investment Company Act of 1940, as amended (the “1940 Act”), as an open-end management investment company. As of December 31, 2018, the Trust operated 12 separate series, or mutual funds, each with its own investment objective and strategy. Rational Income Opportunities Fund commenced operations on April 23, 2018. Effective March 16, 2018, Resolve Asset Management, Inc. replaced Chesapeake Capital Corp. as Rational/Resolves Adaptive Asset Allocation Fund’s sub-advisor. This report contains financial statements and financial highlights of the funds listed below (individually referred to as a “Fund”, or collectively as the “Funds”):
| | | | | |
| Fund | | Sub-Advisor | | Primary Objective |
| Rational Dividend Capture Fund (“Dividend Capture”) | | PVG Asset Management Corporation | | Total return on investment, with dividend income an important component of that return. |
| Rational Hedged Return Fund (“Hedged Return”) | | Warrington Asset Management, LLC | | Total return consisting of long-term capital appreciation and Income. |
| Rational Dynamic Brands Fund (“Dynamic Brands”) | | Accuvest Global Advisors, Inc. | | Long-term capital appreciation. |
| Rational Strategic Allocation Fund (“Strategic Allocation”) | | | | Current income and moderate appreciation of capital. |
| Rational/Resolve Adaptive Asset Allocation Fund (“Resolve Adaptive”) | | ReSolve Asset Management, Inc. | | Capital appreciation uncorrelated to global equity markets. |
| (Formerly, Rational Dynamic Momentum Fund) | | | | |
| Rational Iron Horse Fund (“Iron Horse”) | | Van Hulzen Asset Management, LLC | | Total return with less volatility than equity markets in general. |
| Rational Income Opportunities Fund (“Income Opportunities”) | | Cicero Capital Partners, LLC | | Current income. |
| Rational/NuWave Enhanced Market Opportunity Fund (“NuWave Enhanced”) | | NuWave Investment Management, LLC | | Long-term capital appreciation. |
The Funds are registered as diversified, except Resolve Adaptive, Income Opportunities and NuWave Enhanced, which are non-diversified.
Currently, all Funds offer Class A, Class C and Institutional Class shares. Each class of shares for each Fund has identical rights and privileges except with respect to distribution (12b-1) and service fees, voting rights on matters affecting a single class of shares, exchange privileges of each class of shares and sales charges. The price at which the Funds will offer or redeem shares is the net asset value (“NAV”) per share next determined after the order is considered received, subject to any applicable front end or contingent deferred sales charges. Class A shares have a maximum sales charge on purchases of 5.75% for Resolve Adaptive, Iron Horse, Income Opportunities and NuWave Enhanced and 4.75% for all other Funds as a percentage of the original purchase price. Class C shares have a contingent deferred sales charge of 1.00% on shares sold within one year of purchase. Each Fund’s prospectus provides a description of each Fund’s investment objectives, policies and strategies along with information on the classes of shares currently being offered.
At the close of business of April 7, 2017, pursuant to a Plan of Reorganization, the Predecessor Iron Horse Fund transferred all of its assets and liabilities into the Rational Iron Horse Fund. The Predecessor Iron Horse Fund transferred its net assets of $3,738,544 and $8,903,888 to the Rational Iron Horse Fund for Class A and Institutional Class respectively. The Rational Iron Horse Fund received 361,235 and 859,011 shares from the Predecessor Iron Horse Fund Class A and Institutional Class respectively.
NuWave Enhanced Market Opportunity Fund was organized originally as a limited liability partnership (“NuWave Equity Enhanced Fund LP.”) in March 2013. Effective as of the close of business on February 28, 2018, all of the assets, subject to liabilities of NuWave Equity Enhanced Fund LP., were transferred to Nuwave Enhanced in exchange for Institutional Class Shares of the NuWave Enhanced. The net assets value of the NuWave Enhanced shares on the close of business February 28, 2018, after the reorganization, was $15.00 for Institutional Class shares and received in-kind capital contributions of cash valued at $6,946,234 in exchange for 463,082 Institutional Class shares. Class A shares and Class C shares commenced operations on February 28, 2018.
| RATIONAL FUNDS | |
| CONSOLIDATED NOTES TO FINANCIAL STATEMENTS (Continued) |
| December 31, 2018 | ANNUAL REPORT |
| | |
| (2) | SIGNIFICANT ACCOUNTING POLICIES |
The following is a summary of significant accounting policies consistently followed by the Funds and are in accordance with accounting principles generally accepted in the United States of America (“GAAP”). Each Fund is an investment company and accordingly follow the investment company accounting and reporting guidance of the Financial Accounting Standards Board (FASB) Accounting Standard Codification Topic 946 “Financial Services – Investment Companies” including FASB Accounting Standard Update ASU 2013-08.
The preparation of financial statements in conformity with GAAP requires management to make estimates and assumptions that affect the amounts of assets, liabilities, and disclosure of contingent assets and liabilities at the date of the financial statements and the reported amounts of income and expenses for the period. Actual results could differ from those estimates.
A. Investment Valuations
In computing the NAV of the Funds, fair value is based on market valuations with respect to portfolio securities for which market quotations are readily available. Pursuant to Trustee-approved policies, the Trust relies on certain security pricing services to provide the current market value of securities. Those security pricing services value equity securities (including foreign equity securities, exchange-traded funds and closed-end funds) traded on a securities exchange at the last reported sales price on the principal exchange. Equity securities quoted by NASDAQ are valued at the NASDAQ official closing price. If there is no reported sale on the principal exchange, and in the case of over-the counter securities, equity securities are valued at a bid price estimated by the security pricing service. Debt securities (other than short-term obligations) are valued each day by an independent pricing service approved by the Board of Trustees (the “Board”) using methods which include current market quotations from a major market maker in the securities and based on methods which include the consideration of yields or prices of securities of comparable quality, coupon, maturity and type. Option contracts are generally valued at the close. If the close price is outside the bid and the ask price; the quote closest to the close is used. When there is no trading volume the mean of the bid and ask is used. Foreign securities quoted in foreign currencies are translated into U.S. dollars at the foreign exchange rate in effect as of the close of the NYSE. Forward currency exchange contracts are valued daily at the forward foreign exchange rate in effect as of the close of the NYSE. Investments in open-end investment companies are valued at their respective net asset value as reported by such companies. Futures, which are traded on an exchange, are valued at the settlement price determined by the exchange. Short-term debt obligations having 60 days or less remaining until maturity, at time of purchase, may be valued at amortized cost.
Securities for which market quotations are not readily available are valued at fair value under Trust procedures approved by the Board. In these cases, a Pricing Committee, established and appointed by the Trustees, determines in good faith, subject to Trust procedures, the fair value of portfolio securities held by a Fund (“good faith fair valuation”). When a good faith fair valuation of a security is required, consideration is generally given to a number of factors including, but not limited to the following: dealer quotes, published analyses by dealers or analysts regarding the security, transactions which provide implicit valuation of the security (such as a merger or tender offer transaction), the value of other securities or contracts which derive their value from the security at issue, and the implications of any other circumstances which have caused trading in the security to halt. With respect to certain categories of securities, the procedures utilized by the Pricing Committee detail specific valuation methodologies to be applied in lieu of considering the aforementioned list of factors.
Fair valuation procedures are also used when a significant event affecting the value of a portfolio security is determined to have occurred between the time when the price of the portfolio security is determined and the close of trading on the NYSE, which is when each Fund’s NAV is computed. An event is considered significant if there is both an affirmative expectation that the security’s value will change in response to the event and a reasonable basis for quantifying the resulting change in value. Significant events include significant securities’ market movements occurring between the time the price of the portfolio security is determined and the close of trading on the NYSE. For securities normally priced at their last sale price in a foreign market, such events can occur between the close of trading in the foreign market and the close of trading on the NYSE.
| RATIONAL FUNDS | |
| CONSOLIDATED NOTES TO FINANCIAL STATEMENTS (Continued) |
| December 31, 2018 | ANNUAL REPORT |
| | |
In some cases, events affecting the issuer of a portfolio security may be considered significant events. Examples of potentially significant events include announcements concerning earnings, acquisitions, new products, management changes, litigation developments, a strike or natural disaster affecting the company’s operations or regulatory changes or market developments affecting the issuer’s industry occurring between the time when the price of the portfolio security is determined and the close of trading on the NYSE. For securities of foreign issuers, such events could also include political or other developments affecting the economy or markets in which the issuer conducts its operations or its securities are traded.
There can be no assurance that a Fund could purchase or sell a portfolio security at the price used to calculate the Fund’s NAV. In the case of good faith fair valued portfolio securities, lack of information and uncertainty as to the significance of information may lead to a conclusion that a prior valuation is the best indication of a portfolio security’s present value. Good faith fair valuations generally remain unchanged until new information becomes available. Consequently, changes in good faith fair valuation of portfolio securities may be less frequent and of greater magnitude than changes in the price of portfolio securities valued at their last sale price, by an independent pricing service, or based on market quotations.
Valuation of Fund of Funds – The Funds may invest in portfolios of open-end or closed-end investment companies (the “Underlying Funds”). The Underlying Funds value securities in their portfolios for which market quotations are readily available at their market values (generally the last reported sale price) and all other securities and assets at their fair value based upon the methods established by the board of directors of the Underlying Funds.
Open-end investment companies are valued at their respective net asset values as reported by such investment companies. The shares of many closed-end investment companies, after their initial public offering, frequently trade at a price per share, which is different than the net asset value per share. The difference represents a market premium or market discount of such shares. There can be no assurances that the market discount or market premium on shares of any closed-end investment company purchased by the Funds will not change.
The Trust calculates the NAV for each of the Funds by valuing securities held based on fair value. Fair value is defined as the price that would be received to sell an asset or paid to transfer a liability in an orderly transaction between market participants at the measurement date. The valuation techniques described below maximize the use of observable inputs and minimize the use of unobservable inputs in determining fair value. The inputs used for valuing the Funds’ investments are summarized in the three broad levels listed below:
| ● | Level 1 – unadjusted quoted prices in active markets for identical investments and/or registered investment companies where the value per share is determined and published and is the basis for current transactions for identical assets or liabilities at the valuation date. |
| ● | Level 2 – other significant observable inputs (including quoted prices for similar securities, interest rates, prepayment speeds, credit risk, etc.). |
| ● | Level 3 – significant unobservable inputs (including the Funds’ own assumptions in determining the fair value of investments). |
Changes in valuation techniques may result in transfers in or out of an assigned level within the disclosure hierarchy. The inputs or methodology used for valuing investments is not necessarily an indication of the risk associated with investing in those investments.
The Board has authorized the use of an independent fair valuation service. If the movement in a designated U.S. market index, after foreign markets close, is greater than predetermined levels, the Funds may use a systematic valuation model provided from that independent third party to fair value its international equity securities.
| RATIONAL FUNDS | |
| CONSOLIDATED NOTES TO FINANCIAL STATEMENTS (Continued) |
| December 31, 2018 | ANNUAL REPORT |
The inputs or methodology used for valuing securities are not necessarily an indication of the risk associated with investing in those securities. The following tables summarize the inputs used as of December 31, 2018, for each Fund’s assets and liabilities measured at fair value:
| Dividend Capture | | | | | | | | | | | | |
| Assets* | | Level 1 | | | Level 2 | | | Level 3 | | | Total | |
| Common Stocks | | $ | 14,665,437 | | | $ | — | | | $ | — | | | $ | 14,665,437 | |
| Exchange Traded Funds | | | 1,999,531 | | | | — | | | | — | | | | 1,999,531 | |
| Preferred Stocks | | | 1,073,804 | | | | — | | | | — | | | | 1,073,804 | |
| Short-Term Investments | | | 1,320,587 | | | | — | | | | — | | | | 1,320,587 | |
| Total Assets | | $ | 19,059,359 | | | $ | — | | | $ | — | | | $ | 19,059,359 | |
| | | | | | | | | | | | | | | | | |
| Hedged Return | | | | | | | | | | | | |
| Assets* | | Level 1 | | | Level 2 | | | Level 3 | | | Total | |
| Short-Term Investments | | $ | 20,303,578 | | | $ | — | | | $ | — | | | $ | 20,303,578 | |
| Total Assets | | $ | 20,303,578 | | | $ | — | | | $ | — | | | $ | 20,303,578 | |
| Liabilities* | | | | | | | | | | | | | | | | |
| Derivatives | | | | | | | | | | | | | | | | |
| Written Options | | $ | 9,825 | | | $ | — | | | $ | — | | | $ | 9,825 | |
| Total Liabilities | | $ | 9,825 | | | $ | — | | | $ | — | | | $ | 9,825 | |
| | | | | | | | | | | | | | | | | |
| Dynamic Brands | | | | | | | | | | | | |
| Assets* | | Level 1 | | | Level 2 | | | Level 3 | | | Total | |
| Common Stocks | | $ | 19,066,069 | | | $ | — | | | $ | — | | | $ | 19,066,069 | |
| Short-Term Investments | | | 6,949,234 | | | | — | | | | — | | | | 6,949,234 | |
| Total Assets | | $ | 26,015,303 | | | $ | — | | | $ | — | | | $ | 26,015,303 | |
| | | | | | | | | | | | | | | | | |
| Strategic Allocation | | | | | | | | | | | | |
| Assets* | | Level 1 | | | Level 2 | | | Level 3 | | | Total | |
| Mutual Funds | | $ | 7,740,945 | | | $ | — | | | $ | — | | | $ | 7,740,945 | |
| Exchange Traded Funds | | | 1,945,198 | | | | — | | | | — | | | | 1,945,198 | |
| Short-Term Investments | | | 50,875 | | | | — | | | | — | | | | 50,875 | |
| Total Assets | | $ | 9,737,018 | | | $ | — | | | $ | — | | | $ | 9,737,018 | |
| | | | | | | | | | | | | | | | | |
| Resolve Adaptive | | | | | | | | | | | | |
| Assets* | | Level 1 | | | Level 2 | | | Level 3 | | | Total | |
| Short-Term Investments | | $ | 28,525,426 | | | $ | — | | | $ | — | | | $ | 28,525,426 | |
| Derivatives | | | | | | | | | | | | | | | | |
| Futures Contracts | | $ | 1,093,094 | | | $ | — | | | $ | — | | | $ | 1,093,094 | |
| Total Assets | | $ | 29,618,520 | | | $ | — | | | $ | — | | | $ | 29,618,520 | |
| Liabilities* | | | | | | | | | | | | | | | | |
| Derivatives | | | | | | | | | | | | | | | | |
| Futures Contracts | | $ | 132,413 | | | $ | — | | | $ | — | | | $ | 132,413 | |
| Total Liabilities | | $ | 132,413 | | | $ | — | | | $ | — | | | $ | 132,413 | |
| RATIONAL FUNDS | |
| CONSOLIDATED NOTES TO FINANCIAL STATEMENTS (Continued) |
| December 31, 2018 | ANNUAL REPORT |
| Iron Horse | | | | | | | | | | | | |
| Assets* | | Level 1 | | | Level 2 | | | Level 3 | | | Total | |
| Common Stocks | | $ | 7,801,275 | | | $ | — | | | $ | — | | | $ | 7,801,275 | |
| Exchange Traded Funds | | | 249,920 | | | | — | | | | — | | | | 249,920 | |
| Short-Term Investments | | | 673,802 | | | | — | | | | — | | | | 673,802 | |
| Total Assets | | $ | 8,724,997 | | | $ | — | | | $ | — | | | $ | 8,724,997 | |
| Liabilities* | | | | | | | | | | | | | | | | |
| Derivatives | | | | | | | | | | | | | | | | |
| Call Options Written | | $ | 415,403 | | | $ | — | | | $ | — | | | $ | 415,403 | |
| Total Liabilities | | $ | 415,403 | | | $ | — | | | $ | — | | | $ | 415,403 | |
| | | | | | | | | | | | | | | | | |
| Income Opportunities | | | | | | | | | | | | |
| Assets* | | Level 1 | | | Level 2 | | | Level 3 | | | Total | |
| Asset Backed Securities | | $ | — | | | $ | 3,922,541 | | | $ | — | | | $ | 3,922,541 | |
| Commercial Mortgage Obligations | | | — | | | | 382,828 | | | | — | | | | 382,828 | |
| Exchange Traded Funds | | | 87,825 | | | | — | | | | — | | | | 87,825 | |
| REIT | | | 60,555 | | | | — | | | | — | | | | 60,555 | |
| Short-Term Investments | | | 78,384 | | | | — | | | | — | | | | 78,384 | |
| Total Assets | | $ | 226,764 | | | $ | 4,305,369 | | | $ | — | | | $ | 4,532,133 | |
| | | | | | | | | | | | | | | | | |
| NuWave Enhanced | | | | | | | | | | | | |
| Assets* | | Level 1 | | | Level 2 | | | Level 3 | | | Total | |
| Common Stocks | | $ | 12,550,231 | | | $ | — | | | $ | — | | | $ | 12,550,231 | |
| Exchange Traded Funds | | | 355,083 | | | | — | | | | — | | | | 355,083 | |
| Short-Term Investments | | | 1,806,881 | | | | — | | | | — | | | | 1,806,881 | |
| Derivatives | | | | | | | | | | | | | | | | |
| Futures Contracts | | | 373,873 | | | | — | | | | — | | | | 373,873 | |
| Total Assets | | $ | 15,086,068 | | | $ | — | | | $ | — | | | $ | 15,086,068 | |
| Liabilities* | | | | | | | | | | | | | | | | |
| Derivatives | | | | | | | | | | | | | | | | |
| Futures Contracts | | $ | 386,476 | | | $ | — | | | $ | — | | | $ | 386,476 | |
| Total Liabilities | | $ | 386,476 | | | $ | — | | | $ | — | | | $ | 386,476 | |
| * | Refer to the Portfolios of Investments for industry classifications. |
There were no level 3 securities held during the period for any Fund.
Consolidation of Subsidiaries –The consolidated financial statements of the Resolve Adaptive and NuWave Enhanced include the accounts of RDMF Fund Ltd. (“RDMF” or “CFC”) and RNW Fund Ltd. (“RNW” or “CFC”), respectively, each wholly-owned and controlled foreign subsidiaries. All inter-company accounts and transactions have been eliminated in consolidation.
Each Fund may invest up to 25% of its total assets in a controlled foreign corporation, which acts as an investment vehicle in order to affect certain investments consistent with Resolve Adaptive and NuWave Enhanced investment objectives and policies.
| RATIONAL FUNDS | |
| CONSOLIDATED NOTES TO FINANCIAL STATEMENTS (Continued) |
| December 31, 2018 | ANNUAL REPORT |
| | | | | Inception Date of | | | CFC Net Assets as of | | | % of Net Assets as of | |
| | | | | CFC | | | December 31, 2018 | | | December 31, 2018 | |
| | RDMF Fund, Ltd. | | | 8/5/2016 | | | $ 1,432,298 | | | 4.8% | |
| | RNW Fund, Ltd. | | | 3/2/2018 | | | $ 397,428 | | | 2.4% | |
For tax purposes, each CFC is an exempted Cayman investment company. Each CFC has received an undertaking from the Government of the Cayman Islands exempting it from all local income, profits and capital gains taxes. No such taxes are levied in the Cayman Islands at the present time. For U.S. income tax purposes, a CFC is a Controlled Foreign Corporation which generates and is allocated no income which is considered effectively connected with U.S. trade or business and as such is not subject to U.S. income tax. However, as a wholly-owned Controlled Foreign Corporation, RDMF’s and RNW’s net income and capital gain, to the extent of its earnings and profits, will be included each year in the Resolve Adaptive and NuWave Enhanced investment company taxable income, respectively.
B. Foreign Currency Translation
The accounting records of the Funds are maintained in U.S. dollars. Foreign currency amounts are translated into U.S. dollars at the current rate of exchange each business day to determine the value of investments, and other assets and liabilities. Purchases and sales of foreign securities, and income and expenses, are translated at the prevailing rate of exchange on the respective date of these transactions. The Funds do not isolate that portion of the results of operations resulting from changes in foreign exchange rates on investments from fluctuation arising from changes in market prices of securities held. These fluctuations are included with the net realized and unrealized gain or loss from investments and foreign currency transactions.
Reported net realized foreign exchange gains or losses arise from sales of portfolio securities; sales and maturities of short term securities; sales of foreign currencies; currency gains or losses realized between the trade and settlement dates on securities transactions; and the difference between the amounts of dividends, interest, and foreign withholding taxes recorded on the Funds’ books and the U.S. dollar equivalent of the amounts actually received or paid. Net unrealized foreign exchange gains and losses arise from changes in the values of assets and liabilities, including investments in securities at fiscal period-end, resulting from changes in the exchange rate.
C. Derivative Instruments
Certain of the Funds may be subject to equity price risk, commodity risk, interest rate risk and foreign currency exchange risk in the normal course of pursuing their investment objectives. Certain of the Funds may invest in various financial instruments including positions in foreign currency contracts, written and purchased option contracts and futures contracts to gain exposure to or hedge against changes in the value of equities or foreign currencies. The following is a description of the derivative instruments utilized by the Funds, including the primary underlying risk exposure related to each instrument type.
Futures Contracts – Certain of the Funds may purchase and sell futures contracts. A Fund may use futures contracts to gain exposure to, or hedge against changes in the value of equities, interest rates, commodities prices or foreign currencies. Upon entering into a contract, the Fund deposits and maintains as collateral such initial margin as required by the exchange on which the transaction is affected. Pursuant to the contract, the Fund agrees to receive from or pay to the broker an amount of cash equal to the daily fluctuation in value of the contract. Such receipts or payments are known as “variation margin” and are recorded by the Fund as unrealized gains and losses. When the contract is closed, the Fund records a realized gain or loss equal to the difference between the value of the contract at the time it was opened and the value at the time it was closed. As collateral for futures contracts, the Fund is required under the 1940 Act to maintain assets consisting of cash, cash equivalents or liquid securities. This collateral is required to be adjusted daily to reflect the market value of the purchase obligation for long futures contracts or the market value of the instrument underlying the contract, but not less than the market price at which the futures contract was established, for short futures contracts.
Options Contracts –Certain Funds may purchase put and call options and write put and call options. The premium paid for a purchased put or call option plus any transaction costs will reduce the benefit, if any, realized by a Fund upon exercise of the option, and, unless the price of the underlying security rises or declines sufficiently, the option may expire worthless to
| RATIONAL FUNDS | |
| CONSOLIDATED NOTES TO FINANCIAL STATEMENTS (Continued) |
| December 31, 2018 | ANNUAL REPORT |
the Funds. In addition, in the event that the price of the security in connection with which an option was purchased moves in a direction favorable to the Funds, the benefits realized by the Funds as a result of such favorable movement will be reduced by the amount of the premium paid for the option and related transaction costs.
When a Fund writes an option, an amount equal to the premium received by the Fund is recorded as a liability and is subsequently adjusted to the current fair value of the option written. Premiums received from writing options that expire unexercised are treated by the Funds on the expiration date as realized gains from investments. The difference between the premium and the amount paid on effecting a closing purchase transaction, including brokerage commissions, is also treated as a realized gain, or, if the premium is less than the amount paid for the closing purchase transaction, as a realized loss. If a call option is exercised, the premium is added to the proceeds from the sale of the underlying security or currency in determining whether the Funds have realized gains or losses. If a put option is exercised, the premium reduces the cost basis of the securities purchased by the Funds.
Written and purchased options are non-income producing securities. With options, there is minimal counterparty risk to the Funds since these options are exchange traded and the exchange’s clearinghouse acts as counterparty to all exchange traded options and guarantees against a possible default. Initial margin deposits required upon entering into options contracts are satisfied by the deposits of cash as collateral for the account of the broker (the Fund’s agent in acquiring the options).
The derivatives are not accounted for as hedging instruments under GAAP. The effect of derivative instruments on the Statements of Assets and Liabilities and Consolidated Statements of Assets and Liabilities at December 31, 2018, were as follows:
| | | | | | | Location of derivatives on Statements | | Fair value of asset/liability | |
| Fund | | Derivative | | Risk Type | | of Assets and Liabilities | | derivatives | |
| Hedged Return Fund | | | | | | | |
| | | Written Options | | Equity | | Options Written | | $ | (9,825 | ) |
| | | | | | | | | | | |
| Resolve Adaptive | | | | | | | | |
| | | Futures | | Equity | | Futures unrealized depreciation | | $ | (132,413 | ) |
| | | | | | | | | | | |
| | | | | Interest | | Futures unrealized appreciation | | | 1,093,094 | |
| | | | | | | Totals | | $ | 960,681 | |
| Iron Horse Fund | | | | | | | | |
| | | Written Options | | Equity | | Options Written | | $ | (415,403 | ) |
| | | | | | | | | | | |
| NuWave Enhanced | | | | | | | | |
| | | Futures | | Equity | | Futures unrealized appreciation | | $ | 14,076 | |
| | | | | | | Futures unrealized depreciation | | | (4,067 | ) |
| | | | | Commodity | | Futures unrealized appreciation | | | 63,595 | |
| | | | | | | Futures unrealized depreciation | | | (279,912 | ) |
| | | | | Currency | | Futures unrealized appreciation | | | 7,022 | |
| | | | | | | Futures unrealized depreciation | | | (23,459 | ) |
| | | | | Interest | | Futures unrealized appreciation | | | 289,180 | |
| | | | | | | Futures unrealized depreciation | | | (79,038 | ) |
| | | | | | | Totals | | $ | (12,603 | ) |
| RATIONAL FUNDS | |
| CONSOLIDATED NOTES TO FINANCIAL STATEMENTS (Continued) |
| December 31, 2018 | ANNUAL REPORT |
The effect of derivative instruments on the Statements of Operations and Consolidated Statements of Operations for the Funds, for the year or period ended December 31, 2018, were as follows:
| | | | | | | | | Realized and unrealized gain | |
| Fund | | Derivative | | Risk Type | | Location of gain (loss) on derivatives | | (loss) on derivatives | |
| Hedged Return | | | | | | | | |
| | | Options Written | | Equity | | Net realized gain from options written | | $ | 892,902 | |
| | | | | | | | | | | |
| | | Options Written | | Equity | | Net change in unrealized depreciation on options written | | $ | (612 | ) |
| | | | | | | | | | | |
| Resolve Adaptive | | | | | | | | |
| | | Futures | | Equity | | Net realized gain/loss from futures | | $ | (1,073,541 | ) |
| | | | | Commodity | | Net realized gain/loss from futures | | | (1,764,907 | ) |
| | | | | Currency | | Net realized gain/loss from futures | | | (499,624 | ) |
| | | | | Interest | | Net realized gain/loss from futures | | | 167,968 | |
| | | | | | | Totals | | $ | (3,170,104 | ) |
| | | | | | | | | | | |
| | | Futures | | Equity | | Net change in unrealized depreciation on futures | | $ | (142,294 | ) |
| | | | | Commodity | | Net change in unrealized depreciation on futures | | | (52,788 | ) |
| | | | | Currency | | Net change in unrealized depreciation on futures | | | (123,244 | ) |
| | | | | Interest | | Net change in unrealized appreciation on futures | | | 1,071,965 | |
| | | | | | | Totals | | $ | 753,639 | |
| | | | | | | | | | | |
| | | | | | | | | Realized and unrealized gain | |
| Fund | | Derivative | | Risk Type | | Location of gain (loss) on derivatives | | (loss) on derivatives | |
| Iron Horse | | | | | | | | |
| | | Options Purchased | | Equity | | Net realized gain from options purchased | | | 6,446 | |
| | | Options Written | | Equity | | Net realized gain from options written | | | 104,629 | |
| | | | | | | | | $ | 111,075 | |
| | | | | | | | | | | |
| | | Options Purchased | | Equity | | Net change in unrealized appreciation on options purchased | | $ | 95,165 | |
| | | Options Written | | Equity | | Net change in unrealized appreciation on options written | | | 260,327 | |
| | | | | | | Totals | | $ | 355,492 | |
| NuWave Enhanced | | | | | | | | |
| | | Futures | | Equity | | Net realized gain/loss from futures | | $ | 198,995 | |
| | | | | Commodity | | Net realized gain/loss from futures | | | 1,437,335 | |
| | | | | Currency | | Net realized gain/loss from futures | | | 120,852 | |
| | | | | Interest | | Net realized gain/loss from futures | | | (98,348 | ) |
| | | | | | | Totals | | $ | 1,658,834 | |
| | | | | | | | | | | |
| | | Futures | | Equity | | Net change in unrealized appreciation on futures | | $ | 10,009 | |
| | | | | Commodity | | Net change in unrealized depreciation on futures | | | (216,317 | ) |
| | | | | Currency | | Net change in unrealized depreciation on futures | | | (16,437 | ) |
| | | | | Interest | | Net change in unrealized appreciation on futures | | | 210,142 | |
| | | | | | | Totals | | $ | (12,603 | ) |
| | | | | | | | | | | |
The value of derivative instruments outstanding as of December 31, 2018 as disclosed in the Portfolios of Investments (Consolidated Portfolios of Investments for Resolve Adaptive and NuWave Enhanced) and the amounts realized and changes in unrealized gains and losses on derivative instruments during the period as disclosed above and within the Statements of Operations (Consolidated Statements of Operations for Resolve Adaptive and NuWave Enhanced) serve as indicators of the volume of derivative activity for the Funds.
| RATIONAL FUNDS | |
| CONSOLIDATED NOTES TO FINANCIAL STATEMENTS (Continued) |
| December 31, 2018 | ANNUAL REPORT |
Balance Sheet Offsetting Information
The following table provides a summary of offsetting financial liabilities derivatives and the effect of the derivative instruments on the Statements of Assets and Liabilities as of December 31, 2018:
| | | | | | | | | | | | Gross Amounts of Assets Presented in the | | | | |
| | | | | | | | | | | | (Consolidated) Statement of Assets & Liabilities | | | | |
| | | | | | Gross Amounts | | | Net Amounts | | | | | | | | | | |
| | | Gross Amounts | | | Offset in the | | | Presented in the | | | | | | | | | | |
| | | Recognized in the | | | (Consolidated) | | | (Consolidated) | | | | | | | | | | |
| | | (Consolidated) | | | Statements of | | | Statements of | | | | | | | | | | |
| | | Statements of Assets | | | Assets and | | | Assets and | | | Financial | | | | | | | |
| | | and Liabilities | | | Liabilities | | | Liabilities | | | Instruments | | | Cash Collateral Pledged/Received (1) | | | Net Amount | |
| Hedged Return | | | | | | | | | | | | | | | | | | | | | | | | |
| Description of Liability: | | | | | | | | | | | | | | | | | | | | | | | | |
| Written Option | | $ | 9,825 | | | $ | — | | | $ | 9,825 | | | $ | — | | | $ | 9,825 | | | $ | — | |
| Resolve Adaptive | | | | | | | | | | | | | | | | | | | | | | | | |
| Description of Asset: | | | | | | | | | | | | | | | | | | | | | | | | |
| Futures Contracts | | $ | 1,093,094 | | | $ | — | | | $ | 1,093,094 | | | $ | (132,413 | ) | | $ | — | | | $ | 960,681 | |
| Description of Liability: | | | | | | | | | | | | | | | | | | | | | | | | |
| Futures Contracts | | $ | 132,413 | | | $ | — | | | $ | 132,413 | | | $ | 132,413 | | | $ | — | | | $ | — | |
| Iron Horse | | | | | | | | | | | | | | | | | | | | | | | | |
| Description of Liability: | | | | | | | | | | | | | | | | | | | | | | | | |
| Written Option | | $ | 415,403 | | | $ | — | | | $ | 415,403 | | | $ | 415,403 | | | $ | — | | | $ | — | |
| Nuwave Enhanced | | | | | | | | | | | | | | | | | | | | | | | | |
| Description of Asset: | | | | | | | | | | | | | | | | | | | | | | | | |
| Futures Contracts | | $ | 373,872 | | | $ | — | | | $ | 373,872 | | | $ | (373,872 | ) | | $ | — | | | $ | — | |
| Description of Liability: | | | | | | | | | | | | | | | | | | | | | | | | |
| Futures Contracts | | $ | 386,475 | | | $ | — | | | $ | 386,475 | | | $ | 373,872 | | | $ | 12,603 | | | $ | — | |
| | | | | | | | | | | | | | | | | | | | | | | | | |
| (1) | The amount is limited to the derivative liability balance and accordingly does not include excess collateral pledged. |
D. Security Transactions and Related Income
During the period, investment transactions are accounted for no later than the first calculation of the NAV on the business day following the trade date. For financial reporting purposes, however, security transactions are accounted for on the trade date on the last business day of the reporting period. Discounts and premiums on securities purchased are accreted and amortized over the lives of the respective securities using the effective interest method. Securities gains and losses are calculated on the identified cost basis. Interest income and expenses are accrued daily. Dividends, less foreign tax withholding (if any), are recorded on the ex-dividend date. Withholding taxes and capital gains on foreign dividends have been provided for in accordance with the Funds’ understanding of the applicable country’s tax rules and rates.
E. Dividends and Distributions to Shareholders
Dividends from net investment income are declared and paid annually by the Hedged Return, Dynamic Brands, Resolve Adaptive and NuWave Enhanced. Dividends from net investment income are declared and paid quarterly by the Strategic Allocation and Iron Horse. Dividends from net investment income are declared and paid monthly by Dividend Capture and Income Opportunities. Net realized capital gains, if any, are distributed at least annually.
The amount of dividends from net investment income and net realized gains recorded on the ex-dividend date are determined in accordance with the federal income tax regulations, which may differ from GAAP and are recorded on ex-date. These “book/tax” differences are either considered temporary or permanent in nature. To the extent these differences are permanent in nature (e.g. tax treatment of foreign currency gain/loss, non-deductible stock issuance costs, distributions and income received from pass through investments and net investment loss adjustments), such amounts are
| RATIONAL FUNDS | |
| CONSOLIDATED NOTES TO FINANCIAL STATEMENTS (Continued) |
| December 31, 2018 | ANNUAL REPORT |
| | |
reclassified within the capital accounts based on their nature for federal income tax purposes; temporary differences do not require reclassification. Temporary differences are primarily due to market discounts, capital loss carryforwards and losses deferred due to wash sales, straddles and return of capital from investments.
Dividends are declared separately for each class. No class has preferential rights; differences in per share dividend rates are generally due to differences in separate class expenses.
Certain Funds may own shares of real estate investments trusts (“REITs”) which report information on the source of their distributions annually. Distributions received from investments in REITs in excess of income from underlying investments are recorded as realized gain and/or as a reduction to the cost of the individual REIT.
Certain of the Funds may invest in Master Limited Partnerships (“MLPs”), which generally are treated as partnerships for Federal income tax purposes. As a limited partner in the MLPs, the Funds include their allocable share of the MLPs’ taxable income in computing its own taxable income. Investments in MLPs and MLP-related securities involve risks different from those of investing in common stock including risks related to limited control and limited rights to vote on matters affecting the MLP or MLP-related security, risks related to potential conflicts of interest between an MLP and the MLP’s general partner, cash flow risks, dilution risks (which could occur if the MLP raises capital and then invests it in projects whose return fails to exceed the cost of capital raised) and risks related to the general partner’s limited call right. MLPs and MLP-related securities are generally considered interest-rate sensitive investments. During periods of interest rate volatility, these investments may not provide attractive returns. Depending on the state of interest rates in general, the use of MLPs or MLP-related securities could enhance or harm the overall performance of the Fund.
F. Allocation of Expenses, Income, and Gains and Losses
Expenses directly attributable to a Fund are charged to that Fund. Expenses not directly attributable to a Fund are allocated proportionally among various Funds or all Funds within the Trust in relation to the net assets of each Fund or on another reasonable basis. Income, non-class specific expenses and realized/unrealized gains or losses are allocated to each class based on relative net assets. Distribution fees are charged to each respective share class in accordance with the distribution plan.
G. Federal Income Taxes
It is the policy of each Fund to qualify or continue to qualify as a regulated investment company by complying with the provisions available to certain investment companies, as defined in applicable sections of the Internal Revenue Code, and to make distributions of net investment income and net realized capital gains sufficient to relieve it from all, or substantially all, federal income taxes.
The Funds recognize the tax benefits of uncertain tax positions only where the position is “more likely than not” to be sustained assuming examination by tax authorities. Management has analyzed each Fund’s tax positions and has concluded that no liability for unrecognized tax benefits should be recorded related to uncertain tax positions taken on returns filed for open tax years ended December 31, 2016 to December 31, 2017 (as applicable), or expected to be taken in the Funds’ December 31, 2018 year-end tax returns. Each Fund identifies its major tax jurisdictions as U.S. Federal, and foreign jurisdictions where the Funds make significant investments; however the Funds are not aware of any tax positions for which it is reasonably possible that the total amounts of unrecognized tax benefits will change materially in the next twelve months. The Funds recognize interest and penalties, if any, related to unrecognized tax benefits, as income tax expenses in the Statements of Operations.
H. Indemnification
The Trust indemnifies its Officers and Trustees for certain liabilities that may arise from the performance of their duties to the Trust. Additionally, in the normal course of business, the Funds enter into contracts that contain a variety of representations and warranties and which provide general indemnities. The Funds’ maximum exposure under these arrangements is unknown, as this would involve future claims that may be made against the Funds that have not yet occurred. However, based on experience, the risk of loss due to these warranties and indemnities appears to be remote.
| RATIONAL FUNDS | |
| CONSOLIDATED NOTES TO FINANCIAL STATEMENTS (Continued) |
| December 31, 2018 | ANNUAL REPORT |
| | |
| (3) | FEES AND OTHER TRANSACTIONS WITH AFFILIATES AND OTHER SERVICE PROVIDERS |
Investment Advisory Fee— Rational Advisors, Inc., (the “Advisor”) serves as the Funds’ investment adviser. Under the terms of the Advisory Agreement, the Advisor manages the investment operations of the Funds in accordance with each Fund’s respective investment policies and restrictions. The Funds’ sub-advisors are responsible for the day-to-day management of each Fund’s portfolios. The Advisor provides the Funds with investment advice and supervision and furnishes an investment program for the Funds. For its investment management services, the Funds pay to the Advisor, as of the last day of each month, an annualized fee as shown in the below table, such fees to be computed daily based upon daily average net assets of the Funds. The Funds’ sub-advisors are paid by the Advisor, not the Funds.
| Fund | | Advisory Fee Tiered Annual Rate | |
| | | Rate for the First $500 Million | | | Rate for the Next $500 Million | | | Rate for Excess Over $1 Billion | |
| Dividend Capture | | | 0.75 | % | | | 0.70 | % | | | 0.65 | % |
| Dynamic Brands | | | 0.75 | % | | | 0.70 | % | | | 0.65 | % |
| | | | | | | | | | | | | |
| | | Advisory Fee Annual Rate | | | | | | | | | |
| Strategic Allocation | | | 0.10 | % | | | | | | | | |
| Resolve Adaptive | | | 1.75 | % | | | | | | | | |
| Hedged Return | | | 1.75 | % | | | | | | | | |
| Iron Horse | | | 1.25 | % | | | | | | | | |
| Income Opportunities | | | 1.50 | % | | | | | | | | |
| NuWave Enhanced | | | 1.75 | % | | | | | | | | |
The Advisor has contractually agreed to waive all or a portion of its investment advisory fee (based on average daily net assets) and/or reimburse certain operating expenses of each Fund to the extent necessary in order to limit each Fund’s total annual fund operating expenses (after the fee waivers and/or expense reimbursements, and exclusive of acquired fund fees and expenses, brokerage costs, interest, taxes and dividends, and extraordinary expenses) as listed below:
| | | Expense Caps |
| Fund | | Institutional Class Shares | | Class A Shares | | Class C Shares | | |
| Dividend Capture | | 1.00% | | 1.25% | | 2.00% | (a) | | April 30, 2019 |
| Hedged Return | | 1.99% | | 2.24% | | 2.99% | | | April 30, 2019 |
| Dynamic Brands | | 1.00% | | 1.25% | | 2.00% | (a) | | April 30, 2019 |
| Strategic Allocation | | 0.45% | | 0.70% | | 1.45% | | | April 30, 2019 |
| Resolve Adaptive | | 1.97% | | 2.22% | | 2.97% | | | April 30, 2019 |
| Iron Horse | | 1.70% | | 1.95% | | 2.70% | | | April 30, 2019 |
| Income Opportunities | | 1.75% | | 2.00% | | 2.75% | | | April 30, 2019 |
| NuWave Enhanced | | 1.99% | | 2.24% | | 2.99% | | | April 30, 2019 |
| (a) | Prior to May 1, 2018 the expense cap was 1.75%. |
| RATIONAL FUNDS | |
| CONSOLIDATED NOTES TO FINANCIAL STATEMENTS (Continued) |
| December 31, 2018 | ANNUAL REPORT |
Amounts waived or reimbursed in the contractual period may be recouped by the Advisor within three years of the waiver and/or reimbursement. As of December 31, 2018, the following amounts have been waived or reimbursed by the Advisor and are subject to repayment by the respective Fund:
| | | | | |
| | | Amount Waived or | | Expiring Beginning |
| Fund | | Reimbursed | | December 31, |
| Dividend Capture | | 358,384 | | 2019 |
| | | 161,810 | | 2020 |
| | | 156,337 | | 2021 |
| Hedged Return | | 125,307 | | 2019 |
| | | 105,599 | | 2020 |
| | | 148,732 | | 2021 |
| Dynamic Brands | | 180,941 | | 2019 |
| | | 120,009 | | 2020 |
| | | 175,690 | | 2021 |
| Strategic Allocation | | 94,726 | | 2019 |
| | | 62,598 | | 2020 |
| | | 79,043 | | 2021 |
| Resolve Adaptive | | 49,241 | | 2019 |
| | | 117,608 | | 2020 |
| | | 148,267 | | 2021 |
| Iron Horse | | 171,089 | | 2019 |
| | | 75,447 | | 2020 |
| | | 82,832 | | 2021 |
| Income Opportunities | | 103,260 | | 2021 |
| NuWave Enhanced | | 116,911 | | 2021 |
The Independent Trustees are paid a quarterly retainer, and receive compensation for each committee meeting, telephonic Board meeting, and special in-person Board meeting attended. Officers receive no compensation from the Trust. The Trust reimburses each of the Independent Trustees for travel and other expenses incurred in connection with attendance at such meetings. The Trust has no retirement or pension plans. Additional information regarding the Trust’s Trustees is available in the Funds’ Statement of Additional Information.
The Board has adopted the Trust’s Distribution Plan (the “12b-1 Plan”) which allows each Fund to pay fees up to 0.25% for the class A shares and up to 1.00% for the class C shares based on average daily net assets of each class to financial intermediaries (which may be paid through the Funds’ distributor) for the sale and distribution of these shares. Pursuant to the 12b-1 Plan, the Funds may finance from their assets certain activities or expenses that are intended primarily to result in the sale of Fund shares and to reimburse Northern Lights Distributors, LLC. (the “Distributor”) and Advisor for distribution related expenses. For the year or period ended December 31, 2018, the amounts accrued by the Funds were as follows:
| | | 12b-1 Fees | |
| Fund | | Class A | | | Class C | |
| Dividend Capture | | $ | 41,344 | | | $ | 22,689 | |
| Hedged Return | | | 13,379 | | | | 11 | |
| Dynamic Brands | | | 31,505 | | | | 2,479 | |
| Strategic Allocation | | | 28,777 | | | | 11 | |
| Resolve Adaptive | | | 3,817 | | | | 3,528 | |
| Iron Horse | | | 9,042 | | | | 15 | |
| Income Opportunities | | | 7 | | | | 8 | |
| NuWave Enhanced | | | 4,715 | | | | 192 | |
| RATIONAL FUNDS | |
| CONSOLIDATED NOTES TO FINANCIAL STATEMENTS (Continued) |
| December 31, 2018 | ANNUAL REPORT |
Shareholder Servicing Fees –The Trust has adopted a Shareholder Servicing Plan pursuant to which the Funds may pay Shareholder Services Fees up to 0.25% of the average daily net assets to financial intermediaries for providing shareholder assistance, maintaining shareholder accounts and communicating or facilitating purchases and redemptions of shares for Institutional Class and Class A Shares.
In addition, certain affiliates of the Distributor provide services to the Funds as follows:
Gemini Fund Services, LLC(“GFS”) – GFS an affiliate of the Distributor, provides administrative, fund accounting, and transfer agency services to the Funds pursuant to agreements with the Trust, for which it receives from each Fund the greater of an annual minimum fee or an asset based fee, which scales downward based upon net assets for fund administration, fund accounting and transfer agency services and are reflected as such on the Statements of Operations. The Funds also pay GFS for any out-of-pocket expenses. Officers of the Trust are also employees of GFS, and are not paid any fees directly by the Trust for serving in such capacity.
Blu Giant, LLC (“Blu Giant”) – Blu Giant, an affiliate of GFS and the Distributor, provides EDGAR conversion and filing services as well as print management services for the Funds on an ad-hoc basis. For the provision of these services, Blu Giant receives customary fees from the Funds, which is included in printing expenses on the Statements of Operations.
Pursuant to the Management Services Agreement between the Trust and MFund Services LLC (“MFund”), an affiliate of the Advisor, MFund provides the Funds with various management and administrative services. For these services, the Funds pay MFund an annual base fee plus an annual asset-based fee, which scales downward based upon net assets. In addition, the Funds reimburse MFund for any reasonable out- of- pocket expenses incurred in the performance of its duties under the Management Services Agreement. These fees are included in MFund Services Fees on the Statements of Operations.
Pursuant to the Compliance Services Agreements, MFund provides chief compliance officer services to the Funds. For these services, the Funds pay MFund an annual base fee plus an annual asset-based fee based upon net assets. In addition, the Funds reimburse MFund for any reasonable out- of- pocket expenses incurred in the performance of its duties under the Compliance Services Agreement. The amounts due to MFund at December 31, 2018 for management and chief compliance officer services are listed in the Statements of Assets and Liabilities under “Fees Payable to Affiliate.”
An Officer of the Trust is also the controlling member of MFund and the Advisor, and is not paid any fees directly by the Trust for serving in such capacity.
CIM Securities, LLC acted as the broker of record on executions of purchases and sales on the Dividend Capture Fund’s portfolio investments. For those services, CIM Securities, LLC received $61,213 in brokerage commissions from the Fund for the year ended December 31, 2018. Certain Officers and/or employees of PVG Asset Management Corp. the Fund’s sub-advisor, have an affiliation with CIM Securities, LLC.
| RATIONAL FUNDS | |
| CONSOLIDATED NOTES TO FINANCIAL STATEMENTS (Continued) |
| December 31, 2018 | ANNUAL REPORT |
Affiliated Funds—Affiliated companies are mutual funds that are advised by Catalyst Capital Advisors, AlphaCentric Advisors, LLC or Rational Advisors, Inc. Companies that are affiliates of the Funds’ at December 31, 2018, are noted in the Strategic Allocation Fund’s Portfolios of Investments. A summary of these investments in affiliated funds is set forth below:
| | | Balance | | | | | | | | | Balance | | | | | | Dividends | | | Amount of Gain | |
| | | December 31, | | | | | | | | | December 31, | | | | | | Credited to | | | (Loss) Realized on | |
| Fund | | 2017 | | | Purchases | | | Sales | | | 2018 | | | Fair Value | | | Income | | | Sale of Shares | |
| AlphaCentric Income Opportunities Fund, Inst. Sh. | | | 89,680 | | | | 1,237 | | | | 90,917 | | | | — | | | | — | | | | 15,156 | | | | 67,053 | |
| Catalyst Buyback Strategy Fund, Inst. Sh. | | | — | | | | 22,903 | | | | — | | | | 22,903 | | | | 222,843 | | | | 4,998 | | | | — | |
| Catalyst Dynamic Alpha Fund, Inst. Sh. | | | 47,960 | | | | — | | | | 47,960 | | | | — | | | | — | | | | — | | | | 387,926 | |
| Catalyst Floating Rate Income Fund, Inst. Sh. | | | 65,744 | | | | 11,537 | | | | 77,281 | | | | — | | | | — | | | | 11,773 | | | | 19,705 | |
| Catalyst Insider Buying Fund, Inst. Sh. | | | — | | | | 12,960 | | | | — | | | | 12,960 | | | | 214,230 | | | | — | | | | — | |
| Catalyst Insider Income Fund Inst. Sh. | | | 65,370 | | | | 12,554 | | | | — | | | | 77,924 | | | | 727,813 | | | | 17,099 | | | | — | |
| Catalyst IPOx Allocation Fund Inst. Sh. | | | — | | | | 18,826 | | | | — | | | | 18,826 | | | | 218,946 | | | | 7,711 | | | | 20,010 | |
| Catalyst MLP & Infrastructure Fund, Inst, Sh. | | | 152,852 | | | | 19,501 | | | | 13,711 | | | | 158,642 | | | | 661,415 | | | | 49,601 | | | | (7,844 | ) |
| Catalyst/MAP Global Equity Fund, Inst. Sh. | | | — | | | | 10,884 | | | | — | | | | 10,884 | | | | 142,317 | | | | 222 | | | | 12,841 | |
| Catalyst/Stone Beach Income Opportunity Fund, Inst. Sh. | | | 162,746 | | | | 7,212 | | | | 10,384 | | | | 159,574 | | | | 1,496,805 | | | | 68,383 | | | | (396 | ) |
| Rational Dividend Capture Fund, Inst. Sh. | | | 126,703 | | | | 44 | | | | 126,747 | | | | — | | | | — | | | | 349 | | | | 151,705 | |
| Rational Dynamic Brands Fund, Inst. Sh.* | | | 29,994 | | | | 481 | | | | 12,703 | | | | 17,772 | | | | 607,792 | | | | 16,171 | | | | (144,055 | ) |
| Rational Income Opportunities Fund, Inst. Sh. | | | — | | | | 204,208 | | | | — | | | | 204,208 | | | | 2,052,265 | | | | 44,570 | | | | 20 | |
| Rational NuWave Enhanced Market Opportunity Fund, Inst. Sh. | | | — | | | | 95,849 | | | | — | | | | 95,849 | | | | 1,396,518 | | | | 159,769 | | | | 1,329 | |
| Rational Risk Managed Emerging Markets Fund, Inst. Sh. | | | 278,214 | | | | 27,458 | | | | 305,672 | | | | — | | | | — | | | | — | | | | (352,658 | ) |
| Strategy Shares Ecological Strategy ETF | | | 39,183 | | | | — | | | | 18,215 | | | | 20,968 | | | | 822,784 | | | | 3,118 | | | | 247,647 | |
| Strategy Shares NASDAQ 7 Handl Index ETF | | | — | | | | 43,000 | | | | — | | | | 43,000 | | | | 952,450 | | | | 60,823 | | | | — | |
| Strategy Shares US Market Rotation Strategy ETF | | | 39,569 | | | | — | | | | 34,500 | | | | 5,069 | | | | 169,964 | | | | 5,544 | | | | 472,236 | |
| * | 1 for 10 reverse stock split effective September 21, 2018, shares are adjusted to account for the split. |
| (4) | INVESTMENT TRANSACTIONS |
For the year or period ended December 31, 2018, aggregate purchases and proceeds from sales of investment securities (excluding short-term investments) for the Funds were as follows:
| Fund | | Purchases | | | Sales | |
| Dividend Capture | | $ | 79,620,315 | | | $ | 92,657,584 | |
| Hedged Return | | | — | | | | — | |
| Dynamic Brands | | | 91,982,341 | | | | 88,473,410 | |
| Strategic Allocation | | | 6,172,230 | | | | 8,664,569 | |
| Resolve Adaptive | | | — | | | | — | |
| Iron Horse | | | 19,591,645 | | | | 26,563,494 | |
| Income Opportunities | | | 5,721,374 | | | | 1,246,825 | |
| NuWave Enhanced | | | 137,665,460 | | | | 123,465,537 | |
| | | | | | | | | |
In accordance with its investment objectives and through its exposure to the managed futures programs, Resolve Adaptive and NuWave Enhanced may have increased or decreased exposure to one or more of the following risk factors defined below:
Commodity Risk – Commodity risk relates to the change in value of commodities or commodity indexes as they relate to increases or decreases in the commodities market. Commodities are physical assets that have tangible properties. Examples of these types of assets are crude oil, heating oil, metals, livestock, and agricultural products.
Foreign Exchange Rate Risk – Foreign exchange rate risk relates to the change in the U.S. dollar value of a security held that is denominated in a foreign currency. The U.S. dollar value of a foreign currency denominated security will decrease as the dollar appreciates against the currency, while the U.S. dollar value will increase as the dollar depreciates against the currency.
Interest Rate Risk – Interest rate risk refers to the fluctuations in value of fixed-income securities resulting from the inverse relationship between price and yield. For example, an increase in general interest rates will tend to reduce the market value
| RATIONAL FUNDS | |
| CONSOLIDATED NOTES TO FINANCIAL STATEMENTS (Continued) |
| December 31, 2018 | ANNUAL REPORT |
of already issued fixed-income investments, and a decline in general interest rates will tend to increase their value. In addition, debt securities with longer maturities, which tend to have higher yields, are subject to potentially greater fluctuations in value from changes in interest rates than obligations with shorter maturities.
Volatility Risk – Volatility risk refers to the magnitude of the movement, but not the direction of the movement, in a financial instrument’s price over a defined time period. Large increases or decreases in a financial instrument’s price over a relative time period typically indicate greater volatility risk, while small increases or decreases in its price typically indicate lower volatility risk.
In accordance with its investment objectives and through its exposure to options, the Iron Horse Fund and Hedged Return Fund may have increased or decreased exposure to Option Risk factors defined below:
Options Risk – The Iron Horse and Hedged Return are subject to equity price risks in the normal course of pursuing their investment objective and may purchase or sell options. The seller (writer) of a call option which is covered (e.g., the writer holds the underlying security) assumes the risk of a decline in the market price of an underlying security below the purchase price of an underlying security less the premium received, and gives up the opportunity for gain on the underlying security above the exercise price of the option. The seller of an uncovered call option assumes the risk of a theoretical unlimited increase in the market price of an underlying security above the exercise price of the option. The securities necessary to satisfy the exercise of the call option may be unavailable for purchase except at much higher prices. Purchasing securities to satisfy the exercise of the call option can itself cause the price of securities to rise further, sometimes by a significant amount, thereby exacerbating the loss. The buyer of a call option assumes the risk of losing its entire premium invested in the call option. The seller (writer) of a put option which is covered (e.g., the writer has a short position in the underlying security) assumes the risk of an increase in the market price of the underlying security above the sales price (in establishing the short position) of the underlying security plus the premium received, and gives up the opportunity for gain on the underlying security below the exercise price of the option. The seller of an uncovered put option assumes the risk of a decline in the market price of the underlying security below the exercise price of the option. The buyer of a put option assumes the risk of losing his entire premium invested in the put option.
Please refer to the Funds’ prospectus for a full listing of risks associated with these investments.
| (6) | AGGREGATE UNREALIZED APPRECIATION AND DEPRECIATION – TAX BASIS |
The identified cost of investments in securities owned by each Fund for federal income tax purposes (including options written), and its respective gross unrealized appreciation and depreciation at December 31, 2018, were as follows:
| | | | | | Gross | | | Gross | | | Net Unrealized | |
| | | Tax | | | Unrealized | | | Unrealized | | | Appreciation/ | |
| | | Cost | | | Appreciation | | | Depreciation | | | (Depreciation) | |
| Dividend Capture | | | 21,922,994 | | | | 371,317 | | | | (3,234,952 | ) | | | (2,863,635 | ) |
| Hedged Return | | | 20,293,753 | | | | — | | | | — | | | | — | |
| Dynamic Brands | | | 25,902,980 | | | | 812,700 | | | | (700,377 | ) | | | 112,323 | |
| Strategic Allocation | | | 9,979,781 | | | | 401,214 | | | | (643,977 | ) | | | (242,763 | ) |
| Resolve Adaptive | | | 28,525,426 | | | | — | | | | — | | | | — | |
| Iron Horse | | | 8,932,941 | | | | 245,140 | | | | (868,487 | ) | | | (623,347 | ) |
| Income Opportunities | | | 4,538,238 | | | | 49,705 | | | | (55,810 | ) | | | (6,105 | ) |
| NuWave Enhanced | | | 16,407,727 | | | | 328,821 | | | | (2,060,979 | ) | | | (1,732,158 | ) |
| RATIONAL FUNDS | |
| CONSOLIDATED NOTES TO FINANCIAL STATEMENTS (Continued) |
| December 31, 2018 | ANNUAL REPORT |
| (7) | DISTRIBUTIONS TO SHAREHOLDERS AND TAX COMPONENTS OF CAPITAL |
The tax character of fund distributions paid for the year or period ended December 31, 2018 and December 31, 2017 was as follows:
| For fiscal year or period ended | | Ordinary | | | Long-Term | | | Return of | | | | |
| 12/31/2018 | | Income | | | Capital Gains | | | Capital | | | Total | |
| Dividend Capture | | $ | 1,586,633 | | | $ | — | | | $ | — | | | $ | 1,586,633 | |
| Hedged Return | | | 172,762 | | | | 252,330 | | | | — | | | | 425,092 | |
| Dynamic Brands | | | 814,716 | | | | — | | | | — | | | | 814,716 | |
| Strategic Allocation | | | 385,129 | | | | 259,129 | | | | — | | | | 644,258 | |
| Resolve Adaptive | | | 286,185 | | | | — | | | | — | | | | 286,185 | |
| Iron Horse | | | 322,910 | | | | 121,581 | | | | 391,773 | | | | 836,264 | |
| Income Opportunities | | | 91,521 | | | | 132 | | | | 5,204 | | | | 96,857 | |
| NuWave Enhanced | | | 1,717,251 | | | | 278,449 | | | | — | | | | 1,995,700 | |
| | | | | | | | | | | | | | | | | |
| For fiscal year or period ended | | Ordinary | | | Long-Term | | | Return of | | | | |
| 12/31/2017 | | Income | | | Capital Gains | | | Capital | | | Total | |
| Dividend Capture | | $ | 2,396,564 | | | $ | — | | | $ | — | | | $ | 2,396,564 | |
| Hedged Return | | | 311,816 | | | | — | | | | — | | | | 311,816 | |
| Dynamic Brands | | | 1,231,156 | | | | 2,812,381 | | | | — | | | | 4,043,537 | |
| Strategic Allocation | | | 463,261 | | | | — | | | | 107,881 | | | | 571,142 | |
| Resolve Adaptive | | | 37 | | | | 4,244 | | | | — | | | | 4,281 | |
| Iron Horse | | | 50,235 | | | | — | | | | 617,108 | | | | 667,343 | |
| Income Opportunities | | | — | | | | — | | | | — | | | | — | |
| NuWave Enhanced | | | — | | | | — | | | | — | | | | — | |
| | | | | | | | | | | | | | | | | |
As of December 31, 2018, the components of accumulated earnings/(deficit) on a tax basis were as follows:
| | | Undistributed | | | Undistributed | | | Post October Loss | | | Capital Loss | | | Other | | | Unrealized | | | Total | |
| | | Ordinary | | | Long-Term | | | and | | | Carry | | | Book/Tax | | | Appreciation/ | | | Accumulated | |
| | | Income | | | Capital Gains | | | Late Year Loss | | | Forwards | | | Differences | | | (Depreciation) | | | Earnings/(Deficits) | |
| Dividend Capture | | $ | 853,427 | | | $ | — | | | $ | (740,865 | ) | | $ | (5,119,623 | ) | | $ | — | | | $ | (2,863,635 | ) | | $ | (7,870,696 | ) |
| Hedged Return | | | — | | | | 290,071 | | | | — | | | | (2,370,575 | ) | | | — | | | | — | | | | (2,080,504 | ) |
| Dynamic Brands | | | — | | | | — | | | | (108,608 | ) | | | — | | | | — | | | | 108,520 | | | | (88 | ) |
| Strategic Allocation | | | — | | | | — | | | | (58,787 | ) | | | — | | | | — | | | | (242,763 | ) | | | (301,550 | ) |
| Resolve Adaptive | | | — | | | | — | | | | (14,878 | ) | | | (571,904 | ) | | | — | | | | (106 | ) | | | (586,888 | ) |
| Iron Horse | | | — | | | | — | | | | — | | | | — | | | | (2,128 | ) | | | (623,347 | ) | | | (625,475 | ) |
| Income Opportunities | | | — | | | | — | | | | (2,447 | ) | | | — | | | | — | | | | (6,105 | ) | | | (8,552 | ) |
| NuWave Enhanced | | | — | | | | 105,630 | | | | — | | | | — | | | | — | | | | (1,732,276 | ) | | | (1,626,646 | ) |
The difference between book basis and tax basis unrealized appreciation (depreciation), undistributed ordinary income (loss) and accumulated net realized gain (loss) from investments is primarily attributable to the tax deferral of losses on wash sales and straddles, mark-to-market on open futures contracts, and adjustments for partnerships, real estate investment trusts, C-Corporation return of capital distributions, and trust preferred securities. The unrealized appreciation (depreciation) in the table above includes unrealized foreign currency losses of $(3,803), $(106), and $(118) for the Dynamic Brands Fund, Resolve Adaptive Asset Allocation Fund, and NuWave Enhanced Market Opportunity Fund respectively. In
| RATIONAL FUNDS | |
| CONSOLIDATED NOTES TO FINANCIAL STATEMENTS (Continued) |
| December 31, 2018 | ANNUAL REPORT |
addition, the amount listed under other book/tax differences for the Iron Horse Fund is primarily attributable to the tax deferral of losses on straddles.
Late year losses incurred after December 31 within the fiscal year are deemed to arise on the first business day of the following fiscal year for tax purposes. The Funds incurred and elected to defer such late year losses as follows:
| | | Late Year | |
| | | Losses | |
| Dividend Capture | | $ | — | |
| Hedged Return | | | — | |
| Dynamic Brands | | | — | |
| Strategic Allocation | | | — | |
| Resolve Adaptive | | | 14,878 | |
| Iron Horse | | | — | |
| Income Opportunities | | | — | |
| NuWave Enhanced | | | — | |
Capital losses incurred after October 31 within the fiscal year are deemed to arise on the first business day of the following fiscal year for tax purposes. The Funds incurred and elected to defer such capital losses as follows:
| | | Post October | |
| | | Losses | |
| Dividend Capture | | $ | 740,865 | |
| Hedged Return | | | — | |
| Dynamic Brands | | | 108,608 | |
| Strategic Allocation | | | 58,787 | |
| Resolve Adaptive | | | — | |
| Iron Horse | | | — | |
| Income Opportunities | | | 2,447 | |
| NuWave Enhanced | | | — | |
At December 31, 2018, the Funds had capital loss carry forwards for federal income tax purposes available to offset future capital gains along with capital loss carry forwards utilized and expired in the current year as follows:
| | | | | | Non- Expiring | | | Non-Expiring | | | | | | Capital Loss Carry | | | Capital Loss Carry | |
| | | Expiring | | | Short-Term | | | Long-Term | | | Total | | | Forwards Utilized | | | Forwards Expired | |
| Dividend Capture | | $ | — | | | $ | 2,252,148 | | | $ | 2,867,475 | | | $ | 5,119,623 | | | $ | 49,416 | | | $ | — | |
| Hedged Return* | | | — | | | | 463,904 | | | | 1,906,671 | | | | 2,370,575 | | | | 92,691 | | | | 2,136,294 | |
| Dynamic Brands | | | — | | | | — | | | | — | | | | — | | | | — | | | | — | |
| Strategic Allocation | | | — | | | | — | | | | — | | | | — | | | | 502,978 | | | | — | |
| Resolve Adaptive | | | — | | | | 210,140 | | | | 361,764 | | | | 571,904 | | | | — | | | | — | |
| Iron Horse | | | — | | | | — | | | | — | | | | — | | | | 25,071 | | | | — | |
| Income Opportunities | | | — | | | | — | | | | — | | | | — | | | | — | | | | — | |
| NuWave Enhanced | | | — | | | | — | | | | — | | | | — | | | | — | | | | — | |
| | | | | | | | | | | | | | | | | | | | | | | | | |
| * | The Rational Hedged Return Fund experienced a shareholder change in ownership resulting in an annual limitation on the amount of pre-change capital loss carry forwards available to be recognized in each year. Due to IRC Section 382 limitations, utilization of these carry forwards is limited to a maximum of $92,691 per year. |
| RATIONAL FUNDS | |
| CONSOLIDATED NOTES TO FINANCIAL STATEMENTS (Continued) |
| December 31, 2018 | ANNUAL REPORT |
| | |
Permanent book and tax differences, primarily attributable to the book/tax basis treatment of non-deductible expenses, net operating losses, the reclassification of Fund distributions, the expiration of capital loss carry forwards, and tax adjustments for equalization debits, and the Resolve Adaptive Asset Allocation Fund’s wholly owned subsidiary, resulted in reclassifications for the Funds for the fiscal year or period ended December 31, 2018 as follows:
| | | Paid In | | | Accumulated | |
| | | Capital | | | Earnings (Deficit) | |
| Dividend Capture | | $ | 21 | | | $ | (21 | ) |
| Hedged Return | | | (2,120,118 | ) | | | 2,120,118 | |
| Dynamic Brands | | | — | | | | — | |
| Strategic Allocation | | | — | | | | — | |
| Resolve Adaptive | | | (1,830,013 | ) | | | 1,830,013 | |
| Iron Horse | | | — | | | | — | |
| Income Opportunities | | | (5,204 | ) | | | 5,204 | |
| NuWave Enhanced | | | (19,764 | ) | | | 19,764 | |
| | | | | | | | | |
| (8) | UNDERLYING INVESTMENTS IN OTHER INVESTMENT COMPANIES |
Each underlying fund, including each exchange-traded fund (“ETF”), is subject to specific risks, depending on the nature of the underlying fund. These risks could include liquidity risk, sector risk, foreign and related currency risk, as well as risks associated with real estate investments and commodities. Investors in the Funds will indirectly bear fees and expenses charged by the underlying investment companies in which the Funds invest in addition to the Funds’ direct fees and expenses.
The performance of the Funds will be directly affected by the performance of the Federated Treasury Obligations Fund, Institutional Class. The Federated Treasury Obligations Fund normally invests at least 95% of its assets in U.S. Government securities and repurchase agreements for those securities. The financial statements of the Federated Treasury Obligations Fund, including the portfolio of investments, can be found at the Securities and Exchange Commission’s (“SEC”) website www.sec.gov and should be read in conjunction with the Fund’s financial statements. As of December 31, 2018, the percentage of the Hedged Return Fund’s net assets invested in the Federated Treasury Obligations Fund was 55.4%.
The performance of the Funds will be directly affected by the performance of the Fidelity Institutional Government Portfolio, Institutional Class. The Fidelity Institutional Government Portfolio normally invests at least 95% of its assets in U.S. Government securities and repurchase agreements for those securities. The financial statements of the Fidelity Institutional Government Portfolio, including the portfolio of investments, can be found at the Securities and Exchange Commission’s (“SEC”) website www.sec.gov and should be read in conjunction with the Fund’s financial statements. As of December 31, 2018, the percentage of the Resolve Adaptive’s Fund’s net assets invested in the Fidelity Institutional Government Portfolio was 95.2%.
| RATIONAL FUNDS | |
| CONSOLIDATED NOTES TO FINANCIAL STATEMENTS (Continued) |
| December 31, 2018 | ANNUAL REPORT |
The beneficial ownership, either directly or indirectly, of more than 25% of the voting securities of a fund creates a presumption of control of the fund, under Section 2(a)(9) of the 1940 Act. As of December 31, 2018, the companies that held more than 25% of the voting securities of the Funds, and may be deemed to control each respective Fund, are as follows:
| | | Dividend | | | Hedged | | | Dynamic | | | Strategic | | | Resolve | | | Iron | | | Income | | | NuWave | |
| | | Capture | | | Return | | | Brands | | | Allocation | | | Adaptive | | | Horse | | | Opportunities | | | Enhanced | |
| Troy W Buckner | | | — | | | | — | | | | — | | | | — | | | | — | | | | — | | | | — | | | | 37.75 | % |
| NFS LLC(1) | | | 58.21 | % | | | — | | | | 43.52 | % | | | 95.21 | % | | | — | | | | — | | | | 45.18 | % | | | — | |
| Charles Schwab(1) | | | — | | | | 64.82 | % | | | — | | | | — | | | | 47.23 | % | | | 35.45 | % | | | — | | | | 36.30 | % |
| LPL Financial | | | — | | | | — | | | | — | | | | — | | | | — | | | | 26.69 | % | | | — | | | | — | |
| (1) | This owner is comprised of multiple investors and accounts. |
Effective September 21, 2018 the Rational Dynamic Brands Fund underwent a 1-for-10 reverse share split. The effect of the share split was to divide the number of outstanding shares of the Fund by the split factor, with a corresponding increase in the net asset value per share. This transaction did not change the net assets of the Fund or the value of a shareholder’s investment.
| (11) | NEW ACCOUNTING PRONOUNCEMENTS |
In March 2017, the Financial Accounting Standards Board (FASB) issued Accounting Standards Update (ASU) No. 2017-08, Receivables—Nonrefundable Fees and Other Costs (Subtopic 310-20): Premium Amortization on Purchased Callable Debt Securities. The amendments in the ASU shorten the amortization period for certain callable debt securities, held at a premium, to be amortized to the earliest call date. The ASU does not require an accounting change for securities held at a discount; which continues to be amortized to maturity. The ASU is effective for fiscal years and interim periods within those fiscal years beginning after December 15, 2018. Management is currently evaluating the impact, if any, of applying this provision.
In August 2018, the FASB issued Accounting Standards Update (“ASU”) No. 2018-13, which changes certain fair value measurement disclosure requirements. The new ASU, in addition to other modifications and additions, removes the requirement to disclose the amount and reasons for transfers between Level 1 and Level 2 of the fair value hierarchy, and the policy for the timing of transfers between levels. For investment companies, the amendments are effective for financial statements issued for fiscal years beginning after December 15, 2019, and interim periods within those fiscal years. Early adoption is allowed. These amendments have been adopted with these financial statements.
In August 2018, the Securities and Exchange Commission adopted amendments to certain disclosure requirements under Regulation S-X to conform to US GAAP, including: (i) an amendment to require presentation of the total, rather than the components, of distributable earnings on the Statements of Assets and Liabilities; and (ii) an amendment to require presentation of the total, rather than the components, of distributions to shareholders, except for tax return of capital distributions, if any, on the Statements of Changes in Net Assets. The amendments also removed the requirement for parenthetical disclosure of undistributed net investment income on the Statements of Changes in Net Assets. These amendments have been adopted with these financial statements.
Subsequent events after the date of the Statements of Assets and Liabilities have been evaluated through the date the financial statements were issued. Management has determined that no events or transactions occurred requiring adjustment or disclosure in the financial statements, other than the following.
Effective January 4, 2019, the Rational Hedged Return Fund’s name changed to the Rational Tactical Return Fund.
| RATIONAL FUNDS | |
| CONSOLIDATED NOTES TO FINANCIAL STATEMENTS (Continued) |
| December 31, 2018 | ANNUAL REPORT |
| | |
Effective February 1, 2019, NorthStar Financial Services Group, LLC, the parent company of Gemini Fund Services, LLC (“GFS”) and its affiliated companies including Northern Lights Distributors, LLC (“NLD”), Northern Lights Compliance Services, LLC (“NLCS”) and Blu Giant, LLC (“Blu Giant”) (collectively, the “Gemini Companies”), sold its interest in the Gemini Companies to a third party private equity firm that contemporaneously acquired Ultimus Fund Solutions, LLC (an independent mutual fund administration firm) and its affiliates (collectively, the “Ultimus Companies”). As a result of these separate transactions, the Gemini Companies and the Ultimus Companies are now indirectly owned through a common parent entity, The Ultimus Group, LLC.
REPORT OF INDEPENDENT REGISTERED PUBLIC ACCOUNTING FIRM
To the Shareholders of Rational Dividend Capture Fund, Rational Hedged Return Fund, Rational Dynamic Brands Fund, Rational Strategic Allocation Fund, Rational/Resolve Adaptive Asset Allocation Fund (formerly, Rational Dynamic Momentum Fund), Rational Iron Horse Fund, Rational Income Opportunities Fund, and Rational NuWave Enhanced Market Opportunity Fund and Board of Trustees of Mutual Fund and Variable Insurance Trust
Opinion on the Financial Statements
We have audited the accompanying statements of assets and liabilities, including the portfolios of investments, of Rational Dividend Capture Fund, Rational Hedged Return Fund, Rational Dynamic Brands Fund, Rational Strategic Allocation Fund, Rational Iron Horse Fund and Rational Income Opportunities Fund, and the consolidated statements of assets and liabilities, including the consolidated portfolios of investments, of Rational/Resolve Adaptive Asset Allocation Fund and Rational NuWave Enhanced Market Opportunity Fund (the “Funds”), each a series of Mutual Fund and Variable Insurance Trust, as of December 31, 2018, and the related statements of operations for the year then ended, the statements of changes in net assets for each of the two years or periods in the period then ended, including the related notes, and the financial highlights for each of the years or periods indicated in the period then ended for Rational Dividend Capture Fund, Rational Hedged Return Fund, Rational Dynamic Brands Fund, Rational Strategic Allocation Fund and Rational Iron Horse Fund, and the consolidated statement of operations for the year then ended, the consolidated statements of changes in net assets for the two years in the period then ended, including the related notes, and the consolidated financial highlights for the three periods in the period then ended for Rational/Resolve Adaptive Asset Allocation Fund, and the consolidated statements of operations and changes in net assets, including the related notes, and the consolidated financial highlights for the period February 28, 2018 (commencement of operations) through December 31, 2018 for Rational NuWave Enhanced Market Opportunity Fund, and the statements of operations and changes in net assets, including the related notes, and the financial highlights for the period April 23, 2018 (commencement of operations) through December 31, 2018 for Rational Income Opportunities Fund (collectively referred to as the “financial statements”). In our opinion, the financial statements present fairly, in all material respects, the financial position of each of the Funds as of December 31, 2018, the results of their operations, the changes in their net assets, and the financial highlights for the periods indicated above, in conformity with accounting principles generally accepted in the United States of America.
The Funds’ financial highlights for the periods ended December 31, 2015, and prior, with the exception of Rational Iron Horse Fund, were audited by other auditors whose report dated February 29, 2016, expressed an unqualified opinion on those financial statements and financial highlights.
Basis for Opinion
These financial statements are the responsibility of the Funds’ management. Our responsibility is to express an opinion on the Funds’ financial statements based on our audits. We are a public accounting firm registered with the Public Company Accounting Oversight Board (United States) (“PCAOB”) and are required to be independent with respect to the Funds in accordance with the U.S. federal securities laws and the applicable rules and regulations of the Securities and Exchange Commission and the PCAOB.
We conducted our audits in accordance with the standards of the PCAOB. Those standards require that we plan and perform the audit to obtain reasonable assurance about whether the financial statements are free of material misstatement, whether due to error or fraud.
Our audits included performing procedures to assess the risks of material misstatement of the financial statements, whether due to error or fraud, and performing procedures that respond to those risks. Such procedures included examining, on a test basis, evidence regarding the amounts and disclosures in the financial statements. Our procedures included confirmation of securities owned as of December 31, 2018, by correspondence with the custodian and brokers or by other appropriate auditing procedures where replies from brokers or counterparties were not received. Our audits also included evaluating the accounting principles used and significant estimates made by management, as well as evaluating the overall presentation of the financial statements. We believe that our audits provide a reasonable basis for our opinion.
We have served as the Funds’ auditor since 2016, with the exception of the Rational Iron Horse Fund, which we have served as the Fund’s auditor since 2011.
COHEN & COMPANY, LTD.
Cleveland, Ohio
March 1, 2019
| RATIONAL FUNDS |
| INFORMATION ABOUT YOUR FUNDS’ EXPENSES (Unaudited) |
As a shareholder of the Fund(s), you incur two types of costs: (1) transaction costs, including sales charges (loads) on purchase payments; and (2) ongoing costs, including management fees, distribution and/or service (12b-1) fees; and other Fund expenses. The example below is intended to help you understand your ongoing costs (in dollars) of investing in the Funds and to compare these costs with the ongoing costs of investing in other mutual funds.
The example below illustrates an investment of $1,000 invested at the beginning of the period (07/01/18) and held for the entire period through 12/31/18.
Actual Expenses
The first section of each table below provides information about actual account values and actual expenses. You may use the information in these sections, together with the amount you invested, to estimate the expenses that you paid over the period. Simply divide your account value by $1,000 (for example, an $8,600 account value divided by $1,000 = 8.6), then multiply the result by the number in the first row under the heading entitled “Expenses Paid During the Period” to estimate the expenses you paid on your account during this period.
Hypothetical Example for Comparison Purposes
The second section of each table provides information about the hypothetical account values and hypothetical expenses based on each Fund’s actual expense ratio and an assumed rate of return of 5% per year before expenses, which is not the Funds’ actual return. The hypothetical account values and expenses may not be used to estimate the actual ending account balance or expenses you paid for the period. You may use this information to compare the ongoing costs of investing in the Funds and other funds. To do so, compare this 5% hypothetical example with the 5% hypothetical examples that appear in the shareholder reports of the other funds.
Please note that the expenses shown in the table are meant to highlight your ongoing costs only and do not reflect any transactional costs, such as sales charges (loads) or exchange fees. Therefore, the second section of the table is useful in comparing ongoing costs only, and will not help you determine the relative total costs of owning different funds. In addition, if these transactional costs were included, your costs would have been higher. For more information on transactional costs, please refer to the Funds’ prospectus.
| | | | | | | | | | | | | | | Hypothetical | |
| | | | | | | | | Actual | | | (5% return before expenses) | |
| | | | | | | | | | | | | |
| | | Fund’s | | | Beginning | | | Ending | | | Expenses Paid | | | Ending | | | | |
| | | Annualized | | | Account Value | | | Account Value | | | During Period | | | Account Value | | | Expenses Paid | |
| | | Expense Ratio | | | 07/01/2018 | | | 12/31/2018 | | | * | | | 12/31/2018 | | | During Period * | |
| | | | | | | | | | | | | | | | | | | |
| Rational Dividend Capture Fund - Class A | | | 1.25 | % | | $ | 1,000.00 | | | $ | 878.70 | | | $ | 5.92 | | | $ | 1,018.90 | | | $ | 6.36 | |
| Rational Dividend Capture Fund - Class C | | | 2.00 | % | | | 1,000.00 | | | | 876.40 | | | | 9.46 | | | | 1,015.12 | | | | 10.16 | |
| Rational Dividend Capture Fund - Institutional Class | | | 1.00 | % | | | 1,000.00 | | | | 880.10 | | | | 4.74 | | | | 1,020.16 | | | | 5.09 | |
| Rational Hedged Return Fund - Class A | | | 2.24 | % | | | 1,000.00 | | | | 1,054.80 | | | | 11.60 | | | | 1,013.91 | | | | 11.37 | |
| Rational Hedged Return Fund - Class C | | | 2.99 | % | | | 1,000.00 | | | | 1,050.90 | | | | 15.46 | | | | 1,010.13 | | | | 15.15 | |
| Rational Hedged Return Fund - Institutional Class | | | 1.99 | % | | | 1,000.00 | | | | 1,054.30 | | | | 10.30 | | | | 1,015.17 | | | | 10.11 | |
| Rational Dynamic Brands Fund - Class A | | | 1.25 | % | | | 1,000.00 | | | | 930.90 | | | | 6.08 | | | | 1,018.90 | | | | 6.36 | |
| Rational Dynamic Brands Fund - Class C | | | 2.00 | % | | | 1,000.00 | | | | 929.90 | | | | 9.73 | | | | 1,015.12 | | | | 10.16 | |
| Rational Dynamic Brands Fund - Institutional Class | | | 1.00 | % | | | 1,000.00 | | | | 932.40 | | | | 4.87 | | | | 1,020.16 | | | | 5.09 | |
| Rational Strategic Allocation Fund - Class A | | | 0.70 | % | | | 1,000.00 | | | | 964.60 | | | | 3.47 | | | | 1,021.68 | | | | 3.57 | |
| Rational Strategic Allocation Fund - Class C | | | 1.45 | % | | | 1,000.00 | | | | 960.50 | | | | 7.17 | | | | 1,017.90 | | | | 7.37 | |
| Rational Strategic Allocation Fund - Insitutional Class | | | 0.45 | % | | | 1,000.00 | | | | 965.70 | | | | 2.23 | | | | 1,022.94 | | | | 2.29 | |
| Rational/Resolve Adaptive Asset Allocation Fund - Class A ** | | | 2.22 | % | | | 1,000.00 | | | | 932.40 | | | | 10.81 | | | | 1,014.01 | | | | 11.27 | |
| Rational Resolve Adaptive Asset Allocation Fund - Class C ** | | | 2.97 | % | | | 1,000.00 | | | | 928.80 | | | | 14.44 | | | | 1,010.23 | | | | 15.05 | |
| Rational/Resolve Adaptive Asset Allocation Fund - Institutional Class ** | | | 1.97 | % | | | 1,000.00 | | | | 933.50 | | | | 9.60 | | | | 1,015.27 | | | | 10.01 | |
| Rational Iron Horse - Class A | | | 1.95 | % | | | 1,000.00 | | | | 1,018.80 | | | | 9.92 | | | | 1,015.38 | | | | 9.91 | |
| Rational Iron Horse - Class C | | | 2.30 | % | | | 1,000.00 | | | | 1,017.20 | | | | 11.69 | | | | 1,013.61 | | | | 11.67 | |
| Rational Iron Horse - Institutional Class | | | 1.70 | % | | | 1,000.00 | | | | 1,020.30 | | | | 8.66 | | | | 1,016.64 | | | | 8.64 | |
| Rational Income Opportunities Fund - Class A | | | 2.00 | % | | | 1,000.00 | | | | 1,014.90 | | | | 10.16 | | | | 1,015.12 | | | | 10.16 | |
| Rational Income Opportunities Fund - Class C | | | 2.75 | % | | | 1,000.00 | | | | 1,010.30 | | | | 13.93 | | | | 1,011.34 | | | | 13.94 | |
| Rational Income Opportunities Fund - Institutional Class | | | 1.75 | % | | | 1,000.00 | | | | 1,016.00 | | | | 8.89 | | | | 1,016.38 | | | | 8.89 | |
| Rational NuWave Enhanced Market Opportunity Fund - Class A | | | 2.24 | % | | | 1,000.00 | | | | 1,068.50 | | | | 11.68 | | | | 1,013.91 | | | | 11.37 | |
| Rational NuWave Enhanced Market Opportunity Fund - Class C | | | 2.99 | % | | | 1,000.00 | | | | 1,065.20 | | | | 15.56 | | | | 1,010.13 | | | | 15.15 | |
| Rational NuWave Enhanced Market Opportunity Fund - Class Institutional | | | 1.99 | % | | | 1,000.00 | | | | 1,070.20 | | | | 10.38 | | | | 1,015.17 | | | | 10.11 | |
| * | Expenses are equal to the Funds’ annualized expense ratios multiplied by the average account value over the period, multiplied by 184/365 to reflect the one-half year period. |
| ** | Annualized expense ratio does not include interest expenses or dividend expenses. |
For more information on Fund expenses, please refer to the Funds’ prospectus, which can be obtained from your investment representative or by calling 1-866-447-4228. Please read it carefully before you invest or send money.
| RATIONAL FUNDS | |
| SUPPLEMENTAL INFORMATION (Unaudited) |
| December 31, 2018 | ANNUAL REPORT |
Consideration and Renewal of Management Agreement between Rational Advisors, Inc. and Mutual Fund and Variable Insurance Trust with respect to Rational Dividend Capture Fund, Rational Hedged Return Fund, Rational Dynamic Brands Fund, and Rational Strategic Allocation Fund.
In connection with a regular meeting held on December 14, 2018, the Board of Trustees (the “Board” or the “Trustees”) of Mutual Fund and Variable Insurance Trust (the “Trust”), including a majority of the Trustees who are not “interested persons” as that term is defined in the Investment Company Act of 1940, as amended, discussed the renewal of the management agreement between the Trust and Rational Advisors, Inc. (“Rational”), with respect to Rational Dividend Capture Fund, Rational Hedged Return Fund, Rational Dynamic Brands Fund, and Rational Strategic Allocation Fund (each a “Renewal Fund” collectively the “Renewal Funds”) (the “Management Agreement”). Counsel assisted the Trustees in reviewing Rational’s responses to a series of questions regarding, among other things, the investment performance of each Renewal Fund, Rational’s services to each Renewal Fund, comparative fee and expense information, and Rational’s profitability from advising each Renewal Fund (the “Rational 15c Response”). The Trustees relied upon the advice of counsel and their own business judgment in evaluating and weighting each of the factors to be considered. The conclusions reached by the Trustees were based upon a comprehensive evaluation and discussion of all the information provided in the Rational 15c Response for each Renewal Fund with respect to the renewal of the Management Agreement. The Trustees also considered the information presented at Board meetings throughout the year.
Nature, Extent and Quality of Services.The Trustees noted their familiarity with the key personnel serving the Renewal Funds and discussed the consistent and quality services provided by the team of qualified professionals at Rational. The Trustees then discussed the nature of Rational’s operations, its financial condition and resources, and its strong culture of compliance, noting there were no new compliance or regulatory issues. The Board considered that Rational continued to enhance its risk management program and noted that the risk management team regularly evaluates each Renewal Fund’s performance with respect to volatility, drawdowns and returns relative to their respective investment objective and historical performance. After further discussion and review of the Rational 15c Response, the Trustees concluded that Rational will continue to provide an acceptable level of services to the Renewal Funds.
Performance.The Trustees reviewed the performance of each Renewal Fund relative to a peer group and its respective Morningstar category for various periods ended September 30, 2018.
Dividend Capture Fund. The Trustees noted the Fund underperformed its peer group and the Large Value Morningstar category, while also lagging the S&P 500 Total Return Index and the S&P 500 Value Total Return Index, for the one, five and ten-year periods. The Trustees noted that the Fund was losing assets. A representative of Rational stated the defensive strategy of the Fund during the bull market caused the Fund to underperform and then discussed Rational’s expectation for improved performance under the current volatile market conditions. A representative of Rational also discussed the performance of the Fund relative to other funds seeking a high dividend yield
| RATIONAL FUNDS | |
| SUPPLEMENTAL INFORMATION (Unaudited) (Continued) |
| December 31, 2018 | ANNUAL REPORT |
and discussed how those comparable funds were also underperforming. The Board concluded that the Dividend Capture Fund’s performance was not unacceptable.
Hedged Return Fund. The Trustees noted for the one-year period, the Fund outperformed its peer group and the Managed Futures and Options-Based Morningstar categories but had underperformed its peer group and the Options-Based Morningstar category for the five and ten-year periods. They noted that, in December 2017, a new sub-advisor was appointed and a new investment strategy was implemented for the Fund, and recognized the Fund’s strong performance since that time. A representative of Rational informed the Trustees that year-to-date the Hedged Return Fund was in the first percentile of its Morningstar Options-Based category and was currently the best performing Fund in the Rational family of funds. He noted that the Fund lagged the S&P 500 Index for the one year period but that the Fund’s underperformance relative to the S&P 500 Index was not unexpected for this options-based strategy based on market conditions. The Board determined that it was satisfied with the Fund’s recently improved performance.
Dynamic Brands Fund. The Trustees noted the Dynamic Brands Fund outperformed its peer group and the Large Blend and Large Growth and Morningstar categories for the one-year period, while underperforming its peer group and the Morningstar categories for the three, five, and ten-year periods. The Board noted the addition of a new sub-advisor and the implementation of a new investment strategy in October 2017 and acknowledged the improved performance since that time. A representative of Rational stated that the Fund’s year to date performance was up 4.4% versus the flat performance for the S&P 500 Index. The Board determined that it was satisfied with the Fund’s recently improved performance.
Strategic Allocation Fund. The Trustees noted that the Fund’s performance for the one and three-year periods was in-line with the performance of the peer group and the Allocation 50% to 70% Equity Morningstar category. They noted for the five year and since inception periods, the Fund lagged the peer group and Morningstar category but acknowledged the change in ownership and management of Rational and that the Fund was managed by a different portfolio manager. The Board further noted that the Fund underperformed the S&P 500 Total Return Index and Balanced Allocation Indices Blend Index benchmarks and considered Rational’s explanation that this underperformance was due to a rapid advance in equities and the Fund’s defensive positioning and larger allocation to low correlation and fixed income strategies. After further consideration of the Fund’s strategy and improved performance since the change in the portfolio manager of the Fund, the Board determined that the Fund’s performance was acceptable.
Fees and Expenses.The Trustees reviewed the advisory fees for each Renewal Fund as compared to its respective peer group and respective Morningstar category.
Dividend Capture Fund. The Trustees noted the Fund’s advisory fee of 0.75% was in-line with the peer group and slightly higher than the Large Value Morningstar category. In reviewing the overall expense ratio for the Fund, the Trustees acknowledged that with the expense limitation
| RATIONAL FUNDS | |
| SUPPLEMENTAL INFORMATION (Unaudited) (Continued) |
| December 31, 2018 | ANNUAL REPORT |
agreement in effect, the net expense ratio was higher than the averages, but well within the high and low range of its peer group and Morningstar category.
Hedged Return Fund. The Trustees noted the 1.75% advisory fee for the Hedged Return Fund was above the peer group average but within the high/low range of fees of the peer group funds. The Board further noted that the Fund’s advisory fee was higher than the average of the funds in the Options Based Morningstar and Managed Futures Morningstar categories but within the high/low range of fees of the funds in Managed Futures Morningstar category and at the top of the high/low range of fees of the funds in Options Based category. The Board further noted that the Fund’s expense ratio of 2.28% was higher than the average for its peer group and Morningstar categories but within the high/low range of the peer group and Morningstar categories.
Dynamic Brands Fund. The Trustees noted the advisory fee of 0.75% was below the average for its peer group and higher than the averages of the Large Blend and Large Growth Morningstar categories but well within the high/low range of fees of the funds in each category. The Trustees further noted Dynamic Brands Fund’s expense ratio of 1.25% was below the average of its peer group, and on the lower side of the high/low range of expenses of each Morningstar category.
Strategic Allocation Fund.The Trustees noted that advisory fee of 0.10% was lower than both its peer group and the Allocation 50% - 70% Morningstar category average advisory fee. The Trustees noted that Rational receives an advisory fee from the affiliated funds that the Strategic Allocation Fund invests in. Overall, the Board noted the expense ratio for Strategic Allocation Fund of 1.79% was above the average expense ratio for both the peer group and the Morningstar category but within the high/low range of expenses of funds in the peer group and Morningstar category. The Trustees also noted that a large part of the reposted expense ratio was the expenses of the underlying funds in which the fund invests.
The Trustees discussed the allocation of fees between Rational and the respective sub-advisor of the Dividend Capture Fund, Dynamic Brands Fund and Hedged Return Fund, relative to its respective duties and other factors. The Board agreed that the allocation of fees between Rational and each sub-advisor was appropriate.
In considering the investment strategy, range of fees within each peer group and category, the size of the Renewal Funds, and in recognition of the unique strategies offered by many of the Renewal Funds, the Board determined that the advisory fees in each case were not unreasonable.
Profitability.The Trustees reviewed a profitability analysis provided for each Renewal Fund. The Trustees noted that Rational realized a loss in connection with its relationship with each Renewal Fund except the Dividend Capture Fund. With respect to the Dividend Capture Fund, the Board noted a modest profit. They considered that for each Renewal Fund, no compensation expense for Rational’s principals was allocated or included in the per Fund analysis because those persons received a share of profits rather than salary. After further discussion, the Trustees concluded that Rational’s profitability with respect to the Renewal Funds was reasonable.
| RATIONAL FUNDS | |
| SUPPLEMENTAL INFORMATION (Unaudited) (Continued) |
| December 31, 2018 | ANNUAL REPORT |
“Fall-out” Benefits. The Trustees considered fall-out benefits received by Rational and its affiliates from their relationship with the Renewal Funds and the Trust.
Economies of Scale.The Board considered Rational’s estimates of asset levels where the total expenses of a Fund would likely fall below any expense limitation agreement and Rational would no longer need to waive advisory fees and/or reimburse expenses. The Trustees agreed that breakpoints may be an appropriate way for Rational to share its economies of scale as assets of the Renewal Funds continue to increase. The Trustees determined that it did not appear that economies of scale had been reached at this time and agreed that the matter of economies of scale would be revisited as assets of the Renewal Funds materially increase.
Conclusion.No single factor was determinative to the decision of the Trustees. Having reviewed and discussed in depth such information from Rational as the Trustees believed to be reasonably necessary to evaluate the terms of the Management Agreement, and as assisted by the advice of Counsel, the Trustees concluded that renewal of the Management Agreement on behalf of the Renewal Funds was in the best interests of the shareholders of each Renewal Fund.
Consideration and Renewal of Sub-Advisory Agreement between Rational Advisors, Inc. and PVG Asset Management Corp. with respect to the Rational Dividend Capture Fund
In connection with a regular meeting held on December 14, 2018, the Board of Trustees (the “Board” or the “Trustees”) of Mutual Fund and Variable Insurance Trust (the “Trust”), including a majority of the Trustees who are not “interested persons” as that term is defined in the Investment Company Act of 1940, as amended, discussed the renewal of the sub-advisory agreement between Rational Advisors, Inc. (“Rational”) and PVG Asset Management Corp. (“PVG”) (the “Sub-Advisory Agreement”), with respect to the Rational Dividend Capture Fund (the “Fund”).
The Trustees were assisted by legal counsel throughout the review process. The Trustees relied upon the advice of legal counsel and their own business judgment in determining the material factors to be considered in evaluating the Sub-Advisory Agreement and the weight to be given to each factor considered. The conclusions reached by the Trustees were based on a comprehensive evaluation of all of the information provided. In connection with their deliberations regarding approval of the Sub-Advisory Agreement, the Trustees reviewed materials prepared by PVG (“PVG 15c Response”). The Trustees also considered the information presented at Board meetings throughout the year.
Nature, Extent & Quality of Services.The Trustees considered the consistency in sub-advisor personnel and acknowledged the many years of expertise of the portfolio management team. They noted the sub-advisor reported no material compliance or regulatory matters. The Trustees also reviewed the annual certification under Rule 17j-1 Code of Ethics for PVG as included in the Board Materials. After discussion, the Trustees concluded that the sub-advisor had personnel, resources and investment methods essential to performing its duties under the Sub-Advisory Agreement and that the nature, overall quality and extent of the sub-advisory services provided to the Fund by the sub-advisor were satisfactory.
| RATIONAL FUNDS | |
| SUPPLEMENTAL INFORMATION (Unaudited) (Continued) |
| December 31, 2018 | ANNUAL REPORT |
Performance.The Trustees recalled their discussions with Rational earlier in the meeting regarding the Fund’s performance in connection with the renewal of management agreement between Rational and the Trust. They noted that PVG began serving as sub-advisor to the Fund in January 2017 and that the Fund underperformed its peer group. the Large Value Morningstar category, the S&P 500 Total Return Index and the S&P 500 Value Total Return Index for the one period. The Trustees recalled Rational’s explanation that the defensive strategy of the Fund during the bull market caused the Fund to underperform and then noted Rational’s expectation for improved performance under the current volatile market conditions. They also noted that Rational had informed them that other funds seeking a high dividend yield were also underperforming. The Board concluded that the Dividend Capture Fund’s performance was not unacceptable.
Fees & Expenses.The Trustees noted the sub-advisor receives 50% of the net advisory fee of 0.75% (maximum of 0.375%) of assets invested in the Fund after PVG commenced serving as sub-advisor to the Fund. They acknowledged this was lower than the fees PVG receives for managing other accounts. The Trustees also considered that the sub-advisory fees paid to PVG pursuant to the Sub-Advisory Agreement were paid entirely by Rational. The Trustees concluded that the sub-advisory fee was not unreasonable, and agreed that the allocation of fees between the advisor and sub-advisor was appropriate.
Profitability.The Trustees reviewed the profitability of PVG from sub-advising the Fund and noted that PVG was currently not making a profit from sub-advising the Fund. The Board concluded that PVG’s profitability with respect to the Fund was reasonable.
“Fall-out” Benefits. The Trustees considered fall-out benefits received by PVG from its relationship with the Fund and the Trust.
Economies of Scale.The Trustees agreed that economies of scale was primarily an advisor level issue and should be considered with respect to the overall advisory contract, taking into consideration the impact of the sub-advisory expense.
Conclusion.No single factor was determinative to the decision of the Trustees. Having requested and received such information from the sub-advisor as the Trustees believed to be reasonably necessary to evaluate the terms of the Sub-Advisory Agreement, and as assisted by the advice of Counsel, the Trustees concluded that renewal of the Sub-Advisory Agreement with PVG on behalf of the Fund was in the best interests of the shareholders of the Fund.
| RATIONAL FUNDS | |
| SUPPLEMENTAL INFORMATION (Unaudited) (Continued) |
| December 31, 2018 | ANNUAL REPORT |
Consideration and Renewal of Management Agreement between Rational Advisors, Inc. and Mutual Fund and Variable Insurance Trust with respect to the Rational Resolve Adaptive Asset Allocation Fund (the “Resolve Fund”) and the Management Agreement with RDMF Fund Ltd. (the “Subsidiary”)
In connection with a regular meeting held on August 24, 2018, the Board of Trustees (the “Board” or the “Trustees”) of Mutual Fund and Variable Insurance Trust (the “Trust”), including a majority of the Trustees who are not “interested persons” as that term is defined in the Investment Company Act of 1940, as amended (the “1940 Act”), discussed the renewal of the management agreement between the Trust and Rational Advisors, Inc. (“Rational” or the “Advisor”), with respect to the Resolve Fund (the “Management Agreement”) and the management agreement for the Subsidiary.
Counsel assisted the Trustees in reviewing Rational’s responses to a series of questions regarding, among other things, the investment performance of the Resolve Fund, Rational’s service to the Resolve Fund, comparative fee and expense information, and Rational’s profitability from advising the ReSolve Fund (the “Rational 15c Response”) The Trustees relied upon the advice of counsel and their own business judgment in evaluating and weighting each of the factors to be considered. The conclusions reached by the Trustees were based upon a comprehensive evaluation and discussion of all the information provided in the Rational 15c Response for the ReSolve Fund with respect to the renewal of the Management Agreement and the management agreement with the Subsidiary. The Trustees also considered the information presented at Board meetings throughout the year.
Nature, Extent and Quality of Services. The Trustees discussed the background and experience of senior personnel at the Advisor. The Trustees then discussed the nature of Rational’s operations, its financial condition and resources, and the quality of its compliance program. They considered that the Advisor is responsible for monitoring the sub-advisor’s performance, risk management and compliance with legal standards as well as compliance in trading. The Trust’s CCO confirmed that Rational had a compliance program reasonably designed to prevent violations of applicable laws. The Board then discussed the recent addition of a risk manager to Rational’s team, noting that Rational had continued to retain its third-party risk management firm to support the new risk manager. After further discussion and review of the Rational 15c Response, the Trustees concluded that the Advisor will continue to provide an acceptable level of services to the ReSolve Fund.
Performance.The Trustees noted a new sub-advisor was appointed and material changes to the Fund’s investment strategy were implemented on March 1, 2018. The Trustees reviewed the performance of the ReSolve Fund relative to a peer group and its respective Morningstar categories over various periods. The Board noted that, for the one year period, the ReSolve Fund outperformed its peer group and Morningstar Managed Futures category, but lagged the Morningstar Tactical Allocation category and the S&P 500 Total Return Index. A representative of the Advisor reported that the Fund ranked in the top ten percent of the Morningstar Managed Futures category for the year-to-date period. After further discussion, the Trustees found the ReSolve Fund’s improving performance acceptable.
| RATIONAL FUNDS | |
| SUPPLEMENTAL INFORMATION (Unaudited) (Continued) |
| December 31, 2018 | ANNUAL REPORT |
Fees and Expenses. The Trustees reviewed the advisory fee of the ReSolve Fund compared to its respective peer group and respective Morningstar categories. The Trustees noted the advisory fee of 1.75% was higher than the average for the Managed Futures category and the Tactical Allocation category. They noted, however, that the advisory fee was not the highest in its peer group and noted the ReSolve Fund’s highly specialized strategy. The Board acknowledged that certain of the peer group funds with higher management fees utilized a unified fee structure and may not be appropriate for comparison. In reviewing the overall expense ratio, the Trustees noted it was in line with its peer group average, and above both the Managed Futures category and the Tactical Allocation category averages. The Trustees noted the expense ratio was within the high and low range of its peer group and both the Managed Futures category and Tactical Allocation category. The Board concluded the advisory fee and expenses for the ReSolve Fund were not unreasonable.
Profitability.The Trustees reviewed a profitability analysis provided for ReSolve Fund from Rational. The Board concluded that Rational’s profitability with respect to the ReSolve Fund was reasonable, and they would monitor the Advisor’s profitability as assets of the ReSolve Fund grow.
“Fall-out” Benefits. The Trustees considered fall-out benefits received by Rational and its affiliates from their relationship with the ReSolve Fund and the Trust.
Economies of Scale. The Trustees considered Rational’s estimates of asset levels where the ReSolve Fund would benefit from economies of scale. The Trustees determined, after further discussion, that economies of scale had not been reached at this time and agreed that the matter of economies of scale would be revisited as assets of the ReSolve Fund materially increase.
Conclusion.No single factor was determinative to the decision of the Trustees. Having reviewed and discussed in depth such information from the Advisor as the Trustees believed to be reasonably necessary to evaluate the terms of the management agreements, and as assisted by the advice of Counsel, the Trustees concluded that renewal of the management agreements was in the best interest of the shareholders of the ReSolve Fund and the Subsidiary.
| RATIONAL FUNDS | |
| Boards of Trustees and Trust Officers (Unaudited) (Continued) |
| December 31, 2018 | ANNUAL REPORT |
The Trustees and officers of the Trust, together with information as to their principal business occupations during the past five years and other information, are shown below. Unless otherwise noted, the address of each Trustee and Officer is 36 N. New York Avenue, Huntington, NY 11743. Each Trustee and officer also serves in the same capacity for the Strategy Shares, another open-end investment company whose series are managed by the Advisor. Collectively, the Funds, Strategy Shares, Mutual Fund Series Trust and TCG Financial Trusts I-X comprise the “Fund Complex”.
Independent Trustees Background
| | | | | Number of | |
| | | Term of Office | | Portfolios in | |
| Name, | | and | | Fund Complex | |
| Address and | Position with | Length of Time | Principal Occupation(s) | Overseen by | Other Directorships |
| Year of Birth | the Trust | Served* | During Past 5 Years | Trustee | Held During Past 5 Years |
Tobias Caldwell
Year of Birth: 1967 | Chairman of the Board and Trustee | Since January 2016 | Managing Member, Genovese Family Enterprises, LLC (family office) (1999-present); Managing Member, PTL Real Estate LLC (real estate/investment firm) (2000-present); Manager Member, Bear Properties, LLC (real estate firm) (2006-present). | 55 | Chairman of the Board, Strategy Shares (2016-present); Lead Independent Trustee and Chair of Audit Committee, Mutual Fund Series Trust (2006- present); Independent Trustee and Chair of Audit Committee, Variable Insurance Trust (2010- present); Trustee, M3Sixty Trust (2016-present); Chairman of the Board, AlphaCentric Prime Meridian Income Fund (July 2018 to present). |
Stephen P. Lachenauer
Year of Birth: 1967 | Chair of the Audit Committee and Trustee | Since January 2016 | Attorney, private practice (2011 to present). | 16 | Trustee and Chair of the Audit Committee, Strategy Shares (2016 – present); Trustee, TCG Financial Series Trusts I-X (2015-present); Trustee and Chair of the Audit Committee, AlphaCentric Prime Meridian Income Fund (July 2018 – present). |
Donald McIntosh
Year of Birth: 1967 | Trustee | Since January 2016 | Business Control & Risk Management Advisor, Santander Bank (February 2019 to present); Quality Control Advisor, Santander Bank (July 2016 – January 2019); Credit risk review analyst, Santander Holdings USA (May 2015 – 2016); Governance analyst, Santander Bank (2011 – April 2015). | 16 | Trustee, Strategy Shares (2016– present); Trustee, TCG Financial Series Trusts I-X (2015-present); Trustee, AlphaCentric Prime Meridian Income Fund (July 2018 – present). |
| RATIONAL FUNDS | |
| Boards of Trustees and Trust Officers (Unaudited) (Continued) |
| December 31, 2018 | ANNUAL REPORT |
Officers**
| Name, Address, | Position(s) Held | Term and | Principal Occupation(s) |
| Year of Birth | with Registrant | Length Served* | During Past 5 Years |
| | | | |
Jerry Szilagyi
36 N. New York
Avenue
Huntington, NY 11743
Year of Birth: 1962 | President | Since April 2016 | President, Rational Advisors, Inc., 1/2016 - present; Chief Executive Officer, Catalyst Capital Advisors LLC, 1/2006- present; Member, AlphaCentric Advisors LLC, 2/2014 to Present; Managing Member, MFund Distributors LLC, 10/2012-present; Managing Member, MFund Services LLC, 1/2012 – Present; President, Abbington Capital Group LLC, 1998- present; President, Cross Sound Capital LLC, 6/2011 to 10/2013; President, USA Mutuals, Inc., 3/2011 to 7/2016. |
| | | | |
Erik Naviloff
80 Arkay Drive
Hauppauge, New York
11788
Year of Birth: 1968 | Treasurer | Since April 2016 | Vice President – Fund Administration, Gemini Fund Services, LLC, since 2012. |
| | | | |
Aaron Smith
80 Arkay Drive.
Hauppauge, New York
11788
Year of Birth: 1974 | Assistant Treasurer | Since April 2016 | Manager - Fund Administration, Gemini Fund Services, LLC, since 2012. |
| | | | |
Frederick J. Schmidt
36 N. New York Avenue
Huntington, NY 11743
Year of Birth: 1959 | Chief Compliance Officer | Since April 2016 | Director, MFund Services LLC since 5/2015; Director & Chief Compliance Officer, Citi Fund Services, 2010-2015. |
| | | | |
Jennifer A. Bailey
36 N. New York Avenue
Huntington, NY
11743
Year of Birth: 1968 | Secretary | Since April 2016 | Director of Legal Services, MFund Services LLC, 2/2012 to present. |
| | | | |
Michael Schoonover
36 N. New York Avenue
Huntington, NY 11743
Year of Birth: 1983 | Vice President | Since June 2018 | Chief Operating Officer, Catalyst Capital Advisors LLC & Rational Advisors, Inc., June 2017 to present; Portfolio Manager, Catalyst Capital Advisors LLC 12/2013 to present; Portfolio Manager, Rational Advisors, Inc. 1/2016 to 5/2018; Senior Analyst, Catalyst Capital Advisors LLC, 3/2013 to 12/2013. |
| * | The term of office of each Trustee is indefinite. |
| ** | Officers do not receive any compensation from the Trust. |
The Fund’s Statement of Additional Information (“SAI”) includes additional information about the Trustees and is available free of charge, upon request, by calling toll-free at 1-800-253-0412.
PRIVACY NOTICE
Mutual Fund & Variable Insurance Trust
Rev. July 2017
| FACTS | WHAT DOES MUTUAL FUND & VARIABLE INSURANCE TRUST DO WITH YOUR PERSONAL INFORMATION? |
| Why? | Financial companies choose how they share your personal information. Federal law gives consumers the right to limit some, but not all sharing. Federal law also requires us to tell you how we collect, share, and protect your personal information. Please read this notice carefully to understand what we do. |
| What? | The types of personal information we collect and share depends on the product or service that you have with us. This information can include: ● Social Security number and wire transfer instructions ● account transactions and transaction history ● investment experience and purchase history When you areno longerour customer, we continue to share your information as described in this notice. |
| How? | All financial companies need to share customers’ personal information to run their everyday business. In the section below, we list the reasons financial companies can share their customers’ personal information; the reasons Mutual Fund & Variable Insurance Trust chooses to share; and whether you can limit this sharing. |
Reasons we can share your
personal information: | Does Mutual Fund &
Variable Insurance Trust
share information? | Can you limit this
sharing? |
| For our everyday business purposes -such as to process your transactions, maintain your account(s), respond to court orders and legal investigations, or report to credit bureaus. | YES | NO |
| For our marketing purposes -to offer our products and services to you. | NO | We don’t share |
| For joint marketing with other financial companies. | NO | We don’t share |
| For our affiliates’ everyday business purposes -information about your transactions and records. | NO | We don’t share |
| For our affiliates’ everyday business purposes -information about your credit worthiness. | NO | We don’t share |
| For our affiliates to market to you | NO | We don’t share |
| For non-affiliates to market to you | NO | We don’t share |
| QUESTIONS? | Call 1-800-253-0412 |
PRIVACY NOTICE
Mutual Fund & Variable Insurance Trust
| What we do: |
How does Mutual Fund & Variable Insurance Trust protect my personal information? | To protect your personal information from unauthorized access and use, we use security measures that comply with federal law. These measures include computer safeguards and secured files and buildings. Our service providers are held accountable for adhering to strict policies and procedures to prevent any misuse of your nonpublic personal information. |
How does Mutual Fund & Variable Insurance Trust collect my personal information? | We collect your personal information, for example, when you: ● open an account or deposit money ● direct us to buy securities or direct us to sell your securities ● seek advice about your investments We also collect your personal information from others, such as credit bureaus, affiliates, or other companies. |
Why can’t I limit all sharing? | Federal law gives you the right to limit only: ● sharing for affiliates’ everyday business purposes – information about your creditworthiness. ● affiliates from using your information to market to you. ● sharing for non-affiliates to market to you. State laws and individual companies may give you additional rights to limit sharing. |
| Definitions |
| Affiliates | Companies related by common ownership or control. They can be financial and non-financial companies. ● Mutual Fund & Variable Insurance Trust does not share with affiliates. |
| Non-affiliates | Companies not related by common ownership or control. They can be financial and non-financial companies. ● Mutual Fund & Variable Insurance Trust doesn’t share with non-affiliates so they can market to you. |
| Joint marketing | A formal agreement between nonaffiliated financial companies that together market financial products or services to you. ● Mutual Fund & Variable Insurance Trust doesn’t jointly market. |
A copy of the policies and procedures that the Funds use to determine how to vote proxies relating to securities held in the Funds’ portfolios, as well as a record of how the Funds voted any such proxies during the most recent 12-month period ended June 30, is available without charge and upon request by calling 800-253-0412. This information is also available from the EDGAR database on the SEC’s website at www.sec.gov.
The Funds file with the SEC a complete schedule of their portfolio holdings, as of the close of the first and third quarters of their fiscal year, on “Form N-Q.” These filings are available on the SEC’s website at www.sec.gov and may be reviewed and copied at the SEC’s Public Reference Room in Washington, DC. (call 202-551-8090 for information on the operation of the Public Reference Room.).
Rational Advisors, Inc., serves as Investment Advisor to the Funds.
This report is authorized for distribution to prospective investors only when preceded or accompanied by a prospectus which contains facts concerning the Funds’ objectives and policies, management fees, expenses and other information.
Shareholder Services:800-253-0412
(a) The Registrant has, as of the end of the period covered by this report, adopted a code of ethics that applies to the Registrant's principal executive officer, principal financial officer, and principal accounting officer or controller, or persons performing similar functions, regardless of whether these individuals are employed by the Registrant or a third party.
(b) During the period covered by this report, there were no amendments to any provision of the code of ethics.
(c) During the period covered by the report, with respect to the registrant’s code of ethics that applies to its Principal Executive Officer and Principal Financial Officer: there have been no amendments to a provision that relates to any element of the code of ethics definition enumerated in paragraph (b) of this Item 2.
| Item 3. | Audit Committee Financial Expert. |
3(a) The registrant’s board of trustees has determined that the registrant does not have an audit committee financial expert. The audit committee determined that, although none of its members meet the technical definition of an audit committee financial expert, the committee has sufficient financial expertise to adequately perform its duties under the Audit Committee Charter without the addition of a qualified expert.
| Item 4. | Principal Accountant Fees and Services. |
(a) Audit Fees. The aggregate fees billed for each of the last two fiscal years for professional services rendered by the registrant's principal accountant for the audit of the registrant's annual financial statements or services that are normally provided by the accountant in connection with statutory and regulatory filings or engagements for those fiscal years are as follows:
Fiscal year ended 2018: $76,500
Fiscal year ended 2017: $66,500
(b) Audit-Related Fees. There were no fees billed in each of the last two fiscal years for assurances and related services by the principal accountant that are reasonably related to the performance of the audit of the registrant’s financial statements and are not reported under paragraph (a) of this item.
Fiscal year ended 2018: $0
Fiscal year ended 2017: $0
(c) Tax Fees. The aggregate fees billed in each of the last two fiscal years for professional services rendered by the principal accountant for tax compliance are as follows:
Fiscal year ended 2018: $20,000
Fiscal year ended 2017: $17,500
(d) All other fees billed to the registrant by its principal accountants for the two most recent fiscal years:
Fiscal year ended 2018: $0
Fiscal year ended 2017: $0
(e)(1) The audit committee does not have pre-approval policies and procedures. Instead, the audit committee or audit committee chairman approves on a case-by-case basis each audit or non-audit service before the principal accountant is engaged by the Registrant.
(e)(2) There were no services described in each of paragraphs (b) through (d) of this Item that were approved by the audit committee pursuant to paragraph (c)(7)(i)(C) of Rule 2-01 of Regulation S-X. |
| (f) Not applicable. The percentage of hours expended on the principal accountant's engagement to audit the Registrant's financial statements for the most recent fiscal year that were attributed to work performed by persons other than the principal accountant's full-time, permanent employees was zero percent (0%). |
(g) All non-audit fees billed by the Registrant's principal accountant for services rendered to the Registrant for the fiscal years ended June 30, 2016 and 2015, respectively, are disclosed in (b)-(d) above. There were no audit or non-audit services performed by the Registrant's principal accountant for the Registrant's adviser.
Item 5. | Audit Committee of Listed Registrants.
|
Not applicable.
| Item 6. | Schedule of Investments. |
Included in annual report to shareholders filed under item 1 of this form.
| Item 7. | Disclosure of Proxy Voting Policies and Procedures for Closed-End Management Investment Companies. |
Not applicable.
| Item 8. | Portfolio Managers of Closed-End Management Investment Companies. |
Not applicable.
| Item 9. | Purchases of Equity Securities by Closed-End Management Investment Company and Affiliated Purchasers. |
Not applicable.
| Item 10. | Submission of Matters to a Vote of Security Holders. |
Not applicable.
| Item 11. | Controls and Procedures. |
(a) The registrant’s Principal Executive Officer and Principal Financial Officer, or persons performing similar functions, have concluded that the registrant’s disclosure controls and procedures (as defined in Rule 30a-3(c) under the Act) are effective in design and operation and are sufficient to form the basis of the certifications required by Rule 30a-2 under the Act, based on their evaluation of these disclosure controls and procedures within 90 days of the filing of this report on Form N-CSR.
(b) There were no changes in the registrant’s internal control over financial reporting (as defined in Rule 30a-3(d) under the Act (17 CFR 270.30a-3(d)) that occurred during the second fiscal quarter of the period covered by this report that have materially affected or are reasonably likely to materially affect, the registrant’s internal control over financial reporting.
Item 12. Disclosure of Securities Lending Activities for Closed-Ended Management Investment Companies
Not applicable.
(1) Code of Ethics for Principal Executive and Senior Financial Officers is attached hereto.
(2) Certifications pursuant to Section 302 of the Sarbanes-Oxley Act of 2002 are filed herewith.
(3) Certifications pursuant to Section 906 of the Sarbanes-Oxley Act of 2002 are filed herewith.
SIGNATURES
Pursuant to the requirements of the Securities Exchange Act of 1934 and the Investment Company Act of 1940, the registrant has duly caused this report to be signed on its behalf by the undersigned, thereunto duly authorized.
(Registrant)Mutual Fund and Variable Insurance Trust
| | | |
| By (Signature and Title) | | /s/ Jerry Szilagyi |
| | | Jerry Szilagyi, President and Principal Executive Officer |
| | | | |
| Date | | 3/8/19 | |
| | | | | | |
Pursuant to the requirements of the Securities Exchange Act of 1934 and the Investment Company Act of 1940, this report has been signed below by the following persons on behalf of the registrant and in the capacities and on the dates indicated.
| | | |
| By (Signature and Title) | | /s/ Jerry Szilagyi |
| | | Jerry Szilagyi, President and Principal Executive Officer |
| | | | |
| Date | | 3/8/19 | |
| | | | | | |
| | | |
| By (Signature and Title) | | /s/ Erik Naviloff |
| | | Erik Naviloff, Treasurer and Principal Financial Officer |
| | | | |
| Date | | 3/8/19 | |
| | | | | | |