UNITED STATES
SECURITIES AND EXCHANGE COMMISSION
Washington, D.C. 20549
FORM N-CSR
CERTIFIED SHAREHOLDER REPORT OF REGISTERED
MANAGEMENT INVESTMENT COMPANIES
Investment Company Act file number 811-05010
Mutual Fund and Variable Insurance Trust
(Exact name of registrant as specified in charter)
36 North New York Avenue
Huntington, NY 11743
(Address of principal executive offices) (Zip code)
The Corporation Trust Company
Corporate Trust Center
1209 Orange Street
Wilmington, DE 19801
(Name and address of agent for service)
Registrant’s telephone number, including area code: 1-631-629-4237
Date of fiscal year end: December 31
Date of reporting period: December 31, 2018
| Item 1. | Reports to Shareholders. |

Annual Shareholder Report
December 31, 2018
Rational Trend Aggregation VA Fund (Formerly, Rational Dividend Capture VA Fund)
Rational Insider Buying VA Fund
Beginning on January 1, 2021, as permitted by regulations adopted by the Securities and Exchange Commission, you may not be receiving paper copies of the Funds’ shareholder reports from the insurance company that offers your contract by mail, unless you specifically request paper copies of the reports from your insurance company. Instead, the reports will be made available on a website, and the insurance company will notify you by mail each time a report is posted and provided with a website link to access the report. Instructions for requesting paper copies will be provided by your insurance company.
If you already elected to receive shareholder reports electronically, you will not be affected by this change and you do not need to take any action. You may elect to receive shareholder reports and other communications from the insurance company electronically by providing the instructions provided by your insurance company. You may elect to receive all future reports in paper free of charge from your insurance company. You can inform the insurance company that you wish to continue receiving paper copies of your shareholder reports. Your election to receive reports in paper will apply to all funds available under your contract.

December 31, 2018
Rational Trend Aggregation VA Fund (Unaudited)
Dear Fellow Shareholders,
The Rational Trend Aggregation VA Fund (the “Fund”) seeks total return on investment, with dividend income as an important component of the return. On October 31, 2018 the investment strategy of the fund changed to employ a tactical approach to obtain exposure to US equity markets.
Investment Strategy
Under normal conditions the Fund invests primarily in common stock of companies (a significant portion of which pay dividends) traded on US exchanges. However, depending on the Fund’s tactical trading models, the Fund may invest all or a significant portion of its assets in cash and cash equivalents, including short-term treasury ETFs. The Fund may also invest in inverse ETFs and/or volatility Exchange Traded Notes (“ETNs”) for hedging purposes.
Fund Performance
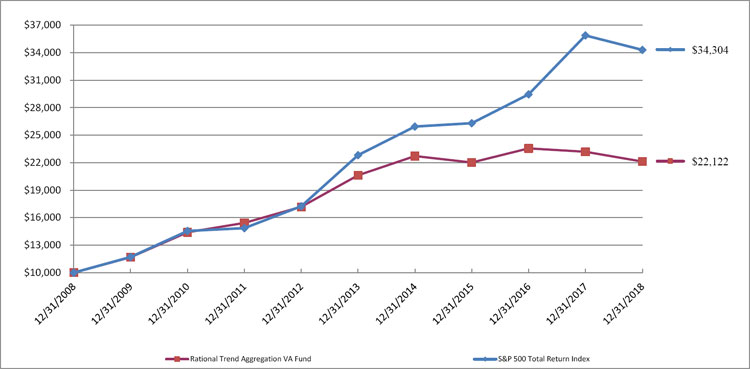
The Fund substantially outperformed the S&P 500 Index following the investment strategy change. It returned -3.17% from October 31, 2018 through December, 31, 2018 vs. a return of -7.18% for the S&P 500 over the same period. The Fund’s tactical models held large cash positions throughout the period along with positions in volatility ETNs. This helped hedge the Fund’s common stock positions.
Going into 2019 the market will be focused on the trade war with China and the Federal Reserve. The Fund will have the flexibility to be able to take advantage of any opportunities that present themselves while being able to be protective if necessary.
The Fund’s total annualized returns through 12/31/18 as compared to the S&P 500 Total Return Index were as follows:
| | 10/31/18- | | | | Since Inception |
| | 12/31/18 | 1 Year | 5 Years | 10 Years | (10/15/2001) |
| Rational Trend Aggregation VA Fund | -3.17% | -4.57%* | 1.42% | 8.26% | 5.59% |
| S&P 500 Total Return Index(1) | -7.18% | -4.38% | 8.49% | 13.12% | 7.09% |
The Fund is an Investment vehicle for variable annuity contracts. All performance figures for the fund do not include any fees, expenses, or insurance charges imposed by the insurance company’s separate account. Please review the insurance contract prospectus for further description of these fees and expenses. This product is available as a sub-account investment to a variable life insurance policy only and is not offered directly to the general public. To obtain the most recent month- end performance information or the Fund’s prospectus please call the Fund, toll free at 1-800-253-0412. You can also obtain a prospectus atwww.rationalvafunds.com.
Summary
We are much encouraged by recent comments by the Federal Reserve Chairman and the progress of trade talks with China. However, there are a number of headwinds that could slow economic growth, and the stock market with it. We are confident that the Fund will benefit from our tactical approach in the current environment.
Sincerely,
Matthew Tuttle
Portfolio Manager
| * | Does not correlate FiHis |
This report is intended for the Fund’s shareholders. It may not be distributed to prospective investors unless it is preceded or accompanied by the current Fund prospectus. To obtain a prospectus or other information about the Fund, please visit www.rationalvafunds.com or call 1-800-253-0412. Please read the prospectus carefully before investing.
| (1) | The S&P 500 Total Return Index by Standard & Poor’s Corp. is a capitalization-weighted index comprising 500 issues listed on various exchanges, representing the performance of the stock market generally. Please note that indices do not take into account any fees and expenses of investing in the individual securities that they track, and individuals cannot invest directly in any index, although individuals may invest in exchange traded funds or other investment vehicles that attempt to track the performance of an index. The Rational Trend Aggregation VA Fund may or may not purchase the types of securities represented by the S&P 500 Total Return Index. |
4226-NLD-2/1/2019
| Rational Trend Aggregation VA Fund (Formerly, Rational Dividend Capture VA Fund) |
| PORTFOLIO REVIEW (Unaudited) |
| December 31, 2018 |
The Fund’s performance figures* for each of the periods ended December 31, 2018, compared to its benchmark:
| | | Annualized |
| | 1 Year Return | 5 Year Return | 10 Year Return | Since Inception** |
| Rational Trend Aggregation VA Fund | -4.57% | 1.42% | 8.26% | 5.59% |
| S&P 500 Total Return Index(a) | -4.38% | 8.49% | 13.12% | 7.09% |
| * | The performance data quoted here represents past performance. Current performance may be lower or higher than the performance data quoted above. Investment return and principal value will fluctuate, so that shares, when redeemed, may be worth more or less than their original cost. The returns shown do not reflect the deduction of taxes that a shareholder would pay on Fund distributions or on the redemptions of Fund shares. Past performance is no guarantee of future results. See the financial highlights for the current expense ratios. Performance figures for periods greater than 1 year are annualized. Per the fee table in the Fund’s November 1, 2018 prospectus, the total annual operating expense is 1.93% before fee waivers. For performance information current to the most recent month-end, please call toll-free 1-800-253-0412. |
| ** | Inception date is October 15, 2001. |
| (a) | The S&P 500 Total Return Index is the primary benchmark; it is an unmanaged index generally representing the performance of the broad domestic economy through changes in the aggregate market value of 500 stocks representing all major industries. The S&P 500 Total Return Index does not include fees and expenses, and investors may not invest directly in an index. |
Comparison of the Change in Value of a $10,000 Investment
| Top 10 Holdings by Industry | | % of Net Assets | |
| Internet | | | 7.6 | % |
| Retail | | | 7.4 | % |
| Commercial Services | | | 5.1 | % |
| Healthcare-Services | | | 5.1 | % |
| Exchange Traded Funds | | | 5.1 | % |
| Diversified Financial Services | | | 4.9 | % |
| Software | | | 4.9 | % |
| Exchange Traded Notes | | | 4.4 | % |
| Reits | | | 4.1 | % |
| Pharmaceuticals | | | 3.1 | % |
| Other/Short-Term Investments | | | 48.3 | % |
| | | | 100.0 | % |
December 31, 2018
Rational Insider Buying VA Fund (Unaudited)
Dear Fellow Shareholders,
The Rational Insider Buying VA Fund (the “Fund”) invests in large capitalization U.S. companies that are experiencing significant corporate insider buying. Over the past year we have witnessed diverse insider buying across sectors. With a wide range of insider buying opportunities to choose from, we focused on the insider buying at companies that have the highest quality earnings growth potential and revenue growth potential. We are pleased with the performance of the strategy over the past year and we are encouraged to see persistent insider buying in attractive securities. We have positioned the Fund in the best signals of the large-cap insider buying strategy and are confident in the long-term potential of the Fund.
Investment Strategy
The Fund uses a quantitative methodology that ranks insider activity based on the strength of the signals that insiders are generating relative to how many executives are buying and how many shares they are purchasing. We believe that corporate insiders understand their own firm better than any outside investor possibly could.
The advisor uses public information that is filed with the Securities and Exchange Commission (“SEC”) on corporate insider and large shareholder buying and selling activity for its investment decisions. Numerous academic studies and our own research of insider trading data over long periods of time has resulted in the development of a proprietary method of analyzing activity that we believe can provide long-term capital appreciation. When looking at SEC filings, we focus on the insider identity (position in the company), potential motivations for buying, insider trading trends, trading volumes, firm size and other factors to select stocks for the portfolio. We sell stocks when the relevant insider trading trends reverse or when portfolio positions achieve or no longer provide targeted risk-adjusted return.
Fund Performance
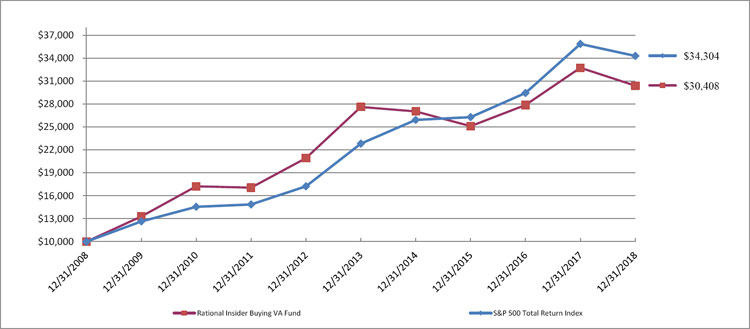
The Rational Insider Buying VA Fund trailed its S&P 500 Total Return Index benchmark during FY 2018 by 280 bps. The Fund’s performance includes relative outperformance from holdings in the communication services, energy, and industrial sectors and relative underperformance in the consumer discretionary and health care sectors.
In 2018, expanding corporate profits helped propel the equity market to all-time highs before retreating significantly in Q4. Concerns regarding global growth combined with the Federal Reserve aggressively hiking rates while shrinking their balance sheet led to the pullback in equities at the end of the year. Despite a market that was driven by a narrow group of stocks that had been pushed to record valuations, there are still companies that are trading at reasonable valuations and whose corporate insiders believe that their share prices are undervalued. We focused on the companies that have the highest quality earnings growth potential and revenue growth potential. This focus helped to drive outperformance from the Fund’s allocations within the communication services sector and provided the strongest relative outperformance compared to the benchmark. The most notable stocks in 2018 in the portfolio that generated material outperformance due to their strong earnings growth were Adobe Inc (ADBE) and Netflix (NFLX). The heavier allocation to information technology stocks over the past year breaks the pattern of the prior three years, where insider buying signals were scarce amongst information technology stocks.
Heading into the first half of 2018, the market wobbled in early February on worries that an increasing fiscal deficit would create a more hawkish Fed. Additionally, multiple index heavyweight tech stocks were impacted from negative headlines early in the year as there was a data breach at Facebook and the President posted negative tweets about Amazon. The Fund was largely insulated from the negative headlines because many of the index heavyweights do not exhibit insider buying and the Fund has no direct exposure to them. In 1Q 2018, during this market turbulence, the Fund returned 1.67% compared to -0.76% for the S&P 500 Total Return Index. The Fund finished the year for 2018 down 7.18% versus a 4.38% loss for the S&P 500 Index. We believe that investing in companies whose insiders believe their own shares are undervalued potentially provides a layer protection during market drawdowns because they may be less susceptible to valuation compression compared to their multiple-stretched peers.
The Fund’s total annualized returns through 12/31/18 as compared to the S&P 500 Total Return Index were as follows:
| | | | | Since Inception |
| | 1 Year | 5 Years | 10 Years | (05/02/04) |
| Rational Insider Buying VA Fund | -7.18% | 1.94% | 11.76% | 7.60% |
| S&P 500 Total Return Index(1) | -4.38% | 8.49% | 13.12% | 7.94% |
The Fund is an Investment vehicle for variable annuity contracts. All performance figures for the fund do not include any fees, expenses, or insurance charges imposed by the insurance company’s separate account. Please review the insurance contract prospectus for further description of these fees and expenses. This product is available as a sub-account investment to a variable life insurance policy only and is not offered directly to the general public. To obtain the most recent month- end performance information or the Fund’s prospectus please call the Fund, toll free at 1-800-253-0412. You can also obtain a prospectus atwww.rationalvafunds.com.
Summary
We hold a relatively concentrated portfolio of large-capitalization U.S. companies experiencing significant insider buying – situations where those that know the most about the company are taking their own money and putting it back in the company through open market purchases. By reviewing numerous academic studies and performing our own historical research, we’ve found that this strategy can outperform the S&P 500 Total Return Index over the long run. Successful investing requires a long-term outlook focused on objective criteria that create value. We have adopted this outlook for the Rational Insider Buying VA Fund, and we are glad that you have decided to share in our vision.
Sincerely,
David Miller
Portfolio Manager
This report is intended for the Fund’s shareholders. It may not be distributed to prospective investors unless it is preceded or accompanied by the current Fund prospectus. To obtain a prospectus or other information about the Fund, please visit www.rationalvafunds.com or call 1-800-253-0412. Please read the prospectus carefully before investing.
| (1) | The S&P 500 Total Return Index by Standard & Poor’s Corp. is a capitalization-weighted index comprising 500 issues listed on various exchanges, representing the performance of the stock market generally. Please note that indices do not take into account any fees and expenses of investing in the individual securities that they track, and individuals cannot invest directly in any index, although individuals may invest in exchange traded funds or other investment vehicles that attempt to track the performance of an index. The Rational Insider Buying VA Fund may or may not purchase the types of securities represented by the S&P 500 Total Return Index. |
4215-NLD-1/31/2019
| Rational Insider Buying VA Fund |
| PORTFOLIO REVIEW (Unaudited) |
| December 31, 2018 |
The Fund’s performance figures* for each of the periods ended December 31, 2018, compared to its benchmark:
| | | Annualized |
| | 1 Year Return | 5 Year Return | 10 Year Return | Since Inception** |
| Rational Insider Buying VA Fund | -7.18% | 1.94% | 11.76% | 7.60% |
| S&P 500 Total Return Index(a) | -4.38% | 8.49% | 13.12% | 7.94% |
| * | The performance data quoted here represents past performance. Current performance may be lower or higher than the performance data quoted above. Investment return and principal value will fluctuate, so that shares, when redeemed, may be worth more or less than their original cost. The returns shown do not reflect the deduction of taxes that a shareholder would pay on Fund distributions or on the redemptions of Fund shares. Past performance is no guarantee of future results. See the financial highlights for the current expense ratios. Performance figures for periods greater than 1 year are annualized. Per the fee table in the Fund’s May 1, 2018 prospectus, the total annual operating expense is 1.68% before fee waivers. For performance information current to the most recent month-end, please call toll-free 1-800-253-0412. |
| ** | Inception date is May 2, 2004. |
| (a) | The S&P 500 Total Return Index is the primary benchmark; it is an unmanaged index generally representing the performance of the broad domestic economy through changes in the aggregate market value of 500 stocks representing all major industries. The S&P 500 Total Return Index does not include fees and expenses, and investors may not invest directly in an index. |
Comparison of the Change in Value of a $10,000 Investment
| Top 10 Holdings by Industry | | % of Net Assets | |
| Retail | | | 24.0 | % |
| Software | | | 16.9 | % |
| Biotechnology | | | 9.4 | % |
| Water | | | 9.4 | % |
| Electric | | | 9.3 | % |
| Reits | | | 6.7 | % |
| Commercial Services | | | 4.8 | % |
| Healthcare-Services | | | 4.7 | % |
| Diversified Financial Services | | | 4.3 | % |
| Machinery | | | 4.0 | % |
| Other/Short-Term Investments | | | 6.5 | % |
| | | | 100.0 | % |
| RATIONAL TREND AGGREGATION VA FUND (Formerly, Rational Dividend Capture VA Fund) |
| PORTFOLIO OF INVESTMENTS |
| December 31, 2018 |
| Shares | | | | | Value | |
| | | | | COMMON STOCKS - 58.8% | | | | |
| | | | | AEROSPACE/DEFENSE - 2.9% | | | | |
| | 1,111 | | | TransDigm Group, Inc. * | | $ | 377,807 | |
| | | | | | | | | |
| | | | | BEVERAGES - 2.8% | | | | |
| | 2,300 | | | Constellation Brands, Inc. | | | 369,886 | |
| | | | | | | | | |
| | | | | COMMERCIAL SERVICES - 5.1% | | | | |
| | 1,849 | | | Moody’s Corp. | | | 258,934 | |
| | 2,412 | | | TransUnion | | | 137,001 | |
| | 2,496 | | | Verisk Analytics, Inc. * | | | 272,164 | |
| | | | | | | | 668,099 | |
| | | | | DIVERSIFIED FINANCIAL SERVICES - 4.9% | | | | |
| | 2,015 | | | Mastercard, Inc. | | | 380,130 | |
| | 1,956 | | | Visa, Inc. | | | 258,074 | |
| | | | | | | | 638,204 | |
| | | | | GAS - 1.0% | | | | |
| | 1,829 | | | Vectren Corp. | | | 131,651 | |
| | | | | | | | | |
| | | | | HEALTHCARE - SERVICES - 5.1% | | | | |
| | 3,427 | | | IQVIA Holdings, Inc. * | | | 398,115 | |
| | 1,118 | | | UnitedHealth Group, Inc. | | | 278,516 | |
| | | | | | | | 676,631 | |
| | | | | INSURANCE - 1.9% | | | | |
| | 245 | | | Markel Corp. * | | | 254,322 | |
| | | | | | | | | |
| | | | | INTERNET - 7.6% | | | | |
| | 1,710 | | | Alibaba Group Holding Ltd. - ADR * | | | 234,390 | |
| | 366 | | | Alphabet, Inc. * | | | 382,455 | |
| | 92 | | | Amazon.com, Inc. * | | | 138,181 | |
| | 1,888 | | | Facebook, Inc. * | | | 247,498 | |
| | | | | | | | 1,002,524 | |
| | | | | LODGING - 1.1% | | | | |
| | 1,434 | | | Wynn Resorts Ltd. | | | 141,837 | |
| | | | | | | | | |
| | | | | MACHINERY - DIVERSIFIED - 2.0% | | | | |
| | 996 | | | Roper Technologies, Inc. | | | 265,454 | |
| | | | | | | | | |
| | | | | PHARMACEUTICALS - 3.1% | | | | |
| | 3,023 | | | Allergan PLC | | | 404,054 | |
| | | | | | | | | |
| | | | | REITS - 4.1% | | | | |
| | 900 | | | American Tower Corp. | | | 142,371 | |
| | 2,410 | | | SBA Communications Corp. * | | | 390,155 | |
| | | | | | | | 532,526 | |
| | | | | RETAIL - 7.4% | | | | |
| | 2,405 | | | CarMax, Inc. * | | | 150,866 | |
| | 4,900 | | | Dollar Tree, Inc. * | | | 442,568 | |
| | 1,112 | | | O’Reilly Automotive, Inc. * | | | 382,895 | |
| | | | | | | | 976,329 | |
| | | | | SOFTWARE - 4.9% | | | | |
| | 2,904 | | | Activision Blizzard, Inc. | | | 135,239 | |
| | 1,133 | | | Adobe, Inc. * | | | 256,330 | |
| | 1,683 | | | Electronic Arts, Inc. * | | | 132,806 | |
| | 1,244 | | | Microsoft Corp. | | | 126,353 | |
| | | | | | | | 650,728 | |
| | | | | TRANSPORTATION - 2.8% | | | | |
| | 753 | | | Canadian Pacific Railway Ltd. | | | 133,748 | |
| | 3,745 | | | CSX Corp. | | | 232,677 | |
| | | | | | | | 366,425 | |
| | | | | WATER - 2.1% | | | | |
| | 2,011 | | | American States Water Co. | | | 134,817 | |
| | 2,936 | | | California Water Service Group | | | 139,930 | |
| | | | | | | | 274,747 | |
| | | | | | | | | |
| | | | | TOTAL COMMON STOCKS (Cost - $7,632,681) | | | 7,731,224 | |
See accompanying notes to financial statements.
| RATIONAL TREND AGGREGATION VA FUND (Formerly, Rational Dividend Capture VA Fund) |
| PORTFOLIO OF INVESTMENTS (Continued) |
| December 31, 2018 |
| Shares | | | | | | | | | Value | |
| | | | | EXCHANGE TRADED FUNDS - 5.1% | | | | | | | | |
| | 1,061 | | | iShares 20+ Year Treasury Bond ETF | | | | | | $ | 128,922 | |
| | 2,216 | | | ProShares Short Dow30 ETF | | | | | | | 135,929 | |
| | 4,163 | | | ProShares Short S&P500 ETF | | | | | | | 130,427 | |
| | 3,964 | | | ProShares Short QQQ ETF | | | | | | | 136,362 | |
| | 1,118 | | | SPDR Gold Shares ETF * | | | | | | | 135,558 | |
| | | | | TOTAL EXCHANGE TRADED FUNDS (Cost - $663,441) | | | | | | | 667,198 | |
| | | | | | | | | | | | | |
| | | | | EXCHANGE TRADED NOTES - 4.4% | | | | | | | | |
| | 9,505 | | | iPATH S&P 500 VIX Short-Term Futures ETN * | | | | | | | 445,609 | |
| | 1,774 | | | VelocityShares Daily 2x VIX Short Term ETN * | | | | | | | 125,794 | |
| | | | | TOTAL EXCHANGE TRADED NOTES (Cost - $591,983) | | | | | | | 571,403 | |
| | | | | | | | | | | | | |
| | | | | CLOSED END FUND - 2.1% | | | | | | | | |
| | 4,672 | | | Altaba, Inc. * | | | | | | | 270,696 | |
| | | | | TOTAL CLOSED END FUND (Cost - $266,227) | | | | | | | 270,696 | |
| | | | | | | | | | | | | |
| | | | | | | Interest | | | | | | |
| | | | | | | Rate (%) | | Maturity | | | | |
| | | | | PREFERRED STOCK - 1.3% | | | | | | | | |
| | | | | INVESMENT COMPANIES | | | | | | | | |
| | 7,000 | | | B Riley Financial, Inc. | | 7.3750 | | 5/31/2023 | | | 170,170 | |
| | | | | TOTAL PREFERRED STOCK (Cost - $175,000) | | | | | | | 170,170 | |
| | | | | | | | | | | | | |
| | | | | SHORT-TERM INVESTMENTS - 30.1% | | | | | | | | |
| | 3,953,404 | | | Federated Treasury Obligations Fund, Institutional Class, 2.31% ** | | | 3,953,404 | |
| | | | | TOTAL SHORT-TERM INVESTMENTS (Cost $3,953,404) | | | | | | | 3,953,404 | |
| | | | | | | | | | | | | |
| | | | | TOTAL INVESTMENTS - 101.8% (Cost - $13,282,736) | | | | | | $ | 13,364,095 | |
| | | | | LIABILITIES IN EXCESS OF OTHER ASSETS - (1.8)% | | | | | | | (233,462 | ) |
| | | | | NET ASSETS - 100.0% | | | | | | $ | 13,130,633 | |
ADR - American Depositary Receipt.
ETF - Exchange Traded Fund
PLC - Public Limited Company.
REIT - Real Estate Investment Trust.
| * | Non-income producing security. |
| ** | Rate shown represents the rate at December 31, 2018 and is subject to change and resets daily. |
See accompanying notes to financial statements.
| RATIONAL INSIDER BUYING VA FUND |
| PORTFOLIO OF INVESTMENTS |
| December 31, 2018 |
| Shares | | | | | Value | |
| | | | | COMMON STOCKS - 98.1% | | | | |
| | | | | AEROSPACE - 0.1% | | | | |
| | 200 | | | Heico Corp. | | $ | 15,496 | |
| | | | | | | | | |
| | | | | BIOTECHNOLOGY - 9.4% | | | | |
| | 108,100 | | | Amarin Corp. PLC - ADR * | | | 1,471,241 | |
| | 5,100 | | | Amgen, Inc. | | | 992,817 | |
| | | | | | | | 2,464,058 | |
| | | | | BUILDING MATERIALS - 0.7% | | | | |
| | 900 | | | Lennox International, Inc. | | | 196,974 | |
| | | | | | | | | |
| | | | | COMMERICIAL SERVICES - 4.8% | | | | |
| | 600 | | | Global Payments, Inc. | | | 61,878 | |
| | 4,300 | | | IHS Markit Ltd. * | | | 206,271 | |
| | 2,600 | | | Paypal Holdings, Inc. * | | | 218,634 | |
| | 1,700 | | | S&P Global, Inc. | | | 288,898 | |
| | 1,900 | | | Total System Services, Inc. | | | 154,451 | |
| | 6,000 | | | TransUnion | | | 340,800 | |
| | | | | | | | 1,270,932 | |
| | | | | COMPUTERS - 1.1% | | | | |
| | 4,500 | | | Cognizant Technology Solutions Corp. | | | 285,660 | |
| | | | | | | | | |
| | | | | DIVERSIFIED FINANCIAL SERVICES - 4.3% | | | | |
| | 8,600 | | | Visa, Inc. | | | 1,134,684 | |
| | | | | | | | | |
| | | | | ELECTRIC - 9.3% | | | | |
| | 16,000 | | | Consolidated Edison, Inc. | | | 1,223,360 | |
| | 14,100 | | | Duke Energy Corp. | | | 1,216,830 | |
| | | | | | | | 2,440,190 | |
| | | | | HEALTHCARE-PRODUCTS - 2.1% | | | | |
| | 3,600 | | | Stryker Corp. | | | 564,300 | |
| | | | | | | | | |
| | | | | HEALTHCARE-SERVICES - 4.7% | | | | |
| | 10,600 | | | Centene Corp. * | | | 1,222,180 | |
| | | | | | | | | |
| | | | | INTERNET - 0.0% | | | | |
| | 200 | | | GoDaddy, Inc. * | | | 13,124 | |
| | | | | | | | | |
| | | | | MACHINERY - 4.0% | | | | |
| | 4,000 | | | Roper Technologies, Inc. | | | 1,066,080 | |
| | | | | | | | | |
| | | | | REITS - 6.7% | | | | |
| | 179,400 | | | Annaly Capital Management, Inc. | | | 1,761,708 | |
| | | | | | | | | |
| | | | | RETAIL - 24.0% | | | | |
| | 1,350 | | | AutoZone, Inc. * | | | 1,131,759 | |
| | 13,600 | | | Dollar Tree, Inc. * | | | 1,228,352 | |
| | 2,000 | | | Five Below, Inc. * | | | 204,640 | |
| | 500 | | | Home Depot, Inc. | | | 85,910 | |
| | 6,900 | | | McDonald’s Corp. | | | 1,225,233 | |
| | 3,500 | | | O’Reilly Automotive, Inc. * | | | 1,205,155 | |
| | 5,000 | | | Ulta Beauty, Inc. * | | | 1,224,200 | |
| | | | | | | | 6,305,249 | |
| | | | | SEMICONDUCTORS - 0.6% | | | | |
| | 600 | | | Broadcom, Inc. | | | 152,568 | |
| | | | | | | | | |
| | | | | SOFTWARE - 16.9% | | | | |
| | 800 | | | Adobe Systems, Inc. * | | | 180,992 | |
| | 1,100 | | | Fair Isaac Corp. * | | | 205,700 | |
| | 8,900 | | | Fiserv, Inc. * | | | 654,061 | |
| | 16,300 | | | Microsoft Corp. | | | 1,655,591 | |
| | 1,300 | | | Paycom Software, Inc. * | | | 159,185 | |
| | 2,700 | | | ServiceNow, Inc. * | | | 480,735 | |
| | 12,500 | | | Veeva Systems, Inc. * | | | 1,116,500 | |
| | | | | | | | 4,452,764 | |
| | | | | WATER - 9.4% | | | | |
| | 13,400 | | | American Water Works Co, Inc. | | | 1,216,318 | |
| | 36,400 | | | Aqua America, Inc. | | | 1,244,516 | |
| | | | | | | | 2,460,834 | |
| | | | | | | | | |
| | | | | TOTAL COMMON STOCKS (Cost - $26,236,850) | | | 25,806,801 | |
See accompanying notes to financial statements.
| RATIONAL INSIDER BUYING VA FUND |
| PORTFOLIO OF INVESTMENTS |
| December 31, 2018 |
| Shares | | | | | Value | |
| | | | | SHORT-TERM INVESTMENTS - 2.1% | | | | |
| | 540,620 | | | Federated Treasury Obligations Fund, Institutional Class, 2.31% ** | | $ | 540,620 | |
| | | | | TOTAL SHORT-TERM INVESTMENTS (Cost - $540,620) | | | 540,620 | |
| | | | | | | | | |
| | | | | TOTAL INVESTMENTS - 100.2% (Cost - $26,777,470) | | $ | 26,347,421 | |
| | | | | LIABILITIES IN EXCESS OF OTHER ASSETS - (0.2)% | | | (38,544 | ) |
| | | | | NET ASSETS - 100.0% | | $ | 26,308,877 | |
ADR - American Deposirty Receipt
| * | Non-income producing security. |
| ** | Rate shown represents the rate at December 31, 2018 and it is subject to change and resets daily. |
See accompanying notes to financial statements.
| RATIONAL VA FUNDS |
| Statements of Assets and Liabilities |
| December 31, 2018 |
| | | Rational | | | Rational | |
| | | Trend Aggregation VA | | | Insider Buying VA | |
| | | Fund | | | Fund | |
| | | | | | | |
| ASSETS: | | | | | | | | |
| Investments in securities, at cost | | $ | 13,282,736 | | | $ | 26,777,470 | |
| Investments, at value | | $ | 13,364,095 | | | $ | 26,347,421 | |
| Receivable for securities sold | | | 2,682,510 | | | | — | |
| Dividends and interest receivable | | | 21,283 | | | | 58,315 | |
| Due from Advisor | | | 9,026 | | | | — | |
| Receivable for Fund shares sold | | | 151 | | | | — | |
| Prepaid expenses and other assets | | | 19 | | | | — | |
| Total Assets | | | 16,077,084 | | | | 26,405,736 | |
| | | | | | | | | |
| LIABILITIES: | | | | | | | | |
| Payable for securities purchased | | | 2,878,269 | | | | — | |
| Accrued 12b-1 fees | | | 36,527 | | | | 33,078 | |
| Payable for Fund shares redeemed | | | 4,014 | | | | 17,580 | |
| Shareholder servicing fee | | | 6,739 | | | | 14,841 | |
| Fees payable to related parties | | | 5,077 | | | | 8,541 | |
| Management fees payable | | | — | | | | 5,537 | |
| Payable for trustee fees | | | 2,026 | | | | 2,009 | |
| Accrued expenses and other liabilities | | | 13,799 | | | | 15,273 | |
| Total Liabilities | | | 2,946,451 | | | | 96,859 | |
| | | | | | | | | |
| Net Assets | | $ | 13,130,633 | | | $ | 26,308,877 | |
| | | | | | | | | |
| NET ASSETS CONSIST OF: | | | | | | | | |
| Paid in Capital | | $ | 14,540,943 | | | $ | 21,129,403 | |
| Accumulated Earnings/Loss | | | (1,410,310 | ) | | | 5,179,474 | |
| Net Assets | | $ | 13,130,633 | | | $ | 26,308,877 | |
| | | | | | | | | |
| Net Assets | | $ | 13,130,633 | | | $ | 26,308,877 | |
| Shares of beneficial interest outstanding (a) | | | 1,225,267 | | | | 2,194,254 | |
| Net asset value, redemption price and offering price per share | | $ | 10.72 | | | $ | 11.99 | |
| (a) | Unlimited number of shares of no par value beneficial interest authorized. |
See accompanying notes to financial statements.
| RATIONAL VA FUNDS |
| Statements of Operations |
| For the Year Ended December 31, 2018 |
| | | Rational | | | Rational | |
| | | Trend Aggregation VA | | | Insider Buying VA | |
| | | Fund | | | Fund | |
| Investment Income: | | | | | | | | |
| Dividend income | | $ | 726,384 | | | $ | 288,525 | |
| Interest income | | | 30,340 | | | | 7,266 | |
| Foreign tax withheld | | | (4,493 | ) | | | — | |
| Total Investment Income | | | 752,231 | | | | 295,791 | |
| | | | | | | | | |
| Operating Expenses: | | | | | | | | |
| Investment management fees | | | 116,292 | | | | 247,064 | |
| Administration fees | | | 51,702 | | | | 96,209 | |
| Shareholder servicing fees | | | 38,764 | | | | 82,355 | |
| 12b-1 fees | | | 38,764 | | | | 82,355 | |
| Management services fees | | | 16,584 | | | | 28,289 | |
| Legal fees | | | 20,284 | | | | 7,301 | |
| Audit and tax fees | | | 10,001 | | | | 10,157 | |
| Printing expense | | | 6,190 | | | | 10,996 | |
| Trustees’ fees | | | 8,439 | | | | 8,439 | |
| Compliance officer fees | | | 9,408 | | | | 7,095 | |
| Insurance expense | | | 4,799 | | | | 9,676 | |
| Custody fees | | | 4,985 | | | | 5,230 | |
| Miscellaneous expense | | | 12 | | | | 12 | |
| Total Operating Expenses | | | 326,224 | | | | 595,178 | |
| Less: Expenses waived/reimbursed by Advisor | | | (132,531 | ) | | | (183,464 | ) |
| Net Operating Expenses | | | 193,693 | | | | 411,714 | |
| | | | | | | | | |
| Net Investment Income (Loss) | | | 558,538 | | | | (115,923 | ) |
| | | | | | | | | |
| Realized and Unrealized Gain (Loss) on Investments: | | | | | | | | |
| Net realized gain (loss) from: | | | | | | | | |
| Investments | | | (1,027,651 | ) | | | 5,429,686 | |
| Foreign currency transactions | | | — | | | | (684 | ) |
| Net Realized Gain (loss) on Investments | | | (1,027,651 | ) | | | 5,429,002 | |
| | | | | | | | | |
| Net change in unrealized appreciation (depreciation) on: | | | | | | | | |
| Investments | | | (194,380 | ) | | | (6,892,262 | ) |
| Foreign currency translations | | | — | | | | 40 | |
| Net Change Unrealized Appreciation (Depreciation) on Investments | | | (194,380 | ) | | | (6,892,222 | ) |
| | | | | | | | | |
| Net Realized and Unrealized Loss on Investments | | | (1,222,031 | ) | | | (1,463,220 | ) |
| | | | | | | | | |
| Net Decrease in Net Assets Resulting From Operations | | $ | (663,493 | ) | | $ | (1,579,143 | ) |
| | | | | | | | | |
See accompanying notes to financial statements.
| RATIONAL VA FUNDS |
| Statements of Changes in Net Assets |
| | | Rational Trend Aggregation VA Fund (Formerly, | | | | | | | |
| | | Rational Dividend Capture VA Fund) | | | Rational Insider Buying VA Fund | |
| | | | | | | |
| | | Year Ended | | | Year Ended | | | Year Ended | | | Year Ended | |
| | | December 31, 2018 | | | December 31, 2017 | | | December 31, 2018 | | | December 31, 2017 | |
| Operations: | | | | | | | | | | | | | | | | |
| Net investment income (loss) | | $ | 558,538 | | | $ | 642,906 | | | $ | (115,923 | ) | | $ | 234,628 | |
| Net realized gain (loss) on investments and foreign currency translation | | | (1,027,651 | ) | | | (743,422 | ) | | | 5,429,002 | | | | 1,384,816 | |
| Net change in unrealized appreciation (depreciation) on investments and foreign currency translation | | | (194,380 | ) | | | (207,760 | ) | | | (6,892,222 | ) | | | 4,053,762 | |
| Net increase (decrease) in net assets resulting from operations | | | (663,493 | ) | | | (308,276 | ) | | | (1,579,143 | ) | | | 5,673,206 | |
| | | | | | | | | | | | | | | | | |
| Distributions to Shareholders from: | | | | | | | | | | | | | | | | |
| Net investment income | | | — | | | | (602,275 | ) | | | — | | | | (192,258 | ) |
| Net realized gains | | | — | | | | — | | | | — | | | | (4,297,807 | ) |
| Total Distributions Paid * | | | (581,978 | ) | | | — | | | | (1,601,532 | ) | | | — | |
| | | | | | | | | | | | | | | | | |
| Total distributions to shareholders | | | (581,978 | ) | | | (602,275 | ) | | | (1,601,532 | ) | | | (4,490,065 | ) |
| | | | | | | | | | | | | | | | | |
| Share Transactions of Beneficial Interest: | | | | | | | | | | | | | | | | |
| Net proceeds from shares sold | | | 263,398 | | | | 638,070 | | | | 543,156 | | | | 510,022 | |
| Reinvestment of distributions | | | 581,978 | | | | 602,275 | | | | 1,601,532 | | | | 4,490,065 | |
| Cost of shares redeemed | | | (3,944,937 | ) | | | (3,589,982 | ) | | | (8,171,477 | ) | | | (6,988,277 | ) |
| Net decrease in net assets from share transactions of beneficial interest | | | (3,099,561 | ) | | | (2,349,637 | ) | | | (6,026,789 | ) | | | (1,988,190 | ) |
| | | | | | | | | | | | | | | | | |
| Total Decrease in Net Assets | | | (4,345,032 | ) | | | (3,260,188 | ) | | | (9,207,464 | ) | | | (805,049 | ) |
| | | | | | | | | | | | | | | | | |
| Net Assets: | | | | | | | | | | | | | | | | |
| Beginning of year | | | 17,475,665 | | | | 20,735,853 | | | | 35,516,341 | | | | 36,321,390 | |
| End of year** | | $ | 13,130,633 | | | $ | 17,475,665 | | | $ | 26,308,877 | | | $ | 35,516,341 | |
| | | | | | | | | | | | | | | | | |
| Share Activity: | | | | | | | | | | | | | | | | |
| Shares Sold | | | 22,959 | | | | 52,981 | | | | 38,911 | | | | 37,599 | |
| Shares Reinvested | | | 55,007 | | | | 52,738 | | | | 134,809 | | | | 356,921 | |
| Shares Redeemed | | | (336,721 | ) | | | (294,121 | ) | | | (561,441 | ) | | | (502,850 | ) |
| Net decrease in shares of Beneficial interest | | | (258,755 | ) | | | (188,402 | ) | | | (387,721 | ) | | | (108,330 | ) |
| * | Distributions from net investment income and net realized capital gains are combined for the year ended December 31, 2018. See “New Accounting Pronouncements” in the Notes to Financial Statements for more information. The dividends and distributiions to shareholders for the year ended December 31, 2017 have not been reclassified to conform to the current year presentation. |
| ** | Net Assets- End of Year includes distributions in excess of net investment income of $622,902 for Trend Aggregation VA Fund and $141,420 for Insider Buying VA Fund as of December 31, 2017. |
See accompanying notes to financial statements.
| RATIONAL VA FUNDS |
| Financial Highlights |
For a Share Outstanding Throughout Each Year
| | | Rational Trend Aggregation VA Fund (Formerly, Rational Dividend Capture VA Fund) | |
| | | For the | | | For the | | | For the | | | For the | | | For the | |
| | | Year Ended | | | Year Ended | | | Year Ended | | | Year Ended | | | Year Ended | |
| | | December 31, | | | December 31, | | | December 31, | | | December 31, | | | December 31, | |
| | | 2018 | | | 2017 | | | 2016 | | | 2015 | | | 2014 | |
| | | | | | | | | | | | | | | | |
| Net asset value, beginning of year | | $ | 11.78 | | | $ | 12.40 | | | $ | 12.16 | | | $ | 13.13 | | | $ | 12.55 | |
| | | | | | | | | | | | | | | | | | | | | |
| INCOME (LOSS) FROM INVESTMENT OPERATIONS: | | | | | | | | | | | | | | | | | | | | |
| Net investment income (A) | | | 0.42 | | | | 0.42 | | | | 0.36 | | | | 0.44 | | | | 0.39 | |
| Net realized and unrealized gain (loss) on investments | | | (0.99 | ) | | | (0.63 | ) | | | 0.48 | | | | (0.86 | ) | | | 0.87 | |
| Total from investment operations | | | (0.57 | ) | | | (0.21 | ) | | | 0.84 | | | | (0.42 | ) | | | 1.26 | |
| | | | | | | | | | | | | | | | | | | | | |
| LESS DISTRIBUTIONS: | | | | | | | | | | | | | | | | | | | | |
| From net investment income | | | (0.49 | ) | | | (0.41 | ) | | | (0.60 | ) | | | (0.55 | ) | | | (0.68 | ) |
| Total distributions | | | (0.49 | ) | | | (0.41 | ) | | | (0.60 | ) | | | (0.55 | ) | | | (0.68 | ) |
| | | | | | | | | | | | | | | | | | | | | |
| Net asset value, end of year | | $ | 10.72 | | | $ | 11.78 | | | $ | 12.40 | | | $ | 12.16 | | | $ | 13.13 | |
| | | | | | | | | | | | | | | | | | | | | |
| Total return (B) | | | (4.75 | )% (D) | | | (1.59 | )% | | | 6.97 | % | | | (3.06 | )% | | | 10.16 | % |
| | | | | | | | | | | | | | | | | | | | | |
| RATIOS/SUPPLEMENTAL DATA: | | | | | | | | | | | | | | | | | | | | |
| Net assets, end of year (in 000’s) | | $ | 13,131 | | | $ | 17,476 | | | $ | 20,736 | | | $ | 23,561 | | | $ | 35,215 | |
| Expenses, before waiver and reimbursement (C) | | | 2.11 | % | | | 1.84 | % | | | 1.80 | % | | | 1.12 | % | | | 1.05 | % |
| Expenses, net waiver and reimbursement (C) | | | 1.25 | % | | | 1.25 | % | | | 1.25 | % | | | 0.99 | % | | | 0.98 | % |
| Ratios of net investment income | | | 3.60 | % | | | 3.44 | % | | | 2.87 | % | | | 3.40 | % | | | 3.00 | % |
| Portfolio turnover rate | | | 672 | % | | | 261 | % | | | 166 | % | | | 94 | % | | | 103 | % |
| (A) | Calculated using average shares for the year. |
| (B) | Total returns do not include any insurance, sales or administrative charges of variable annuity or life insurance contracts. If these were included, the returns would be lower. |
| (C) | The ratios shown do not include the Fund’s proportionate shares of the expenses of the underlying funds in which it invests. |
| (D) | Includes adjustments in accordance with accounting principals generally accepted in the United States and, consequently, the net asset value for financial reporting purposes and the returns based upon the net asset values may differ from the net asset values and returns for shareholder transactions. |
See accompanying notes to financial statements.
| RATIONAL VA FUNDS |
| Financial Highlights |
For a Share Outstanding Throughout Each Year
| | | Rational Insider Buying VA Fund | |
| | | For the | | | For the | | | For the | | | For the | | | For the | |
| | | Year Ended | | | Year Ended | | | Year Ended | | | Year Ended | | | Year Ended | |
| | | December 31, | | | December 31, | | | December 31, | | | December 31, | | | December 31, | |
| | | 2018 | | | 2017 | | | 2016 | | | 2015 | | | 2014 | |
| | | | | | | | | | | | | | | | |
| Net asset value, beginning of year | | $ | 13.76 | | | $ | 13.50 | | | $ | 17.34 | | | $ | 22.13 | | | $ | 23.95 | |
| | | | | | | | | | | | | | | | | | | | | |
| INCOME (LOSS) FROM INVESTMENT OPERATIONS: | | | | | | | | | | | | | | | | | | | | |
| Net investment income (loss) | | | (0.05 | ) (A) | | | 0.09 | (A) | | | 0.10 | (A) | | | 0.12 | | | | 0.07 | |
| Net realized and unrealized gain (loss) on investments | | | (0.95 | ) | | | 2.09 | | | | 1.35 | | | | (1.66 | ) | | | (0.52 | ) |
| Total from investment operations | | | (1.00 | ) | | | 2.18 | | | | 1.45 | | | | (1.54 | ) | | | (0.45 | ) |
| | | | | | | | | | | | | | | | | | | | | |
| LESS DISTRIBUTIONS: | | | | | | | | | | | | | | | | | | | | |
| From net investment income | | | (0.10 | ) | | | (0.08 | ) | | | (0.11 | ) | | | (0.12 | ) | | | (0.12 | ) |
| From net realized gains on investments | | | (0.67 | ) | | | (1.84 | ) | | | (5.18 | ) | | | (3.13 | ) | | | (1.25 | ) |
| Total distributions | | | (0.77 | ) | | | (1.92 | ) | | | (5.29 | ) | | | (3.25 | ) | | | (1.37 | ) |
| | | | | | | | | | | | | | | | | | | | | |
| Net asset value, end of year | | $ | 11.99 | | | $ | 13.76 | | | $ | 13.50 | | | $ | 17.34 | | | $ | 22.13 | |
| | | | | | | | | | | | | | | | | | | | | |
| Total return (B) | | | (7.18 | )% | | | 17.52 | % | | | 11.00 | % | | | (7.17 | )% | | | (2.06 | )% |
| | | | | | | | | | | | | | | | | | | | | |
| RATIOS/SUPPLEMENTAL DATA: | | | | | | | | | | | | | | | | | | | | |
| Net assets, end of year (in 000’s) | | $ | 26,309 | | | $ | 35,516 | | | $ | 36,321 | | | $ | 38,218 | | | $ | 61,972 | |
| Expenses, before waiver and reimbursement | | | 1.81 | % | | | 1.68 | % | | | 1.70 | % | | | 1.10 | % | | | 1.03 | % |
| Expenses, net waiver and reimbursement | | | 1.25 | % | | | 1.25 | % | | | 1.25 | % | | | 1.02 | % | | | 0.99 | % |
| Ratios of net investment income (loss) | | | (0.35 | )% | | | 0.67 | % | | | 0.64 | % | | | 0.46 | % | | | 0.24 | % |
| Portfolio turnover rate | | | 213 | % | | | 56 | % | | | 166 | % | | | 68 | % | | | 21 | % |
| (A) | Calculated using average shares for the year. |
| (B) | Total returns do not include any insurance, sales or administrative charges of variable annuity or life insurance contracts. If these were included, the returns would be lower. |
See accompanying notes to financial statements.
| RATIONAL VA FUNDS | |
| NOTES TO FINANCIAL STATEMENTS | |
| December 31, 2018 | ANNUAL REPORT |
| (1) | ORGANIZATION AND SIGNIFICANT ACCOUNTING POLICIES |
Rational Trend Aggregation VA Fund (“Trend Aggregation VA Fund”) and Rational Insider Buying VA Fund (“Insider Buying VA Fund”) are both diversified series of shares of beneficial interest of Mutual Fund and Variable Insurance Trust (the “Trust”) a statutory trust organized under the laws of the state of Delaware on June 23, 2006. The Trust is registered under the Investment Company Act of 1940, as amended (the “1940 Act”), as an open-end management investment company. As of December 31, 2018, the Trust operated 12 separate series, or mutual funds. Effective November 1, 2018, Rational Trend Aggregation VA Fund changed its name from Rational Dividend Capture VA Fund and changed sub-advisors from PVG Asset Management Corporation to Tuttle Tactical Management, LLC. This report contains financial statements and financial highlights of the funds listed below (individually referred to as a “Fund”, or collectively as the “Funds”):
| Fund | Sub-Advisor | Primary Objective |
| Rational Trend Aggregation VA Fund (“Trend Aggregation VA Fund”) | Tuttle Tactical Management, LLC | Seek total return on investment, with dividend income as an important component of that return |
| Rational Insider Buying VA Fund (“Insider Buying VA Fund”) | None | Seek long-term capital appreciation |
You may purchase shares of the Funds only through variable annuity contracts or variable life insurance policies offered by participating insurance companies. Fund shares are not offered directly to the public. You should refer to the prospectus for the variable annuity contract or variable life insurance policy for information on how to purchase a variable contract or policy and how to select a Fund as an investment option for your contract or policy. You may redeem shares of the Funds only through participating insurance companies, Lincoln Life Insurance Company, Nationwide Life Insurance Company, Delaware Life Insurance Company, Forethought Life Insurance Company, Talcott Resolution Life Insurance Company and Transamerica Life Insurance Company. We redeem shares of the Fund on any business day when the New York Stock Exchange (“NYSE”) is open. The price at which the Funds will redeem a share will be its Net Asset Value (“NAV”) next determined after the order is considered received. The Funds have authorized the participating insurance companies to accept redemption requests on their behalf. Talcott Resolution Life Insurance Company and Transamerica Life Insurance Company own 55.3% and 26.1%, respectively of Trend Aggregation VA Fund and Nationwide Life Insurance Company 60.5% of Insider Buying VA Fund.
| (2) | SIGNIFICANT ACCOUNTING POLICIES |
The following is a summary of significant accounting policies consistently followed by the Funds and are in accordance with accounting principles generally accepted in the United States of America (“GAAP”). Each Fund is an investment company and accordingly follow the investment company accounting and reporting guidance of the Financial Accounting Standards Board (“FASB”) Accounting Standard Codification Topic 946 Financial Services – Investment Companies.
The preparation of financial statements in conformity with GAAP requires management to make estimates and assumptions that affect the amounts of assets, liabilities, and disclosure of contingent assets and liabilities at the date of the financial statements and the reported amounts of income and expenses for the period. Actual results could differ from those estimates.
A. Investment Valuations
In computing the NAV of the Funds, fair value is based on market valuations with respect to portfolio securities for which market quotations are readily available. Pursuant to Trustee-approved policies, the Trust relies on certain security pricing services to provide the current market value of securities. Those security pricing services value equity securities (including foreign equity securities, exchange-traded funds and closed-end funds) traded on a securities exchange at the last reported sales price on the principal exchange. Equity securities quoted by NASDAQ are valued at the NASDAQ official closing price. If there is no reported sale on the principal exchange, and in the case of over-the counter securities, equity securities are valued at a bid price estimated by the security pricing service. Investments in open-end investment companies are valued at their respective net asset value as reported by such companies and are typically categorized as Level 1 in the fair value hierarchy. Short-term debt obligations having 60 days or less remaining until maturity, at time of purchase, may be valued at amortized cost, which approximates value.
| RATIONAL VA FUNDS | |
| NOTES TO FINANCIAL STATEMENTS (Continued) | |
| December 31, 2018 | ANNUAL REPORT |
Securities for which market quotations are not readily available are valued at fair value under Trust procedures approved by the Trust’s Board of Trustees (the “Board”). In these cases, a Pricing Committee, established and appointed by the Board determines in good faith, subject to Trust procedures, the fair value of portfolio securities held by a Fund (“good faith fair valuation”). When a good faith fair valuation of a security is required, consideration is generally given to a number of factors including, but not limited to the following: dealer quotes, published analyses by dealers or analysts regarding the security, transactions which provide implicit valuation of the security (such as a merger or tender offer transaction), the value of other securities or contracts which derive their value from the security at issue, and the implications of any other circumstances which have caused trading in the security to halt. With respect to certain categories of securities, the procedures utilized by the Pricing Committee detail specific valuation methodologies to be applied in lieu of considering the aforementioned list of factors.
Fair valuation procedures are also used when a significant event affecting the value of a portfolio security is determined to have occurred between the time when the price of the portfolio security is determined and the close of trading on the NYSE, which is when each Fund’s NAV is computed. An event is considered significant if there is both an affirmative expectation that the security’s value will change in response to the event and a reasonable basis for quantifying the resulting change in value. Significant events include significant securities’ market movements occurring between the time the price of the portfolio security is determined and the close of trading on the NYSE. For securities normally priced at their last sale price in a foreign market, such events can occur between the close of trading in the foreign market and the close of trading on the NYSE.
In some cases, events affecting the issuer of a portfolio security may be considered significant events. Examples of potentially significant events include announcements concerning earnings, acquisitions, new products, management changes, litigation developments, a strike or natural disaster affecting the company’s operations or regulatory changes or market developments affecting the issuer’s industry occurring between the time when the price of the portfolio security is determined and the close of trading on the NYSE. For securities of foreign issuers, such events could also include political or other developments affecting the economy or markets in which the issuer conducts its operations or its securities are traded.
There can be no assurance that a Fund could purchase or sell a portfolio security at the price used to calculate the Fund’s NAV. In the case of good faith fair valued portfolio securities, lack of information and uncertainty as to the significance of information may lead to a conclusion that a prior valuation is the best indication of a portfolio security’s present value. Good faith fair valuations generally remain unchanged until new information becomes available. Consequently, changes in good faith fair valuation of portfolio securities may be less frequent and of greater magnitude than changes in the price of portfolio securities valued at their last sale price, by an independent pricing service, or based on market quotations.
The Trust calculates the NAV for each of the Funds by valuing securities held based on fair value. Fair value is defined as the price that would be received to sell an asset or paid to transfer a liability in an orderly transaction between market participants at the measurement date. The valuation techniques described below maximize the use of observable inputs and minimize the use of unobservable inputs in determining fair value. The inputs used for valuing the Funds’ investments are summarized in the three broad levels listed below:
| ● | Level 1 - unadjusted quoted prices in active markets for identical investments and/or registered investment companies where the value per share is determined and published and is the basis for current transactions for identical assets or liabilities at the valuation date. |
| ● | Level 2 - other significant observable inputs (including quoted prices for similar securities, interest rates, prepayment speeds, credit risk, etc.). |
| ● | Level 3 - significant unobservable inputs (including the Funds’ own assumptions in determining the fair value of investments). |
Changes in valuation techniques may result in transfers in or out of an assigned level within the disclosure hierarchy. The inputs or methodology used for valuing investments is not necessarily an indication of the risk associated with investing in those investments.
The Board has authorized the use of an independent fair valuation service. If the movement in a designated U.S. market index, after foreign markets close, is greater than predetermined levels, the Funds may use a systematic valuation model provided from that independent third party to fair value its international equity securities.
| RATIONAL VA FUNDS | |
| NOTES TO FINANCIAL STATEMENTS (Continued) | |
| December 31, 2018 | ANNUAL REPORT |
The inputs or methodology used for valuing securities are not necessarily an indication of the risk associated with investing in those securities. The following tables summarize the inputs used as of December 31, 2018, for each Fund’s assets measured at fair value:
| Trend Aggregation VA Fund * | | | | | | | | | | | | |
| Assets | | Level 1 | | | Level 2 | | | Level 3 | | | Total | |
| Common Stocks | | $ | 7,731,224 | | | | — | | | | — | | | $ | 7,731,224 | |
| Exchange Traded Funds | | | 667,198 | | | | — | | | | — | | | | 667,198 | |
| Exchange Traded Notes | | | 571,403 | | | | — | | | | — | | | | 571,403 | |
| Closed End Fund | | | 270,696 | | | | — | | | | — | | | | 270,696 | |
| Preferred Stock | | | 170,170 | | | | — | | | | — | | | | 170,170 | |
| Short-Term Investments | | | 3,953,404 | | | | — | | | | — | | | | 3,953,404 | |
| Total Assets | | $ | 13,364,095 | | | $ | — | | | $ | — | | | $ | 13,364,095 | |
| | | | | | | | | | | | | | | | | |
| Insider Buying VA Fund* | |
| Assets | | Level 1 | | | Level 2 | | | Level 3 | | | Total | |
| Common Stocks | | $ | 25,806,801 | | | | — | | | | — | | | $ | 25,806,801 | |
| Short-Term Investments | | | 540,620 | | | | — | | | | — | | | | 540,620 | |
| Total Assets | | $ | 26,347,421 | | | $ | — | | | $ | — | | | $ | 26,347,421 | |
| * | Refer to the Portfolios of Investments for industry classifications. |
For the year ended December 31, 2018, there were no Level 3 investments for which significant unobservable inputs were used to determine fair value.
B. Foreign Currency Translation
The accounting records of the Funds are maintained in U.S. dollars. Foreign currency amounts are translated into U.S. dollars at the current rate of exchange each business day to determine the value of investments, and other assets and liabilities. Purchases and sales of foreign securities, and income and expenses, are translated at the prevailing rate of exchange on the respective date of these transactions. The Funds do not isolate that portion of the results of operations resulting from changes in foreign exchange rates on investments from fluctuation arising from changes in market prices of securities held. These fluctuations are included with the net realized and unrealized gain or loss on investments and foreign currency transactions/translations.
Reported net realized foreign exchange gains or losses arise from sales of portfolio securities; sales and maturities of short term securities; sales of foreign currencies; currency gains or losses realized between the trade and settlement dates on securities transactions; and the difference between the amounts of dividends, interest, and foreign withholding taxes recorded on the Funds’ books and the U.S. dollar equivalent of the amounts actually received or paid. Net unrealized foreign exchange gains and losses arise from changes in the values of assets and liabilities, including investments in securities at fiscal period-end, resulting from changes in the exchange rate.
C. Security Transactions and Related Income
During the period, investment transactions are accounted for no later than the first calculation of the NAV on the business day following the trade date. For financial reporting purposes, however, security transactions are accounted for on trade date on the last business day of the reporting period. Securities gains and losses are calculated on the identified cost basis. Interest income and expenses are accrued daily. Dividends, less foreign tax withholding (if any), are recorded on the ex-dividend date. Withholding taxes on foreign interest, dividends and capital gains with respect to the Funds have been provided for in accordance with each applicable country’s tax rules and rates.
| RATIONAL VA FUNDS | |
| NOTES TO FINANCIAL STATEMENTS (Continued) | |
| December 31, 2018 | ANNUAL REPORT |
D. Dividends and Distributions to Shareholders
Dividends from net investment income, if any, are declared and paid annually by the Funds. Net realized capital gains, if any, are distributed at least annually. The amount of dividends from net investment income and net realized gains are determined in accordance with the federal income tax regulations, which may differ from GAAP and are recorded on ex-date. These “book/tax” differences are either considered temporary or permanent in nature. To the extent these differences are permanent in nature (e.g. tax treatment of foreign currency gain/loss, distributions and income received from pass through investments and net investment loss adjustments), such amounts are reclassified within the capital accounts based on their nature for federal income tax purposes; temporary differences do not require reclassification.
The Funds may own shares of real estate investments trusts (“REITs”) which report information on the source of their distributions annually. Distributions received from investments in REITs in excess of income from underlying investments are recorded as realized gain and/or as a reduction to the cost of the individual REIT.
The Funds may invest in Master Limited Partnerships (“MLPs”), which generally are treated as partnerships for Federal income tax purposes. As a limited partner in the MLPs, each Fund includes its allocable share of the MLPs’ taxable income in computing its own taxable income.
E. Allocation of Expenses, Income, and Gains and Losses
Expenses directly attributable to a Fund are charged to that Fund. Expenses not directly attributable to a Fund are allocated proportionally among various funds or all funds within the Trust in relation to the net assets of each fund or on another reasonable basis.
F. Federal Income Taxes
It is the policy of each Fund to qualify or continue to qualify as a regulated investment company by complying with the provisions available to certain investment companies, as defined in applicable sections of the Internal Revenue Code, and to make distributions of net investment income and net realized capital gains sufficient to relieve it from all, or substantially all, federal income taxes. In addition to complying with the federal tax requirements applicable to regulated investment companies, the Funds also plan to comply with certain diversification standards applicable to underlying assets of variable annuity contracts in order to avoid taxation on the variable contract owners with respect to earnings allocable to the contract from investments in the Funds.
The Funds recognize the tax benefits of uncertain tax positions only where the position is “more likely than not” to be sustained assuming examination by tax authorities. Management has analyzed each Funds’ tax positions and has concluded that no liability for unrecognized tax benefits should be recorded related to uncertain tax positions taken on returns filed for open tax years or expected to be taken in the Funds’ December 31, 2018 year end tax returns. Each Fund identifies its major tax jurisdictions as U.S. Federal, and foreign jurisdictions where the Funds make significant investments; however the Funds are not aware of any tax positions for which it is reasonably possible that the total amounts of unrecognized tax benefits will change materially in the next twelve months. The Funds’ recognize interest and penalties, if any, related to unrecognized tax benfits, as income tax expenses, in the Statements of Operations.
G. Indemnification
Under the Trust’s organizational documents, its officers and Trustees are indemnified against certain liabilities arising out of the performance of their duties to the Funds. In addition, in the normal course of business, the Trust may enter into contracts with vendors and others that provide for general indemnifications. The Trust’s maximum exposure under these arrangements is unknown, as this would involve future claims that may be made against the Trust. However, based on experience, the Trust expects that risk of loss to be remote.
| (3) | FEES AND OTHER TRANSACTIONS WITH RELATED PARTIES AND OTHER SERVICE PROVIDERS |
Investment Advisory Fee— Rational Advisors, Inc., (the “Advisor”) serves as the Funds’ investment adviser. Under the terms of the Advisory Agreement, the Advisor manages the investment operations of the Funds in accordance with each Fund’s respective investment policies and restrictions. The Funds’ sub-advisors, when applicable, are responsible for the day-to-day management of each Fund’s portfolios. The Advisor provides the Funds with investment advice and supervision and furnishes an investment program for the
| RATIONAL VA FUNDS | |
| NOTES TO FINANCIAL STATEMENTS (Continued) | |
| December 31, 2018 | ANNUAL REPORT |
Funds. For its investment management services, the Funds pay to the Advisor, an annualized fee as shown in the below table, such fees to be computed daily based upon daily average net assets of the Funds. The Funds’ sub-advisors are paid by the Advisor, not the Funds.
The Advisor has agreed to contractually waive all or a portion of its investment advisory fee for the following Funds (based on average daily net assets) to which it is otherwise entitled to receive and/or to reimburse certain operating expenses in order to limit each Fund’s total annual fund expenses (after fee waivers, and/or expense reimbursements, and exclusive of acquired fund fees and expenses, brokerage costs, interest, taxes and dividends, and extraordinary expenses) as listed below:
| | | Advisory | | | Expense | | | Expense Cap |
| Fund | | Fee | | | Limitation | | | Expiration Date |
| Trend Aggregation VA Fund | | | 0.75% | | | | 1.25% | | | April 30, 2020 |
| Insider Buying VA Fund | | | 0.75% | | | | 1.25% | | | April 30, 2019 |
Amounts waived or reimbursed in the contractual period may be recouped by the Advisor within three years of the waiver and/or reimbursement. For the year ended December 31, 2018, for Trend Aggregation VA Fund and Insider Buying VA Fund the Advisor waived $132,531 and $183,464, respectively. As of December 31, 2018, the following amounts have been waived or reimbursed by the Advisor and are subject to repayment by the respective Fund:
| | | Repayment Expires December 31, | |
| Fund | | 2019 | | | 2020 | | | 2021 | |
| Trend Aggregation VA Fund | | $ | 121,175 | | | $ | 110,893 | | | $ | 132,531 | |
| Insider Buying VA Fund | | | 159,746 | | | | 149,095 | | | | 183,464 | |
The Independent Trustees are paid a quarterly retainer, and receive compensation for each committee meeting, telephonic Board meeting, and special in-person Board meeting attended. Officers receive no compensation from the Trust. The Trust reimburses each of the Independent Trustees for travel and other expenses incurred in connection with attendance at such meetings. The Trust has no retirement or pension plans. Additional information regarding the Trust’s Trustees is available in the Funds’ Statement of Additional Information.
The Board has adopted the Trust’s Distribution Plan (the “12b-1 Plan”) which allows each Fund to pay fees up to 0.25% of the Fund’s average daily net assets for Insider Buying VA Fund and Trend Aggregation VA Fund to financial intermediaries (which may be paid through the Funds’ distributor) for the sale and distribution of fund shares. Pursuant to the Funds’ 12b-1 Plan, the Funds may finance from their assets certain activities or expenses that are intended primarily to result in the sale of Fund shares and to reimburse Northern Lights Distributors, LLC. (the “Distributor”) and Advisor for distribution related expenses. 12b-1 fees incurred for the year ended December 31, 2018 were $38,764 and $82,355 for the Trend Aggregation VA Fund and Insider Buying VA Fund, respectively.
Shareholder Servicing Fees – The Trust has adopted a Shareholder Services Plan pursuant to which the Funds may pay Shareholder Services Fees up to 0.25% of the average daily net assets of the Fund for Trend Aggregation VA Fund and Insider Buying VA Fund to financial intermediaries for providing shareholder assistance, maintaining shareholder accounts and communicating or facilitating purchases and redemptions of shares.
In addition, certain affiliates of the Distributor provide services to the Funds as follows:
Gemini Fund Services, LLC (“GFS”) – GFS, an affiliate of the Distributor, provides administrative, fund accounting, and transfer agency services to the Funds pursuant to agreements with the Trust, for which it receives from each Fund the greater of an annual minimum fee or an asset based fee, which scales downward based upon net assets for fund administration, fund accounting and transfer agency services and reflected as such on the Statements of Operations. The Funds also pay GFS for any out-of-pocket expenses. Officers of the Trust are also employees of GFS, and are not paid any fees directly by the Trust for serving in such capacity.
Blu Giant, LLC (“Blu Giant”) – Blu Giant, an affiliate of GFS and the Distributor, provides EDGAR conversion and filing services as well as print management services for the Funds on an ad-hoc basis. For the provision of these services, Blu Giant receives customary fees from the Funds, which are included in printing expenses on the Statements of Operations.
Pursuant to the Management Services Agreement between the Trust and MFund Services LLC (“MFund”), an affiliate of the Advisor, provides the Funds with various management and administrative services. For these services, the Funds pay MFund an annual base fee
| RATIONAL VA FUNDS | |
| NOTES TO FINANCIAL STATEMENTS (Continued) | |
| December 31, 2018 | ANNUAL REPORT |
| | |
plus an annual asset-based fee which scales downward based upon net assets. In addition, the Funds reimburse MFund for any reasonable out- of- pocket expenses incurred in the performance of its duties under the Management Services Agreement.
Pursuant to the Compliance Services Agreement, MFund provides chief compliance officer services to the Funds. For these services, the Funds pay MFund an annual base fee plus an annual asset-based fee based upon net assets. In addition, the Funds reimburse MFund for any reasonable out of pocket expenses incurred in the performance of its duties under the Compliance Services Agreement. The amounts due to MFund at December 31, 2018 for management and chief compliance officer services are listed in the Statements of Assets and Liabilities under “Fees payable to related parties.” The fees incurred by the Funds are reflected within Management services fees on the Statements of Operations.
A Trustee and Officer of the Trust is also the controlling member of MFund and the Advisor, and is not paid any fees directly by the Trust for serving in such capacities.
CIM Securities, LLC acted as the broker of record on executions of purchases and sales on the Trend Aggregation VA Fund’s portfolio investments. For those services, CIM Securities, LLC received $27,902 in brokerage commissions from the Fund for the year ended December 31, 2018. Certain Officers and/or employees of PVG Asset Management Corporation, Trend Aggregation VA Fund’s sub-advisor prior to November 1, 2018, have an affiliation with CIM Securities, LLC.
| (4) | INVESTMENT TRANSACTIONS |
Purchases and sales of investments, excluding short-term securities, for the year ended December 31, 2018, were as follows:
| Fund | | Purchases | | | Sales | |
| Trend Aggregation VA Fund | | $ | 92,940,798 | | | $ | 99,106,174 | |
| Insider Buying VA Fund | | | 68,750,113 | | | | 76,474,434 | |
| (5) | DISTRIBUTIONS TO SHAREHOLDERS AND TAX COMPONENTS OF CAPITAL |
The tax character of distributions paid during the years ended December 31, 2018 and December 31, 2017 was as follows:
For the year ended December 31, 2018:
| | | Ordinary | | | Long-Term | |
| | | Income | | | Capital Gains | |
| Trend Aggregation VA Fund | | $ | 581,978 | | | $ | — | |
| Insider Buying VA Fund | | | 1,492,365 | | | | 109,167 | |
| | | | | | | | | |
| For the year ended December 31, 2017: | |
| | | Ordinary | | | Long-Term | |
| | | Income | | | Capital Gains | |
| Trend Aggregation VA Fund | | $ | 602,275 | | | $ | — | |
| Insider Buying VA Fund | | | 763,899 | | | | 3,726,166 | |
| | | | | | | | | |
As of December 31, 2018, the components of accumulated earnings/(deficit) on a tax basis were as follows:
| | | Undistributed | | | Undistributed | | | Post October Loss | | | Capital Loss | | | Other | | | Unrealized | | | Total | |
| | | Ordinary | | | Long-Term | | | and | | | Carry | | | Book/Tax | | | Appreciation/ | | | Accumulated | |
| | | Income | | | Capital Gains | | | Late Year Loss | | | Forwards | | | Differences | | | (Depreciation) | | | Earnings/(Deficits) | |
| Trend Aggregation VA Fund | | $ | 438,056 | | | $ | — | | | $ | — | | | $ | (1,091,492 | ) | | $ | — | | | $ | (756,874 | ) | | $ | (1,410,310 | ) |
| Insider Buying VA Fund | | | — | | | | 5,688,655 | | | | — | | | | — | | | | — | | | | (509,181 | ) | | | 5,179,474 | |
The difference between book basis and tax basis unrealized appreciation (depreciation), undistributed ordinary income (loss) and accumulated net realized gain (loss) from investments is primarily attributable to the tax deferral of losses on wash sales and tax
| RATIONAL VA FUNDS | |
| NOTES TO FINANCIAL STATEMENTS (Continued) | |
| December 31, 2018 | ANNUAL REPORT |
adjustments for trust preferred securities. The unrealized appreciation (depreciation) in the table above includes unrealized foreign currency losses of $165 for the Rational Insider Buying VA Fund.
At December 31, 2018, the Funds had capital loss carry forwards for federal income tax purposes available to offset future capital gains as follows:
| | | Non-Expiring | | | | |
| | | Short-Term | | | Long-Term | | | Total | |
| Trend Aggregation VA Fund | | $ | 870,872 | | | $ | 220,620 | | | $ | 1,091,492 | |
| Insider Buying VA Fund | | | — | | | | — | | | | — | |
Permanent book and tax differences, primarily attributable to the book/tax basis treatment of net operating losses, resulted in reclassifications for the Funds for the fiscal year ended December 31, 2018 as follows:
| | | Paid In | | | Accumulated | |
| | | Capital | | | Earnings (Losses) | |
| Trend Aggregation VA Fund | | $ | — | | | $ | — | |
| Insider Buying VA Fund | | | (243,532 | ) | | | 243,532 | |
| (6) | AGGREGATE UNREALIZED APPRECIATION AND DEPRECATION – TAX BASIS |
The identified cost of investments in securities owned by each Fund for federal income tax purposes, and its respective gross unrealized appreciation and depreciation at December 31, 2018, were as follows:
| | | Tax | | | Unrealized | | | Unrealized | | | Appreciation/ | |
| | | Cost | | | Appreciation | | | Depreciation | | | (Depreciation) | |
| Trend Aggregation VA | | $ | 14,120,969 | | | $ | 176,525 | | | $ | (933,399 | ) | | $ | (756,874 | ) |
| Insider Buying VA | | | 26,856,447 | | | | 969,772 | | | | (1,478,798 | ) | | | (509,026 | ) |
| | | | | | | | | | | | | | | | | |
| (7) | UNDERLYING INVESTMENT IN OTHER INVESTMENT COMPANIES |
The performance of the Trend Aggregation VA Fund will be directly affected by the performance of the Federated Treasury Obligation Fund Institutional Class. The Federated Treasury Obligation Fund invests exclusively in U.S. Government securities and repurchase agreements for those securities. The financial statements of the Federated Treasury Obligation Fund, including the portfolio of investments, can be found at the Securities and Exchange Commission’s (“SEC”) website www.sec.gov and should be read in conjunction with the Trend Aggregation VA Fund’s financial statements. As of December 31, 2018, the percentage of the Trend Aggregation VA Fund’s net assets invested in the Federated Treasury Obligations Fund was 30.1%.
| (8) | NEW ACCOUNTING PRONOUNCEMENTS |
In August 2018, the FASB issued Accounting Standards Update (“ASU”) No. 2018-13, which changes certain fair value measurement disclosure requirements. The new ASU, in addition to other modifications and additions, removes the requirement to disclose the amount and reasons for transfers between Level 1 and Level 2 of the fair value hierarchy, and the policy for the timing of transfers between levels. For investment companies, the amendments are effective for financial statements issued for fiscal years beginning after December 15, 2019, and interim periods within those fiscal years. Early adoption is allowed. These amendments have been adopted with these financial statements.
In August 2018, the Securities and Exchange Commission adopted amendments to certain disclosure requirements under Regulation S-X to conform to US GAAP, including: (i) an amendment to require presentation of the total, rather than the components, of distributable earnings on the Statements of Assets and Liabilities; and (ii) an amendment to require presentation of the total, rather than the components, of distributions to shareholders, except for tax return of capital distributions, if any, on the Statements of Changes in Net Assets. The amendments also removed the requirement for parenthetical disclosure of undistributed net investment income on the Statements of Changes in Net Assets. These amendments have been adopted with these financial statements.
| RATIONAL VA FUNDS | |
| NOTES TO FINANCIAL STATEMENTS (Continued) | |
| December 31, 2018 | ANNUAL REPORT |
| | |
Subsequent events after the date of the Statements of Assets and Liabilities have been evaluated through the date the financial statements were issued. Management has determined that no events or transactions occurred requiring adjustment or disclosure in the financial statements, other than the following.
Effective February 1, 2019, NorthStar Financial Services Group, LLC, the parent company of Gemini Fund Services, LLC (“GFS”) and its affiliated companies including Northern Lights Distributors, LLC (“NLD”), Northern Lights Compliance Services, LLC (“NLCS”) and Blu Giant, LLC (“Blu Giant”) (collectively, the “Gemini Companies”), sold its interest in the Gemini Companies to a third party private equity firm that contemporaneously acquired Ultimus Fund Solutions, LLC (an independent mutual fund administration firm) and its affiliates (collectively, the “Ultimus Companies”). As a result of these separate transactions, the Gemini Companies and the Ultimus Companies are now indirectly owned through a common parent entity, The Ultimus Group, LLC.
REPORT OF INDEPENDENT REGISTERED PUBLIC ACCOUNTING FIRM
To the Shareholders of Rational Trend Aggregation VA Fund and Rational Insider Buying VA Fund and
Board of Trustees of Mutual Fund and Variable Insurance Trust
Opinion on the Financial Statements
We have audited the accompanying statements of assets and liabilities, including the portfolios of investments, of Rational Trend Aggregation VA Fund (formerly, Rational Dividend Capture VA Fund) and Rational Insider Buying VA Fund (the “Funds”), each a series of Mutual Fund and Variable Insurance Trust, as of December 31, 2018, and the related statements of operations for the year then ended, the statements of changes in net assets for each of the two years in the period then ended, including the related notes, and the financial highlights for each of the three years in the period then ended (collectively referred to as the “financial statements”). In our opinion, the financial statements present fairly, in all material respects, the financial position of the each of the Funds as of December 31, 2018, the results of their operations for the year then ended, the changes in their net assets for each of the two years in the period then ended, and the financial highlights for each of the three years in the period then ended, in conformity with accounting principles generally accepted in the United States of America.
The Funds’ financial highlights for the periods ended December 31, 2015, and prior, were audited by other auditors whose report dated February 29, 2016, expressed an unqualified opinion on those financial highlights.
Basis for Opinion
These financial statements are the responsibility of the Funds’ management. Our responsibility is to express an opinion on the Funds’ financial statements based on our audits. We are a public accounting firm registered with the Public Company Accounting Oversight Board (United States) (“PCAOB”) and are required to be independent with respect to the Funds in accordance with the U.S. federal securities laws and the applicable rules and regulations of the Securities and Exchange Commission and the PCAOB.
We conducted our audits in accordance with the standards of the PCAOB. Those standards require that we plan and perform the audit to obtain reasonable assurance about whether the financial statements are free of material misstatement, whether due to error or fraud.
Our audits included performing procedures to assess the risks of material misstatement of the financial statements, whether due to error or fraud, and performing procedures that respond to those risks. Such procedures included examining, on a test basis, evidence regarding the amounts and disclosures in the financial statements. Our procedures included confirmation of securities owned as of December 31, 2018, by correspondence with the custodian and brokers or by other appropriate auditing procedures where replies from brokers or counterparties were not received. Our audits also included evaluating the accounting principles used and significant estimates made by management, as well as evaluating the overall presentation of the financial statements. We believe that our audits provide a reasonable basis for our opinion.
We have served as the Funds’ auditor since 2016.
COHEN & COMPANY, LTD.
Cleveland, Ohio
February 25, 2019
| RATIONAL VA FUNDS |
| Supplemental Information (Unaudited) |
| |
| Shareholder Expense Examples |
Fund Expenses.As a shareholder of a Fund, you incur ongoing costs, including management fees and other Fund expenses. These examples are intended to help you understand your ongoing costs (in dollars) of investing in the Funds and to compare these costs with the ongoing costs of investing in other mutual funds.
These examples are based on an investment of $1,000.00 invested at the beginning of the period and held for the entire six-month period from July 1, 2018 to December 31, 2018.
Actual Expenses.The “Actual” lines of the table provide information about actual account values and actual expenses. You may use the information on this line together with the amount you invested to estimate the expense that you paid over the period. Simply divide your account value by $1,000.00 (for example, an $8,600.00 account value divided by $1,000.00 = 8.60), then multiply the result by the number in the “Actual” line under the heading entitled “Expenses Paid During Period” to estimate the expenses you paid on your account during this period.
Hypothetical Example for Comparison Purposes.The “Hypothetical” lines of the table provide information about hypothetical account values and hypothetical expenses based on the Funds’ actual expense ratios and an assumed rate of return of 5% per year before expenses, which are not the Funds’ actual returns. The hypothetical account values and expenses may not be used to estimate the actual ending account balance or expenses you paid for the period. You may use this information to compare the ongoing costs of investing in the Funds and other funds. To do so, compare the 5% hypothetical examples with the 5% hypothetical examples that appear in the shareholder reports of other funds.
Please note that the expenses shown in the table are meant to highlight your ongoing costs only and do not reflect any transactional costs, such as withdrawal charges, mortality and expense risk fees and other charges that may be assessed by participating insurance companies under the separate accounts, variable annuity contracts or variable life insurance policies. Therefore, the “Actual” and “Hypothetical” lines of the table are useful in comparing ongoing costs only, and will not help you determine the relative total costs of owning different funds. In addition, if these transactional costs were included, your costs would have been higher.
| | | Beginning | | | Annualized | | | Ending | | | Expenses | |
| | | Account | | | Expense Ratio | | | Account | | | Paid During | |
| | | Value 7/1/2018 | | | For the period | | | Value 12/31/2018 | | | the Period* | |
| Trend Aggregation VA Fund | | | | | | | | | | | | | | | | |
| Actual | | $ | 1,000.00 | | | | 1.25 | % | | $ | 951.90 | | | $ | 6.15 | |
| Hypothetical | | | 1,000.00 | | | | 1.25 | % | | | 1,018.90 | | | | 6.36 | |
| Insider Buying VA Fund | | | | | | | | | | | | | | | | |
| Actual | | $ | 1,000.00 | | | | 1.25 | % | | $ | 891.90 | | | $ | 5.96 | |
| Hypothetical | | | 1,000.00 | | | | 1.25 | % | | | 1,018.90 | | | | 6.36 | |
| | | | | | | | | | | | | | | | | |
| * | Expenses are equal to the Fund’s annualized expense ratio multiplied by the average account value over the period, multiplied by 184/365. |
| RATIONAL VA FUNDS | |
| Supplemental Information (Unaudited) | |
| December 31, 2018 | ANNUAL REPORT |
At an in-person Board Meeting held on December 14, 2018, the Board of Trustees (the “Board” or the “Trustees”) of Mutual Fund & Variable Insurance Trust (the “Trust”), including a majority of the Trustees who are not “interested persons” as that term is defined in the Investment Company Act of 1940, as amended, discussed the renewal of the Management Agreement between Rational Advisors, Inc. (“Rational”) and the Trust with respect to the Rational Trend Aggregation VA Fund (“Trend VA Fund”) and Rational Insider Buying VA Fund (“Insider Buying VA Fund” (together the “Renewal Funds”). The Trustees reviewed Rational’s responses to a series of questions regarding, among other things, the investment performance of each Renewal Fund, Rational’s services to each Renewal Fund, comparative fee and expense information, and Rational’s profitability from advising each Renewal Fund (the “Rational 15(c) Response.).
The Trustees relied upon the advice of counsel and their own business judgement in evaluating and weighting each of the factors to be considered. The conclusions reached by the Trustees were based upon a comprehensive evaluation and discussion of all the information provided in the Rational 15(c) Response for each Renewal Fund with respect to the approval of the Management Agreement. The Trustees also considered the information presented at Board meetings throughout the year.
Nature, Extent and Quality of Services.The Trustees noted their familiarity with the key personnel serving the Renewal Funds and discussed the consistent and quality services provided by the dedicated team of qualified professionals at Rational. The Trustees then discussed the nature of Rational’s operations, its financial condition and resources, and its strong culture of compliance, noting there were no new compliance or regulatory issues. The Board considered that Rational continued to enhance its risk management program and noted that the risk management team regularly evaluates each Renewal Fund’s performance with respect to volatility, drawdowns and returns relative to their respective investment objective. After further discussion and review of the Rational 15(c) Response, the Trustees concluded that Rational will continue to provide an acceptable level of services to the Renewal Funds.
Performance.The Trustees reviewed the performance of each Renewal Fund relative to a peer group and its respective Morningstar category for various periods ended September 30, 2018.
Trend VA Fund. The Trustees noted the Fund’s underperformance for each of the periods presented. They discussed the change in investment strategy and sub-advisor to the Fund effective November 1, 2018 and concluded that the amount of time since these changes was insufficient to evaluate the Fund’s performance. They agreed to continue to monitor performance, and that Rational should be given time to demonstrate improved performance.
Insider Buying VA Fund. In reviewing performance of the Fund, the Trustees noted the Fund outperformed its peer group and Large Blend Morningstar category and was in-line with the Large Growth Morningstar category for the one-year period. The Trustees reviewed the three-year performance and noted the Fund was in-line with the Large Blend Morningstar category and outperformed its peer group but underperformed the Large Growth Morningstar category. The Trustees discussed the Fund’s underperformance of each metric for the five-year period and
| RATIONAL VA FUNDS | |
| Supplemental Information (Unaudited) (Continued) | |
| December 31, 2018 | ANNUAL REPORT |
| | |
underperformance of the Morningstar categories and S&P 500 Total Return Index during which they acknowledged the change in ownership and management of Rational and change in the portfolio manager of the Fund effective January 1, 2016. The Trustees determined that the performance of the Fund was not unacceptable.
Fees and Expenses.The Trustees reviewed the advisory fees for each Renewal Fund as compared to its respective peer group and respective Morningstar category.
Trend VA Fund. The Trustees reviewed the advisory fee of 0.75%, and noted it matched its peer group and was higher than the Large Value Morningstar average advisory fee but within the range of fees charged by funds in the Morningstar category. The Fund’s expense ratio of 1.34% was determined by the Board to be above averages for both its peer group and Morningstar category, and within the high/low range of expenses for both.
Insider Buying VA Fund. The Trustees noted the advisory fee of 0.75% for the Fund was lower than its peer group, and above the Large Blend and Large Growth Morningstar category averages. The advisory fee was found by the Trustees to be within the high/low range of fees of the funds in Large Blend Morningstar category and at the top of the high/low range of fees of the funds in the Large Growth Morningstar category. The Trustees further noted the Fund’s expense ratio of 1.25% was below the average for its peer group but above the average of its Morningstar categories.
The Trustees discussed the allocation of fees between Rational and the sub-advisor of the Trend VA Fund relative to its respective duties and other factors. The Board agreed that the allocation of fees between Rational and the sub-advisor was appropriate.
In considering the investment strategy, range of fees within each peer group and category and the size of the Renewal Funds, the Board determined that the advisory fees in each case were not unreasonable.
Profitability.The Trustees reviewed a profitability analysis provided for each Renewal Fund. The Trustees noted that Rational realized a loss in connection with its relationship with each Renewal Fund. They considered that for each Renewal Fund, no compensation expense for Rational’s principals was allocated or included in the per Fund analysis because those persons received a share of profits rather than salary. After further discussion, the Trustees concluded that Rational’s profitability with respect to the Renewal Funds was currently not a concern.
“Fall-out” Benefits. The Trustees considered fall-out benefits received by Rational and its affiliates from their relationship with the Renewal Funds and the Trust.
Economies of Scale.The Board considered Rational’s estimates of asset levels where the total expenses of a Fund would likely fall below any expense limitation agreement and Rational would no longer need to waive advisory fees and/or reimburse expenses. The Trustees agreed that breakpoints may be an appropriate way for Rational to share its economies of scale as assets of the Renewal Funds increase substantially. The Trustees determined that it did not appear that
| RATIONAL VA FUNDS | |
| Supplemental Information (Unaudited) (Continued) | |
| December 31, 2018 | ANNUAL REPORT |
| | |
economies of scale had been reached at this time and agreed that the matter of economies of scale would be revisited as assets of the Renewal Funds materially increase.
Conclusion.No single factor was determinative to the decision of the Trustees. Having reviewed and discussed in depth such information from the Adviser as the Trustees believed to be reasonably necessary to evaluate the terms of the Management Agreement, and as assisted by the advice of Counsel, the Trustees concluded that renewal of the Management Agreement on behalf of the Renewal Funds was in the best interests of the shareholders of each Renewal Fund.
| RATIONAL VA FUNDS | |
| Supplemental Information (Unaudited) | |
| December 31, 2018 | ANNUAL REPORT |
Consideration and approval of Sub-Advisory Agreement between Rational Advisors, Inc. and Tuttle Tactical Management LLC with respect to the Rational Dividend CaptureVA Fund
In connection with a regular meeting held on August 24, 2018, the Board of Trustees (the “Board” or the “Trustees”) of Mutual Fund and Variable Insurance Trust, including a majority of the Trustees who are not “interested persons” as that term is defined in the Investment Company Act of 1940, as amended, discussed the approval of a sub-advisory agreement (the “Sub-Advisory Agreement”) between Rational Advisors, Inc. (“Rational”) and Tuttle Tactical Management LLC (“Tuttle”), with respect to the Rational Dividend Capture VA Fund (the “Fund”).
The Trustees then reviewed responses to a series of questions regarding, among other things, Tuttle’s expected service to the Fund, comparative fee and expense information and Tuttle’s expected profitability from managing the Fund.
Nature, Extent and Quality of Services.The Trustees considered that Tuttle will be responsible for day to day investment activities of the Fund, as well as for monitoring the Fund’s compliance both with legal standards and required reporting and trading within the Fund’s investment strategy. The Trustees also considered Tuttle’s cooperation and acceptance of the Board’s recommendations for compliance and operations as discussed in detail with Tuttle and determined that it is not unreasonable to expect that Tuttle will provide a level of service consistent with Rational’s and the Board’s expectations.
Performance. The Trustees then considered the performance of the Trend Aggregation Growth Fund which commenced operations on May 17, 2018. The Trustees noted that the Trend Aggregation Growth Fund outperformed the Morningstar Tactical category and Bloomberg Barclays US Aggregate Bond Index but underperformed the S&P 500 Index for the period since the Fund’s inception. The Board recognized the performance of other funds sub-advised by Tuttle within the fund complex. After further discussion, the Trustees concluded that it is not unreasonable to expect that the sub-advisor’s performance in managing the Fund will benefit its shareholders.
Fees and Expenses.As to the costs of the services to be provided by the sub-adviser to the Fund, the Board discussed the sub-advisory fee payable to Tuttle relative to the advisory fee noting that Tuttle will be paid a sub-advisory of 50% of the net management fee, (currently at 0.75%) and that Rational, not the Fund, would be responsible for the payment of such fee. The Trustees further noted that the management fee currently charged by Tuttle for other funds and accounts under management is 1%; well above the fee it will earn as sub-adviser to the Fund. The Trustees discussed the allocation of fees between Rational and the sub-adviser relative to its respective duties and other factors, and agreed that the allocation of fees between Rational and the sub-adviser was appropriate. The Trustees concluded that the proposed sub-advisory fee was not unreasonable.
Profitability.The Trustees discussed the total fees expected to be paid to Tuttle, and noted that Tuttle will receive no other compensation from its relationship with the Fund except the sub-
| RATIONAL VA FUNDS | |
| Supplemental Information (Unaudited) (Continued) | |
| December 31, 2018 | ANNUAL REPORT |
| | |
advisory fee earned pursuant to the proposed Sub-Advisory Agreement. The Trustees reviewed a profitability analysis prepared by Tuttle and noted that based on growth in assets projected by Tuttle, a healthy profit was expected during the first two years of Tuttle’s relationship with the Fund. The Trustees determined to monitor the actual growth in the Fund’s assets and will consider breakpoints in advisory/sub-advisory fee if the profit is determined to be excessive.
Economies of Scale.The Trustees considered whether there will be economies of scale with respect to the management of the Fund. The Trustees agreed that this was primarily an adviser level issue and should be considered with respect to the overall management agreement, taking into consideration the impact of the sub-advisory expense.
Conclusion.Having requested and received such information from the sub-adviser as the Trustees believed to be reasonably necessary to evaluate the terms of the Sub-Advisory Agreement, and as assisted by the advice of legal counsel, the Trustees concluded that based upon discussions and Tuttle’s pledge to enhance its compliance program, the Sub-Advisory Agreement was in the best interests of the Fund and its shareholders.
| RATIONAL VA FUNDS | |
| Boards of Trustees and Trust Officers (Unaudited) (Continued) | |
| December 31, 2018 | ANNUAL REPORT |
The Trustees and officers of the Trust, together with information as to their principal business occupations during the past five years and other information, are shown below. Unless otherwise noted, the address of each Trustee and Officer is 36 N. New York Avenue, Huntington, NY 11743. Each Trustee and officer also serves in the same capacity for the Strategy Shares, another open-end investment company whose series are managed by the Advisor. Collectively, the Funds, Strategy Shares, Mutual Fund Series Trust and TCG Financial Trusts I-X comprise the “Fund Complex”.
Independent Trustees Background
| | | | | Number of | |
| | | Term of Office | | Portfolios in | |
| Name, | | and | | Fund Complex | |
| Address and | Position with | Length of Time | Principal Occupation(s) | Overseen by | Other Directorships |
| Year of Birth | the Trust | Served* | During Past 5 Years | Trustee | Held During Past 5 Years |
Tobias Caldwell
Year of Birth: 1967 | Chairman of the Board and Trustee | Since January 2016 | Managing Member, Genovese Family Enterprises, LLC (family office) (1999-present); Managing Member, PTL Real Estate LLC (real estate/investment firm) (2000-present); Manager Member, Bear Properties, LLC (real estate firm) (2006-present). | 55 | Chairman of the Board, Strategy Shares (2016-present); Lead Independent Trustee and Chair of Audit Committee, Mutual Fund Series Trust (2006- present); Independent Trustee and Chair of Audit Committee, Variable Insurance Trust (2010- present); Trustee, M3Sixty Trust (2016-present); Chairman of the Board, AlphaCentric Prime Meridian Income Fund (July 2018 to present). |
Stephen P. Lachenauer
Year of Birth:
1967 | Chair of the Audit Committee and Trustee | Since January 2016 | Attorney, private practice (2011 to present). | 16 | Trustee and Chair of the Audit Committee, Strategy Shares (2016 – present); Trustee, TCG Financial Series Trusts I-X (2015-present); Trustee and Chair of the Audit Committee, AlphaCentric Prime Meridian Income Fund (July 2018 – present). |
Donald McIntosh
Year of Birth:
1967 | Trustee | Since January 2016 | Business Control & Risk Management Advisor, Santander Bank (February 2019 to present); Quality Control Advisor, Santander Bank (July 2016 – January 2019); Credit risk review analyst, Santander Holdings USA (May 2015 – 2016); Governance analyst, Santander Bank (2011 – April 2015). | 16 | Trustee, Strategy Shares (2016– present); Trustee, TCG Financial Series Trusts I-X (2015-present); Trustee, AlphaCentric Prime Meridian Income Fund (July 2018 – present). |
| RATIONAL VA FUNDS | |
| Boards of Trustees and Trust Officers (Unaudited) (Continued) | |
| December 31, 2018 | ANNUAL REPORT |
Officers**
| Name, Address, | Position(s) Held | Term and | Principal Occupation(s) |
| Year of Birth | with Registrant | Length Served* | During Past 5 Years |
| | | | |
Jerry Szilagyi
36 N. New York
Avenue
Huntington, NY 11743
Year of Birth: 1962 | President | Since April 2016 | President, Rational Advisors, Inc., 1/2016 - present; Chief Executive Officer, Catalyst Capital Advisors LLC, 1/2006- present; Member, AlphaCentric Advisors LLC, 2/2014 to Present; Managing Member, MFund Distributors LLC, 10/2012-present; Managing Member, MFund Services LLC, 1/2012 – Present; President, Abbington Capital Group LLC, 1998- present; President, Cross Sound Capital LLC, 6/2011 to 10/2013; President, USA Mutuals, Inc., 3/2011 to 7/2016. |
| | | | |
Erik Naviloff
80 Arkay Drive
Hauppauge, New York
11788
Year of Birth: 1968 | Treasurer | Since April 2016 | Vice President – Fund Administration, Gemini Fund Services, LLC, since 2012. |
| | | | |
Aaron Smith
80 Arkay Drive.
Hauppauge, New York
11788
Year of Birth: 1974 | Assistant Treasurer | Since April 2016 | Manager - Fund Administration, Gemini Fund Services, LLC, since 2012. |
| | | | |
Frederick J. Schmidt
36 N. New York Avenue
Huntington, NY 11743
Year of Birth: 1959 | Chief Compliance Officer | Since April 2016 | Director, MFund Services LLC since 5/2015; Director & Chief Compliance Officer, Citi Fund Services, 2010-2015. |
| | | | |
Jennifer A. Bailey
36 N. New York Avenue
Huntington, NY
11743
Year of Birth: 1968 | Secretary | Since April 2016 | Director of Legal Services, MFund Services LLC, 2/2012 to present. |
| | | | |
Michael Schoonover
36 N. New York Avenue
Huntington, NY 11743
Year of Birth: 1983 | Vice President | Since June 2018 | Chief Operating Officer, Catalyst Capital Advisors LLC & Rational Advisors, Inc., June 2017 to present; Portfolio Manager, Catalyst Capital Advisors LLC 12/2013 to present; Portfolio Manager, Rational Advisors, Inc. 1/2016 to 5/2018; Senior Analyst, Catalyst Capital Advisors LLC, 3/2013 to 12/2013. |
| * | The term of office of each Trustee is indefinite. |
| ** | Officers do not receive any compensation from the Trust. |
The Fund’s Statement of Additional Information (“SAI”) includes additional information about the Trustees and is available free of charge, upon request, by calling toll-free at 1-800-253-0412.
PRIVACY NOTICE
Mutual Fund & Variable Insurance Trust
Rev. July 2017
| FACTS | WHAT DOES MUTUAL FUND & VARIABLE INSURANCE TRUST DO WITH YOUR PERSONAL INFORMATION? |
| Why? | Financial companies choose how they share your personal information. Federal law gives consumers the right to limit some, but not all sharing. Federal law also requires us to tell you how we collect, share, and protect your personal information. Please read this notice carefully to understand what we do. |
| What? | The types of personal information we collect and share depends on the product or service that you have with us. This information can include: ● Social Security number and wire transfer instructions ● account transactions and transaction history ● investment experience and purchase history When you areno longerour customer, we continue to share your information as described in this notice. |
| How? | All financial companies need to share customers’ personal information to run their everyday business. In the section below, we list the reasons financial companies can share their customers’ personal information; the reasons Mutual Fund & Variable Insurance Trust chooses to share; and whether you can limit this sharing. |
Reasons we can share your
personal information: | Does Mutual Fund &
Variable Insurance Trust
share information? | Can you limit this
sharing? |
| For our everyday business purposes -such as to process your transactions, maintain your account(s), respond to court orders and legal investigations, or report to credit bureaus. | YES | NO |
| For our marketing purposes -to offer our products and services to you. | NO | We don’t share |
| For joint marketing with other financial companies. | NO | We don’t share |
| For our affiliates’ everyday business purposes -information about your transactions and records. | NO | We don’t share |
| For our affiliates’ everyday business purposes -information about your credit worthiness. | NO | We don’t share |
| For our affiliates to market to you | NO | We don’t share |
| For non-affiliates to market to you | NO | We don’t share |
| QUESTIONS? | Call 1-800-253-0412 |
PRIVACY NOTICE
Mutual Fund & Variable Insurance Trust
| What we do: |
How does Mutual Fund & Variable Insurance Trust protect my personal information? | To protect your personal information from unauthorized access and use, we use security measures that comply with federal law. These measures include computer safeguards and secured files and buildings. Our service providers are held accountable for adhering to strict policies and procedures to prevent any misuse of your nonpublic personal information. |
How does Mutual Fund & Variable Insurance Trust collect my personal information? | We collect your personal information, for example, when you: ● open an account or deposit money ● direct us to buy securities or direct us to sell your securities ● seek advice about your investments We also collect your personal information from others, such as credit bureaus, affiliates, or other companies. |
Why can’t I limit all sharing? | Federal law gives you the right to limit only: ● sharing for affiliates’ everyday business purposes – information about your creditworthiness. ● affiliates from using your information to market to you. ● sharing for non-affiliates to market to you. State laws and individual companies may give you additional rights to limit sharing. |
| Definitions |
| Affiliates | Companies related by common ownership or control. They can be financial and non-financial companies. ● Mutual Fund & Variable Insurance Trust does not share with our affiliates. |
| Non-affiliates | Companies not related by common ownership or control. They can be financial and non-financial companies. ● Mutual Fund & Variable Insurance Trust does not share with non-affiliates so they can market to you. |
| Joint marketing | A formal agreement between nonaffiliated financial companies that together market financial products or services to you. ● Mutual Fund & Variable Insurance Trust doesn’t jointly market. |
Variable investment options are not bank deposits or obligations, are not guaranteed by any bank, and are not insured or guaranteed by the U.S. government, the Federal Deposit Insurance Corporation, the Federal Reserve Board or any other government agency. Investment in variable investment options involves investment risk, including the possible loss of principal.
A copy of the policies and procedures that the Funds use to determine how to vote proxies relating to securities held in the Funds’ portfolios, as well as a record of how the Funds voted any such proxies during the most recent 12-month period ended June 30, is available without charge and upon request by calling 1-800-253-0412. This information is also available from the EDGAR database on the SEC’s website at www.sec.gov.
The Funds file with the SEC a complete schedule of their portfolio holdings, as of the first and third quarters of their fiscal year, on “Form N-Q”. These filings are available on the SEC’s website at www.sec.gov and may be reviewed and copied at the SEC’s Public Reference Room in Washington, D.C. (call 1-202-551-8090 for information on the operation of the Public Reference Room.)
The Huntington National Bank, is the Custodian of The Funds. Gemini Fund Services, LLC serves as the Administrator, Transfer Agent and Fund Accountant. Rational Advisors, Inc., serves as Investment Advisor to the Funds.
This report is authorized for distribution to prospective investors only when preceded or accompanied by the Funds’ prospectus, which contains facts concerning each Fund’s objective and policies, management fees, expenses and other information.
Shareholder Services:800-253-0412
(a) The Registrant has, as of the end of the period covered by this report, adopted a code of ethics that applies to the Registrant's principal executive officer, principal financial officer, and principal accounting officer or controller, or persons performing similar functions, regardless of whether these individuals are employed by the Registrant or a third party.
(b) During the period covered by this report, there were no amendments to any provision of the code of ethics.
(c) During the period covered by the report, with respect to the registrant’s code of ethics that applies to its Principal Executive Officer and Principal Financial Officer: there have been no amendments to a provision that relates to any element of the code of ethics definition enumerated in paragraph (b) of this Item 2.
| Item 3. | Audit Committee Financial Expert. |
3(a) The registrant’s board of trustees has determined that the registrant does not have an audit committee financial expert. The audit committee determined that, although none of its members meet the technical definition of an audit committee financial expert, the committee has sufficient financial expertise to adequately perform its duties under the Audit Committee Charter without the addition of a qualified expert.
| Item 4. | Principal Accountant Fees and Services. |
(a) Audit Fees. The aggregate fees billed for each of the last two fiscal years for professional services rendered by the registrant's principal accountant for the audit of the registrant's annual financial statements or services that are normally provided by the accountant in connection with statutory and regulatory filings or engagements for those fiscal years are as follows:
Fiscal year ended 2018: $16,000
Fiscal year ended 2017: $26,500
(b) Audit-Related Fees. There were no fees billed in each of the last two fiscal years for assurances and related services by the principal accountant that are reasonably related to the performance of the audit of the registrant’s financial statements and are not reported under paragraph (a) of this item.
Fiscal year ended 2018: $0
Fiscal year ended 2017: $0
(c) Tax Fees. The aggregate fees billed in each of the last two fiscal years for professional services rendered by the principal accountant for tax compliance are as follows:
Fiscal year ended 2018: $4,000
Fiscal year ended 2017: $6,000
(d) All other fees billed to the registrant by its principal accountants for the two most recent fiscal years:
Fiscal year ended 2018: $0
Fiscal year ended 2017: $0
(e)(1) The audit committee does not have pre-approval policies and procedures. Instead, the audit committee or audit committee chairman approves on a case-by-case basis each audit or non-audit service before the principal accountant is engaged by the Registrant.
(e)(2) There were no services described in each of paragraphs (b) through (d) of this Item that were approved by the audit committee pursuant to paragraph (c)(7)(i)(C) of Rule 2-01 of Regulation S-X. |
| (f) Not applicable. The percentage of hours expended on the principal accountant's engagement to audit the Registrant's financial statements for the most recent fiscal year that were attributed to work performed by persons other than the principal accountant's full-time, permanent employees was zero percent (0%). |
(g) All non-audit fees billed by the Registrant's principal accountant for services rendered to the Registrant for the fiscal years ended December 31, 2018 and 2017, respectively, are disclosed in (b)-(d) above. There were no audit or non-audit services performed by the Registrant's principal accountant for the Registrant's adviser.
Item 5. | Audit Committee of Listed Registrants.
|
Not applicable.
| Item 6. | Schedule of Investments. |
Included in annual report to shareholders filed under item 1 of this form.
| Item 7. | Disclosure of Proxy Voting Policies and Procedures for Closed-End Management Investment Companies. |
Not applicable.
| Item 8. | Portfolio Managers of Closed-End Management Investment Companies. |
Not applicable.
| Item 9. | Purchases of Equity Securities by Closed-End Management Investment Company and Affiliated Purchasers. |
Not applicable.
| Item 10. | Submission of Matters to a Vote of Security Holders. |
Not applicable.
| Item 11. | Controls and Procedures. |
(a) The registrant’s Principal Executive Officer and Principal Financial Officer, or persons performing similar functions, have concluded that the registrant’s disclosure controls and procedures (as defined in Rule 30a-3(c) under the Act) are effective in design and operation and are sufficient to form the basis of the certifications required by Rule 30a-2 under the Act, based on their evaluation of these disclosure controls and procedures within 90 days of the filing of this report on Form N-CSR.
(b) There were no changes in the registrant’s internal control over financial reporting (as defined in Rule 30a-3(d) under the Act (17 CFR 270.30a-3(d)) that occurred during the second fiscal quarter of the period covered by this report that have materially affected or are reasonably likely to materially affect, the registrant’s internal control over financial reporting.
Item 12. Disclosure of Securities Lending Activities for Closed-Ended Management Investment Companies
Not applicable.
(1) Code of Ethics for Principal Executive and Senior Financial Officers is attached hereto.
(2) Certifications pursuant to Section 302 of the Sarbanes-Oxley Act of 2002 are filed herewith.
(3) Certifications pursuant to Section 906 of the Sarbanes-Oxley Act of 2002 are filed herewith.
SIGNATURES
Pursuant to the requirements of the Securities Exchange Act of 1934 and the Investment Company Act of 1940, the registrant has duly caused this report to be signed on its behalf by the undersigned, thereunto duly authorized.
(Registrant)Mutual Fund and Variable Insurance Trust
| | | |
| By (Signature and Title) | | /s/ Jerry Szilagyi |
| | | Jerry Szilagyi, President and Principal Executive Officer |
| | | | |
| Date | | 3/6/19 | |
| | | | | | |
Pursuant to the requirements of the Securities Exchange Act of 1934 and the Investment Company Act of 1940, this report has been signed below by the following persons on behalf of the registrant and in the capacities and on the dates indicated.
| | | |
| By (Signature and Title) | | /s/ Jerry Szilagyi |
| | | Jerry Szilagyi, President and Principal Executive Officer |
| | | | |
| Date | | 3/6/19 | |
| | | | | | |
| | | |
| By (Signature and Title) | | /s/ Erik Naviloff |
| | | Erik Naviloff, Treasurer and Principal Financial Officer |
| | | | |
| Date | | 3/6/19 | |
| | | | | | |