UNITED STATES
SECURITIES AND EXCHANGE COMMISSION
Washington, D.C. 20549
FORM N-CSR
CERTIFIED SHAREHOLDER REPORT OF REGISTERED
MANAGEMENT INVESTMENT COMPANIES
Investment Company Act file number 811-05010
Mutual Fund and Variable Insurance Trust
(Exact name of registrant as specified in charter)
36 North New York Avenue
Huntington, NY 11743
(Address of principal executive offices) (Zip code)
Gemini Fund Services, LLC
17605 Wright Street
Omaha, Nebraska 68130
(Name and address of agent for service)
Registrant’s telephone number, including area code: 1-631-629-4237
Date of fiscal year end: December 31
Date of reporting period: December 31, 2017
| Item 1. | Reports to Shareholders. |

Annual Shareholder Report
December 31, 2017
Rational Dividend Capture VA Fund
(formerly, Catalyst Dividend Capture VA Fund)
Rational Insider Buying VA Fund
(formerly, Catalyst Insider Buying VA Fund)
Rational Dynamic Momentum VA Fund

January 31, 2018
Rational Dividend Capture VA Fund
Dear Fellow Shareholders,
The Rational Dividend Capture VA Fund (the “Fund”) seeks total return on investment, with dividend income an important component of that return. The Fund focuses on high dividend paying stocks that also are attractively valued to provide an attractive return over a full market cycle. We define a full market cycle as both a bear market and a bull market. It is expected that this strategy will underperform when such sectors like technology are very strong but outperform when the more aggressive sectors of the market are weak. The dividend yield provides a nice consistent stream of income and stability to the long-term returns. An appropriate benchmark for this strategy is not a simple question, it has characteristics of both an equity portfolio but also the yield more resembling the bond market historically. Many of the higher yielding sectors of the market had very negative returns in 2017, such as the energy sectors and telecommunications. Business Development Companies and REITs also underperformed significantly. Lastly, value-oriented stock also significantly underperformed growth stock, and in fact have done so 3 of the last four years. The value stocks and yield oriented stocks are very attractive on a historical basis relative to the market and in particular the growth or the momentum sectors. We are confident in the long-term potential of the Fund and strategy, particularly relative to more aggressive types of investments given where the markets are versus their long-term norms.
Investment Strategy
The Fund normally invests at least 80% of its net assets in dividend paying stocks, including preferred stocks and REITs.
The Fund uses a value approach to identify attractive, dividend paying stocks. The discipline focuses on cash flows or earnings of companies, their growth rate, and the valuation of their stock prices. As an example, the manager likes to buy REITs below their real estate value or operating companies below their intrinsic value, to gain from the appreciation of the stock overtime and collect an attractive dividend yield. Stocks are sold when the fundamentals deteriorate, become too highly valued, or when there may be a better alternative including cash.
As part of the investment process, the Fund invests in both preferred stocks and common stocks.
Fund Performance
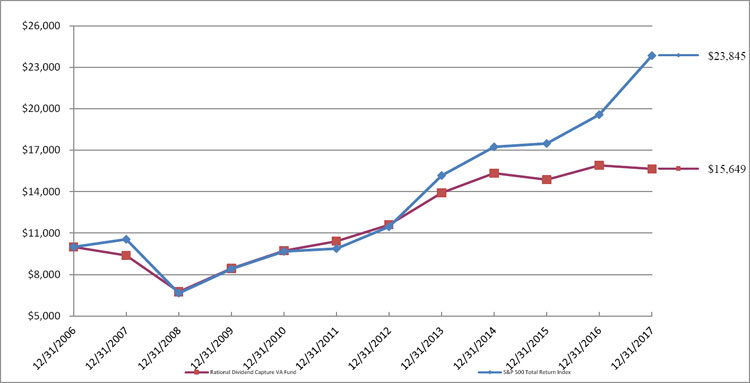
The Rational Dividend Capture VA Fund had a tough year, significantly underperforming its S&P 500 Total Return Index benchmark with a -1.59% return versus 21.83% for the benchmark. As we mentioned, the sectors the Fund invests, in order to get an attractive dividend yield and appreciation, performed poorly in 2017. The technology sector was an extremely strong performer in 2017, driven by securities that do not fit the invest criteria of the Fund. What typically happens in the late stage of a market cycle is the momentum or speculative stocks perform very strongly and the value and income stocks lag considerably relative to the market. This is exactly what happened in 2017. It is the expectation of management that the volatility of the markets is going to rise significantly in 2018, having an attractive dividend yield and having a cash reserve will help cushion the potential downside. Additionally, the cash can be invested opportunistically. Bear markets are always difficult to predict. Bear market occur due to recessions, or in the case of the 1987 crash it was due to rising interest rates, high valuations, too much bullish sentiment, too much margin debt, and a weak dollar, we have similar conditions currently. This strategy maybe a nice way of weathering the storm or benefitting from a resumption of value stocks due to stronger economic growth.
The Fund’s total annualized returns through 12/31/17 as compared to the S&P 500 Total Return Index were as follows:
| | 1 Year | 5 Years | 10 Years | Since Inception
(10/15/2001) |
| Rational Dividend Capture VA Fund | -1.59% | 6.16% | 5.24% | 6.25% |
| S&P 500 Total Return Index1 | 21.83% | 15.79% | 8.50% | 7.84% |
The Fund is an Investment vehicle for variable annuity contracts. All performance figures for the fund do not include any fees, expenses, or insurance charges imposed by the insurance company’s separate account. Please review the insurance contract prospectus for further description of these fees and expenses. This product is available as a sub-account investment to a variable life insurance policy only and is not offered directly to the general public. To obtain the most recent month- end performance information or the Fund’s prospectus please call the Fund, toll free at 1-800-253-0412. You can also obtain a prospectus at www.rationalvafunds.com.
Summary
We are much encouraged by the recent fiscal stimulus to accelerate the growth of the U.S. Economy improving the fundamentals of the sectors that the Fund typically focuses. We are confident in the long-term success of the strategy. Successful investing requires a long-term outlook focused on objective criteria that create value. We have adopted this outlook for the Fund, and we are glad that you have decided to share in our vision.
Sincerely,
Patrick Adams and Rick Garcia
Portfolio Managers
This report is intended for the Fund’s shareholders. It may not be distributed to prospective investors unless it is preceded or accompanied by the current Fund prospectus. To obtain a prospectus or other information about the Fund, please visit www.rationalvafunds.com or call 1-800-253-0412. Please read the prospectus carefully before investing.
| (1) | The S&P 500 Total Return Index by Standard & Poor’s Corp. is a capitalization-weighted index comprising 500 issues listed on various exchanges, representing the performance of the stock market generally. Please note that indices do not take into account any fees and expenses of investing in the individual securities that they track, and individuals cannot invest directly in any index, although individuals may invest in exchange traded funds or other investment vehicles that attempt to track the performance of an index. The Rational Dividend Capture VA Fund may or may not purchase the types of securities represented by the S&P 500 Total Return Index. |
4219-NLD-2/15/2018
| Rational Dividend Capture VA Fund (formerly, Catalyst Dividend Capture VA Fund) |
| PORTFOLIO REVIEW (Unaudited) |
| December 31, 2017 |
The Fund’s performance figures* for each of the periods ended December 31, 2017, compared to its benchmarks:
| | | Annualized |
| | 1 Year Return | 5 Year Return | 10 Year Return | Since Inception** |
| Rational Dividend Capture VA Fund | -1.59% | 6.16% | 5.24% | 6.25% |
| S&P 500 Total Return Index (a) | 21.83% | 15.79% | 8.50% | 7.84% |
| * | The performance data quoted here represents past performance. Current performance may be lower or higher than the performance data quoted above. Investment return and principal value will fluctuate, so that shares, when redeemed, may be worth more or less than their original cost. The returns shown do not reflect the deduction of taxes that a shareholder would pay on Fund distributions or on the redemptions of Fund shares. Past performance is no guarantee of future results. See the financial highlights for the current expense ratios. Performance figures for periods greater than 1 year are annualized. Per the fee table in the Fund’s May 1, 2017 prospectus, the total annual operating expense are 1.80% before fee waivers. For performance information current to the most recent month-end, please call toll-free 1-800-253-0412. |
| ** | Inception date is October 15, 2001. |
| (a) | The S&P 500 Total Return Index is the primary benchmark; it is an unmanaged index generally representing the performance of the broad domestic economy through changes in the aggregate market value |
Value of a $10,000 Investment
| Top 10 Holdings by Industry | | % of Net Assets | |
| REITS | | | 18.0 | % |
| Investment Companies | | | 14.7 | % |
| Oil & Gas | | | 11.6 | % |
| Exchange Traded Funds | | | 7.8 | % |
| Pharmaceuticals | | | 7.4 | % |
| Retail | | | 7.3 | % |
| Diversified Financials | | | 5.9 | % |
| Telecommunications | | | 5.2 | % |
| Semiconductors | | | 3.3 | % |
| Food | | | 3.1 | % |
| Other/Short-Term Investments | | | 15.7 | % |
| | | | 100.0 | % |
January 31, 2018
Rational Insider Buying VA Fund
Dear Fellow Shareholders,
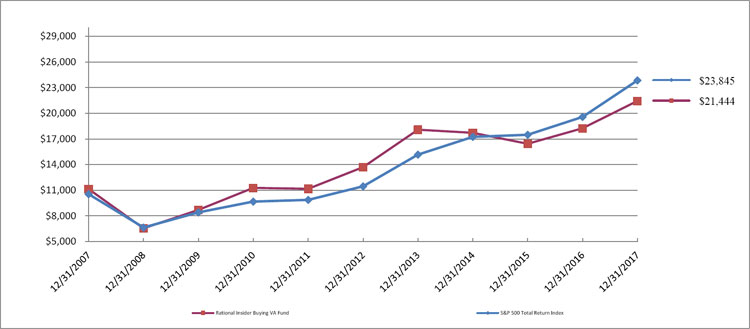
The Rational Insider Buying VA Fund (the “Fund”) invests in large capitalization U.S. companies that are experiencing significant corporate insider buying. During 2017, the Fund achieved double digit returns; however, it underperformed its S&P 500 Total Return Index (1) benchmark with a 17.52% return versus 21.83% for the benchmark. The Fund benefited from its overweight exposure to the Financials and Consumer Discretionary sectors. However, underweight exposure to the Information Technology and Health Care sectors detracted from Fund performance. We have positioned the Fund in the best signals of the large-cap insider buying strategy and are confident in the long-term potential of the Fund.
Investment Strategy
The Fund uses a quantitative methodology that ranks insider activity based on the strength of the signals that insiders are generating relative to how many executives are buying and how many shares they are purchasing. We believe that corporate insiders understand their own firm better than any outside investor possibly could.
The Fund uses public information that is filed with the Securities and Exchange Commission (“SEC”) on corporate insider and large shareholder buying and selling activity for its investment decisions. Numerous academic studies and our own research of insider trading data over long periods of time has resulted in the development of a proprietary method of analyzing activity that we believe can provide long-term capital appreciation. When looking at SEC filings, we focus on the insider identity (position in the company), potential motivations for buying, insider trading trends, trading volumes, firm size and other factors to select stocks for the portfolio. We sell stocks when the relevant insider trading trends reverse or when portfolio positions achieve or no longer provide targeted risk-adjusted return.
Fund Performance
The Rational Insider Buying VA Fund trailed its benchmark during 2017 due to limited exposure to the Information Technology sector which had neutral to negative insider sentiment during most of the year. Despite trailing its benchmark, the Fund generated stable returns throughout the year as performance was buoyed by its exposure to the Financials and Consumer Discretionary sectors.
The strong performance of the US equity market in 2017 was fueled by healthy corporate earnings, rising GDP, and the prospect for continued economic expansion driven by pro-growth government policy. Market participants favored growth stocks over value stocks and the Information Technology sector was the clear leader. One of the biggest influencers on market leadership was the massive and consistent inflows into passive equity strategies. The inflows into index tracking strategies continued to contribute to the narrow market leadership environment as the passive strategies allocated according to the weightings of the major indexes that they track. The S&P 500 Index heavyweights; Apple (AAPL), Microsoft (MSFT), Amazon (AMZN), and Facebook (FB); accounted for roughly 20% of the index’s gain during 2017. Throughout the year, the mechanical buying of passive strategies injected blind demand into these stock’s prices, however corporate executives within these companies did not participate in the buying as there were no insider purchases within these companies during 2017.
The frequency of corporate insider buying is often higher at companies with stock prices that reflect low valuation multiples. During much of the year, the Fund struggled to outperform the growth leadership group because it was
taking positions in companies with relatively lower valuation multiples where corporate insiders were buying their own stock.
During the past year, the Fund had its largest allocations within the Financials and Consumer Discretionary sectors as both exhibited substantial insider buying signals. We are pleased with the performance of the companies that have exhibited the most compelling insider activity within these sectors, and, the holdings within the Financials sector which significantly outperformed the S&P 500 Total Return Index benchmark during the trailing year. Despite not allocating to the S&P 500 Index heavy-weights, the Fund was able to generate a 17.52% return by investing in companies where corporate insiders are taking a personal stake in the performance of their company’s stock.
The Fund’s total annualized returns through 12/31/17 as compared to the S&P 500 Total Return Index were as follows:
| | 1 Year | 5 Years | 10 Years | Since Inception
(05/02/04) |
| Rational Insider Buying VA Fund | 17.52% | 9.37% | 6.77% | 8.77% |
| S&P 500 Total Return Index | 21.83% | 15.79% | 8.50% | 8.91% |
The Fund is an Investment vehicle for variable annuity contracts. All performance figures for the fund do not include any fees, expenses, or insurance charges imposed by the insurance company’s separate account. Please review the insurance contract prospectus for further description of these fees and expenses. This product is available as a sub-account investment to a variable life insurance policy only and is not offered directly to the general public. To obtain the most recent month- end performance information or the Fund’s prospectus please call the Fund, toll free at 1-800-253-0412. You can also obtain a prospectus at www.rationalvafunds.com.
Summary
We hold a relatively concentrated portfolio of large-capitalization U.S. companies experiencing significant insider buying – situations where those that know the most about the company are taking their own money and putting it back in the company through open market purchases. By reviewing numerous academic studies and performing our own historical research, we’ve found that this strategy can outperform the S&P 500 Total Return Index over the long run. Successful investing requires a long-term outlook focused on objective criteria that create value. We have adopted this outlook for the Rational Insider Buying VA Fund, and we are glad that you have decided to share in our vision.
Sincerely,
David Miller and Michael Schoonover
Portfolio Managers
This report is intended for the Fund’s shareholders. It may not be distributed to prospective investors unless it is preceded or accompanied by the current Fund prospectus. To obtain a prospectus or other information about the Fund, please visit www.rationalvafunds.com or call 1-800-253-0412. Please read the prospectus carefully before investing.
| (1) | The S&P 500 Total Return Index by Standard & Poor’s Corp. is a capitalization-weighted index comprising 500 issues listed on various exchanges, representing the performance of the stock market generally. Please note that indices do not take into account any fees and expenses of investing in the individual securities that they track, and individuals cannot invest directly in any index, although individuals may invest in exchange traded funds or other investment vehicles that attempt to track the performance of an index. The Rational Insider Buying VA Fund may or may not purchase the types of securities represented by the S&P 500 Total Return Index. |
3220-NLD-2/18/2018
| Rational Insider Buying VA Fund (formerly, Catalyst Insider Buying VA Fund) |
| PORTFOLIO REVIEW (Unaudited) |
| December 31, 2017 |
The Fund’s performance figures* for each of the periods ended December 31, 2017, compared to its benchmarks:
| | | Annualized |
| | 1 Year Return | 5 Year Return | 10 Year Return | Since Inception** |
| Rational Insider Buying VA Fund | 17.52% | 9.37% | 6.77% | 8.77% |
| S&P 500 Total Return Index(a) | 21.83% | 15.79% | 8.50% | 8.91% |
| * | The performance data quoted here represents past performance. Current performance may be lower or higher than the performance data quoted above. Investment return and principal value will fluctuate, so that shares, when redeemed, may be worth more or less than their original cost. The returns shown do not reflect the deduction of taxes that a shareholder would pay on Fund distributions or on the redemptions of Fund shares. Past performance is no guarantee of future results. See the financial highlights for the current expense ratios. Performance figures for periods greater than 1 year are annualized. Per the fee table in the Fund’s May 1, 2017 prospectus, the total annual operating expense are 1.71% before fee waivers. For performance information current to the most recent month-end, please call toll-free 1-800-253-0412. |
| ** | Inception date is May 2, 2004. |
| (a) | The S&P 500 Total Return Index is the primary benchmark; it is an unmanaged index generally representing the performance of the broad domestic economy through changes in the aggregate market value of 500 stocks representing all major industries. The S&P 500 Total Return Index does not include fees and expenses, and investors may not invest directly in an index. |
Value of a $10,000 Investment
| Top 10 Holdings by Industry | | % of Net Assets | |
| Banks | | | 13.3 | % |
| Retail | | | 11.9 | % |
| Healthcare-Products | | | 8.9 | % |
| Insurance | | | 6.6 | % |
| Semiconductors | | | 5.3 | % |
| Healthcare- Services | | | 5.1 | % |
| Internet | | | 5.0 | % |
| Chemicals | | | 4.9 | % |
| Food | | | 4.5 | % |
| Agriculture | | | 4.3 | % |
| Other/Short-Term Investments | | | 30.2 | % |
| | | | 100.0 | % |
January 31, 2018
Rational Dynamic Momentum VA Fund
Dear Fellow Shareholders,
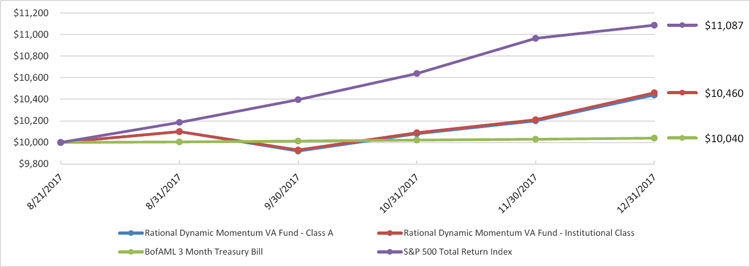
The Rational Dynamic Momentum VA Fund (“the Fund”) commenced trading in August 2017. The Fund seeks to provide investors capital appreciation uncorrelated to global equity markets.
The Fund’s total annualized returns through 12/31/17 as compared to the S&P 500 Total Return Index were as follows:
| | 3 Months | Since Inception
(08/21/2017) |
| Rational Dynamic Momentum VA Fund Class A | 5.24% | 4.40% |
| Rational Dynamic Momentum VA Fund Institutional | 5.34% | 4.60% |
| S&P 500 Total Return Index1 | 6.64% | 10.87% |
The Fund is an Investment vehicle for variable annuity contracts. All performance figures for the fund do not include any fees, expenses, or insurance charges imposed by the insurance company’s separate account. Please review the insurance contract prospectus for further description of these fees and expenses. This product is available as a sub-account investment to a variable life insurance policy only and is not offered directly to the general public. To obtain the most recent month- end performance information or the Fund’s prospectus please call the Fund, toll free at 1-800-253-0412. You can also obtain a prospectus at www.rationalvafunds.com.
Summary
Below, please find the yearly summary broken down by month:
August
August proved to be a profitable month. The markets were somewhat volatile due to the events of North Korea, and thus, holding a diversified portfolio proved beneficial to our holdings. Continued weakness in the US dollar also benefited the portfolio, while some small losses from our fixed income positions were offset by profits from the stock sector.
Overall, the commodities were profitable. The biggest losses came the meats sector led by our long positions in cattle and hogs. However, these losses were more than offset by the gains in the metals and softs sectors. In the metals, our long positions in high grade copper and palladium led the way. In the softs sector, weaker prices in coffee and cocoa benefited our short positions. We continue to believe that our long-term trend-following approach coupled with our trading a diversified portfolio helped to successfully navigate the volatility of August.
September
Performance in September was lower. The weakness in the dollar in recent months did not continue in September as the Fed’s desire to continue raising interest rates fueled a rally, hurting performance. Even though we did profit in our Ruble and British Pound positions, their gains could not offset the losses incurred in our USD/Swedish Krona, Australian Dollar, and Mexican Peso positions.
The fund had profits from the fixed income sector led by our short position in the three-month Canadian Bankers Acceptances. In commodities, the metals proved to be the most challenging. Gains in our short positions in platinum and silver could not overcome the losses in our long gold and copper positions.
October
October’s performance was very strong as the stock and commodity sectors led the way and more than offset the slight losses experienced by the currency sector. The dollar rally continued in October as a myriad of events in October
helped to sustain the rally. Optimism from the likelihood of tax cuts, an interest rate hike in December and better than expected GDP data were some reasons.
Much of the stock rally was led by tech sector. In the commodities, most of the positive performance came from metals. Increased demand in the US and China helped push copper prices higher. Palladium prices continued its multi-month climb higher, partly due to rising auto sales in China and also by added demand in the US by those replacing their automobiles lose in the recent hurricanes. In the meats sector, soaring cattle prices in October also benefited the portfolio.
November
November was a profitable month led mostly by currencies and stocks. The commodities had a negative impact, but losses in this sector were more than offset by the profits in the other sectors. With the currencies, the strength in the British Pound, Euro and Mexican Peso against the US dollar helped the portfolio.
The surging stock market continued in November partially fueled by the strong prospects of a major tax overhaul. In fixed income, the notion of higher interest rates helped our short positions. In November, three of the four major sectors benefited the portfolio which led to this month’s positive performance.
December
The year ended on a solid note in December. All major sectors exhibited positive performance, led by currencies and the commodities. In the currencies, the dollar’s continued weakness seemed to be the trend. Expectations that the European economy will continue to expand coupled with the tapering of the economic stimulus pushed the Euro higher.
In the commodities, the metals and energy prices continued to climb in December. The positive performance in the metals was led by aluminum and copper, while long positions in heating oil also benefited the portfolio. In the fixed income sector, higher interest rate was again the theme, as the Fed raised rates by 25 basis points. Stocks also contributed to the month’s gains.
Sincerely,
Jerry Parker, Jr and Michael Ivie
Portfolio Managers
This report is intended for the Fund’s shareholders. It may not be distributed to prospective investors unless it is preceded or accompanied by the current Fund prospectus. To obtain a prospectus or other information about the Fund, please visit www.rationalvafunds.com or call 1-800-253-0412. Please read the prospectus carefully before investing.
| 1 | The S&P 500 Total Return Index® (“S&P 500 TR”) is an unmanaged index generally representing the performance of the broad domestic economy through changes in the aggregate market value of 500 stocks representing all major industries. Indices are unmanaged and, unlike the Fund, are not affected by cash flows. It is not possible to invest directly in an Index. For additional disclosure relating to the S&P 500 Value TR and S&P 500 TR, please see “Additional Disclaimers” in the Fund’s Prospectus. |
4218-NLD-2/15/2018
| Rational Dynamic Momentum VA Fund |
| PORTFOLIO REVIEW (Unaudited) |
| December 31, 2017 |
The Fund’s performance figures* for each of the periods ended December 31, 2017, compared to its benchmarks:
| | Annualized |
| | Since Inception** |
| Rational Dynamic Momentum VA Fund - Class A | 4.40% |
| Rational Dynamic Momentum VA Fund - Institutional | 4.60% |
| BofAML 3 Month Treasury Bill (a) | 0.29% |
| S&P 500 Total Return Index (b) | 10.87% |
| * | The performance data quoted here represents past performance. Current performance may be lower or higher than the performance data quoted above. Investment return and principal value will fluctuate, so that shares, when redeemed, may be worth more or less than their original cost. The returns shown do not reflect the deduction of taxes that a shareholder would pay on Fund distributions or on the redemptions of Fund shares. Past performance is no guarantee of future results. See the financial highlights for the current expense ratios. Performance figures for periods greater than 1 year are annualized. Per the fee table in the Fund’s May 1, 2017 prospectus, the total annual operating expense for Class A is 2.89% and Class I is 2.39%, before fee waivers. For performance information current to the most recent month-end, please call toll-free 1-800-253-0412. |
| ** | Inception date is August 21, 2017. |
| (a) | BofA Merrill Lynch 3-Month U.S. Treasury Bill Index “BofAML 3-Month T-Bill,” is an index of short-term U.S. Government securities maturing in 90 days. Investors cannot invest directly in an Index. |
| (b) | The S&P 500 Total Return Index is the primary benchmark; it is an unmanaged index generally representing the performance of the broad domestic economy through changes in the aggregate market value of 500 stocks representing all major industries. The S&P 500 Total Return Index does not include fees and expenses, and investors may not invest directly in an index. |
Comparison of the Change in Value of a $10,000 Investment
| Top 10 Holdings by Industry * | | % of Net Assets | |
| Short-Term Investments | | | 5.9 | % |
| Other/Cash & Equivalents | | | 94.1 | % |
| | | | 100.0 | % |
* The holdings by industry detail does not include derivative exposre.
Please refer to the Consolidated Portfolio of Investments for a more detailed breakdown of the Fund’s assets.
| RATIONAL DIVIDEND CAPTURE VA FUND (Formerly CATALYST DIVIDEND CAPTURE VA FUND) |
| PORTFOLIO OF INVESTMENTS |
| December 31, 2017 |
| Shares | | | | | Value | |
| | | | | COMMON STOCK - 86.9% | | | | |
| | | | | BANKS - 2.0% | | | | |
| | 6,000 | | | Bank of America Corp. | | $ | 177,120 | |
| | 1,600 | | | JPMorgan Chase & Co. | | | 171,104 | |
| | | | | | | | 348,224 | |
| | | | | COMPUTERS - 1.0% | | | | |
| | 1,100 | | | International Business Machines Corp. | | | 168,762 | |
| | | | | | | | | |
| | | | | DIVERSIFIED FINANCIAL SERVICES - 4.9% | | | | |
| | 30,100 | | | Arlington Asset Investment Corp. | | | 354,578 | |
| | 37,900 | | | Five Oaks Investment Corp. | | | 151,600 | |
| | 53,887 | | | Medley Management Inc | | | 350,265 | |
| | | | | | | | 856,443 | |
| | | | | ENTERTAINMENT - 2.9% | | | | |
| | 33,350 | | | AMC Entertainment Holdings Inc | | | 503,585 | |
| | | | | | | | | |
| | | | | FOOD - 3.1% | | | | |
| | 2,950 | | | JM Smucker Co. | | | 366,508 | |
| | 2,600 | | | Kellogg Co. | | | 176,748 | |
| | | | | | | | 543,256 | |
| | | | | INVESTMENT COMPANIES - 14.7% | | | | |
| | 58,900 | | | Apollo Investment Corp. | | | 333,374 | |
| | 10,000 | | | Capitala Finance Corp. | | | 72,800 | |
| | 45,700 | | | FS Investment Corp. | | | 335,895 | |
| | 154,500 | | | Medley Capital Corp. | | | 806,490 | |
| | 73,100 | | | Oaktree Specialty Lending Corp. | | | 357,459 | |
| | 48,800 | | | PennantPark Investment Corp. | | | 337,208 | |
| | 16,400 | | | Solar Capital Ltd. | | | 331,444 | |
| | | | | | | | 2,574,670 | |
| | | | | IRON/STEEL- 1.0% | | | | |
| | 2,800 | | | Nucor Corp. | | | 178,024 | |
| | | | | | | | | |
| | | | | MEDIA - 1.1% | | | | |
| | 1,700 | | | Walt Disney Co. | | | 182,767 | |
| | | | | | | | | |
| | | | | MISCELLANEOUS MANUFACTURING - 2.4% | | | | |
| | 24,300 | | | General Electric Co. | | | 424,035 | |
| | | | | | | | | |
| | | | | OIL & GAS - 11.6% | | | | |
| | 29,000 | | | Alliance Resource Partners LP | | | 571,300 | |
| | 5,215 | | | Anadarko Petroleum Corp. | | | 279,733 | |
| | 12,900 | | | BP PLC | | | 542,187 | |
| | 30,385 | | | Nabors Industries Ltd. | | | 207,530 | |
| | 6,370 | | | Royal Dutch Shell PLC | | | 424,943 | |
| | | | | | | | 2,025,693 | |
| | | | | PHARMACEUTICALS - 7.4% | | | | |
| | 20,800 | | | GlaxoSmithKline PLC | | | 737,776 | |
| | 9,795 | | | Merck & Co, Inc. | | | 551,165 | |
| | | | | | | | 1,288,941 | |
| | | | | PIPELINES - 2.0% | | | | |
| | 8,200 | | | Plains All American Pipeline LP | | | 169,248 | |
| | 3,650 | | | Western Gas Partners LP | | | 175,528 | |
| | | | | | | | 344,776 | |
| | | | | REITS - 17.0% | | | | |
| | 21,100 | | | CBL & Associates Properties, Inc. | | | 119,426 | |
| | 20,000 | | | City Office REIT, Inc. | | | 260,200 | |
| | 38,200 | | | CYS Investments, Inc. | | | 306,746 | |
| | 18,080 | | | Global Medical REIT,Inc. | | | 148,256 | |
| | 26,890 | | | Independence Realty Trust, Inc. | | | 271,320 | |
| | 96,100 | | | New Senior Investment Group, Inc. | | | 726,516 | |
| | 6,200 | | | Omega Healthcare Investors, Inc. | | | 170,748 | |
| | 5,000 | | | Senior Housing Properties Trust | | | 95,750 | |
| | 29,674 | | | Uniti Group, Inc. | | | 527,900 | |
| | 24,110 | | | Whitestone REIT | | | 347,425 | |
| | | | | | | | 2,974,287 | |
See accompanying notes to financial statements.
| RATIONAL DIVIDEND CAPTURE VA FUND (Formerly CATALYST DIVIDEND CAPTURE VA FUND) |
| PORTFOLIO OF INVESTMENTS (Continued) |
| December 31, 2017 |
| Shares | | | | | | | | | Value | |
| | | | | COMMON STOCK - 86.9% (Continued) | | | | | | | | |
| | | | | RETAIL - 7.3% | | | | | | | | |
| | 2,450 | | | CVS Health Corp. | | | | | | $ | 177,625 | |
| | 3,600 | | | Kohl’s Corp. | | | | | | | 195,228 | |
| | 6,900 | | | Macy’s, Inc. | | | | | | | 173,811 | |
| | 54,100 | | | Office Depot, Inc . | | | | | | | 191,514 | |
| | 2,800 | | | Target Corp. | | | | | | | 182,700 | |
| | 4,900 | | | Wal-Mart Stores, Inc. | | | | | | | 355,838 | |
| | | | | | | | | | | | 1,276,716 | |
| | | | | SEMICONDUCTORS - 3.3% | | | | | | | | |
| | 3,700 | | | Intel Corp. | | | | | | | 170,792 | |
| | 6,520 | | | Qualcomm, Inc. | | | | | | | 417,410 | |
| | | | | | | | | | | | 588,202 | |
| | | | | TELECOMMUNICATIONS - 5.2% | | | | | | | | |
| | 19,200 | | | CenturyLink, Inc. | | | | | | | 320,256 | |
| | 12,300 | | | Frontier Communications Corp. | | | | | | | 83,148 | |
| | 51,500 | | | Telefonica SA | | | | | | | 498,520 | |
| | | | | | | | | | | | 901,924 | |
| | | | | | | | | | | | | |
| | | | | TOTAL COMMON STOCK (Cost - $14,817,659) | | | | | | | 15,180,305 | |
| | | | | | | | | | | | | |
| | | | | EXCHANGE TRADED FUNDS - 7.8% | | | | | | | | |
| | 58,600 | | | ProShares UltraPro Short S&P 500 | | | | | | | 666,282 | |
| | 32,500 | | | ProShares UltraPro Short QQQ | | | | | | | 699,075 | |
| | | | | TOTAL EXCHANGE TRADED FUNDS (Cost - $1,467,947) | | | | | | | 1,365,357 | |
| | | | | | | | | | | | | |
| | | | | | | Interest Rate (%) | | Maturity | | | | |
| | | | | PREFERRED STOCK - 2.0% | | | | | | | | |
| | | | | DIVERSIFIED FINANCIAL SERVICES - 1.0% | | | | | | | | |
| | 7,050 | | | Ladenburg Thalmann Financial Services, Inc. | | 6.5000 | | 11/30/2027 | | | 173,705 | |
| | | | | | | | | | | | | |
| | | | | REIT - 1.0% | | | | | | | | |
| | 6,200 | | | Innovative Industrial Properties, Inc. | | 9.0000 | | Perpetual | | | 173,228 | |
| | | | | | | | | | | | | |
| | | | | TOTAL PREFERRED STOCK (Cost - $331,250) | | | | | | | 346,933 | |
| | | | | | | | | | | | | |
| | | | | SHORT-TERM INVESTMENTS - 3.5% | | | | | | | | |
| | 617,743 | | | Federated Treasury Obligations Fund, Institutional Class, 1.15% ** | | | | | | | 617,743 | |
| | | | | TOTAL SHORT-TERM INVESTMENTS (Cost $617,743) | | | | | | | 617,743 | |
| | | | | | | | | | | | | |
| | | | | TOTAL INVESTMENTS - 100.2% (Cost - $17,234,599) (a) | | | | | | $ | 17,510,338 | |
| | | | | LIABILITIES IN EXCESS OF OTHER ASSETS - (0.2)% | | | | | | | (34,673 | ) |
| | | | | NET ASSETS - 100.0% | | | | | | $ | 17,475,665 | |
PLC - Public Limited Company.
REIT - Real Estate Investment Trust.
| ** | Rate shown represents the rate at December 31, 2017 and is subject to change and resets daily. |
| (a) | Represents cost for financial reporting purposes. Aggregate cost for federal tax purposes is $17,291,585 and differs from fair value by net unrealized appreciation (depreciation) of securities as follows: |
| Unrealized appreciation: | | $ | 1,030,405 | |
| Unrealized depreciation: | | | (811,652 | ) |
| Net unrealized appreciation: | | $ | 218,753 | |
See accompanying notes to financial statements.
| RATIONAL INSIDER BUYING VA FUND (Fomerly CATALYST INSIDER BUYING VA FUND) |
| PORTFOLIO OF INVESTMENTS |
| December 31, 2017 |
| Shares | | | | | Value | |
| | | | | COMMON STOCK - 98.6% | | | | |
| | | | | AGRICULTURE - 4.3% | | | | |
| | 11,500 | | | Altria Group, Inc. | | $ | 821,215 | |
| | 6,500 | | | Philip Morris International, Inc. | | | 686,725 | |
| | | | | | | | 1,507,940 | |
| | | | | AIRLINES - 2.6% | | | | |
| | 14,000 | | | Southwest Airlines Co. | | | 916,300 | |
| | | | | | | | | |
| | | | | BANKS - 13.3% | | | | |
| | 29,200 | | | Bank of America Corp. | | | 861,984 | |
| | 23,300 | | | Citizens Financial Group, Inc. | | | 978,134 | |
| | 8,600 | | | JPMorgan Chase & Co. | | | 919,684 | |
| | 6,800 | | | PNC Financial Services Group, Inc. | | | 981,172 | |
| | 14,950 | | | SunTrust Banks, Inc. | | | 965,620 | |
| | | | | | | | 4,706,594 | |
| | | | | BEVERAGES - 2.8% | | | | |
| | 4,400 | | | Constellation Brands, Inc. | | | 1,005,708 | |
| | | | | | | | | |
| | | | | CHEMICALS - 4.9% | | | | |
| | 6,500 | | | Monsanto Co. | | | 759,070 | |
| | 2,400 | | | Sherwin-Williams Co. | | | 984,096 | |
| | | | | | | | 1,743,166 | |
| | | | | COMMERICIAL SERVICES - 2.7% | | | | |
| | 5,700 | | | S&P Global, Inc. | | | 965,580 | |
| | | | | | | | | |
| | | | | FOOD - 4.5% | | | | |
| | 16,800 | | | Mondelez International, Inc. | | | 719,040 | |
| | 14,500 | | | Sysco Corp. | | | 880,585 | |
| | | | | | | | 1,599,625 | |
| | | | | HAND/MACHINE TOOLS - 2.7% | | | | |
| | 5,700 | | | Stanley Black & Decker, Inc. | | | 967,233 | |
| | | | | | | | | |
| | | | | HEALTHCARE-PRODUCTS - 8.9% | | | | |
| | 4,000 | | | Cooper Cos., Inc. | | | 871,520 | |
| | 6,500 | | | Edwards Lifesciences Corp. * | | | 732,615 | |
| | 4,600 | | | IDEXX Laboratories, Inc. * | | | 719,348 | |
| | 5,400 | | | Stryker Corp. | | | 836,136 | |
| | | | | | | | 3,159,619 | |
| | | | | HEALTHCARE-SERVICES - 5.1% | | | | |
| | 9,600 | | | Centene Corp. * | | | 968,448 | |
| | 9,400 | | | HCA Holdings, Inc. * | | | 825,696 | |
| | | | | | | | 1,794,144 | |
| | | | | HOME FURNISHINGS - 1.8% | | | | |
| | 3,800 | | | Whirlpool Corp. | | | 640,832 | |
| | | | | | | | | |
| | | | | INSURANCE - 6.6% | | | | |
| | 9,800 | | | Aflac, Inc. | | | 860,244 | |
| | 16,500 | | | CNA Financial Corp. | | | 875,325 | |
| | 7,000 | | | Torchmark Corp. | | | 634,970 | |
| | | | | | | | 2,370,539 | |
| | | | | INTERNET - 5.0% | | | | |
| | 20,000 | | | eBay, Inc. * | | | 754,800 | |
| | 5,250 | | | Netflix, Inc. * | | | 1,007,790 | |
| | | | | | | | 1,762,590 | |
| | | | | LODGING - 2.3% | | | | |
| | 24,000 | | | MGM Resorts International | | | 801,360 | |
| | | | | | | | | |
| | | | | OIL & GAS - 2.8% | | | | |
| | 15,000 | | | Marathon Petroleum Corp. | | | 989,700 | |
See accompanying notes to financial statements.
| RATIONAL INSIDER BUYING VA FUND (Fomerly CATALYST INSIDER BUYING VA FUND) |
| PORTFOLIO OF INVESTMENTS (Continued) |
| December 31, 2017 |
| Shares | | | | | Value | |
| | | | | COMMON STOCK - 98.6% (Continued) | | | | |
| | | | | PIPELINES - 1.9% | | | | |
| | 25,800 | | | Enterprise Products Partners LP | | $ | 683,958 | |
| | | | | | | | | |
| | | | | REITS - 4.0% | | | | |
| | 66,000 | | | Annaly Capital Management, Inc. | | | 784,740 | |
| | 3,100 | | | Public Storage | | | 647,900 | |
| | | | | | | | 1,432,640 | |
| | | | | RETAIL - 11.9% | | | | |
| | 10,600 | | | Darden Restaurants, Inc. | | | 1,017,812 | |
| | 5,425 | | | Home Depot, Inc. | | | 1,028,199 | |
| | 6,100 | | | McDonald’s Corp. | | | 1,049,932 | |
| | 2,550 | | | O’Reilly Automotive, Inc. * | | | 613,377 | |
| | 2,300 | | | Ulta Beauty, Inc. * | | | 514,418 | |
| | | | | | | | 4,223,738 | |
| | | | | SEMICONDUCTORS - 5.3% | | | | |
| | 9,500 | | | Analog Devices, Inc. | | | 845,785 | |
| | 50,000 | | | ON Semiconductor Corp. * | | | 1,047,000 | |
| | | | | | | | 1,892,785 | |
| | | | | SOFTWARE - 2.5% | | | | |
| | 6,800 | | | Fiserv, Inc. * | | | 891,684 | |
| | | | | | | | | |
| | | | | TEXTILES - 2.7% | | | | |
| | 3,500 | | | Mohawk Industries, Inc. * | | | 965,650 | |
| | | | | | | | | |
| | | | | TOTAL COMMON STOCK (Cost - $28,559,172) | | | 35,021,385 | |
| | | | | | | | | |
| | | | | SHORT-TERM INVESTMENTS - 1.7% | | | | |
| | 608,377 | | | Federated Treasury Obligations Fund, Institutional Class, 1.15% ** | | | 608,377 | |
| | | | | TOTAL SHORT-TERM INVESTMENTS (Cost - $608,377) | | | 608,377 | |
| | | | | | | | | |
| | | | | TOTAL INVESTMENTS - 100.3% (Cost - $29,167,549) (a) | | $ | 35,629,762 | |
| | | | | LIABILITIES IN EXCESS OF OTHER ASSETS - (0.3)% | | | (113,421 | ) |
| | | | | NET ASSETS - 100.0% | | $ | 35,516,341 | |
LP - Limited Partnership.
REIT - Real Estate Investment Trust.
| * | Non-income producing security. |
| ** | Rate shown represents the rate at December 31, 2017; it is subject to change and resets daily. |
| (a) | Represents cost for financial reporting purposes. Aggregate cost for federal tax purposes is $29,114,112 and differs from fair value by net unrealized appreciation (depreciation) of securities as follows: |
| Unrealized appreciation: | | $ | 6,928,530 | |
| Unrealized depreciation: | | | (412,880 | ) |
| Net unrealized appreciation: | | $ | 6,515,650 | |
See accompanying notes to financial statements.
| RATIONAL DYNAMIC MOMENTUM VA FUND |
| CONSOLIDATED PORTFOLIO OF INVESTMENTS |
| December 31, 2017 |
| Shares | | | | | Value | |
| | | | | SHORT-TERM INVESTMENTS - 5.9% | | | | |
| | 614,910 | | | Fidelity Institutional Government Portfolio , Institutional Class, 1.19% * + (Cost - $614,910) | | $ | 614,910 | |
| | | | | | | | | |
| | | | | TOTAL INVESTMENTS - 5.9% (Cost - $614,910) (a) | | $ | 614,910 | |
| | | | | OTHER ASSETS LESS LIABILITIES - 94.1% | | | 9,839,923 | |
| | | | | NET ASSETS - 100.0% | | $ | 10,454,833 | |
| * | Rate shown represents the rate at December 31, 2017, and is subject to change and resets daily. |
| + | All or a portion of this investment is a holding of the Catalyst Managed Futures Strategy Fund Limited. |
| (a) | Represents cost for financial reporting purposes. Aggregate cost for federal tax purposes, including futures, is $855,684 and differs from fair value by net unrealized appreciation (depreciation) of securities as follows: |
| Unrealized appreciation: | | $ | 129,544 | |
| Unrealized depreciation: | | | (134,246 | ) |
| Net unrealized depreciation: | | $ | (4,702 | ) |
| | | | | | | | | | Unrealized | |
| | | | | | Underlying Face | | | | Appreciation / | |
| Long Contracts | | | | | Amount at Value ($) | | Maturity | | (Depreciation) | |
| | | | | OPEN LONG FUTURES CONTRACTS - 1.9% | | | | | | | | |
| | 31 | | | 3M Co. | | 731,569 | | March 2018 | | $ | (9,848 | ) |
| | 86 | | | Abbott Laboratories | | 492,092 | | March 2018 | | | 1,811 | |
| | 4 | | | Alphabet, Inc. | | 422,468 | | March 2018 | | | 1,011 | |
| | 4 | | | Amazon.Com, Inc. | | 469,020 | | March 2018 | | | 475 | |
| | 38 | | | Apple, Inc. | | 644,784 | | March 2018 | | | (10,373 | ) |
| | 12 | | | AUD USD Currency Future | | 937,320 | | March 2018 | | | 15,710 | |
| | 112 | | | Bank Of America Corp. | | 331,520 | | March 2018 | | | (618 | ) |
| | 3 | | | Biogen Idec, Inc. | | 95,823 | | March 2018 | | | (1,632 | ) |
| | 26 | | | BP Currency Future | | 2,203,013 | | March 2018 | | | 12,725 | |
| | 35 | | | Brazil Real Future | | 1,054,725 | | February 2018 | | | 2,520 | |
| | 56 | | | Bristrol-Myer Squibb Co. | | 344,064 | | March 2018 | | | (4,523 | ) |
| | 28 | | | C$ Currency Future | | 2,237,200 | | March 2018 | | | 34,595 | |
| | 30 | | | Chevron Corp. | | 376,560 | | March 2018 | | | 5,664 | |
| | 86 | | | Cisco Systems, Inc. | | 330,240 | | March 2018 | | | (184 | ) |
| | 54 | | | Citigroup, Inc. | | 402,894 | | March 2018 | | | (7,670 | ) |
| | 107 | | | Coca-Cola Co. | | 492,200 | | March 2018 | | | (3,091 | ) |
| | 50 | | | Conocophillips | | 275,150 | | March 2018 | | | 3,357 | |
| | 18 | | | Copper Future + | | 1,485,225 | | March 2018 | | | 37,875 | |
| | 4 | | | Cotton Future + | | 157,260 | | March 2018 | | | 1,195 | |
| | 15 | | | Euro Fx Currency Future | | 2,264,156 | | March 2018 | | | 20,769 | |
| | 20 | | | Fedex Corp. | | 500,220 | | March 2018 | | | 4,606 | |
| | 43 | | | Ford Motor Co. | | 53,836 | | March 2018 | | | (658 | ) |
| | 5 | | | Gasoline Future + | | 377,118 | | February 2018 | | | 13,772 | |
| | 38 | | | Home Depot, Inc. | | 722,114 | | March 2018 | | | 5,406 | |
| | 79 | | | Intel Corp. | | 365,612 | | March 2018 | | | 1,308 | |
| | 55 | | | JPMorgan Chase & Co. | | 589,710 | | March 2018 | | | (3,743 | ) |
| | 13 | | | Live Cattle Future + | | 632,060 | | February 2018 | | | (10,970 | ) |
| | 9 | | | LME Aluminum Forward + | | 510,019 | | February 2018 | | | 17,681 | |
| | 2 | | | LME Nickel Forward + | | 152,856 | | February 2018 | | | 1,314 | |
| | 3 | | | LME Zinc Forward + | | 249,638 | | February 2018 | | | 4,875 | |
| | 53 | | | McDonalds Corp. | | 914,621 | | March 2018 | | | (3,016 | ) |
| | 17 | | | Mexican Peso Future | | 425,680 | | March 2018 | | | (6,360 | ) |
| | 51 | | | Microsoft Corp. | | 437,427 | | March 2018 | | | 4,109 | |
| | 57 | | | Nike, Inc. | | 357,447 | | March 2018 | | | (3,422 | ) |
| | 9 | | | NY Harbor ULSD Future | | 781,742 | | February 2018 | | | 30,332 | |
| | 90 | | | Oracle Corp. | | 426,600 | | March 2018 | | | (8,354 | ) |
| | 9 | | | Palladium Future + | | 954,900 | | March 2018 | | | 31,945 | |
| | 25 | | | PepsiCo, Inc. | | 300,600 | | March 2018 | | | 1,764 | |
| | 107 | | | Pfizer, Inc. | | 388,624 | | March 2018 | | | (4,475 | ) |
| | 1 | | | Priceline Group, Inc. | | 174,231 | | March 2018 | | | (957 | ) |
| | 32 | | | Russian Ruble Future | | 1,378,000 | | March 2018 | | | 21,850 | |
| | 38 | | | Southern Co. | | 183,236 | | March 2018 | | | (4,732 | ) |
| | 9 | | | Verizon Communications, Inc. | | 47,763 | | March 2018 | | | (277 | ) |
| | 62 | | | Wal-Mart Stores, Inc. | | 613,862 | | March 2018 | | | 1,351 | |
| | 5 | | | WTI Crude Future + | | 302,100 | | February 2018 | | | 6,550 | |
| | | | | Net Unrealized Appreciation From Open Long Futures Contracts | | $ | 199,667 | |
See accompanying notes to financial statements.
| RATIONAL DYNAMIC MOMENTUM VA FUND |
| CONSOLIDATED PORTFOLIO OF INVESTMENTS (Continued) |
| December 31, 2017 |
| | | | | | | | | | Unrealized | |
| Short | | | | | Underlying Face | | | | Appreciation / | |
| Contracts | | | | | Amount at Value ($) | | Maturity | | (Depreciation) | |
| | | | | OPEN SHORT FUTURES CONTRACTS - 0.3% | | | | | | | | |
| | (52 | ) | | 90 Day Euro Future | | (12,706,200) | | June 2019 | | $ | 788 | |
| | (41 | ) | | AT&T, Inc. | | (159,818) | | March 2018 | | | (2,585 | ) |
| | (42 | ) | | Bank Accept Future | | (8,205,495) | | September 2018 | | | 6,981 | |
| | (15 | ) | | Coffee ‘C’ Future + | | (709,875) | | March 2018 | | | (4,838 | ) |
| | (26 | ) | | Corn Future + | | (455,975) | | March 2018 | | | (850 | ) |
| | (6 | ) | | JPN Yen Currency | | (668,550) | | March 2018 | | | (1,475 | ) |
| | (31 | ) | | Mill Wheat Euro + | | (295,937) | | March 2018 | | | 2,957 | |
| | (6 | ) | | New Zealand Future | | (425,220) | | March 2018 | | | (7,460 | ) |
| | (11 | ) | | Platinum Future + | | (516,065) | | April 2018 | | | (5,505 | ) |
| | (4 | ) | | Silver Future + | | (342,900) | | March 2018 | | | (5,475 | ) |
| | (41 | ) | | Sugar #11 (World) + | | (696,147) | | March 2018 | | | (24,382 | ) |
| | (74 | ) | | US 2YR Note (CBT) | | (15,844,094) | | March 2018 | | | 12,062 | |
| | (12 | ) | | US 5YR Note (CBT) | | (1,393,969) | | March 2018 | | | (1,063 | ) |
| | (60 | ) | | USD/CNH PH Future | | (6,025,568) | | March 2018 | | | 54,230 | |
| | (11 | ) | | USD/SEK Future | | (1,093,887) | | March 2018 | | | 19,714 | |
| | (2 | ) | | USD/ZAR Currency Future | | (202,302) | | March 2018 | | | (1,131 | ) |
| | (32 | ) | | Wheat Future + | | (683,200) | | March 2018 | | | (5,563 | ) |
| | | | | Net Unrealized Appreciation From Open Short Futures Contracts | | $ | 36,405 | |
| | | | | Total Unrealized Appreciation from Open Futures Contracts | | $ | 236,072 | |
| + | All or a portion of this investment is a holding of the Catalyst Managed Futures Strategy Fund Limited. |
See accompanying notes to financial statements.
| RATIONAL VA FUNDS |
| Statements of Assets and Liabilities |
| December 31, 2017 |
| | | Rational | | | Rational | | | Rational | |
| | | Dividend Capture VA | | | Insider Buying VA | | | Dynamic Momentum VA | |
| | | Fund (a) | | | Fund (a) | | | Fund | |
| | | | | | | | | (Consolidated) | |
| ASSETS: | | | | | | | | | | | | |
| Investments in securities, at cost | | $ | 17,234,599 | | | $ | 29,167,549 | | | $ | 614,910 | |
| Investments, at value | | $ | 17,510,338 | | | $ | 35,629,762 | | | $ | 614,910 | |
| Cash | | | — | | | | — | | | | 7,953,102 | |
| Foreign Cash (Cost - $15,419) | | | — | | | | — | | | | 16,600 | |
| Deposits with Broker for future contracts | | | — | | | | — | | | | 1,658,326 | |
| Net unrealized appreciation on futures contracts | | | — | | | | — | | | | 381,302 | |
| Dividends and interest receivable | | | 120,735 | | | | 44,391 | | | | 476 | |
| Receivable for Fund shares sold | | | 50 | | | | 10,231 | | | | — | |
| Due from Advisor | | | — | | | | — | | | | 2,111 | |
| Prepaid expenses and other assets | | | 266 | | | | 324 | | | | — | |
| Total Assets | | | 17,631,389 | | | | 35,684,708 | | | | 10,626,827 | |
| | | | | | | | | | | | | |
| LIABILITIES: | | | | | | | | | | | | |
| Accrued 12b-1 fees | | | 85,529 | | | | 82,512 | | | | 10,082 | |
| Payable for Fund shares redeemed | | | 4,622 | | | | 37,988 | | | | 130 | |
| Payable for securities purchased | | | 41,432 | | | | — | | | | — | |
| Net unrealized depreciation on futures contracts | | | — | | | | — | | | | 145,230 | |
| Management fees payable | | | 1,259 | | | | 11,462 | | | | — | |
| Fees payable to related parties | | | 3,593 | | | | 7,805 | | | | 1,251 | |
| Shareholder servicing fee | | | 4,327 | | | | 11,422 | | | | — | |
| Accrued expenses and other liabilities | | | 14,962 | | | | 17,178 | | | | 15,301 | |
| Total Liabilities | | | 155,724 | | | | 168,367 | | | | 171,994 | |
| | | | | | | | | | | | | |
| Net Assets | | $ | 17,475,665 | | | $ | 35,516,341 | | | $ | 10,454,833 | |
| | | | | | | | | | | | | |
| NET ASSETS CONSIST OF: | | | | | | | | | | | | |
| Paid in capital | | $ | 17,640,504 | | | $ | 27,399,724 | | | $ | 10,149,160 | |
| Undistributed net investment income (loss) | | | 622,902 | | | | 141,420 | | | | 46,570 | |
| Accumulated net realized gain (loss) on investments, futures and foreign currency transactions | | | (1,063,480 | ) | | | 1,513,189 | | | | 85,937 | |
| Net unrealized appreciation on investments, futures and foreign currency translations | | | 275,739 | | | | 6,462,008 | | | | 173,166 | |
| Net Assets | | $ | 17,475,665 | | | $ | 35,516,341 | | | $ | 10,454,833 | |
| | | | | | | | | | | | | |
| Net Assets | | $ | 17,475,665 | | | $ | 35,516,341 | | | | | |
| Shares of beneficial interest outstanding (b) | | | 1,484,022 | | | | 2,581,975 | | | | | |
| Net asset value, redemption price and offering price per share | | $ | 11.78 | | | $ | 13.76 | | | | | |
| | | | | | | | | | | | | |
| Class A | | | | | | | | | | $ | 10,453,787 | |
| Shares of beneficial interest outstanding (b) | | | | | | | | | | | 1,001,159 | |
| Net asset value, redemption price and offering price per share | | | | | | | | | | $ | 10.44 | |
| | | | | | | | | | | | | |
| Institutional Class | | | | | | | | | | $ | 1,046 | |
| Shares of beneficial interest outstanding (b) | | | | | | | | | | | 100 | |
| Net asset value, redemption price and offering price per share | | | | | | | | | | $ | 10.46 | |
| (a) | Formerly the Catalyst Dividend VA Fund and Catalyst Insider Buying VA Fund. |
| (b) | Unlimited number of shares of no par value beneficial interest authorized. |
See accompanying notes to financial statements.
| RATIONAL VA FUNDS |
| Statements of Operations |
| For the Year or Period Ended December 31, 2017 |
| | | Rational | | | Rational | | | Rational | |
| | | Dividend Capture VA | | | Insider Buying VA | | | Dynamic Momentum VA | |
| | | Fund (a) | | | Fund (a) | | | Fund (b) | |
| | | | | | | | | (Consolidated) | |
| Investment Income: | | | | | | | | | | | | |
| Dividend income | | $ | 862,385 | | | $ | 669,400 | | | $ | — | |
| Interest income | | | 14,923 | | | | 4,012 | | | | 2,052 | |
| Foreign tax withheld | | | (938 | ) | | | — | | | | — | |
| Total Investment Income | | | 876,370 | | | | 673,412 | | | | 2,052 | |
| | | | | | | | | | | | | |
| Operating Expenses: | | | | | | | | | | | | |
| Investment management fees | | | 140,145 | | | | 263,286 | | | | 35,294 | |
| 12b-1 Fees Class A | | | 46,715 | | | | 87,762 | | | | 10,082 | |
| Shareholder servicing fees | | | 46,715 | | | | 87,762 | | | | — | |
| Administration fees | | | 38,484 | | | | 65,220 | | | | 5,967 | |
| MFund services fees | | | 17,289 | | | | 29,038 | | | | 3,373 | |
| Legal fees | | | 13,001 | | | | 8,760 | | | | 25,950 | |
| Audit fees | | | 10,295 | | | | 10,007 | | | | 13,396 | |
| Printing expense | | | 5,633 | | | | 9,583 | | | | 6,397 | |
| Compliance officer fees | | | 9,632 | | | | 6,694 | | | | 3,678 | |
| Trustees’ fees | | | 7,478 | | | | 7,476 | | | | 3,162 | |
| Insurance expense | | | 4,262 | | | | 6,895 | | | | — | |
| Custody fees | | | 4,650 | | | | 4,771 | | | | 1,599 | |
| Miscellaneous expense | | | 58 | | | | 625 | | | | 1,174 | |
| Total Operating Expenses | | | 344,357 | | | | 587,879 | | | | 110,072 | |
| Less: Expenses waived by Advisor | | | (110,893 | ) | | | (149,095 | ) | | | (59,142 | ) |
| Net Operating Expenses | | | 233,464 | | | | 438,784 | | | | 50,930 | |
| | | | | | | | | | | | | |
| Net Investment Income (Loss) | | | 642,906 | | | | 234,628 | | | | (48,878 | ) |
| | | | | | | | | | | | | |
| Realized and Unrealized Gain (Loss) on Investments: | | | | | | | | | | | | |
| Net realized gain (loss) from: | | | | | | | | | | | | |
| Investments | | | 163,286 | | | | 1,385,111 | | | | — | |
| Futures | | | (906,708 | ) | | | — | | | | 114,194 | |
| Foreign currency transactions | | | — | | | | (295 | ) | | | (786 | ) |
| Net Realized Gain (Loss) on Investments | | | (743,422 | ) | | | 1,384,816 | | | | 113,408 | |
| | | | | | | | | | | | | |
| Net change in unrealized appreciation (depreciation) on: | | | | | | | | | | | | |
| Investments | | | (207,760 | ) | | | 4,053,539 | | | | — | |
| Futures | | | — | | | | — | | | | 236,072 | |
| Foreign currency translations | | | — | | | | 223 | | | | 1,181 | |
| Net Change Unrealized Appreciation (Depreciation) | | | (207,760 | ) | | | 4,053,762 | | | | 237,253 | |
| | | | | | | | | | | | | |
| Net Realized and Unrealized Gain (Loss) on Investments | | | (951,182 | ) | | | 5,438,578 | | | | 350,661 | |
| | | | | | | | | | | | | |
| Net Increase (Decrease) in Net Assets Resulting From Operations | | $ | (308,276 | ) | | $ | 5,673,206 | | | $ | 301,783 | |
| (a) | Formerly the Catalyst Dividend Capture VA Fund and Catalyst Insider Buying VA Fund. |
| (b) | The Fund commenced operations on August 21, 2017. |
See accompanying notes to financial statements.
| RATIONAL VA FUNDS |
| Statements of Changes in Net Assets |
| | | | | | | | | | | | | | | Rational | |
| | | Rational Dividend Capture VA Fund (a) | | | Rational Insider Buying VA Fund (a) | | | Dynamic Momentum VA Fund (b) | |
| | | | | | | | | | | | | | | (Consolidated) | |
| | | | | | | | | | | | | | | | |
| | | Year Ended | | | Year Ended | | | Year Ended | | | Year Ended | | | Period Ended | |
| | | December 31, 2017 | | | December 31, 2016 | | | December 31, 2017 | | | December 31, 2016 | | | December 31, 2017 | |
| Operations: | | | | | | | | | | | | | | | | | | | | |
| Net investment income (loss) | | $ | 642,906 | | | $ | 636,818 | | | $ | 234,628 | | | $ | 228,816 | | | $ | (48,878 | ) |
| Net realized gain (loss) on investments, futures and foreign currency translation | | | (743,422 | ) | | | (287,836 | ) | | | 1,384,816 | | | | 4,297,271 | | | | 113,408 | |
| Net change in unrealized appreciation (depreciation) on investments, futures and foreign currency translation | | | (207,760 | ) | | | 1,137,451 | | | | 4,053,762 | | | | (875,814 | ) | | | 237,253 | |
| Net increase (decrease) in net assets resulting from operations | | | (308,276 | ) | | | 1,486,433 | | | | 5,673,206 | | | | 3,650,273 | | | | 301,783 | |
| | | | | | | | | | | | | | | | | | | | | |
| Distributions to Shareholders from: | | | | | | | | | | | | | | | | | | | | |
| Net investment income | | | (602,275 | ) | | | (1,005,479 | ) | | | (192,258 | ) | | | (219,930 | ) | | | — | |
| Net realized gains | | | — | | | | — | | | | (4,297,807 | ) | | | (10,192,203 | ) | | | — | |
| | | | | | | | | | | | | | | | | | | | | |
| Total distributions to shareholders | | | (602,275 | ) | | | (1,005,479 | ) | | | (4,490,065 | ) | | | (10,412,133 | ) | | | — | |
| | | | | | | | | | | | | | | | | | | | | |
| Share Transactions of Beneficial Interest: | | | | | | | | | | | | | | | | | | | | |
| Net proceeds from shares sold Fund | | | 638,070 | | | | 928,461 | | | | 510,022 | | | | 1,368,134 | | | | — | |
| Class A | | | — | | | | — | | | | — | | | | — | | | | 10,160,805 | |
| Institutional Class | | | — | | | | — | | | | — | | | | — | | | | 1,000 | |
| Reinvestment of distributions Fund | | | 602,275 | | | | 1,005,479 | | | | 4,490,065 | | | | 10,412,133 | | | | — | |
| Cost of shares redeemed Fund | | | (3,589,982 | ) | | | (5,240,223 | ) | | | (6,988,277 | ) | | | (6,914,662 | ) | | | — | |
| Class A | | | — | | | | — | | | | — | | | | — | | | | (8,755 | ) |
| Net increase (decrease) in net assets from share transactions of beneficial interest | | | (2,349,637 | ) | | | (3,306,283 | ) | | | (1,988,190 | ) | | | 4,865,605 | | | | 10,153,050 | |
| | | | | | | | | | | | | | | | | | | | | |
| Total (Decrease) in Net Assets | | | (3,260,188 | ) | | | (2,825,329 | ) | | | (805,049 | ) | | | (1,896,255 | ) | | | 10,454,833 | |
| | | | | | | | | | | | | | | | | | | | | |
| Net Assets: | | | | | | | | | | | | | | | | | | | | |
| Beginning of period | | | 20,735,853 | | | | 23,561,182 | | | | 36,321,390 | | | | 38,217,645 | | | | — | |
| End of period* | | $ | 17,475,665 | | | $ | 20,735,853 | | | $ | 35,516,341 | | | $ | 36,321,390 | | | $ | 10,454,833 | |
| * Includes undistributed net investment income at end of period: | | $ | 622,902 | | | $ | 561,551 | | | $ | 141,420 | | | $ | 228,866 | | | $ | 46,570 | |
| | | | | | | | | | | | | | | | | | | | | |
| Share Activity: | | | | | | | | | | | | | | | | | | | | |
| Fund | | | | | | | | | | | | | | | | | | | | |
| Shares Sold | | | 52,981 | | | | 74,752 | | | | 37,599 | | | | 91,427 | | | | | |
| Shares Reinvested | | | 52,738 | | | | 82,756 | | | | 356,921 | | | | 838,336 | | | | | |
| Shares Redeemed | | | (294,121 | ) | | | (422,095 | ) | | | (502,850 | ) | | | (443,954 | ) | | | | |
| Net increase (decrease) in shares of Beneficial interest | | | (188,402 | ) | | | (264,587 | ) | | | (108,330 | ) | | | 485,809 | | | | | |
| | | | | | | | | | | | | | | | | | | | | |
| Class A | | | | | | | | | | | | | | | | | | | | |
| Shares Sold | | | | | | | | | | | | | | | | | | | 1,002,023 | |
| Shares Redeemed | | | | | | | | | | | | | | | | | | | (864 | ) |
| Net increase in shares of Beneficial interest | | | | | | | | | | | | | | | | | | | 1,001,159 | |
| | | | | | | | | | | | | | | | | | | | | |
| Institutional Class | | | | | | | | | | | | | | | | | | | | |
| Shares Sold | | | | | | | | | | | | | | | | | | | 100 | |
| Net increase in shares of Beneficial interest | | | | | | | | | | | | | | | | | | | 100 | |
| (a) | Formerly the Catalyst Dividend Capture VA Fund and Catalyst Insider Buying VA Fund. |
| (b) | The Fund commenced operations on August 21, 2017. |
See accompanying notes to financial statements.
| RATIONAL VA FUNDS |
| Financial Highlights |
For a Share Outstanding Throughout Each Period
| | | Rational Dividend Capture VA Fund (A) | |
| | | For the | | | For the | | | For the | | | For the | | | For the | |
| | | Year Ended | | | Year Ended | | | Year Ended | | | Year Ended | | | Year Ended | |
| | | December 31, | | | December 31, | | | December 31, | | | December 31, | | | December 31, | |
| | | 2017 | | | 2016 | | | 2015 | | | 2014 | | | 2013 | |
| | | | | | | | | | | | | | | | |
| Net asset value, beginning of period | | $ | 12.40 | | | $ | 12.16 | | | $ | 13.13 | | | $ | 12.55 | | | $ | 10.78 | |
| INCOME (LOSS) FROM INVESTMENT OPERATIONS: | | | | | | | | | | | | | | | | | | | | |
| Net investment income | | | 0.42 | (B) | | | 0.36 | (B) | | | 0.44 | (B) | | | 0.39 | (B) | | | 0.43 | |
| Net realized and unrealized gain (loss) on investments | | | (0.63 | ) | | | 0.48 | | | | (0.86 | ) | | | 0.87 | | | | 1.72 | |
| Total from investment operations | | | (0.21 | ) | | | 0.84 | | | | (0.42 | ) | | | 1.26 | | | | 2.15 | |
| | | | | | | | | | | | | | | | | | | | | |
| LESS DISTRIBUTIONS: | | | | | | | | | | | | | | | | | | | | |
| From net investment income | | | (0.41 | ) | | | (0.60 | ) | | | (0.55 | ) | | | (0.68 | ) | | | (0.38 | ) |
| Total distributions | | | (0.41 | ) | | | (0.60 | ) | | | (0.55 | ) | | | (0.68 | ) | | | (0.38 | ) |
| Net asset value, end of period | | $ | 11.78 | | | $ | 12.40 | | | $ | 12.16 | | | $ | 13.13 | | | $ | 12.55 | |
| Total return (C) | | | (1.59 | )% | | | 6.97 | % | | | (3.06 | )% | | | 10.16 | % | | | 19.96 | % |
| | | | | | | | | | | | | | | | | | | | | |
| RATIOS/SUPPLEMENTAL DATA: | | | | | | | | | | | | | | | | | | | | |
| Net assets, end of period (in 000’s) | | $ | 17,476 | | | $ | 20,736 | | | $ | 23,561 | | | $ | 35,215 | | | $ | 41,109 | |
| Expenses, before waiver and reimbursement | | | 1.84 | % | | | 1.80 | % | | | 1.12 | % | | | 1.05 | % | | | 0.98 | % |
| Expenses, net waiver and reimbursement | | | 1.25 | % | | | 1.25 | % | | | 0.99 | % | | | 0.98 | % | | | 0.98 | % |
| Ratios of net investment income | | | 3.44 | % | | | 2.87 | % | | | 3.40 | % | | | 3.00 | % | | | 3.63 | % |
| Portfolio turnover rate | | | 261 | % | | | 166 | % | | | 94 | % | | | 103 | % | | | 118 | % |
| (A) | Formerly Catalyst Dividend Capture VA Fund. |
| (B) | Calculated using average shares for the period. |
| (C) | Total returns do not include any insurance, sales or administrative charges of variable annuity or life insurance contracts. If these were included, the returns would be lower. |
See accompanying notes to financial statements.
| RATIONAL VA FUNDS |
| Financial Highlights |
For a Share Outstanding Throughout Each Period
| | | Rational Insider Buying VA Fund (A) | |
| | | For the | | | For the | | | For the | | | For the | | | For the | |
| | | Year Ended | | | Year Ended | | | Year Ended | | | Year Ended | | | Year Ended | |
| | | December 31, | | | December 31, | | | December 31, | | | December 31, | | | December 31, | |
| | | 2017 | | | 2016 | | | 2015 | | | 2014 | | | 2013 | |
| | | | | | | | | | | | | | | | |
| Net asset value, beginning of period | | $ | 13.50 | | | $ | 17.34 | | | $ | 22.13 | | | $ | 23.95 | | | $ | 18.21 | |
| INCOME (LOSS) FROM INVESTMENT OPERATIONS: | | | | | | | | | | | | | | | | | | | | |
| Net investment income | | | 0.09 | (B) | | | 0.10 | (B) | | | 0.12 | | | | 0.07 | | | | 0.08 | |
| Net realized and unrealized gain (loss) on investments | | | 2.09 | | | | 1.35 | | | | (1.66 | ) | | | (0.52 | ) | | | 5.73 | |
| Total from investment operations | | | 2.18 | | | | 1.45 | | | | (1.54 | ) | | | (0.45 | ) | | | 5.81 | |
| | | | | | | | | | | | | | | | | | | | | |
| LESS DISTRIBUTIONS: | | | | | | | | | | | | | | | | | | | | |
| From net investment income | | | (0.08 | ) | | | (0.11 | ) | | | (0.12 | ) | | | (0.12 | ) | | | (0.07 | ) |
| From net realized gains on investments | | | (1.84 | ) | | | (5.18 | ) | | | (3.13 | ) | | | (1.25 | ) | | | — | |
| Total distributions | | | (1.92 | ) | | | (5.29 | ) | | | (3.25 | ) | | | (1.37 | ) | | | (0.07 | ) |
| Net asset value, end of period | | $ | 13.76 | | | $ | 13.50 | | | $ | 17.34 | | | $ | 22.13 | | | $ | 23.95 | |
| Total return (C) | | | 17.52 | % | | | 11.00 | % | | | (7.17 | )% | | | (2.06 | )% | | | 31.92 | % |
| | | | | | | | | | | | | | | | | | | | | |
| RATIOS/SUPPLEMENTAL DATA: | | | | | | | | | | | | | | | | | | | | |
| Net assets, end of period (in 000’s) | | $ | 35,516 | | | $ | 36,321 | | | $ | 38,218 | | | $ | 61,972 | | | $ | 62,227 | |
| Expenses, before waiver and reimbursement | | | 1.68 | % | | | 1.70 | % | | | 1.10 | % | | | 1.03 | % | | | 0.94 | % |
| Expenses, net waiver and reimbursement | | | 1.25 | % | | | 1.25 | % | | | 1.02 | % | | | 0.99 | % | | | 0.94 | % |
| Ratios of net investment income | | | 0.67 | % | | | 0.64 | % | | | 0.46 | % | | | 0.24 | % | | | 0.42 | % |
| Portfolio turnover rate | | | 56 | % | | | 166 | % | | | 68 | % | | | 21 | % | | | 26 | % |
| (A) | Formerly Catalyst Insider Buying VA Fund. |
| (B) | Calculated using average shares for the period. |
| (C) | Total returns do not include any insurance, sales or administrative charges of variable annuity or life insurance contracts. If these were included, the returns would be lower. |
See accompanying notes to financial statements.
| RATIONAL VA FUNDS |
| Financial Highlights |
For a Share Outstanding Throughout Each Period
| | | Class A | | | Institutional Class | |
| | | | | | | |
| | | Rational | | | Rational | |
| | | Dynamic Momentum VA | | | Dynamic Momentum VA | |
| | | Fund (A) | | | Fund (A) | |
| | | (Consolidated) | | | (Consolidated) | |
| | | Period Ended | | | Period Ended | |
| | | December 31, 2017 | | | December 31, 2017 | |
| | | | | | | |
| Net asset value, beginning of period | | $ | 10.00 | | | $ | 10.00 | |
| | | | | | | | | |
| INCOME (LOSS) FROM INVESTMENT OPERATIONS: | | | | | | | | |
| Net investment loss (B) | | | (0.09 | ) | | | (0.07 | ) |
| Net realized and unrealized gain (loss) on investments | | | 0.53 | | | | 0.53 | |
| Total from investment operations | | | 0.44 | | | | 0.46 | |
| Net asset value, end of period | | $ | 10.44 | | | $ | 10.46 | |
| Total return (C,D) | | | 4.40 | % | | | 4.60 | % |
| | | | | | | | | |
| RATIOS/SUPPLEMENTAL DATA: | | | | | | | | |
| Net assets, end of period (in 000’s) | | $ | 10,454 | | | $ | 1 | |
| Expenses, before waiver and reimbursement (E) | | | 5.39 | % | | | 4.89 | % |
| Expenses, net waiver and reimbursement (E) | | | 2.49 | % | | | 1.99 | % |
| Ratios of net investment income (loss) (E) | | | (2.39 | )% | | | (1.89 | )% |
| Portfolio turnover rate (D) | | | 0 | % | | | 0 | % |
| (A) | Rational Dynamic Momentum VA commenced operations on August 21, 2017. |
| (B) | Calculated using average shares for the period. |
| (C) | Total returns do not include any insurance, sales or administrative charges of variable annuity or life insurance contracts. If these were included, the returns would be lower. |
See accompanying notes to financial statements.
| RATIONAL VA FUNDS | |
| CONSOLIDATED NOTES TO FINANCIAL STATEMENTS |
| December 31, 2017 | ANNUAL REPORT |
| (1) | ORGANIZATION AND SIGNIFICANT ACCOUNTING POLICIES |
Rational Dividend Capture VA and Rational Insider Buying VA are both diversified series of shares of beneficial interest of The Mutual Fund and Variable Insurance Trust (the “Trust”) a statutory trust organized under the laws of the state of Delaware on June 23, 2006. Rational Dynamic Momentum VA is a non-diversified series of shares of beneficial interest of the Trust. The Trust is registered under the Investment Company Act of 1940, as amended (the “1940 Act”), as an open-end management investment company. As of December 31, 2017, the Trust operated 10 separate series, or mutual funds. The Trust was renamed effective February 22, 2016; it was formerly the Huntington Funds. This report contains financial statements and financial highlights of the funds listed below (individually referred to as a “Fund”, or collectively as the “Funds”):
| Fund | Sub-Advisor | Primary Objective |
| Rational Dividend Capture VA Fund (“Dividend Capture VA Fund”) | PVG Asset Management Corp. | Seek total return on investment, with dividend income as an important component of that return |
| Rational Insider Buying VA Fund (“Insider Buying VA Fund”) | | Seek long-term capital appreciation |
| Rational Dynamic Momentum VA Fund(“Dynamic Momentum VA Fund”) | Chesapeake Capital Corporation | Capital appreciation uncorrelated to global equity markets |
The Dynamic Momentum VA Fund offers Class A and Institutional Class shares each of which are offered at Net Asset Value (“NAV”). Class A and Institutional Class shares inception date is August 21, 2017.
You may purchase Shares of the Funds only through variable annuity contracts or variable life insurance policies offered by participating insurance companies. Fund Shares are not offered directly to the public. You should refer to the prospectus for the variable annuity contract or variable life insurance policy for information on how to purchase a variable contract or policy and how to select the Fund as an investment option for your contract or policy. You may redeem Shares of the Funds only through participating insurance companies, Hartford Life Insurance Company, Lincoln Life Insurance Company, Nationwide Life Insurance Company, Delaware Life Insurance Company, Forethought Life Insurance Company, First Security Life Insurance Company and Transamerica Life Insurance Company. We redeem Shares of the Fund on any business day when the NYSE is open. The price at which the Funds will redeem a Share will be its NAV next determined after the order is considered received. The Funds have authorized the participating insurance companies to accept redemption requests on their behalf.
| (2) | SIGNIFICANT ACCOUNTING POLICIES |
The following is a summary of significant accounting policies consistently followed by the Funds and are in accordance with accounting principles generally accepted in the United States of America (“GAAP”). Each Fund is an investment company and accordingly follow the investment company accounting and reporting guidance of the Financial Accounting Standards Board (FASB) Accounting Standard Codification Topic 946 “Financial Services – Investment Companies” including FASB Accounting Standard Update ASU 2013-08.
The preparation of financial statements in conformity with GAAP requires management to make estimates and assumptions that affect the amounts of assets, liabilities, and disclosure of contingent assets and liabilities at the date of the financial statements and the reported amounts of income and expenses for the period. Actual results could differ from those estimates.
A. Investment Valuations
In computing the NAV of the Funds, fair value is based on market valuations with respect to portfolio securities for which market quotations are readily available. Pursuant to Trustee-approved policies, the Trust relies on certain security pricing services to provide the current market value of securities. Those security pricing services value equity securities (including foreign equity securities, exchange-traded funds and closed-end funds) traded on a securities exchange at the last reported sales price on the principal exchange. Equity securities quoted by NASDAQ are valued at the NASDAQ official closing price. If there is no reported sale on the principal exchange, and in the case of over-the counter securities, equity securities are valued at a bid price estimated by the security pricing service. Investments in open-end investment companies are valued at their respective net asset value as reported by such companies and are typically categorized as Level 1 in the fair value hierarchy. Futures, which are traded on an exchange, are valued at the
| RATIONAL VA FUNDS | |
| CONSOLIDATED NOTES TO FINANCIAL STATEMENTS (Continued) |
| December 31, 2017 | ANNUAL REPORT |
settlement price determined by the exchange. Short-term debt obligations having 60 days or less remaining until maturity, at time of purchase, may be valued at amortized cost.
Securities for which market quotations are not readily available are valued at fair value under Trust procedures approved by the Board of Trustees (the “Board”). In these cases, a Pricing Committee, established and appointed by the Board determines in good faith, subject to Trust procedures, the fair value of portfolio securities held by a Fund (“good faith fair valuation”). When a good faith fair valuation of a security is required, consideration is generally given to a number of factors including, but not limited to the following: dealer quotes, published analyses by dealers or analysts regarding the security, transactions which provide implicit valuation of the security (such as a merger or tender offer transaction), the value of other securities or contracts which derive their value from the security at issue, and the implications of any other circumstances which have caused trading in the security to halt. With respect to certain categories of securities, the procedures utilized by the Pricing Committee detail specific valuation methodologies to be applied in lieu of considering the aforementioned list of factors.
Fair valuation procedures are also used when a significant event affecting the value of a portfolio security is determined to have occurred between the time when the price of the portfolio security is determined and the close of trading on the NYSE, which is when each Fund’s NAV is computed. An event is considered significant if there is both an affirmative expectation that the security’s value will change in response to the event and a reasonable basis for quantifying the resulting change in value. Significant events include significant securities’ market movements occurring between the time the price of the portfolio security is determined and the close of trading on the NYSE. For securities normally priced at their last sale price in a foreign market, such events can occur between the close of trading in the foreign market and the close of trading on the NYSE.
In some cases, events affecting the issuer of a portfolio security may be considered significant events. Examples of potentially significant events include announcements concerning earnings, acquisitions, new products, management changes, litigation developments, a strike or natural disaster affecting the company’s operations or regulatory changes or market developments affecting the issuer’s industry occurring between the time when the price of the portfolio security is determined and the close of trading on the NYSE. For securities of foreign issuers, such events could also include political or other developments affecting the economy or markets in which the issuer conducts its operations or its securities are traded.
There can be no assurance that a Fund could purchase or sell a portfolio security at the price used to calculate the Fund’s NAV. In the case of good faith fair valued portfolio securities, lack of information and uncertainty as to the significance of information may lead to a conclusion that a prior valuation is the best indication of a portfolio security’s present value. Good faith fair valuations generally remain unchanged until new information becomes available. Consequently, changes in good faith fair valuation of portfolio securities may be less frequent and of greater magnitude than changes in the price of portfolio securities valued at their last sale price, by an independent pricing service, or based on market quotations.
The Trust calculates the NAV for each of the Funds by valuing securities held based on fair value. Fair value is defined as the price that would be received to sell an asset or paid to transfer a liability in an orderly transaction between market participants at the measurement date. The valuation techniques described below maximize the use of observable inputs and minimize the use of unobservable inputs in determining fair value. The inputs used for valuing the Funds’ investments are summarized in the three broad levels listed below:
| ● | Level 1 – unadjusted quoted prices in active markets for identical investments and/or registered investment companies where the value per share is determined and published and is the basis for current transactions for identical assets or liabilities at the valuation date. |
| ● | Level 2 – other significant observable inputs (including quoted prices for similar securities, interest rates, prepayment speeds, credit risk, etc.). |
| ● | Level 3 – significant unobservable inputs (including the Funds’ own assumptions in determining the fair value of investments). |
Changes in valuation techniques may result in transfers in or out of an assigned level within the disclosure hierarchy. The inputs or methodology used for valuing investments is not necessarily an indication of the risk associated with investing in those investments.
| RATIONAL VA FUNDS | |
| CONSOLIDATED NOTES TO FINANCIAL STATEMENTS (Continued) |
| December 31, 2017 | ANNUAL REPORT |
The Board has authorized the use of an independent fair valuation service. If the movement in a designated U.S. market index, after foreign markets close, is greater than predetermined levels, the Funds may use a systematic valuation model provided from that independent third party to fair value its international equity securities.
The inputs or methodology used for valuing securities are not necessarily an indication of the risk associated with investing in those securities. The following tables summarize the inputs used as of December 31, 2017, for each Fund’s assets measured at fair value:
| Dividend Capture VA Fund* | | |
| Assets | | Level 1 | | | Level 2 | | | Level 3 | | | Total | |
| Common Stock | | $ | 15,180,305 | | | $ | — | | | $ | — | | | $ | 15,180,305 | |
| Exchange Traded Funds | | | 1,365,357 | | | | — | | | | — | | | | 1,365,357 | |
| Preferred Stock | | | 346,933 | | | | — | | | | — | | | | 346,933 | |
| Short-Term Investments | | | 617,743 | | | | — | | | | — | | | | 617,743 | |
| Total Assets | | $ | 17,510,338 | | | $ | — | | | $ | — | | | $ | 17,510,338 | |
| | | | | | | | | | | | | | | | | |
| Insider Buying VA Fund* | | | |
| Assets | | Level 1 | | | Level 2 | | | Level 3 | | | Total | |
| Common Stock | | $ | 35,021,385 | | | $ | — | | | $ | — | | | $ | 35,021,385 | |
| Short-Term Investments | | | 608,377 | | | | — | | | | — | | | | 608,377 | |
| Total Assets | | $ | 35,629,762 | | | $ | — | | | $ | — | | | $ | 35,629,762 | |
| | | | | | | | | | | | | | | | | |
| Dynamic Momentum VA Fund* | | | |
| Assets | | Level 1 | | | Level 2 | | | Level 3 | | | Total | |
| Short-Term Investments | | $ | 614,910 | | | $ | — | | | $ | — | | | $ | 614,910 | |
| Derivatives | | | | | | | | | | | | | | | | |
| Futures Contracts | | | 381,302 | | | | — | | | | — | | | | 381,302 | |
| Total Assets | | $ | 996,212 | | | $ | — | | | | — | | | $ | 996,212 | |
| Liabilities* | | | | | | | | | | | | | | | | |
| Futures Contracts | | $ | 145,230 | | | $ | — | | | $ | — | | | $ | 145,230 | |
| * | Refer to the Portfolios of Investments for industry classifications. |
For the period ended December 31, 2017, there were no Level 3 investments for which significant unobservable inputs were used to determine fair value. There were no transfers into or out of Level 1 and Level 2 during the year or period ended December 31, 2017. The Trust recognizes significant transfers between fair value hierarchy levels at the reporting year or period end.
Consolidation of Subsidiaries – The consolidated financial statements of the Dynamic Momentum VA Fund include the accounts of Catalyst Managed Futures Strategy Fund Ltd. (“CMFS” or “CFC”), a wholly-owned and controlled foreign subsidiary. All inter-company accounts and transactions have been eliminated in consolidation.
The Fund may invest up to 25% of its total assets in a controlled foreign corporation, which acts as an investment vehicle in order to affect certain investments consistent with the Dynamic Momentum Fund’s investment objectives and policies.
| | Inception Date of
CFC | CFC Net Assets as of
December 31, 2017 | % of Net Assets as of
December 31, 2017 |
| CMFS Fund Ltd. | 8/22/2017 | $ 872,577 | 8.3% |
For tax purposes, the CFC is an exempted Cayman investment company. The CFC has received an undertaking from the Government of the Cayman Islands exempting it from all local income, profits and capital gains taxes. No such taxes are levied in the Cayman Islands at the present time. For U.S. income tax purposes, a CFC is a Controlled Foreign Corporation which generates and is allocated no income which is considered effectively connected with U.S. trade or business and as such is not subject to U.S. income tax. However, as a
| RATIONAL VA FUNDS | |
| CONSOLIDATED NOTES TO FINANCIAL STATEMENTS (Continued) |
| December 31, 2017 | ANNUAL REPORT |
wholly-owned Controlled Foreign Corporation, CMFS’s net income and capital gain, to the extent of its earnings and profits, will be included each year in Dynamic Momentum VA Fund’s investment company taxable income.
B. Foreign Currency Translation
The accounting records of the Funds are maintained in U.S. dollars. Foreign currency amounts are translated into U.S. dollars at the current rate of exchange each business day to determine the value of investments, and other assets and liabilities. Purchases and sales of foreign securities, and income and expenses, are translated at the prevailing rate of exchange on the respective date of these transactions. The Funds do not isolate that portion of the results of operations resulting from changes in foreign exchange rates on investments from fluctuation arising from changes in market prices of securities held. These fluctuations are included with the net realized and unrealized gain or loss on investments and foreign currency transactions/translations.
Reported net realized foreign exchange gains or losses arise from sales of portfolio securities; sales and maturities of short term securities; sales of foreign currencies; currency gains or losses realized between the trade and settlement dates on securities transactions; and the difference between the amounts of dividends, interest, and foreign withholding taxes recorded on the Funds’ books and the U.S. dollar equivalent of the amounts actually received or paid. Net unrealized foreign exchange gains and losses arise from changes in the values of assets and liabilities, including investments in securities at fiscal period-end, resulting from changes in the exchange rate.
C. Derivative Instruments
Certain of the Funds may be subject to equity price risk, interest rate risk and foreign currency exchange risk in the normal course of pursuing their investment objectives. Certain of the Funds may invest in various financial instruments including positions in foreign currency contracts and Futures to gain exposure to or hedge against changes in the value of equities or foreign currencies. The following is a description of the derivative instruments utilized by the Funds, including the primary underlying risk exposure related to each instrument type.
Futures Contracts – Certain of the Funds may purchase and sell futures contracts. A Fund may use futures contracts to gain exposure to, or hedge against changes in the value of equities, interest rates, commodities prices or foreign currencies. Upon entering into a contract, the Fund deposits and maintains as collateral such initial margin as required by the exchange on which the transaction is affected. Pursuant to the contract, the Fund agrees to receive from or pay to the broker an amount of cash equal to the daily fluctuation in value of the contract. Such receipts or payments are known as “variation margin” and are recorded by the Fund as unrealized gains and losses. When the contract is closed, the Fund records a realized gain or loss equal to the difference between the value of the contract at the time it was opened and the value at the time it was closed. As collateral for futures contracts, the Fund is required under the 1940 Act to maintain assets consisting of cash, cash equivalents or liquid securities. This collateral is required to be adjusted daily to reflect the market value of the purchase obligation for long futures contracts or the market value of the instrument underlying the contract, but not less than the market price at which the futures contract was established, for short futures contracts.
Foreign Exchange Contracts – The Funds may enter into forward foreign exchange contracts. A forward foreign exchange contract involves an obligation to purchase or sell a specific currency at a future date at a price set at the time of the contract. Such contracts are used to sell unwanted currency exposure that comes with holding securities in a market, or to buy currency exposure where the exposure from holding securities is insufficient to provide the desired currency exposure. The contracts are marked-to-market daily and the change in market value is recorded as unrealized appreciation or depreciation. When a forward foreign currency contract is closed, a Fund records a realized gain or loss equal to the difference between the value at the time it was opened and the value at the time it was closed. These unrealized and realized gains and losses are reported on the Statement of Operations. The Fund could be exposed to risks if the counterparties to the contracts are unable to meet the terms of their contracts and from unanticipated movements in exchange rates.
| RATIONAL VA FUNDS | |
| CONSOLIDATED NOTES TO FINANCIAL STATEMENTS (Continued) |
| December 31, 2017 | ANNUAL REPORT |
The derivatives are not accounted for as hedging instruments under GAAP. The effect of derivative instruments on the Statements of Assets and Liabilities and Consolidated Statements of Assets and Liabilities at December 31, 2017, were as follows:
| | | | | | | Location of Derivatives on Consolidated Statement | | Fair Value of asset/liability | |
| Fund | | Derivative | | Risk Type | | of Assets and Liabilities | | derivatives | |
| Dynamic Momentum VA Fund | | Futures | | Commodity | | Net unrealized appreciation on futures contracts | | | 148,496 | |
| | | | | Currency | | Net unrealized appreciation on futures contracts | | | 182,113 | |
| | | | | Equity | | Net unrealized appreciation on futures contracts | | | 30,862 | |
| | | | | Interest | | Net unrealized appreciation on futures contracts | | | 19,831 | |
| | | | | | | Total | | 381,302 | |
| | | | | | | | | | | |
| | | | | Commodity | | Net unrealized depreciation on futures contracts | | | (57,583 | ) |
| | | | | Currency | | Net unrealized depreciation on futures contracts | | | (16,426 | ) |
| | | | | Equity | | Net unrealized depreciation on futures contracts | | | (70,158 | ) |
| | | | | Interest | | Net unrealized depreciation on futures contracts | | | (1,063 | ) |
| | | | | | | Total | | (145,230 | ) |
| | | | | | | | | | |
| The effect of derivative instruments on the Statements of Operations and Consolidated Statements of Operations for the Funds, for the year or period ended December 31, 2017, were as follows: |
| | | | | | | | | | |
| | | | | | | | | Realized and unrealized | |
| Fund | | Derivative | | Risk Type | | Location of Gain (loss) on derivatives | | gain (loss) on derivatives | |
| Dividend Capture VA Fund | | | | | | | | | | |
| | | Futures | | Equity | | Net realized (loss) from futures | | | (906,708 | ) |
| | | | | | | Total | | (906,708 | ) |
| Dynamic Momentum VA Fund | | | | | | | | | | |
| | | Futures | | Commodity | | Net realized gain from futures | | | 29,530 | |
| | | | | Currency | | Net realized gain from futures | | | (137,801 | ) |
| | | | | Equity | | Net realized gain from futures | | | 217,100 | |
| | | | | Interest | | Net realized gain from futures | | | 5,365 | |
| | | | | | | Total | | 114,194 | |
| | | | | | | | | | | |
| | | | | Commodity | | Net change in unrealized appreciation on futures | | | 90,913 | |
| | | | | Currency | | Net change in unrealized appreciation on futures | | | 165,687 | |
| | | | | Equity | | Net change in unrealized appreciation on futures | | | (39,296 | ) |
| | | | | Interest | | Net change in unrealized appreciation on futures | | | 18,768 | |
| | | | | | | Total | | 236,072 | |
The value of derivative instruments outstanding as of December 31, 2017 as disclosed in the Consolidated Portfolios of Investments and the amounts realized and changes in unrealized gains and losses on derivative instruments during the period as disclosed above and within the Consolidated Statements of Operations serve as indicators of the volume of derivative activity for the Funds.
| RATIONAL VA FUNDS | |
| CONSOLIDATED NOTES TO FINANCIAL STATEMENTS (Continued) |
| December 31, 2017 | ANNUAL REPORT |
Balance Sheet Offsetting Information
The following table provides a summary of offsetting financial asset and liability derivatives and the effect of the derivative instruments on the Consolidated Statements of Assets and Liabilities as of December 31, 2017:
| | | | | | | | | | | | Gross Amounts of Assets Presented | | | | |
| | | | | | | | | | | | in the (Consolidated) Statement of | | | | |
| Assets: | | | | | | | | | | | Assets & Liabilities | | | | |
| | | Gross Amounts | | | Gross Amounts | | | Net Amounts | | | | | | | | | | |
| | | Recognized in the | | | Offset in the | | | Presented in the | | | | | | | | | | |
| | | (Consolidated) | | | (Consolidated) | | | (Consolidated) | | | | | | | | | | |
| | | Statements of | | | Statements of | | | Statements of | | | Financial | | | | | | | |
| | | Assets and | | | Assets and | | | Assets and | | | Instruments | | | Cash Collateral | | | | |
| | | Liabilities | | | Liabilities | | | Liabilities | | | Pledged | | | Pledged/ Received | | | Net Amount | |
| Dynamic Momentum VA Fund | | | | | | | | | | | | | | | | | | | | | | | | |
| Description of Asset: | | | | | | | | | | | | | | | | | | | | | | | | |
| Futures Contracts | | $ | 381,302 | | | $ | — | | | $ | 381,302 | | | $ | (145,230 | ) | | $ | — | (1) | | $ | 236,072 | |
| | | | | | | | | | | | | | | | | | | | | | | | | |
| | | | | | | | | | | | Gross Amounts of Assets Presented | | | | |
| | | | | | | | | | | | in the (Consolidated) Statement of | | | | |
| Liabilities: | | | | | | | | | | | Assets & Liabilities | | | | |
| | | Gross Amounts | | | Gross Amounts | | | Net Amounts | | | | | | | | | | |
| | | Recognized in the | | | Offset in the | | | Presented in the | | | | | | | | | | |
| | | (Consolidated) | | | (Consolidated) | | | (Consolidated) | | | | | | | | | | |
| | | Statements of | | | Statements of | | | Statements of | | | Financial | | | | | | | |
| | | Assets and | | | Assets and | | | Assets and | | | Instruments | | | Cash Collateral | | | | |
| | | Liabilities | | | Liabilities | | | Liabilities | | | Pledged | | | Pledged/ Received | | | Net Amount | |
| Dynamic Momentum VA Fund | | | | | | | | | | | | | | | | | | | | | | | | |
| Description of Asset: | | | | | | | | | | | | | | | | | | | | | | | | |
| Futures Contracts | | $ | (145,230 | ) | | $ | — | | | $ | (145,230 | ) | | $ | 145,230 | | | $ | — | (1) | | $ | — | |
| (1) | The amount is limited to the derivative liability balance and accordingly does not include excess collateral pledged. |
D. Security Transactions and Related Income
During the period, investment transactions are accounted for no later than the first calculation of the NAV on the business day following the trade date. For financial reporting purposes, however, security transactions are accounted for on trade date on the last business day of the reporting period. Securities gains and losses are calculated on the identified cost basis. Interest income and expenses are accrued daily. Dividends, less foreign tax withholding (if any), are recorded on the ex-dividend date. Withholding taxes on foreign interest, dividends and capital gains with respect to the Funds have been provided for in accordance with each applicable country’s tax rules and rates.
E. Dividends and Distributions to Shareholders
Dividends from net investment income, if any, are declared and paid annually by the Funds. Net realized capital gains, if any, are distributed at least annually. The amount of dividends from net investment income and net realized gains are determined in accordance with the federal income tax regulations, which may differ from GAAP and are recorded on ex-date. These “book/tax” differences are either considered temporary or permanent in nature. To the extent these differences are permanent in nature (e.g. tax treatment of foreign currency gain/loss, distributions and income received from pass through investments and net investment loss adjustments), such amounts are reclassified within the capital accounts based on their nature for federal income tax purposes; temporary differences do not require reclassification.
| RATIONAL VA FUNDS | |
| CONSOLIDATED NOTES TO FINANCIAL STATEMENTS (Continued) |
| December 31, 2017 | ANNUAL REPORT |
The Funds may own shares of real estate investments trusts (“REITs”) which report information on the source of their distributions annually. Distributions received from investments in REITs in excess of income from underlying investments are recorded as realized gain and/or as a reduction to the cost of the individual REIT.
The Funds may invest in Master Limited Partnerships (“MLPs”), which generally are treated as partnerships for Federal income tax purposes. As a limited partner in the MLPs, the Funds include its allocable share of the MLPs’ taxable income in computing its own taxable income.
F. Allocation of Expenses, Income, and Gains and Losses
Expenses directly attributable to a Fund are charged to that Fund. Expenses not directly attributable to a Fund are allocated proportionally among various Funds or all Funds within the Trust in relation to the net assets of each Fund or on another reasonable basis. Income, non-class specific expenses and realized/unrealized gains or losses are allocated to each class based on relative net assets. Distribution fees are charged to each respective share class in accordance with the distribution plan.
G. Federal Income Taxes
It is the policy of each Fund to qualify or continue to qualify as a regulated investment company by complying with the provisions available to certain investment companies, as defined in applicable sections of the Internal Revenue Code, and to make distributions of net investment income and net realized capital gains sufficient to relieve it from all, or substantially all, federal income taxes. In addition to complying with the federal tax requirements applicable to regulated investment companies, the Funds also plan to comply with certain diversification standards applicable to underlying assets of variable annuity contracts in order to avoid taxation on the variable contract owners with respect to earnings allocable to the contract from investments in the Funds.
The Funds recognize the tax benefits of uncertain tax positions only where the position is “more likely than not” to be sustained assuming examination by tax authorities. Management has analyzed each Funds tax positions and has concluded that no liability for unrecognized tax benefits should be recorded related to uncertain tax positions taken on returns filed for open tax years ended December 31, 2014 to December 31, 2016, or expected to be taken in the Funds’ December 31, 2017 year end tax returns. Each Fund identifies its major tax jurisdictions as U.S. Federal, and foreign jurisdictions where the Funds make significant investments; however the Funds are not aware of any tax positions for which it is reasonably possible that the total amounts of unrecognized tax benefits will change materially in the next twelve months.
Withholding taxes on foreign interest, dividends and capital gains with respect to the Funds have been provided for in accordance with each applicable country’s tax rules and rates.
H. Indemnification
Under the Trust’s organizational documents, its officers and Trustees are indemnified against certain liabilities arising out of the performance of their duties to the Funds. In addition, in the normal course of business, the Trust may enter into contracts with vendors and others that provide for general indemnifications. The Trust’s maximum exposure under these arrangements is unknown, as this would involve future claims that may be made against the Trust. However, based on experience, the Trust expects that risk of loss to be remote.
I. Cash
The Funds considers their investment in an FDIC insured interest bearing savings account to be cash. The Funds maintain cash balances, which, at times, may exceed federally insured limits. The Funds maintain these balances with a high quality financial institution.
| (3) | FEES AND OTHER TRANSACTIONS WITH RELATED PARTIES AND OTHER SERVICE PROVIDERS |
Investment Advisory Fee— Rational Advisors, Inc., (the “Advisor”) serves as the Funds’ investment adviser. Under the terms of the Advisory Agreement, the Advisor manages the investment operations of the Funds in accordance with each Fund’s respective investment policies and restrictions. The Funds’, sub-advisors, when applicable, are responsible for the day-to-day management of their Fund’s portfolios. The Advisor provides the Funds with investment advice and supervision and furnishes an investment program for the Funds. For its investment management services, the Funds pay to the Advisor, as of the last day of each month, an annualized fee as
| RATIONAL VA FUNDS | |
| CONSOLIDATED NOTES TO FINANCIAL STATEMENTS (Continued) |
| December 31, 2017 | ANNUAL REPORT |
shown in the below table, such fees to be computed daily based upon daily average net assets of the Funds. The Funds’ sub-advisors are paid by the Advisor, not the Funds.
The Advisor has agreed to contractually waive all or a portion of its investment advisory fee for the following Funds (based on average daily net assets) to which it is otherwise entitled to receive and/or to reimburse certain operating expenses in order to limit each Fund’s total annual fund expenses (after fee waivers, and/or expense reimbursements, and exclusive of acquired fund fees and expenses, brokerage costs, interest, taxes and dividends, and extraordinary expenses) as listed below:
| | | | | | | | | |
| | | Advisory | | | Expense | | | Expense Cap |
| Fund | | fee | | | Limitation | | | Expiration Date |
| Dividend Capture VA Fund | | | 0.75 | % | | | 1.25 | % | | April 30, 2018 |
| Insider Buying VA Fund | | | 0.75 | % | | | 1.25 | % | | April 30, 2018 |
| Dynamic Momentum VA Fund | | | | | | | | | | |
| Class A | | | 1.75 | % | | | 2.49 | % | | April 30, 2018 |
| Institutional Class | | | 1.75 | % | | | 1.99 | % | | April 30, 2018 |
Amounts waived or reimbursed in the contractual period may be recouped by the Advisor within three years of the waiver and/or reimbursement. As of December 31, 2017, the following amounts have been waived or reimbursed by the Advisor and are subject to repayment by the respective Fund:
| | | Repayment Expires December 31, | |
| Fund | | 2018 | | | 2019 | | | 2020 | |
| Dividend Capture VA Fund | | $ | 37,235 | | | $ | 121,175 | | | $ | 110,893 | |
| Insider Buying VA Fund | | | 39,947 | | | | 159,746 | | | | 149,095 | |
| Dynamic Momentum VA Fund | | | — | | | | — | | | | 59,142 | |
The Independent Trustees are paid a quarterly retainer, and receive compensation for each committee meeting, telephonic Board meeting, and special in-person Board meeting attended. Officers receive no compensation from the Trust. The Trust reimburses each of the Independent Trustees for travel and other expenses incurred in connection with attendance at such meetings. The Trust has no retirement or pension plans. Additional information regarding the Trust’s Trustees is available in the Funds’ Statement of Additional Information.
The Board has adopted the Trust’s Distribution Plan (the “12b-1 Plan”) which allows each Fund to pay fees up to 0.25% of the Fund’s average daily net assets for Insider Buying VA Fund and Dividend Capture VA Fund and 0.50% of the average daily net assets for class A for Dynamic Momentum VA Fund to financial intermediaries (which may be paid through the Funds’ distributor) for the sale and distribution of these Shares. Pursuant to the Funds’ 12b-1 Plan, the Funds may finance from their assets certain activities or expenses that are intended primarily to result in the sale of Fund shares and to reimburse Northern Lights Distributors, LLC. (the “Distributor”) and Advisor for distribution related expenses. 12b-1 fees incurred for the year or period ended December 31, 2017 were $46,715, $87,762 and $10,082 for the Dividend Capture VA Fund, Insider Buying VA Fund and Dynamic Momentum VA Fund Class A, respectively.
Shareholder Servicing Fees – The Trust has adopted a Shareholder Servicing Plan pursuant to which the Funds may pay Shareholder Services Fees up to 0.25% of the average daily net assets of the Fund for Dividend Capture VA Fund and Insider Buying VA Fund to financial intermediaries for providing shareholder assistance, maintaining shareholder accounts and communicating or facilitating purchases and redemptions of Shares.
In addition, certain affiliates of the Distributor provide services to the Funds as follows:
Gemini Fund Services, LLC (“GFS”) – GFS an affiliate of the Distributor, provides administrative, fund accounting, and transfer agency services to the Funds pursuant to agreements with the Trust, for which it receives from each Fund the greater of an annual minimum fee or an asset based fee, which scales downward based upon net assets for fund administration, fund accounting and transfer agency services and reflected on the financial statements. The Fund also pays GFS for any out-of-pocket expenses. Officers of the Trust are also employees of GFS, and are not paid any fees directly by the Trust for serving in such capacity.
| RATIONAL VA FUNDS | |
| CONSOLIDATED NOTES TO FINANCIAL STATEMENTS (Continued) |
| December 31, 2017 | ANNUAL REPORT |
Blu Giant, LLC (“Blu Giant”) – Blu Giant, an affiliate of GFS and the Distributor, provides EDGAR conversion and filing services as well as print management services for the Funds on an ad-hoc basis. For the provision of these services, Blu Giant receives customary fees from the Funds.
Pursuant to the Management Services Agreement between the Trust and MFund Services LLC (“MFund”), MFund, an affiliate of the Advisor, provides the Funds with various management and administrative services. For these services, the Funds pay MFund an annual base fee plus an annual asset-based fee which scales downward based upon net assets. In addition, the Funds reimburse MFund for any reasonable out- of- pocket expenses incurred in the performance of its duties under the Management Services Agreement.
Pursuant to the Compliance Services Agreement, MFund provides chief compliance officer services to the Funds. For these services, the Funds pay MFund an annual base fee plus an annual asset-based fee based upon net assets. In addition, the Funds reimburse MFund for any reasonable out- of- pocket expenses incurred in the performance of its duties under the Compliance Services Agreement. The amounts due to MFund at December 31, 2017 for management and chief compliance officer services are listed in the Statements of Assets and Liabilities under “Fees Payable to related parties.” The fees incurred by the Funds are reflected within MFund service fees on the Statements of Operations.
A Trustee and Officer of the Trust is also the controlling member of MFund and the Advisor, and is not paid any fees directly by the Trust for serving in such capacities.
| (4) | INVESTMENT TRANSACTIONS |
Purchases and sales of investments, excluding short-term securities, for the year or period ended December 31, 2017, were as follows:
| | | | | | | | | U.S. Government | |
| Fund | | Purchases | | | Sales | | | Purchases | | | Sales | |
| Dividend Capture VA Fund | | $ | 42,492,363 | | | $ | 45,790,265 | | | $ | 779,597 | | | $ | 780,000 | |
| Insider Buying VA Fund | | | 19,562,263 | | | | 25,285,583 | | | | — | | | | — | |
| Dynamic Momentum VA Fund | | | — | | | | — | | | | — | | | | — | |
| (5) | FOREIGN INVESTMENT RISK |
Compared with investing in the United States, investing in foreign markets involves a greater degree and variety of risk. Investors in international or foreign markets may face delayed settlements, currency controls and adverse economic developments as well as higher overall transaction costs. In addition, fluctuations in the U.S. dollar’s value versus other currencies may erode or reverse gains from investments denominated in foreign currencies or widen losses. Foreign governments may expropriate assets, impose capital or currency controls, impose punitive taxes, impose limits on ownership or nationalize a company or industry. Any of these actions could have severe effect on security prices and impair a Fund’s ability to bring its capital or income back to the U.S. Exchange rate. Fluctuations also may impair an issuer’s ability to repay U.S. dollar denominated debt, thereby increasing credit risk of such debt. Finally, the value of foreign securities may be affected by incomplete, less frequent or inaccurate financial information about their issuers, social upheavals or political actions ranging from tax code changes to government collapse. Foreign companies may also receive less coverage than U.S. companies by market analysts, and financial reporting standards or regulatory requirements may not be comparable to those applicable to U.S. companies.
| (6) | DISTRIBUTIONS TO SHAREHOLDERS AND TAX COMPONENTS OF CAPITAL |
The tax character of distributions paid during the years or period ended December 31, 2017 and December 31, 2016 was as follows:
For the year or period ended December 31, 2017:
| | | Ordinary | | | Long-Term | |
| | | Income | | | Capital Gains | |
| Dividend Capture VA Fund | | $ | 602,275 | | | $ | — | |
| Insider Buying VA Fund | | | 763,899 | | | | 3,726,166 | |
| Dynamic Momentum VA Fund | | | — | | | | — | |
| RATIONAL VA FUNDS | |
| CONSOLIDATED NOTES TO FINANCIAL STATEMENTS (Continued) |
| December 31, 2017 | ANNUAL REPORT |
| For the year ended December 31, 2016: |
| |
| | | Ordinary | | | Long-Term | |
| | | Income | | | Capital Gains | |
| Dividend Capture VA Fund | | $ | 1,005,479 | | | $ | — | |
| Insider Buying VA Fund | | | 963,007 | | | | 9,449,126 | |
| | | | | | | | | |
As of December 31, 2017, the components of accumulated earnings/(deficit) on a tax basis were as follows:
| | | Undistributed | | | Undistributed | | | Post October Loss | | | Capital Loss | | | Other | | | Unrealized | | | Total | |
| | | Ordinary | | | Long-Term | | | and | | | Carry | | | Book/Tax | | | Appreciation/ | | | Accumulated | |
| | | Income | | | Capital Gains | | | Late Year Loss | | | Forwards | | | Differences | | | (Depreciation) | | | Earnings/(Deficits) | |
| Dividend Capture VA Fund | | $ | 576,852 | | | $ | — | | | $ | — | | | $ | (960,444 | ) | | $ | — | | | $ | 218,753 | | | $ | (164,839 | ) |
| Insider Buying VA Fund | | | 1,492,243 | | | | 108,929 | | | | — | | | | — | | | | — | | | | 6,515,445 | | | | 8,116,617 | |
| Dynamic Momentum VA Fund | | | 284,988 | | | | 24,206 | | | | | | | | | | | | | | | | (3,521 | ) | | | 305,673 | |
The difference between book basis and tax basis unrealized appreciation (depreciation), undistributed ordinary income (loss) and accumulated net realized gain (loss) from investments is primarily attributable to the tax deferral of losses on wash sales, mark-to-market on open futures contracts, adjustments for partnerships, C-Corporation return of capital distributions and trust preferred securities. The unrealized appreciation (depreciation) in the table above includes unrealized foreign currency gains (losses) of $(205) and $1,181 for the Insider Buying VA Fund and Dynamic Momentum VA Fund, respectively.
At December 31, 2017, the Portfolios had capital loss carry forwards for federal income tax purposes available to offset future capital gains along with capital loss carry forwards expired in the current year as follows:
| | | Non-Expiring | | | | | | | |
| | | | | | | | | | | | | |
| | | Short-Term | | | Long-Term | | | Total | | | CLCF Expired | |
| Dividend Capture VA Fund | | $ | 467,943 | | | $ | 492,501 | | | $ | 960,444 | | | $ | 7,597 | |
| Insider Buying VA Fund | | | — | | | | — | | | | — | | | | | |
| Dynamic Momentum VA Fund | | | — | | | | — | | | | — | | | | | |
| | | | | | | | | | | | | | | | | |
Permanent book and tax differences, primarily attributable to the book/ tax basis treatment of foreign currency gains (losses) and non-deductible expenses, the expiration of capital loss carry forwards and adjustments related to partnerships, C-Corporation return of capital distributions, trust preferred securities, and the Dynamic Momentum VA Fund’s wholly owned subsidiary, resulted in reclassification for the following Portfolios for the year or period ended December 31, 2017 as follows:
| | | Paid | | | Undistributed | | | Undistributed | | | | |
| | | In | | | Ordinary | | | Net Realized | | | Net | |
| | | Capital | | | Income (Loss) | | | Gains (Loss) | | | Unrealized | |
| Dividend Capture VA Fund | | $ | (7,597 | ) | | $ | 20,720 | | | $ | (13,123 | ) | | $ | — | |
| Insider Buying VA Fund | | | — | | | | (129,816 | ) | | | 129,816 | | | | — | |
| Dynamic Momentum VA Fund | | | (3,890 | ) | | | 95,448 | | | | (27,471 | ) | | | (64,087 | ) |
| | | | | | | | | | | | | | | | | |
Management of the Funds has evaluated the need for disclosure and/or adjustments resulting from subsequent events through the date these financial statements were issued. There were no other additional items requiring adjustment of the financial statements or additional disclosure.
REPORT OF INDEPENDENT REGISTERED PUBLIC ACCOUNTING FIRM
To the Shareholders of Rational Dividend Capture VA Fund (formerly, Catalyst Dividend Capture VA Fund), Rational Insider Buying VA Fund (formerly, Catalyst Insider Buying VA Fund), and Rational Dynamic Momentum VA Fund and
Board of Trustees of Mutual Fund and Variable Insurance Trust
Opinion on the Financial Statements
We have audited the accompanying statements of assets and liabilities, including the portfolios of investments, of Rational Dividend Capture VA Fund (formerly, Catalyst Dividend Capture VA Fund) and Rational Insider Buying VA Fund (formerly, Catalyst Insider Buying VA Fund), and the accompanying consolidated statement of assets and liabilities, including the consolidated portfolio of investments, of Rational Dynamic Momentum VA Fund (the “Funds”), each a series of Mutual Fund and Variable Insurance Trust, as of December 31, 2017, and the related statements of operations for the year then ended, the statements of changes in net assets for each of the two years in the period then ended, including the related notes, and the financial highlights for each of the two years in the period then ended for the Rational Dividend Capture VA Fund and Rational Insider Buying VA Fund and the related consolidated statements of operations and changes in net assets, and the financial highlights for the period August 21, 2017 (commencement of operations) through December 31, 2017, for the Rational Dynamic Momentum VA Fund (collectively referred to as the “financial statements”). In our opinion, the financial statements present fairly, in all material respects, the financial position of each of the Funds as of December 31, 2017, the results of their operations for the year or period then ended and the changes in their net assets and the financial highlights for the periods indicated above, in conformity with accounting principles generally accepted in the United States of America. The Funds’ financial statements and financial highlights for the periods ended prior to December 31, 2016 were audited by other auditors whose report dated February 29, 2016, expressed an unqualified opinion on those financial statements and financial highlights.
Basis for Opinion
These financial statements are the responsibility of the Funds’ management. Our responsibility is to express an opinion on the Funds’ financial statements based on our audits. We are a public accounting firm registered with the Public Company Accounting Oversight Board (United States) (“PCAOB”) and are required to be independent with respect to the Funds in accordance with the U.S. federal securities laws and the applicable rules and regulations of the Securities and Exchange Commission and the PCAOB.
We conducted our audits in accordance with the standards of the PCAOB. Those standards require that we plan and perform the audit to obtain reasonable assurance about whether the financial statements are free of material misstatement, whether due to error or fraud.
Our audits include performing procedures to assess the risks of material misstatement of the financial statements, whether due to error or fraud, and performing procedures that respond to those risks. Such procedures include examining, on a test basis, evidence regarding the amounts and disclosures in the financial statements and confirmation of securities owned as of December 31, 2017, by correspondence
with the custodian and brokers. Our audits also included evaluating the accounting principles used and significant estimates made by management, as well as evaluating the overall presentation of the financial statements. We believe that our audits provide a reasonable basis for our opinion.
We have served as the Funds’ auditor since 2016.
COHEN & COMPANY, LTD.
Cleveland, Ohio
February 26, 2018
| RATIONAL VA FUNDS |
| Supplemental Information (Unaudited) |
| Shareholder Expense Examples |
Fund Expenses. As a shareholder of a Fund, you incur ongoing costs, including management fees and other Fund expenses. These examples are intended to help you understand your ongoing costs (in dollars) of investing in the Funds and to compare these costs with the ongoing costs of investing in other mutual funds.
These examples are based on an investment of $1,000.00 invested at the beginning of the period and held for the entire six-month period from June 30, 2017 to December 31, 2017.
Actual Expenses. The “Actual” lines of the table provide information about actual account values and actual expenses. You may use the information on this line together with the amount you invested to estimate the expense that you paid over the period. Simply divide your account value by $1,000.00 (for example, an $8,600.00 account value divided by $1,000.00 = 8.60), then multiply the result by the number in the “Actual” line under the heading entitled “Expenses Paid During Period” to estimate the expenses you paid on your account during this period.
Hypothetical Example for Comparison Purposes. The “Hypothetical” lines of the table provide information about hypothetical account values and hypothetical expenses based on the Funds’ actual expense ratios and an assumed rate of return of 5% per year before expenses, which are not the Funds’ actual returns. The hypothetical account values and expenses may not be used to estimate the actual ending account balance or expenses you paid for the period. You may use this information to compare the ongoing costs of investing in the Funds and other funds. To do so, compare the 5% hypothetical examples with the 5% hypothetical examples that appear in the shareholder reports of other funds.
Please note that the expenses shown in the table are meant to highlight your ongoing costs only and do not reflect any transactional costs, such as withdrawal charges, mortality and expense risk fees and other charges that may be assessed by participating insurance companies under the separate accounts, variable annuity contracts or variable life insurance policies. Therefore, the “Actual” and “Hypothetical” lines of the table are useful in comparing ongoing costs only, and will not help you determine the relative total costs of owning different funds. In addition, if these transactional costs were included, your costs would have been higher.
| | | Beginning | | | Annualized | | Ending | | | Expenses | |
| | | Account | | | Expense Ratio | | Account | | | Paid During | |
| | | Value 06/30/2017 | | | For the period | | Value 12/31/2017 | | | the Period* | |
| Dividend Capture VA Fund | | | | | | | | | | | | | | |
| Actual | | $ | 1,000.00 | | | 1.25% | | $ | 989.70 | | | $ | 6.27 | |
| Hypothetical | | | 1,000.00 | | | 1.25% | | | 1,018.60 | | | | 6.36 | |
| Insider Buying VA Fund | | | | | | | | | | | | | | |
| Actual | | $ | 1,000.00 | | | 1.25% | | $ | 1,080.00 | | | $ | 6.55 | |
| Hypothetical | | | 1,000.00 | | | 1.25% | | | 1,018.90 | | | | 6.36 | |
| | | | | | | | | | | | | | | |
| Dynamic Momentum VA Fund Class A ** | | | | | | | | | | | |
| Actual | | $ | 1,000.00 | | | 2.49% | | $ | 1,044.00 | | | $ | 9.20 | |
| Hypothetical | | | 1,000.00 | | | 2.49% | | | 1,012.65 | | | | 12.63 | |
| Dynamic Momentum VA Fund Institutional Class ** | | | | | | | | | | | |
| Actual | | $ | 1,000.00 | | | 1.99% | | $ | 1,046.00 | | | $ | 7.36 | |
| Hypothetical | | | 1,000.00 | | | 1.99% | | | 1,015.17 | | | | 10.11 | |
| * | Expenses are equal to the Fund’s annualized expense ratio multiplied by the average account value over the period, multiplied by 184/365. |
| ** | Dynamic Momentum VA Fund commenced operations on August 21, 2017 and its expenses are equal to the Fund’s annualized expense ratio multiplied by the average account value over the period, multiplied by 132/365. |
| RATIONAL VA FUNDS | |
| SUPPLEMENTAL INFORMATION (Unaudited) | |
| December 31, 2017 | ANNUAL REPORT |
Consideration and Renewal of Management Agreement between Rational Advisors, Inc. and Mutual Fund & Variable Insurance Trust with respect to the Rational Dividend Capture Fund VA Fund and Rational Insider Buying VA Fund
In connection with an in person Board Meeting held on December 15, 2017, the Board of Trustees (the “Board” or the “Trustees”) of Mutual Fund & Variable Insurance Trust (the “Trust”), including a majority of the Trustees who are not “interested persons” as that term is defined in the Investment Company Act of 1940, as amended, discussed the renewal of the Management Agreement between Rational Advisors, Inc. (“Rational”) and the Trust with respect to the Rational Dividend Capture Fund VA Fund (the “Dividend Capture VA” or “Fund”) and Rational Insider Buying VA Fund (the “Insider Buying VA” or “Fund”),(together the “VA Funds”).
The Trustees reviewed Rational’s responses to a series of questions (“Rational 15c Response”) regarding, among other things, the investment performance of Rational or applicable sub-advisor; the nature, extent, and quality of the services to be provided by the Rational and applicable sub-advisor; the advisory fees and costs of the services to be provided and the profits to be realized by Rational and its affiliates from its relationship with the VA Funds; the extent to which economies of scale will be realized as each VA Fund grows; and whether the fee levels reflect these economies of scale to the benefit of shareholders.
The Trustees relied upon the advice of legal counsel and their own business judgment in evaluating and weighting each of the factors to be considered. The conclusions reached by the Trustees were based upon a comprehensive evaluation and discussion of all the information provided in the Rational 15c Response for each VA Fund with respect to the approval of the Management Agreement.
Nature and Extent of Services. The Trustees discussed the background and experience of senior personnel at Rational. The Trustees then discussed the nature of Rational’s operations and the quality of its compliance program. They considered that Rational is responsible for monitoring any sub-advisor’s performance and compliance and risk management with legal standards as well as compliance in trading within each VA Fund’s investment strategy. The Trust’s CCO confirmed that Rational has a compliance program designed to prevent violations of applicable laws. They noted their satisfaction with Rational’s commentary on performance and insight as to any sub-advisor’s management. After further discussion and review of the Rational 15(c) Response; the Trustees concluded that the Rational will continue to provide an acceptable level of services to the VA Funds.
Performance. The Trustees reviewed the performance of each VA Fund relative to some or all of one or more benchmark indices, a peer group and its respective Morningstar category or categories.
With respect to the Dividend Capture VA Fund, the Trustees noted the Fund lagged behind its peer group average and the S&P 500 Index for the 1, 5 and 10 year periods. The Trustees further noted that performance since inception slightly lagged the Morningstar category, Large Value and the S&P 500 Total Return Index. They recalled their discussions with a representative of Rational earlier in the meeting, noting that the underperformance of the Dividend Capture VA Fund was the result of a focus on dividend yield and the risk management process over the past few years which resulted in reducing equity exposure during a strong equity rally. They further noted that adjustments were made to the strategy and the Fund’s performance has improved in the months since September 30, 2017. The Board concluded that the Dividend Capture VA Fund’s performance was acceptable.
In reviewing performance of the Insider Buying VA Fund, the Trustees noted that performance for the 5 and 10 year periods lagged the peer group average and the Morningstar Large Cap Blend category, as well as the S&P 500 Total Return Index. For the one year period, the Fund outperformed the peer group and the Morningstar Large Cap Blend category but underperformed the S&P 500 Total Return Index slightly. The Board further noted that since inception, the Fund slightly lagged the S&P 500 Total Return Index, and out-performed the peer group and Morningstar category. The Trustees acknowledged this is the result of the Fund operating its prior investment strategy. With consideration to Rational’s management ability, they expect future performance of Insider Buying VA to improve.
Fees and Expenses. The Trustees reviewed the advisory fees for each VA Fund as compared to its respective peer group and respective Morningstar category.
4821-8335-7790.1
| RATIONAL VA FUNDS | |
| SUPPLEMENTAL INFORMATION (Unaudited)(Continued) |
| December 31, 2017 | ANNUAL REPORT |
With respect to the Dividend Capture VA Fund, the Trustees noted that the advisory fee of 0.75% for the Fund was slightly higher that the average for both the peer group and the Morningstar category, Large Value, and within the range of fees for the categories. In reviewing the overall expense ratios, the Trustees noted it was slightly higher than the averages, but within the high and low range its peer group and Morningstar category. The Trustees discussed the allocation of fees between Rational and the Dividend Capture VA Fund’s sub-advisor relative to its respective duties and other factors, and agreed that the allocation of fees between Rational and the sub-advisor was appropriate.
With respect to Insider Buying VA Fund, the Trustees noted the advisory fee of 0.75% was lower than the peer group, and slightly above the Morningstar Large Blend category average, while mid-range for both groups. The Trustees further noted the expense ratio of 1.25% was below the average for peer group but above the average of its Morningstar category, yet within the range of the Morningstar category.
In considering the investment strategy, range of fees within each category, the size of the VA Funds, and in recognition of the unique strategies offered by the VA Funds, the Board determined that the advisory fees in each case were not unreasonable.
Profitability. The Trustees reviewed a profitability analysis provided for each VA Fund. The Trustees noted that Rational realized a modest profit with respect to advisory services and no profits based on the totality of its relations with each of the VA Funds. They considered that for each VA Fund, no compensation for Rational’s principals and primary portfolio management team was allocated or included in the per Fund analysis because those persons received a share of profits rather than salary. After further discussion, the Trustees concluded that excessive advisor profitability was not currently a concern for any of the VA Funds and that Rational’s access to additional capital provided a satisfactory financial cushion in spite of losses.
Economies of Scale. The Trustees noted that Rational stated it anticipates that each VA Fund would benefit from economies of scale when it reaches approximately $200 million in net assets. At that point the total expenses of a Fund would start to fall below any expense limitation agreement and Rational would no longer need to waive advisory fees and/or reimburse expenses. The Trustees noted that the Management Agreement does not contain breakpoints that reduce the fee rate on assets above specified levels. The Independent Trustees agreed that breakpoints may be an appropriate way for Rational to share its economies of scale as assets of the VA Funds continue to increase. They further noted that Rational currently does not believe that breakpoints in the advisory fees are appropriate. The Trustees determined, after further discussion, that economies of scale have not been reached at this time and agreed that the matter of economies of scale would be revisited as assets of the VA Funds materially increase.
Conclusion. Having reviewed and discussed in depth such information from Rational as the Trustees believed to be reasonably necessary to evaluate the terms of the Management Agreement, and as assisted by the advice of legal counsel, the Trustees concluded that renewal of the management agreement was in the best interest of the shareholders of the Dividend Capture VA Fund, and Insider Buying VA Fund.
4821-8335-7790.1
| RATIONAL VA FUNDS | |
| SUPPLEMENTAL INFORMATION (Unaudited) |
| December 31, 2017 | ANNUAL REPORT |
Consideration and approval of an Advisory Agreement between Rational Advisors, Inc. (“Rational”) and the Trust with respect to the Rational Dynamic Momentum VA Fund (previously the Catalyst Managed Futures Strategy VA Fund”).
In connection with a regular meeting held on February 26, 2016, the Board of Trustees (the “Board” or the “Trustees”) of Mutual Fund & Variable Insurance Trust (the “Trust”), including a majority of the Trustees who are not “interested persons” as that term is defined in the Investment Company Act of 1940, as amended, discussed the approval of a proposed advisory agreement between Rational and the Trust (the “Advisory Agreement”), with respect to the Dynamic Momentum Fund VA Fund (the “New VA Fund”).
The Trustees reviewed the investment strategies of the proposed New VA Fund of investing in long and short positions on futures contracts, forward contracts and options on futures contracts; and Rational’s responses to a series of questions regarding, among other things, the expected investment performance of the New VA Fund; and the services to be provided by Rational to the New VA Fund, comparative fees and expense limitation information, and Rational’s expected profitability from advising the New VA Fund. They noted Rational’s experience in choosing sub-advisers and its oversight capabilities.
Nature and Extent of Services. The Trustees were provided with information regarding Rational’s corporate structure, officers, owners, and its compliance record. The Trustees were also provided with information describing the background and experience of Rational’s senior personnel. Other factors covered in the materials provided to the Trustees included the adviser’s compliance and risk management structure, financial stability and past performance. The Trustees had experience in working with Rational as adviser to other series of the Trust. After further discussion and review the Trustees concluded that Rational would provide an acceptable level of services to the New VA Fund.
Performance. As the New VA Fund would be sub-advised by Chesapeake Capital Corporation, (“Chesapeake”) for performance comparison, the Trustees considered the performance history of the Equinox Chesapeake Strategy Fund, the Chesapeake Capital “Flagship” strategy, and the Mariner Managed Futures Strategy Portfolio (the “Chesapeake Strategies”), each of which had strategies similar to that proposed for the New VA Fund. The performance information provided reflected strong performance for the Chesapeake Strategies with the Equinox Chesapeake Strategy Fund outperforming the S&P 500 for the 1 and 3 year periods, and significantly outperforming the Morningstar Managed Futures category over each period. The Trustees concluded they were satisfied with Chesapeake’s ability to manage assets, and agreed that Rational had the skill necessary to provide the requisite performance oversight of the sub-adviser to the benefit of the New VA Fund and its future shareholders.
Fees and Expenses. The proposed annual advisory fee for the New VA Fund was 1.75% which was slightly below the average of its peer group but above the average for of the Morningstar Managed Futures Category. The Trustees discussed the allocation of fees between Rational and the sub-advisor relative to their respective duties and other factors, and agreed that the allocation of fees between Rational and Chesapeake was appropriate. In considering the strategy, range of fees within the category, and noting the significant range in fees in the category, the projected size of the Fund, and in recognition of the unique strategy offered by the New VA Fund, the Board determined that the advisory fees were not unreasonable.
Profitability. Rational provided a profitability analysis estimating its potential profitability in connection with its relationship with the New VA Fund. Rational estimated realizing a net loss during the initial year of the Advisory Agreement. The Trustees agreed that excessive profits were not a concern at this time.
Economies of Scale. The Trustees considered whether there would be economies of scale with respect to the management of the New VA Fund. They noted that economies of scale were not anticipated to be reached during
| RATIONAL VA FUNDS | |
| SUPPLEMENTAL INFORMATION (Unaudited)(Continued) |
| December 31, 2017 | ANNUAL REPORT |
the initial period of the Advisory Agreement, and agreed that the matter of economies of scale would be revisited when the New VA Fund reach significant asset levels.
Conclusion. Having requested and received such information from Rational as the Trustees believed to be reasonably necessary to evaluate the terms of the Advisory Agreement, and as assisted by the advice of Counsel, the Trustees concluded that the approval of the Advisory Agreement was in the best interests of the future shareholders of the New VA Fund.
Consideration and approval of Sub-Advisory Agreement between Rational and Chesapeake with respect to the Rational Dynamic Momentum VA Fund
In connection with a regular meeting held on February 26, 2016, the Board discussed the approval of a sub-advisory agreement between Rational and Chesapeake (the “Sub-Advisory Agreement”), with respect to the Dynamic Momentum Fund VA Fund (the “New VA Fund”).
The Trustees were provided with information from Chesapeake regarding, among other things, the expected investment performance of the New VA Fund; and the services to be provided by Chesapeake to the New VA Fund, comparative fees and expense limitation information, and Rational’s expected profitability from advising the New VA Fund. Other factors considered by the Trustees included the compliance and risk management structure, financial stability and past performance. They noted Rational’s experience in choosing sub-advisers and their oversight capabilities.
Nature and Extent of Services. The Trustees reviewed the Chesapeake’s Form ADV, which provides information on the corporate structure, officers, owners, and compliance record of Chesapeake. They noted that it has $153.2m in AUM as of December 2015, and is a newly registered investment adviser. The Trustees discussed the background and experience of senior personnel at the firm. The Trustees then discussed the nature of Chesapeake’s operations, the quality of its compliance and the experience of its management personnel. After further discussion and review the Trustees concluded that the Chesapeake will provide an acceptable level of services to the New VA Fund.
Performance. The Trustees considered the performance history of the Chesapeake Strategies, each of which had strategies similar to that proposed for the New VA Fund. The performance information provided reflected strong performance for the Chesapeake Strategies with the Equinox Chesapeake Strategy Fund outperforming the S&P 500 for the 1 and 3 year periods, and significantly outperforming the Morningstar Managed Futures category over each period. The Trustees concluded they were satisfied with Chesapeake’s ability to manage assets, and agreed that Rational had the skill necessary to provide the requisite performance oversight of the sub-adviser to the benefit of the New VA Fund and its future shareholders.
Fees and Expenses. Chesapeake would receive 0.50% of the net advisory fee under the Sub-Advisory Agreement. The Trustees discussed the allocation of fees between Rational and the sub-advisor relative to their respective duties and other factors, and agreed that the allocation of fees between Rational and Chesapeake was appropriate. In considering the strategy, range of fees within the category, and noting the significant range in fees in the category, the projected size of the Fund, and in recognition of the unique strategy offered by the New VA Fund, the Board determined that the proposed sub-advisory fee was not unreasonable.
Profitability. The Trustees were provided with a profitability analysis from Chesapeake. They noted that Chesapeake did not expect to realize a profit in connection with the New VA Fund during the initial year of the Sub-Advisory Agreement. The Trustees agreed that excessive profits were not a concern at this time.
Economies of Scale. The Trustees considered whether the sub-advisor was expected to realize economies of scale with respect to the sub-advisory services provided to the Fund. The Trustees agreed that this was primarily an
| RATIONAL VA FUNDS | |
| SUPPLEMENTAL INFORMATION (Unaudited)(Continued) |
| December 31, 2017 | ANNUAL REPORT |
advisor level issue and should be considered with respect to the overall advisory contract, taking into consideration the impact of the sub-advisory expense and that at currently projected asset levels, it was unlikely the sub-adviser would achieved any economies of scale during the initial term of the Sub-Advisory Agreement.
Conclusion. Having requested and received such information from Chesapeake as the Trustees believed to be reasonably necessary to evaluate the terms of the Sub-Advisory Agreement, and as assisted by the advice of Counsel, the Trustees concluded that approval of the Sub-Advisory Agreement was in the best interests of each of the New VA Fund and its future shareholders.
| RATIONAL VA FUNDS | |
| Boards of Trustees and Trust Officers (Unaudited) (Continued) |
| December 31, 2017 | ANNUAL REPORT |
The Trustees and officers of the Trust, together with information as to their principal business occupations during the past five years and other information, are shown below. Unless otherwise noted, the address of each Trustee and Officer is 36 N. New York Avenue, Huntington, NY 11743. Each Trustee and officer also serves in the same capacity for the Strategy Shares, another open-end investment company whose series are managed by the Advisor. Collectively, the Funds, Strategy Shares, Mutual Fund Series Trust and TCG Financial Trusts I-X comprise the “Fund Complex.
Independent Trustees Background
Name, Address
and Age | Position(s)
with Trust | Term
and
Length
Served* | Principal Occupation(s)
During Past 5 Years | Number of
Portfolios
in Fund
Complex
Overseen
by Trustee | Other Directorships
Held by Trustees |
Tobias Caldwell
Age: 48 | Chairman of the Board and Trustee | Since January 2016 | Managing member, Bear Properties, LLC (2006 - present) (real estate firm); Managing member, PTL Real Estate, LLC (2000 – present) (real estate/investment firm); Managing member, Genovese Family Enterprises, LLC (1999 – present) (real estate firm). | 52 | Chairman of the Board, Strategy Shares, comprised of 3 funds (January 2016-present); Lead independent trustee and Chairman of the Audit Committee, Mutual Fund Series Trust, comprised of 41funds (2006-present) Trustee, M3Sixty Funds Trust comprised of 3 funds (2016 -present). |
Stephen P. Lachenauer
Age: 48 | Trustee | Since January 2016 | Attorney, private practice (2006-present). | 23 | Board Member, Strategy Shares, comprised of 3 funds (January 2016 – present); Trustee, TCG Financial Series Trusts I-X, each Trust is comprised of 1 fund (2015-present). |
Donald McIntosh
Age: 47 | Trustee | Since January 2016 | Credit risk review analyst, Santander Holdings USA (May 2015 – present); Governance analyst, Santander Bank (2011 – April 2015). | 23 | Board Member, Strategy Shares, comprised of 3 funds (January 2016– present); Trustee, TCG Financial Series Trusts I-X, each Trust is comprised of 1 fund (2015-present). |
| RATIONAL VA FUNDS | |
| Boards of Trustees and Trust Officers (Unaudited) (Continued) |
| December 31, 2017 | ANNUAL REPORT |
Officers**
Name, Address
and Age | Position(s)
with Trust | Term
and
Length
Served | Principal Occupation(s) During Past 5
Years | Number of
Portfolios in
Fund
Complex
Overseen
by Trustee |
Jerry Szilagyi
Age: 54 | President | Since April 2016 | President, Rational Advisors, Inc., 1/2016 -present; Chief Executive Officer, Catalyst Capital Advisors LLC, 1/2006- present; Member, AlphaCentric Advisors LLC, 2/2014 to Present; Managing Member, MFund Distributors LLC, 10/2012-present; Managing Member, MFund Services LLC, 1/2012 – Present; President, Abbington Capital Group LLC, 1998- present; President, Cross Sound Capital LLC, 6/2011 to 10/2013; President, USA Mutuals, Inc., 3/2011 to 7/2016. | 52 |
Erik Naviloff
80 Arkay Drive,
Hauppauge, New
York 11788
Age: 48 | Treasurer | Since April 2016 | Vice President –Fund Administration, Gemini Fund Services, LLC, since 2012; Assistant Vice President, Gemini Fund Services, 2007 - 2012. | N/A |
Aaron Smith
80 Arkay Drive,
Hauppauge, New
York 11788
Age: 42
| Assistant Treasurer | Since April 2016 | Manager - Fund Administration, Gemini Fund Services, LLC, since 2012; Authorized Officer, UBS Global Asset Management, a business division of UBS AG, 2010-2012. | N/A |
Frederick J. Schmidt
Age: 57 | Chief Compliance Officer | Since April 2016 | Director, MFund Services LLC since 5/2015; Director & Chief Compliance Officer, Citi Fund Services, 2010-2015; Senior Vice President & Chief Compliance Officer, Citi Fund Services, 2004-2010. | N/A |
Jennifer A. Bailey
Age: 48 | Secretary | Since April 2016 | Director of Legal Services, MFund Services LLC, 2/2012 to present | N/A |
| * | The term of office of each Trustee is indefinite. |
| ** | Officers do not receive any compensation from the Trust. |
The Fund’s Statement of Additional Information (“SAI”) includes additional information about the Trustees and is available free of charge, upon request, by calling toll-free at 1-800-253-0412.
PRIVACY NOTICE
Mutual Fund & Variable Insurance Trust
Rev. July 2017
| FACTS | WHAT DOES MUTUAL FUND & VARIABLE INSURANCE TRUST DO WITH YOUR PERSONAL INFORMATION? |
| Why? | Financial companies choose how they share your personal information. Federal law gives consumers the right to limit some, but not all sharing. Federal law also requires us to tell you how we collect, share, and protect your personal information. Please read this notice carefully to understand what we do. |
| What? | The types of personal information we collect and share depends on the product or service that you have with us. This information can include: ● Social Security number and wire transfer instructions ● account transactions and transaction history ● investment experience and purchase history When you are no longer our customer, we continue to share your information as described in this notice. |
| How? | All financial companies need to share customers’ personal information to run their everyday business. In the section below, we list the reasons financial companies can share their customers’ personal information; the reasons Mutual Fund & Variable Insurance Trust chooses to share; and whether you can limit this sharing. |
Reasons we can share your
personal information: | Does Mutual Fund &
Variable Insurance Trust
share information? | Can you limit this
sharing? |
| For our everyday business purposes - such as to process your transactions, maintain your account(s), respond to court orders and legal investigations, or report to credit bureaus. | YES | NO |
| For our marketing purposes - to offer our products and services to you. | NO | We don’t share |
| For joint marketing with other financial companies. | NO | We don’t share |
| For our affiliates’ everyday business purposes - information about your transactions and records. | NO | We don’t share |
| For our affiliates’ everyday business purposes - information about your credit worthiness. | NO | We don’t share |
| For our affiliates to market to you | NO | We don’t share |
| For non-affiliates to market to you | NO | We don’t share |
| QUESTIONS? | Call 1-800-253-0412 |
PRIVACY NOTICE
Mutual Fund & Variable Insurance Trust
| What we do: |
How does Mutual Fund & Variable Insurance Trust protect my personal information? | To protect your personal information from unauthorized access and use, we use security measures that comply with federal law. These measures include computer safeguards and secured files and buildings. Our service providers are held accountable for adhering to strict policies and procedures to prevent any misuse of your nonpublic personal information. |
How does Mutual Fund & Variable Insurance Trust collect my personal information? | We collect your personal information, for example, when you: ● open an account or deposit money ● direct us to buy securities or direct us to sell your securities ● seek advice about your investments We also collect your personal information from others, such as credit bureaus, affiliates, or other companies. |
Why can’t I limit all sharing? | Federal law gives you the right to limit only: ● sharing for affiliates’ everyday business purposes – information about your creditworthiness. ● affiliates from using your information to market to you. ● sharing for non-affiliates to market to you. State laws and individual companies may give you additional rights to limit sharing. |
| Definitions |
| Affiliates | Companies related by common ownership or control. They can be financial and non-financial companies. ● Mutual Fund & Variable Insurance Trust does not share with affiliates.. |
| Non-affiliates | Companies not related by common ownership or control. They can be financial and non-financial companies. ● Mutual Fund & Variable Insurance Trust doesn’t share with non-affiliates so they can market to you. |
| Joint marketing | A formal agreement between nonaffiliated financial companies that together market financial products or services to you. ● Mutual Fund & Variable Insurance Trust doesn’t jointly market. |
Variable investment options are not bank deposits or obligations, are not guaranteed by any bank, and are not insured or guaranteed by the U.S. government, the Federal Deposit Insurance Corporation, the Federal Reserve Board or any other government agency. Investment in variable investment options involves investment risk, including the possible loss of principal.
A copy of the policies and procedures that the Funds use to determine how to vote proxies relating to securities held in the Funds’ portfolios, as well as a record of how the Funds voted any such proxies during the most recent 12-month period ended December 31, is available without charge and upon request by calling 1-800-253-0412. This information is also available from the EDGAR database on the SEC’s website at www.sec.gov.
The Funds file with the SEC a complete schedule of their portfolio holdings, as of the first and third quarters of their fiscal year, on “Form N-Q”. These filings are available on the SEC’s website at www.sec.gov and may be reviewed and copied at the SEC’s Public Reference Room in Washington, D.C. (call 1-202-551-8090 for information on the operation of the Public Reference Room.)
The Huntington National Bank, is the Custodian of The Funds. Gemini Fund Services, LLC serves as the Administrator, Transfer Agent and Fund Accountant. Rational Advisors, Inc., serves as Investment Advisor to the Funds.
This report is authorized for distribution to prospective investors only when preceded or accompanied by the Funds’ prospectus, which contains facts concerning each Fund’s objective and policies, management fees, expenses and other information.
Shareholder Services: 800-253-0412
(a) The Registrant has, as of the end of the period covered by this report, adopted a code of ethics that applies to the Registrant's principal executive officer, principal financial officer, and principal accounting officer or controller, or persons performing similar functions, regardless of whether these individuals are employed by the Registrant or a third party.
(b) During the period covered by this report, there were no amendments to any provision of the code of ethics.
(c) During the period covered by the report, with respect to the registrant’s code of ethics that applies to its Principal Executive Officer and Principal Financial Officer: there have been no amendments to a provision that relates to any element of the code of ethics definition enumerated in paragraph (b) of this Item 2.
| Item 3. | Audit Committee Financial Expert. |
3(a) The registrant’s board of trustees has determined that the registrant does not have an audit committee financial expert. The audit committee determined that, although none of its members meet the technical definition of an audit committee financial expert, the committee has sufficient financial expertise to adequately perform its duties under the Audit Committee Charter without the addition of a qualified expert.
| Item 4. | Principal Accountant Fees and Services. |
(a) Audit Fees. The aggregate fees billed for each of the last two fiscal years for professional services rendered by the registrant's principal accountant for the audit of the registrant's annual financial statements or services that are normally provided by the accountant in connection with statutory and regulatory filings or engagements for those fiscal years are as follows:
Fiscal year ended 2017: $26,500
Fiscal year ended 2016: $72,500
(b) Audit-Related Fees. There were no fees billed in each of the last two fiscal years for assurances and related services by the principal accountant that are reasonably related to the performance of the audit of the registrant’s financial statements and are not reported under paragraph (a) of this item.
Fiscal year ended 2017: $0
Fiscal year ended 2016: $0
(c) Tax Fees. The aggregate fees billed in each of the last two fiscal years for professional services rendered by the principal accountant for tax compliance are as follows:
Fiscal year ended 2017: $6,000
Fiscal year ended 2016: $19,000
(d) All other fees billed to the registrant by its principal accountants for the two most recent fiscal years:
Fiscal year ended 2017: $0
Fiscal year ended 2016: $0
(e)(1) The audit committee does not have pre-approval policies and procedures. Instead, the audit committee or audit committee chairman approves on a case-by-case basis each audit or non-audit service before the principal accountant is engaged by the Registrant.
(e)(2) There were no services described in each of paragraphs (b) through (d) of this Item that were approved by the audit committee pursuant to paragraph (c)(7)(i)(C) of Rule 2-01 of Regulation S-X. |
| (f) Not applicable. The percentage of hours expended on the principal accountant's engagement to audit the Registrant's financial statements for the most recent fiscal year that were attributed to work performed by persons other than the principal accountant's full-time, permanent employees was zero percent (0%). |
(g) All non-audit fees billed by the Registrant's principal accountant for services rendered to the Registrant for the fiscal years ended December 31, 2017 and 2016, respectively, are disclosed in (b)-(d) above. There were no audit or non-audit services performed by the Registrant's principal accountant for the Registrant's adviser.
Item 5. | Audit Committee of Listed Registrants.
|
Not applicable.
| Item 6. | Schedule of Investments. |
Included in annual report to shareholders filed under item 1 of this form.
| Item 7. | Disclosure of Proxy Voting Policies and Procedures for Closed-End Management Investment Companies. |
Not applicable.
| Item 8. | Portfolio Managers of Closed-End Management Investment Companies. |
Not applicable.
| Item 9. | Purchases of Equity Securities by Closed-End Management Investment Company and Affiliated Purchasers. |
Not applicable.
| Item 10. | Submission of Matters to a Vote of Security Holders. |
Not applicable.
| Item 11. | Controls and Procedures. |
(a) The registrant’s Principal Executive Officer and Principal Financial Officer, or persons performing similar functions, have concluded that the registrant’s disclosure controls and procedures (as defined in Rule 30a-3(c) under the Act) are effective in design and operation and are sufficient to form the basis of the certifications required by Rule 30a-2 under the Act, based on their evaluation of these disclosure controls and procedures within 90 days of the filing of this report on Form N-CSR.
(b) There were no changes in the registrant’s internal control over financial reporting (as defined in Rule 30a-3(d) under the Act (17 CFR 270.30a-3(d)) that occurred during the second fiscal quarter of the period covered by this report that have materially affected or are reasonably likely to materially affect, the registrant’s internal control over financial reporting.
(1) Code of Ethics for Principal Executive and Senior Financial Officers is attached hereto.
(2) Certifications pursuant to Section 302 of the Sarbanes-Oxley Act of 2002 are filed herewith.
(3) Certifications pursuant to Section 906 of the Sarbanes-Oxley Act of 2002 are filed herewith.
SIGNATURES
Pursuant to the requirements of the Securities Exchange Act of 1934 and the Investment Company Act of 1940, the registrant has duly caused this report to be signed on its behalf by the undersigned, thereunto duly authorized.
(Registrant) Mutual Fund and Variable Insurance Trust
| | | |
| By (Signature and Title) | | /s/ Jerry Szilagyi |
| | | Jerry Szilagyi, President and Principal Executive Officer |
| | | | |
| Date | | 3/8/18 | |
| | | | | | |
Pursuant to the requirements of the Securities Exchange Act of 1934 and the Investment Company Act of 1940, this report has been signed below by the following persons on behalf of the registrant and in the capacities and on the dates indicated.
| | | |
| By (Signature and Title) | | /s/ Jerry Szilagyi |
| | | Jerry Szilagyi, President and Principal Executive Officer |
| | | | |
| Date | | 3/8/18 | |
| | | | | | |
| | | |
| By (Signature and Title) | | /s/ Erik Naviloff |
| | | Erik Naviloff, Treasurer and Principal Financial Officer |
| | | | |
| Date | | 3/8/18 | |
| | | | | | |