UNITED STATES
SECURITIES AND EXCHANGE COMMISSION
Washington, D.C. 20549
FORM N-CSR
CERTIFIED SHAREHOLDER REPORT OF REGISTERED
MANAGEMENT INVESTMENT COMPANIES
Investment Company Act file number 811-05010
Mutual Fund and Variable Insurance Trust
(Exact name of registrant as specified in charter)
36 North New York Avenue
Huntington, NY 11743
(Address of principal executive offices) (Zip code)
The Corporation Trust Company
Corporate Trust Center
1209 Orange Street
Wilmington, DE 19801
(Name and address of agent for service)
Registrant’s telephone number, including area code: 1-631-629-4237
Date of fiscal year end: December 31
Date of reporting period: December 31, 2020
| Item 1. | Reports to Shareholders. |
 |
| |
| |
| |
| |
| |
| |
| |
| Annual Shareholder Report |
| |
| |
| |
| |
| |
| |
| |
| D e c e m b e r 3 1 , 2 0 2 0 |
| INSTITUTIONAL SHARES |
| CLASS A SHARES |
| CLASS C SHARES |
| |
| |
| |
| |
| |
| |
| |
| |
| |
| |
| |
| |
| |
| |
| |
| |
| |
| |
| |
| |
| |
| |
| |
| |
| |
| |
| |
| |
| |
| |
| |
| |
| |
| |
| |
| |
| |
| |
| |

December 31, 2020
Rational Equity Armor Fund
Dear Fellow Shareholders,
The Rational Equity Armor Fund (the “Fund”) seeks total return on investment, with dividend income an important component of that return. The Fund seeks to achieve this goal by investing in two baskets, a long equity portfolio and a volatility hedge overlay. Prior to December 13, 2019, the Fund was managed by another sub-advisor with a different investment strategy. The Fund is now managed by Equity Armor Investments and its investment strategy is the Equity Armor Hedged Dividend Strategy.
Fund Performance
2020 is a year which will have a lasting impact. The disruption to our lives caused by a pandemic changed how the economy works, advanced some technology faster, and adjusted the way we view volatility and the markets. As a new manager implementing a new strategy in the Fund as of December 12, 2019, Equity Armor’s proprietary long volatility Hedge (EAVOL), was challenged to prove it worked right away. We felt the same about investing in 2019 as we do now, and we are still poised to take advantage of the new economy, and the new world of investing characterized by higher valuations, lower bond yields, and lower liquidity. Using volatility, to both limit the downside risk to owning equities, and, to add alpha in times of volatility, the Rational Equity Armor Fund stood out in a year when many funds struggled to manage risks.
For the fiscal year ending December 31, 2020, the Fund returned +15.85% (Institutional Class), while the S&P 500 Value TR Index benchmark returned +1.36%. Prior to December 13, 2019, the Fund had a different sub-advisor that implemented a different strategy.
The Fund’s total annualized returns through December 31, 2020 as compared to the S&P 500 Value TR Index were as follows:
| | 1 Year | 3 Years | 5 Years | 10 Years | Since Inception* |
| Institutional Class | 15.85% | 4.33% | 3.39% | 5.96% | 5.60% |
| Class A | 15.74% | 4.10% | 3.15% | 5.70% | 5.35% |
| Class C** | 14.88% | 3.31% | 2.48% | 5.00% | 4.47% |
| Class A w/ Sales Charge | 10.17% | 2.42% | 2.15% | 5.19% | 5.09% |
| S&P 500 Value TR Index (1) | 1.36% | 6.78% | 10.52% | 10.74% | 6.29% |
| | | | | | |
| ** | Class C Shares commenced operations on January 3, 2014. Returns prior to that date are of the Institutional Shares, adjusted for expenses of Class C Shares. Institutional Shares would have had substantially similar annual returns because the shares are invested in the same portfolio. |
The Fund’s maximum sales charge for Class “A” shares is 4.75%. Investments in mutual funds involve risks. Performance is historic and does not guarantee future results. Investment return and principal value will fluctuate with changing market conditions so that when redeemed, shares may be worth more or less than their original cost. Current performance may be lower or higher than the performance data quoted. To obtain the most recent month-end performance information or the Fund’s prospectus please call the Fund, toll free at 1-800-253-0412. You can also obtain a prospectus at www.RationalMF.com.
Volatility Conditions
The Fund’s goal is to take advantage of the historical mean reversion of volatility by (a) using the Equity Armor Investments, VOL365 Index (EAVOL) to provide a volatility overlay as a hedge for downside equity risk exposure, and (b) to add alpha to equity portfolios by rebalancing equity to EAVOL index weightings in times of dislocation.
The EAVOL Index is a dynamic VIX futures trading system, which analyzes the market and selects the optimal VIX positions to hold to take advantage of shifts in the volatility futures expiration curve.
Going forward in 2021, we continue to see value in holding a long volatility hedge. It allows us to take advantage of market fluctuations like February and March of 2020. Our proprietary model allows us to harvest volatility when it increases and put it back to work by buying stocks which are correspondingly down. EAVOL is a rule based quantitative strategy implemented to own volatility and reduce the drag associated with owning volatility as insurance. Our equities are selected based upon an economically driven model which allows us to find value within the economy, rather than company specific information. Together with daily rebalancing of the volatility overlay, which is the most efficient way to trade long volatility as it allows the Fund to hold defense.
Summary
As experienced investors and traders, we at Equity Armor Investments note two typical patterns in the stock market that given a long enough period, S&P 500 stocks have gone higher while stocks have experienced major corrections along the way. We are going into our 12th year in the current bull market, and along the way each time the VIX has neared the 11 level (plus or minus 20%), we see the volatility pendulum swing back to the other extreme within a few months. The Fund’s constant volatility overlay provides consistent positioning and diversity that seeks to avoid wishing or jumping on momentum. We cannot say for certain when the next correction will come, but we believe the Fund invests in a prudent and effective manner to weather any storm, while potentially increasing wealth over time. We believe that employing an investment strategy that is data-driven; seeks to invest in stocks and that should experience less volatility than the market on down days by maintaining a volatility overlay should enable the Fund both to seek capital appreciation and take advantage of volatility in the market over a full market cycle.
Sincerely,
Joe Tigay
Brian Stutland
Luke Rahbari
Portfolio Managers
This report is intended for the Fund’s shareholders. It may not be distributed to prospective investors unless it is preceded or accompanied by the current Fund prospectus. To obtain a prospectus or other information about the Fund, please visit www.RationalMF.com or call 1-800-253-0412. Please read the prospectus carefully before investing.
| (1) | The S&P 500 Value Total Return Index® (“S&P 500 Value TR”) is an unmanaged market-capitalization weighted index consisting of those stocks within the S&P 500 that exhibit strong value characteristics. It uses a numerical ranking system based on four value factors and three growth factors to determine the constituents and their weightings. The S&P 500 Total Return Index® (“S&P 500 TR”) is an unmanaged index generally representing the performance of the broad domestic economy through changes in the aggregate market value of 500 stocks representing all major industries. Indices are unmanaged and, unlike the Fund, are not affected by cash flows. It is not possible to invest directly in an Index. For additional disclosure relating to the S&P 500 Value TR and S&P 500 TR, please see “Additional Disclaimers” in the Fund’s Prospectus. 2. The Price-to-Earnings Ratio (“P/E Ratio”) measures the current share price relative to the per-share earnings. |
4269-NLD-2/5/2021
| Rational Equity Armor Fund |
| PORTFOLIO REVIEW (Unaudited) |
| December 31, 2020 |
| |
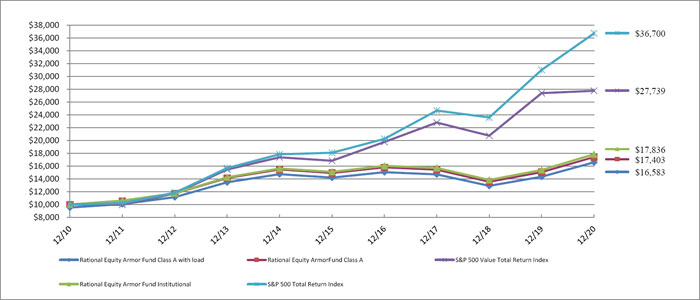
The Fund’s performance figures* for each of the periods ended December 31, 2020, compared to its benchmarks:
| | | Annualized | Annualized | Annualized | Annualized |
| | 1 Year Return | 5 Year Return | 10 Year Return | Since Inception(a) | Since Inception(b) |
| Institutional | 15.85% | 3.39% | 5.96% | 5.60% | N/A |
| Class A | 15.74% | 3.15% | 5.70% | 5.35% | N/A |
| Class A with load | 10.17% | 2.15% | 5.19% | 5.09% | N/A |
| Class C | 14.88% | 2.48% | N/A | N/A | 2.49% |
| S&P 500 Value Total Return Index (c) | 1.36% | 10.52% | 10.74% | 6.88% | 8.84% |
| S&P 500 Total Return Index (d) | 18.40% | 15.22% | 13.88% | 7.86% | 13.08% |
| | | | | | |
| * | The performance data quoted here represents past performance. Current performance may be lower or higher than the performance data quoted above. Investment return and principal value will fluctuate, so that shares, when redeemed, may be worth more or less than their original cost. The returns shown do not reflect the deduction of taxes that a shareholder would pay on Fund distributions or on the redemptions of Fund shares. Past performance is no guarantee of future results. Performance figures for periods greater than 1 year are annualized. Per the fee table in the Fund’s May 1, 2020 prospectus, the total annual operating expense are 1.77% for Institutional shares, 2.02% for A shares and 2.77% for C shares before fee waivers. See the financial highlights for current expense ratios. For performance information current to the most recent month-end, please call toll-free 1-800-253-0412. Class A shares are subject to a maximum load of 4.75%. |
Performance information for the period prior to December 2019 does not reflect the Fund’s current strategy and the Fund’s portfolio was not managed by the Fund’s current Sub-Advisor.
| (a) | Inception date is February 28, 2001 for Class A, Institutional and the benchmarks. |
| (b) | Inception date is January 2, 2014 for Class C and the benchmarks. |
| (c) | The S&P 500 Value Total Return Index uses a numerical ranking system based on four value factors and three growth factors to determine the constituents and their weightings. Investors cannot invest directly in an Index. |
| (d) | The S&P 500 Total Return Index, a registered trademark of S&P Global., Inc., is a market capitalization-weighted index of 500 widely held common stocks. Investors cannot invest directly in an Index. |
Comparison of the Change in Value of a $10,000 Investment
| Top 10 Holdings by Industry ^ | | % of Net Assets | |
| Biotech & Pharma | | | 10.5 | % |
| Banking | | | 9.0 | % |
| Software | | | 5.2 | % |
| Machinery | | | 4.8 | % |
| Institutional Financial Services | | | 4.5 | % |
| Transportation & Logistics | | | 4.5 | % |
| Semiconductors | | | 4.4 | % |
| Electric Utilities | | | 3.9 | % |
| Technology Hardware | | | 3.9 | % |
| Retail - Discrectionary | | | 3.8 | % |
| Other/Short-Term Investments | | | 45.5 | % |
| | | | 100.0 | % |
| | | | | |
| ^ Does not include derivatives in which the Fund invests. |
Please refer to the Portfolio of Investments for a more detailed breakdown of the Fund’s assets.
December 31, 2020
Rational Tactical Return Fund
Dear Fellow Shareholders,
The Rational Tactical Return Fund (the “Fund”) seeks total return consisting of capital appreciation and income by making investments in long and short call and put options on futures contracts on the S&P 500 Index, as well as cash, and cash equivalents. 2020 was the third full year for Warrington to be the Sub Advisor for the Rational Tactical Return Fund. For the year, the Fund posted a +2.65% (Class I) return versus the +18.40% for the S&P 500 TR Index (S&P).
Investment Strategy
The Sub Advisor’s strategy seeks to achieve its investment objective in three ways: (1) Premium Collection – the Fund collects premiums on options it sells; (2) Volatility Trading – the Fund may enter into positions designed to hedge or profit from either an increase or a decrease in Index volatility; and (3) Trend Following – the Fund may increase or decrease the balance of puts and calls based on trending market direction. The Fund is designed to produce returns that are not correlated with equity market returns. The Fund employs strict risk management procedures, supported by both technical and fundamental analysis, that are intended to provide consistency of returns and to mitigate the extent of losses.
Fund Performance
The Tactical Return Fund generated a 2020 return of +2.65% (Class I), versus +18.40% for its S&P 500 TR Index (S&P) benchmark.
As other competitors in the Fund’s Morningstar category are more closely correlated with equity markets, the Fund lagged some of those competitors. Outperforming equity markets is not the target of the Fund, but rather the goal is to achieve consistent positive returns in a variety of market environments. Using both quantitative and fundamental indicators to ascertain near-term market movements, Warrington has been able to navigate the markets and minimize losses during volatile periods due to stringent risk management, while concurrently seeking profit opportunities. That balanced approach with a healthy respect for risk management may have caused the Fund to lag category leaders, but the same approach helps protect the Fund during volatile periods.
The Fund’s total annualized returns through December 31, 2020 as compared to the S&P 500 TR Index (S&P) benchmark were as follows:
| | | | | | | Since |
| | | Since | | | | Inception |
| | 1 Year | 12/5/17 | 3 Years | 5 Years | 10 Years | (05/02/07) * |
| Class I | 2.65% | 7.00% | 6.84% | 6.23% | 0.04% | -1.21% |
| Class A | 2.45% | 6.75% | 6.62% | 6.05% | -0.11% | -1.39% |
| Class C | 1.77% | 6.05% | 5.76% | n/a | n/a | 5.64% |
| Class A with Sales Charge | -2.35% | 5.07% | 4.91% | 5.03% | -0.60% | -1.74% |
| S&P 500 Total Return Index (1) | 18.40% | 14.49% | n/a** | n/a** | n/a** | n/a** |
| | | | | | | |
| * | Inception: 05/02/2007 (Class A & Inst.), 05/31/2016 (Class C). Prior to 12/5/2017, the Rational Tactical Return Fund was named the Rational Real Strategies Fund, which was managed by a different sub-advisor and implemented a different investment strategy. |
| ** | S&P 500 TR Index not relevant to strategy prior to 12/5/2017 strategy change. |
The Fund’s maximum sales charge for Class “A” shares is 4.75%. Investments in mutual funds involve risks. Performance is historic and does not guarantee future results. Investment return and principal value will fluctuate with changing market conditions so that when redeemed, shares may be worth more or less than their original cost.
Current performance may be lower or higher than the performance data quoted. To obtain the most recent month-end performance information or the Fund’s prospectus please call the Fund, toll free at 1-800-253-0412. You can also obtain a prospectus at www.RationalMF.com.
Summary
In its third full year as the Fund’s Sub Advisor, Warrington continued to provide strong absolute and relative returns, while consistently managing market risks. The Fund’s assets grew significantly in 2020, and we seek to continue that growth as equity markets have become richly valued in recent months, increasing the likelihood of future market volatility and heightened risk. In volatile markets, Warrington ensures that risk management is paramount, while concurrently evaluating the risk / reward relationship of the opportunities presented by those volatile markets.
Sincerely,
Scott Kimple and Mark Adams
Portfolio Managers
This report is intended for the Fund’s shareholders. It may not be distributed to prospective investors unless it is preceded or accompanied by the current Fund prospectus. To obtain a prospectus or other information about the Fund, please visit www.RationalMF.com or call 1-800-253-0412. Please read the prospectus carefully before investing.
| (1) | The S&P 500 Total Return Index by Standard & Poor’s Corp. is a capitalization-weighted index comprising 500 issues listed on various exchanges, representing the performance of the stock market generally. Please note that indices do not take into account any fees and expenses of investing in the individual securities that they track, and individuals cannot invest directly in any index, although individuals may invest in exchange traded funds or other investment vehicles that attempt to track the performance of an index. The Rational Tactical Return Fund may or may not purchase the types of securities represented by the S&P 500 Total Return Index. |
4270-NLD-2/5/2021
| Rational Tactical Return Fund |
| PORTFOLIO REVIEW (Unaudited) |
| December 31, 2020 |
| |
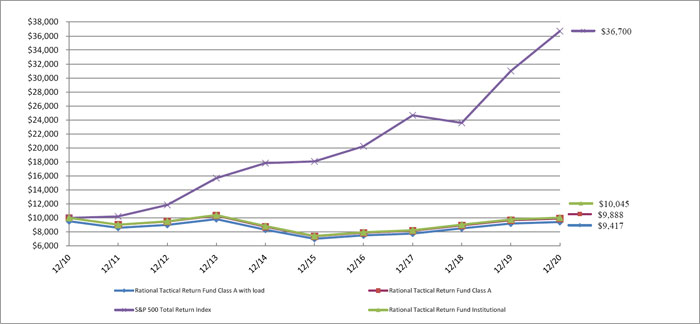
The Fund’s performance figures* for each of the periods ended December 31, 2020, compared to its benchmarks:
| | | Annualized | Annualized | Annualized | Annualized |
| | 1 Year Return | 5 Year Return | 10 Year Return | Since Inception(a) | Since Inception(b) |
| Institutional | 2.65% | 6.23% | 0.04% | (1.21)% | N/A |
| Class A | 2.45% | 6.05% | (0.11)% | (1.39)% | N/A |
| Class A with load | (2.35)% | 5.03% | (0.60)% | (1.74)% | N/A |
| Class C | 1.77% | N/A | N/A | N/A | 5.64% |
| S&P 500 Total Return Index (c) | 18.40% | 15.22% | 13.88% | 9.29% | 15.81% |
| | | | | | |
| * | The performance data quoted here represents past performance. Current performance may be lower or higher than the performance data quoted above. Investment return and principal value will fluctuate, so that shares, when redeemed, may be worth more or less than their original cost. The returns shown do not reflect the deduction of taxes that a shareholder would pay on Fund distributions or on the redemptions of Fund shares. Past performance is no guarantee of future results. Performance figures for periods greater than 1 year are annualized. Per the fee table in the Fund’s May 1, 2020 prospectus, the total annual operating expense are 2.20% for Institutional Class shares, 2.56% for Class A shares and 3.16% for Class C shares before fee waivers. See the financial highlights for current expense ratios. For performance information current to the most recent month-end, please call toll-free 1-800-253-0412. Class A shares are subject to a maximum load of 4.75%. |
Performance information for the period prior to December 2017 does not reflect the Fund’s current strategy and the Fund’s portfolio was not managed by the Fund’s current Sub-Advisor.
| (a) | Inception date is May 1, 2007 for Class A, Institutional and the benchmark. |
| (b) | Inception date is May 31, 2016 for Class C and the benchmark. |
| (c) | The S&P 500 Total Return Index, a registered trademark of S&P Global., Inc., is a market capitalization-weighted index of 500 widely held common stocks. Investors cannot invest directly in an Index. |
Comparison of the Change in Value of a 10,000 Investment
| Top Holdings by Asset Type ^ | | % of Net Assets | |
| Short-Term Investments | | | 34.1 | % |
| Other/Cash & Equivalents | | | 65.9 | % |
| | | | 100.0 | % |
| | | | | |
| ^ Does not include derivatives in which the Fund invests. |
| | | | | |
Please refer to the Portfolio of Investments for a more detailed breakdown of the Fund’s assets.
December 31, 2020
Rational Dynamic Brands Fund
Dear Fellow Shareholders,
The Rational Dynamic Brands Fund (the “Fund”) seeks long-term capital appreciation by investing in a focused group (25-50 holdings) of the most attractive & relevant brands contained in the Alpha Brands Consumer Spending Index (the “Index”) which has 200 constituents. Security selection is driven by a combination of fundamental and technical factors as well as using a proprietary brand relevancy scoring system that pulls from >40 business assessment factors using a qualitative and quantitative approach. In times of economic turmoil or unusually high equity valuations where equity risk is deemed high, the Fund may also invest in cash and cash equivalents and in asset classes that have historically been safe havens when equities were experiencing drawdowns. De-risking is designed to happen in stages. Risk management decisions are guided by: relative strength leadership, economic growth trajectory, the Fund management team’s assessment of the dominant equity trend, economic growth profile, consumer health, equity valuations, technical analysis, FED policy, investor sentiment, and changes in interest rates, credit spreads, and asset class volatility trends.
I think I speak for everyone when I say 2020 was a year unlike any other. I think a healthy dose of “normal” would make us all happy. Though the journey in 2021 will likely have the normal bumps along the way, our team at Accuvest is excited for what’s to come in 2021.
When our team created the Dynamic Brands strategy and took over as the new sub-advisor for HSUTX on October 17, 2017, our goal was to offer every investor the opportunity to invest easily in the most important and powerful theme driving every major economy, household & business spending. As a reminder, this important theme is a $40+ trillion per year phenomenon that, given its size & scope, warrants allocation in a portfolio. Our logic is rooted in common sense yet sometimes the most obvious decisions get over-shadowed by a quest to find the latest and greatest fad. Nothing is more predictable than a consumer’s propensity to spend.
If consumption drives the global economy, shouldn’t the most powerful brands serving this theme be the ideal core equity holding?
The Rational Dynamic Brands Fund (HSUTX) returned 45.3% for 2020, which significantly outperformed the S&P 500 Index return of +18.4%.
The Fund’s total annualized returns through December 31, 2020 as compared to the S&P 500 Total Return Index were as follows. Reminder, the Fund was converted to the Dynamic Brands Equity Strategy on 10/17/17:
| | 1 Year | 5 Years | 10 Years | Since Inception
(09/30/02) * |
| Class I | 45.28% | 17.97% | 12.33% | 12.30% |
| Class A | 44.91% | 17.69% | 12.04% | 12.02% |
| Class C | 45.28% | 17.97% | 12.33% | 12.30% |
| Class A with Sales Charge | 38.03% | 16.55% | 11.49% | 11.72% |
| S&P 500 Total Return Index (1) | 18.40% | 15.22% | 13.88% | 10.87% |
| | | | | |
| * | Inception: 09/30/2002 (Class A & I), 01/03/2014 (Class C). Prior to 10/17/2017, Rational Dynamic Brands Fund was named the Rational Defensive Growth Fund, which implemented a different investment strategy. |
The Fund’s maximum sales charge for Class “A” shares is 4.75%. Investments in mutual funds involve risks. Performance is historic and does not guarantee future results. Investment return and principal value will fluctuate with changing market conditions so that when redeemed, shares may be worth more or less than their original cost.
Current performance may be lower or higher than the performance data quoted. To obtain the most recent month-end performance information or the Fund’s prospectus please call the Fund, toll free at 1-800-253-0412. You can also obtain a prospectus at www.RationalMF.com.
Commentary:
The wild ride our economy and equity markets took in 2020 has been heavily chronicled so I won’t bore you with more of the details. Very few investors would have expected the yearly investment outcome we received when looking through a lens last March. 2020 was a year where growth-focused investors generated strong returns and everyone else lagged in general. Some sectors and industries delivered an outright negative return. The main question investors should ask: how many of my top performing funds or ETF’s were lucky to be in the right place at the right time and which ones made active decisions to be in the right place at the right time? The answer to that question should help you allocate in 2021. We are not growth-stock dedicated investors. We are opportunistically focused investors. In 2020, growth was where the opportunities lived. In 2021 we suspect the opportunities will be more diverse. If we are correct, our more diverse portfolio should fare better than the typical growth strategy, which is forced to invest in growth no matter the opportunities.
We side with famed investor Charlie Munger from Berkshire Hathaway… “fish where the fish are.” Our style-factor radar helps us understand where the fish are gathering today and where new momentum might be gathering.
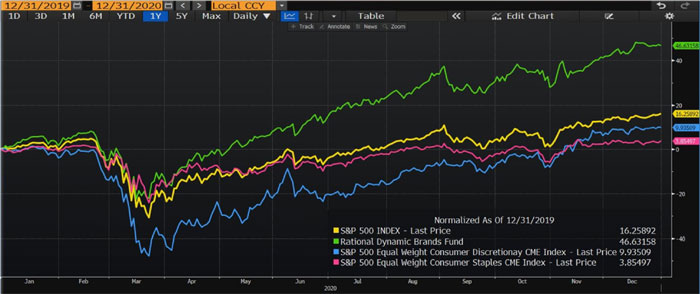
The Dynamic Brands Fund performed well in a year when its primary market, the global consumer, did rather poorly (see below for the returns of various equal-weighted indices). As the global economy experienced rolling lockdowns, consumer spending became very narrow and for a few months, it fell off a cliff. Consumers spent their money on fewer spending categories and with fewer brands. As an active investor without biases, the number of stocks we held shrank with the opportunities we saw for part of the year. A key differentiator for the Fund is having the ability to assess, pivot, and adapt to changing market conditions. The team designed the Fund’s strategy to offer maximum flexibility to manage through whatever storms emerge in global equity markets. Understanding no two bear markets or corrections are ever the same, our goal is to have a full toolbox of risk management tools that could help mitigate the volatility felt during periods of high stress. Over the last 3+ years and in 2020, we are proud to say having these tools and using them prudently has offered attractive returns and a smoother ride along the way.
2020: What drove the outperformance?
Flexibility.
You have to trade the market you have not the one you want. As thematic investors we are generally focused on identifying important sub-themes within the global consumer spending secular theme. In 2020 our investment focus was largely on e-commerce, streaming media, digital payments, and work from home beneficiaries. Many of the biggest winners are some of the most admired brands on the planet. Because of our diverse 200 stock investment universe (Alpha Brands Consumer Spending Index) and no matter the environment, we should always have great brands to invest in. After seeing how 2020 played out, we simply cannot imagine being forced to stay in a style-box to own companies or industries that do not seem well positioned for the current environment. As our goal is to provide attractive long-term returns while offering investors a smoother ride along the way, having as much flexibility as possible is the only way to survive and thrive in a chaotic market.
Volatility management is a key differentiator of our investment process. When uncertainty & volatility arrive, we like to add a tactical trading component to the investment process to take advantage of irrational markets. The combination of long-term investing and active trading combined with the ability to hold excess cash reserves allowed our team to navigate the turmoil earlier this past year; be opportunistic into the panic bottom of late March; and generate a solid excess return in 2020. The flexibility of our strategy is a key to our ability to manage through multi-month periods of high volatility. I’m not sure there is a better 3-year period to assess a manager’s acumen to manage through good times and bad than the last 3 years.
2021: A mean reversion back towards normal.
As stated above, the Fund performed exceptionally well in a year when the typical consumer stock lagged badly. Below is a chart of the S&P 500 Index plotted with the Rational Dynamic Brands Fund, the S&P Equal Weighted Consumer Discretionary Index, and the S&P Equal Weighted Consumer Staples Index for 2020. As you can see, the two consumer indices lagged the market rather severely which is quite logical given how badly consumer spending dropped off in March-May of this year. With some parts of the economy back to normal and the hope for vaccine adoption high, there is significant pent-up demand building in a few key segments of household spending. It’s in categories like travel, personal services, physical retail, and social experiences that our excitement is highest for 2021. The most relevant brands serving these industries generated sub-par returns in 2020 but we think 2021 will offer a quite different and positive result.
For more information on what parts of the economy and spending we think have strong snap-back potential, here’s our two-part blog post last December:
Part 1: 2021 – An end to the social gathering recession https://catalyst-insights.com/brands-expert-calls-it-the-social-gathering-recession/
Part 2: 2021 – Massive spending potential could be unleashed https://catalyst-insights.com/2021-massive-spending-potential-could-be-unleashed/
In the first part of 2021, we expect to see a continuation of the short-term volatility spasms we saw in 2020 until we get more clarity on vaccines, election run-offs, and stimulus longevity. The economy will not heal in a linear fashion. We expect it to be lumpy, so equity markets could respond in-kind for a while longer. On the positive side, Central Banks around the world are about as accommodative as they have ever been and fiscal stimulus efforts appear to be evolving, albeit slowly. We are watching the 20 level on the Volatility Index (VIX) for clues that a broad-based,up-trending market will return. Once the VIX Index falls below the magic 20 level, more systematic investors with massive amounts of investment capital and a rabid hunger to get more invested, will get more engaged in stocks. The combination of these investors, the cash on the sidelines currently and the wall of fixed income money that’s seeking a better potential return with rates close to zero, we expect strong demand for equities in 2021 even if we see short term drawdowns along the way.
Over the last few months, we have been trimming or selling some of our big winners in 2020 and have begun building positions across important laggard spending categories like travel, physical retail, healthcare, mobility, and social gathering. The Fund is more balanced across spending categories than it has ever been. Below, we have highlighted what consumption themes the Fund’s current holdings give investors access to. In aggregate, the current portfolio of Iconic Brands spans all market caps (small, mid, large), style boxes (value, core, growth) and
geographies (U.S., developed international and emerging markets) for a diverse collection of great businesses indeed.

For now, we are avoiding many of the most crowded and expensive stocks. Many of which were last year’s top winners. Why? Many of these great companies have market valuations that reflect a decade or more of perfect business execution. For more information on what we see for this group of expensive, popular stocks, here’s our last blog post of 2020 entitled, “2021: A Consumption Trend Change”. https://catalyst-insights.com/2021-consumption-trend-change/
The Fund’s portfolio as we enter 2021:
| 1. | Mega Brands – the Mega Brands basket will typically be the largest portion of the Fund. These are many of the world’s most admired companies. They are often highly recognized businesses with strong and stable business models and high quality balance sheets. Think of this core group of brands as being the chassis of the car, or the foundation of a house. This group of industry leaders typically makes up approximately 70% of the total portfolio. Here is a snapshot of the blue chip, mega brands our investors have a small ownership stake in: Amazon, Apple, Tencent (China), Nike, Lululemon, Nintendo, Microsoft, Costco, Mastercard, Google, Visa, Salesforce, Chipotle, Spotify, Shopify, Target, Adidas, Johnson & Johnson, Sherwin Williams, CBRE (global real estate), PayPal, Goldman Sachs, Ferrari, Pfizer, and United Healthcare. |
| 2. | Innovator/Disruptor Brands – these great companies are often satellite positions around the Mega Brands names but could offer significantly more upside potential because they are disrupting their industries; offer superior products and services; and have much higher top-line revenue growth along with other impressive financial metrics. This group of innovators will typically make up approximately 15-30% of the total |
| | portfolio. The current roster of innovators in the Fund are: Rocket Companies (mortgages), RH (Restoration Hardware), Mercado Libre, Teledoc, Nvidia (semiconductors), Square, Zoom, Airbnb, Jumia (Africa e-commerce), Afterpay (buy now, pay in installments provider), and Uber. |
| 3. | Tactical, Contrarian Brands – every so often an investment opportunity arises because of a positive business or industry inflection, mean reversion, or a deeply oversold trading opportunity. The timing of these opportunities is always difficult to predict, but, when they are presented to us, we enjoy taking advantage of a market that does not see what we see. Tactical opportunities will typically be roughly 10-20% of the total portfolio. The brands owned here are: Southwest Airlines, Shake Shack, Medifast (weight loss nutrition), Royal Caribbean, Norwegian Cruises, Hilton, Marriot, Expedia, Booking Holdings, Live Nation, Capri Holdings (Michael Kors, Jimmy Chu, Versace), and medical science leader Regeneron. |
Reminder: the holdings and allocation weights will change over time according to the opportunities we see in the marketplace.
We thank you for your loyalty to the Dynamic Brands Fund and for appreciating the value of investing in the $44 trillion global consumption theme.
Sincerely,
David Garff, Eric Clark, and James Calhoun
Portfolio Managers
This report is intended for the Fund’s shareholders. It may not be distributed to prospective investors unless it is preceded or accompanied by the current Fund prospectus. To obtain a prospectus or other information about the Fund, please visit www.RationalMF.com or call 1-800-253-0412. Please read the prospectus carefully before investing.
| (1) | The S&P 500 Value Total Return Index® (“S&P 500 Value TR”) is an unmanaged market-capitalization weighted index consisting of those stocks within the S&P 500 that exhibit strong value characteristics. It uses a numerical ranking system based on four value factors and three growth factors to determine the constituents and their weightings. The S&P 500 Total Return Index® (“S&P 500 TR”) is an unmanaged index generally representing the performance of the broad domestic economy through changes in the aggregate market value of 500 stocks representing all major industries. Indices are unmanaged and, unlike the Fund, are not affected by cash flows. It is not possible to invest directly in an Index. For additional disclosure relating to the S&P 500 Value TR and S&P 500 TR, please see “Additional Disclaimers” in the Fund’s Prospectus. |
4387-NLD-2/24/2021
| Rational Dynamic Brands Fund |
| PORTFOLIO REVIEW (Unaudited) |
| December 31, 2020 |
| |
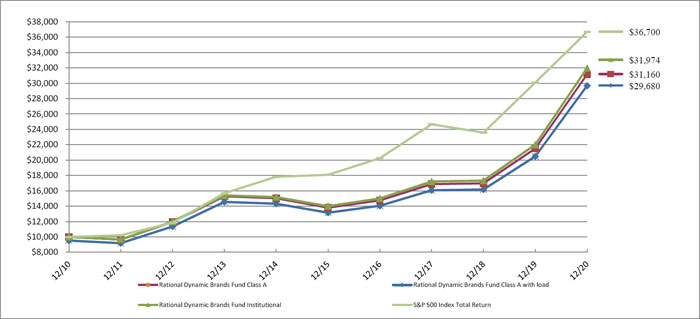
The Fund’s performance figures* for each of the periods ended December 31, 2020, compared to its benchmarks:
| | | Annualized | Annualized | Annualized | Annualized |
| | 1 Year Return | 5 Year Return | 10 Year Return | Since Inception(a) | Since Inception(b) |
| Institutional | 45.28% | 17.97% | 12.33% | 12.30% | N/A |
| Class A | 44.91% | 17.69% | 12.04% | 12.02% | N/A |
| Class A with load | 38.03% | 16.55% | 11.49% | 11.72% | N/A |
| Class C | 43.80% | 16.93% | N/A | N/A | 10.25% |
| S&P 500 Total Return Index (c) | 18.40% | 15.22% | 13.88% | 10.87% | 13.08% |
| | | | | | |
| * | The performance data quoted here represents past performance. Current performance may be lower or higher than the performance data quoted above. Investment return and principal value will fluctuate, so that shares, when redeemed, may be worth more or less than their original cost. The returns shown do not reflect the deduction of taxes that a shareholder would pay on Fund distributions or on the redemptions of Fund shares. Past performance is no guarantee of future results. Performance figures for periods greater than 1 year are annualized. Per the fee table in the Fund’s May 1, 2020 prospectus, the total annual operating expense are 1.46% for Institutional shares, 1.75% for Class A shares and 2.69% for Class C shares before fee waivers. See the financial highlights for current expense ratios. For performance information current to the most recent month-end, please call toll-free 1-800-253-0412. Class A shares are subject to a maximum load of 4.75%. |
Performance information for the period prior to October 2017 does not reflect the Fund’s current strategy and the Fund’s portfolio was not managed by the Fund’s current Sub-Advisor.
| (a) | Inception date is September 27, 2002, for Class A, Institutional and the benchmark. |
| (b) | Inception date is January 2, 2014 for Class C and the benchmark. |
| (c) | The S&P 500 Total Return Index, a registered trademark of S&P Global., Inc., is a market capitalization-weighted index of 500 widely held common stocks. Investors cannot invest directly in an Index. |
Comparison of the Change in Value of a $10,000 Investment
| Top 10 Holdings by Industry | | % of Net Assets | |
| Internet Media & Services | | | 15.6 | % |
| Technology Hardware | | | 10.4 | % |
| Technology Services | | | 10.4 | % |
| E-Commerce Discretionary | | | 8.3 | % |
| Leisure Facilities & Services | | | 8.3 | % |
| Software | | | 7.9 | % |
| Apparel & Textile Products | | | 6.5 | % |
| Retail - Discretionary | | | 6.4 | % |
| Retail - Consumer Staples | | | 4.7 | % |
| Biotech & Pharmaceuticals | | | 3.1 | % |
| Other/Short-Term Investments | | | 18.4 | % |
| | | | 100.0 | % |
| | | | | |
Please refer to the Portfolio of Investments for a more detailed breakdown of the Fund’s assets.
December 31, 2020
Rational Strategic Allocation Fund
Dear Fellow Shareholders,
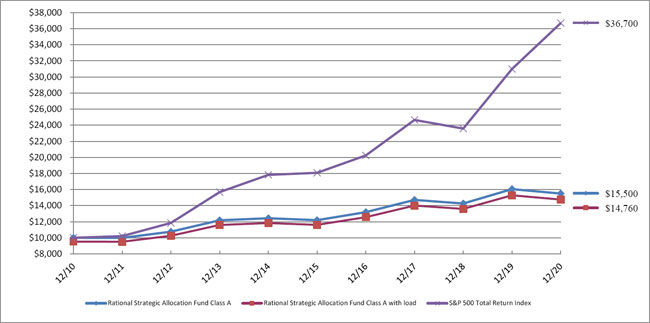
The Rational Strategic Allocation Fund (the “Fund”) seeks current income and moderate appreciation of capital by implementing a distinct “index plus” strategy that provides investors exposure to a non-traditional fixed income portfolio with an S&P 500 Index equity overlay. During 2020, the Fund underperformed the S&P 500 Total Return Index (1) with a -3.42% (Class A) return versus +18.40% for the S&P 500 Total Return Index. The Fund benefited from its allocations to fixed income funds. The Fund underperformed its benchmark, however, as a result of taking a defensive position during the year and removing our futures exposure to the S&P 500 for several months.
Investment Strategy
The Fund invests in a portfolio of futures contracts on the S&P 500 Index and income-oriented mutual funds typically representing non-traditional fixed income asset classes. We select underlying funds using a fundamental research process, including a top-down analysis of market conditions and investment category historical performance during various market conditions. We also perform a bottom-up analysis of each potential fund for investment, including investment allocations, investment valuations and characteristics, positioning, historical performance during various market conditions and each fund’s portfolio manager’s outlook. The Fund typically maintains 70% to 100% notional exposure to the S&P 500 Index and 70% to 100% notional exposure to the fixed income portfolio.
Fund Performance
During 2020, the Fund returned -3.42% (Class A), trailing its S&P 500 benchmark’s return of +18.40%. Towards the end of 2019, the fund underwent a change in its methodology, shifting the focus of the Fund to an “index plus” strategy, as described above. On January 10th, we fully entered into our futures position related to the S&P 500. We remained at our target allocation until the end of February, which is when the effects of the COVID-19 outbreak were beginning to be felt within the U.S. equity markets. At that time, we felt it was best for our shareholders to assume a defensive position by reducing our futures position amid all of the uncertainty in the equity market. We believed the risk associated with remaining fully allocated was too high and felt it was best to remain defensive until we had a clearer picture of how the pandemic would affect markets. We maintained this defensive position until the beginning of September, at which time we reallocated back to our target notional exposure. As a result of our defensive positioning, we missed a lot of the upside of the equity market recovery, but we did position the Fund to avoid significant losses had the stock market returns reflected the reality of what was occurring throughout the summer, something we believed was prudent in a balanced allocation strategy. Our fixed income sleeve of the portfolio held up well throughout the pandemic, recovering nicely across the board after initial dislocations in pricing related to our RMBS strategies in March.
The majority of the holdings performed to our expectations. The top performing funds held in the portfolio during 2020 were: The Rational/Pier 88 Convertible Securities Fund (PBXIX +17.09%), the Catalyst Insider Income Fund (IIXIX +6.57%), and the Catalyst Enhanced Income Fund (EIXIX +6.16%). The weakest performing funds held in the portfolio during 2020 were: The AlphaCentric Income Opportunities Fund (IOFIX -10.58%) and the Rational Special Situations Fund (RFXIX +2.83%).
The Fund’s total annualized returns through December 31, 2020 as compared to the S&P 500 Total Return Index were as follows:
| | 1 Year | 3 Years | 5 Years | Since Inception
(07/30/09) |
| Class A | -3.42% | 1.75% | 4.92% | 5.42% |
| Class A with Sales Charge | -8.01% | 0.11% | 3.90% | 4.97% |
| S&P 500 Total Return Index (1) | 18.40% | 14.18% | 15.22% | 14.75% |
The Fund’s maximum sales charge for Class “A” shares is 4.75%. Investments in mutual funds involve risks. Performance is historic and does not guarantee future results. Investment return and principal value will fluctuate with changing market conditions so that when redeemed, shares may be worth more or less than their original cost. Current performance may be lower or higher than the performance data quoted. To obtain the most recent month-end performance information or the Fund’s prospectus please call the Fund, toll free at 1-800-253-0412. You can also obtain a prospectus at www.RationalMF.com.
Sincerely,
David Miller
Portfolio Manager
This report is intended for the Fund’s shareholders. It may not be distributed to prospective investors unless it is preceded or accompanied by the current Fund prospectus. To obtain a prospectus or other information about the Fund, please visit www.RationalMF.com or call 1-800-253-0412. Please read the prospectus carefully before investing.
| (1) | The S&P 500 Total Return Index by Standard & Poor’s Corp. is a capitalization-weighted index comprising 500 issues listed on various exchanges, representing the performance of the stock market generally. Please note that indices do not take into account any fees and expenses of investing in the individual securities that they track, and individuals cannot invest directly in any index, although individuals may invest in exchange traded funds or other investment vehicles that attempt to track the performance of an index. The Rational Strategic Allocation Fund may or may not purchase the types of securities represented by the S&P 500 Total Return Index. |
4338-NLD-2/16/2021
| Rational Strategic Allocation Fund |
| PORTFOLIO REVIEW (Unaudited) |
| December 31, 2020 |
| |
The Fund’s performance figures* for each of the periods ended December 31, 2020, compared to its benchmarks:
| | | Annualized | Annualized | Annualized | Annualized |
| | 1 Year Return | 5 Year Return | 10 Year Return | Since Inception(a) | Since Inception(b) |
| Institutional | (3.19)% | N/A | N/A | N/A | 4.93% |
| Class A | (3.42)% | 4.92% | 4.48% | 5.42% | N/A |
| Class A with load | (8.01)% | 3.90% | 3.97% | 4.97% | N/A |
| Class C | (4.13)% | N/A | N/A | N/A | 3.91% |
| S&P 500 Total Return Index (c) | 18.40% | 15.22% | 13.88% | 14.75% | 15.81% |
| | | | | | |
| * | The performance data quoted here represents past performance. Current performance may be lower or higher than the performance data quoted above. Investment return and principal value will fluctuate, so that shares, when redeemed, may be worth more or less than their original cost. The returns shown do not reflect the deduction of taxes that a shareholder would pay on Fund distributions or on the redemptions of Fund shares. Past performance is no guarantee of future results. Performance figures for periods greater than 1 year are annualized. Per the fee table in the Fund’s May 1, 2020 prospectus, the total annual operating expense are 2.46% for Institutional shares, 2.83% for Class A shares and 3.50% for Class C shares before fee waivers. See the financial highlights for current expense ratios. For performance information current to the most recent month-end, please call toll-free 1-800-253-0412. Class A shares are subject to a maximum load of 4.75%. |
Performance information for the period prior to January 2016 does not reflect the Fund’s current strategy and the Fund’s portfolio was not managed by the Fund’s current Sub-Advisor.
| (a) | Inception date is July 30, 2009 for Class A and the benchmark. |
| (b) | Inception date is May 31, 2016 for Class C, Institutional and the benchmark. |
| (c) | The S&P 500 Total Return Index, a registered trademark of S&P Global., Inc., is a market capitalization-weighted index of 500 widely held common stocks. Investors cannot invest directly in an Index. |
Comparison of the Change in Value of a $10,000 Investment
| Top Holdings by Asset Type ^ | | % of Net Assets | |
| Mutual Funds | | | 84.8 | % |
| Other/Short-Term Investments | | | 15.2 | % |
| | | | 100.0 | % |
| | | | | |
| ^ Does not include derivatives in which the Fund invests. |
| | | | | |
Please refer to the Portfolio of Investments for a more detailed breakdown of the Fund’s total investments.
December 31, 2020
Rational/ReSolve Adaptive Asset Allocation Fund
Dear Fellow Shareholders,
The Rational/ReSolve Adaptive Asset Allocation Fund (“the Fund”) commenced trading on March 16th, 2018, when ReSolve Asset Management officially replaced the previous manager as sub-advisor.
ReSolve’s Adaptive Asset Allocation1 methodology uses proprietary quantitative and machine learning innovations that emphasize characteristics such as, but not limited to, total return momentum, trends, seasonal patterns, carry measures, mean reversion and others, while simultaneously maximizing diversification based on changing estimates of volatility and correlations across a global universe of futures markets consisting of stock and bond indices, commodities, and currencies.
Portfolio Review
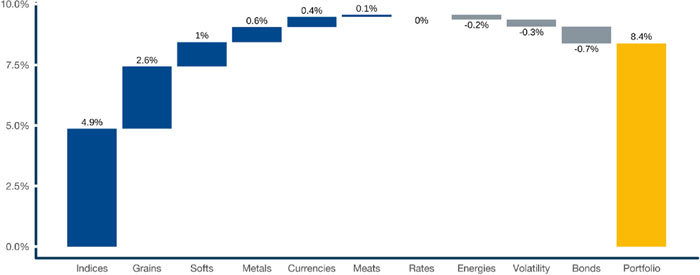
The Fund endured the year’s most intense period – from January through August – under a strategy design informed by an ensemble of short-, medium- and longer-term factor sleeves. While the systems that focused on shorter time frames navigated February and March quite well, other systems struggled with the unprecedented speed during the acute phase of the pandemic induced crash. This dynamic also played out during the aggressive recovery of April and May. Despite these challenges, the strategy managed to produce a small +0.65% gain for the year.
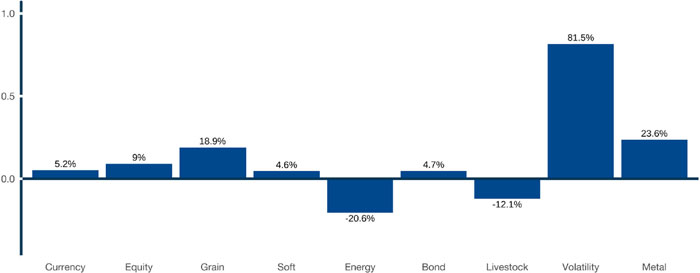
Bonds, led by 10-year US Treasuries and German Bunds, were the main source of positive returns. Grains also offered some ballast, mainly through soymeal and soybeans, while softs (cocoa and coffee), metals (copper and gold) and meats (lean hogs) provided marginal gains. Most losses came from currencies (mainly the Canadian dollar and Sterling), equity markets (Canadian TSX, Aussie 200, German DAX and UK FTSE100) and energies (crude oil, RBOB and heating oil).
| 1 | For our 8-year track record, please visit: https://investresolve.com/strategies/resolve-adaptive-asset-allocation-cad-8-volatility/ |
Figure 1. 2020 Return Attribution
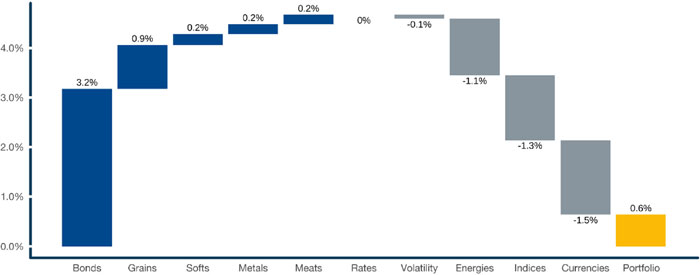
Source: ReSolve Asset Management. Results may differ due to rounding. Performance is expressed in USD. Strategy attribution is a best efforts approximation, net of all applicable borrowing costs, fees and Fund accruals for the period. Indicated returns of one year or more are annualized. Past performance is not indicative of future performance.
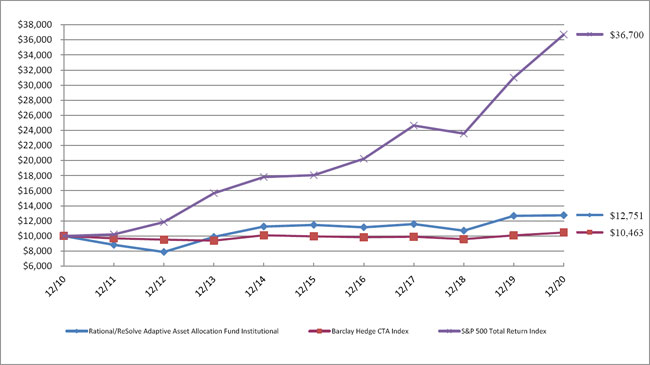
The Fund’s total annualized returns through December 31, 2020 as compared to the BarclayHedge CTA Index(2) and the S&P 500 Total Return Index were as follows:
| | 1 Year | 3 Years | 5 Years | 10 Years | Since Inception (3) |
| Class I | 0.65% | 3.22% | 2.14% | 2.46% | 5.97% |
| BarclayHedge CTA Index (2) | 3.66% | 1.82% | 0.98% | 0.44% | 4.19% |
| S&P 500 Total Return Index (1) | 18.40% | 14.18% | 15.22% | 13.88% | 10.21% |
| Class A | 0.38% | 2.97% | n/a | n/a | 5.70% |
| Class C | -0.35% | 2.21% | n/a | n/a | 4.93% |
| Class A w/ Sales Charge | -5.37% | 0.96% | n/a | n/a | 5.70% |
| | | | | | |
The Fund’s maximum sales charge for Class “A” shares is 5.75%. Investments in mutual funds involve risks. Performance is historic and does not guarantee future results. Investment return and principal value will fluctuate with changing market conditions so that when redeemed, shares may be worth more or less than their original cost. Current performance may be lower or higher than the performance data quoted. To obtain the most recent month-end performance information or the Fund’s prospectus please call the Fund, toll free at 1-800-253-0412. You can also obtain a prospectus at www.RationalMF.com.
The Fund acquired all of the assets and liabilities of Chesapeake Fund, LLC (the “Predecessor Fund”) in a tax free reorganization on December 31, 2016. In connection with this acquisition, shares of the Predecessor Fund were exchanged for Institutional Shares of the Fund. At the time of the reorganization, the Predecessor Fund had an investment objective and strategies that were, in all material respects, the same as those of the Fund, and was managed in a manner that, in all material respects, complied with the investment guidelines and restrictions of the Fund. Effective February 27, 2018, the Fund’s investment strategy changed, and a new Sub Advisor replaced the prior sub-advisor. Consequently, prior performance may not reflect the Fund’s current operations.
Risk Management at a Glance
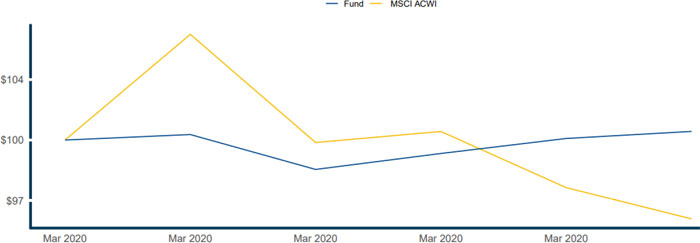
The Fund began the year with a large exposure to global risk assets – global equities in particular – as it transitioned away from dominant positions in US and global sovereign bonds that dominated in 2019. This allocation led to an early outperformance (+14.6%) against the MSCI All Country World Index (ACWI, +2.2%) through February 20th. When news of the global pandemic finally caught up with equity markets, the abrupt selloff led the MSCI ACWI to a -33.5% peak-to-trough loss, while the Fund experienced a more manageable -19.9% loss over the same period. Gains accumulated by the Fund up until that moment were particularly important to soften the overall blow, as the strategy was never down by more than -8% during the pandemic-led crash in the first quarter.
To better understand how the strategy navigated the fastest market correction in history, it is useful to examine three distinct moments:
| ● | First, the initial shock phase – from the Fund’s peak on February 19th to February 28th the Fund exhibited a very similar correction to that of the MSCI ACWI, losing approximately -10% and -11%, respectively. The unprecedented speed of the first leg of the correction posed a challenge given our relative higher weight to equities. |
Figure 2. Fund vs MSCI ACWI Returns – February 19th – 28th, 2020
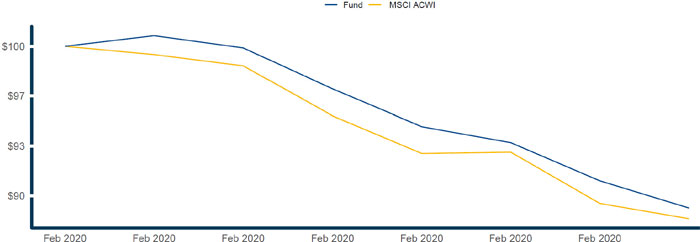
Source: ReSolve Asset Management. Data from CSI. PAST PERFORMANCE IS NOT INDICATIVE OF FUTURE RESULTS.
| ● | Second, the volatility adjustment phase – from February 28th to March 16th, the strategy dramatically reduced overall exposure in order to control portfolio volatility and avoided a significant portion of the losses experienced by global equities during the most acute phase of the selloff (losing -8.1% vs the ACWI’s - 21.3%). Even though the portfolio was still in the midst of rebalancing into the safety of gold and sovereign bonds, the reduction in exposure by itself led to a fraction of the losses experienced by risk assets over the same period. |
Figure 3. Fund vs MSCI ACWI Returns – February 28th – March 16th, 2020
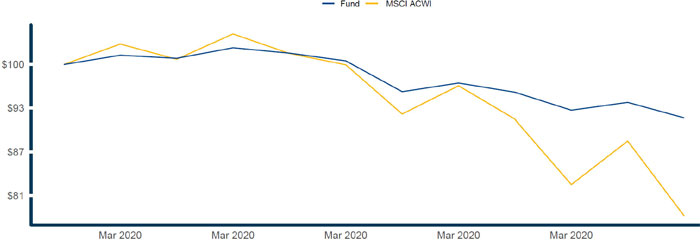
Source: ReSolve Asset Management. Data from CSI. PAST PERFORMANCE IS NOT INDICATIVE OF FUTURE RESULTS.
| ● | The third and final phase of the correction – from March 16th to March 23rd, the Fund had transitioned into a more neutral asset-allocation stance. This allowed the strategy to produce a small positive return of +0.5% while global stocks endured yet another -4.4% downward leg. |
Figure 4. Fund vs MSCI ACWI Returns – March 16th – 23rd, 2020
Source: ReSolve Asset Management. Data from CSI. PAST PERFORMANCE IS NOT INDICATIVE OF FUTURE RESULTS.
Despite the unprecedented speed of the market crash in late February and March, the strategy’s risk management protocols responded precisely as they were designed, quickly reducing exposure while simultaneously shifting its allocation towards asset classes that offered safety (and even positive returns). Had equity markets continued to spiral downwards, the Fund was positioned defensively, and had the potential to deliver material gains.
Previous Recoveries
V-shaped recoveries are particularly challenging to risk management protocols, as evidenced by the Fund’s performance since mid-March. Rebalancing towards a more neutral stance prevented the Fund from enduring what might have been a significant loss, but as a result returns temporarily flat-lined, while equities (particularly mega-cap US companies) rallied aggressively.
This is not the first time we have seen this lag. In December 2018, the strategy protected and profited during the sharp -14% market correction as the underlying indicators had produced a relatively neutral allocation. Back then, flattish performance (slightly upward trending, in reality) was positively perceived in comparison to the sell-off in global equities (as can be seen in the first section of Figure 5 below).
Figure 5. Fund vs MSCI ACWI Returns – December 1st, 2018 – December 31st, 2020
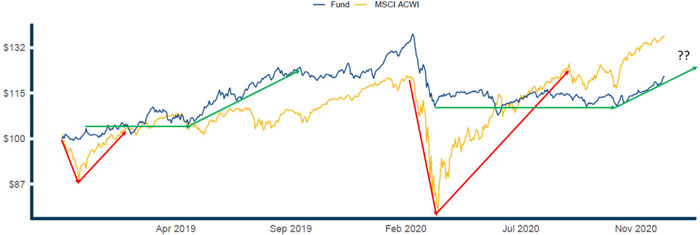
Source: ReSolve Asset Management. Data from CSI. PAST PERFORMANCE IS NOT INDICATIVE OF FUTURE RESULTS.
Diversification works, even when you would rather it didn’t.
Because of the larger magnitude and unprecedented velocity of this most recent event, the consolidation period has lasted commensurately longer. The strategy moved away from its more defensive positions and took on more risk in Q3, rising approximately 9 percent in the final two months of the year.
It is useful to remember that the strategy is directional in nature and has a low, yet conditional, correlation to global equity markets. This means that at times we may profit when stocks crash, but in other instances we may also endure some of that pain, depending on our asset-allocation mix coming into these events.
From a diversification standpoint, the Fund remains an attractive component to any portfolio that seeks a risk balanced exposure to traditional and non-traditional global asset classes while maintaining a low correlation to global equity markets in the medium-term. In particular, given the wide variety of global commodities markets in its investment universe, the Fund may be well positioned to take advantage of any shift toward non-US equity markets and inflation assets in the coming months and years.
Figure 6. Daily Correlation between the Fund and MSCI ACWI – December 1st, 2018 – December 31st, 2020
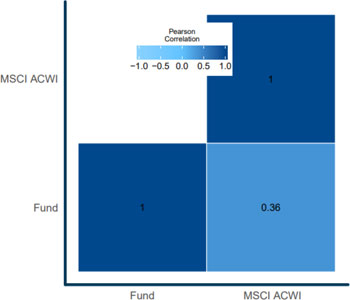
Source: ReSolve Asset Management. Data from CSI. PAST PERFORMANCE IS NOT INDICATIVE OF FUTURE RESULTS.
Research and Innovation
“When the facts change, I change my mind. What do you do, sir?” – John Maynard Keynes
ReSolve has always based its investment philosophy on two overarching principles: relentless risk management and seeking excess returns (i.e. alpha) in areas where most investors cannot participate, whether due to structural limitations or lack of expertise. The notion of avoiding the crowds guided us, from our founding days, to focus on asset-classes as opposed to security selection – which also served a meaningful role in risk management given the structurally diverse nature of global asset-classes.
Our pursuit of alpha, initially through the herding behavior – represented by the Trend and Momentum factors – and then additionally via other well-established edges, always sought diverse ways of measuring and harvesting these phenomena. Ensemble methods, considered best practices in fields as diverse as operations research and data science, triangulate across multiple datapoints with the explicit goal of finding signals that are broadly correct, while avoiding reliance on any single measure that could be specifically wrong.
While this approach has served us well for several years, we had been noticing a decrease in the availability of excess return in these factors in the last few years, even when using ensembles. This was most likely due to the overgrazing of these edges, and we found evidence that pointed to a massive increase in the amount of dollars chasing these strategies2. It also became obvious to us, and possibly to many of you, that the speed and intensity of movements in global asset classes has increased significantly.
| 2 | For more on this, please watch this short video: https://www.youtube.com/watch?v=GO8bvCJNxYE&t=235s |
Our research team has spent the better part of the last two years developing state-of-the-art technology to improve our ability to generate consistent returns in this environment, while effectively managing the risk of sustained losses. We have developed a machine learning engine that takes a bespoke approach to analyzing patterns in individual asset-classes while enhancing portfolio agility and flexibility.
Since these improvements were rolled out in the Fund at the beginning of September; it is useful to highlight the Fund’s performance during the final quarter of the year:
Figure 7. Q4 Return Attribution
Source: ReSolve Asset Management. Results may differ due to rounding. Performance is expressed in USD. Strategy attribution is a best efforts approximation, net of all applicable borrowing costs, fees and Fund accruals for the period. Indicated returns of one year or more are annualized. Past performance is not indicative of future performance.
Though the lion’s share of fourth quarter gains stemmed from the explosive rally in equities, both international (led by the Aussie 200, Italy’s MIB, Hong Kong’s Hang-Seng, and Japanese Nikkei and Topix indices) and US (S&P 500 & Nasdaq), the strategy drew returns from a diverse group of asset-classes. Grains (soy meal, soybeans, corn and wheat), softs (cotton and cocoa), metals (copper) and currencies (Swiss Franc, Euro and Japanese Yen) also offered a meaningful contribution.
General Market Review
It was a year like no other in living memory. The outbreak of a new coronavirus in a central Chinese province during the final months of 2019 morphed into a global pandemic of proportions not since seen the 1918 Spanish Influenza. As cases spread through all corners of the globe and threatened to overwhelm healthcare systems, major cities – and in some cases entire countries – were placed under varying forms of lockdown. By the early days of March much of the planet had come to a halt. Airports, retail centers and most communal spaces became practically (and in some cases completely) deserted. The mass shutdown of businesses – many of which will never reopen – brought about a huge spike in unemployed, a collapse in inflation and growth, and the deepest global recession since World War II3.
The ensuing correction in global risk assets was comparable to, and in some instances exceeded, the throes of 2008’s Global Financial Crisis. Equity markets experienced their fastest 30% decline in history4. Emerging Markets were
| 3 | https://www.worldbank.org/en/news/press-release/2020/06/08/covid-19-to-plunge-global-economy-into-worst-recession-since-world-war-ii |
| 4 | https://www.cnbc.com/2020/03/23/this-was-the-fastest-30percent-stock-market-decline-ever.html |
amongst the worst affected, especially given their dependency on commodities, which suffered some of the largest drawdowns. The most remarkable story was in crude oil, where a price war aggravated a backdrop of plummeting demand and limited storage capacity, leading to the implausible episode of negative prices for a few North American energy contracts. Investors sought refuge in the US dollar, the Japanese Yen, the Swiss Franc and a handful of sovereign bonds as most yields contracted to all-time lows. Gold also offered protection, though other precious metals sustained double-digit losses. The VIX (CBOE Volatility Index) rose approximately fourfold and closed at almost 83 on March 16th, its highest recorded level.
Policymakers responded with colossal firepower, with an almost USD 3 trillion fiscal package from the US and trillions more from European and Asian economies. The IMF estimated, as of the end of May, that approximately USD 9 trillion had been deployed by governments around the world in emergency relief. Central banks also mustered their collective toolkits, bringing (or keeping) policy rates close to zero and restarting (or expanding) their quantitative easing programs. In addition, the Fed joined the ECB and Bank of Japan in buying corporate bonds in the secondary market through a special purpose vehicle – essentially circumventing the law in support of credit markets. The definition of whatever it takes increased by a few orders of magnitude.
But few anticipated what followed. Vast government stimuli combined with a surge in demand for services catering to the stay-at-home economy – from online retail and social media, to video conferencing and streaming – turned the fastest bear market in history into the shortest. Led by its dominant technology sector, the S&P500 rallied 55% and broke new highs by August. What many believed would be another Great Depression became the shortest recession in US history. History neither repeated nor rhymed.
Though global asset classes continued their recovery into the very end of the year, the ride was anything but smooth. After a quiet summer, the virus resurged in September and new restrictive measures were once again imposed across much of the world. This resulted in an increasingly bifurcated, K-shaped recovery, where large companies – and much of their now remote workforce – were able to adapt (and even thrive), while small businesses, gig-workers and much of the general population appeared largely left behind.
A highly polarized and contentious US presidential election was yet another source of volatility, culminating in the victory of Democrat Joe Biden over the Republican incumbent Donald Trump. Geopolitical tensions between the US and China also intensified across multiple fronts including corporate espionage, the crackdown in Hong Kong, and accusations over the origins and fallout of the pandemic.
The final two months of the year saw successful trials followed by approvals of several different vaccines, an extraordinary feat of ingenuity and collective effort, especially given the speed with which it was accomplished. A massive rally in risk assets ensued, led by raw materials (particularly energies) and global equities, some of which had their largest monthly gains in over 30 years. By the time the long awaited additional fiscal relief package was approved by the US Congress and an initial Brexit trade deal was signed, they were basically icing on the cake.
Figure 8. Global Asset Classes – Performance per Sector in 2020
Source: ReSolve Asset Management. Data from CSI. Each sector is built using the following futures contracts, assembled in inverse-volatility weight:
Currency: Australian Dollar, British Pound, Canadian Dollar, Euro, Japanese Yen, New Zealand Dollar, Swiss Franc
Equity: CAC40, DJIA, AEX, S&P 500, DAX, Hang Seng, IBEX, MSCI EM, SGX Nifty, NASDAQ, Nikkei 225, S&P/TSX 60, Russell 2000, FTSE/MIB, Topix, EStoxx 50, Aussie 200, ChinaA50, FTSE
Grain: Bean Oil, Corn, Mill Wheat, KC Wheat, Soybean, Soy Meal, Wheat
Soft: Cocoa, Cotton, Coffee, Sugar
Energy: WTI Crude, Brent Crude, UK Nat Gas, Heating Oil, C Emissions, Nat Gas, Gasoil, RBOB
Bond (Sovereigns): Canadian 10y, US 5y, UK Gilts, Italian 10y, Japanese 10y, French 10y, German 5y, German 10y, US 10y, German LT, US 30y
Livestock: Feeder Cattle, Live Cattle, Lean Hogs
Volatility: Mini VSTOXX and VIX
Metal: Gold, Copper, Platinum, Silver
Figure 9. 2020 Asset-Class Highlights
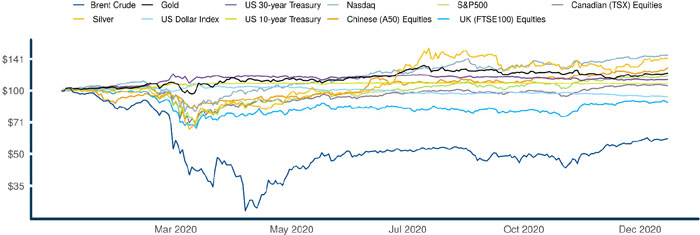
Source: ReSolve Asset Management. Data from CSI, using continuous futures contracts.
| | Nasdaq
100 | Silver | Chinese
(A50)
Equities | Gold | S&P500 | US 30-year
Treasury | US
10-year
Treasury | Canadian
(TSX)
Equities | US Dollar
Index | UK
(FTSE100)
Equities | Brent Crude |
| Annualized Return | 45.78% | 40.62% | 27.66% | 20.17% | 17.00% | 12.56% | 7.96% | 4.95% | -6.01% | -12.14% | -39.84% |
| Annualized Volatility | 35.10% | 45.00% | 23.50% | 20.80% | 33.70% | 12.30% | 5.00% | 33.40% | 7.30% | 28.70% | 64.90% |
| Maximum Peak to Trough Loss | -28.60% | -37.80% | -19.00% | -14.00% | -34.20% | -9.50% | -3.80% | -35.60% | -13.40% | -35.10% | -74.00% |
Source: ReSolve Asset Management. Data from CSI, using continuous futures contracts.
Do Valuations Still Matter?
While markets rose steadily through December, a new and more contagious strain of the coronavirus was discovered, leading to renewed and, in some cases, stricter lockdown measures in many countries. Not only does it remain unclear whether the various vaccines are effective against this new mutation (several labs have claimed “confidence” that they will be), but questions also arose whether inoculated individuals might be protected against severe illness but could still transmit the virus. Tensions also increased on the geopolitical front as reports emerged of a massive cybersecurity breach across multiple US government agencies. According to experts, the highly sophisticated nature of the attack bears the signs of state-sponsored espionage and appears to have lasted for several months.
The aggressive recovery and performance of equity markets in 2020 has shocked many investors, some of whom have described this as the biggest asset bubble in history. Others have retorted that this is just the natural consequence of the actions of policymakers; not only eliminating any meaningful opportunity cost for capital (left with no alternative but to chase stocks higher) but also encouraging increased risk-taking by delivering on the promise to always be there to rescue shareholders (the infamous Fed Put).
Some observers have also pointed to the relentless growth of passive investment vehicles, many of which track popular market-cap weighted indices, and their simplistic reaction function: buy stocks when money flows in, sell when it flows out. This price-insensitive dynamic leads to an overallocation to ever-larger mega-cap stocks (think Big Tech), while little to no capital is directed to smaller, and largely cheaper, peers. As money continues to flow towards these index-tracking funds, and away from active equity managers (many of whom would tend to buy the cheap and sell/short the expensive companies), the gap between prices and what historically have been considered sound, long-term fundamentals, may continue to widen.
Yet there are signs that markets may have begun to price in some of these imbalances and underlying risks in the system. A plunging US dollar and strong appreciation of gold and other precious metals – not to mention the meteoric rise in Bitcoin and other crypto-assets – are suggestive of concerns that the US and other countries might seek to debase their currencies in order to inflate away an unsustainable global debt-load. Meanwhile, the possibility of a major regulatory clampdown on both sides of the Atlantic hangs over technology giants, which could overwhelm equity markets.
As elevated uncertainty continues to set the tone and investors grow more accustomed to prices divorced from valuations, they should consider whether there are any risks beyond the powers of almighty policymakers.
Sincerely,
ReSolve Asset Management
Fund Sub-Advisor
This report is intended for the Fund’s shareholders. It may not be distributed to prospective investors unless it is preceded or accompanied by the current Fund prospectus. To obtain a prospectus or other information about the Fund, please visit www.RationalMF.com or call 1-800-253-0412. Please read the prospectus carefully before investing.
| (1) | The S&P 500 Total Return Index by Standard & Poor’s Corp. is a capitalization-weighted index comprising 500 issues listed on various exchanges, representing the performance of the stock market generally. Please note that indices do not take into account any fees and expenses of investing in the individual securities that they track, and individuals cannot invest directly in any index, although individuals may invest in exchange traded funds or other investment vehicles that attempt to track the performance of an index. The Rational Adaptive Asset Allocation Fund may or may not purchase the types of securities represented by the S&P 500 Total Return Index. |
| (2) | The Barclay Hedge CTA Index is a leading industry benchmark of representative performance of commodity trading advisors. There are currently 510 programs included in the calculation of the Barclay CTA Index for 2020. The Index is equally weighted and rebalanced at the beginning of each year. |
| (3) | Inception: Institutional 02/01/1994, Class A & C 09/30/2016. Performance shown before 09/30/2016 is for the Fund’s predecessor, the Rational Dynamic Momentum Fund. |
4183-NLD-1/27/2021
| Rational/ReSolve Adaptive Asset Allocation Fund |
| PORTFOLIO REVIEW (Unaudited) |
| December 31, 2020 |
| |
The Fund’s performance figures* for each of the periods ended December 31, 2020, compared to its benchmarks:
| | | Annualized | Annualized | Annualized | Annualized |
| | 1 Year Return | 5 Year Return | 10 Year Return | Since Inception(a) | Since Inception(b) |
| Institutional (c) | 0.65% | 2.14% | 2.46% | N/A | 5.97% |
| Class A | 0.38% | N/A | N/A | 2.25% | N/A |
| Class A with load | (5.37)% | N/A | N/A | 0.83% | N/A |
| Class C | (0.35)% | N/A | N/A | 1.53% | N/A |
| S&P 500 Total Return Index (d) | 18.40% | 15.22% | 13.88% | 16.05% | 10.21% |
| Barclay Hedge CTA Index (e) | 3.66% | 0.98% | 0.44% | 2.38% | 4.19% |
| | | | | | |
| * | The performance data quoted here represents past performance. Current performance may be lower or higher than the performance data quoted above. Investment return and principal value will fluctuate, so that shares, when redeemed, may be worth more or less than their original cost. The returns shown do not reflect the deduction of taxes that a shareholder would pay on Fund distributions or on the redemptions of Fund shares. Past performance is no guarantee of future results. Performance figures for periods greater than 1 year are annualized. Per the fee table in the Fund’s May 1 , 2020 prospectus, the total annual operating expense are 2.45% for Institutional shares, 2.73% for Class A shares and 3.50% for Class C shares before fee waivers. See the financial highlights for current expense ratios. For performance information current to the most recent month-end, please call toll-free 1-800-253-0412. Class A shares are subject to a maximum load of 5.75%. |
Performance information for the period prior to February 2018 does not reflect the Fund’s current strategy and the Fund’s portfolio was not managed by the Fund’s current Sub-Advisor.
| (a) | Inception date is September 30, 2016 for Class A, Class C and the benchmarks. |
| (b) | Inception date is February 28, 1994 for Institutional and the benchmarks. |
| (c) | The Fund acquired all of the assets and liabilities of Chesapeake Fund LLC (the “Predecessor Fund”) in a tax-free reorganization on September 30, 2016. In connection with this acquisition, shares of the Predecessor Fund were exchanged for Institutional shares of the Fund, so the Predecessor Fund became the Institutional shares of the Fund. The Fund’s investment objective, policies and guidelines are, in all material respects, equivalent to the Predecessor Fund’s investment objectives, policies and guidelines. The Predecessor Fund commenced operations on February 28,1994. Updated performance information will be available at no cost by calling 1-800-253-0412 or visiting the Fund’s website at www.RationalMF.com. |
| (d) | The S&P 500 Total Return Index, a registered trademark of S&P Global., Inc., is a market capitalization-weighted index of 500 widely held common stocks. Investors cannot invest directly in an Index. |
| (e) | The Barclay Hedge CTA Index is a leading industry benchmark of representative performance of commodity trading advisors. |
Comparison of the Change in Value of a $10,000 Investment
| Holdings by Asset Type ^ | | % of Net Assets | |
| Short-Term Investments | | | 89.7 | % |
| Other/Cash & Equivalents | | | 10.3 | % |
| | | | 100.0 | % |
| | | | | |
| ^ Does not include derivatives in which the Fund invests. |
| | | | | |
Please refer to the Consolidated Portfolio of Investments for a more detailed breakdown of the Fund’s assets.
December 31, 2020
Rational/Pier 88 Convertible Securities Fund
Dear Fellow Shareholders,
The Rational/Pier 88 Convertible Securities Fund (the “Fund”) seeks total return consisting of capital appreciation and income, offering a “call option” on fast growing businesses by investing primarily in convertible securities, which offer equity participation with the added benefit of a bond floor component. The Fund maintains an average investment grade rating with the goal of providing additional downside risk management The Pier 88 approach to managing the convertible bond asset class can be characterized by the word “balance”. We endeavor to take a balanced view of risk versus reward. The team is cognizant that all investments present a plethora of risk including macroeconomic, market and idiosyncratic. Our portfolio remains diversified from a sector, market cap and style perspective.
During 2020, the Fund returned 17.08% versus 7.05% for the ICE BofAML Investment Grade US Convertible Index, and 18.40% for the broader S&P market. The outperformance of over 1,000 basis points to the comparable convertible index was attributable to both sector allocation coupled with security selection. The Fund benefited from overweight positions in technology and consumer discretionary, specifically software, semi-conductors and internet related retail focused sub-sectors. Moreover, the Fund’s material under-weight in utilities and financials added to overall outperformance during the period.
Investment Strategy
The Fund seeks to achieve its objective by investing in convertible securities, which are “hybrid” securities that possess both fixed income and equity characteristics. The convertible securities asset class is often overlooked because of its unique profile and often trades at a discount to its pari-passu fixed income counterparts. As equity sensitivity has been the primary driver of returns of the asset class, our investment team employs an equity analysis perspective for investment decisions.
Fund Performance
Although the Fund benefitted from a healthy yield, the majority of the return came from capital appreciation. 2020 saw strong positive returns for the convertible asset class across multiple industry sectors. Information Technology delivered the strongest positive returns with sub-sectors of software, semi-conductors and internet related retail driving the bulk of stock selection. The Fund benefitted from exposure to fast growing businesses which saw incremental demand in a COVID-19 world, like next generation healthcare testing, ecommerce, on-line education, and work-from-home technologies. We remain bullish on the fundamentals underlying many of our companies; our secular growth stories have years to expand their business, while our blue-chip franchises are well capitalized and possess the stability to fund their yields.
Summary
The Rational/Pier 88 Convertible Securities Fund delivered high double digit returns in 2020. The Fund nicely outperformed the broad fixed income index (The Barclays US Aggregate Bond Index), while slightly lagging the broader S&P (but with 93% of S&P upside) . The majority of the holdings performed to our expectations and the Fund benefitted from rigorous security selection and solid risk management. We believe investing on behalf of others is a privilege we must earn everyday through adherence to a disciplined investment process. Thank you for your support.
Sincerely,
Frank Timons
Portfolio Manager
The Fund’s total annualized returns through 12/31/20 as compared to its benchmark were as follows:
| | QTD | 1 Year | 3 Years | Inception* |
| Class I | 10.41% | 17.08% | 12.54% | 11.64% |
| Barclays US Convertibles TR Index (1) | 0.67% | 7.51% | 5.34% | 5.02% |
| Class A | 10.36% | 16.97% | 12.30% | 11.44% |
| Class C | 10.15% | 16.33% | 11.56% | 10.66% |
| Class A w/ Sales Charge | 5.15% | 11.39% | 10.49% | 10.04% |
| | | | | |
| * | A&C Inception date: 12/06/2019, I Inception date: 03/01/2017 |
Maximum sales charge for Class A is 4.75%. Maximum Deferred Sales Charge of 1.00% on Class C Shares applies to shares sold within 12 months of purchase. The performance data quoted here represents past performance. Current performance may be lower or higher than the performance data quoted above. Investment return and principal value will fluctuate, so that shares, when redeemed, may be worth more or less than their original cost. Past performance is no guarantee of future results. Results shown reflect the waiver, without which the results could have been lower. A fund’s performance, especially for very short periods of time, should not be the sole factor in making your investment decisions. To obtain the most recent month end performance information or the Fund’s prospectus please call 800-253-0412 or visit www.RationalMF.com.
| (1) | Bloomberg Barclays US Convertibles TR Index: An index used to represent the U.S. convertible bond asset class. |
4268-NLD-2/5/2021
| Rational/Pier 88 Convertible Securities Fund |
| PORTFOLIO REVIEW (Unaudited) |
| December 31, 2020 |
| |
The Fund’s performance figures* for each of the periods ended December 31, 2020, compared to its benchmarks:
| | | Annualized | Annualized |
| | 1 Year Return | Since Inception(a) | Since Inception(b) |
| Institutional (c) | 17.08% | N/A | 11.68% |
| Class A | 16.97% | 11.44% | N/A |
| Class A with load | 11.39% | 10.04% | N/A |
| Class C | 16.33% | 10.66% | N/A |
| S&P 500 Total Return Index (d) | 18.40% | 20.20% | 14.63% |
| ICE BofA Investment Grade U.S. Convertible 5% Constrained Index (e) | 7.05% | 47.95% | 11.53% |
| Bloomberg Barclays U.S. Aggregate Bond Index(f) | 7.51% | 7.16% | 5.02% |
| | | | |
| * | The performance data quoted here represents past performance. Current performance may be lower or higher than the performance data quoted above. Investment return and principal value will fluctuate, so that shares, |
| (a) | Inception date is December 6, 2019 for Class A, Class C and the benchmark. |
| (b) | Inception date is March 1, 2017 for Institutional and the benchmark. |
| (c) | The Fund acquired all of the assets and liabilities of Lake Como Convertible Bond Fund L.P. (the “Predecessor Fund”) in a tax-free reorganization on December 6, 2019. In connection with this acquisition, shares of the Predecessor Fund were exchanged for Institutional shares of the Fund, so the Predecessor Fund became the Institutional shares of the Fund. The Fund’s investment objective, policies and guidelines are, in all material respects, equivalent to the Predecessor Fund’s investment objectives, policies and guidelines. The Predecessor Fund commenced operations in March 2017. Updated performance information will be available at no cost by calling 1-800-253-0412 or visiting the Fund’s website at www.rationalmf.com. |
| (d) | The S&P 500 Total Return Index, a registered trademark of S&P Global., Inc., is a market capitalization-weighted index of 500 widely held common stocks. Investors cannot invest directly in an Index. |
| (e) | The ICE BofA Investment Grade U.S. Convertible 5% Constrained Index (VX5C) is a market-capitalization-weighted index of domestic corporate convertible securities. Bonds and preferred stocks must be convertible only to common stock, ADRs or cash equivalent and have a market value of at least $50 million. It includes Coupon, OID, or zero coupon convertible bonds rated by Moody’s and/or S&P with an average rating of Baa3/BBB- or higher. All positions are capped at 5% of market value. |
| (f) | The Bloomberg Barclays U.S. Aggregate Bond Index, or the Agg, is a broad base, market capitalization-weighted bond market index representing intermediate term investment grade bonds traded in the United States. Investors frequently use the index as a stand-in for measuring the performance of the US bond market. |
Comparison of the Change in Value of a $10,000 Investment
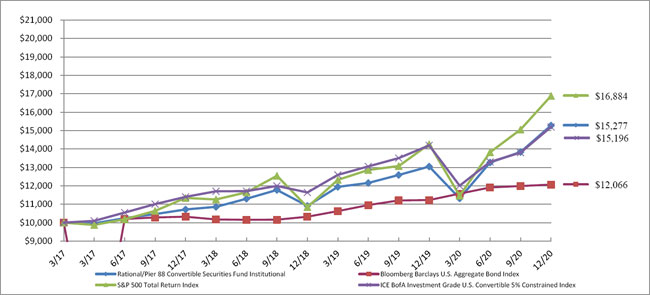
| Top 10 Holdings by Industry | | % of Net Assets | |
| Software | | | 17.2 | % |
| Semiconductors | | | 14.1 | % |
| Medical Equipment & Devices | | | 11.1 | % |
| Electric Utilities | | | 11.0 | % |
| Asset Management | | | 7.4 | % |
| Banking | | | 7.1 | % |
| Machinery | | | 4.4 | % |
| Technology Services | | | 4.2 | % |
| Healthcare Facilities & Services | | | 3.0 | % |
| Commercial Services | | | 2.8 | % |
| Other/Short-Term Investments | | | 17.7 | % |
| | | | 100.0 | % |
| | | | | |
Please refer to the Portfolio of Investments for a more detailed breakdown of the Fund’s assets.
December 31, 2020
Rational Special Situations Income Fund
Dear Fellow Shareholders,
The Rational Special Situations Income Fund (the “Fund”) returned +0.47% (Class I) in December, bringing the 2020 total return to 2.83%. We are pleased to have had positive performance in a year that was marred by the Covid-19 pandemic, which placed considerable stress on capital markets.
The Barclays U.S. Aggregate Bond Index (“Agg”) returned +0.14% in December and its 2020 total return was 7.51%. This was driven primarily by interest rate moves; the five-year Treasury yield fell by 1.33% over the course of the year. Given that the index’s duration is roughly 6 years, its strong showing this year is no surprise. The current yield on the Agg is only 1.2%, which does not leave much room for price appreciation. Although we think Fed rate hikes are extremely unlikely this year, and of course modestly negative interest rates are not impossible, the risk of higher interest rates two or three years down the road outweighs the carry or the potential for further capital gains.
The Bloomberg Barclays U.S. Mortgage-Backed Securities Index returned 0.22% in December and 3.87% for the year. This index is also interest rate sensitive, though not to the extent of the Agg.
Investment Strategy
The Fund seeks to achieve its investment objective by primarily investing in agency and non-agency residential and commercial mortgage-backed securities, with a focus on non-agency residential mortgage backed securities. Non-agency residential mortgage-backed securities are collateralized by pools of residential mortgages which are not insured by government sponsored enterprises (“GSEs”) or government agencies, including the Federal National Mortgage Association (FNMA), Federal Home Loan Mortgage Corporation (FHLMC) and Government National Mortgage Association (GNMA). Many of the mortgages underlying non-agency mortgage-backed securities are non-conforming (not eligible for GSE or agency purchase) for a variety of reasons, including loan size above GSE limits, incomplete documentation of assets or income, excessive borrower debt-to-income ratio (as defined by the GSEs), or unusual loan terms for which GSEs have not established programs. The Fund’s non -agency mortgage -backed securities investments have a wide variety of payment characteristics and preferences and can have fixed or floating interest rates. The Fund may also invest in collateralized debt obligations (“CDOs”), collateralized loan obligations (“CLOs”) and other asset-backed securities, including those backed by credit card receivables, auto loans, aircraft leases and student loans.
Fund Performance
The performance of RFXIX was driven in the beginning of the year by a few litigation-based special situation trades. In some cases, we were directly involved in the litigation and helped to produce favorable rulings that enhanced fundamental value. In other cases, we simply followed litigation closely and aggressively bought bonds that were positively impacted by legal developments before the market fully digested the new information and adjusted prices accordingly.
The spring was marked by a steep decline in asset prices almost across the board. While equities saw declines more than 30% and many NARMBS funds that held more junior tranches saw even bigger declines, RFXIX experienced a much smaller drop. At the end of March, we were down 7.01% on the year, and our NAV climbed steadily higher from there.
The election turned out to be a non -event in terms of the MBS market. We were prepared for significant volatility, and we accumulated a sizable cash position in anticipation of this, but in the end there was no significant disruption of the markets.
The Fund’s total annualized returns through 12/31/20 as compared to the insert appropriate indexes were as follows:
| | 1 year | 3 years | 5 years | 10 years | Inception* |
| Class I | 2.83% | 7.35% | 8.35% | 10.79% | 14.82% |
| Barclays US Agg TR Index (3) | 7.51% | 5.34% | 4.44% | 3.84% | 4.34% |
| Bloomberg MBS TR Index (2) | 3.87% | 3.71% | 3.05% | 3.01% | 3.45% |
| Class A | 2.60% | 7.07% | 8.07% | 10.50% | 14.55% |
| Class C | 1.82% | 6.27% | 7.26% | 9.69% | 13.69% |
| Class A w/ Sales Charge | -2.27% | 7.07% | 8.07% | 10.50% | 14.55% |
| | | | | | |
| * | A&C Inception date: 07/17/2019, I Inception date: 02/01/2009 |
Maximum sales charge for Class A is 4.75%. Maximum Deferred Sales Charge of 1.00% on Class C Shares applies to shares sold within 12 months of purchase. The performance data quoted here represents past performance. Current performance may be lower or higher than the performance data quoted above. Investment return and principal value will fluctuate, so that shares, when redeemed, may be worth more or less than their original cost. Past performance is no guarantee of future results. Results shown reflect the waiver, without which the results could have been lower. A fund’s performance, especially for very short periods of time, should not be the sole factor in making your investment decisions. To obtain the most recent month end performance information or the Fund’s prospectus please call 800-253-0412 or visit www.RationalMF.com.
The Fund commenced operations by acquiring all of the assets and liabilities of ESM Fund I, L.P. (the “Predecessor Fund”) in a tax- free reorganization on July 17, 2019 (the “Reorganization”). In connection with the Reorganization, investors in the Predecessor Fund received Institutional Shares of the Fund. The Fund’s investment objectives, policies, guidelines and restrictions are, in all material respects, equivalent to those of the Predecessor Fund. However, the Predecessor Fund was not registered under the 1940 Act and, therefore, was not subject to certain investment restrictions, limitations and diversification requirements that are imposed by the 1940 Act or Subchapter M of the Internal Revenue Code, which, if they had been applicable, might have adversely affected the Predecessor Fund’s performance. The Fund’s Sub-Advisor was the investment adviser to the Predecessor Fund. The Fund’s fees and expenses are expected to be higher than those of the Predecessor Fund, so if the Fund’s expenses were applied to the Predecessor Fund’s performance, the performance would have been lower.
Summary
Prices on both senior and non- senior NARMBS continued to rise through the end of the year. In our view, this was partially because the economy continued to strengthen, and homeowners’ finances improved. We believe that prices were pushed even higher by the larger deficit spending on the federal level. We are concerned that non-senior tranches of NARMBS have been pushed to the point where they are “priced to perfection” and therefore present significant downside risk.
Because of this, we are continuing to be disciplined in our security selection process. As always, we want to earn our excess returns from special situations, not from simply taking market-correlated credit risk.
We are seeing opportunities in NARMBS and structured finance more generally that fit our framework for trading. The upside potential exists because of complexity and documentation errors, not because of credit risk. For this reason, we are optimistic for the general outlook of special situations trading in the new year.
We thank you for your continued support.
Sincerely,
Eric S. Meyer and William Van de Water
Portfolio Managers
Similar risk disclosure as the paragraph below is not included in any of the other letters.
Investors should carefully consider the investment objectives, risks, charges and expenses of the Rational Funds. This and other important information about the Fund are contained in the prospectus, which can be obtained by calling (800) 253-0412 or at www.RationalMF.com. The prospectus should be read carefully before investing. The Rational Funds are distributed by Northern Lights Distributors, LLC member FINRA/SIPC. Rational Advisors, Inc. is not affiliated with Northern Lights Distributors, LLC
| (1) | The S&P 500 Total Return Index by Standard & Poor’s Corp. is a capitalization-weighted index comprising 500 issues listed on various exchanges, representing the performance of the stock market generally. Please note that indices do not take into account any fees and expenses of investing in the individual securities that they track, and individuals cannot invest directly in any index, although individuals may invest in exchange traded funds or other investment vehicles that attempt to track the performance of an index. The Rational Special Situations Income Fund may or may not purchase the types of securities represented by the S&P 500 Total Return Index. |
| (2) | Bloomberg MBS TR Index tracks fixed-rate agency mortgage backed passthrough securities guaranteed by Ginnie Mae (GNMA), Fannie Mae (FNMA), and Freddie Mac (FHLMC). The index is constructed by grouping individual TBA-deliverable MBS pools into aggregates or generics based on program, coupon, and vintage. |
(3) The Barclays U.S. Aggregate Bond Index is a broad-based flagship benchmark that measures the investment grade, US dollar-denominated, fixed-rate taxable bond market. The index includes Treasuries, government-related and corporate securities, MBS (agency fixed-rate and hybrid ARM pass-throughs), ABS and CMBS (agency and non-agency). Please note that indices do not take into account any fees and expenses of investing in the individual securities that they track, and individuals cannot invest directly in any index, although individuals may invest in exchange traded funds or other investment vehicles that attempt to track the performance of an index. The Catalyst Insider Income Fund may or may not purchase the types of securities represented by the Barclays U.S. Aggregate Bond Index.
4267-NLD-2/5/2021
| Rational Special Situations Income Fund |
| PORTFOLIO REVIEW (Unaudited) |
| December 31, 2020 |
| |
The Fund’s performance figures* for each of the periods ended December 31, 2020, compared to its benchmarks:
| | | Annualized | Annualized | Annualized | Annualized |
| | 1 Year Return | 5 Year Return | 10 Year Return | Since Inception(a) | Since Inception(b) |
| Institutional (c) | 2.83% | 8.35% | 10.79% | N/A | 14.82% |
| Class A | 2.60% | N/A | N/A | 2.99% | N/A |
| Class A with load | (2.27)% | N/A | N/A | (0.40)% | N/A |
| Class C | 1.82% | N/A | N/A | 2.23% | N/A |
| Bloomberg Barclays U.S. Aggregate Bond Index (d) | 7.51% | 4.44% | 3.84% | 6.91% | 4.34% |
| Bloomberg Barclays U.S. Mortgage Backed Securities Index (e) | 3.87% | 3.05% | 3.01% | 3.95% | 3.45% |
| | | | | | |
| * | The performance data quoted here represents past performance. Current performance may be lower or higher than the performance data quoted above. Investment return and principal value will fluctuate, so that shares, when redeemed, may be worth more or less than their original cost. The returns shown do not reflect the deduction of taxes that a shareholder would pay on Fund distributions or on the redemptions of Fund shares. Past performance is no guarantee of future results. Performance figures for periods greater than 1 year are annualized. Per the fee table in the Fund’s May 1, 2020 prospectus, the total annual operating expense are 2.07% for Institutional shares, 2.22% for Class A shares and 2.98% for Class C shares before fee waivers. See the financial highlights for current expense ratios. For performance information current to the most recent month-end, please call toll-free 1-800-253-0412. Class A shares are subject to a maximum load of 4.75%. |
| (a) | Inception date is July 17, 2019 for Class A, Class C and the benchmarks. |
| (b) | Inception date is February 1, 2009 for Institutional and the benchmarks. |
| (c) | The Fund acquired all of the assets and liabilities of ESM Fund I, L.P. (the “Predecessor Fund”) in a tax-free reorganization on July 17, 2019. In connection with this acquisition, shares of the Predecessor Fund were exchanged for Institutional shares of the Fund, so the Predecessor Fund became the Institutional shares of the Fund. The Fund’s investment objective, policies and guidelines are, in all material respects, equivalent to the Predecessor Fund’s investment objectives, policies and guidelines. The Predecessor Fund commenced operations in February 2009. Updated performance information will be available at no cost by calling 1-800-253-0412 or visiting the Fund’s website at www.RationalMF.com. |
| (d) | The Bloomberg Barclays U.S. Aggregate Bond Index is a market capitalization-weighted index that is designed to measure the performance of the U.S. investment grade bond market with maturities of more than one year. Investors cannot invest directly in an Index. |
| (e) | The Bloomberg Barclays U.S. Mortgage Backed Securities Index tracks agency mortgage pass-through securities. Investors cannot invest directly in an Index. |
Comparison of the Change in Value of a $10,000 Investment
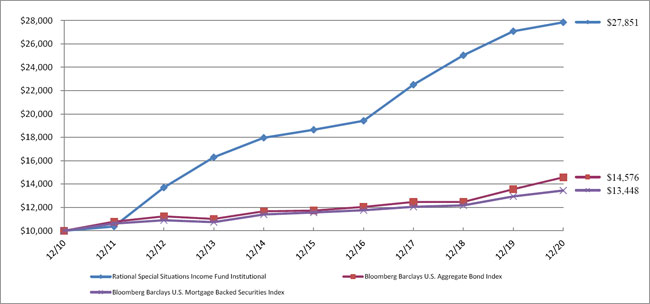
| Holdings by Asset Type | | % of Net Assets | |
| Collateralized Mortgage Obligations | | | 60.3 | % |
| Home Equity | | | 14.2 | % |
| Residential Mortgage | | | 6.1 | % |
| Non Agency CMBS | | | 5.2 | % |
| Other ABS | | | 3.7 | % |
| Syndicated Loan | | | 2.4 | % |
| CDO | | | 1.5 | % |
| Transportation & Logistics | | | 0.7 | % |
| Agency CMBS | | | 0.4 | % |
| Manufactured Housing | | | 0.2 | % |
| Other/Short-Term Investments | | | 5.3 | % |
| | | | 100.0 | % |
| | | | | |
Please refer to the Portfolio of Investments for a more detailed breakdown of the Fund’s assets.
| RATIONAL EQUITY ARMOR FUND |
| PORTFOLIO OF INVESTMENTS |
| December 31, 2020 |
| Shares | | | | | Value | |
| | | | | COMMON STOCKS - 84.2% | | | | |
| | | | | ASSET MANAGEMENT - 2.2% | | | | |
| | 1,832 | | | BlackRock, Inc. | | $ | 1,321,861 | |
| | | | | | | | | |
| | | | | BANKING - 9.0% | | | | |
| | 34,894 | | | Bank of America Corp. | | | 1,057,637 | |
| | 38,373 | | | Fifth Third Bancorp | | | 1,057,944 | |
| | 16,447 | | | JPMorgan Chase & Co | | | 2,089,920 | |
| | 25,231 | | | US Bancorp | | | 1,175,512 | |
| | | | | | | | 5,381,013 | |
| | | | | BIOTECH & PHARMA - 10.5% | | | | |
| | 10,575 | | | AbbVie, Inc. | | | 1,133,111 | |
| | 14,040 | | | Johnson & Johnson | | | 2,209,615 | |
| | 13,534 | | | Merck & Co., Inc. | | | 1,107,081 | |
| | 46,846 | | | Pfizer, Inc. | | | 1,724,401 | |
| | 5,300 | | | Viatris, Inc. * | | | 99,322 | |
| | | | | | | | 6,273,530 | |
| | | | | CABLE & SATELLITE - 3.0% | | | | |
| | 33,674 | | | Comcast Corporation | | | 1,764,518 | |
| | | | | | | | | |
| | | | | CHEMICALS - 1.8% | | | | |
| | 8,447 | | | Celanese Corp. | | | 1,097,603 | |
| | | | | | | | | |
| | | | | ELECTRIC UTILITIES - 3.9% | | | | |
| | 8,704 | | | Sempra Energy | | | 1,108,977 | |
| | 19,963 | | | Southern Co. | | | 1,226,327 | |
| | | | | | | | 2,335,304 | |
| | | | | ENTERTAINMENT CONTENT - 2.1% | | | | |
| | 6,804 | | | Walt Disney Company * | | | 1,232,749 | |
| | | | | | | | | |
| | | | | HOME CONSTRUCTION - 3.7% | | | | |
| | 23,566 | | | Masco Corp. | | | 1,294,480 | |
| | 21,016 | | | PulteGroup, Inc. | | | 906,210 | |
| | | | | | | | 2,200,690 | |
| | | | | HOUSEHOLD PRODUCTS- 2.4% | | | | |
| | 10,352 | | | Procter & Gamble Co. | | | 1,440,377 | |
| | | | | | | | | |
| | | | | INSTITUTIONAL FINANCIAL SERVICES - 4.5% | | | | |
| | 5,157 | | | Goldman Sachs Group, Inc. | | | 1,359,953 | |
| | 19,680 | | | Morgan Stanley | | | 1,348,670 | |
| | | | | | | | 2,708,623 | |
| | | | | LEISURE FACILITIES & SERVICES - 2.4% | | | | |
| | 13,528 | | | Starbucks Corporation | | | 1,447,225 | |
| | | | | | | | | |
| | | | | MACHINERY - 4.8% | | | | |
| | 7,273 | | | Caterpillar, Inc. | | | 1,323,831 | |
| | 5,696 | | | Deere & Company | | | 1,532,509 | |
| | | | | | | | 2,856,340 | |
| | | | | MEDICAL EQUIPMENT & DEVICES - 2.1% | | | | |
| | 10,509 | | | Agilent Technologies, Inc. | | | 1,245,211 | |
| | | | | | | | | |
| | | | | METALS & MINING - 1.0% | | | | |
| | 23,985 | | | Freeport-McMoRan, Inc. | | | 624,090 | |
| | | | | | | | | |
| | | | | OIL & GAS PRODUCERS - 2.9% | | | | |
| | 12,185 | | | Chevron Corp. | | | 1,029,023 | |
| | 17,462 | | | ConocoPhillips | | | 698,305 | |
| | | | | | | | 1,727,328 | |
| | | | | RETAIL - CONSUMER STAPLES - 1.5% | | | | |
| | 2,347 | | | Costco Wholesale Corporation | | | 884,303 | |
| | | | | | | | | |
| | | | | RETAIL - DISCRETIONARY - 3.8% | | | | |
| | 10,285 | | | Best Buy Co., Inc. | | | 1,026,340 | |
| | 7,693 | | | Lowe’s Cos., Inc. | | | 1,234,803 | |
| | | | | | | | 2,261,143 | |
| | | | | SEMICONDUCTORS - 4.4% | | | | |
| | 2,983 | | | KLA Corporation | | | 772,329 | |
| | 8,370 | | | QUALCOMM, Inc. | | | 1,275,086 | |
| | 3,757 | | | Skyworks Solutions, Inc. | | | 574,370 | |
| | | | | | | | 2,621,785 | |
See accompanying notes to financial statements.
| RATIONAL EQUITY ARMOR FUND |
| PORTFOLIO OF INVESTMENTS (Continued) |
| December 31, 2020 |
| Shares | | | | | Value | |
| | | | | COMMON STOCKS - 84.2% (Continued) | | | | |
| | | | | SOFTWARE - 5.2% | | | | |
| | 8,294 | | | Akamai Technologies, Inc. * | | $ | 870,787 | |
| | 5,343 | | | Microsoft Corporation | | | 1,188,390 | |
| | 16,368 | | | Oracle Corporation | | | 1,058,846 | |
| | | | | | | | 3,118,023 | |
| | | | | TECHNOLOGY HARDWARE - 3.9% | | | | |
| | 9,781 | | | Apple, Inc. | | | 1,297,841 | |
| | 12,591 | | | Cognizant Technology Solutions Corporation | | | 1,031,833 | |
| | | | | | | | 2,329,674 | |
| | | | | TELECOMMUNICATIONS - 2.9% | | | | |
| | 29,454 | | | Verizon Communications, Inc. | | | 1,730,423 | |
| | | | | | | | | |
| | | | | TOBACCO & CANNABIS - 1.7% | | | | |
| | 24,101 | | | Altria Group, Inc. | | | 988,141 | |
| | | | | | | | | |
| | | | | TRANSPORTATION & LOGISTICS - 4.5% | | | | |
| | 5,159 | | | FedEx Corp. | | | 1,339,380 | |
| | 5,845 | | | Cummins, Inc. | | | 1,327,400 | |
| | | | | | | | 2,666,780 | |
| | | | | | | | | |
| | | | | TOTAL COMMON STOCKS (Cost $43,191,950) | | | 50,256,734 | |
| | | | | | | | | |
| | | | | EXCHANGE-TRADED FUND - 0.9% | | | | |
| | | | | EQUITY - 0.9% | | | | |
| | 4,068 | | | iShares S&P 500 Value ETF (Cost - $511,827) | | | 520,785 | |
| | | | | | | | | |
| | | | | REITS - 2.4% | | | | |
| | 3,050 | | | American Tower Corp. | | | 684,603 | |
| | 25,422 | | | Healthpeak Properties, Inc. | | | 768,507 | |
| | | | | TOTAL RETS (Cost $1,449,291) | | | 1,453,110 | |
| | | | | | | | | |
| | | | | SHORT-TERM INVESTMENTS - 8.5% | | | | |
| | 5,101,719 | | | First American Government Obligations Fund, Class U, 0.04% + (Cost - $5,101,719) | | | 5,101,719 | |
| | | | | | | | | |
| | | | | TOTAL INVESTMENTS - 96.0% (Cost $50,254,787) | | $ | 57,332,348 | |
| | | | | OTHER ASSETS LESS LIABILITIES - 4.0% | | | 2,382,141 | |
| | | | | NET ASSETS - 100.0% | | $ | 59,714,489 | |
REIT - Real Estate Investment Trust.
| * | Non-income producing securities. |
| + | Rate shown represents the rate at December 31, 2020, and is subject to change and resets daily. |
| (a) | Each contract is equivalent to one of the underlying futures contract. |
| | | | | | | | | | Unrealized | |
| | | | | | | | | | Appreciation / | |
| Long Contracts | | | | | Notional Amount ($) | | Maturity | | (Depreciation) | |
| | | | | OPEN LONG FUTURES CONTRACTS - (0.3)% | | | | | | |
| | 331 | | | CBOE VIX FUTURE | | 7,836,425 | | January-21 | | $ | (146,779 | ) |
| | | | | Net Unrealized Depreciation From Open Long Futures Contracts | | | (146,779 | ) |
| | | | | | | | | | | | | |
| Short Contracts | | | | | | | | | | | |
| | | | | OPEN SHORT FUTURES CONTRACTS - 0.2% | | | | | | |
| | (455 | ) | | CBOE VIX FUTURE | | 11,636,625 | | February-21 | | | 86,717 | |
| | | | | Net Unrealized Appreciation From Open Short Futures Contracts | | | 86,717 | |
| | | | | Total Unrealized Appreciation From Open Futures Contracts | | $ | (60,062 | ) |
See accompanying notes to financial statements.
| RATIONAL TACTICAL RETURN FUND |
| PORTFOLIO OF INVESTMENTS |
| December 31, 2020 |
| Shares | | | | | Value | |
| | | | | SHORT-TERM INVESTMENTS - 34.1% | | | | |
| | | | | MONEY MARKET FUND - 34.1% | | | | |
| | 73,899,661 | | | First American Government Obligations Fund, Class U, 0.04% * | | | | |
| | | | | TOTAL SHORT-TERM INVESTMENTS (Cost - $73,899,661) | | $ | 73,899,661 | |
| | | | | | | | | |
| | | | | TOTAL INVESTMENTS - 34.1% (Cost - $73,899,661) | | $ | 73,899,661 | |
| | | | | OTHER ASSETS LESS LIABILITIES - 65.9% | | | 142,640,499 | |
| | | | | NET ASSETS - 100.0% | | $ | 216,540,160 | |
| | | | | | | | | |
| | | | | | | | Notional | | Expiration | | Exercise | | | |
| Contracts ^ | | | | | Counterparty | | Amount ($) | | Date | | Price ($) | | Value | |
| | | | | OPTIONS WRITTEN ** - 4.4% | | | | | | | | | | | | |
| | | | | CALL OPTIONS WRITTEN - 4.4% | | | | | | | | | | | | |
| | 1,046 | | | S&P 500 Index 2nd Week Option | | ADM, ED&F, Gain Capital | | 1,030,310,000 | | 1/31/2021 | | 3,940 | | $ | 91,525 | |
| | 200 | | | S&P 500 E Mini 2nd Week Option | | ED&F | | 197,000,000 | | 1/31/2021 | | 3,940 | | | 3,500 | |
| | | | | TOTAL CALL OPTIONS WRITTEN (Premiums Received - $128,291) | | $ | 95,025 | |
| ^ | Each option contract is equivalent to one options contract. |
| * | Rate shown represents the rate at December 31, 2020 and is subject to change and resets daily. |
| ** | Non-income producing security. |
See accompanying notes to financial statements.
| RATIONAL DYNAMIC BRANDS FUND |
| PORTFOLIO OF INVESTMENTS |
| December 31, 2020 |
| Shares | | | | | Value | |
| | | | | COMMON STOCKS - 95.7% | | | | |
| | | | | ADVERTISING & MARKETING - 0.6% | | | | |
| | 10,000 | | | Jumia Technologies AG - ADR * | | $ | 403,500 | |
| | | | | | | | | |
| | | | | APPAREL & TEXTILE PRODUCTS - 6.5% | | | | |
| | 5,200 | | | adidas AG - ADR * | | | 951,548 | |
| | 13,000 | | | Capri Holdings Ltd. * | | | 546,000 | |
| | 22,839 | | | NIKE, Inc. | | | 3,231,033 | |
| | | | | | | | 4,728,581 | |
| | | | | AUTOMOTIVE - 0.5% | | | | |
| | 1,500 | | | Ferrari NV | | | 344,280 | |
| | | | | | | | | |
| | | | | BIOTECH & PHARMACEUTICALS - 3.1% | | | | |
| | 2,000 | | | Johnson & Johnson | | | 314,760 | |
| | 20,000 | | | Pfizer, Inc. | | | 736,200 | |
| | 1,800 | | | Regeneron Pharmaceuticals, Inc. * | | | 869,598 | |
| | 2,000 | | | Zoetis, Inc. | | | 331,000 | |
| | | | | | | | 2,251,558 | |
| | | | | CHEMICALS - 1.8% | | | | |
| | 1,800 | | | Sherwin-Williams Co. | | | 1,322,838 | |
| | | | | | | | | |
| | | | | CONSUMER SERVICES - 1.1% | | | | |
| | 4,000 | | | Medifast, Inc. | | | 785,360 | |
| | | | | | | | | |
| | | | | E-COMMERCE DISCRETIONARY - 8.3% | | | | |
| | 1,266 | | | Amazon.com, Inc. * | | | 4,123,273 | |
| | 1,113 | | | MercadoLibre, Inc. * | | | 1,864,520 | |
| | | | | | | | 5,987,793 | |
| | | | | HEALTH CARE FACILITIES & SERVICES - 1.4% | | | | |
| | 3,000 | | | UnitedHealth Group, Inc. | | | 1,052,040 | |
| | | | | | | | | |
| | | | | INSTITUTIONAL FINANCIAL SERVICES - 0.9% | | | | |
| | 2,500 | | | Goldman Sachs Group, Inc. | | | 659,275 | |
| | | | | | | | | |
| | | | | INTERNET MEDIA & SERVICES- 15.6% | | | | |
| | 3,000 | | | Airbnb, Inc. * | | | 440,400 | |
| | 1,250 | | | Alphabet, Inc. * | | | 2,190,800 | |
| | 350 | | | Booking Holdings, Inc. * | | | 779,545 | |
| | 5,500 | | | Expedia Group, Inc. | | | 728,200 | |
| | 4,166 | | | Roku, Inc. * | | | 1,383,195 | |
| | 1,187 | | | Shopify, Inc. * | | | 1,343,625 | |
| | 4,438 | | | Spotify Technology SA * | | | 1,396,461 | |
| | 36,505 | | | Tencent Holdings Ltd. - ADR | | | 2,624,344 | |
| | 9,000 | | | Uber Technologies, Inc. * | | | 459,000 | |
| | | | | | | | 11,345,570 | |
| | | | | LEISURE FACILITIES & SERVICES - 8.3% | | | | |
| | 1,600 | | | Chipotle Mexican Grill, Inc. * | | | 2,218,736 | |
| | 7,200 | | | Hilton Worldwide Holdings, Inc. | | | 801,072 | |
| | 3,500 | | | Live Nation Entertainment, Inc. * | | | 257,180 | |
| | 3,000 | | | Marriott International, Inc. | | | 395,760 | |
| | 14,000 | | | Norwegian Cruise Line Holdings Ltd. * | | | 356,020 | |
| | 10,500 | | | Royal Caribbean Cruises Ltd. | | | 784,245 | |
| | 14,500 | | | Shake Shack, Inc. * | | | 1,229,310 | |
| | | | | | | | 6,042,323 | |
| | | | | MEDICAL EQUIPMENT & DEVICES - 1.4% | | | | |
| | 2,100 | | | Thermo Fisher Scientific, Inc. | | | 978,138 | |
| | | | | | | | | |
| | | | | REAL ESTATE SERVICES - 1.6% | | | | |
| | 18,500 | | | CBRE Group, Inc. * | | | 1,160,320 | |
| | | | | | | | | |
| | | | | RETAIL - CONSUMER STAPLES - 4.7% | | | | |
| | 4,874 | | | Costco Wholesale Corp. | | | 1,836,426 | |
| | 9,000 | | | Target Corp. | | | 1,588,770 | |
| | | | | | | | 3,425,196 | |
| | | | | RETAIL - DISCRETIONARY - 6.4% | | | | |
| | 6,261 | | | Lululemon Athletica, Inc. * | | | 2,179,016 | |
| | 5,500 | | | RH * | | | 2,461,360 | |
| | | | | | | | 4,640,376 | |
| | | | | SEMICONDUCTORS - 1.0% | | | | |
| | 1,420 | | | NVIDIA Corp. | | | 741,524 | |
| | | | | | | | | |
| | | | | SOFTWARE - 7.9% | | | | |
| | 13,097 | | | Microsoft Corp. | | | 2,913,035 | |
| | 10,500 | | | salesforce.com, Inc. * | | | 2,336,565 | |
| | 1,500 | | | Zoom Video Communications, Inc. * | | | 505,980 | |
| | | | | | | | 5,755,580 | |
See accompanying notes to consolidated financial statements.
| RATIONAL DYNAMIC BRANDS FUND |
| PORTFOLIO OF INVESTMENTS (Continued) |
| December 31, 2020 |
| Shares | | | | | Value | |
| | | | | COMMON STOCKS - 95.7% (Continued) | | | | |
| | | | | SPECIALTY FINANCE- 2.4% | | | | |
| | 6,500 | | | Afterpay Ltd. - ADR * | | $ | 598,650 | |
| | 56,000 | | | Rocket Cos., Inc. * | | | 1,132,320 | |
| | | | | | | | 1,730,970 | |
| | | | | TECHNOLOGY HARDWARE - 10.4% | | | | |
| | 29,756 | | | Apple, Inc. | | | 3,948,323 | |
| | 44,600 | | | Nintendo Company Ltd. - ADR | | | 3,591,192 | |
| | | | | | | | 7,539,515 | |
| | | | | TECHNOLOGY SERVICES - 10.4% | | | | |
| | 10,628 | | | Mastercard, Inc. | | | 3,793,558 | |
| | 1,745 | | | PayPal Holdings, Inc. * | | | 408,679 | |
| | 3,328 | | | Square, Inc. * | | | 724,306 | |
| | 12,128 | | | Visa, Inc. | | | 2,652,757 | |
| | | | | | | | 7,579,300 | |
| | | | | TRANSPORTATION & LOGISTICS - 1.4% | | | | |
| | 22,000 | | | Southwest Airlines Co. | | | 1,025,420 | |
| | | | | | | | | |
| | | | | TOTAL COMMON STOCKS (Cost $55,580,532) | | | 69,499,457 | |
| | | | | | | | | |
| | | | | SHORT-TERM INVESTMENTS - 7.8% | | | | |
| | 5,652,450 | | | First American Government Obligations Fund - Class U, 0.04% ** | | | 5,652,450 | |
| | | | | TOTAL SHORT-TERM INVESTMENTS (Cost $5,652,450) | | | 5,652,450 | |
| | | | | | | | | |
| | | | | TOTAL INVESTMENTS - 103.5% (Cost $61,232,982) | | $ | 75,151,907 | |
| | | | | LIABILITIES LESS OTHER ASSETS - (3.5)% | | | (2,553,029 | ) |
| | | | | NET ASSETS - 100.0% | | $ | 72,598,878 | |
ADR - American Depositary Receipt.
| * | Non-income producing security. |
| ** | Rate shown represents the rate at December 31, 2020, and is subject to change and resets daily. |
See accompanying notes to consolidated financial statements.
| RATIONAL STRATEGIC ALLOCATION FUND |
| PORTFOLIO OF INVESTMENTS |
| December 31, 2020 |
| Shares | | | | | | | | | Value | |
| | | | | MUTUAL FUNDS - 84.8% | | | | | | | | |
| | | | | FIXED INCOME - 84.8% | | | | | | | | |
| | 39,468 | | | AlphaCentric Income Opportunities Fund, Class I + | | | | | | $ | 435,322 | |
| | 124,639 | | | Catalyst Enhanced Income Strategy Fund, Institutional Class + | | | 1,404,690 | |
| | 77,855 | | | Catalyst Insider Income Fund, Institutional Class + | | | | | | | 766,875 | |
| | 82,210 | | | Catalyst/CIFC Floating Rate Income Fund + | | | | | | | 785,929 | |
| | 70,017 | | | Catalyst/Stone Beach Income Opportunity Fund, Institutional Class + | | | 648,359 | |
| | 70,961 | | | Rational Special Situations Income Fund, Institutional Class + | | | 1,395,098 | |
| | 112,557 | | | Rational/Pier 88 Convertible Securities Fund, Institutional Class + | | | 1,315,735 | |
| | | | | TOTAL MUTUAL FUNDS (Cost - $6,403,055) | | | | | | | 6,752,008 | |
| | | | | | | | | | | | | |
| | | | | SHORT-TERM INVESTMENTS - 3.9% | | | | | | | | |
| | | | | MONEY MARKET FUNDS - 3.9% | | | | | | | | |
| | 314,073 | | | First American Government Obligations Fund, Class U, 0.04% * | | | 314,073 | |
| | | | | TOTAL SHORT-TERM INVESTMENTS (Cost - $314,073) | | | 314,073 | |
| | | | | | | | | | | | | |
| | | | | TOTAL INVESTMENTS - 88.7% (Cost - $6,717,128) | | $ | 7,066,081 | |
| | | | | OTHER ASSETS LESS LIABILITIES - 11.3% | | | | | | | 895,948 | |
| | | | | NET ASSETS - 100.0% | | | | | | $ | 7,962,029 | |
| | | | | | | | | | | | | |
| Long Contracts | | | | | Notional Amount ($) | | Maturity | | Unrealized
Appreciation | |
| | | | | OPEN LONG FUTURES CONTRACTS - (0.1)% | | | | | | | | |
| | 42 | | | S&P 500 E-MINI Future | | 7,872,480 | | March-21 | | $ | 184,380 | |
| | | | | Net Unrealized Appreciation from Open Long Futures Contracts | | $ | 184,380 | |
| + | Investment in affiliate. |
| * | Rate shown represents the rate at December 31, 2020, and is subject to change and resets daily. |
See accompanying notes to consolidated financial statements.
| RATIONAL/RESOLVE ADAPTIVE ASSET ALLOCATION FUND |
| CONSOLIDATED PORTFOLIO OF INVESTMENTS |
| December 31, 2020 |
| Shares | | | | | | | | | Value | |
| | | | | SHORT-TERM INVESTMENTS - 89.7% | | | | |
| | 56,661,833 | | | First American Government Obligations Fund, Class U, 0.04% *+ | | $ | 56,661,833 | |
| | | | | TOTAL SHORT-TERM INVESTMENTS (Cost - $56,661,833) | | | 56,661,833 | |
| | | | | | | | | | | | | |
| | | | | TOTAL INVESTMENTS - 89.7% (Cost - $56,661,833) | | $ | 56,661,833 | |
| | | | | OTHER ASSETS LESS LIABILITIES - 10.3% | | | 6,540,985 | |
| | | | | NET ASSETS - 100.0% | | | | | | $ | 63,202,818 | |
| | | | | | | | | | | | | |
| | | | | | | | | | | Unrealized | |
| | | | | | | | | | | Appreciation / | |
| Long Contracts | | | | | Notional Amount ($) | | Maturity | | (Depreciation) | |
| | | | | OPEN LONG FUTURES CONTRACTS - 3.8% | | | | | | | | |
| | 3 | | | CBOE Volatility Index Future + | | 77,325 | | March-21 | | $ | (725 | ) |
| | 20 | | | CBOT $5 Mini Dow Jones Industrial Average e-CBOE Future | | 3,049,700 | | March-21 | | | 39,590 | |
| | 9 | | | CBOT 10 Year US Treasury Note | | 2,485,406 | | March-21 | | | 2,530 | |
| | 327 | | | CBOT 5 Year US Treasury Note | | 41,255,628 | | March-21 | | | 63,526 | |
| | 77 | | | CBOT Corn Future + | | 1,863,400 | | March-21 | | | 180,175 | |
| | 27 | | | CBOT Soybean Future + | | 1,769,850 | | March-21 | | | 84,675 | |
| | 29 | | | CBOT Soybean Meal Future + | | 1,245,260 | | March-21 | | | 110,720 | |
| | 14 | | | CBOT Soybean Oil Future + | | 356,160 | | March-21 | | | 27,942 | |
| | 17 | | | CBOT US Long Bond Future | | 2,944,196 | | March-21 | | | 15,477 | |
| | 9 | | | CBOT Wheat Future + | | 288,225 | | March-21 | | | 12,650 | |
| | 3 | | | CME Australian Dollar Currency Future | | 231,000 | | March-21 | | | 2,755 | |
| | 26 | | | CME British Pound Currency Future | | 2,219,588 | | March-21 | | | 31,163 | |
| | 177 | | | CME Canadian Dollar Currency Future | | 13,866,180 | | March-21 | | | (1,255 | ) |
| | 10 | | | CME E-Mini NASDAQ 100 Index Future | | 2,577,100 | | March-21 | | | 41,480 | |
| | 9 | | | CME E-Mini Standard & Poor’s 500 Index Future | | 1,686,960 | | March-21 | | | 23,685 | |
| | 123 | | | CME Euro Foreign Exchange Currency Future | | 18,828,225 | | March-21 | | | 142,184 | |
| | 13 | | | CME Feeder Cattle Future + | | 911,463 | | March-21 | | | (11,163 | ) |
| | 65 | | | CME Japanese Yen Currency Future | | 7,872,313 | | March-21 | | | (6,275 | ) |
| | 31 | | | CME Lean Hogs Future + | | 871,410 | | February-21 | | | 48,570 | |
| | 15 | | | CME Live Cattle Future + | | 690,150 | | February-21 | | | 4,770 | |
| | 17 | | | CME New Zealand Dollar Currency Future | | 1,221,960 | | March-21 | | | 10,000 | |
| | 14 | | | CME Nikkei 225 Index Future | | 1,927,450 | | March-21 | | | 73,925 | |
| | 134 | | | CME Swiss Franc Currency Future | | 18,964,350 | | March-21 | | | 94,175 | |
| | 71 | | | COMEX Copper Future + | | 6,246,225 | | March-21 | | | 351,350 | |
| | 29 | | | COMEX Gold 100 Troy Ounces Future + | | 5,495,790 | | February-21 | | | 85,170 | |
| | 10 | | | COMEX Silver Future + | | 1,320,600 | | March-21 | | | 71,150 | |
| | 24 | | | Eurex 30 Year Euro BUXL Future | | 6,604,213 | | March-21 | | | (20,843 | ) |
| | 170 | | | Eurex 5 Year Euro BOBL Future | | 28,075,384 | | March-21 | | | 2,983 | |
| | 4 | | | Euro-BTP Italian Bond Futures | | 743,968 | | March-21 | | | 6,839 | |
| | 11 | | | Euronext Amsterdam Index Future | | 1,681,117 | | January-21 | | | 6,888 | |
| | 2 | | | Euronext CAC 40 Index Future | | 135,618 | | January-21 | | | (656 | ) |
| | 208 | | | Euronext Milling Wheat Future + | | 2,713,591 | | March-21 | | | 62,004 | |
| | 6 | | | French Government Bond Futures | | 1,232,311 | | March-21 | | | 6,506 | |
| | 21 | | | FTSE 100 Index Future | | 1,842,924 | | March-21 | | | (17,576 | ) |
| | 45 | | | FVSA index - Mini-Futures on VSTOXX + | | 130,767 | | February-21 | | | 3,531 | |
| | 11 | | | HKG Hang Seng Index Future | | 1,930,712 | | January-21 | | | 56,922 | |
| | 69 | | | ICE Brent Crude Oil Future + | | 3,574,200 | | January-21 | | | 46,300 | |
| | 57 | | | ICE Gas Oil Future + | | 2,411,100 | | February-21 | | | 22,975 | |
| | 30 | | | ICE Natural Gas Future + | | 647,607 | | February-21 | | | 53,666 | |
| | 3 | | | ICE US MSCI Emerging Markets EM Index Futures | | 193,230 | | March-21 | | | 5,100 | |
| | 46 | | | KCBT Hard Red Winter Wheat Future + | | 1,388,050 | | March-21 | | | 95,425 | |
| | 31 | | | Long Gilt Future | | 5,743,574 | | March-21 | | | 34,590 | |
| | 191 | | | Montreal Exchange 10 Year Canadian Bond Future | | 22,358,562 | | March-21 | | | 88,059 | |
| | 10 | | | NYBOT CSC C Coffee Future + | | 480,938 | | March-21 | | | 19,219 | |
| | 29 | | | NYBOT CSC Cocoa Future + | | 754,870 | | March-21 | | | 29,530 | |
| | 44 | | | NYBOT CSC Number 11 World Sugar Future + | | 763,347 | | February-21 | | | 28,874 | |
| | 60 | | | NYBOT CTN Number 2 Cotton Future + | | 2,343,600 | | March-21 | | | 209,215 | |
| | 51 | | | NYMEX Light Sweet Crude Oil Future + | | 2,474,520 | | January-21 | | | 44,670 | |
| | 23 | | | NYMEX Platinum Future + | | 1,241,080 | | April-21 | | | (2,480 | ) |
| | 22 | | | NYMEX RBOB Future + | | 1,302,932 | | January-21 | | | 51,114 | |
| | 2 | | | SFE S&P ASX Share Price Index 200 Future | | 252,214 | | March-21 | | | (2,546 | ) |
See accompanying notes to consolidated financial statements.
| RATIONAL/RESOLVE ADAPTIVE ASSET ALLOCATION FUND |
| CONSOLIDATED PORTFOLIO OF INVESTMENTS (Continued) |
| December 31, 2020 |
| | | | | | | | | | Unrealized | |
| | | | | | | | | | Appreciation / | |
| Long Contracts | | | | | Notional Amount ($) | | Maturity | | (Depreciation) | |
| | | | | OPEN LONG FUTURES CONTRACTS - 3.8% (Continued) | | | | |
| | 52 | | | SGX FTSE China A50 Future | | 921,024 | | January-21 | | $ | 40,824 | |
| | 28 | | | SGX Nifty 50 Index Future | | 784,896 | | January-21 | | | 1,123 | |
| | 4 | | | SGX Nikkei 225 Stock Index Future | | 532,520 | | March-21 | | | 20,970 | |
| | 42 | | | TSE Japanese 10 Year Bond Future | | 61,785,998 | | March-21 | | | (36,684 | ) |
| | 11 | | | TSE TOPIX (Tokyo Price Index) Future | | 1,922,563 | | March-21 | | | 50,724 | |
| | | | | Net Unrealized Appreciation from Open Long Futures Contracts | | | 2,405,510 | |
| | | | | | | | | | | | | |
| Short Contracts | | | | | | | | | | | |
| | | | | OPEN SHORT FUTURES CONTRACTS - 0.0% | | | | |
| | (2 | ) | | CBOE Volatility Index Future + | | (47,350) | | January-21 | | | 300 | |
| | (5 | ) | | ICE Carbon Emissions Future + | | (163,600) | | December-21 | | | (6,680 | ) |
| | (7 | ) | | NYMEX Henry Hub Natural Gas Future + | | (177,730) | | January-21 | | | 7,250 | |
| | (10 | ) | | NYMEX NY Harbor ULSD Futures + | | (623,280) | | January-21 | | | (2,692 | ) |
| | | | | Net Unrealized Depreciation from Open Short Futures Contracts | | | (1,822 | ) |
| | | | | Total Unrealized Appreciation From Open Futures Contracts | | $ | 2,403,688 | |
| * | Rate shown represents the rate at December 31, 2020, and is subject to change and resets daily. |
| + | All or a portion of this investment is a holding of the RDMF Fund, Ltd. |
See accompanying notes to consolidated financial statements.
| RATIONAL/PIER 88 CONVERTIBLE SECURITIES FUND |
| PORTFOLIO OF INVESTMENTS |
| December 31, 2020 |
| Shares | | | | | | | | | Value | |
| | | | | COMMON STOCK - 1.4% | | | | | | | | |
| | | | | BIOTECH & PHARMACEUTICALS - 1.4% | | | | | | | | |
| | 14,133 | | | Horizon Therapeutics Plc | | | | | | $ | 1,033,829 | |
| | | | | TOTAL COMMON STOCK (Cost - $658,480) | | | | | | | | |
| | | | | | | | | | | | | |
| Principal | | | | | | | | | | | |
| Amount ($) | | | | | Coupon Rate (%) | | Maturity | | | | |
| | | | | CONVERTIBLE BONDS - 58.9% | | | | | | | | |
| | | | | ASSET MANAGEMENT - 5.8% | | | | | | | | |
| | 1,340,000 | | | Ares Capital Corporation | | 4.6250 | | 3/1/2024 | | | 1,410,350 | |
| | 1,690,886 | | | New Mountain Finance Corp. | | 5.7500 | | 8/15/2023 | | | 1,737,385 | |
| | 1,056,540 | | | Sixth Street Specialty Lending, Inc. | | 4.5000 | | 8/1/2022 | | | 1,139,510 | |
| | | | | | | | | | | | 4,287,245 | |
| | | | | COMMERCIAL SERVICES - 2.8% | | | | | | | | |
| | 1,845,000 | | | Chegg, Inc. (a) | | 0.0000 | | 9/1/2026 | | | 2,063,111 | |
| | | | | | | | | | | | | |
| | | | | E-COMMERCE DISCRETIONARY - 2.1% | | | | | | | | |
| | 1,245,000 | | | Etsy, Inc. (a) | | 0.1250 | | 9/1/2027 | | | 1,540,137 | |
| | | | | | | | | | | | | |
| | | | | HEALTH CARE FACILITIES & SERVICES - 3.0% | | | | | | | | |
| | 422,616 | | | Anthem, Inc. | | 2.7500 | | 10/15/2042 | | | 1,893,279 | |
| | 305,000 | | | Teledoc Health, Inc. (a) | | 1.2500 | | 6/1/2027 | | | 365,300 | |
| | | | | | | | | | | | 2,258,579 | |
| | | | | INTERNET MEDIA & SERVICES - 2.2% | | | | | | | | |
| | 1,435,000 | | | Booking Holdings, Inc. | | 0.9000 | | 9/15/2021 | | | 1,663,205 | |
| | | | | | | | | | | | | |
| | | | | MEDICAL EQUIPMENT & DEVICES - 3.9% | | | | | | | | |
| | 560,000 | | | DexCom, Inc. (a) | | 0.2500 | | 11/15/2025 | | | 563,136 | |
| | 505,042 | | | Illumina, Inc. | | 0.5000 | | 6/15/2021 | | | 738,055 | |
| | 1,235,000 | | | Insulet Corp. | | 0.3750 | | 9/1/2026 | | | 1,628,038 | |
| | | | | | | | | | | | 2,929,229 | |
| | | | | OIL & GAS PRODUCERS - 1.4% | | | | | | | | |
| | 780,000 | | | Pioneer Natural Resources Co. (a) | | 0.2500 | | 5/15/2025 | | | 1,036,377 | |
| | | | | | | | | | | | | |
| | | | | SEMICONDUCTORS - 9.4% | | | | | | | | |
| | 750,000 | | | Microchip Technology, Inc. | | 1.6250 | | 2/15/2027 | | | 1,516,952 | |
| | 235,000 | | | Micron Technology, Inc. | | 3.1250 | | 5/1/2032 | | | 1,768,458 | |
| | 128,443 | | | Novellus Systems, Inc. | | 2.6250 | | 5/15/2041 | | | 1,902,363 | |
| | 1,055,000 | | | ON Semiconductor Corporation | | 1.6250 | | 10/15/2023 | | | 1,767,636 | |
| | | | | | | | | | | | 6,955,409 | |
| | | | | SOFTWARE - 17.2% | | | | | | | | |
| | 808,734 | | | Alteryx, Inc. | | 1.0000 | | 8/1/2026 | | | 853,565 | |
| | 245,000 | | | Cloudflare, Inc. (a) | | 0.7500 | | 5/15/2025 | | | 522,786 | |
| | 170,000 | | | Coupa Software, Inc. | | 0.1250 | | 6/15/2025 | | | 370,810 | |
| | 815,000 | | | CyberArk Software Ltd. | | 0.0000 | | 11/15/2024 | | | 988,704 | |
| | 369,599 | | | DocuSign, Inc. | | 0.5000 | | 9/15/2023 | | | 1,151,822 | |
| | 645,000 | | | FireEye, Inc. | | 0.8750 | | 6/1/2024 | | | 783,560 | |
| | 442,000 | | | Okta, Inc. | | 0.1250 | | 9/1/2025 | | | 657,751 | |
| | 1,510,000 | | | Proofpoint, Inc. | | 0.2500 | | 8/15/2024 | | | 1,690,658 | |
| | 700,000 | | | PROS Holdings, Inc. | | 1.0000 | | 5/15/2024 | | | 741,411 | |
| | 1,570,000 | | | RingCentral, Inc. (a) | | 0.0000 | | 3/1/2025 | | | 2,002,672 | |
| | 140,000 | | | ServiceNow, Inc. | | 0.0000 | | 6/1/2022 | | | 570,713 | |
| | 780,000 | | | Shopify, Inc. | | 0.1250 | | 11/1/2025 | | | 918,450 | |
| | 368,291 | | | Splunk, Inc. | | 1.1250 | | 9/15/2025 | | | 498,656 | |
| | 620,000 | | | Workday, Inc. | | 0.2500 | | 10/1/2022 | | | 1,035,991 | |
| | | | | | | | | | | | 12,787,549 | |
| | | | | TECHNOLOGY HARDWARE - 2.2% | | | | | | | | |
| | 1,628,080 | | | Western Digital Corp. | | 1.6500 | | 2/1/2024 | | | 1,618,223 | |
| | | | | | | | | | | | | |
| | | | | TECHNOLOGY SERVICES - 4.2% | | | | | | | | |
| | 2,760,928 | | | Euronet Worldwide, Inc. | | 0.7500 | | 3/15/2049 | | | 3,120,981 | |
| | | | | | | | | | | | | |
| | | | | TRANSPORTATION & LOGISTICS - 2.6% | | | | | | | | |
| | 1,350,000 | | | Southwest Airlines Co. | | 1.2500 | | 5/1/2025 | | | 1,960,875 | |
| | | | | | | | | | | | | |
| | | | | TRANSPORTATION EQUIPMENT - 2.1% | | | | | | | | |
| | 1,381,118 | | | Meritor, Inc. | | 3.2500 | | 10/15/2037 | | | 1,585,201 | |
| | | | | | | | | | | | | |
| | | | | TOTAL CONVERTIBLE BONDS ( Cost - $38,377,012) | | | | 43,806,121 | |
See accompanying notes to financial statements.
| RATIONAL/PIER 88 CONVERTIBLE SECURITIES FUND |
| PORTFOLIO OF INVESTMENTS (Continued) |
| December 31, 2020 |
| Principal | | | | | | | | | | |
| Amount ($) | | | | | Coupon Rate (%) | | Maturity | | Value | |
| | | | | PREFERRED STOCKS - 36.0% | | | | | | | | |
| | | | | ASSET MANAGEMENT - 1.6% | | | | | | | | |
| | 24,200 | | | AMG Capital Trust II | | 2.5800 | | 10/15/2037 | | $ | 1,180,476 | |
| | | | | | | | | | | | | |
| | | | | BANKING - 7.1% | | | | | | | | |
| | 1,858 | | | Bank of America Corp. | | 7.2500 | | Perpetual | | | 2,821,522 | |
| | 1,628 | | | Wells Fargo & Co. | | 7.5000 | | Perpetual | | | 2,471,141 | |
| | | | | | | | | | | | 5,292,663 | |
| | | | | ELECTRIC UTILITIES - 11.0% | | | | | | | | |
| | 21,636 | | | Dominion Energy, Inc. | | 7.2500 | | 6/1/2022 | | | 2,170,740 | |
| | 26,900 | | | DTE Energy Co. | | 6.2500 | | 11/1/2022 | | | 1,294,966 | |
| | 25,118 | | | NextEra Energy, Inc. | | 5.2790 | | 3/1/2023 | | | 1,276,999 | |
| | 34,713 | | | NextEra Energy, Inc. | | 4.8720 | | 9/1/2022 | | | 2,055,010 | |
| | 27,233 | | | Southern Co. | | 6.7500 | | 8/1/2022 | | | 1,413,393 | |
| | | | | | | | | | | | 8,211,108 | |
| | | | | MACHINERY - 4.4% | | | | | | | | |
| | 23,305 | | | Stanley Black & Decker, Inc. | | 5.2500 | | Perpetual | | | 2,606,431 | |
| | 510 | | | Stanley Black & Decker, Inc. | | 5.0000 | | Perpetual | | | 630,719 | |
| | | | | | | | | | | | 3,237,150 | |
| | | | | MEDICAL EQUIPMENT & DEVICES - 7.2% | | | | | | | | |
| | 20,565 | | | Boston Scientific Corp. | | 5.5000 | | 6/1/2023 | | | 2,247,373 | |
| | 805 | | | Danaher Corp. | | 4.7500 | | 4/15/2022 | | | 1,214,600 | |
| | 1,450 | | | Danaher Corp. | | 5.0000 | | 4/15/2023 | | | 1,874,241 | |
| | | | | | | | | | | | 5,336,214 | |
| | | | | SEMICONDUCTORS - 4.7% | | | | | | | | |
| | 2,444 | | | Broadcom, Inc. | | 8.0000 | | 9/30/2022 | | | 3,476,517 | |
| | | | | | | | | | | | | |
| | | | | TOTAL PREFERRED STOCKS (Cost - $24,449,538) | | | | 26,734,128 | |
| | | | | | | | | | | | | |
| Shares | | | | | | | | | | | |
| | | | | SHORT-TERM INVESTMENTS - 2.7% | | | | | | | | |
| | 2,033,670 | | | First American Government Obligations Fund - Class U, 0.04% * | | | | 2,033,670 | |
| | | | | TOTAL SHORT-TERM INVESTMENTS (Cost - $2,033,670) | | | | | |
| | | | | | | | | | | | | |
| | | | | TOTAL INVESTMENTS - 99.0% (Cost $65,518,700) | | | $ | 73,607,748 | |
| | | | | OTHER ASSETS LESS LIABILITIES - 1.0% | | | | | | | 729,913 | |
| | | | | NET ASSETS - 100.0% | | | | | | $ | 74,337,661 | |
Perpetual - Perpetual Preferred Stocks are fixed income instruments without defined maturity dates.
| * | Rate shown represents the rate at December 31, 2020, and is subject to change and resets daily. |
| (a) | Securities exempt from registration under Rule 144A of Securities Act of 1933. These securities are considered liquid and may be resold in transactions exempt from registration to qualified institutional buyers. At December 31, 2020, these securities amounted to $8,093,519 or 10.89% of net assets. |
See accompanying notes to financial statements.
| RATIONAL SPECIAL SITUATIONS INCOME FUND |
| PORTFOLIO OF INVESTMENTS |
| December 31, 2020 |
| Principal | | | | | | | Coupon | | | | | |
| Amount ($) | | | | | Variable Rate | | Rate (%) | | Maturity | | Value | |
| | | | | ASSET BACKED SECURITIES - 90.0% | | | | | | | | | | |
| | | | | COLLATERALIZED DEBT OBLIGATIONS - 1.5% | | | | | | | | | | |
| | 1,761,382 | | | Aspen Funding I Ltd. (b) ** | | | | 9.0600 | | 7/10/2037 | | $ | 1,889,963 | |
| | 5,762,359 | | | Fulton Street CDO Ltd. (b,c) ** | | US0003M + 0.42 | | 0.6384 | | 4/20/2032 | | | 3,254,840 | |
| | 643,125 | | | Soloso CDO 2007-1 Ltd. (b,e,h) ** | | | | — | | 2/15/2037 | | | 428,203 | |
| | 200,000 | | | Tropic CDO V Ltd. (b,e,h) ** | | | | — | | 7/15/2036 | | | 135,762 | |
| | 363,385 | | | Wachovia Repackaged Asset Participating Securities Series 2003-Saybrook Senior (b,c) | | US0003M + 0.55 | | 0.7630 | | 2/8/2035 | | | 297,976 | |
| | | | | | | | | | | | | | 6,006,744 | |
| | | | | COLLATERALIZED MORTGAGE OBLIGATIONS - 59.6% | | | | | | | | | | |
| | 233,765 | | | Adjustable Rate Mortgage Trust 2005-2 (a) | | | | 3.2324 | | 6/25/2035 | | | 234,936 | |
| | 224,478 | | | Adjustable Rate Mortgage Trust 2005-5 (a) | | | | 3.3562 | | 9/25/2035 | | | 211,408 | |
| | 176,597 | | | Adjustable Rate Mortgage Trust 2005-10 (a) | | | | 2.8613 | | 1/25/2036 | | | 164,373 | |
| | 696,267 | | | Adjustable Rate Mortgage Trust 2005-10 (a) | | | | 2.7455 | | 1/25/2036 | | | 664,995 | |
| | 467,986 | | | Adjustable Rate Mortgage Trust 2005-10 (a) | | | | 2.7455 | | 1/25/2036 | | | 452,398 | |
| | 232,751 | | | Adjustable Rate Mortgage Trust 2005-10 (c) | | US0001M + 0.54 | | 0.6880 | | 1/25/2036 | | | 223,295 | |
| | 115,267 | | | Alternative Loan Trust 2003-J3 | | | | 5.2500 | | 11/25/2033 | | | 117,918 | |
| | 515,691 | | | Alternative Loan Trust 2004-2CB | | | | 5.0000 | | 8/25/2054 | | | 505,383 | |
| | 4,240 | | | Alternative Loan Trust 2004-33 (a) | | | | 3.0039 | | 12/25/2034 | | | 4,314 | |
| | 103,496 | | | Alternative Loan Trust 2005-17 (c) | | US0001M + 0.56 | | 0.7080 | | 7/25/2035 | | | 73,998 | |
| | 917,572 | | | Alternative Loan Trust 2005-43 (a) | | | | 3.2509 | | 9/25/2035 | | | 872,439 | |
| | 133,501 | | | Alternative Loan Trust 2005-51 (c) | | US0001M + 0.60 | | 0.7437 | | 11/20/2035 | | | 123,966 | |
| | 107,934 | | | Alternative Loan Trust 2005-63 (a) | | | | 3.2383 | | 12/25/2035 | | | 103,339 | |
| | 1,510,906 | | | Alternative Loan Trust 2006-J6 (c) | | US0001M + 0.50 | | 0.6480 | | 9/25/2036 | | | 759,696 | |
| | 1,843,306 | | | Alternative Loan Trust 2006-J6 (c,g) | | US0001M + 5.50 | | 5.3520 | | 9/25/2036 | | | 428,285 | |
| | 246,154 | | | Alternative Loan Trust 2006-OA7 (c) | | US0001M + 0.42 | | 0.5680 | | 6/25/2046 | | | 190,126 | |
| | 78,583 | | | Alternative Loan Trust 2006-Oc11 (c) | | US0001M + 0.17 | | 0.3180 | | 1/25/2037 | | | 94,175 | |
| | 488,130 | | | Alternative Loan Trust 2007-5CB (c,g) | | US0001M + 5.65 | | 5.5020 | | 4/25/2037 | | | 125,063 | |
| | 396,026 | | | Alternative Loan Trust 2007-5CB | | | | — | | 4/25/2037 | | | 133,225 | |
| | 925,013 | | | Alternative Loan Trust Resecuritization 2005-12R | | | | 6.0000 | | 11/25/2034 | | | 924,448 | |
| | 592,417 | | | American Home Mortgage Assets Trust 2006-1 (c) | | US0001M + 0.19 | | 0.5280 | | 5/25/2046 | | | 512,372 | |
| | 71,753 | | | American Home Mortgage Investment Trust 2004-1 (c) | | US0001M + 0.90 | | 1.0480 | | 4/25/2044 | | | 69,400 | |
| | 2,153,360 | | | American Home Mortgage Investment Trust 2005-2 (d) | | | | 5.8280 | | 9/25/2035 | | | 1,954,524 | |
| | 1,243,662 | | | American Home Mortgage Investment Trust 2005-4 (c) | | US0006M + 1.75 | | 1.9929 | | 11/25/2045 | | | 782,220 | |
| | 440,298 | | | American Home Mortgage Investment Trust 2006-2 (c) | | US0001M + 0.22 | | 0.3680 | | 6/25/2036 | | | 27,276 | |
| | 1,106,790 | | | American Home Mortgage Investment Trust 2006-3 (c) | | US0001M + 0.38 | | 0.5280 | | 12/25/2046 | | | 1,085,902 | |
| | 1,383,810 | | | American Home Mortgage Investment Trust 2007-1 (c) | | US0001M + 0.16 | | 0.3080 | | 5/25/2047 | | | 982,249 | |
| | 442,288 | | | Banc of America Alternative Loan Trust 2005-3 (c) | | US0001M + 0.50 | | 0.6480 | | 4/25/2035 | | | 372,828 | |
| | 132,931 | | | Banc of America Alternative Loan Trust 2005-5 | | | | 6.0000 | | 6/25/2035 | | | 133,659 | |
| | 269,748 | | | Banc of America Alternative Loan Trust 2005-12 | | | | 5.7500 | | 1/25/2036 | | | 284,290 | |
| | 316,199 | | | Banc of America Alternative Loan Trust 2006-4 | | | | 6.0000 | | 5/25/2046 | | | 290,826 | |
| | 582,659 | | | Banc of America Funding 2004-B Trust (a) | | | | 2.1682 | | 12/20/2034 | | | 505,589 | |
| | 145,957 | | | Banc of America Funding 2005-8 Trust | | | | — | | 1/25/2036 | | | 109,365 | |
| | 279,567 | | | Banc of America Funding 2005-B Trust (a) | | | | 3.2209 | | 4/20/2035 | | | 264,631 | |
| | 2,932,527 | | | Banc of America Funding 2005-E Trust (a) | | | | 3.4848 | | 5/20/2035 | | | 2,776,559 | |
| | 185,783 | | | Banc of America Funding 2005-E Trust (c) | | COF 11 + 1.43 | | 1.9330 | | 6/20/2035 | | | 154,204 | |
| | 655,754 | | | Banc of America Funding 2006-B Trust (a) | | | | 3.9333 | | 3/20/2036 | | | 623,104 | |
| | 271,122 | | | Banc of America Funding 2006-C Trust (a) | | | | 3.7753 | | 4/20/2036 | | | 269,012 | |
| | 193,383 | | | Banc of America Funding 2006-D Trust (a) | | | | 3.4990 | | 5/20/2036 | | | 184,564 | |
| | 265,416 | | | Banc of America Funding 2006-F Trust (a) | | | | 3.5596 | | 7/20/2036 | | | 285,757 | |
| | 206,968 | | | Banc of America Funding 2006-I Trust (a) | | | | 2.8879 | | 10/20/2046 | | | 184,961 | |
| | 124,589 | | | Banc of America Funding 2007-4 Trust | | | | 5.5000 | | 11/25/2034 | | | 124,702 | |
| | 160,640 | | | Banc of America Funding 2007-7 Trust (h) | | | | — | | 9/25/2037 | | | 99,730 | |
| | 226,035 | | | Banc of America Funding 2007-C Trust (c) | | US0001M + 0.27 | | 0.6916 | | 5/20/2047 | | | 215,931 | |
| | 142,613 | | | Banc of America Funding 2016-R2 Trust (a,b) | | | | 4.7000 | | 5/1/2033 | | | 136,485 | |
| | 98,487 | | | Banc of America Mortgage 2005-A Trust (a) | | | | 3.6720 | | 2/25/2035 | | | 99,214 | |
| | 837,984 | | | Banc of America Mortgage 2005-G Trust (a) | | | | 3.0425 | | 8/25/2035 | | | 790,333 | |
| | 2,434,275 | | | Banc of America Mortgage 2005-I Trust (a) | | | | 2.5054 | | 10/25/2035 | | | 2,340,823 | |
| | 195,562 | | | Banc of America Mortgage 2006-A Trust (a) | | | | 3.8153 | | 2/25/2036 | | | 167,776 | |
| | 156,965 | | | Banc of America Mortgage 2006-B Trust (a) | | | | 2.9052 | | 11/20/2046 | | | 147,210 | |
| | 69,258 | | | Banc of America Mortgage Trust 2004-2 | | | | 5.5000 | | 3/25/2034 | | | 67,784 | |
| | 36,144 | | | Banc of America Mortgage Trust 2005-3 | | | | 5.5000 | | 3/25/2035 | | | 35,905 | |
| | 5,019,558 | | | BCAP LLC 2011-RR11-I Trust (a,b) | | | | 3.2117 | | 6/27/2036 | | | 4,822,357 | |
| | 3,548,759 | | | BCAP LLC 2011-RR4-I Trust (b) | | | | 5.2500 | | 4/26/2037 | | | 2,638,236 | |
| | 285,558 | | | BCAP LLC Trust 2007-AA2 | | | | 6.0000 | | 3/25/2022 | | | 286,418 | |
| | 388,905 | | | Bear Stearns ALT-A Trust 2004-11 (a) | | | | 2.8664 | | 11/25/2034 | | | 384,692 | |
| | 55,729 | | | Bear Stearns ALT-A Trust 2004-11 (a) | | | | 3.1408 | | 11/25/2034 | | | 56,254 | |
| | 19,291 | | | Bear Stearns ALT-A Trust 2004-9 (a) | | | | 3.5012 | | 9/25/2034 | | | 20,920 | |
| | 5,681,375 | | | Bear Stearns ALT-A Trust 2005-10 (c) | | US0001M + 0.50 | | 0.6480 | | 1/25/2036 | | | 7,079,408 | |
| | 139,285 | | | Bear Stearns ALT-A Trust 2005-10 (a) | | | | 3.1493 | | 1/25/2036 | | | 132,388 | |
| | 142,004 | | | Bear Stearns ALT-A Trust 2005-4 (a) | | | | 3.4211 | | 5/25/2035 | | | 140,587 | |
| | 4,225,743 | | | Bear Stearns ALT-A Trust 2006-1 (c) | | US0001M + 0.48 | | 0.6280 | | 2/25/2036 | | | 4,157,702 | |
| | 3,004,105 | | | Bear Stearns ALT-A Trust 2006-2 (c) | | US0001M + 0.44 | | 0.5880 | | 4/25/2036 | | | 3,555,392 | |
| | 283,041 | | | Bear Stearns ALT-A Trust 2006-3 (c) | | US0001M + 0.38 | | 0.5280 | | 5/25/2036 | | | 314,108 | |
| | 120,812 | | | Bear Stearns ALT-A Trust 2006-3 (a) | | | | 3.9729 | | 5/25/2036 | | | 94,729 | |
See accompanying notes to financial statements.
| RATIONAL SPECIAL SITUATIONS INCOME FUND |
| PORTFOLIO OF INVESTMENTS (Continued) |
| December 31, 2020 |
| Principal | | | | | | | Coupon | | | | | |
| Amount ($) | | | | | Variable Rate | | Rate (%) | | Maturity | | Value | |
| | | | | ASSET BACKED SECURITIES - 90.0% (Continued) | | | | | | | | | | |
| | | | | COLLATERALIZED MORTGAGE OBLIGATIONS - 59.6% (Continued) | | | | | | | | | | |
| | 584,857 | | | Bear Stearns ALT-A Trust 2006-3 (a) | | | | 3.7585 | | 5/25/2036 | | $ | 398,512 | |
| | 918,523 | | | Bear Stearns ALT-A Trust 2006-R1 (a) | | | | 3.2288 | | 8/25/2036 | | | 919,838 | |
| | 51,096 | | | Bear Stearns ALT-A Trust II 2007-1 (a) | | | | 3.2671 | | 9/25/2047 | | | 34,570 | |
| | 54,481 | | | Bear Stearns ARM Trust 2003-8 (a) | | | | 4.0000 | | 1/25/2034 | | | 52,156 | |
| | 18,661 | | | Bear Stearns ARM Trust 2004-1 (a) | | | | 2.9056 | | 4/25/2034 | | | 18,415 | |
| | 94,880 | | | Bear Stearns ARM Trust 2004-10 (a) | | | | 3.2301 | | 1/25/2035 | | | 98,439 | |
| | 1,979,925 | | | Bear Stearns ARM Trust 2005-12 (a) | | | | 2.5578 | | 2/25/2036 | | | 1,659,267 | |
| | 396,813 | | | Bear Stearns ARM Trust 2005-3 (a) | | | | 3.4455 | | 6/25/2035 | | | 397,557 | |
| | 328,641 | | | Bear Stearns ARM Trust 2005-8 (a,b) | | | | 4.1523 | | 8/25/2035 | | | 323,620 | |
| | 220,547 | | | Bear Stearns Asset Backed Securities I Trust 2005-AC5 (c) | | US0001M + 1.00 | | 1.1480 | | 8/25/2035 | | | 162,278 | |
| | 56,132 | | | Bear Stearns Asset Backed Securities Trust 2007-SD2 | | | | — | | 9/25/2046 | | | 37,403 | |
| | 145,069 | | | Bear Stearns Mortgage Funding Trust 2006-AR5 (c) | | US0001M + 0.19 | | 0.3380 | | 1/25/2037 | | | 130,495 | |
| | 37,601 | | | Bear Stearns Mortgage Securities, Inc. (a) | | | | 6.2693 | | 3/25/2031 | | | 37,650 | |
| | 221,582 | | | Chase Mortgage Finance Trust Series 2005-S1 | | | | 5.0000 | | 5/25/2035 | | | 205,492 | |
| | 90,897 | | | CHL Mortgage Pass-Through Trust 2004-8 | | | | 0.0001 | | 7/25/2034 | | | 72,455 | |
| | 3,983 | | | CHL Mortgage Pass-Through Trust 2005-11 (c) | | US0001M + 0.32 | | 0.4680 | | 4/25/2035 | | | 2,530 | |
| | 177,754 | | | CHL Mortgage Pass-Through Trust 2005-15 | | | | 5.1000 | | 8/25/2035 | | | 178,915 | |
| | 3,152 | | | CHL Mortgage Pass-Through Trust 2005-7 (c) | | US0001M + 0.72 | | 0.8680 | | 3/25/2035 | | | 1,228 | |
| | 324,043 | | | CHL Mortgage Pass-Through Trust 2005-J2 | | | | 5.0000 | | 8/25/2035 | | | 252,645 | |
| | 555,333 | | | CitiCorp. Mortgage Securities, Inc. (a) | | | | 5.5000 | | 3/25/2035 | | | 572,884 | |
| | 204,932 | | | CitiCorp. Mortgage Securities Trust Series 2006-1 (a) | | | | 6.0000 | | 2/25/2036 | | | 213,350 | |
| | 23,029 | | | CitiCorp. Mortgage Securities Trust Series 2007-5 (a) | | | | 5.5000 | | 6/25/2022 | | | 22,909 | |
| | 228,706 | | | Citigroup Mortgage Loan Trust 2004-HYB2 (a) | | | | 3.6811 | | 3/25/2034 | | | 227,887 | |
| | 105,798 | | | Citigroup Mortgage Loan Trust 2005-11 (c) | | H15T1Y + 2.40 | | 2.5200 | | 11/25/2035 | | | 102,283 | |
| | 537,442 | | | Citigroup Mortgage Loan Trust 2006-AR2 (a) | | | | 3.6750 | | 3/25/2036 | | | 510,984 | |
| | 200,190 | | | Citigroup Mortgage Loan Trust 2006-AR5 (a) | | | | 3.2094 | | 7/25/2036 | | | 183,086 | |
| | 5,361 | | | Citigroup Mortgage Loan Trust 2007-10 (a) | | | | 3.1984 | | 9/25/2037 | | | 5,309 | |
| | 2,799,526 | | | Citigroup Mortgage Loan Trust 2008-RR1 (b,c) | | US0001M + 0.07 | | 0.2180 | | 1/25/2037 | | | 2,465,837 | |
| | 481,549 | | | Citigroup Mortgage Loan Trust 2013-8 (a,b) | | | | 2.6701 | | 11/25/2036 | | | 397,701 | |
| | 1,344,139 | | | Citigroup Mortgage Loan Trust 2018-C (b,d) | | | | 4.1250 | | 3/25/2059 | | | 1,344,248 | |
| | 438,291 | | | Citigroup Mortgage Loan Trust 2019-C (b,d) | | | | 3.2280 | | 9/25/2059 | | | 441,726 | |
| | 1,114,140 | | | Citigroup Mortgage Loan Trust, Inc. | | | | 5.7500 | | 11/25/2035 | | | 985,697 | |
| | 26,687 | | | CitiMortgage Alternative Loan Trust Series 2007-A1 | | | | 6.0000 | | 1/25/2037 | | | 26,869 | |
| | 495,984 | | | Credit Suisse First Boston Mortgage Securities Corp. (a,b) | | | | 0.7979 | | 3/25/2032 | | | 462,608 | |
| | 121,172 | | | Credit Suisse First Boston Mortgage Securities Corp. (a) | | | | 2.4509 | | 11/25/2032 | | | 119,765 | |
| | 30,857 | | | Credit Suisse First Boston Mortgage Securities Corp. (a) | | | | 2.4509 | | 11/25/2032 | | | 29,752 | |
| | 53,296 | | | Credit Suisse First Boston Mortgage Securities Corp. | | | | 5.0000 | | 9/25/2034 | | | 53,444 | |
| | 860,378 | | | Credit Suisse First Boston Mortgage Securities Corp. | | | | 5.5000 | | 8/25/2025 | | | 843,987 | |
| | 752,784 | | | CSFB Mortgage-Backed Pass-Through Certificates Series 2002-29 | | | | 7.0000 | | 10/25/2032 | | | 778,213 | |
| | 101,523 | | | CSFB Mortgage-Backed Pass-Through Certificates Series 2003-29 | | | | 6.5000 | | 12/25/2033 | | | 105,052 | |
| | 217,599 | | | CSFB Mortgage-Backed Pass-Through Certificates Series 2004-AR5 (a) | | | | 3.4248 | | 6/25/2034 | | | 219,632 | |
| | 1,251,784 | | | CSFB Mortgage-Backed Pass-Through Certificates Series 2005-9 (c) | | US0001M + 0.35 | | 0.4980 | | 10/25/2035 | | | 1,038,485 | |
| | 2,793,716 | | | CSMC Mortgage-Backed Trust 2006-9 | | | | 6.5000 | | 11/25/2036 | | | 2,443,121 | |
| | 376,768 | | | CSMC Mortgage-Backed Trust 2007-1 | | | | 6.0000 | | 2/25/2037 | | | 337,350 | |
| | 768,895 | | | CSMC Mortgage-Backed Trust 2007-3 (a) | | | | 5.8368 | | 4/25/2037 | | | 322,041 | |
| | 775,811 | | | CSMC Mortgage-Backed Trust 2007-3 | | | | 5.0000 | | 4/25/2037 | | | 778,487 | |
| | 319,338 | | | CSMC Mortgage-Backed Trust 2007-3 (c) | | US0001M + 0.25 | | 0.3980 | | 4/25/2037 | | | 265,787 | |
| | 363,180 | | | CSMC Mortgage-Backed Trust 2007-4 (c) | | US0001M + 0.40 | | 0.5480 | | 6/25/2037 | | | 252,536 | |
| | 68,662 | | | CSMC Mortgage-Backed Trust 2007-5 | | | | 6.0000 | | 4/25/2029 | | | 68,042 | |
| | 172,918 | | | CSMC Series 2011-6R (a,b) | | | | 3.7592 | | 4/28/2037 | | | 171,905 | |
| | 187,600 | | | CSMC Series 2014-4R (b,c) | | US0001M + 0.20 | | 0.3501 | | 2/27/2036 | | | 182,173 | |
| | 265,652 | | | Deutsche Alt-B Securities, Inc. Mortgage Loan Trust Series 2006-AB2 (a) | | | | 5.0135 | | 6/25/2036 | | | 257,594 | |
| | 43,777 | | | Deutsche Mortgage Securities, Inc. Mortgage Loan Trust Series 2004-1 (a) | | | | 5.5000 | | 9/25/2033 | | | 38,809 | |
| | 992,351 | | | Deutsche Mortgage Securities, Inc. Mortgage Loan Trust 2004-4 (c) | | US0001M + 0.35 | | 0.4980 | | 6/25/2034 | | | 942,722 | |
| | 206,734 | | | Deutsche Mortgage Securities, Inc. Mortgage Loan Trust Series 2006-PR1 (b,c) | | US0001M + 0.28 | | 0.4386 | | 4/15/2036 | | | 141,199 | |
| | 344,542 | | | DSLA Mortgage Loan Trust 2004-AR1 (c) | | US0001M + 0.84 | | 0.9916 | | 9/19/2044 | | | 327,485 | |
| | 53,054 | | | DSLA Mortgage Loan Trust 2004-AR1 (c) | | US0001M + 0.82 | | 0.9716 | | 9/19/2044 | | | 50,696 | |
| | 21,491 | | | DSLA Mortgage Loan Trust 2004-AR1 (c) | | US0001M + 0.84 | | 0.9916 | | 9/19/2044 | | | 20,086 | |
| | 547,029 | | | DSLA Mortgage Loan Trust 2004-AR2 (c) | | US0001M + 0.80 | | 0.9516 | | 11/19/2044 | | | 505,953 | |
| | 2,287,537 | | | DSLA Mortgage Loan Trust 2004-AR4 (c) | | US0001M + 0.35 | | 0.8516 | | 1/19/2045 | | | 2,014,872 | |
| | 3,126,625 | | | DSLA Mortgage Loan Trust 2007-AR1 (c) | | US0001M + 0.14 | | 0.2916 | | 4/19/2047 | | | 2,700,318 | |
| | 522,242 | | | First Horizon Alternative Mortgage Securities Trust 2004-AA5 (a) | | | | 2.6003 | | 12/25/2034 | | | 504,040 | |
| | 366,112 | | | First Horizon Alternative Mortgage Securities Trust 2004-AA7 (a) | | | | 2.4919 | | 2/25/2035 | | | 312,156 | |
| | 40,619 | | | First Horizon Alternative Mortgage Securities Trust 2005-AA1 (a) | | | | 2.9206 | | 3/25/2035 | | | 31,462 | |
| | 1,520,368 | | | First Horizon Alternative Mortgage Securities Trust 2005-AA3 (a) | | | | 2.4101 | | 5/25/2035 | | | 1,074,537 | |
| | 67,195 | | | First Horizon Alternative Mortgage Securities Trust 2006-AA4 (a) | | | | 2.1249 | | 7/25/2036 | | | 57,030 | |
| | 716,895 | | | First Horizon Asset Securities, Inc. (a) | | | | 2.6250 | | 1/25/2036 | | | 514,703 | |
| | 52,200 | | | First Horizon Mortgage Pass-Through Trust 2000-H (a) | | | | 3.5808 | | 5/25/2030 | | | 50,388 | |
| | 32,621 | | | First Horizon Mortgage Pass-Through Trust 2000-H (a) | | | | 3.2206 | | 5/25/2030 | | | 30,446 | |
| | 136,058 | | | First Horizon Mortgage Pass-Through Trust 2004-FL1 (c) | | US0001M + 0.27 | | 0.4180 | | 2/25/2035 | | | 127,043 | |
| | 424,413 | | | First Horizon Mortgage Pass-Through Trust 2005-AR4 (a) | | | | 2.8953 | | 10/25/2035 | | | 418,407 | |
| | 1,171,887 | | | Global Mortgage Securitization Ltd. (b,c) | | US0001M + 0.32 | | 0.4680 | | 11/25/2032 | | | 1,106,552 | |
See accompanying notes to financial statements.
| RATIONAL SPECIAL SITUATIONS INCOME FUND |
| PORTFOLIO OF INVESTMENTS (Continued) |
| December 31, 2020 |
| Principal | | | | | | | Coupon | | | | | |
| Amount ($) | | | | | Variable Rate | | Rate (%) | | Maturity | | Value | |
| | | | | ASSET BACKED SECURITIES - 90.0% (Continued) | | | | | | | | | | |
| | | | | COLLATERALIZED MORTGAGE OBLIGATIONS - 59.6% (Continued) | | | | | | | | | | |
| | 268,431 | | | GMACM Mortgage Loan Trust 2005-AR6 (a) | | | | 3.1397 | | 11/19/2035 | | $ | 227,010 | |
| | 786,210 | | | GreenPoint Mortgage Funding Trust 2005-AR4 (c) | | US0001M + 0.52 | | 0.6680 | | 10/25/2045 | | | 774,195 | |
| | 549,320 | | | GreenPoint Mortgage Funding Trust 2005-AR4 (c) | | US0001M + 0.20 | | 0.3480 | | 10/25/2045 | | | 492,335 | |
| | 439,272 | | | GreenPoint Mortgage Funding Trust 2005-AR5 (c) | | US0001M + 0.54 | | 0.6880 | | 11/25/2045 | | | 383,607 | |
| | 383,956 | | | GreenPoint Mortgage Funding Trust 2005-AR5 (c) | | US0001M + 0.56 | | 0.7080 | | 11/25/2045 | | | 296,746 | |
| | 1,269,114 | | | GreenPoint Mortgage Funding Trust 2006-AR2 (c) | | 12MTA + 2.00 | | 2.6094 | | 3/25/2036 | | | 1,229,753 | |
| | 136,759 | | | GreenPoint Mortgage Funding Trust 2006-AR3 (c) | | US0001M + 0.21 | | 0.5680 | | 4/25/2036 | | | 131,340 | |
| | 732,621 | | | GreenPoint Mortgage Loan Trust 2004-1 (c) | | US0001M + 0.58 | | 0.7230 | | 10/25/2034 | | | 640,671 | |
| | 234,119 | | | GSMPS Mortgage Loan Trust (a,b) | | | | 7.7500 | | 5/19/2027 | | | 234,085 | |
| | 628,077 | | | GSMPS Mortgage Loan Trust 2001-2 (a,b) | | | | 7.5000 | | 6/19/2032 | | | 629,886 | |
| | 42,312 | | | GSR Mortgage Loan Trust 2003-1 (c) | | H15T1Y + 1.75 | | 2.9300 | | 3/25/2033 | | | 42,066 | |
| | 182,527 | | | GSR Mortgage Loan Trust 2003-1 (a) | | | | 3.1211 | | 3/25/2033 | | | 173,300 | |
| | 182,934 | | | GSR Mortgage Loan Trust 2005-8F | | | | 5.0000 | | 11/25/2035 | | | 175,770 | |
| | 172,338 | | | GSR Mortgage Loan Trust 2005-8F | | | | 5.5000 | | 11/25/2035 | | | 181,185 | |
| | 417,279 | | | GSR Mortgage Loan Trust 2005-AR5 (a) | | | | 3.4526 | | 10/25/2035 | | | 414,497 | |
| | 477,067 | | | GSR Mortgage Loan Trust 2005-AR7 (a) | | | | 3.1339 | | 11/25/2035 | | | 448,590 | |
| | 816,933 | | | GSR Mortgage Loan Trust 2007-1F | | | | 6.0000 | | 1/25/2037 | | | 710,223 | |
| | 37,282 | | | GSR Mortgage Loan Trust 2007-1F | | | | 5.5000 | | 1/25/2037 | | | 42,486 | |
| | 3,204,727 | | | GSR Mortgage Loan Trust 2007-3F | | | | 5.7500 | | 5/25/2037 | | | 4,482,603 | |
| | 1,520,660 | | | GSR Mortgage Loan Trust 2007-AR1 (a) | | | | 2.8140 | | 3/25/2037 | | | 1,389,855 | |
| | 8,014 | | | GSR Mortgage Loan Trust 2007-AR1 (a) | | | | 2.3220 | | 3/25/2037 | | | 7,832 | |
| | 111,242 | | | HarborView Mortgage Loan Trust 2003-1 (a) | | | | 2.7849 | | 5/19/2033 | | | 107,389 | |
| | 659,271 | | | HarborView Mortgage Loan Trust 2004-1 (a) | | | | 2.5435 | | 4/19/2034 | | | 542,200 | |
| | 2,326,251 | | | HarborView Mortgage Loan Trust 2004-8 (c) | | US0001M + 0.80 | | 0.9516 | | 11/19/2034 | | | 2,216,386 | |
| | 151,017 | | | HarborView Mortgage Loan Trust 2004-9 (c) | | US0001M + 0.78 | | 0.9316 | | 12/19/2034 | | | 138,329 | |
| | 6,093 | | | HarborView Mortgage Loan Trust 2005-1 (c) | | US0001M + 0.66 | | 0.8116 | | 3/19/2035 | | | 4,126 | |
| | 55,667 | | | HarborView Mortgage Loan Trust 2005-14 (a) | | | | 3.1530 | | 12/19/2035 | | | 53,498 | |
| | 245,922 | | | HarborView Mortgage Loan Trust 2005-14 (a) | | | | 2.9945 | | 12/19/2035 | | | 234,466 | |
| | 2,748,754 | | | HarborView Mortgage Loan Trust 2005-2 (c) | | US0001M + 0.52 | | 0.6716 | | 5/19/2035 | | | 1,407,379 | |
| | 639,539 | | | HarborView Mortgage Loan Trust 2005-4 (a) | | | | 2.9654 | | 7/19/2035 | | | 641,845 | |
| | 29,455 | | | HarborView Mortgage Loan Trust 2005-8 (c) | | US0001M + 0.66 | | 0.8116 | | 9/19/2035 | | | 24,824 | |
| | 33,815 | | | Impac CMB Trust Series 2003-11 (c) | | US0001M + 4.50 | | 4.6480 | | 10/25/2033 | | | 33,412 | |
| | 3,436 | | | Impac CMB Trust Series 2003-8 (c) | | US0001M + 2.63 | | 2.7730 | | 10/25/2033 | | | 3,410 | |
| | 6,253 | | | Impac CMB Trust Series 2003-8 (c) | | US0001M + 4.50 | | 4.6480 | | 10/25/2033 | | | 6,010 | |
| | 273,026 | | | Impac CMB Trust Series 2004-10 (c) | | US0001M + 0.80 | | 0.9480 | | 3/25/2035 | | | 248,341 | |
| | 59,046 | | | Impac CMB Trust Series 2004-10 (c) | | US0001M + 1.50 | | 1.6480 | | 3/25/2035 | | | 56,617 | |
| | 217,626 | | | Impac CMB Trust Series 2004-10 (c) | | US0001M + 2.78 | | 2.9230 | | 3/25/2035 | | | 215,499 | |
| | 86,057 | | | IndyMac IMSC Mortgage Loan Trust 2007-F3 | | | | 0.0000 | | 9/25/2037 | | | 56,948 | |
| | 184,627 | | | IndyMac INDA Mortgage Loan Trust 2005-AR1 (a) | | | | 3.2496 | | 11/25/2035 | | | 176,039 | |
| | 36,058 | | | IndyMac INDA Mortgage Loan Trust 2005-AR2 (a) | | | | 3.6626 | | 1/25/2036 | | | 35,079 | |
| | 1,600,371 | | | IndyMac INDX Mortgage Loan Trust 2004-AR2 (a) | | | | 3.2799 | | 6/25/2034 | | | 1,620,886 | |
| | 170,157 | | | IndyMac INDX Mortgage Loan Trust 2006-AR2 (c) | | US0001M + 0.21 | | 0.5680 | | 2/25/2046 | | | 136,392 | |
| | 1,621,560 | | | Jefferies Resecuritization Trust 2009-R7 (a,b) | | | | 2.8557 | | 10/21/2035 | | | 1,710,838 | |
| | 519,261 | | | JP Morgan Alternative Loan Trust | | | | 5.0000 | | 12/25/2035 | | | 513,014 | |
| | 190,217 | | | JP Morgan Alternative Loan Trust (d) | | | | 6.6900 | | 5/25/2036 | | | 183,168 | |
| | 90,561 | | | JP Morgan Mortgage Trust 2004-S2 | | | | 5.5000 | | 11/25/2024 | | | 91,281 | |
| | 338,271 | | | JP Morgan Mortgage Trust 2004-S2 | | | | 6.0000 | | 11/25/2034 | | | 340,685 | |
| | 2,829,213 | | | JP Morgan Mortgage Trust 2005-A6 (a) | | | | 2.9934 | | 8/25/2035 | | | 2,738,791 | |
| | 1,172,659 | | | JP Morgan Mortgage Trust 2005-A8 (a) | | | | 2.9561 | | 11/25/2035 | | | 1,068,047 | |
| | 312,015 | | | JP Morgan Mortgage Trust 2006-A6 (a) | | | | 3.2415 | | 10/25/2036 | | | 279,922 | |
| | 94,797 | | | JP Morgan Mortgage Trust 2007-A2 (a) | | | | 3.2933 | | 4/25/2037 | | | 80,316 | |
| | 246,992 | | | Lehman Mortgage Trust 2006-4 | | | | 6.0000 | | 8/25/2021 | | | 246,623 | |
| | 497,021 | | | Lehman Mortgage Trust 2006-7 (a) | | | | 4.8442 | | 9/25/2036 | | | 189,476 | |
| | 210,545 | | | Lehman Mortgage Trust 2007-3 (h) | | | | 0.0000 | | 3/25/2037 | | | 160,917 | |
| | 154,652 | | | Lehman XS Trust 2007-5H (a) | | | | 2.6069 | | 5/25/2037 | | | 142,432 | |
| | 701,040 | | | Lehman XS Trust Series 2005-5N (c) | | US0001M + 0.36 | | 0.5080 | | 11/25/2035 | | | 637,064 | |
| | 415,003 | | | Lehman XS Trust Series 2006-2N (c) | | US0001M + 0.26 | | 0.6680 | | 2/25/2046 | | | 372,298 | |
| | 551,433 | | | Luminent Mortgage Trust 2006-7 (c) | | US0001M + 0.36 | | 0.5080 | | 12/25/2036 | | | 516,596 | |
| | 28,170 | | | Luminent Mortgage Trust 2006-7 (c) | | US0001M + 0.17 | | 0.3180 | | 12/25/2036 | | | 26,440 | |
| | 854,367 | | | Luminent Mortgage Trust 2007-2 (c) | | US0001M + 0.23 | | 0.6080 | | 5/25/2037 | | | 774,227 | |
| | 350,000 | | | MASTR Adjustable Rate Mortgages Trust 2004-11 (c) | | US0001M + 1.75 | | 2.3980 | | 11/25/2034 | | | 336,464 | |
| | 1,249,223 | | | MASTR Adjustable Rate Mortgages Trust 2004-14 (c) | | US0001M + 3.40 | | 3.5480 | | 1/25/2035 | | | 1,032,456 | |
| | 4,363,934 | | | MASTR Adjustable Rate Mortgages Trust 2006-OA2 (c) | | 12MTA + 0.80 | | 1.4094 | | 12/25/2046 | | | 7,825,182 | |
| | 565,474 | | | MASTR Adjustable Rate Mortgages Trust 2006-OA2 (c) | | 12MTA + 0.80 | | 1.4094 | | 12/25/2046 | | | 1,092,709 | |
| | 5,608,359 | | | MASTR Adjustable Rate Mortgages Trust 2006-OA2 (c) | | 12MTA + 0.85 | | 1.4594 | | 12/25/2046 | | | 10,837,847 | |
| | 3,429,354 | | | MASTR Adjustable Rate Mortgages Trust 2006-OA2 (c) | | 12MTA + 1.20 | | 1.8094 | | 12/25/2046 | | | 6,657,232 | |
| | 51,533 | | | MASTR Adjustable Rate Mortgages Trust 2007-1 (c) | | US0001M + 0.16 | | 0.3080 | | 1/25/2047 | | | 60,009 | |
| | 5,884,265 | | | MASTR Adjustable Rate Mortgages Trust 2007-1 (c) | | 12MTA + 0.74 | | 1.4834 | | 1/25/2047 | | | 10,758,712 | |
| | 183,816 | | | MASTR Adjustable Rate Mortgages Trust 2007-3 (c) | | US0001M + 0.68 | | 0.8280 | | 5/25/2047 | | | 202,012 | |
| | 30,175,837 | | | MASTR Adjustable Rate Mortgages Trust 2007-3 22A2 (e,f,h) | | US001M+0.42 | | 0.3800 | | 5/25/2047 | | | 3,100,000 | |
| | 874,027 | | | MASTR Alternative Loan Trust 2004-13 | | | | 5.5000 | | 1/25/2035 | | | 705,613 | |
| | 90,156 | | | MASTR Alternative Loan Trust 2005-6 | | | | 0.0000 | | 12/25/2035 | | | 42,188 | |
| | 49,712 | | | MASTR Alternative Loan Trust 2006-2 | | | | 0.0000 | | 3/25/2036 | | | 26,156 | |
See accompanying notes to financial statements.
| RATIONAL SPECIAL SITUATIONS INCOME FUND |
| PORTFOLIO OF INVESTMENTS (Continued) |
| December 31, 2020 |
| Principal | | | | | | | Coupon | | | | | |
| Amount ($) | | | | | Variable Rate | | Rate (%) | | Maturity | | Value | |
| | | | | ASSET BACKED SECURITIES - 90.0% (Continued) | | | | | | | | | | |
| | | | | COLLATERALIZED MORTGAGE OBLIGATIONS - 59.6% (Continued) | | | | | | | | | | |
| | 69,971 | | | MASTR Asset Securitization Trust 2004-3 | | | | 5.2500 | | 3/25/2024 | | $ | 70,246 | |
| | 132,185 | | | MASTR Asset Securitization Trust 2004-9 | | | | 5.2500 | | 7/25/2034 | | | 130,836 | |
| | 82,552 | | | MASTR Seasoned Securitization Trust 2003-1 (c) | | US0001M + 0.40 | | 0.5480 | | 2/25/2033 | | | 73,510 | |
| | 156,129 | | | Mellon Residential Funding Cor Mor Pas Thr Tr Ser 1999-tbc3 (a,b) | | | | 2.6100 | | 10/20/2029 | | | 140,938 | |
| | 93,617 | | | Mellon Residential Funding Cor Mor Pas Thr Tr Ser 1999-tbc3 (a,b) | | | | 2.6100 | | 10/20/2029 | | | 84,501 | |
| | 430,832 | | | Merrill Lynch Mortgage Backed Securities Trust Series 2007-1 (a) | | | | 3.5366 | | 4/25/2037 | | | 427,438 | |
| | 908 | | | Merrill Lynch Mortgage Investors Trust Series 2005-A3 (c) | | US0001M + 0.27 | | 0.6880 | | 4/25/2035 | | | 907 | |
| | 190,586 | | | Merrill Lynch Mortgage Investors Trust Series 2006-AF1 | | | | 0.0000 | | 8/25/2036 | | | 36,209 | |
| | 1,034,792 | | | Merrill Lynch Mortgage Investors Trust Series MLCC 2007-2 (a) | | | | 2.6923 | | 6/25/2037 | | | 991,084 | |
| | 1,980,784 | | | Merrill Lynch Mortgage Investors Trust Series MLMI 2005-A7 (a) | | | | 3.2572 | | 9/25/2035 | | | 1,822,682 | |
| | 422,855 | | | Morgan Stanley Mortgage Loan Trust 2005-10 | | | | 5.5000 | | 12/25/2035 | | | 350,252 | |
| | 206,053 | | | Morgan Stanley Mortgage Loan Trust 2005-4 | | | | 5.0000 | | 8/25/2035 | | | 208,518 | |
| | 205,020 | | | Morgan Stanley Mortgage Loan Trust 2006-2 | | | | 5.2500 | | 2/25/2021 | | | 202,519 | |
| | 19,819 | | | Morgan Stanley Mortgage Loan Trust 2006-7 | | | | 5.0000 | | 6/25/2021 | | | 16,278 | |
| | 328,201 | | | Mortgage Loan Resecuritization Trust (b,c) | | US0001M + 0.34 | | 0.4948 | | 4/16/2036 | | | 293,249 | |
| | 463,355 | | | Mortgage Loan Trust Series 2004-3 (c) | | US0001M + 1.88 | | 2.0230 | | 5/25/2034 | | | 461,793 | |
| | 2,515,318 | | | MortgageIT Mortgage Loan Trust 2006-1 (c) | | US0001M + 0.20 | | 0.5480 | | 4/25/2036 | | | 1,959,736 | |
| | 12,500,138 | | | New Residential Mortgage Loan Trust 2019-5 (a,b,g) | | | | 0.5000 | | 8/25/2059 | | | 375,004 | |
| | 17,568,304 | | | New Residential Mortgage Loan Trust 2019-5 (a,b,g) | | | | 0.7500 | | 8/25/2059 | | | 790,574 | |
| | 416,951 | | | New York Mortgage Trust 2006-1 (a) | | | | 3.6881 | | 5/25/2036 | | | 378,459 | |
| | 180,045 | | | Nomura Asset Acceptance Corp. Alternative Loan Trust Series 2004-AR1 (c) | | US0001M + 1.02 | | 1.1680 | | 8/25/2034 | | | 191,104 | |
| | 461,348 | | | Nomura Asset Acceptance Corp. Alternative Loan Trust Series 2006-AF1 (a) | | | | 3.8388 | | 6/25/2036 | | | 465,279 | |
| | 91,505 | | | Nomura Asset Acceptance Corp. Alternative Loan Trust Series 2007-1 (d) | | | | 5.9570 | | 3/25/2047 | | | 95,230 | |
| | 1,163,323 | | | Nomura Asset Acceptance Corp. Alternative Loan Trust Series 2007-1 (d) | | | | 6.1380 | | 3/25/2047 | | | 1,210,497 | |
| | 220,318 | | | NovaStar Mortgage Funding Trust Series 2006-MTA1 (c) | | US0001M + 0.38 | | 0.5177 | | 9/25/2046 | | | 213,945 | |
| | 223,760 | | | Prime Mortgage Trust 2004-1 | | | | 5.2500 | | 8/25/2034 | | | 229,984 | |
| | 34,716 | | | Prime Mortgage Trust 2005-4 | | | | 5.0000 | | 10/25/2035 | | | 34,675 | |
| | 2,929,182 | | | Prime Mortgage Trust 2006-DR1 (b) | | | | 5.5000 | | 5/25/2035 | | | 2,451,652 | |
| | 710,474 | | | Prime Mortgage Trust 2006-DR1 (b) | | | | 6.0000 | | 5/25/2035 | | | 587,488 | |
| | 161,673 | | | PRPM 2019-GS1 (a,b) | | | | 4.7500 | | 10/25/2024 | | | 162,222 | |
| | 725,792 | | | RALI Series 2004-QA4 Trust (a) | | | | 0.2555 | | 9/25/2034 | | | 671,629 | |
| | 465,562 | | | RALI Series 2004-QA4 Trust (a) | | | | 3.2395 | | 9/25/2034 | | | 468,592 | |
| | 76,908 | | | RALI Series 2004-QA6 Trust (a) | | | | 3.5428 | | 12/26/2034 | | | 63,796 | |
| | 2,076,572 | | | RALI Series 2005-QA12 Trust (a) | | | | 4.5953 | | 12/25/2035 | | | 1,952,735 | |
| | 280,147 | | | RALI Series 2005-QA2 Trust (a) | | | | 3.9067 | | 2/25/2035 | | | 236,113 | |
| | 406,339 | | | RALI Series 2005-QA3 Trust (a) | | | | 3.9500 | | 3/25/2035 | | | 133,098 | |
| | 1,018,387 | | | RALI Series 2005-QA4 Trust (a) | | | | 4.5941 | | 4/25/2035 | | | 890,238 | |
| | 137,665 | | | RALI Series 2005-QA6 Trust (a) | | | | 4.0281 | | 5/25/2035 | | | 88,137 | |
| | 582,430 | | | RALI Series 2005-QA8 Trust (a) | | | | 3.7485 | | 7/25/2035 | | | 431,056 | |
| | 149,568 | | | RALI Series 2005-QA8 Trust (a) | | | | 3.5596 | | 7/25/2035 | | | 137,745 | |
| | 196,097 | | | RALI Series 2005-QA9 Trust (a) | | | | 3.2986 | | 8/25/2035 | | | 108,733 | |
| | 868,690 | | | RALI Series 2005-QO4 Trust (c) | | US0001M + 0.56 | | 0.7080 | | 12/25/2045 | | | 684,745 | |
| | 2,025,694 | | | RALI Series 2005-QS5 Trust | | | | 5.7000 | | 4/25/2035 | | | 2,065,999 | |
| | 27,826 | | | RALI Series 2006-QA1 Trust (a) | | | | 5.6038 | | 1/25/2036 | | | 24,265 | |
| | 202,773 | | | RALI Series 2006-QA2 Trust (a) | | | | 5.5493 | | 2/25/2036 | | | 167,202 | |
| | 122,159 | | | RALI Series 2006-QS10 Trust | | | | 6.0000 | | 8/25/2036 | | | 121,472 | |
| | 89,848 | | | RALI Series 2006-QS12 Trust | | | | 5.0000 | | 9/25/2036 | | | 84,273 | |
| | 685,934 | | | RALI Series 2007-QH4 Trust (c) | | US0001M + 0.19 | | 0.3380 | | 5/25/2037 | | | 646,127 | |
| | 207,132 | | | RAMP Series 2003-SL1 Trust | | | | 8.0000 | | 4/25/2031 | | | 211,229 | |
| | 785,143 | | | RAMP Series 2004-SL1 Trust | | | | 6.5000 | | 11/25/2031 | | | 765,418 | |
| | 320,217 | | | RAMP Series 2004-SL4 Trust | | | | 7.5000 | | 7/25/2032 | | | 203,445 | |
| | 174,530 | | | RAMP Series 2005-SL1 Trust | | | | 7.5000 | | 5/25/2032 | | | 34,100 | |
| | 225,883 | | | RAMP Series 2005-SL1 Trust | | | | 7.5000 | | 5/25/2032 | | | 227,109 | |
| | 676,572 | | | RAMP Series 2005-SL1 Trust | | | | 8.0000 | | 5/25/2032 | | | 532,101 | |
| | 305,622 | | | RAMP Series 2005-SL2 Trust | | | | 8.0000 | | 10/25/2031 | | | 216,250 | |
| | 892,970 | | | RBSGC Mortgage Loan Trust 2005-A | | | | 6.0000 | | 4/25/2035 | | | 899,690 | |
| | 1,922,349 | | | RBSSP Resecuritization Trust 2009-6 (b) | | | | 6.0000 | | 8/26/2035 | | | 1,277,866 | |
| | 181,778 | | | Reperforming Loan REMIC Trust 2004-R1 (b) | | | | 6.5000 | | 11/25/2034 | | | 182,002 | |
| | 730,539 | | | Reperforming Loan REMIC Trust 2006-R2 (b,c) | | US0001M + 0.42 | | 0.5680 | | 7/25/2036 | | | 661,089 | |
| | 304,209 | | | Residential Asset Securitization Trust 2004-A2 (c) | | US0001M + 0.55 | | 0.6980 | | 5/25/2034 | | | 289,551 | |
| | 279,169 | | | Residential Asset Securitization Trust 2006-A3CB (a) | | | | 6.0000 | | 1/25/2046 | | | 71,454 | |
| | 262,456 | | | Residential Asset Securitization Trust 2006-A3CB | | | | 0.0000 | | 1/25/2046 | | | 63,733 | |
| | 1,520,867 | | | RFMSI Series 2005-SA1 Trust (a) | | | | 3.4312 | | 3/25/2035 | | | 1,258,691 | |
| | 4,833 | | | RFMSI Series 2005-SA2 Trust (a) | | | | 3.5111 | | 6/25/2035 | | | 4,807 | |
| | 1,390,995 | | | RFMSI Series 2005-SA5 Trust (a) | | | | 3.5481 | | 11/25/2035 | | | 1,327,569 | |
| | 2,714,725 | | | RFMSI Series 2006-SA2 Trust (a) | | | | 4.7637 | | 8/25/2036 | | | 2,502,574 | |
| | 191,074 | | | RFMSI Series 2006-SA3 Trust (a) | | | | 4.2759 | | 9/25/2036 | | | 178,077 | |
| | 283,531 | | | RFMSI Series 2006-SA4 Trust (a) | | | | 4.7828 | | 11/25/2036 | | | 270,799 | |
| | 285,805 | | | Sequoia Mortgage Trust 2007-1 (a) | | | | 2.9484 | | 1/20/2047 | | | 246,253 | |
| | 154,371 | | | Sofi Mortgage Trust 2016-1 (a,b) | | | | 3.0000 | | 11/25/2046 | | | 154,099 | |
| | 356,611 | | | Structured Adjustable Rate Mortgage Loan Trust (c) | | US0001M + 0.31 | | 0.4580 | | 7/25/2035 | | | 258,523 | |
| | 61,243 | | | Structured Adjustable Rate Mortgage Loan Trust (a) | | | | 3.4213 | | 3/25/2034 | | | 60,835 | |
See accompanying notes to financial statements.
| RATIONAL SPECIAL SITUATIONS INCOME FUND |
| PORTFOLIO OF INVESTMENTS (Continued) |
| December 31, 2020 |
| Principal | | | | | | | Coupon | | | | | |
| Amount ($) | | | | | Variable Rate | | Rate (%) | | Maturity | | Value | |
| | | | | ASSET BACKED SECURITIES - 90.0% (Continued) | | | | | | | | | | |
| | | | | COLLATERALIZED MORTGAGE OBLIGATIONS - 59.6% (Continued) | | | | | | | | | | |
| | 2,238,137 | | | Structured Adjustable Rate Mortgage Loan Trust (c) | | US0001M + 0.41 | | 0.5530 | | 6/25/2034 | | $ | 2,071,719 | |
| | 502,876 | | | Structured Adjustable Rate Mortgage Loan Trust Series 2005-19XS (c) | | US0001M + 0.32 | | 0.4680 | | 10/25/2035 | | | 486,321 | |
| | 358,913 | | | Structured Adjustable Rate Mortgage Loan Trust Series 2007-3 (a) | | | | 3.7599 | | 4/25/2047 | | | 355,465 | |
| | 275,689 | | | Structured Asset Mortgage Investments II Trust 2004-AR6 (c) | | US0001M + 0.40 | | 0.5516 | | 2/19/2035 | | | 258,441 | |
| | 1,377,910 | | | Structured Asset Mortgage Investments II Trust 2005-AR2 (c) | | US0001M + 0.46 | | 0.6080 | | 5/25/2045 | | | 1,003,098 | |
| | 751,973 | | | Structured Asset Mortgage Investments II Trust 2006-AR1 (c) | | US0001M + 0.23 | | 0.6080 | | 2/25/2036 | | | 696,791 | |
| | 189,446 | | | Structured Asset Mortgage Investments II Trust 2006-AR2 (c) | | US0001M + 0.23 | | 0.6080 | | 2/25/2036 | | | 167,958 | |
| | 173,846 | | | Structured Asset Mortgage Investments II Trust 2006-AR3 (a) | | | | 2.8841 | | 5/25/2036 | | | 105,725 | |
| | 489,088 | | | Structured Asset Mortgage Investments II Trust 2006-AR5 (c) | | US0001M + 0.21 | | 0.5680 | | 5/25/2046 | | | 429,505 | |
| | 2,304,912 | | | Structured Asset Mortgage Investments II Trust 2006-AR5 (c) | | US0001M + 0.21 | | 0.5680 | | 5/25/2046 | | | 1,478,190 | |
| | 74,244 | | | Structured Asset Mortgage Investments II Trust 2006-AR6 (c) | | US0001M + 0.19 | | 0.3380 | | 7/25/2046 | | | 56,638 | |
| | 230,960 | | | Structured Asset Mortgage Investments II Trust 2007-AR1 (c) | | US0001M + 0.18 | | 0.3280 | | 1/25/2037 | | | 200,813 | |
| | 95,607 | | | Structured Asset Mortgage Investments II Trust 2007-AR2 (c) | | US0001M + 0.30 | | 0.4480 | | 2/25/2037 | | | 89,543 | |
| | 834,450 | | | Structured Asset Mortgage Investments II Trust 2007-AR2 (c) | | US0001M + 0.26 | | 0.4080 | | 3/25/2037 | | | 351,487 | |
| | 774,913 | | | Structured Asset Mortgage Investments Trust 2002-AR5 (c) | | US0001M + 1.20 | | 1.3516 | | 5/19/2033 | | | 693,810 | |
| | 2,510 | | | Structured Asset Securities Corp. Mortgage Pass-Through Certificates Series 2001-14a (a) | | | | 2.1806 | | 7/25/2032 | | | 2,363 | |
| | 2,102,564 | | | Structured Asset Securities Corp. Mortgage Pass-Through Certificates Series 2003-40A (a) | | | | 2.4892 | | 1/25/2034 | | | 1,333,544 | |
| | 146,625 | | | Structured Asset Securities Corp. Mortgage Pass-Through Certificates Series 2002-21A (a) | | | | 2.3606 | | 11/25/2032 | | | 144,363 | |
| | 627,427 | | | Structured Asset Securities Corp. Mortgage Loan Trust Series 2006-RF3 (a,b) | | | | 3.0458 | | 10/25/2036 | | | 619,880 | |
| | 149,826 | | | Structured Asset Securities Corp. Mortgage Pass-Through Certificates Series 2003 (d) | | | | 3.8926 | | 8/25/2033 | | | 155,083 | |
| | 1,166,166 | | | TBW Mortgage-Backed Trust 2006-6 (d) | | | | 5.6600 | | 1/25/2037 | | | 468,881 | |
| | 444,324 | | | Terwin Mortgage Trust 2007-6ALT (b,c) | | US0001M + 0.30 | | 0.4480 | | 8/25/2038 | | | 372,104 | |
| | 198,224 | | | Thornburg Mortgage Securities Trust 2007-3 (c) | | US0012M + 1.25 | | 1.5886 | | 6/25/2047 | | | 193,921 | |
| | 2,276,178 | | | Voyager CNTYW Delaware Trust (a,b) | | | | 0.3986 | | 2/16/2036 | | | 2,024,961 | |
| | 19,652,924 | | | Voyager CNTYW Delaware Trust (a,b) | | | | 0.3586 | | 5/16/2036 | | | 17,333,804 | |
| | 8,233,018 | | | Voyager CNTYW Delaware Trust (a,b) | | | | 0.3986 | | 2/16/2036 | | | 7,277,519 | |
| | 2,192,280 | | | Voyager CNTYW Delaware Trust (a,b) | | | | 0.4586 | | 12/16/2033 | | | 2,055,561 | |
| | 167,709 | | | Voyager OPTONE Delaware Trust (a,b,g) | | | | 0.3980 | | 2/25/2038 | | | 57,468 | |
| | 148,841 | | | Wachovia Mortgage Loan Trust LLC Series 2006-A Trust (a) | | | | 3.2763 | | 5/20/2036 | | | 150,980 | |
| | 156,870 | | | WaMu Mortgage Pass-Through Certificates Series 2002-AR13 Trust (a) | | | | 2.4950 | | 10/25/2032 | | | 149,913 | |
| | 501,268 | | | WaMu Mortgage Pass-Through Certificates Series 2002-AR19 Trust (a) | | | | 3.6603 | | 2/25/2033 | | | 485,918 | |
| | 356,101 | | | WaMu Mortgage Pass-Through Certificates Series 2002-AR6 Trust (c) | | 12MTA + 1.40 | | 2.0094 | | 6/25/2042 | | | 327,841 | |
| | 178,451 | | | WaMu Mortgage Pass-Through Certificates Series 2002-AR6 Trust (c) | | 12MTA + 1.40 | | 2.0094 | | 6/25/2042 | | | 163,378 | |
| | 180,216 | | | WaMu Mortgage Pass-Through Certificates Series 2002-AR6 Trust (c) | | 12MTA + 1.40 | | 2.0094 | | 6/25/2042 | | | 160,456 | |
| | 96,965 | | | WaMu Mortgage Pass-Through Certificates Series 2002-AR9 Trust (c) | | 12MTA + 1.40 | | 2.0094 | | 8/25/2042 | | | 91,482 | |
| | 283,506 | | | WaMu Mortgage Pass-Through Certificates Series 2002-S8 Trust | | | | 5.7500 | | 1/25/2033 | | | 290,997 | |
| | 77,991 | | | WaMu Mortgage Pass-Through Certificates Series 2003-AR10 Trust (a) | | | | 2.5701 | | 10/25/2033 | | | 78,420 | |
| | 309,939 | | | WaMu Mortgage Pass-Through Certificates Series 2003-AR9 Trust (a) | | | | 2.8013 | | 9/25/2033 | | | 301,452 | |
| | 1,395,297 | | | WaMu Mortgage Pass-Through Certificates Series 2003-S4 (a) | | | | 2.5829 | | 6/25/2033 | | | 798,211 | |
| | 76,394 | | | WaMu Mortgage Pass-Through Certificates Series 2006-AR12 Trust (a) | | | | 3.2138 | | 10/25/2036 | | | 68,624 | |
| | 3,260,924 | | | WaMu Mortgage Pass-Through Certificates Series 2006-AR7 Trust (c) | | 12MTA + 0.98 | | 1.5894 | | 7/25/2046 | | | 3,001,679 | |
| | 92,843 | | | WaMu Pass Through Certificates Series 2002-AR12 Trust (a) | | | | 2.3250 | | 10/25/2032 | | | 85,726 | |
| | 133,773 | | | Washington Mutual Mortgage Pass-Through Certificates WMALT Series 2005-1 Trust | | | | 5.5000 | | 3/25/2035 | | | 134,597 | |
| | 427,810 | | | Washington Mutual Mortgage Pass-Through Certificates WMALT Series 2006-2 Trust | | | | 6.0000 | | 3/25/2036 | | | 374,440 | |
| | 2,605,060 | | | Washington Mutual Mortgage Pass-Through Certificates WMALT Series 2006-AR1 Trust (c) | | US0001M + 0.25 | | 0.6480 | | 2/25/2036 | | | 2,175,731 | |
| | 80,823 | | | Washington Mutual Mortgage Pass-Through Certificates WMALT Series 2006-AR2 Trust (c) | | 12MTA + 0.94 | | 1.5494 | | 4/25/2046 | | | 73,660 | |
| | 517,088 | | | Washington Mutual Mortgage Pass-Through Certificates WMALT Series 2006-AR5 Trust (c) | | 12MTA + 0.94 | | 1.5494 | | 7/25/2046 | | | 358,056 | |
| | 865,857 | | | Washington Mutual Mortgage Pass-Through Certificates WMALT Series 2006-AR6 Trust (c) | | 12MTA + 0.96 | | 1.5694 | | 8/25/2046 | | | 574,555 | |
| | 68,785 | | | Washington Mutual Mortgage Pass-Through Certificates WMALT Series 2006-AR8 Trust (c) | | 12MTA + 0.85 | | 1.4594 | | 10/25/2046 | | | 60,903 | |
| | 470,758 | | | Washington Mutual Mortgage Pass-Through Certificates WMALT Series 2007-3 Trust | | | | 6.0000 | | 4/25/2037 | | | 467,846 | |
| | 51,551 | | | Washington Mutual MSC Mortgage Pass-Through Certificates Series 2002-MS4 (b) | | | | 6.5000 | | 10/19/2029 | | | 51,127 | |
| | 51,551 | | | Washington Mutual MSC Mortgage Pass-Through Certificates Series 2002-MS4 (b) | | | | 6.5000 | | 10/19/2029 | | | 51,078 | |
| | 91,462 | | | Washington Mutual MSC Mortgage Pass-Through Certificates Series 2003-AR1 Trust (a) | | | | 3.4970 | | 2/25/2033 | | | 92,219 | |
| | 836,589 | | | Washington Mutual MSC Mortgage Pass-Through Certificates Series 2003-AR2 Trust (a) | | | | 2.5907 | | 5/25/2033 | | | 799,023 | |
| | 1,080,864 | | | Washington Mutual MSC Mortgage Pass-Through Certificates Series 2004-RA2 Trust (a) | | | | 6.9971 | | 7/25/2033 | | | 1,086,775 | |
| | 277,025 | | | Wells Fargo Alternative Loan 2007-PA2 Trust | | | | 5.5000 | | 6/25/2022 | | | 275,166 | �� |
| | 21,627 | | | Wells Fargo Mortgage Backed Securities 2003-I Trust (a) | | | | 0.0001 | | 9/25/2033 | | | 16,653 | |
| | 93,341 | | | Wells Fargo Mortgage Backed Securities 2004-K Trust (a) | | | | 0.0001 | | 7/25/2034 | | | 92,366 | |
| | 35,212 | | | Wells Fargo Mortgage Backed Securities 2006-20 Trust | | | | 5.5000 | | 12/25/2021 | | | 34,990 | |
| | | | | | | | | | | | | | 240,858,340 | |
| | | | | HOME EQUITY - 14.2% | | | | | | | | | | |
| | 1,267,749 | | | ABFS Mortgage Loan Trust 2003-1 (c) | | US0001M + 2.25 | | 2.4086 | | 8/15/2033 | | | 1,263,596 | |
| | 600,083 | | | Accredited Mortgage Loan Trust 2003-3 (d) | | | | 5.2100 | | 1/25/2034 | | | 634,544 | |
| | 892,823 | | | Accredited Mortgage Loan Trust 2005-1 (c) | | US0001M + 3.30 | | 3.4480 | | 4/25/2035 | | | 903,642 | |
| | 9,402 | | | ACE Securities Corp. Home Equity Loan Trust Series 2007-WM1 (c) | | US0001M + 0.07 | | 0.2180 | | 11/25/2036 | | | 5,004 | |
| | 249,014 | | | ACE Securities Corp. Home Equity Loan Trust Series 2007-WM2 (c) | | US0001M + 0.18 | | 0.3280 | | 2/25/2037 | | | 140,433 | |
| | 59,901 | | | Aegis Asset Backed Securities Trust 2004-6 (c) | | US0001M + 1.00 | | 1.1480 | | 3/25/2035 | | | 58,404 | |
| | 66,935 | | | AFC Home Equity Loan Trust (c) | | US0001M + 0.72 | | 0.8680 | | 9/22/2028 | | | 66,006 | |
| | 1,282,434 | | | AFC Trust Series 2000-2 (c) | | US0001M + 0.79 | | 0.9380 | | 6/25/2030 | | | 1,208,746 | |
| | 542,186 | | | AFC Trust Series 2000-2 (c) | | US0001M + 0.70 | | 0.8480 | | 6/25/2030 | | | 507,152 | |
| | 1,025,445 | | | AFC Trust Series 2000-3 (b,c) | | US0001M + 0.75 | | 0.8980 | | 10/25/2030 | | | 967,221 | |
| | 174,774 | | | AFC Trust Series 2000-3 (b,c) | | US0001M + 0.64 | | 0.7880 | | 10/25/2030 | | | 168,092 | |
See accompanying notes to financial statements.
| RATIONAL SPECIAL SITUATIONS INCOME FUND |
| PORTFOLIO OF INVESTMENTS (Continued) |
| December 31, 2020 |
| Principal | | | | | | | Coupon | | | | | |
| Amount ($) | | | | | Variable Rate | | Rate (%) | | Maturity | | Value | |
| | | | | ASSET BACKED SECURITIES - 90.0% (Continued) | | | | | | | | | | |
| | | | | HOME EQUITY - 14.2% (Continued) | | | | | | | | | | |
| | 2,355 | | | American Home Mortgage Investment Trust 2004-4 (c) | | US0001M + 0.20 | | 0.3480 | | 9/25/2030 | | $ | 2,346 | |
| | 276,222 | | | Ameriquest Mortgage Securities Asset-Backed Pass-Through Ctfs Ser 2003 AR1 (c) | | US0001M + 4.50 | | 3.4637 | | 1/25/2033 | | | 282,467 | |
| | 208,031 | | | Asset Backed Securities Corp Home Equity Loan Trust Series 2003-HE3 (c) | | US0001M + 3.53 | | 3.6836 | | 6/15/2033 | | | 210,598 | |
| | 601,270 | | | Asset Backed Securities Corp Home Equity Loan Trust Series 2003-HE5 (c) | | US0001M + 6.38 | | 4.2488 | | 9/15/2033 | | | 585,923 | |
| | 9,034 | | | Asset Backed Securities Corp. Home Equity Loan Trust Series AMQ 2007-HE2 (c) | | US0001M + 0.08 | | 0.2280 | | 5/25/2037 | | | 7,411 | |
| | 71,233 | | | Asset-Backed Pass Through Certificates 2002-3 (c) | | US0001M + 2.85 | | 2.9980 | | 8/25/2032 | | | 71,356 | |
| | 360,997 | | | Bayview Financial Asset Trust 2007-SSR1 (b,c) | | US0001M + 0.80 | | 1.7466 | | 3/25/2037 | | | 335,070 | |
| | 213,247 | | | Bayview Financial Asset Trust 2007-SSR1 (b,c) | | US0001M + 1.15 | | 2.8109 | | 3/25/2037 | | | 205,163 | |
| | 712,907 | | | Bear Stearns Asset Backed Securities I Trust 2005-HE6 (c) | | US0001M + 1.01 | | 1.1530 | | 6/25/2035 | | | 712,422 | |
| | 3,547,332 | | | Bear Stearns Asset Backed Securities I Trust 2005-TC2 (b,c) | | US0001M + 4.50 | | 4.5881 | | 8/25/2035 | | | 3,808,842 | |
| | 1,186,103 | | | Bear Stearns Asset Backed Securities I Trust 2006-EC2 (c) | | US0001M + 0.63 | | 0.7780 | | 2/25/2036 | | | 1,172,215 | |
| | 1,010,867 | | | Bear Stearns Asset Backed Securities I Trust 2006-HE7 (c) | | US0001M + 0.16 | | 0.3080 | | 8/25/2036 | | | 1,282,474 | |
| | 1,377,924 | | | Bear Stearns Asset Backed Securities I Trust 2007-HE2 (c) | | US0001M + 0.23 | | 0.3780 | | 2/25/2037 | | | 1,225,434 | |
| | 178,134 | | | Centex Home Equity Loan Trust 2004-C (c) | | US0001M + 0.80 | | 0.9430 | | 6/25/2034 | | | 169,564 | |
| | 332,914 | | | Centex Home Equity Loan Trust 2004-D (d) | | | | 5.2055 | | 9/25/2034 | | | 352,426 | |
| | 563,703 | | | Citigroup Mortgage Loan Trust 2007-OPX1 (d) | | | | 5.8630 | | 1/25/2037 | | | 311,061 | |
| | 163 | | | Countrywide Asset-Backed Certificates (a) | | | | 5.0910 | | 5/25/2032 | | | 160 | |
| | 65,444 | | | Countrywide Asset-Backed Certificates (d) | | | | 5.2520 | | 2/25/2035 | | | 65,295 | |
| | 5,527 | | | Countrywide Asset-Backed Certificates (a) | | | | 5.8340 | | 7/25/2034 | | | 5,551 | |
| | 41,094 | | | Countrywide Home Equity Loan Trust (c) | | US0001M + 0.15 | | 0.3086 | | 11/15/2036 | | | 35,267 | |
| | 846,202 | | | Countrywide Home Equity Loan Trust (c) | | US0001M + 0.15 | | 0.3086 | | 11/15/2036 | | | 744,736 | |
| | 883,019 | | | Credit Suisse First Boston Mortgage Securities Corp. (c) | | US0001M + 0.74 | | 0.8880 | | 8/25/2032 | | | 852,017 | |
| | 1,725,000 | | | Credit Suisse Seasoned Loan Trust 2006-1 (b,c) | | US0001M + 0.55 | | 0.6980 | | 10/25/2034 | | | 1,604,116 | |
| | 22,994 | | | CWABS Revolving Home Equity Loan Trust Series 2004-J (c) | | US0001M + 0.29 | | 0.4486 | | 12/15/2033 | | | 22,448 | |
| | 130,146 | | | CWABS Revolving Home Equity Loan Trust Series 2004-O (c) | | US0001M + 0.28 | | 0.4386 | | 2/15/2034 | | | 126,873 | |
| | 83,834 | | | CWABS Revolving Home Equity Loan Trust Series 2004-O (c) | | US0001M + 0.28 | | 0.4386 | | 2/15/2034 | | | 78,632 | |
| | 6,695,332 | | | CWHEQ Home Equity Loan Trust Series 2006-S5 | | | | 6.1550 | | 6/25/2035 | | | 7,804,070 | |
| | 950,756 | | | CWHEQ Revolving Home Equity Loan Trust Series 2005-K (c) | | US0001M + 0.24 | | 0.3986 | | 2/15/2036 | | | 892,291 | |
| | 1,505,560 | | | CWHEQ Revolving Home Equity Loan Trust Series 2005-K (c) | | US0001M + 0.34 | | 0.4986 | | 2/15/2036 | | | 1,415,557 | |
| | 1,739,553 | | | CWHEQ Revolving Home Equity Loan Trust Series 2006-D (c) | | US0001M + 0.20 | | 0.3586 | | 5/15/2036 | | | 1,634,352 | |
| | 99,953 | | | CWHEQ Revolving Home Equity Loan Trust Series 2006-I (c) | | US0001M + 0.14 | | 0.2986 | | 1/15/2037 | | | 95,501 | |
| | 408,418 | | | FirstCity Capital Home Equity Loan Trust 1998-2 (b,c) | | US0001M + 0.80 | | 0.9480 | | 1/25/2029 | | | 397,240 | |
| | 12,346 | | | GMACM Home Equity Loan Trust 2005-HE1 (b,c) | | US0001M + 0.50 | | 0.6480 | | 8/25/2035 | | | 16,211 | |
| | 2,667,462 | | | GMACM Home Equity Loan Trust 2007-HE2 (c) | | US0001M + 0.14 | | 0.2880 | | 12/25/2037 | | | 2,508,979 | |
| | 547,645 | | | GMACM Mortgage Loan Trust 2004-GH1 (d) | | | | 5.0000 | | 7/25/2035 | | | 332,883 | |
| | 86,641 | | | GreenPoint Home Equity Loan Trust 2004-4 (c) | | US0001M + 0.28 | | 0.4386 | | 8/15/2030 | | | 85,293 | |
| | 981,573 | | | GSAA Home Equity Trust 2005-2 (c) | | US0001M + 2.18 | | 2.3230 | | 12/25/2034 | | | 1,010,036 | |
| | 15,704 | | | Home Equity Mortgage Trust 2007-1 (c) | | US0001M + 0.34 | | 0.4880 | | 5/25/2037 | | | 14,327 | |
| | 144,059 | | | IMC Home Equity Loan Trust 1998-5 (d) | | | | 6.4543 | | 12/20/2029 | | | 151,412 | |
| | 83,134 | | | Irwin Home Equity Loan Trust 2004-1 (c) | | US0001M + 1.25 | | 2.0230 | | 12/25/2034 | | | 83,064 | |
| | 1,019,425 | | | Irwin Home Equity Loan Trust 2006-P1 (b,c) | | US0001M + 0.28 | | 0.4280 | | 12/25/2036 | | | 973,007 | |
| | 1,541,512 | | | Irwin Home Equity Loan Trust 2006-P1(b,d) | | | | 6.3000 | | 6/25/2037 | | | 1,549,842 | |
| | 530,747 | | | Mastr Asset Backed Securities Trust 2003-NC1 (c) | | US0001M + 5.25 | | 4.0530 | | 4/25/2033 | | | 545,210 | |
| | 259,551 | | | Mastr Asset Backed Securities Trust 2004-WMC2 (c) | | US0001M + 3.23 | | 3.3730 | | 4/25/2034 | | | 270,561 | |
| | 947,349 | | | Mastr Asset Backed Securities Trust 2005-NC2 (c) | | US0001M + 0.50 | | 0.6480 | | 11/25/2035 | | | 710,308 | |
| | 1,516,660 | | | Mastr Asset Backed Securities Trust 2005-NC2 (c) | | US0001M + 0.70 | | 0.8480 | | 11/25/2035 | | | 1,156,998 | |
| | 5,655,435 | | | Merrill Lynch Mortgage Investors Trust Series 2006-FF1 (b,c) | | US0001M + 0.75 | | 1.2730 | | 8/25/2036 | | | 6,107,694 | |
| | 2,350 | | | Morgan Stanley ABS Capital I Inc. Trust 2007-HE4 (c) | | US0001M + 0.11 | | 0.2580 | | 2/25/2037 | | | 989 | |
| | 104,022 | | | Morgan Stanley Dean Witter Capital I Inc. Trust 2001-AM1 (c) | | US0001M + 2.10 | | 2.2480 | | 2/25/2032 | | | 104,447 | |
| | 114,562 | | | Morgan Stanley Mortgage Loan Trust 2006-16AX (c) | | US0001M + 0.17 | | 0.3180 | | 11/25/2036 | | | 45,347 | |
| | 133,554 | | | New Century Home Equity Loan Trust 2003-6 (c) | | US0001M + 1.08 | | 1.2280 | | 1/25/2034 | | | 129,743 | |
| | 378,938 | | | Option One Mortgage Loan Trust 2007-FXD2 (d) | | | | 6.1020 | | 3/25/2037 | | | 384,508 | |
| | 401,740 | | | RAAC Series 2004-SP1 Trust (d) | | | | 6.1180 | | 3/25/2034 | | | 407,448 | |
| | 2,742,835 | | | RASC Series 2004-KS11 Trust (c) | | US0001M + 1.50 | | 1.6480 | | 12/25/2034 | | | 2,749,047 | |
| | 67,659 | | | Renaissance Home Equity Loan Trust 2002-4 (d) | | | | 7.5720 | | 3/25/2033 | | | 58,458 | |
| | 740,474 | | | Renaissance Home Equity Loan Trust 2004-2 (c) | | US0001M + 0.48 | | 1.1080 | | 7/25/2034 | | | 699,147 | |
| | 288,311 | | | Renaissance Home Equity Loan Trust 2004-3 (d) | | | | 5.3240 | | 11/25/2034 | | | 295,379 | |
| | 378,753 | | | Renaissance Home Equity Loan Trust 2005-4 (d) | | | | 5.8250 | | 2/25/2036 | | | 382,260 | |
| | 1,230,732 | | | Saxon Asset Securities Trust 2002-1 (c) | | US0001M + 1.80 | | 1.9480 | | 11/25/2031 | | | 1,142,155 | |
| | 979,656 | | | Structured Asset Securities Corp. Mortgage Pass Through Certificates Ser 2001-SB1 | | | | 3.3750 | | 8/25/2031 | | | 944,687 | |
| | 49,441 | | | Terwin Mortgage Trust 2006-10SL (a,b) | | | | 4.7500 | | 10/25/2037 | | | 27,292 | |
| | 1,313,305 | | | Terwin Mortgage Trust 2006-4SL (a,b) | | | | 4.5000 | | 5/25/2037 | | | 876,379 | |
| | 2,090,246 | | | Terwin Mortgage Trust 2006-6 (a,b) | | | | 0.5017 | | 7/25/2037 | | | 1,184,381 | |
| | 78,718 | | | Wells Fargo Home Equity Asset-Backed Securities 2004-2 Trust (a) | | | | 4.9800 | | 4/25/2034 | | | 80,835 | |
| | | | | | | | | | | | | | 57,460,045 | |
| | | | | MANUFACTURED HOUSING - 0.2% | | | | | | | | | | |
| | 122,974 | | | Oakwood Mortgage Investors, Inc. (a) | | | | 5.1900 | | 6/15/2032 | | | 125,644 | |
| | 960,475 | | | Origen Manufactured Housing Contract Trust 2007-A (a) | | | | 3.0097 | | 4/15/2037 | | | 912,536 | |
| | 45,340 | | | Origen Manufactured Housing Contract Trust 2007-B (b,c) | | US0001M + 1.20 | | 1.3524 | | 10/15/2037 | | | 44,675 | |
| | | | | | | | | | | | | | 1,082,855 | |
See accompanying notes to financial statements.
| RATIONAL SPECIAL SITUATIONS INCOME FUND |
| PORTFOLIO OF INVESTMENTS (Continued) |
| December 31, 2020 |
| Principal | | | | | | | Coupon | | | | | |
| Amount ($) | | | | | Variable Rate | | Rate (%) | | Maturity | | Value | |
| | | | | ASSET BACKED SECURITIES - 90.0% (Continued) | | | | | | | | | | |
| | | | | NON AGENCY CMBS - 5.2% | | | | | | | | | | |
| | 466,351 | | | Banc of America Commercial Mortgage Trust 2006-4 (a) | | | | 5.7540 | | 7/10/2046 | | $ | 460,429 | |
| | 749,973 | | | Banc of America Commercial Mortgage Trust 2007-1 (a) | | | | 5.5230 | | 1/15/2049 | | | 495,959 | |
| | 565,000 | | | Banc of America Commercial Mortgage Trust 2015-UBS7 | | | | 3.1670 | | 9/15/2048 | | | 317,262 | |
| | 1,237,763 | | | Bear Stearns Commercial Mortgage Securities Trust 2006-TOP22 (a,b) | | | | 6.1246 | | 4/12/2038 | | | 1,237,065 | |
| | 435,251 | | | CD 2007-CD5 Mortgage Trust (a,b) | | | | 6.3693 | | 11/15/2044 | | | 430,028 | |
| | 19,207,525 | | | CFCRE Commercial Mortgage Trust 2017-C8 (a,g) | | | | 1.5987 | | 6/15/2050 | | | 1,349,976 | |
| | 2,935,145 | | | CSMC 2014-USA OA LLC (a,b,g) | | | | 0.5401 | | 9/15/2037 | | | 57,589 | |
| | 512,561 | | | DBUBS 2011-LC1 Mortgage Trust (b) | | | | 5.0020 | | 11/10/2046 | | | 512,518 | |
| | 110,000 | | | DBUBS 2011-LC1 Mortgage Trust (a,b) | | | | 5.4710 | | 11/10/2046 | | | 110,094 | |
| | 719,138 | | | Greenwich Capital Commercial Mortgage Trust 2006-RR1 (a,b) | | | | 5.6579 | | 3/18/2049 | | | 695,414 | |
| | 760,000 | | | GS Mortgage Securities Corp. II (b,c) | | US0001M + 2.50 | | 2.6586 | | 9/15/2031 | | | 638,421 | |
| | 1,500,000 | | | GS Mortgage Securities Trust 2010-C1 | | | | 5.1480 | | 8/10/2043 | | | 1,448,117 | |
| | 106,442 | | | GS Mortgage Securities Trust 2011-GC3(b) | | | | 5.3610 | | 3/10/2044 | | | 106,402 | |
| | 1,365,000 | | | GS Mortgage Securities Trust 2011-GC5 (a,b) | | | | 5.2090 | | 8/10/2044 | | | 1,382,050 | |
| | 481,000 | | | GS Mortgage Securities Trust 2011-GC5 (a,b) | | | | 5.3881 | | 8/10/2044 | | | 411,795 | |
| | 214,490 | | | Impac CMB Trust Series 2004-8 (c) | | US0001M + 1.58 | | 1.7230 | | 8/25/2034 | | | 207,183 | |
| | 2,000,000 | | | JP Morgan Chase Commercial Mortgage Securities Trust 2010-C2 (a,b) | | | | 5.6545 | | 11/15/2043 | | | 1,176,474 | |
| | 572,348 | | | JP Morgan Chase Commercial Mortgage Securities Trust 2012-WLDN (b) | | | | 3.9100 | | 5/5/2030 | | | 465,275 | |
| | 107,000 | | | JP Morgan Chase Commercial Mortgage Securities Trust 2013-LC11 (a) | | | | 4.1670 | | 4/15/2046 | | | 73,444 | |
| | 142,461 | | | LB Commercial Mortgage Trust 2007-C3 (b,c) | | US0001M + 0.35 | | 0.4935 | | 7/15/2044 | | | 139,652 | |
| | 387,281 | | | Merrill Lynch Mortgage Trust 2006-C1 (a) | | | | 6.2646 | | 5/12/2039 | | | 377,259 | |
| | 363,000 | | | Morgan Stanley Capital I Trust 2011-C1 (a,b) | | | | 5.5629 | | 9/15/2047 | | | 363,190 | |
| | 2,430,844 | | | Morgan Stanley Capital I Trust 2011-C2 (b) | | | | 4.6610 | | 6/15/2044 | | | 2,444,937 | |
| | 8,000,000 | | | TMSQ 2014-1500 Mortgage Trust (a,b,g) | | | | 0.1549 | | 10/10/2036 | | | 51,736 | |
| | 163,000 | | | UBS Commercial Mortgage Trust 2012-C1 (a,b) | | | | 5.5689 | | 5/10/2045 | | | 125,743 | |
| | 265,000 | | | UBS-Citigroup Commercial Mortgage Trust 2011-C1 (a,b) | | | | 6.0502 | | 1/10/2045 | | | 119,542 | |
| | 460,139 | | | Wachovia Bank Commercial Mortgage Trust Series 2004-C11 (a,b) | | | | 5.3100 | | 1/15/2041 | | | 441,895 | |
| | 1,378,368 | | | Wachovia Bank Commercial Mortgage Trust Series 2005-C21 (a,b) | | | | 5.0999 | | 10/15/2044 | | | 1,292,975 | |
| | 3,000,000 | | | XCALI 2020-5 Mortgage Trust (b,c) | | US0001M + 3.25 | | 4.2500 | | 10/15/2023 | | | 3,009,535 | |
| | 1,000,000 | | | XCALI 2020-5 Mortgage Trust (b,c) | | US0001M + 8.25 | | 9.2500 | | 10/15/2023 | | | 1,004,768 | |
| | | | | | | | | | | | | | 20,946,727 | |
| | | | | OTHER ASSET BACKED SECURITIES - 3.7% | | | | | | | | | | |
| | 147,985 | | | AFC Trust Series 2000-4 (b,c) | | US0001M + 0.77 | | 0.9181 | | 1/25/2031 | | | 143,456 | |
| | 4,650,586 | | | Legal Fee Funding 2006-1 LLC (b) | | | | 8.0000 | | 7/20/2036 | | | 4,796,754 | |
| | 1,238,532 | | | Mosaic Solar Loans 2017-1 LLC (b,h) | | | | — | | 6/20/2042 | | | 1,122,529 | |
| | 414,930 | | | Oakwood Mortgage Investors, Inc. (a.b) | | | | 8.4500 | | 10/15/2026 | | | 416,629 | |
| | 4,000,000 | | | PEAR 2020-1 LLC (b) | | | | 3.7500 | | 12/15/2032 | | | 4,000,000 | |
| | 2,541,950 | | | SolarCity LMC Series III LLC (b) | | | | 5.4400 | | 7/20/2044 | | | 2,582,682 | |
| | | | | | | | | | | | | | 13,062,050 | |
| | | | | RESIDENTIAL MORTGAGE - 6.1% | | | | | | | | | | |
| | 1,000,000 | | | Bear Stearns Asset Backed Securities Trust 2006-SD2 (c) | | US0001M + 0.80 | | 0.9480 | | 6/25/2036 | | | 961,491 | |
| | 97,404 | | | Bear Stearns Asset Backed Securities Trust 2006-SD3 (a) | | | | 3.3454 | | 7/25/2036 | | | 97,748 | |
| | 332,363 | | | Bear Stearns Asset Backed Securities Trust 2006-SD4 (c) | | 12MTA + 0.98 | | 1.5894 | | 10/25/2036 | | | 124,128 | |
| | 422,232 | | | Bear Stearns Asset Backed Securities Trust 2007-SD1 | | | | 6.0000 | | 10/25/2036 | | | 292,459 | |
| | 251,476 | | | Bear Stearns Asset Backed Securities Trust 2007-SD2 | | | | 5.5000 | | 9/25/2046 | | | 254,856 | |
| | 87,303 | | | Chase Funding Trust Series 2003-6 (d) | | | | 4.9955 | | 11/25/2034 | | | 92,005 | |
| | 146,393 | | | Citigroup Mortgage Loan Trust, Inc. (c) | | US0001M + 2.63 | | 2.7730 | | 11/25/2034 | | | 874,632 | |
| | 2,016,968 | | | Countrywide Asset-Backed Certificates (c) | | US0001M + 0.66 | | 0.8080 | | 11/25/2033 | | | 1,916,846 | |
| | 1,221,122 | | | Countrywide Asset-Backed Certificates (c) | | US0001M + 0.50 | | 0.6501 | | 5/25/2037 | | | 987,189 | |
| | 20,472 | | | Credit-Based Asset Servicing and Securitization LLC (a,b) | | | | 5.7965 | | 2/3/2029 | | | 8,701 | |
| | 506,505 | | | Credit-Based Asset Servicing and Securitization LLC (b,c) | | US0001M + 1.60 | | 1.7480 | | 9/25/2035 | | | 508,660 | |
| | 571,000 | | | Credit-Based Asset Servicing and Securitization LLC (b,d) | | | | 5.0207 | | 12/25/2037 | | | 638,292 | |
| | 765,899 | | | Credit-Based Asset Servicing and Securitization LLC (b,c) | | US0001M + 0.46 | | 0.6080 | | 2/25/2037 | | | 630,626 | |
| | 574,288 | | | Credit-Based Asset Servicing and Securitization LLC (b,d) | | | | 5.8250 | | 12/25/2036 | | | 575,661 | |
| | 294,515 | | | Credit-Based Asset Servicing and Securitization LLC (d) | | | | 3.1768 | | 12/25/2036 | | | 293,457 | |
| | 553,042 | | | CSFB Mortgage-Backed Pass-Through Certificates Series 2005-AGE1 (c) | | US0001M + 4.00 | | 4.1480 | | 2/25/2032 | | | 575,979 | |
| | 280,478 | | | CWABS Asset-Backed Certificates Trust 2005-17 (d) | | | | 4.1081 | | 5/25/2036 | | | 287,923 | |
| | 572,106 | | | Equity One Mortgage Pass-Through Trust 2002-1 (a) | | | | 6.2820 | | 8/25/2032 | | | 581,042 | |
| | 209,469 | | | Finance America Mortgage Loan Trust 2004-3 (c) | | US0001M + 0.95 | | 1.0930 | | 11/25/2034 | | | 196,992 | |
| | 195,762 | | | Finance America Mortgage Loan Trust 2004-3 (c) | | US0001M + 1.02 | | 1.1680 | | 11/25/2034 | | | 182,410 | |
| | 1,706,875 | | | Fremont Home Loan Trust 2002-2 (c) | | US0001M + 1.73 | | 1.8730 | | 10/25/2033 | | | 1,718,250 | |
| | 56,309 | | | Fremont Home Loan Trust 2005-A (c) | | US0001M + 0.74 | | 0.8830 | | 1/25/2035 | | | 55,787 | |
| | 650,000 | | | Fremont Home Loan Trust 2005-E (c) | | US0001M + 0.68 | | 0.8230 | | 1/25/2036 | | | 560,140 | |
| | 130,435 | | | GSAMP Trust 2004-HE1 (c) | | US0001M + 0.83 | | 0.9730 | | 5/25/2034 | | | 127,377 | |
| | 1,694,428 | | | GSRPM Mortgage Loan Trust Series 2004-1 (b,c) | | US0001M + 2.50 | | 2.6480 | | 9/25/2042 | | | 1,716,680 | |
| | 59,278 | | | Lehman XS Trust 2006-8 (d) | | | | 4.9452 | | 6/25/2036 | | | 61,456 | |
| | 884,493 | | | Lehman XS Trust 2007-3 (c) | | US0001M + 0.16 | | 0.4680 | | 3/25/2037 | | | 757,393 | |
| | 1,996,566 | | | Lehman XS Trust Series 2005-4 (a,c) | | US0001M + 0.75 | | 0.8980 | | 10/25/2035 | | | 2,604,782 | |
| | 333,814 | | | New Century Home Equity Loan Trust 2006-1 (c) | | US0001M + 0.18 | | 0.3280 | | 5/25/2036 | | | 314,801 | |
| | 187,408 | | | PFCA Home Equity Investment Trust (a,b) | | | | 4.1577 | | 1/22/2035 | | | 192,723 | |
See accompanying notes to financial statements.
| RATIONAL SPECIAL SITUATIONS INCOME FUND |
| PORTFOLIO OF INVESTMENTS (Continued) |
| December 31, 2020 |
| Principal | | | | | | | Coupon | | | | | |
| Amount ($) | | | | | Variable Rate | | Rate (%) | | Maturity | | Value | |
| | | | | ASSET BACKED SECURITIES - 90.0% (Continued) | | | | | | | | | | |
| | | | | RESIDENTIAL MORTGAGE - 6.1% (Continued) | | | | | | | | | | |
| | 384,330 | | | PFCA Home Equity Investment Trust (a,b) | | | | 3.5492 | | 8/25/2035 | | $ | 387,465 | |
| | 2,759,324 | | | RAAC Series 2006-RP1 Trust (c) | | US0001M + 1.88 | | 2.0230 | | 10/25/2045 | | | 2,817,500 | |
| | 923,024 | | | RAMP Series 2004-SL3 Trust | | | | 8.5000 | | 12/25/2031 | | | 572,667 | |
| | 1,268,638 | | | RAMP Series 2007-RS1 Trust (c) | | US0001M + 0.16 | | 0.3080 | | 11/25/2036 | | | 1,286,951 | |
| | 177,111 | | | RFSC Series 2002-RP2 Trust (b,c) | | US0001M + 1.50 | | 1.6480 | | 10/25/2032 | | | 170,514 | |
| | 22,489 | | | SACO I Trust 2005-9 (c) | | US0001M + 0.69 | | 0.8380 | | 12/25/2035 | | | 143,362 | |
| | 129,133 | | | SACO I Trust 2005-WM2 (c) | | US0001M + 0.83 | | 0.9730 | | 7/25/2035 | | | 542,546 | |
| | 142,947 | | | SACO I Trust 2006-6 (c) | | US0001M + 0.26 | | 0.4080 | | 6/25/2036 | | | 140,599 | |
| | 308,244 | | | Structured Asset Securities Corp. Mortgage Loan Trust 2005-7XS (c) | | US0001M + 1.50 | | 1.6491 | | 4/25/2035 | | | 304,888 | |
| | | | | | | | | | | | | | 24,556,978 | |
| | | | | | | | | | | | | | | |
| | | | | TOTAL ASSET BACKED SECURITIES (Cost - $353,047,241) | | | | | | | | | 363,973,739 | |
| | | | | | | | | | | | | | | |
| | | | | COLLATERALIZED MORTGAGE OBLIGATIONS - 0.7% | | | | | | | | | | |
| | | | | AGENCY COMMERCIAL MORTGAGE BACKED SECURITIES- 0.4% | | | | | | | | | | |
| | 14,915,294 | | | Ginnie Mae Strip (g) | | | | 1.4000 | | 9/16/2045 | | | 1,485,569 | |
| | 28,878,046 | | | Government National Mortgage Association (g) | | | | 0.2630 | | 6/16/2040 | | | 63,797 | |
| | 4,297,519 | | | Government National Mortgage Association (a,g) | | | | 0.0879 | | 8/16/2048 | | | 31,925 | |
| | | | | | | | | | | | | | 1,581,291 | |
| | | | | COLLATERALIZED MORTGAGE OBLIGATIONS - 0.3% | | | | | | | | | | |
| | 299,706 | | | Fannie Mae Interest Strip(g) | | | | 6.5000 | | 10/25/2023 | | | 19,895 | |
| | 236,317 | | | Fannie Mae Interest Strip (g) | | | | 6.0000 | | 1/25/2035 | | | 46,516 | |
| | 632,377 | | | Fannie Mae Interest Strip (g) | | | | 4.5000 | | 8/25/2035 | | | 85,041 | |
| | 393,046 | | | Fannie Mae Interest Strip (a,g) | | | | 5.0000 | | 3/25/2038 | | | 64,383 | |
| | 795,849 | | | Fannie Mae Interest Strip (g) | | | | 5.0000 | | 1/25/2040 | | | 128,487 | |
| | 650,846 | | | Fannie Mae Interest Strip (a,g) | | | | 3.5000 | | 4/25/2027 | | | 38,110 | |
| | 624,397 | | | Fannie Mae REMICS (c,g) | | US0001M + 6.15 | | 6.0020 | | 1/25/2049 | | | 102,075 | |
| | 460,676 | | | Freddie Mac Strips (g) | | | | 6.0000 | | 6/15/2039 | | | 101,945 | |
| | 560,891 | | | Freddie Mac Strips (a,g) | | | | 4.5000 | | 5/15/2049 | | | 91,466 | |
| | 2,879,865 | | | Freddie Mac Structured Pass-Through Certificates (a,g) | | | | 0.5240 | | 5/25/2043 | | | 60,119 | |
| | 232,926 | | | Government National Mortgage Association (c,g) | | US0001M + 5.40 | | 5.2484 | | 5/20/2041 | | | 38,229 | |
| | 286,417 | | | Government National Mortgage Association (c,g) | | US0001M + 5.45 | | 5.2984 | | 6/20/2041 | | | 53,658 | |
| | 311,041 | | | Government National Mortgage Association (g) | | | | 5.0000 | | 10/20/2039 | | | 54,450 | |
| | 345,419 | | | Wachovia Mortgage Loan Trust LLC Series 2005-A Trust (a) | | | | 3.0046 | | 8/20/2035 | | | 347,844 | |
| | | | | | | | | | | | | | 1,232,218 | |
| | | | | | | | | | | | | | | |
| | | | | TOTAL COLLATERALIZED MORTGAGE OBLIGATIONS (Cost - $3,095,773) | | | | | | | | | 2,813,509 | |
| | | | | | | | | | | | | | | |
| | | | | CORPORATE BONDS - 3.1% | | | | | | | | | | |
| | | | | SYNDICATED LOAN - 2.4% | | | | | | | | | | |
| | 9,750,000 | | | Deer Finance Syndicated Loan (e) | | | | 8.0000 | | 10/7/2023 | | | 9,893,679 | |
| | | | | | | | | | | | | | | |
| | | | | TRANSPORTATION & LOGISTICS - 0.7% | | | | | | | | | | |
| | 279,387 | | | American Airlines 2013-2 Class A Pass Through Trust | | | | 4.0000 | | 1/15/2023 | | | 266,220 | |
| | 1,770,408 | | | American Airlines 2013-2 Class A Pass Through Trust | | | | 4.9500 | | 1/15/2027 | | | 1,499,763 | |
| | 961,440 | | | US Airways 2013-1 Class A Pass Through Trust | | | | 3.9500 | | 11/15/2025 | | | 889,689 | |
| | | | | | | | | | | | | | 2,655,672 | |
| | | | | | | | | | | | | | | |
| | | | | TOTAL CORPORATE BONDS (Cost - $12,369,266) | | | | | | | | | 12,549,351 | |
See accompanying notes to financial statements.
| RATIONAL SPECIAL SITUATIONS INCOME FUND |
| PORTFOLIO OF INVESTMENTS (Continued) |
| December 31, 2020 |
| Shares | | | | | Value | |
| | | | | SHORT-TERM INVESTMENTS - 6.4% | | | | |
| | 25,894,565 | | | First American Government Obligations Fund - Class U, 0.04% * | | | 25,894,565 | |
| | | | | TOTAL SHORT-TERM INVESTMENTS (Cost - $25,894,565) | | | | |
| | | | | | | | | |
| | | | | TOTAL INVESTMENTS - 100.2% (Cost $394,406,845) | | $ | 405,231,164 | |
| | | | | LIABILITIES IN EXCESS OF OTHER ASSETS - (0.2)% | | | (992,243 | ) |
| | | | | NET ASSETS - 100.0% | | $ | 404,238,921 | |
| * | Rate shown represents the rate at December 31, 2020, and is subject to change and resets daily. |
| (a) | Variable or floating rate security, the interest rate of which adjusts periodically based on changes in current interest rates and prepayments on the underlying pool of assets. |
| (b) | Securities exempt from registration under Rule 144A of Securities Act of 1933. These securities may be resold in transactions exempt from registration to qualified institutional buyers. At December 31, 2020, these securities amounted to $112,594,007 or 27.9% of net assets. |
| (c) | Variable rate security; the rate shown represents the rate on December 31, 2020. |
| (d) | Step-Up Bond; the interest rate shown is the rate in effect as of December 31, 2020. |
| (f) | Security currently in litigation. |
Definitions
COF - Cost of Funds
H15T1Y - US Treasury Yield Curve Rate; T-Note Constant Maturity 1 Year
12MTA - 12 Month Treasury Average Index
US001M - 1 Month London Interbank Offered Rate
US003M - 3 Month London Interbank Offered Rate
US0012M - 12 Month London Interbank Offered Rate
See accompanying notes to financial statements.
| RATIONAL FUNDS |
| Statements of Assets and Liabilities |
| December 31, 2020 |
| | | Rational | | | Rational | | | Rational | | | Rational | |
| | | Equity Armor | | | Tactical Return | | | Dynamic Brands | | | Strategic Allocation | |
| | | Fund | | | Fund | | | Fund | | | Fund | |
| ASSETS: | | | | | | | | | | | | | | | | |
| Investments in Unaffiliated securities, at cost | | $ | 50,254,787 | | | $ | 73,899,661 | | | $ | 61,232,982 | | | $ | 314,073 | |
| Investments in Affiliated securities, at cost | | | — | | | | — | | | | — | | | | 6,403,055 | |
| Total Securities at Cost | | | 50,254,787 | | | | 73,899,661 | | | | 61,232,982 | | | | 6,717,128 | |
| | | | | | | | | | | | | | | | | |
| Investments in Unaffiliated securities, at value | | $ | 57,332,348 | | | $ | 73,899,661 | | | $ | 75,151,907 | | | $ | 314,073 | |
| Investments in Affiliated securities, at value | | | — | | | | — | | | | — | | | | 6,752,008 | |
| Total Securities at Value | | $ | 57,332,348 | | | $ | 73,899,661 | | | $ | 75,151,907 | | | $ | 7,066,081 | |
| Cash | | | — | | | | — | | | | — | | | | — | |
| Deposits with Brokers for futures and options | | | 1,963,809 | | | | 142,971,521 | | | | — | | | | 738,723 | |
| Receivable for securities sold | | | 1,909,782 | | | | — | | | | 190,520 | | | | — | |
| Receivable for Fund shares sold | | | 343,042 | | | | 144,491 | | | | 551,173 | | | | — | |
| Unrealized appreciation from open futures contracts | | | 86,717 | | | | — | | | | — | | | | 184,380 | |
| Dividends and interest receivable | | | 80,770 | | | | 3,415 | | | | 4,135 | | | | 4,362 | |
| Due from Advisor | | | — | | | | — | | | | — | | | | 6,816 | |
| Prepaid expenses and other assets | | | 58,391 | | | | 45,747 | | | | 38,427 | | | | 4,980 | |
| Total Assets | | | 61,774,859 | | | | 217,064,835 | | | | 75,936,162 | | | | 8,005,342 | |
| | | | | | | | | | | | | | | | | |
| LIABILITIES: | | | | | | | | | | | | | | | | |
| Options written (premiums received $0, $128,291, $0, $0) | | | — | | | | 95,025 | | | | — | | | | — | |
| Payable for securities purchased | | | 1,830,907 | | | | — | | | | 3,153,583 | | | | 4,361 | |
| Management fees payable | | | 27,611 | | | | 315,123 | | | | 48,043 | | | | — | |
| Unrealized depreciation from open futures contracts | | | 146,779 | | | | — | | | | — | | | | — | |
| Payable for Fund shares redeemed | | | 704 | | | | 13,608 | | | | 86,498 | | | | 2,207 | |
| Payable to related parties | | | 11,292 | | | | 33,793 | | | | 9,047 | | | | 4,250 | |
| Shareholder services fees payable | | | 3,186 | | | | 19,344 | | | | 5,992 | | | | 1,285 | |
| Accrued 12b-1 fees | | | 4,359 | | | | 14,724 | | | | 8,952 | | | | 1,535 | |
| Trustee fees payable | | | 2,742 | | | | 2,505 | | | | 2,430 | | | | 2,460 | |
| Accrued expenses and other liabilities | | | 32,790 | | | | 30,553 | | | | 22,739 | | | | 27,215 | |
| Total Liabilities | | | 2,060,370 | | | | 524,675 | | | | 3,337,284 | | | | 43,313 | |
| | | | | | | | | | | | | | | | | |
| Net Assets | | $ | 59,714,489 | | | $ | 216,540,160 | | | $ | 72,598,878 | | | $ | 7,962,029 | |
| | | | | | | | | | | | | | | | | |
| NET ASSETS CONSIST OF: | | | | | | | | | | | | | | | | |
| Paid in capital | | $ | 61,401,990 | | | $ | 215,666,859 | | | $ | 55,476,101 | | | $ | 8,359,640 | |
| Accumulated earnings/(loss) | | | (1,687,501 | ) | | | 873,301 | | | | 17,122,777 | | | | (397,611 | ) |
| Net Assets | | $ | 59,714,489 | | | $ | 216,540,160 | | | $ | 72,598,878 | | | $ | 7,962,029 | |
| | | | | | | | | | | | | | | | | |
| Institutional Shares | | | | | | | | | | | | | | | | |
| Net Assets | | $ | 46,451,371 | | | $ | 199,987,072 | | | $ | 53,101,932 | | | $ | 248,052 | |
| Shares of beneficial interest outstanding (a) | | | 5,838,976 | | | | 35,157,977 | | | | 944,913 | | | | 27,734 | |
| Net asset value per share | | $ | 7.96 | | | $ | 5.69 | | | $ | 56.20 | | | $ | 8.94 | |
| | | | | | | | | | | | | | | | | |
| Class A Shares | | | | | | | | | | | | | | | | |
| Net Assets | | $ | 12,098,667 | | | $ | 7,422,935 | | | $ | 17,971,800 | | | $ | 7,712,980 | |
| Shares of beneficial interest outstanding (a) | | | 1,522,546 | | | | 1,297,847 | | | | 483,637 | | | | 858,419 | |
| Net asset value and redemption price per share | | $ | 7.95 | | | $ | 5.72 | | | $ | 37.16 | | | $ | 8.99 | |
| Maximum offering price per share (b) | | $ | 8.35 | | | $ | 6.01 | | | $ | 39.01 | | | $ | 9.44 | |
| | | | | | | | | | | | | | | | | |
| Class C Shares | | | | | | | | | | | | | | | | |
| Net Assets | | $ | 1,164,451 | | | $ | 9,130,153 | | | $ | 1,525,146 | | | | 997 | |
| Shares of beneficial interest outstanding (a) | | | 147,354 | | | | 1,631,105 | | | | 47,153 | | | | 111 | |
| Net asset value, offering price and redemption price per share (c) | | $ | 7.90 | | | $ | 5.60 | | | $ | 32.34 | | | $ | 8.95 | (d) |
| (a) | Unlimited number of shares of no par value beneficial interest authorized. |
| (b) | There is a maximum front-end sales charge (load) of 4.75% imposed on purchases of Class A shares for each Fund. |
| (c) | A contingent deferred sales charge (“CDSC”) of 1.00% may be charged on shares held less than 12 months. |
| (d) | Does not calculate due to rounding. |
See accompanying notes to consolidated financial statements.
| RATIONAL FUNDS |
| Statements of Assets and Liabilities Continued) |
| December 31, 2020 |
| | | Rational/ | | | Rational/Pier 88 | | | Rational | |
| | | ReSolve Adaptive | | | Convertible Securities | | | Special Situations | |
| | | Asset Allocation Fund | | | Fund | | | Income Fund | |
| | | (Consolidated) | | | | | | | |
| ASSETS: | | | | | | | | | | | | |
| Investments in securities, at cost | | $ | 56,661,833 | | | $ | 65,518,700 | | | $ | 394,406,845 | |
| Investments, at value | | $ | 56,661,833 | | | $ | 73,607,748 | | | $ | 405,231,164 | |
| Cash | | | — | | | | — | | | | 51,458 | |
| Deposits with Brokers for futures | | | 410,980 | | | | — | | | | — | |
| Unrealized appreciation from open futures contracts | | | 2,513,263 | | | | — | | | | — | |
| Foreign Deposits with Brokers for futures (Cost $3,735,229) | | | 3,828,897 | | | | — | | | | — | |
| Receivable for securities sold | | | — | | | | — | | | | 364,438 | |
| Dividends and interest receivable | | | 2,036 | | | | 212,517 | | | | 1,150,959 | |
| Receivable for Fund shares sold | | | 1,948 | | | | 588,700 | | | | 680,626 | |
| Prepaid expenses and other assets | | | 33,056 | | | | 21,959 | | | | 63,175 | |
| Total Assets | | | 63,452,013 | | | | 74,430,924 | | | | 407,541,820 | |
| | | | | | | | | | | | | |
| LIABILITIES: | | | | | | | | | | | | |
| Payable for Fund shares redeemed | | | 6,577 | | | | — | | | | 2,613,177 | |
| Unrealized depreciation from open futures contracts | | | 109,575 | | | | — | | | | — | |
| Management fees payable | | | 80,505 | | | | 43,403 | | | | 497,308 | |
| Payable to related parties | | | 12,951 | | | | 13,613 | | | | 74,330 | |
| Accrued 12b-1 fees | | | 53 | | | | 438 | | | | 54,637 | |
| Shareholder services fees payable | | | 7,021 | | | | 4,913 | | | | 12,278 | |
| Trustee fees payable | | | 2,597 | | | | 2,484 | | | | 2,629 | |
| Accrued expenses and other liabilities | | | 29,916 | | | | 28,412 | | | | 48,540 | |
| Total Liabilities | | | 249,195 | | | | 93,263 | | | | 3,302,899 | |
| | | | | | | | | | | | | |
| Net Assets | | $ | 63,202,818 | | | $ | 74,337,661 | | | $ | 404,238,921 | |
| | | | | | | | | | | | | |
| NET ASSETS CONSIST OF: | | | | | | | | | | | | |
| Paid in capital | | $ | 66,107,831 | | | $ | 65,781,223 | | | $ | 400,449,771 | |
| Accumulated earnings/ (loss) | | | (2,905,013 | ) | | | 8,556,438 | | | | 3,789,150 | |
| Net Assets | | $ | 63,202,818 | | | $ | 74,337,661 | | | $ | 404,238,921 | |
| | | | | | | | | | | | | |
| Institutional Shares | | | | | | | | | | | | |
| Net Assets | | $ | 62,176,204 | | | $ | 73,946,290 | | | $ | 352,892,465 | |
| Shares of beneficial interest outstanding (a) | | | 2,616,217 | | | | 6,328,117 | | | | 17,952,050 | |
| Net asset value per share | | $ | 23.77 | | | $ | 11.69 | | | $ | 19.66 | |
| | | | | | | | | | | | | |
| Class A Shares | | | | | | | | | | | | |
| Net Assets | | $ | 776,123 | | | $ | 336,836 | | | $ | 37,223,946 | |
| Shares of beneficial interest outstanding (a) | | | 32,878 | | | | 28,822 | | | | 1,895,539 | |
| Net asset value and redemption price per share | | $ | 23.61 | | | $ | 11.69 | | | $ | 19.64 | |
| Maximum offering price per share (b) | | $ | 25.05 | | | $ | 12.27 | | | $ | 20.62 | |
| | | | | | | | | | | | | |
| Class C Shares | | | | | | | | | | | | |
| Net Assets | | $ | 250,491 | | | $ | 54,535 | | | $ | 14,122,510 | |
| Shares of beneficial interest outstanding (a) | | | 10,877 | | | | 4,678 | | | | 720,674 | |
| Net asset value, offering price and redemption price per share (c) | | $ | 23.03 | | | $ | 11.66 | | | $ | 19.60 | |
| (a) | Unlimited number of shares of no par value beneficial interest authorized |
| (b) | There is a maximum front-end sales charge (load) of 4.75% imposed on purchases of Class A shares for each Fund except Resolve Adaptive Asset Allocation Fund whose maximum front-end sales charge (load) is 5.75%. |
| (c) | A contingent deferred sales charge (“CDSC”) of 1.00% may be charged on shares held less than 12 months |
See accompanying notes to consolidated financial statements.
| RATIONAL FUNDS |
| Statements of Operations |
| For the Year Ended December 31, 2020 |
| | | Rational | | | Rational | | | Rational | | | Rational | |
| | | Equity Armor | | | Tactical Return | | | Dynamic Brands | | | Strategic Allocation | |
| | | Fund | | | Fund | | | Fund | | | Fund | |
| Investment Income: | | | | | | | | | | | | | | | | |
| Dividend income | | $ | 774,506 | | | $ | — | | | $ | 316,835 | | | $ | — | |
| Interest income | | | 5,107 | | | | 902,265 | | | | 7,788 | | | | 9,270 | |
| Dividend income - affiliated companies (Note 3 | | | — | | | | — | | | | — | | | | 277,599 | |
| Foreign tax withheld | | | — | | | | — | | | | (19,040 | ) | | | — | |
| Total Investment Income | | | 779,613 | | | | 902,265 | | | | 305,583 | | | | 286,869 | |
| | | | | | | | | | | | | | | | | |
| Operating Expenses: | | | | | | | | | | | | | | | | |
| Investment management fees | | | 289,703 | | | | 3,479,192 | | | | 336,281 | | | | 7,751 | |
| 12b-1 Fees - Class A Shares | | | 29,036 | | | | 21,435 | | | | 33,808 | | | | 18,803 | |
| 12b-1 Fees - Class C Shares | | | 11,222 | | | | 84,735 | | | | 4,992 | | | | 9 | |
| Shareholder Services Fees - Institutional Shares | | | 14,443 | | | | 157,919 | | | | 27,432 | | | | — | |
| Shareholder Services Fees - Class A Shares | | | 13,094 | | | | 9,423 | | | | 12,611 | | | | 7,099 | |
| Shareholder Services Fees - Class C Shares | | | 642 | | | | 6,178 | | | | 1,391 | | | | — | |
| Administration fees | | | 42,778 | | | | 159,690 | | | | 47,390 | | | | 22,181 | |
| Registration fees | | | 56,572 | | | | 75,001 | | | | 50,537 | | | | 9,186 | |
| Management Service Fees | | | 22,854 | | | | 94,851 | | | | 24,765 | | | | 8,496 | |
| Legal fees | | | 14,511 | | | | 10,869 | | | | 15,820 | | | | 13,332 | |
| Printing expense | | | 10,242 | | | | 31,739 | | | | 6,444 | | | | 4,214 | |
| Audit fees | | | 15,001 | | | | 13,027 | | | | 10,527 | | | | 13,371 | |
| Compliance officer fees | | | 12,034 | | | | 16,274 | | | | 11,140 | | | | 5,310 | |
| Custody fees | | | 19,176 | | | | 7,574 | | | | 7,249 | | | | 4,728 | |
| Trustees’ fees | | | 9,105 | | | | 9,510 | | | | 9,510 | | | | 9,510 | |
| Insurance expense | | | 1,327 | | | | 10,793 | | | | 2,158 | | | | 615 | |
| Interest expense | | | 4,082 | | | | 1,216 | | | | — | | | | — | |
| Miscellaneous expenses | | | 1,644 | | | | 3,851 | | | | 2,406 | | | | 2,406 | |
| Total Operating Expenses | | | 567,466 | | | | 4,193,277 | | | | 604,461 | | | | 127,011 | |
| Less: Expenses waived/reimbursed by Advisor | | | (135,785 | ) | | | (127,155 | ) | | | (8,050 | ) | | | (72,877 | ) |
| Net Operating Expenses | | | 431,681 | | | | 4,066,122 | | | | 596,411 | | | | 54,134 | |
| | | | | | | | | | | | | | | | | |
| Net Investment Income (Loss) | | | 347,932 | | | | (3,163,857 | ) | | | (290,828 | ) | | | 232,735 | |
| | | | | | | | | | | | | | | | | |
| Realized and Unrealized Gain (Loss) on Investments: | | | | | | | | | | | | | | | | |
| Net Realized Gain (Loss) from: | | | | | | | | | | | | | | | | |
| Investments | | | 85,095 | | | | — | | | | 10,520,178 | | | | 109,171 | |
| Affiliated companies | | | — | | | | — | | | | — | | | | (25,128 | ) |
| Securities sold short | | | (1,137 | ) | | | — | | | | — | | | | — | |
| Options purchased | | | (1,389,813 | ) | | | (2,390,237 | ) | | | — | | | | — | |
| Options written | | | 77,741 | | | | 10,485,082 | | | | — | | | | — | |
| Futures | | | (182,381 | ) | | | — | | | | — | | | | (973,157 | ) |
| Foreign currency transactions | | | — | | | | — | | | | 80 | | | | — | |
| Net Realized Gain (Loss) | | | (1,410,495 | ) | | | 8,094,845 | | | | 10,520,258 | | | | (889,114 | ) |
| | | | | | | | | | | | | | | | | |
| Net Change in Unrealized Appreciation (Depreciation) on Investments | | | | | | | | | | | | | | | | |
| Investments | | | 6,865,963 | | | | (38,174 | ) | | | 7,985,926 | | | | — | |
| Affiliated companies | | | — | | | | — | | | | — | | | | (22,204 | ) |
| Options written | | | — | | | | 33,266 | | | | — | | | | — | |
| Futures | | | (5,460 | ) | | | — | | | | — | | | | 184,380 | |
| Foreign currency translations | | | — | | | | — | | | | 1,114 | | | | — | |
| Net Change in Unrealized Appreciation (Depreciation) on Investments | | | 6,860,503 | | | | (4,908 | ) | | | 7,987,040 | | | | 162,176 | |
| | | | | | | | | | | | | | | | | |
| Net Realized and Unrealized Gain (Loss) on Investments | | | 5,450,008 | | | | 8,089,937 | | | | 18,507,298 | | | | (726,938 | ) |
| | | | | | | | | | | | | | | | | |
| Net Increase (Decrease) in Net Assets Resulting From Operations | | $ | 5,797,940 | | | $ | 4,926,080 | | | $ | 18,216,470 | | | $ | (494,203 | ) |
| | | | | | | | | | | | | | | | | |
See accompanying notes to consolidated financial statements.
| Rational Funds |
| Statements of Operations (Continued) |
| For the Year Ended December 31, 2020 |
| | | Rational/ | | | Rational/ Pier 88 | | | Rational | |
| | | ReSolve Adaptive | | | Convertible Securities | | | Special Situations | |
| | | Asset Allocation Fund | | | Fund | | | Income Fund | |
| | | (Consolidated) | | | | | | | |
| Investment Income: | | | | | | | | | | | | |
| Dividend income | | $ | — | | | $ | 1,184,035 | | | $ | — | |
| Interest income | | | 235,345 | | | | 375,185 | | | | 10,711,199 | |
| Total Investment Income | | | 235,345 | | | | 1,559,220 | | | | 10,711,199 | |
| | | | | | | | | | | | | |
| Operating Expenses: | | | | | | | | | | | | |
| Investment management fees | | | 1,110,897 | | | | 505,278 | | | | 4,079,371 | |
| 12b-1 Fees - Class A Shares | | | 7,737 | | | | 221 | | | | 60,865 | |
| 12b-1 Fees - Class C Shares | | | 3,459 | | | | 162 | | | | 75,707 | |
| Shareholder Services Fees - Institutional Shares | | | 58,764 | | | | 52,801 | | | | 149,251 | |
| Shareholder Services Fees - Class A Shares | | | 4,297 | | | | 19 | | | | 25,459 | |
| Shareholder Services Fees - Class C Shares | | | 894 | | | | — | | | | 2,523 | |
| Administrative fees | | | 63,034 | | | | 63,720 | | | | 310,599 | |
| Management Service Fees | | | 33,769 | | | | 31,592 | | | | 124,715 | |
| Registration fees | | | 36,579 | | | | 12,634 | | | | 82,774 | |
| Legal fees | | | 21,246 | | | | 22,737 | | | | 14,888 | |
| Custody fees | | | 6,644 | | | | 4,927 | | | | 46,517 | |
| Printing expenses | | | 9,213 | | | | 10,349 | | | | 35,424 | |
| Audit fees | | | 13,027 | | | | 12,878 | | | | 21,745 | |
| Compliance officer fees | | | 13,336 | | | | 11,137 | | | | 17,341 | |
| Trustees’ fees | | | 9,510 | | | | 10,009 | | | | 10,943 | |
| Insurance Expense | | | 3,818 | | | | 3,517 | | | | 7,878 | |
| Interest expense | | | — | | | | 30 | | | | — | |
| Tax Expense | | | — | | | | 706 | | | | 16,468 | |
| Miscellaneous expense | | | 3,356 | | | | 4,494 | | | | 5,275 | |
| Total Operating Expenses | | | 1,399,580 | | | | 747,211 | | | | 5,087,743 | |
| Less: Expenses waived/reimbursed by Advisor | | | (137,538 | ) | | | (155,789 | ) | | | (159,379 | ) |
| Net Operating Expenses | | | 1,262,042 | | | | 591,422 | | | | 4,928,364 | |
| | | | | | | | | | | | | |
| Net Investment Income (Loss) | | | (1,026,697 | ) | | | 967,798 | | | | 5,782,835 | |
| | | | | | | | | | | | | |
| Realized and Unrealized Gain (Loss) on Investments: | | | | | | | | | | | | |
| Net Realized Gain (Loss) from: | | | | | | | | | | | | |
| Investments | | | — | | | | 670,721 | | | | 241,732 | |
| Options purchased | | | — | | | | 7,270 | | | | — | |
| Options written | | | — | | | | 7,985 | | | | — | |
| Futures | | | (3,096,409 | ) | | | — | | | | — | |
| Foreign currency translations | | | 166,874 | | | | — | | | | — | |
| Net Realized Gain (Loss) | | | (2,929,535 | ) | | | 685,976 | | | | 241,732 | |
| | | | | | | | | | | | | |
| Net Change in Unrealized Appreciation on Investments | | | | | | | | | | | | |
| Investments | | | — | | | | 7,676,411 | | | | 4,315,358 | |
| Futures | | | 4,204,766 | | | | — | | | | — | |
| Foreign currency translations | | | 76,023 | | | | — | | | | — | |
| Net Change in Unrealized Appreciation on Investments | | | 4,280,789 | | | | 7,676,411 | | | | 4,315,358 | |
| | | | | | | | | | | | | |
| Net Realized and Unrealized Gain on Investments | | | 1,351,254 | | | | 8,362,387 | | | | 4,557,090 | |
| | | | | | | | | | | | | |
| Net Increase in Net Assets Resulting From Operations | | $ | 324,557 | | | $ | 9,330,185 | | | $ | 10,339,925 | |
| | | | | | | | | | | | | |
See accompanying notes to consolidated financial statements.
| RATIONAL FUNDS |
| Statements of Changes in Net Assets |
| | | Rational Equity Armor Fund | | | Rational Tactical Return Fund | | | Rational Dynamic Brands Fund | |
| | | Year Ended | | | Year Ended | | | Year Ended | | | Year Ended | | | Year Ended | | | Year Ended | |
| | | December 31, 2020 | | | December 31, 2019 | | | December 31, 2020 | | | December 31, 2019 | | | December 31, 2020 | | | December 31, 2019 | |
| Operations: | | | | | | | | | | | | | | | | | | | | | | | | |
| Net investment income (loss) | | $ | 347,932 | | | $ | 527,003 | | | $ | (3,163,857 | ) | | $ | (210,188 | ) | | $ | (290,828 | ) | | $ | (143,260 | ) |
| Net realized gain (loss) on investments, Futures and options | | | (1,410,495 | ) | | | (1,387,776 | ) | | | 8,094,845 | | | | 7,773,203 | | | | 10,520,258 | | | | 2,119,623 | |
| Net change in unrealized appreciation (depreciation) on investments, foreign currency, options and Futures | | | 6,860,503 | | | | 2,767,256 | | | | (4,908 | ) | | | 38,174 | | | | 7,987,040 | | | | 5,508,569 | |
| Net increase in net assets resulting from operations | | | 5,797,940 | | | | 1,906,483 | | | | 4,926,080 | | | | 7,601,189 | | | | 18,216,470 | | | | 7,484,932 | |
| | | | | | | | | | | | | | | | | | | | | | | | | |
| Distributions to Shareholders from: | | | | | | | | | | | | | | | | | | | | | | | | |
| Total Distributions: | | | | | | | | | | | | | | | | | | | | | | | | |
| Institutional | | | (453,360 | ) | | | (292,419 | ) | | | (4,130,182 | ) | | | (4,728,957 | ) | | | (5,481,617 | ) | | | (70,371 | ) |
| Class A | | | (105,252 | ) | | | (605,303 | ) | | | (153,641 | ) | | | (486,093 | ) | | | (2,718,838 | ) | | | (58,160 | ) |
| Class C | | | (5,581 | ) | | | (59,313 | ) | | | (194,050 | ) | | | (203,580 | ) | | | (248,596 | ) | | | (955 | ) |
| | | | | | | | | | | | | | | | | | | | | | | | | |
| Total distributions to shareholders | | | (564,193 | ) | | | (957,035 | ) | | | (4,477,873 | ) | | | (5,418,630 | ) | | | (8,449,051 | ) | | | (129,486 | ) |
| | | | | | | | | | | | | | | | | | | | | | | | | |
| Share Transactions of Beneficial Interest: | | | | | | | | | | | | | | | | | | | | | | | | |
| Net proceeds from shares sold | | | | | | | | | | | | | | | | | | | | | | | | |
| Institutional | | | 44,970,883 | | | | 4,732,165 | | | | 191,749,850 | | | | 151,376,666 | | | | 28,554,449 | | | | 4,509,893 | |
| Class A | | | 2,091,540 | | | | 685,323 | | | | 6,172,898 | | | | 11,325,757 | | | | 2,596,224 | | | | 428,540 | |
| Class C | | | 172,712 | | | | 17,983 | | | | 3,883,968 | | | | 6,512,697 | | | | 1,197,830 | | | | 72,450 | |
| Reinvestment of distributions | | | | | | | | | | | | | | | | | | | | | | | | |
| Institutional | | | 233,417 | | | | 125,043 | | | | 3,914,858 | | | | 4,417,062 | | | | 5,090,472 | | | | 63,070 | |
| Class A | | | 94,487 | | | | 536,878 | | | | 149,294 | | | | 470,585 | | | | 2,671,413 | | | | 57,800 | |
| Class C | | | 2,956 | | | | 24,379 | | | | 184,052 | | | | 138,693 | | | | 234,552 | | | | 919 | |
| Cost of shares redeemed | | | | | | | | | | | | | | | | | | | | | | | | |
| Institutional | | | (9,494,876 | ) | | | (2,826,668 | ) | | | (147,243,068 | ) | | | (24,262,179 | ) | | | (9,523,310 | ) | | | (4,228,288 | ) |
| Class A | | | (3,055,029 | ) | | | (3,064,402 | ) | | | (14,008,530 | ) | | | (16,035,990 | ) | | | (2,125,183 | ) | | | (2,004,823 | ) |
| Class C | | | (404,081 | ) | | | (544,564 | ) | | | (1,330,893 | ) | | | (167,373 | ) | | | (63,151 | ) | | | (149,597 | ) |
| Net increase (decrease) in net assets from share transactions of beneficial interest | | | 34,612,009 | | | | (313,863 | ) | | | 43,472,429 | | | | 133,775,918 | | | | 28,633,296 | | | | (1,250,036 | ) |
| | | | | | | | | | | | | | | | | | | | | | | | | |
| Total Increase in Net Assets | | | 39,845,756 | | | | 635,585 | | | | 43,920,636 | | | | 135,958,477 | | | | 38,400,715 | | | | 6,105,410 | |
| | | | | | | | | | | | | | | | | | | | | | | | | |
| Net Assets: | | | | | | | | | | | | | | | | | | | | | | | | |
| Beginning of year | | | 19,868,733 | | | | 19,233,148 | | | | 172,619,524 | | | | 36,661,047 | | | | 34,198,163 | | | | 28,092,753 | |
| End of year | | $ | 59,714,489 | | | $ | 19,868,733 | | | $ | 216,540,160 | | | $ | 172,619,524 | | | $ | 72,598,878 | | | $ | 34,198,163 | |
| | | | | | | | | | | | | | | | | | | | | | | | | |
| Share Activity: | | | | | | | | | | | | | | | | | | | | | | | | |
| Institutional Class | | | | | | | | | | | | | | | | | | | | | | | | |
| Shares Sold | | | 6,038,880 | | | | 670,763 | | | | 33,529,962 | | | | 26,831,790 | | | | 555,404 | | | | 118,490 | |
| Shares Reinvested | | | 30,046 | | | | 18,203 | | | | 689,236 | | | | 784,558 | | | | 89,922 | | | | 1,472 | |
| Shares Redeemed | | | (1,261,579 | ) | | | (408,604 | ) | | | (25,764,629 | ) | | | (4,308,637 | ) | | | (199,858 | ) | | | (109,597 | ) |
| Net increase in shares of Beneficial interest | | | 4,807,347 | | | | 280,362 | | | | 8,454,569 | | | | 23,307,711 | | | | 445,468 | | | | 10,365 | |
| | | | | | | | | | | | | | | | | | | | | | | | | |
| Class A | | | | | | | | | | | | | | | | | | | | | | | | |
| Shares Sold | | | 282,090 | | | | 99,093 | | | | 1,069,707 | | | | 1,994,596 | | | | 66,023 | | | | 15,805 | |
| Shares Reinvested | | | 12,186 | | | | 78,257 | | | | 26,146 | | | | 82,995 | | | | 71,371 | | | | 1,931 | |
| Shares Redeemed | | | (426,210 | ) | | | (445,643 | ) | | | (2,446,070 | ) | | | (2,792,875 | ) | | | (62,938 | ) | | | (73,310 | ) |
| Net increase (decrease) in shares of Beneficial interest | | | (131,934 | ) | | | (268,293 | ) | | | (1,350,217 | ) | | | (715,284 | ) | | | 74,456 | | | | (55,574 | ) |
| | | | | | | | | | | | | | | | | | | | | | | | | |
| Class C | | | | | | | | | | | | | | | | | | | | | | | | |
| Shares Sold | | | 22,902 | | | | 2,669 | | | | 686,028 | | | | 1,151,566 | | | | 35,459 | | | | 3,090 | |
| Shares Reinvested | | | 380 | | | | 3,556 | | | | 32,925 | | | | 24,767 | | | | 7,197 | | | | 35 | |
| Shares Redeemed | | | (57,096 | ) | | | (78,941 | ) | | | (235,139 | ) | | | (29,248 | ) | | | (2,278 | ) | | | (6,200 | ) |
| Net increase (decrease) in shares of Beneficial interest | | | (33,814 | ) | | | (72,716 | ) | | | 483,814 | | | | 1,147,085 | | | | 40,378 | | | | (3,075 | ) |
| | | | | | | | | | | | | | | | | | | | | | | | | |
See accompanying notes to consolidated financial statements.
| RATIONAL FUNDS |
| Statements of Changes in Net Assets (Continued) |
| | | | | | Rational/ReSolve Adaptive | |
| | | Rational Strategic Allocation Fund | | | Asset Allocation Fund | |
| | | | | | | | | (Consolidated) | |
| | | Year Ended | | | Year Ended | | | Year Ended | | | Year Ended | |
| | | December 31, 2020 | | | December 31 ,2019 | | | December 31, 2020 | | | December 31 ,2019 | |
| Operations: | | | | | | | | | | | | | | | | |
| Net investment income (loss) | | $ | 232,735 | | | $ | 324,811 | | | $ | (1,026,697 | ) | | $ | (35,714 | ) |
| Net realized gain (loss) on investments, affiliated companies foreign currency transactions and futures | | | (889,114 | ) | | | 284,815 | | | | (2,929,535 | ) | | | 8,370,908 | |
| Net change in unrealized appreciation (depreciation) on investments, affiliated companies, foreign currency transactions and futures | | | 162,176 | | | | 571,560 | | | | 4,280,789 | | | | (2,745,008 | ) |
| Net increase (decrease) in net assets resulting from operations | | | (494,203 | ) | | | 1,181,186 | | | | 324,557 | | | | 5,590,186 | |
| | | | | | | | | | | | | | | | | |
| Distributions to Shareholders: | | | | | | | | | | | | | | | | |
| From return of capital: | | | | | | | | | | | | | | | | |
| Institutional | | | (564 | ) | | | (1,615 | ) | | | (88,954 | ) | | | (73,376 | ) |
| Class A | | | (18,057 | ) | | | (55,483 | ) | | | — | | | | (8,665 | ) |
| Class C | | | (2 | ) | | | (6 | ) | | | — | | | | (707 | ) |
| Total Distributions Paid: | | | | | | | | | | | | | | | | |
| Institutional | | | (7,668 | ) | | | (17,335 | ) | | | (205,777 | ) | | | (6,750,584 | ) |
| Class A | | | (225,046 | ) | | | (569,624 | ) | | | — | | | | (791,508 | ) |
| Class C | | | (21 | ) | | | (59 | ) | | | — | | | | (60,987 | ) |
| | | | | | | | | | | | | | | | | |
| Total distributions to shareholders | | | (251,358 | ) | | | (644,122 | ) | | | (294,731 | ) | | | (7,685,827 | ) |
| | | | | | | | | | | | | | | | | |
| Share Transactions of Beneficial Interest: | | | | | | | | | | | | | | | | |
| Net proceeds from shares sold | | | | | | | | | | | | | | | | |
| Institutional | | | — | | | | — | | | | 34,738,337 | | | | 32,935,272 | |
| Class A | | | 44,999 | | | | 82,587 | | | | 9,754,139 | | | | 4,989,087 | |
| Class C | | | — | | | | — | | | | 31,295 | | | | 171,500 | |
| Reinvestment of distributions | | | | | | | | | | | | | | | | |
| Institutional | | | — | | | | — | | | | 245,746 | | | | 5,904,868 | |
| Class A | | | 235,629 | | | | 608,679 | | | | — | | | | 745,397 | |
| Class C | | | — | | | | — | | | | — | | | | 24,298 | |
| Cost of shares redeemed | | | | | | | | | | | | | | | | |
| Institutional | | | — | | | | — | | | | (24,056,010 | ) | | | (13,564,157 | ) |
| Class A | | | (1,234,592 | ) | | | (1,663,220 | ) | | | (14,414,075 | ) | | | (1,904,239 | ) |
| Class C | | | — | | | | — | | | | (210,779 | ) | | | (73,239 | ) |
| Net increase (decrease) in net assets from share transactions of beneficial interest | | | (953,964 | ) | | | (971,954 | ) | | | 6,088,653 | | | | 29,228,787 | |
| | | | | | | | | | | | | | | | | |
| Total Increase (Decrease) in Net Assets | | | (1,699,525 | ) | | | (434,890 | ) | | | 6,118,479 | | | | 27,133,146 | |
| | | | | | | | | | | | | | | | | |
| Net Assets: | | | | | | | | | | | | | | | | |
| Beginning of year | | | 9,661,554 | | | | 10,096,444 | | | | 57,084,339 | | | | 29,951,193 | |
| End of year | | $ | 7,962,029 | | | $ | 9,661,554 | | | $ | 63,202,818 | | | $ | 57,084,339 | |
| | | | | | | | | | | | | | | | | |
| Share Activity: | | | | | | | | | | | | | | | | |
| Institutional Class | | | | | | | | | | | | | | | | |
| Shares Sold | | | — | | | | — | | | | 1,494,929 | | | | 1,272,697 | |
| Shares Reinvested | | | — | | | | — | | | | 10,506 | | | | 244,407 | |
| Shares Redeemed | | | — | | | | — | | | | (1,047,952 | ) | | | (547,188 | ) |
| Net increase in shares of Beneficial interest | | | — | | | | — | | | | 457,483 | | | | 969,916 | |
| | | | | | | | | | | | | | | | | |
| Class A | | | | | | | | | | | | | | | | |
| Shares Sold | | | 5,447 | | | | 8,475 | | | | 407,554 | | | | 183,752 | |
| Shares Reinvested | | | 29,250 | | | | 62,558 | | | | — | | | | 31,110 | |
| Shares Redeemed | | | (152,303 | ) | | | (170,459 | ) | | | (605,271 | ) | | | (78,735 | ) |
| Net increase (decrease) in shares of Beneficial interest | | | (117,606 | ) | | | (99,426 | ) | | | (197,717 | ) | | | 136,127 | |
| | | | | | | | | | | | | | | | | |
| Class C | | | | | | | | | | | | | | | | |
| Shares Sold | | | — | | | | — | | | | 1,382 | | | | 6,675 | |
| Shares Reinvested | | | — | | | | — | | | | — | | | | 1,032 | |
| Shares Redeemed | | | — | | | | — | | | | (9,460 | ) | | | (2,991 | ) |
| Net increase (decrease) in shares of Beneficial interest | | | — | | | | — | | | | (8,078 | ) | | | 4,716 | |
| | | | | | | | | | | | | | | | | |
See accompanying notes to consolidated financial statements.
| RATIONAL FUNDS |
| Statements of Changes in Net Assets (Continued) |
| | | Rational/ Pier 88 Convertible Securities Fund | | | Rational Special Situations Income Fund | |
| | | Year Ended | | | Period Ended | | | Year Ended | | | Period Ended | |
| | | December 31, 2020 | | | December 31, 2019 (b) | | | December 31, 2020 | | | December 31, 2019 (a) | |
| Operations: | | | | | | | | | | | | | | | | |
| Net investment income | | $ | 967,798 | | | $ | 14,597 | | | $ | 5,782,835 | | | $ | 763,990 | |
| Net realized gain on investments | | | 685,976 | | | | 46,775 | | | | 241,732 | | | | 348,885 | |
| Net change in unrealized appreciation (depreciation) on investments | | | 7,676,411 | | | | 31,557 | | | | 4,315,358 | | | | (67,967 | ) |
| Net increase in net assets resulting from operations | | | 9,330,185 | | | | 92,929 | | | | 10,339,925 | | | | 1,044,908 | |
| | | | | | | | | | | | | | | | | |
| Distributions to Shareholders: | | | | | | | | | | | | | | | | |
| From return of capital: | | | | | | | | | | | | | | | | |
| Institutional Class | | | — | | | | — | | | | (549,867 | ) | | | — | |
| Class A | | | — | | | | — | | | | (56,508 | ) | | | — | |
| Class C | | | — | | | | — | | | | (16,854 | ) | | | — | |
| Total Distributions : | | | | | | | | | | | | | | | | |
| Institutional | | | (1,243,586 | ) | | | — | | | | (11,887,080 | ) | | | (787,652 | ) |
| Class A | | | (4,253 | ) | | | — | | | | (1,173,195 | ) | | | (32,838 | ) |
| Class C | | | (623 | ) | | | — | | | | (311,996 | ) | | | (8,854 | ) |
| | | | | | | | | | | | | | | | | |
| Total distributions to shareholders | | | (1,248,462 | ) | | | — | | | | (13,995,500 | ) | | | (829,344 | ) |
| | | | | | | | | | | | | | | | | |
| Share Transactions of Beneficial Interest: | | | | | | | | | | | | | | | | |
| Net proceeds from shares sold | | | | | | | | | | | | | | | | |
| Institutional | | | 65,326,825 | | | | 5,614,057 | | | | 359,188,223 | | | | 78,517,156 | |
| Class A | | | 348,047 | | | | 10 | | | | 37,959,162 | | | | 5,462,001 | |
| Class C | | | 50,000 | | | | 10 | | | | 13,980,430 | | | | 1,281,680 | |
| Reinvestment of distributions | | | | | | | | | | | | | | | | |
| Institutional | | | 177,486 | | | | — | | | | 9,575,043 | | | | 700,862 | |
| Class A | | | 4,253 | | | | — | | | | 1,047,397 | | | | 30,149 | |
| Class C | | | 623 | | | | — | | | | 272,495 | | | | 7,802 | |
| Cost of shares redeemed | | | | | | | | | | | | | | | | |
| Institutional | | | (5,326,333 | ) | | | — | | | | (89,158,528 | ) | | | (2,599,773 | ) |
| Class A | | | (31,969 | ) | | | — | | | | (7,198,360 | ) | | | (41,908 | ) |
| Class C | | | — | | | | — | | | | (1,342,540 | ) | | | (2,359 | ) |
| Net increase in net assets from share transactions of beneficial interest | | | 60,548,932 | | | | 5,614,077 | | | | 324,323,322 | | | | 83,355,610 | |
| | | | | | | | | | | | | | | | | |
| Total Increase in Net Assets | | | 68,630,655 | | | | 5,707,006 | | | | 320,667,747 | | | | 83,571,174 | |
| | | | | | | | | | | | | | | | | |
| Net Assets: | | | | | | | | | | | | | | | | |
| Beginning of year/period | | | 5,707,006 | | | | — | | | | 83,571,174 | | | | — | |
| End of year/period | | $ | 74,337,661 | | | $ | 5,707,006 | | | $ | 404,238,921 | | | $ | 83,571,174 | |
| | | | | | | | | | | | | | | | | |
| Share Activity: | | | | | | | | | | | | | | | | |
| Institutional | | | | | | | | | | | | | | | | |
| Shares Sold | | | 6,322,918 | | | | 561,091 | | | | 18,243,801 | | | | 3,917,533 | |
| Shares Reinvested | | | 15,655 | | | | — | | | | 489,738 | | | | 34,919 | |
| Shares Redeemed | | | (571,547 | ) | | | — | | | | (4,604,174 | ) | | | (129,767 | ) |
| Net increase in shares of Beneficial interest | | | 5,767,026 | | | | 561,091 | | | | 14,129,365 | | | | 3,822,685 | |
| | | | | | | | | | | | | | | | | |
| Class A | | | | | | | | | | | | | | | | |
| Shares Sold | | | 31,516 | | | | 1 | | | | 1,937,859 | | | | 271,920 | |
| Shares Reinvested | | | 374 | | | | — | | | | 53,707 | | | | 1,502 | |
| Shares Redeemed | | | (3,069 | ) | | | — | | | | (367,362 | ) | | | (2,087 | ) |
| Net increase in shares of Beneficial interest | | | 28,821 | | | | 1 | | | | 1,624,204 | | | | 271,335 | |
| | | | | | | | | | | | | | | | | |
| Class C | | | | | | | | | | | | | | | | |
| Shares Sold | | | 4,622 | | | | 1 | | | | 711,234 | | | | 63,990 | |
| Shares Reinvested | | | 55 | | | | — | | | | 13,986 | | | | 389 | |
| Shares Redeemed | | | — | | | | — | | | | (68,807 | ) | | | (118 | ) |
| Net increase in shares of Beneficial interest | | | 4,677 | | | | 1 | | | | 656,413 | | | | 64,261 | |
| (a) | The Rational Special Situations Income Fund launched on July 17, 2019 |
| (b) | The Rational/Pier 88 Convertible Securities Fund launched on December 6, 2019 |
See accompanying notes to consolidated financial statements.
| RATIONAL FUNDS |
| Rational Equity Armor Fund |
| Financial Highlights |
For a Share Outstanding Throughout Each Year
| | | Institutional | |
| | | For the | | | For the | | | For the | | | For the | | | For the | |
| | | Year Ended | | | Year Ended | | | Year Ended | | | Year Ended | | | Year Ended | |
| | | December 31, | | | December 31, | | | December 31, | | | December 31, | | | December 31, | |
| | | 2020 | | | 2019 | | | 2018 | | | 2017 | | | 2016 | |
| | | | | | | | | | | | | | | | | | | | | |
| Net asset value, beginning of year | | $ | 6.94 | | | $ | 6.58 | | | $ | 8.02 | | | $ | 8.64 | | | $ | 8.41 | |
| INCOME (LOSS) FROM INVESTMENT OPERATIONS: | | | | | | | | | | | | | | | | | | | | |
| Net investment income (A) | | | 0.08 | | | | 0.22 | | | | 0.34 | | | | 0.30 | | | | 0.29 | |
| Net realized and unrealized gain (loss) on investments | | | 1.03 | | | | 0.51 | | | | (1.26 | ) | | | (0.47 | ) | | | 0.22 | |
| Total from investment operations | | | 1.11 | | | | 0.73 | | | | (0.92 | ) | | | (0.17 | ) | | | 0.51 | |
| LESS DISTRIBUTIONS: | | | | | | | | | | | | | | | | | | | | |
| From net investment income | | | (0.09 | ) | | | (0.37 | ) | | | (0.52 | ) | | | (0.45 | ) | | | (0.26 | ) |
| From net realized gains on investments | | | — | | | | — | | | | — | | | | — | | | | (0.02 | ) |
| Total distributions | | | (0.09 | ) | | | (0.37 | ) | | | (0.52 | ) | | | (0.45 | ) | | | (0.28 | ) |
| Net asset value, end of year | | $ | 7.96 | | | $ | 6.94 | | | $ | 6.58 | | | $ | 8.02 | | | $ | 8.64 | |
| Total return (B) | | | 16.00 | % (E) | | | 11.32 | % | | | (11.96 | )% | | | (1.99 | )% | | | 6.15 | % |
| RATIOS/SUPPLEMENTAL DATA: | | | | | | | | | | | | | | | | | | | | |
| Net assets, end of year (in 000’s) | | $ | 46,451 | | | $ | 7,155 | | | $ | 4,940 | | | $ | 12,188 | | | $ | 47,544 | |
| Ratios to average net assets (including interest expense) | | | | | | | | | | | | | | | | | | | | |
| Expenses, before waiver and reimbursement (C) | | | 1.32 | % | | | 1.75 | % | | | 1.58 | % | | | 1.33 | % | | | 1.42 | % |
| Expenses, net waiver and reimbursement (C) | | | 1.01 | % | | | 1.00 | % | | | 1.00 | % | | | 1.00 | % | | | 1.00 | % |
| Net investment income | | | 1.10 | % | | | 3.12 | % | | | 4.32 | % | | | 3.53 | % | | | 3.37 | % |
| Portfolio turnover rate | | | 480 | % | | | 394 | % | | | 307 | % | | | 224 | % | | | 159 | % |
| | | | | | | | | | | | | | | | | | | | | |
| | | | | | | | | | | | | | | | | | | | | |
| | | Class A | |
| | | For the | | | For the | | | For the | | | For the | | | For the | |
| | | Year Ended | | | Year Ended | | | Year Ended | | | Year Ended | | | Year Ended | |
| | | December 31, | | | December 31, | | | December 31, | | | December 31, | | | December 31, | |
| | | 2020 | | | 2019 | | | 2018 | | | 2018 | | | 2016 | |
| | | | | | | | | | | | | | | | | | | | | |
| Net asset value, beginning of year | | $ | 6.93 | | | $ | 6.57 | | | $ | 8.01 | | | $ | 8.63 | | | $ | 8.40 | |
| INCOME (LOSS) FROM INVESTMENT OPERATIONS: | | | | | | | | | | | | | | | | | | | | |
| Net investment income (A) | | | 0.04 | | | | 0.20 | | | | 0.32 | | | | 0.30 | | | | 0.27 | |
| Net realized and unrealized gain (loss) on investments | | | 1.05 | | | | 0.51 | | | | (1.26 | ) | | | (0.49 | ) | | | 0.22 | |
| Total from investment operations | | | 1.09 | | | | 0.71 | | | | (0.94 | ) | | | (0.19 | ) | | | 0.49 | |
| LESS DISTRIBUTIONS: | | | | | | | | | | | | | | | | | | | | |
| From net investment income | | | (0.07 | ) | | | (0.35 | ) | | | (0.50 | ) | | | (0.43 | ) | | | (0.24 | ) |
| From net realized gains on investments | | | — | | | | — | | | | — | | | | — | | | | (0.02 | ) |
| Total distributions | | | (0.07 | ) | | | (0.35 | ) | | | (0.50 | ) | | | (0.43 | ) | | | (0.26 | ) |
| Net asset value, end of year | | $ | 7.95 | | | $ | 6.93 | | | $ | 6.57 | | | $ | 8.01 | | | $ | 8.63 | |
| Total return (B) | | | 15.74 | % | | | 11.03 | % | | | (12.22 | )% | | | (2.24 | )% | | | 5.89 | % |
| RATIOS/SUPPLEMENTAL DATA: | | | | | | | | | | | | | | | | | | | | |
| Net assets, end of year (in 000’s) | | $ | 12,099 | | | $ | 11,462 | | | $ | 12,629 | | | $ | 20,327 | | | $ | 32,269 | |
| Ratios to average net assets (including interest expense) | | | | | | | | �� | | | | | | | | | | | | |
| Expenses, before waiver and reimbursement (D) | | | 1.69 | % | | | 2.00 | % | | | 1.82 | % | | | 1.57 | % | | | 1.67 | % |
| Expenses, net waiver and reimbursement (D) | | | 1.26 | % | | | 1.25 | % | | | 1.25 | % | | | 1.25 | % | | | 1.25 | % |
| Net investment income | | | 0.58 | % | | | 2.90 | % | | | 4.17 | % | | | 3.52 | % | | | 3.12 | % |
| Portfolio turnover rate | | | 480 | % | | | 394 | % | | | 307 | % | | | 224 | % | | | 159 | % |
| | | | | | | | | | | | | | | | | | | | | |
| (A) | Per share amounts calculated using average shares method, which more appropriately presents the per share data for the year. |
| (B) | Total return in the above table represents the rate that the investor would have earned or lost on an investment in the Fund assuming reinvestment of dividends and does not reflect the impact of sales charges. Had the Advisor not waived its fees and reimbursed expenses, total return would have been lower. |
| (C) Ratios to average net assets (excluding interest expense) | | | | | | | | | | | | | | | | | | | | |
| Expenses, before waiver and reimbursement | | | 1.31 | % | | | 1.75 | % | | | 1.58 | % | | | 1.33 | % | | | 1.42 | % |
| Expenses, net waiver and reimbursement | | | 1.00 | % | | | 1.00 | % | | | 1.00 | % | | | 1.00 | % | | | 1.00 | % |
| | | | | | | | | | | | | | | | | | | | | |
| (D) Ratios to average net assets (excluding interest expense) | | | | | | | | | | | | | | | | | | | | |
| Expenses, before waiver and reimbursement | | | 1.68 | % | | | 2.00 | % | | | 1.82 | % | | | 1.57 | % | | | 1.67 | % |
| Expenses, net waiver and reimbursement | | | 1.25 | % | | | 1.25 | % | | | 1.25 | % | | | 1.25 | % | | | 1.25 | % |
| (E) | Includes adjustments in accordance with accounting principles generally accepted in the United States and, consequently, the net asset value for financial reporting purposes and the returns based upon those net asset values may differ from the net asset values and returns for shareholder transactions. |
See accompanying notes to financial statements.
| RATIONAL FUNDS |
| Rational Equity Armor Fund (Continued) |
| Financial Highlights |
For a Share Outstanding Throughout Each Year
| | | Class C | |
| | | For the | | | For the | | | For the | | | For the | | | For the | |
| | | Year Ended | | | Year Ended | | | Year Ended | | | Year Ended | | | Year Ended | |
| | | December 31, | | | December 31, | | | December 31, | | | December 31, | | | December 31, | |
| | | 2020 | | | 2019 | | | 2018 | | | 2017 | | | 2016 | |
| | | | | | | | | | | | | | | | | | | | | |
| Net asset value, beginning of year | | $ | 6.91 | | | $ | 6.55 | | | $ | 7.99 | | | $ | 8.61 | | | $ | 8.38 | |
| INCOME (LOSS) FROM INVESTMENT OPERATIONS: | | | | | | | | | | | | | | | | | | | | |
| Net investment income (loss) (A) | | | (0.01 | ) | | | 0.15 | | | | 0.27 | | | | 0.29 | | | | 0.22 | |
| Net realized and unrealized gain (loss) on investments | | | 1.04 | | | | 0.51 | | | | (1.27 | ) | | | (0.52 | ) | | | 0.22 | |
| Total from investment operations | | | 1.03 | | | | 0.66 | | | | (1.00 | ) | | | (0.23 | ) | | | 0.44 | |
| LESS DISTRIBUTIONS: | | | | | | | | | | | | | | | | | | | | |
| From net investment income | | | (0.04 | ) | | | (0.30 | ) | | | (0.44 | ) | | | (0.39 | ) | | | (0.19 | ) |
| From net realized gains on investments | | | — | | | | — | | | | — | | | | — | | | | (0.02 | ) |
| Total distributions | | | (0.04 | ) | | | (0.30 | ) | | | (0.44 | ) | | | (0.39 | ) | | | (0.21 | ) |
| Net asset value, end of year | | $ | 7.90 | | | $ | 6.91 | | | $ | 6.55 | | | $ | 7.99 | | | $ | 8.61 | |
| Total return (B) | | | 14.88 | % | | | 10.23 | % (C) | | | (12.92 | )% (C) | | | (2.68 | )% | | | 5.34 | % |
| RATIOS/SUPPLEMENTAL DATA: | | | | | | | | | | | | | | | | | | | | |
| Net assets, end of year (in 000’s) | | $ | 1,164 | | | $ | 1,252 | | | $ | 1,664 | | | $ | 2,799 | | | $ | 1,654 | |
| Ratios to average net assets (including interest expense) | | | | | | | | | | | | | | | | | | | | |
| Expenses, before waiver and reimbursement (D) | | | 2.39 | % | | | 2.75 | % | | | 2.59 | % | | | 2.31 | % | | | 2.17 | % |
| Expenses, net waiver and reimbursement (D) | | | 2.01 | % | | | 2.00 | % | | | 1.90 | % | | | 1.75 | % | | | 1.75 | % |
| Net investment income (loss) | | | (0.18 | )% | | | 2.16 | % | | | 3.52 | % | | | 3.50 | % | | | 2.61 | % |
| Portfolio turnover rate | | | 480 | % | | | 394 | % | | | 307 | % | | | 224 | % | | | 159 | % |
| | | | | | | | | | | | | | | | | | | | | |
| (A) | Per share amounts calculated using average shares method, which more appropriately presents the per share data for the year. |
| (B) | Total return in the above table represents the rate that the investor would have earned or lost on an investment in the Fund assuming reinvestment of dividends. Had the Advisor not waived its fees and reimbursed expenses, total return would have been lower. |
| (C) | Includes adjustments in accordance with accounting principles generally accepted in the United States and, consequently, the net asset value for financial reporting purposes and the returns based upon those net asset values may differ from the net asset values and returns for shareholder transactions. |
| (D) Ratios to average net assets (excluding interest expense) | | | | | | | | | | | | | | | |
| Expenses, before waiver and reimbursement | | | 2.38 | % | | | 2.75 | % | | | 2.59 | % | | | 2.31 | % | | | 2.17 | % |
| Expenses, net waiver and reimbursement | | | 2.00 | % | | | 2.00 | % | | | 1.90 | % | | | 1.75 | % | | | 1.75 | % |
See accompanying notes to financial statements.
| RATIONAL FUNDS |
| Rational Tactical Return Fund |
| Financial Highlights |
For a Share Outstanding Throughout Each Year
| | | Institutional | |
| | | For the | | | For the | | | For the | | | For the | | | For the | |
| | | Year Ended | | | Year Ended | | | Year Ended | | | Year Ended | | | Year Ended | |
| | | December 31, | | | December 31, | | | December 31, | | | December 31, | | | December 31, | |
| | | 2020 | | | 2019 | | | 2018 | | | 2017 | | | 2016 | |
| | | | | | | | | | | | | | | | | | | | | |
| Net asset value, beginning of year | | $ | 5.66 | | | $ | 5.40 | | | $ | 4.99 | | | $ | 5.12 | | | $ | 5.39 | |
| INCOME (LOSS) FROM INVESTMENT OPERATIONS: | | | | | | | | | | | | | | | | | | | | |
| Net investment income (loss) (A) | | | (0.09 | ) | | | (0.01 | ) | | | (0.06 | ) | | | 0.01 | | | | 0.06 | |
| Net realized and unrealized gain on investments | | | 0.24 | | | | 0.46 | | | | 0.55 | | | | 0.14 | | | | 0.37 | |
| Total from investment operations | | | 0.15 | | | | 0.45 | | | | 0.49 | | | | 0.15 | | | | 0.43 | |
| LESS DISTRIBUTIONS: | | | | | | | | | | | | | | | | | | | | |
| From net investment income | | | — | | | | — | | | | (0.01 | ) | | | (0.28 | ) | | | (0.70 | ) |
| From net realized gains on investments | | | (0.12 | ) | | | (0.19 | ) | | | (0.07 | ) | | | — | | | | — | |
| Total distributions | | | (0.12 | ) | | | (0.19 | ) | | | (0.08 | ) | | | (0.28 | ) | | | (0.70 | ) |
| Net asset value, end of year | | $ | 5.69 | | | $ | 5.66 | | | $ | 5.40 | | | $ | 4.99 | | | $ | 5.12 | |
| Total return (B) | | | 2.65 | % | | | 8.35 | % | | | 9.66 | % | | | 2.89 | % (C) | | | 7.82 | % (C) |
| RATIOS/SUPPLEMENTAL DATA: | | | | | | | | | | | | | | | | | | | | |
| Net assets, end of year (in 000’s) | | $ | 199,987 | | | $ | 151,070 | | | $ | 18,333 | | | $ | 5,451 | | | $ | 4,747 | |
| Ratios to average net assets (including interest expense) | | | | | | | | | | | | | | | | | | | | |
| Expenses, before waiver and reimbursement | | | 2.05 | % | | | 2.15 | % | | | 3.16 | % | | | 4.29 | % | | | 2.61 | % |
| Expenses, net waiver and reimbursement | | | 1.99 | % | | | 1.99 | % | | | 1.99 | % | | | 1.17 | % | | | 1.00 | % |
| Net investment income (loss) | | | (1.54 | )% | | | (0.15 | )% | | | (1.20 | )% | | | 0.22 | % | | | 1.07 | % |
| Portfolio turnover rate | | | 0 | % | | | 0 | % | | | 0 | % | | | 199 | % | | | 246 | % |
| | | | | | | | | | | | | | | | | | | | | |
| | | | | | | | | | | | | | | | | | | | | |
| | | Class A | |
| | | For the | | | For the | | | For the | | | For the | | | For the | |
| | | Year Ended | | | Year Ended | | | Year Ended | | | Year Ended | | | Year Ended | |
| | | December 31, | | | December 31, | | | December 31, | | | December 31, | | | December 31, | |
| | | 2020 | | | 2019 | | | 2018 | | | 2017 | | | 2016 | |
| | | | | | | | | | | | | | | | | | | | | |
| | | $ | 5.70 | | | $ | 5.45 | | | $ | 5.04 | | | $ | 5.16 | | | $ | 5.43 | |
| Net asset value, beginning of year | | | | | | | | | | | | | | | | | | | | |
| INCOME (LOSS) FROM INVESTMENT OPERATIONS: | | | | | | | | | | | | | | | | | | | | |
| Net investment income (loss) (A) | | | (0.09 | ) | | | (0.02 | ) | | | (0.07 | ) | | | 0.01 | | | | 0.05 | |
| Net realized and unrealized gain on investments | | | 0.23 | | | | 0.46 | | | | 0.55 | | | | 0.14 | | | | 0.37 | |
| Total from investment operations | | | 0.14 | | | | 0.44 | | | | 0.48 | | | | 0.15 | | | | 0.42 | |
| LESS DISTRIBUTIONS: | | | | | | | | | | | | | | | | | | | | |
| From net investment income | | | — | | | | — | | | | (0.00 | ) (D) | | | (0.27 | ) | | | (0.69 | ) |
| From net realized gains on investments | | | (0.12 | ) | | | (0.19 | ) | | | (0.07 | ) | | | — | | | | — | |
| Total distributions | | | (0.12 | ) | | | (0.19 | ) | | | (0.07 | ) | | | (0.27 | ) | | | (0.69 | ) |
| Net asset value, end of year | | $ | 5.72 | | | $ | 5.70 | | | $ | 5.45 | | | $ | 5.04 | | | $ | 5.16 | |
| Total return (B) | | | 2.45 | % | | | 8.09 | % | | | 9.45 | % | | | 2.98 | % (C) | | | 7.48 | % (C) |
| RATIOS/SUPPLEMENTAL DATA: | | | | | | | | | | | | | | | | | | | | |
| Net assets, end of year (in 000’s) | | $ | 7,423 | | | $ | 15,097 | | | $ | 18,327 | | | $ | 449 | | | $ | 964 | |
| Ratios to average net assets (including interest expense) | | | | | | | | | | | | | | | | | | | | |
| Expenses, before waiver and reimbursement | | | 2.33 | % | | | 2.51 | % | | | 3.50 | % | | | 4.54 | % | | | 2.86 | % |
| Expenses, net waiver and reimbursement | | | 2.24 | % | | | 2.24 | % | | | 2.24 | % | | | 1.35 | % | | | 1.25 | % |
| Net investment income (loss) | | | (1.64 | )% | | | (0.31 | )% | | | (1.20 | )% | | | 0.19 | % | | | 0.92 | % |
| Portfolio turnover rate | | | 0 | % | | | 0 | % | | | 0 | % | | | 199 | % | | | 246 | % |
| | | | | | | | | | | | | | | | | | | | | |
| (A) | Per share amounts calculated using average shares method, which more appropriately presents the per share data for the year. |
| (B) | Total return in the above table represents the rate that the investor would have earned or lost on an investment in the Fund assuming reinvestment of dividends and does not reflect the impact of sales charges. Had the Advisor not waived its fees and reimbursed expenses, total return would have been lower. |
| (C) | Includes adjustments in accordance with accounting principles generally accepted in the United States and, consequently, the net asset value for financial reporting purposes and the returns based upon those net asset values may differ from the net asset values and returns for shareholder transactions. |
| (D) | Amount is less than $0.005. |
See accompanying notes to financial statements.
| RATIONAL FUNDS |
| Rational Tactical Return Fund |
| Financial Highlights |
For a Share Outstanding Throughout Each Year/Period
| | | Class C | |
| | | For the | | | For the | | | For the | | | For the | | | For the | |
| | | Year Ended | | | Year Ended | | | Year Ended | | | Year Ended | | | Period Ended | |
| | | December 31, | | | December 31, | | | December 31, | | | December 31, | | | December 31, | |
| | | 2020 | | | 2019 | | | 2018 | | | 2017 | | | 2016 (A) | |
| | | | | | | | | | | | | | | | | | | | | |
| Net asset value, beginning of year/period | | $ | 5.62 | | | $ | 5.43 | | | $ | 5.06 | | | $ | 5.16 | | | $ | 5.49 | |
| LOSS FROM INVESTMENT OPERATIONS: | | | | | | | | | | | | | | | | | | | | |
| Net investment income (loss) (B) | | | (0.14 | ) | | | (0.07 | ) | | | (0.12 | ) | | | (0.03 | ) | | | 0.00 | (C) |
| Net realized and unrealized gain on investments | | | 0.24 | | | | 0.45 | | | | 0.56 | | | | 0.15 | | | | 0.35 | |
| Total from investment operations | | | 0.10 | | | | 0.38 | | | | 0.44 | | | | 0.12 | | | | 0.35 | |
| LESS DISTRIBUTIONS: | | | | | | | | | | | | | | | | | | | | |
| From net investment income | | | — | | | | — | | | | — | | | | (0.22 | ) | | | (0.68 | ) |
| From net realized gains on investments | | | (0.12 | ) | | | (0.19 | ) | | | (0.07 | ) | | | — | | | | — | |
| Total distributions | | | (0.12 | ) | | | (0.19 | ) | | | (0.07 | ) | | | (0.22 | ) | | | (0.68 | ) |
| Net asset value, end of year/period | | $ | 5.60 | | | $ | 5.62 | | | $ | 5.43 | | | $ | 5.06 | | | $ | 5.16 | |
| Total return (D) | | | 1.77 | % | | | 7.01 | % | | | 8.62 | % | | | 2.42 | % (E) | | | 6.13 | % (E, F) |
| RATIOS/SUPPLEMENTAL DATA: | | | | | | | | | | | | | | | | | | | | |
| Net assets, end of year/period (in 000’s) | | $ | 9,130 | | | $ | 6,453 | | | $ | 1 | | | $ | 1 | | | $ | 1 | |
| Ratios to average net assets (including interest expense) | | | | | | | | | | | | | | | | | | | | |
| Expenses, before waiver and reimbursement | | | 3.04 | % | | | 3.11 | % | | | 4.16 | % | | | 5.29 | % | | | 3.61 | % (G) |
| Expenses, net waiver and reimbursement | | | 2.99 | % | | | 2.99 | % | | | 2.99 | % | | | 2.17 | % | | | 2.00 | % (G) |
| Net investment (loss) | | | (2.54 | )% | | | (1.18 | )% | | | (2.34 | )% | | | (0.53 | )% | | | (0.14 | )% (G) |
| Portfolio turnover rate | | | 0 | % | | | 0 | % | | | 0 | % | | | 199 | % | | | 246 | % (F) |
| | | | | | | | | | | | | | | | | | | | | |
| (A) | The Rational Tactical Return Fund Class C shares commenced operations on May 31, 2016. |
| (B) | Per share amounts calculated using average shares method, which more appropriately presents the per share data for the year/period. |
| (C) | Amount is less than $0.005. |
| (D) | Total return in the above table represents the rate that the investor would have earned or lost on an investment in the Fund assuming reinvestment of dividends. Had the Advisor not waived its fees and reimbursed expenses, total return would have been lower. |
| (E) | Includes adjustments in accordance with accounting principles generally accepted in the United States and, consequently, the net asset value for financial reporting purposes and the returns based upon those net asset values may differ from the net asset values and returns for shareholder transactions. |
See accompanying notes to financial statements.
| RATIONAL FUNDS |
| Rational Dynamic Brands Fund |
| Financial Highlights |
For a Share Outstanding Throughout Each Year
| | | Institutional | |
| | | For the | | | For the | | | For the | | | For the | | | For the | |
| | | Year Ended | | | Year Ended | | | Year Ended | | | Year Ended | | | Year Ended | |
| | | December 31, | | | December 31, | | | December 31, | | | December 31, | | | December 31, | |
| | | 2020 | | | 2019 | | | 2018 (A) | | | 2017 (A) | | | 2016 (A) | |
| | | | | | | | | | | | | | | | | | | | | |
| Net asset value, beginning of year | | $ | 43.30 | | | $ | 34.20 | | | $ | 34.90 | | | $ | 37.80 | | | $ | 46.90 | |
| INCOME (LOSS) FROM INVESTMENT OPERATIONS: | | | | | | | | | | | | | | | | | | | | |
| Net investment income (loss) (B) | | | (0.33 | ) | | | (0.14 | ) | | | 0.16 | | | | 0.20 | | | | 0.50 | |
| Net realized and unrealized gain on investments | | | 19.98 | | | | 9.38 | | | | 0.07 | (D) | | | 5.40 | | | | 3.10 | |
| Total from investment operations | | | 19.65 | | | | 9.24 | | | | 0.23 | | | | 5.60 | | | | 3.60 | |
| LESS DISTRIBUTIONS: | | | | | | | | | | | | | | | | | | | | |
| From net investment income | | | — | | | | — | | | | (0.09 | ) | | | (0.20 | ) | | | (0.60 | ) |
| From net realized gains on investments | | | (6.75 | ) | | | (0.14 | ) | | | (0.84 | ) | | | (8.30 | ) | | | (12.10 | ) |
| Total distributions | | | (6.75 | ) | | | (0.14 | ) | | | (0.93 | ) | | | (8.50 | ) | | | (12.70 | ) |
| Net asset value, end of year | | $ | 56.20 | | | $ | 43.30 | | | $ | 34.20 | | | $ | 34.90 | | | $ | 37.80 | |
| Total return (C) | | | 45.28 | % | | | 27.03 | % | | | 0.72 | % | | | 14.66 | % | | | 7.21 | % |
| RATIOS/SUPPLEMENTAL DATA: | | | | | | | | | | | | | | | | | | | | |
| Net assets, end of year (in 000’s) | | $ | 53,102 | | | $ | 21,627 | | | $ | 16,725 | | | $ | 3,269 | | | $ | 3,445 | |
| Ratios to average net assets | | | | | | | | | | | | | | | | | | | | |
| Expenses, before waiver and reimbursement | | | 1.25 | % | | | 1.45 | % | | | 1.67 | % | | | 1.69 | % | | | 1.76 | % |
| Expenses, net waiver and reimbursement | | | 1.24 | % | | | 1.17 | % | | | 1.00 | % | | | 1.00 | % | | | 1.00 | % |
| Net investment income (loss) | | | (0.56 | )% | | | (0.36 | )% | | | 0.42 | % | | | 0.60 | % | | | 1.17 | % |
| Portfolio turnover rate | | | 320 | % | | | 220 | % | | | 411 | % | | | 305 | % | | | 178 | % |
| | | | | | | | | | | | | | | | | | | | | |
| | | | | | | | | | | | | | | | | | | | | |
| | | Class A | |
| | | For the | | | For the | | | For the | | | For the | | | For the | |
| | | Year Ended | | | Year Ended | | | Year Ended | | | Year Ended | | | Year Ended | |
| | | December 31, | | | December 31, | | | December 31, | | | December 31, | | | December 31, | |
| | | 2020 | | | 2019 | | | 2018 (A) | | | 2018 (A) | | | 2017 (A) | |
| | | | | | | | | | | | | | | | | | | | | |
| Net asset value, beginning of year | | $ | 30.27 | | | $ | 24.00 | | | $ | 24.70 | | | $ | 28.90 | | | $ | 38.60 | |
| INCOME (LOSS) FROM INVESTMENT OPERATIONS: | | | | | | | | | | | | | | | | | | | | |
| Net investment income (loss) (B) | | | (0.28 | ) | | | (0.16 | ) | | | 0.02 | | | | 0.10 | | | | 0.30 | |
| Net realized and unrealized gain on investments | | | 13.92 | | | | 6.57 | | | | 0.12 | (D) | | | 4.10 | | | | 2.60 | |
| Total from investment operations | | | 13.64 | | | | 6.41 | | | | 0.14 | | | | 4.20 | | | | 2.90 | |
| LESS DISTRIBUTIONS: | | | | | | | | | | | | | | | | | | | | |
| From net investment income | | | — | | | | — | | | | — | | | | (0.10 | ) | | | (0.50 | ) |
| From net realized gains on investments | | | (6.75 | ) | | | (0.14 | ) | | | (0.84 | ) | | | (8.30 | ) | | | (12.10 | ) |
| Total distributions | | | (6.75 | ) | | | (0.14 | ) | | | (0.84 | ) | | | (8.40 | ) | | | (12.60 | ) |
| Net asset value, end of year | | $ | 37.16 | | | $ | 30.27 | | | $ | 24.00 | | | $ | 24.70 | | | $ | 28.90 | |
| Total return (C) | | | 44.91 | % | | | 26.72 | % | | | 0.63 | % | | | 14.30 | % | | | 6.91 | % |
| RATIOS/SUPPLEMENTAL DATA: | | | | | | | | | | | | | | | | | | | | |
| Net assets, end of year (in 000’s) | | $ | 17,972 | | | $ | 12,387 | | | $ | 11,154 | | | $ | 12,870 | | | $ | 16,180 | |
| Ratios to average net assets | | | | | | | | | | | | | | | | | | | | |
| Expenses, before waiver and reimbursement | | | 1.52 | % | | | 1.74 | % | | | 2.05 | % | | | 1.94 | % | | | 2.01 | % |
| Expenses, net waiver and reimbursement | | | 1.49 | % | | | 1.41 | % | | | 1.25 | % | | | 1.25 | % | | | 1.25 | % |
| Net investment income (loss) | | | (0.82 | )% | | | (0.59 | )% | | | 0.08 | % | | | 0.35 | % | | | 0.86 | % |
| Portfolio turnover rate | | | 320 | % | | | 220 | % | | | 411 | % | | | 305 | % | | | 178 | % |
| | | | | | | | | | | | | | | | | | | | | |
| (A) | Effective September 21, 2018, the Fund had a one-to-ten reverse stock split. Per Share amounts for the periods have been adjusted to give effect to the one-to-ten stock split. |
| (B) | Per share amounts calculated using average shares method, which more appropriately presents the per share data for the year. |
| (C) | Total return in the above table represents the rate that the investor would have earned or lost on an investment in the Fund assuming reinvestment of dividends and does not reflect the impact of sales charges. |
| (D) | As required by SEC standard per share data calculation methodology, this represents a balancing figure derived from the other amounts in the financial highlights tables that captures all other changes affecting net asset value per share. This per share gain amount does not correlate to the aggregate of the net realized and unrealized loss in the Statement of Operations for the year ended December 31, 2018, primarily due to the timing of sales and repurchases of the Fund’s shares in relation to fluctuating market values of the Fund’s portfolio. |
See accompanying notes to financial statements.
| RATIONAL FUNDS |
| Rational Dynamic Brands Fund (Continued) |
| Financial Highlights |
For a Share Outstanding Throughout Each Year
| | | Class C | |
| | | For the | | | For the | | | For the | | | For the | | | For the | |
| | | Year Ended | | | Year Ended | | | Year Ended | | | Year Ended | | | Year Ended | |
| | | December 31, | | | December 31, | | | December 31, | | | December 31, | | | December 31, | |
| | | 2020 | | | 2019 | | | 2018 (A) | | | 2017 (A) | | | 2016 (A) | |
| | | | | | | | | | | | | | | | | | | | | |
| Net asset value, beginning of year | | $ | 27.15 | | | $ | 21.70 | | | $ | 22.60 | | | $ | 27.10 | | | $ | 36.90 | |
| INCOME (LOSS) FROM INVESTMENT OPERATIONS: | | | | | | | | | | | | | | | | | | | | |
| Net investment income (loss) (B) | | | (0.50 | ) | | | (0.32 | ) | | | (0.14 | ) | | | (0.00 | ) (C) | | | 0.10 | |
| Net realized and unrealized gain on investments | | | 12.44 | | | | 5.91 | | | | 0.08 | (F) | | | 3.80 | | | | 2.40 | |
| Total from investment operations | | | 11.94 | | | | 5.59 | | | | (0.06 | ) | | | 3.80 | | | | 2.50 | |
| LESS DISTRIBUTIONS: | | | | | | | | | | | | | | | | | | | | |
| From net investment income | | | — | | | | — | | | | — | | | | — | | | | (0.20 | ) |
| From net realized gains on investments | | | (6.75 | ) | | | (0.14 | ) | | | (0.84 | ) | | | (8.30 | ) | | | (12.10 | ) |
| Total distributions | | | (6.75 | ) | | | (0.14 | ) | | | (0.84 | ) | | | (8.30 | ) | | | (12.30 | ) |
| Net asset value, end of year | | $ | 32.34 | | | $ | 27.15 | | | $ | 21.70 | | | $ | 22.60 | | | $ | 27.10 | |
| Total return (D) | | | 43.80 | % | | | 25.78 | % (E) | | | (0.20 | )% (E) | | | 14.03 | % | | | 6.19 | % |
| RATIOS/SUPPLEMENTAL DATA: | | | | | | | | | | | | | | | | | | | | |
| Net assets, end of year (in 000’s) | | $ | 1,525 | | | $ | 184 | | | $ | 214 | | | $ | 231 | | | $ | 394 | |
| Ratios to average net assets | | | | | | | | | | | | | | | | | | | | |
| Expenses, before waiver and reimbursement | | | 2.41 | % | | | 2.68 | % | | | 2.73 | % | | | 2.65 | % | | | 2.51 | % |
| Expenses, net waiver and reimbursement | | | 2.24 | % | | | 2.15 | % | | | 1.91 | % | | | 1.75 | % | | | 1.75 | % |
| Net investment income (loss) | | | (1.54 | )% | | | (1.30 | )% | | | (0.59 | )% | | | (0.14 | )% | | | 0.28 | % |
| Portfolio turnover rate | | | 320 | % | | | 220 | % | | | 411 | % | | | 305 | % | | | 178 | % |
| | | | | | | | | | | | | | | | | | | | | |
| (A) | Effective September 21, 2018, the Fund had a one-to-ten reverse stock split. Per Share amounts for the periods have been adjusted to give effect to the one-to-ten stock split. |
| (B) | Per share amounts calculated using average shares method, which more appropriately presents the per share data for the year/period. |
| (C) | Amount is less than $0.005. |
| (D) | Total return in the above table represents the rate that the investor would have earned or lost on an investment in the Fund assuming reinvestment of dividends and does not reflect the impact of sales charges. |
| (E) | Includes adjustments in accordance with accounting principles generally accepted in the United States and, consequently, the net asset value for financial reporting purposes and the returns based upon those net asset values may differ from the net asset values and returns for shareholder transactions. |
| (F) | As required by SEC standard per share data calculation methodology, this represents a balancing figure derived from the other amounts in the financial highlights tables that captures all other changes affecting net asset value per share. This per share gain amount does not correlate to the aggregate of the net realized and unrealized loss in the Statement of Operations for the year ended December 31, 2018, primarily due to the timing of sales and repurchases of the Fund’s shares in relation to fluctuating market values of the Fund’s portfolio. |
See accompanying notes to financial statements.
| RATIONAL FUNDS |
| Rational Strategic Allocation Fund |
| Financial Highlights |
For a Share Outstanding Throughout Each Year/Period
| | | Institutional | |
| | | For the | | | For the | | | For the | | | For the | | | For the | |
| | | Year Ended | | | Year Ended | | | Year Ended | | | Year Ended | | | Period Ended | |
| | | December 31, | | | December 31, | | | December 31, | | | December 31, | | | December 31, | |
| | | 2020 | | | 2019 | | | 2018 | | | 2017 | | | 2016 (A) | |
| | | | | | | | | | | | | | | | | | | | | |
| Net asset value, beginning of year | | $ | 9.58 | | | $ | 9.12 | | | $ | 10.02 | | | $ | 9.37 | | | $ | 9.99 | |
| INCOME (LOSS) FROM INVESTMENT OPERATIONS: | | | | | | | | | | | | | | | | | | | | |
| Net investment income (B) | | | 0.27 | | | | 0.36 | | | | 0.39 | | | | 0.33 | | | | 0.43 | |
| Net realized and unrealized gain (loss) on investments | | | (0.61 | ) | | | 0.79 | | | | (0.67 | ) | | | 0.78 | | | | 0.09 | (C) |
| Total from investment operations | | | (0.34 | ) | | | 1.15 | | | | (0.28 | ) | | | 1.11 | | | | 0.52 | |
| LESS DISTRIBUTIONS: | | | | | | | | | | | | | | | | | | | | |
| From net investment income | | | (0.28 | ) | | | (0.41 | ) | | | (0.36 | ) | | | (0.46 | ) | | | (0.17 | ) |
| From net realized gains on investments | | | — | | | | (0.22 | ) | | | (0.26 | ) | | | — | | | | (0.97 | ) |
| From Return of capital | | | (0.02 | ) | | | (0.06 | ) | | | — | | | | — | | | | — | |
| Total distributions | | | (0.30 | ) | | | (0.69 | ) | | | (0.62 | ) | | | (0.46 | ) | | | (1.14 | ) |
| Net asset value, end of year/period | | $ | 8.94 | | | $ | 9.58 | | | $ | 9.12 | | | $ | 10.02 | | | $ | 9.37 | |
| Total return (D) | | | (3.19 | )% | | | 12.64 | % | | | (2.81 | )% | | | 11.95 | % | | | 5.11 | % (E) |
| RATIOS/SUPPLEMENTAL DATA: | | | | | | | | | | | | | | | | | | | | |
| Net assets, end of year/period (in 000’s) | | $ | 248 | | | $ | 266 | | | $ | 253 | | | $ | 278 | | | $ | 260 | |
| Ratios to average net assets | | | | | | | | | | | | | | | | | | | | |
| Expenses, before waiver and reimbursement (F) | | | 1.31 | % | | | 0.98 | % | | | 1.04 | % | | | 0.85 | % | | | 1.36 | % (G) |
| Expenses, net waiver and reimbursement (F) | | | 0.45 | % | | | 0.45 | % | | | 0.45 | % | | | 0.45 | % | | | 0.45 | % (G) |
| Net investment income (F,H) | | | 3.26 | % | | | 3.67 | % | | | 3.91 | % | | | 3.35 | % | | | 6.98 | % (G) |
| Portfolio turnover rate | | | 89 | % | | | 62 | % | | | 53 | % | | | 17 | % | | | 27 | % (E) |
| | | | | | | | | | | | | | | | | | | | | |
| | | | | | | | | | | | | | | | | | | | | |
| | | Class A | |
| | | For the | | | For the | | | For the | | | For the | | | For the | |
| | | Year Ended | | | Year Ended | | | Year Ended | | | Year Ended | | | Year Ended | |
| | | December 31, | | | December 31, | | | December 31, | | | December 31, | | | December 31, | |
| | | 2020 | | | 2019 | | | 2018 | | | 2017 | | | 2016 | |
| | | | | | | | | | | | | | | | | | | | | |
| Net asset value, beginning of year | | $ | 9.63 | | | $ | 9.15 | | | $ | 10.05 | | | $ | 9.40 | | | $ | 9.78 | |
| INCOME (LOSS) FROM INVESTMENT OPERATIONS: | | | | | | | | | | | | | | | | | | | | |
| Net investment income (B) | | | 0.25 | | | | 0.32 | | | | 0.33 | | | | 0.26 | | | | 0.18 | |
| Net realized and unrealized gain (loss) on investments | | | (0.61 | ) | | | 0.82 | | | | (0.63 | ) | | | 0.83 | | | | 0.62 | |
| Total from investment operations | | | (0.36 | ) | | | 1.14 | | | | (0.30 | ) | | | 1.09 | | | | 0.80 | |
| LESS DISTRIBUTIONS: | | | | | | | | | | | | | | | | | | | | |
| From net investment income | | | (0.26 | ) | | | (0.38 | ) | | | (0.34 | ) | | | (0.44 | ) | | | (0.21 | ) |
| From net realized gains on investments | | | — | | | | (0.22 | ) | | | (0.26 | ) | | | — | | | | (0.97 | ) |
| From Return of capital | | | (0.02 | ) | | | (0.06 | ) | | | — | | | | — | | | | — | |
| Total distributions | | | (0.28 | ) | | | (0.66 | ) | | | (0.60 | ) | | | (0.44 | ) | | | (1.18 | ) |
| Net asset value, end of year | | $ | 8.99 | | | $ | 9.63 | | | $ | 9.15 | | | $ | 10.05 | | | $ | 9.40 | |
| Total return (D) | | | (3.42 | )% | | | 12.49 | % | | | (3.05 | )% | | | 11.61 | % | | | 8.16 | % |
| RATIOS/SUPPLEMENTAL DATA: | | | | | | | | | | | | | | | | | | | | |
| Net assets, end of year (in 000’s) | | $ | 7,713 | | | $ | 9,395 | | | $ | 9,842 | | | $ | 13,033 | | | $ | 14,822 | |
| Ratios to average net assets | | | | | | | | | | | | | | | | | | | | |
| Expenses, before waiver and reimbursement (F) | | | 1.65 | % | | | 1.35 | % | | | 1.37 | % | | | 1.14 | % | | | 1.30 | % |
| Expenses, net waiver and reimbursement (F) | | | 0.70 | % | | | 0.70 | % | | | 0.70 | % | | | 0.70 | % | | | 0.70 | % |
| Net Investment income (F,H) | | | 2.98 | % | | | 3.25 | % | | | 3.25 | % | | | 2.60 | % | | | 1.82 | % |
| Portfolio turnover rate | | | 89 | % | | | 62 | % | | | 53 | % | | | 17 | % | | | 27 | % |
| | | | | | | | | | | | | | | | | | | | | |
| (A) | The Rational Strategic Allocation Fund Institutional Class shares commenced operations on May 31, 2016. |
| (B) | Per share amounts calculated using average shares method, which more appropriately presents the per share data for the year/period. |
| (C) | As required by SEC standard per share data calculation methodology, this represents a balancing figure derived from the other amounts in the financial highlights tables that captures all other changes affecting net asset value per share. This per share gain amount does not correlate to the aggregate of the net realized and unrealized loss in the Statement of Operations for the period ended December 31, 2016, primarily due to the timing of sales and repurchases of the Fund’s shares in relation to fluctuating market values of the Fund’s portfolio. |
| (D) | Total return in the above table represents the rate that the investor would have earned or lost on an investment in the Fund assuming reinvestment of dividends and does not reflect the impact of sales charges. Had the Advisor not waived its fees and reimbursed expenses, total return would have been lower. |
| (F) | The ratios of expenses to average net assets and net investment income (loss) to average net assets do not reflect the expenses of the underlying investment companies in which the Fund invests. |
| (H) | Recognition of net investment income (loss) is affected by the timing and declaration of dividends by the underlying investment companies in which the Fund invests. |
See accompanying notes to financial statements.
| RATIONAL FUNDS |
| Rational Strategic Allocation Fund (Continued) |
| Financial Highlights |
For a Share Outstanding Throughout Each Year/Period
| | | Class C | |
| | | For the | | | For the | | | For the | | | For the | | | For the | |
| | | Year Ended | | | Year Ended | | | Year Ended | | | Year Ended | | | Period Ended | |
| | | December 31, | | | December 31, | | | December 31, | | | December 31, | | | December 31, | |
| | | 2020 | | | 2019 | | | 2018 | | | 2018 | | | 2016 (A) | |
| | | | | | | | | | | | | | | | | | | | | |
| Net asset value, beginning of year/period | | $ | 9.58 | | | $ | 9.11 | | | $ | 10.03 | | | $ | 9.39 | | | $ | 9.99 | |
| INCOME (LOSS) FROM INVESTMENT OPERATIONS: | | | | | | | | | | | | | | | | | | | | |
| Net investment income (B) | | | 0.19 | | | | 0.26 | | | | 0.29 | | | | 0.23 | | | | 0.24 | |
| Net realized and unrealized gain (loss) on investments | | | (0.61 | ) | | | 0.80 | | | | (0.67 | ) | | | 0.78 | | | | 0.22 | (C) |
| Total from investment operations | | | (0.42 | ) | | | 1.06 | | | | (0.38 | ) | | | 1.01 | | | | 0.46 | |
| LESS DISTRIBUTIONS: | | | | | | | | | | | | | | | | | | | | |
| From net investment income | | | (0.19 | ) | | | (0.31 | ) | | | (0.28 | ) | | | (0.37 | ) | | | (0.09 | ) |
| From net realized gains on investments | | | — | | | | (0.22 | ) | | | (0.26 | ) | | | — | | | | (0.97 | ) |
| From Return of capital | | | (0.02 | ) | | | (0.06 | ) | | | — | | | | — | | | | — | |
| Total distributions | | | (0.21 | ) | | | (0.59 | ) | | | (0.54 | ) | | | (0.37 | ) | | | (1.06 | ) |
| Net asset value, end of year/period | | $ | 8.95 | | | $ | 9.58 | | | $ | 9.11 | | | $ | 10.03 | | | $ | 9.39 | |
| Total return (D) | | | (4.13 | )% | | | 11.61 | % | | | (3.83 | )% | | | 10.80 | % | | | 4.56 | % (E) |
| RATIOS/SUPPLEMENTAL DATA: | | | | | | | | | | | | | | | | | | | | |
| Net assets, end of year/period (in 000’s) | | $ | 1 | | | $ | 1 | | | $ | 1 | | | $ | 1 | | | $ | 1 | |
| Ratios to average net assets | | | | | | | | | | | | | | | | | | | | |
| Expenses, before waiver and reimbursement (F) | | | 2.33 | % | | | 2.02 | % | | | 1.92 | % | | | 1.82 | % | | | 1.89 | % (G) |
| Expenses, net waiver and reimbursement (F) | | | 1.45 | % | | | 1.45 | % | | | 1.45 | % | | | 1.45 | % | | | 1.45 | % (G) |
| Net investment income (F,H) | | | 2.26 | % | | | 2.65 | % | | | 2.89 | % | | | 2.31 | % | | | 3.92 | % (G) |
| Portfolio turnover rate | | | 89 | % | | | 62 | % | | | 53 | % | | | 17 | % | | | 27 | % (E) |
| | | | | | | | | | | | | | | | | | | | | |
| (A) | The Rational Strategic Allocation Fund Class C shares commenced operations on May 31, 2016. |
| (B) | Per share amounts calculated using average shares method, which more appropriately presents the per share data for the year/period. |
| (C) | As required by SEC standard per share data calculation methodology, this represents a balancing figure derived from the other amounts in the financial highlights tables that captures all other changes affecting net asset value per share. This per share gain amount does not correlate to the aggregate of the net realized and unrealized loss in the Statement of Operations for the period ended December 31, 2016, primarily due to the timing of sales and repurchases of the Fund’s shares in relation to fluctuating market values of the Fund’s portfolio. |
| (D) | Total return in the above table represents the rate that the investor would have earned or lost on an investment in the Fund assuming reinvestment of dividends and does not reflect the impact of sales charges. Had the Advisor not waived its fees and reimbursed expenses, total return would have been lower. |
| (F) | The ratios of expenses to average net assets and net investment income (loss) to average net assets do not reflect the expenses of the underlying investment companies in which the Fund invests. |
| (H) | Recognition of net investment income (loss) is affected by the timing and declaration of dividends by the underlying investment companies in which the Fund invests. |
See accompanying notes to financial statements.
| RATIONAL FUNDS |
| Rational/ReSolve Adaptive Asset Allocation Fund |
| Financial Highlights (Consolidated) |
For a Share Outstanding Throughout Each Year/Period
| | | Institutional | |
| | | For the | | | For the | | | For the | | | For the | | | For the | |
| | | Year Ended | | | Year Ended | | | Year Ended | | | Year Ended | | | Period Ended | |
| | | December 31, | | | December 31, | | | December 31, | | | December 31, | | | December 31, | |
| | | 2020 | | | 2019 | | | 2018 | | | 2018 | | | 2016 (A) | |
| | | | | | | | | | | | | | | | | | | | | |
| Net asset value, beginning of year/period | | $ | 23.73 | | | $ | 23.10 | | | $ | 25.25 | | | $ | 24.33 | | | $ | 25.00 | |
| INCOME (LOSS) FROM INVESTMENT OPERATIONS: | | | | | | | | | | | | | | | | | | | | |
| Net investment (loss) (B) | | | (0.37 | ) | | | (0.02 | ) | | | (0.04 | ) | | | (0.32 | ) | | | (0.12 | ) |
| Net realized and unrealized gain (loss) on investments | | | 0.52 | | | | 4.32 | | | | (1.89 | ) | | | 1.26 | | | | (0.55 | ) |
| Total from investment operations | | | 0.15 | | | | 4.30 | | | | (1.93 | ) | | | 0.94 | | | | (0.67 | ) |
| LESS DISTRIBUTIONS: | | | | | | | | | | | | | | | | | | | | |
| From net investment income | | | (0.08 | ) | | | (0.69 | ) | | | — | | | | — | | | | — | |
| From net realized gains on investments | | | — | | | | (2.94 | ) | | | (0.22 | ) | | | (0.02 | ) | | | — | |
| From Return of capital | | | (0.03 | ) | | | (0.04 | ) | | | — | | | | — | | | | — | |
| Total distributions | | | (0.11 | ) | | | (3.67 | ) | | | (0.22 | ) | | | (0.02 | ) | | | — | |
| Net asset value, end of year/period | | $ | 23.77 | | | $ | 23.73 | | | $ | 23.10 | | | $ | 25.25 | | | $ | 24.33 | |
| Total return (C) | | | 0.65 | % | | | 18.32 | % | | | (7.64 | )% | | | 3.85 | % | | | (2.68 | )% (D) |
| RATIOS/SUPPLEMENTAL DATA: | | | | | | | | | | | | | | | | | | | | |
| Net assets, end of year/period (in 000’s) | | $ | 62,176 | | | $ | 51,221 | | | $ | 27,460 | | | $ | 5,883 | | | $ | 15,083 | |
| Ratios to average net assets | | | | | | | | | | | | | | | | | | | | |
| Expenses, before waiver and reimbursement | | | 2.18 | % | | | 2.32 | % | | | 2.90 | % | | | 2.49 | % | | | 3.27 | % (E) |
| Expenses, net waiver and reimbursement | | | 1.97 | % | | | 1.97 | % | | | 1.97 | % | | | 1.97 | % | | | 1.99 | % (E) |
| Net investment loss | | | (1.61 | )% | | | (0.06 | )% | | | (0.17 | )% | | | (1.33 | )% | | | (1.74 | )% (E) |
| Portfolio turnover rate | | | 0 | % | | | 0 | % | | | 0 | % | | | 0 | % | | | 0 | % (D) |
| | | | | | | | | | | | | | | | | | | | | |
| | | | | | | | | | | | | | | | | | | | | |
| | | Class A | |
| | | For the | | | For the | | | For the | | | For the | | | For the | |
| | | Year Ended | | | Year Ended | | | Year Ended | | | Year Ended | | | Period Ended | |
| | | December 31, | | | December 31, | | | December 31, | | | December 31, | | | December 31, | |
| | | 2020 | | | 2019 | | | 2018 | | | 2018 | | | 2016 (A) | |
| | | | | | | | | | | | | | | | | | | | | |
| Net asset value, beginning of year/period | | $ | 23.52 | | | $ | 22.96 | | | $ | 25.16 | | | $ | 24.30 | | | $ | 25.00 | |
| INCOME (LOSS) FROM INVESTMENT OPERATIONS: | | | | | | | | | | | | | | | | | | | | |
| Net investment (loss) (B) | | | (0.36 | ) | | | (0.10 | ) | | | (0.11 | ) | | | (0.21 | ) | | | (0.13 | ) |
| Net realized and unrealized gain (loss) on investments | | | 0.45 | | | | 4.30 | | | | (1.87 | ) | | | 1.09 | | | | (0.57 | ) |
| Total from investment operations | | | 0.09 | | | | 4.20 | | | | (1.98 | ) | | | 0.88 | | | | (0.70 | ) |
| LESS DISTRIBUTIONS: | | | | | | | | | | | | | | | | | | | | |
| From net investment income | | | — | | | | (0.66 | ) | | | — | | | | — | | | | — | |
| From net realized gains on investments | | | — | | | | (2.94 | ) | | | (0.22 | ) | | | (0.02 | ) | | | — | |
| From Return of capital | | | — | | | | (0.04 | ) | | | — | | | | — | | | | — | |
| Total distributions | | | — | | | | (3.64 | ) | | | (0.22 | ) | | | (0.02 | ) | | | — | |
| Net asset value, end of year/period | | $ | 23.61 | | | $ | 23.52 | | | $ | 22.96 | | | $ | 25.16 | | | $ | 24.30 | |
| Total return (C) | | | 0.38 | % | | | 18.01 | % | | | (7.87 | )% (F) | | | 3.57 | % | | | (2.80 | )% (D) |
| RATIOS/SUPPLEMENTAL DATA: | | | | | | | | | | | | | | | | | | | | |
| Net assets, end of year/period (in 000’s) | | $ | 776 | | | $ | 5,425 | | | $ | 2,169 | | | $ | 130 | | | $ | 1 | |
| Ratios to average net assets | | | | | | | | | | | | | | | | | | | | |
| Expenses, before waiver and reimbursement | | | 2.47 | % | | | 2.60 | % | | | 3.14 | % | | | 2.90 | % | | | 3.52 | % (E) |
| Expenses, net waiver and reimbursement | | | 2.22 | % | | | 2.22 | % | | | 2.22 | % | | | 2.22 | % | | | 2.24 | % (E) |
| Net investment (loss) | | | (1.43 | )% | | | (0.39 | )% | | | (0.45 | )% | | | (0.88 | )% | | | (2.09 | )% (E) |
| Portfolio turnover rate | | | 0 | % | | | 0 | % | | | 0 | % | | | 0 | % | | | 0 | % (D) |
| | | | | | | | | | | | | | | | | | | | | |
| (A) | The Rational/ReSolve Adaptive Asset Allocation Fund Institutional Class and Class A shares commenced operations on September 30, 2016. |
| (B) | Per share amounts calculated using average shares method, which more appropriately presents the per share data for the year/period. |
| (C) | Total return in the above table represents the rate that the investor would have earned or lost on an investment in the Fund assuming reinvestment of dividends and does not reflect the impact of sales charges. Had the Advisor not waived its fees and reimbursed expenses, total return would have been lower. |
| (F) | Includes adjustments in accordance with accounting principles generally accepted in the United States and, consequently, the net asset value for financial reporting purposes and the returns based upon those net asset values may differ from the net asset values and returns for shareholder transactions. |
See accompanying notes to consolidated financial statements.
| RATIONAL FUNDS |
| Rational/ReSolve Adaptive Asset Allocation Fund (Continued) |
| Financial Highlights (Consolidated) |
For a Share Outstanding Throughout Each Year/Period
| | | Class C | |
| | | For the | | | For the | | | For the | | | For the | | | For the | |
| | | Year Ended | | | Year Ended | | | Year Ended | | | Year Ended | | | Period Ended | |
| | | December 31, | | | December 31, | | | December 31, | | | December 31, | | | December 31, | |
| | | 2020 | | | 2019 | | | 2018 | | | 2018 | | | 2016 (A) | |
| | | | | | | | | | | | | | | | | | | | | |
| Net asset value, beginning of year/period | | $ | 23.11 | | | $ | 22.61 | | | $ | 24.96 | | | $ | 24.29 | | | $ | 25.00 | |
| INCOME (LOSS) FROM INVESTMENT OPERATIONS: | | | | | | | | | | | | | | | | | | | | |
| Net investment (loss) (B) | | | (0.57 | ) | | | (0.26 | ) | | | (0.31 | ) | | | (0.54 | ) | | | (0.17 | ) |
| Net realized and unrealized gain (loss) on investments | | | 0.49 | | | | 4.20 | | | | (1.82 | ) | | | 1.23 | | | | (0.54 | ) |
| Total from investment operations | | | (0.08 | ) | | | 3.94 | | | | (2.13 | ) | | | 0.69 | | | | (0.71 | ) |
| LESS DISTRIBUTIONS: | | | | | | | | | | | | | | | | | | | | |
| From net investment income | | | — | | | | (0.46 | ) | | | — | | | | — | | | | — | |
| From net realized gains on investments | | | — | | | | (2.94 | ) | | | (0.22 | ) | | | (0.02 | ) | | | — | |
| From Return of capital | | | — | | | | (0.04 | ) | | | — | | | | — | | | | — | |
| Total distributions | | | — | | | | (3.44 | ) | | | (0.22 | ) | | | (0.02 | ) | | | — | |
| Net asset value, end of year/period | | $ | 23.03 | | | $ | 23.11 | | | $ | 22.61 | | | $ | 24.96 | | | $ | 24.29 | |
| Total return (C) | | | (0.35 | )% | | | 17.15 | % | | | (8.53 | )% | | | 2.83 | % | | | (2.84 | )% (D) |
| RATIOS/SUPPLEMENTAL DATA: | | | | | | | | | | | | | | | | | | | | |
| Net assets, end of year/period (in 000’s) | | $ | 250 | | | $ | 438 | | | $ | 322 | | | $ | 371 | | | $ | 21 | |
| Ratios to average net assets | | | | | | | | | | | | | | | | | | | | |
| Expenses, before waiver and reimbursement | | | 3.35 | % | | | 3.37 | % | | | 4.65 | % | | | 3.60 | % | | | 4.27 | % (E) |
| Expenses, net waiver and reimbursement | | | 2.97 | % | | | 2.97 | % | | | 2.97 | % | | | 2.97 | % | | | 2.99 | % (E) |
| Net investment (loss) | | | (2.51 | )% | | | (1.04 | )% | | | (1.24 | )% | | | (2.26 | )% | | | (2.69 | )% (E) |
| Portfolio turnover rate | | | 0 | % | | | 0 | % | | | 0 | % | | | 0 | % | | | 0 | % (D) |
| | | | | | | | | | | | | | | | | | | | | |
| (A) | The Rational/ReSolve Adaptive Asset Allocation Fund Class C shares commenced operations on September 30, 2016. |
| (B) | Per share amounts calculated using average shares method, which more appropriately presents the per share data for the year/period. |
| (C) | Total return in the above table represents the rate that the investor would have earned or lost on an investment in the Fund assuming reinvestment of dividends and does not reflect the impact of sales charges. Had the Advisor not waived its fees and reimbursed expenses, total return would have been lower. |
See accompanying notes to consolidated financial statements.
| RATIONAL FUNDS |
| Rational/Pier 88 Convertible Securities Fund |
| Financial Highlights |
For a Share Outstanding Throughout Each Year/Period
| | | Institutional | | | Class A | | | Class C | |
| | | For the | | | For the | | | For the | | | For the | | | For the | | | For the | |
| | | Year Ended | | | Period Ended | | | Year Ended | | | Period Ended | | | Year Ended | | | Period Ended | |
| | | December 31, | | | December 31, | | | December 31, | | | December 31, | | | December 31, | | | December 31, | |
| | | 2020 | | | 2019 (A) | | | 2020 | | | 2019 (A) | | | 2020 | | | 2019 (A) | |
| | | | | | | | | | | | | | | | | | | | | | | | | |
| Net asset value, beginning of year/period | | $ | 10.17 | | | $ | 10.00 | | | $ | 10.17 | | | $ | 10.00 | | | $ | 10.17 | | | $ | 10.00 | |
| INCOME (LOSS) FROM INVESTMENT OPERATIONS: | | | | | | | | | | | | | | | | | | | | | | | | |
| Net investment income (B) | | | 0.17 | | | | 0.03 | | | | 0.39 | | | | 0.02 | | | | 0.32 | | | | 0.02 | |
| Net realized and unrealized gain on investments | | | 1.56 | | | | 0.14 | | | | 1.33 | | | | 0.15 | | | | 1.34 | | | | 0.15 | |
| Total from investment operations | | | 1.73 | | | | 0.17 | | | | 1.72 | | | | 0.17 | | | | 1.66 | | | | 0.17 | |
| LESS DISTRIBUTIONS: | | | | | | | | | | | | | | | | | | | | | | | | |
| From net investment income | | | (0.20 | ) | | | — | | | | (0.19 | ) | | | — | | | | (0.16 | ) | | | — | |
| From net realized gains on investments | | | (0.01 | ) | | | — | | | | (0.01 | ) | | | — | | | | (0.01 | ) | | | — | |
| Total distributions | | | (0.21 | ) | | | — | | | | (0.20 | ) | | | — | | | | (0.17 | ) | | | — | |
| Net asset value, end of year/period | | $ | 11.69 | | | $ | 10.17 | | | $ | 11.69 | | | $ | 10.17 | | | $ | 11.66 | | | $ | 10.17 | |
| Total return (C) | | | 17.08 | % | | | 1.70 | % (D) | | | 16.97 | % | | | 1.70 | % (D) | | | 16.33 | % | | | 1.70 | % (D) |
| RATIOS/SUPPLEMENTAL DATA: | | | | | | | | | | | | | | | | | | | | | | | | |
| Net assets, end of year/period (in 000’s) | | $ | 73,946 | | | $ | 5,707 | | | $ | 337 | | | $ | 0 | (F) | | $ | 55 | (F) | | $ | 0 | (F) |
| Ratios to average net assets | | | | | | | | | | | | | | | | | | | | | | | | |
| Expenses, before waiver and reimbursement | | | 1.25 | % | | | 7.22 | % (E) | | | 1.40 | % | | | 7.47 | % (E) | | | 2.13 | % | | | 8.22 | % (E) |
| Expenses, net waiver and reimbursement | | | 0.99 | % | | | 0.99 | % (E) | | | 1.24 | % | | | 1.24 | % (E) | | | 1.99 | % | | | 1.99 | % (E) |
| Net investment income | | | 1.62 | % | | | 4.22 | % (E) | | | 3.50 | % | | | 3.17 | % (E) | | | 2.87 | % | | | 3.17 | % (E) |
| Portfolio turnover rate | | | 140 | % | | | 5 | % (D) | | | 140 | % | | | 5 | % (D) | | | 140 | % | | | 5 | % (D) |
| | | | | | | | | | | | | | | | | | | | | | | | | |
| (A) | The Rational/Pier 88 Convertible Securities Fund Institutional Class, Class A and Class C Shares commenced operations December 6, 2019. |
| (B) | Per share amounts calculated using average shares method, which more appropriately presents the per share data for the period. |
| (C) | Total return in the above table represents the rate that the investor would have earned or lost on an investment in the Fund assuming reinvestment of dividends and does not reflect the impact of sales charges. |
| (F) | Amount is less than $1000. |
See accompanying notes to financial statements.
| RATIONAL FUNDS |
| Rational Special Situations Income Fund |
| Financial Highlights |
For a Share Outstanding Throughout Each Year/Period
| | | Institutional | | | Class A | | | Class C | |
| | | For the | | | For the | | | For the | | | For the | | | For the | | | For the | |
| | | Year Ended | | | Period Ended | | | Year Ended | | | Period Ended | | | Year Ended | | | Period Ended | |
| | | December 31, | | | December 31, | | | December 31, | | | December 31, | | | December 31, | | | December 31, | |
| | | 2020 | | | 2019 (A) | | | 2020 | | | 2019 (A) | | | 2020 | | | 2019 (A) | |
| | | | | | | | | | | | | | | | | | | | | | | | | |
| Net asset value, beginning of year/period | | $ | 20.10 | | | $ | 20.00 | | | $ | 20.08 | | | $ | 20.00 | | | $ | 20.06 | | | $ | 20.00 | |
| INCOME FROM INVESTMENT OPERATIONS: | | | | | | | | | | | | | | | | | | | | | | | | |
| Net investment income (B) | | | 0.43 | | | | 0.32 | | | | 0.37 | | | | 0.30 | | | | 0.21 | | | | 0.23 | |
| Net realized and unrealized gain on investments | | | 0.11 | | | | 0.06 | | | | 0.13 | | | | 0.05 | | | | 0.14 | | | | 0.05 | |
| Total from investment operations | | | 0.54 | | | | 0.38 | | | | 0.50 | | | | 0.35 | | | | 0.35 | | | | 0.28 | |
| LESS DISTRIBUTIONS: | | | | | | | | | | | | | | | | | | | | | | | | |
| From net investment income | | | (0.93 | ) | | | (0.25 | ) | | | (0.89 | ) | | | (0.24 | ) | | | (0.76 | ) | | | (0.19 | ) |
| From net realized gains on investments | | | — | | | | (0.03 | ) | | | — | | | | (0.03 | ) | | | — | | | | (0.03 | ) |
| From Return of capital | | | (0.05 | ) | | | — | | | | (0.05 | ) | | | — | | | | (0.05 | ) | | | — | |
| Total distributions | | | (0.98 | ) | | | (0.28 | ) | | | (0.94 | ) | | | (0.27 | ) | | | (0.81 | ) | | | (0.22 | ) |
| Net asset value, end of year/period | | $ | 19.66 | | | $ | 20.10 | | | $ | 19.64 | | | $ | 20.08 | | | $ | 19.60 | | | $ | 20.06 | |
| Total return (C) | | | 2.83 | % | | | 1.91 | % (D) | | | 2.60 | % | | | 1.74 | % (D) | | | 1.82 | % | | | 1.43 | % (D) |
| RATIOS/SUPPLEMENTAL DATA: | | | | | | | | | | | | | | | | | | | | | | | | |
| Net assets, end of year/period (in 000’s) | | $ | 352,892 | | | $ | 76,833 | | | $ | 37,224 | | | $ | 5,449 | | | $ | 14,123 | | | $ | 1,289 | |
| Ratios to average net assets | | | | | | | | | | | | | | | | | | | | | | | | |
| Expenses, before waiver and reimbursement | | | 1.80 | % | | | 2.06 | % (E) | | | 2.10 | % | | | 2.21 | % (E) | | | 2.77 | % | | | 2.97 | % (E) |
| Expenses, net waiver and reimbursement | | | 1.75 | % | | | 1.75 | % (E) | | | 2.00 | % | | | 2.00 | % (E) | | | 2.75 | % | | | 2.75 | % (E) |
| Net investment income | | | 2.17 | % | | | 3.48 | % (E) | | | 1.88 | % | | | 3.22 | % (E) | | | 1.05 | % | | | 2.47 | % (E) |
| Portfolio turnover rate | | | 4 | % | | | 14 | % (D) | | | 4 | % | | | 14 | % (D) | | | 4 | % | | | 14 | % (D) |
| | | | | | | | | | | | | | | | | | | | | | | | | |
| (A) | The Rational Special Situtations Income Fund Institutional Class, Class A and Class C Shares commenced operations July 17, 2019. |
| (B) | Per share amounts calculated using average shares method, which more appropriately presents the per share data for the period. |
| (C) | Total return in the above table represents the rate that the investor would have earned or lost on an investment in the Fund assuming reinvestment of dividends and does not reflect the impact of sales charges. |
See accompanying notes to financial statements.
RATIONAL FUNDS
CONSOLIDATED NOTES TO FINANCIAL STATEMENTS
| December 31, 2020 | ANNUAL REPORT |
| (1) | ORGANIZATION AND SIGNIFICANT ACCOUNTING POLICIES |
The Mutual Fund and Variable Insurance Trust (the “Trust”) was organized as a Delaware statutory trust on June 23, 2006. The Trust is registered under the Investment Company Act of 1940, as amended (the “1940 Act”), as an open-end management investment company. As of December 31, 2020, the Trust operated 9 separate series, or mutual funds, each with its own investment objective and strategy. This report contains financial statements and financial highlights of the funds listed below (individually referred to as a “Fund”, or collectively as the “Funds”):
| Fund | Sub-Advisor | Primary Objective |
| Rational Equity Armor Fund | Equity Armor Investments, LLC | Total return on investment, with dividend income |
| (“Equity Armor”) | | an important component of that return. |
| (Formerly, Rational Dividend Capture Fund) | | | |
| Rational Tactical Return Fund | Warrington Asset Management, LLC | Total return consisting of long-term | |
| (“Tactical Return”) | | capital appreciation and income. |
| Rational Dynamic Brands Fund | Accuvest Global Advisors, Inc. | Long-term capital appreciation. | |
| (“Dynamic Brands”) | | | |
| Rational Strategic Allocation Fund | | Current income and moderate appreciation | |
| (“Strategic Allocation”) | | of capital. |
| Rational/ReSolve Adaptive Asset Allocation Fund | ReSolve Asset Management, Inc. | Long-term capital appreciation. | |
| (“ReSolve Adaptive”) | | | |
| Rational/Pier 88 Convertible Securities Fund | Pier 88 Investment Partners, LLC | Total return consisting of capital appreciation | |
| (“Pier 88”) | | and income. |
| Rational Special Situations Income Fund | ESM Management, LLC | Total return consisting of capital appreciation | |
| (“Special Situations”) | | and income. |
The Funds are classified as diversified funds under the 1940 Act, except ReSolve Adaptive, Special Situations and Pier 88, which are classified as non-diversified funds.
Currently, all Funds offer Class A, Class C and Institutional shares. Each class of shares for each Fund has identical rights and privileges except with respect to distribution (12b-1) and service fees, if any, voting rights on matters affecting a single class of shares, exchange privileges of each class of shares and sales charges. The price at which the Funds will offer or redeem shares is the net asset value (“NAV”) per share next determined after the order is considered received, subject to any applicable front end or contingent deferred sales charges. Class A shares have a maximum sales charge on purchases of 5.75% for ReSolve Adaptive and 4.75% for all other Funds as a percentage of the original purchase price. Class C shares have a contingent deferred sales charge of 1.00% on shares sold within one year of purchase. Each Fund’s prospectus provides a description of each Fund’s investment objectives, policies and strategies along with information on the classes of shares currently being offered.
| (2) | SIGNIFICANT ACCOUNTING POLICIES |
The following is a summary of significant accounting policies consistently followed by the Funds and are in accordance with accounting principles generally accepted in the United States of America (“GAAP”). Each Fund is an investment company and accordingly follows the investment company accounting and reporting guidance of the Financial Accounting Standards Board (FASB) Accounting Standard Codification Topic 946 Financial Services – Investment Companies.
The preparation of financial statements in conformity with GAAP requires management to make estimates and assumptions that affect the amounts of assets, liabilities, and disclosure of contingent assets and liabilities at the date of the financial statements and the reported amounts of income and expenses for the period. Actual results could differ from those estimates.
In computing the NAV of the Funds, fair value is based on market valuations with respect to portfolio securities for which market quotations are readily available. Pursuant to Trustee-approved policies, the Trust relies on certain security pricing services to provide the current market value of securities. Those security pricing services value equity securities (including foreign equity securities, exchange-traded funds and closed-end funds) traded on a securities exchange at the last reported sales price on the principal exchange. Equity securities quoted by NASDAQ are valued at the NASDAQ official closing price. If there is no reported sale on the principal exchange, and in the case of over-the counter securities, equity securities are
RATIONAL FUNDS
CONSOLIDATED NOTES TO FINANCIAL STATEMENTS (Continued)
| December 31, 2020 | ANNUAL REPORT |
valued at a bid price estimated by the security pricing service. Debt securities (other than short-term obligations) are valued each day by an independent pricing service approved by the Board of Trustees (the “Board”) using methods which include current market quotations from a major market maker in the securities and based on methods which include the consideration of yields or prices of securities of comparable quality, coupon, maturity and type. Option contracts are generally valued at the close. If the close price is outside the bid and the ask price; the quote closest to the close is used. When there is no trading volume the mean of the bid and ask is used. Foreign securities quoted in foreign currencies are translated into U.S. dollars at the foreign exchange rate in effect as of the close of the NYSE. Investments in open-end investment companies (except for exchange-traded funds) are valued at their respective net asset value as reported by such companies. Futures, which are traded on an exchange, are valued at the settlement price determined by the exchange. Short-term debt obligations having 60 days or less remaining until maturity, at time of purchase, may be valued at amortized cost.
Securities for which market quotations are not readily available are valued at fair value under Trust procedures approved by the Board. In these cases, a Pricing Committee, established and appointed by the Board, determines in good faith, subject to Trust procedures, the fair value of portfolio securities held by a Fund (“good faith fair valuation”). When a good faith fair valuation of a security is required, consideration is generally given to a number of factors including, but not limited to the following: dealer quotes, published analyses by dealers or analysts regarding the security, transactions which provide implicit valuation of the security (such as a merger or tender offer transaction), the value of other securities or contracts which derive their value from the security at issue, and the implications of any other circumstances which have caused trading in the security to halt. With respect to certain categories of securities, the procedures utilized by the Pricing Committee detail specific valuation methodologies to be applied in lieu of considering the aforementioned list of factors.
Fair valuation procedures are also used when a significant event affecting the value of a portfolio security is determined to have occurred between the time when the price of the portfolio security is determined and the close of trading on the NYSE, which is when each Fund’s NAV is computed. An event is considered significant if there is both an affirmative expectation that the security’s value will change in response to the event and a reasonable basis for quantifying the resulting change in value. Significant events include significant securities’ market movements occurring between the time the price of the portfolio security is determined and the close of trading on the NYSE. For securities normally priced at their last sale price in a foreign market, such events can occur between the close of trading in the foreign market and the close of trading on the NYSE.
In some cases, events affecting the issuer of a portfolio security may be considered significant events. Examples of potentially significant events include announcements concerning earnings, acquisitions, new products, management changes, litigation developments, a strike or natural disaster affecting the company’s operations or regulatory changes or market developments affecting the issuer’s industry occurring between the time when the price of the portfolio security is determined and the close of trading on the NYSE. For securities of foreign issuers, such events could also include political or other developments affecting the economy or markets in which the issuer conducts its operations or its securities are traded.
There can be no assurance that a Fund could purchase or sell a portfolio security at the price used to calculate the Fund’s NAV. In the case of good faith fair valued portfolio securities, lack of information and uncertainty as to the significance of information may lead to a conclusion that a prior valuation is the best indication of a portfolio security’s present value. Good faith fair valuations generally remain unchanged until new information becomes available. Consequently, changes in good faith fair valuation of portfolio securities may be less frequent and of greater magnitude than changes in the price of portfolio securities valued at their last sale price, by an independent pricing service, or based on market quotations.
Valuation of Fund of Funds – The Funds may invest in portfolios of open-end or closed-end investment companies (the “Underlying Funds”). The Underlying Funds value securities in their portfolios for which market quotations are readily available at their market values (generally the last reported sale price) and all other securities and assets at their fair value based upon the methods established by the board of directors of the Underlying Funds.
RATIONAL FUNDS
CONSOLIDATED NOTES TO FINANCIAL STATEMENTS (Continued)
| December 31, 2020 | ANNUAL REPORT |
Open-end investment companies are valued at their respective net asset values as reported by such investment companies. The shares of many closed-end investment companies, after their initial public offering, frequently trade at a price per share, which is different than the net asset value per share. The difference represents a market premium or market discount of such shares. There can be no assurances that the market discount or market premium on shares of any closed-end investment company purchased by the Funds will not change.
The Trust calculates the NAV for each of the Funds by valuing securities held based on fair value. Fair value is defined as the price that would be received to sell an asset or paid to transfer a liability in an orderly transaction between market participants at the measurement date. The valuation techniques described below maximize the use of observable inputs and minimize the use of unobservable inputs in determining fair value. The inputs used for valuing the Funds’ investments are summarized in the three broad levels listed below:
| ● | Level 1 - unadjusted quoted prices in active markets for identical investments and/or registered investment companies where the value per share is determined and published and is the basis for current transactions for identical assets or liabilities at the valuation date. |
| ● | Level 2 - other significant observable inputs (including quoted prices for similar securities, interest rates, prepayment speeds, credit risk, etc.). |
| ● | Level 3 - significant unobservable inputs (including the Funds’ own assumptions in determining the fair value of investments). |
Changes in valuation techniques may result in transfers in or out of an assigned level within the disclosure hierarchy. The inputs or methodology used for valuing investments is not necessarily an indication of the risk associated with investing in those investments.
The inputs or methodology used for valuing securities are not necessarily an indication of the risk associated with investing in those securities. The following tables summarize the inputs used as of December 31, 2020, for each Fund’s assets and liabilities measured at fair value:
| Equity Armor | | | | | | | | | | | | |
| | | | | | | | | | | | | |
| Assets* | | Level 1 | | | Level 2 | | | Level 3 | | | Total | |
| Common Stocks | | $ | 50,256,734 | | | $ | — | | | $ | — | | | $ | 50,256,734 | |
| Exchange Traded Fund | | | 520,785 | | | | — | | | | — | | | | 520,785 | |
| Reits | | | 1,453,110 | | | | — | | | | — | | | | 1,453,110 | |
| Short-Term Investments | | | 5,101,719 | | | | — | | | | — | | | | 5,101,719 | |
| Derivatives | | | | | | | | | | | | | | | | |
| Future Contracts | | $ | 86,717 | | | $ | — | | | $ | — | | | $ | 86,717 | |
| Total Assets | | $ | 57,419,065 | | | $ | — | | | $ | — | | | $ | 57,419,065 | |
| Liabilities* | | | | | | | | | | | | | | | | |
| Derivatives | | | | | | | | | | | | | | | | |
| Future Contracts | | $ | 146,779 | | | $ | — | | | $ | — | | | $ | 146,779 | |
| Total Liabilities | | $ | 146,779 | | | $ | — | | | $ | — | | | $ | 146,779 | |
RATIONAL FUNDS
CONSOLIDATED NOTES TO FINANCIAL STATEMENTS (Continued)
| December 31, 2020 | ANNUAL REPORT |
| Tactical Return | | | | | | | | | | | | |
| | | | | | | | | | | | | |
| Assets* | | Level 1 | | | Level 2 | | | Level 3 | | | Total | |
| Short-Term Investments | | $ | 73,899,661 | | | $ | — | | | $ | — | | | $ | 73,899,661 | |
| Liabilities* | | | | | | | | | | | | | | | | |
| Derivatives | | | | | | | | | | | | | | | | |
| Written Options | | $ | 95,025 | | | $ | — | | | $ | — | | | $ | 95,025 | |
| | | | | | | | | | | | | | | | | |
| Dynamic Brands | | | | | | | | | | | | | | | | |
| | | | | | | | | | | | | | | | | |
| Assets* | | | Level 1 | | | | Level 2 | | | | Level 3 | | | | Total | |
| Common Stocks | | $ | 69,499,457 | | | $ | — | | | $ | — | | | $ | 69,499,457 | |
| Short-Term Investments | | | 5,652,450 | | | | — | | | | — | | | | 5,652,450 | |
| Total Assets | | $ | 75,151,907 | | | $ | — | | | $ | — | | | $ | 75,151,907 | |
| | | | | | | | | | | | | | | | | |
| Strategic Allocation | | | | | | | | | | | | | | | | |
| | | | | | | | | | | | | | | | | |
| Assets* | | | Level 1 | | | | Level 2 | | | | Level 3 | | | | Total | |
| Mutual Funds | | $ | 6,752,008 | | | $ | — | | | $ | — | | | $ | 6,752,008 | |
| Short-Term Investments | | | 314,073 | | | | — | | | | — | | | | 314,073 | |
| Derivatives | | | | | | | | | | | | | | | | |
| Futures Contract | | $ | 184,380 | | | $ | — | | | $ | — | | | $ | 184,380 | |
| Total Assets | | $ | 7,250,461 | | | $ | — | | | $ | — | | | $ | 7,250,461 | |
ReSolve Adaptive
| Assets* | | Level 1 | | | Level 2 | | | Level 3 | | | Total | |
| Short-Term Investments | | $ | 56,661,833 | | | $ | — | | | $ | — | | | $ | 56,661,833 | |
| Derivatives | | | | | | | | | | | | | | | | |
| Futures Contracts | | $ | 2,513,263 | | | $ | — | | | $ | — | | | $ | 2,513,263 | |
| Total Assets | | $ | 59,175,096 | | | $ | — | | | $ | — | | | $ | 59,175,096 | |
| Liabilities* | | | | | | | | | | | | | | | | |
| Derivatives | | | | | | | | | | | | | | | | |
| Futures Contracts | | $ | 109,575 | | | $ | — | | | $ | — | | | $ | 109,575 | |
| Total Liabilities | | $ | 109,575 | | | $ | — | | | $ | — | | | $ | 109,575 | |
Pier 88
| Assets* | | Level 1 | | | Level 2 | | | Level 3 | | | Total | |
| Common Stock | | $ | 1,033,829 | | | $ | — | | | $ | — | | | $ | 1,033,829 | |
| Convertible Bonds | | | — | | | | 43,806,121 | | | | — | | | | 43,806,121 | |
| Preferred Stocks | | | 26,734,128 | | | | — | | | | — | | | | 26,734,128 | |
| Short-Term Investments | | | 2,033,670 | | | | — | | | | — | | | | 2,033,670 | |
| Total Assets | | $ | 29,801,627 | | | $ | 43,806,121 | | | $ | — | | | $ | 73,607,748 | |
RATIONAL FUNDS
CONSOLIDATED NOTES TO FINANCIAL STATEMENTS (Continued)
| December 31, 2020 | ANNUAL REPORT |
| Special Situations | | | | | | | | | | | | |
| | | | | | | | | | | | | |
| Assets* | | Level 1 | | | Level 2 | | | Level 3 | | | Total | |
| Asset Backed Securities | | $ | — | | | $ | 363,973,739 | | | $ | — | | | $ | 363,973,739 | |
| Collateralized Mortgage Obligations | | | — | | | | 2,813,509 | | | | — | | | | 2,813,509 | |
| Corporate Bonds | | | | | | | 12,549,351 | | | | — | | | | 12,549,351 | |
| Short-Term Investments | | | 25,894,565 | | | | — | | | | — | | | | 25,894,565 | |
| Total Assets | | $ | 25,894,565 | | | $ | 379,336,599 | | | $ | — | | | $ | 405,231,164 | |
| * | Refer to the Portfolios of Investments for industry classifications. |
There were no level 3 securities held during the period for any Fund.
Consolidation of Subsidiaries – The consolidated financial statements of the ReSolve Adaptive include the accounts of RDMF Fund Ltd. (“RDMF” or “CFC”), a wholly-owned and controlled foreign subsidiary. All inter-company accounts and transactions have been eliminated in consolidation.
Each Fund may invest up to 25% of its total assets in a controlled foreign corporation, which acts as an investment vehicle in order to affect certain investments consistent with ReSolve Adaptive’s respective investment objectives and policies.
| | Inception Date of | CFC Net Assets as of | % of Net Assets as of |
| | CFC | December 31, 2020 | December 31, 2020 |
| RDMF Fund, Ltd. | 8/5/2016 | $ 8,311,086 | 13.1% |
For tax purposes, this is an exempted Cayman investment company. The CFC has received an undertaking from the Government of the Cayman Islands exempting it from all local income, profits and capital gains taxes. No such taxes are levied in the Cayman Islands at the present time. For U.S. income tax purposes, a CFC is a Controlled Foreign Corporation which generates and is allocated no income which is considered effectively connected with U.S. trade or business and as such is not subject to U.S. income tax. However, as a wholly -owned Controlled Foreign Corporation, RDMF’s net income and capital gain, to the extent of its earnings and profits, will be included each year in the ReSolve Adaptive’s investment company taxable income.
| B. | Foreign Currency Translation |
The accounting records of the Funds are maintained in U.S. dollars. Foreign currency amounts are translated into U.S. dollars at the current rate of exchange each business day to determine the value of investments, and other assets and liabilities. Purchases and sales of foreign securities, and income and expenses, are translated at the prevailing rate of exchange on the respective date of these transactions. The Funds do not isolate that portion of the results of operations resulting from changes in foreign exchange rates on investments from fluctuation arising from changes in market prices of securities held. These fluctuations are included with the net realized and unrealized gain or loss from investments and foreign currency transactions.
Reported net realized foreign exchange gains or losses arise from sales of portfolio securities; sales and maturities of short term securities; sales of foreign currencies; currency gains or losses realized between the trade and settlement dates on securities transactions; and the difference between the amounts of dividends, interest, and foreign withholding taxes recorded on the Funds’ books and the U.S. dollar equivalent of the amounts actually received or paid. Net unrealized foreign exchange gains and losses arise from changes in the values of assets and liabilities, including investments in securities at fiscal period-end, resulting from changes in the exchange rate.
RATIONAL FUNDS
CONSOLIDATED NOTES TO FINANCIAL STATEMENTS (Continued)
| December 31, 2020 | ANNUAL REPORT |
Certain of the Funds may be subject to equity price risk, commodity risk, interest rate risk and foreign currency exchange risk in the normal course of pursuing their investment objectives. Certain of the Funds may invest in various financial instruments including positions in foreign currency contracts, written and purchased option contracts and futures contracts to gain exposure to or hedge against changes in the value of equities or foreign currencies. The following is a description of the derivative instruments utilized by the Funds, including the primary underlying risk exposure related to each instrument type.
Futures Contracts – Certain of the Funds may purchase and sell futures contracts. A Fund may use futures contracts to gain exposure to, or hedge against changes in the value of underlying reference assets, such as equities, interest rates, commodities prices or foreign currencies. Upon entering into a contract, the Fund deposits and maintains as collateral such initial margin as required by the exchange on which the transaction is affected. Pursuant to the contract, the Fund agrees to receive from or pay to the broker an amount of cash equal to the daily fluctuation in value of the contract. Such receipts or payments are known as “variation margin” and are recorded by the Fund as unrealized gains and losses. When the contract is closed, the Fund records a realized gain or loss equal to the difference between the value of the contract at the time it was opened and the value at the time it was closed. As collateral for futures contracts, the Fund is required under the 1940 Act to maintain assets consisting of cash, cash equivalents or liquid securities. This collateral is required to be adjusted daily to reflect the market value of the purchase obligation for long futures contracts or the market value of the instrument underlying the contract, but not less than the market price at which the futures contract was established, for short futures contracts.
Options Contracts – Certain Funds may purchase put and call options and write put and call options. The premium paid for a purchased put or call option plus any transaction costs will reduce the benefit, if any, realized by a Fund upon exercise of the option, and, unless the price of the underlying security rises or declines sufficiently, the option may expire worthless to the Funds. In addition, in the event that the price of the security in connection with which an option was purchased moves in a direction favorable to the Funds, the benefits realized by the Funds as a result of such favorable movement will be reduced by the amount of the premium paid for the option and related transaction costs.
When a Fund writes an option, an amount equal to the premium received by the Fund is recorded as a liability and is subsequently adjusted to the current fair value of the option written. Premiums received from writing options that expire unexercised are treated by the Funds on the expiration date as realized gains from investments. The difference between the premium and the amount paid on effecting a closing purchase transaction, including brokerage commissions, is also treated as a realized gain, or, if the premium is less than the amount paid for the closing purchase transaction, as a realized loss. If a call option is exercised, the premium is added to the proceeds from the sale of the underlying security or currency in determining whether the Funds have realized gains or losses. If a put option is exercised, the premium reduces the cost basis of the securities purchased by the Funds.
Written and purchased options are non-income producing securities. With options, there is minimal counterparty risk to the Funds since these options are exchange traded and the exchange’s clearinghouse acts as counterparty to all exchange traded options and guarantees against a possible default. Initial margin deposits required upon entering into options contracts are satisfied by the deposits of cash as collateral for the account of the broker (the Fund’s agent in acquiring the options).
Convertible Securities – Pier 88 invests in convertible securities, which include fixed income securities that may be exchanged or converted into a predetermined number of shares of the issuer’s underlying common stock at the option of the holder during a specified period. Convertible securities may take the form of convertible preferred stock, convertible bonds or debentures, units consisting of “usable” bonds and warrants or a combination of the features of several of these securities. The investment characteristics of each convertible security vary widely, which allows convertible securities to be employed for a variety of investment strategies. The Fund will exchange or convert the convertible securities held in its portfolio into shares of the underlying common stock when, in the Advisor’s or Sub-Advisor’s opinion, the investment characteristics of the underlying common shares will assist the Fund in achieving its investment objective. Otherwise the Fund may hold or trade convertible securities.
RATIONAL FUNDS
CONSOLIDATED NOTES TO FINANCIAL STATEMENTS (Continued)
| December 31, 2020 | ANNUAL REPORT |
The derivatives are not accounted for as hedging instruments under GAAP. The effect of derivative instruments on the Statements of Assets and Liabilities and Consolidated Statements of Assets and Liabilities at December 31, 2020, were as follows:
| | | | | | | | Location of derivatives on Statements of | | Fair value of asset/liability | |
| Fund | | Derivative | | | Risk Type | | Assets and Liabilities | | derivatives | |
| Equity Armor | | | | | | | | | |
| | | Futures | | | Equity | | Futures unrealized appreciation | | $ | 86,717 | |
| | | | | | | | | Futures unrealized depreciation | | | (146,779 | ) |
| | | | | | | | | Totals | | $ | (60,062 | ) |
| Tactical Return | | | | | | | | | |
| | | | Futures | | | Interest Rate | | Options Written | | $ | 95,025 | |
| | | | | | | | | Totals | | $ | 95,025 | |
| Strategic Allocation | | | | | | | | | |
| | | | Futures | | | Equity | | Futures unrealized appreciation | | $ | 184,380 | |
| | | | | | | | | Totals | | $ | 184,380 | |
| ReSolve Adaptive | | | | | | | | | |
| | | | Futures | | | Equity | | Futures unrealized appreciation | | $ | 365,062 | |
| | | | | | | | | Futures unrealized depreciation | | | (21,503 | ) |
| | | | | | | Commodity | | Futures unrealized appreciation | | | 1,647,414 | |
| | | | | | | | | Futures unrealized depreciation | | | (23,014 | ) |
| | | | | | | Currency | | Futures unrealized appreciation | | | 280,276 | |
| | | | | | | | | Futures unrealized depreciation | | | (7,530 | ) |
| | | | | | | Interest | | Futures unrealized appreciation | | | 220,511 | |
| | | | | | | | | Futures unrealized depreciation | | | (57,528 | ) |
| | | | | | | | | Totals | | $ | 2,403,688 | |
RATIONAL FUNDS
CONSOLIDATED NOTES TO FINANCIAL STATEMENTS (Continued)
| December 31, 2020 | ANNUAL REPORT |
The effect of derivative instruments on the Statements of Operations and Consolidated Statements of Operations for the Funds, for the year ended December 31, 2020, were as follows:
| | | | | | | | | Realized and unrealized gain | |
| Fund | | Derivative | | Risk Type | | Location of gain (loss) on derivatives | | (loss) on derivatives | |
| Equity Armor | | | | | | | | | | |
| | | Options Purchased | | Equity | | Net realized loss from options purchased | | $ | (1,389,813 | ) |
| | | Options Written | | Equity | | Net realized gain from options written | | | 77,741 | |
| | | Futures | | Equity | | Net realized loss from futures | | | (182,381 | ) |
| | | | | | | | | $ | (1,494,453 | ) |
| | | | | | | | | | | |
| | | Futures | | Equity | | Net change in unrealized depreciation on futures | | $ | (5,460 | ) |
| Tactical Return | | | | | | | | | | |
| | | | | | | | | | | |
| | | Options Purchased | | Equity | | Net realized loss from options purchased | | $ | (2,390,237 | ) |
| | | Options Written | | Equity | | Net realized gain from options written | | | 10,485,082 | |
| | | | | | | | | $ | 8,094,845 | |
| | | | | | | | | | | |
| | | Options Written | | Equity | | Net change in unrealized gain from options written | | $ | 33,266 | |
| | | | | | | | | | | |
| Strategic Allocation | | | | | | | | | | |
| | | Futures | | Equity | | Net realized loss from futures | | $ | (973,157 | ) |
| | | | | | | | | | | |
| | | Futures | | Equity | | Net change in unrealized appreciation on futures | | | 184,380 | |
| | | | | | | | | $ | (788,777 | ) |
| ReSolve Adaptive | | | | | | | | | | |
| | | Futures | | Equity | | Net realized loss from futures | | $ | (3,483,516 | ) |
| | | | | Commodity | | Net realized loss from futures | | | (913,050 | ) |
| | | | | Currency | | Net realized loss from futures | | | (4,166,775 | ) |
| | | | | Interest | | Net realized gain from futures | | | 5,466,932 | |
| | | | | | | Totals | | $ | (3,096,409 | ) |
| | | | | | | | | | | |
| | | Futures | | Equity | | Net change in unrealized appreciation on futures | | $ | 354,980 | |
| | | | | Commodity | | Net change in unrealized appreciation on futures | | | 1,534,570 | |
| | | | | Currency | | Net change in unrealized appreciation on futures | | | 953,548 | |
| | | | | Interest | | Net change in unrealized appreciation on futures | | | 1,361,668 | |
| | | | | | | Totals | | $ | 4,204,766 | |
| Pier 88 | | | | | | | | | | |
| | | Options Purchased | | Equity | | Net realized gain from options purchased | | $ | 7,270 | |
| | | Options Written | | Equity | | Net realized gain from options written | | | 7,985 | |
| | | | | | | | | $ | 15,255 | |
The value of derivative instruments outstanding as of December 31, 2020 as disclosed in the Portfolios of Investments (Consolidated Portfolios of Investments for ReSolve Adaptive) and the amounts realized and changes in unrealized gains and losses on derivative instruments during the period as disclosed above and within the Statements of Operations (Consolidated Statements of Operations for ReSolve Adaptive) serve as indicators of the volume of derivative activity for the Funds.
RATIONAL FUNDS
CONSOLIDATED NOTES TO FINANCIAL STATEMENTS (Continued)
| December 31, 2020 | ANNUAL REPORT |
Balance Sheet Offsetting Information
The following table provides a summary of offsetting financial assets and liabilities derivatives and the effect of the derivative instruments on the Statements of Assets and Liabilities and Consolidated Statements of Assets and Liabilities as of December 31, 2020:
| | | | | | Gross Amounts | | | Net Amounts | | | | | | | | | | |
| | | Gross Amounts | | | Offset in the | | | Presented in the | | | | | | | | | | |
| | | Recognized in the | | | (Consolidated) | | | (Consolidated) | | | | | | | | | | |
| | | (Consolidated) | | | Statements of | | | Statements of | | | | | | | | | | |
| | | Statements of Assets | | | Assets and | | | Assets and | | | Financial | | | Cash Collateral | | | | |
| | | and Liabilities | | | Liabilities | | | Liabilities | | | Instruments | | | Pledged/Received (1) | | | Net Amount | |
| Equity Armor | | | | | | | | | | | | | | | | | | | | | | | | |
| Description of Asset: | | | | | | | | | | | | | | | | | | | | | | | | |
| Futures Contracts | | $ | 86,717 | | | $ | — | | | $ | 86,717 | | | $ | (86,717 | ) | | $ | — | | | $ | — | |
| Description of Liability: | | | | | | | | | | | | | | | | | | | | | | | | |
| Futures Contracts | | $ | 146,779 | | | $ | — | | | $ | 146,779 | | | $ | 86,717 | | | $ | (60,062 | ) | | $ | — | |
| Strategic Allocation | | | | | | | | | | | | | | | | | | | | | | | | |
| Description of Asset: | | | | | | | | | | | | | | | | | | | | | | | | |
| Futures Contracts | | $ | 184,380 | | | $ | — | | | $ | 184,380 | | | $ | — | | | $ | — | | | $ | 184,380 | |
| ReSolve Adaptive | | | | | | | | | | | | | | | | | | | | | | | | |
| Description of Asset: | | | | | | | | | | | | | | | | | | | | | | | | |
| Futures Contracts | | $ | 2,513,263 | | | $ | — | | | $ | 2,513,263 | | | $ | (109,575 | ) | | $ | — | | | $ | 2,403,688 | |
| Description of Liability: | | | | | | | | | | | | | | | | | | | | | | | | |
| Futures Contracts | | $ | 109,575 | | | $ | — | | | $ | 109,575 | | | $ | (109,575 | ) | | $ | — | | | $ | — | |
| (1) | The amount is limited to the derivative liability balance and accordingly does not include excess collateral pledged. |
| D. | Security Transactions and Related Income |
During the period, investment transactions are accounted for no later than the first calculation of the NAV on the business day following the trade date. For financial reporting purposes, however, security transactions are accounted for on the trade date on the last business day of the reporting period. Discounts and premiums on securities purchased are accreted and amortized over the lives of the respective securities using the effective interest method. For convertible securities, premiums attributable to the conversion feature are not amortized. Securities gains and losses are calculated on the identified cost basis. Interest income and expenses are accrued daily. Dividends, less foreign tax withholding (if any), are recorded on the ex-dividend date. Withholding taxes and capital gains on foreign dividends have been provided for in accordance with the Funds’ understanding of the applicable country’s tax rules and rates.
| E. | Dividends and Distributions to Shareholders |
The amount of dividends from net investment income and net realized gains recorded on the ex-dividend date are determined in accordance with the federal income tax regulations, which may differ from GAAP and are recorded on ex-date. These “book/tax” differences are either considered temporary or permanent in nature. To the extent these differences are permanent in nature (e.g. tax treatment of foreign currency gain/loss, non -deductible stock issuance costs, distributions and income received from pass through investments and net investment loss adjustments), such amounts are reclassified within the capital accounts based on their nature for federal income tax purposes; temporary differences do not require reclassification. Temporary differences are primarily due to market discounts, capital loss carryforwards and losses deferred due to wash sales, straddles and return of capital from investments. Dividends are declared separately for each class. No class has preferential rights; differences in per share dividend rates are generally due to differences in separate class expenses.
RATIONAL FUNDS
CONSOLIDATED NOTES TO FINANCIAL STATEMENTS (Continued)
| December 31, 2020 | ANNUAL REPORT |
| Fund | Income Dividends | Capital Gains |
| Equity Armor | Monthly | Annually |
| Tactical Return | Annually | Annually |
| Dynamic Brands | Annually | Annually |
| Strategic Allocation | Quarterly | Annually |
| ReSolve Adaptive | Annually | Annually |
| Pier 88 | Quarterly | Annually |
| Special Situations | Monthly | Annually |
Certain Funds may own shares of real estate investments trusts (“REITs”) which report information on the source of their distributions annually. Distributions received from investments in REITs in excess of income from underlying investments are recorded as realized gain and/or as a reduction to the cost of the individual REIT.
| F. | Allocation of Expenses, Income, and Gains and Losses |
Expenses directly attributable to a Fund are charged to that Fund. Expenses not directly attributable to a Fund are allocated proportionally among various Funds or all Funds within the Trust in relation to the net assets of each Fund or on another reasonable basis. Income, non-class specific expenses and realized/unrealized gains or losses are allocated to each class based on relative net assets. Distribution fees are charged to each respective share class in accordance with the distribution plan.
It is the policy of each Fund to qualify or continue to qualify as a regulated investment company by complying with the provisions available to certain investment companies, as defined in applicable sections of the Internal Revenue Code, and to make distributions of net investment income and net realized capital gains sufficient to relieve it from all, or substantially all, federal income taxes.
The Funds recognize the tax benefits of uncertain tax positions only where the position is “more likely than not” to be sustained assuming examination by tax authorities. Management has analyzed each Fund’s tax positions and has concluded that no liability for unrecognized tax benefits should be recorded related to uncertain tax positions taken on returns filed for open tax years ended December 31, 2017 to December 31, 2019 (as applicable), or expected to be taken in the Funds’ December 31, 2020 year-end tax returns. Each Fund identifies its major tax jurisdictions as U.S. Federal, and foreign jurisdictions where the Funds make significant investments; however the Funds are not aware of any tax positions for which it is reasonably possible that the total amounts of unrecognized tax benefits will change materially in the next twelve months. The Funds recognize interest and penalties, if any, related to unrecognized tax benefits, as income tax expenses in the Statements of Operations. As of December 31, 2020, the Funds did not incur any interest or penalties.
The Trust indemnifies its Officers and Trustees for certain liabilities that may arise from the performance of their duties to the Trust. Additionally, in the normal course of business, the Funds enter into contracts that contain a variety of representations and warranties and which provide general indemnities. The Funds’ maximum exposure under these arrangements is unknown, as this would involve future claims that may be made against the Funds that have not yet occurred. However, based on experience, the risk of loss due to these warranties and indemnities appears to be remote.
Overall market risks may also affect the value of a Fund. The market values of securities or other investments owned by a Fund will go up or down, sometimes rapidly or unpredictably. Factors such as economic growth and market conditions, interest rate levels, exchange rates and political events affect the securities markets. Changes in market conditions and interest rates generally do not have the same impact on all types of securities and instruments. Unexpected local, regional or global events and their aftermath, such as war; acts of terrorism; financial, political or social disruptions; natural, environmental or man-made disasters; the spread of infectious illnesses or other public health issues; recessions and
RATIONAL FUNDS
CONSOLIDATED NOTES TO FINANCIAL STATEMENTS (Continued)
| December 31, 2020 | ANNUAL REPORT |
depressions; or other tragedies, catastrophes and events could have a significant impact on a Fund and its investments and could result in increased premiums or discounts to the Fund’s net asset value, and may impair market liquidity, thereby increasing liquidity risk. Such events can cause investor fear and panic, which can adversely affect the economies of many companies, sectors, nations, regions and the market in general, in ways that cannot necessarily be foreseen. A Fund could lose money over short periods due to short-term market movements and over longer periods during more prolonged market downturns. During a general market downturn, multiple asset classes may be negatively affected. In times of severe market disruptions, you could lose your entire investment.
An outbreak of infectious respiratory illness caused by a novel coronavirus known as COVID-19 was first detected in China in December 2019 and subsequently spread globally. This coronavirus has resulted in, among other things, travel restrictions, closed international borders, enhanced health screenings at ports of entry and elsewhere, disruption of and delays in healthcare service preparation and delivery, prolonged quarantines, significant disruptions to business operations, market closures, cancellations and restrictions, supply chain disruptions, lower consumer demand, and significant volatility and declines in global financial markets, as well as general concern and uncertainty. The impact of COVID-19 has adversely affected, and other infectious illness outbreaks that may arise in the future could adversely affect, the economies of many nations and the entire global economy, individual issuers and capital markets in ways that cannot necessarily be foreseen. In addition, the impact of infectious illnesses in emerging market countries may be greater due to generally less established healthcare systems. Public health crises caused by the COVID-19 outbreak may exacerbate other pre-existing political, social and economic risks in certain countries or globally. The duration of the COVID-19 outbreak and its effects cannot be determined with certainty.
| (3) | FEES AND OTHER TRANSACTIONS WITH AFFILIATES AND OTHER SERVICE PROVIDERS |
Investment Advisory Fee— Rational Advisors, Inc., (the “Advisor”) serves as the Funds’ investment adviser. Under the terms of the Advisory Agreement, the Advisor manages the investment operations of the Funds in accordance with each Fund’s respective investment policies and restrictions. The Funds’ sub-advisors are responsible for the day-to-day management of each Fund’s portfolios. The Advisor provides the Funds with investment advice and supervision and furnishes an investment program for the Funds. For its investment management services, the Funds pay to the Advisor, as of the last day of each month, an annualized fee as shown in the below table, such fees to be computed daily based upon daily average net assets of the Funds. The Funds’ sub-advisors are paid by the Advisor, not the Funds.
| Fund | Advisory Fee Tiered Annual Rate |
| Equity Armor | Rate for the First $500 Million | Rate for the Next $500 Million | Rate for Excess Over $1 Billion | |
| 0.75% | 0.70% | 0.65% | |
| Dynamic Brands | 0.75% | 0.70% | 0.65% | |
| Strategic Allocation | Advisory Fee Annual Rate | |
| 0.10% | |
| ReSolve Adaptive | 1.75% | |
| Tactical Return | 1.75% | |
| Pier 88 | 0.85% | |
| Special Situations | 1.50% | |
RATIONAL FUNDS
CONSOLIDATED NOTES TO FINANCIAL STATEMENTS (Continued)
| December 31, 2020 | ANNUAL REPORT |
The Advisor has contractually agreed to waive all or a portion of its investment advisory fee (based on average daily net assets) and/or reimburse certain operating expenses of each Fund to the extent necessary in order to limit each Fund’s total annual fund operating expenses (exclusive of acquired fund fees and expenses, brokerage commissions and trading costs, interest (including borrowing costs and overdraft charges), taxes, short sale dividends and interest expenses, non-routine or extraordinary expenses (such as litigation or reorganizational costs), and costs and expenses of litigation or claims on behalf of the Fund regarding portfolio investments initiated (or threatened) by the investment advisor or sub-advisor) as listed below:
| Expense Caps | Expiration |
| Fund | Institutional Class Shares | Class A Shares | Class C Shares | |
| Equity Armor | 1.00% | 1.25% | 2.00% | April 30, 2021 |
| Tactical Return | 1.99% | 2.24% | 2.99% | April 30, 2021 |
| Dynamic Brands | 1.24% | 1.49% | 2.24% | April 30, 2021 |
| Strategic Allocation | 0.45% | 0.70% | 1.45% | April 30, 2021 |
| ReSolve Adaptive | 1.97% | 2.22% | 2.97% | April 30, 2021 |
| Pier 88 | 0.99% | 1.24% | 1.99% | April 30, 2021 |
| Special Situations | 1.75% | 2.00% | 2.75% | April 30, 2021 |
Amounts waived or reimbursed in the contractual period may be recouped by the Advisor within three years of the waiver and/or reimbursement. As of December 31, 2020, the following amounts have been waived or reimbursed by the Advisor and are subject to repayment by the respective Fund:
| | | Amount Waived or | | | Expiring Beginning | |
| Fund | | Reimbursed | | | December 31, | |
| Equity Armor | | $ | 156,337 | | | | 2021 | |
| | | | 137,069 | | | | 2022 | |
| | | | 135,785 | | | | 2023 | |
| Tactical Return | | | 148,732 | | | | 2021 | |
| | | | 179,111 | | | | 2022 | |
| | | | 127,155 | | | | 2023 | |
| Dynamic Brands | | | 175,690 | | | | 2021 | |
| | | | 94,974 | | | | 2022 | |
| | | | 8,050 | | | | 2023 | |
| Strategic Allocation | | | 79,043 | | | | 2021 | |
| | | | 63,678 | | | | 2022 | |
| | | | 72,877 | | | | 2023 | |
| ReSolve Adaptive | | | 148,267 | | | | 2021 | |
| | | | 140,730 | | | | 2022 | |
| | | | 137,538 | | | | 2023 | |
| Pier 88 | | | 21,532 | | | | 2022 | |
| | | | 155,789 | | | | 2023 | |
| Special Situations | | | 66,286 | | | | 2022 | |
| | | | 159,379 | | | | 2023 | |
The Independent Trustees are paid a quarterly retainer, and receive compensation for each committee meeting, telephonic Board meeting, and special in-person Board meeting attended. Officers receive no compensation from the Trust. The Trust reimburses each of the Independent Trustees for travel and other expenses incurred in connection with attendance at such meetings. The Trust has no retirement or pension plans. Additional information regarding the Trust’s Trustees is available in the Funds’ Statement of Additional Information.
RATIONAL FUNDS
CONSOLIDATED NOTES TO FINANCIAL STATEMENTS (Continued)
| December 31, 2020 | ANNUAL REPORT |
The Board has adopted the Trust’s Distribution Plan (the “12b-1 Plan”) which allows each Fund to pay fees up to 0.25% for Class A shares and up to 1.00% for Class C shares based on average daily net assets of each class to financial intermediaries (which may be paid through the Funds’ distributor) for the sale and distribution of these shares. Pursuant to the 12b -1 Plan, the Funds may finance from their assets certain activities or expenses that are intended primarily to result in the sale of Fund shares and to reimburse Northern Lights Distributors, LLC., the Funds’ distributor (the “Distributor or NLD”), and the Advisor for distribution related expenses. For the year ended December 31, 2020, the amounts accrued by the Funds were as follows:
| | | 12b-1 Fees | |
| Fund | | Class A | | | Class C | |
| Equity Armor | | $ | 29,036 | | | $ | 11,222 | |
| Tactical Return | | | 21,435 | | | | 84,735 | |
| Dynamic Brands | | | 33,808 | | | | 4,992 | |
| Strategic Allocation | | | 18,803 | | | | 9 | |
| ReSolve Adaptive | | | 7,737 | | | | 3,459 | |
| Pier 88 | | | 221 | | | | 162 | |
| Special Situations | | | 60,865 | | | | 75,707 | |
Shareholder Servicing Fees - The Trust has adopted a Shareholder Services Plan pursuant to which the Funds may pay Shareholder Services Fees up to 0.25% of the average daily net assets to financial intermediaries for providing shareholder assistance, maintaining shareholder accounts and communicating or facilitating purchases and redemptions of shares for Institutional, Class A and Class C Shares.
In addition, certain affiliates of the Distributor provide services to the Funds as follows:
Gemini Fund Services, LLC (“GFS”) – GFS an affiliate of the Distributor, provides administrative, fund accounting, and transfer agency services to the Funds pursuant to agreements with the Trust, for which it receives from each Fund the greater of an annual minimum fee or an asset based fee, which scales downward based upon net assets for fund administration, fund accounting and transfer agency services and are reflected as such on the Statements of Operations. The Funds also pay GFS for any out-of-pocket expenses. Officers of the Trust are also employees of GFS, and are not paid any fees directly by the Trust for serving in such capacity.
Blu Giant, LLC (“Blu Giant”) – Blu Giant, an affiliate of GFS and the Distributor, provides EDGAR conversion and filing services as well as print management services for the Funds on an ad-hoc basis. For the provision of these services, Blu Giant receives customary fees from the Funds, which are included in printing expenses on the Statements of Operations.
Pursuant to the Management Services Agreement between the Trust and MFund Services LLC (“MFund”), an affiliate of the Advisor, MFund provides the Funds with various management and administrative services. For these services, the Funds pay MFund an annual base fee plus an annual asset-based fee, which scales downward based upon net assets. In addition, the Funds reimburse MFund for any reasonable out- of- pocket expenses incurred in the performance of its duties under the Management Services Agreement. These fees are included in Management Service Fees on the Statements of Operations.
Pursuant to the Compliance Services Agreement, MFund provides chief compliance officer services to the Funds. For these services, the Funds pay MFund an annual base fee plus an annual asset-based fee based upon net assets. In addition, the Funds reimburse MFund for any reasonable out - of- pocket expenses incurred in the performance of its duties under the Compliance Services Agreement. These fees are included in Compliance Officer Fees on the Statements of Operations. The amounts due to MFund at December 31, 2020 for management and chief compliance officer services are listed in the Statements of Assets and Liabilities under Payable to related parties.
An Officer of the Trust is also the controlling member of MFund and the Advisor, and is not paid any fees directly by the Trust for serving in such capacity.
RATIONAL FUNDS
CONSOLIDATED NOTES TO FINANCIAL STATEMENTS (Continued)
| December 31, 2020 | ANNUAL REPORT |
Affiliated Funds — Affiliated companies are mutual funds that are advised by Catalyst Capital Advisors, AlphaCentric Advisors, LLC or Rational Advisors, Inc. Companies that are affiliates of the Funds at December 31, 2020, are noted in the Strategic Allocation’s Portfolio of Investments. A summary of these investments in affiliated funds is set forth below:
| | | Shares Balance | | | | | | | | | Shares Balance | | | | | | Change in | | | Dividends | | | Amount of Gain | |
| | | December 31, | | | | | | | | | December 31, | | | | | | Unrealized | | | Credited to | | | (Loss) Realized on | |
| Fund | | 2019 | | | Purchases | | | Sales | | | 2020 | | | Fair Value | | | Gain/(Loss) | | | Income | | | Sale of Shares | |
| AlphaCentric Income Opportunities Fund, Inst. Sh. | | | — | | | | 46,516 | | | | 7,048 | | | | 39,468 | | | $ | 435,322 | | | $ | 84,876 | | | $ | 13,759 | | | $ | 11,687 | |
| Catalyst Buyback Strategy Fund, Inst. Sh. | | | 23,039 | | | | — | | | | 23,039 | | | | — | | | | — | | | | (5,189 | ) | | | — | | | | 5,881 | |
| Catalyst/CIFC Floating Rate Income Fund | | | — | | | | 108,822 | | | | 26,612 | | | | 82,210 | | | | 785,929 | | | | (4,904 | ) | | | 32,704 | | | | 356 | |
| Catalyst Enhanced CoreFund Inst. Sh. | | | 18,831 | | | | — | | | | 18,831 | | | | — | | | | — | | | | (4,669 | ) | | | — | | | | 11,448 | |
| Catalyst Enhanced Income Strategy Fund, Inst. Sh. | | | 108,789 | | | | 64,667 | | | | 48,817 | | | | 124,639 | | | | 1,404,690 | | | | 3,871 | | | | 77,679 | | | | (6,805 | ) |
| Catalyst Insider Buying Fund, Inst. Sh. | | | 12,960 | | | | — | | | | 12,960 | | | | — | | | | — | | | | (16,071 | ) | | | — | | | | 19,181 | |
| Catalyst Insider Income Fund Inst. Sh. | | | 53,074 | | | | 55,016 | | | | 30,235 | | | | 77,855 | | | | 766,875 | | | | 19,838 | | | | 28,744 | | | | (29 | ) |
| Catalyst MLP & Infrastructure Fund, Inst, Sh. | | | 150,157 | | | | — | | | | 150,157 | | | | — | | | | — | | | | 2,926 | | | | 47 | | | | 178,038 | |
| Catalyst/Stone Beach Income Opportunity Fund, Inst. Sh. | | | 84,643 | | | | 8,597 | | | | 23,223 | | | | 70,017 | | | | 648,359 | | | | (119,452 | ) | | | 24,160 | | | | 2,864 | |
| Context Insurance Linked Income Fund, Inst. Sh | | | — | | | | 258 | | | | 258 | | | | — | | | | — | | | | — | | | | — | | | | 261 | |
| Rational Dynamic Brands Fund, Inst. Sh. | | | 15,969 | | | | — | | | | 15,969 | | | | — | | | | — | | | | (87,883 | ) | | | — | | | | 98,742 | |
| Rational NuWave Enhanced Market Opportunity Fund, Inst. Sh. | | | 117,556 | | | | — | | | | 117,556 | | | | — | | | | — | | | | 16,100 | | | | — | | | | (6,695 | ) |
| Rational Special Situations Income Fund, Inst. Sh. | | | 104,694 | | | | 12,354 | | | | 46,087 | | | | 70,961 | | | | 1,395,098 | | | | (142,739 | ) | | | 61,230 | | | | 12,558 | |
| Rational/Pier 88 Convertible Securities Fund CL. I | | | — | | | | 266,511 | | | | 153,954 | | | | 112,557 | | | | 1,315,735 | | | | 207,555 | | | | 21,632 | | | | (278,637 | ) |
| Strategy Shares NASDAQ 7 Handl Index ETF | | | 43,000 | | | | — | | | | 43,000 | | | | — | | | | — | | | | 23,537 | | | | 17,644 | | | | (73,978 | ) |
| Total | | | 732,712 | | | | 562,741 | | | | 717,746 | | | | 577,707 | | | $ | 6,752,008 | | | $ | (22,204 | ) | | $ | 277,599 | | | $ | (25,128 | ) |
| (4) | INVESTMENT TRANSACTIONS |
For the year ended December 31, 2020, aggregate purchases and proceeds from sales of investment securities (excluding short-term investments) for the Funds were as follows:
| Fund | | Purchases | | | Sales | |
| Equity Armor | | $ | 189,993,410 | | | $ | 161,763,992 | |
| Tactical Return | | | — | | | | — | |
| Dynamic Brands | | | 154,118,379 | | | | 137,100,820 | |
| Strategic Allocation | | | 6,332,530 | | | | 9,300,486 | |
| ReSolve Adaptive | | | — | | | | — | |
| Pier 88 | | | 133,151,239 | | | | 75,239,934 | |
| Special Situations | | | 370,197,444 | | | | 9,346,025 | |
In accordance with its investment objectives and through its exposure to the managed futures programs, each of Equity Armor, Strategic Allocation and ReSolve Adaptive may have increased or decreased exposure to one or more of the following risk factors defined below:
Commodity Risk - Commodity risk relates to the change in value of commodities or commodity indexes as they relate to increases or decreases in the commodities market. Commodities are physical assets that have tangible properties. Examples of these types of assets are crude oil, heating oil, metals, livestock, and agricultural products.
Foreign Exchange Rate Risk - Foreign exchange rate risk relates to the change in the U.S. dollar value of a security held that is denominated in a foreign currency. The U.S. dollar value of a foreign currency denominated security will decrease as the dollar appreciates against the currency, while the U.S. dollar value will increase as the dollar depreciates against the currency.
Interest Rate Risk - Interest rate risk refers to the fluctuations in value of fixed-income securities resulting from the inverse relationship between price and yield. For example, an increase in general interest rates will tend to reduce the market value of already issued fixed-income investments, and a decline in general interest rates will tend to increase their value. In
RATIONAL FUNDS
CONSOLIDATED NOTES TO FINANCIAL STATEMENTS (Continued)
| December 31, 2020 | ANNUAL REPORT |
addition, debt securities with longer maturities, which tend to have higher yields, are subject to potentially greater fluctuations in value from changes in interest rates than obligations with shorter maturities.
Volatility Risk - Volatility risk refers to the magnitude of the movement, but not the direction of the movement, in a financial instrument’s price over a defined time period. Large increases or decreases in a financial instrument’s price over a relative time period typically indicate greater volatility risk, while small increases or decreases in its price typically indicate lower volatility risk.
In accordance with its investment objectives and through its exposure to options, Tactical Return may have increased or decreased exposure to Option Risk factors defined below:
Options Risk - Tactical Return are subject to equity price risks in the normal course of pursuing their investment objective and may purchase or sell options. The seller (writer) of a call option which is covered (e.g., the writer holds the underlying security) assumes the risk of a decline in the market price of an underlying security below the purchase price of an underlying security less the premium received, and gives up the opportunity for gain on the underlying security above the exercise price of the option. The seller of an uncovered call option assumes the risk of a theoretical unlimited increase in the market price of an underlying security above the exercise price of the option. The securities necessary to satisfy the exercise of the call option may be unavailable for purchase except at much higher prices. Purchasing securities to satisfy the exercise of the call option can itself cause the price of securities to rise further, sometimes by a significant amount, thereby exacerbating the loss. The buyer of a call option assumes the risk of losing its entire premium invested in the call option. The seller (writer) of a put option which is covered (e.g., the writer has a short position in the underlying security) assumes the risk of an increase in the market price of the underlying security above the sales price (in establishing the short position) of the underlying security plus the premium received, and gives up the opportunity for gain on the underlying security below the exercise price of the option. The seller of an uncovered put option assumes the risk of a decline in the market price of the underlying security below the exercise price of the option. The buyer of a put option assumes the risk of losing his entire premium invested in the put option.
Activist Strategies Risk - As part of Special Situation’s principal investment strategy, the Sub-Advisor seeks to identify “special situations” where it can seek to remedy legal, technical or structural issues it has identified in the securities held by the Fund through activist strategies, including through litigation or the threat of litigation. Such activist strategies may not be successful and may have a negative impact on the Fund, including causing the Fund to incur legal related costs and expenses and portfolio turnover if the Sub-Advisor determines to sell such securities.
Please refer to the Funds’ prospectus for a full listing of risks associated with these investments.
| (6) | AGGREGATE UNREALIZED APPRECIATION AND DEPRECIATION – TAX BASIS |
The identified cost of investments in securities owned by each Fund for federal income tax purposes (including options written), and its respective gross unrealized appreciation and depreciation at December 31, 2020, were as follows:
| | | | | | Gross | | | Gross | | | Net Unrealized | |
| | | Tax | | | Unrealized | | | Unrealized | | | Appreciation/ | |
| | Cost | | | Appreciation | | | Depreciation | | | (Depreciation) | |
| Equity Armor | | $ | 50,910,290 | | | $ | 7,207,919 | | | $ | (785,861 | ) | | $ | 6,422,058 | |
| Tactical Return | | | 73,804,636 | | | | — | | | | — | | | | — | |
| Dynamic Brands | | | 61,611,766 | | | | 14,239,033 | | | | (698,892 | ) | | | 13,540,141 | |
| Strategic Allocation | | | 6,719,716 | | | | 401,058 | | | | (54,692 | ) | | | 346,366 | |
| ReSolve Adaptive | | | 56,661,833 | | | | 378,433 | | | | (60,730 | ) | | | 317,703 | |
| Pier 88 | | | 66,003,491 | | | | 8,332,012 | | | | (727,755 | ) | | | 7,604,257 | |
| Special Situations | | | 394,406,845 | | | | 18,129,699 | | | | (7,305,380 | ) | | | 10,824,319 | |
RATIONAL FUNDS
CONSOLIDATED NOTES TO FINANCIAL STATEMENTS (Continued)
| December 31, 2020 | ANNUAL REPORT |
| (7) | DISTRIBUTIONS TO SHAREHOLDERS AND TAX COMPONENTS OF CAPITAL |
The tax character of fund distributions paid for the year ended December 31, 2020 and December 31, 2019 was as follows:
| For fiscal year ended | | Ordinary | | | Long-Term | | | Return of | | | | |
| 12/31/2020 | | Income | | | Capital Gains | | | Capital | | | Total | |
| Equity Armor | | $ | 564,193 | | | $ | — | | | $ | — | | | $ | 564,193 | |
| Tactical Return | | | 1,086,680 | | | | 3,391,193 | | | | — | | | | 4,477,873 | |
| Dynamic Brands | | | 5,764,896 | | | | 2,684,155 | | | | — | | | | 8,449,051 | |
| Strategic Allocation | | | 232,735 | | | | — | | | | 18,623 | | | | 251,358 | |
| ReSolve Adaptive | | | 205,777 | | | | — | | | | 88,954 | | | | 294,731 | |
| Pier 88 | | | 1,229,024 | | | | 19,438 | | | | — | | | | 1,248,462 | |
| Special Situations | | | 13,372,271 | | | | — | | | | 623,229 | | | | 13,995,500 | |
| For fiscal year or period ended | | Ordinary | | | Long-Term | | | Return of | | | | |
| 12/31/2019 | | Income | | | Capital Gains | | | Capital | | | Total | |
| Equity Armor | | $ | 957,035 | | | $ | — | | | $ | — | | | $ | 957,035 | |
| Tactical Return | | | 1,761,554 | | | | 3,657,076 | | | | — | | | | 5,418,630 | |
| Dynamic Brands | | | — | | | | 129,486 | | | | — | | | | 129,486 | |
| Strategic Allocation | | | 427,376 | | | | 159,642 | | | | 57,104 | | | | 644,122 | |
| ReSolve Adaptive | | | 4,161,597 | | | | 3,441,482 | | | | 82,748 | | | | 7,685,827 | |
| Pier 88 | | | — | | | | — | | | | — | | | | — | |
| Special Situations | | | 829,344 | | | | — | | | | — | | | | 829,344 | |
As of December 31, 2020, the components of distributable earnings/ (accumulated deficit) on a tax basis were as follows:
| | | Undistributed | | | Undistributed | | | Post October Loss | | | Capital Loss | | | Other | | | Unrealized | | | Total | |
| | | Ordinary | | | Long-Term | | | and | | | Carry | | | Book/Tax | | | Appreciation/ | | | Distributable Earnings/ | |
| | | Income | | | Capital Gains | | | Late Year Loss | | | Forwards | | | Differences | | | (Depreciation) | | | (Accumulated Deficits) | |
| Equity Armor | | $ | 336,070 | | | $ | — | | | $ | (1,383,973 | ) | | $ | (7,061,656 | ) | | $ | — | | | $ | 6,422,058 | | | $ | (1,687,501 | ) |
| Tactical Return | | | 354,239 | | | | 2,704,255 | | | | — | | | | (2,185,193 | ) | | | — | | | | — | | | | 873,301 | |
| Dynamic Brands | | | 3,180,375 | | | | 402,164 | | | | — | | | | — | | | | — | | | | 13,540,238 | | | | 17,122,777 | |
| Strategic Allocation | | | — | | | | — | | | | — | | | | (743,977 | ) | | | — | | | | 346,366 | | | | (397,611 | ) |
| ReSolve Adaptive | | | — | | | | — | | | | (166,515 | ) | | | (3,148,869 | ) | | | — | | | | 410,371 | | | | (2,905,013 | ) |
| Pier 88 | | | 886,308 | | | | 65,873 | | | | — | | | | — | | | | — | | | | 7,604,257 | | | | 8,556,438 | |
| Special Situations | | | — | | | | — | | | | (939,552 | ) | | | (6,095,617 | ) | | | — | | | | 10,824,319 | | | | 3,789,150 | |
The difference between book basis and tax basis unrealized appreciation (depreciation), undistributed ordinary income (loss) and accumulated net realized gain (loss) from investments is primarily attributable to the tax deferral of losses on wash sales, mark-to-market on open futures and options 1256 contracts, and adjustments for trust preferred securities and income on contingent convertible debt securities. The unrealized appreciation (depreciation) in the table above includes unrealized foreign currency gains of $97 and $92,668 for the Dynamic Brands and ReSolve Adaptive, respectively.
RATIONAL FUNDS
CONSOLIDATED NOTES TO FINANCIAL STATEMENTS (Continued)
| December 31, 2020 | ANNUAL REPORT |
Late year losses incurred after December 31 within the fiscal year are deemed to arise on the first business day of the following fiscal year for tax purposes. The Funds incurred and elected to defer such late year losses as follows:
| | | Late Year | |
| | | Losses | |
| Equity Armor | | $ | — | |
| Tactical Return | | | — | |
| Dynamic Brands | | | — | |
| Strategic Allocation | | | — | |
| ReSolve Adaptive | | | 166,515 | |
| Pier 88 | | | — | |
| Special Situations | | | — | |
Capital losses incurred after October 31 within the fiscal year are deemed to arise on the first business day of the following fiscal year for tax purposes. The Funds incurred and elected to defer such capital losses as follows:
| | | Post October | |
| | Losses | |
| Equity Armor | | | $1,383,973 | |
| Tactical Return | | | — | |
| Dynamic Brands | | | — | |
| Strategic Allocation | | | — | |
| ReSolve Adaptive | | | — | |
| Pier 88 | | | — | |
| Special Situations | | | 939,552 | |
At December 31, 2020, the Funds had capital loss carry forwards for federal income tax purposes available to offset future capital gains along with capital loss carry forwards utilized in the current year as follows:
| | | Non- Expiring | | | Non-Expiring | | | | | | Capital Loss Carry | |
| | | Short-Term | | | Long-Term | | | Total | | | Forwards Utilized | |
| Equity Armor | | $ | 3,164,565 | | | $ | 3,897,091 | | | $ | 7,061,656 | | | $ | 523,351 | |
| Tactical Return* | | | 356,948 | | | | 1,828,245 | | | | 2,185,193 | | | | 92,691 | |
| Dynamic Brands | | | — | | | | — | | | | — | | | | — | |
| Strategic Allocation | | | 378,805 | | | | 365,172 | | | | 743,977 | | | | — | |
| ReSolve Adaptive | | | 2,974,209 | | | | 174,660 | | | | 3,148,869 | | | | — | |
| Pier 88 | | | — | | | | — | | | | — | | | | — | |
| Special Situations | | | 5,552,134 | | | | 543,483 | | | | 6,095,617 | | | | — | |
| * | The Rational Tactical Return Fund experienced a shareholder change in ownership resulting in an annual limitation on the amount of pre-change capital loss carry forwards available to be recognized in each year. Due to IRC Section 382 limitations, utilization of these carry forwards is limited to a maximum of $92,691 per year. |
RATIONAL FUNDS
CONSOLIDATED NOTES TO FINANCIAL STATEMENTS (Continued)
| December 31, 2020 | ANNUAL REPORT |
Permanent book and tax differences, primarily attributable to the book/tax basis treatment of non-deductible expenses, net operating losses, the reclassification of Fund distributions, and adjustments for the Resolve Adaptive Asset Allocation Fund’s wholly owned subsidiary, which has a November 30 tax year end, resulted in reclassifications for the Funds for the fiscal year ended December 31, 2020 as follows:
| | | Paid In | | | Accumulated | |
| | | Capital | | | Earnings (Deficit) | |
| Equity Armor | | $ | — | | | $ | — | |
| Tactical Return | | | (323,039 | ) | | | 323,039 | |
| Dynamic Brands | | | — | | | | — | |
| Strategic Allocation | | | (18,623 | ) | | | 18,623 | |
| ReSolve Adaptive | | | 580,324 | | | | (580,324 | ) |
| Pier 88 | | | (706 | ) | | | 706 | |
| Special Situations | | | (16,468 | ) | | | 16,468 | |
Effective December 10, 2020, the Trust has a $100,000,000 uncommitted line of credit provided by U.S. Bank National Association (the “Bank”) under an agreement (the “Uncommitted Line”). Any advance under the Uncommitted Line is contemplated primarily for temporary or emergency purposes, including the meeting of redemption requests that otherwise might require the untimely disposition of securities. Interest on borrowings is payable on a monthly basis. The Uncommitted Line is not a “committed” line of credit, which is to say that the Bank is not obligated to lend money to the Funds. Accordingly, it is possible that the Funds may wish to borrow money for a temporary or emergency purpose but may not be able to do so. The Funds did not access the line of credit during the year ended December 31, 2020.
| (9) | UNDERLYING INVESTMENTS IN OTHER INVESTMENT COMPANIES |
Each underlying fund, including each exchange -traded fund (“ETF”), is subject to specific risks, depending on the nature of the underlying fund. These risks could include liquidity risk, sector risk, foreign and related currency risk, as well as risks associated with real estate investments and commodities. Investors in the Funds will indirectly bear fees and expenses charged by the underlying investment companies in which the Funds invest in addition to the Funds’ direct fees and expenses.
The performance of Tactical Return and ReSolve Adaptive will be directly affected by the performance of the First American Government Obligations Fund, U Class. The financial statements of the First American Government Obligations Fund, U, including the portfolio of investments, can be found at the Securities and Exchange Commission’s (“SEC”) website www.sec.gov and should be read in conjunction with the Fund’s financial statements. As of December 31, 2020, the percentage of Tactical Return and ReSolve Adaptive’s net assets invested in the First American Government Obligations Fund were 34.1% and 89.7%, respectively.
RATIONAL FUNDS
CONSOLIDATED NOTES TO FINANCIAL STATEMENTS (Continued)
| December 31, 2020 | ANNUAL REPORT |
The beneficial ownership, either directly or indirectly, of more than 25% of the voting securities of a fund creates a presumption of control of the fund, under Section 2(a)(9) of the 1940 Act. As of December 31, 2020, the companies that held more than 25% of the voting securities of the Funds, and may be deemed to control each respective Fund, are as follows:
| | | Equity | | | Tactical | | | Dynamic | | | Strategic | | | ReSolve | | | Pier | | | Special | |
| | | Armor | | | Return | | | Brands | | | Allocation | | | Adaptive | | | 88 | | | Situations | |
| NFS LLC (1) | | | 36.67 | % | | | — | | | | 25.84 | % | | | 94.22 | % | | | — | | | | 85.44 | % | | | — | |
| Charles Schwab (1) | | | — | | | | 27.00 | % | | | — | | | | — | | | | 54.99 | % | | | — | | | | 29.57 | % |
| LPL Financial (1) | | | — | | | | 30.22 | % | | | — | | | | — | | | | — | | | | — | | | | — | |
| TD Ameritrade | | | 26.24 | % | | | — | | | | — | | | | — | | | | — | | | | — | | | | — | |
| (1) | This owner is comprised of multiple investors and accounts. |
Effective September 21, 2018, Dynamic Brands underwent a 1-for-10 reverse share split. The effect of the share split was to divide the number of outstanding shares of the Fund by the split factor, with a corresponding increase in the net asset value per share. This transaction did not change the net assets of the Fund or the value of a shareholder’s investment.
Subsequent events after the date of the Statements of Assets and Liabilities have been evaluated through the date the financial statements were issued. Management has determined that no events or transactions occurred requiring adjustment or disclosure in the financial statements.

REPORT OF INDEPENDENT REGISTERED PUBLIC ACCOUNTING FIRM
To the Shareholders of Rational Equity Armor Fund, Rational Tactical Return Fund, Rational Dynamic Brands Fund, Rational Strategic Allocation Fund, Rational/ReSolve Adaptive Asset Allocation Fund, Rational/Pier 88 Convertible Securities Fund, and Rational Special Situations Income Fund and Board of Trustees of Mutual Fund and Variable Insurance Trust
Opinion on the Financial Statements
We have audited the accompanying statements of assets and liabilities, including the portfolios of investments, of the funds listed below (the “Funds”), each a series of Mutual Fund and Variable Insurance Trust, as of December 31, 2020, the related statements of operations, the statements of changes in net assets, the related notes, and the financial highlights for each of the periods indicated below (collectively referred to as the “financial statements”) . In our opinion, the financial statements present fairly, in all material respects, the financial position of each of the Funds as of December 31, 2020, the results of their operations, the changes in net assets, and the financial highlights for each of the periods indicated below in conformity with accounting principles generally accepted in the United States of America.
| Fund Name | Statements of
Operations | Statement(s) of
Changes in Net
Assets | Financial
Highlights |
| Rational Equity Armor Fund, Rational Tactical Return Fund, Rational Dynamic Brands Fund, and Rational Strategic Allocation Fund | For the year ended December 31, 2020 | For the years ended December 31, 2020 and 2019 | For the years ended December 31, 2020, 2019, 2018, 2017, and 2016 |
| Rational/ReSolve Adaptive Asset Allocation Fund * | For the year ended December 31, 2020 | For the years ended December 31, 2020 and 2019 | For the years ended December 31, 2020, 2019, 2018, 2017 and for the period from September 30, 2016 (commencement of operations) through December 31, 2016 |
| Rational/Pier 88 Convertible Securities Fund | For the year ended December 31, 2020 | For the year ended December 31, 2020 and the for the period December 6, 2019 (commencement of operations) through December 31, 2019 |
| Rational Special Situations Income Fund | For the year ended December 31, 2020 | For the year ended December 31, 2020 and the for the period July 17, 2019 (commencement of operations) through December 31, 2019 |
| * | The financial statements referred to above are Consolidated Financial Statements. |
COHEN & COMPANY, LTD.
800.229.1099 | 866.818.4535 fax | cohencpa.com
Registered with the Public Company Accounting Oversight Board
Basis for Opinion
These financial statements are the responsibility of the Funds’ management. Our responsibility is to express an opinion on the Funds’ financial statements based on our audits. We are a public accounting firm registered with the Public Company Accounting Oversight Board (United States) (“PCAOB”) and are required to be independent with respect to the Funds in accordance with the U.S. federal securities laws and the applicable rules and regulations of the Securities and Exchange Commission and the PCAOB.
We conducted our audits in accordance with the standards of the PCAOB. Those standards require that we plan and perform the audit to obtain reasonable assurance about whether the financial statements are free of material misstatement whether due to error or fraud.
Our audits included performing procedures to assess the risks of material misstatement of the financial statements, whether due to error or fraud, and performing procedures that respond to those risks. Such procedures included examining, on a test basis, evidence regarding the amounts and disclosures in the financial statements. Our procedures included confirmation of securities owned as of December 31, 2020, by correspondence with the custodian and brokers; when replies were not received from brokers, we performed other auditing procedures. Our audits also included evaluating the accounting principles used and significant estimates made by management, as well as evaluating the overall presentation of the financial statements. We believe that our audits provide a reasonable basis for our opinion.
We have served as the Funds’ auditor since 2016.

COHEN & COMPANY, LTD.
Chicago, Illinois
March 1, 2021
| RATIONAL FUNDS |
| INFORMATION ABOUT YOUR FUNDS’ EXPENSES (Unaudited) |
As a shareholder of the Fund(s), you incur two types of costs: (1) transaction costs, including sales charges (loads) on purchase payments; and (2) ongoing costs, including management fees, distribution and/or service (12b-1) fees; and other Fund expenses. The example below is intended to help you understand your ongoing costs (in dollars) of investing in the Funds and to compare these costs with the ongoing costs of investing in other mutual funds.
The example below illustrates an investment of $1,000 invested at the beginning of the period 07/01/20 and held for the entire period through 12/31/20
Actual Expenses
The first section of each table below provides information about actual account values and actual expenses. You may use the information in these sections, together with the amount you invested, to estimate the expenses that you paid over the period. Simply divide your account value by $1,000 (for example, an $8,600 account value divided by $1,000 = 8.6), then multiple the result by the number in the first row under the heading entitled “Expenses Paid During Period” to estimate the expenses you paid on your account during this period.
Hypothetical Example for Comparison Purposes
The second section of each table provides information about the hypothetical account values and hypothetical expenses based on each Fund’s actual expense ratio and an assumed rate of return of 5% per year before expenses, which is not the Funds’ actual return. The hypothetical account values and expenses may not be used to estimate the actual ending account balance or expenses you paid for the period. You may use this information to compare the ongoing costs of investing in the Funds and other funds. To do so, compare this 5% hypothetical example with the 5% hypothetical examples that appear in the shareholder reports of the other funds.
Please note that the expenses shown in the table are meant to highlight your ongoing costs only and do not reflect any transactional costs, such as sales charges (loads) or exchange fees. Therefore, the second section of the table is useful in comparing ongoing costs only, and will not help you determine the relative total costs of owning different funds. In addition, if these transactional costs were included, your costs would have been higher. For more information on transactional costs, please refer to the Funds’ prospectus.
| | | | | | | | | | | | Hypothetical | |
| | | | | | | | | Actual | | | (5% return before expenses) | |
| | | Fund’s | | | Beginning | | | Ending | | | | | | Ending | | | | |
| | | Annualized | | | Account Value | | | Account Value | | | Expenses Paid | | | Account Value | | | Expenses Paid | |
| | | Expense Ratio | | | 07/01/2020 | | | 12/31/2020 | | | During Period * | | | 12/31/2020 | | | During Period * | |
| Rational Equity Armor Fund - Class A ** | | | 1.25 | % | | $ | 1,000.00 | | | $ | 1,080.90 | | | $ | 6.54 | | | $ | 1,018.85 | | | $ | 6.34 | |
| Rational Equity Armor Fund - Class C ** | | | 2.00 | % | | | 1,000.00 | | | | 1,075.70 | | | | 10.44 | | | | 1,015.08 | | | | 10.13 | |
| Rational Equity Armor Fund - Institutional ** | | | 1.00 | % | | | 1,000.00 | | | | 1,080.70 | | | | 5.23 | | | | 1,020.11 | | | | 5.08 | |
| Rational Tactical Return Fund - Class A ** | | | 2.24 | % | | | 1,000.00 | | | | 1,010.30 | | | | 11.32 | | | | 1,013.88 | | | | 11.34 | |
| Rational Tactical Return Fund - Class C ** | | | 2.99 | % | | | 1,000.00 | | | | 1,007.00 | | | | 15.08 | | | | 1,010.10 | | | | 15.11 | |
| Rational Tactical Return Fund - Institutional ** | | | 1.99 | % | | | 1,000.00 | | | | 1,010.40 | | | | 10.06 | | | | 1,015.13 | | | | 10.08 | |
| Rational Dynamic Brands Fund - Class A | | | 1.49 | % | | | 1,000.00 | | | | 1,283.00 | | | | 8.55 | | | | 1,017.65 | | | | 7.56 | |
| Rational Dynamic Brands Fund - Class C | | | 2.24 | % | | | 1,000.00 | | | | 1,278.00 | | | | 12.83 | | | | 1,013.88 | | | | 11.34 | |
| Rational Dynamic Brands Fund - Institutional | | | 1.24 | % | | | 1,000.00 | | | | 1,284.80 | | | | 7.12 | | | | 1,018.90 | | | | 6.29 | |
| Rational Strategic Allocation Fund - Class A | | | 0.70 | % | | | 1,000.00 | | | | 1,179.50 | | | | 3.83 | | | | 1,021.62 | | | | 3.56 | |
| Rational Strategic Allocation Fund - Class C | | | 1.45 | % | | | 1,000.00 | | | | 1,175.80 | | | | 7.93 | | | | 1,017.85 | | | | 7.35 | |
| Rational Strategic Allocation Fund - Institutional | | | 0.45 | % | | | 1,000.00 | | | | 1,180.60 | | | | 2.47 | | | | 1,022.87 | | | | 2.29 | |
| Rational/ReSolve Adaptive Asset Allocation Fund - Class A | | | 2.22 | % | | | 1,000.00 | | | | 1,072.70 | | | | 11.57 | | | | 1,013.98 | | | | 11.24 | |
| Rational/ReSolve Adaptive Asset Allocation Fund - Class C | | | 2.97 | % | | | 1,000.00 | | | | 1,068.70 | | | | 15.44 | | | | 1,010.21 | | | | 15.01 | |
| Rational/ReSolve Adaptive Asset Allocation Fund - Institutional | | | 1.97 | % | | | 1,000.00 | | | | 1,074.40 | | | | 10.27 | | | | 1,015.23 | | | | 9.98 | |
| Rational Special Situations Income Fund - Class A | | | 2.00 | % | | | 1,000.00 | | | | 1,033.60 | | | | 10.22 | | | | 1,015.08 | | | | 10.13 | |
| Rational Special Situations Income Fund - Class C | | | 2.75 | % | | | 1,000.00 | | | | 1,030.00 | | | | 14.03 | | | | 1,011.31 | | | | 13.90 | |
| Rational Special Situations Income Fund - Institutional | | | 1.75 | % | | | 1,000.00 | | | | 1,034.90 | | | | 8.95 | | | | 1,016.34 | | | | 8.87 | |
| Rational/Pier 88 Convertible Securities Fund - Class A | | | 1.24 | % | | | 1,000.00 | | | | 1,112.10 | | | | 6.58 | | | | 1,018.90 | | | | 6.29 | |
| Rational/Pier 88 Convertible Securities Fund - Class C | | | 1.99 | % | | | 1,000.00 | | | | 1,107.90 | | | | 10.54 | | | | 1,015.13 | | | | 10.08 | |
| Rational/Pier 88 Convertible Securities Fund - Institutional ** | | | 0.99 | % | | | 1,000.00 | | | | 1,113.10 | | | | 5.26 | | | | 1,020.16 | | | | 5.03 | |
| * | Expenses are equal to the Funds’ annualized expense ratios multiplied by the average account value over the period, multiplied by 184/366 to reflect the one-half year period. |
| ** | Annualized expense ratio does not include interest expenses or dividend expenses |
| RATIONAL FUNDS | |
| SUPPLEMENTAL INFORMATION (Unaudited) (Continued) |
| December 31, 2020 | ANNUAL REPORT |
Consideration and Renewal of Management Agreement between Mutual Fund and Variable Insurance Trust and Rational Advisors, Inc. with respect to Rational Equity Armor Fund, Rational Tactical Return Fund, Rational Dynamic Brands Fund, Rational Strategic Allocation Fund, and Rational/ReSolve Adaptive Asset Allocation Fund, December 11, 2020
In connection with a telephonic meeting held on December 11, 2021, the Board of Trustees (the “Board” or the “Trustees”) of Mutual Fund and Variable Insurance Trust (the “Trust”), including a majority of the Trustees who are not “interested persons,” as that term is defined in the Investment Company Act of 1940, as amended, of the Trust, discussed the renewal of the management agreement between the Trust and Rational Advisors, Inc. (“Rational”) with respect to Rational Equity Armor Fund (the “Equity Armor Fund”), Rational Tactical Return Fund (the “Tactical Return Fund”), Rational Dynamic Brands Fund (the “Dynamic Brands Fund”), Rational Strategic Allocation Fund (the “Strategic Allocation Fund”), and Rational/ReSolve Adaptive Asset Allocation Fund (the “ReSolve Fund”), each a series of the Trust (collectively the “Renewal Funds”) (the “Management Agreement”).
The Board relied upon the advice of legal counsel and its own business judgment in evaluating the Management Agreement and the weight to be given to each factor considered. The conclusions reached by the Board were based upon a comprehensive evaluation and discussion of all the information provided and were not the result of any one factor. Moreover, each Trustee might have afforded different weight to the various factors in reaching his conclusions with respect to the Management Agreement. In connection with its deliberations regarding approval of the Agreement, the Board reviewed materials prepared by Rational (the “Rational 15(c) Response”). The Board also considered the information presented at Board meetings throughout the year.
Nature, Extent, and Quality of Services. The Board reviewed the services provided by the team of professionals at Rational. The Board reviewed information concerning Rational’s resources, personnel, business operations, and culture of compliance. The Board reviewed Rational’s Form ADV as of March 30, 2020 and the firm’s balance sheet as of September 30, 2020. The Board noted that there were no new compliance or regulatory issues. The Board considered that Rational continues to enhance its oversight of the sub-advisors of the Equity Armor Fund, Tactical Return Fund, Dynamic Brands Fund, and ReSolve Fund in reviewing those Funds’ returns relative to their respective investment objectives and principal investment strategies. After further discussion and review of the Rational 15(c) Response, the Board concluded that Rational would continue to provide an acceptable level of services to the Renewal Funds.
Performance. The Board compared the returns of each Renewal Fund to those of its peer group, Morningstar category, and benchmarks for various periods ended September 30, 2020.
Equity Armor Fund. The Board considered that the Equity Armor Fund’s assets as of September 30, 2020 amounted to $50.7 million, an increase from $19.9 million in assets as of December 31, 2019, when Equity Armor began sub-advising the Fund. The Board noted that the Fund had outperformed the S&P 500 TR Index during that time period. The Board considered that the Fund had outperformed the Morningstar Large Value category and its peer group for the one- and three-year periods, outperformed the Morningstar Options-Based category for the one- and ten-year period, underperformed the Morningstar Large Value category and its peer group for the five- and ten-year periods, and underperformed the Morningstar Options-Based category for the three- and five-year periods. The Board considered that the Fund had outperformed the S&P 500 Value TR Index for the one-year period; underperformed the S&P 500 Value TR Index for the three-, five-, and ten-year periods; and underperformed the S&P 500 TR Index for the one-, three-, five-, and ten-year periods. After further discussion, the Board determined that the Fund’s performance was acceptable.
Tactical Return Fund. The Board considered that the Tactical Return Fund had outperformed the Morningstar Options-Based category for the three- and five-year periods and underperformed the category for the one- and ten-year periods; outperformed the peer group and the Morningstar Managed Futures category for the one-, three-,
| RATIONAL FUNDS | |
| SUPPLEMENTAL INFORMATION (Unaudited) (Continued) |
| December 31, 2020 | ANNUAL REPORT |
five-, and ten -year periods; and underperformed the S&P 500 TR Index for the one-, three-, five-, and ten-year periods. After further discussion, the Board determined that the Fund’s performance was acceptable.
Dynamic Brands Fund. The Board considered that the Dynamic Brands Fund had outperformed the peer group for the one-, three-, five-, and ten-year periods; outperformed the Morningstar Large Growth category for the one- and three-year periods and underperformed the category for the five- and ten-year periods; outperformed the S&P 500 TR Index for the one-, three-, and five-year periods, and underperformed the S&P 500 TR Index for the ten-year period. The Board considered that the Fund had outperformed S&P 500 TR Index from October 2017, when Accuvest Global Advisors LLC, the Fund’s current sub-advisor, began managing the Fund, through September 30, 2020. After further discussion, the Board determined that the Fund’s performance was acceptable.
Strategic Allocation Fund. The Board considered that the Strategic Allocation Fund had the same return as the Bloomberg Barclays US Aggregate Bond Index for the ten-year period but underperformed that Index for the one-, three-, and five year periods. The Board considered that the Fund had underperformed the Morningstar Allocation 50-70% Equity category, the peer group, and the S&P 500 TR Index for the one-, three-, five-, and ten-year periods. The Board noted Rational’s explanation that the Fund’s historical performance did not represent the changes to the Fund’s principal investment strategy that were implemented in December 2019 and that, apart from the Fund’s more recent underperformance due to the overall market decline in March 2020, the Fund has performed well under its new strategy. After further discussion, the Board determined that the Fund’s performance was acceptable.
ReSolve Fund. The Board considered that the ReSolve Fund had outperformed the Morningstar Managed Futures category, peer group, and Bloomberg Barclays CTA Index for the three-, five-, and 10-year periods; outperformed the Morningstar Multialternative category for the three- and ten-year periods; underperformed the Morningstar Multialternative category for the one- and five-year periods; underperformed the Morningstar Managed Futures category and the peer group for the one-year period; and underperformed the S&P 500 TR Index for the one-, three-, five-, and ten-year periods. The Board considered Rational’s statement that the Fund’s underperformance since ReSolve Asset Management Inc. began managing the Fund’s portfolio in March 2018 was attributable to the Fund’s failure to participate in the market recovery following the market drawdown in March 2020. The Board considered Rational’s statement that it believed that the Fund had nevertheless met its objective of long-term capital appreciation. After further discussion, the Board determined that the Fund’s performance was acceptable.
Fees and Expenses. The Board compared each Renewal Fund’s management fees and net expenses to those of its peer group and Morningstar category.
Equity Armor Fund. The Board considered that Rational’s management fee for the Equity Armor Fund was lower than the average management fees of the peer group and Morningstar Options -based category, higher than the average management fee of the Morningstar Large Value category, and within the range of management fees of the peer group and both Morningstar categories. The Board considered Rational’s statement that the Morningstar Options-based category provided a more appropriate management fee comparison for the Fund, which combined an actively managed equity strategy with a hedging overlay, whereas the Morningstar Large Value category included funds with passive strategies and commensurately lower management fees. The Board noted that with the contractual expense cap in place, Rational was waiving a portion of its fees with respect to the Fund. After further discussion, the Board concluded that the management fees payable to Rational with respect to the Fund were reasonable.
The Board considered that the Equity Armor Fund’s net expense ratio was lower the average expense ratios of the peer group and Morningstar Options-based category, higher than the average expense ratio of the Morningstar Large Value category, and within the range of net expense ratios of the peer group, and Morningstar Options-based and Large Value categories. After further discussion, the Board concluded that the Fund’s net expenses were reasonable.
| RATIONAL FUNDS | |
| SUPPLEMENTAL INFORMATION (Unaudited) (Continued) |
| December 31, 2020 | ANNUAL REPORT |
Tactical Return Fund. The Board considered that Rational’s management fee for the Tactical Return Fund was higher than the average management fees, within the range of management fees, of the peer group and Morningstar Managed Futures category, and equal to the highest management fees of the Morningstar Options-based category. The Board considered Rational’s statement that the Fund’s management fees were the same as those of two other funds in the peer group. The Board noted that with the contractual expense cap in place, Rational was waiving a portion of its fees with respect to the Fund. After further discussion, the Board concluded that the management fees payable to Rational with respect to the Fund were reasonable.
The Board considered that the Tactical Return Fund’s net expense ratio was higher than the average expense ratios, but within the range of net expense ratios, of the peer group and Morningstar Options-based and Managed Futures categories. After further discussion, the Board concluded that the Fund’s net expenses were reasonable.
Dynamic Brands Fund. The Board considered that Rational’s management fee for the Dynamic Brands Fund was lower than the average management fee the peer group, higher than the average management fee of the Morningstar Large Growth category, and within the range of management fees of the peer group and Morningstar category. The Board considered Rational’s statement that the Fund’s management were competitive relative to the peer group and other funds in the Morningstar category that implement a more active approach. The Board noted that with the contractual expense cap in place, Rational was waiving a portion of its fees with respect to the Fund. After further discussion, the Board concluded that the management fees payable to Rational with respect to the Fund were reasonable.
The Board considered that the Dynamic Brands Fund’s net expense ratio was higher than average expense ratio of the peer group and the Morningstar Large Growth category, and within the range of the net expense ratios of the peer group and Morningstar category. After further discussion, the Board concluded that the Fund’s net expenses were reasonable.
Strategic Allocation Fund. The Board considered that Rational’s management fee for the Strategic Allocation Fund was lower than the average management fee, and within the range of management fees, of the peer group and the Morningstar Allocation 50%-70% Equity category. The Board noted that with the contractual expense cap in place, Rational was waiving a portion of its fees with respect to the Fund. After further discussion, the Board concluded that the management fees payable to Rational with respect to the Fund were reasonable.
The Board considered that the Strategic Allocation Fund’s net expense ratio was higher than average expense ratios, but within the range the net expense ratios, of the peer group and the Morningstar Allocation 50%-70% Equity category. After further discussion, the Board concluded that the Fund’s net expenses were reasonable.
ReSolve Fund. The Board considered that Rational’s management fee for the ReSolve Fund was higher than the average management fees of the peer group, and the Morningstar Multialternative and Managed Futures categories, but within the range of management fees of the peer group and Morningstar categories. The Board considered Rational’s statement that the Fund’s management fee reflected the specialized nature of the Fund’s investment strategy and the extent of oversight that Rational provided with respect to complex strategies. The Board noted that with the contractual expense cap in place, Rational was waiving a portion of its fees with respect to the Fund. After further discussion, the Board concluded that the management fees payable to Rational with respect to the Fund were reasonable.
The Board considered that the ReSolve Fund’s net expense ratio was higher than the average expense ratios, but within the range of the net expense ratios, of the peer group, and the Morningstar Multialternative and Managed Futures categories. After further discussion, the Board concluded that the Fund’s net expenses were reasonable.
| RATIONAL FUNDS | |
| SUPPLEMENTAL INFORMATION (Unaudited) (Continued) |
| December 31, 2020 | ANNUAL REPORT |
Equity Armor Fund, Tactical Return Fund, Dynamic Brands Fund, and ReSolve Fund. The Board discussed the allocation of fees between Rational and the sub-advisors of these Funds relative to Rational’s duties and other factors. The Board concluded that the allocation of fees between Rational and each sub-advisor was appropriate.
Profitability. The Board reviewed a report from Rational analyzing the firm’s profitability with respect to its relationship with each Renewal Fund. The Board noted that the report showed that Rational had realized a loss in connection with its relationship with each of the Equity Armor Fund, Dynamic Brands Fund, and Strategic Allocation Fund. After further discussion, the Board concluded that the level of Rational’s profitability with respect to each Renewal Fund did not raise any concerns.
“Fall-out” Benefits. The Board considered fall-out benefits received by Rational and its affiliates from their relationship with each of the Renewal Funds and the Trust.
Economies of Scale. The Board considered Rational’s statement that it anticipated that each Renewal Fund would benefit from economies of scale when it reached approximately $200 million in net assets. The Board noted that the Management Agreement did not contain breakpoints that reduce the fee rate on assets above specified levels. The Board agreed that establishing management fee breakpoints might be an appropriate way for Rational to share its economies of scale as assets of the Renewal Funds increased. The Board determined, after further discussion, that economies of scale had not been reached and agreed that the matter of economies of scale would be revisited as the Renewal Funds’ assets materially increased.
Conclusion. The Board considered many factors, and no single factor was determinative to the decision of the Board concerning the renewal of the Management Agreement. Having requested, reviewed, and discussed in depth such information from Rational as the Board believed to be reasonably necessary to evaluate the terms of the Management Agreement, and as assisted by the advice of counsel, the Board concluded that renewal of the Management Agreement was in the best interest of each Renewal Fund and its shareholders.
| RATIONAL FUNDS | |
| SUPPLEMENTAL INFORMATION (Unaudited) (Continued) |
| December 31, 2020 | ANNUAL REPORT |
Consideration and Renewal of Sub-Advisory Agreement between Rational Advisors, Inc. and Warrington Asset Management, LLC with respect to Rational Tactical Return Fund, December 11, 2020
In connection with a telephonic meeting held on December 11, 20201, the Board of Trustees (the “Board” or the “Trustees”) of Mutual Fund and Variable Insurance Trust (the “Trust”), including a majority of the Trustees who are not “interested persons,” as that term is defined in the Investment Company Act of 1940, as amended, of the Trust, discussed the renewal of the sub-advisory agreement between Rational Advisors, Inc. (“Rational”) and Warrington Asset Management, LLC (“Warrington”) with respect to Rational Tactical Return Fund (the “Fund”), a series of the Trust (the “Warrington Sub-Advisory Agreement”).
The Board was assisted by legal counsel throughout the review process. The Board relied upon the advice of legal counsel and its own business judgment in evaluating the Warrington Sub -Advisory Agreement and the weight to be given to each factor considered. The conclusions reached by the Board were based upon a comprehensive evaluation and discussion of all the information provided and were not the result of any one factor. Moreover, each Trustee might have afforded different weight to the various factors in reaching his conclusions with respect to the Warrington Sub-Advisory Agreement. In connection with its deliberations regarding approval of the Warrington Sub-Advisory Agreement, the Board reviewed materials prepared by Warrington (the “Warrington 15(c) Response”) and Rational. The Board also considered the information presented at Board meetings throughout the year, and particularly at the September 18, 2020 Board meeting in which Warrington had participated. At the September 18, 2020 Board meeting, the Board had reviewed the Warrington 15(c) Response and considered the factors discussed below.
Nature, Extent, and Quality of Services. The Board reviewed the nature, extent and quality of services provided by the investment professionals at Warrington. The Board reviewed information concerning Warrington’s financial condition and resources, personnel, business operations, and compliance program. The Board considered that Warrington managed the Tactical Return Fund’s portfolio in accordance with its principal strategies in seeking to achieve the Fund’s investment objective. The Board reviewed a copy of Warrington’s Form ADV. After further discussion and review of the Warrington 15(c) Response, the Board concluded that Warrington would continue to provide an acceptable level of services to the Fund.
Performance. The Board reviewed the performance of the Tactical Return Fund relative to its peer group, the Morningstar Options-Based and Managed Futures categories, and the S&P 500 TR Index for various periods ended September 30, 2020. The Board considered that the Fund had outperformed the Morningstar Options-Based category for the three- and five-year periods and underperformed the category for the one- and ten-year periods; outperformed the peer group and Morningstar Managed Futures category for the one-, three-, five-, and ten-year periods; and underperformed the S&P 500 TR Index for the one-, three-, five-, and ten-year periods. The Board also considered information in the Warrington 15(c) Response initially reviewed at the September 18, 2020 Board meeting regarding the performance and volatility of the Fund’s investment strategy relative to the S&P 500 Total Return Index and noted that the Fund historically has performed well during times of market volatility over the three years ended June 30, 2020. The Board recalled discussions regarding Fund performance in prior Board meetings. The Board determined that the Fund’s performance was acceptable.
Fees and Expenses. The Board considered that the sub -advisory fees paid to Warrington with respect to the Tactical Return Fund were paid entirely by Rational. The Board noted that the sub-advisory fees payable to Warrington, 50% of the 1.75% fee charged by Rational, were lower than the fees that Warrington charged to separately managed accounts following a similar strategy. The Board noted that with the contractual expense cap in place, Rational and Warrington were waiving a portion of their fees. After further discussion, the Board concluded that the sub-advisory fees payable to Warrington with respect to the Fund were reasonable.
| RATIONAL FUNDS | |
| SUPPLEMENTAL INFORMATION (Unaudited) (Continued) |
| December 31, 2020 | ANNUAL REPORT |
The Board considered the respective duties of Rational and Warrington and analyzed how fees were allocated between Warrington and Rational. After consideration and discussion, the Board concluded that the Fund’s investment management fees were allocated appropriately between Warrington and Rational.
Profitability. The Board reviewed a profitability analysis provided by Warrington with respect to the Tactical Return Fund and noted that Warrington operated the Fund at a net profit. After further discussion, the Board concluded that the level of Warrington’s profitability with respect to the Fund did not raise any concerns.
“Fall-out” Benefits. The Board considered fall-out benefits received by Warrington from its relationship with the Tactical Return Fund and the Trust.
Economies of Scale. The Board agreed that economies of scale are primarily an advisor-level issue and should be considered with respect to the overall advisory contract, taking into consideration the impact of the sub-advisory expense.
Conclusion. The Board considered many factors, and no single factor was determinative to the decision of the Board concerning the renewal of the Warrington Sub-Advisory Agreement. Having requested, reviewed, and discussed in depth such information from Warrington as the Board believed to be reasonably necessary to evaluate the terms of the Warrington Sub-Advisory Agreement, and as assisted by the advice of counsel, the Board concluded that renewal of the Warrington Sub-Advisory Agreement was in the best interest of the Tactical Return Fund and its shareholders.
| RATIONAL FUNDS | |
| SUPPLEMENTAL INFORMATION (Unaudited) (Continued) |
| December 31, 2020 | ANNUAL REPORT |
Consideration and Renewal of Sub-Advisory Agreement between Rational Advisors, Inc. and Accuvest Global Advisors with respect to Rational Dynamic Brands Fund, December 11, 2020
In connection with a telephonic meeting held on December 11, 20201, the Board of Trustees (the “Board” or the “Trustees”) of Mutual Fund and Variable Insurance Trust (the “Trust”), including a majority of the Trustees who are not “interested persons,” as that term is defined in the Investment Company Act of 1940, as amended, of the Trust, discussed the renewal of the sub-advisory agreement between Rational Advisors, Inc. (“Rational”) and Accuvest Global Advisors (“Accuvest”) with respect to Rational Dynamic Brands Fund (the “Fund”), a series of the Trust (the “Accuvest Sub-Advisory Agreement”).
The Board was assisted by legal counsel throughout the review process. The Board relied upon the advice of legal counsel and its own business judgment in evaluating the Accuvest Sub-Advisory Agreement and the weight to be given to each factor considered. The conclusions reached by the Board were based upon a comprehensive evaluation and discussion of all the information provided and were not the result of any one factor. Moreover, each Trustee might have afforded different weight to the various factors in reaching his conclusions with respect to the Accuvest Sub-Advisory Agreement. In connection with its deliberations regarding approval of the Accuvest Sub-Advisory Agreement, the Board reviewed materials prepared by Accuvest (the “Accuvest 15(c) Response”) and Rational. The Board also considered the information presented at Board meetings throughout the year, and particularly at the September 18, 2020 Board meeting in which Accuvest had participated. At the September 18, 2020 Board meeting, the Board had reviewed the Accuvest 15(c) Response and considered the factors discussed below.
Nature, Extent and Quality of Services. The Board reviewed the nature, extent and quality of services provided by the investment professionals at Accuvest. The Board reviewed information concerning Accuvest’s financial condition and resources, personnel, business operations, and compliance program. The Board considered that Accuvest managed the Dynamic Brands Fund’s portfolio in accordance with its principal strategies in seeking to achieve the Fund’s investment objective. The Board reviewed a copy of Accuvest’s Form ADV. After further discussion and review of the Accuvest 15(c) Response, the Board concluded that Accuvest would continue to provide an acceptable level of services to the Fund.
Performance. The Board reviewed the performance of the Dynamic Brands Fund relative to its peer group, the Morningstar Large Growth category, and the S&P 500 TR Index for various periods ended September 30, 2020. The Board considered that the Fund had outperformed the peer group for the one-, three-, five-, and ten-year periods; outperformed the Morningstar Large Growth category for the one- and three-year periods and underperformed the category for the five- and ten -year periods; outperformed the S&P 500 TR Index for the one-, three-, and five-year periods, and underperformed the S&P 500 TR Index for the ten-year period. The Board considered that the Fund had outperformed S&P 500 TR Index from October 2017, when Accuvest began managing the Fund, through September 30, 2020. The Board also considered information in the Accuvest 15(c) Response initially reviewed at the September 18, 2020 Board meeting regarding the performance of the Fund and noted that the Fund had outperformed the S&P 500 Total Return Index since the Fund’s transition to Accuvest on October 17, 2017 through August 1, 2020. After further discussion, the Board determined that the Fund’s performance was acceptable.
Fees and Expenses. The Board considered that the sub-advisory fees paid to Accuvest with respect to the Dynamic Brands Fund were paid entirely by Rational. The Board noted that the sub-advisory fees payable to Accuvest, 50% of the fee charged by Rational, were lower than the fees that Accuvest charged to other funds and separately managed accounts following a similar strategy. The Board noted that with the contractual expense cap in place, Rational and Accuvest were waiving a portion of their fees. After further discussion, the Board concluded that the sub-advisory fees were reasonable.
| RATIONAL FUNDS | |
| SUPPLEMENTAL INFORMATION (Unaudited) (Continued) | |
| December 31, 2020 | ANNUAL REPORT |
The Board considered the respective duties of Rational and Accuvest and analyzed how fees were allocated between Accuvest and Rational. After consideration and discussion, the Board concluded that the Fund’s investment management fees were allocated appropriately between Accuvest and Rational.
Profitability. The Board reviewed a profitability analysis provided by Accuvest with respect to the Dynamic Brands Fund and noted that Accuvest was operating the Fund at a net profit. After further discussion, the Board concluded that the level of Accuvest’s profitability with respect to the Fund did not raise any concerns.
“Fall-out” Benefits. The Board considered fall-out benefits received by Accuvest from its relationship with the Dynamic Brands Fund and the Trust.
Economies of Scale. The Board agreed that economies of scale are primarily an advisor-level issue and should be considered with respect to the overall advisory contract, taking into consideration the impact of the sub-advisory expense.
Conclusion. The Board considered many factors, and no single factor was determinative to the decision of the Board concerning the renewal of the Accuvest Sub -Advisory Agreement. Having requested, reviewed and discussed in depth such information from Accuvest as the Board believed to be reasonably necessary to evaluate the terms of the Accuvest Sub-Advisory Agreement, and as assisted by the advice of counsel, the Board concluded that renewal of the Accuvest Sub-Advisory Agreement was in the best interest of the Dynamic Brands Fund and its shareholders.
| RATIONAL FUNDS | |
| SUPPLEMENTAL INFORMATION (Unaudited) (Continued) |
| December 31, 2020 | ANNUAL REPORT |
Consideration and Renewal of Sub-Advisory Agreement between Rational Advisors, Inc. and Warrington Asset Management, LLC with respect to Rational Tactical Return Fund, September 18, 2020
In connection with a telephonic meeting held on September 18, 2020, the Board of Trustees (the “Board” or the “Trustees”) of Mutual Fund and Variable Insurance Trust (the “Trust”), including a majority of the Trustees who are not “interested persons,” as that term is defined in the Investment Company Act of 1940, as amended, of the Trust, discussed the renewal of the sub-advisory agreement between Rational Advisors, Inc. (“Rational”) and Warrington Asset Management, LLC (“Warrington”) with respect to Rational Tactical Return Fund (the “Fund”), a series of the Trust (the “Sub-Advisory Agreement”).
The Board was assisted by legal counsel throughout the review process. The Board relied upon the advice of legal counsel and its own business judgment in evaluating the Sub-Advisory Agreement and the weight to be given to each factor considered. The conclusions reached by the Board were based upon a comprehensive evaluation and discussion of all the information provided and were not the result of any one factor. Moreover, each Trustee might have afforded different weight to the various factors in reaching his conclusions with respect to the Agreement. In connection with its deliberations regarding approval of the Sub-Advisory Agreement, the Board reviewed materials prepared by Warrington (the “Warrington 15(c) Response”). The Board also considered the information presented at Board meetings throughout the year.
Nature, Extent and Quality of Services. The Board reviewed the nature, extent and quality of services provided by the investment professionals at Warrington. It reviewed information concerning Warrington’s financial condition and resources, personnel, business operations, and compliance program. The Board considered that Warrington managed the Fund’s portfolio in accordance with its principal strategies in seeking to achieve the Fund’s investment objective. The Board reviewed a copy of Warrington’s Form ADV. After further discussion and review of the Warrington 15(c) Response, the Board concluded that Warrington would continue to provide an acceptable level of services to the Fund.
Performance. The Board reviewed information provided by Warrington regarding the performance and volatility of the Fund’s investment strategy relative to the S&P 500 Total Return Index and noted that the Fund historically has performed well during times of market volatility over the past three years. The Board recalled discussions regarding Fund performance earlier in the meeting. The Board determined that the Fund’s performance under Warrington’s management was acceptable.
Fees and Expenses. The Board noted that the sub-advisory fee payable to Warrington, 50% of the 1.75% management fee charged by Rational, was lower than fees that Warrington charged to separately managed accounts following a similar strategy. After further discussion, the Board concluded the sub-advisory fee payable to Warrington with respect to the Fund was reasonable.
The Board considered the respective duties of Rational and Warrington and analyzed how fees were allocated between Warrington and Rational. After consideration and discussion, the Board decided that the Fund’s investment management fees were allocated appropriately between Warrington and Rational.
Profitability. The Board reviewed a profitability analysis provided by Warrington relevant to the Fund and noted that Warrington realized a profit from its management of the Fund. After further discussion, the Board concluded that Warrington’s profitability with respect to its management of the Fund was reasonable and not excessive.
“Fall-out” Benefits. The Board considered the fall-out benefits that Warrington received from its relationship with the Fund and the Trust.
Economies of Scale. The Board noted that economies of scale was primarily an advisor-level issue and should be considered with respect to the overall advisory contract, taking into consideration the impact of the sub-advisory expense.
Conclusion. The Board considered many factors, and no single factor was determinative to the decision of the Board concerning the renewal of the Sub-Advisory Agreement. Having received and reviewed with in depth discussion such
| RATIONAL FUNDS | |
| SUPPLEMENTAL INFORMATION (Unaudited) (Continued) |
| December 31, 2020 | ANNUAL REPORT |
information from Warrington as the Board believed to be reasonably necessary to evaluate the terms of the Agreement, and as assisted by the advice of counsel, the Board concluded that the renewal of the Agreement was in the best interests of the Fund and its shareholders.
| RATIONAL FUNDS | |
| SUPPLEMENTAL INFORMATION (Unaudited) (Continued) |
| December 31, 2020 | ANNUAL REPORT |
Consideration and Renewal of Sub-Advisory Agreement between Rational Advisors, Inc. and Accuvest Global Advisors, LLC with respect to Rational Dynamic Brands Fund, September 18, 2020
In connection with a telephonic meeting held on September 18, 2020, the Board of Trustees (the “Board” or the “Trustees”) of Mutual Fund and Variable Insurance Trust (the “Trust”), including a majority of the Trustees who are not “interested persons,” as that term is defined in the Investment Company Act of 1940, as amended, of the Trust, discussed the renewal of the sub-advisory agreement between Rational Advisors, Inc. (“Rational”) and Accuvest Global Advisors, LLC (“Accuvest”) with respect to Rational Dynamic Brands Fund (the “Fund”), a series of the Trust (the “Sub-Advisory Agreement”).
The Board was assisted by legal counsel throughout the review process. The Board relied upon the advice of legal counsel and its own business judgment in evaluating the Sub-Advisory Agreement and the weight to be given to each factor considered. The conclusions reached by the Board were based upon a comprehensive evaluation and discussion of all the information provided and were not the result of any one factor. Moreover, each Trustee might have afforded different weight to the various factors in reaching his conclusions with respect to the Sub-Advisory Agreement. In connection with its deliberations regarding approval of the Sub-Advisory Agreement, the Board reviewed materials prepared by Accuvest. The Board also considered the information presented at Board meetings throughout the year.
Nature, Extent and Quality of Services. The Board reviewed the nature, extent and quality of the services that Accuvest provided to the Fund. They reviewed information concerning the financial condition and resources; personnel, business operations, and compliance program of Accuvest. The Board considered the experience of the investment team and investment strategy employed by Accuvest in managing the Fund. After further discussion, the Board concluded that Accuvest would continue to provide an acceptable level of services to the Fund.
Performance. The Board reviewed the performance of Fund and noted that the Fund had outperformed the S&P 500 Total Return Index since the Fund’s transition to Accuvest on October 17, 2017 through August 1, 2020. The Board determined that the Fund’s performance under Accuvest’s management was acceptable.
Fees and Expenses. The Board noted that the sub-advisory fee payable to Accuvest, 50% of the 0.75% management fee charged by Rational, was lower than fees that Accuvest charged to separately managed accounts following a similar strategy. The Board determined that this fee was appropriate for the services provided. After further discussion, the Board concluded that the sub-advisory fee payable to Accuvest with respect to the Fund was reasonable.
The Board considered the respective duties of Rational and Accuvest and analyzed how fees were allocated between Accuvest and Rational. After consideration and discussion, the Board decided that the Fund’s investment management fees were allocated appropriately between Accuvest and Rational.
Profitability. The Board reviewed a profitability analysis provided by Accuvest relevant to the Fund and noted that Accuvest realized a profit from its management of the Fund. After further discussion, the Board concluded that Accuvest’s profitability with respect to its management of the Fund was reasonable and not excessive.
“Fall-out” Benefits. The Board considered the fall-out benefits that Accuvest received from its relationship with the Fund and the Trust.
Economies of Scale. The Board noted that economies of scale was primarily an advisor-level issue and should be considered with respect to the overall advisory contract, taking into consideration the impact of the sub-advisory expense.
| RATIONAL FUNDS | |
| SUPPLEMENTAL INFORMATION (Unaudited) (Continued) |
| December 31, 2020 | ANNUAL REPORT |
Conclusion. The Board considered many factors, and no single factor was determinative to the decision of the Board concerning the renewal of the Sub-Advisory Agreement. Having received and reviewed with in depth discussion such information from Accuvest as the Board believed to be reasonably necessary to evaluate the terms of the Sub-Advisory Agreement, and as assisted by the advice of counsel, the Board concluded that the renewal of the Sub-Advisory Agreement was in the best interests of the Fund and its shareholders.
| RATIONAL FUNDS | |
| SUPPLEMENTAL INFORMATION (Unaudited) (Continued) |
| December 31, 2020 | ANNUAL REPORT |
Consideration and Approval of New Sub-Advisory Agreement between Rational Advisors, Inc. and ReSolve Asset Management Inc. with respect to Rational/ReSolve Adaptive Asset Allocation Fund, March 20 and 27, 2020 and August 21, 2020
In connection with telephonic meetings held on March 20 and 27, 2020 and August 21, 2020, the Board of Trustees (the “Board” or the “Trustees”) of Mutual Fund and Variable Insurance Trust (the “Trust”), including a majority of the Trustees who are not “interested persons,” as that term is defined in the Investment Company Act of 1940, as amended, of the Trust, discussed the approval of a new sub-advisory agreement between Rational Advisors, Inc. (“Rational”) and ReSolve Asset Management Inc. with respect to Rational/ReSolve Adaptive Asset Allocation Fund (the “Fund”), a series of the Trust (the “New ReSolve Sub-Advisory Agreement”). The proposed approval of the ReSolve Sub-Advisory Agreement resulted from the anticipated assignment and automatic termination of the then-current sub-advisory agreement with ReSolve (the “Prior ReSolve Sub-Advisory Agreement”) resulting from a change in ReSolve’s ownership and control that was expected to take place on October 1, 2020 (the “Change of Control”).
The Board was assisted by legal counsel throughout the review process. The Board relied upon the advice of legal counsel and its own business judgment in evaluating the ReSolve Sub-Advisory Agreement and the weight to be given to each factor considered. The conclusions reached by the Board were based upon a comprehensive evaluation and discussion of all the information provided and were not the result of any one factor. Moreover, each Trustee might have afforded different weight to the various factors in reaching his conclusions with respect to the New ReSolve Sub-Advisory Agreement. In connection with its deliberations regarding approval of the New ReSolve Sub-Advisory Agreement, the Board reviewed materials prepared by ReSolve (the “ReSolve 15(c) Response”) and Rational. The Board also considered its review of the Prior ReSolve Sub-Advisory Agreement at its meeting on December 19, 2019. The Board also considered the information presented at Board meetings throughout the year.
The following discussion summarizes the factors that the Board reviewed at its December 19, 2019 meeting regarding the Prior ReSolve Sub-Advisory Agreement, and the conclusions reached regarding that Agreement, which discussion and conclusions also apply to the New ReSolve Sub-Advisory Agreement.
Nature, Extent, and Quality of Services. The Trustees discussed the services that ReSolve provided to the Fund under the Prior ReSolve Sub -Advisory Agreement and would provide under the New ReSolve Sub -Advisory Agreement. The Trustees reviewed information concerning the background and experience of the portfolio management and other personnel who provide and would continue to provide services to the Fund, as well as information concerning ReSolve’s financial condition and resources, business, operations, and compliance capabilities. The Board considered the consistency in sub-advisor personnel and acknowledged the many years of expertise of the management team. The Trustees noted that ReSolve had reported no material compliance or regulatory matters. After discussion, the Trustees concluded that ReSolve had good quality and depth of personnel, resources and investment methods essential to performing its duties under the New ReSolve Sub -Advisory Agreement and that the nature, overall quality and extent of the management services provided to the Fund by ReSolve were satisfactory.
Performance. The Trustees noted that for the 1-, 3-, and 5-year periods ended September 30, 2019, the Fund outperformed the average performance of its peer group and Morningstar categories: Managed Futures and Tactical Allocation. The Board also noted that the Fund outperformed its peer group and the Managed Futures category for the 10-year period ended September 30, 2019, but underperformed the Tactical Allocation category for that period. The Trustees discussed the criteria used by Rational for selecting the peer group. The Board also compared the Fund’s performance against its benchmark indices, noting that the Fund outperformed the BofAML 3 Month Treasury Bill Index and Barclays CTA Index for all periods, and outperformed the S&P 500 TR Index for the 1-year period, but underperformed the S&P 500 TR Index for the 3-, 5-, and 10-year periods. Rational reported that since March 1, 2018, when ReSolve commenced serving as sub -advisor to the Fund, the Fund has returned 6.52% annualized versus 8.14% for the S&P 500 TR Index and 3.35% for the Barclays CTA Index.
The Trustees also reviewed performance information for a composite of similarly managed separate accounts for periods ended September 30, 2019 and noted that the composite outperformed its benchmark, the Global Balanced Portfolio, for the 1- and 3-year periods and since the inception of the composite.
| RATIONAL FUNDS | |
| SUPPLEMENTAL INFORMATION (Unaudited) (Continued) |
| December 31, 2020 | ANNUAL REPORT |
Fees and Expenses. The Trustees considered that the sub-advisory fees payable to ReSolve pursuant to the New ReSolve Sub-Advisory Agreement would be entirely paid by Rational and would be the same as under the Prior ReSolve Sub-Advisory Agreement. The Trustees noted that ReSolve received 50% of the net advisory fee and noted that the fee was lower than the fees that ReSolve received for managing other accounts. The Board discussed the Fund’s strategy and determined that the sub-advisory fee was reasonable for the investment services provided.
Profitability. The Trustees reviewed information regarding the profitability to ReSolve of managing the Fund.
“Fall-out” Benefits. The Trustees considered fall-out benefits received by ReSolve and its affiliates from their relationship with the Fund and the Trust.
Economies of Scale. The Trustees agreed that economies of scale are primarily an advisor-level issue and should be considered with respect to the overall advisory contract, taking into consideration the impact of the sub-advisory expense.
Conclusion. No single factor was determinative to the decision of the Trustees. Having requested, reviewed and discussed in depth such information relating to ReSolve as the Trustees believed to be reasonably necessary to evaluate the terms of the New ReSolve Sub -Advisory Agreement, and as assisted by the advice of counsel, the Trustees concluded that approval of the New ReSolve Sub-Advisory Agreement was in the best interests of the Fund and its shareholders.
In addition, at its meetings on March 20-27, 2020 and August 21, 2020, the Board and representatives of ReSolve discussed the Change of Control. The Board reviewed information provided by ReSolve regarding the firm’s beneficial owners after the Change of Control and their involvement in the day-to-day management of the firm, if any. The Board and ReSolve also discussed the nature and quality of the services that ReSolve would provide to the Fund after the Change of Control, and ReSolve informed the Board that Adam Butler and Rodrigo Gordillo would remain jointly and primarily responsible for the day-to-day management of the Fund’s portfolio as employees of ReSolve, and that there would be no material changes to the nature and quality of the sub-advisory services that ReSolve would provide.
| RATIONAL FUNDS |
| LIQUIDITY RISK MANAGEMENT PROGRAM (Unaudited) |
| December 31, 2020 |
The Funds have adopted and implemented a written liquidity risk management program as required by Rule 22e-4 (the “Liquidity Rule”) under the Investment Company Act. The program is reasonably designed to assess and manage each Fund’s liquidity risk, taking into consideration, among other factors, the respective Fund’s investment strategy and the liquidity of its portfolio investments during normal and reasonably foreseeable stressed conditions; its short and long-term cash flow projections; and its cash holdings and access to other funding sources.
During the fiscal year ended December 31, 2020, the Trust’s Liquidity Risk Management Program Committee (the “Committee”) reviewed each Fund’s investments and determined that the Funds held adequate levels of cash and highly liquid investments to meet shareholder redemption activities in accordance with applicable requirements. Accordingly, the Committee concluded that (i) the Funds’ liquidity risk management program is reasonably designed to prevent violations of the Liquidity Rule and (ii) the Funds’ liquidity risk management program has been effectively implemented.
| RATIONAL FUNDS | |
| Boards of Trustees and Trust Officers (Unaudited) |
| December 31, 2020 | ANNUAL REPORT |
Independent Trustees Background
Name,
Address and
Year of Birth | Position with
the Trust | Term of
Office and
Length of
Time Served* | Principal Occupation(s)
During Past 5 Years | Number of
Portfolios in
Fund
Complex
Overseen by
Trustee** | Other Directorships
Held During Past 5 Years |
Tobias Caldwell
Year of Birth: 1967 | Chairman of the Board and Trustee | Since 2016 | Managing Member, Genovese Family Enterprises, LLC (real estate firm), since 1999; Managing member, PTL Real Estate, LLC (real estate/investment firm), since 2000; Managing member, Bear Properties, LLC (real estate firm), since 2006. | 52 | Chairman of the Board, Strategy Shares, since 2016; Lead Independent Trustee and Chair of Audit Committee, Mutual Fund Series Trust, since 2006; Independent Trustee and Chair of Audit Committee, Variable Insurance Trust, since 2010; Trustee, M3Sixty Trust,since 2016; Chairman of the Board, AlphaCentric Prime Meridian Income Fund, since 2018. |
Stephen P. Lachenauer
Year of Birth: 1967 | Chair of the Audit, Risk and Compliance, and Investment Committees, and Trustee | Chair of the Audit and Risk and Compliance Committees, since 2016; Chair of the Investment Committee, since 11/2020. | Attorney, private practice, since 2011. | 14 | Trustee and Chair of the Audit, Risk and Compliance, and Investment Committees, ,since 2016, and Chair of the Investment Committee, Strategy Shares, since 11/2020; Trustee, TCG Financial Series Trusts I-X, since 2015; Trustee and Chair of the Audit and Risk and Compliance Committees, since 2018, and Chair of the Investment Committee, since 11/2020, AlphaCentric Prime Meridian Income Fund. |
Donald McIntosh
Year of Birth: 1967 | Trustee | Since 2016 | Credit risk review analyst, Santander Holdings USA, since 2015; Governance analyst, Santander Bank, 2011 – 2015. | 14 | Trustee, Strategy Shares, since 2016; Trustee, TCG Financial Series Trusts I-X, since 2015; Trustee, AlphaCentric Prime Meridian Income Fund,since 2018. |
| * | The term of office of each Trustee is indefinite. |
| ** | The “Fund Complex” includes the Trust, Strategy Shares, Mutual Fund Series Trust, Variable Insurance Trust, AlphaCentric Prime Meridian Income Fund and the TCG Financial Series Trusts I-X, each a registered investment company. |
| RATIONAL FUNDS | |
| Boards of Trustees and Trust Officers (Unaudited) (Continued) |
| December 31, 2020 | ANNUAL REPORT |
Officers
Name, Address,
Year of Birth | Position(s)
Held
with Registrant | Term and
Length
Served* | Principal Occupation(s)
During Past 5 Years |
Jerry Szilagyi
53 Palmeras St. Suite 601
San Juan, PR 00901
Year of Birth: 1962 | President | Since 2016 | President, Rational Advisors, Inc., since 2016; Chief Executive Officer, Catalyst Capital Advisors LLC, since 2006; Member, AlphaCentric Advisors LLC, since 2014; Managing Member, MFund Distributors LLC, since 2012; Managing Member, MFund Services LLC, since 2012; President, Abbington Capital Group LLC, since 1998; CEO, Catalyst Capital International, LLC, since 2017; President, USA Mutuals, Inc., 2011 to 7/2016; President, Cross Sound LLC, 2011 – 2016; CEO, Catalyst International Advisors LLC, since 2019; CEO, Insights Media LLC, since 2019; CEO, MFund Management LLC, since 2019. |
| | | | |
Erik Naviloff
4221 North 203rd Street,
Suite 100
Elkhorn, Nebraska, 68022
Year of Birth: 1968 | Treasurer | Since 2016 | Vice President – Fund Administration, Gemini Fund Services, LLC, since 2012. |
| | | | |
Aaron Smith
4221 North 203rd Street,
Suite 100
Elkhorn, Nebraska, 68022
Year of Birth: 1974 | Assistant
Treasurer | Since 2016 | Manager -Fund Administration, Gemini Fund Services, LLC, since 2012. |
| | | | |
Frederick J. Schmidt
Year of Birth: 1959 | Chief
Compliance
Officer | Since 2016 | Director, MFund Services LLC since 5/2015. |
| | | | |
Jennifer A. Bailey
Year of Birth: 1968 | Secretary | Since 2016 | Director of Legal Services, MFund Services LLC, since 2012. |
| | | | |
Michael Schoonover
53 Palmeras St. Suite 601
San Juan, PR 00901
Year of Birth: 1983 | Vice President | Since 2018 | Chief Operating Officer, Catalyst Capital Advisors LLC & Rational Advisors, Inc., since 2017; Portfolio Manager, Catalyst Capital Advisors LLC, since 2013; Portfolio Manager, Rational Advisors, Inc. 2016 – 2018; President, MFund Distributors LLC, since 2020; COO, Catalyst International Advisors LLC, since 2019; COO, Insights Media LLC, since 2019; COO, MFund Management LLC, since 2019;COO, AlphaCentric Advisors LLC, since 1/2021. |
PRIVACY NOTICE
Mutual Fund & Variable Insurance Trust
Rev. July 2017
| FACTS | WHAT DOES MUTUAL FUND & VARIABLE INSURANCE TRUST DO WITH YOUR PERSONAL INFORMATION? |
| Why? | Financial companies choose how they share your personal information. Federal law gives consumers the right to limit some, but not all sharing. Federal law also requires us to tell you how we collect, share, and protect your personal information. Please read this notice carefully to understand what we do. |
| What? | The types of personal information we collect and share depends on the product or service that you have with us. This information can include: ● Social Security number and wire transfer instructions ● account transactions and transaction history ● investment experience and purchase history When you are no longer our customer, we continue to share your information as described in this notice. |
| How? | All financial companies need to share customers’ personal information to run their everyday business. In the section below, we list the reasons financial companies can share their customers’ personal information; the reasons Mutual Fund & Variable Insurance Trust chooses to share; and whether you can limit this sharing. |
Reasons we can share your
personal information: | Does Mutual Fund &
Variable Insurance Trust
share information? | Can you limit this
sharing? |
| For our everyday business purposes - such as to process your transactions, maintain your account(s), respond to court orders and legal investigations, or report to credit bureaus. | YES | NO |
| For our marketing purposes - to offer our products and services to you. | NO | We don’t share |
| For joint marketing with other financial companies. | NO | We don’t share |
| For our affiliates’ everyday business purposes - information about your transactions and records. | NO | We don’t share |
| For our affiliates’ everyday business purposes - information about your credit worthiness. | NO | We don’t share |
| For our affiliates to market to you | NO | We don’t share |
| For non-affiliates to market to you | NO | We don’t share |
| QUESTIONS? | Call 1-800-253-0412 |
PRIVACY NOTICE
Mutual Fund & Variable Insurance Trust
| What we do: |
How does Mutual Fund & Variable Insurance Trust protect my personal information? | To protect your personal information from unauthorized access and use, we use security measures that comply with federal law. These measures include computer safeguards and secured files and buildings. Our service providers are held accountable for adhering to strict policies and procedures to prevent any misuse of your nonpublic personal information. |
How does Mutual Fund & Variable Insurance Trust collect my personal information? | We collect your personal information, for example, when you: ● open an account or deposit money ● direct us to buy securities or direct us to sell your securities ● seek advice about your investments We also collect your personal information from others, such as credit bureaus, affiliates, or other companies. |
Why can’t I limit all sharing? | Federal law gives you the right to limit only: ● sharing for affiliates’ everyday business purposes – information about your creditworthiness. ● affiliates from using your information to market to you. ● sharing for non-affiliates to market to you. State laws and individual companies may give you additional rights to limit sharing. |
| Definitions |
| Affiliates | Companies related by common ownership or control. They can be financial and non-financial companies. ● Mutual Fund & Variable Insurance Trust does not share with affiliates. |
| Non-affiliates | Companies not related by common ownership or control. They can be financial and non-financial companies. ● Mutual Fund & Variable Insurance Trust doesn’t share with non-affiliates so they can market to you. |
| Joint marketing | A formal agreement between nonaffiliated financial companies that together market financial products or services to you. ● Mutual Fund & Variable Insurance Trust doesn’t jointly market. |
A copy of the policies and procedures that the Funds use to determine how to vote proxies relating to securities held in the Funds’ portfolios, as well as a record of how the Funds voted any such proxies during the most recent 12-month period ended June 30, is available without charge and upon request by calling 800-253-0412. This information is also available from the EDGAR database on the SEC’s website at www.sec.gov.
The Funds file with the SEC a complete schedule of their portfolio holdings, as of the close of the first and third quarters of their fiscal year, on Form N-Port. Prior to April 30, 2020, the Funds made these filings on Form N-Q. These filings are available on the SEC’s website at www.sec.gov. You may also access this information at www.rationalmf.com by selecting “Form N-PORT” or for fillings made prior to April 30, 2020, “Form N-Q.”
Rational Advisors, Inc., serves as Investment Advisor to the Funds.
This report is authorized for distribution to prospective investors only when preceded or accompanied by a prospectus which contains facts concerning the Funds’ objectives and policies, management fees, expenses and other information.
Shareholder Services: 800-253-0412
Rational-A20
(a) The Registrant has, as of the end of the period covered by this report, adopted a code of ethics that applies to the Registrant's principal executive officer, principal financial officer, and principal accounting officer or controller, or persons performing similar functions, regardless of whether these individuals are employed by the Registrant or a third party.
(b) During the period covered by this report, there were no amendments to any provision of the code of ethics.
(c) During the period covered by the report, with respect to the registrant’s code of ethics that applies to its Principal Executive Officer and Principal Financial Officer: there have been no amendments to a provision that relates to any element of the code of ethics definition enumerated in paragraph (b) of this Item 2.
| Item 3. | Audit Committee Financial Expert. |
3(a) The registrant’s board of trustees has determined that the registrant does not have an audit committee financial expert. The audit committee determined that, although none of its members meet the technical definition of an audit committee financial expert, the committee has sufficient financial expertise to adequately perform its duties under the Audit Committee Charter without the addition of a qualified expert.
| Item 4. | Principal Accountant Fees and Services. |
(a) Audit Fees. The aggregate fees billed for each of the last two fiscal years for professional services rendered by the registrant's principal accountant for the audit of the registrant's annual financial statements or services that are normally provided by the accountant in connection with statutory and regulatory filings or engagements for those fiscal years are as follows:
Fiscal year ended 2020: $80,000
Fiscal year ended 2019: $92,250
(b) Audit-Related Fees. There were no fees billed in each of the last two fiscal years for assurances and related services by the principal accountant that are reasonably related to the performance of the audit of the registrant’s financial statements and are not reported under paragraph (a) of this item.
Fiscal year ended 2020: $0
Fiscal year ended 2019: $0
(c) Tax Fees. The aggregate fees billed in each of the last two fiscal years for professional services rendered by the principal accountant for tax compliance are as follows:
Fiscal year ended 2020: $17,500
Fiscal year ended 2019: $22,500
(d) All other fees billed to the registrant by its principal accountants for the two most recent fiscal years:
Fiscal year ended 2020: $0
Fiscal year ended 2019: $0
(e)(1) The audit committee does not have pre-approval policies and procedures. Instead, the audit committee or audit committee chairman approves on a case-by-case basis each audit or non-audit service before the principal accountant is engaged by the Registrant.
(e)(2) There were no services described in each of paragraphs (b) through (d) of this Item that were approved by the audit committee pursuant to paragraph (c)(7)(i)(C) of Rule 2-01 of Regulation S-X. |
| (f) Not applicable. The percentage of hours expended on the principal accountant's engagement to audit the Registrant's financial statements for the most recent fiscal year that were attributed to work performed by persons other than the principal accountant's full-time, permanent employees was zero percent (0%). |
(g) All non-audit fees billed by the Registrant's principal accountant for services rendered to the Registrant for the fiscal years ended June 30, 2016 and 2015, respectively, are disclosed in (b)-(d) above. There were no audit or non-audit services performed by the Registrant's principal accountant for the Registrant's adviser.
Item 5. | Audit Committee of Listed Registrants.
|
Not applicable.
| Item 6. | Schedule of Investments. |
Included in annual report to shareholders filed under item 1 of this form.
| Item 7. | Disclosure of Proxy Voting Policies and Procedures for Closed-End Management Investment Companies. |
Not applicable.
| Item 8. | Portfolio Managers of Closed-End Management Investment Companies. |
Not applicable.
| Item 9. | Purchases of Equity Securities by Closed-End Management Investment Company and Affiliated Purchasers. |
Not applicable.
| Item 10. | Submission of Matters to a Vote of Security Holders. |
Not applicable.
| Item 11. | Controls and Procedures. |
(a) The registrant’s Principal Executive Officer and Principal Financial Officer, or persons performing similar functions, have concluded that the registrant’s disclosure controls and procedures (as defined in Rule 30a-3(c) under the Act) are effective in design and operation and are sufficient to form the basis of the certifications required by Rule 30a-2 under the Act, based on their evaluation of these disclosure controls and procedures within 90 days of the filing of this report on Form N-CSR.
(b) There were no changes in the registrant’s internal control over financial reporting (as defined in Rule 30a-3(d) under the Act (17 CFR 270.30a-3(d)) that occurred during the second fiscal quarter of the period covered by this report that have materially affected or are reasonably likely to materially affect, the registrant’s internal control over financial reporting.
Item 12. Disclosure of Securities Lending Activities for Closed-Ended Management Investment Companies
Not applicable.
(1) Code of Ethics for Principal Executive and Senior Financial Officers is attached hereto.
(2) Certifications pursuant to Section 302 of the Sarbanes-Oxley Act of 2002 are filed herewith.
(3) Certifications pursuant to Section 906 of the Sarbanes-Oxley Act of 2002 are filed herewith.
SIGNATURES
Pursuant to the requirements of the Securities Exchange Act of 1934 and the Investment Company Act of 1940, the registrant has duly caused this report to be signed on its behalf by the undersigned, thereunto duly authorized.
(Registrant) Mutual Fund and Variable Insurance Trust
| | | |
| By (Signature and Title) | | /s/ Jerry Szilagyi |
| | | Jerry Szilagyi, President and Principal Executive Officer |
| | | | |
| Date | | 3/8/21 | |
| | | | | | |
Pursuant to the requirements of the Securities Exchange Act of 1934 and the Investment Company Act of 1940, this report has been signed below by the following persons on behalf of the registrant and in the capacities and on the dates indicated.
| | | |
| By (Signature and Title) | | /s/ Jerry Szilagyi |
| | | Jerry Szilagyi, President and Principal Executive Officer |
| | | |
| By (Signature and Title) | | /s/ Erik Naviloff |
| | | Erik Naviloff, Treasurer and Principal Financial Officer |
| | | | |
| Date | | 3/8/21 | |
| | | | | | |