UNITED STATES
SECURITIES AND EXCHANGE COMMISSION
Washington, D.C. 20549
FORM N-CSR
CERTIFIED SHAREHOLDER REPORT OF REGISTERED
MANAGEMENT INVESTMENT COMPANIES
Investment Company Act file number 811-05010
Mutual Fund and Variable Insurance Trust
(Exact name of registrant as specified in charter)
36 North New York Avenue
Huntington, NY 11743
(Address of principal executive offices) (Zip code)
The Corporation Trust Company
Corporate Trust Center
1209 Orange Street
Wilmington, DE 19801
(Name and address of agent for service)
Registrant’s telephone number, including area code: 1-631-629-4237
Date of fiscal year end: December 31
Date of reporting period: December 31, 2021
| Item 1. | Reports to Shareholders. |

Annual Shareholder Report
December 31, 2021
INSTITUTIONAL SHARES
CLASS A SHARES
CLASS C SHARES

unaudited
December 31, 2021
Rational Equity Armor Fund
Dear Fellow Shareholders,
The Rational Equity Armor Fund (HDCTX and the “Fund”) seeks total return on investment, with dividend income an important component of that return. The Fund seeks to achieve this goal by investing in two baskets, a long equity portfolio and a volatility hedge overlay. The Fund seeks to achieve its investment objective by investing primarily in common stock of dividend paying companies included within the S&P 500 Index. The Fund also invests a portion of its assets in futures contracts on the Cboe Volatility Index in cash as a hedge against the common stock held in the Fund’s portfolio.
Since the liquidity crisis of 2008, the Fed has made it clear to traders, should the market falter, the Fed would step up with additional stimulus. While this factor, known as the “Fed Put”, creates challenging market conditions for hedged equity funds like HDCTX, where the Fund is invested in stocks and a long volatility hedge, the Fund has managed to provide an attractive risk-adjusted return.
In 2021 we saw volatility and implied volatility, as measured by the VIX, move significantly lower as the Fed pumped liquidity into the markets. 2021 was a year when equities rose on lower volatility. During the year, the Fund was roughly invested 85% in stocks and 12% in our proprietary volatility hedge. Which makes it difficult to match the performance of any equity index or benchmark in a particularly strong year for stocks combined with low volatility. Despite this headwind, we were able to provide our investors double digit returns while taking significantly reduced market risk.
We believe that 2022 will be a challenging year for investors. The Fed is poised to pull back on its bond buying and shrink its balance sheet. We have already seen the 10-year rate rise from 1.35 to 1.80 (+22%) in less than a month. We believe core inflation is running at well above what the Fed has claimed and will continue to stay elevated for the next 12 to 18 months. The Nasdaq Index is trading around a 36 multiple, and the last time inflation was this high, it traded around a 22 multiple. Over 50% of the SPX Index is comprised of Nasdaq stocks and the top 5 stocks in the SPX had a combined +28% return. Valuations are high, market returns are concentrated, and there likely will be no rising tide that lifts all boats in 2022.
Risk managers need to be cognizant of the change 2022 will bring. Low inflation of the past 20 years has given a false sense of security. When inflation is high, the Fed cannot print its way out of a problem. Stock selection, nimble portfolio management, and rebalancing will be key in 2022 as we believe investors will see a return of “normalized volatility” to the markets where macroeconomic factors and good old-fashioned stock valuations and balance-sheet discipline will rule markets again.
We believe the Fund is well positioned to meet the challenges of the year ahead with its hedged investment strategy and experienced management team, which has over 80 years of combined experience in equity and equity derivatives markets. Our CEO, Luke Rahbari, ran the largest options pit by volume in the United States during the 90s Dot.com era. He later ran a large Equity Derivatives desk trading in the multiple billions in notional value. Our CIO, Brian Stutland, was in the CBOE pits when VIX options started trading and was at one time the largest electronic market-maker in the VIX options. Our other portfolio manager, Joe Tigay, started his career with Brian and has traded multiple instruments including the VIX, SPX and NDX to name a few.
We thank you for your trust in us and will strive to continue to deliver outstanding risk adjusted returns to you.
Sincerely,
Joe Tigay
Brian Stutland
Luke Rahbari
The Fund’s total annualized returns through December 31, 2021 as compared to the S&P 500 Value TR Index were as follows:
| | 1 Year | 3 Years | 5 Years | 10 Years | Since
Inception* |
| Institutional Class | 14.52% | 13.88% | 4.97% | 6.78% | 6.01% |
| Class A | 14.11% | 13.61% | 4.71% | 6.51% | 5.75% |
| Class C** | 13.40% | 12.715 | 4.01% | 5.85% | 4.88% |
| Class A w/ Sales Charge | 8.64% | 11.77 | 3.69% | 6.00% | 5.50% |
| S&P 500 Value TR Index (1) | 24.90% | 18.65% | 11.90% | 13.29% | 7.12% |
| ** | Class C Shares commenced operations on January 3, 2014. Returns prior to that date are of the Institutional Shares, adjusted for expenses of Class C Shares. Institutional Shares would have had substantially similar annual returns because the shares are invested in the same portfolio. |
The Fund’s maximum sales charge for Class “A” shares is 4.75%. Investments in mutual funds involve risks. Performance is historic and does not guarantee future results. Investment return and principal value will fluctuate with changing market conditions so that when redeemed, shares may be worth more or less than their original cost. Current performance may be lower or higher than the performance data quoted. To obtain the most recent month- end performance information or the Fund’s prospectus please call the Fund, toll free at 1-800-253-0412. You can also obtain a prospectus at www.RationalMF.com.
This report is intended for the Fund’s shareholders. It may not be distributed to prospective investors unless it is preceded or accompanied by the current Fund prospectus. To obtain a prospectus or other information about the Fund, please visit www.RationalMF.com or call 1-800-253-0412. Please read the prospectus carefully before investing.
| (1) | The S&P 500 Value Total Return Index® (“S&P 500 Value TR”) is an unmanaged market-capitalization weighted index consisting of those stocks within the S&P 500 that exhibit strong value characteristics. It uses a numerical ranking system based on four value factors and three growth factors to determine the constituents and their weightings. The S&P 500 Total Return Index® (“S&P 500 TR”) is an unmanaged index generally representing the performance of the broad domestic economy through changes in the aggregate market value of 500 stocks representing all major industries. Indices are unmanaged and, unlike the Fund, are not affected by cash flows. It is not possible to invest directly in an Index. |
5189-NLD-0128-2022
Rational Equity Armor Fund
PORTFOLIO REVIEW (Unaudited)
December 31, 2021
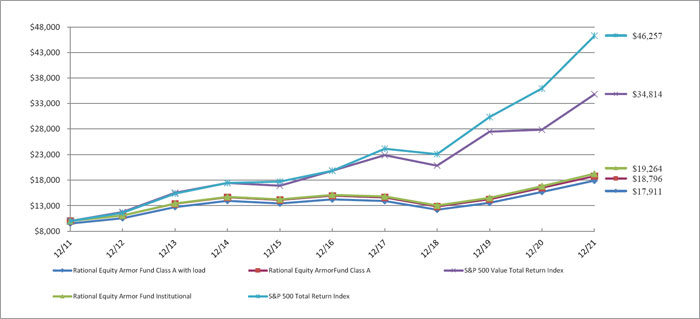
The Fund’s performance figures* for each of the periods ended December 31, 2021, compared to its benchmarks:
| | | Annualized | Annualized | Annualized | Annualized |
| | 1 Year Return | 5 Year Return | 10 Year Return | Since Inception(a) | Since Inception(b) |
| Institutional | 14.52% | 4.97% | 6.78% | 6.01% | N/A |
| Class A | 14.11% | 4.71% | 6.51% | 5.75% | N/A |
| Class A with load | 8.64% | 3.69% | 6.00% | 5.50% | N/A |
| Class C | 13.40% | 4.01% | N/A | N/A | 3.80% |
| S&P 500 Value Total Return Index (c) | 24.90% | 11.90% | 13.29% | 7.12% | 10.73% |
| S&P 500 Total Return Index (d) | 28.71% | 18.47% | 16.55% | 8.78% | 14.92% |
| * | The performance data quoted here represents past performance. Current performance may be lower or higher than the performance data quoted above. Investment return and principal value will fluctuate, so that shares, when redeemed, may be worth more or less than their original cost. The returns shown do not reflect the deduction of taxes that a shareholder would pay on Fund distributions or on the redemptions of Fund shares. Past performance is no guarantee of future results. Performance figures for periods greater than 1 year are annualized. Per the fee table in the Fund’s May 1, 2021 prospectus, the total annual operating expense are 1.33% for Institutional shares, 1.70% for A shares and 2.40% for C shares before fee waivers. See the financial highlights for current expense ratios. For performance information current to the most recent month-end, please call toll-free 1-800-253-0412. Class A shares are subject to a maximum load of 4.75%. |
Performance information for the period prior to December 2019 does not reflect the Fund’s current strategy and the Fund’s portfolio was not managed by the Fund’s current Sub-Advisor.
| (a) | Inception date is March 1, 2001 for Class A, Institutional and the benchmarks. |
| (b) | Inception date is January 3, 2014 for Class C and the benchmarks. |
| (c) | The S&P 500 Value Total Return Index uses a numerical ranking system based on four value factors and three growth factors to determine the constituents and their weightings. Investors cannot invest directly in an Index. |
| (d) | The S&P 500 Total Return Index, a registered trademark of S&P Global., Inc., is a market capitalization-weighted index of 500 widely held common stocks. Investors cannot invest directly in an Index. |
Comparison of the Change in Value of a $10,000 Investment
| Top 10 Holdings by Industry ^ | | % of Net Assets | |
| Banking | | | 10.1 | % |
| Institutional Financial Services | | | 7.0 | % |
| Oil & Gas Producers | | | 6.3 | % |
| Biotech & Pharma | | | 5.8 | % |
| Machinery | | | 5.2 | % |
| Wholesale - Consumer Staples | | | 4.9 | % |
| Food | | | 4.6 | % |
| Home Construction | | | 4.1 | % |
| Reits | | | 4.1 | % |
| Semiconductors | | | 3.9 | % |
| Other/Short-Term Investments | | | 44.0 | % |
| | | | 100.0 | % |
| ^ | Does not include derivatives in which the Fund invests. |
Please refer to the Schedule of Investments for a more detailed breakdown of the Fund’s assets.
unaudited
December 31, 2021
Rational Tactical Return Fund
Dear Fellow Shareholders,
The Rational Tactical Return Fund (the “Fund”) seeks total return consisting of capital appreciation and income by making investments in long and short call and put options on futures contracts on the S&P 500 Index, as well as cash, and cash equivalents. For the year, the Fund posted a +3.94% (Class I) return versus +28.71% for the S&P 500 TR Index (S&P).
Investment Strategy
The Sub Advisor’s strategy seeks to achieve its investment objective in three ways: (1) Premium Collection – the Fund collects premiums on options it sells; (2) Volatility Trading – the Fund may enter into positions designed to hedge or profit from either an increase or a decrease in Index volatility; and (3) Trend Following – the Fund may increase or decrease the balance of puts and calls based on trending market direction. The Fund is designed to produce returns that are not correlated with equity market returns. The Fund employs strict risk management procedures, supported by both technical and fundamental analysis, that are intended to provide consistency of returns and to mitigate the extent of losses.
Fund Performance
The Fund’s stated objective is “to seek total return consisting of capital appreciation and income.” While many will compare the Fund to the S&P, as we trade options on that index, our goal is to have low correlation to that benchmark. In this light, our objective is to provide positive, risk adjusted absolute returns to our investors. When those returns are additionally weighed against the volatility endured to produce such returns, with extremely low standard deviation on a daily, monthly, and yearly timeframe, the Fund has delivered results at the top of its peer group. We also continue to provide excellent downside protection during periods of great stress on the benchmark. For these reasons we believe the Fund has performed well and has met its objective.
In looking at the Morningstar ranking and return data for the category in which the strategy is placed, “Options Trading,” the category is extremely broad with all options traders, many of whom take extreme risk collecting premiums during periods of positive index performance and may at times outperform but suffer in periods of rising volatility. That can be seen when looking at the recent 1 and 3-month performance where the Fund significantly outperformed both the Index and category. When looking at the Morningstar Risk evaluations for the most recent 3-year period, the Fund has provided multiples of Alpha when compared to the index and category. Also, the Fund produced a Sharpe ratio more than double the index and triple the category, at a volatility (Std Dev) of 1.6 vs 7.6 and 9.6 for the index and category.
While the overall market performed well during 2021, under the surface, the characteristics of volatility presented some challenges and opportunities for the Fund. Historically high levels of the volatility of volatility itself (the VVIX) meant that the market would oscillate between low and high volatility levels very quickly. This allowed us to monetize positions on a number of occasions but also led to more frequent hedging of the portfolio. We anticipate this environment to continue and will seek to take advantage of this conditions in the future.
The Fund’s total annualized returns through December 31, 2021 as compared to the S&P 500 TR Index (S&P) benchmark were as follows:
| | 1 Year | 3 Years | Since
12/5/17 | 5 Years | 10 Years | Since
Inception
(05/02/07) * |
| Class I | 3.94% | 4.95% | 6.24% | 5.58% | 1.46% | -0.87% |
| Class A | 3.75% | 4.74% | 6.01% | 5.43% | 1.30% | -1.05% |
| Class C | 2.94% | 3.88% | 5.28% | 4.64% | n/a | 5.15% |
| Class A with Sales Charge | -1.26% | 3.06% | 4.75% | 4.39% | 0.81% | -1.38% |
| S&P 500 Total Return Index (1) | 28.71% | 26.07% | 17.83% | n/a** | n/a** | n/a** |
| * | Inception: 05/02/2007 (Class A & Inst.), 05/31/2016 (Class C). Prior to 12/5/2017, the Rational Tactical Return Fund was named the Rational Real Strategies Fund, which was managed by a different sub-advisor and implemented a different investment strategy. |
| ** | S&P 500 TR Index not relevant to strategy prior to 12/5/2017 strategy change. |
The Fund’s maximum sales charge for Class “A” shares is 4.75%. Investments in mutual funds involve risks. Performance is historic and does not guarantee future results. Investment return and principal value will fluctuate with changing market conditions so that when redeemed, shares may be worth more or less than their original cost. Current performance may be lower or higher than the performance data quoted. To obtain the most recent month- end performance information or the Fund’s prospectus please call the Fund, toll free at 1-800-253-0412. You can also obtain a prospectus at www.RationalMF.com.
Summary
In its fourth full year as the Fund’s Sub Advisor, Warrington has continued to provide strong absolute and relative returns, while consistently managing market risks. The Fund’s assets grew significantly in 2021, and we seek to continue to manage that growth carefully as equity markets have become richly valued in recent months, increasing the likelihood of future market volatility and heightened risk. In volatile markets, Warrington ensures that risk management is paramount, while concurrently evaluating the risk / reward relationship of the opportunities presented by volatile markets.
Sincerely,
Scott Kimple and Mark Adams
Portfolio Managers
This report is intended for the Fund’s shareholders. It may not be distributed to prospective investors unless it is preceded or accompanied by the current Fund prospectus. To obtain a prospectus or other information about the Fund, please visit www.RationalMF.com or call 1-800-253-0412. Please read the prospectus carefully before investing.
| (1) | The S&P 500 Total Return Index by Standard & Poor’s Corp. is a capitalization-weighted index comprising 500 issues listed on various exchanges, representing the performance of the stock market generally. Please note that indices do not take into account any fees and expenses of investing in the individual securities that they track, and individuals cannot invest directly in any index, although individuals may invest in exchange traded funds or other investment vehicles that attempt to track the performance of an index. The Rational Tactical Return Fund may or may not purchase the types of securities represented by the S&P 500 Total Return Index. |
1150-NLD-01272022
Rational Tactical Return Fund
PORTFOLIO REVIEW (Unaudited)
December 31, 2021
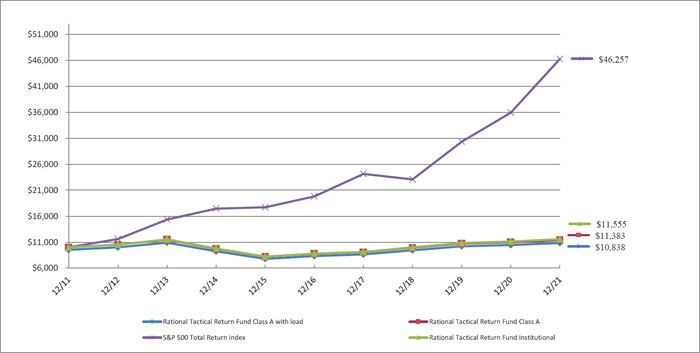
The Fund’s performance figures* for each of the periods ended December 31, 2021, compared to its benchmarks:
| | | Annualized | Annualized | Annualized | Annualized |
| | 1 Year Return | 5 Year Return | 10 Year Return | Since Inception(a) | Since Inception(b) |
| Institutional | 3.94% | 5.58% | 1.46% | (0.87)% | N/A |
| Class A | 3.75% | 5.43% | 1.30% | (1.05)% | N/A |
| Class A with load | (1.26)% | 4.39% | 0.81% | (1.38)% | N/A |
| Class C | 2.94% | 4.64% | N/A | N/A | 5.15% |
| S&P 500 Total Return Index (c) | 28.71% | 18.47% | 16.55% | 10.52% | 18.02% |
| * | The performance data quoted here represents past performance. Current performance may be lower or higher than the performance data quoted above. Investment return and principal value will fluctuate, so that shares, when redeemed, may be worth more or less than their original cost. The returns shown do not reflect the deduction of taxes that a shareholder would pay on Fund distributions or on the redemptions of Fund shares. Past performance is no guarantee of future results. Performance figures for periods greater than 1 year are annualized. Per the fee table in the Fund’s May 1, 2021 prospectus, the total annual operating expense are 2.10% for Institutional Class shares, 2.38% for Class A shares and 3.09% for Class C shares before fee waivers. See the financial highlights for current expense ratios. For performance information current to the most recent month-end, please call toll-free 1-800-253-0412. Class A shares are subject to a maximum load of 4.75%. |
Performance information for the period prior to December 2017 does not reflect the Fund’s current strategy and the Fund’s portfolio was not managed by the Fund’s current Sub-Advisor.
| (a) | Inception date is May 1, 2007 for Class A, Institutional and the benchmark. |
| (b) | Inception date is May 31, 2016 for Class C and the benchmark. |
| (c) | The S&P 500 Total Return Index, a registered trademark of S&P Global., Inc., is a market capitalization-weighted index of 500 widely held common stocks. Investors cannot invest directly in an Index. |
Comparison of the Change in Value of a $10,000 Investment
| Top Holdings by Asset Type ^ | | % of Net Assets | |
| Short-Term Investments | | | 65.2 | % |
| Other/Cash & Equivalents | | | 34.8 | % |
| | | | 100.0 | % |
| ^ | Does not include derivatives in which the Fund invests. |
Please refer to the Schedule of Investments for a more detailed breakdown of the Fund’s assets.
unaudited
December 31, 2021
Rational Dynamic Brands Fund (HSUAX | HSUCX | HSUTX) vert
Dear Investors,
Happy New Year! If you are an avid mountain biker and thrill-seeker and get to Lake Tahoe, you will absolutely want to ride Mr. Toad’s Wild Ride. We bring this up because that’s how we would describe equity markets in 2021. Our Investor Update last year started by asking the market gods for a “healthy dose of normal” across markets for 2021. As we write this year’s annual letter, we can definitively say, the market gods ignored our request in favor of a wild ride worthy of Mr. Toad’s. In hindsight, investing in stage one of a global pandemic is a lot simpler than investing in stage two. In stage two, human beings and investors must deal with all the distortions that are created by the crisis, as well as the responses to the crisis by policy makers and politicians. As we start 2022, we are extremely excited about the current portfolio holdings and their ability to generate a relatively stable stream of revenue, free cash flow, and actual earnings. Remember “earnings”? For the last five years, actual profits were not required to generate strong returns in growth stocks. We think it’s safe to say, profits and revenue growth and generating free cash flow are the hallmarks of solid long-term businesses, generally more stable stock price movements and solid long-term returns. That’s our focus as we start 2022 as the 2-year Covid distortions begin to normalize.
We all like investing in calm markets with high certainty, but the reality is, the best returns often happen when fear is everywhere and there is a very high wall of worry to climb. That’s where we are today in markets, Fed policy, and the economy. Here’s the positive disconnect between the narrative and the business fundamentals of our companies: we see tremendous value across important global consumption categories, particularly in the services sector. Overall, stocks and bonds are expensive relative to history, but we urge investors to be careful about broad-based market narratives. No matter what market or economic environment we are in, there’s always a sub-segment of the market that appears attractive for investment. We own a focused basket of highly relevant brands, most of which are trading at very reasonable valuations, hold strong recovery potential, and are operating at the center of significant secular growth tailwinds. In 2020, work from home, e-commerce, and high growth, profitless businesses worked the best. 2021 was the year where indexes held up well, but the average stock experienced significant volatility and rolling corrections. The second and third-tier businesses (we tend not to traffic in this group) that survived the global economic shutdowns experienced monumental snapbacks as bankruptcies were avoided. Suffice it to say, the lowest quality, least competitive, least profitable businesses only outperform once in a very long time. Our approach is to anchor to the most relevant and innovative brands across important spending categories, and those businesses, on average, outperform low quality companies more often than not. In 2022, our team has high confidence that a return to quality stocks with superior pricing power and high profitability will occur and that these companies offer the best opportunity for attractive total returns. We couldn’t be more excited about the current group of brands we own in the Fund. And the best part for investors is that the market is putting them on sale right now. Buying low (fear), selling high (euphoria) will never go out of style. The short-term uncertainty caused by Omicron, the Fed normalization process and inflation are offering solid entry points for long-term investors.
As a reminder, global consumer spending is a $40+ trillion per year phenomenon that, given its size and scope, warrants dedication in a portfolio. Most portfolios still do not hold sufficient exposure to a stable, predictable theme like consumer spending. That’s why the Dynamic Brands strategy was created and why we took over the Rational Dynamic Brands (HSUTX) Fund in October 2017. In a world with so many complex equity strategies, our thesis is likely the simplest to understand. At the center of this fund is logic, commonsense and risk management:
If consumption is the core of the economy at 70% of GDP,
shouldn’t the most powerful brands serving this theme be the core holding in your portfolio?
COMMENTARY
When high quality stocks go on sale and underperform, we thank our lucky stars and build bigger positions. We have relatively modest exposure to the highest valuation, lowest profitability, growth stocks in favor of owning a high profitability, high quality and a travel recovery barbell. At one end of the barbell, we own a core group of exceptionally high-quality brands serving important “every-day” spending & investing categories like saving for retirement, e-commerce, athleisure, credit card payments, home improvements & luxury home furnishings, home building, real estate platforms, brick-and-mortar mass market retail, video streaming, consumer healthcare, electric & traditional luxury vehicles, cloud computing, luxury apparel and accessories, and healthy fast casual restaurants. At the opposite end of the barbell, we have a basket of travel and recreation platforms via Expedia, Airbnb, and Caesar’s, a leader in Vegas entertainment & sports betting. Our exposure to Visa, Mastercard, PayPal, and Google serve both masters with key exposure to both portions of the thematic barbell. Dynamic Brands will always be a diverse, thematic consumer trends fund that holds baskets of great brands serving a differentiated group of sub-themes within the global consumption primary opportunity. As consumer trends & habits evolve, so too will the portfolio of brands we own. We are absolutely thrilled to be the only fund and management team investing across lifetime spending categories and through a dedication to highly relevant, strong brands. These intangible assets continue to be misunderstood and largely ignored by most investors.
The chart below highlights a tale of two markets in 2021. On the surface, the markets were solid and quiet, but under the surface there was massive volatility, wild sector rotations and a rolling correction that was quite severe. Most indexes performed strongly, most stocks inside these indexes lagged. The vast majority of returns came from the largest stocks in the indexes which was driven by a historic amount of money flowing into the largest, most liquid market cap weighted ETF’s. In 2021, the ETF effect was in full force. The good news for investors: we now have a better base to build from and valuations and expectations have largely been re-set. Here’s how crazy the market was in 2021: as of 12/20/21, >90% of the S&P 500 and Nasdaq Index stocks were at least 10% away from their 52-week highs and 68% of the Nasdaq holdings had at least a 25% pullback from their highs. This kind of variance between the index performance and the average stock performance is very rare. Between hedge fund redemptions, algo-traders that use short-term momentum signals for decision making, tax-loss selling, cap gains being pulled forward, Covid variants spiking, and nervousness about current & future monetary policy, 2021 truly was a year like few others. We feel confident you will hear this story across most of the letters you read.
| | S&P 500 | NASDAQ 100 | NASDAQ
Composite | Russell 2000 |
| | | | | |
| % Of Members With At Least 25% Correction From YTD High* | 20% | 35% | 68% | 66% |
| | | | | |
| | | | | |
| % Of Members With At Least 20% Correction From YTD High* | 37% | 54% | 74% | 78% |
| | | | | |
| | | | | |
| % Of Members With At Least 10% Correction From YTD High* | 91% | 94% | 89% | 98% |
| | | | | |
| | | | | |
| Average % Price Decline From YTD High* | -19% | -25% | -43% | -39% |
| | | | | |
| * As of 12/20/2021; source: Bloomberg | © Alpine Macro 2021 |
Here’s another fascinating statistic: if you removed the largest 5 stocks from the Nasdaq Composite Index (Apple, Microsoft, Amazon, Google, Tesla), the 2021 return of the index would be negative on the year. Like every year, 2022 will have its ups and downs, but on the margin, we think the supply chain issues & clogged port issues will begin to normalize, albeit slowly, while labor shortages and high wage inflation could stay present for longer. The pent-up demand for being out and about and traveling around the world has never been greater so we continue to like the service & leisure sector rebound. Our stock selection is centered around the brands with high demand for their products/services, with sustainable pricing power because of strong brand love and loyalty, and a tilt towards asset-light business models with lower labor costs given our view that wage pressure will linger for quite a while.
THE CONSUMER IS STILL SPENDING WELL
At 70% of total GDP, consumption spending really matters. Regardless of the current narrative, the consumer is still very healthy, home prices are high, and the wealth effect is very strong. Having a solid job with good wage growth, lower credit card debt outstanding, higher savings & money market balances and easily being able to upgrade your job & salary, all feed into our collective consumption capacity readings. The path we see currently out the front of the windshield is currently quite positive and sustainable from a consumption perspective. In a world filled with uncertainty, the predictability of consumer spending given there’s still roughly $3 trillion in excess savings, makes us feel quite good about the prospects for the most important brands serving key consumption industries. Yes, the cost of everything we want/need has gone up, year over year, and a portion of the population is feeling a new pinch in their wallets. Consumer behavior is very likely to change in 2022 and that’s where stock picking can add a significant amount of value to a portfolio. When the price of everything is high and stubborn, the masses tend to start prioritizing their spending while deferring other, non-core spending. That process is what will drive continued earnings and revenue beats or misses in the coming quarters.
The most beloved brands selling the most in-demand products and services will continue to thrive, the second-tier brands in non-critical spending categories could see demand erosion if the price to value ratio is not attractive. The current dynamic portfolio construction reflects the brands and spending categories we believe are most important to consumers today. When the number of categories and brands that are thriving moves down, the portfolio gets more concentrated. The portfolio is simply a reflection of the opportunities we see across the wide spectrum of consumer spending and business investment.
2022: SHIFT FURTHER UP IN QUALITY, LOWER THE NUMBER OF BRANDS, & UTILIZE PORTFOLIO FLEXIBILITY.
The distortions created through global policy mistakes have created a very compelling investment opportunity across high quality brands. Consumer favorites like Amazon, Visa, Mastercard, PayPal, and Netflix have largely underperformed the market since mid-2020. That’s an opportunity, particularly now that their stock and valuations have moved to the lower end of their historic ranges versus the index. These are strong businesses utilized by global consumers and they have very loyal customers and high brand love. History suggests when they go out of favor, you overweight them, and that’s exactly what we have done in the portfolio. Visa, Mastercard, and PayPal, in particular, are buying stock back aggressively while the stocks are low. What happens when business trends return to normal, and the number of outstanding shares have been aggressively reduced? Earnings beats. That’s what we see for many of the brands we own in the portfolio.
When our team wrote the Brands Fund prospectus, we wanted to have wide flexibility to deal with whatever market environment we had at any part of the business cycle. As we enter 2022, we think portfolio flexibility will be a key factor driving the returns for the year. Having the ability to use cash to our advantage, actively trade if/when volatility is stubbornly high, and play offense and defense offers investors more ways to win. If you have been in this business for many decades, you know that there are very few equity funds with wide latitude in the prospectus. Whether it’s the Brands Fund or others, we urge you to seek exposure to flexible strategies given how many uncertainties there are around the globe. Our strong return in 2020 highlights our ability and interest in using volatility to our advantage. Just a reminder: if you seek attractive returns, you must be willing to ride through the occasional bout of volatility. Market returns do not happen in a linear fashion, they often come in a more volatile fashion. It’s just the nature of the beast.
DYNAMIC BRANDS: The Fund that reflects your life-time spending interests.
Advisors and clients have repeatedly told us how secure they feel about holding companies they know, trust and love. That’s why a brand-centric portfolio is the ideal core equity allocation for investors. Staying invested through the tough times is a key attribute for long-term success and understanding and having an emotional connection to our favorite brands goes a long way in helping people stay engaged.
When we feel panic and fear and objectively assess the health of the companies we spend our time and money on, our panic often turns to excitement and opportunity and that’s an exciting nuance that can drive success as an investor. Think about how you spend your time and money. What brands do you have emotional connections to? Which brands are you fiercely loyal to? Which brands are part of your mind and wallet share on a very regular basis? The brands the masses favor the most tend to be terrifically profitable businesses & have strong performance track records over time. Dynamic Brands is filled with the brands we turn to for our most important spending needs.
With your investment in the Brands Fund, you currently have ownership in some of the most iconic, most profitable and beloved brands ever created:
| ● | Video streaming: Netflix, Amazon Prime Video, AppleTV |
| ● | Online & in-person shopping: Amazon, Target, Costco, Nike, Lululemon, Home Depot, Lowes. |
| ● | Travel & recreation: home sharing and travel platform use via AirBnb, VRBO, Expedia, and Caesar’s in Vegas. |
| ● | FinTech & Payment of all purchases versus using cash: Visa, Mastercard, Paypal & Venmo, Square & Cash App. |
| ● | Consumer electronics: Apple iPhones, iPads, AirPods, Microsoft X-Box, Office365 |
| ● | Healthy fast casual dining: Chipotle. |
| ● | Cloud computing: Amazon AWS, Google Cloud, Microsoft Azure. |
| ● | Luxury goods: Louis Vuitton brands (Tiffany, Dior, Sephora), Estee Lauder (Clinique, MAC Cosmetics, Aveda) |
| ● | Luxury auto’s: Tesla, Ferrari, VW to gain access to Porsche, Audi, Bentley, Lamborghini, Ducati Motorcycles |
| ● | Investments in private equity, infrastructure, real estate: Blackstone & KKR – the smartest investors in the world. |
| ● | Advertising & Internet Search: Google and You-Tube, plus all their “other bets” like Waymo self-driving . |
| ● | Household formation as Millennials start families: Lennar, one of the largest homebuilders & Zillow Marketplace |
| ● | Luxury home furnishings: RH (Restoration Hardware) serving the world’s wealthy consumers. |
| ● | Health & Wellness: Abbott Labs |
Here’s the link to the Dynamic Brands Fund portfolio, we will be making ongoing comments about each brand we own so you can follow along. Dynamic Brands Portfolio-Click each logo for recent updates
PERFORMANCE
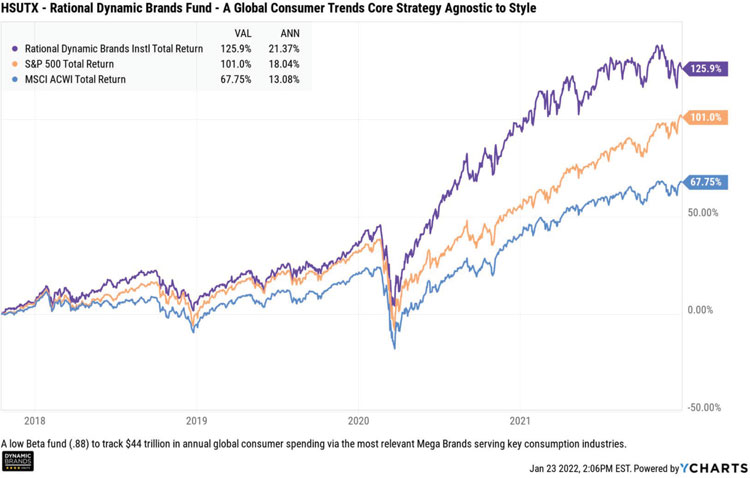
No investor has a playbook for investing in and through a global pandemic. In early 2020 if I told you the world’s economies would grind to a halt because of a global virus and that the policies surrounding that pandemic would create massive supply chain disruptions, shipping delays, an inflation spike, an epic labor shortage, tremendous uncertainties and volatility spasms, mass human suffering, extensive hedge fund redemptions, a pulling forward of capital losses and gains in anticipation of higher tax rates going forward, and the virtual halting of many businesses in the services sector, would you have guessed that the average annual return for the 2 year period from 2020 to 2021 for stocks would have been average (~10%), below average or above average? I suspect we all would have guessed the returns would have been below the long-term average of roughly 10%. Here’s the two-year stack of performance for the S&P 500, the Dynamic Brands Fund, and the MSCI All Country World Index. The last 2 years were among the wildest I’ve ever witnessed.
Suffice to say, most investments generated returns well above the long-term averages and certainly better than any of us would have expected given a global pandemic, high inflation and multiple start/stops for the global economy. We are looking forward to getting back to more normal central bank policies, a real economy, and back to live as we have always known it. We think many of the distortions that have occurred because of Covid are already in the process of normalizing and earnings variability should begin to revert to more normal levels. For the first half of 2022, we could still see some lingering concern due to the uncertainty in Federal Reserve policy and inflation expectations as well as more earnings volatility around companies that pulled forward 3+ years of revenue from the “digitization of everything” theme. Many of these great
businesses pulled forward strong returns so valuations are still quite high. Once these high comparisons fade, these secular growers should see much more stable price movements.
The Dynamic Brands Fund underperformed the S&P 500 in 2021 but our return remained well above the long-term average market return. In fact, since 2017, the two years the Fund has lagged the market were both periods in which the market generated outsized gains and the Brands Fund generated returns well above “normal”.
Our focus on stability and predictability often generates outperformance in more difficult, sub-par years for the indexes because money tends to rotate to mega brands for their relative safety and predictability. Importantly, the Fund has performed strongly over the 2-year Covid Pandemic period. Last year’s underperformance came largely from our anchoring to two key consumption trends we think have enormous opportunities for the foreseeable future (a return to normal travel & recreation trends and the death of cash in favor of using credit card payments & rewards programs). The return to cross-border travel straddles both these themes.
There is no guarantee that any investment strategy will achieve its objectives, generate profits or avoid losses.
We took advantage of short-term dislocations in both industries to add to these positions on dips because we have a high degree of confidence in their revival in 2022. Sometimes, when there’s wonderful opportunities in the short-term, you have to be willing to ride through the short-term volatility to hope to receive a long-term benefit. Like we stated earlier in this update, the average stock has already experienced a significant correction. Corrections never feel good when they are happening, but they tend to offer much more attractive entry points for attractive, long-term gains.
As we kick off 2022, we expect the road to normal Fed policy will create periodic bouts of volatility, but this normalization is very healthy for markets and the economy. 2022 should be less about the index and more about active stock picking as the economy normalizes and companies get back to more typical operating environments. Concentrated portfolios should outperform investments that own thousands of stocks. Quality & profitability should lead low quality and highly levered balance sheets and pent-up demand industries like services should have much smoother quarterly consumption trends.
We thank you for your loyalty to the Rational Dynamic Brands Fund and for appreciating the value of investing in the $44 trillion global consumption theme through the brands that make a difference in all our lives. Investing in the brands that build innovative and necessity-based products and services is a timeless approach to long-term investing.
Reminder: the holdings and allocation weights will change over time according to the opportunities we see in the marketplace. Fund holdings are subject to change and should not be considered investment advice.
Sincerely,
The Accuvest Dynamic Brands Team: Eric Clark, Dave Garff, James Calhoun
| | | | | | Previous Strategy |
| | | | | | |
| Share Class/Benchmark | YTD | 1 Year | 3 Years | Since
10/16/171 | 5 Years | 10 Years | Since
Inception* |
| Class I | 14.97 | 14.97 | 28.50 | 21.31 | 19.63 | 14.29 | 12.44 |
| S&P 500 TR Index | 28.71 | 28.71 | 26.07 | 18.08 | 18.47 | 16.55 | 11.73 |
| Class A | 14.59 | 14.59 | 28.15 | 20.98 | 19.34 | 13.99 | 12.15 |
| Class A w/ Sales Charge | 9.16 | 9.16 | 26.08 | 19.59 | 18.18 | 13.44 | 11.87 |
| | | | | | | | |
| * Inception: 09/27/2002 |
| 1 | Prior to 10/17/2017, Rational Dynamic Brands Fund was named the Rational Defensive Growth Fund, which had a different investment strategy and sub-advisor. |
The maximum sales charge for Class “A” Shares is 4.75%. Investments in mutual funds involve risks. Performance is historic and does not guarantee future results. Investment return and principal value will fluctuate with changing market conditions so that when redeemed, shares may be worth more or less than their original cost. Current performance may be lower or higher than the performance data quoted. To obtain the most recent month end performance information or the Fund’s prospectus please call 800-253-0412 or visit www.RationalMF.com.
There is no guarantee that any investment strategy will achieve its objectives, generate profits or avoid losses.
As of December 31, 2021, the Fund’s top 10 holdings were:
| RH | 7.72% |
| | |
| Visa Inc | 5.28% |
| | |
| Alphabet Inc | 5.25% |
| | |
| KKR & Co Inc | 5.18% |
| | |
| Blackstone Inc | 5.03% |
| | |
| Microsoft Corp | 4.86% |
| | |
| PayPal Holdings Inc | 4.81% |
| | |
| Apple Inc | 4.65% |
| | |
| Netflix Inc | 4.33% |
| | |
| Amazon.com Inc | 4.16% |
| | |
Portfolio holdings are subject to change and should not be considered investment advice.
This report is intended for the Fund’s shareholders. To obtain a prospectus or other information about the Fund, please visit www.RationalMF.com or call 1-800-253-0412. Please read the prospectus carefully before investing.
The S&P 500 Total Return Index by Standard & Poor’s Corp. is a capitalization-weighted index comprising 500 issues listed on various exchanges, representing the performance of the stock market generally. Please note that indices do not take into account any fees and expenses of investing in the individual securities that they track, and individuals cannot invest directly in any index, although individuals may invest in exchange traded funds or other investment vehicles that attempt to track the performance of an index. The Rational Dynamic Brands Fund may or may not purchase the types of securities represented by the S&P 500 Total Return Index.
1142-NLD-01262022
Rational Dynamic Brands Fund
PORTFOLIO REVIEW (Unaudited)
December 31, 2021
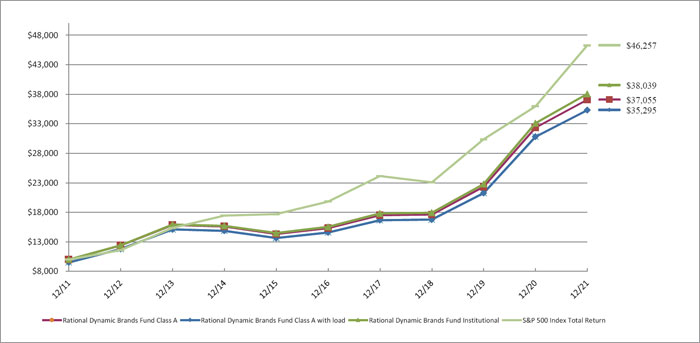
The Fund’s performance figures* for each of the periods ended December 31, 2021, compared to its benchmarks:
| | | Annualized | Annualized | Annualized | Annualized |
| | 1 Year Return | 5 Year Return | 10 Year Return | Since Inception(a) | Since Inception(b) |
| Institutional | 14.97% | 19.63% | 14.29% | 12.44% | N/A |
| Class A | 14.59% | 19.34% | 13.99% | 12.15% | N/A |
| Class A with load | 9.16% | 18.18% | 13.44% | 11.87% | N/A |
| Class C | 13.85% | 18.57% | N/A | N/A | 10.69% |
| S&P 500 Total Return Index (c) | 28.71% | 18.47% | 16.55% | 11.73% | 14.92% |
| * | The performance data quoted here represents past performance. Current performance may be lower or higher than the performance data quoted above. Investment return and principal value will fluctuate, so that shares, when redeemed, may be worth more or less than their original cost. The returns shown do not reflect the deduction of taxes that a shareholder would pay on Fund distributions or on the redemptions of Fund shares. Past performance is no guarantee of future results. Performance figures for periods greater than 1 year are annualized. Per the fee table in the Fund’s May 1, 2021 prospectus, the total annual operating expense are 1.26% for Institutional shares, 1.53% for Class A shares and 2.42% for Class C shares before fee waivers. See the financial highlights for current expense ratios. For performance information current to the most recent month-end, please call toll-free 1-800-253-0412. Class A shares are subject to a maximum load of 4.75%. |
Performance information for the period prior to October 2017 does not reflect the Fund’s current strategy and the Fund’s portfolio was not managed by the Fund’s current Sub-Advisor.
| (a) | Inception date is September 27, 2002, for Class A, Institutional and the benchmark. |
| (b) | Inception date is January 2, 2014 for Class C and the benchmark. |
| (c) | The S&P 500 Total Return Index, a registered trademark of S&P Global., Inc., is a market capitalization-weighted index of 500 widely held common stocks. Investors cannot invest directly in an Index. |
Comparison of the Change in Value of a $10,000 Investment
| Top 10 Holdings by Industry | | % of Net Assets | |
| Retail - Discretionary | | | 18.5 | % |
| Internet Media & Services | | | 16.1 | % |
| Technology Services | | | 15.4 | % |
| Asset Management | | | 10.3 | % |
| Apparel & Textile Products | | | 8.2 | % |
| Leisure Facilities & Services | | | 5.0 | % |
| Software | | | 4.9 | % |
| Technology Hardware | | | 4.7 | % |
| Automotive | | | 4.4 | % |
| E-Commerce Discretionary | | | 4.2 | % |
| Other/Short-Term Investments | | | 8.3 | % |
| | | | 100.0 | % |
Please refer to the Schedule of Investments for a more detailed breakdown of the Fund’s assets.
unaudited
December 31, 2021
Rational Strategic Allocation Fund
Dear Fellow Shareholders,
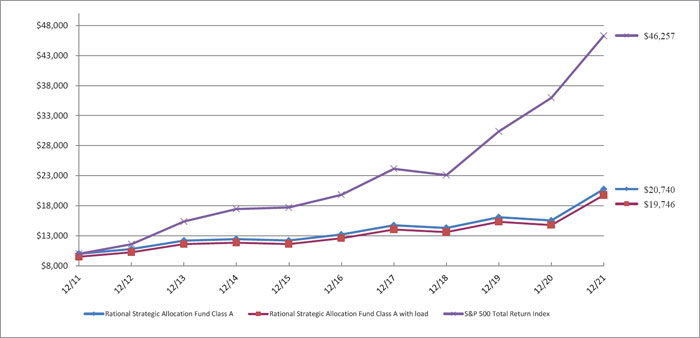
The Rational Strategic Allocation Fund (the “Fund”) seeks current income and moderate appreciation of capital by implementing a distinct “index plus” strategy that provides investors exposure to a non-traditional fixed income portfolio with an S&P 500 Index equity overlay. During 2021, the Fund outperformed the S&P 500 Total Return Index (1) with a +33.57% (Class A) return versus +28.71% for the S&P 500 Total Return Index. The Fund benefited from its allocations to futures contracts on the S&P 500 Index and fixed income funds.
Investment Strategy
The Fund invests in a portfolio of futures contracts on the S&P 500 Index and income-oriented mutual funds typically representing non-traditional fixed income asset classes. We select underlying funds using a fundamental research process, including a top-down analysis of market conditions and investment category historical performance during various market conditions. We also perform a bottom-up analysis of each potential fund for investment, including investment allocations, investment valuations and characteristics, positioning, historical performance during various market conditions and each fund’s portfolio manager’s outlook. The Fund typically maintains 70% to 100% notional exposure to the S&P 500 Index and 70% to 100% notional exposure to the fixed income portfolio.
Fund Performance
The Fund performed in-line with our expectations. Our exposure to S&P 500 Index futures contracts allowed us to participate in the upswings of the equity markets while our non-traditional fixed income portfolio served to provide current income and support the goal of moderate capital appreciation by buffering the impact of downside equity market volatility. Throughout 2021, we were able to maintain our targeted notional exposure of 70% to 100% to the S&P 500 Index.
The majority of the holdings performed to our expectations. The top performing funds held in the portfolio during 2021 were: The AlphaCentric Income Opportunities Fund (IOFIX +14.92%), The Rational/Pier 88 Convertible Securities Fund (PBXIX +10.21%) and The Rational Special Situations Fund (RFXIX +5.30%). The weakest performing fund held in the portfolio during 2021 was: The Catalyst/Stone Beach Income Opportunity Fund (IOXIX -4.31%).
The Fund’s total annualized returns through December 31, 2021 as compared to the S&P 500 Total Return Index were as follows:
| | 1 Year | 3 Years | 5 Years | Since Inception
(07/30/09) |
| Class A | 33.57% | 13.21% | 9.44% | 7.45% |
| Class A with Sales Charge | 27.20% | 11.38% | 8.38% | 7.03% |
| S&P 500 Total Return Index (1) | 28.71% | 26.07% | 18.47% | 15.82% |
The Fund’s maximum sales charge for Class “A” shares is 4.75%. Investments in mutual funds involve risks. Performance is historic and does not guarantee future results. Investment return and principal value will fluctuate with changing market conditions so that when redeemed, shares may be worth more or less than their original cost. Current performance may be lower or higher than the performance data quoted. To obtain the most recent month- end performance information or the Fund’s prospectus please call the Fund, toll free at 1-800-253-0412. You can also obtain a prospectus at www.RationalMF.com.
Sincerely,
David Miller
Portfolio Manager
This report is intended for the Fund’s shareholders. It may not be distributed to prospective investors unless it is preceded or accompanied by the current Fund prospectus. To obtain a prospectus or other information about the Fund, please visit www.RationalMF.com or call 1-800-253-0412. Please read the prospectus carefully before investing.
| (1) | The S&P 500 Total Return Index by Standard & Poor’s Corp. is a capitalization-weighted index comprising 500 issues listed on various exchanges, representing the performance of the stock market generally. Please note that indices do not take into account any fees and expenses of investing in the individual securities that they track, and individuals cannot invest directly in any index, although individuals may invest in exchange traded funds or other investment vehicles that attempt to track the performance of an index. The Rational Strategic Allocation Fund may or may not purchase the types of securities represented by the S&P 500 Total Return Index. |
1149-NLD-01272022
Rational Strategic Allocation Fund
PORTFOLIO REVIEW (Unaudited)
December 31, 2021
The Fund’s performance figures* for each of the periods ended December 31, 2021, compared to its benchmarks:
| | | Annualized | Annualized | Annualized | Annualized |
| | 1 Year Return | 5 Year Return | 10 Year Return | Since Inception(a) | Since Inception(b) |
| Institutional | 33.94% | 9.71% | N/A | N/A | 9.62% |
| Class A | 33.57% | 9.44% | 7.57% | 7.45% | N/A |
| Class A with load | 27.20% | 8.38% | 7.04% | 7.03% | N/A |
| Class C | 32.60% | 8.62% | N/A | N/A | 8.54% |
| S&P 500 Total Return Index (c) | 28.71% | 18.47% | 16.55% | 15.82% | 18.02% |
| * | The performance data quoted here represents past performance. Current performance may be lower or higher than the performance data quoted above. Investment return and principal value will fluctuate, so that shares, when redeemed, may be worth more or less than their original cost. The returns shown do not reflect the deduction of taxes that a shareholder would pay on Fund distributions or on the redemptions of Fund shares. Past performance is no guarantee of future results. Performance figures for periods greater than 1 year are annualized. Per the fee table in the Fund’s May 1, 2021 prospectus, the total annual operating expense are 2.45% for Institutional shares, 2.79% for Class A shares and 3.47% for Class C shares before fee waivers. See the financial highlights for current expense ratios. For performance information current to the most recent month-end, please call toll-free 1-800-253-0412. Class A shares are subject to a maximum load of 4.75%. |
Performance information for the period prior to January 2016 does not reflect the Fund’s current strategy and the Fund’s portfolio was not managed by the Fund’s current Sub-Advisor.
| (a) | Inception date is July 30, 2009 for Class A and the benchmark. |
| (b) | Inception date is May 31, 2016 for Class C, Institutional and the benchmark. |
| (c) | The S&P 500 Total Return Index, a registered trademark of S&P Global., Inc., is a market capitalization-weighted index of 500 widely held common stocks. Investors cannot invest directly in an Index. |
Comparison of the Change in Value of a $10,000 Investment
| Top Holdings by Asset Type ^ | | % of Net Assets | |
| Fixed Income | | | 72.9 | % |
| Alternative | | | 9.8 | % |
| Other/Short-Term Investments | | | 17.3 | % |
| | | | 100.0 | % |
| ^ | Does not include derivatives in which the Fund invests. |
Please refer to the Schedule of Investments for a more detailed breakdown of the Fund’s total investments.
unaudited
December 31, 2021
Rational ReSolve Adaptive Asset Allocation Fund
Dear Shareholders,
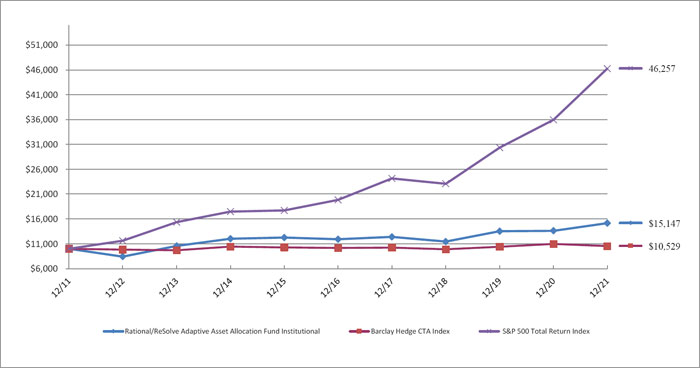
The Rational ReSolve Adaptive Asset Allocation Fund (the “Fund”) commenced trading on March 16, 2018, when ReSolve Asset Management officially replaced the previous manager as sub-advisor.
ReSolve’s Adaptive Asset Allocation1 methodology uses proprietary quantitative and machine learning innovations that emphasize characteristics such as, but not limited to, total return momentum, trends, seasonal patterns, carry measures, mean reversion and others, while simultaneously maximizing diversification based on changing estimates of volatility and correlations across a global universe of futures markets consisting of stock and bond indices, commodities, and currencies.
Portfolio Review
In 2021, the first calendar year after the innovations deployed in September 20202, the Fund (RDMIX) delivered a solid +11.28% return. More importantly, it displayed the very diversified set of return streams that it seeks to provide.
Energies drove the largest share of P&L, mostly from longs in crude oil and gasoil. Carbon emissions and natural gas also contributed on the long side. Our systems were agile in reducing exposure and avoiding the brunt of the November selloff in the sector.
Equities benefited primarily from long positions in the Nasdaq, UK FTSE, and Canadian TSX. Other meaningful contributions were drawn from longs in the Dutch AEX, Dow Jones, and Spanish IBEX.
Grains were a close third best sector, stemming largely from longs in corn and milling wheat. Bean oil, soybeans and wheat offered modest positive returns. Active trading protected gains when volatility spiked in the second half.
Metals also provided important contributions; copper was the main highlight. Platinum was a close second, with active trading and profitable long and short positions that flipped several times throughout the year.
Softs were not far behind, with the lion’s share of positive returns coming from long cotton. Cocoa and coffee provided incremental gains.
Currencies were by far the largest detractors, mostly led by longs in the Swiss Franc, Japanese Yen, and the New Zealand Dollar.
Bonds suffered from offside long exposure to the Canadian 10-year bonds and 5-year Treasuries, which were partially offset by being long 30-year Treasuries during its April through July recovery rally.
| 1 | For our 10-year track record, please visit: https://investresolve.com/strategies/resolve-adaptive-asset-allocation-cad-8-volatility/ |
| 2 | For more information, please refer to the Fund’s 2020 commentary. |
Figure 1. 2021 Return Attribution
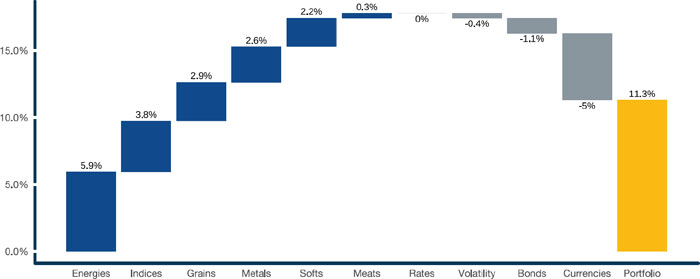
Source: ReSolve Asset Management. Results may differ due to rounding. Performance is expressed in USD. Strategy attribution is a best efforts approximation, net of all applicable borrowing costs, fees and fund accruals for the period. Indicated returns of one year or more are annualized. Past performance is not indicative of future performance.
The Fund’s total annualized returns through December 31, 2021 as compared to the Barclay Hedge CTA Index(4) and the S&P 500 Total Return Index were as follows:
| | | | | | Previous Manager |
| | YTD | 1Yr | 3yrs | Since 02/28/2018 | 5YRS | 10YRS | Incep |
| | | | | | | | |
| Institutional Class | 11.28 | 11.28 | 9.84 | 4.76 | 4.91 | 4.24 | 6.16 |
| | | | | | | | |
| Barclay Hedge CTA Index4 | 5.21 | 5.21 | 5.27 | 3.56 | 2.61 | 1.44 | 4.29 |
| | | | | | | | |
| S&P 500 TR Index3 | 28.71 | 28.71 | 26.07 | 17.89 | 18.47 | 16.55 | 10.82 |
| | | | | | | | |
| Class A | 10.99 | 10.99 | 9.55 | 4.48 | 4.65 | 3.97 | 5.89 |
| | | | | | | | |
| Class C | 10.18 | 10.18 | 8.76 | 3.73 | 3.88 | 3.22 | 5.11 |
| | | | | | | | |
| Class A w/ Sales Charge | 4.61 | 4.61 | 7.41 | 2.89 | 3.42 | 3.97 | 5.89 |
| | | | | | | | |
| * | Inception: 02/01/1994. The performance shown prior to September 30, 2016 is that of the Predecessor Fund, which reflects all of the Predecessor Fund’s actual fees and expenses adjusted to include any fees of each share class. |
The Fund’s maximum sales charge for Class “A” shares is 5.75%. Investments in mutual funds involve risks. Performance is historic and does not guarantee future results. Investment return and principal value will fluctuate with changing market conditions so that when redeemed, shares may be worth more or less than their original cost. Current performance may be lower or higher than the performance data quoted. To obtain the most recent month- end performance information please call the Fund, toll free at 1-800-253-0412.
The Fund acquired all of the assets and liabilities of Chesapeake Fund, LLC (the “Predecessor Fund”) in a tax free reorganization on December 31, 2016. In connection with this acquisition, shares of the Predecessor Fund were exchanged for Institutional Shares of the Fund. At the time of the reorganization, the Predecessor Fund had an investment objective and strategies that were, in all material respects, the same as those of the Fund, and was managed in a manner that, in all material respects, complied with the investment guidelines and restrictions of the Fund. Effective February 27, 2018, the Fund’s investment strategy changed, and a new Sub Advisor replaced the prior sub-advisor. Consequently, prior performance may not reflect the Fund’s current operations.
General Market Review
Investor sentiment and risk appetite continued to be dominated by the news flow surrounding the pandemic and its repercussions. The first half of the year saw renewed optimism with the successful rollout of vaccination campaigns – initially in the US and UK, followed by Europe – leading to a significant decrease in infection rates across western countries. The signing of an historic USD 1.9 trillion stimulus package in the US, the size and scope of which go beyond any other fiscal outlay since the beginning of the pandemic, was the other major driver of the economic recovery.
The case for more persistent inflation gathered steam throughout the year. Data from the United Nations pointed to a whopping 31 percent rise in global food prices for the 12-month period ending July 2021. Food prices in the US jumped by 8 percent over a similar period, driven largely by imports, while gas lines in Britain and other shortages in developed economies captured headlines across much of the world. Supply-chain disruptions became the most overused catchphrase in recent memory.
Though the Fed had been trying to ignite inflation since 2009, it began to indicate discomfort as inflation readings remained higher than expected throughout the second half of 2021. Aside from supply-demand mismatches, the major inflationary thrust was exacerbated by expansionary fiscal policy directed at the population at large, associated with their higher propensity to spend it. Stubbornly low labor participation was another important variable, which appears to be swinging the bargaining pendulum away from capital in the form of higher wages. By mid-December, the Federal Open Market Committee (FOMC) voted to accelerate the pace of asset purchase tapering and signaled as many as three rate hikes may be warranted in 2022.
Commodities were the best performing asset-class, led by the incredible rally in the energy sector, where the price of UK natural gas rose four-fold, carbon emissions doubled, and crude oil and distillates increased between 50 and 80 percent, approximately. While copper and other base metals enjoyed double-digit gains, precious metals – including gold, silver, platinum and palladium, were down for the year. Agricultural commodities also saw huge gains, led by oils (palm, canola and bean), along with coffee, corn, cotton, sugar and wheat. Global equities experienced another strong year, led by US, European and Canadian stocks. Japanese shares had modest gains, while Chinese indices suffered from government intervention and were broadly down. Government bonds were also largely in negative territory in the wake of rising inflation, while the US Dollar strengthened against most major and emerging market currencies.
For the past decade, investors have shifted focus from the macroeconomic data itself, to an emphasis on how the data might affect Fed policy. Apart from the Fed’s recent promise to “remove the party’s punch bowl” sooner than expected, most other central banks have indicated loose monetary conditions for the foreseeable future. And even though, as of the writing of this commentary, markets are once again throwing a tantrum given the more hawkish tone in recently released FOMC minutes, there are reasons to doubt whether the Fed may be willing, or perhaps even able, to follow through. For one, higher inflation for a prolonged period would eventually erode, in real terms, part of the enormous debt pile that has dragged on growth for years. This suggests that, despite tough rhetoric, inflation might in fact be a feature, and not a bug, of the current policy agenda.
Further, the apparent demise of Biden’s Build Back Better fiscal package removes an important tailwind for the economy just as the effects of COVID-relief legislation begin to fade. Recent evidence points to a slowdown in activity, not only in the US but also in much of the world. The Chinese economy is particularly concerning given recent draconian lockdown measures in some regions, not to mention the yet unknown knock-on effects of the likely collapse of its largest real-estate developer. Investors should expect no respite from the heightened uncertainty they’ve had to endure in the last few years.
Sincerely,
ReSolve Asset Management
Strategy Sub-Advisor
This report is intended for the Fund’s shareholders. It may not be distributed to prospective investors unless it is preceded or accompanied by the current Fund prospectus. To obtain a prospectus or other information about the Fund, please visit www.RationalMF.com or call 1-800-253-0412. Please read the prospectus carefully before investing.
| (3) | The S&P 500 Total Return Index by Standard & Poor’s Corp. is a capitalization-weighted index comprising 500 issues listed on various exchanges, representing the performance of the stock market generally. Please note that indices do not take into account any fees and expenses of investing in the individual securities that they track, and individuals cannot invest directly in any index, although individuals may invest in exchange traded funds or other investment vehicles that attempt to track the performance of an index. The Rational Adaptive Asset Allocation Fund may or may not purchase the types of securities represented by the S&P 500 Total Return Index. |
| (4) | The Barclay Hedge CTA Index is a leading industry benchmark of representative performance of commodity trading advisors. There are currently 510 programs included in the calculation of the Barclay CTA Index for 2020. The Index is equally weighted and rebalanced at the beginning of each year. |
8023-NLD-1/31/2022
Rational/ReSolve Adaptive Asset Allocation Fund
PORTFOLIO REVIEW (Unaudited)
December 31, 2021
The Fund’s performance figures* for each of the periods ended December 31, 2021, compared to its benchmarks:
| | | Annualized | Annualized | Annualized | Annualized |
| | 1 Year Return | 5 Year Return | 10 Year Return | Since Inception(a) | Since Inception(b) |
| Institutional (c) | 11.28% | 4.91% | 4.24% | N/A | 6.16% |
| Class A | 10.99% | 4.65% | N/A | 3.86% | N/A |
| Class A with load | 4.61% | 3.42% | N/A | 2.69% | N/A |
| Class C | 10.18% | 3.88% | N/A | 5.11% | N/A |
| S&P 500 Total Return Index (d) | 28.71% | 18.47% | 16.55% | 18.36% | 10.82% |
| Barclay Hedge CTA Index (e) | 5.21% | 2.61% | 1.44% | 2.27% | 4.29% |
| * | The performance data quoted here represents past performance. Current performance may be lower or higher than the performance data quoted above. Investment return and principal value will fluctuate, so that shares, when redeemed, may be worth more or less than their original cost. The returns shown do not reflect the deduction of taxes that a shareholder would pay on Fund distributions or on the redemptions of Fund shares. Past performance is no guarantee of future results. Performance figures for periods greater than 1 year are annualized. Per the fee table in the Fund’s May 1 , 2021 prospectus, the total annual operating expense are 2.29% for Institutional shares, 2.58% for Class A shares and 3.46% for Class C shares before fee waivers. See the financial highlights for current expense ratios. For performance information current to the most recent month-end, please call toll-free 1-800-253-0412. |
Class A shares are subject to a maximum load of 5.75%.
Performance information for the period prior to February 2018 does not reflect the Fund’s current strategy and the Fund’s portfolio was not managed by the Fund’s current Sub-Advisor.
| (a) | Inception date is September 30, 2016 for Class A, Class C and the benchmarks. |
| (b) | Inception date is February 28, 1994 for Institutional and the benchmarks. |
| (c) | The Fund acquired all of the assets and liabilities of Chesapeake Fund LLC (the “Predecessor Fund”) in a tax-free reorganization on September 30, 2016. In connection with this acquisition, shares of the Predecessor Fund were exchanged for Institutional shares of the Fund, so the Predecessor Fund became the Institutional shares of the Fund. The Fund’s investment objective, policies and guidelines are, in all material respects, equivalent to the Predecessor Fund’s investment objectives, policies and guidelines. The Predecessor Fund commenced operations on February 28,1994. Updated performance information will be available at no cost by calling 1-800-253-0412 or visiting the Fund’s website at www.RationalMF.com. |
| (d) | The S&P 500 Total Return Index, a registered trademark of S&P Global., Inc., is a market capitalization-weighted index of 500 widely held common stocks. Investors cannot invest directly in an Index. |
| (e) | The Barclay Hedge CTA Index is a leading industry benchmark of representative performance of commodity trading advisors. |
Comparison of the Change in Value of a $10,000 Investment
| Holdings by Asset Type ^ | | % of Net Assets | |
| Short-Term Investments | | | 93.2 | % |
| Other/Cash & Equivalents | | | 6.8 | % |
| | | | 100.0 | % |
| ^ | Does not include derivatives in which the Fund invests. |
Please refer to the Consolidated Schedule of Investments for a more detailed breakdown of the Fund’s assets.
unaudited
January 17, 2022
Rational/Pier 88 Convertible Securities Fund
Dear Fellow Shareholders,
The Rational/Pier 88 Convertible Securities Fund (the “Fund”) seeks total return consisting of capital appreciation and income, offering a “call option” on fast growing businesses by investing primarily in convertible securities, which offer equity participation with the added benefit of a bond floor component. The Fund maintains an average investment grade rating with the goal of providing additional downside risk management. The Pier 88 approach to managing the convertible bond asset class can be characterized by the word “balance.” We endeavor to take a balanced view of risk versus reward. The team is cognizant that all investments present a plethora of risk including macroeconomic, market and idiosyncratic. Our portfolio remains diversified from a sector, market capitalization and style perspective.
During 2021, the Fund (PBXIX) returned +10.21% versus +12.49% for the ICE BofAML Investment Grade US Convertible Index. The Fund benefited from strong stock selection in Technology, Healthcare and Industrials. Conversely, the Fund primarily underperformed based on its underweight position in energy and the large reversion in the sector post the 2020 sell off. Given the massive growth to value rotation in the public market that started in November 2020 and continued throughout 2021, we think it is important to examine the past 24 months of performance for context.
In 2020, the outperformance of over 1,000 basis points to the comparable convertible index was attributable to both sector allocation coupled with strong security selection. The Fund benefited from overweight positions in technology and consumer discretionary, specifically software, semi-conductors and internet-related retail focused sub-sectors. Moreover, the Fund’s material underweight in utilities and financials added to overall outperformance during that period. As the market experienced a growth to value rotation, secular growth names in the portfolio began to underperform while more cyclical names levered to the re-opening of the economy recovered. The ICE BofAML Investment Grade US Convertible Index has broader exposure to value-oriented sectors like energy and financials. Given this value tilt, one would typically expect the Index to outperform the Fund as investors sold the underlying securities of growth companies to buy the securities of value companies. Nevertheless, our security selection and risk management process helped blunt the impacts of the rotation. In 2021, investors preferred cyclical companies like semiconductors, e-commerce, energy and travel at the expense of more secular names like software and digital learning. Semiconductor-related and cybersecurity names were solid contributors to the Fund as underlying company fundamentals remained very strong.
Investment Strategy
The Fund seeks to achieve its objective by investing in convertible securities, which are “hybrid” securities that possess both fixed income and equity characteristics. The convertible securities asset class is often overlooked because of its unique profile and often trades at a discount to its pari-passu fixed income counterparts. As equity sensitivity has been the primary driver of returns of the asset class, our investment team employs an equity analysis perspective for investment decisions.
Fund Performance
Although the Fund benefitted from a healthy yield, the majority of the return came from capital appreciation. Full year 2021 saw strong positive returns for the convertible asset class across multiple industry sectors. Information Technology Healthcare and Financials delivered the strongest positive returns with sub-sectors of cyber security, semi-conductors, lifesciences, biotechnology and private equity driving the bulk of stock selection. The Fund benefitted from exposure to fast growing businesses which saw increased demand from rebounding economies, continued demand for technologies to fight new cyberattacks, and new innovations in life sciences and biotechnology. We remain bullish on the fundamentals underlying many of our companies; our secular growth stories have years to expand their business, while our blue-chip franchises are well capitalized and possess the stability to fund their yields.
Summary
The Rational/Pier 88 Convertible Securities Fund delivered strong positive returns in 2021 following high double digit returns in 2020. The Fund outperformed the broad fixed income index (The Barclays US Aggregate Bond Index), which was negative, while lagging the broader S&P. The majority of the holdings performed to our expectations and the Fund benefitted from rigorous security selection and solid risk management. We believe investing on behalf of others is a privilege we must earn everyday through adherence to a disciplined investment process. Thank you for your support.
Sincerely,
Frank Timons
Portfolio Manager
The Fund’s total annualized returns through 12/31/21 as compared to its benchmark were as follows:
| | QTD | 1 Year | 3 Years | Inception* |
| Class I | 5.20 | 10.21 | 15.56 | 11.38 |
| Bloomberg Barclays US Aggregate TR Index1 | 0.01 | -1.54 | 4.79 | 3.63 |
| S&P 500 TR Index | 11.03 | 28.71 | 26.07 | 17.41 |
| ICE BofAML Investment Grade US Convertible 5% Constrained Index | 5.10 | 12.49 | 13.68 | 11.73 |
| Class A | 5.15 | 9.97 | 15.32 | 11.14 |
| Class C | 4.89 | 9.11 | 14.54 | 10.34 |
| Class A w/ Load | 0.12 | 4.77 | 13.45 | 10.03 |
| * | Inception: 03/01/2017. The performance shown prior to December 6, 2019 is that of the Predecessor Fund, which reflects all of the Predecessor Fund’s actual fees and expenses adjusted to include any fees of each share class. |
S&P 500 is the primary benchmark.
Maximum sales charge for Class A is 4.75%. Maximum Deferred Sales Charge of 1.00% on Class C Shares applies to shares sold within 12 months of purchase. The performance data quoted here represents past performance. Current performance may be lower or higher than the performance data quoted above. Investment return and principal value will fluctuate, so that shares, when redeemed, may be worth more or less than their original cost. Past performance is no guarantee of future results. Results shown reflect the waiver, without which the results could have been lower. A fund’s performance, especially for very short periods of time, should not be the sole factor in making your investment decisions. To obtain the most recent month end performance information or the Fund’s prospectus please call 800-253-0412 or visit www.RationalMF.com.
Gross expense ratios are 1.41%, 2.14%, and 1.26% for Class A, C and I shares. Net expense ratios are 1.25%, 2.00%, and 1.00% for Class A, C and I shares. Expense limitation is 0.99%, 1.24% and 1.99% for the Institutional class, Class A and Class C respectively and is contractually agreed upon through April 30, 2022
This report is intended for the Fund’s shareholders. It may not be distributed to prospective investors unless it is preceded or accompanied by the current Fund prospectus. To obtain a prospectus or other information about the Fund, please visit www.RationalMF.com or call 1-800-253-0412. Please read the prospectus carefully before investing.
8016-NLD-1/26/2022
Rational/Pier 88 Convertible Securities Fund
PORTFOLIO REVIEW (Unaudited)
December 31, 2021
The Fund’s performance figures* for each of the periods ended December 31, 2021, compared to its benchmarks:
| | | Annualized | Annualized |
| | 1 Year Return | Since Inception(a) | Since Inception(b) |
| Institutional (c) | 10.21% | N/A | 11.38% |
| Class A | 9.97% | 13.87% | N/A |
| Class A with load | 4.77% | 11.22% | N/A |
| Class C | 9.11% | 13.14% | N/A |
| S&P 500 Total Return Index (d) | 28.71% | 24.24% | 17.41% |
| Bloomberg Barclays US Convertible TR Index (e) | 4.32% | 25.33% | 16.52% |
| ICE BofA Investment Grade U.S. Convertible 5% Constrained Index (f) | 12.49% | 9.39% | 11.73% |
| * | The performance data quoted here represents past performance. Current performance may be lower or higher than the performance data quoted above. Investment return and principal value will fluctuate, so that shares, when redeemed, may be worth more or less than their original cost. The returns shown do not reflect the deduction of taxes that a shareholder would pay on Fund distributions or on the redemptions of Fund shares. Past performance is no guarantee of future results. Performance figures for periods greater than 1 year are annualized. Per the fee table in the Fund’s May 1, 2021 prospectus, the total annual operating expense are 1.26% for Institutional shares, 1.41% for Class A shares and 2.14% for Class C shares before fee waivers. See the financial highlights for current expense ratios. For performance information current to the most recent month-end, please call toll-free 1-800-253-0412. Class A shares are subject to a maximum load of 4.75%. |
| (a) | Inception date is December 6, 2019 for Class A, Class C and the benchmark. |
| (b) | Inception date is March 1, 2017 for Institutional and the benchmark. |
| (c) | The Fund acquired all of the assets and liabilities of Lake Como Convertible Bond Fund L.P. (the “Predecessor Fund”) in a tax-free reorganization on December 6, 2019. In connection with this acquisition, shares of the Predecessor Fund were exchanged for Institutional shares of the Fund, so the Predecessor Fund became the Institutional shares of the Fund. The Fund’s investment objective, policies and guidelines are, in all material respects, equivalent to the Predecessor Fund’s investment objectives, policies and guidelines. The Predecessor Fund commenced operations in March 2017. Updated performance information will be available at no cost by calling 1-800-253-0412 or visiting the Fund’s website at www.rationalmf.com. |
| (d) | The S&P 500 Total Return Index, a registered trademark of S&P Global., Inc., is a market capitalization-weighted index of 500 widely held common stocks. Investors cannot invest directly in an Index. |
| (e) | The Bloomberg Barclays US Convertible TR Index: An index used to represent the US convertible bond asset class |
| (f) | The ICE BofA Investment Grade U.S. Convertible 5% Constrained Index (VX5C) is a market-capitalization-weighted index of domestic corporate convertible securities. Bonds and preferred stocks must be convertible only to common stock, ADRs or cash equivalent and have a market value of at least $50 million. It includes Coupon, OID, or zero coupon convertible bonds rated by Moody’s and/or S&P with an average rating of Baa3/BBB- or higher. All positions are capped at 5% of market value. |
Comparison of the Change in Value of a $10,000 Investment
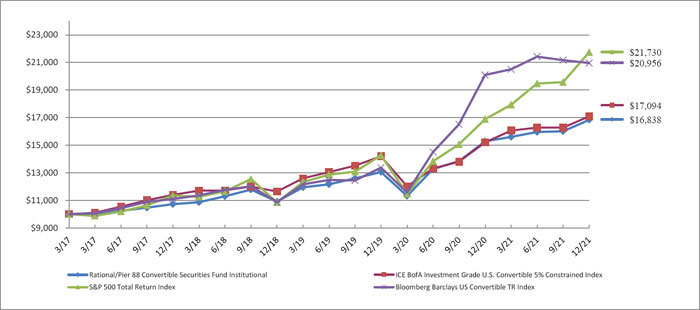
| Top 10 Holdings by Industry | | % of Net Assets | |
| Medical Equipment & Devices | | | 15.0 | % |
| Electric Utilities | | | 11.7 | % |
| Software | | | 11.7 | % |
| Semiconductors | | | 10.1 | % |
| Asset Management | | | 10.0 | % |
| Banking | | | 8.3 | % |
| Internet Media & Services | | | 5.8 | % |
| Machinery | | | 3.7 | % |
| Technology Services | | | 3.2 | % |
| Transportation Equipment | | | 3.1 | % |
| Other/Short-Term Investments | | | 17.4 | % |
| | | | 100.0 | % |
Please refer to the Schedule of Investments for a more detailed breakdown of the Fund’s assets.
Unaudited
December 31, 2021
Rational Special Situations Income Fund
Dear Fellow Shareholders,
The Rational Special Situations Income Fund (the “Fund”) returned +0.52% (Class I) in December, bringing the 2021 total return to +5.30%. This compares favorably with both the Barclays U.S. Aggregate Bond Index1 (down 0.26% this month and down 1.54% for the year) and the Bloomberg Barclays U.S. Mortgage Backed Securities Index2 (down 0.09% this month and down 1.04% for the year).
Bond indices were hurt this year by rising interest rates. For example, the 5-year Treasury yield rose by 90 bps and the 10-year yield rose by 60 bps. We have well below average interest rate exposure in our fund since a majority of our holdings are floating rate instruments, and most of the fixed rate instruments we hold have either shorter terms or idiosyncratic aspects that effectively reduce their duration.
The biggest economic story of the year was inflation. The latest CPI numbers (released in early December) show a 6.8% YOY increase in consumer prices. While this is far above the Fed’s stated target, we still believe that inflation is nearing its end. Recent inflation was caused by pandemic-related stimulus, pent-up demand, and supply chain issues; all three of these effects are transitory.
Inflation itself, of course, has the effect of reducing the real debt burden of homeowners relative to the value of their collateral, so it can be a positive for mortgagor creditworthiness, all other things being equal.
Even if inflation does lead to rate hikes from the Federal Reserve, we do not expect our portfolio to be hurt very much; however, we do plan to keep a cash buffer of approximately 5-10% of NAV in order to take advantage of dislocations that may arise from a sell-off.
Investment Strategy
The Fund seeks to achieve its investment objective by primarily investing in agency and non-agency residential and commercial mortgage-backed securities, with a focus on non- agency residential mortgage backed securities. Non-agency residential mortgage-backed securities are collateralized by pools of residential mortgages which are not insured by government sponsored enterprises (“GSEs”) or government agencies, including the Federal National Mortgage Association (FNMA), Federal Home Loan Mortgage Corporation (FHLMC) and Government National Mortgage Association (GNMA). Many of the mortgages underlying non-agency mortgage-backed securities are non-conforming (not eligible for GSE or agency purchase) for a variety of reasons, including loan size above GSE limits, incomplete documentation of assets or income, excessive borrower debt-to-income ratio (as defined by the GSEs), or unusual loan terms for which GSEs have not established programs. The Fund’s non-agency mortgage-backed securities investments have a wide variety of payment characteristics and preferences and can have fixed or floating interest rates. The Fund may also invest in collateralized debt obligations (“CDOs”), collateralized loan obligations (“CLOs”) and other asset-backed securities, including those backed by credit card receivables, auto loans, aircraft leases and student loans.
Fund Performance
We had considerable success this year in finding securitized loans where the number of underlying loans is small and can be analyzed individually. Mid-year, we profited off of an RMBS in which a majority of the delinquencies (in dollar terms) consisted of a single large defaulted loan. The borrower had been delinquent for 10 years and the market was clearly assuming that there was little chance of recovery.
We identified that the homeowner was in bankruptcy and tracked down the particular court case. We found that the approved bankruptcy plan included paying off the loan (remaining principal, interest and penalties) in full. Since the market ignored this fact (even though it was publicly available information), the bond was being significantly undervalued. When the house was finally sold, the money was paid out to bondholders, which produced an approximately 14 bp absolute return for the Fund.
Along the same lines, we have had success in the CMBS space where there were only a few remaining loans, and they are amenable to detailed credit analysis. We believe that we will continue to find opportunities in the CMBS space without having to take excessive credit risk on the sector as a whole. Our focus, however, remains in the RMBS space.
In February, we benefited from one of our long-term special situation trades paying off. It involved litigation over breaches of representation and warranties by UBS when it underwrote a certain bond issue back in 2006. We had realized gains during the previous year, but a significant additional bump in performance came toward the end February 2021.
A similar special situations trade paid off at the end of the year, when litigation came to a close and the trust administrator finally posted a notice declaring that a final distribution order had been certified, which means that a very favorable settlement payout will happen at the end of January 2022.
We have several other special situation trades in progress. One involves litigation that we are not a party to, though we believe that we understand the case much better than most market players and that this will give us a significant advantage in trading. A few of the others either involve preparation for imminent litigation or are in the active discussion/negotiation stage with adverse parties.
The Fund’s total annualized returns through 12/31/21 as compared to the Fund’s benchmarks were as follows:
Performance (%): Ending December 31, 2021
Annualized if greater than a year
| Share Class/Benchmark | 1 Year | 3 Years | 5 Years | 10 Years | Since Inception* |
| Class I | 5.30 | 5.39 | 8.60 | 10.96 | 14.06 |
| Barclays US Agg TR Index | -1.54 | 4.79 | 3.57 | 2.90 | 3.88 |
| Bloomberg MBS TR Index | -1.04 | 3.01 | 2.50 | 2.28 | 3.09 |
| Class A | 5.00 | 5.10 | 8.31 | 10.67 | 13.78 |
| Class C | 4.22 | 4.32 | 7.50 | 9.85 | 12.93 |
| Class A w/ Sales Charge | 0.01 | 3.42 | 7.26 | 10.13 | 13.34 |
| * | Inception: 02/01/2009. The performance shown prior to July 17, 2019 is that of the Predecessor Fund, which reflects all of the Predecessor Fund’s actual fees and expenses adjusted to include any fees of each share class. |
The Fund’s maximum sales charge for Class “A” shares is 4.75%. Investments in mutual funds involve risks. Performance is historic and does not guarantee future results. Investment return and principal value will fluctuate with changing market conditions so that when redeemed, shares may be worth more or less than their original cost. Current performance may be lower or higher than the performance data quoted. To obtain the most recent month-end performance information or the Fund’s prospectus please call the Fund, toll free at 1-800-253-0412. You can also obtain a prospectus at www.RationalMF.com.
Summary
We remain optimistic about trading opportunities in our space. Yields continue to exceed that of similar, more heavily analyzed instruments, and special situation trades abound.
We thank you for your continued support.
Sincerely,
Eric S. Meyer and William Van de Water
Portfolio Managers
This report is intended for the Fund’s shareholders. It may not be distributed to prospective investors unless it is preceded or accompanied by the current Fund prospectus. To obtain a prospectus or other information about the Fund, please visit www.RationalMF.com or call 1-800-253-0412. Please read the prospectus carefully before investing.
Rational Special Situations Income Fund is distributed by Northern Lights Distributors, LLC, Member FINRA/SIPC Rational Advisors, Inc.is not affiliated with Northern Lights Distributors, LLC.
| (1) | The Barclays U.S. Aggregate Bond Index is a broad-based flagship benchmark that measures the investment grade, US dollar-denominated, fixed-rate taxable bond market. The index includes Treasuries, government-related and corporate securities, MBS (agency fixed-rate and hybrid ARM pass-throughs), ABS and CMBS (agency and non-agency). Please note that indices do not take into account any fees and expenses of investing in the individual securities that they track, and individuals cannot invest directly in any index, although individuals may invest in exchange traded funds or other investment vehicles that attempt to track the performance of an index. The Catalyst Insider Income Fund may or may not purchase the types of securities represented by the Barclays U.S. Aggregate Bond Index. |
| (2) | Bloomberg MBS TR Index tracks fixed-rate agency mortgage backed passthrough securities guaranteed by Ginnie Mae (GNMA), Fannie Mae (FNMA), and Freddie Mac (FHLMC). The index is constructed by grouping individual TBA-deliverable MBS pools into aggregates or generics based on program, coupon, and vintage. |
5156-NLD-01212022
Rational Special Situations Income Fund
PORTFOLIO REVIEW (Unaudited)
December 31, 2021
The Fund’s performance figures* for each of the periods ended December 31, 2021, compared to its benchmarks:
| | | Annualized | Annualized | Annualized | Annualized |
| | 1 Year Return | 5 Year Return | 10 Year Return | Since Inception(a) | Since Inception(b) |
| Institutional (c) | 5.30% | 8.60% | 10.96% | N/A | 14.06% |
| Class A | 5.00% | N/A | N/A | 3.80% | N/A |
| Class A with load | 0.01% | N/A | N/A | 1.76% | N/A |
| Class C | 4.22% | N/A | N/A | 3.04% | N/A |
| Barclays U.S. Aggregate Bond Index (d) | (1.54)% | 3.57% | 2.90% | 3.39% | 3.88% |
Bloomberg Barclays U.S. Mortgage
Backed Securities Index (e) | (1.04)% | 2.50% | 2.28% | 1.89% | 3.09% |
| * | The performance data quoted here represents past performance. Current performance may be lower or higher than the performance data quoted above. Investment return and principal value will fluctuate, so that shares, when redeemed, may be worth more or less than their original cost. The returns shown do not reflect the deduction of taxes that a shareholder would pay on Fund distributions or on the redemptions of Fund shares. Past performance is no guarantee of future results. Performance figures for periods greater than 1 year are annualized. Per the fee table in the Fund’s May 1, 2021 prospectus, the total annual operating expense are 1.81% for Institutional shares, 2.11% for Class A shares and 2.78% for Class C shares before fee waivers. See the financial highlights for current expense ratios. For performance information current to the most recent month-end, please call toll-free 1-800-253-0412. Class A shares are subject to a maximum load of 4.75%. |
| (a) | Inception date is July 17, 2019 for Class A, Class C and the benchmarks. |
| (b) | Inception date is February 1, 2009 for Institutional and the benchmarks. |
| (c) | The Fund acquired all of the assets and liabilities of ESM Fund I, L.P. (the “Predecessor Fund”) in a tax-free reorganization on July 17, 2019. In connection with this acquisition, shares of the Predecessor Fund were exchanged for Institutional shares of the Fund, so the Predecessor Fund became the Institutional shares of the Fund. The Fund’s investment objective, policies and guidelines are, in all material respects, equivalent to the Predecessor Fund’s investment objectives, policies and guidelines. The Predecessor Fund commenced operations in February 2009. Updated performance information will be available at no cost by calling 1-800-253-0412 or visiting the Fund’s website at www.RationalMF.com. |
| (d) | The Bloomberg Barclays U.S. Aggregate Bond Index is a market capitalization-weighted index that is designed to measure the performance of the U.S. investment grade bond market with maturities of more than one year. Investors cannot invest directly in an Index. |
| (e) | The Bloomberg Barclays U.S. Mortgage Backed Securities Index tracks agency mortgage pass-through securities. Investors cannot invest directly in an Index. |
Comparison of the Change in Value of a $10,000 Investment
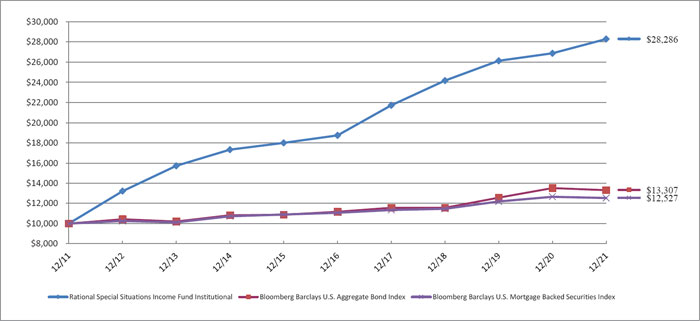
| Holdings by Asset Type | | % of Net Assets | |
| Collateralized Mortgage Obligations | | | 35.4 | % |
| Non Agency CMBS | | | 13.9 | % |
| Home Equity | | | 12.0 | % |
| Insurance | | | 11.0 | % |
| Residential Mortgage | | | 7.9 | % |
| Syndicated Loans | | | 3.3 | % |
| CDO | | | 2.8 | % |
| Manufactured Housing | | | 1.8 | % |
| Specialty Finance | | | 1.5 | % |
| Other ABS | | | 1.4 | % |
| Other/Short-Term Investments | | | 9.0 | % |
| | | | 100.0 | % |
Please refer to the Schedule of Investments for a more detailed breakdown of the Fund’s assets.
| December 31, 2021 | unaudited |
Rational Inflation Growth Fund
Dear Fellow Shareholders,
The Rational Inflation Growth Fund (the “Fund”) seeks to achieve its investment objective by investing in securities that the Sub-Advisor expects to increase with elevated U.S. inflation or with expectations of higher U.S. inflation.
The Fund primarily invests in the common stock of domestic and foreign companies, including ADRs and REITs, with any market capitalization within sectors and/or asset classes that the Sub-Advisor believes to have a strong positive correlation to inflation, including, but not limited to, real estate, infrastructure, energy, blockchain technology services and commodities.
The Fund may also invest in ETFs to gain exposure to a sector or asset class when obtaining the desired exposure is not available through investment in common stocks or when investment indirectly through an ETF would otherwise be beneficial to the Fund.
Fund Performance
The Fund launched in August 2021, meaning it was in operation for just over four months of the year. During this period, it returned -1.26% (IGOIX) versus its index, which was +5.01%. Longer term inflation expectations moderated during 4Q21 as markets priced in more hawkish Federal Reserve policy. This caused the yield curve to flatten, which caused losses on the Fund’s interest rate futures positions and led to inflation-sensitive stocks to lag the broader market. For example, financials (as defined by the Financial Select Sector TR Index, IXMTR) lagged the S&P500 by 4.40%, precious metals (defined by the LBMA Gold Price AM Index, GOLDLNAM) lagged the S&P500 by 7.07%, and leisure and entertainment (as defined by the Dynamic Leisure & Entertainment Intellidex Index, DZLTRlagged the S&P500 by 6.35%.
Performance (%): Ending December 31, 2021
Annualized if greater than a year
| | QTD | YTD | I Year | 3 Year | Inception* |
| Class I | 0.55 | n/a | n/a | n/a | -1.26 |
| 60% S&P 500 TR Index/40% LBUSTRUU Index1 | 6.57 | n/a | n/a | n/a | 5.01 |
| Class A | 0.42 | n/a | n/a | n/a | -1.39 |
| Class C | 0.31 | n/a | n/a | n/a | -1.60 |
| Class A w/ Sales Charge | -5.36 | n/a | n/a | n/a | -7.06 |
Maximum sales charge for Class A is 5.75%. Maximum Deferred Sales Charge of 1.00% on Class C Shares applies to shares sold within 12 months of purchase. The performance data quoted here represents past performance. Current performance may be lower or higher than the performance data quoted above. Investment return and principal value will fluctuate, so that shares, when redeemed, may be worth more or less than their original cost. Past performance is no guarantee of future results. To obtain the most recent month end performance information or the Fund’s prospectus please call 800-253-0412 or visit www.RationalMF.com.
Results shown reflect the waiver, without which the results could have been lower. A fund’s performance, especially for very short periods of time, should not be the sole factor in making your investment decisions.
Gross expense ratios were 2.46%, 3.21%, and 2.21% for Class A, C, and I share, respectively. Net expense ratios were 1.85%, 2.60%, and 1.60% for Class A, C, and I share, respectively. The Fund’s investment advisor has contractually agreed to waive all or a portion of its management fee and/or reimburse certain operating expenses of the Fund to the extent necessary in order to limit the Total Annual Fund Operating Expenses to not more than 1.49%, 1.74%, and 2.49% of the daily net assets of the Fund’s Institutional, Class A, and Class C shares, respectively, through April 30, 2023.
Summary
The Sub-Advisor believes that inflation is likely to remain persistently higher than the Federal Reserve’s long term 2% target and that the Fund’s investments should deliver positive returns with such an outcome.
| Simon Lack | Henry Hoffman |
| Portfolio Manager | Portfolio Manager |
This report is intended for the Fund’s shareholders. It may not be distributed to prospective investors unless it is preceded or accompanied by the current Fund prospectus. To obtain a prospectus or other information about the Fund, please visit www.RationalMF.com or call 1-800-253-0412. Please read the prospectus carefully before investing.
| 1 | The 60% S&P 500 TR Index/40% LBUSTRUU Index represents a blended index consisting of 60% of returns generated from the S&P 500 TR Index and 40% of returns generated from the Bloomberg U.S. Aggregate Bond Index. |
Important Risk Information:
As with any mutual fund, there is no guarantee that the Fund will achieve its objective. Investment markets are unpredictable and there will be certain market conditions where the Fund will not meet its investment objective and will lose money. The Fund has a limited history of operations for investors to evaluate. If the Fund is unable to achieve an economic size, expenses will be higher than expected and the Fund might close, which could produce adverse tax consequences for shareholders.
There is no guarantee that the value of the Fund’s investments will increase with inflation or with the expectation of higher inflation in the future. It is possible that the Fund’s investments may be negatively correlated with inflation trends or show no such correlation at all, either because the estimate of correlation by the Sub-Advisor or its proprietary model was wrong or because the correlation in the market changed. Historic correlation is no guarantee of future correlation.
ADRs are subject to the same risks as direct investment in foreign companies discussed below and involve risks that are not found in investments in U.S. companies. ADRs may not track the price of the underlying foreign securities on which they are based, and their value may change materially at times when U.S. markets are not open for trading.
Like a mutual fund, the value of an ETF can fluctuate based on the prices of the securities owned by the ETF. Because the Fund may invest its assets in ETFs that have their own fees and expenses in addition to those charged directly by the Fund, the Fund may bear higher expenses than a fund that invests directly in individual securities.
The Fund’s investments in REITs are subject to the same risks as direct investments in real estate, including sensitivity to general economic downturns and the volatility of local real estate markets.
The Fund is distributed by NLD Distributors, LLC. (Member FINRA) Rational Funds, the subadvisor and and NLD Distributors, LLC are separate and unaffiliated.
8021-NLD-1/25/2022
| Rational Inflation Growth Fund |
| PORTFOLIO REVIEW (Unaudited) |
| December 31, 2021 |
The Fund’s performance figures* for each of the periods ended December 31, 2021, compared to its benchmarks:
| | Annualized |
| | Since Inception(a) |
| Institutional | (1.26)% |
| Class A | (1.39)% |
| Class A with load | (7.06)% |
| Class C | (1.60)% |
| 60% S&P 500/40% Bloomberg Barclays Aggregate Index (b) | 5.01% |
| S&P 500 Total Return Index (c) | 8.86% |
| Barclays U.S. Aggregate Bond Index (d) | (0.79)% |
| * | The performance data quoted here represents past performance. Current performance may be lower or higher than the performance data quoted above. Investment return and principal value will fluctuate, so that shares, when redeemed, may be worth more or less than their original cost. The returns shown do not reflect the deduction of taxes that a shareholder would pay on Fund distributions or on the redemptions of Fund shares. Past performance is no guarantee of future results. Performance figures for periods greater than 1 year are annualized. Per the fee table in the Fund’s August 18, 2021 prospectus, the total annual operating expense are 2.21% for Institutional shares, 2.46% for Class A shares and 3.21% for Class C shares before fee waivers. See the financial highlights for current expense ratios. For performance information current to the most recent month-end, please call toll-free 1-800-253-0412. Class A shares are subject to a maximum load of 5.75%. |
| (a) | Inception date is August 18, 2021 for Class A, Class C, Institutional and the benchmarks. |
| (b) | The 60% S&P 500/40% Bloomberg Barclays Aggregate Index is a hypothetical combination of unmanaged indices comprised of 60% S&P 500 Index and 40% Bloomberg U.S. Aggregate Bond Index, representing the Company’s neutral mix of 60% stocks and 40% bonds. |
| (c) | The S&P 500 Total Return Index, a registered trademark of S&P Global., Inc., is a market capitalization-weighted index of 500 widely held common stocks. Investors cannot invest directly in an Index. |
| (d) | The Bloomberg Barclays U.S. Aggregate Bond Index is a market capitalization-weighted index that is designed to measure the performance of the U.S. investment grade bond market with maturities of more than one year. Investors cannot invest directly in an Index. |
Comparison of the Change in Value of a $10,000 Investment
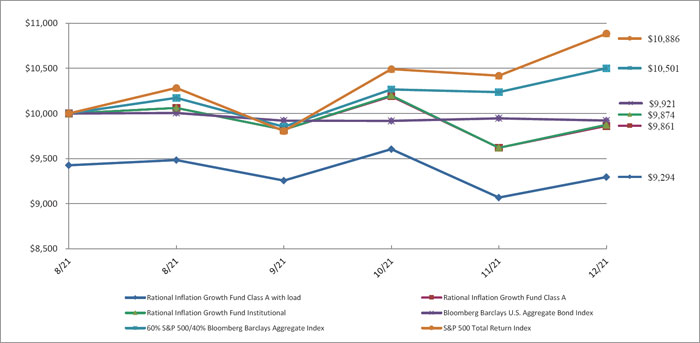
| Holdings by Asset Type | | % of Net Assets | |
| Commodity | | | 21.8 | % |
| Metals & Mining | | | 17.9 | % |
| Oil & Gas Producers | | | 13.1 | % |
| Reits | | | 6.3 | % |
| Insurance | | | 5.8 | % |
| Chemicals | | | 5.0 | % |
| Banks | | | 4.4 | % |
| Leisure Facilities & Services | | | 3.4 | % |
| Technology Services | | | 2.7 | % |
| Electric Utilities | | | 2.5 | % |
| Other/Short-Term Investments | | | 17.1 | % |
| | | | 100.0 | % |
Please refer to the Schedule of Investments for a more detailed breakdown of the Fund’s assets.
RATIONAL EQUITY ARMOR FUND
SCHEDULE OF INVESTMENTS
December 31, 2021
| Shares | | | | | Fair Value | |
| | | | | COMMON STOCKS — 88.3% | | | | |
| | | | | APPAREL & TEXTILE PRODUCTS - 1.2% | | | | |
| | 20,439 | | | Tapestry, Inc. | | $ | 829,823 | |
| | | | | | | | | |
| | | | | ASSET MANAGEMENT - 1.3% | | | | |
| | 13,484 | | | Stifel Financial Corporation | | | 949,543 | |
| | | | | | | | | |
| | | | | AUTOMOTIVE - 1.9% | | | | |
| | 65,340 | | | Ford Motor Company | | | 1,357,112 | |
| | | | | | | | | |
| | | | | BANKING - 10.1% | | | | |
| | 40,120 | | | Bank of America Corporation | | | 1,784,939 | |
| | 38,134 | | | Fifth Third Bancorp | | | 1,660,736 | |
| | 16,400 | | | JPMorgan Chase & Company | | | 2,596,940 | |
| | 21,553 | | | US Bancorp | | | 1,210,632 | |
| | | | | | | | 7,253,247 | |
| | | | | BIOTECH & PHARMA - 5.8% | | | | |
| | 9,197 | | | AbbVie, Inc. | | | 1,245,274 | |
| | 11,783 | | | Johnson & Johnson | | | 2,015,717 | |
| | 17,636 | | | Pfizer, Inc. | | | 1,041,406 | |
| | | | | | | | 4,302,397 | |
| | | | | CHEMICALS - 3.4% | | | | |
| | 7,213 | | | Celanese Corporation | | | 1,212,217 | |
| | 22,347 | | | Olin Corporation | | | 1,285,399 | |
| | | | | | | | 2,497,616 | |
| | | | | COMMERCIAL SUPPORT SERVICES - 2.7% | | | | |
| | 11,548 | | | Waste Management, Inc. | | | 1,927,361 | |
| | | | | | | | | |
| | | | | E-COMMERCE DISCRETIONARY - 1.1% | | | | |
| | 243 | | | Amazon.com, Inc.(a) | | | 810,245 | |
| | | | | | | | | |
| | | | | ELECTRIC UTILITIES - 2.4% | | | | |
| | 14,504 | | | Exelon Corporation | | | 837,751 | |
| | 13,126 | | | Southern Company (The) | | | 900,181 | |
| | | | | | | | 1,737,932 | |
See accompanying notes to financial statements.
RATIONAL EQUITY ARMOR FUND
SCHEDULE OF INVESTMENTS (Continued)
December 31, 2021
| Shares | | | | | Fair Value | |
| | | | | COMMON STOCKS — 88.3% (Continued) | | | | |
| | | | | FOOD - 4.6% | | | | |
| | 9,548 | | | Hershey Company (The) | | $ | 1,847,252 | |
| | 17,153 | | | Tyson Foods, Inc., Class A | | | 1,495,055 | |
| | | | | | | | 3,342,307 | |
| | | | | HEALTH CARE FACILITIES & SERVICES - 1.7% | | | | |
| | 2,410 | | | UnitedHealth Group, Inc. | | | 1,210,157 | |
| | | | | | | | | |
| | | | | HOME CONSTRUCTION - 4.1% | | | | |
| | 8,712 | | | Lennar Corporation, Class A | | | 1,011,986 | |
| | 28,227 | | | Masco Corporation | | | 1,982,100 | |
| | | | | | | | 2,994,086 | |
| | | | | INSTITUTIONAL FINANCIAL SERVICES - 7.0% | | | | |
| | 4,201 | | | CME Group, Inc. | | | 959,760 | |
| | 4,944 | | | Goldman Sachs Group, Inc. (The) | | | 1,891,328 | |
| | 15,179 | | | Morgan Stanley | | | 1,489,971 | |
| | 3,624 | | | Nasdaq, Inc. | | | 761,076 | |
| | | | | | | | 5,102,135 | |
| | | | | INTERNET MEDIA & SERVICES - 2.3% | | | | |
| | 582 | | | Alphabet, Inc., Class A(a) | | | 1,686,077 | |
| | | | | | | | | |
| | | | | LEISURE FACILITIES & SERVICES - 1.4% | | | | |
| | 6,677 | | | Darden Restaurants, Inc. | | | 1,005,823 | |
| | | | | | | | | |
| | | | | MACHINERY - 5.2% | | | | |
| | 8,852 | | | Caterpillar, Inc. | | | 1,830,062 | |
| | 5,814 | | | Deere & Company | | | 1,993,563 | |
| | | | | | | | 3,823,625 | |
| | | | | MEDICAL EQUIPMENT & DEVICES - 0.9% | | | | |
| | 3,870 | | | Agilent Technologies, Inc. | | | 617,846 | |
| | | | | | | | | |
| | | | | OIL & GAS PRODUCERS - 6.3% | | | | |
| | 28,917 | | | ConocoPhillips | | | 2,087,229 | |
See accompanying notes to financial statements.
RATIONAL EQUITY ARMOR FUND
SCHEDULE OF INVESTMENTS (Continued)
December 31, 2021
| Shares | | | | | Fair Value | |
| | | | | COMMON STOCKS — 88.3% (Continued) | | | | |
| | | | | OIL & GAS PRODUCERS - 6.3% (Continued) | | | | |
| | 40,879 | | | Exxon Mobil Corporation | | $ | 2,501,386 | |
| | | | | | | | 4,588,615 | |
| | | | | REITS – 4.1% | | | | |
| | 41,491 | | | Gaming and Leisure Properties, Inc. | | | 2,018,953 | |
| | 2,583 | | | Public Storage | | | 967,488 | |
| | | | | | | | 2,986,441 | |
| | | | | RETAIL - DISCRETIONARY - 1.1% | | | | |
| | 6,725 | | | AutoNation, Inc.(a) | | | 785,816 | |
| | | | | | | | | |
| | | | | SEMICONDUCTORS - 3.9% | | | | |
| | 12,394 | | | Applied Materials, Inc. | | | 1,950,320 | |
| | 5,792 | | | Skyworks Solutions, Inc. | | | 898,571 | |
| | | | | | | | 2,848,891 | |
| | | | | SOFTWARE - 3.6% | | | | |
| | 4,861 | | | Microsoft Corporation | | | 1,634,852 | |
| | 11,083 | | | Oracle Corporation | | | 966,548 | |
| | | | | | | | 2,601,400 | |
| | | | | TECHNOLOGY HARDWARE - 2.8% | | | | |
| | 5,811 | | | Apple, Inc. | | | 1,031,860 | |
| | 15,731 | | | Cisco Systems, Inc. | | | 996,873 | |
| | | | | | | | 2,028,733 | |
| | | | | TECHNOLOGY SERVICES - 2.0% | | | | |
| | 3,454 | | | Accenture plc, Class A | | | 1,431,856 | |
| | | | | | | | | |
| | | | | TRANSPORTATION EQUIPMENT - 2.5% | | | | |
| | 8,273 | | | Cummins, Inc. | | | 1,804,672 | |
| | | | | | | | | |
| | | | | WHOLESALE - CONSUMER STAPLES - 4.9% | | | | |
| | 30,340 | | | Archer-Daniels-Midland Company | | | 2,050,680 | |
| | 16,091 | | | Bunge Ltd. | | | 1,502,256 | |
| | | | | | | | 3,552,936 | |
| | | | | | | | | |
| | | | | TOTAL COMMON STOCKS (Cost $53,114,117) | | | 64,076,692 | |
See accompanying notes to financial statements.
RATIONAL EQUITY ARMOR FUND
SCHEDULE OF INVESTMENTS (Continued)
December 31, 2021
| Shares | | | | | | | | | | | | | | | Fair Value | |
| | | | | SHORT-TERM INVESTMENTS — 4.0% | | | | | |
| | | | | MONEY MARKET FUNDS - 4.0% | | | | | |
| | 2,882,062 | | | First American Government Obligations Fund, Class U, 0.03% (Cost $2,882,062)(b) | | | $ | 2,882,062 | |
| | | | | | | | | | | | | | | | | | | | | |
| | | | | | | | | | | | | | | | | | | | | |
| Contracts(c) | | | | | Counterparty | | Expiration Date | | Exercise Price | | | Notional Value | | | | | |
| | | | | CALL OPTIONS PURCHASED - 3.2% | | | |
| | | | | CALL OPTIONS PURCHASED - 3.2% | | | | | |
| | 275 | | | S&P 500 Index Future, Maturing March 2022 | | WEDX | | 12/16/2022 | | $ | 5,100 | | | $ | 70,125,000 | | | $ | 2,351,251 | |
| | | | | TOTAL CALL OPTIONS PURCHASED (Cost - $1,928,438) | | | | | |
| | | | | | | | | | |
| | | | | TOTAL INVESTMENTS - 95.5% (Cost $57,924,617) | | | $ | 69,310,005 | |
| | | | | CALL OPTIONS WRITTEN - (0.8)% (Proceeds - $477,813) | | | | (543,125 | ) |
| | | | | OTHER ASSETS IN EXCESS OF LIABILITIES- 5.3% | | | | 3,837,568 | |
| | | | | NET ASSETS - 100.0% | | | $ | 72,604,448 | |
| | | | | | | | | | | | | | | | | | | | | |
| Contracts(c) | | | | | Counterparty | | Expiration Date | | Exercise Price | | | Notional Value | | | | | |
| | | | | WRITTEN CALL OPTIONS - (0.8)% | | | |
| | | | | CALL OPTIONS WRITTEN- (0.8)% | | | | | |
| | 275 | | | S&P 500 Index Future, Maturing March 2022 | | WEDX | | 12/16/2022 | | $ | 5,600 | | | $ | 77,000,000 | | | $ | 543,125 | |
| | | | | TOTAL CALL OPTIONS WRITTEN (Proceeds - $477,813) | | | | | |
| OPEN FUTURES CONTRACTS |
Number of
Contracts | | | Open Long Futures Contracts | | Expiration | | Notional Amount(d) | | | Unrealized
Depreciation | |
| | 390 | | | CBOE Volatility Index Future | | 03/15/2022 | | $ | 9,152,716 | | | $ | (834,159 | ) |
| | 187 | | | CBOE Volatility Index Future | | 04/20/2022 | | | 4,617,273 | | | | (85,698 | ) |
| | | | | TOTAL FUTURES CONTRACTS | | | | | | | | $ | (919,857 | ) |
| OPEN FUTURES CONTRACTS |
Number of
Contracts | | | Open Short Futures Contracts | | Expiration | | Notional Amount(d) | | | Unrealized
Appreciation | |
| | 115 | | | CBOE Volatility Index Future | | 01/19/2022 | | $ | 2,262,568 | | | $ | 491,105 | |
| | 52 | | | CBOE Volatility Index Future | | 02/16/2022 | | | 1,142,466 | | | | 40,422 | |
| | | | | TOTAL FUTURES CONTRACTS | | | | | | | | $ | 531,527 | |
| PLC | - Public Limited Company |
| REIT | - Real Estate Investment Trust |
| (a) | Non-income producing security. |
| (b) | Rate disclosed is the seven day effective yield as of December 31, 2021. |
| (c) | Each contract is equivalent to one futures contract. |
| (d) | The amounts shown are the underlying reference notional amounts to stock exchange indices and equities upon which the fair value of the futures contracts held by the Fund are based. Notional values do not represent the current fair value of, and are not necessarily indicative of the future cash flows of the Fund’s futures contracts. Further, the underlying price changes in relation to the variables specified by the notional values affects the fair value of these derivative financial instruments. The notional values as set forth within this schedule do not purport to represent economic value at risk to the Fund. |
See accompanying notes to financial statements.
RATIONAL TACTICAL RETURN FUND
SCHEDULE OF INVESTMENTS
December 31, 2021
| Shares | | | | | Fair Value | |
| | | | | SHORT-TERM INVESTMENTS — 65.2% | | | | |
| | | | | MONEY MARKET FUNDS - 65.2% | | | | |
| | 190,637,306 | | | First American Government Obligations Fund, Class U, 0.03% (Cost $190,637,306)(a) | | $ | 190,637,306 | |
| | | | | | | | | |
| | | | | TOTAL INVESTMENTS - 65.2% (Cost $190,637,306) | | $ | 190,637,306 | |
| | | | | OTHER ASSETS IN EXCESS OF LIABILITIES- 34.8% | | | 101,858,097 | |
| | | | | NET ASSETS - 100.0% | | $ | 292,495,403 | |
| (a) | Rate disclosed is the seven day effective yield as of December 31, 2021. |
See accompanying notes to financial statements.
RATIONAL DYNAMIC BRANDS FUND
SCHEDULE OF INVESTMENTS
December 31, 2021
| Shares | | | | | Fair Value | |
| | | | | COMMON STOCKS — 100.4% | | | | |
| | | | | APPAREL & TEXTILE PRODUCTS - 8.2% | | | | |
| | 27,700 | | | LVMH Moet Hennessy Louis Vuitton S.E. - ADR | | $ | 4,584,350 | |
| | 26,939 | | | NIKE, Inc., Class B | | | 4,489,923 | |
| | | | | | | | 9,074,273 | |
| | | | | ASSET MANAGEMENT - 10.3% | | | | |
| | 43,300 | | | Blackstone, Inc. | | | 5,602,587 | |
| | 77,500 | | | KKR & Company, Inc. | | | 5,773,750 | |
| | | | | | | | 11,376,337 | |
| | | | | AUTOMOTIVE - 4.4% | | | | |
| | 4,500 | | | Ferrari N.V. | | | 1,164,690 | |
| | 1,825 | | | Tesla, Inc.(a) | | | 1,928,624 | |
| | 60,000 | | | Volkswagen A.G. - ADR | | | 1,752,000 | |
| | | | | | | | 4,845,314 | |
| | | | | E-COMMERCE DISCRETIONARY - 4.2% | | | | |
| | 1,391 | | | Amazon.com, Inc.(a) | | | 4,638,067 | |
| | | | | | | | | |
| | | | | HOME CONSTRUCTION - 0.5% | | | | |
| | 5,000 | | | Lennar Corporation, Class A | | | 580,800 | |
| | | | | | | | | |
| | | | | HOUSEHOLD PRODUCTS - 2.2% | | | | |
| | 6,500 | | | Estee Lauder Companies, Inc. (The), Class A | | | 2,406,300 | |
| | | | | | | | | |
| | | | | INTERNET MEDIA & SERVICES - 16.1% | | | | |
| | 19,900 | | | Airbnb, Inc., CLASS A(a) | | | 3,313,151 | |
| | 2,020 | | | Alphabet, Inc., Class A(a) | | | 5,852,021 | |
| | 16,500 | | | Expedia Group, Inc.(a) | | | 2,981,880 | |
| | 8,000 | | | Netflix, Inc.(a) | | | 4,819,520 | |
| | 14,000 | | | Zillow Group, Inc., Class C(a) | | | 893,900 | |
| | | | | | | | 17,860,472 | |
| | | | | LEISURE FACILITIES & SERVICES - 5.0% | | | | |
| | 36,600 | | | Caesars Entertainment, Inc.(a) | | | 3,423,198 | |
| | 1,220 | | | Chipotle Mexican Grill, Inc.(a) | | | 2,132,865 | |
| | | | | | | | 5,556,063 | |
See accompanying notes to financial statements.
RATIONAL DYNAMIC BRANDS FUND
SCHEDULE OF INVESTMENTS (Continued)
December 31, 2021
| Shares | | | | | Fair Value | |
| | | | | COMMON STOCKS — 100.4% (Continued) | | | | |
| | | | | MEDICAL EQUIPMENT & DEVICES - 3.1% | | | | |
| | 24,200 | | | Abbott Laboratories | | $ | 3,405,908 | |
| | | | | | | | | |
| | | | | RETAIL - CONSUMER STAPLES - 2.9% | | | | |
| | 3,874 | | | Costco Wholesale Corporation | | | 2,199,270 | |
| | 4,550 | | | Target Corporation | | | 1,053,052 | |
| | | | | | | | 3,252,322 | |
| | | | | RETAIL - DISCRETIONARY - 18.5% | | | | |
| | 10,500 | | | Home Depot, Inc. (The) | | | 4,357,605 | |
| | 15,000 | | | Lowe’s Companies, Inc. | | | 3,877,200 | |
| | 9,511 | | | Lululemon Athletica, Inc.(a) | | | 3,723,081 | |
| | 16,050 | | | RH(a) | | | 8,601,836 | |
| | | | | | | | 20,559,722 | |
| | | | | SOFTWARE - 4.9% | | | | |
| | 16,097 | | | Microsoft Corporation | | | 5,413,743 | |
| | | | | | | | | |
| | | | | TECHNOLOGY HARDWARE - 4.7% | | | | |
| | 29,156 | | | Apple, Inc. | | | 5,177,231 | |
| | | | | | | | | |
| | | | | TECHNOLOGY SERVICES - 15.4% | | | | |
| | 17,328 | | | Block, Inc., Class A(a) | | | 2,798,645 | |
| | 8,500 | | | Mastercard, Inc., Class A | | | 3,054,220 | |
| | 28,445 | | | PayPal Holdings, Inc.(a) | | | 5,364,158 | |
| | 27,128 | | | Visa, Inc., Class A | | | 5,878,909 | |
| | | | | | | | 17,095,932 | |
| | | | | | | | | |
| | | | | TOTAL COMMON STOCKS (Cost $96,010,297) | | | 111,242,484 | |
| | | | | | | | | |
| | | | | SHORT-TERM INVESTMENTS — 0.2% | | | | |
| | | | | MONEY MARKET FUNDS - 0.2% | | | | |
| | 177,647 | | | First American Government Obligations Fund, Class U, 0.03% (Cost $177,647)(b) | | | 177,647 | |
| | | | | | | | | |
| | | | | TOTAL INVESTMENTS - 100.6% (Cost $96,187,944) | | $ | 111,420,131 | |
| | | | | LIABILITIES IN EXCESS OF OTHER ASSETS - (0.6)% | | | (669,879 | ) |
| | | | | NET ASSETS - 100.0% | | $ | 110,750,252 | |
| ADR | - American Depositary Receipt |
| ETF | - Exchange-Traded Fund |
| NV | - Naamioze Vennootschap |
| (a) | Non-income producing security. |
| (b) | Rate disclosed is the seven day effective yield as of December 31, 2021. |
See accompanying notes to financial statements.
RATIONAL STRATEGIC ALLOCATION FUND
SCHEDULE OF INVESTMENTS
December 31, 2021
| Shares | | | | | Fair Value | |
| | | | | OPEN END FUNDS — 82.7% | | | | |
| | | | | ALTERNATIVE - 9.8% | | | | |
| | 103,185 | | | Catalyst Insider Income Fund, Class I(a) | | $ | 1,010,182 | |
| | | | | | | | | |
| | | | | FIXED INCOME - 72.9% | | | | |
| | 43,779 | | | AlphaCentric Income Opportunities Fund, Class I(a) | | | 532,796 | |
| | 160,742 | | | Catalyst Enhanced Income Strategy Fund, Class I(a) | | | 1,766,550 | |
| | 105,601 | | | Catalyst/CIFC Floating Rate Income Fund, Class I(a) | | | 1,015,884 | |
| | 96,310 | | | Catalyst/Stone Beach Income Opportunity Fund, Class I(a) | | | 806,129 | |
| | 90,146 | | | Rational Special Situations Income Fund, Institutional Class(a) | | | 1,774,959 | |
| | 138,101 | | | Rational/Pier 88 Convertible Securities Fund, Institutional Class(a) | | | 1,651,693 | |
| | | | | | | | 7,548,011 | |
| | | | | | | | | |
| | | | | TOTAL OPEN END FUNDS (Cost $8,229,089) | | | 8,558,193 | |
| | | | | | | | | |
| | | | �� | SHORT-TERM INVESTMENTS — 7.9% | | | | |
| | | | | MONEY MARKET FUNDS - 7.9% | | | | |
| | 815,854 | | | First American Government Obligations Fund, Class U, 0.03% (Cost $815,854)(b) | | | 815,854 | |
| | | | | | | | | |
| | | | | TOTAL INVESTMENTS - 90.6% (Cost $9,044,943) | | $ | 9,374,047 | |
| | | | | OTHER ASSETS IN EXCESS OF LIABILITIES- 9.4% | | | 975,865 | |
| | | | | NET ASSETS - 100.0% | | $ | 10,349,912 | |
| OPEN FUTURES CONTRACTS |
| Number of | | | | | | | | | | Unrealized | |
| Contracts | | | Open Long Futures Contracts | | Expiration | | Notional Amount(c) | | | Appreciation | |
| | 44 | | | CME E-Mini Standard & Poor’s 500 Index Future | | 03/18/2022 | | $ | 10,468,700 | | | $ | 225,560 | |
| | | | | TOTAL FUTURES CONTRACTS | | | | | | | | | | |
| (b) | Rate disclosed is the seven day effective yield as of December 31, 2021. |
| (c) | The amounts shown are the underlying reference notional amounts to stock exchange indices and equities upon which the fair value of the futures contracts held by the Fund are based. Notional values do not represent the current fair value of, and are not necessarily indicative of the future cash flows of the Fund’s futures contracts. Further, the underlying price changes in relation to the variables specified by the notional values affects the fair value of these derivative financial instruments. The notional values as set forth within this schedule do not purport to represent economic value at risk to the Fund. |
See accompanying notes to financial statements.
RATIONAL/RESOLVE ADAPTIVE ASSET ALLOCATION FUND
CONSOLIDATED SCHEDULE OF INVESTMENTS
December 31, 2021
| Shares | | | | | Fair Value | |
| | | | | SHORT-TERM INVESTMENTS — 93.2% | | | | |
| | | | | MONEY MARKET FUNDS - 93.2% | | | | |
| | 61,259,968 | | | First American Government Obligations Fund, Class U, 0.03%(a),(c) | | $ | 61,259,968 | |
| | | | | TOTAL SHORT-TERM INVESTMENTS (Cost $61,259,968) | | | 61,259,968 | |
| | | | | | | | | |
| | | | | TOTAL INVESTMENTS - 93.2% (Cost $61,259,968) | | $ | 61,259,968 | |
| | | | | OTHER ASSETS IN EXCESS OF LIABILITIES- 6.8% | | | 4,476,950 | |
| | | | | NET ASSETS - 100.0% | | $ | 65,736,918 | |
| OPEN FUTURES CONTRACTS |
Number of
Contracts | | | Open Long Futures Contracts | | Expiration | | Notional Amount(b) | | | Unrealized
Appreciation
(Depreciation) | |
| | 9 | | | CBOT 10 Year US Treasury Note | | 03/22/2022 | | $ | 1,174,221 | | | $ | (670 | ) |
| | 69 | | | CBOT 5 Year US Treasury Note | | 03/31/2022 | | | 8,347,413 | | | | 3,046 | |
| | 60 | | | CBOT Corn Future(c) | | 03/14/2022 | | | 1,779,750 | | | | 2,037 | |
| | 28 | | | CBOT Soybean Future(c) | | 03/14/2022 | | | 1,874,950 | | | | (26,738 | ) |
| | 30 | | | CBOT Soybean Meal Future(c) | | 03/14/2022 | | | 1,197,300 | | | | 92,500 | |
| | 22 | | | CBOT US Long Bond Future | | 03/22/2022 | | | 3,529,636 | | | | 7,573 | |
| | 15 | | | CBOT Wheat Future(c) | | 03/14/2022 | | | 578,063 | | | | (12,200 | ) |
| | 23 | | | CME British Pound Currency Future | | 03/14/2022 | | | 1,945,081 | | | | 28,962 | |
| | 14 | | | CME Canadian Dollar Currency Future | | 03/15/2022 | | | 1,106,700 | | | | 15,200 | |
| | 4 | | | CME E-Mini NASDAQ 100 Index Future | | 03/18/2022 | | | 1,305,664 | | | | (13,571 | ) |
| | 8 | | | CME E-mini Russell 2000 Index Futures | | 03/18/2022 | | | 897,120 | | | | 20,760 | |
| | 2 | | | CME Feeder Cattle Future(c) | | 03/31/2022 | | | 169,950 | | | | 2,375 | |
| | 8 | | | CME Lean Hogs Future(c) | | 02/14/2022 | | | 260,720 | | | | 410 | |
| | 28 | | | CME New Zealand Dollar Currency Future | | 03/14/2022 | | | 1,916,180 | | | | 18,260 | |
| | 6 | | | CME Nikkei 225 Index Future | | 03/10/2022 | | | 866,400 | | | | 2,300 | |
| | 2 | | | CME Swiss Franc Currency Future | | 03/14/2022 | | | 274,800 | | | | 3,162 | |
| | 31 | | | COMEX Copper Future(c) | | 03/29/2022 | | | 3,459,213 | | | | 81,725 | |
| | 18 | | | COMEX Gold 100 Troy Ounces Future(c) | | 02/24/2022 | | | 3,291,480 | | | | (16,850 | ) |
| | 29 | | | Eurex 30 Year Euro BUXL Future | | 03/08/2022 | | | 6,818,039 | | | | (178,036 | ) |
| | 80 | | | Eurex 5 Year Euro BOBL Future | | 03/08/2022 | | | 12,121,646 | | | | (32,452 | ) |
| | 1 | | | Eurex DAX Index Future | | 03/18/2022 | | | 450,786 | | | | 10,087 | |
| | 28 | | | Eurex EURO STOXX 50 Future | | 03/18/2022 | | | 1,365,209 | | | | 42,707 | |
| | 4 | | | Euro-BTP Italian Bond Futures | | 03/08/2022 | | | 668,719 | | | | (10,041 | ) |
| | 13 | | | Euronext Amsterdam Index Future | | 01/21/2022 | | | 2,358,547 | | | | 57,478 | |
| | 25 | | | Euronext CAC 40 Index Future | | 01/21/2022 | | | 2,030,756 | | | | 40,544 | |
| | 84 | | | Euronext Milling Wheat Future(c) | | 03/10/2022 | | | 1,330,183 | | | | (69,664 | ) |
| | 17 | | | FTSE 100 Index Future | | 03/18/2022 | | | 1,686,400 | | | | 32,058 | |
| | 20 | | | FTSE/MIB Index Future | | 03/18/2022 | | | 3,098,643 | | | | 49,039 | |
| | 97 | | | FVSA index - Mini-Futures on VSTOXX(c) | | 02/16/2022 | | | 238,818 | | | | (16,342 | ) |
| | 16 | | | HKG Hang Seng Index Future | | 01/28/2022 | | | 2,406,372 | | | | 23,535 | |
See accompanying notes to consolidated financial statements.
RATIONAL/RESOLVE ADAPTIVE ASSET ALLOCATION FUND
CONSOLIDATED SCHEDULE OF INVESTMENTS (Continued)
December 31, 2021
OPEN FUTURES CONTRACTS (Continued)
Number of
Contracts | | | Open Long Futures Contracts | | Expiration | | Notional Amount(b) | | | Unrealized
Appreciation
(Depreciation) | |
| | 22 | | | ICE Brent Crude Oil Future(c) | | 01/31/2022 | | $ | 1,711,160 | | | $ | 16,660 | |
| | 24 | | | ICE Gas Oil Future(c) | | 02/10/2022 | | | 1,599,000 | | | | 58,975 | |
| | 12 | | | KCBT Hard Red Winter Wheat Future(c) | | 03/14/2022 | | | 480,900 | | | | (15,100 | ) |
| | 32 | | | Long Gilt Future | | 03/29/2022 | | | 5,413,470 | | | | (54,096 | ) |
| | 12 | | | MEFF Madrid IBEX 35 Index Future | | 01/21/2022 | | | 1,185,108 | | | | 49,991 | |
| | 55 | | | Montreal Exchange 10 Year Canadian Bond Future | | 03/22/2022 | | | 6,209,952 | | | | 35,205 | |
| | 13 | | | Montreal Exchange S&P/TSX 60 Index Future | | 03/17/2022 | | | 2,636,536 | | | | 39,124 | |
| | 17 | | | NYBOT CSC C Coffee Future(c) | | 03/21/2022 | | | 1,441,387 | | | | (75,957 | ) |
| | 28 | | | NYBOT CSC Cocoa Future(c) | | 03/16/2022 | | | 705,600 | | | | 21,290 | |
| | 6 | | | NYBOT CSC Number 11 World Sugar Future(c) | | 02/28/2022 | | | 126,874 | | | | (1,321 | ) |
| | 26 | | | NYBOT CTN Number 2 Cotton Future(c) | | 03/09/2022 | | | 1,463,800 | | | | 76,535 | |
| | 22 | | | NYMEX Light Sweet Crude Oil Future(c) | | 01/20/2022 | | | 1,654,620 | | | | 80,770 | |
| | 13 | | | NYMEX NY Harbor ULSD Futures(c) | | 01/31/2022 | | | 1,269,614 | | | | 79,909 | |
| | 11 | | | NYMEX Platinum Future(c) | | 04/27/2022 | | | 531,410 | | | | 445 | |
| | 16 | | | NYMEX Reformulated Gasoline Blendstock for Oxygen(c) | | 01/31/2022 | | | 1,494,931 | | | | 67,204 | |
| | 10 | | | SFE S&P ASX Share Price Index 200 Future | | 03/17/2022 | | | 1,335,409 | | | | 8,125 | |
| | 33 | | | SGX FTSE China A50 Futures Contract | | 01/27/2022 | | | 518,067 | | | | (5,902 | ) |
| | 4 | | | SGX Nifty 50 Index Futures | | 01/27/2022 | | | 139,516 | | | | 1,461 | |
| | 1 | | | SGX Nikkei 225 Stock Index Future | | 03/10/2022 | | | 124,875 | | | | 1,688 | |
| | 29 | | | TSE Japanese 10 Year Bond Futures | | 03/14/2022 | | | 38,175,590 | | | | (119,931 | ) |
| | 4 | | | TSE TOPIX (Tokyo Price Index) Future | | 03/10/2022 | | | 691,937 | | | | (901 | ) |
| | | | | TOTAL FUTURES CONTRACTS | | | | | | | | $ | 421,368 | |
| OPEN FUTURES CONTRACTS |
Number of
Contracts | | | Open Short Futures Contracts | | Expiration | | Notional Amount(b) | | | Unrealized
Appreciation
(Depreciation) | |
| | 1 | | | CBOT Soybean Oil Future(c) | | 03/14/2022 | | $ | 33,918 | | | $ | (222 | ) |
| | 9 | | | CME Australian Dollar Currency Future | | 03/14/2022 | | | 655,020 | | | | (14,096 | ) |
| | 9 | | | CME Euro Foreign Exchange Currency Future | | 03/14/2022 | | | 1,282,781 | | | | (7,193 | ) |
| | 17 | | | CME Japanese Yen Currency Future | | 03/14/2022 | | | 1,848,325 | | | | 19,286 | |
| | 18 | | | CME Live Cattle Future(c) | | 02/28/2022 | | | 1,005,840 | | | | (16,830 | ) |
| | 13 | | | COMEX Silver Future(c) | | 03/29/2022 | | | 1,517,880 | | | | (49,155 | ) |
| | 17 | | | NYMEX Henry Hub Natural Gas Futures(c) | | 01/27/2022 | | | 634,100 | | | | 10,400 | |
| | | | | TOTAL FUTURES CONTRACTS | | | | | | | | $ | (57,810 | ) |
| (a) | Rate disclosed is the seven day effective yield as of December 31, 2021. |
| (b) | The amounts shown are the underlying reference notional amounts to stock exchange indices and equities upon which the fair value of the futures contracts held by the Fund are based. Notional values do not represent the current fair value of, and are not necessarily indicative of the future cash flows of the Fund’s futures contracts. Further, the underlying price changes in relation to the variables specified by the notional values affects the fair value of these derivative financial instruments. The notional values as set forth within this schedule do not purport to represent economic value at risk to the Fund. |
| (c) | All or a portion of this investment is a holding of the RDMF Fund, Ltd. |
See accompanying notes to consolidated financial statements.
RATIONAL/PIER 88 CONVERTIBLE SECURITIES FUND
SCHEDULE OF INVESTMENTS
December 31, 2021
| Shares | | | | | | | | | | Fair Value | |
| | | | | COMMON STOCKS — 1.9% | | | | | | | | | | |
| | | | | ASSET MANAGEMENT - 1.1% | | | | | | | | | | |
| | 57,418 | | | Sixth Street Specialty Lending, Inc. | | | | | | | | $ | 1,343,007 | |
| | | | | | | | | | | | | | | |
| | | | | BIOTECH & PHARMA - 0.8% | | | | | | | | | | |
| | 8,733 | | | Horizon Therapeutics plc(a) | | | | | | | | | 941,068 | |
| | | | | | | | | | | | | | | |
| | | | | TOTAL COMMON STOCKS (Cost $1,625,838) | | | | | | | | | 2,284,075 | |
| | | | | | | | | | | | | | | |
| | | | | | | Dividend Rate (%) | | Maturity | | | | | |
| | | | | PREFERRED STOCKS — 43.1% | | | | | | | | | | |
| | | | | ASSET MANAGEMENT - 3.4% | | | | | | | | | | |
| | 17,000 | | | AMG Capital Trust II | | 2.5800 | | | 10/15/2037 | | | | 997,688 | |
| | 34,000 | | | KKR & Company, Inc. | | 6.0000 | | | 9/15/2023 | | | | 3,167,100 | |
| | | | | | | | | | | | | | 4,164,788 | |
| | | | | BANKING - 8.3% | | | | | | | | | | |
| | 4,148 | | | Bank of America Corporation | | 7.2500 | | | Perpetual | | | | 5,995,519 | |
| | 2,683 | | | Wells Fargo & Company - Series L | | 7.5000 | | | Perpetual | | | | 3,999,092 | |
| | | | | | | | | | | | | | 9,994,611 | |
| | | | | ELECTRIC UTILITIES - 11.7% | | | | | | | | | | |
| | 51,450 | | | American Electric Power Company, Inc. | | 6.1250 | | | 3/15/2022 | | | | 2,578,674 | |
| | 29,266 | | | Dominion Energy, Inc. | | 7.2500 | | | 6/1/2022 | | | | 2,945,330 | |
| | 20,055 | | | DTE Energy Company | | 6.2500 | | | 11/1/2022 | | | | 1,029,624 | |
| | 34,713 | | | NextEra Energy, Inc. | | 4.8720 | | | 9/1/2022 | | | | 2,363,608 | |
| | 25,118 | | | NextEra Energy, Inc. | | 5.2790 | | | 3/1/2023 | | | | 1,445,290 | |
| | 21,800 | | | NextEra Energy, Inc. | | 6.2190 | | | 9/1/2023 | | | | 1,262,438 | |
| | 46,313 | | | Southern Company (The) - Series 2019 | | 6.7500 | | | 8/1/2022 | | | | 2,489,324 | |
| | | | | | | | | | | | | | 14,114,288 | |
| | | | | GAS & WATER UTILITIES - 2.8% | | | | | | | | | | |
| | 29,900 | | | NiSource, Inc. | | 7.7500 | | | 3/1/2024 | | | | 3,345,511 | |
| | | | | | | | | | | | | | | |
| | | | | MACHINERY - 3.7% | | | | | | | | | | |
| | 40,990 | | | Stanley Black & Decker, Inc. | | 5.2500 | | | Perpetual | | | | 4,475,698 | |
| | | | | | | | | | | | | | | |
| | | | | MEDICAL EQUIPMENT & DEVICES - 8.7% | | | | | | | | | | |
| | 102,700 | | | Becton Dickinson and Company | | 6.0000 | | | 6/1/2023 | | | | 5,417,425 | |
| | 20,935 | | | Boston Scientific Corporation | | 5.5000 | | | 6/1/2023 | | | | 2,381,984 | |
See accompanying notes to financial statements.
RATIONAL/PIER 88 CONVERTIBLE SECURITIES FUND
SCHEDULE OF INVESTMENTS (Continued)
December 31, 2021
| Shares | | | | | Dividend Rate (%) | | Maturity | | | Fair Value | |
| | | | | PREFERRED STOCKS — 43.1% (Continued) | | | | | | | | | | |
| | | | | MEDICAL EQUIPMENT & DEVICES - 8.7% (Continued) | | | | | | | | | | |
| | 1,545 | | | Danaher Corporation | | 5.0000 | | | 4/1/2023 | | | $ | 2,699,888 | |
| | | | | | | | | | | | | | 10,499,297 | |
| | | | | SEMICONDUCTORS - 4.5% | | | | | | | | | | |
| | 2,624 | | | Broadcom, Inc. - Series A | | 8.0000 | | | 9/30/2022 | | | | 5,445,823 | |
| | | | | | | | | | | | | | | |
| | | | | TOTAL PREFERRED STOCKS (Cost $46,167,277) | | | | | | | | | 52,040,016 | |
| | | | | | | | | | | | | | | |
| Principal | | | | | Coupon Rate | | | | | | | | |
| Amount ($) | | | | | (%) | | | | | | | | |
| | | | | CONVERTIBLE BONDS — 52.1% | | | | | | | | | | |
| | | | | ASSET MANAGEMENT — 5.5% | | | | | | | | | | |
| | 4,210,000 | | | Ares Capital Corporation | | 4.6250 | | | 03/01/24 | | | | 4,815,398 | |
| | 1,690,886 | | | New Mountain Finance Corporation | | 5.7500 | | | 08/15/23 | | | | 1,788,112 | |
| | | | | | | | | | | | | | 6,603,510 | |
| | | | | AUTOMOTIVE — 1.1% | | | | | | | | | | |
| | 1,260,000 | | | Fisker, Inc.(b) | | 2.5000 | | | 09/15/26 | | | | 1,302,588 | |
| | | | | | | | | | | | | | | |
| | | | | E-COMMERCE DISCRETIONARY — 1.2% | | | | | | | | | | |
| | 1,250,000 | | | Etsy, Inc.(b) | | 0.2500 | | | 06/15/28 | | | | 1,469,500 | |
| | | | | | | | | | | | | | | |
| | | | | ENGINEERING & CONSTRUCTION — 2.1% | | | | | | | | | | |
| | 1,360,000 | | | KBR, Inc. | | 2.5000 | | | 11/01/23 | | | | 2,586,149 | |
| | | | | | | | | | | | | | | |
| | | | | HEALTH CARE FACILITIES & SERVICES — 2.9% | | | | | | | | | | |
| | 530,000 | | | Anthem, Inc. | | 2.7500 | | | 10/15/42 | | | | 3,482,630 | |
| | | | | | | | | | | | | | | |
| | | | | INTERNET MEDIA & SERVICES — 5.8% | | | | | | | | | | |
| | 1,220,000 | | | Booking Holdings, Inc. | | 0.7500 | | | 05/01/25 | | | | 1,791,570 | |
| | 4,535,000 | | | Expedia Group, Inc.(b),(c) | | — | | | 02/15/26 | | | | 5,217,518 | |
| | | | | | | | | | | | | | 7,009,088 | |
| | | | | MEDICAL EQUIPMENT & DEVICES — 6.3% | | | | | | | | | | |
| | 3,160,000 | | | Dexcom, Inc. | | 0.2500 | | | 11/15/25 | | | | 3,750,525 | |
| | 1,650,000 | | | Insulet Corporation | | 0.3750 | | | 09/01/26 | | | | 2,182,750 | |
| | 1,750,000 | | | NuVasive, Inc. | | 1.0000 | | | 06/01/23 | | | | 1,750,000 | |
| | | | | | | | | | | | | | 7,683,275 | |
See accompanying notes to financial statements.
RATIONAL/PIER 88 CONVERTIBLE SECURITIES FUND
SCHEDULE OF INVESTMENTS (Continued)
December 31, 2021
| Principal | | | | | Coupon Rate | | | | | | |
| Amount ($) | | | | | (%) | | Maturity | | | Fair Value | |
| | | | | CONVERTIBLE BONDS — 52.1% (Continued) | | | | | | | | | | |
| | | | | OIL & GAS PRODUCERS — 1.4% | | | | | | | | | | |
| | 965,000 | | | Pioneer Natural Resources Company | | 0.2500 | | | 05/15/25 | | | $ | 1,719,509 | |
| | | | | | | | | | | | | | | |
| | | | | SEMICONDUCTORS — 5.6% | | | | | | | | | | |
| | 2,660,000 | | | ON Semiconductor Corporation(b),(c) | | — | | | 05/01/27 | | | | 3,870,300 | |
| | 1,630,000 | | | Silicon Laboratories, Inc. | | 0.6250 | | | 06/15/25 | | | | 2,857,553 | |
| | | | | | | | | | | | | | 6,727,853 | |
| | | | | SOFTWARE — 11.7% | | | | | | | | | | |
| | 3,295,000 | | | CyberArk Software Ltd.(c) | | — | | | 11/15/24 | | | | 4,151,700 | |
| | 2,155,000 | | | Mandiant, Inc. | | 0.8750 | | | 06/01/24 | | | | 2,241,200 | |
| | 2,630,000 | | | PROS Holdings, Inc. | | 1.0000 | | | 05/15/24 | | | | 2,440,969 | |
| | 1,105,000 | | | RingCentral, Inc.(c) | | — | | | 03/01/25 | | | | 1,038,103 | |
| | 4,530,000 | | | Splunk, Inc. | | 1.1250 | | | 06/15/27 | | | | 4,224,225 | |
| | | | | | | | | | | | | | 14,096,197 | |
| | | | | TECHNOLOGY HARDWARE — 2.2% | | | | | | | | | | |
| | 2,673,080 | | | Western Digital Corporation B | | 1.5000 | | | 02/01/24 | | | | 2,698,140 | |
| | | | | | | | | | | | | | | |
| | | | | TECHNOLOGY SERVICES — 3.2% | | | | | | | | | | |
| | 3,630,928 | | | Euronet Worldwide, Inc. | | 0.7500 | | | 03/15/49 | | | | 3,921,402 | |
| | | | | | | | | | | | | | | |
| | | | | TRANSPORTATION EQUIPMENT — 3.1% | | | | | | | | | | |
| | 3,391,118 | | | Meritor, Inc. | | 3.2500 | | | 10/15/37 | | | | 3,692,250 | |
| | | | | | | | | | | | | | | |
| | | | | TOTAL CONVERTIBLE BONDS (Cost $59,997,792) | | | | | | | | | 62,992,091 | |
| | | | | | | | | | | | | | | |
| Shares | | | | | | | | | | | | | |
| | | | | SHORT-TERM INVESTMENTS — 2.7% | | | | | | | | | | |
| | | | | MONEY MARKET FUNDS - 2.7% | | | | | | | | | | |
| | 3,318,618 | | | First American Government Obligations Fund, Class U, 0.03% (Cost $3,318,618)(d) | | | | | | | | | 3,318,618 | |
| | | | | | | | | | | | | | | |
| | | | | TOTAL INVESTMENTS - 99.8% (Cost $111,109,525) | | | | | | | | $ | 120,634,800 | |
| | | | | OTHER ASSETS IN EXCESS OF LIABILITIES- 0.2% | | | | | | | | | 178,834 | |
| | | | | NET ASSETS - 100.0% | | | | | | | | $ | 120,813,634 | |
| PLC | - Public Limited Company |
| (a) | Non-income producing security. |
| (b) | Security exempt from registration under Rule 144A or Section 4(2) of the Securities Act of 1933. The security may be resold in transactions exempt from registration, normally to qualified institutional buyers. As of December 31, 2021 the total market value of 144A securities is 11,859,906 or 9.8% of net assets. |
| (d) | Rate disclosed is the seven day effective yield as of December 31, 2021. |
See accompanying notes to financial statements.
RATIONAL SPECIAL SITUATIONS INCOME FUND
SCHEDULE OF INVESTMENTS
December 31, 2021
| Principal | | | | | | | Dividend Rate | | | | | |
| Amount ($) | | | | | | | % | | Maturity | | Fair Value | |
| | | | | PREFERRED STOCKS — 0.3% | | | | | | | | | | |
| | | | | REAL ESTATE INVESTMENT TRUSTS 0.3% | | | | | | | | | | |
| | 80,000 | | | Vinebrook Homes Trust, Inc.(a) (h) | | | | 6.5000 | | 10/7/27 | | $ | 2,060,000 | |
| | | | | TOTAL PREFERRED STOCKS (Cost $2,002,560) | | | | | | | | | | |
| | | | | | | | | | | | | | | |
| Principal | | | | | | | Coupon Rate | | | | | |
| Amount ($) | | | | | Spread | | (%) | | | | | |
| | | | | ASSET BACKED SECURITIES — 75.6% | | | | | | | | | | |
| | | | | AGENCY CMBS — 0.4% | | | | | | | | | | |
| | 29,134,678 | | | Ginnie Mae Strip(b) | | | | 1.4000 | | 09/16/45 | | $ | 2,704,863 | |
| | 1,980,920 | | | Government National Mortgage Association(b),(c) | | | | 0.0240 | | 08/16/48 | | | 5,496 | |
| | | | | | | | | | | | | | 2,710,359 | |
| | | | | CDO — 2.8% | | | | | | | | | | |
| | 374,706 | | | Ansonia CDO 2006 1 Ltd.(a),(d) (h) | | US0001M + 0.300% | | 0.4150 | | 07/28/46 | | | 354,048 | |
| | 190,672 | | | Ansonia CDO 2006 1 Ltd.(a) (h) | | | | 5.7020 | | 07/28/46 | | | 185,596 | |
| | 1,926,526 | | | Aspen Funding I Ltd.(a) (h) | | | | 9.0600 | | 07/10/37 | | | 1,999,784 | |
| | 10,000,000 | | | Bleecker Structured Asset Funding Ltd. (h) | | | | 1.0310 | | 04/01/35 | | | 1,043,100 | |
| | 8,563,445 | | | Capitalsource Real Estate Loan Trust(a),(d) (h) | | US0003M + 0.650% | | 0.7710 | | 01/20/37 | | | 8,178,090 | |
| | 5,734,326 | | | Fulton Street CDO Ltd.(a),(d) (h) | | US0003M + 0.420% | | 0.5510 | | 04/20/32 | | | 3,682,424 | |
| | 4,090,784 | | | Nomura CRE CDO 2007 2 Ltd.(a),(d) (h) | | US0003M + 0.450% | | 0.6100 | | 05/21/42 | | | 1,534,044 | |
| | 3,432,031 | | | RAIT CRE CDO I Ltd.(a),(d) (h) | | US0001M + 0.850% | | 0.9540 | | 11/20/46 | | | 2,554,313 | |
| | 2,000,000 | | | Taberna Preferred Funding II Ltd.(a),(d) (h) | | US0003M + 0.650% | | 0.7900 | | 11/05/35 | | | 980,000 | |
| | 469,239 | | | Wachovia Repackaged Asset Participating Securities(a),(d) | | US0003M + 0.550% | | 0.6940 | | 02/08/35 | | | 436,392 | |
| | 717,490 | | | Wachovia Repackaged Asset Participating Securities(a),(d) | | US0003M + 0.550% | | 0.6940 | | 02/08/35 | | | 595,517 | |
| | | | | | | | | | | | | | 21,543,308 | |
| | | | | COLLATERALIZED MORTGAGE OBLIGATIONS — 35.4% | | | | | | | | | | |
| | 195,263 | | | ABN Amro Mortgage Corporation | | | | 5.7500 | | 12/25/32 | | | 198,486 | |
| | 20,725 | | | Adjustable Rate Mortgage Trust 2004 5(c) | | | | 2.6610 | | 04/25/35 | | | 21,017 | |
| | 192,067 | | | Adjustable Rate Mortgage Trust 2005 10(d) | | US0001M + 0.540% | | 0.6420 | | 01/25/36 | | | 190,014 | |
| | 494,107 | | | Adjustable Rate Mortgage Trust 2005 10(c) | | | | 2.5040 | | 01/25/36 | | | 465,059 | |
| | 331,821 | | | Adjustable Rate Mortgage Trust 2005 10(c) | | | | 2.5040 | | 01/25/36 | | | 315,742 | |
| | 118,225 | | | Adjustable Rate Mortgage Trust 2005 10(c) | | | | 2.7320 | | 01/25/36 | | | 111,825 | |
| | 219,599 | | | Adjustable Rate Mortgage Trust 2005 2(c) | | | | 2.7470 | | 06/25/35 | | | 221,507 | |
| | 128,073 | | | Adjustable Rate Mortgage Trust 2005 4(c) | | | | 2.1290 | | 08/25/35 | | | 100,316 | |
| | 270,430 | | | Adjustable Rate Mortgage Trust 2005 5(c) | | | | 2.5740 | | 09/25/35 | | | 256,322 | |
See accompanying notes to financial statements.
RATIONAL SPECIAL SITUATIONS INCOME FUND
SCHEDULE OF INVESTMENTS (Continued)
December 31, 2021
| Principal | | | | | | | Coupon Rate | | | | | |
| Amount ($) | | | | | Spread | | (%) | | Maturity | | Fair Value | |
| | | | | ASSET BACKED SECURITIES — 75.6% (Continued) | | | | | | | | | | |
| | | | | COLLATERALIZED MORTGAGE OBLIGATIONS — 35.4% (Continued) | | | | | | | | | | |
| | 260,895 | | | Adjustable Rate Mortgage Trust 2005-6A(d) | | US0001M + 0.520% | | 0.6220 | | 11/25/35 | | $ | 247,845 | |
| | 183,243 | | | Adjustable Rate Mortgage Trust 2005-6A(d) | | US0001M + 0.540% | | 0.6420 | | 11/25/35 | | | 174,077 | |
| | 14,649 | | | Alternative Loan Trust 2003-4CB | | | | 5.7500 | | 04/25/33 | | | 15,258 | |
| | 95,029 | | | Alternative Loan Trust 2003-J3 | | | | 5.2500 | | 11/25/33 | | | 97,418 | |
| | 515,691 | | | Alternative Loan Trust 2004-2CB | | | | 5.0000 | | 08/25/54 | | | 525,710 | |
| | 62,950 | | | Alternative Loan Trust 2004-33(c) | | | | 2.9600 | | 12/25/34 | | | 63,384 | |
| | 78,662 | | | Alternative Loan Trust 2005-17(d) | | US0001M + 0.560% | | 0.6620 | | 07/25/35 | | | 57,326 | |
| | 752,486 | | | Alternative Loan Trust 2005-43(c) | | | | 3.3620 | | 09/25/35 | | | 722,855 | |
| | 102,849 | | | Alternative Loan Trust 2005-51(d) | | US0001M + 0.600% | | 0.7030 | | 11/20/35 | | | 99,168 | |
| | 49,252 | | | Alternative Loan Trust 2005-63(c) | | | | 3.3180 | | 12/25/35 | | | 48,556 | |
| | 465,690 | | | Alternative Loan Trust 2006-32CB(d) | | US0001M + 0.670% | | 0.7720 | | 11/25/36 | | | 240,520 | |
| | 773,045 | | | Alternative Loan Trust 2006-32CB(b),(d) | | US0001M + 5.330% | | 5.2280 | | 11/25/36 | | | 126,542 | |
| | 1,452,756 | | | Alternative Loan Trust 2006-J6(d) | | US0001M + 0.500% | | 0.6020 | | 09/25/36 | | | 692,721 | |
| | 1,772,363 | | | Alternative Loan Trust 2006-J6(b),(d) | | US0001M + 5.500% | | 5.3980 | | 09/25/36 | | | 357,817 | |
| | 218,476 | | | Alternative Loan Trust 2006-OA7(d) | | US0001M + 0.420% | | 0.5220 | | 06/25/46 | | | 175,410 | |
| | 375 | | | Alternative Loan Trust 2006-OC11(d) | | US0001M + 0.340% | | 0.4420 | | 01/25/37 | | | 5,664 | |
| | 344,325 | | | Alternative Loan Trust 2007-5CB(e) | | | | — | | 04/25/37 | | | 98,470 | |
| | 424,404 | | | Alternative Loan Trust 2007-5CB(b),(d) | | US0001M + 5.650% | | 5.5480 | | 04/25/37 | | | 114,741 | |
| | 135,171 | | | Alternative Loan Trust Resecuritization 2005-12R | | | | 6.0000 | | 11/25/34 | | | 135,416 | |
| | 466,350 | | | American Home Mortgage Assets Trust 2006-1(d) | | US0001M + 0.190% | | 0.2920 | | 05/25/46 | | | 419,034 | |
| | 25,606 | | | American Home Mortgage Investment Trust 2004-1(d) | | US0001M + 0.900% | | 1.0020 | | 04/25/44 | | | 25,628 | |
| | 27,125 | | | American Home Mortgage Investment Trust 2004-3 Series 2004-3 Class IV-A(d) | | US0006M + 1.500% | | 1.6570 | | 10/25/34 | | | 27,511 | |
| | 39,482 | | | American Home Mortgage Investment Trust 2005-1(d) | | US0006M + 2.000% | | 2.1700 | | 06/25/45 | | | 40,402 | |
| | 1,848,853 | | | American Home Mortgage Investment Trust 2005-2(f) | | | | 5.8280 | | 09/25/35 | | | 1,579,349 | |
| | 1,059,100 | | | American Home Mortgage Investment Trust 2005-4(d) | | US0006M + 1.750% | | 1.9960 | | 11/25/45 | | | 618,034 | |
| | 433,609 | | | American Home Mortgage Investment Trust 2006-2(d) | | US0001M + 0.220% | | 0.3220 | | 06/25/36 | | | 27,387 | |
| | 671,230 | | | American Home Mortgage Investment Trust 2006-3(d) | | US0001M + 0.380% | | 0.4820 | | 12/25/46 | | | 673,903 | |
| | 1,396,581 | | | American Home Mortgage Investment Trust 2007-1(d) | | US0001M + 0.160% | | 0.2620 | | 05/25/47 | | | 1,018,540 | |
| | 690,666 | | | Banc of America Alternative Loan Trust 2006-4(d) | | US0001M + 0.850% | | 0.9520 | | 05/25/46 | | | 595,391 | |
| | 696,991 | | | Banc of America Alternative Loan Trust 2006-4(b),(d) | | US0001M + 5.150% | | 5.0480 | | 05/25/46 | | | 102,978 | |
| | 378,510 | | | Banc of America Alternative Loan Trust 2006-4 | | | | 6.0000 | | 05/25/46 | | | 381,761 | |
| | 305,460 | | | Banc of America Alternative Loan Trust 2006-4 | | | | 6.0000 | | 05/25/46 | | | 309,460 | |
| | 353,516 | | | Banc of America Alternative Loan Trust 2006-4 | | | | 6.0000 | | 05/25/46 | | | 356,553 | |
| | 533,837 | | | Banc of America Funding 2004-B Trust(c) | | | | 2.1630 | | 12/20/34 | | | 481,036 | |
See accompanying notes to financial statements.
RATIONAL SPECIAL SITUATIONS INCOME FUND
SCHEDULE OF INVESTMENTS (Continued)
December 31, 2021
| Principal | | | | | | | Coupon Rate | | | | | |
| Amount ($) | | | | | Spread | | (%) | | Maturity | | Fair Value | |
| | | | | ASSET BACKED SECURITIES — 75.6% (Continued) | | | | | | | | | | |
| | | | | COLLATERALIZED MORTGAGE OBLIGATIONS — 35.4% (Continued) | | | | | | | | | | |
| | 64,487 | | | Banc of America Funding 2005-8 Trust(e) | | | | — | | 01/25/36 | | $ | 47,353 | |
| | 244,306 | | | Banc of America Funding 2005-B Trust(c) | | | | 2.6490 | | 04/20/35 | | | 235,371 | |
| | 1,863,556 | | | Banc of America Funding 2005-E Trust(c) | | | | 2.9360 | | 05/20/35 | | | 1,818,942 | |
| | 131,123 | | | Banc of America Funding 2005-E Trust(d) | | COF 11 + 1.430% | | 1.6550 | | 06/20/35 | | | 111,226 | |
| | 189,470 | | | Banc of America Funding 2006-B Trust(c) | | | | 2.2470 | | 03/20/36 | | | 187,982 | |
| | 217,132 | | | Banc of America Funding 2006-B Trust(c) | | | | 2.5220 | | 03/20/36 | | | 200,594 | |
| | 191,370 | | | Banc of America Funding 2006-C Trust(c) | | | | 2.9560 | | 04/20/36 | | | 190,902 | |
| | 183,960 | | | Banc of America Funding 2006-D Trust(c) | | | | 3.4990 | | 05/20/36 | | | 182,368 | |
| | 530,996 | | | Banc of America Funding 2006-F Trust(c) | | | | 2.5940 | | 07/20/36 | | | 527,248 | |
| | 44,742 | | | Banc of America Funding 2006-G Trust(d) | | US0012M + 1.750% | | 2.1700 | | 07/20/36 | | | 46,063 | |
| | 124,903 | | | Banc of America Funding 2006-I Trust(c) | | | | 2.3940 | | 10/20/46 | | | 110,663 | |
| | 95,059 | | | Banc of America Funding 2007-4 Trust | | | | 5.5000 | | 11/25/34 | | | 95,532 | |
| | 136,460 | | | Banc of America Funding 2007-7 Trust(e) | | | | — | | 09/25/37 | | | 80,695 | |
| | 515,605 | | | Banc of America Funding 2007-8 Trust | | | | 6.0000 | | 09/25/22 | | | 403,545 | |
| | 165,458 | | | Banc of America Funding 2007-C Trust(d) | | US0001M + 0.540% | | 0.6440 | | 05/20/47 | | | 161,499 | |
| | 128,311 | | | Banc of America Funding 2016-R2 Trust(a),(c) | | | | 4.7000 | | 05/01/33 | | | 131,090 | |
| | 2,104,032 | | | Banc of America Funding Corporation(c) | | | | 3.7470 | | 09/25/48 | | | 2,119,998 | |
| | 66,431 | | | Banc of America Mortgage 2005-A Trust(c) | | | | 2.5020 | | 02/25/35 | | | 68,677 | |
| | 473,572 | | | Banc of America Mortgage 2005-G Trust(c) | | | | 3.0920 | | 08/25/35 | | | 470,807 | |
| | 1,305,916 | | | Banc of America Mortgage 2005-I Trust(c) | | | | 2.1680 | | 10/25/35 | | | 1,295,844 | |
| | 116,388 | | | Banc of America Mortgage 2006-A Trust(c) | | | | 3.2590 | | 02/25/36 | | | 103,617 | |
| | 101,384 | | | Banc of America Mortgage 2006-B Trust(c) | | | | 2.8400 | | 11/20/46 | | | 97,124 | |
| | 27,828 | | | Banc of America Mortgage Trust 2005-3 | | | | 5.5000 | | 03/25/35 | | | 27,609 | |
| | 46,561 | | | Bank of America Mortgage 2002-J Trust(c) | | | | 3.3870 | | 09/25/32 | | | 46,893 | |
| | 2,814,379 | | | BCAP, LLC 2010-RR11-I Trust(a),(c) | | | | 2.8330 | | 06/27/36 | | | 2,767,572 | |
| | 2,710,408 | | | BCAP, LLC 2011-RR4-I Trust(a) | | | | 5.2500 | | 04/26/37 | | | 1,894,480 | |
| | 4,213,741 | | | BCAP, LLC 2013-RR7 Trust(a),(c) | | | | 2.9030 | | 12/27/34 | | | 4,005,383 | |
| | 148,803 | | | BCAP, LLC Trust 2007-AA2 | | | | 6.0000 | | 03/25/22 | | | 146,530 | |
| | 15,992 | | | Bear Stearns ALT-A Trust 2004-9(c) | | | | 3.2760 | | 09/25/34 | | | 17,759 | |
| | 4,542,940 | | | Bear Stearns ALT-A Trust 2005-10(d) | | US0001M + 0.500% | | 0.6020 | | 01/25/36 | | | 5,442,375 | |
| | 112,604 | | | Bear Stearns ALT-A Trust 2005-10(c) | | | | 2.9190 | | 01/25/36 | | | 110,122 | |
| | 81,234 | | | Bear Stearns ALT-A Trust 2005-4(c) | | | | 2.5250 | | 05/25/35 | | | 81,464 | |
| | 3,513,732 | | | Bear Stearns ALT-A Trust 2006-1(d) | | US0001M + 0.480% | | 0.5820 | | 02/25/36 | | | 3,553,248 | |
| | 2,293,402 | | | Bear Stearns ALT-A Trust 2006-2(d) | | US0001M + 0.440% | | 0.5420 | | 04/25/36 | | | 2,922,257 | |
See accompanying notes to financial statements.
RATIONAL SPECIAL SITUATIONS INCOME FUND
SCHEDULE OF INVESTMENTS (Continued)
December 31, 2021
| Principal | | | | | | | Coupon Rate | | | | | |
| Amount ($) | | | | | Spread | | (%) | | Maturity | | Fair Value | |
| | | | | ASSET BACKED SECURITIES — 75.6% (Continued) | | | | | | | | | | |
| | | | | COLLATERALIZED MORTGAGE OBLIGATIONS — 35.4% (Continued) | | | | | | | | | | |
| | 234,073 | | | Bear Stearns ALT-A Trust 2006-3(d) | | US0001M + 0.380% | | 0.4820 | | 05/25/36 | | $ | 251,494 | |
| | 99,752 | | | Bear Stearns ALT-A Trust 2006-3(c) | | | | 3.0600 | | 05/25/36 | | | 76,717 | |
| | 490,651 | | | Bear Stearns ALT-A Trust 2006-3(c) | | | | 3.1500 | | 05/25/36 | | | 316,155 | |
| | 45,828 | | | Bear Stearns ALT-A Trust II 2007-1(c) | | | | 3.0910 | | 09/25/47 | | | 29,726 | |
| | 49,977 | | | Bear Stearns ARM Trust 2003-8(c) | | | | 2.3750 | | 01/25/34 | | | 49,475 | |
| | 11,856 | | | Bear Stearns ARM Trust 2004-1(c) | | | | 2.0670 | | 04/25/34 | | | 11,905 | |
| | 72,436 | | | Bear Stearns ARM Trust 2004-10(c) | | | | 3.0900 | | 01/25/35 | | | 76,259 | |
| | 412,830 | | | Bear Stearns ARM Trust 2004-9(c) | | | | 2.1580 | | 11/25/34 | | | 406,014 | |
| | 278,074 | | | Bear Stearns ARM Trust 2005-3(c) | | | | 3.0090 | | 06/25/35 | | | 283,765 | |
| | 41,312 | | | Bear Stearns ARM Trust 2005-8(a),(c) | | | | 3.3860 | | 08/25/35 | | | 38,983 | |
| | 792,576 | | | Bear Stearns ARM Trust 2006-4(c) | | | | 2.8090 | | 10/25/36 | | | 779,554 | |
| | 63,972 | | | Bear Stearns ARM Trust 2007-5(c) | | | | 3.0550 | | 08/25/47 | | | 63,468 | |
| | 193,206 | | | Bear Stearns Asset Backed Securities I Trust(d) | | US0001M + 1.000% | | 1.1020 | | 08/25/35 | | | 140,361 | |
| | 1,235,145 | | | Bear Stearns Mortgage Funding Trust 2006-SL5(d) | | US0001M + 0.300% | | 0.3920 | | 12/25/36 | | | 1,295,231 | |
| | 104,633 | | | Bear Stearns Mortgage Securities, Inc.(c) | | | | 6.3310 | | 03/25/31 | | | 104,488 | |
| | 17,877 | | | Bear Stearns Mortgage Securities, Inc.(c) | | | | 6.3310 | | 03/25/31 | | | 17,857 | |
| | 37,788,470 | | | CBASS 1248MKAB1 DEL TR 2011-1(a),(d) | | US0001M + 0.460% | | 2.2220 | | 02/25/37 | | | 1,382,699 | |
| | 200,899 | | | Chase Mortgage Finance Trust Series 2005-S1 | | | | 5.0000 | | 05/25/35 | | | 200,948 | |
| | 1,227,605 | | | ChaseFlex Trust Series 2005-2 | | | | 7.5000 | | 06/25/35 | | | 979,901 | |
| | 14,135 | | | CHL Mortgage Pass-Through Trust 2003-56(c) | | | | 2.5220 | | 12/25/33 | | | 14,177 | |
| | 298,064 | | | CHL Mortgage Pass-Through Trust 2004-2(c) | | | | 2.7640 | | 02/25/34 | | | 288,032 | |
| | 391,388 | | | CHL Mortgage Pass-Through Trust 2004-5 | | | | 5.0000 | | 05/25/34 | | | 401,562 | |
| | 40,994 | | | CHL Mortgage Pass-Through Trust 2004-7(c) | | | | 2.4710 | | 06/25/34 | | | 41,667 | |
| | 55,990 | | | CHL Mortgage Pass-Through Trust 2004-8(e) | | | | — | | 07/25/34 | | | 43,926 | |
| | 2,962 | | | CHL Mortgage Pass-Through Trust 2005-11(d) | | US0001M + 0.320% | | 0.4220 | | 04/25/35 | | | 1,687 | |
| | 166,462 | | | CHL Mortgage Pass-Through Trust 2005-15 | | | | 5.1000 | | 08/25/35 | | | 167,409 | |
| | 2,481 | | | CHL Mortgage Pass-Through Trust 2005-7(d) | | US0001M + 0.720% | | 0.8220 | | 03/25/35 | | | 905 | |
| | 443,080 | | | CHL Mortgage Pass-Through Trust 2005-HYB6(c) | | | | 2.1650 | | 10/20/35 | | | 436,848 | |
| | 271,860 | | | CHL Mortgage Pass-Through Trust 2005-J2 | | | | 5.0000 | | 08/25/35 | | | 202,194 | |
| | 141,519 | | | Citicorp Mortgage Securities Trust Series 2006-1 | | | | 6.0000 | | 02/25/36 | | | 145,763 | |
| | 357,307 | | | Citicorp Mortgage Securities, Inc. | | | | 5.5000 | | 03/25/35 | | | 359,486 | |
| | 23,472 | | | Citigroup Global Markets Mortgage Securities VII,(c) | | | | 2.6110 | | 10/25/23 | | | 23,217 | |
| | 166,676 | | | Citigroup Mortgage Loan Trust 2004-HYB2(c) | | | | 2.5860 | | 03/25/34 | | | 168,736 | |
| | 67,613 | | | Citigroup Mortgage Loan Trust 2005-11(d) | | H15T1Y + 2.400% | | 2.4800 | | 11/25/35 | | | 68,241 | |
See accompanying notes to financial statements.
RATIONAL SPECIAL SITUATIONS INCOME FUND
SCHEDULE OF INVESTMENTS (Continued)
December 31, 2021
| Principal | | | | | | | Coupon Rate | | | | | |
| Amount ($) | | | | | Spread | | (%) | | Maturity | | Fair Value | |
| | | | | ASSET BACKED SECURITIES — 75.6% (Continued) | | | | | | | | | | |
| | | | | COLLATERALIZED MORTGAGE OBLIGATIONS — 35.4% (Continued) | | | | | | | | | | |
| | 661,873 | | | Citigroup Mortgage Loan Trust 2006-AR2(c) | | | | 2.5400 | | 03/25/36 | | $ | 639,866 | |
| | 113,920 | | | Citigroup Mortgage Loan Trust 2006-AR5(c) | | | | 2.4970 | | 07/25/36 | | | 105,618 | |
| | 2,018,079 | | | Citigroup Mortgage Loan Trust 2008-RR1(a),(d) | | US0001M + 0.070% | | 0.1730 | | 01/25/37 | | | 1,904,857 | |
| | 469,900 | | | Citigroup Mortgage Loan Trust 2010-8(a),(c) | | | | 2.9750 | | 11/19/35 | | | 420,015 | |
| | 401,457 | | | Citigroup Mortgage Loan Trust 2013-8(a),(c) | | | | 2.6330 | | 11/25/36 | | | 326,447 | |
| | 356,652 | | | Citigroup Mortgage Loan Trust 2019-C(a),(f) | | | | 3.2280 | | 09/25/59 | | | 356,977 | |
| | 927,909 | | | Citigroup Mortgage Loan Trust, Inc.(a),(d) | | US0001M + 0.400% | | 0.5030 | | 01/25/29 | | | 864,029 | |
| | 989,932 | | | Citigroup Mortgage Loan Trust, Inc. | | | | 5.7500 | | 11/25/35 | | | 902,869 | |
| | 93,873 | | | CitiMortgage Alternative Loan Trust Series 2007-A1(e) | | | | — | | 01/25/37 | | | 60,587 | |
| | 202,630 | | | CitiMortgage Alternative Loan Trust Series 2007-A1(b),(d) | | US0001M + 5.400% | | 5.2980 | | 01/25/37 | | | 30,794 | |
| | 21,206 | | | CitiMortgage Alternative Loan Trust Series 2007-A1 | | | | 6.0000 | | 01/25/37 | | | 21,383 | |
| | 31,827,712 | | | COMM 2007-C9 Mortgage Trust(a),(b),(c) | | | | 0.4330 | | 12/10/49 | | | 358,880 | |
| | 603,232 | | | Credit Suisse First Boston Mortgage Securities | | | | 5.5000 | | 08/25/25 | | | 570,443 | |
| | 380,712 | | | Credit Suisse First Boston Mortgage Securities(a),(c) | | | | 0.5930 | | 03/25/32 | | | 364,736 | |
| | 142,092 | | | Credit Suisse First Boston Mortgage Securities(c) | | | | 7.0000 | | 06/25/32 | | | 141,402 | |
| | 29,248 | | | Credit Suisse First Boston Mortgage Securities(c) | | | | 2.0560 | | 11/25/32 | | | 26,128 | |
| | 114,693 | | | Credit Suisse First Boston Mortgage Securities(c) | | | | 2.0560 | | 11/25/32 | | | 116,526 | |
| | 24,763 | | | Credit Suisse First Boston Mortgage Securities(c) | | | | 6.9630 | | 12/25/32 | | | 26,038 | |
| | 79,951 | | | Credit Suisse First Boston Mortgage Securities(c) | | | | 5.6730 | | 04/25/33 | | | 75,727 | |
| | 52,685 | | | Credit Suisse First Boston Mortgage Securities | | | | 5.0000 | | 09/25/34 | | | 54,714 | |
| | 372,316 | | | Credit Suisse First Boston Mortgage Securities | | | | 5.2500 | | 01/25/36 | | | 376,945 | |
| | 2,613 | | | CSFB Mortgage-Backed Pass-Through Certificates | | | | 5.0000 | | 11/25/28 | | | 2,687 | |
| | 637,873 | | | CSFB Mortgage-Backed Pass-Through Certificates | | | | 7.0000 | | 10/25/32 | | | 666,190 | |
| | 69,588 | | | CSFB Mortgage-Backed Pass-Through Certificates | | | | 6.5000 | | 12/25/33 | | | 72,207 | |
| | 154,232 | | | CSFB Mortgage-Backed Pass-Through Certificates(c) | | | | 2.2770 | | 06/25/34 | | | 156,957 | |
| | 9,170 | | | CSFB Mortgage-Backed Pass-Through Certificates(c) | | | | 2.2820 | | 06/25/34 | | | 9,625 | |
| | 833,005 | | | CSFB Mortgage-Backed Pass-Through Certificates(d) | | US0001M + 0.350% | | 0.4520 | | 10/25/35 | | | 705,181 | |
| | 7,598,807 | | | CSFB Mortgage-Backed Pass-Through Certificates | | | | 6.5000 | | 11/25/35 | | | 2,225,562 | |
| | 34,399 | | | CSFB Mortgage-Backed Trust Series 2004-AR6(c) | | | | 2.6380 | | 10/25/34 | | | 34,977 | |
| | 2,286,276 | | | CSMC Mortgage-Backed Trust 2006-9 | | | | 6.5000 | | 11/25/36 | | | 1,965,073 | |
| | 625,868 | | | CSMC Mortgage-Backed Trust 2007-1 | | | | 6.0000 | | 02/25/37 | | | 534,590 | |
| | 186,563 | | | CSMC Mortgage-Backed Trust 2007-3(d) | | US0001M + 0.250% | | 0.3520 | | 04/25/37 | | | 158,866 | |
| | 383,429 | | | CSMC Mortgage-Backed Trust 2007-3 | | | | 5.0000 | | 04/25/37 | | | 379,538 | |
| | 727,968 | | | CSMC Mortgage-Backed Trust 2007-3(c) | | | | 5.8370 | | 04/25/37 | | | 258,743 | |
See accompanying notes to financial statements.
RATIONAL SPECIAL SITUATIONS INCOME FUND
SCHEDULE OF INVESTMENTS (Continued)
December 31, 2021
| Principal | | | | | | | Coupon Rate | | | | | |
| Amount ($) | | | | | Spread | | (%) | | Maturity | | Fair Value | |
| | | | | ASSET BACKED SECURITIES — 75.6% (Continued) | | | | | | | | | | |
| | | | | COLLATERALIZED MORTGAGE OBLIGATIONS — 35.4% (Continued) | | | | | | | | | | |
| | 237,035 | | | CSMC Mortgage-Backed Trust 2007-4(d) | | US0001M + 0.400% | | 0.5020 | | 06/25/37 | | $ | 161,640 | |
| | 2,350,262 | | | CSMC Mortgage-Backed Trust 2007-4 | | | | 6.0000 | | 06/25/37 | | | 523,844 | |
| | 55,724 | | | CSMC Mortgage-Backed Trust 2007-5 | | | | 6.0000 | | 04/25/29 | | | 55,814 | |
| | 123,838 | | | CSMC Series 2011-6R(a),(c) | | | | 3.2520 | | 04/28/37 | | | 124,894 | |
| | 152,196 | | | CSMC Series 2014-4R(a),(d) | | US0001M + 0.200% | | 0.2920 | | 02/27/36 | | | 147,549 | |
| | 210,602 | | | Deutsche Alt-B Securities Inc Mortgage Loan Trust(c) | | | | 4.9160 | | 06/25/36 | | | 209,389 | |
| | 149,220 | | | Deutsche Alt-B Securities Mortgage Loan Trust(f) | | | | 5.8650 | | 02/25/36 | | | 153,815 | |
| | 36,392 | | | Deutsche Mortgage Sec Inc Mort Loan Tr Ser 2004-1(c) | | | | 5.5000 | | 09/25/33 | | | 32,754 | |
| | 416,974 | | | Deutsche Mortgage Securities Inc Mortgage Loan(a),(d) | | US0001M + 0.280% | | 0.3900 | | 04/15/36 | | | 381,795 | |
| | 113,924 | | | Deutsche Mortgage Securities Inc Mortgage Loan(a),(d) | | US0001M + 0.280% | | 0.3900 | | 04/15/36 | | | 104,313 | |
| | 75,846 | | | Deutsche Mortgage Securities Inc Mortgage Loan(a),(d) | | US0001M + 0.290% | | 0.4000 | | 04/15/36 | | | 68,150 | |
| | 15,734 | | | DSLA Mortgage Loan Trust 2004-AR1(d) | | US0001M + 0.840% | | 0.9440 | | 09/19/44 | | | 15,223 | |
| | 371,349 | | | DSLA Mortgage Loan Trust 2004-AR2(d) | | US0001M + 0.800% | | 0.9040 | | 11/19/44 | | | 358,234 | |
| | 1,289,483 | | | DSLA Mortgage Loan Trust 2004-AR2(d) | | US0001M + 0.800% | | 0.9040 | | 11/19/44 | | | 1,167,658 | |
| | 2,741,738 | | | DSLA Mortgage Loan Trust 2007-AR1(d) | | US0001M + 0.140% | | 0.2440 | | 04/19/47 | | | 2,453,587 | |
| | 152,047 | | | Fannie Mae Interest Strip(b) (h) | | | | 6.5000 | | 10/25/23 | | | 6,414 | |
| | 405,432 | | | Fannie Mae Interest Strip(b),(c) | | | | 3.5000 | | 04/25/27 | | | 19,571 | |
| | 190,429 | | | Fannie Mae Interest Strip(b) | | | | 6.0000 | | 01/25/35 | | | 36,520 | |
| | 455,015 | | | Fannie Mae Interest Strip(b) | | | | 4.5000 | | 08/25/35 | | | 60,856 | |
| | 302,686 | | | Fannie Mae Interest Strip(b),(c) | | | | 5.0000 | | 03/25/38 | | | 48,056 | |
| | 608,817 | | | Fannie Mae Interest Strip(b) | | | | 5.0000 | | 01/25/40 | | | 108,546 | |
| | 514,346 | | | Fannie Mae REMICS(b),(d) | | US0001M + 6.500% | | 6.3980 | | 05/25/40 | | | 42,030 | |
| | 443,509 | | | Fannie Mae REMICS(b),(d) | | US0001M + 6.150% | | 6.0480 | | 01/25/49 | | | 64,403 | |
| | 1,444,576 | | | Fannie Mae Trust 2003-W6(b),(d) | | US0001M + 7.600% | | 7.4970 | | 09/25/42 | | | 311,430 | |
| | 492,800 | | | First Horizon Alternative Mortgage Securities(c) | | | | 2.5420 | | 12/25/34 | | | 496,717 | |
| | 455,678 | | | First Horizon Alternative Mortgage Securities(c) | | | | 2.2980 | | 02/25/35 | | | 434,808 | |
| | 36,210 | | | First Horizon Alternative Mortgage Securities(c) | | | | 2.9180 | | 03/25/35 | | | 27,516 | |
| | 924,463 | | | First Horizon Alternative Mortgage Securities(c) | | | | 2.0000 | | 05/25/35 | | | 553,295 | |
| | 1,112 | | | First Horizon Alternative Mortgage Securities(c) | | | | 2.0000 | | 07/25/36 | | | 959 | |
| | 683,361 | | | First Horizon Mortgage Pass-Through Trust(c) | | | | 2.6250 | | 01/25/36 | | | 506,221 | |
| | 27,564 | | | First Horizon Mortgage Pass-Through Trust 2000-H(c) | | | | 2.2930 | | 05/25/30 | | | 26,311 | |
| | 28,170 | | | First Horizon Mortgage Pass-Through Trust 2000-H(c) | | | | 2.3460 | | 05/25/30 | | | 27,660 | |
| | 84,534 | | | First Horizon Mortgage Pass-Through Trust 2004-FL1(d) | | US0001M + 0.270% | | 0.3720 | | 02/25/35 | | | 80,485 | |
| | 302,384 | | | First Horizon Mortgage Pass-Through Trust 2005-AR4(c) | | | | 2.8150 | | 10/25/35 | | | 303,495 | |
See accompanying notes to financial statements.
RATIONAL SPECIAL SITUATIONS INCOME FUND
SCHEDULE OF INVESTMENTS (Continued)
December 31, 2021
| Principal | | | | | | | Coupon Rate | | | | | |
| Amount ($) | | | | | Spread | | (%) | | Maturity | | Fair Value | |
| | | | | ASSET BACKED SECURITIES — 75.6% (Continued) | | | | | | | | | | |
| | | | | COLLATERALIZED MORTGAGE OBLIGATIONS — 35.4% (Continued) | | | | | | | | | | |
| | 58,762 | | | First Horizon Mortgage Pass-Through Trust 2007-AR2(c) | | | | 3.2890 | | 07/25/37 | | $ | 43,615 | |
| | 438,064 | | | Freddie Mac REMICS(b),(d) | | US0001M + 6.000% | | 5.8900 | | 11/15/40 | | | 79,592 | |
| | 363,418 | | | Freddie Mac Strips(b) | | | | 6.0000 | | 06/15/39 | | | 86,416 | |
| | 408,909 | | | Freddie Mac Strips(b),(c) | | | | 4.5000 | | 05/15/49 | | | 72,566 | |
| | 3,425,005 | | | Freddie Mac Structured Pass-Through Certificates(b),(c) | | | | 0.5240 | | 05/25/43 | | | 73,592 | |
| | 827,006 | | | Global Mortgage Securitization Ltd.(a),(d) | | US0001M + 0.320% | | 0.4220 | | 11/25/32 | | | 807,323 | |
| | 234,387 | | | GMACM Mortgage Loan Trust 2004-J2(e) | | | | — | | 06/25/34 | | | 201,275 | |
| | 128,984 | | | GMACM Mortgage Loan Trust 2005-AR6(c) | | | | 2.9750 | | 11/19/35 | | | 109,126 | |
| | 725,507 | | | Government National Mortgage Association(b),(f) | | | | 4.0000 | | 09/16/25 | | | 30,904 | |
| | 224,103 | | | Government National Mortgage Association(b),(d) | | US0001M + 7.550% | | 7.4460 | | 02/20/33 | | | 23,940 | |
| | 217,821 | | | Government National Mortgage Association(b) | | | | 5.0000 | | 05/20/34 | | | 28,692 | |
| | 223,268 | | | Government National Mortgage Association(b) | | | | 5.0000 | | 10/20/39 | | | 38,412 | |
| | 171,379 | | | Government National Mortgage Association(b),(d) | | US0001M + 5.400% | | 5.2960 | | 05/20/41 | | | 24,940 | |
| | 208,549 | | | Government National Mortgage Association(b),(d) | | US0001M + 5.450% | | 5.3460 | | 06/20/41 | | | 30,757 | |
| | 663,656 | | | GreenPoint Mortgage Funding Trust 2005-AR4(d) | | US0001M + 0.520% | | 0.6220 | | 10/25/45 | | | 673,498 | |
| | 370,304 | | | GreenPoint Mortgage Funding Trust 2005-AR5(d) | | US0001M + 0.540% | | 0.6420 | | 11/25/45 | | | 337,586 | |
| | 349,639 | | | GreenPoint Mortgage Funding Trust 2005-AR5(d) | | US0001M + 0.560% | | 0.6620 | | 11/25/45 | | | 278,747 | |
| | 1,032,614 | | | GreenPoint Mortgage Funding Trust 2006-AR2(d) | | 12MTA + 2.000% | | 2.0820 | | 03/25/36 | | | 1,027,048 | |
| | 111,120 | | | GreenPoint Mortgage Funding Trust 2006-AR3(d) | | US0001M + 0.420% | | 0.5220 | | 04/25/36 | | | 110,014 | |
| | 663,682 | | | GreenPoint Mortgage Loan Trust 2004-1(d) | | US0001M + 1.150% | | 1.2520 | | 10/25/34 | | | 605,233 | |
| | 541,460 | | | GreenPoint MTA Trust 2005-AR3(d) | | US0001M + 0.480% | | 0.5820 | | 08/25/45 | | | 524,268 | |
| | 191,355 | | | GSMPS Mortgage Loan Trust(a),(c) | | | | 7.7500 | | 05/19/27 | | | 190,755 | |
| | 89,413 | | | GSMPS Mortgage Loan Trust(a),(c) | | | | 5.2980 | | 09/19/27 | | | 90,078 | |
| | 58,592 | | | GSMPS Mortgage Loan Trust(a),(c) | | | | 8.0000 | | 09/19/27 | | | 57,709 | |
| | 194,239 | | | GSMPS Mortgage Loan Trust(a),(c) | | | | 8.0000 | | 09/19/27 | | | 198,245 | |
| | 536,717 | | | GSMPS Mortgage Loan Trust 2001-2(a),(c) | | | | 7.5000 | | 06/19/32 | | | 529,829 | |
| | 20,810 | | | GSR Mortgage Loan Trust 2003-1(d) | | H15T1Y + 1.750% | | 1.8400 | | 03/25/33 | | | 21,299 | |
| | 137,370 | | | GSR Mortgage Loan Trust 2003-1(c) | | | | 2.3420 | | 03/25/33 | | | 134,212 | |
| | 129,903 | | | GSR Mortgage Loan Trust 2003-3F(c) | | | | 5.9720 | | 04/25/33 | | | 134,488 | |
| | 206,361 | | | GSR Mortgage Loan Trust 2003-4F(c) | | | | 5.9200 | | 05/25/33 | | | 207,015 | |
| | 8,065 | | | GSR Mortgage Loan Trust 2004-10F | | | | 4.5000 | | 09/25/34 | | | 8,084 | |
| | 52,470 | | | GSR Mortgage Loan Trust 2004-13F | | | | 6.0000 | | 11/25/34 | | | 55,160 | |
| | 251,533 | | | GSR Mortgage Loan Trust 2004-15F(d) | | US0001M + 0.300% | | 0.4020 | | 12/25/34 | | | 236,594 | |
| | 15,684 | | | GSR Mortgage Loan Trust 2004-8F | | | | 6.0000 | | 09/25/34 | | | 16,044 | |
See accompanying notes to financial statements.
RATIONAL SPECIAL SITUATIONS INCOME FUND
SCHEDULE OF INVESTMENTS (Continued)
December 31, 2021
| Principal | | | | | | | Coupon Rate | | | | | |
| Amount ($) | | | | | Spread | | (%) | | Maturity | | Fair Value | |
| | | | | ASSET BACKED SECURITIES — 75.6% (Continued) | | | | | | | | | | |
| | | | | COLLATERALIZED MORTGAGE OBLIGATIONS — 35.4% (Continued) | | | | | | | | | | |
| | 32,641 | | | GSR Mortgage Loan Trust 2005-7F | | | | 5.5000 | | 09/25/35 | | $ | 33,581 | |
| | 118,126 | | | GSR Mortgage Loan Trust 2005-8F | | | | 5.5000 | | 11/25/35 | | | 123,561 | |
| | 243,365 | | | GSR Mortgage Loan Trust 2005-AR5(c) | | | | 2.5570 | | 10/25/35 | | | 243,494 | |
| | 17,204 | | | GSR Mortgage Loan Trust 2005-AR6 Series 2005-AR6-1(c) | | | | 2.7470 | | 09/25/35 | | | 17,424 | |
| | 23,497 | | | GSR Mortgage Loan Trust 2005-AR6(c) | | | | 2.8660 | | 09/25/35 | | | 23,750 | |
| | 76,230 | | | GSR Mortgage Loan Trust 2005-AR7(c) | | | | 2.3360 | | 11/25/35 | | | 73,554 | |
| | 332,675 | | | GSR Mortgage Loan Trust 2005-AR7(c) | | | | 3.1380 | | 11/25/35 | | | 317,277 | |
| | 1,624,890 | | | GSR Mortgage Loan Trust 2006-10F | | | | 5.7500 | | 12/25/36 | | | 2,986,528 | |
| | 1,501,434 | | | GSR Mortgage Loan Trust 2006-1F(d) | | US0001M + 0.950% | | 1.0520 | | 02/25/36 | | | 2,354,755 | |
| | 1,986,607 | | | GSR Mortgage Loan Trust 2006-2F | | | | 5.7500 | | 02/25/36 | | | 2,031,917 | |
| | 2,347,373 | | | GSR Mortgage Loan Trust 2006-2F | | | | 5.7500 | | 02/25/36 | | | 2,400,912 | |
| | 500,630 | | | GSR Mortgage Loan Trust 2006-7F | | | | 6.0000 | | 08/25/36 | | | 3,795,233 | |
| | 902,822 | | | GSR Mortgage Loan Trust 2007-1F | | | | 5.5000 | | 01/25/37 | | | 1,499,022 | |
| | 230,696 | | | GSR Mortgage Loan Trust 2007-1F | | | | 5.5000 | | 01/25/37 | | | 273,168 | |
| | 644,583 | | | GSR Mortgage Loan Trust 2007-1F | | | | 6.0000 | | 01/25/37 | | | 542,299 | |
| | 1,953,253 | | | GSR Mortgage Loan Trust 2007-3F | | | | 5.7500 | | 05/25/37 | | | 3,289,258 | |
| | 77,318 | | | GSR Mortgage Loan Trust 2007-4F | | | | 5.0000 | | 07/25/37 | | | 109,558 | |
| | 3,384,295 | | | GSR Mortgage Loan Trust 2007-4F | | | | 5.7500 | | 07/25/37 | | | 5,164,485 | |
| | 986,781 | | | GSR Mortgage Loan Trust 2007-AR1(c) | | | | 2.5680 | | 03/25/37 | | | 921,499 | |
| | 88,379 | | | HarborView Mortgage Loan Trust 2003-1(c) | | | | 2.1410 | | 05/19/33 | | | 72,289 | |
| | 357,835 | | | HarborView Mortgage Loan Trust 2004-1(c) | | | | 2.1990 | | 04/19/34 | | | 294,067 | |
| | 2,267,842 | | | HarborView Mortgage Loan Trust 2004-8(d) | | US0001M + 0.800% | | 0.9040 | | 11/19/34 | | | 2,183,955 | |
| | 112,997 | | | HarborView Mortgage Loan Trust 2004-9(d) | | US0001M + 0.780% | | 0.8840 | | 12/19/34 | | | 106,430 | |
| | 4,139 | | | HarborView Mortgage Loan Trust 2005-1(d) | | US0001M + 0.660% | | 0.7640 | | 03/19/35 | | | 2,921 | |
| | 28,836 | | | HarborView Mortgage Loan Trust 2005-14(c) | | | | 2.4260 | | 12/19/35 | | | 27,783 | |
| | 347,788 | | | HarborView Mortgage Loan Trust 2005-14(c) | | | | 2.4430 | | 12/19/35 | | | 336,212 | |
| | 1,054,003 | | | HarborView Mortgage Loan Trust 2005-16(d) | | 12MTA + 2.000% | | 2.0820 | | 01/19/37 | | | 923,239 | |
| | 2,477,062 | | | HarborView Mortgage Loan Trust 2005-2(d) | | US0001M + 0.520% | | 0.6240 | | 05/19/35 | | | 1,061,049 | |
| | 344,624 | | | HarborView Mortgage Loan Trust 2005-4(c) | | | | 3.8730 | | 07/19/35 | | | 329,853 | |
| | 23,066 | | | HarborView Mortgage Loan Trust 2005-8(d) | | US0001M + 0.660% | | 0.7640 | | 09/19/35 | | | 18,785 | |
| | 30,666 | | | Impac CMB Trust Series 2003-11(d) | | US0001M + 4.500% | | 4.6030 | | 10/25/33 | | | 30,543 | |
| | 2,622 | | | Impac CMB Trust Series 2003-8(d) | | US0001M + 2.625% | | 2.7280 | | 10/25/33 | | | 2,630 | |
| | 4,772 | | | Impac CMB Trust Series 2003-8(d) | | US0001M + 4.500% | | 4.6030 | | 10/25/33 | | | 4,674 | |
| | 207,565 | | | Impac CMB Trust Series 2004-10(d) | | US0001M + 0.800% | | 0.9020 | | 03/25/35 | | | 195,011 | |
See accompanying notes to financial statements.
RATIONAL SPECIAL SITUATIONS INCOME FUND
SCHEDULE OF INVESTMENTS (Continued)
December 31, 2021
| Principal | | | | | | | Coupon Rate | | | | | |
| Amount ($) | | | | | Spread | | (%) | | Maturity | | Fair Value | |
| | | | | ASSET BACKED SECURITIES — 75.6% (Continued) | | | | | | | | | | |
| | | | | COLLATERALIZED MORTGAGE OBLIGATIONS — 35.4% (Continued) | | | | | | | | | | |
| | 41,382 | | | Impac CMB Trust Series 2004-10(d) | | US0001M + 1.500% | | 1.6020 | | 03/25/35 | | $ | 40,627 | |
| | 192,855 | | | Impac CMB Trust Series 2004-10(d) | | US0001M + 2.775% | | 2.8770 | | 03/25/35 | | | 196,319 | |
| | 238,348 | | | Impac CMB Trust Series 2005-4(d) | | US0001M + 0.380% | | 0.8630 | | 05/25/35 | | | 226,295 | |
| | 714,372 | | | Impac CMB Trust Series 2005-4(d) | | US0001M + 1.650% | | 2.5780 | | 05/25/35 | | | 719,925 | |
| | 160,631 | | | Impac Secured Assets CMN Owner Trust(c) | | | | 2.8070 | | 07/25/35 | | | 152,012 | |
| | 136,366 | | | Impac Secured Assets Trust 2006-2(d) | | US0001M + 1.650% | | 1.7520 | | 08/25/36 | | | 138,112 | |
| | 158,672 | | | IndyMac ARM Trust 2001-H1(c) | | | | 1.8990 | | 08/25/31 | | | 88,743 | |
| | 83,681 | | | IndyMac IMSC Mortgage Loan Trust 2007-F3(e) | | | | — | | 09/25/37 | | | 54,347 | |
| | 94,715 | | | IndyMac INDA Mortgage Loan Trust 2005-AR1(c) | | | | 2.9010 | | 11/25/35 | | | 93,206 | |
| | 22,249 | | | IndyMac INDA Mortgage Loan Trust 2005-AR2(c) | | | | 2.8690 | | 01/25/36 | | | 21,903 | |
| | 74,884 | | | IndyMac INDA Mortgage Loan Trust 2007-AR4(c) | | | | 3.3490 | | 08/25/37 | | | 76,326 | |
| | 38,944 | | | IndyMac INDX Mortgage Loan Trust 2004-AR10(d) | | US0001M + 0.920% | | 1.0220 | | 05/25/34 | | | 35,816 | |
| | 195,291 | | | IndyMac INDX Mortgage Loan Trust 2004-AR5(d) | | US0001M + 0.860% | | 0.9620 | | 08/25/34 | | | 187,382 | |
| | 2,267,409 | | | IndyMac INDX Mortgage Loan Trust 2005-AR9(c) | | | | 2.9140 | | 07/25/35 | | | 2,261,622 | |
| | 191,086 | | | IndyMac INDX Mortgage Loan Trust 2006-AR2(d) | | US0001M + 0.420% | | 0.5220 | | 02/25/46 | | | 152,519 | |
| | 130,205 | | | IndyMac INDX Mortgage Loan Trust 2006-AR33(c) | | | | 3.5320 | | 01/25/37 | | | 127,921 | |
| | 911,643 | | | Jefferies Resecuritization Trust 2009-R7(a),(c) | | | | 2.6270 | | 10/21/35 | | | 972,148 | |
| | 435,661 | | | JP Morgan Alternative Loan Trust | | | | 5.0000 | | 12/25/35 | | | 416,445 | |
| | 4,466,730 | | | JP Morgan Alternative Loan Trust(c) | | | | 3.0450 | | 03/25/36 | | | 4,527,418 | |
| | 93,712 | | | JP Morgan Alternative Loan Trust(f) | | | | 6.1900 | | 05/25/36 | | | 94,317 | |
| | 58,140 | | | JP Morgan Mortgage Trust 2004-S2 | | | | 5.5000 | | 11/25/24 | | | 58,454 | |
| | 272,185 | | | JP Morgan Mortgage Trust 2004-S2 | | | | 6.0000 | | 11/25/34 | | | 274,451 | |
| | 1,666,217 | | | JP Morgan Mortgage Trust 2005-A6(c) | | | | 2.4810 | | 08/25/35 | | | 1,638,157 | |
| | 997,307 | | | JP Morgan Mortgage Trust 2005-A8(c) | | | | 2.7280 | | 11/25/35 | | | 920,021 | |
| | 230,467 | | | JP Morgan Mortgage Trust 2006-A6(c) | | | | 2.9120 | | 10/25/36 | | | 201,165 | |
| | 65,540 | | | JP Morgan Mortgage Trust 2007-A2(c) | | | | 2.8530 | | 04/25/37 | | | 59,839 | |
| | 65,926 | | | JP Morgan Resecuritization Trust Series 2009-7(a),(c) | | | | 6.8370 | | 07/27/37 | | | 65,960 | |
| | 2,500,000 | | | Legacy Mortgage Asset Trust 2019-GS6(a),(f) | | | | 4.4500 | | 06/25/59 | | | 2,505,819 | |
| | 1,040,143 | | | Lehman Mortgage Trust 2005-2(d) | | US0001M + 0.900% | | 1.0020 | | 12/25/35 | | | 751,766 | |
| | 915,671 | | | Lehman Mortgage Trust 2005-2(b) | | | | 5.5000 | | 12/25/35 | | | 157,446 | |
| | 167,495 | | | Lehman Mortgage Trust 2005-2(d) | | US0001M + 28.060% | | 27.5910 | | 12/25/35 | | | 202,116 | |
| | 190,040 | | | Lehman Mortgage Trust 2006-4 | | | | 6.0000 | | 07/31/36 | | | 183,012 | |
| | 486,144 | | | Lehman Mortgage Trust 2006-7(c) | | | | 4.8800 | | 09/25/36 | | | 179,733 | |
| | 239,731 | | | Lehman Mortgage Trust 2007-10 | | | | 6.5000 | | 01/25/38 | | | 108,009 | |
See accompanying notes to financial statements.
RATIONAL SPECIAL SITUATIONS INCOME FUND
SCHEDULE OF INVESTMENTS (Continued)
December 31, 2021
| Principal | | | | | | | Coupon Rate | | | | | |
| Amount ($) | | | | | Spread | | (%) | | Maturity | | Fair Value | |
| | | | | ASSET BACKED SECURITIES — 75.6% (Continued) | | | | | | | | | | |
| | | | | COLLATERALIZED MORTGAGE OBLIGATIONS — 35.4% (Continued) | | | | | | | | | | |
| | 162,330 | | | Lehman Mortgage Trust 2007-3(e) | | | | — | | 03/25/37 | | $ | 126,236 | |
| | 1,449,314 | | | Lehman Mortgage Trust 2007-5(d) | | US0001M + 0.280% | | 0.3820 | | 08/25/36 | | | 194,937 | |
| | 1,466,844 | | | Lehman Mortgage Trust 2007-5(b),(d) | | US0001M + 7.720% | | 7.6180 | | 08/25/36 | | | 608,953 | |
| | 844,754 | | | Lehman XS Trust Series 2005-5N(d) | | US0001M + 0.360% | | 0.4620 | | 11/25/35 | | | 820,397 | |
| | 346,687 | | | Lehman XS Trust Series 2006-2N(d) | | US0001M + 0.520% | | 0.6220 | | 02/25/46 | | | 320,304 | |
| | 23,102 | | | Luminent Mortgage Trust 2006-7(d) | | US0001M + 0.170% | | 0.2720 | | 12/25/36 | | | 22,118 | |
| | 393,942 | | | Luminent Mortgage Trust 2006-7(d) | | US0001M + 0.360% | | 0.4620 | | 12/25/36 | | | 373,327 | |
| | 697,978 | | | Luminent Mortgage Trust 2007-2(d) | | US0001M + 0.460% | | 0.5620 | | 05/25/37 | | | 661,221 | |
| | 350,000 | | | MASTR Adjustable Rate Mortgages Trust 2004-11(d) | | US0001M + 2.250% | | 2.3520 | | 11/25/34 | | | 354,796 | |
| | 1,252,157 | | | MASTR Adjustable Rate Mortgages Trust 2004-14(d) | | US0001M + 3.400% | | 3.5020 | | 01/25/35 | | | 1,127,354 | |
| | 99,624 | | | MASTR Adjustable Rate Mortgages Trust 2004-5(c) | | | | 4.1250 | | 06/25/34 | | | 102,981 | |
| | 1,107,801 | | | MASTR Adjustable Rate Mortgages Trust 2005-6(c) | | | | 2.6720 | | 07/25/35 | | | 552,216 | |
| | 399,583 | | | MASTR Adjustable Rate Mortgages Trust 2006-OA2(d) | | 12MTA + 0.800% | | 0.8820 | | 12/25/46 | | | 381,658 | |
| | 4,351,295 | | | MASTR Adjustable Rate Mortgages Trust 2006-OA2(d) | | 12MTA + 0.800% | | 0.8820 | | 12/25/46 | | | 3,968,179 | |
| | 2,890,517 | | | MASTR Adjustable Rate Mortgages Trust 2006-OA2(d) | | 12MTA + 0.850% | | 0.9320 | | 12/25/46 | | | 2,720,093 | |
| | 1,725,181 | | | MASTR Adjustable Rate Mortgages Trust 2006-OA2(d) | | 12MTA + 1.200% | | 1.2820 | | 12/25/46 | | | 1,633,072 | |
| | 499,195 | | | MASTR Adjustable Rate Mortgages Trust 2007-1(c) | | | | 2.7200 | | 11/25/36 | | | 350,630 | |
| | 38,110 | | | MASTR Adjustable Rate Mortgages Trust 2007-1(d) | | US0001M + 0.320% | | 0.4220 | | 01/25/47 | | | 53,355 | |
| | 4,451,523 | | | MASTR Adjustable Rate Mortgages Trust 2007-1(d) | | 12MTA + 0.740% | | 0.8220 | | 01/25/47 | | | 11,128,808 | |
| | 183,287 | | | MASTR Adjustable Rate Mortgages Trust 2007-3(d) | | US0001M + 0.680% | | 0.7820 | | 05/25/47 | | | 227,956 | |
| | 29,909 | | | MASTR Alternative Loan Trust 2003-5 | | | | 5.5000 | | 07/25/33 | | | 31,169 | |
| | 18,669 | | | MASTR Alternative Loan Trust 2004-10 | | | | 6.0000 | | 09/25/34 | | | 19,266 | |
| | 13,931 | | | MASTR Alternative Loan Trust 2004-12 | | | | 5.5000 | | 12/25/34 | | | 14,569 | |
| | 642,826 | | | MASTR Alternative Loan Trust 2004-13 | | | | 5.5000 | | 01/25/35 | | | 471,738 | |
| | 73,297 | | | MASTR Alternative Loan Trust 2005-6(e) | | | | — | | 12/25/35 | | | 30,932 | |
| | 40,459 | | | MASTR Alternative Loan Trust 2006-2(e) | | | | — | | 03/25/36 | | | 19,674 | |
| | 78,197 | | | MASTR Asset Securitization Trust 2003-11 | | | | 5.2500 | | 12/25/33 | | | 80,879 | |
| | 1,170,308 | | | MASTR Asset Securitization Trust 2004-11 | | | | 5.7500 | | 12/25/34 | | | 1,202,747 | |
| | 5,503 | | | MASTR Asset Securitization Trust 2004-3 | | | | 5.2500 | | 03/25/24 | | | 5,495 | |
| | 49,531 | | | MASTR Asset Securitization Trust 2004-3 | | | | 5.2500 | | 03/25/24 | | | 49,571 | |
| | 95,911 | | | MASTR Asset Securitization Trust 2004-9 | | | | 5.2500 | | 07/25/34 | | | 94,532 | |
| | 67,004 | | | MASTR Seasoned Securitization Trust 2003-1(d) | | US0001M + 0.400% | | 0.5020 | | 02/25/33 | | | 65,051 | |
| | 118,741 | | | Mellon Residential Funding Cor Mor Pas Thr Tr Ser(a),(c) | | | | 2.6100 | | 10/20/29 | | | 110,442 | |
| | 72,882 | | | Mellon Residential Funding Cor Mor Pas Thr Tr Ser(a),(c) | | | | 2.6100 | | 10/20/29 | | | 67,782 | |
See accompanying notes to financial statements.
RATIONAL SPECIAL SITUATIONS INCOME FUND
SCHEDULE OF INVESTMENTS (Continued)
December 31, 2021
| Principal | | | | | | | Coupon Rate | | | | | |
| Amount ($) | | | | | Spread | | (%) | | Maturity | | Fair Value | |
| | | | | ASSET BACKED SECURITIES — 75.6% (Continued) | | | | | | | | | | |
| | | | | COLLATERALIZED MORTGAGE OBLIGATIONS — 35.4% (Continued) | | | | | | | | | | |
| | 1,921,581 | | | MERIT Securities Corporation(a),(d) | | US0001M + 2.250% | | 2.3520 | | 09/28/32 | | $ | 1,764,422 | |
| | 248,148 | | | Merrill Lynch Alternative Note Asset Trust Series | | | | 5.7500 | | 05/25/37 | | | 251,488 | |
| | 358,114 | | | Merrill Lynch Mortgage Backed Securities Trust(c) | | | | 2.7050 | | 04/25/37 | | | 363,203 | |
| | 133,732 | | | Merrill Lynch Mortgage Investors Trust MLMI Series(c) | | | | 1.8690 | | 03/25/33 | | | 115,004 | |
| | 162,237 | | | Merrill Lynch Mortgage Investors Trust Series(e) | | | | — | | 08/25/36 | | | 23,759 | |
| | 103,540 | | | Merrill Lynch Mortgage Investors Trust Series MLCC(d) | | US0001M + 0.945% | | 1.0470 | | 08/25/28 | | | 95,382 | |
| | 78,047 | | | Merrill Lynch Mortgage Investors Trust Series MLCC(d) | | US0001M + 2.250% | | 2.3520 | | 08/25/28 | | | 69,268 | |
| | 351,817 | | | Merrill Lynch Mortgage Investors Trust Series MLCC(d) | | US0001M + 0.900% | | 1.0020 | | 10/25/28 | | | 334,117 | |
| | 921,063 | | | Merrill Lynch Mortgage Investors Trust Series MLCC(c) | | | | 1.9570 | | 06/25/37 | | | 878,293 | |
| | 1,362,510 | | | Merrill Lynch Mortgage Investors Trust Series MLMI(c) | | | | 2.1580 | | 09/25/35 | | | 1,222,543 | |
| | 17,728 | | | Morgan Stanley Mortgage Loan Trust 2004-3 | | | | 6.0000 | | 04/25/34 | | | 18,678 | |
| | 916,086 | | | Morgan Stanley Mortgage Loan Trust 2005-10 | | | | 5.5000 | | 12/25/35 | | | 708,428 | |
| | 190,808 | | | Morgan Stanley Mortgage Loan Trust 2005-4 | | | | 5.0000 | | 08/25/35 | | | 188,583 | |
| | 139,312 | | | Morgan Stanley Mortgage Loan Trust 2006-2 | | | | 5.2500 | | 01/25/22 | | | 136,211 | |
| | 123,973 | | | Morgan Stanley Mortgage Loan Trust 2006-7 | | | | 5.0000 | | 01/25/22 | | | 84,291 | |
| | 195,158 | | | Morgan Stanley Mortgage Loan Trust 2006-7 | | | | 6.0000 | | 06/25/31 | | | 145,629 | |
| | 28,772 | | | Morgan Stanley Re-REMIC Trust 2010-R7(a) | | | | 5.5000 | | 11/26/34 | | | 27,747 | |
| | 9,111,351 | | | Mortgage Loan Resecuritization Trust(a),(d) | | US0001M + 0.340% | | 0.4390 | | 04/16/36 | | | 8,561,752 | |
| | 4,384,622 | | | Mortgage Loan Resecuritization Trust(a),(d) | | US0001M + 0.340% | | 0.4390 | | 04/16/36 | | | 2,162,973 | |
| | 3,483,726 | | | MortgageIT Mortgage Loan Trust 2006-1(d) | | US0001M + 0.400% | | 0.5020 | | 04/25/36 | | | 2,877,953 | |
| | 193,543 | | | MortgageIT Mortgage Loan Trust 2006-1(d) | | US0001M + 0.460% | | 0.5620 | | 04/25/36 | | | 186,453 | |
| | 345,424 | | | MortgageIT Trust 2004-1(d) | | US0001M + 3.225% | | 3.3270 | | 11/25/34 | | | 349,655 | |
| | 12,052,113 | | | New Residential Mortgage Loan Trust 2019-5(a),(b),(c) | | | | 0.5000 | | 08/25/59 | | | 298,892 | |
| | 16,938,628 | | | New Residential Mortgage Loan Trust 2019-5(a),(b),(c) | | | | 0.7500 | | 08/25/59 | | | 672,464 | |
| | 275,679 | | | New York Mortgage Trust 2006-1(c) | | | | 2.6780 | | 05/25/36 | | | 254,931 | |
| | 32,500 | | | Nomura Asset Acceptance Corp Alternative Loan(f) | | | | 5.8030 | | 03/25/34 | | | 32,654 | |
| | 163,552 | | | Nomura Asset Acceptance Corp Alternative Loan(d) | | US0001M + 1.020% | | 1.1220 | | 08/25/34 | | | 166,671 | |
| | 1,901,733 | | | Nomura Asset Acceptance Corp Alternative Loan(d) | | US0001M + 1.700% | | 1.8020 | | 10/25/34 | | | 2,090,077 | |
| | 4,471 | | | Nomura Asset Acceptance Corp Alternative Loan(f) | | | | 5.5710 | | 10/25/34 | | | 4,519 | |
| | 58,291 | | | Nomura Asset Acceptance Corp Alternative Loan(c) | | | | 5.6880 | | 07/25/35 | | | 59,953 | |
| | 27,364 | | | Nomura Asset Acceptance Corp Alternative Loan(c) | | | | 2.8130 | | 12/25/35 | | | 27,461 | |
| | 471,757 | | | Nomura Asset Acceptance Corp Alternative Loan(c) | | | | 5.8940 | | 05/25/36 | | | 144,311 | |
| | 240,899 | | | Nomura Asset Acceptance Corp Alternative Loan(c) | | | | 3.2690 | | 06/25/36 | | | 211,322 | |
| | 419,644 | | | Nomura Asset Acceptance Corp Alternative Loan(c) | | | | 3.8170 | | 06/25/36 | | | 423,864 | |
See accompanying notes to financial statements.
RATIONAL SPECIAL SITUATIONS INCOME FUND
SCHEDULE OF INVESTMENTS (Continued)
December 31, 2021
| Principal | | | | | | | Coupon Rate | | | | | |
| Amount ($) | | | | | Spread | | (%) | | Maturity | | Fair Value | |
| | | | | ASSET BACKED SECURITIES — 75.6% (Continued) | | | | | | | | | | |
| | | | | COLLATERALIZED MORTGAGE OBLIGATIONS — 35.4% (Continued) | | | | | | | | | | |
| | 76,169 | | | Nomura Asset Acceptance Corp Alternative Loan(f) | | | | 5.9570 | | 03/25/47 | | $ | 79,076 | |
| | 968,343 | | | Nomura Asset Acceptance Corp Alternative Loan(f) | | | | 6.1380 | | 03/25/47 | | | 1,005,165 | |
| | 147,705 | | | NovaStar Mortgage Funding Trust Series 2006-MTA1(d) | | US0001M + 0.380% | | 0.4300 | | 09/25/46 | | | 145,548 | |
| | 292,685 | | | Ocwen Residential MBS Corporation(a),(c) | | | | 0.9750 | | 06/25/39 | | | 145,294 | |
| | 401,238 | | | PHHMC Series 2006-4 Trust(c) | | | | 6.2510 | | 12/18/36 | | | 404,882 | |
| | 210,228 | | | Prime Mortgage Trust 2004-1 | | | | 5.2500 | | 08/25/34 | | | 216,712 | |
| | 197,542 | | | Prime Mortgage Trust 2005-1(a) | | | | 5.5000 | | 09/25/34 | | | 199,681 | |
| | 102,673 | | | Prime Mortgage Trust 2005-4 | | | | 5.2500 | | 01/25/22 | | | 104,542 | |
| | 13,789 | | | Prime Mortgage Trust 2005-4 | | | | 5.0000 | | 10/25/35 | | | 14,042 | |
| | 2,397,546 | | | Prime Mortgage Trust 2006-DR1(a) | | | | 5.5000 | | 05/25/35 | | | 2,299,612 | |
| | 606,204 | | | Prime Mortgage Trust 2006-DR1(a) | | | | 6.0000 | | 05/25/35 | | | 579,412 | |
| | 405,466 | | | RALI Series 2004-QA4 Trust(c) | | | | 3.0130 | | 09/25/34 | | | 418,783 | |
| | 700,344 | | | RALI Series 2004-QA4 Trust(c) | | | | 7.8580 | | 09/25/34 | | | 639,494 | |
| | 845,977 | | | RALI Series 2004-QA6 Trust(c) | | | | 2.9110 | | 12/26/34 | | | 839,793 | |
| | 190,774 | | | RALI Series 2004-QA6 Trust(c) | | | | 3.2020 | | 12/26/34 | | | 185,833 | |
| | 2,695,729 | | | RALI Series 2005-QA11 Trust(c) | | | | 3.7300 | | 10/25/35 | | | 1,305,608 | |
| | 1,256,757 | | | RALI Series 2005-QA11 Trust(c) | | | | 4.1530 | | 10/25/35 | | | 1,205,766 | |
| | 1,608,970 | | | RALI Series 2005-QA12 Trust(c) | | | | 4.1550 | | 12/25/35 | | | 1,539,742 | |
| | 2,252,163 | | | RALI Series 2005-QA2 Trust(c) | | | | 3.0720 | | 02/25/35 | | | 1,718,113 | |
| | 198,568 | | | RALI Series 2005-QA2 Trust(c) | | | | 3.3730 | | 02/25/35 | | | 177,716 | |
| | 215,351 | | | RALI Series 2005-QA3 Trust(c) | | | | 2.3250 | | 03/25/35 | | | 71,066 | |
| | 228,762 | | | RALI Series 2005-QA4 Trust(c) | | | | 4.0910 | | 04/25/35 | | | 200,666 | |
| | 386,871 | | | RALI Series 2005-QA6 Trust(c) | | | | 3.7390 | | 05/25/35 | | | 251,243 | |
| | 115,872 | | | RALI Series 2005-QA8 Trust(c) | | | | 3.4100 | | 07/25/35 | | | 106,007 | |
| | 490,294 | | | RALI Series 2005-QA8 Trust(c) | | | | 3.4420 | | 07/25/35 | | | 353,793 | |
| | 195,094 | | | RALI Series 2005-QA9 Trust(c) | | | | 3.1320 | | 08/25/35 | | | 104,129 | |
| | 1,944,944 | | | RALI Series 2005-QA9 Trust(c) | | | | 3.3780 | | 08/25/35 | | | 1,897,137 | |
| | 681,087 | | | RALI Series 2005-QO4 Trust(d) | | US0001M + 0.560% | | 0.6620 | | 12/25/45 | | | 550,863 | |
| | 1,480,962 | | | RALI Series 2005-QS5 Trust | | | | 5.7000 | | 04/25/35 | | | 1,434,778 | |
| | 14,755 | | | RALI Series 2006-QA1 Trust(c) | | | | 5.3280 | | 01/25/36 | | | 13,999 | |
| | 147,082 | | | RALI Series 2006-QA2 Trust(c) | | | | 5.4320 | | 02/25/36 | | | 124,656 | |
| | 7,823,979 | | | RALI Series 2006-QS11 Trust | | | | 6.5000 | | 08/25/36 | | | 3,746,924 | |
| | 68,644 | | | RALI Series 2006-QS12 Trust | | | | 5.0000 | | 09/25/36 | | | 63,347 | |
| | 349,807 | | | RALI Series 2007-QS4 Trust | | | | 6.2500 | | 03/25/37 | | | 326,088 | |
See accompanying notes to financial statements.
RATIONAL SPECIAL SITUATIONS INCOME FUND
SCHEDULE OF INVESTMENTS (Continued)
December 31, 2021
| Principal | | | | | | | Coupon Rate | | | | | |
| Amount ($) | | | | | Spread | | (%) | | Maturity | | Fair Value | |
| | | | | ASSET BACKED SECURITIES — 75.6% (Continued) | | | | | | | | | | |
| | | | | COLLATERALIZED MORTGAGE OBLIGATIONS — 35.4% (Continued) | | | | | | | | | | |
| | 168,936 | | | RAMP Series 2003-SL1 Trust | | | | 8.0000 | | 04/25/31 | | $ | 171,584 | |
| | 594,019 | | | RAMP Series 2004-SL1 Trust | | | | 6.5000 | | 11/25/31 | | | 574,690 | |
| | 294,474 | | | RAMP Series 2004-SL4 Trust | | | | 7.5000 | | 07/25/32 | | | 165,912 | |
| | 160,097 | | | RAMP Series 2005-SL1 Trust | | | | 7.5000 | | 05/25/32 | | | 32,123 | |
| | 547,474 | | | RAMP Series 2005-SL1 Trust | | | | 8.0000 | | 05/25/32 | | | 432,787 | |
| | 248,736 | | | RAMP Series 2005-SL2 Trust | | | | 8.0000 | | 10/25/31 | | | 157,142 | |
| | 651,628 | | | RBSGC Mortgage Loan Trust 2005-A | | | | 6.0000 | | 04/25/35 | | | 633,147 | |
| | 1,650,938 | | | RBSSP Resecuritization Trust 2009-6(a),(c) | | | | 6.0000 | | 08/26/35 | | | 987,909 | |
| | 135,982 | | | Reperforming Loan REMIC Trust 2004-R1(a) | | | | 6.5000 | | 11/25/34 | | | 135,877 | |
| | 772,507 | | | Reperforming Loan REMIC Trust 2005-R2(a),(b),(c) | | | | 5.5340 | | 06/25/35 | | | 101,616 | |
| | 577,188 | | | Reperforming Loan REMIC Trust 2006-R2(a),(d) | | US0001M + 0.420% | | 0.5220 | | 07/25/36 | | | 544,453 | |
| | 574,024 | | | Residential Asset Securitization Trust 2004-A2(d) | | US0001M + 0.550% | | 0.6520 | | 05/25/34 | | | 557,051 | |
| | 254,443 | | | Residential Asset Securitization Trust 2006-A3CB(e) | | | | — | | 01/25/46 | | | 56,978 | |
| | 231,027 | | | Residential Asset Securitization Trust 2006-A3CB(b),(c) | | | | 6.0000 | | 01/25/46 | | | 55,956 | |
| | 1,598,462 | | | RFMSI Series 2005-SA1 Trust(c) | | | | 2.6210 | | 03/25/35 | | | 1,341,742 | |
| | 1,461 | | | RFMSI Series 2005-SA2 Trust(c) | | | | 2.9440 | | 06/25/35 | | | 1,423 | |
| | 1,066,480 | | | RFMSI Series 2005-SA5 Trust(c) | | | | 3.4690 | | 11/25/35 | | | 1,014,920 | |
| | 2,045,914 | | | RFMSI Series 2006-SA2 Trust(c) | | | | 4.1810 | | 08/25/36 | | | 1,868,807 | |
| | 112,969 | | | RFMSI Series 2006-SA3 Trust(c) | | | | 4.6950 | | 09/25/36 | | | 105,000 | |
| | 181,868 | | | RFMSI Series 2006-SA4 Trust(c) | | | | 4.4800 | | 11/25/36 | | | 174,829 | |
| | 207,333 | | | Sequoia Mortgage Trust 2004-1(d) | | US0001M + 0.825% | | 0.9290 | | 02/20/34 | | | 179,003 | |
| | 225,276 | | | Sequoia Mortgage Trust 2004-11(d) | | US0006M + 0.640% | | 0.8630 | | 12/20/34 | | | 212,020 | |
| | 63,628 | | | Sequoia Mortgage Trust 2004-5(d) | | US0001M + 0.720% | | 0.8240 | | 06/20/34 | | | 57,881 | |
| | 58,658 | | | Sequoia Mortgage Trust 2004-6(d) | | US0001M + 0.750% | | 0.8540 | | 07/20/34 | | | 55,650 | |
| | 204,856 | | | Sequoia Mortgage Trust 2007-1(c) | | | | 2.9880 | | 01/20/47 | | | 175,486 | |
| | 1,433,678 | | | Sequoia Mortgage Trust 4(d) | | US0001M + 1.250% | | 1.3410 | | 04/22/25 | | | 1,272,285 | |
| | 58,032 | | | Sofi Mortgage Trust 2016-1(a),(c) | | | | 3.0000 | | 11/25/46 | | | 58,650 | |
| | 55,606 | | | Structured Adjustable Rate Mortgage Loan Trust(c) | | | | 2.8810 | | 03/25/34 | | | 55,806 | |
| | 1,599,115 | | | Structured Adjustable Rate Mortgage Loan Trust(d) | | US0001M + 0.405% | | 0.5070 | | 06/25/34 | | | 1,525,256 | |
| | 297,849 | | | Structured Adjustable Rate Mortgage Loan Trust(d) | | US0001M + 0.310% | | 0.4120 | | 07/25/35 | | | 213,055 | |
| | 257,581 | | | Structured Adjustable Rate Mortgage Loan Trust(c) | | | | 3.2520 | | 04/25/47 | | | 261,474 | |
| | 299,883 | | | Structured Asset Mortgage Investments II Trust(c) | | | | 2.6210 | | 10/19/34 | | | 294,590 | |
| | 232,103 | | | Structured Asset Mortgage Investments II Trust(d) | | US0001M + 0.400% | | 0.5040 | | 02/19/35 | | | 224,849 | |
| | 1,451,016 | | | Structured Asset Mortgage Investments II Trust(d) | | US0001M + 0.400% | | 0.5020 | | 02/25/36 | | | 1,263,391 | |
See accompanying notes to financial statements.
RATIONAL SPECIAL SITUATIONS INCOME FUND
SCHEDULE OF INVESTMENTS (Continued)
December 31, 2021
| Principal | | | | | | | Coupon Rate | | | | | |
| Amount ($) | | | | | Spread | | (%) | | Maturity | | Fair Value | |
| | | | | ASSET BACKED SECURITIES — 75.6% (Continued) | | | | | | | | | | |
| | | | | COLLATERALIZED MORTGAGE OBLIGATIONS — 35.4% (Continued) | | | | | | | | | | |
| | 153,587 | | | Structured Asset Mortgage Investments II Trust(d) | | US0001M + 0.460% | | 0.5620 | | 02/25/36 | | $ | 144,671 | |
| | 666,479 | | | Structured Asset Mortgage Investments II Trust(d) | | US0001M + 0.460% | | 0.5620 | | 02/25/36 | | | 641,822 | |
| | 4,863,067 | | | Structured Asset Mortgage Investments II Trust(c) | | | | 2.4570 | | 05/25/36 | | | 1,693,508 | |
| | 171,087 | | | Structured Asset Mortgage Investments II Trust(c) | | | | 2.5250 | | 05/25/36 | | | 110,697 | |
| | 75,022 | | | Structured Asset Mortgage Investments II Trust(d) | | US0001M + 0.150% | | 0.2520 | | 02/25/37 | | | 73,220 | |
| | 794,013 | | | Structured Asset Mortgage Investments II Trust(d) | | US0001M + 0.260% | | 0.3620 | | 03/25/37 | | | 307,631 | |
| | 1,073,468 | | | Structured Asset Mortgage Investments II Trust(d) | | US0001M + 0.460% | | 0.5620 | | 05/25/45 | | | 907,247 | |
| | 1,932,342 | | | Structured Asset Mortgage Investments II Trust(d) | | US0001M + 0.420% | | 0.5220 | | 05/25/46 | | | 1,202,794 | |
| | 411,724 | | | Structured Asset Mortgage Investments II Trust(d) | | US0001M + 0.420% | | 0.5220 | | 05/25/46 | | | 367,359 | |
| | 690,611 | | | Structured Asset Mortgage Investments Trust(d) | | US0001M + 1.200% | | 1.3040 | | 05/19/33 | | | 648,970 | |
| | 469,587 | | | Structured Asset Sec Corp Mort Pass Thr Certs | | | | 6.5000 | | 07/25/28 | | | 255,019 | |
| | 1,589,019 | | | Structured Asset Sec Corp Mort Passthr Certs Ser(d) | | | | 2.4170 | | 01/25/34 | | | 1,111,849 | |
| | 96,286 | | | Structured Asset Sec Mortgage Pass-Through(c) | | | | 2.1650 | | 11/25/32 | | | 96,674 | |
| | 127,026 | | | Structured Asset Securities Corp Mortgage(f) | | | | 3.9670 | | 08/25/33 | | | 132,719 | |
| | 657,225 | | | Structured Asset Securities Corp Mortgage(f) | | | | 4.9880 | | 06/25/34 | | | 676,353 | |
| | 153,257 | | | Structured Asset Securities Corp Mortgage Loan(a),(c) | | | | 2.7760 | | 10/25/36 | | | 150,802 | |
| | 83,044 | | | Structured Asset Securities Corporation(f) | | | | 5.1320 | | 02/25/34 | | | 84,519 | |
| | 521,111 | | | TBW Mortgage-Backed Pass-Through Certificates | | | | 6.5000 | | 04/25/36 | | | 435,784 | |
| | 1,348,014 | | | TBW Mortgage-Backed Trust 2006-6(f) | | | | 5.6600 | | 01/25/37 | | | 517,486 | |
| | 483,804 | | | TBW Mortgage-Backed Trust Series 2006-2 | | | | 6.0000 | | 07/25/36 | | | 243,157 | |
| | 1,028,070 | | | Terwin Mortgage Trust 2006-9HGA(a),(d) | | US0001M + 0.560% | | 0.6620 | | 10/25/37 | | | 434,116 | |
| | 378,891 | | | Terwin Mortgage Trust 2007-6ALT(a),(d) | | US0001M + 0.600% | | 0.7020 | | 08/25/38 | | | 330,518 | |
| | 166,488 | | | Thornburg Mortgage Securities Trust 2007-3(d) | | US0012M + 1.250% | | 1.8110 | | 06/25/47 | | | 165,459 | |
| | 15,752,371 | | | Voyager CBASS Delaware Trust(a),(c) | | | | 0.5630 | | 02/26/37 | | | 642,539 | |
| | 1,670,461 | | | Voyager CNTYW Delaware Trust(a),(c) | | | | 0.4100 | | 12/16/33 | | | 1,601,368 | |
| | 1,463,064 | | | Voyager CNTYW Delaware Trust(a),(c) | | | | 0.3500 | | 02/16/36 | | | 1,331,905 | |
| | 5,588,725 | | | Voyager CNTYW Delaware Trust(a),(c) | | | | 0.3500 | | 02/16/36 | | | 5,055,719 | |
| | 13,382,259 | | | Voyager CNTYW Delaware Trust(a),(c) | | | | 0.3100 | | 05/16/36 | | | 12,020,352 | |
| | 585,742 | | | Voyager OPTONE Delaware Trust(a),(b),(c) | | | | 0.3530 | | 02/25/38 | | | 182,299 | |
| | 398,239 | | | Wachovia Mortgage Loan Trust, LLC Series 2005-A(c) | | | | 2.1780 | | 08/20/35 | | | 406,229 | |
| | 2,386,400 | | | Wachovia Mortgage Loan Trust, LLC Series 2005-A(c) | | | | 2.8230 | | 08/20/35 | | | 2,397,129 | |
| | 95,239 | | | Wachovia Mortgage Loan Trust, LLC Series 2006-A(c) | | | | 2.8580 | | 05/20/36 | | | 97,731 | |
| | 34,024 | | | Wachovia Mortgage Loan Trust, LLC Series 2006-A(c) | | | | 3.0400 | | 05/20/36 | | | 33,273 | |
| | 1,067,948 | | | Wachovia Mortgage Loan Trust, LLC Series 2007-A(c) | | | | 2.4170 | | 03/20/37 | | | 1,045,221 | |
See accompanying notes to financial statements.
RATIONAL SPECIAL SITUATIONS INCOME FUND
SCHEDULE OF INVESTMENTS (Continued)
December 31, 2021
| Principal | | | | | | | Coupon Rate | | | | | |
| Amount ($) | | | | | Spread | | (%) | | Maturity | | Fair Value | |
| | | | | ASSET BACKED SECURITIES — 75.6% (Continued) | | | | | | | | | | |
| | | | | COLLATERALIZED MORTGAGE OBLIGATIONS — 35.4% (Continued) | | | | | | | | | | |
| | 149,167 | | | WaMu Mortgage Backed Pass Through Certificates(c) | | | | 1.6440 | | 12/19/39 | | $ | 143,999 | |
| | 50,873 | | | WaMu Mortgage Backed Pass Through Certificates(a),(c) | | | | 1.6440 | | 12/19/39 | | | 45,946 | |
| | 38,170 | | | WaMu Mortgage Backed Pass Through Certificates(a),(c) | | | | 1.6440 | | 12/19/39 | | | 33,741 | |
| | 29,451 | | | WaMu Mortgage Backed Pass Through Certificates(a),(c) | | | | 1.6440 | | 12/19/39 | | | 21,058 | |
| | 145,483 | | | WaMu Mortgage Pass-Through Certificates Series(c) | | | | 2.4950 | | 10/25/32 | | | 143,466 | |
| | 262,678 | | | WaMu Mortgage Pass-Through Certificates Series | | | | 5.7500 | | 01/25/33 | | | 267,911 | |
| | 474,819 | | | WaMu Mortgage Pass-Through Certificates Series(c) | | | | 2.6090 | | 02/25/33 | | | 471,383 | |
| | 1,239,719 | | | WaMu Mortgage Pass-Through Certificates Series(c) | | | | 0.4300 | | 06/25/33 | | | 740,232 | |
| | 202,596 | | | WaMu Mortgage Pass-Through Certificates Series(c) | | | | 2.5140 | | 09/25/33 | | | 174,129 | |
| | 99,061 | | | WaMu Mortgage Pass-Through Certificates Series | | | | 5.5000 | | 06/25/34 | | | 101,468 | |
| | 17,228 | | | WaMu Mortgage Pass-Through Certificates Series | | | | 5.5000 | | 07/25/34 | | | 18,103 | |
| | 60,342 | | | WaMu Mortgage Pass-Through Certificates Series(c) | | | | 3.2620 | | 10/25/36 | | | 58,890 | |
| | 279,326 | | | WaMu Mortgage Pass-Through Certificates Series(c) | | | | 1.4840 | | 11/25/41 | | | 250,222 | |
| | 21,767 | | | WaMu Mortgage Pass-Through Certificates Series(a),(d) | | 12MTA + 1.400% | | 1.4820 | | 06/25/42 | | | 6,986 | |
| | 116,491 | | | WaMu Mortgage Pass-Through Certificates Series(d) | | 12MTA + 1.400% | | 1.4820 | | 06/25/42 | | | 110,089 | |
| | 115,350 | | | WaMu Mortgage Pass-Through Certificates Series(d) | | 12MTA + 1.400% | | 1.4820 | | 06/25/42 | | | 109,743 | |
| | 230,182 | | | WaMu Mortgage Pass-Through Certificates Series(d) | | 12MTA + 1.400% | | 1.4820 | | 06/25/42 | | | 220,139 | |
| | 36,127 | | | WaMu Mortgage Pass-Through Certificates Series(d) | | 12MTA + 1.400% | | 1.4820 | | 08/25/42 | | | 25,867 | |
| | 75,834 | | | WaMu Mortgage Pass-Through Certificates Series(d) | | 12MTA + 1.400% | | 1.4820 | | 08/25/42 | | | 73,996 | |
| | 2,474,589 | | | WaMu Mortgage Pass-Through Certificates Series(d) | | 12MTA + 0.980% | | 1.0620 | | 07/25/46 | | | 2,379,519 | |
| | 131,213 | | | WaMu Pass Through Certificates Series 2002-AR12(c) | | | | 2.3250 | | 10/25/32 | | | 130,472 | |
| | 80,706 | | | WaMu Pass Through Certificates Series 2002-AR12(c) | | | | 2.3250 | | 10/25/32 | | | 77,165 | |
| | 1,407,607 | | | Washington Mutual Mortgage Pass-Through | | | | 5.5000 | | 03/25/35 | | | 1,412,530 | |
| | 101,448 | | | Washington Mutual Mortgage Pass-Through | | | | 5.5000 | | 03/25/35 | | | 102,752 | |
| | 2,174,952 | | | Washington Mutual Mortgage Pass-Through(d) | | US0001M + 0.500% | | 0.6020 | | 02/25/36 | | | 1,886,005 | |
| | 356,380 | | | Washington Mutual Mortgage Pass-Through | | | | 6.0000 | | 03/25/36 | | | 323,925 | |
| | 342,088 | | | Washington Mutual Mortgage Pass-Through | | | | 6.0000 | | 04/25/37 | | | 338,916 | |
| | 65,568 | | | Washington Mutual Mortgage Pass-Through(d) | | 12MTA + 0.940% | | 1.0220 | | 04/25/46 | | | 61,663 | |
| | 445,334 | | | Washington Mutual Mortgage Pass-Through(d) | | 12MTA + 0.940% | | 1.0220 | | 07/25/46 | | | 302,974 | |
| | 737,730 | | | Washington Mutual Mortgage Pass-Through(d) | | 12MTA + 0.960% | | 1.0420 | | 08/25/46 | | | 480,248 | |
| | 57,305 | | | Washington Mutual Mortgage Pass-Through(d) | | 12MTA + 0.850% | | 0.9320 | | 10/25/46 | | | 52,123 | |
| | 35,651 | | | Washington Mutual MSC Mortgage Pass-Through(a) | | | | 6.5000 | | 10/19/29 | | | 35,130 | |
| | 35,651 | | | Washington Mutual MSC Mortgage Pass-Through(a) | | | | 6.5000 | | 10/19/29 | | | 35,110 | |
| | 59,283 | | | Washington Mutual MSC Mortgage Pass-Through(c) | | | | 2.7990 | | 02/25/33 | | | 59,516 | |
See accompanying notes to financial statements.
RATIONAL SPECIAL SITUATIONS INCOME FUND
SCHEDULE OF INVESTMENTS (Continued)
December 31, 2021
| Principal | | | | | | | Coupon Rate | | | | | |
| Amount ($) | | | | | Spread | | (%) | | Maturity | | Fair Value | |
| | | | | ASSET BACKED SECURITIES — 75.6% (Continued) | | | | | | | | | | |
| | | | | COLLATERALIZED MORTGAGE OBLIGATIONS — 35.4% (Continued) | | | | | | | | | | |
| | 364,211 | | | Washington Mutual MSC Mortgage Pass-Through(a),(c) | | | | 5.6900 | | 02/25/33 | | $ | 102,983 | |
| | 75,335 | | | Washington Mutual MSC Mortgage Pass-Through | | | | 5.7500 | | 03/25/33 | | | 75,694 | |
| | 161,251 | | | Washington Mutual MSC Mortgage Pass-Through(c) | | | | 8.3400 | | 03/25/33 | | | 116,541 | |
| | 49,734 | | | Washington Mutual MSC Mortgage Pass-Through | | | | 7.5000 | | 04/25/33 | | | 50,919 | |
| | 716,356 | | | Washington Mutual MSC Mortgage Pass-Through(c) | | | | 2.4210 | | 05/25/33 | | | 715,714 | |
| | 827,979 | | | Washington Mutual MSC Mortgage Pass-Through(c) | | | | 6.9970 | | 07/25/33 | | | 811,298 | |
| | 33,578 | | | Wells Fargo Alternative Loan 2007-PA2 Trust | | | | 5.5000 | | 06/25/22 | | | 33,467 | |
| | 58,948 | | | Wells Fargo Mortgage Backed Securities 2003-I(c) | | | | 2.3780 | | 09/25/33 | | | 47,211 | |
| | 37,695 | | | Wells Fargo Mortgage Backed Securities 2004-K(c) | | | | 2.6150 | | 07/25/34 | | | 38,041 | |
| | 62,541 | | | Wells Fargo Mortgage Backed Securities 2004-K(c) | | | | 2.6150 | | 07/25/34 | | | 63,028 | |
| | | | | | | | | | | | | | 270,578,779 | |
| | | | | HOME EQUITY — 12.0% | | | | | | | | | | |
| | 1,300,807 | | | ABFC 2002-WF2 Trust | | | | — | | 11/25/29 | | | 1,325,002 | |
| | 156,422 | | | ABFS Mortgage Loan Trust 2000-3(f) | | | | 8.1100 | | 09/15/31 | | | 153,481 | |
| | 3,208,295 | | | ABFS Mortgage Loan Trust 2002-1(f) | | | | 7.0100 | | 12/15/32 | | | 3,165,488 | |
| | 1,152,110 | | | ABFS Mortgage Loan Trust 2003-1(d) | | US0001M + 2.250% | | 2.3600 | | 08/15/33 | | | 1,147,811 | |
| | 375,167 | | | Accredited Mortgage Loan Trust 2004-3(f) | | | | 6.0000 | | 10/25/34 | | | 380,607 | |
| | 892,823 | | | Accredited Mortgage Loan Trust 2005-1(d) | | US0001M + 3.300% | | 3.4020 | | 04/25/35 | | | 917,882 | |
| | 22,085 | | | ACE Securities Corp Home Equity Loan Trust Series(d) | | US0001M + 1.275% | | 1.3770 | | 08/25/32 | | | 21,472 | |
| | 322,426 | | | ACE Securities Corp Home Equity Loan Trust Series(d) | | US0001M + 2.250% | | 2.3530 | | 12/25/33 | | | 323,073 | |
| | 528,589 | | | ACE Securities Corp Home Equity Loan Trust Series(a),(d) | | US0001M + 5.250% | | 5.3520 | | 07/25/34 | | | 527,872 | |
| | 1,531,310 | | | ACE Securities Corp Home Equity Loan Trust Series(d) | | US0001M + 3.500% | | 3.6020 | | 05/25/35 | | | 1,619,113 | |
| | 8,878 | | | ACE Securities Corp Home Equity Loan Trust Series(d) | | US0001M + 0.070% | | 0.1720 | | 11/25/36 | | | 4,436 | |
| | 236,537 | | | ACE Securities Corp Home Equity Loan Trust Series(d) | | US0001M + 0.180% | | 0.2820 | | 02/25/37 | | | 130,291 | |
| | 482,688 | | | Aegis Asset Backed Securities Trust Mortgage(d) | | US0001M + 2.025% | | 2.1270 | | 10/25/34 | | | 484,736 | |
| | 370,110 | | | Aegis Asset Backed Securities Trust Mortgage Pass-(d) | | US0001M + 3.150% | | 3.2520 | | 09/25/34 | | | 384,866 | |
| | 52,068 | | | AFC Home Equity Loan Trust(d) | | US0001M + 0.720% | | 0.8220 | | 09/22/28 | | | 51,649 | |
| | 832,686 | | | AFC Trust Series 2000-2(d) | | US0001M + 0.700% | | 0.8020 | | 06/25/30 | | | 802,155 | |
| | 1,193,134 | | | AFC Trust Series 2000-2(d) | | US0001M + 0.790% | | 0.8920 | | 06/25/30 | | | 1,157,279 | |
| | 153,910 | | | AFC Trust Series 2000-3(a),(d) | | US0001M + 0.640% | | 0.7420 | | 10/25/30 | | | 150,637 | |
| | 881,039 | | | AFC Trust Series 2000-3(a),(d) | | US0001M + 0.750% | | 0.8520 | | 10/25/30 | | | 849,712 | |
| | 51,611 | | | Ameriquest Mortgage Securities Asset-Backed(d) | | US0001M + 2.850% | | 2.9520 | | 08/25/32 | | | 51,794 | |
| | 209,560 | | | Ameriquest Mortgage Securities Asset-Backed(d) | | US0001M + 4.500% | | 3.5600 | | 01/25/33 | | | 213,553 | |
| | 416,621 | | | Ameriquest Mortgage Securities Inc Asset-Backed(d) | | US0001M + 3.750% | | 3.1900 | | 02/25/33 | | | 412,071 | |
See accompanying notes to financial statements.
RATIONAL SPECIAL SITUATIONS INCOME FUND
SCHEDULE OF INVESTMENTS (Continued)
December 31, 2021
| Principal | | | | | | | Coupon Rate | | | | | |
| Amount ($) | | | | | Spread | | (%) | | Maturity | | Fair Value | |
| | | | | ASSET BACKED SECURITIES — 75.6% (Continued) | | | | | | | | | | |
| | | | | HOME EQUITY — 12.0% (Continued) | | | | | | | | | | |
| | 1,236,342 | | | Amresco Residential Securities Corp Mort Loan(d) | | US0001M + 0.750% | | 1.3520 | | 11/25/29 | | $ | 1,249,231 | |
| | 79,399 | | | Amresco Residential Securities Corp Mortgage Loan(f) | | | | 7.5180 | | 10/25/27 | | | 80,834 | |
| | 762,597 | | | Argent Securities Inc Asset-Backed Pass-Through(d) | | US0001M + 5.625% | | 4.0620 | | 09/25/33 | | | 778,499 | |
| | 1,862,380 | | | Asset Backed Securities Corp Home Equity Loan(d) | | US0001M + 5.250% | | 5.3600 | | 01/15/33 | | | 1,927,934 | |
| | 7,949 | | | Asset Backed Securities Corp Home Equity Loan(d) | | US0001M + 0.080% | | 0.1820 | | 05/25/37 | | | 6,362 | |
| | 309,404 | | | Bayview Financial Asset Trust 2007-SSR1(a),(d) | | US0001M + 0.800% | | 0.8920 | | 03/25/37 | | | 296,774 | |
| | 182,770 | | | Bayview Financial Asset Trust 2007-SSR1(a),(d) | | US0001M + 1.150% | | 1.2420 | | 03/25/37 | | | 177,942 | |
| | 46,278 | | | Bayview Financial Mortgage Pass-Through(d) | | US0001M + 2.850% | | 2.9520 | | 08/28/44 | | | 46,993 | |
| | 434,232 | | | Bear Stearns Asset Backed Securities I Trust(d) | | US0001M + 1.755% | | 1.8570 | | 09/25/34 | | | 440,680 | |
| | 9,082,000 | | | Bear Stearns Asset Backed Securities I Trust(d) | | US0001M + 6.000% | | 6.1020 | | 10/25/34 | | | 9,663,592 | |
| | 148,759 | | | Bear Stearns Asset Backed Securities I Trust(d) | | US0001M + 4.650% | | 4.7420 | | 12/25/34 | | | 160,179 | |
| | 572,024 | | | Bear Stearns Asset Backed Securities I Trust(d) | | US0001M + 2.550% | | 2.6420 | | 05/25/35 | | | 580,968 | |
| | 3,547,332 | | | Bear Stearns Asset Backed Securities I Trust(a),(d) | | US0001M + 4.500% | | 4.5920 | | 08/25/35 | | | 3,787,716 | |
| | 820,843 | | | Bear Stearns Asset Backed Securities I Trust(d) | | US0001M + 0.615% | | 0.7170 | | 02/25/36 | | | 951,250 | |
| | 277,664 | | | Bear Stearns Asset Backed Securities I Trust(d) | | US0001M + 0.270% | | 0.3720 | | 01/25/37 | | | 970,802 | |
| | 28,034 | | | Bear Stearns Second Lien Trust 2007-1(d) | | US0001M + 0.440% | | 0.5420 | | 08/25/37 | | | 26,766 | |
| | 589,524 | | | Bond Securitization Trust 2003-1(c),(e) | | | | — | | 10/25/34 | | | 486,113 | |
| | 152,101 | | | Centex Home Equity Loan Trust 2004-C(d) | | US0001M + 0.795% | | 0.8970 | | 06/25/34 | | | 147,645 | |
| | 332,914 | | | Centex Home Equity Loan Trust 2004-D(f) | | | | 6.0600 | | 09/25/34 | | | 343,877 | |
| | 489,224 | | | Citigroup Mortgage Loan Trust 2007-OPX1(f) | | | | 5.8630 | | 01/25/37 | | | 277,957 | |
| | 99,455 | | | Contimortgage Home Equity Loan Trust 1996-4(d) | | US0001M + 0.480% | | 0.5900 | | 01/15/28 | | | 90,727 | |
| | 163 | | | Countrywide Asset-Backed Certificates(c) | | | | 5.0910 | | 05/25/32 | | | 160 | |
| | 20 | | | Countrywide Asset-Backed Certificates(c) | | | | 5.8340 | | 07/25/34 | | | 20 | |
| | 45,791 | | | Countrywide Asset-Backed Certificates(f) | | | | 5.2520 | | 02/25/35 | | | 46,645 | |
| | 32,622 | | | Countrywide Home Equity Loan Trust(d) | | US0001M + 0.150% | | 0.2600 | | 11/15/36 | | | 28,989 | |
| | 708,162 | | | Countrywide Home Equity Loan Trust(d) | | US0001M + 0.150% | | 0.2600 | | 11/15/36 | | | 616,862 | |
| | 741,697 | | | Credit Suisse First Boston Mortgage Securities(d) | | US0001M + 0.740% | | 0.8420 | | 08/25/32 | | | 732,406 | |
| | 578,775 | | | Credit Suisse First Boston Mortgage Securities(d) | | US0001M + 3.250% | | 3.3520 | | 04/25/34 | | | 586,925 | |
| | 535 | | | CWABS Revolving Home Equity Loan Trust Series(d) | | US0001M + 0.290% | | 0.4000 | | 12/15/33 | | | 535 | |
| | 66,776 | | | CWABS Revolving Home Equity Loan Trust Series(d) | | US0001M + 0.280% | | 0.3900 | | 02/15/34 | | | 65,985 | |
| | 107,266 | | | CWABS Revolving Home Equity Loan Trust Series(d) | | US0001M + 0.280% | | 0.3900 | | 02/15/34 | | | 103,003 | |
| | 3,009,262 | | | CWHEQ Home Equity Loan Trust Series 2006-S5 | | | | 6.1550 | | 06/25/35 | | | 3,837,006 | |
| | 611,121 | | | CWHEQ Revolving Home Equity Loan Trust Series(d) | | US0001M + 0.240% | | 0.3500 | | 02/15/36 | | | 586,475 | |
| | 967,733 | | | CWHEQ Revolving Home Equity Loan Trust Series(d) | | US0001M + 0.340% | | 0.4500 | | 02/15/36 | | | 925,190 | |
See accompanying notes to financial statements.
RATIONAL SPECIAL SITUATIONS INCOME FUND
SCHEDULE OF INVESTMENTS (Continued)
December 31, 2021
| Principal | | | | | | | Coupon Rate | | | | | |
| Amount ($) | | | | | Spread | | (%) | | Maturity | | Fair Value | |
| | | | | ASSET BACKED SECURITIES — 75.6% (Continued) | | | | | | | | | | |
| | | | | HOME EQUITY — 12.0% (Continued) | | | | | | | | | | |
| | 1,244,468 | | | CWHEQ Revolving Home Equity Loan Trust Series(d) | | US0001M + 0.200% | | 0.3100 | | 05/15/36 | | $ | 1,193,671 | |
| | 74,753 | | | CWHEQ Revolving Home Equity Loan Trust Series(d) | | US0001M + 0.140% | | 0.2500 | | 01/15/37 | | | 71,618 | |
| | 441,574 | | | EquiFirst Mortgage Loan Trust 2004-2(d) | | US0001M + 1.875% | | 1.9770 | | 10/25/34 | | | 441,034 | |
| | 389,026 | | | FirstCity Capital Home Equity Loan Trust 1998-2(a),(d) | | US0001M + 1.600% | | 1.7020 | | 01/25/29 | | | 387,280 | |
| | 312,988 | | | GMACM Home Equity Loan Trust 2004-HE1(d) | | US0001M + 0.500% | | 0.5890 | | 06/25/34 | | | 308,658 | |
| | 650,654 | | | GMACM Home Equity Loan Trust 2004-HE1(a),(d) | | US0001M + 0.500% | | 0.5890 | | 06/25/34 | | | 641,653 | |
| | 77,295 | | | GMACM Home Equity Loan Trust 2004-HE3(a),(d) | | US0001M + 0.500% | | 0.6020 | | 10/25/34 | | | 74,574 | |
| | 17,326 | | | GMACM Home Equity Loan Trust 2005-HE1(a),(d) | | US0001M + 0.500% | | 0.6020 | | 08/25/35 | | | 13,868 | |
| | 1,822,374 | | | GMACM Home Equity Loan Trust 2007-HE2(d) | | US0001M + 0.140% | | 0.2420 | | 12/25/37 | | | 1,789,527 | |
| | 1,382,832 | | | GMACM Home Equity Loan Trust 2007-HE2(f) | | | | 7.4240 | | 12/25/37 | | | 1,441,517 | |
| | 546,720 | | | GMACM Mortgage Loan Trust 2004-GH1(f) | | | | 5.5000 | | 07/25/35 | | | 402,057 | |
| | 25,657 | | | GreenPoint Home Equity Loan Trust 2004-4(d) | | US0001M + 0.280% | | 0.3900 | | 08/15/30 | | | 25,162 | |
| | 476,229 | | | GSAA Home Equity Trust 2005-2(d) | | US0001M + 2.175% | | 2.2770 | | 12/25/34 | | | 540,783 | |
| | 1,277,386 | | | GSAA Home Equity Trust 2005-5(d) | | US0001M + 2.550% | | 2.6420 | | 02/25/35 | | | 1,309,739 | |
| | 20,304 | | | GSAA Trust 2004-3(f) | | | | 6.2200 | | 04/25/34 | | | 20,775 | |
| | 50,935 | | | Home Equity Asset Trust(d) | | US0001M + 1.500% | | 1.6020 | | 03/25/33 | | | 51,292 | |
| | 18,412 | | | Home Equity Asset Trust 2002-2(d) | | US0001M + 2.600% | | 2.7020 | | 06/25/32 | | | 32,097 | |
| | 196,997 | | | Home Equity Mortgage Loan Asset-Backed Trust(d) | | US0001M + 1.425% | | 1.5270 | | 10/25/33 | | | 193,571 | |
| | 210,647 | | | Home Equity Mortgage Loan Asset-Backed Trust(d) | | US0001M + 3.300% | | 3.4020 | | 11/25/34 | | | 211,983 | |
| | 818,125 | | | Home Equity Mortgage Trust 2007-1(d) | | US0001M + 0.340% | | 0.4320 | | 05/25/37 | | | 784,937 | |
| | 657,859 | | | Imc Home Equity Loan Trust 1998-3(f) | | | | 5.4320 | | 08/20/29 | | | 682,437 | |
| | 122,750 | | | IMC Home Equity Loan Trust 1998-5(f) | | | | 5.9590 | | 12/20/29 | | | 126,658 | |
| | 64,571 | | | Irwin Home Equity Loan Trust 2004-1(d) | | US0001M + 1.875% | | 1.9770 | | 12/25/34 | | | 63,895 | |
| | 786,828 | | | Irwin Home Equity Loan Trust 2006-P1(a),(d) | | US0001M + 0.280% | | 0.3720 | | 12/25/36 | | | 769,572 | |
| | 957,758 | | | Irwin Home Equity Loan Trust 2006-P1(a),(f) | | | | 6.3000 | | 06/25/37 | | | 981,165 | |
| | 449,543 | | | MAFI II Remic Trust 1999-A(a),(c) | | | | 8.0000 | | 03/20/25 | | | 448,153 | |
| | 276,282 | | | Mastr Asset Backed Securities Trust 2003-NC1(d) | | US0001M + 5.250% | | 4.2780 | | 04/25/33 | | | 289,419 | |
| | 15,801 | | | Mastr Asset Backed Securities Trust 2004-WMC2(d) | | US0001M + 3.225% | | 3.3270 | | 04/25/34 | | | 18,630 | |
| | 862,023 | | | Mastr Asset Backed Securities Trust 2005-NC2(d) | | US0001M + 0.500% | | 0.6020 | | 11/25/35 | | | 626,478 | |
| | 1,380,058 | | | Mastr Asset Backed Securities Trust 2005-NC2(d) | | US0001M + 0.700% | | 0.8020 | | 11/25/35 | | | 1,020,709 | |
| | 75,365 | | | Meritage Mortgage Loan Trust 2003-1(d) | | US0001M + 2.325% | | 2.4270 | | 11/25/33 | | | 75,618 | |
| | 84,341 | | | Merrill Lynch Mortgage Investors Trust Series(d) | | US0001M + 3.075% | | 3.1770 | | 10/25/35 | | | 85,610 | |
| | 5,683,476 | | | Merrill Lynch Mortgage Investors Trust Series(a),(d) | | US0001M + 1.125% | | 1.2270 | | 08/25/36 | | | 6,377,919 | |
See accompanying notes to financial statements.
RATIONAL SPECIAL SITUATIONS INCOME FUND
SCHEDULE OF INVESTMENTS (Continued)
December 31, 2021
| Principal | | | | | | | Coupon Rate | | | | | |
| Amount ($) | | | | | Spread | | (%) | | Maturity | | Fair Value | |
| | | | | ASSET BACKED SECURITIES — 75.6% (Continued) | | | | | | | | | | |
| | | | | HOME EQUITY — 12.0% (Continued) | | | | | | | | | | |
| | 133,689 | | | Morgan Stanley A.B.S Capital I Inc Trust 2003-NC8(d) | | US0001M + 3.150% | | 3.2520 | | 09/25/33 | | $ | 135,465 | |
| | 2,210 | | | Morgan Stanley A.B.S Capital I Inc Trust 2007-HE4(d) | | US0001M + 0.110% | | 0.2120 | | 02/25/37 | | | 935 | |
| | 75,180 | | | Morgan Stanley Dean Witter Capital I Inc Trust(d) | | US0001M + 2.100% | | 2.2020 | | 02/25/32 | | | 75,237 | |
| | 107,732 | | | Morgan Stanley Mortgage Loan Trust 2006-16AX(d) | | US0001M + 0.340% | | 0.4420 | | 11/25/36 | | | 40,716 | |
| | 2,611,223 | | | Morgan Stanley Mortgage Loan Trust 2007-10XS(c) | | | | 6.2500 | | 02/25/37 | | | 2,251,274 | |
| | 4,469,863 | | | Morgan Stanley Mortgage Loan Trust 2007-8XS(c) | | | | 6.0000 | | 04/25/37 | | | 3,775,386 | |
| | 105,209 | | | New Century Home Equity Loan Trust 2003-6(d) | | US0001M + 1.080% | | 1.1820 | | 01/25/34 | | | 105,105 | |
| | 5,667 | | | New Century Home Equity Loan Trust Series 2003-5(c) | | | | 4.8660 | | 11/25/33 | | | 5,811 | |
| | 91,352 | | | New Century Home Equity Loan Trust Series 2003-5(f) | | | | 6.0000 | | 11/25/33 | | | 92,849 | |
| | 9,297 | | | New Century Home Equity Loan Trust Series 2005-A Series 2005-A-A4W(f) | | | | 4.7130 | | 08/25/35 | | | 9,284 | |
| | 743,268 | | | NovaStar Mortgage Funding Trust Series 2003-2(d) | | US0001M + 2.775% | | 2.8780 | | 09/25/33 | | | 761,661 | |
| | 372,333 | | | Option One Mortgage Loan Trust 2004-1(d) | | US0001M + 1.650% | | 1.7520 | | 01/25/34 | | | 374,955 | |
| | 178,972 | | | Option One Mortgage Loan Trust 2004-1(d) | | US0001M + 2.475% | | 2.5770 | | 01/25/34 | | | 179,912 | |
| | 575,945 | | | Option One Mortgage Loan Trust 2004-2(d) | | US0001M + 1.575% | | 1.6770 | | 05/25/34 | | | 602,414 | |
| | 104,819 | | | Option One Mortgage Loan Trust 2004-2(d) | | US0001M + 3.000% | | 3.1020 | | 05/25/34 | | | 106,595 | |
| | 1,091,183 | | | Option One Mortgage Loan Trust 2007-FXD1(f) | | | | 5.8660 | | 01/25/37 | | | 1,077,820 | |
| | 355,874 | | | Option One Mortgage Loan Trust 2007-FXD2(f) | | | | 6.1020 | | 03/25/37 | | | 361,618 | |
| | 205,253 | | | RAAC Series 2004-SP1 Trust(f) | | | | 6.1180 | | 03/25/34 | | | 206,954 | |
| | 8,723 | | | RASC Series 2003-KS4 Trust(f) | | | | 4.6700 | | 06/25/33 | | | 8,822 | |
| | 2,742,835 | | | RASC Series 2004-KS11 Trust(d) | | US0001M + 1.000% | | 1.6020 | | 12/25/34 | | | 3,054,198 | |
| | 67,659 | | | Renaissance Home Equity Loan Trust 2002-4(f) | | | | 7.0720 | | 03/25/33 | | | 67,688 | |
| | 187,793 | | | Renaissance Home Equity Loan Trust 2004-3(f) | | | | 4.8240 | | 11/25/34 | | | 187,191 | |
| | 278,859 | | | Renaissance Home Equity Loan Trust 2005-4(f) | | | | 5.8250 | | 02/25/36 | | | 277,870 | |
| | 29,688 | | | Saco I Trust 2007-1(d) | | US0001M + 0.320% | | 0.4220 | | 01/25/37 | | | 30,101 | |
| | 51,190 | | | Saco I Trust 2007-2(d) | | US0001M + 0.320% | | 0.4220 | | 02/25/37 | | | 51,716 | |
| | 35,244,527 | | | Soundview Home Loan Trust 2007-OPT4(b),(c) | | | | 0.5800 | | 09/25/37 | | | 1,049,966 | |
| | 643,075 | | | Structured Asset Securities Corp Mortgage Pass | | | | 3.3750 | | 08/25/31 | | | 636,372 | |
| | 1 | | | Structured Asset Securities Corp Pass-Through | | | | — | | 02/25/32 | | | 130,000 | |
| | 393,818 | | | Terwin Mortgage Trust 2004-1HE(a),(d) | | US0001M + 2.475% | | 2.5770 | | 02/25/34 | | | 399,370 | |
| | 2,299,013 | | | Terwin Mortgage Trust 2004-21HE(a),(d) | | US0001M + 2.625% | | 2.7270 | | 12/25/34 | | | 2,348,389 | |
| | 67,813 | | | Terwin Mortgage Trust 2006-10SL(a),(c) | | | | 4.7500 | | 10/25/37 | | | 39,547 | |
| | 1,261,092 | | | Terwin Mortgage Trust 2006-4SL(a),(c) | | | | 0.1680 | | 05/25/37 | | | 834,236 | |
| | 1,785,787 | | | Terwin Mortgage Trust 2006-6(a),(c) | | | | 0.2370 | | 07/25/37 | | | 1,032,258 | |
| | 4,765,248 | | | Truman Capital Mortgage Loan Trust(a),(d) | | US0001M + 4.650% | | 4.7530 | | 11/25/32 | | | 4,438,804 | |
See accompanying notes to financial statements.
RATIONAL SPECIAL SITUATIONS INCOME FUND
SCHEDULE OF INVESTMENTS (Continued)
December 31, 2021
| Principal | | | | | | | Coupon Rate | | | | | |
| Amount ($) | | | | | Spread | | (%) | | Maturity | | Fair Value | |
| | | | | ASSET BACKED SECURITIES — 75.6% (Continued) | | | | | | | | | | |
| | | | | HOME EQUITY — 12.0% (Continued) | | | | | | | | | | |
| | 16,075 | | | United National Home Loan Owner Trust 1999-1(f) | | | | 6.9100 | | 03/25/25 | | $ | 15,997 | |
| | 48,340 | | | Wells Fargo Home Equity Asset-Backed Securities(c) | | | | 4.9800 | | 04/25/34 | | | 49,055 | |
| | 176,910 | | | Wells Fargo Home Equity Asset-Backed Securities(d) | | US0001M + 2.820% | | 2.9220 | | 10/25/34 | | | 178,022 | |
| | 693,175 | | | Wells Fargo Home Equity Asset-Backed Securities(d) | | US0001M + 2.550% | | 2.6520 | | 04/25/35 | | | 697,536 | |
| | | | | | | | | | | | | | 91,491,210 | |
| | | | | MANUFACTURED HOUSING — 1.8% | | | | | | | | | | |
| | 774,715 | | | BCMSC Trust 1998-C(c) | | | | 7.5100 | | 01/15/29 | | | 752,736 | |
| | 591,707 | | | BCMSC Trust 1999-B(c) | | | | 6.9750 | | 12/15/29 | | | 111,961 | |
| | 2,477,895 | | | Conseco Finance Corporation(c) | | | | 7.0200 | | 10/15/27 | | | 2,505,685 | |
| | 363,669 | | | Conseco Finance Corporation(c) | | | | 7.5300 | | 03/15/28 | | | 367,967 | |
| | 3,069,118 | | | Conseco Finance Corporation(c) | | | | 7.5400 | | 06/15/28 | | | 3,157,340 | |
| | 460,066 | | | Conseco Finance Corporation(c) | | | | 6.9400 | | 12/01/28 | | | 464,503 | |
| | 394,726 | | | Conseco Finance Corporation(c) | | | | 7.5000 | | 03/01/30 | | | 206,775 | |
| | 11,569 | | | Credit-Based Asset Servicing and Securitization,(a),(f) | | | | 6.2500 | | 10/25/36 | | | 11,627 | |
| | 329,669 | | | Deutsche Financial Capital Securitization, LLC | | | | 6.8000 | | 04/15/28 | | | 339,710 | |
| | 2,211,756 | | | Deutsche Financial Capital Securitization, LLC | | | | 7.2750 | | 04/15/28 | | | 2,242,762 | |
| | 13,434 | | | MERIT Securities Corporation(f) | | | | 7.6300 | | 07/28/33 | | | 13,683 | |
| | 1,190,000 | | | Morgan Stanley Resecuritization Trust 2015-R7(a),(c) | | | | 7.2800 | | 02/26/29 | | | 1,187,887 | |
| | 12,850 | | | Oakwood Mortgage Investors, Inc. | | | | 7.7500 | | 08/15/27 | | | 12,824 | |
| | 12,529 | | | Oakwood Mortgage Investors, Inc.(c) | | | | 7.3250 | | 02/15/28 | | | 12,311 | |
| | 1,534,887 | | | Oakwood Mortgage Investors, Inc.(a) | | | | 7.4150 | | 01/15/29 | | | 1,580,373 | |
| | 71,845 | | | Oakwood Mortgage Investors, Inc.(c) | | | | 5.1900 | | 06/15/32 | | | 72,781 | |
| | 691,540 | | | Origen Manufactured Housing Contract Trust 2007-A(c) | | | | 2.5440 | | 04/15/37 | | | 662,811 | |
| | 31,742 | | | Origen Manufactured Housing Contract Trust 2007-B(a),(d) | | US0001M + 1.200% | | 1.3100 | | 10/15/37 | | | 31,489 | |
| | 7,539 | | | UCFC Manufactured Housing Contract | | | | 6.2270 | | 01/15/30 | | | 7,657 | |
| | | | | | | | | | | | | | 13,742,882 | |
| | | | | NON AGENCY CMBS — 13.9% | | | | | | | | | | |
| | 407,895 | | | BAMLL Re-REMIC Trust 2016-RRGG10(a),(c) | | | | 5.8300 | | 08/10/45 | | | 147,862 | |
| | 777,813 | | | Banc of America Commercial Mortgage Trust 2006-4(c) | | | | 5.7540 | | 07/10/46 | | | 770,035 | |
| | 7,209,031 | | | Banc of America Commercial Mortgage Trust 2007-1(c) | | | | 5.5230 | | 01/15/49 | | | 3,534,902 | |
| | 374,826 | | | Bear Stearns Asset Backed Securities Trust 2003-3(d) | | US0001M + 1.230% | | 1.3320 | | 06/25/43 | | | 379,983 | |
| | 236,641 | | | Bear Stearns Commercial Mortgage Securities Trust(a) | | | | 5.4120 | | 12/11/38 | | | 27,924 | |
| | 464,087 | | | Bear Stearns Commercial Mortgage Securities Trust(a),(c) | | | | 5.7520 | | 06/11/40 | | | 465,943 | |
| | 572,085 | | | Bear Stearns Commercial Mortgage Securities Trust(a),(c) | | | | 5.7500 | | 09/11/41 | | | 567,130 | |
See accompanying notes to financial statements.
RATIONAL SPECIAL SITUATIONS INCOME FUND
SCHEDULE OF INVESTMENTS (Continued)
December 31, 2021
| Principal | | | | | | | Coupon Rate | | | | | |
| Amount ($) | | | | | Spread | | (%) | | Maturity | | Fair Value | |
| | | | | ASSET BACKED SECURITIES — 75.6% (Continued) | | | | | | | | | | |
| | | | | NON AGENCY CMBS — 13.9% (Continued) | | | | | | | | | | |
| | 1,223,000 | | | Bear Stearns Commercial Mortgage Securities Trust Series 2007-T26 Class AJ(c) | | | | 5.4300 | | 01/12/45 | | $ | 985,151 | |
| | 2,148,611 | | | CD 2005-CD1 Commercial Mortgage Trust(a),(c) | | | | 5.1980 | | 07/15/44 | | | 2,148,611 | |
| | 397,331 | | | CD 2007-CD5 Mortgage Trust(a),(c) | | | | 6.3690 | | 11/15/44 | | | 393,357 | |
| | 16,354,829 | | | CFCRE Commercial Mortgage Trust 2017-C8 Series 2017-C8 Class X-A(b),(c) | | | | 1.4960 | | 06/15/50 | | | 1,058,594 | |
| | 34,187,675 | | | Citigroup Commercial Mortgage Trust 2014-GC23(b),(c) | | | | 0.9120 | | 07/10/47 | | | 705,316 | |
| | 12,087 | | | COMM 2010-C1 Mortgage Trust(a),(c) | | | | 5.8520 | | 07/10/46 | | | 12,100 | |
| | 1,031,000 | | | COMM 2010-C1 Mortgage Trust(a),(c) | | | | 5.9870 | | 07/10/46 | | | 1,043,270 | |
| | 2,000,000 | | | COMM 2013-LC13 Mortgage Trust(a),(c) | | | | 5.2610 | | 08/10/46 | | | 1,930,615 | |
| | 108,610,000 | | | COMM 2014-CCRE19 Mortgage Trust(a),(b),(c) | | | | 0.0800 | | 08/10/47 | | | 79,633 | |
| | 22,125,961 | | | COMM 2015-LC21 Mortgage Trust Series 2015-LC21 Class X-A(b),(c) | | | | 0.6740 | | 07/10/48 | | | 441,276 | |
| | 14,355 | | | Credit Suisse Commercial Mortgage Trust Series(a),(c) | | | | 5.6270 | | 01/15/49 | | | 14,355 | |
| | 2,935,145 | | | CSMC 2014-USA OA, LLC(a),(b),(c) | | | | 0.5400 | | 09/15/37 | | | 50,703 | |
| | 3,000,000 | | | DBUBS 2011-LC3 Mortgage Trust Series 2011-LC3A D(a),(c) | | | | 5.3650 | | 08/10/44 | | | 2,910,000 | |
| | 49,796 | | | GMAC Commercial Mortgage Securities Inc Series(c) | | | | 5.3490 | | 11/10/45 | | | 48,047 | |
| | 2,308,983 | | | Greenwich Capital Commercial Mortgage Trust(a),(c) | | | | 5.9280 | | 03/18/49 | | | 2,026,982 | |
| | 728,855 | | | GS Mortgage Securities Corporation II(a),(d) | | US0001M + 2.750% | | 2.8600 | | 09/15/31 | | | 592,097 | |
| | 180,635 | | | GS Mortgage Securities Trust 2010-C1(a) | | | | 4.5920 | | 08/10/43 | | | 180,461 | |
| | 1,827,000 | | | GS Mortgage Securities Trust 2010-C1(a) | | | | 5.1480 | | 08/10/43 | | | 1,829,065 | |
| | 3,000,000 | | | GS Mortgage Securities Trust 2010-C1(a),(c) | | | | 5.6350 | | 08/10/43 | | | 2,798,433 | |
| | 9,080,000 | | | GS Mortgage Securities Trust 2010-C1(a),(c) | | | | 5.9890 | | 08/10/43 | | | 6,603,524 | |
| | 1,051,985 | | | GS Mortgage Securities Trust 2011-GC5(a),(c) | | | | 5.1580 | | 08/10/44 | | | 1,056,209 | |
| | 481,000 | | | GS Mortgage Securities Trust 2011-GC5(a),(c) | | | | 5.1580 | | 08/10/44 | | | 232,083 | |
| | 1,000,000 | | | Harvest Commercial Capital Loan Trust 2020-1(a),(c) | | | | 5.9640 | | 04/25/52 | | | 1,025,457 | |
| | 164,451 | | | Impac CMB Trust Series 2004-8(d) | | US0001M + 1.575% | | 1.6770 | | 08/25/34 | | | 166,535 | |
| | 1,478,000 | | | JP MORGAN CHASE COMMERCIAL MORTGAGE ADJ% 02/15/46(a),(c) | | | | 5.5230 | | 02/15/46 | | | 1,179,655 | |
| | 7,007,954 | | | JP Morgan Chase Commercial Mortgage Securities(a) | | | | 3.9100 | | 05/05/30 | | | 6,183,426 | |
| | 4,700,000 | | | JP Morgan Chase Commercial Mortgage Securities(a),(d) | | US0001M + 4.250% | | 4.3600 | | 11/15/31 | | | 1,871,285 | |
| | 1,152,515 | | | JP Morgan Chase Commercial Mortgage Securities(a),(c) | | | | 6.4030 | | 07/12/35 | | | 1,143,312 | |
| | 66,359 | | | JP Morgan Chase Commercial Mortgage Securities(c) | | | | 5.4830 | | 07/15/41 | | | 65,667 | |
| | 9,979,422 | | | JP Morgan Chase Commercial Mortgage Securities Series 2010-C2 D(a),(c) | | | | 5.6940 | | 11/15/43 | | | 9,914,173 | |
| | 2,100,000 | | | JP Morgan Chase Commercial Mortgage Securities(a),(c) | | | | 5.6940 | | 11/15/43 | | | 1,713,120 | |
| | 724,377 | | | JP Morgan Chase Commercial Mortgage Securities(a),(c) | | | | 5.6940 | | 11/15/43 | | | 722,487 | |
| | 1,530,202 | | | JP Morgan Chase Commercial Mortgage Securities(c) | | | | 5.4890 | | 12/12/43 | | | 1,109,473 | |
See accompanying notes to financial statements.
RATIONAL SPECIAL SITUATIONS INCOME FUND
SCHEDULE OF INVESTMENTS (Continued)
December 31, 2021
| Principal | | | | | | | Coupon Rate | | | | | |
| Amount ($) | | | | | Spread | | (%) | | Maturity | | Fair Value | |
| | | | | ASSET BACKED SECURITIES — 75.6% (Continued) | | | | | | | | | | |
| | | | | NON AGENCY CMBS — 13.9% (Continued) | | | | | | | | | | |
| | 1,179,889 | | | JP Morgan Chase Commercial Mortgage Securities(a),(c) | | | | 5.0130 | | 02/15/46 | | $ | 1,186,311 | |
| | 3,630,000 | | | JP Morgan Chase Commercial Mortgage Securities(a),(c) | | | | 5.3600 | | 02/15/46 | | | 3,585,811 | |
| | 107,000 | | | JP Morgan Chase Commercial Mortgage Securities(c) | | | | 4.1640 | | 04/15/46 | | | 86,975 | |
| | 169,406 | | | JP Morgan Chase Commercial Mortgage Securities(a),(c) | | | | 5.3890 | | 07/15/46 | | | 175,062 | |
| | 2,058,000 | | | JP Morgan Chase Commercial Mortgage Securities(a),(c) | | | | 5.5270 | | 07/15/46 | | | 2,099,314 | |
| | 9,257,728 | | | JP Morgan Chase Commercial Mortgage Securities Series 2006-LDP9 Class A-MS | | | | 5.3370 | | 05/15/47 | | | 8,738,969 | |
| | 9,140 | | | JP Morgan Chase Commercial Mortgage Securities(c) | | | | 6.5010 | | 02/15/51 | | | 8,409 | |
| | 8,309,112 | | | JP Morgan Chase Commercial Mortgage Securities(c) | | | | 6.8240 | | 02/15/51 | | | 8,715,510 | |
| | 21,801 | | | LB Commercial Mortgage Trust 2007-C3(a),(d) | | US0001M + 0.350% | | 0.4590 | | 07/15/44 | | | 21,369 | |
| | 4,814 | | | LB Commercial Mortgage Trust 2007-C3(c) | | | | 5.8230 | | 07/15/44 | | | 4,753 | |
| | 4,355,000 | | | LBSBC NIM Company 2005-2(a) | | | | 5.5000 | | 09/27/30 | | | 5,625,001 | |
| | 840,847 | | | LBSBC NIM Company 2005-2(a) | | | | 7.8600 | | 09/27/30 | | | 1,109,943 | |
| | 100 | | | LBSBN 2005-2A PS | | | | — | | 09/27/30 | | | 1,575,000 | |
| | 25,914 | | | Merrill Lynch Mortgage Investors Trust Series(a),(c) | | | | 6.2500 | | 11/15/26 | | | 26,163 | |
| | 66,905 | | | Merrill Lynch Mortgage Trust 2005-CKI1(a),(c) | | | | 5.1690 | | 11/12/37 | | | 33,453 | |
| | 366,427 | | | Merrill Lynch Mortgage Trust 2006-C1(c) | | | | 6.3180 | | 05/12/39 | | | 354,135 | |
| | 809,955 | | | ML-CFC Commercial Mortgage Trust 2007-9(c) | | | | 6.1930 | | 09/12/49 | | | 782,403 | |
| | 403,966 | | | ML-CFC Commercial Mortgage Trust 2007-9(c) | | | | 6.2220 | | 09/12/49 | | | 387,949 | |
| | 2,798,742 | | | Morgan Stanley Capital I Trust 2006-TOP21(a),(c) | | | | 5.5690 | | 10/12/52 | | | 2,924,174 | |
| | 153,845 | | | Morgan Stanley Capital I Trust 2011-C2 Series 2011-C2 D(a),(c) | | | | 5.2110 | | 06/15/44 | | | 150,532 | |
| | 545,000 | | | Morgan Stanley Capital I Trust 2011-C2(a),(c) | | | | 5.2110 | | 06/15/44 | | | 436,000 | |
| | 198,000 | | | Morgan Stanley Capital I Trust 2011-C3(a),(c) | | | | 5.0860 | | 07/15/49 | | | 180,708 | |
| | 287,950 | | | Morgan Stanley Capital I Trust 2011-C3(a),(c) | | | | 5.0860 | | 07/15/49 | | | 213,588 | |
| | 384,000 | | | Morgan Stanley Capital I Trust 2011-C3(a),(c) | | | | 5.0860 | | 07/15/49 | | | 212,180 | |
| | 60,000 | | | Morgan Stanley Capital I Trust 2012-C4(a),(c) | | | | 5.2130 | | 03/15/45 | | | 60,068 | |
| | 3,000,000 | | | ReadyCap Commercial Mortgage Trust 2018-4(a),(c) | | | | 5.2460 | | 02/27/51 | | | 3,105,534 | |
| | 8,000,000 | | | TMSQ 2014-1500 Mortgage Trust(a),(b),(c) | | | | 0.1550 | | 10/10/36 | | | 36,744 | |
| | 163,000 | | | UBS Commercial Mortgage Trust 2012-C1(a),(c) | | | | 5.5170 | | 05/10/45 | | | 153,233 | |
| | 265,000 | | | UBS-Citigroup Commercial Mortgage Trust 2011-C1 Series 2011-C1 E(a),(c) | | | | 6.4120 | | 01/10/45 | | | 100,700 | |
| | 1,970,334 | | | Wachovia Bank Commercial Mortgage Trust Series(a),(c) | | | | 5.3100 | | 01/15/41 | | | 1,956,562 | |
| | 1,261,313 | | | Wachovia Bank Commercial Mortgage Trust Series(a),(c) | | | | 5.1040 | | 10/15/44 | | | 1,214,119 | |
| | 281,000 | | | WFRBS Commercial Mortgage Trust 2011-C4(a),(c) | | | | 4.8870 | | 06/15/44 | | | 266,573 | |
| | 225,000 | | | WFRBS Commercial Mortgage Trust 2013-C11(a),(c) | | | | 4.2390 | | 03/15/45 | | | 222,214 | |
See accompanying notes to financial statements.
RATIONAL SPECIAL SITUATIONS INCOME FUND
SCHEDULE OF INVESTMENTS (Continued)
December 31, 2021
| Principal | | | | | | | Coupon Rate | | | | | |
| Amount ($) | | | | | Spread | | (%) | | Maturity | | Fair Value | |
| | | | | ASSET BACKED SECURITIES — 75.6% (Continued) | | | | | | | | | | |
| | | | | NON AGENCY CMBS — 13.9% (Continued) | | | | | | | | | | |
| | 3,000,000 | | | X-Caliber Funding, LLC(a),(d) | | US0001M + 3.000% | | 4.0000 | | 01/06/26 | | $ | 3,000,000 | |
| | | | | | | | | | | | | | 106,877,710 | |
| | | | | OTHER ABS — 1.4% | | | | | | | | | | |
| | 114,336 | | | AFC Trust Series 2000-4(a),(d) | | US0001M + 0.770% | | 0.8720 | | 01/25/31 | | | 112,632 | |
| | 2,991,739 | | | Legal Fee Funding 2006-1, LLC(a) | | | | 8.0000 | | 07/20/36 | | | 3,065,644 | |
| | 30,175,837 | | | Mastr Adjustable Rate Mortgages Trust 2007-3 22A2(h),(i),(j) | | US0001M + 0.420% | | 0.3186 | | 05/25/47 | | | 3,800,000 | |
| | 211,350 | | | Oakwood Mortgage Investors, Inc.(a),(c) | | | | 8.4500 | | 10/15/26 | | | 210,879 | |
| | 2,946,094 | | | PEAR 2020-1, LLC(a) | | | | 3.7500 | | 12/15/32 | | | 2,938,356 | |
| | 178,988 | | | Planet Fitness Master Issuer, LLC Series 2018-1A A2I(a) | | | | 4.2620 | | 09/05/48 | | | 179,055 | |
| | | | | | | | | | | | | | 10,306,566 | |
| | | | | RESIDENTIAL MORTGAGE — 7.9% | | | | | | | | | | |
| | 992,136 | | | Ameriquest Mortgage Securities Asset-Backed(d) | | US0001M + 2.760% | | 2.8620 | | 05/25/34 | | | 1,013,188 | |
| | 72,631 | | | Bear Stearns Asset Backed Securities Trust(d) | | US0001M + 0.900% | | 1.0020 | | 12/25/33 | | | 71,597 | |
| | 65,766 | | | Bear Stearns Asset Backed Securities Trust(c) | | | | 2.6920 | | 07/25/36 | | | 65,774 | |
| | 106,375 | | | Bear Stearns Asset Backed Securities Trust | | | | 5.5000 | | 08/25/36 | | | 106,946 | |
| | 332,369 | | | Bear Stearns Asset Backed Securities Trust(d) | | 12MTA + 0.980% | | 1.0620 | | 10/25/36 | | | 126,392 | |
| | 373,359 | | | Bear Stearns Asset Backed Securities Trust | | | | 6.0000 | | 10/25/36 | | | 239,981 | |
| | 277,237 | | | Bear Stearns Asset Backed Securities Trust(d) | | US0001M + 3.150% | | 3.2520 | | 11/25/39 | | | 283,379 | |
| | 902,000 | | | Bear Stearns Asset Backed Securities Trust(d) | | US0001M + 3.150% | | 3.2520 | | 12/25/42 | | | 953,216 | |
| | 550,000 | | | Bear Stearns Asset Backed Securities Trust(d) | | US0001M + 3.150% | | 3.2520 | | 12/25/42 | | | 578,727 | |
| | 42,296 | | | Bear Stearns Asset Backed Securities Trust(e) | | | | — | | 09/25/46 | | | 30,799 | |
| | 198,534 | | | Bear Stearns Asset Backed Securities Trust | | | | 5.5000 | | 09/25/46 | | | 196,407 | |
| | 2,987,000 | | | Bear Stearns Asset Backed Securities Trust 2006-2(d) | | US0001M + 2.625% | | 2.7270 | | 07/25/36 | | | 3,034,083 | |
| | 290,210 | | | Carrington Mortgage Loan Trust Series 2005-FRE1(d) | | US0001M + 0.705% | | 0.8070 | | 12/25/35 | | | 293,081 | |
| | 65,444 | | | Chase Funding Trust Series 2003-6(f) | | | | 4.9350 | | 11/25/34 | | | 68,435 | |
| | 1,896 | | | Citicorp Residential Mortgage Trust Series 2006-1(f) | | | | 4.8610 | | 07/25/36 | | | 1,893 | |
| | 2,851 | | | Citicorp Residential Mortgage Trust Series 2007-2(f) | | | | 4.9140 | | 06/25/37 | | | 2,870 | |
| | 146,393 | | | Citigroup Mortgage Loan Trust, Inc.(d) | | US0001M + 2.625% | | 2.7270 | | 11/25/34 | | | 964,102 | |
| | 10,487 | | | Citigroup Mortgage Loan Trust, Inc.(f) | | | | 6.0300 | | 11/25/34 | | | 10,687 | |
| | 452,008 | | | Countrywide Asset-Backed Certificates(d) | | US0001M + 2.625% | | 2.7270 | | 10/25/33 | | | 460,958 | |
| | 1,490,555 | | | Countrywide Asset-Backed Certificates(d) | | US0001M + 0.660% | | 0.7620 | | 11/25/33 | | | 1,455,088 | |
| | 68,243 | | | Countrywide Asset-Backed Certificates(a),(f) | | | | 5.5000 | | 08/25/35 | | | 69,203 | |
| | 666,841 | | | Countrywide Asset-Backed Certificates(f) | | | | 4.0820 | | 01/25/37 | | | 665,923 | |
| | 1,108,034 | | | Countrywide Asset-Backed Certificates(d) | | US0001M + 0.500% | | 0.6020 | | 05/25/37 | | | 1,030,574 | |
See accompanying notes to financial statements.
RATIONAL SPECIAL SITUATIONS INCOME FUND
SCHEDULE OF INVESTMENTS (Continued)
December 31, 2021
| Principal | | | | | | | Coupon Rate | | | | | |
| Amount ($) | | | | | Spread | | (%) | | Maturity | | Fair Value | |
| | | | | ASSET BACKED SECURITIES — 75.6% (Continued) | | | | | | | | | | |
| | | | | RESIDENTIAL MORTGAGE — 7.9% (Continued) | | | | | | | | | | |
| | 571,000 | | | Credit-Based Asset Servicing and(a),(f) | | | | 4.7740 | | 12/25/37 | | $ | 631,912 | |
| | 13,310 | | | Credit-Based Asset Servicing and Securitization,(a),(c) | | | | 5.7960 | | 02/03/29 | | | 10,411 | |
| | 26,874 | | | Credit-Based Asset Servicing and Securitization,(d) | | US0001M + 2.850% | | 2.9520 | | 06/25/32 | | | 26,906 | |
| | 449,495 | | | Credit-Based Asset Servicing and Securitization,(d) | | US0001M + 2.100% | | 2.1920 | | 12/25/33 | | | 454,464 | |
| | 142,707 | | | Credit-Based Asset Servicing and Securitization,(a),(d) | | US0001M + 2.400% | | 2.5020 | | 09/25/35 | | | 145,332 | |
| | 315,017 | | | Credit-Based Asset Servicing and Securitization,(f) | | | | 3.0700 | | 12/25/36 | | | 319,631 | |
| | 737,188 | | | Credit-Based Asset Servicing and Securitization,(a),(d) | | US0001M + 0.460% | | 0.5630 | | 02/25/37 | | | 624,598 | |
| | 553,042 | | | CSFB Mortgage-Backed Pass-Through Certificates(d) | | US0001M + 4.000% | | 4.1020 | | 02/25/32 | | | 584,032 | |
| | 279,949 | | | CWABS Asset-Backed Certificates Trust 2004-13(c) | | | | 4.6880 | | 01/25/35 | | | 210,516 | |
| | 2,472 | | | CWABS Asset-Backed Certificates Trust 2004-15(f) | | | | 4.4890 | | 05/25/35 | | | 2,470 | |
| | 12,917 | | | CWABS Asset-Backed Certificates Trust 2005-1 Series 2005-1-AF5A(f) | | | | 5.1590 | | 07/25/35 | | | 12,964 | |
| | 82,943 | | | CWABS Asset-Backed Certificates Trust 2005-16(c) | | | | 4.4310 | | 05/25/36 | | | 83,527 | |
| | 285,165 | | | CWABS Asset-Backed Certificates Trust 2005-17(f) | | | | 3.9110 | | 05/25/36 | | | 284,482 | |
| | 489,288 | | | Equity One Mortgage Pass-Through Trust 2002-1(c) | | | | 6.2820 | | 08/25/32 | | | 491,412 | |
| | 209,469 | | | Finance America Mortgage Loan Trust 2004-3(d) | | US0001M + 0.945% | | 1.0470 | | 11/25/34 | | | 209,773 | |
| | 195,762 | | | Finance America Mortgage Loan Trust 2004-3(d) | | US0001M + 1.020% | | 1.1220 | | 11/25/34 | | | 195,763 | |
| | 280,000 | | | First Franklin Mortgage Loan Trust 2003-FFB(c),(e) | | | | — | | 02/25/33 | | | 280,000 | |
| | 204,224 | | | First Franklin Mortgage Loan Trust 2004-FF2(d) | | US0001M + 1.500% | | 1.6020 | | 03/25/34 | | | 201,525 | |
| | 899,859 | | | First Franklin Mortgage Loan Trust 2004-FFA(a) | | | | — | | 03/25/24 | | | 875,000 | |
| | 2,392,566 | | | Fremont Home Loan Trust 2002-2(d) | | US0001M + 1.725% | | 1.8270 | | 10/25/33 | | | 2,431,161 | |
| | 35,506 | | | Fremont Home Loan Trust 2004-B(d) | | US0001M + 3.000% | | 3.1020 | | 05/25/34 | | | 38,527 | |
| | 40,463 | | | Fremont Home Loan Trust 2005-A(d) | | US0001M + 0.735% | | 0.8370 | | 01/25/35 | | | 40,261 | |
| | 41,856 | | | GSAMP Trust 2003-SEA2(f) | | | | 5.4210 | | 07/25/33 | | | 41,435 | |
| | 114,955 | | | GSAMP Trust 2004-HE1(d) | | US0001M + 0.825% | | 0.9270 | | 05/25/34 | | | 112,224 | |
| | 1,101,996 | | | GSRPM Mortgage Loan Trust Series 2004-1(a),(d) | | US0001M + 3.750% | | 3.8520 | | 09/25/42 | | | 1,112,973 | |
| | 590,372 | | | Lehman XS Trust 2007-3(d) | | US0001M + 0.320% | | 0.4220 | | 03/25/37 | | | 537,768 | |
| | 3,487,106 | | | Lehman XS Trust Series 2005-4(d) | | US0001M + 0.750% | | 0.8520 | | 10/25/35 | | | 4,702,182 | |
| | 4,624,284 | | | Long Beach Mortgage Loan Trust 2005-WL1(d) | | US0001M + 0.975% | | 1.0770 | | 06/25/45 | | | 5,093,667 | |
| | 2,835,325 | | | Morgan Stanley A.B.S Capital I Inc Trust 2005-WMC2(d) | | US0001M + 0.705% | | 0.8070 | | 02/25/35 | | | 2,863,958 | |
| | 2,631,284 | | | Park Place Securities Inc Asset-Backed(d) | | US0001M + 1.650% | | 1.7520 | | 12/25/34 | | | 2,727,710 | |
| | 158,239 | | | PFCA Home Equity Investment Trust(a),(c) | | | | 4.3550 | | 01/22/35 | | | 161,404 | |
| | 325,994 | | | PFCA Home Equity Investment Trust(a),(c) | | | | 3.3360 | | 08/25/35 | | | 320,081 | |
| | 3,080,000 | | | RAAC Series 2005-RP2 Trust(a),(d) | | US0001M + 2.000% | | 3.1030 | | 06/25/35 | | | 3,111,452 | |
| | 8,103,518 | | | RAAC Series 2005-SP3 Trust | | | | — | | 12/25/35 | | | 7,560,001 | |
See accompanying notes to financial statements.
RATIONAL SPECIAL SITUATIONS INCOME FUND
SCHEDULE OF INVESTMENTS (Continued)
December 31, 2021
| Principal | | | | | | | Coupon Rate | | | | | |
| Amount ($) | | | | | Spread | | (%) | | Maturity | | Fair Value | |
| | | | | ASSET BACKED SECURITIES — 75.6% (Continued) | | | | | | | | | | |
| | | | | RESIDENTIAL MORTGAGE — 7.9% (Continued) | | | | | | | | | | |
| | 2,759,324 | | | RAAC Series 2006-RP1 Trust(a),(d) | | US0001M + 1.875% | | 1.9770 | | 10/25/45 | | $ | 2,885,254 | |
| | 428,692 | | | RAMP Series 2003-RS10 Trust(d) | | US0001M + 1.700% | | 2.6420 | | 11/25/33 | | | 437,372 | |
| | 699,316 | | | RAMP Series 2004-SL3 Trust | | | | 8.5000 | | 12/25/31 | | | 426,586 | |
| | 208,529 | | | RAMP Series 2006-RS6 Trust(d) | | US0001M + 0.540% | | 0.6420 | | 11/25/36 | | | 196,313 | |
| | 2,092 | | | RASC Series 2006-KS9 Trust(d) | | US0001M + 0.160% | | 0.2620 | | 11/25/36 | | | 3,463 | |
| | 831,973 | | | RFSC Series 2002-RP2 Trust(a),(d) | | US0001M + 1.500% | | 1.6020 | | 10/25/32 | | | 811,688 | |
| | 4,884 | | | SACO I Trust 2005-9(d) | | US0001M + 0.690% | | 0.7920 | | 12/25/35 | | | 126,294 | |
| | 90,372 | | | SACO I Trust 2005-WM2(d) | | US0001M + 0.825% | | 0.9270 | | 07/25/35 | | | 90,880 | |
| | 77,621 | | | SACO I Trust 2006-6(d) | | US0001M + 0.260% | | 0.3620 | | 06/25/36 | | | 76,746 | |
| | 3,330,000 | | | SASCO ARC NIM 2003-5 20330627(a) | | | | 6.0000 | | 06/27/33 | | | 3,430,366 | |
| | 494,767 | | | Soundview Home Loan Trust 2004-1(d) | | US0001M + 1.020% | | 1.1220 | | 07/25/34 | | | 497,756 | |
| | 95,493 | | | Soundview Home Loan Trust 2004-1(d) | | US0001M + 2.925% | | 3.0270 | | 07/25/34 | | | 97,476 | |
| | 739,165 | | | Soundview Home Loan Trust 2004-1(d) | | US0001M + 4.875% | | 4.9780 | | 07/25/34 | | | 769,736 | |
| | 644,378 | | | Structured Asset Investment Loan Trust 2004-8(d) | | US0001M + 3.750% | | 3.8520 | | 09/25/34 | | | 726,136 | |
| | 475,439 | | | Structured Asset Securities Corp Mortgage Loan(d) | | US0001M + 0.630% | | 0.7320 | | 05/25/35 | | | 459,570 | |
| | 470,541 | | | Structured Asset Securities Corp Mortgage Loan(d) | | US0001M + 0.945% | | 1.0470 | | 05/25/35 | | | 451,654 | |
| | 357,135 | | | Structured Asset Securities Corp Mortgage Loan(d) | | US0001M + 0.990% | | 1.0920 | | 05/25/35 | | | 341,667 | |
| | 145,141 | | | Structured Asset Securities Corp Mortgage Loan(d) | | US0001M + 1.650% | | 1.7520 | | 05/25/35 | | | 143,374 | |
| | 36,326 | | | Structured Asset Securities Corp Mortgage Loan(d) | | US0001M + 0.435% | | 0.5370 | | 06/25/35 | | | 36,324 | |
| | | | | | | | | | | | | | 60,231,480 | |
| | | | | TOTAL ASSET BACKED SECURITIES (Cost $564,548,970) | | | | | | | | | 577,482,294 | |
| | | | | | | | | | | | | | | |
| | | | | CORPORATE BONDS — 16.3% | | | | | | | | | | |
| | | | | INSURANCE — 11.0% | | | | | | | | | | |
| | 42,056,467 | | | Ambac Assurance Corporation(a) | | | | — | | 06/07/69 | | | 56,650,060 | |
| | 18,369,527 | | | AMBAC Assurance Corporation(a) | | | | 8.5000 | | 02/12/55 | | | 17,451,051 | |
| | 1,086,996 | | | MBIA Global Funding, LLC(a),(e) | | | | — | | 12/15/31 | | | 452,056 | |
| | 27,495,743 | | | MBIA Global Funding, LLC(e) | | | | — | | 12/15/33 | | | 9,466,505 | |
| | | | | | | | | | | | | | 84,019,672 | |
| | | | | SPECIALTY FINANCE — 1.5% | | | | | | | | | | |
| | 2,000,000 | | | OWS Cre Funding I, LLC(a),(d) | | US0001M + 4.900% | | 5.0100 | | 09/15/23 | | | 2,020,180 | |
| | 8,659,350 | | | Preferred Term Securities Limited(a) | | | | — | | 09/15/30 | | | 5,628,578 | |
| | 1,000,000 | | | US Capital Funding II Ltd. Capital Funding II(a),(d) | | US0003M + 1.650% | | 1.7820 | | 08/01/34 | | | 800,000 | |
| | 1,500,000 | | | X-Caliber Funding, LLC(a) | | | | 5.0000 | | 09/24/24 | | | 1,507,506 | |
See accompanying notes to financial statements.
RATIONAL SPECIAL SITUATIONS INCOME FUND
SCHEDULE OF INVESTMENTS (Continued)
December 31, 2021
| Principal | | | | | | | Coupon Rate | | | | | |
| Amount ($) | | | | | Spread | | (%) | | Maturity | | Fair Value | |
| | | | | CORPORATE BONDS — 16.3% (Continued) | | | | | | | | | | |
| | | | | SPECIALTY FINANCE — 1.5% (Continued) | | | | | | | | | | |
| | 1,275,000 | | | X-Caliber Funding, LLC(a) | | | | 11.0000 | | 09/24/24 | | $ | 1,295,849 | |
| | | | | | | | | | | | | | 11,252,113 | |
| | | | | SYNDICATED LOANS — 3.3% | | | | | | | | | | |
| | 9,688,281 | | | Deer Finance Syndicated Loan | | | | 6.0000 | | 10/07/23 | | | 9,688,280 | |
| | 4,000,000 | | | Milberg Coleman Bryson Phillips Grossman Syndicated Loan | | | | 17.5000 | | 04/28/25 | | | 4,000,000 | |
| | 7,500,000 | | | MSP Deer Finance Syndicated Loan | | | | 17.0000 | | 04/09/25 | | | 7,500,000 | |
| | 3,973,530 | | | Watts Guerra 005-A Deer Finance Syndicated Loan | | | | 15.5000 | | 10/30/25 | | | 3,973,530 | |
| | | | | | | | | | | | | | 25,161,810 | |
| | | | | TRANSPORTATION & LOGISTICS — 0.5% | | | | | | | | | | |
| | 3,160,615 | | | American Airlines 2013-1 Class A Pass Through Series 2013-1 Class A | | | | 4.0000 | | 01/15/27 | | | 3,051,836 | |
| | 113,909 | | | American Airlines 2013-2 Class A Pass Through Series 2013-2 Class A | | | | 4.9500 | | 01/15/23 | | | 116,404 | |
| | 716,513 | | | US Airways 2013-1 Class A Pass Through Trust Series 13-1 A | | | | 3.9500 | | 11/15/25 | | | 723,249 | |
| | | | | | | | | | | | | | 3,891,489 | |
| | | | | TOTAL CORPORATE BONDS (Cost $125,931,577) | | | | | | | | | 124,325,084 | |
| Shares | | | | | | |
| | | | | SHORT TERM INVESTMENTS — 7.5% | | | | |
| | | | | MONEY MARKET FUNDS - 7.5% | | | | |
| | 57,654,111 | | | First American Government Obligations Fund, Class U, 0.03% (Cost $57,654,111)(g) | | | 57,654,111 | |
| | | | | | | | | |
| | | | | TOTAL INVESTMENTS - 99.7% (Cost $750,137,218) | | $ | 761,521,489 | |
| | | | | OTHER ASSETS IN EXCESS OF LIABILITIES - 0.3% | | | 2,417,503 | |
| | | | | NET ASSETS - 100.0% | | $ | 763,938,992 | |
| LLC | - Limited Liability Company |
| | |
| LTD | - Limited Company |
| | |
| REIT | - Real Estate Investment Trust |
| | |
| REMIC | - Real Estate Mortgage Investment Conduit |
| | |
| 12MTA | Federal Reserve US 12 Month Cumulative Avg 1 Year CMT |
| | |
| COF 11 | Cost of Funds for the 11th District of San Francisco |
| | |
| H15T1Y | US Treasury Yield Curve Rate T Note Constant Maturity 1 Year |
| | |
| US0001M | ICE LIBOR USD 1 Month |
| | |
| US0003M | ICE LIBOR USD 3 Month |
| | |
| US0006M | ICE LIBOR USD 6 Month |
| | |
| US0012M | ICE LIBOR USD 12 Month |
See accompanying notes to financial statements.
RATIONAL SPECIAL SITUATIONS INCOME FUND
SCHEDULE OF INVESTMENTS (Continued)
December 31, 2021
| (a) | Security exempt from registration under Rule 144A or Section 4(2) of the Securities Act of 1933. The security may be resold in transactions exempt from registration, normally to qualified institutional buyers. As of December 31, 2021 the total fair value of 144A securities is $295,219,438 or 38.6% of net assets. |
| (b) | Interest only securities. |
| (c) | Variable rate security; the rate shown represents the rate on December 31, 2021. |
| (d) | Variable or floating rate security, the interest rate of which adjusts periodically based on changes in current interest rates and prepayments on the underlying pool of assets. |
| (f) | Step bond. Coupon rate is fixed rate that changes on a specified date. The rate shown is the current rate at December 31, 2021. |
| (g) | Rate disclosed is the seven day effective yield as of December 31, 2021. |
| (i) | Security currently in litigation. |
| (j) | Non-income producing security. |
| (h) | Illiquid security, total illiquid securities equal 2.96% |
See accompanying notes to financial statements.
| RATIONAL INFLATION GROWTH FUND |
| SCHEDULE OF INVESTMENTS |
| December 31, 2021 |
| Shares | | | | | Fair Value | |
| | | | | COMMON STOCKS — 75.0% | | | | |
| | | | | AEROSPACE & DEFENSE - 2.2% | | | | |
| | 111 | | | Boeing Company (The)(a) | | $ | 22,347 | |
| | 278 | | | Raytheon Technologies Corp. | | | 23,924 | |
| | | | | | | | 46,271 | |
| | | | | BANKS - 4.4% | | | | |
| | 548 | | | Bank of America Corporation | | | 24,381 | |
| | 346 | | | Citigroup, Inc. | | | 20,895 | |
| | 147 | | | JPMorgan Chase & Company | | | 23,277 | |
| | 499 | | | Wells Fargo & Company | | | 23,942 | |
| | | | | | | | 92,495 | |
| | | | | CHEMICALS - 5.0% | | | | |
| | 86 | | | Air Products & Chemicals, Inc. | | | 26,166 | |
| | 105 | | | Ecolab, Inc. | | | 24,632 | |
| | 75 | | | Linde plc | | | 25,982 | |
| | 77 | | | Sherwin-Williams Company (The) | | | 27,117 | |
| | | | | | | | 103,897 | |
| | | | | DIVERSIFIED FINANCIAL SERVICES - 1.2% | | | | |
| | 85 | | | Berkshire Hathaway, Inc., Class B(a) | | | 25,415 | |
| | | | | | | | | |
| | | | | DIVERSIFIED INDUSTRIALS - 1.1% | | | | |
| | 108 | | | Honeywell International, Inc. | | | 22,519 | |
| | | | | | | | | |
| | | | | ELECTRIC UTILITIES - 2.5% | | | | |
| | 577 | | | NRG Energy, Inc. | | | 24,857 | |
| | 1,245 | | | Vistra Energy Corporation | | | 28,349 | |
| | | | | | | | 53,206 | |
| | | | | ENTERTAINMENT - 1.9% | | | | |
| | 641 | | | ViacomCBS, Inc., Class B | | | 19,345 | |
| | 139 | | | Walt Disney Company (The)(a) | | | 21,530 | |
| | | | | | | | 40,875 | |
| | | | | INSURANCE - 5.8% | | | | |
| | 319 | | | Athene Holding Ltd., Class A(a) | | | 26,582 | |
| | 163 | | | Goosehead Insurance, Inc., Class A | | | 21,203 | |
| | 372 | | | Lemonade, Inc.(a) | | | 15,665 | |
| | 249 | | | Progressive Corporation (The) | | | 25,560 | |
See accompanying notes to financial statements.
| RATIONAL INFLATION GROWTH FUND |
| SCHEDULE OF INVESTMENTS (Continued) |
| December 31, 2021 |
| Shares | | | | | Fair Value | |
| | | | | COMMON STOCKS — 75.0% (Continued) | | | | |
| | | | | INSURANCE - 5.8% (Continued) | | | | |
| | 238 | | | Trupanion, Inc.(a) | | $ | 31,423 | |
| | | | | | | | 120,433 | |
| | | | | LEISURE FACILITIES & SERVICES - 3.4% | | | | |
| | 99 | | | McDonald’s Corp. | | | 26,539 | |
| | 210 | | | Starbucks Corporation | | | 24,564 | |
| | 413 | | | Yum China Holdings, Inc. | | | 20,584 | |
| | | | | | | | 71,687 | |
| | | | | METALS & MINING - 17.9% | | | | |
| | 432 | | | Agnico Eagle Mines Ltd. | | | 22,956 | |
| | 1,228 | | | Barrick Gold Corporation | | | 23,332 | |
| | 1,196 | | | Cleveland-Cliffs, Inc.(a) | | | 26,037 | |
| | 1,861 | | | First Majestic Silver Corporation | | | 20,676 | |
| | 170 | | | Franco-Nevada Corporation | | | 23,509 | |
| | 656 | | | Freeport-McMoRan, Inc. | | | 27,375 | |
| | 4,065 | | | Hecla Mining Company | | | 21,219 | |
| | 416 | | | Newmont Corporation | | | 25,800 | |
| | 241 | | | Nucor Corporation | | | 27,510 | |
| | 934 | | | Pan American Silver Corporation | | | 23,322 | |
| | 170 | | | Reliance Steel & Aluminum Company | | | 27,577 | |
| | 1,441 | | | SSR Mining, Inc. | | | 25,506 | |
| | 399 | | | Steel Dynamics, Inc. | | | 24,766 | |
| | 1,126 | | | United States Steel Corporation | | | 26,810 | |
| | 574 | | | Wheaton Precious Metals Corporation | | | 24,642 | |
| | | | | | | | 371,037 | |
| | | | | OIL & GAS PRODUCERS - 13.1% | | | | |
| | 2,350 | | | Antero Midstream Corp. | | | 22,748 | |
| | 225 | | | Chevron Corporation | | | 26,404 | |
| | 371 | | | ConocoPhillips | | | 26,779 | |
| | 598 | | | Enbridge, Inc. | | | 23,370 | |
| | 3,690 | | | EnLink Midstream, LLC | | | 25,424 | |
| | 303 | | | EOG Resources, Inc. | | | 26,914 | |
| | 403 | | | Exxon Mobil Corporation | | | 24,660 | |
| | 1,441 | | | Kinder Morgan, Inc. | | | 22,854 | |
| | 413 | | | ONEOK, Inc. | | | 24,268 | |
See accompanying notes to financial statements.
| RATIONAL INFLATION GROWTH FUND |
| SCHEDULE OF INVESTMENTS (Continued) |
| December 31, 2021 |
| Shares | | | | | Fair Value | |
| | | | | COMMON STOCKS — 75.0% (Continued) | | | | |
| | | | | OIL & GAS PRODUCERS - 13.1% (Continued) | | | | |
| | 488 | | | TC Energy Corporation | | $ | 22,712 | |
| | 911 | | | Williams Companies, Inc. (The) | | | 23,722 | |
| | | | | | | | 269,855 | |
| | | | | OIL & GAS SERVICES & EQUIPMENT - 1.1% | | | | |
| | 796 | | | Schlumberger Ltd. | | | 23,840 | |
| | | | | | | | | |
| | | | | REITS - 6.3% | | | | |
| | 84 | | | American Tower Corporation | | | 24,570 | |
| | 127 | | | Crown Castle International Corporation | | | 26,510 | |
| | 29 | | | Equinix, Inc. | | | 24,529 | |
| | 171 | | | Prologis, Inc. | | | 28,790 | |
| | 73 | | | Public Storage | | | 27,343 | |
| | | | | | | | 131,742 | |
| | | | | RENEWABLE ENERGY - 0.9% | | | | |
| | 666 | | | Sunnova Energy International, Inc.(a) | | | 18,595 | |
| | | | | | | | | |
| | | | | SOFTWARE - 0.9% | | | | |
| | 35 | | | MicroStrategy, Inc., Class A(a) | | | 19,057 | |
| | | | | | | | | |
| | | | | SPECIALTY FINANCE - 0.9% | | | | |
| | 563 | | | Marathon Digital Holdings, Inc.(a) | | | 18,500 | |
| | | | | | | | | |
| | | | | TECHNOLOGY HARDWARE - 1.2% | | | | |
| | 840 | | | Plantronics, Inc.(a) | | | 24,646 | |
| | | | | | | | | |
| | | | | TECHNOLOGY SERVICES - 2.7% | | | | |
| | 89 | | | Coinbase Global, Inc., Class A(a) | | | 22,461 | |
| | 97 | | | PayPal Holdings, Inc.(a) | | | 18,293 | |
| | 99 | | | Square, Inc., Class A(a) | | | 15,989 | |
| | | | | | | | 56,743 | |
| | | | | TRANSPORTATION & LOGISTICS - 2.5% | | | | |
| | 107 | | | Union Pacific Corporation | | | 26,957 | |
See accompanying notes to financial statements.
| RATIONAL INFLATION GROWTH FUND |
| SCHEDULE OF INVESTMENTS (Continued) |
| December 31, 2021 |
| Shares | | | | | Fair Value | |
| | | | | COMMON STOCKS — 75.0% (Continued) | | | | |
| | | | | TRANSPORTATION & LOGISTICS - 2.5% (Continued) | | | | |
| | 120 | | | United Parcel Service, Inc., Class B | | $ | 25,721 | |
| | | | | | | | 52,678 | |
| | | | | | | | | |
| | | | | TOTAL COMMON STOCKS (Cost $1,556,908) | | | 1,563,491 | |
| | | | | | | | | |
| | | | | EXCHANGE-TRADED FUNDS — 21.8% | | | | |
| | | | | COMMODITY - 21.8% | | | | |
| | 1,746 | | | abrdn Bloomberg All Commodity Strategy K-1 Free | | | 40,141 | |
| | 1,539 | | | Direxion Auspice Broad Commodity Strategy ETF | | | 44,908 | |
| | 1,611 | | | GraniteShares Bloomberg Commodity Broad Strategy | | | 41,322 | |
| | 2,368 | | | Invesco DB Commodity Index Tracking Fund(a) | | | 49,207 | |
| | 2,384 | | | Invesco Optimum Yield Diversified Commodity | | | 33,519 | |
| | 1,368 | | | iShares Commodities Select Strategy ETF | | | 42,244 | |
| | 2,860 | | | iShares S&P GSCI Commodity Indexed Trust(a) | | | 48,935 | |
| | 2,169 | | | iShares Silver Trust(a) | | | 46,655 | |
| | 1,133 | | | KraneShares Global Carbon ETF | | | 57,669 | |
| | 282 | | | SPDR® Gold Shares(a) | | | 48,211 | |
| | | | | TOTAL EXCHANGE-TRADED FUNDS (Cost $476,580) | | | 452,811 | |
| | | | | | | | | |
| | | | | SHORT-TERM INVESTMENTS — 1.5% | | | | |
| | | | | MONEY MARKET FUNDS - 1.5% | | | | |
| | 30,892 | | | First American Government Obligations Fund, Class U, 0.03% (Cost $30,892)(b) | | | 30,892 | |
| | | | | | | | | |
| | | | | TOTAL INVESTMENTS - 98.3% (Cost $2,064,380) | | $ | 2,047,194 | |
| | | | | OTHER ASSETS IN EXCESS OF LIABILITIES - 1.7% | | | 34,667 | |
| | | | | NET ASSETS - 100.0% | | $ | 2,081,861 | |
| ETF | - Exchange-Traded Fund |
| LLC | - Limited Liability Company |
| PLC | - Public Limited Company |
| REIT | - Real Estate Investment Trust |
| SPDR | - Standard & Poor’s Depositary Receipt |
| (a) | Non-income producing security. |
| (b) | Rate disclosed is the seven day effective yield as of December 31, 2021. |
See accompanying notes to financial statements.
| RATIONAL FUNDS |
| Statements of Assets and Liabilities |
| December 31, 2021 |
| | | Rational | | | Rational | | | Rational | | | Rational | |
| | | Equity Armor | | | Tactical Return | | | Dynamic Brands | | | Strategic Allocation | |
| | | Fund | | | Fund | | | Fund | | | Fund | |
| ASSETS: | | | | | | | | | | | | | | | | |
| Investments in Unaffiliated securities, at cost | | $ | 57,924,617 | | | $ | 190,637,306 | | | $ | 96,187,944 | | | $ | 815,854 | |
| Investments in Affiliated securities, at cost | | | — | | | | — | | | | — | | | | 8,229,089 | |
| Total Securities at Cost | | | 57,924,617 | | | | 190,637,306 | | | | 96,187,944 | | | | 9,044,943 | |
| | | | | | | | | | | | | | | | | |
| Investments in Unaffiliated securities, at value | | $ | 69,310,005 | | | $ | 190,637,306 | | | $ | 111,420,131 | | | $ | 815,854 | |
| Investments in Affiliated securities, at value | | | — | | | | — | | | | — | | | | 8,558,193 | |
| Total Securities at Value | | $ | 69,310,005 | | | $ | 190,637,306 | | | $ | 111,420,131 | | | $ | 9,374,047 | |
| Deposits with Brokers for futures and options | | | 4,211,485 | | | | 101,882,046 | | | | — | | | | 769,132 | |
| Receivable for securities sold | | | — | | | | — | | | | 4,114,691 | | | | — | |
| Receivable for Fund shares sold | | | 25 | | | | 895,042 | | | | 86,621 | | | | — | |
| Futures unrealized appreciation | | | 531,527 | | | | — | | | | — | | | | 225,560 | |
| Dividends and interest receivable | | | 65,502 | | | | 2,907 | | | | 7,274 | | | | 4,981 | |
| Due from Advisor | | | — | | | | — | | | | — | | | | 3,491 | |
| Prepaid expenses and other assets | | | 42,492 | | | | 37,346 | | | | 41,231 | | | | 7,453 | |
| Total Assets | | | 74,161,036 | | | | 293,454,647 | | | | 115,669,948 | | | | 10,384,664 | |
| | | | | | | | | | | | | | | | | |
| LIABILITIES: | | | | | | | | | | | | | | | | |
| Options written (premiums received $477,813, $0, $0, $0) | | | 543,125 | | | | — | | | | — | | | | — | |
| Payable for securities purchased | | | — | | | | — | | | | 4,549,411 | | | | 4,990 | |
| Management fees payable | | | 45,628 | | | | 423,752 | | | | 70,383 | | | | — | |
| Futures unrealized depreciation | | | 919,857 | | | | — | | | | — | | | | — | |
| Payable for Fund shares redeemed | | | 7,260 | | | | 402,933 | | | | 223,996 | | | | 120 | |
| Payable to related parties | | | 6,129 | | | | 22,546 | | | | 11,008 | | | | 3,099 | |
| Shareholder services fees payable | | | 6,946 | | | | 38,055 | | | | 15,228 | | | | 1,187 | |
| Accrued 12b-1 fees | | | 4,789 | | | | 43,956 | | | | 28,388 | | | | 2,412 | |
| Trustee fees payable | | | 3,494 | | | | 3,508 | | | | 3,500 | | | | 3,498 | |
| Accrued expenses and other liabilities | | | 19,360 | | | | 24,494 | | | | 17,782 | | | | 19,446 | |
| Total Liabilities | | | 1,556,588 | | | | 959,244 | | | | 4,919,696 | | | | 34,752 | |
| | | | | | | | | | | | | | | | | |
| Net Assets | | $ | 72,604,448 | | | $ | 292,495,403 | | | $ | 110,750,252 | | | $ | 10,349,912 | |
| | | | | | | | | | | | | | | | | |
| NET ASSETS CONSIST OF: | | | | | | | | | | | | | | | | |
| Paid in capital | | $ | 66,246,252 | | | $ | 294,528,609 | | | $ | 93,444,209 | | | $ | 9,656,610 | |
| Accumulated earnings (deficits) | | | 6,358,196 | | | | (2,033,206 | ) | | | 17,306,043 | | | | 693,302 | |
| Net Assets | | $ | 72,604,448 | | | $ | 292,495,403 | | | $ | 110,750,252 | | | $ | 10,349,912 | |
| | | | | | | | | | | | | | | | | |
| Institutional Shares | | | | | | | | | | | | | | | | |
| Net Assets | | $ | 58,975,104 | | | $ | 264,557,157 | | | $ | 82,647,945 | | | $ | 519,102 | |
| Shares of beneficial interest outstanding (a) | | | 6,561,711 | | | | 46,433,254 | | | | 1,388,685 | | | | 50,669 | |
| Net asset value per share | | $ | 8.99 | | | $ | 5.70 | | | $ | 59.52 | | | $ | 10.24 | |
| | | | | | | | | | | | | | | | | |
| Class A Shares | | | | | | | | | | | | | | | | |
| Net Assets | | $ | 11,858,112 | | | $ | 18,494,222 | | | $ | 23,204,791 | | | $ | 9,829,668 | |
| Shares of beneficial interest outstanding (a) | | | 1,321,055 | | | | 3,234,707 | | | | 618,979 | | | | 954,556 | |
| Net asset value and redemption price per share | | $ | 8.98 | | | $ | 5.72 | | | $ | 37.49 | | | $ | 10.30 | |
| Maximum offering price per share (b) | | $ | 9.43 | | | $ | 6.01 | | | $ | 39.36 | | | $ | 10.81 | |
| | | | | | | | | | | | | | | | | |
| Class C Shares | | | | | | | | | | | | | | | | |
| Net Assets | | $ | 1,771,232 | | | $ | 9,444,024 | | | $ | 4,897,516 | | | | 1,142 | |
| Shares of beneficial interest outstanding (a) | | | 198,449 | | | | 1,703,022 | | | | 154,338 | | | | 111 | |
| Net asset value, offering price and redemption price per share (c) | | $ | 8.93 | | | $ | 5.55 | | | $ | 31.73 | | | $ | 10.25 | (d) |
| | | | | | | | | | | | | | | | | |
| (a) | Unlimited number of shares of no par value beneficial interest authorized. |
| (b) | There is a maximum front-end sales charge (load) of 4.75% imposed on purchases of Class A shares for each Fund. |
| (c) | A contingent deferred sales charge (“CDSC”) of 1.00% may be charged on shares held less than 12 months. |
| (d) | Does not calculate due to rounding. |
See accompanying notes to consolidated financial statements.
| RATIONAL FUNDS |
| Statements of Assets and Liabilities (Continued) |
| December 31, 2021 |
| | | Rational/ | | | Rational/Pier 88 | | | Rational | | | Rational | |
| | | ReSolve Adaptive | | | Convertible Securities | | | Special Situations | | | Inflation Growth | |
| | | Asset Allocation Fund | | | Fund | | | Income Fund | | | Fund | |
| | | (Consolidated) | | | | | | | | | | |
| ASSETS: | | | | | | | | | | | | | | | | |
| Investments in securities, at cost | | $ | 61,259,968 | | | $ | 111,109,525 | | | $ | 750,137,218 | | | $ | 2,064,380 | |
| Investments, at value | | $ | 61,259,968 | | | $ | 120,634,800 | | | $ | 761,521,489 | | | $ | 2,047,194 | |
| Cash | | | — | | | | — | | | | 2,756 | | | | — | |
| Deposits with Brokers for futures | | | 2,232,016 | | | | — | | | | — | | | | 22,288 | |
| Unrealized appreciation from open futures contracts | | | 1,100,826 | | | | — | | | | — | | | | — | |
| Foreign cash deposits with brokers for futures (Cost $1,993,169, $0, $0. $0) | | | 1,984,821 | | | | — | | | | — | | | | — | |
| Receivable for securities sold | | | — | | | | — | | | | 169,720 | | | | — | |
| Dividends and interest receivable | | | 1,262 | | | | 291,430 | | | | 4,059,472 | | | | 7,636 | |
| Receivable for Fund shares sold | | | 395 | | | | 300 | | | | 3,305,553 | | | | — | |
| Due from Advisor | | | — | | | | — | | | | — | | | | 13,868 | |
| Prepaid expenses and other assets | | | 28,188 | | | | 20,645 | | | | 122,275 | | | | 4,490 | |
| Total Assets | | | 66,607,476 | | | | 120,947,175 | | | | 769,181,265 | | | | 2,095,476 | |
| | | | | | | | | | | | | | | | | |
| LIABILITIES: | | | | | | | | | | | | | | | | |
| Payable for securities purchased | | | — | | | | — | | | | 3,872,287 | | | | — | |
| Unrealized depreciation from open futures contracts | | | 737,268 | | | | — | | | | — | | | | — | |
| Management fees payable | | | 86,880 | | | | 74,212 | | | | 930,431 | | | | — | |
| Payable for Fund shares redeemed | | | 307 | | | | — | | | | 127,518 | | | | — | |
| Payable to related parties | | | 8,912 | | | | 11,116 | | | | 67,526 | | | | 2,220 | |
| Accrued 12b-1 fees | | | 218 | | | | 8,333 | | | | 128,642 | | | | 136 | |
| Due to custodian | | | — | | | | 4,019 | | | | — | | | | — | |
| Shareholder services fees payable | | | 8,825 | | | | 10,853 | | | | 64,759 | | | | 71 | |
| Trustee fees payable | | | 3,519 | | | | 3,501 | | | | 3,497 | | | | 3,482 | |
| Accrued expenses and other liabilities | | | 24,629 | | | | 21,507 | | | | 47,613 | | | | 7,706 | |
| Total Liabilities | | | 870,558 | | | | 133,541 | | | | 5,242,273 | | | | 13,615 | |
| | | | | | | | | | | | | | | | | |
| Net Assets | | $ | 65,736,918 | | | $ | 120,813,634 | | | $ | 763,938,992 | | | $ | 2,081,861 | |
| | | | | | | | | | | | | | | | | |
| NET ASSETS CONSIST OF: | | | | | | | | | | | | | | | | |
| Paid in capital | | $ | 69,248,615 | | | $ | 111,584,018 | | | $ | 759,580,199 | | | $ | 2,147,061 | |
| Accumulated earnings (deficits) | | | (3,511,697 | ) | | | 9,229,616 | | | | 4,358,793 | | | | (65,200 | ) |
| Net Assets | | $ | 65,736,918 | | | $ | 120,813,634 | | | $ | 763,938,992 | | | $ | 2,081,861 | |
| | | | | | | | | | | | | | | | | |
| Institutional Shares | | | | | | | | | | | | | | | | |
| Net Assets | | $ | 64,889,548 | | | $ | 118,333,426 | | | $ | 670,278,295 | | | $ | 1,359,654 | |
| Shares of beneficial interest outstanding (a) | | | 2,857,229 | | | | 9,896,458 | | | | 34,048,090 | | | | 138,740 | |
| Net asset value per share | | $ | 22.71 | | | $ | 11.96 | | | $ | 19.69 | | | $ | 9.80 | |
| | | | | | | | | | | | | | | | | |
| Class A Shares | | | | | | | | | | | | | | | | |
| Net Assets | | $ | 606,774 | | | $ | 2,231,070 | | | $ | 58,163,502 | | | $ | 696,576 | |
| Shares of beneficial interest outstanding (a) | | | 26,929 | | | | 186,371 | | | | 2,957,871 | | | | 71,119 | |
| Net asset value and redemption price per share | | $ | 22.53 | | | $ | 11.97 | | | $ | 19.66 | | | $ | 9.79 | |
| Maximum offering price per share (b) | | $ | 23.90 | | | $ | 12.57 | | | $ | 20.64 | | | $ | 10.39 | |
| | | | | | | | | | | | | | | | | |
| Class C Shares | | | | | | | | | | | | | | | | |
| Net Assets | | $ | 240,596 | | | $ | 249,138 | | | $ | 35,497,195 | | | $ | 25,631 | |
| Shares of beneficial interest outstanding (a) | | | 10,995 | | | | 20,932 | | | | 1,809,878 | | | | 2,624 | |
| Net asset value, offering price and redemption price per share (c) | | $ | 21.88 | | | $ | 11.90 | | | $ | 19.61 | | | $ | 9.77 | |
| | | | | | | | | | | | | | | | | |
| (a) | Unlimited number of shares of no par value beneficial interest authorized. |
| (b) | There is a maximum front-end sales charge (load) of 4.75% imposed on purchases of Class A shares for each Fund except Resolve Adaptive Asset Allocation Fund and Inflation Growth Fund whose maximum front-end sales charge (load) is 5.75%. |
| (c) | A contingent deferred sales charge (“CDSC”) of 1.00% may be charged on shares held less than 12 months. |
See accompanying notes to consolidated financial statements.
| RATIONAL FUNDS |
| Statements of Operations |
| For the Year Ended December 31, 2021 |
| | | Rational | | | Rational | | | Rational | | | Rational | |
| | | Equity Armor | | | Tactical Return | | | Dynamic Brands | | | Strategic Allocation | |
| | | Fund | | | Fund | | | Fund | | | Fund | |
| Investment Income: | | | | | | | | | | | | | | | | |
| Dividend income | | $ | 1,296,513 | | | $ | — | | | $ | 479,305 | | | $ | — | |
| Interest income | | | 1,220 | | | | 35,185 | | | | 412 | | | | 402 | |
| Dividend income - affiliated companies (Note 3) | | | — | | | | — | | | | — | | | | 354,811 | |
| Foreign tax withheld | | | — | | | | — | | | | (21,092 | ) | | | — | |
| Total Investment Income | | | 1,297,733 | | | | 35,185 | | | | 458,625 | | | | 355,213 | |
| | | | | | | | | | | | | | | | | |
| Operating Expenses: | | | | | | | | | | | | | | | | |
| Investment management fees | | | 512,764 | | | | 4,382,854 | | | | 714,418 | | | | 8,809 | |
| 12b-1 Fees - Class C Shares | | | 15,132 | | | | 90,393 | | | | 34,875 | | | | 11 | |
| 12b-1 Fees - Class A Shares | | | 30,673 | | | | 33,309 | | | | 54,214 | | | | 21,125 | |
| Shareholder Services Fees - Institutional Shares | | | 44,206 | | | | 247,909 | | | | 61,902 | | | | — | |
| Shareholder Services Fees - Class A Shares | | | 12,843 | | | | 15,535 | | | | 23,802 | | | | 8,080 | |
| Shareholder Services Fees - Class C Shares | | | 625 | | | | 6,849 | | | | 2,535 | | | | — | |
| Administration fees | | | 56,262 | | | | 157,141 | | | | 75,851 | | | | 22,898 | |
| Registration fees | | | 58,445 | | | | 82,227 | | | | 58,479 | | | | 8,116 | |
| Management Service Fees | | | 30,447 | | | | 98,900 | | | | 41,267 | | | | 8,453 | |
| Legal fees | | | 11,580 | | | | 12,529 | | | | 12,773 | | | | 10,456 | |
| Audit fees | | | 13,209 | | | | 13,429 | | | | 12,529 | | | | 13,640 | |
| Compliance officer fees | | | 10,755 | | | | 17,399 | | | | 13,047 | | | | 6,101 | |
| Printing expense | | | 9,116 | | | | 22,378 | | | | 7,071 | | | | 2,380 | |
| Trustees’ fees | | | 12,674 | | | | 12,305 | | | | 12,135 | | | | 11,955 | |
| Custody fees | | | 8,374 | | | | 9,401 | | | | 8,392 | | | | 3,339 | |
| Insurance expense | | | 3,024 | | | | 10,964 | | | | 3,825 | | | | 430 | |
| Interest expense | | | 1,184 | | | | 1,668 | | | | 2,085 | | | | 1,002 | |
| Miscellaneous expenses | | | 2,640 | | | | 2,380 | | | | 2,587 | | | | 2,255 | |
| Total Operating Expenses | | | 833,953 | | | | 5,217,570 | | | | 1,141,787 | | | | 129,050 | |
| Less: Expenses waived/reimbursed by Advisor | | | (38,723 | ) | | | (104,062 | ) | | | — | | | | (67,124 | ) |
| Plus: Waived Fees Recaptured by Advisor | | | — | | | | — | | | | 49,609 | | | | — | |
| Net Operating Expenses | | | 795,230 | | | | 5,113,508 | | | | 1,191,396 | | | | 61,926 | |
| | | | | | | | | | | | | | | | | |
| Net Investment Income (Loss) | | | 502,503 | | | | (5,078,323 | ) | | | (732,771 | ) | | | 293,287 | |
| | | | | | | | | | | | | | | | | |
| Realized and Unrealized Gain (Loss) on Investments: | | | | | | | | | | | | | | | | |
| Net Realized Gain (Loss) from: | | | | | | | | | | | | | | | | |
| Investments | | | 7,755,992 | | | | — | | | | 10,553,815 | | | | — | |
| Affiliated companies | | | — | | | | — | | | | — | | | | (1,537 | ) |
| Securities sold short | | | (14 | ) | | | — | | | | — | | | | — | |
| Distribution of realized gains by underlying investment companies | | | — | | | | — | | | | — | | | | 42,742 | |
| Options purchased | | | (683,372 | ) | | | (2,103,046 | ) | | | — | | | | — | |
| Options written | | | 259,472 | | | | 16,428,204 | | | | — | | | | — | |
| Futures | | | (2,877,781 | ) | | | 4,324 | | | | — | | | | 2,205,142 | |
| Foreign currency transactions | | | — | | | | — | | | | 11 | | | | — | |
| Net Realized Gain | | | 4,454,297 | | | | 14,329,482 | | | | 10,553,826 | | | | 2,246,347 | |
| | | | | | | | | | | | | | | | | |
| Net Change in Unrealized Appreciation (Depreciation) on Investments | | | | | | | | | | | | | | | | |
| Investments | | | 3,885,014 | | | | — | | | | 1,313,262 | | | | — | |
| Affiliated companies | | | — | | | | — | | | | — | | | | (19,849 | ) |
| Options purchased | | | 422,813 | | | | — | | | | — | | | | — | |
| Options written | | | (65,312 | ) | | | (33,266 | ) | | | — | | | | — | |
| Futures | | | (328,268 | ) | | | — | | | | — | | | | 41,180 | |
| Foreign currency translations | | | — | | | | — | | | | (97 | ) | | | — | |
| Net Change in Unrealized Appreciation (Depreciation) on Investments | | | 3,914,247 | | | | (33,266 | ) | | | 1,313,165 | | | | 21,331 | |
| | | | | | | | | | | | | | | | | |
| Net Realized and Unrealized Gain on Investments | | | 8,368,544 | | | | 14,296,216 | | | | 11,866,991 | | | | 2,267,678 | |
| | | | | | | | | | | | | | | | | |
| Net Increase in Net Assets Resulting From Operations | | $ | 8,871,047 | | | $ | 9,217,893 | | | $ | 11,134,220 | | | $ | 2,560,965 | |
| | | | | | | | | | | | | | | | | |
See accompanying notes to consolidated financial statements.
| Rational Funds |
| Statements of Operations (Continued) |
| For the Year Ended December 31, 2021 |
| | | Rational/ | | | Rational/ Pier 88 | | | Rational | | | Rational | |
| | | ReSolve Adaptive | | | Convertible Securities | | | Special Situations | | | Inflation Growth | |
| | | Asset Allocation Fund | | | Fund | | | Income Fund | | | Fund (a) | |
| Investment Income: | | (Consolidated) | | | | | | | | | | | | | |
| Dividend income | | $ | — | | | $ | 2,008,474 | | | $ | 97,500 | | | $ | 48,003 | |
| Interest income | | | 17,358 | | | | 71,357 | | | | 31,014,416 | | | | 14 | |
| Foreign tax withheld | | | — | | | | — | | | | — | | | | (213 | ) |
| Total Investment Income | | | 17,358 | | | | 2,079,831 | | | | 31,111,916 | | | | 47,804 | |
| | | | | | | | | | | | | | | | | |
| Operating Expenses: | | | | | | | | | | | | | | | | |
| Investment management fees | | | 1,142,604 | | | | 856,438 | | | | 8,445,834 | | | | 6,149 | |
| 12b-1 Fees - Class A Shares | | | 1,567 | | | | 10,965 | | | | 122,516 | | | | 241 | |
| 12b-1 Fees - Class C Shares | | | 2,603 | | | | 1,652 | | | | 257,466 | | | | 14 | |
| Shareholder Services Fees - Institutional Shares | | | 66,236 | | | | 95,854 | | | | 438,886 | | | | 124 | |
| Shareholder Services Fees - Class A Shares | | | 213 | | | | 1,158 | | | | 47,716 | | | | — | |
| Shareholder Services Fees - Class C Shares | | | 289 | | | | 65 | | | | 16,686 | | | | — | |
| Administrative fees | | | 58,119 | | | | 79,384 | | | | 524,747 | | | | 5,175 | |
| Management Service Fees | | | 32,107 | | | | 43,519 | | | | 216,016 | | | | 2,032 | |
| Registration fees | | | 35,580 | | | | 29,909 | | | | 95,109 | | | | 144 | |
| Printing expenses | | | 9,497 | | | | 4,677 | | | | 38,431 | | | | 4,911 | |
| Legal fees | | | 17,699 | | | | 11,313 | | | | 78,467 | | | | 10,670 | |
| Audit fees | | | 14,051 | | | | 13,287 | | | | 37,495 | | | | 13,296 | |
| Compliance officer fees | | | 10,766 | | | | 14,319 | | | | 24,884 | | | | 5,529 | |
| Custody fees | | | 5,600 | | | | 5,568 | | | | 49,829 | | | | 3,480 | |
| Trustees’ fees | | | 15,206 | | | | 12,084 | | | | 12,743 | | | | 7,131 | |
| Insurance Expense | | | 2,781 | | | | 4,408 | | | | 20,928 | | | | — | |
| Interest expense | | | 7,336 | | | | 1,068 | | | | 1,002 | | | | — | |
| Miscellaneous expense | | | 973 | | | | 1,652 | | | | 5,119 | | | | 888 | |
| Total Operating Expenses | | | 1,423,227 | | | | 1,187,320 | | | | 10,433,874 | | | | 59,784 | |
| Less: Expenses waived/reimbursed by Advisor | | | (125,327 | ) | | | (174,835 | ) | | | (119,447 | ) | | | (52,120 | ) |
| Net Operating Expenses | | | 1,297,900 | | | | 1,012,485 | | | | 10,314,427 | | | | 7,664 | |
| | | | | | | | | | | | | | | | | |
| Net Investment Income (Loss) | | | (1,280,542 | ) | | | 1,067,346 | | | | 20,797,489 | | | | 40,140 | |
| | | | | | | | | | | | | | | | | |
| Realized and Unrealized Gain (Loss) on Investments: | | | | | | | | | | | | | | | | |
| Net Realized Gain (Loss) from: | | | | | | | | | | | | | | | | |
| Investments | | | — | | | | 6,743,996 | | | | 5,986,376 | | | | 20 | |
| Futures | | | 10,204,307 | | | | — | | | | — | | | | (72,712 | ) |
| Foreign currency translations | | | (201,349 | ) | | | — | | | | — | | | | — | |
| Net Realized Gain (Loss) | | | 10,002,958 | | | | 6,743,996 | | | | 5,986,376 | | | | (72,692 | ) |
| | | | | | | | | | | | | | | | | |
| Net Change in Unrealized Appreciation/Depreciation on Investments | | | | | | | | | | | | | | | | |
| Investments | | | — | | | | 1,436,227 | | | | 559,952 | | | | (17,186 | ) |
| Futures | | | (2,040,130 | ) | | | — | | | | — | | | | — | |
| Foreign currency translations | | | (101,016 | ) | | | — | | | | — | | | | — | |
| Net Change in Unrealized Appreciation/(Depreciation) on Investments | | | (2,141,146 | ) | | | 1,436,227 | | | | 559,952 | | | | (17,186 | ) |
| | | | | | | | | | | | | | | | | |
| Net Realized and Unrealized Gain (Loss) on Investments | | | 7,861,812 | | | | 8,180,223 | | | | 6,546,328 | | | | (89,878 | ) |
| | | | | | | | | | | | | | | | | |
| Net Increase/(Decrease) in Net Assets Resulting From Operations | | $ | 6,581,270 | | | $ | 9,247,569 | | | $ | 27,343,817 | | | $ | (49,738 | ) |
| | | | | | | | | | | | | | | | | |
| (a) | The Rational Inflation Growth Fund launched August 18, 2021. |
See accompanying notes to consolidated financial statements.
| RATIONAL FUNDS |
| Statements of Changes in Net Assets |
| | | Rational Equity Armor Fund | | | Rational Tactical Return Fund | | | Rational Dynamic Brands Fund | |
| | | | | | | | | | |
| | | Year Ended | | | Year Ended | | | Year Ended | | | Year Ended | | | Year Ended | | | Year Ended | |
| | | December 31, 2021 | | | December 31, 2020 | | | December 31, 2021 | | | December 31, 2020 | | | December 31, 2021 | | | December 31, 2020 | |
| Operations: | | | | | | | | | | | | | | | | | | | | | | | | |
| Net investment income (loss) | | $ | 502,503 | | | $ | 347,932 | | | $ | (5,078,323 | ) | | $ | (3,163,857 | ) | | $ | (732,771 | ) | | $ | (290,828 | ) |
| Net realized gain (loss) on investments, futures and options | | | 4,454,297 | | | | (1,410,495 | ) | | | 14,329,482 | | | | 8,094,845 | | | | 10,553,826 | | | | 10,520,258 | |
| Net change in unrealized appreciation (depreciation) on investments, foreign currency, options and futures | | | 3,914,247 | | | | 6,860,503 | | | | (33,266 | ) | | | (4,908 | ) | | | 1,313,165 | | | | 7,987,040 | |
| Net increase in net assets resulting from operations | | | 8,871,047 | | | | 5,797,940 | | | | 9,217,893 | | | | 4,926,080 | | | | 11,134,220 | | | | 18,216,470 | |
| | | | | | | | | | | | | | | | | | | | | | | | | |
| Distributions to Shareholders from: | | | | | | | | | | | | | | | | | | | | | | | | |
| Total Distributions : | | | | | | | | | | | | | | | | | | | | | | | | |
| Institutional | | | (695,718 | ) | | | (453,360 | ) | | | (9,695,970 | ) | | | (4,130,182 | ) | | | (6,392,799 | ) | | | (5,481,617 | ) |
| Class A | | | (124,680 | ) | | | (105,252 | ) | | | (708,470 | ) | | | (153,641 | ) | | | (2,707,366 | ) | | | (2,718,838 | ) |
| Class C | | | (4,952 | ) | | | (5,581 | ) | | | (350,842 | ) | | | (194,050 | ) | | | (663,584 | ) | | | (248,596 | ) |
| | | | | | | | | | | | | | | | | | | | | | | | | |
| Total distributions to shareholders | | | (825,350 | ) | | | (564,193 | ) | | | (10,755,282 | ) | | | (4,477,873 | ) | | | (9,763,749 | ) | | | (8,449,051 | ) |
| | | | | | | | | | | | | | | | | | | | | | | | | |
| Share Transactions of Beneficial Interest: | | | | | | | | | | | | | | | | | | | | | | | | |
| Net proceeds from shares sold | | | | | | | | | | | | | | | | | | | | | | | | |
| Institutional | | | 20,865,224 | | | | 44,970,883 | | | | 136,008,323 | | | | 191,749,850 | | | | 42,502,657 | | | | 28,554,449 | |
| Class A | | | 650,739 | | | | 2,091,540 | | | | 15,876,211 | | | | 6,172,898 | | | | 5,544,410 | | | | 2,596,224 | |
| Class C | | | 750,631 | | | | 172,712 | | | | 1,641,657 | | | | 3,883,968 | | | | 3,236,037 | | | | 1,197,830 | |
| Reinvestment of distributions | | | | | | | | | | | | | | | | | | | | | | | | |
| Institutional | | | 412,310 | | | | 233,417 | | | | 8,992,274 | | | | 3,914,858 | | | | 6,017,286 | | | | 5,090,472 | |
| Class A | | | 113,225 | | | | 94,487 | | | | 683,615 | | | | 149,294 | | | | 2,626,558 | | | | 2,671,413 | |
| Class C | | | 3,648 | | | | 2,956 | | | | 336,130 | | | | 184,052 | | | | 651,676 | | | | 234,552 | |
| Cost of shares redeemed | | | | | | | | | | | | | | | | | | | | | | | | |
| Institutional | | | (15,151,537 | ) | | | (9,494,876 | ) | | | (79,268,838 | ) | | | (147,243,068 | ) | | | (20,674,521 | ) | | | (9,523,310 | ) |
| Class A | | | (2,487,456 | ) | | | (3,055,029 | ) | | | (5,207,000 | ) | | | (14,008,530 | ) | | | (2,949,599 | ) | | | (2,125,183 | ) |
| Class C | | | (312,522 | ) | | | (404,081 | ) | | | (1,569,740 | ) | | | (1,330,893 | ) | | | (173,601 | ) | | | (63,151 | ) |
| Net increase (decrease) in net assets from share transactions of beneficial interest | | | 4,844,262 | | | | 34,612,009 | | | | 77,492,632 | | | | 43,472,429 | | | | 36,780,903 | | | | 28,633,296 | |
| | | | | | | | | | | | | | | | | | | | | | | | | |
| Total Increase in Net Assets | | | 12,889,959 | | | | 39,845,756 | | | | 75,955,243 | | | | 43,920,636 | | | | 38,151,374 | | | | 38,400,715 | |
| | | | | | | | | | | | | | | | | | | | | | | | | |
| Net Assets: | | | | | | | | | | | | | | | | | | | | | | | | |
| Beginning of period | | | 59,714,489 | | | | 19,868,733 | | | | 216,540,160 | | | | 172,619,524 | | | | 72,598,878 | | | | 34,198,163 | |
| End of period | | $ | 72,604,448 | | | $ | 59,714,489 | | | $ | 292,495,403 | | | $ | 216,540,160 | | | $ | 110,750,252 | | | $ | 72,598,878 | |
| | | | | | | | | | | | | | | | | | | | | | | | | |
| Share Activity: | | | | | | | | | | | | | | | | | | | | | | | | |
| Institutional Class | | | | | | | | | | | | | | | | | | | | | | | | |
| Shares Sold | | | 2,444,483 | | | | 6,038,880 | | | | 23,387,599 | | | | 33,529,962 | | | | 676,341 | | | | 555,404 | |
| Shares Reinvested | | | 47,844 | | | | 30,046 | | | | 1,580,365 | | | | 689,236 | | | | 104,015 | | | | 89,922 | |
| Shares Redeemed | | | (1,769,592 | ) | | | (1,261,579 | ) | | | (13,692,687 | ) | | | (25,764,629 | ) | | | (336,584 | ) | | | (199,858 | ) |
| Net increase in shares of Beneficial interest | | | 722,735 | | | | 4,807,347 | | | | 11,275,277 | | | | 8,454,569 | | | | 443,772 | | | | 445,468 | |
| | | | | | | | | | | | | | | | | | | | | | | | | |
| Class A | | | | | | | | | | | | | | | | | | | | | | | | |
| Shares Sold | | | 77,811 | | | | 282,090 | | | | 2,711,661 | | | | 1,069,707 | | | | 136,048 | | | | 66,023 | |
| Shares Reinvested | | | 13,173 | | | | 12,186 | | | | 119,722 | | | | 26,146 | | | | 72,079 | | | | 71,371 | |
| Shares Redeemed | | | (292,475 | ) | | | (426,210 | ) | | | (894,523 | ) | | | (2,446,070 | ) | | | (72,785 | ) | | | (62,938 | ) |
| Net increase (decrease) in shares of Beneficial interest | | | (201,491 | ) | | | (131,934 | ) | | | 1,936,860 | | | | (1,350,217 | ) | | | 135,342 | | | | 74,456 | |
| | | | | | | | | | | | | | | | | | | | | | | | | |
| Class C | | | | | | | | | | | | | | | | | | | | | | | | |
| Shares Sold | | | 88,587 | | | | 22,902 | | | | 288,092 | | | | 686,028 | | | | 91,014 | | | | 35,459 | |
| Shares Reinvested | | | 426 | | | | 380 | | | | 60,673 | | | | 32,925 | | | | 21,117 | | | | 7,197 | |
| Shares Redeemed | | | (37,918 | ) | | | (57,096 | ) | | | (276,848 | ) | | | (235,139 | ) | | | (4,946 | ) | | | (2,278 | ) |
| Net increase (decrease) in shares of Beneficial interest | | | 51,095 | | | | (33,814 | ) | | | 71,917 | | | | 483,814 | | | | 107,185 | | | | 40,378 | |
| | | | | | | | | | | | | | | | | | | | | | | | | |
See accompanying notes to consolidated financial statements.
| RATIONAL FUNDS |
| Statements of Changes in Net Assets (Continued) |
| | | | | | | | | | | Rational/ReSolve Adaptive | |
| | | Rational Strategic Allocation Fund | | | Asset Allocation Fund | |
| | | | | | (Consolidated) | |
| | | | | | | |
| | | Year Ended | | | Year Ended | | | Year Ended | | | Year Ended | |
| | | December 31, 2021 | | | December 31, 2020 | | | December 31, 2021 | | | December 31, 2020 | |
| Operations: | | | | | | | | | | | | |
| Net investment income (loss) | | $ | 293,287 | | | $ | 232,735 | | | $ | (1,280,542 | ) | | $ | (1,026,697 | ) |
| Distribution of realized gains by investment companies | | | 42,742 | | | | — | | | | — | | | | — | |
| Net realized gain (loss) on investments, affiliated companies foreign currency transactions and futures | | | 2,203,605 | | | | (889,114 | ) | | | 10,002,958 | | | | (2,929,535 | ) |
| Net change in unrealized appreciation (depreciation) on investments, affiliated companies, foreign currency transactions and futures | | | 21,331 | | | | 162,176 | | | | (2,141,146 | ) | | | 4,280,789 | |
| Net increase (decrease) in net assets resulting from operations | | | 2,560,965 | | | | (494,203 | ) | | | 6,581,270 | | | | 324,557 | |
| | | | | | | | | | | | | | | | | |
| Distributions to Shareholders: | | | | | | | | | | | | | | | | |
| From return of capital: | | | | | | | | | | | | | | | | |
| Institutional | | | — | | | | (564 | ) | | | — | | | | (88,954 | ) |
| Class A | | | — | | | | (18,057 | ) | | | — | | | | — | |
| Class C | | | — | | | | (2 | ) | | | — | | | | — | |
| Total Distributions Paid : | | | | | | | | | | | | | | | | |
| Institutional | | | (80,151 | ) | | | (7,668 | ) | | | (8,743,313 | ) | | | (205,777 | ) |
| Class A | | | (1,355,722 | ) | | | (225,046 | ) | | | (84,747 | ) | | | — | |
| Class C | | | (171 | ) | | | (21 | ) | | | (37,149 | ) | | | — | |
| | | | | | | | | | | | | | | | | |
| Total distributions to shareholders | | | (1,436,044 | ) | | | (251,358 | ) | | | (8,865,209 | ) | | | (294,731 | ) |
| | | | | | | | | | | | | | | | | |
| Share Transactions of Beneficial Interest: | | | | | | | | | | | | | | | | |
| Net proceeds from shares sold | | | | | | | | | | | | | | | | |
| Institutional | | | 250,000 | | | | — | | | | 32,962,809 | | | | 34,738,337 | |
| Class A | | | 854,083 | | | | 44,999 | | | | 107,690 | | | | 9,754,139 | |
| Class C | | | — | | | | — | | | | 3,600 | | | | 31,295 | |
| Reinvestment of distributions | | | | | | | | | | | | | | | | |
| Institutional | | | — | | | | — | | | | 7,186,351 | | | | 245,746 | |
| Class A | | | 1,239,373 | | | | 235,629 | | | | 84,747 | | | | — | |
| Class C | | | — | | | | — | | | | 9,973 | | | | — | |
| Cost of shares redeemed | | | | | | | | | | | | | | | | |
| Institutional | | | — | | | | — | | | | (35,187,481 | ) | | | (24,056,010 | ) |
| Class A | | | (1,080,494 | ) | | | (1,234,592 | ) | | | (338,550 | ) | | | (14,414,075 | ) |
| Class C | | | — | | | | — | | | | (11,100 | ) | | | (210,779 | ) |
| Net increase (decrease) in net assets from share transactions of beneficial interest | | | 1,262,962 | | | | (953,964 | ) | | | 4,818,039 | | | | 6,088,653 | |
| | | | | | | | | | | | | | | | | |
| Total Increase (Decrease) in Net Assets | | | 2,387,883 | | | | (1,699,525 | ) | | | 2,534,100 | | | | 6,118,479 | |
| | | | | | | | | | | | | | | | | |
| Net Assets: | | | | | | | | | | | | | | | | |
| Beginning of period | | | 7,962,029 | | | | 9,661,554 | | | | 63,202,818 | | | | 57,084,339 | |
| End of period | | $ | 10,349,912 | | | $ | 7,962,029 | | | $ | 65,736,918 | | | $ | 63,202,818 | |
| | | | | | | | | | | | | | | | | |
| Share Activity: | | | | | | | | | | | | | | | | |
| Institutional Class Shares Sold | | | 22,935 | | | | — | | | | 1,306,885 | | | | 1,494,929 | |
| Shares Reinvested | | | — | | | | — | | | | 317,980 | | | | 10,506 | |
| Shares Redeemed | | | — | | | | — | | | | (1,383,853 | ) | | | (1,047,952 | ) |
| Net increase in shares of Beneficial interest | | | 22,935 | | | | — | | | | 241,012 | | | | 457,483 | |
| | | | | | | | | | | | | | | | | |
| Class A | | | | | | | | | | | | | | | | |
| Shares Sold | | | 77,863 | | | | 5,447 | | | | 4,194 | | | | 407,554 | |
| Shares Reinvested | | | 123,693 | | | | 29,250 | | | | 3,780 | | | | — | |
| Shares Redeemed | | | (105,419 | ) | | | (152,303 | ) | | | (13,923 | ) | | | (605,271 | ) |
| Net increase/(decrease) in shares of Beneficial interest | | | 96,137 | | | | (117,606 | ) | | | (5,949 | ) | | | (197,717 | ) |
| | | | | | | | | | | | | | | | | |
| Class C | | | | | | | | | | | | | | | | |
| Shares Sold | | | — | | | | — | | | | 147 | | | | 1,382 | |
| Shares Reinvested | | | — | | | | — | | | | 458 | | | | — | |
| Shares Redeemed | | | — | | | | — | | | | (487 | ) | | | (9,460 | ) |
| Net increase/(decrease) in shares of Beneficial interest | | | — | | | | — | | | | 118 | | | | (8,078 | ) |
| | | | | | | | | | | | | | | | | |
See accompanying notes to consolidated financial statements.
| RATIONAL FUNDS |
| Statements of Changes in Net Assets (Continued) |
| | | | | | | | | | | | | | | Rational Inflation | |
| | | Rational/ Pier 88 Convertible Securities Fund | | | Rational Special Situations Income Fund | | | Growth Fund (a) | |
| | | | | | | | | | | | | | | | |
| | | Year Ended | | | Year Ended | | | Year Ended | | | Year Ended | | | Period Ended | |
| | | December 31, 2021 | | | December 31, 2020 | | | December 31, 2021 | | | December 31, 2020 | | | December 31, 2021 | |
| Operations: | | | | | | | | | | | | | | | | | | | | |
| Net investment income | | $ | 1,067,346 | | | $ | 967,798 | | | $ | 20,797,489 | | | $ | 5,782,835 | | | $ | 40,140 | |
| Net realized gain (loss) on investments | | | 6,743,996 | | | | 685,976 | | | | 5,986,376 | | | | 241,732 | | | | (72,692 | ) |
| Net change in unrealized appreciation (depreciation) on investments | | | 1,436,227 | | | | 7,676,411 | | | | 559,952 | | | | 4,315,358 | | | | (17,186 | ) |
| Net increase/(decrease) in net assets resulting from operations | | | 9,247,569 | | | | 9,330,185 | | | | 27,343,817 | | | | 10,339,925 | | | | (49,738 | ) |
| | | | | | | | | | | | | | | | | | | | | |
| Distributions to Shareholders: | | | | | | | | | | | | | | | | | | | | |
| From return of capital: | | | | | | | | | | | | | | | | | | | | |
| Institutional Class | | | — | | | | — | | | | (20,093 | ) | | | (549,867 | ) | | | — | |
| Class A | | | — | | | | — | | | | (2,024 | ) | | | (56,508 | ) | | | — | |
| Class C | | | — | | | | — | | | | (1,059 | ) | | | (16,854 | ) | | | — | |
| Total Distributions : | | | | | | | | | | | | | | | | | | | | |
| Institutional | | | (8,210,628 | ) | | | (1,243,586 | ) | | | (24,923,652 | ) | | | (11,887,080 | ) | | | (10,107 | ) |
| Class A | | | (348,029 | ) | | | (4,253 | ) | | | (2,364,197 | ) | | | (1,173,195 | ) | | | (5,164 | ) |
| Class C | | | (15,734 | ) | | | (623 | ) | | | (1,074,235 | ) | | | (311,996 | ) | | | (191 | ) |
| | | | | | | | | | | | | | | | | | | | | |
| Total distributions to shareholders | | | (8,574,391 | ) | | | (1,248,462 | ) | | | (28,385,260 | ) | | | (13,995,500 | ) | | | (15,462 | ) |
| | | | | | | | | | | | | | | | | | | | | |
| Share Transactions of Beneficial Interest: | | | | | | | | | | | | | | | | | | | | |
| Net proceeds from shares sold | | | | | | | | | | | | | | | | | | | | |
| Institutional | | | 45,959,654 | | | | 65,326,825 | | | | 444,790,373 | | | | 359,188,223 | | | | 1,384,379 | |
| Class A | | | 5,031,959 | | | | 348,047 | | | | 35,690,230 | | | | 37,959,162 | | | | 728,711 | |
| Class C | | | 182,100 | | | | 50,000 | | | | 23,289,704 | | | | 13,980,430 | | | | 25,149 | |
| Reinvestment of distributions | | | | | | | | | | | | | | | | | | | | |
| Institutional | | | 2,931,508 | | | | 177,486 | | | | 21,004,850 | | | | 9,575,043 | | | | 6,483 | |
| Class A | | | 314,092 | | | | 4,253 | | | | 2,001,003 | | | | 1,047,397 | | | | 4,525 | |
| Class C | | | 15,734 | | | | 623 | | | | 882,571 | | | | 272,495 | | | | 7 | |
| Cost of shares redeemed | | | | | | | | | | | | | | | | | | | | |
| Institutional | | | (5,230,173 | ) | | | (5,326,333 | ) | | | (147,524,386 | ) | | | (89,158,528 | ) | | | (2,193 | ) |
| Class A | | | (3,402,079 | ) | | | (31,969 | ) | | | (16,690,058 | ) | | | (7,198,360 | ) | | | — | |
| Class C | | | — | | | | — | | | | (2,702,773 | ) | | | (1,342,540 | ) | | | — | |
| Net increase in net assets from share transactions of beneficial interest | | | 45,802,795 | | | | 60,548,932 | | | | 360,741,514 | | | | 324,323,322 | | | | 2,147,061 | |
| | | | | | | | | | | | | | | | | | | | | |
| Total Increase in Net Assets | | | 46,475,973 | | | | 68,630,655 | | | | 359,700,071 | | | | 320,667,747 | | | | 2,081,861 | |
| | | | | | | | | | | | | | | | | | | | | |
| Net Assets: | | | | | | | | | | | | | | | | | | | | |
| Beginning of period | | | 74,337,661 | | | | 5,707,006 | | | | 404,238,921 | | | | 83,571,174 | | | | — | |
| End of period | | $ | 120,813,634 | | | $ | 74,337,661 | | | $ | 763,938,992 | | | $ | 404,238,921 | | | $ | 2,081,861 | |
| | | | | | | | | | | | | | | | | | | | | |
| Share Activity: | | | | | | | | | | | | | | | | | | | | |
| Institutional | | | | | | | | | | | | | | | | | | | | |
| Shares Sold | | | 3,747,781 | | | | 6,322,918 | | | | 22,491,468 | | | | 18,243,801 | | | | 138,301 | |
| Shares Reinvested | | | 247,587 | | | | 15,655 | | | | 1,064,410 | | | | 489,738 | | | | 663 | |
| Shares Redeemed | | | (427,027 | ) | | | (571,547 | ) | | | (7,459,838 | ) | | | (4,604,174 | ) | | | (224 | ) |
| Net increase in shares of Beneficial interest | | | 3,568,341 | | | | 5,767,026 | | | | 16,096,040 | | | | 14,129,365 | | | | 138,740 | |
| | | | | | | | | | | | | | | | | | | | | |
| Class A | | | | | | | | | | | | | | | | | | | | |
| Shares Sold | | | 417,885 | | | | 31,516 | | | | 1,806,173 | | | | 1,937,859 | | | | 70,656 | |
| Shares Reinvested | | | 26,625 | | | | 374 | | | | 101,502 | | | | 53,707 | | | | 463 | |
| Shares Redeemed | | | (286,961 | ) | | | (3,069 | ) | | | (845,343 | ) | | | (367,362 | ) | | | — | |
| Net increase in shares of Beneficial interest | | | 157,549 | | | | 28,821 | | | | 1,062,332 | | | | 1,624,204 | | | | 71,119 | |
| | | | | | | | | | | | | | | | | | | | | |
| Class C | | | | | | | | | | | | | | | | | | | | |
| Shares Sold | | | 14,914 | | | | 4,622 | | | | 1,181,532 | | | | 711,234 | | | | 2,623 | |
| Shares Reinvested | | | 1,340 | | | | 55 | | | | 44,876 | | | | 13,986 | | | | 1 | |
| Shares Redeemed | | | — | | | | — | | | | (137,204 | ) | | | (68,807 | ) | | | — | |
| Net increase in shares of Beneficial interest | | | 16,254 | | | | 4,677 | | | | 1,089,204 | | | | 656,413 | | | | 2,624 | |
| | | | | | | | | | | | | | | | | | | | | |
| (a) | The Rational Inflation Growth Fund launched August 18, 2021. |
See accompanying notes to consolidated financial statements.
| RATIONAL FUNDS |
| Rational Equity Armor Fund |
| Financial Highlights |
| |
| For a Share Outstanding Throughout Each Year |
| | | Institutional | |
| | | For the | | | For the | | | For the | | | For the | | | For the | |
| | | Year Ended | | | Year Ended | | | Year Ended | | | Year Ended | | | Year Ended | |
| | | December 31, | | | December 31, | | | December 31, | | | December 31, | | | December 31, | |
| | | 2021 | | | 2020 | | | 2019 | | | 2018 | | | 2017 | |
| Net asset value, beginning of year | | $ | 7.96 | | | $ | 6.94 | | | $ | 6.58 | | | $ | 8.02 | | | $ | 8.64 | |
| | | | | | | | | | | | | | | | | | | | | |
| INCOME (LOSS) FROM INVESTMENT OPERATIONS: | | | | | | | | | | | | | | | | | | | | |
| Net investment income (A) | | | 0.07 | | | | 0.08 | | | | 0.22 | | | | 0.34 | | | | 0.30 | |
| Net realized and unrealized gain (loss) on investments | | | 1.07 | | | | 1.03 | | | | 0.51 | | | | (1.26 | ) | | | (0.47 | ) |
| Total from investment operations | | | 1.14 | | | | 1.11 | | | | 0.73 | | | | (0.92 | ) | | | (0.17 | ) |
| | | | | | | | | | | | | | | | | | | | | |
| LESS DISTRIBUTIONS: | | | | | | | | | | | | | | | | | | | | |
| From net investment income | | | (0.11 | ) | | | (0.09 | ) | | | (0.37 | ) | | | (0.52 | ) | | | (0.45 | ) |
| From net realized gains on investments | | | — | | | | — | | | | — | | | | — | | | | — | |
| Total distributions | | | (0.11 | ) | | | (0.09 | ) | | | (0.37 | ) | | | (0.52 | ) | | | (0.45 | ) |
| | | | | | | | | | | | | | | | | | | | | |
| Net asset value, end of year | | $ | 8.99 | | | $ | 7.96 | | | $ | 6.94 | | | $ | 6.58 | | | $ | 8.02 | |
| | | | | | | | | | | | | | | | | | | | | |
| Total return (B) | | | 14.37 | % (E) | | | 16.00 | % (E) | | | 11.32 | % | | | (11.96 | )% | | | (1.99 | )% |
| | | | | | | | | | | | | | | | | | | | | |
| RATIOS/SUPPLEMENTAL DATA: | | | | | | | | | | | | | | | | | | | | |
| Net assets, end of year (in 000’s) | | $ | 58,975 | | | $ | 46,451 | | | $ | 7,155 | | | $ | 4,940 | | | $ | 12,188 | |
| Ratios to average net assets (including interest expense) | | | | | | | | | | | | | | | | | | | | |
| Expenses, before waiver and reimbursement (C) | | | 1.15 | % | | | 1.32 | % | | | 1.75 | % | | | 1.58 | % | | | 1.33 | % |
| Expenses, net waiver and reimbursement (C) | | | 1.10 | % | | | 1.01 | % | | | 1.00 | % | | | 1.00 | % | | | 1.00 | % |
| Net investment income | | | 0.80 | % | | | 1.10 | % | | | 3.12 | % | | | 4.32 | % | | | 3.53 | % |
| Portfolio turnover rate | | | 239 | % | | | 480 | % | | | 394 | % | | | 307 | % | | | 224 | % |
| | | | | | | | | | | | | | | | | | | | | |
| | | Class A | |
| | | For the | | | For the | | | For the | | | For the | | | For the | |
| | | Year Ended | | | Year Ended | | | Year Ended | | | Year Ended | | | Year Ended | |
| | | December 31, | | | December 31, | | | December 31, | | | December 31, | | | December 31, | |
| | | 2021 | | | 2020 | | | 2019 | | | 2018 | | | 2018 | |
| Net asset value, beginning of year | | $ | 7.95 | | | $ | 6.93 | | | $ | 6.57 | | | $ | 8.01 | | | $ | 8.63 | |
| | | | | | | | | | | | | | | | | | | | | |
| INCOME (LOSS) FROM INVESTMENT OPERATIONS: | | | | | | | | | | | | | | | | | | | | |
| Net investment income (A) | | | 0.05 | | | | 0.04 | | | | 0.20 | | | | 0.32 | | | | 0.30 | |
| Net realized and unrealized gain (loss) on investments | | | 1.07 | | | | 1.05 | | | | 0.51 | | | | (1.26 | ) | | | (0.49 | ) |
| Total from investment operations | | | 1.12 | | | | 1.09 | | | | 0.71 | | | | (0.94 | ) | | | (0.19 | ) |
| | | | | | | | | | | | | | | | | | | | | |
| LESS DISTRIBUTIONS: | | | | | | | | | | | | | | | | | | | | |
| From net investment income | | | (0.09 | ) | | | (0.07 | ) | | | (0.35 | ) | | | (0.50 | ) | | | (0.43 | ) |
| From net realized gains on investments | | | — | | | | — | | | | — | | | | — | | | | — | |
| Total distributions | | | (0.09 | ) | | | (0.07 | ) | | | (0.35 | ) | | | (0.50 | ) | | | (0.43 | ) |
| | | | | | | | | | | | | | | | | | | | | |
| Net asset value, end of year | | $ | 8.98 | | | $ | 7.95 | | | $ | 6.93 | | | $ | 6.57 | | | $ | 8.01 | |
| | | | | | | | | | | | | | | | | | | | | |
| Total return (B) | | | 14.11 | % | | | 15.74 | % | | | 11.03 | % | | | (12.22 | )% | | | (2.24 | )% |
| | | | | | | | | | | | | | | | | | | | | |
| RATIOS/SUPPLEMENTAL DATA: | | | | | | | | | | | | | | | | | | | | |
| Net assets, end of year (in 000’s) | | $ | 11,858 | | | $ | 12,099 | | | $ | 11,462 | | | $ | 12,629 | | | $ | 20,327 | |
| Ratios to average net assets (including interest expense) | | | | | | | | | | | | | | | | | | | | |
| Expenses, before waiver and reimbursement (D) | | | 1.40 | % | | | 1.69 | % | | | 2.00 | % | | | 1.82 | % | | | 1.57 | % |
| Expenses, net waiver and reimbursement (D) | | | 1.35 | % | | | 1.26 | % | | | 1.25 | % | | | 1.25 | % | | | 1.25 | % |
| Net investment income | | | 0.55 | % | | | 0.58 | % | | | 2.90 | % | | | 4.17 | % | | | 3.52 | % |
| Portfolio turnover rate | | | 239 | % | | | 480 | % | | | 394 | % | | | 307 | % | | | 224 | % |
| | | | | | | | | | | | | | | | | | | | | |
| (A) | Per share amounts calculated using average shares method, which more appropriately presents the per share data for the year. |
| (B) | Total return in the above table represents the rate that the investor would have earned or lost on an investment in the Fund assuming reinvestment of dividends and does not reflect the impact of sales charges. Had the Advisor not waived its fees and reimbursed expenses, total return would have been lower. |
| (C) | Ratios to average net assets (excluding interest expense) |
| Expenses, before waiver and reimbursement | | | 1.15 | % | | | 1.31 | % | | | 1.75 | % | | | 1.58 | % | | | 1.33 | % |
| Expenses, net waiver and reimbursement | | | 1.10 | % | | | 1.00 | % | | | 1.00 | % | | | 1.00 | % | | | 1.00 | % |
| | | | | | | | | | | | | | | | | | | | | |
| (D) | Ratios to average net assets (excluding interest expense) |
| Expenses, before waiver and reimbursement | | | 1.40 | % | | | 1.68 | % | | | 2.00 | % | | | 1.82 | % | | | 1.57 | % |
| Expenses, net waiver and reimbursement | | | 1.35 | % | | | 1.25 | % | | | 1.25 | % | | | 1.25 | % | | | 1.25 | % |
| | | | | | | | | | | | | | | | | | | | | |
| (E) | Includes adjustments in accordance with accounting principles generally accepted in the United States and, consequently, the net asset value for financial reporting purposes and the returns based upon those net asset values may differ from the net asset values and returns for shareholder transactions. |
See accompanying notes to financial statements.
| RATIONAL FUNDS |
| Rational Equity Armor Fund (Continued) |
| Financial Highlights |
| |
| For a Share Outstanding Throughout Each Year |
| | | Class C | |
| | | For the | | | For the | | | For the | | | For the | | | For the | |
| | | Year Ended | | | Year Ended | | | Year Ended | | | Year Ended | | | Year Ended | |
| | | December 31, | | | December 31, | | | December 31, | | | December 31, | | | December 31, | |
| | | 2021 | | | 2020 | | | 2019 | | | 2018 | | | 2017 | |
| Net asset value, beginning of year | | $ | 7.90 | | | $ | 6.91 | | | $ | 6.55 | | | $ | 7.99 | | | $ | 8.61 | |
| | | | | | | | | | | | | | | | | | | | | |
| INCOME (LOSS) FROM INVESTMENT OPERATIONS: | | | | | | | | | | | | | | | | | | | | |
| Net investment income (loss) (A) | | | (0.01 | ) | | | (0.01 | ) | | | 0.15 | | | | 0.27 | | | | 0.29 | |
| Net realized and unrealized gain (loss) on investments | | | 1.07 | | | | 1.04 | | | | 0.51 | | | | (1.27 | ) | | | (0.52 | ) |
| Total from investment operations | | | 1.06 | | | | 1.03 | | | | 0.66 | | | | (1.00 | ) | | | (0.23 | ) |
| | | | | | | | | | | | | | | | | | | | | |
| LESS DISTRIBUTIONS: | | | | | | | | | | | | | | | | | | | | |
| From net investment income | | | (0.03 | ) | | | (0.04 | ) | | | (0.30 | ) | | | (0.44 | ) | | | (0.39 | ) |
| From net realized gains on investments | | | — | | | | — | | | | — | | | | — | | | | — | |
| Total distributions | | | (0.03 | ) | | | (0.04 | ) | | | (0.30 | ) | | | (0.44 | ) | | | (0.39 | ) |
| | | | | | | | | | | | | | | | | | | | | |
| Net asset value, end of year | | $ | 8.93 | | | $ | 7.90 | | | $ | 6.91 | | | $ | 6.55 | | | $ | 7.99 | |
| | | | | | | | | | | | | | | | | | | | | |
| Total return (B) | | | 13.40 | % | | | 14.88 | % | | | 10.23 | % (C) | | | (12.92 | )% (C) | | | (2.68 | )% |
| | | | | | | | | | | | | | | | | | | | | |
| RATIOS/SUPPLEMENTAL DATA: | | | | | | | | | | | | | | | | | | | | |
| Net assets, end of year (in 000’s) | | $ | 1,771 | | | $ | 1,164 | | | $ | 1,252 | | | $ | 1,664 | | | $ | 2,799 | |
| Ratios to average net assets (including interest expense) | | | | | | | | | | | | | | | | | | | | |
| Expenses, before waiver and reimbursement (D) | | | 2.15 | % | | | 2.39 | % | | | 2.75 | % | | | 2.59 | % | | | 2.31 | % |
| Expenses, net waiver and reimbursement (D) | | | 2.06 | % | | | 2.01 | % | | | 2.00 | % | | | 1.90 | % | | | 1.75 | % |
| Net investment income (loss) | | | (0.16 | )% | | | (0.18 | )% | | | 2.16 | % | | | 3.52 | % | | | 3.50 | % |
| Portfolio turnover rate | | | 239 | % | | | 480 | % | | | 394 | % | | | 307 | % | | | 224 | % |
| | | | | | | | | | | | | | | | | | | | | |
| (A) | Per share amounts calculated using average shares method, which more appropriately presents the per share data for the year. |
| (B) | Total return in the above table represents the rate that the investor would have earned or lost on an investment in the Fund assuming reinvestment of dividends. Had the Advisor not waived its fees and reimbursed expenses, total return would have been lower. |
| (C) | Includes adjustments in accordance with accounting principles generally accepted in the United States and, consequently, the net asset value for financial reporting purposes and the returns based upon those net asset values may differ from the net asset values and returns for shareholder transactions. |
| (D) | Ratios to average net assets (excluding interest expense) |
| Expenses, before waiver and reimbursement | | | 2.14 | % | | | 2.38 | % | | | 2.75 | % | | | 2.59 | % | | | 2.31 | % |
| Expenses, net waiver and reimbursement | | | 2.06 | % | | | 2.00 | % | | | 2.00 | % | | | 1.90 | % | | | 1.75 | % |
| | | | | | | | | | | | | | | | | | | | | |
See accompanying notes to financial statements.
| RATIONAL FUNDS |
| Rational Tactical Return Fund |
| Financial Highlights |
| |
| For a Share Outstanding Throughout Each Year |
| | | Institutional | |
| | | For the | | | For the | | | For the | | | For the | | | For the | |
| | | Year Ended | | | Year Ended | | | Year Ended | | | Year Ended | | | Year Ended | |
| | | December 31, | | | December 31, | | | December 31, | | | December 31, | | | December 31, | |
| | | 2021 | | | 2020 | | | 2019 | | | 2018 | | | 2017 | |
| Net asset value, beginning of year | | $ | 5.69 | | | $ | 5.66 | | | $ | 5.40 | | | $ | 4.99 | | | $ | 5.12 | |
| | | | | | | | | | | | | | | | | | | | | |
| INCOME (LOSS) FROM INVESTMENT OPERATIONS: | | | | | | | | | | | | | | | | | | | | |
| Net investment income (loss) (A) | | | (0.11 | ) | | | (0.09 | ) | | | (0.01 | ) | | | (0.06 | ) | | | 0.01 | |
| Net realized and unrealized gain on investments | | | 0.33 | | | | 0.24 | | | | 0.46 | | | | 0.55 | | | | 0.14 | |
| Total from investment operations | | | 0.22 | | | | 0.15 | | | | 0.45 | | | | 0.49 | | | | 0.15 | |
| | | | | | | | | | | | | | | | | | | | | |
| LESS DISTRIBUTIONS: | | | | | | | | | | | | | | | | | | | | |
| From net investment income | | | — | | | | — | | | | — | | | | (0.01 | ) | | | (0.28 | ) |
| From net realized gains on investments | | | (0.21 | ) | | | (0.12 | ) | | | (0.19 | ) | | | (0.07 | ) | | | — | |
| Total distributions | | | (0.21 | ) | | | (0.12 | ) | | | (0.19 | ) | | | (0.08 | ) | | | (0.28 | ) |
| | | | | | | | | | | | | | | | | | | | | |
| Net asset value, end of year | | $ | 5.70 | | | $ | 5.69 | | | $ | 5.66 | | | $ | 5.40 | | | $ | 4.99 | |
| | | | | | | | | | | | | | | | | | | | | |
| Total return (B) | | | 3.94 | % | | | 2.65 | % | | | 8.35 | % | | | 9.66 | % | | | 2.89 | % (C) |
| | | | | | | | | | | | | | | | | | | | | |
| RATIOS/SUPPLEMENTAL DATA: | | | | | | | | | | | | | | | | | | | | |
| Net assets, end of year (in 000’s) | | $ | 264,557 | | | $ | 199,987 | | | $ | 151,070 | | | $ | 18,333 | | | $ | 5,451 | |
| Ratios to average net assets (including interest expense) | | | | | | | | | | | | | | | | | | | | |
| Expenses, before waiver and reimbursement (E) | | | 2.04 | % | | | 2.05 | % | | | 2.15 | % | | | 3.16 | % | | | 4.29 | % |
| Expenses, net waiver and reimbursement (E) | | | 1.99 | % | | | 1.99 | % | | | 1.99 | % | | | 1.99 | % | | | 1.17 | % |
| Net investment income (loss) | | | (1.98 | )% | | | (1.54 | )% | | | (0.15 | )% | | | (1.20 | )% | | | 0.22 | % |
| Portfolio turnover rate | | | 0 | % | | | 0 | % | | | 0 | % | | | 0 | % | | | 199 | % |
| | | | | | | | | | | | | | | | | | | | | |
| | | Class A | |
| | | For the | | | For the | | | For the | | | For the | | | For the | |
| | | Year Ended | | | Year Ended | | | Year Ended | | | Year Ended | | | Year Ended | |
| | | December 31, | | | December 31, | | | December 31, | | | December 31, | | | December 31, | |
| | | 2021 | | | 2020 | | | 2019 | | | 2018 | | | 2017 | |
| | | $ | 5.72 | | | $ | 5.70 | | | $ | 5.45 | | | $ | 5.04 | | | $ | 5.16 | |
| Net asset value, beginning of year | | | | | | | | | | | | | | | | | | | | |
| | | | | | | | | | | | | | | | | | | | | |
| INCOME (LOSS) FROM INVESTMENT OPERATIONS: | | | | | | | | | | | | | | | | | | | | |
| Net investment income (loss) (A) | | | (0.13 | ) | | | (0.09 | ) | | | (0.02 | ) | | | (0.07 | ) | | | 0.01 | |
| Net realized and unrealized gain on investments | | | 0.34 | | | | 0.23 | | | | 0.46 | | | | 0.55 | | | | 0.14 | |
| Total from investment operations | | | 0.21 | | | | 0.14 | | | | 0.44 | | | | 0.48 | | | | 0.15 | |
| | | | | | | | | | | | | | | | | | | | | |
| LESS DISTRIBUTIONS: | | | | | | | | | | | | | | | | | | | | |
| From net investment income | | | — | | | | — | | | | — | | | | (0.00 | ) (D) | | | (0.27 | ) |
| From net realized gains on investments | | | (0.21 | ) | | | (0.12 | ) | | | (0.19 | ) | | | (0.07 | ) | | | — | |
| Total distributions | | | (0.21 | ) | | | (0.12 | ) | | | (0.19 | ) | | | (0.07 | ) | | | (0.27 | ) |
| | | | | | | | | | | | | | | | | | | | | |
| Net asset value, end of year | | $ | 5.72 | | | $ | 5.72 | | | $ | 5.70 | | | $ | 5.45 | | | $ | 5.04 | |
| | | | | | | | | | | | | | | | | | | | | |
| Total return (B) | | | 3.75 | % | | | 2.45 | % | | | 8.09 | % | | | 9.45 | % | | | 2.98 | % (C) |
| | | | | | | | | | | | | | | | | | | | | |
| RATIOS/SUPPLEMENTAL DATA: | | | | | | | | | | | | | | | | | | | | |
| Net assets, end of year (in 000’s) | | $ | 18,494 | | | $ | 7,423 | | | $ | 15,097 | | | $ | 18,327 | | | $ | 449 | |
| Ratios to average net assets (including interest expense) | | | | | | | | | | | | | | | | | | | | |
| Expenses, before waiver and reimbursement (F) | | | 2.29 | % | | | 2.33 | % | | | 2.51 | % | | | 3.50 | % | | | 4.54 | % |
| Expenses, net waiver and reimbursement (F) | | | 2.24 | % | | | 2.24 | % | | | 2.24 | % | | | 2.24 | % | | | 1.35 | % |
| Net investment income (loss) | | | (2.23 | )% | | | (1.64 | )% | | | (0.31 | )% | | | (1.20 | )% | | | 0.19 | % |
| Portfolio turnover rate | | | 0 | % | | | 0 | % | | | 0 | % | | | 0 | % | | | 199 | % |
| | | | | | | | | | | | | | | | | | | | | |
| (A) | Per share amounts calculated using average shares method, which more appropriately presents the per share data for the year. |
| (B) | Total return in the above table represents the rate that the investor would have earned or lost on an investment in the Fund assuming reinvestment of dividends and does not reflect the impact of sales charges. Had the Advisor not waived its fees and reimbursed expenses, total return would have been lower. |
| (C) | Includes adjustments in accordance with accounting principles generally accepted in the United States and, consequently, the net asset value for financial reporting purposes and the returns based upon those net asset values may differ from the net asset values and returns for shareholder transactions. |
| (D) | Amount is less than $0.005. |
| (E) | Ratios to average net assets (excluding interest expense) |
| Expenses, before waiver and reimbursement | | | 2.04 | % | | | 2.05 | % | | | 2.51 | % | | | 3.50 | % | | | 4.54 | % |
| Expenses, net waiver and reimbursement | | | 1.99 | % | | | 1.99 | % | | | 2.24 | % | | | 2.24 | % | | | 1.35 | % |
| | | | | | | | | | | | | | | | | | | | | |
| (F) | Ratios to average net assets (excluding interest expense) |
| Expenses, before waiver and reimbursement | | | 2.29 | % | | | 2.33 | % | | | 2.51 | % | | | 3.50 | % | | | 4.54 | % |
| Expenses, net waiver and reimbursement | | | 2.24 | % | | | 2.24 | % | | | 2.24 | % | | | 2.24 | % | | | 1.35 | % |
| | | | | | | | | | | | | | | | | | | | | |
See accompanying notes to financial statements.
| RATIONAL FUNDS |
| Rational Tactical Return Fund (Continued) |
| Financial Highlights |
| |
| For a Share Outstanding Throughout Each Year |
| | | Class C | |
| | | For the | | | For the | | | For the | | | For the | | | For the | |
| | | Year Ended | | | Year Ended | | | Year Ended | | | Year Ended | | | Year Ended | |
| | | December 31, | | | December 31, | | | December 31, | | | December 31, | | | December 31, | |
| | | 2021 | | | 2020 | | | 2019 | | | 2018 | | | 2017 | |
| Net asset value, beginning of year | | $ | 5.60 | | | $ | 5.62 | | | $ | 5.43 | | | $ | 5.06 | | | $ | 5.16 | |
| | | | | | | | | | | | | | | | | | | | | |
| INCOME (LOSS) FROM INVESTMENT OPERATIONS: | | | | | | | | | | | | | | | | | | | | |
| Net investment loss (A) | | | (0.17 | ) | | | (0.14 | ) | | | (0.07 | ) | | | (0.12 | ) | | | (0.03 | ) |
| Net realized and unrealized gain on investments | | | 0.33 | | | | 0.24 | | | | 0.45 | | | | 0.56 | | | | 0.15 | |
| Total from investment operations | | | 0.16 | | | | 0.10 | | | | 0.38 | | | | 0.44 | | | | 0.12 | |
| | | | | | | | | | | | | | | | | | | | | |
| LESS DISTRIBUTIONS: | | | | | | | | | | | | | | | | | | | | |
| From net investment income | | | — | | | | — | | | | — | | | | — | | | | (0.22 | ) |
| From net realized gains on investments | | | (0.21 | ) | | | (0.12 | ) | | | (0.19 | ) | | | (0.07 | ) | | | — | |
| Total distributions | | | (0.21 | ) | | | (0.12 | ) | | | (0.19 | ) | | | (0.07 | ) | | | (0.22 | ) |
| | | | | | | | | | | | | | | | | | | | | |
| Net assets, end of year (in 000’s) | | $ | 5.55 | | | $ | 5.60 | | | $ | 5.62 | | | $ | 5.43 | | | $ | 5.06 | |
| | | | | | | | | | | | | | | | | | | | | |
| Total return (B) | | | 2.94 | % | | | 1.77 | % | | | 7.01 | % | | | 8.62 | % | | | 2.42 | % (C) |
| | | | | | | | | | | | | | | | | | | | | |
| RATIOS/SUPPLEMENTAL DATA: | | | | | | | | | | | | | | | | | | | | |
| Net assets, end of year (in 000’s) | | $ | 9,444 | | | $ | 9,130 | | | $ | 6,453 | | | $ | 1 | | | $ | 1 | |
| Ratios to average net assets (including interest expense) | | | | | | | | | | | | | | | | | | | | |
| Expenses, before waiver and reimbursement (D) | | | 3.00 | % | | | 3.04 | % | | | 3.11 | % | | | 4.16 | % | | | 5.29 | % |
| Expenses, net waiver and reimbursement (D) | | | 2.99 | % | | | 2.99 | % | | | 2.99 | % | | | 2.99 | % | | | 2.17 | % |
| Net investment loss | | | (2.98 | )% | | | (2.54 | )% | | | (1.18 | )% | | | (2.34 | )% | | | (0.53 | )% |
| Portfolio turnover rate | | | 0 | % | | | 0 | % | | | 0 | % | | | 0 | % | | | 199 | % |
| | | | | | | | | | | | | | | | | | | | | |
| (A) | Per share amounts calculated using average shares method, which more appropriately presents the per share data for the year. |
| (B) | Total return in the above table represents the rate that the investor would have earned or lost on an investment in the Fund assuming reinvestment of dividends. Had the Advisor not waived its fees and reimbursed expenses, total return would have been lower. |
| (C) | Includes adjustments in accordance with accounting principles generally accepted in the United States and, consequently, the net asset value for financial reporting purposes and the returns based upon those net asset values may differ from the net asset values and returns for shareholder transactions. |
| (D) | Ratios to average net assets (excluding interest expense) |
| Expenses, before waiver and reimbursement | | | 3.00 | % | | | 3.04 | % | | | 3.11 | % | | | 4.16 | % | | | 5.29 | % |
| Expenses, net waiver and reimbursement | | | 2.99 | % | | | 2.99 | % | | | 2.99 | % | | | 2.99 | % | | | 2.17 | % |
| | | | | | | | | | | | | | | | | | | | | |
See accompanying notes to financial statements.
| RATIONAL FUNDS |
| Rational Dynamic Brands Fund |
| Financial Highlights |
| |
| For a Share Outstanding Throughout Each Year |
| | | Institutional | |
| | | For the | | | For the | | | For the | | | For the | | | For the | |
| | | Year Ended | | | Year Ended | | | Year Ended | | | Year Ended | | | Year Ended | |
| | | December 31, | | | December 31, | | | December 31, | | | December 31, | | | December 31, | |
| | | 2021 | | | 2020 | | | 2019 | | | 2018(A) | | | 2017(A) | |
| Net asset value, beginning of year | | $ | 56.20 | | | $ | 43.30 | | | $ | 34.20 | | | $ | 34.90 | | | $ | 37.80 | |
| | | | | | | | | | | | | | | | | | | | | |
| INCOME (LOSS) FROM INVESTMENT OPERATIONS: | | | | | | | | | | | | | | | | | | | | |
| Net investment income (loss) (B) | | | (0.41 | ) | | | (0.33 | ) | | | (0.14 | ) | | | 0.16 | | | | 0.20 | |
| Net realized and unrealized gain on investments | | | 8.68 | | | | 19.98 | | | | 9.38 | | | | 0.07 | (D) | | | 5.40 | |
| Total from investment operations | | | 8.27 | | | | 19.65 | | | | 9.24 | | | | 0.23 | | | | 5.60 | |
| | | | | | | | | | | | | | | | | | | | | |
| LESS DISTRIBUTIONS: | | | | | | | | | | | | | | | | | | | | |
| From net investment income | | | — | | | | — | | | | — | | | | (0.09 | ) | | | (0.20 | ) |
| From net realized gains on investments | | | (4.95 | ) | | | (6.75 | ) | | | (0.14 | ) | | | (0.84 | ) | | | (8.30 | ) |
| Total distributions | | | (4.95 | ) | | | (6.75 | ) | | | (0.14 | ) | | | (0.93 | ) | | | (8.50 | ) |
| | | | | | | | | | | | | | | | | | | | | |
| Net assets, end of year (in 000’s) | | $ | 59.52 | | | $ | 56.20 | | | $ | 43.30 | | | $ | 34.20 | | | $ | 34.90 | |
| | | | | | | | | | | | | | | | | | | | | |
| Total return (C) | | | 14.97 | % | | | 45.28 | % | | | 27.03 | % | | | 0.72 | % | | | 14.66 | % |
| | | | | | | | | | | | | | | | | | | | | |
| RATIOS/SUPPLEMENTAL DATA: | | | | | | | | | | | | | | | | | | | | |
| Net assets, end of year (in 000’s) | | $ | 82,648 | | | $ | 53,102 | | | $ | 21,627 | | | $ | 16,725 | | | $ | 3,269 | |
| Ratios to average net assets (including interest expense) | | | | | | | | | | | | | | | | | | | | |
| Expenses, before waiver and reimbursement (E) | | | 1.10 | % | | | 1.25 | % | | | 1.45 | % | | | 1.67 | % | | | 1.69 | % |
| Expenses, net waiver and reimbursement (E) | | | 1.14 | % | | | 1.24 | % | | | 1.17 | % | | | 1.00 | % | | | 1.00 | % |
| Net investment income (loss) | | | (0.65 | )% | | | (0.56 | )% | | | (0.36 | )% | | | 0.42 | % | | | 0.60 | % |
| Portfolio turnover rate | | | 225 | % | | | 320 | % | | | 220 | % | | | 411 | % | | | 305 | % |
| | | | | | | | | | | | | | | | | | | | | |
| | | Class A | |
| | | For the | | | For the | | | For the | | | For the | | | For the | |
| | | Year Ended | | | Year Ended | | | Year Ended | | | Year Ended | | | Year Ended | |
| | | December 31, | | | December 31, | | | December 31, | | | December 31, | | | December 31, | |
| | | 2021 | | | 2020 | | | 2019 | | | 2018(A) | | | 2018(A) | |
| Net asset value, beginning of year | | $ | 37.16 | | | $ | 30.27 | | | $ | 24.00 | | | $ | 24.70 | | | $ | 28.90 | |
| | | | | | | | | | | | | | | | | | | | | |
| INCOME (LOSS) FROM INVESTMENT OPERATIONS: | | | | | | | | | | | | | | | | | | | | |
| Net investment income (loss) (B) | | | (0.41 | ) | | | (0.28 | ) | | | (0.16 | ) | | | 0.02 | | | | 0.10 | |
| Net realized and unrealized gain on investments | | | 5.69 | | | | 13.92 | | | | 6.57 | | | | 0.12 | (D) | | | 4.10 | |
| Total from investment operations | | | 5.28 | | | | 13.64 | | | | 6.41 | | | | 0.14 | | | | 4.20 | |
| | | | | | | | | | | | | | | | | | | | | |
| LESS DISTRIBUTIONS: | | | | | | | | | | | | | | | | | | | | |
| From net investment income | | | — | | | | — | | | | — | | | | — | | | | (0.10 | ) |
| From net realized gains on investments | | | (4.95 | ) | | | (6.75 | ) | | | (0.14 | ) | | | (0.84 | ) | | | (8.30 | ) |
| Total distributions | | | (4.95 | ) | | | (6.75 | ) | | | (0.14 | ) | | | (0.84 | ) | | | (8.40 | ) |
| | | | | | | | | | | | | | | | | | | | | |
| Net assets, end of year (in 000’s) | | $ | 37.49 | | | $ | 37.16 | | | $ | 30.27 | | | $ | 24.00 | | | $ | 24.70 | |
| | | | | | | | | | | | | | | | | | | | | |
| Total return (C) | | | 14.59 | % | | | 44.91 | % | | | 26.72 | % | | | 0.63 | % | | | 14.30 | % |
| | | | | | | | | | | | | | | | | | | | | |
| RATIOS/SUPPLEMENTAL DATA: | | | | | | | | | | | | | | | | | | | | |
| Net assets, end of year (in 000’s) | | $ | 23,205 | | | $ | 17,972 | | | $ | 12,387 | | | $ | 11,154 | | | $ | 12,870 | |
| Ratios to average net assets (including interest expense) | | | | | | | | | | | | | | | | | | | | |
| Expenses, before waiver and reimbursement (F) | | | 1.37 | % | | | 1.52 | % | | | 1.74 | % | | | 2.05 | % | | | 1.94 | % |
| Expenses, net waiver and reimbursement (F) | | | 1.47 | % | | | 1.49 | % | | | 1.41 | % | | | 1.25 | % | | | 1.25 | % |
| Net investment income (loss) | | | (1.00 | )% | | | (0.82 | )% | | | (0.59 | )% | | | 0.08 | % | | | 0.35 | % |
| Portfolio turnover rate | | | 225 | % | | | 320 | % | | | 220 | % | | | 411 | % | | | 305 | % |
| | | | | | | | | | | | | | | | | | | | | |
| (A) | Effective September 21, 2018, the Fund had a one-to-ten reverse stock split. Per Share amounts for the periods have been adjusted to give effect to the one-to-ten stock split. |
| (B) | Per share amounts calculated using average shares method, which more appropriately presents the per share data for the year. |
| (C) | Total return in the above table represents the rate that the investor would have earned or lost on an investment in the Fund assuming reinvestment of dividends and does not reflect the impact of sales charges. |
| (D) | As required by SEC standard per share data calculation methodology, this represents a balancing figure derived from the other amounts in the financial highlights tables that captures all other changes affecting net asset value per share. This per share gain amount does not correlate to the aggregate of the net realized and unrealized loss in the Statement of Operations for the year ended December 31, 2018, primarily due to the timing of sales and repurchases of the Fund’s shares in relation to fluctuating market values of the Fund’s portfolio. |
| (E) | Ratios to average net assets (excluding interest expense) |
| Expenses, before waiver and reimbursement | | | 1.10 | % | | | 1.25 | % | | | 1.45 | % | | | 1.67 | % | | | 1.69 | % |
| Expenses, net waiver and reimbursement | | | 1.14 | % | | | 1.24 | % | | | 1.17 | % | | | 1.00 | % | | | 1.00 | % |
| | | | | | | | | | | | | | | | | | | | | |
| (F) | Ratios to average net assets (excluding interest expense) |
| Expenses, before waiver and reimbursement | | | 1.37 | % | | | 1.52 | % | | | 1.74 | % | | | 2.05 | % | | | 1.94 | % |
| Expenses, net waiver and reimbursement | | | 1.47 | % | | | 1.49 | % | | | 1.41 | % | | | 1.25 | % | | | 1.25 | % |
| | | | | | | | | | | | | | | | | | | | | |
See accompanying notes to financial statements.
| RATIONAL FUNDS |
| Rational Dynamic Brands Fund (Continued) |
| Financial Highlights |
| |
| For a Share Outstanding Throughout Each Year |
| | | Class C | |
| | | For the | | | For the | | | For the | | | For the | | | For the | |
| | | Year Ended | | | Year Ended | | | Year Ended | | | Year Ended | | | Year Ended | |
| | | December 31, | | | December 31, | | | December 31, | | | December 31, | | | December 31, | |
| | | 2021 | | | 2020 | | | 2019 | | | 2018(A) | | | 2017(A) | |
| Net asset value, beginning of year | | $ | 32.34 | | | $ | 27.15 | | | $ | 21.70 | | | $ | 22.60 | | | $ | 27.10 | |
| | | | | | | | | | | | | | | | | | | | | |
| INCOME (LOSS) FROM INVESTMENT OPERATIONS: | | | | | | | | | | | | | | | | | | | | |
| Net investment loss (B) | | | (0.58 | ) | | | (0.50 | ) | | | (0.32 | ) | | | (0.14 | ) | | | (0.00 | ) (C) |
| Net realized and unrealized gain on investments | | | 4.92 | | | | 12.44 | | | | 5.91 | | | | 0.08 | (F) | | | 3.80 | |
| Total from investment operations | | | 4.34 | | | | 11.94 | | | | 5.59 | | | | (0.06 | ) | | | 3.80 | |
| | | | | | | | | | | | | | | | | | | | | |
| LESS DISTRIBUTIONS: | | | | | | | | | | | | | | | | | | | | |
| From net investment income | | | — | | | | — | | | | — | | | | — | | | | — | |
| From net realized gains on investments | | | (4.95 | ) | | | (6.75 | ) | | | (0.14 | ) | | | (0.84 | ) | | | (8.30 | ) |
| Total distributions | | | (4.95 | ) | | | (6.75 | ) | | | (0.14 | ) | | | (0.84 | ) | | | (8.30 | ) |
| | | | | | | | | | | | | | | | | | | | | |
| Net assets, end of year (in 000’s) | | $ | 31.73 | | | $ | 32.34 | | | $ | 27.15 | | | $ | 21.70 | | | $ | 22.60 | |
| | | | | | | | | | | | | | | | | | | | | |
| Total return (D) | | | 13.85 | % | | | 43.80 | % | | | 25.78 | % (E) | | | (0.20 | )% (E) | | | 14.03 | % |
| | | | | | | | | | | | | | | | | | | | | |
| RATIOS/SUPPLEMENTAL DATA: | | | | | | | | | | | | | | | | | | | | |
| Net assets, end of year (in 000’s) | | $ | 4,898 | | | $ | 1,525 | | | $ | 184 | | | $ | 214 | | | $ | 231 | |
| Ratios to average net assets (including interest expense) | | | | | | | | | | | | | | | | | | | | |
| Expenses, before waiver and reimbursement (G) | | | 2.08 | % | | | 2.41 | % | | | 2.68 | % | | | 2.73 | % | | | 2.65 | % |
| Expenses, net waiver and reimbursement (G) | | | 2.12 | % | | | 2.24 | % | | | 2.15 | % | | | 1.91 | % | | | 1.75 | % |
| Net investment loss | | | (1.62 | )% | | | (1.54 | )% | | | (1.30 | )% | | | (0.59 | )% | | | (0.14 | )% |
| Portfolio turnover rate | | | 225 | % | | | 320 | % | | | 220 | % | | | 411 | % | | | 305 | % |
| | | | | | | | | | | | | | | | | | | | | |
| (A) | Effective September 21, 2018, the Fund had a one-to-ten reverse stock split. Per Share amounts for the periods have been adjusted to give effect to the one-to-ten stock split. |
| (B) | Per share amounts calculated using average shares method, which more appropriately presents the per share data for the year. |
| (C) | Amount is less than $0.005. |
| (D) | Total return in the above table represents the rate that the investor would have earned or lost on an investment in the Fund assuming reinvestment of dividends and does not reflect the impact of sales charges. |
| (E) | Includes adjustments in accordance with accounting principles generally accepted in the United States and, consequently, the net asset value for financial reporting purposes and the returns based upon those net asset values may differ from the net asset values and returns for shareholder transactions. |
| (F) | As required by SEC standard per share data calculation methodology, this represents a balancing figure derived from the other amounts in the financial highlights tables that captures all other changes affecting net asset value per share. This per share gain amount does not correlate to the aggregate of the net realized and unrealized loss in the Statement of Operations for the year ended December 31, 2018, primarily due to the timing of sales and repurchases of the Fund’s shares in relation to fluctuating market values of the Fund’s portfolio. |
| (G) | Ratios to average net assets (excluding interest expense) |
| Expenses, before waiver and reimbursement | | | 2.08 | % | | | 2.41 | % | | | 2.68 | % | | | 2.73 | % | | | 2.65 | % |
| Expenses, net waiver and reimbursement | | | 2.12 | % | | | 2.24 | % | | | 2.15 | % | | | 1.91 | % | | | 1.75 | % |
| | | | | | | | | | | | | | | | | | | | | |
See accompanying notes to financial statements.
| RATIONAL FUNDS |
| Rational Strategic Allocation Fund |
| Financial Highlights |
| |
| For a Share Outstanding Throughout Each Year |
| | | Institutional | |
| | | For the | | | For the | | | For the | | | For the | | | For the | |
| | | Year Ended | | | Year Ended | | | Year Ended | | | Year Ended | | | Year Ended | |
| | | December 31, | | | December 31, | | | December 31, | | | December 31, | | | December 31, | |
| | | 2021 | | | 2020 | | | 2019 | | | 2018 | | | 2017 | |
| Net asset value, beginning of year | | $ | 8.94 | | | $ | 9.58 | | | $ | 9.12 | | | $ | 10.02 | | | $ | 9.37 | |
| | | | | | | | | | | | | | | | | | | | | |
| INCOME (LOSS) FROM INVESTMENT OPERATIONS: | | | | | | | | | | | | | | | | | | | | |
| Net investment income (A) | | | 0.40 | | | | 0.27 | | | | 0.36 | | | | 0.39 | | | | 0.33 | |
| Net realized and unrealized gain (loss) on investments | | | 2.54 | | | | (0.61 | ) | | | 0.79 | | | | (0.67 | ) | | | 0.78 | |
| Total from investment operations | | | 2.94 | | | | (0.34 | ) | | | 1.15 | | | | (0.28 | ) | | | 1.11 | |
| | | | | | | | | | | | | | | | | | | | | |
| LESS DISTRIBUTIONS: | | | | | | | | | | | | | | | | | | | | |
| From net investment income | | | (0.36 | ) | | | (0.28 | ) | | | (0.41 | ) | | | (0.36 | ) | | | (0.46 | ) |
| From net realized gains on investments | | | (1.28 | ) | | | — | | | | (0.22 | ) | | | (0.26 | ) | | | — | |
| From Return of capital | | | — | | | | (0.02 | ) | | | (0.06 | ) | | | — | | | | — | |
| Total distributions | | | (1.64 | ) | | | (0.30 | ) | | | (0.69 | ) | | | (0.62 | ) | | | (0.46 | ) |
| | | | | | | | | | | | | | | | | | | | | |
| Net asset value, end of year | | $ | 10.24 | | | $ | 8.94 | | | $ | 9.58 | | | $ | 9.12 | | | $ | 10.02 | |
| | | | | | | | | | | | | | | | | | | | | |
| Total return (B) | | | 33.94 | % | | | (3.19 | )% | | | 12.64 | % | | | (2.81 | )% | | | 11.95 | % |
| | | | | | | | | | | | | | | | | | | | | |
| RATIOS/SUPPLEMENTAL DATA: | | | | | | | | | | | | | | | | | | | | |
| Net assets, end of year (in 000’s) | | $ | 519 | | | $ | 248 | | | $ | 266 | | | $ | 253 | | | $ | 278 | |
| Ratios to average net assets (including interest expense) | | | | | | | | | | | | | | | | | | | | |
| Expenses, before waiver and reimbursement (C,E) | | | 1.11 | % | | | 1.31 | % | | | 0.98 | % | | | 1.04 | % | | | 0.85 | % |
| Expenses, net waiver and reimbursement (C,E) | | | 0.46 | % | | | 0.45 | % | | | 0.45 | % | | | 0.45 | % | | | 0.45 | % |
| Net investment income (C,D) | | | 3.78 | % | | | 3.26 | % | | | 3.67 | % | | | 3.91 | % | | | 3.35 | % |
| Portfolio turnover rate | | | 2 | % | | | 89 | % | | | 62 | % | | | 53 | % | | | 17 | % |
| | | | | | | | | | | | | | | | | | | | | |
| | | | | | | | | | | | | | | | | | | | | |
| | | Class A | |
| | | For the | | | For the | | | For the | | | For the | | | For the | |
| | | Year Ended | | | Year Ended | | | Year Ended | | | Year Ended | | | Year Ended | |
| | | December 31, | | | December 31, | | | December 31, | | | December 31, | | | December 31, | |
| | | 2021 | | | 2020 | | | 2019 | | | 2018 | | | 2017 | |
| Net asset value, beginning of year | | $ | 8.99 | | | $ | 9.63 | | | $ | 9.15 | | | $ | 10.05 | | | $ | 9.40 | |
| | | | | | | | | | | | | | | | | | | | | |
| INCOME (LOSS) FROM INVESTMENT OPERATIONS: | | | | | | | | | | | | | | | | | | | | |
| Net investment income (A) | | | 0.34 | | | | 0.25 | | | | 0.32 | | | | 0.33 | | | | 0.26 | |
| Net realized and unrealized gain (loss) on investments | | | 2.59 | | | | (0.61 | ) | | | 0.82 | | | | (0.63 | ) | | | 0.83 | |
| Total from investment operations | | | 2.93 | | | | (0.36 | ) | | | 1.14 | | | | (0.30 | ) | | | 1.09 | |
| | | | | | | | | | | | | | | | | | | | | |
| LESS DISTRIBUTIONS: | | | | | | | | | | | | | | | | | | | | |
| From net investment income | | | (0.34 | ) | | | (0.26 | ) | | | (0.38 | ) | | | (0.34 | ) | | | (0.44 | ) |
| From net realized gains on investments | | | (1.28 | ) | | | — | | | | (0.22 | ) | | | (0.26 | ) | | | — | |
| From Return of capital | | | — | | | | (0.02 | ) | | | (0.06 | ) | | | — | | | | — | |
| Total distributions | | | (1.62 | ) | | | (0.28 | ) | | | (0.66 | ) | | | (0.60 | ) | | | (0.44 | ) |
| | | | | | | | | | | | | | | | | | | | | |
| Net assets, end of year (in 000’s) | | $ | 10.30 | | | $ | 8.99 | | | $ | 9.63 | | | $ | 9.15 | | | $ | 10.05 | |
| | | | | | | | | | | | | | | | | | | | | |
| Total return (B) | | | 33.57 | % | | | (3.42 | )% | | | 12.49 | % | | | (3.05 | )% | | | 11.61 | % |
| | | | | | | | | | | | | | | | | | | | | |
| RATIOS/SUPPLEMENTAL DATA: | | | | | | | | | | | | | | | | | | | | |
| Net assets, end of year (in 000’s) | | $ | 9,830 | | | $ | 7,713 | | | $ | 9,395 | | | $ | 9,842 | | | $ | 13,033 | |
| Ratios to average net assets (including interest expense) | | | | | | | | | | | | | | | | | | | | |
| Expenses, before waiver and reimbursement (C,F) | | | 1.47 | % | | | 1.65 | % | | | 1.35 | % | | | 1.37 | % | | | 1.14 | % |
| Expenses, net waiver and reimbursement (C,F) | | | 0.71 | % | | | 0.70 | % | | | 0.70 | % | | | 0.70 | % | | | 0.70 | % |
| Net Investment income (C,D) | | | 3.30 | % | | | 2.98 | % | | | 3.25 | % | | | 3.25 | % | | | 2.60 | % |
| Portfolio turnover rate | | | 2 | % | | | 89 | % | | | 62 | % | | | 53 | % | | | 17 | % |
| | | | | | | | | | | | | | | | | | | | | |
| (A) | Per share amounts calculated using average shares method, which more appropriately presents the per share data for the year. |
| (B) | Total return in the above table represents the rate that the investor would have earned or lost on an investment in the Fund assuming reinvestment of dividends and does not reflect the impact of sales charges. Had the Advisor not waived its fees and reimbursed expenses, total return would have been lower. |
| (C) | The ratios of expenses to average net assets and net investment income (loss) to average net assets do not reflect the expenses of the underlying investment companies in which the Fund invests. |
| (D) | Recognition of net investment income (loss) is affected by the timing and declaration of dividends by the underlying investment companies in which the Fund invests. |
| (E) | Ratios to average net assets (excluding interest expense) |
| Expenses, before waiver and reimbursement | | | 1.10 | % | | | 1.31 | % | | | 0.98 | % | | | 1.04 | % | | | 0.85 | % |
| Expenses, net waiver and reimbursement | | | 0.45 | % | | | 0.45 | % | | | 0.45 | % | | | 0.45 | % | | | 0.45 | % |
| | | | | | | | | | | | | | | | | | | | | |
| (F) | Ratios to average net assets (excluding interest expense) |
| Expenses, before waiver and reimbursement | | | 1.46 | % | | | 1.65 | % | | | 1.35 | % | | | 1.37 | % | | | 1.14 | % |
| Expenses, net waiver and reimbursement | | | 0.70 | % | | | 0.70 | % | | | 0.70 | % | | | 0.70 | % | | | 0.70 | % |
| | | | | | | | | | | | | | | | | | | | | |
See accompanying notes to financial statements.
| RATIONAL FUNDS |
| Rational Strategic Allocation Fund (Continued) |
| Financial Highlights |
| |
| For a Share Outstanding Throughout Each Year |
| | | Class C | |
| | | For the | | | For the | | | For the | | | For the | | | For the | |
| | | Year Ended | | | Year Ended | | | Year Ended | | | Year Ended | | | Year Ended | |
| | | December 31, | | | December 31, | | | December 31, | | | December 31, | | | December 31, | |
| | | 2021 | | | 2020 | | | 2019 | | | 2018 | | | 2017 | |
| Net asset value, beginning of year | | $ | 8.95 | | | $ | 9.58 | | | $ | 9.11 | | | $ | 10.03 | | | $ | 9.39 | |
| | | | | | | | | | | | | | | | | | | | | |
| INCOME (LOSS) FROM INVESTMENT OPERATIONS: | | | | | | | | | | | | | | | | | | | | |
| Net investment income (A) | | | 0.26 | | | | 0.19 | | | | 0.26 | | | | 0.29 | | | | 0.23 | |
| Net realized and unrealized gain (loss) on investments | | | 2.58 | | | | (0.61 | ) | | | 0.80 | | | | (0.67 | ) | | | 0.78 | |
| Total from investment operations | | | 2.84 | | | | (0.42 | ) | | | 1.06 | | | | (0.38 | ) | | | 1.01 | |
| | | | | | | | | | | | | | | | | | | | | |
| LESS DISTRIBUTIONS: | | | | | | | | | | | | | | | | | | | | |
| From net investment income | | | (0.26 | ) | | | (0.19 | ) | | | (0.31 | ) | | | (0.28 | ) | | | (0.37 | ) |
| From net realized gains on investments | | | (1.28 | ) | | | — | | | | (0.22 | ) | | | (0.26 | ) | | | — | |
| From Return of capital | | | — | | | | (0.02 | ) | | | (0.06 | ) | | | — | | | | — | |
| Total distributions | | | (1.54 | ) | | | (0.21 | ) | | | (0.59 | ) | | | (0.54 | ) | | | (0.37 | ) |
| | | | | | | | | | | | | | | | | | | | | |
| Net asset value, end of year | | $ | 10.25 | | | $ | 8.95 | | | $ | 9.58 | | | $ | 9.11 | | | $ | 10.03 | |
| | | | | | | | | | | | | | | | | | | | | |
| Total return (B) | | | 32.60 | % | | | (4.13 | )% | | | 11.61 | % | | | (3.83 | )% | | | 10.80 | % |
| | | | | | | | | | | | | | | | | | | | | |
| RATIOS/SUPPLEMENTAL DATA: | | | | | | | | | | | | | | | | | | | | |
| Net assets, end of year (in 000’s) | | $ | 1 | | | $ | 1 | | | $ | 1 | | | $ | 1 | | | $ | 1 | |
| Ratios to average net assets (including interest expense) | | | | | | | | | | | | | | | | | | | | |
| Expenses, before waiver and reimbursement (C,E) | | | 2.24 | % | | | 2.33 | % | | | 2.02 | % | | | 1.92 | % | | | 1.82 | % |
| Expenses, net waiver and reimbursement (C,E) | | | 1.46 | % | | | 1.45 | % | | | 1.45 | % | | | 1.45 | % | | | 1.45 | % |
| Net investment income (C,D) | | | 2.53 | % | | | 2.26 | % | | | 2.65 | % | | | 2.89 | % | | | 2.31 | % |
| Portfolio turnover rate | | | 2 | % | | | 89 | % | | | 62 | % | | | 53 | % | | | 17 | % |
| | | | | | | | | | | | | | | | | | | | | |
| (A) | Per share amounts calculated using average shares method, which more appropriately presents the per share data for the year. |
| (B) | Total return in the above table represents the rate that the investor would have earned or lost on an investment in the Fund assuming reinvestment of dividends and does not reflect the impact of sales charges. Had the Advisor not waived its fees and reimbursed expenses, total return would have been lower. |
| (C) | The ratios of expenses to average net assets and net investment income (loss) to average net assets do not reflect the expenses of the underlying investment companies in which the Fund invests. |
| (D) | Recognition of net investment income (loss) is affected by the timing and declaration of dividends by the underlying investment companies in which the Fund invests. |
| (E) | Ratios to average net assets (excluding interest expense) |
| Expenses, before waiver and reimbursement | | | 2.23 | % | | | 2.33 | % | | | 2.02 | % | | | 1.92 | % | | | 1.82 | % |
| Expenses, net waiver and reimbursement | | | 1.45 | % | | | 1.45 | % | | | 1.45 | % | | | 1.45 | % | | | 1.45 | % |
| | | | | | | | | | | | | | | | | | | | | |
See accompanying notes to financial statements.
| RATIONAL FUNDS |
| Rational/ReSolve Adaptive Asset Allocation Fund |
| Financial Highlights (Consolidated) |
| |
| For a Share Outstanding Throughout Each Year |
| | | Institutional | |
| | | For the | | | For the | | | For the | | | For the | | | For the | |
| | | Year Ended | | | Year Ended | | | Year Ended | | | Year Ended | | | Year Ended | |
| | | December 31, | | | December 31, | | | December 31, | | | December 31, | | | December 31, | |
| | | 2021 | | | 2020 | | | 2019 | | | 2018 | | | 2017 | |
| Net asset value, beginning of year | | $ | 23.77 | | | $ | 23.73 | | | $ | 23.10 | | | $ | 25.25 | | | $ | 24.33 | |
| | | | | | | | | | | | | | | | | | | | | |
| INCOME (LOSS) FROM INVESTMENT OPERATIONS: | | | | | | | | | | | | | | | | | | | | |
| Net investment loss (A) | | | (0.50 | ) | | | (0.37 | ) | | | (0.02 | ) | | | (0.04 | ) | | | (0.32 | ) |
| Net realized and unrealized gain (loss) on investments | | | 3.16 | | | | 0.52 | | | | 4.32 | | | | (1.89 | ) | | | 1.26 | |
| Total from investment operations | | | 2.66 | | | | 0.15 | | | | 4.30 | | | | (1.93 | ) | | | 0.94 | |
| | | | | | | | | | | | | | | | | | | | | |
| LESS DISTRIBUTIONS: | | | | | | | | | | | | | | | | | | | | |
| From net investment income | | | (3.72 | ) | | | (0.08 | ) | | | (0.69 | ) | | | — | | | | — | |
| From net realized gains on investments | | | — | | | | — | | | | (2.94 | ) | | | (0.22 | ) | | | (0.02 | ) |
| From Return of capital | | | — | | | | (0.03 | ) | | | (0.04 | ) | | | — | | | | — | |
| Total distributions | | | (3.72 | ) | | | (0.11 | ) | | | (3.67 | ) | | | (0.22 | ) | | | (0.02 | ) |
| | | | | | | | | | | | | | | | | | | | | |
| Net asset value, end of year | | $ | 22.71 | | | $ | 23.77 | | | $ | 23.73 | | | $ | 23.10 | | | $ | 25.25 | |
| | | | | | | | | | | | | | | | | | | | | |
| Total return (B) | | | 11.28 | % | | | 0.65 | % | | | 18.32 | % | | | (7.64 | )% | | | 3.85 | % |
| | | | | | | | | | | | | | | | | | | | | |
| RATIOS/SUPPLEMENTAL DATA: | | | | | | | | | | | | | | | | | | | | |
| Net assets, end of year (in 000’s) | | $ | 64,890 | | | $ | 62,176 | | | $ | 51,221 | | | $ | 27,460 | | | $ | 5,883 | |
| Ratios to average net assets (including interest expense) | | | | | | | | | | | | | | | | | | | | |
| Expenses, before waiver and reimbursement (C) | | | 2.17 | % | | | 2.18 | % | | | 2.32 | % | | | 2.90 | % | | | 2.49 | % |
| Expenses, net waiver and reimbursement (C) | | | 1.98 | % | | | 1.97 | % | | | 1.97 | % | | | 1.97 | % | | | 1.97 | % |
| Net investment loss | | | (1.95 | )% | | | (1.61 | )% | | | (0.06 | )% | | | (0.17 | )% | | | (1.33 | )% |
| Portfolio turnover rate | | | 0 | % | | | 0 | % | | | 0 | % | | | 0 | % | | | 0 | % |
| | | | | | | | | | | | | | | | | | | | | |
| | | Class A | |
| | | For the | | | For the | | | For the | | | For the | | | For the | |
| | | Year Ended | | | Year Ended | | | Year Ended | | | Year Ended | | | Year Ended | |
| | | December 31, | | | December 31, | | | December 31, | | | December 31, | | | December 31, | |
| | | 2021 | | | 2020 | | | 2019 | | | 2018 | | | 2017 | |
| Net asset value, beginning of year | | $ | 23.61 | | | $ | 23.52 | | | $ | 22.96 | | | $ | 25.16 | | | $ | 24.30 | |
| | | | | | | | | | | | | | | | | | | | | |
| INCOME (LOSS) FROM INVESTMENT OPERATIONS: | | | | | | | | | | | | | | | | | | | | |
| Net investment loss (A) | | | (0.55 | ) | | | (0.36 | ) | | | (0.10 | ) | | | (0.11 | ) | | | (0.21 | ) |
| Net realized and unrealized gain (loss) on investments | | | 3.13 | | | | 0.45 | | | | 4.30 | | | | (1.87 | ) | | | 1.09 | |
| Total from investment operations | | | 2.58 | | | | 0.09 | | | | 4.20 | | | | (1.98 | ) | | | 0.88 | |
| | | | | | | | | | | | | | | | | | | | | |
| LESS DISTRIBUTIONS: | | | | | | | | | | | | | | | | | | | | |
| From net investment income | | | (3.66 | ) | | | — | | | | (0.66 | ) | | | — | | | | — | |
| From net realized gains on investments | | | — | | | | — | | | | (2.94 | ) | | | (0.22 | ) | | | (0.02 | ) |
| From Return of capital | | | — | | | | — | | | | (0.04 | ) | | | — | | | | — | |
| Total distributions | | | (3.66 | ) | | | — | | | | (3.64 | ) | | | (0.22 | ) | | | (0.02 | ) |
| | | | | | | | | | | | | | | | | | | | | |
| Net asset value, end of year | | $ | 22.53 | | | $ | 23.61 | | | $ | 23.52 | | | $ | 22.96 | | | $ | 25.16 | |
| | | | | | | | | | | | | | | | | | | | | |
| Total return (B) | | | 10.99 | % | | | 0.38 | % | | | 18.01 | % | | | (7.87 | )% (E) | | | 3.57 | % |
| | | | | | | | | | | | | | | | | | | | | |
| RATIOS/SUPPLEMENTAL DATA: | | | | | | | | | | | | | | | | | | | | |
| Net assets, end of year (in 000’s) | | $ | 607 | | | $ | 776 | | | $ | 5,425 | | | $ | 2,169 | | | $ | 130 | |
| Ratios to average net assets (including interest expense) | | | | | | | | | | | | | | | | | | | | |
| Expenses, before waiver and reimbursement (D) | | | 2.36 | % | | | 2.47 | % | | | 2.60 | % | | | 3.14 | % | | | 2.90 | % |
| Expenses, net waiver and reimbursement (D) | | | 2.23 | % | | | 2.22 | % | | | 2.22 | % | | | 2.22 | % | | | 2.22 | % |
| Net investment loss | | | (2.10 | )% | | | (1.43 | )% | | | (0.39 | )% | | | (0.45 | )% | | | (0.88 | )% |
| Portfolio turnover rate | | | 0 | % | | | 0 | % | | | 0 | % | | | 0 | % | | | 0 | % |
| | | | | | | | | | | | | | | | | | | | | |
| (A) | Per share amounts calculated using average shares method, which more appropriately presents the per share data for the year. |
| (B) | Total return in the above table represents the rate that the investor would have earned or lost on an investment in the Fund assuming reinvestment of dividends and does not reflect the impact of sales charges. Had the Advisor not waived its fees and reimbursed expenses, total return would have been lower. |
| (C) | Ratios to average net assets (excluding interest expense) |
| Expenses, before waiver and reimbursement | | | 2.16 | % | | | 2.18 | % | | | 2.32 | % | | | 2.90 | % | | | 2.49 | % |
| Expenses, net waiver and reimbursement | | | 1.97 | % | | | 1.97 | % | | | 1.97 | % | | | 1.97 | % | | | 1.97 | % |
| | | | | | | | | | | | | | | | | | | | | |
| (D) | Ratios to average net assets (excluding interest expense) |
| Expenses, before waiver and reimbursement | | | 2.35 | % | | | 2.47 | % | | | 2.60 | % | | | 3.14 | % | | | 2.90 | % |
| Expenses, net waiver and reimbursement | | | 2.22 | % | | | 2.22 | % | | | 2.22 | % | | | 2.22 | % | | | 2.22 | % |
| | | | | | | | | | | | | | | | | | | | | |
| (E) | Includes adjustments in accordance with accounting principles generally accepted in the United States and, consequently, the net asset value for financial reporting purposes and the returns based upon those net asset values may differ from the net asset values and returns for shareholder transactions. |
See accompanying notes to consolidated financial statements.
| RATIONAL FUNDS |
| Rational/ReSolve Adaptive Asset Allocation Fund (Continued) |
| Financial Highlights (Consolidated) |
| |
| Net asset value, beginning of year |
| | | Class C | |
| | | For the | | | For the | | | For the | | | For the | | | For the | |
| | | Year Ended | | | Year Ended | | | Year Ended | | | Year Ended | | | Year Ended | |
| | | December 31, | | | December 31, | | | December 31, | | | December 31, | | | December 31, | |
| | | 2021 | | | 2020 | | | 2019 | | | 2018 | | | 2017 | |
| Net asset value, beginning of year | | $ | 23.03 | | | $ | 23.11 | | | $ | 22.61 | | | $ | 24.96 | | | $ | 24.29 | |
| | | | | | | | | | | | | | | | | | | | | |
| INCOME (LOSS) FROM INVESTMENT OPERATIONS: | | | | | | | | | | | | | | | | | | | | |
| Net investment loss (A) | | | (0.72 | ) | | | (0.57 | ) | | | (0.26 | ) | | | (0.31 | ) | | | (0.54 | ) |
| Net realized and unrealized gain (loss) on investments | | | 3.05 | | | | 0.49 | | | | 4.20 | | | | (1.82 | ) | | | 1.23 | |
| Total from investment operations | | | 2.33 | | | | (0.08 | ) | | | 3.94 | | | | (2.13 | ) | | | 0.69 | |
| | | | | | | | | | | | | | | | | | | | | |
| LESS DISTRIBUTIONS: | | | | | | | | | | | | | | | | | | | | |
| From net investment income | | | (3.48 | ) | | | — | | | | (0.46 | ) | | | — | | | | — | |
| From net realized gains on investments | | | — | | | | — | | | | (2.94 | ) | | | (0.22 | ) | | | (0.02 | ) |
| From Return of capital | | | — | | | | — | | | | (0.04 | ) | | | — | | | | — | |
| Total distributions | | | (3.48 | ) | | | — | | | | (3.44 | ) | | | (0.22 | ) | | | (0.02 | ) |
| | | | | | | | | | | | | | | | | | | | | |
| Net asset value, end of year | | $ | 21.88 | | | $ | 23.03 | | | $ | 23.11 | | | $ | 22.61 | | | $ | 24.96 | |
| | | | | | | | | | | | | | | | | | | | | |
| Total return (B) | | | 10.18 | % | | | (0.35 | )% | | | 17.15 | % | | | (8.53 | )% | | | 2.83 | % |
| | | | | | | | | | | | | | | | | | | | | |
| RATIOS/SUPPLEMENTAL DATA: | | | | | | | | | | | | | | | | | | | | |
| Net assets, end of year (in 000’s) | | $ | 241 | | | $ | 250 | | | $ | 438 | | | $ | 322 | | | $ | 371 | |
| Ratios to average net assets (including interest expense) | | | | | | | | | | | | | | | | | | | | |
| Expenses, before waiver and reimbursement (C) | | | 3.18 | % | | | 3.35 | % | | | 3.37 | % | | | 4.65 | % | | | 3.60 | % |
| Expenses, net waiver and reimbursement (C) | | | 2.98 | % | | | 2.97 | % | | | 2.97 | % | | | 2.97 | % | | | 2.97 | % |
| Net investment loss | | | (2.95 | )% | | | (2.51 | )% | | | (1.04 | )% | | | (1.24 | )% | | | (2.26 | )% |
| Portfolio turnover rate | �� | | 0 | % | | | 0 | % | | | 0 | % | | | 0 | % | | | 0 | % |
| | | | | | | | | | | | | | | | | | | | | |
| (A) | Per share amounts calculated using average shares method, which more appropriately presents the per share data for the year. |
| (B) | Total return in the above table represents the rate that the investor would have earned or lost on an investment in the Fund assuming reinvestment of dividends and does not reflect the impact of sales charges. Had the Advisor not waived its fees and reimbursed expenses, total return would have been lower. |
| (C) | Ratios to average net assets (excluding interest expense) |
| Expenses, before waiver and reimbursement | | | 3.17 | % | | | 3.35 | % | | | 3.37 | % | | | 4.65 | % | | | 3.60 | % |
| Expenses, net waiver and reimbursement | | | 2.97 | % | | | 2.97 | % | | | 2.97 | % | | | 2.97 | % | | | 2.97 | % |
| | | | | | | | | | | | | | | | | | | | | |
See accompanying notes to consolidated financial statements.
| RATIONAL FUNDS |
| Rational/Pier 88 Convertible Securities Fund |
| Financial Highlights |
| |
| For a Share Outstanding Throughout Each Year/Period |
| | | Institutional | | | Class A | |
| | | For the | | | For the | | | For the | | | For the | | | For the | | | For the | |
| | | Year Ended | | | Year Ended | | | Period Ended | | | Year Ended | | | Year Ended | | | Period Ended | |
| | | December 31, | | | December 31, | | | December 31, | | | December 31, | | | December 31, | | | December 31, | |
| | | 2021 | | | 2020 | | | 2019(A) | | | 2021 | | | 2020 | | | 2019(A) | |
| Net asset value, beginning of year/period | | $ | 11.69 | | | $ | 10.17 | | | $ | 10.00 | | | $ | 11.69 | | | $ | 10.17 | | | $ | 10.00 | |
| | | | | | | | | | | | | | | | | | | | | | | | | |
| INCOME FROM INVESTMENT OPERATIONS: | | | | | | | | | | | | | | | | | | | | | | | | |
| Net investment income (B) | | | 0.13 | | | | 0.17 | | | | 0.03 | | | | 0.11 | | | | 0.39 | | | | 0.02 | |
| Net realized and unrealized gain on investments | | | 1.04 | | | | 1.56 | | | | 0.14 | | | | 1.03 | | | | 1.33 | | | | 0.15 | |
| Total from investment operations | | | 1.17 | | | | 1.73 | | | | 0.17 | | | | 1.14 | | | | 1.72 | | | | 0.17 | |
| | | | | | | | | | | | | | | | | | | | | | | | | |
| LESS DISTRIBUTIONS: | | | | | | | | | | | | | | | | | | | | | | | | |
| From net investment income | | | (0.17 | ) | | | (0.20 | ) | | | — | | | | (0.13 | ) | | | (0.19 | ) | | | — | |
| From net realized gains on investments | | | (0.73 | ) | | | (0.01 | ) | | | — | | | | (0.73 | ) | | | (0.01 | ) | | | — | |
| Total distributions | | | (0.90 | ) | | | (0.21 | ) | | | — | | | | (0.86 | ) | | | (0.20 | ) | | | — | |
| | | | | | | | | | | | | | | | | | | | | | | | | |
| Net asset value, end of year/period | | $ | 11.96 | | | $ | 11.69 | | | $ | 10.17 | | | $ | 11.97 | | | $ | 11.69 | | | $ | 10.17 | |
| | | | | | | | | | | | | | | | | | | | | | | | | |
| Total return (C) | | | 10.21 | % | | | 17.08 | % | | | 1.70 | % (D) | | | 9.97 | % | | | 16.97 | % | | | 1.70 | % (D) |
| | | | | | | | | | | | | | | | | | | | | | | | | |
| RATIOS/SUPPLEMENTAL DATA: | | | | | | | | | | | | | | | | | | | | | | | | |
| Net assets, end of year/period (in 000’s) | | $ | 118,333 | | | $ | 73,946 | | | $ | 5,707 | | | $ | 2,231 | | | $ | 337 | | | $ | 0 | (F) |
| Ratios to average net assets (including interest expense) | | | | | | | | | | | | | | | | | | | | | | | | |
| Expenses, before waiver and reimbursement (G) | | | 1.17 | % | | | 1.25 | % | | | 7.22 | % (E) | | | 1.35 | % | | | 1.40 | % | | | 7.47 | % (E) |
| Expenses, net waiver and reimbursement (G) | | | 0.99 | % | | | 0.99 | % | | | 0.99 | % (E) | | | 1.24 | % | | | 1.24 | % | | | 1.24 | % (E) |
| Net investment income | | | 1.07 | % | | | 1.62 | % | | | 4.22 | % (E) | | | 0.88 | % | | | 3.50 | % | | | 3.17 | % (E) |
| Portfolio turnover rate | | | 130 | % | | | 140 | % | | | 5 | % (D) | | | 130 | % | | | 140 | % | | | 5 | % (D) |
| | | | | | | | | | | | | | | | | | | | | | | | | |
| (A) | The Rational/Pier 88 Convertible Securities Fund Institutional Class, Class A and Class C Shares commenced operations December 6, 2019. |
| (B) | Per share amounts calculated using average shares method, which more appropriately presents the per share data for the period. |
| (C) | Total return in the above table represents the rate that the investor would have earned or lost on an investment in the Fund assuming reinvestment of dividends and does not reflect the impact of sales charges. |
| (F) | Amount is less than $1000. |
| (G) | Ratios to average net assets (excluding interest expense) |
| Expenses, before waiver and reimbursement | | | 1.17 | % | | | 1.25 | % | | | 7.22 | % | | | 1.35 | % | | | 1.40 | % | | | 7.47 | % |
| Expenses, net waiver and reimbursement | | | 0.99 | % | | | 0.99 | % | | | 0.99 | % | | | 1.24 | % | | | 1.24 | % | | | 1.24 | % |
| | | | | | | | | | | | | | | | | | | | | | | | | |
See accompanying notes to financial statements.
| RATIONAL FUNDS |
| Rational/Pier 88 Convertible Securities Fund (Continued) |
| Financial Highlights |
| |
| For a Share Outstanding Throughout Each Year/Period |
| | | Class C | |
| | | For the | | | For the | | | For the | |
| | | Year Ended | | | Year Ended | | | Period Ended | |
| | | December 31, | | | December 31, | | | December 31, | |
| | | 2021 | | | 2020 | | | 2019(A) | |
| Net asset value, beginning of year/period | | $ | 11.66 | | | $ | 10.17 | | | $ | 10.00 | |
| | | | | | | | | | | | | |
| INCOME (LOSS) FROM INVESTMENT OPERATIONS: | | | | | | | | | | | | |
| Net investment income (B) | | | 0.02 | | | | 0.32 | | | | 0.02 | |
| Net realized and unrealized gain on investments | | | 1.02 | | | | 1.34 | | | | 0.15 | |
| Total from investment operations | | | 1.04 | | | | 1.66 | | | | 0.17 | |
| | | | | | | | | | | | | |
| LESS DISTRIBUTIONS: | | | | | | | | | | | | |
| From net investment income | | | (0.07 | ) | | | (0.16 | ) | | | — | |
| From net realized gains on investments | | | (0.73 | ) | | | (0.01 | ) | | | — | |
| Total distributions | | | (0.80 | ) | | | (0.17 | ) | | | — | |
| | | | | | | | | | | | | |
| Net asset value, end of year/period | | $ | 11.90 | | | $ | 11.66 | | | $ | 10.17 | |
| | | | | | | | | | | | | |
| Total return (C) | | | 9.11 | % | | | 16.33 | % | | | 1.70 | % (D) |
| | | | | | | | | | | | | |
| RATIOS/SUPPLEMENTAL DATA: | | | | | | | | | | | | |
| Net assets, end of year/period (in 000’s) | | $ | 249 | | | $ | 55 | (F) | | $ | 0 | (F) |
| Ratios to average net assets (including interest expense) | | | | | | | | | | | | |
| Expenses, before waiver and reimbursement (G) | | | 2.10 | % | | | 2.13 | % | | | 8.22 | % (E) |
| Expenses, net waiver and reimbursement (G) | | | 1.99 | % | | | 1.99 | % | | | 1.99 | % (E) |
| Net investment income | | | 0.17 | % | | | 2.87 | % | | | 3.17 | % (E) |
| Portfolio turnover rate | | | 130 | % | | | 140 | % | | | 5 | % (D) |
| | | | | | | | | | | | | |
| (A) | The Rational/Pier 88 Convertible Securities Fund Institutional Class, Class A and Class C Shares commenced operations December 6, 2019. |
| (B) | Per share amounts calculated using average shares method, which more appropriately presents the per share data for the period. |
| (C) | Total return in the above table represents the rate that the investor would have earned or lost on an investment in the Fund assuming reinvestment of dividends and does not reflect the impact of sales charges. |
| (F) | Amount is less than $1000. |
| (G) | Ratios to average net assets (excluding interest expense) |
| Expenses, before waiver and reimbursement | | | 2.10 | % | | | 2.13 | % | | | 8.22 | % |
| Expenses, net waiver and reimbursement | | | 1.99 | % | | | 1.99 | % | | | 1.99 | % |
| | | | | | | | | | | | | |
See accompanying notes to financial statements.
| RATIONAL FUNDS |
| Rational Special Situations Income Fund |
| Financial Highlights |
| |
| For a Share Outstanding Throughout Each Year/Period |
| | | Institutional | | | Class A | |
| | | For the | | | For the | | | For the | | | For the | | | For the | | | For the | |
| | | Year Ended | | | Year Ended | | | Period Ended | | | Year Ended | | | Year Ended | | | Period Ended | |
| | | December 31, | | | December 31, | | | December 31, | | | December 31, | | | December 31, | | | December 31, | |
| | | 2021 | | | 2020 | | | 2019(A) | | | 2021 | | | 2020 | | | 2019(A) | |
| Net asset value, beginning of year/period | | $ | 19.66 | | | $ | 20.10 | | | $ | 20.00 | | | $ | 19.64 | | | $ | 20.08 | | | $ | 20.00 | |
| | | | | | | | | | | | | | | | | | | | | | | | | |
| INCOME FROM INVESTMENT OPERATIONS: | | | | | | | | | | | | | | | | | | | | | | | | |
| Net investment income (B) | | | 0.74 | | | | 0.43 | | | | 0.32 | | | | 0.72 | | | | 0.37 | | | | 0.30 | |
| Net realized and unrealized gain on investments | | | 0.28 | | | | 0.11 | | | | 0.06 | | | | 0.24 | | | | 0.13 | | | | 0.05 | |
| Total from investment operations | | | 1.02 | | | | 0.54 | | | | 0.38 | | | | 0.96 | | | | 0.50 | | | | 0.35 | |
| | | | | | | | | | | | | | | | | | | | | | | | | |
| LESS DISTRIBUTIONS: | | | | | | | | | | | | | | | | | | | | | | | | |
| From net investment income | | | (0.99 | ) | | | (0.93 | ) | | | (0.25 | ) | | | (0.94 | ) | | | (0.89 | ) | | | (0.24 | ) |
| From net realized gains on investments | | | — | | | | — | | | | (0.03 | ) | | | — | | | | — | | | | (0.03 | ) |
| From Return of capital | | | (0.00 | ) (C) | | | (0.05 | ) | | | — | | | | (0.00 | ) (C) | | | (0.05 | ) | | | — | |
| Total distributions | | | (0.99 | ) | | | (0.98 | ) | | | (0.28 | ) | | | (0.94 | ) | | | (0.94 | ) | | | (0.27 | ) |
| | | | | | | | | | | | | | | | | | | | | | | | | |
| Net asset value, end of year/period | | $ | 19.69 | | | $ | 19.66 | | | $ | 20.10 | | | $ | 19.66 | | | $ | 19.64 | | | $ | 20.08 | |
| | | | | | | | | | | | | | | | | | | | | | | | | |
| Total return (D) | | | 5.30 | % | | | 2.83 | % | | | 1.91 | % (E) | | | 5.00 | % | | | 2.60 | % | | | 1.74 | % (E) |
| | | | | | | | | | | | | | | | | | | | | | | | | |
| RATIOS/SUPPLEMENTAL DATA: | | | | | | | | | | | | | | | | | | | | | | | | |
| Net assets, end of year/period (in 000’s) | | $ | 670,278 | | | $ | 352,892 | | | $ | 76,833 | | | $ | 58,164 | | | $ | 37,224 | | | $ | 5,449 | |
| Ratios to average net assets (including interest expense) | | | | | | | | | | | | | | | | | | | | | | | | |
| Expenses, before waiver and reimbursement (G) | | | 1.77 | % | | | 1.80 | % | | | 2.06 | % (F) | | | 2.03 | % | | | 2.10 | % | | | 2.21 | % (F) |
| Expenses, net waiver and reimbursement (G) | | | 1.75 | % | | | 1.75 | % | | | 1.75 | % (F) | | | 2.00 | % | | | 2.00 | % | | | 2.00 | % (F) |
| Net investment income | | | 3.75 | % | | | 2.17 | % | | | 3.48 | % (F) | | | 3.67 | % | | | 1.88 | % | | | 3.22 | % (F) |
| Portfolio turnover rate | | | 37 | % | | | 4 | % | | | 14 | % (E) | | | 37 | % | | | 4 | % | | | 14 | % (E) |
| | | | | | | | | | | | | | | | | | | | | | | | | |
| (A) | The Rational Special Situations Income Fund Institutional Class, Class A and Class C Shares commenced operations July 17, 2019. |
| (B) | Per share amounts calculated using average shares method, which more appropriately presents the per share data for the year/period. |
| (C) | Represents an amount less than $0.01 per share. |
| (D) | Total return in the above table represents the rate that the investor would have earned or lost on an investment in the Fund assuming reinvestment of dividends and does not reflect the impact of sales charges. |
| (G) | Ratios to average net assets (excluding interest expense) |
| Expenses, before waiver and reimbursement | | | 1.77 | % | | | 1.80 | % | | | 2.06 | % | | | 2.03 | % | | | 2.10 | % | | | 2.21 | % |
| Expenses, net waiver and reimbursement | | | 1.75 | % | | | 1.75 | % | | | 1.75 | % | | | 2.00 | % | | | 2.00 | % | | | 2.00 | % |
| | | | | | | | | | | | | | | | | | | | | | | | | |
See accompanying notes to financial statements.
| RATIONAL FUNDS |
| Rational Special Situations Income Fund (Continued) |
| Financial Highlights |
| |
| For a Share Outstanding Throughout Each Year/Period |
| | | Class C | |
| | | For the | | | For the | | | For the | |
| | | Year Ended | | | Year Ended | | | Period Ended | |
| | | December 31, | | | December 31, | | | December 31, | |
| | | 2021 | | | 2020 | | | 2019(A) | |
| Net asset value, beginning of year/period | | $ | 19.60 | | | $ | 20.06 | | | $ | 20.00 | |
| | | | | | | | | | | | | |
| INCOME FROM INVESTMENT OPERATIONS: | | | | | | | | | | | | |
| Net investment income (B) | | | 0.48 | | | | 0.21 | | | | 0.23 | |
| Net realized and unrealized gain on investments | | | 0.33 | | | | 0.14 | | | | 0.05 | |
| Total from investment operations | | | 0.81 | | | | 0.35 | | | | 0.28 | |
| | | | | | | | | | | | | |
| LESS DISTRIBUTIONS: | | | | | | | | | | | | |
| From net investment income | | | (0.80 | ) | | | (0.76 | ) | | | (0.19 | ) |
| From net realized gains on investments | | | — | | | | — | | | | (0.03 | ) |
| From Return of capital | | | (0.00 | ) (C) | | | (0.05 | ) | | | — | |
| Total distributions | | | (0.80 | ) | | | (0.81 | ) | | | (0.22 | ) |
| | | | | | | | | | | | | |
| Net asset value, end of year/period | | $ | 19.61 | | | $ | 19.60 | | | $ | 20.06 | |
| | | | | | | | | | | | | |
| Total return (D) | | | 4.22 | % | | | 1.82 | % | | | 1.43 | % (E) |
| | | | | | | | | | | | | |
| RATIOS/SUPPLEMENTAL DATA: | | | | | | | | | | | | |
| Net assets, end of year/period (in 000’s) | | $ | 35,497 | | | $ | 14,123 | | | $ | 1,289 | |
| Ratios to average net assets (including interest expense) | | | | | | | | | | | | |
| Expenses, before waiver and reimbursement (G) | | | 2.74 | % | | | 2.77 | % | | | 2.97 | % (F) |
| Expenses, net waiver and reimbursement (G) | | | 2.75 | % | | | 2.75 | % | | | 2.75 | % (F) |
| Net investment income | | | 2.46 | % | | | 1.05 | % | | | 2.47 | % (F) |
| Portfolio turnover rate | | | 37 | % | | | 4 | % | | | 14 | % (E) |
| | | | | | | | | | | | | |
| (A) | The Rational Special Situations Income Fund Institutional Class, Class A and Class C Shares commenced operations July 17, 2019. |
| (B) | Per share amounts calculated using average shares method, which more appropriately presents the per share data for the year/period. |
| (C) | Represents an amount less than $0.01 per share. |
| (D) | Total return in the above table represents the rate that the investor would have earned or lost on an investment in the Fund assuming reinvestment of dividends and does not reflect the impact of sales charges. |
| (G) | Ratios to average net assets (excluding interest expense) |
| Expenses, before waiver and reimbursement | | | 2.74 | % | | | 2.77 | % | | | 2.97 | % |
| Expenses, net waiver and reimbursement | | | 2.75 | % | | | 2.75 | % | | | 2.75 | % |
| | | | | | | | | | | | | |
See accompanying notes to financial statements.
| RATIONAL FUNDS |
| Rational Inflation Growth Fund |
| Financial Highlights |
| |
| For a Share Outstanding Throughout Each Year/Period |
| | | Institutional | | | Class A | | | Class C | |
| | | For the | | | For the | | | For the | |
| | | Period Ended | | | Period Ended | | | Period Ended | |
| | | December 31, | | | December 31, | | | December 31, | |
| | | 2021(A) | | | 2021(A) | | | 2021(A) | |
| Net asset value, beginning of period | | $ | 10.00 | | | $ | 10.00 | | | $ | 10.00 | |
| | | | | | | | | | | | | |
| INCOME (LOSS) FROM INVESTMENT OPERATIONS: | | | | | | | | | | | | |
| Net investment income (B) | | | 0.25 | | | | 0.49 | | | | 0.70 | |
| Net realized and unrealized loss on investments | | | (0.38 | ) | | | (0.63 | ) | | | (0.86 | ) |
| Total from investment operations | | | (0.13 | ) | | | (0.14 | ) | | | (0.16 | ) |
| | | | | | | | | | | | | |
| LESS DISTRIBUTIONS: | | | | | | | | | | | | |
| From net investment income | | | (0.07 | ) | | | (0.07 | ) | | | (0.07 | ) |
| From net realized gains on investments | | | — | | | | — | | | | — | |
| Total distributions | | | (0.07 | ) | | | (0.07 | ) | | | (0.07 | ) |
| | | | | | | | | | | | | |
| Net asset value, end of period | | $ | 9.80 | | | $ | 9.79 | | | $ | 9.77 | |
| | | | | | | | | | | | | |
| Total return (C) | | | (1.26 | )% (D) | | | (1.39 | )% (D) | | | (1.60 | )% (D) |
| | | | | | | | | | | | | |
| RATIOS/SUPPLEMENTAL DATA: | | | | | | | | | | | | |
| Net assets, end of period (in 000’s) | | $ | 1,360 | | | $ | 697 | | | $ | 26 | |
| Ratios to average net assets | | | | | | | | | | | | |
| Expenses, before waiver and reimbursement | | | 12.47 | % (E) | | | 12.72 | % (E) | | | 13.47 | % (E) |
| Expenses, net waiver and reimbursement | | | 1.49 | % (E) | | | 1.74 | % (E) | | | 2.49 | % (E) |
| Net investment income | | | 6.83 | % (E) | | | 13.23 | % (E) | | | 19.41 | % (E) |
| Portfolio turnover rate | | | 0 | % (D) | | | 0 | % (D) | | | 0 | % (D) |
| | | | | | | | | | | | | |
| (A) | The Rational Inflation Growth Fund commenced operations August 18, 2021. |
| (B) | Per share amounts calculated using average shares method, which more appropriately presents the per share data for the period. |
| (C) | Total return in the above table represents the rate that the investor would have earned or lost on an investment in the Fund assuming reinvestment of dividends and does not reflect the impact of sales charges. |
See accompanying notes to consolidated financial statements.
| RATIONAL FUNDS | |
| CONSOLIDATED NOTES TO FINANCIAL STATEMENTS |
| December 31, 2021 | ANNUAL REPORT |
(1) ORGANIZATION AND SIGNIFICANT ACCOUNTING POLICIES
The Mutual Fund and Variable Insurance Trust (the “Trust”) was organized as a Delaware statutory trust on June 23, 2006. The Trust is registered under the Investment Company Act of 1940, as amended (the “1940 Act”), as an open-end management investment company. As of December 31, 2021, the Trust operated 8 separate series, or mutual funds, each with its own investment objective and strategy. Rational Inflation Growth Fund commenced operations on August 18, 2021. This report contains financial statements and financial highlights of the funds listed below (individually referred to as a “Fund”, or collectively as the “Funds”):
| Fund | Sub-Advisor | Primary Objective |
Rational Equity Armor Fund
(“Equity Armor”) | Equity Armor Investments, LLC | Total return on investment, with dividend income an important component of that return. |
Rational Tactical Return Fund
(“Tactical Return”) | Warrington Asset Management, LLC | Total return consisting of long-term capital appreciation and income. |
Rational Dynamic Brands Fund
(“Dynamic Brands”) | Accuvest Global Advisors, Inc. | Long-term capital appreciation. |
Rational Strategic Allocation Fund
(“Strategic Allocation”) | | Current income and moderate appreciation of capital. |
Rational/ReSolve Adaptive Asset Allocation Fund
(“ReSolve Adaptive”) | ReSolve Asset Management, Inc. | Long-term capital appreciation. |
Rational/Pier 88 Convertible Securities Fund
(“Pier 88”) | Pier 88 Investment Partners, LLC | Total return consisting of capital appreciation and income. |
Rational Special Situations Income Fund
(“Special Situations”) | ESM Management, LLC | Total return consisting of capital appreciation and income. |
Rational Inflation Growth Fund
(“Inflation Growth”) | SL Advisors, LLC | Long-term capital appreciation. |
The Funds are classified as diversified funds under the 1940 Act, except Special Situations, Pier 88 and Inflation Growth, which are classified as non-diversified funds.
Currently, all Funds offer Class A, Class C and Institutional shares. Each class of shares for each Fund has identical rights and privileges except with respect to distribution (12b-1) and service fees, if any, voting rights on matters affecting a single class of shares, exchange privileges of each class of shares and sales charges. The price at which the Funds will offer or redeem shares is the net asset value (“NAV”) per share next determined after the order is considered received, subject to any applicable front end or contingent deferred sales charges. Class A shares have a maximum sales charge on purchases of 5.75% for ReSolve Adaptive and Inflation Growth and 4.75% for all other Funds as a percentage of the original purchase price. Class C shares have a contingent deferred sales charge of 1.00% on shares sold within one year of purchase. Each Fund’s prospectus provides a description of each Fund’s investment objectives, policies and strategies along with information on the classes of shares currently being offered.
(2) SIGNIFICANT ACCOUNTING POLICIES
The following is a summary of significant accounting policies consistently followed by the Funds and are in accordance with accounting principles generally accepted in the United States of America (“GAAP”). Each Fund is an investment company and accordingly follows the investment company accounting and reporting guidance of the Financial Accounting Standards Board (“FASB”) Accounting Standard Codification Topic 946 Financial Services – Investment Companies.
The preparation of financial statements in conformity with GAAP requires management to make estimates and assumptions that affect the amounts of assets, liabilities, and disclosure of contingent assets and liabilities at the date of the financial statements and the reported amounts of income and expenses for the period. Actual results could differ from those estimates.
A. Investment Valuations
All investments in securities are recorded at their estimated fair value. In computing the NAV of the Funds, fair value is based on market valuations with respect to portfolio securities for which market quotations are readily available. Pursuant to Trustee-approved policies, the Trust relies on certain security pricing services to provide the current market value of securities. Those security pricing services value equity securities (including foreign equity securities, exchange-traded funds
| RATIONAL FUNDS | |
| CONSOLIDATED NOTES TO FINANCIAL STATEMENTS (Continued) |
| December 31, 2021 | ANNUAL REPORT |
and closed-end funds) traded on a securities exchange at the last reported sales price on the principal exchange. Equity securities quoted by NASDAQ are valued at the NASDAQ official closing price. If there is no reported sale on the principal exchange, and in the case of over-the counter securities, equity securities are valued at a bid price estimated by the security pricing service. Debt securities (other than short-term obligations) are valued each day by an independent pricing service approved by the Board of Trustees (the “Board”) using methods which include current market quotations from a major market maker in the securities and based on methods which include the consideration of yields or prices of securities of comparable quality, coupon, maturity and type. Option contracts are generally valued at the close. If the close price is outside the bid and the ask price; the quote closest to the close is used. When there is no trading volume the mean of the bid and ask is used. Foreign securities quoted in foreign currencies are translated into U.S. dollars at the foreign exchange rate in effect as of the close of the NYSE. Investments in open-end investment companies (except for exchange-traded funds) are valued at their respective net asset value as reported by such companies. Futures, which are traded on an exchange, are valued at the settlement price determined by the exchange. Short-term debt obligations having 60 days or less remaining until maturity, at time of purchase, may be valued at amortized cost.
Securities for which market quotations are not readily available are valued at fair value under Trust procedures approved by the Board. In these cases, a Pricing Committee, established and appointed by the Board, determines in good faith, subject to Trust procedures, the fair value of portfolio securities held by a Fund (“good faith fair valuation”). When a good faith fair valuation of a security is required, consideration is generally given to a number of factors including, but not limited to the following: dealer quotes, published analyses by dealers or analysts regarding the security, transactions which provide implicit valuation of the security (such as a merger or tender offer transaction), the value of other securities or contracts which derive their value from the security at issue, and the implications of any other circumstances which have caused trading in the security to halt. With respect to certain categories of securities, the procedures utilized by the Pricing Committee detail specific valuation methodologies to be applied in lieu of considering the aforementioned list of factors.
Fair valuation procedures are also used when a significant event affecting the value of a portfolio security is determined to have occurred between the time when the price of the portfolio security is determined and the close of trading on the NYSE, which is when each Fund’s NAV is computed. An event is considered significant if there is both an affirmative expectation that the security’s value will change in response to the event and a reasonable basis for quantifying the resulting change in value. Significant events include significant securities’ market movements occurring between the time the price of the portfolio security is determined and the close of trading on the NYSE. For securities normally priced at their last sale price in a foreign market, such events can occur between the close of trading in the foreign market and the close of trading on the NYSE.
In some cases, events affecting the issuer of a portfolio security may be considered significant events. Examples of potentially significant events include announcements concerning earnings, acquisitions, new products, management changes, litigation developments, a strike or natural disaster affecting the company’s operations or regulatory changes or market developments affecting the issuer’s industry occurring between the time when the price of the portfolio security is determined and the close of trading on the NYSE. For securities of foreign issuers, such events could also include political or other developments affecting the economy or markets in which the issuer conducts its operations or its securities are traded.
There can be no assurance that a Fund could purchase or sell a portfolio security at the price used to calculate the Fund’s NAV. In the case of good faith fair valued portfolio securities, lack of information and uncertainty as to the significance of information may lead to a conclusion that a prior valuation is the best indication of a portfolio security’s present value. Good faith fair valuations generally remain unchanged until new information becomes available. Consequently, changes in good faith fair valuation of portfolio securities may be less frequent and of greater magnitude than changes in the price of portfolio securities valued at their last sale price, by an independent pricing service, or based on market quotations.
Valuation of Fund of Funds – The Funds may invest in portfolios of open-end or closed-end investment companies (the “Underlying Funds”). The Underlying Funds value securities in their portfolios for which market quotations are readily available at their market values (generally the last reported sale price) and all other securities and assets at their fair value based upon the methods established by the board of directors of the Underlying Funds.
| RATIONAL FUNDS | |
| CONSOLIDATED NOTES TO FINANCIAL STATEMENTS (Continued) |
| December 31, 2021 | ANNUAL REPORT |
Open-end investment companies are valued at their respective net asset values as reported by such investment companies. The shares of many closed-end investment companies, after their initial public offering, frequently trade at a price per share, which is different than the net asset value per share. The difference represents a market premium or market discount of such shares. There can be no assurances that the market discount or market premium on shares of any closed-end investment company purchased by the Funds will not change.
The Trust calculates the NAV for each of the Funds by valuing securities held based on fair value. Fair value is defined as the price that would be received to sell an asset or paid to transfer a liability in an orderly transaction between market participants at the measurement date. The valuation techniques described below maximize the use of observable inputs and minimize the use of unobservable inputs in determining fair value. The inputs used for valuing the Funds’ investments are summarized in the three broad levels listed below:
| ● | Level 1 - unadjusted quoted prices in active markets for identical investments and/or registered investment companies where the value per share is determined and published and is the basis for current transactions for identical assets or liabilities at the valuation date. |
| ● | Level 2 - other significant observable inputs (including quoted prices for similar securities, interest rates, prepayment speeds, credit risk, etc.). |
| ● | Level 3 - significant unobservable inputs (including the Funds’ own assumptions in determining the fair value of investments). |
Changes in valuation techniques may result in transfers in or out of an assigned level within the disclosure hierarchy. The inputs or methodology used for valuing investments is not necessarily an indication of the risk associated with investing in those investments.
The inputs or methodology used for valuing securities are not necessarily an indication of the risk associated with investing in those securities. The following tables summarize the inputs used as of December 31, 2021, for each Fund’s assets and liabilities measured at fair value:
| Equity Armor | | | | | | | | | | | | |
| | | | | | | | | | | | | |
| Assets* | | Level 1 | | | Level 2 | | | Level 3 | | | Total | |
| Common Stocks | | $ | 64,076,692 | | | $ | — | | | $ | — | | | $ | 64,076,692 | |
| Short-Term Investments | | | 2,882,062 | | | | — | | | | — | | | | 2,882,062 | |
| Derivatives | | | | | | | | | | | | | | | | |
| Purchased Options | | $ | 2,351,251 | | | $ | — | | | $ | — | | | $ | 2,351,251 | |
| Futures Contracts | | | 531,527 | | | | — | | | | — | | | | 531,527 | |
| Total Assets | | $ | 69,841,532 | | | $ | — | | | $ | — | | | $ | 69,841,532 | |
| Liabilities* | | | | | | | | | | | | | | | | |
| Derivatives | | | | | | | | | | | | | | | | |
| Written Options | | $ | 543,125 | | | $ | — | | | $ | — | | | $ | 543,125 | |
| Futures Contracts | | | 919,857 | | | | — | | | | — | | | | 919,857 | |
| Total Liabilities | | $ | 1,462,982 | | | $ | — | | | $ | — | | | $ | 1,462,982 | |
| | | | | | | | | | | | | | | | | |
| Tactical Return | | | | | | | | | | | | |
| | | | | | | | | | | | | |
| Assets* | | Level 1 | | | Level 2 | | | Level 3 | | | Total | |
| Short-Term Investments | | $ | 190,637,306 | | | $ | — | | | $ | — | | | $ | 190,637,306 | |
| Total Assets | | $ | 190,637,306 | | | $ | — | | | $ | — | | | $ | 190,637,306 | |
| RATIONAL FUNDS | |
| CONSOLIDATED NOTES TO FINANCIAL STATEMENTS (Continued) |
| December 31, 2021 | ANNUAL REPORT |
| Dynamic Brands | | | | | | | | | | | | |
| | | | | | | | | | | | | |
| Assets* | | Level 1 | | | Level 2 | | | Level 3 | | | Total | |
| Common Stocks | | $ | 111,242,484 | | | $ | — | | | $ | — | | | $ | 111,242,484 | |
| Short-Term Investments | | | 177,647 | | | | — | | | | — | | | | 177,647 | |
| Total Assets | | $ | 111,420,131 | | | $ | — | | | $ | — | | | $ | 111,420,131 | |
| | | | | | | | | | | | | | | | | |
| Strategic Allocation | | | | | | | | | | | | |
| | | | | | | | | | | | | |
| Assets* | | Level 1 | | | Level 2 | | | Level 3 | | | Total | |
| Open End Funds | | $ | 8,558,193 | | | $ | — | | | $ | — | | | $ | 8,558,193 | |
| Short-Term Investments | | | 815,854 | | | | — | | | | — | | | | 815,854 | |
| Derivatives | | | | | | | | | | | | | | | | |
| Futures Contract | | $ | 225,560 | | | $ | — | | | $ | — | | | $ | 225,560 | |
| Total Assets | | $ | 9,599,607 | | | $ | — | | | $ | — | | | $ | 9,599,607 | |
| | | | | | | | | | | | | | | | | |
| ReSolve Adaptive | | | | | | | | | | | | |
| | | | | | | | | | | | | |
| Assets* | | Level 1 | | | Level 2 | | | Level 3 | | | Total | |
| Short-Term Investments | | $ | 61,259,968 | | | $ | — | | | $ | — | | | $ | 61,259,968 | |
| Derivatives | | | | | | | | | | | | | | | | |
| Futures Contracts | | | 1,100,826 | | | | — | | | | — | | | | 1,100,826 | |
| Total Assets | | $ | 62,360,794 | | | $ | — | | | $ | — | | | $ | 62,360,794 | |
| Liabilities* | | | | | | | | | | | | | | | | |
| Derivatives | | | | | | | | | | | | | | | | |
| Futures Contracts | | $ | 737,268 | | | $ | — | | | $ | — | | | $ | 737,268 | |
| Total Liabilities | | $ | 737,268 | | | $ | — | | | $ | — | | | $ | 737,268 | |
| | | | | | | | | | | | | | | | | |
| Pier 88 | | | | | | | | | | | | |
| | | | | | | | | | | | | |
| Assets* | | Level 1 | | | Level 2 | | | Level 3 | | | Total | |
| Common Stocks | | $ | 2,284,075 | | | $ | — | | | $ | — | | | $ | 2,284,075 | |
| Preferred Stocks | | | 52,040,016 | | | | — | | | | — | | | | 52,040,016 | |
| Convertible Bonds | | | — | | | | 62,992,091 | | | | — | | | | 62,992,091 | |
| Short-Term Investments | | | 3,318,618 | | | | — | | | | — | | | | 3,318,618 | |
| Total Assets | | $ | 57,642,709 | | | $ | 62,992,091 | | | $ | — | | | $ | 120,634,800 | |
| | | | | | | | | | | | | | | | | |
| Special Situations | | | | | | | | | | | | |
| | | | | | | | | | | | | |
| Assets* | | Level 1 | | | Level 2 | | | Level 3 | | | Total | |
| Preferred Stocks | | $ | — | | | $ | 2,060,000 | | | $ | — | | | $ | 2,060,000 | |
| Asset Backed Securities | | | — | | | | 577,482,294 | | | | — | | | | 577,482,294 | |
| Corporate Bonds | | | — | | | | 124,325,084 | | | | — | | | | 124,325,084 | |
| Short-Term Investments | | | 57,654,111 | | | | — | | | | — | | | | 57,654,111 | |
| Total Assets | | $ | 57,654,111 | | | $ | 703,867,378 | | | $ | — | | | $ | 761,521,489 | |
| RATIONAL FUNDS | |
| CONSOLIDATED NOTES TO FINANCIAL STATEMENTS (Continued) |
| December 31, 2021 | ANNUAL REPORT |
| Inflation Growth | | | | | | | | | | | | |
| | | | | | | | | | | | | |
| Assets* | | Level 1 | | | Level 2 | | | Level 3 | | | Total | |
| Common Stocks | | $ | 1,563,491 | | | $ | — | | | $ | — | | | $ | 1,563,491 | |
| Exchange-Traded Funds | | | 452,811 | | | | — | | | | — | | | | 452,811 | |
| Short-Term Investments | | | 30,892 | | | | — | | | | — | | | | 30,892 | |
| Total Assets | | $ | 2,047,194 | | | $ | — | | | $ | — | | | $ | 2,047,194 | |
| * | Refer to the Schedule of Investments for industry classifications. |
There were no level 3 securities held during the period for any Fund.
Consolidation of Subsidiaries – The consolidated financial statements of the ReSolve Adaptive include the accounts of RDMF Fund Ltd. (“RDMF” or “CFC”), a wholly-owned and controlled foreign subsidiary. All inter-company accounts and transactions have been eliminated in consolidation.
Each Fund may invest up to 25% of its total assets in a controlled foreign corporation, which acts as an investment vehicle in order to affect certain investments consistent with ReSolve Adaptive’s respective investment objectives and policies.
| | Inception Date of | CFC Net Assets as of | % of Net Assets as of |
| | CFC | December 31, 2021 | December 31, 2021 |
| RDMF Fund, Ltd. | 8/5/2016 | $ 9,517,589 | 14.5% |
For tax purposes, this is an exempted Cayman investment company. The CFC has received an undertaking from the Government of the Cayman Islands exempting it from all local income, profits and capital gains taxes. No such taxes are levied in the Cayman Islands at the present time. For U.S. income tax purposes, a CFC is a Controlled Foreign Corporation which generates and is allocated no income which is considered effectively connected with U.S. trade or business and as such is not subject to U.S. income tax. However, as a wholly-owned Controlled Foreign Corporation, RDMF’s net income and capital gain, to the extent of its earnings and profits, will be included each year in the ReSolve Adaptive’s investment company taxable income.
B. Foreign Currency Translation
The accounting records of the Funds are maintained in U.S. dollars. Foreign currency amounts are translated into U.S. dollars at the current rate of exchange each business day to determine the value of investments, and other assets and liabilities. Purchases and sales of foreign securities, and income and expenses, are translated at the prevailing rate of exchange on the respective date of these transactions. The Funds do not isolate that portion of the results of operations resulting from changes in foreign exchange rates on investments from fluctuation arising from changes in market prices of securities held. These fluctuations are included with the net realized and unrealized gain or loss from investments and foreign currency transactions.
Reported net realized foreign exchange gains or losses arise from sales of portfolio securities; sales and maturities of short term securities; sales of foreign currencies; currency gains or losses realized between the trade and settlement dates on securities transactions; and the difference between the amounts of dividends, interest, and foreign withholding taxes recorded on the Funds’ books and the U.S. dollar equivalent of the amounts actually received or paid. Net unrealized foreign exchange gains and losses arise from changes in the values of assets and liabilities, including investments in securities at fiscal period-end, resulting from changes in the exchange rate.
C. Derivative Instruments
Certain of the Funds may be subject to equity price risk, commodity risk, interest rate risk and foreign currency exchange risk in the normal course of pursuing their investment objectives. Certain of the Funds may invest in various financial instruments including positions in foreign currency contracts, written and purchased option contracts and futures contracts to gain exposure to or hedge against changes in the value of equities or foreign currencies. The following is a description of
| RATIONAL FUNDS | |
| CONSOLIDATED NOTES TO FINANCIAL STATEMENTS (Continued) |
| December 31, 2021 | ANNUAL REPORT |
the derivative instruments utilized by the Funds, including the primary underlying risk exposure related to each instrument type.
Futures Contracts – Certain of the Funds may purchase and sell futures contracts. A Fund may use futures contracts to gain exposure to, or hedge against changes in the value of underlying reference assets, such as equities, interest rates, commodities prices or foreign currencies. Upon entering into a contract, the Fund deposits and maintains as collateral such initial margin as required by the exchange on which the transaction is affected. Pursuant to the contract, the Fund agrees to receive from or pay to the broker an amount of cash equal to the daily fluctuation in value of the contract. Such receipts or payments are known as “variation margin” and are recorded by the Fund as unrealized gains and losses. When the contract is closed, the Fund records a realized gain or loss equal to the difference between the value of the contract at the time it was opened and the value at the time it was closed. As collateral for futures contracts, the Fund is required under the 1940 Act to maintain assets consisting of cash, cash equivalents or liquid securities. This collateral is required to be adjusted daily to reflect the market value of the purchase obligation for long futures contracts or the market value of the instrument underlying the contract, but not less than the market price at which the futures contract was established, for short futures contracts.
Options Contracts – Certain Funds may purchase put and call options and write put and call options. The premium paid for a purchased put or call option plus any transaction costs will reduce the benefit, if any, realized by a Fund upon exercise of the option, and, unless the price of the underlying security rises or declines sufficiently, the option may expire worthless to the Funds. In addition, in the event that the price of the security in connection with which an option was purchased moves in a direction favorable to the Funds, the benefits realized by the Funds as a result of such favorable movement will be reduced by the amount of the premium paid for the option and related transaction costs.
When a Fund writes an option, an amount equal to the premium received by the Fund is recorded as a liability and is subsequently adjusted to the current fair value of the option written. Premiums received from writing options that expire unexercised are treated by the Funds on the expiration date as realized gains from investments. The difference between the premium and the amount paid on effecting a closing purchase transaction, including brokerage commissions, is also treated as a realized gain, or, if the premium is less than the amount paid for the closing purchase transaction, as a realized loss. If a call option is exercised, the premium is added to the proceeds from the sale of the underlying security or currency in determining whether the Funds have realized gains or losses. If a put option is exercised, the premium reduces the cost basis of the securities purchased by the Funds.
Written and purchased options are non-income producing securities. With options, there is minimal counterparty risk to the Funds since these options are exchange traded and the exchange’s clearinghouse acts as counterparty to all exchange traded options and guarantees against a possible default. Initial margin deposits required upon entering into options contracts are satisfied by the deposits of cash as collateral for the account of the broker (the Fund’s agent in acquiring the options).
Convertible Securities – Pier 88 invests in convertible securities, which include fixed income securities that may be exchanged or converted into a predetermined number of shares of the issuer’s underlying common stock at the option of the holder during a specified period. Convertible securities may take the form of convertible preferred stock, convertible bonds or debentures, units consisting of “usable” bonds and warrants or a combination of the features of several of these securities. The investment characteristics of each convertible security vary widely, which allows convertible securities to be employed for a variety of investment strategies. The Fund will exchange or convert the convertible securities held in its portfolio into shares of the underlying common stock when, in the Advisor’s or Sub-Advisor’s opinion, the investment characteristics of the underlying common shares will assist the Fund in achieving its investment objective. Otherwise, the Fund may hold or trade convertible securities.
| RATIONAL FUNDS | |
| CONSOLIDATED NOTES TO FINANCIAL STATEMENTS (Continued) |
| December 31, 2021 | ANNUAL REPORT |
The derivatives are not accounted for as hedging instruments under GAAP. The effect of derivative instruments on the Statements of Assets and Liabilities and Consolidated Statements of Assets and Liabilities at December 31, 2021, were as follows:
| | | | | | | Location of derivatives on Statements | | Fair value of asset/liability | |
| Fund | | Derivative | | Risk Type | | of Assets and Liabilities | | derivatives | |
| Equity Armor | | | | | | | | |
| | | Futures | | Equity | | Futures unrealized appreciation | | $ | 531,527 | |
| | | | | | | Futures unrealized depreciation | | | (919,857 | ) |
| | | | | | | Totals | | $ | (388,330 | ) |
| | | | | | | | | | | |
| | | Options | | Equity | | Securities at Value | | $ | 2,351,251 | |
| | | | | | | | | $ | 2,351,251 | |
| | | | | | | | | | | |
| | | Options | | Equity | | Options Written | | $ | 543,125 | |
| | | | | | | | | $ | 543,125 | |
| Strategic Allocation | | | | | | | | |
| | | | | | | | | | | |
| | | Futures | | Equity | | Futures unrealized appreciation | | $ | 225,560 | |
| | | | | | | Totals | | $ | 225,560 | |
| ReSolve Adaptive | | | | | | | | |
| | | | | | | | | | | |
| | | Futures | | Equity | | Futures unrealized appreciation | | $ | 378,897 | |
| | | | | | | Futures unrealized depreciation | | | (36,716 | ) |
| | | | | Commodity | | Futures unrealized appreciation | | | 591,235 | |
| | | | | | | Futures unrealized depreciation | | | (284,037 | ) |
| | | | | Currency | | Futures unrealized appreciation | | | 84,870 | |
| | | | | | | Futures unrealized depreciation | | | (21,289 | ) |
| | | | | Interest | | Futures unrealized appreciation | | | 45,824 | |
| | | | | | | Futures unrealized depreciation | | | (395,226 | ) |
| | | | | | | Totals | | $ | 363,558 | |
| RATIONAL FUNDS | |
| CONSOLIDATED NOTES TO FINANCIAL STATEMENTS (Continued) |
| December 31, 2021 | ANNUAL REPORT |
The effect of derivative instruments on the Statements of Operations and Consolidated Statements of Operations for the Funds, for the year ended December 31, 2021, were as follows:
| | | | | | | | | Realized and unrealized gain | |
| Fund | | Derivative | | Risk Type | | Location of gain (loss) on derivatives | | (loss) on derivatives | |
| Equity Armor | | Options Purchased | | Equity | | Net realized loss from options purchased | | $ | (683,372 | ) |
| | | | | | | | | | | |
| | | Options Written | | Equity | | Net realized gain from options written | | | 259,472 | |
| | | Futures | | Equity | | Net realized loss from futures | | | (2,877,781 | ) |
| | | | | | | Totals | | $ | (3,301,681 | ) |
| | | Options Purchased | | Equity | | Net change in unrealized appreciation on options purchased | | $ | 422,813 | |
| | | Options Written | | Equity | | Net change in unrealized appreciation on options written | | | 65,312 | |
| | | Futures | | Equity | | Net change in unrealized depreciation on futures | | | (328,268 | ) |
| Tactical Return | | | | Totals | | $ | 159,857 | |
| | | Options Purchased | | Equity | | Net realized loss from options purchased | | $ | (2,103,046 | ) |
| | | Options Written | | Equity | | Net realized gain from options written | | | 16,428,204 | |
| | | Futures | | Equity | | Net realized gain from futures | | | 4,324 | |
| | | | | | | Totals | | $ | 14,329,482 | |
| | | Options Written | | Equity | | Net change in unrealized depreciation on options written | | $ | (33,266 | ) |
| | | | | | | | | | | |
| Strategic Allocation | | | | | | | | |
| | | Futures | | Equity | | Net realized gain from futures | | $ | 2,205,142 | |
| | | | | | | | | | | |
| | | Futures | | Equity | | Net change in unrealized appreciation on futures | | | 41,180 | |
| | | | | | | Totals | | $ | 2,246,322 | |
| | | | | | | | | | | |
| ReSolve Adaptive | | | | | | | | |
| | | Futures | | Equity | | Net realized gain from futures | | $ | 2,638,392 | |
| | | | | | | | | | | |
| | | | | Commodity | | Net realized gain from futures | | | 10,818,730 | |
| | | | | Currency | | Net realized loss from futures | | | (3,538,853 | ) |
| | | | | Interest | | Net realized loss from futures | | | 286,038 | |
| | | | | | | Totals | | $ | 10,204,307 | |
| | | Futures | | Equity | | Net change in unrealized depreciation on futures | | $ | (1,378 | ) |
| | | | | Commodity | | Net change in unrealized depreciation on futures | | | (1,317,202 | ) |
| | | | | Currency | | Net change in unrealized depreciation on futures | | | (209,165 | ) |
| | | | | Interest | | Net change in unrealized appreciation on futures | | | (512,385 | ) |
| | | | | | | Totals | | $ | (2,040,130 | ) |
| | | | | | | | | | | |
| Inflation Growth | | Futures | | Equity | | Net realized loss from futures | | $ | (72,712 | ) |
The value of derivative instruments outstanding as of December 31, 2021 as disclosed in the Schedules of Investments (Consolidated Schedule of Investments for ReSolve Adaptive) and the amounts realized and changes in unrealized gains and losses on derivative instruments during the period as disclosed above and within the Statements of Operations (Consolidated Statements of Operations for ReSolve Adaptive) serve as indicators of the volume of derivative activity for the Funds.
| RATIONAL FUNDS | |
| CONSOLIDATED NOTES TO FINANCIAL STATEMENTS (Continued) |
| December 31, 2021 | ANNUAL REPORT |
Balance Sheet Offsetting Information
The following table provides a summary of offsetting financial assets and liabilities derivatives and the effect of the derivative instruments on the Statements of Assets and Liabilities and Consolidated Statements of Assets and Liabilities as of December 31, 2021:
| | | | | | | | | | | | Gross Amounts of Assets Presented in the | | | | |
| | | | | | | | | | | | (Consolidated) Statement of Assets & Liabilities | | | | |
| | | | | | Gross Amounts | | | Net Amounts | | | | | | | | | | |
| | | Gross Amounts | | | Offset in the | | | Presented in the | | | | | | | | | | |
| | | Recognized in the | | | (Consolidated) | | | (Consolidated) | | | | | | | | | | |
| | | (Consolidated) | | | Statements of | | | Statements of | | | | | | | | | | |
| | | Statements of Assets | | | Assets and | | | Assets and | | | Financial | | | Cash Collateral | | | | |
| | | and Liabilities | | | Liabilities | | | Liabilities | | | Instruments | | | Pledged/Received (1) | | | Net Amount | |
| Equity Armor | | | | | | | | | | | | | | | | | | | | | | | | |
| Description of Asset: | | | | | | | | | | | | | | | | | | | | | | | | |
| Futures Contracts | | $ | 531,527 | | | $ | — | | | $ | 531,527 | | | $ | (531,527 | ) | | $ | — | | | $ | — | |
| Description of Liability: | | | | | | | | | | | | | | | | | | | | | | | | |
| Futures Contracts | | $ | 919,857 | | | $ | — | | | $ | 919,857 | | | $ | 531,527 | | | $ | (388,330 | ) | | $ | — | |
| Strategic Allocation | | | | | | | | | | | | | | | | | | | | | | | | |
| Description of Asset: | | | | | | | | | | | | | | | | | | | | | | | | |
| Futures Contracts | | $ | 225,560 | | | $ | — | | | $ | 225,560 | | | $ | — | | | $ | — | | | $ | 225,560 | |
| ReSolve Adaptive | | | | | | | | | | | | | | | | | | | | | | | | |
| Description of Asset: | | | | | | | | | | | | | | | | | | | | | | | | |
| Futures Contracts | | $ | 1,100,826 | | | $ | — | | | $ | 1,100,826 | | | $ | (737,268 | ) | | $ | — | | | $ | 363,558 | |
| Description of Liability: | | | | | | | | | | | | | | | | | | | | | | | | |
| Futures Contracts | | $ | 737,268 | | | $ | — | | | $ | 737,268 | | | $ | (737,268 | ) | | $ | — | | | $ | — | |
| (1) | The amount is limited to the derivative liability balance and accordingly does not include excess collateral pledged. |
D. Security Transactions and Related Income
During the period, investment transactions are accounted for no later than the first calculation of the NAV on the business day following the trade date. For financial reporting purposes, however, security transactions are accounted for on the trade date on the last business day of the reporting period. Discounts and premiums on securities purchased are accreted and amortized over the lives of the respective securities using the effective interest method. For convertible securities, premiums attributable to the conversion feature are not amortized. Securities gains and losses are calculated on the identified cost basis. Interest income and expenses are accrued daily. Dividends, less foreign tax withholding (if any), are recorded on the ex-dividend date. Withholding taxes and capital gains on foreign dividends have been provided for in accordance with the Funds’ understanding of the applicable country’s tax rules and rates.
E. Dividends and Distributions to Shareholders
The amount of dividends from net investment income and net realized gains recorded on the ex-dividend date are determined in accordance with the federal income tax regulations, which may differ from GAAP and are recorded on ex-date. These “book/tax” differences are either considered temporary or permanent in nature. To the extent these differences are permanent in nature (e.g. tax treatment of foreign currency gain/loss, non-deductible stock issuance costs, distributions and income received from pass through investments and net investment loss adjustments), such amounts are reclassified within the capital accounts based on their nature for federal income tax purposes; temporary differences do not require reclassification. Temporary differences are primarily due to market discounts, capital loss carryforwards and losses deferred due to wash sales, straddles and return of capital from investments. Dividends are declared separately for each class. No class has preferential rights; differences in per share dividend rates are generally due to differences in separate class expenses.
| RATIONAL FUNDS | |
| CONSOLIDATED NOTES TO FINANCIAL STATEMENTS (Continued) |
| December 31, 2021 | ANNUAL REPORT |
| Fund | | Income Dividends | | Capital Gains |
| Equity Armor | | Monthly | | Annually |
| Tactical Return | | Annually | | Annually |
| Dynamic Brands | | Annually | | Annually |
| Strategic Allocation | | Quarterly | | Annually |
| ReSolve Adaptive | | Annually | | Annually |
| Pier 88 | | Quarterly | | Annually |
| Special Situations | | Monthly | | Annually |
| Inflation Growth | | Quarterly | | Annually |
Certain Funds may own shares of real estate investments trusts (“REITs”) which report information on the source of their distributions annually. Distributions received from investments in REITs in excess of income from underlying investments are recorded as realized gain and/or as a reduction to the cost of the individual REIT.
F. Allocation of Expenses, Income, and Gains and Losses
Expenses directly attributable to a Fund are charged to that Fund. Expenses not directly attributable to a Fund are allocated proportionally among various Funds or all Funds within the Trust in relation to the net assets of each Fund or on another reasonable basis. Income, non-class specific expenses and realized/unrealized gains or losses are allocated to each class based on relative net assets. Distribution fees are charged to each respective share class in accordance with the distribution plan.
G. Federal Income Taxes
It is the policy of each Fund to qualify or continue to qualify as a regulated investment company by complying with the provisions available to certain investment companies, as defined in applicable sections of the Internal Revenue Code, and to make distributions of net investment income and net realized capital gains sufficient to relieve it from all, or substantially all, federal income taxes.
The Funds recognize the tax benefits of uncertain tax positions only where the position is “more likely than not” to be sustained assuming examination by tax authorities. Management has analyzed each Fund’s tax positions and has concluded that no liability for unrecognized tax benefits should be recorded related to uncertain tax positions taken on returns filed for open tax years ended December 31, 2018 to December 31, 2020 (as applicable), or expected to be taken in the Funds’ December 31, 2021 year-end tax returns. Each Fund identifies its major tax jurisdictions as U.S. Federal, and foreign jurisdictions where the Funds make significant investments; however the Funds are not aware of any tax positions for which it is reasonably possible that the total amounts of unrecognized tax benefits will change materially in the next twelve months. The Funds recognize interest and penalties, if any, related to unrecognized tax benefits, as income tax expenses in the Statements of Operations. As of December 31, 2021, the Funds did not incur any interest or penalties.
H. Indemnification
The Trust indemnifies its Officers and Trustees for certain liabilities that may arise from the performance of their duties to the Trust. Additionally, in the normal course of business, the Funds enter into contracts that contain a variety of representations and warranties and which provide general indemnities. The Funds’ maximum exposure under these arrangements is unknown, as this would involve future claims that may be made against the Funds that have not yet occurred. However, based on experience, the risk of loss due to these warranties and indemnities appears to be remote.
I. Market Risk
Overall market risks may also affect the value of a Fund. The market values of securities or other investments owned by a Fund will go up or down, sometimes rapidly or unpredictably. Factors such as economic growth and market conditions, interest rate levels, exchange rates and political events affect the securities markets. Changes in market conditions and interest rates generally do not have the same impact on all types of securities and instruments. Unexpected local, regional or global events and their aftermath, such as war; acts of terrorism; financial, political or social disruptions; natural, environmental or man-made disasters; the spread of infectious illnesses or other public health issues; recessions and
| RATIONAL FUNDS | |
| CONSOLIDATED NOTES TO FINANCIAL STATEMENTS (Continued) |
| December 31, 2021 | ANNUAL REPORT |
depressions; or other tragedies, catastrophes and events could have a significant impact on a Fund and its investments and could result in increased premiums or discounts to the Fund’s net asset value, and may impair market liquidity, thereby increasing liquidity risk. Such events can cause investor fear and panic, which can adversely affect the economies of many companies, sectors, nations, regions and the market in general, in ways that cannot necessarily be foreseen. A Fund could lose money over short periods due to short-term market movements and over longer periods during more prolonged market downturns. During a general market downturn, multiple asset classes may be negatively affected. In times of severe market disruptions, you could lose your entire investment.
An outbreak of infectious respiratory illness caused by a novel coronavirus known as COVID-19 was first detected in China in December 2019 and subsequently spread globally. This coronavirus has resulted in, among other things, travel restrictions, closed international borders, enhanced health screenings at ports of entry and elsewhere, disruption of and delays in healthcare service preparation and delivery, prolonged quarantines, significant disruptions to business operations, market closures, cancellations and restrictions, supply chain disruptions, lower consumer demand, and significant volatility and declines in global financial markets, as well as general concern and uncertainty. The impact of COVID-19 has adversely affected, and other infectious illness outbreaks that may arise in the future could adversely affect, the economies of many nations and the entire global economy, individual issuers and capital markets in ways that cannot necessarily be foreseen. In addition, the impact of infectious illnesses in emerging market countries may be greater due to generally less established healthcare systems. Public health crises caused by the COVID-19 outbreak may exacerbate other pre-existing political, social and economic risks in certain countries or globally. The duration of the COVID-19 outbreak and its effects cannot be determined with certainty.
(3) FEES AND OTHER TRANSACTIONS WITH AFFILIATES AND OTHER SERVICE PROVIDERS
Investment Advisory Fee— Rational Advisors, Inc., (the “Advisor”) serves as the Funds’ investment adviser. Under the terms of the Advisory Agreement, the Advisor manages the investment operations of the Funds in accordance with each Fund’s respective investment policies and restrictions. The Funds’ sub-advisors are responsible for the day-to-day management of each Fund’s portfolios. The Advisor provides the Funds with investment advice and supervision and furnishes an investment program for the Funds. For its investment management services, the Funds pay to the Advisor, as of the last day of each month, an annualized fee as shown in the below table, such fees to be computed daily based upon daily average net assets of the Funds. The Funds’ sub-advisors are paid by the Advisor, not the Funds.
| Fund | | Advisory Fee Tiered Annual Rate |
| | | Rate for the First $500 Million | | Rate for the Next $500 Million | | Rate for Excess Over $1 Billion |
| Equity Armor | | 0.75% | | 0.70% | | 0.65% |
| Dynamic Brands | | 0.75% | | 0.70% | | 0.65% |
| | | | | | | |
| | | Advisory Fee Annual Rate | | | | |
| Strategic Allocation | | 0.10% | | | | |
| ReSolve Adaptive | | 1.75% | | | | |
| Tactical Return | | 1.75% | | | | |
| Pier 88 | | 0.85% | | | | |
| Special Situations | | 1.50% | | | | |
| Inflation Growth | | 1.25% | | | | |
The Advisor has contractually agreed to waive all or a portion of its investment advisory fee (based on average daily net assets) and/or reimburse certain operating expenses of each Fund to the extent necessary in order to limit each Fund’s total annual fund operating expenses (exclusive of acquired fund fees and expenses, brokerage commissions and trading costs, interest (including borrowing costs and overdraft charges), taxes, short sale dividends and interest expenses, non-routine or extraordinary expenses (such as litigation or reorganizational costs), and costs and expenses of litigation or claims on behalf of the Fund regarding portfolio investments initiated (or threatened) by the investment advisor or sub-advisor) as listed below:
| RATIONAL FUNDS | |
| CONSOLIDATED NOTES TO FINANCIAL STATEMENTS (Continued) |
| December 31, 2021 | ANNUAL REPORT |
| | | Expense Caps | | Expiration |
| Fund | | Institutional Class Shares | | Class A Shares | | Class C Shares | | |
| Equity Armor* | | N/A | | N/A | | N/A | | N/A |
| Tactical Return | | 1.99% | | 2.24% | | 2.99% | | April 30, 2022 |
| Dynamic Brands | | 1.24% | | 1.49% | | 2.24% | | April 30, 2022 |
| Strategic Allocation | | 0.45% | | 0.70% | | 1.45% | | April 30, 2022 |
| ReSolve Adaptive | | 1.97% | | 2.22% | | 2.97% | | April 30, 2022 |
| Pier 88 | | 0.99% | | 1.24% | | 1.99% | | April 30, 2022 |
| Special Situations | | 1.75% | | 2.00% | | 2.75% | | April 30, 2022 |
| Inflation Growth | | 1.49% | | 1.74% | | 2.49% | | April 30, 2023 |
| * | Equity Armor expense limitation agreement expired April 30, 2021. The expense limitation prior to April 30, 2021 was 1.00% for Institutional shares, 1.25% for class A shares and 2.00% for class C shares. |
Amounts waived or reimbursed in the contractual period may be recouped by the Advisor within three years of the waiver and/or reimbursement. As of December 31, 2021, the following amounts have been waived or reimbursed by the Advisor and are subject to repayment by the respective Fund:
| | | Amount Waived or | | | Expiring Beginning | |
| Fund | | Reimbursed | | | December 31, | |
| Equity Armor | | | 137,069 | | | | 2022 | |
| | | | 135,785 | | | | 2023 | |
| | | | 38,723 | | | | 2024 | |
| Tactical Return | | | 179,111 | | | | 2022 | |
| | | | 127,155 | | | | 2023 | |
| | | | 104,062 | | | | 2024 | |
| Dynamic Brands | | | 53,415 | | | | 2022 | |
| | | | — | | | | 2023 | |
| | | | — | | | | 2024 | |
| Strategic Allocation | | | 63,678 | | | | 2022 | |
| | | | 72,877 | | | | 2023 | |
| | | | 67,124 | | | | 2024 | |
| ReSolve Adaptive | | | 140,730 | | | | 2022 | |
| | | | 137,538 | | | | 2023 | |
| | | | 125,327 | | | | 2024 | |
| Pier 88 | | | 21,532 | | | | 2022 | |
| | | | 155,789 | | | | 2023 | |
| | | | 174,835 | | | | 2024 | |
| Special Situations | | | 66,286 | | | | 2022 | |
| | | | 159,379 | | | | 2023 | |
| | | | 119,447 | | | | 2024 | |
| Inflation Growth | | | 52,120 | | | | 2024 | |
During the year ended December 31, 2021, the Advisor for Dynamic Brands recaptured $49,609 of previously waived expenses.
The Independent Trustees are paid a quarterly retainer, and receive compensation for each committee meeting, telephonic Board meeting, and special in-person Board meeting attended. Officers receive no compensation from the Trust. The Trust reimburses each of the Independent Trustees for travel and other expenses incurred in connection with attendance at such meetings. The Trust has no retirement or pension plans. Additional information regarding the Trust’s Trustees is available in the Funds’ Statement of Additional Information.
| RATIONAL FUNDS | |
| CONSOLIDATED NOTES TO FINANCIAL STATEMENTS (Continued) |
| December 31, 2021 | ANNUAL REPORT |
The Board has adopted the Trust’s Distribution Plan (the “12b-1 Plan”) which allows each Fund to pay fees up to 0.25% for Class A shares and up to 1.00% for Class C shares based on average daily net assets of each class to financial intermediaries (which may be paid through the Funds’ distributor) for the sale and distribution of these shares. Pursuant to the 12b-1 Plan, the Funds may finance from their assets certain activities or expenses that are intended primarily to result in the sale of Fund shares and to reimburse Northern Lights Distributors, LLC., the Funds’ distributor (the “Distributor or NLD”), and the Advisor for distribution related expenses. For the year ended December 31, 2021, the amounts accrued by the Funds were as follows:
| | | 12b-1 Fees | |
| Fund | | Class A | | | Class C | |
| Equity Armor | | $ | 30,673 | | | $ | 15,132 | |
| Tactical Return | | | 33,309 | | | | 90,393 | |
| Dynamic Brands | | | 54,214 | | | | 34,875 | |
| Strategic Allocation | | | 21,125 | | | | 11 | |
| ReSolve Adaptive | | | 1,567 | | | | 2,603 | |
| Pier 88 | | | 10,965 | | | | 1,652 | |
| Special Situations | | | 122,516 | | | | 257,466 | |
| Inflation Growth | | | 241 | | | | 14 | |
Shareholder Servicing Fees - The Trust has adopted a Shareholder Services Plan pursuant to which the Funds may pay Shareholder Services Fees up to 0.25% of the average daily net assets to financial intermediaries for providing shareholder assistance, maintaining shareholder accounts and communicating or facilitating purchases and redemptions of shares for Institutional, Class A and Class C Shares.
In addition, certain affiliates of the Distributor provide services to the Funds as follows:
Ultimus Fund Solutions, LLC (“UFS”) – UFS an affiliate of the Distributor, provides administrative, fund accounting, and transfer agency services to the Funds pursuant to agreements with the Trust, for which it receives from each Fund the greater of an annual minimum fee or an asset based fee, which scales downward based upon net assets for fund administration, fund accounting and transfer agency services and are reflected as such on the Statements of Operations. The Funds also pay UFS for any out-of-pocket expenses. Officers of the Trust are also employees of UFS, and are not paid any fees directly by the Trust for serving in such capacity.
Blu Giant, LLC (“Blu Giant”) – Blu Giant, an affiliate of UFS and the Distributor, provides EDGAR conversion and filing services as well as print management services for the Funds on an ad-hoc basis. For the provision of these services, Blu Giant receives customary fees from the Funds, which are included in printing expenses on the Statements of Operations.
Pursuant to the Management Services Agreement between the Trust and MFund Services LLC (“MFund”), an affiliate of the Advisor, MFund provides the Funds with various management and administrative services. For these services, the Funds pay MFund an annual base fee plus an annual asset-based fee, which scales downward based upon net assets. In addition, the Funds reimburse MFund for any reasonable out- of- pocket expenses incurred in the performance of its duties under the Management Services Agreement. These fees are included in Management Service Fees on the Statements of Operations.
Pursuant to the Compliance Services Agreement, MFund provides chief compliance officer services to the Funds. For these services, the Funds pay MFund an annual base fee plus an annual asset-based fee based upon net assets. In addition, the Funds reimburse MFund for any reasonable out- of- pocket expenses incurred in the performance of its duties under the Compliance Services Agreement. These fees are included in Compliance Officer Fees on the Statements of Operations. The amounts due to MFund at December 31, 2021 for management and chief compliance officer services are listed in the Statements of Assets and Liabilities under Payable to related parties.
| RATIONAL FUNDS | |
| CONSOLIDATED NOTES TO FINANCIAL STATEMENTS (Continued) |
| December 31, 2021 | ANNUAL REPORT |
An Officer of the Trust is also the controlling member of MFund and the Advisor, and is not paid any fees directly by the Trust for serving in such capacity.
Affiliated Funds — Affiliated companies are mutual funds that are advised by Catalyst Capital Advisors, AlphaCentric Advisors, LLC or Rational Advisors, Inc. Companies that are affiliates of the Funds at December 31, 2021, are noted in the Strategic Allocation’s Schedule of Investments. A summary of these investments in affiliated funds is set forth below:
| | | Shares Balance | | | | | | | | | Shares Balance | | | | | | Change in | | | Dividends | | | Amount of Gain | |
| | | December 31, | | | | | | | | | December 31, | | | | | | Unrealized | | | Credited to | | | (Loss) Realized on | |
| Fund | | 2020 | | | Purchases | | | Sales | | | 2021 | | | Fair Value | | | Gain/(Loss) | | | Income | | | Sale of Shares | |
| AlphaCentric Income Opportunities Fund, Inst. Sh. | | | 39,468 | | | | 5,996 | | | | 1,685 | | | | 43,779 | | | $ | 532,796 | | | $ | 58,894 | | | $ | 7,833 | | | $ | 746 | |
| Catalyst Enhanced Income Strategy Fund, Inst. Sh. | | | 124,639 | | | | 37,886 | | | | 1,783 | | | | 160,742 | | | | 1,766,550 | | | | (41,695 | ) | | | 108,804 | | | | (250 | ) |
| Catalyst Insider Income Fund Inst. Sh. | | | 77,855 | | | | 27,350 | | | | 2,020 | | | | 103,185 | | | | 1,010,182 | | | | (6,437 | ) | | | 22,403 | | | | 2,331 | |
| Catalyst/CIFC Floating Rate Income Fund | | | 82,210 | | | | 25,477 | | | | 2,086 | | | | 105,601 | | | | 1,015,884 | | | | 4,799 | | | | 30,274 | | | | (125 | ) |
| Catalyst/Stone Beach Income Opportunity Fund, Inst. Sh. | | | 70,017 | | | | 28,597 | | | | 2,304 | | | | 96,310 | | | | 806,129 | | | | (66,131 | ) | | | 35,933 | | | | (2,032 | ) |
| Rational Special Situations Income Fund, Inst. Sh. | | | 70,961 | | | | 20,193 | | | | 1,008 | | | | 90,146 | | | | 1,774,959 | | | | 5,962 | | | | 73,943 | | | | (43 | ) |
| Rational/Pier 88 Convertible Securities Fund CL. I | | | 112,557 | | | | 27,167 | | | | 1,623 | | | | 138,101 | | | | 1,651,693 | | | | 24,759 | | | | 75,621 | | | | 40,578 | |
| Total | | | 577,707 | | | | 172,666 | | | | 12,509 | | | | 737,864 | | | | 8,558,193 | | | | (19,849 | ) | | | 354,811 | | | | 41,205 | |
(4) INVESTMENT TRANSACTIONS
For the year ended December 31, 2021, aggregate purchases and proceeds from sales of investment securities (excluding short-term investments) for the Funds were as follows:
| Fund | | Purchases | | | Sales | |
| Equity Armor | | $ | 143,669,936 | | | $ | 143,445,834 | |
| Tactical Return | | | — | | | | — | |
| Dynamic Brands | | | 238,894,711 | | | | 209,018,762 | |
| Strategic Allocation | | | 1,978,421 | | | | 182,742 | |
| ReSolve Adaptive | | | — | | | | — | |
| Pier 88 | | | 162,682,007 | | | | 124,574,879 | |
| Special Situations | | | 500,429,002 | | | | 192,302,263 | |
| Inflation Growth | | | 2,033,582 | | | | — | |
(5) INVESTMENT RISK
In accordance with its investment objectives and through its exposure to the managed futures programs, each of Equity Armor, Strategic Allocation, ReSolve Adaptive and Inflation Growth may have increased or decreased exposure to one or more of the following risk factors defined below:
Commodity Risk – Commodity risk relates to the change in value of commodities or commodity indexes as they relate to increases or decreases in the commodities market. Commodities are physical assets that have tangible properties. Examples of these types of assets are crude oil, heating oil, metals, livestock, and agricultural products.
Foreign Exchange Rate Risk – Foreign exchange rate risk relates to the change in the U.S. dollar value of a security held that is denominated in a foreign currency. The U.S. dollar value of a foreign currency denominated security will decrease as the dollar appreciates against the currency, while the U.S. dollar value will increase as the dollar depreciates against the currency.
Interest Rate Risk – Interest rate risk refers to the fluctuations in value of fixed-income securities resulting from the inverse relationship between price and yield. For example, an increase in general interest rates will tend to reduce the market value of already issued fixed-income investments, and a decline in general interest rates will tend to increase their value. In
| RATIONAL FUNDS | |
| CONSOLIDATED NOTES TO FINANCIAL STATEMENTS (Continued) |
| December 31, 2021 | ANNUAL REPORT |
addition, debt securities with longer maturities, which tend to have higher yields, are subject to potentially greater fluctuations in value from changes in interest rates than obligations with shorter maturities.
Volatility Risk – Volatility risk refers to the magnitude of the movement, but not the direction of the movement, in a financial instrument’s price over a defined time period. Large increases or decreases in a financial instrument’s price over a relative time period typically indicate greater volatility risk, while small increases or decreases in its price typically indicate lower volatility risk.
In accordance with its investment objectives and through its exposure to options, Tactical Return and Equity Armor may have increased or decreased exposure to Option Risk factors defined below:
Options Risk – Tactical Return and Equity Armor are subject to equity price risks in the normal course of pursuing their investment objective and may purchase or sell options. The seller (writer) of a call option which is covered (e.g., the writer holds the underlying security) assumes the risk of a decline in the market price of an underlying security below the purchase price of an underlying security less the premium received and gives up the opportunity for gain on the underlying security above the exercise price of the option. The seller of an uncovered call option assumes the risk of a theoretical unlimited increase in the market price of an underlying security above the exercise price of the option. The securities necessary to satisfy the exercise of the call option may be unavailable for purchase except at much higher prices. Purchasing securities to satisfy the exercise of the call option can itself cause the price of securities to rise further, sometimes by a significant amount, thereby exacerbating the loss. The buyer of a call option assumes the risk of losing its entire premium invested in the call option. The seller (writer) of a put option which is covered (e.g., the writer has a short position in the underlying security) assumes the risk of an increase in the market price of the underlying security above the sales price (in establishing the short position) of the underlying security plus the premium received and gives up the opportunity for gain on the underlying security below the exercise price of the option. The seller of an uncovered put option assumes the risk of a decline in the market price of the underlying security below the exercise price of the option. The buyer of a put option assumes the risk of losing his entire premium invested in the put option.
Activist Strategies Risk – As part of Special Situation’s principal investment strategy, the Sub-Advisor seeks to identify “special situations” where it can seek to remedy legal, technical or structural issues it has identified in the securities held by the Fund through activist strategies, including through litigation or the threat of litigation. Such activist strategies may not be successful and may have a negative impact on the Fund, including causing the Fund to incur legal related costs and expenses and portfolio turnover if the Sub-Advisor determines to sell such securities.
Please refer to the Funds’ prospectus for a full listing of risks associated with these investments.
(6) AGGREGATE UNREALIZED APPRECIATION AND DEPRECIATION – TAX BASIS
The identified cost of investments in securities owned by each Fund for federal income tax purposes (including options written), and its respective gross unrealized appreciation and depreciation at December 31, 2021, were as follows:
| | | | | | Gross | | | Gross | | | Net Unrealized | |
| | | Tax | | | Unrealized | | | Unrealized | | | Appreciation/ | |
| | | Cost | | | Appreciation | | | Depreciation | | | (Depreciation) | |
| Equity Armor | | $ | 58,364,570 | | | $ | 11,010,791 | | | $ | (608,481 | ) | | $ | 10,402,310 | |
| Tactical Return | | | 190,637,306 | | | | — | | | | — | | | | — | |
| Dynamic Brands | | | 97,010,827 | | | | 17,353,738 | | | | (2,944,434 | ) | | | 14,409,304 | |
| Strategic Allocation | | | 9,048,571 | | | | 446,210 | | | | (120,734 | ) | | | 325,476 | |
| ReSolve Adaptive | | | 61,259,968 | | | | 306,188 | | | | (471,023 | ) | | | (164,835 | ) |
| Pier 88 | | | 111,791,399 | | | | 10,734,081 | | | | (1,890,680 | ) | | | 8,843,401 | |
| Special Situations | | | 750,200,632 | | | | 33,866,571 | | | | (22,545,714 | ) | | | 11,320,857 | |
| Inflation Growth | | | 2,063,029 | | | | 90,229 | | | | (106,064 | ) | | | (15,835 | ) |
| RATIONAL FUNDS | |
| CONSOLIDATED NOTES TO FINANCIAL STATEMENTS (Continued) |
| December 31, 2021 | ANNUAL REPORT |
(7) DISTRIBUTIONS TO SHAREHOLDERS AND TAX COMPONENTS OF CAPITAL
The tax character of fund distributions paid for the year or period ended December 31, 2021 and December 31, 2020 was as follows:
| For fiscal year ended | | Ordinary | | | Long-Term | | | Return of | | | | |
| December 31, 2021 | | Income | | | Capital Gains | | | Capital | | | Total | |
| Equity Armor | | $ | 825,350 | | | $ | — | | | $ | — | | | $ | 825,350 | |
| Tactical Return | | | 170,878 | | | | 10,584,404 | | | | — | | | | 10,755,282 | |
| Dynamic Brands | | | 6,465,633 | | | | 3,298,116 | | | | — | | | | 9,763,749 | |
| Strategic Allocation | | | 681,214 | | | | 754,830 | | | | — | | | | 1,436,044 | |
| ReSolve Adaptive | | | 8,865,209 | | | | — | | | | — | | | | 8,865,209 | |
| Pier 88 | | | 5,673,975 | | | | 2,900,416 | | | | — | | | | 8,574,391 | |
| Special Situations | | | 28,362,084 | | | | — | | | | 23,176 | | | | 28,385,260 | |
| Inflation Growth | | | 15,445 | | | | 17 | | | | — | | | | 15,462 | |
| | | | | | | | | | | | | | | | | |
| For fiscal year ended | | Ordinary | | | Long-Term | | | Return of | | | | |
| December 31, 2020 | | Income | | | Capital Gains | | | Capital | | | Total | |
| Equity Armor | | $ | 564,193 | | | $ | — | | | $ | — | | | $ | 564,193 | |
| Tactical Return | | | 1,086,680 | | | | 3,391,193 | | | | — | | | | 4,477,873 | |
| Dynamic Brands | | | 5,764,896 | | | | 2,684,155 | | | | — | | | | 8,449,051 | |
| Strategic Allocation | | | 232,735 | | | | — | | | | 18,623 | | | | 251,358 | |
| ReSolve Adaptive | | | 205,777 | | | | — | | | | 88,954 | | | | 294,731 | |
| Pier 88 | | | 1,229,024 | | | | 19,438 | | | | — | | | | 1,248,462 | |
| Special Situations | | | 13,372,271 | | | | — | | | | 623,229 | | | | 13,995,500 | |
As of December 31, 2021, the components of accumulated earnings/(deficit) on a tax basis were as follows:
| | | Undistributed | | | Undistributed | | | Post October Loss | | | Capital Loss | | | Other | | | Unrealized | | | Total | |
| | | Ordinary | | | Long-Term | | | and | | | Carry | | | Book/Tax | | | Appreciation/ | | | Distributable Earnings/ | |
| | | Income | | | Capital Gains | | | Late Year Loss | | | Forwards | | | Differences | | | (Depreciation) | | | (Accumulated Deficits) | |
| Equity Armor | | $ | 13,223 | | | $ | — | | | $ | — | | | $ | (4,057,337 | ) | | $ | — | | | $ | 10,402,310 | | | $ | 6,358,196 | |
| Tactical Return | | | 59,296 | | | | — | | | | — | | | | (2,092,502 | ) | | | — | | | | — | | | | (2,033,206 | ) |
| Dynamic Brands | | | 2,896,739 | | | | — | | | | — | | | | — | | | | — | | | | 14,409,304 | | | | 17,306,043 | |
| Strategic Allocation | | | 132,688 | | | | 235,138 | | | | — | | | | — | | | | — | | | | 325,476 | | | | 693,302 | |
| ReSolve Adaptive | | | 671,426 | | | | — | | | | (603,264 | ) | | | (3,406,676 | ) | | | — | | | | (173,183 | ) | | | (3,511,697 | ) |
| Pier 88 | | | 386,215 | | | | — | | | | — | | | | — | | | | — | | | | 8,843,401 | | | | 9,229,616 | |
| Special Situations | | | — | | | | — | | | | (4,159,228 | ) | | | (2,802,836 | ) | | | — | | | | 11,320,857 | | | | 4,358,793 | |
| Inflation Growth | | | — | | | | — | | | | (49,365 | ) | | | — | | | | — | | | | (15,835 | ) | | | (65,200 | ) |
The difference between book basis and tax basis unrealized appreciation (depreciation), undistributed ordinary income (loss) and accumulated net realized gain (loss) from investments is primarily attributable to the tax deferral of losses on wash sales, mark-to-market on open futures and options 1256 contracts, and adjustments for C-Corporation return of capital distributions, grantor trusts, perpetual bonds, trust preferred securities, income on contingent convertible debt securities, and Section 305(c) deemed dividend distributions. The unrealized appreciation (depreciation) in the table above includes unrealized foreign currency losses of $(8,348) for the Resolve Adaptive Asset Allocation Fund.
| RATIONAL FUNDS | |
| CONSOLIDATED NOTES TO FINANCIAL STATEMENTS (Continued) |
| December 31, 2021 | ANNUAL REPORT |
Late year losses incurred after December 31 within the fiscal year are deemed to arise on the first business day of the following fiscal year for tax purposes. The Funds incurred and elected to defer such late year losses as follows:
| | | Late Year | |
| | | Losses | |
| Equity Armor | | $ | — | |
| Tactical Return | | | — | |
| Dynamic Brands | | | — | |
| Strategic Allocation | | | — | |
| ReSolve Adaptive | | | — | |
| Pier 88 | | | — | |
| Special Situations | | | — | |
| Inflation Growth | | | 49,365 | |
Capital losses incurred after October 31 within the fiscal year are deemed to arise on the first business day of the following fiscal year for tax purposes. The Funds incurred and elected to defer such capital losses as follows:
| | | Post October | |
| | | Losses | |
| Equity Armor | | $ | — | |
| Tactical Return | | | — | |
| Dynamic Brands | | | — | |
| Strategic Allocation | | | — | |
| ReSolve Adaptive | | | 603,264 | |
| Pier 88 | | | — | |
| Special Situations | | | 4,159,228 | |
| Inflation Growth | | | — | |
At December 31, 2021, the Funds had capital loss carry forwards for federal income tax purposes available to offset future capital gains along with capital loss carry forwards utilized in the current year as follows:
| | | Non- Expiring | | | Non-Expiring | | | | | | Capital Loss Carry | |
| | | Short-Term | | | Long-Term | | | Total | | | Forwards Utilized | |
| Equity Armor | | $ | 733,723 | | | $ | 3,323,614 | | | $ | 4,057,337 | | | $ | 3,004,319 | |
| Tactical Return* | | | 303,470 | | | | 1,789,032 | | | | 2,092,502 | | | | 92,691 | |
| Dynamic Brands | | | — | | | | — | | | | — | | | | — | |
| Strategic Allocation | | | — | | | | — | | | | — | | | | 743,977 | |
| ReSolve Adaptive | | | 2,222,013 | | | | 1,184,663 | | | | 3,406,676 | | | | — | |
| Pier 88 | | | — | | | | — | | | | — | | | | — | |
| Special Situations | | | 2,802,836 | | | | — | | | | 2,802,836 | | | | 3,292,781 | |
| Inflation Growth | | | — | | | | — | | | | — | | | | — | |
| * | The Rational Tactical Return Fund experienced a shareholder change in ownership resulting in an annual limitation on the amount of pre-change capital loss carry forwards available to be recognized in each year. Due to IRC Section 382 limitations, utilization of these carry forwards is limited to a maximum of $92,691 per year. |
During the fiscal year ended December 31, 2021, the Funds utilized tax equalization which is the use of earnings and profits distributions to shareholders on redemption of shares as part of the dividends paid deduction for income tax purposes. Permanent book and tax differences, primarily attributable to the book/tax basis treatment of the use of tax equalization credits, the reclassification of prior year paydown adjustments and adjustments for the Resolve Adaptive’s wholly owned subsidiary, which has a November 30 tax year end, resulted in reclassifications for the
| RATIONAL FUNDS | |
| CONSOLIDATED NOTES TO FINANCIAL STATEMENTS (Continued) |
| December 31, 2021 | ANNUAL REPORT |
Funds for the fiscal year ended December 31, 2021 as follows:
| | | Paid In | | | Accumulated | |
| | | Capital | | | Earnings (Deficit) | |
| Equity Armor | | $ | — | | | $ | — | |
| Tactical Return | | | 1,369,118 | | | | (1,369,118 | ) |
| Dynamic Brands | | | 1,187,205 | | | | (1,187,205 | ) |
| Strategic Allocation | | | 34,008 | | | | (34,008 | ) |
| ReSolve Adaptive | | | (1,677,255 | ) | | | 1,677,255 | |
| Pier 88 | | | — | | | | — | |
| Special Situations | | | (1,587,910 | ) | | | 1,587,910 | |
| Inflation Growth | | | — | | | | — | |
(8) LINE OF CREDIT
Effective December 10, 2020, the Trust has a $100,000,000 uncommitted line of credit provided by U.S. Bank National Association (the “Bank”) under an agreement (the “Uncommitted Line”). Any advance under the Uncommitted Line is contemplated primarily for temporary or emergency purposes, including the meeting of redemption requests that otherwise might require the untimely disposition of securities. Interest on borrowings is payable on a monthly basis. The Uncommitted Line is not a “committed” line of credit, which is to say that the Bank is not obligated to lend money to the Funds. Accordingly, it is possible that the Funds may wish to borrow money for a temporary or emergency purpose but may not be able to do so.
During the year ended December 31, 2021, the average amount of borrowings outstanding was as follows:
| | | Average | | | | | | |
| | | borrowings | | | Interest | | | Average |
| Fund | | outstanding | | | Expense* | | | borrowings rate |
| Dynamic Brands | | $ | 664,889 | | | $ | 1,080 | | | 3.25% |
| Pier 88 | | | 728,000 | | | | 66 | | | 3.25% |
| * | Includes interest expenses for borrowings on the line of credit and may not tie back to the Statement of Operations, which may include overdraftsfees, line of credit fees and broker interest. |
The largest outstanding borrowing during the year ended December 31, 2021, was $1,412,000 and $728,000 for Dynamic Brands and Pier 88, respectively. As of December 31, 2021, no Funds had outstanding borrowings.
(9) UNDERLYING INVESTMENTS IN OTHER INVESTMENT COMPANIES
Each underlying fund, including each exchange-traded fund (“ETF”), is subject to specific risks, depending on the nature of the underlying fund. These risks could include liquidity risk, sector risk, foreign and related currency risk, as well as risks associated with real estate investments and commodities. Investors in the Funds will indirectly bear fees and expenses charged by the underlying investment companies in which the Funds invest in addition to the Funds’ direct fees and expenses.
The performance of Tactical Return and ReSolve Adaptive will be directly affected by the performance of the First American Government Obligations Fund, U Class. The financial statements of the First American Government Obligations Fund, including the Schedule of investments, can be found at the Securities and Exchange Commission’s (“SEC”) website www.sec.gov and should be read in conjunction with the Funds’ financial statements. As of December 31, 2021, the percentage of Tactical Return and ReSolve Adaptive’s net assets invested in the First American Government Obligations Fund were 65.2% and 93.2%, respectively.
| RATIONAL FUNDS | |
| CONSOLIDATED NOTES TO FINANCIAL STATEMENTS (Continued) |
| December 31, 2021 | ANNUAL REPORT |
(10) BENEFICIAL OWNERSHIP
The beneficial ownership, either directly or indirectly, of more than 25% of the voting securities of a fund creates a presumption of control of the fund, under Section 2(a)(9) of the 1940 Act. As of December 31, 2021, the companies that held more than 25% of the voting securities of the Funds, and may be deemed to control each respective Fund, are as follows:
| | | Equity | | Tactical | | Strategic | | ReSolve | | Pier | | Special | | Inflation |
| | | Armor | | Return | | Allocation | | Adaptive | | 88 | | Situations | | Growth |
| NFS LLC(1) | | 35.56% | | — | | 85.62% | | 35.96% | | 74.75% | | — | | — |
| Charles Schwab (1) | | — | | — | | — | | 45.99% | | — | | 29.01% | | — |
| LPL Financial (1) | | — | | 34.11% | | — | | — | | — | | — | | — |
| TD Ameritrade | | 28.94% | | — | | — | | — | | — | | — | | — |
| Pershing | | — | | — | | — | | — | | — | | — | | 27.60% |
| (1) | This owner is comprised of multiple investors and accounts. |
(11) NEW ACCOUNTING PRONOUNCEMENTS
In March 2020, FASB issued ASU 2020-04, Reference Rate Reform (Topic 848): Facilitation of the Effects of Reference Rate Reform on Financial Reporting (’‘ASU 2020-04’’). The amendments in ASU 2020-04 provide optional temporary financial reporting relief from the effect of certain types of contract modifications due to the planned discontinuation of LIBOR and other interbank-offered based reference rates as of the end of 2021. ASU 2020-04 is effective for certain reference rate-related contract modifications that occur during the period March 12, 2020 through December 31, 2022. Management is currently evaluating the impact, if any of applying this ASU.
In October 2020, the Securities and Exchange Commission (“SEC”) adopted new regulations governing the use of derivative by registered investment companies (“Rule 18f-4”). Rule 18f-4 will impose limits on the amount of derivatives a Fund can enter into, eliminate the asset segregation framework currently used by funds to comply with Section 18 of the 1940 Act, and require funds whose use of derivatives is greater than a limited specified amount to establish and maintain a comprehensive derivatives risk management program and appoint a derivatives risk manager. Funds will be required to comply with Rule 18f-4 by August 19,2022. It is not currently clear what impact, if any, Rule 18f-4 will have on the availability, liquidity or performance of derivatives. Management is currently evaluating the potential impact of Rule 18f-4 on the Funds. When fully implemented, Rule 18f-4 may require changes in how a Fund uses derivatives, adversely affect the Funds’ performance and increase costs related to the Funds’ use of derivatives.
(12) SUBSEQUENT EVENTS
Subsequent events after the date of the Statements of Assets and Liabilities have been evaluated through the date the financial statements were issued. Management has determined that no events or transactions occurred requiring adjustment or disclosure in the financial statements.

REPORT OF INDEPENDENT REGISTERED PUBLIC ACCOUNTING FIRM
To the Shareholders of Rational Equity Armor Fund, Rational Tactical Return Fund, Rational Dynamic Brands Fund, Rational Strategic Allocation Fund, Rational/ReSolve Adaptive Asset Allocation Fund, Rational/Pier 88 Convertible Securities Fund, Rational Special Situations Income Fund, and Rational Inflation Growth Fund and Board of Trustees of Mutual Fund and Variable Insurance Trust
Opinion on the Financial Statements
We have audited the accompanying statements of assets and liabilities, including the schedules of investments, of the funds listed below (the “Funds”), each a series of Mutual Fund and Variable Insurance Trust, as of December 31, 2021, the related statements of operations, the statements of changes in net assets, the related notes, and the financial highlights for each of the periods indicated below (collectively referred to as the “financial statements”). In our opinion, the financial statements present fairly, in all material respects, the financial position of each of the Funds as of December 31, 2021, the results of their operations, the changes in net assets, and the financial highlights for each of the periods indicated below in conformity with accounting principles generally accepted in the United States of America.
| Fund Name | Statements of
Operations | Statement(s) of
Changes in Net
Assets | Financial
Highlights |
| Rational Equity Armor Fund, Rational Tactical Return Fund, Rational Dynamic Brands Fund, Rational Strategic Allocation Fund, and Rational/ReSolve Adaptive Asset Allocation Fund * | For the year ended December 31, 2021 | For the years ended December 31, 2021 and 2020 | For the years ended December 31, 2021, 2020, 2019, 2018, and 2017 |
| Rational/Pier 88 Convertible Securities Fund | For the year ended December 31, 2021 | For the years ended December 31, 2021 and 2020 | For the years ended 2021, 2020, and for the period from December 6, 2019 (commencement of operations) through December 31, 2019 |
| Rational Special Situations Income Fund | For the year ended December 31, 2021 | For the years ended December 31, 2021 and 2020 | For the years ended 2021, 2020, and for the period from July 17, 2019 (commencement of operations) through December 31, 2019 |
| Rational Inflation Growth Fund | For the period from August 18, 2021 through December 31, 2021 |
| * | The financial statements referred to above are Consolidated Financial Statements. |
COHEN & COMPANY, LTD.
800.229.1099 | 866.818.4535 fax | cohencpa.com
Registered with the Public Company Accounting Oversight Board
Basis for Opinion
These financial statements are the responsibility of the Funds’ management. Our responsibility is to express an opinion on the Funds’ financial statements based on our audits. We are a public accounting firm registered with the Public Company Accounting Oversight Board (United States) (“PCAOB”) and are required to be independent with respect to the Funds in accordance with the U.S. federal securities laws and the applicable rules and regulations of the Securities and Exchange Commission and the PCAOB.
We conducted our audits in accordance with the standards of the PCAOB. Those standards require that we plan and perform the audit to obtain reasonable assurance about whether the financial statements are free of material misstatement whether due to error or fraud.
Our audits included performing procedures to assess the risks of material misstatement of the financial statements, whether due to error or fraud, and performing procedures that respond to those risks. Such procedures included examining, on a test basis, evidence regarding the amounts and disclosures in the financial statements. Our procedures included confirmation of securities owned as of December 31, 2021, by correspondence with the custodian and brokers; when replies were not received from brokers, we performed other auditing procedures. Our audits also included evaluating the accounting principles used and significant estimates made by management, as well as evaluating the overall presentation of the financial statements. We believe that our audits provide a reasonable basis for our opinion.
We have served as the Funds’ auditor since 2016.

COHEN & COMPANY, LTD.
Cleveland, Ohio
March 1, 2022
| RATIONAL FUNDS |
| INFORMATION ABOUT YOUR FUNDS’ EXPENSES (Unaudited) |
As a shareholder of the Fund(s), you incur two types of costs: (1) transaction costs, including sales charges (loads) on purchase payments; and (2) ongoing costs, including management fees, distribution and/or service (12b-1) fees; and other Fund expenses. The example below is intended to help you understand your ongoing costs (in dollars) of investing in the Funds and to compare these costs with the ongoing costs of investing in other mutual funds.
The example below illustrates an investment of $1,000 invested at the beginning of the period 07/01/21 and held for the entire period through 12/31/21
Actual Expenses
The first section of each table below provides information about actual account values and actual expenses. You may use the information in these sections, together with the amount you invested, to estimate the expenses that you paid over the period. Simply divide your account value by $1,000 (for example, an $8,600 account value divided by $1,000 = 8.6), then multiply the result by the number in the first row under the heading entitled “Expenses Paid During Period” to estimate the expenses you paid on your account during this period.
Hypothetical Example for Comparison Purposes
The second section of each table provides information about the hypothetical account values and hypothetical expenses based on each Fund’s actual expense ratio and an assumed rate of return of 5% per year before expenses, which is not the Funds’ actual return. The hypothetical account values and expenses may not be used to estimate the actual ending account balance or expenses you paid for the period. You may use this information to compare the ongoing costs of investing in the Funds and other funds. To do so, compare this 5% hypothetical example with the 5% hypothetical examples that appear in the shareholder reports of the other funds.
Please note that the expenses shown in the table are meant to highlight your ongoing costs only and do not reflect any transactional costs, such as sales charges (loads) or exchange fees. Therefore, the second section of the table is useful in comparing ongoing costs only, and will not help you determine the relative total costs of owning different funds. In addition, if these transactional costs were included, your costs would have been higher. For more information on transactional costs, please refer to the Funds’ prospectus.
| | | | | | | | | | | Hypothetical | |
| | | | | | | | Actual | | | (5% return before expenses) | |
| | | Fund’s | | Beginning | | | Ending | | | | | | Ending | | | | |
| | | Annualized | | Account Value | | | Account Value | | | Expenses Paid | | | Account Value | | | Expenses Paid | |
| | | Expense Ratio | | 07/01/2021 | | | 12/31/2021 | | | During Period * | | | 12/31/2021 | | | During Period * | |
| Rational Equity Armor Fund - Class A ** | | 1.37% | | $ | 1,000.00 | | | $ | 1,055.40 | | | $ | 7.10 | | | $ | 1,018.30 | | | $ | 6.97 | |
| Rational Equity Armor Fund - Class C ** | | 2.12% | | | 1,000.00 | | | | 1,051.80 | | | | 10.96 | | | | 1,014.52 | | | | 10.76 | |
| Rational Equity Armor Fund - Institutional ** | | 1.12% | | | 1,000.00 | | | | 1,056.60 | | | | 5.81 | | | | 1,019.56 | | | | 5.70 | |
| Rational Tactical Return Fund - Class A ** | | 2.24% | | | 1,000.00 | | | | 1,012.70 | | | | 11.36 | | | | 1,013.91 | | | | 11.37 | |
| Rational Tactical Return Fund - Class C ** | | 2.99% | | | 1,000.00 | | | | 1,009.50 | | | | 15.14 | | | | 1,010.13 | | | | 15.15 | |
| Rational Tactical Return Fund - Institutional ** | | 1.99% | | | 1,000.00 | | | | 1,014.50 | | | | 10.10 | | | | 1,015.17 | | | | 10.11 | |
| Rational Dynamic Brands Fund - Class A | | 1.49% | | | 1,000.00 | | | | 1,002.90 | | | | 7.52 | | | | 1,017.69 | | | | 7.58 | |
| Rational Dynamic Brands Fund - Class C | | 2.24% | | | 1,000.00 | | | | 999.70 | | | | 11.29 | | | | 1,013.91 | | | | 11.37 | |
| Rational Dynamic Brands Fund - Institutional | | 1.24% | | | 1,000.00 | | | | 1,004.90 | | | | 6.27 | | | | 1,018.95 | | | | 6.31 | |
| Rational Strategic Allocation Fund - Class A | | 0.70% | | | 1,000.00 | | | | 1,138.20 | | | | 3.77 | | | | 1,021.68 | | | | 3.57 | |
| Rational Strategic Allocation Fund - Class C | | 1.45% | | | 1,000.00 | | | | 1,133.40 | | | | 7.80 | | | | 1,017.90 | | | | 7.37 | |
| Rational Strategic Allocation Fund - Insitutional | | 0.45% | | | 1,000.00 | | | | 1,139.10 | | | | 2.43 | | | | 1,022.94 | | | | 2.29 | |
| Rational/ReSolve Adaptive Asset Allocation Fund - Class A | | 2.22% | | | 1,000.00 | | | | 1,042.70 | | | | 11.43 | | | | 1,014.01 | | | | 11.27 | |
| Rational/ReSolve Adaptive Asset Allocation Fund - Class C | | 2.97% | | | 1,000.00 | | | | 1,039.10 | | | | 15.26 | | | | 1,010.23 | | | | 15.05 | |
| Rational/ReSolve Adaptive Asset Allocation Fund - Institutional | | 1.97% | | | 1,000.00 | | | | 1,044.30 | | | | 10.15 | | | | 1,015.27 | | | | 10.01 | |
| Rational Special Situations Income Fund - Class A | | 2.00% | | | 1,000.00 | | | | 1,020.00 | | | | 10.18 | | | | 1,015.12 | | | | 10.16 | |
| Rational Special Situations Income Fund - Class C | | 2.75% | | | 1,000.00 | | | | 1,016.30 | | | | 13.98 | | | | 1,011.34 | | | | 13.94 | |
| Rational Special Situations Income Fund - Institutional | | 1.75% | | | 1,000.00 | | | | 1,021.70 | | | | 8.92 | | | | 1,016.38 | | | | 8.89 | |
| Rational/Pier 88 Convertible Securities Fund - Class A | | 1.24% | | | 1,000.00 | | | | 986.10 | | | | 6.21 | | | | 1,018.95 | | | | 6.31 | |
| Rational/Pier 88 Convertible Securities Fund - Class C | | 1.99% | | | 1,000.00 | | | | 984.00 | | | | 9.95 | | | | 1,015.17 | | | | 10.11 | |
| Rational/Pier 88 Convertible Securities Fund - Institutional ** | | 0.99% | | | 1,000.00 | | | | 987.40 | | | | 4.96 | | | | 1,020.21 | | | | 5.04 | |
| Rational Inflation Growth Fund - Class A ++ | | 1.74% | | | 1,000.00 | | | | 986.10 | | | | 6.39 | | | | 1,012.06 | | | | 6.47 | |
| Rational Inflation Growth Fund - Class C ++ | | 2.49% | | | 1,000.00 | | | | 984.00 | | | | 9.14 | | | | 1,009.28 | | | | 9.25 | |
| Rational Inflation Growth Fund - Institutional ++ | | 1.49% | | | 1,000.00 | | | | 987.40 | | | | 5.48 | | | | 1,012.98 | | | | 5.55 | |
| * | Expenses are equal to the Funds’ annualized expense ratios multiplied by the average account value over the period, multiplied by 184/365 to reflect the one-half year period. |
| ** | Annualized expense ratio does not include interest expenses or dividend expenses. |
| + | Actual Expenses calculated from August 18, 2021 (commencement of operations) to December 31, 2021. Please note that while the Fund commenced operations on August 18, 2021, the hypothetical expenses paid during the period reflect activity for the full six month period for the purpose of comparability. This projection assumes that annualized expense ratios were in effect during the period July 1, 2021 to December 31, 2021. Expenses are equal to the Fund’s annualized expense ratio, multiplied by the number of days in the period (135) divided by the number of days in the fiscal year (365). |
| RATIONAL FUNDS | |
| SUPPLEMENTAL INFORMATION |
| December 31, 2021 | ANNUAL REPORT |
MFVIT Approvals for December 31, 2021 Annual Report
September 14 and 22, 2021 Approvals
Consideration and Renewal of Management Agreement between Mutual Fund and Variable Insurance Trust and Rational Advisors, Inc. with respect to Rational Pier 88 Fund, September 14 and 22, 2021
In connection with a telephonic meeting held on September 14 and 22, 2021, the Board of Trustees (the “Board” or the “Trustees”) of Mutual Fund and Variable Insurance Trust (the “Trust”), including a majority of the Trustees who are not “interested persons,” as that term is defined in the Investment Company Act of 1940, as amended, of the Trust, discussed the renewal of the management agreement between the Trust and Rational Advisors, Inc. (“Rational”) with respect to Rational Pier 88 Fund (the “Pier 88 Fund”), a series of the Trust (the “Management Agreement”).
The Board was assisted by legal counsel throughout the review process. The Board relied upon the advice of legal counsel and its own business judgment in evaluating the Management Agreement and the weight to be given to each factor considered. The conclusions reached by the Board were based upon a comprehensive evaluation and discussion of all the information provided and were not the result of any one factor. Moreover, each Trustee might have afforded different weight to the various factors in reaching his conclusions with respect to the Management Agreement. In connection with its deliberations regarding approval of the Management Agreement, the Board reviewed materials prepared by Rational (the “Rational 15(c) Response”). The Board also considered the information presented at Board meetings throughout the year.
Review of Rational 15 (c)Response
Nature, Extent and Quality of Services. The Board reviewed the services Rational provides to the Pier 88 Fund and information concerning Rational’s financial condition, resources, personnel, business operations, and compliance program. The Board reviewed Rational’s Form ADV as of April 27, 2021, and the firm’s balance sheet as of June 30, 2021. The Board noted that there were no new compliance or regulatory issues. After further discussion and review of the Rational 15(c) Response, the Board concluded that Rational had sufficient quality of personnel, resources, operations and compliance policies and procedures essential to performing its duties under the Management Agreement and that the nature, overall quality and extent of the advisory services provided to the Fund by Rational were acceptable.
Performance. The Board considered that the Pier 88 Fund’s assets as of June 30, 2021, had grown to approximately $98.2 million, an increase from approximately $ 57.4 million in assets as of June 30, 2020. The Board compared the returns of the Fund to those of its peer group, Morningstar category, and benchmarks for periods ended June 30, 2021. The Board considered that the Fund had outperformed the Bloomberg U.S. Aggregate Bond Index for the 1- and 3-year periods and the period since inception on March 1, 2017; outperformed the ICE BofA Investment Grade U.S. Convertible 5% Constrained Index for the 3-year period but underperformed for the 1-year and since inception periods; and underperformed its peer group, the Morningstar Convertibles
| RATIONAL FUNDS | |
| SUPPLEMENTAL INFORMATION (Continued) |
| December 31, 2021 | ANNUAL REPORT |
category, and the S&P 500 Total Return Index for the 1-year 3-year and since inception periods. The Board noted that the Fund invested primarily in investment-grade debt obligations and considered Rational’s attribution of the Fund’s underperformance of its peer group and Morningstar category averages to strong returns from below investment-grade convertible bonds. The Board considered Rational’s statement that the expertise of the Fund’s sub-advisor, Pier 88 Investments, LLC (“Pier 88”), in investment grade-convertible debt and investment approach have contributed to the Fund’s performance. After further discussion, the Board determined the Fund’s performance was acceptable.
Fees and Expenses. The Board considered that Rational’s management fee for Pier 88 Fund was higher than the median and average, but within the range of, advisory fees for the peer group and the Morningstar Convertibles category. After further discussion, the Board concluded that the management fees payable to Rational with respect to the Fund were reasonable.
The Board also noted that the Fund’s net expense ratio (after waivers and reimbursements) was below the peer group and Morningstar category median expenses, below the peer group and above the Morningstar category average expenses, but within the range of average expenses for the peer group and Morningstar category. After further discussion, the Board concluded that the Fund’s net expenses were reasonable.
Profitability. The Board reviewed a report from Rational analyzing the firm’s profitability with respect to its management of the Pier 88 Fund, and noted that Rational was managing the Fund at a loss. The Board concluded that the level of Rational’s profitability with respect to the Fund did not raise any concerns.
“Fall-out” Benefits. The Board considered fall-out benefits received by Rational from its relationship with the Pier 88 Fund and the Trust.
Economies of Scale. The Board considered whether Rational was sharing economies of scale with the Pier 88 Fund. The Board noted that the Management Agreement did not contain breakpoints that reduce the fee rate on assets above specified levels. The Board considered Rational’s view that advisory fee breakpoints were not appropriate in light of the significant risks inherent in the management of funds. The Board determined, after further discussion, that economies of scale had not been reached and agreed that the matter of economies of scale would be revisited as the Fund’s assets increased.
Conclusion. The Board considered many factors, and no single factor was determinative to the decision of the Board. Having requested, reviewed, and discussed in depth such information from Rational as the Board believed to be reasonably necessary to evaluate the terms of the Management Agreement, as assisted by the advice of counsel, the Board concluded that renewal of the Management Agreement was in the best interest of the Pier 88 Fund and its shareholders.
| RATIONAL FUNDS | |
| SUPPLEMENTAL INFORMATION (Continued) |
| December 31, 2021 | ANNUAL REPORT |
Consideration and Renewal of Sub-Advisory Agreement between Rational Advisors, Inc. and Pier 88 Investment Partners with respect to Rational Pier 88 Convertible Securities Fund, September 14 and 22, 2021
In connection with a telephonic meeting held on September 14 and 22, 2021, the Board of Trustees (the “Board” or the “Trustees”) of Mutual Fund and Variable Insurance Trust (the “Trust”), including a majority of the Trustees who are not “interested persons,” as that term is defined in the Investment Company Act of 1940, as amended, of the Trust, discussed the renewal of the sub-advisory agreement between Rational Advisors, Inc. (“Rational”) and Pier 88 Investment Partners (“Pier 88”) with respect to Rational Pier 88 Convertible Securities Fund (the “Pier 88 Fund”), a series of the Trust (the “Pier 88 Sub-Advisory Agreement”).
The Board was assisted by legal counsel throughout the review process. The Board relied upon the advice of legal counsel and its own business judgment in evaluating the Pier 88 Sub-Advisory Agreement and the weight to be given to each factor considered. The conclusions reached by the Board were based upon a comprehensive evaluation and discussion of all the information provided and were not the result of any one factor. Moreover, each Trustee might have afforded different weight to the various factors in reaching his conclusions with respect to the Pier 88 Sub-Advisory Agreement. In connection with its deliberations regarding approval of the Pier 88 Sub-Advisory Agreement, the Board reviewed materials prepared by Pier 88 (the “Pier 88 15(c) Response”) and Rational, and considered the information presented at Board meetings throughout the year.
Review of Pier 88 15(c) Response
Nature, Extent, and Quality of Services. The Board reviewed the nature, extent, and quality of the services provided by the investment professionals at Pier 88. The Board reviewed information concerning Pier 88’s financial condition and resources; personnel, business operations, and compliance program. The Board considered that Pier 88 managed the Pier 88 Fund’s portfolio in accordance with its principal strategies in seeking to achieve the Fund’s investment objective. The Board reviewed a copy of Pier 88’s Form ADV. After further discussion and review of the Pier 88 15(c) Response, the Board concluded that Pier 88 would continue to provide an acceptable level of services to the Fund.
Performance. The Board considered that the Pier 88 Fund’s assets as of June 30, 2021, had grown to approximately $98.2 million, an increase from approximately $ 57.4 million in assets as of June 30, 2020. The Board compared the returns of the Fund to those of its peer group, Morningstar category, and benchmarks for periods ended June 30, 2021. The Board considered that the Fund had outperformed the Bloomberg U.S. Aggregate Bond Index for the 1- and 3-year periods and the period since inception on March 1, 2017; outperformed the ICE BofA Investment Grade U.S. Convertible 5% Constrained Index for the 3-year period but underperformed for the 1 -year and since inception periods; and underperformed its peer group, the Morningstar Convertibles category, and the S&P 500 Total Return Index for the 1- and 3-year and since inception periods. The Board noted that the Fund invested primarily in investment-grade debt obligations and considered Rational’s attribution of the Fund’s underperformance of its peer group and Morningstar category averages to strong returns from below investment-grade convertible bonds. The Board considered
| RATIONAL FUNDS | |
| SUPPLEMENTAL INFORMATION (Continued) |
| December 31, 2021 | ANNUAL REPORT |
Rational’s statement that the expertise of the Fund’s sub-advisor, Pier 88 Investments, LLC (“Pier 88”), in investment grade-convertible debt and investment approach have contributed to the Fund’s performance. After further discussion, the Board determined the Fund’s performance was acceptable.
Fees and Expenses. The Board considered that the sub-advisory fees paid to Pier 88 with respect to the Fund were paid entirely by Rational. The Board noted that the sub-advisory fee payable to Pier 88 were 50% of the 0.85% fee charged by Rational and considered Rational and Pier 88’s view that the sub-advisory fee was reasonable in light of the 0.75% that Pier 88 charges to separately managed accounts with similar investment strategies. The Board noted that with the contractual expense cap in place, Rational and Pier 88 were waiving a portion of their fees. After further discussion, the Board concluded that the sub-advisory fees payable to Pier 88 with respect to the Fund were reasonable.
Profitability. The Board reviewed a profitability analysis provided by Pier 88 with respect to the Pier 88 Fund and noted that Pier 88 operates the Fund at a loss after marketing expenses. After further discussion, the Board concluded that the level of Pier 88’s profitability with respect to the Fund was not a concern at this time.
“Fall-out” Benefits. The Board considered fall-out benefits received by Pier 88 from its relationship with the Pier 88 Fund and the Trust.
Economies of Scale. The Board agreed that economies of scale are primarily an advisor level issue and should be considered with respect to the overall Management Agreement, taking into consideration the impact of the sub-advisory expense.
Conclusion. The Board considered many factors, and no single factor was determinative to the decision of the Board concerning the renewal of the Pier 88 Sub-Advisory Agreement. Having received, reviewed, and discussed in depth such information from Pier 88 as the Board believed to be reasonably necessary to evaluate the terms of the Pier 88 Sub-Advisory Agreement, and as assisted by the advice of counsel, the Board concluded that renewal of the Pier 88 Sub-Advisory Agreement was in the best interests of the Pier 88 Fund and its shareholders.
Consideration and Renewal of Sub-Advisory Agreement between Rational Advisors, Inc. and Equity Armor, LLC with respect to Rational Equity Armor Fund, September 14 and 22, 2021
In connection with a telephonic meeting held on September 14 and 22, 2021, the Board of Trustees (the “Board” or the “Trustees”) of Mutual Fund and Variable Insurance Trust (the “Trust”), including a majority of the Trustees who are not “interested persons,” as that term is defined in the Investment Company Act of 1940, as amended, of the Trust, discussed the renewal of the sub-advisory agreement between Rational Advisors, Inc. (“Rational”) and Equity Armor, LLC (“Equity Armor”) with respect to Rational Equity Armor Fund (the “Equity Armor Fund”), a series of the Trust (the “Equity Armor Sub-Advisory Agreement”).
The Board was assisted by legal counsel throughout the review process. The Board relied upon the advice of legal counsel and its own business judgment in evaluating the Equity Armor
| RATIONAL FUNDS | |
| SUPPLEMENTAL INFORMATION (Continued) |
| December 31, 2021 | ANNUAL REPORT |
Sub-Advisory Agreement and the weight to be given to each factor considered. The conclusions reached by the Board were based upon a comprehensive evaluation and discussion of all the information provided and were not the result of any one factor. Moreover, each Trustee might have afforded different weight to the various factors in reaching his conclusions with respect to the Equity Armor Sub-Advisory Agreement. In connection with its deliberations regarding approval of the Equity Armor Sub-Advisory Agreement, the Board reviewed materials prepared by Equity Armor and Rational (the “Equity Armor 15(c) Response”), and considered the information presented at Board meetings throughout the year.
Review of Equity Armor 15(c)Responses
Nature, Extent, and Quality of Services. The Board reviewed the nature, extent, and quality of the services provided by the investment professionals at Equity Armor. The Board reviewed information concerning Equity Armor’s financial condition and resources; personnel, business operations, and compliance program. The Board considered that Equity Armor managed the Equity Armor Fund’s portfolio in accordance with its principal strategies in seeking to achieve the Fund’s investment objective. The Board reviewed a copy of Equity Armor’s Form ADV. The Board recommended that Equity Armor work with Mr. Schmidt to improve its compliance program and Board reporting. After further discussion and review of the Equity Armor 15(c) Response, the Board concluded that Equity Armor would continue to provide an acceptable level of services to the Fund.
Performance. The Board considered that the Equity Armor Fund’s assets as of June 30, 2021, had grown to approximately $70.6 million, an increase from approximately $38.4 million in assets as of June 30, 2020. The Board compared the returns of the Fund to those of its peer group, Morningstar category, and benchmarks for periods ended June 30, 2021. The Board noted that the Fund performed in line with five-star Morningstar rated hedged equity type funds such as the JP Morgan Hedged Equity Fund. The Board considered that the Fund lagged the S&P 500 Value Index and the S&P 500 Total Return Index for the one-, five-, and ten-year periods, but outperformed the S&P Value Index since Equity Armor began managing the Fund’s portfolio on December 12, 2019. The Board considered that Rational believes that the Fund has met its objective of seeking total return, with dividend income an important component of that return. After further discussion, the Board determined that the Fund’s performance was acceptable.
Fees and Expenses. The Board considered that the sub-advisory fees paid to Equity Armor with respect to the Equity Armor Fund were paid entirely by Rational. The Board noted that the sub-advisory fee payable to Equity Armor was 50% of the 0.75% fee paid by the Fund to Rational. The Board considered Rational and Equity Armor’s view that the sub-advisory fee was low relative to other funds that use derivatives of volatility products or funds that are actively managed with similar investment objectives. After further discussion, the Board concluded that the sub-advisory fees payable to Equity Armor with respect to the Fund were reasonable.
Profitability. The Board reviewed a profitability analysis provided by Equity Armor with respect to Equity Armor Fund and noted that Equity Armor operates the Fund with a minimal profit after taking into account marketing expenses. After further discussion, the Board concluded that the
| RATIONAL FUNDS | |
| SUPPLEMENTAL INFORMATION (Continued) |
| December 31, 2021 | ANNUAL REPORT |
level of Equity Armor’s profitability with respect to its overall relationship with the Equity Armor Fund was not a concern at this time.
“Fall-out” Benefits. The Board considered fall-out benefits received by Equity Armor from its relationship with the Equity Armor Fund and the Trust.
Economies of Scale. The Board agreed that economies of scale are primarily an advisor level issue and should be considered with respect to the overall Management Agreement, taking into consideration the impact of the sub-advisory expense.
Conclusion. The Board considered many factors, and no single factor was determinative to the decision of the Board concerning the renewal of the Equity Armor Sub-Advisory Agreement. Having received, reviewed, and discussed in depth such information from Equity Armor as the Board believed to be reasonably necessary to evaluate the terms of the Equity Armor Sub-Advisory Agreement, and as assisted by the advice of counsel, the Board concluded that renewal of the Equity Armor Sub-Advisory Agreement was in the best interests of the Equity Armor Fund and its shareholders.
June 18, 2021 Approval for the Inflation Growth Fund
Consideration and Approval of Management Agreement between Mutual Fund and Variable Insurance Trust and Rational Advisors, Inc. with respect to Rational Inflation Growth Fund, June 18, 2021
In connection with a telephonic meeting held on June 18, 2021, the Board of Trustees (the “Board” or the “Trustees”) of Mutual Fund and Variable Insurance Trust (the “Trust”), including a majority of the Trustees who are not “interested persons,” as that term is defined in the Investment Company Act of 1940, as amended, of the Trust, discussed the approval of the proposed management agreement between the Trust and Rational Advisors, Inc. (“Rational”) with respect to Rational Inflation Growth Fund (the “Inflation Growth Fund”), a newly established series of the Trust (the “Management Agreement”).
The Board was assisted by legal counsel throughout the review process. The Board relied upon the advice of legal counsel and its own business judgment in evaluating the Management Agreement and the weight to be given to each factor considered. The conclusions reached by the Board were based upon a comprehensive evaluation and discussion of all the information provided and were not the result of any one factor. Moreover, each Trustee might have afforded different weight to the various factors in reaching his conclusions with respect to the Management Agreement. In connection with its deliberations regarding approval of the Management Agreement, the Board reviewed materials prepared by Rational (the “Rational 15(c) Response”).
Review of Rational 15(c) Response
Nature, Extent, and Quality of Services. The Board reviewed the services that Rational would provide to the Inflation Growth Fund and information concerning the financial condition and resources, personnel, business, operations, and compliance program of Rational. The Board noted
| RATIONAL FUNDS | |
| SUPPLEMENTAL INFORMATION (Continued) |
| December 31, 2021 | ANNUAL REPORT |
its familiarity with the key personnel serving the other series of the Trust and other affiliated funds, and discussed the consistent and quality services provided by the team of professionals at Rational. The Board then discussed the firm’s culture of compliance and risk management program. After further discussion and review of the Rational 15(c) Response, the Board concluded that Rational would provide an acceptable level of services to the Fund.
Performance. The Board compared the returns of the Energy Infrastructure Fund (which is mutual fund with a comparable investment strategy focused on infrastructure and managed by Catalyst Capital Advisors LLC, an affiliate of Rational (“Catalyst”), and also sub-advised by SL Advisors) for various periods ended March 31, 2021 to those of its benchmark, the Alerian MLP TR Index, and noted that the Energy Infrastructure Fund had outperformed its benchmark for the 5-year period, but underperformed the benchmark for the 1- and 3-year periods and the period since inception. After further discussion, the Board determined that it would revisit the Inflation Growth Fund’s performance after it commenced investment operations.
Fees and Expenses. The Board reviewed the proposed advisory fees for the Inflation Growth Fund of 1.25% as compared to those of a peer group of alternative strategy funds drawn from the Morningstar Multialternative category. The Board considered that the proposed advisory fee was lower than the median and average advisory fees of the peer group and was higher than the median and average, but within the range of, advisory fees in the Morningstar category.
The Board considered that the Inflation Growth Fund’s Institutional shares expected gross expense ratio, 2.10%, was above the median and average expense ratios of the peer group and Morningstar Multialternative category. The Board also considered that expected net expense ratio (after expense reimbursements) of the Fund’s Institutional shares, 1.49%, was higher than the median net expense ratio of the Morningstar category, but lower than the median expense ratio of the peer group and the average net expenses for both the peer group and the Morningstar category.
Profitability. The Board reviewed the projected profitability analysis that Rational had provided with respect to the Inflation Growth Fund and considered that Rational did not expect to realize a profit from its management of the Fund in the first 12 months of operations, but did expect to realize a profit during the second year. After further discussion, the Board concluded that the level of Rational’s expected profitability with respect to the Fund did not raise any concerns.
“Fall-out” Benefits. The Board considered the fall-out benefits that Rational was expected to receive from its relationship with the Inflation Growth Fund and the Trust.
Economies of Scale. The Board considered Rational’s statement that it did not expect the Inflation Growth Fund to benefit from economies of scale until the Fund had achieved at least $200 million in assets. The Board considered Rational’s statement that it did not believe that advisory fee breakpoints were appropriate due to the nature of the Fund’s management and risks, including liquidity and complex and extensive compliance issues. The Board determined, after further discussion, that the matter of economies of scale would be revisited as the Fund’s assets materially increased.
| RATIONAL FUNDS | |
| SUPPLEMENTAL INFORMATION (Continued) |
| December 31, 2021 | ANNUAL REPORT |
Conclusion. No single factor was determinative to the decision of the Board. Having reviewed and discussed in depth such information from Rational as the Board believed to be reasonably necessary to evaluate the terms of the Management Agreement, and as assisted by the advice of counsel, the Board concluded that approval of the Agreement was in the best interests of the Inflation Growth Fund and its future shareholders.
Consideration and Approval of Sub-Advisory Agreement between Rational Advisors, Inc. and SL Advisors, LLC with respect to Rational Inflation Growth Fund, June 18, 2021
In connection with a telephonic meeting held on June 10, 2021, the Board of Trustees (the “Board” or the “Trustees”) of Mutual Fund and Variable Insurance Trust (the “Trust”), including a majority of the Trustees who are not “interested persons,” as that term is defined in the Investment Company Act of 1940, as amended, of the Trust, discussed the approval of the proposed sub-advisory agreement between Rational Advisors, Inc. (“Rational”) and SL Advisors, LLC (“SL Advisors”) with respect to Rational Inflation Growth Fund (the “Inflation Growth Fund”), a newly established series of the Trust (the “SL Advisors Sub-Advisory Agreement”).
The Board was assisted by legal counsel throughout the review process. The Board relied upon the advice of legal counsel and its own business judgment in evaluating the SL Advisors Sub-Advisory Agreement and the weight to be given to each factor considered. The conclusions reached by the Board were based upon a comprehensive evaluation and discussion of all the information provided and were not the result of any one factor. Moreover, each Trustee might have afforded different weight to the various factors in reaching his conclusions with respect to the SL Advisors Sub-Advisory Agreement. In connection with its deliberations regarding approval of the SL Advisors Sub-Advisory Agreement, the Board reviewed materials prepared by SL Advisors (the “SL Advisors 15(c) Response”) and Rational.
Review of SL Advisors 15(c) Response
Nature, Extent, and Quality Extent of Services. The Board discussed the nature of SL Advisor’s operations and its management team. The Board reviewed SL Advisors’ Form ADV and considered Trust’s CCO’s determination that SL Advisors’ compliance program was reasonably designed to prevent violations of federal securities laws. The Board reviewed SL Advisors’ financial statement and determined that it did not raise any issues. After further discussion and review of the SL Advisors 15(c) Response, the Board concluded that SL Advisors would provide an acceptable level of services to the Inflation Growth Fund.
Performance. The Board compared the returns of the Energy Infrastructure Fund (which is mutual fund with a comparable investment strategy focused on infrastructure and managed by Catalyst Capital Advisors LLC, an affiliate of Rational (“Catalyst”), and also sub-advised by SL Advisors) for various periods ended March 31, 2021 to those of its benchmark, the Alerian MLP TR Index, and noted that the Energy Infrastructure Fund had outperformed its benchmark for the 5-year period, but underperformed the benchmark for the 1- and 3-year periods and the period since inception. After further discussion, the Board determined that it would revisit the Inflation Growth Fund’s performance after it commenced investment operations.
| RATIONAL FUNDS | |
| SUPPLEMENTAL INFORMATION (Continued) |
| December 31, 2021 | ANNUAL REPORT |
Fees and Expenses. The Board considered that the sub-advisory fees payable to SL Advisors with respect to the Inflation Growth Fund would be paid entirely by Rational. The Board noted that the sub-advisory fees payable to SL Advisors were 50% of the 1.25% fee to be charged by Rational, and considered Rational and SL Advisors’ view that the sub-advisory fee was reasonable in light of the specialized and active nature of the Fund’s portfolio management style. The Board noted that with the contractual expense cap in place, Rational and SL Advisors were waiving a portion of their fees. After further discussion, the Board concluded that the sub-advisory fees payable to SL Advisors with respect to the Fund were reasonable.
Profitability. The Board reviewed the projected profitability analysis that SL Advisors had provided with respect to the Inflation Growth Fund and considered that SL Advisors did not expect to realize a profit from its management of the Fund in the first 12 months of operations, but did expect to realize a profit during the second year. After further discussion, the Board concluded that the level of SL Advisors’ expected profitability with respect to the Fund did not raise any concerns.
“Fall-out” Benefits. The Board considered the fall-out benefits that SL Advisors was expected to receive from its relationship with the Inflation Growth Fund and the Trust.
Economies of Scale. The Board agreed that economies of scale are primarily an advisor-level issue and should be considered with respect to the overall management agreement with Rational, taking into consideration the impact of the sub-advisory expense.
Conclusion. The Board considered many factors, and no single factor was determinative to the decision of the Board concerning the approval of the SL Advisors Sub-Advisory Agreement. Having requested, reviewed, and discussed in depth such information from SL Advisors as the Board believed to be reasonably necessary to evaluate the terms of the SL Advisors Sub-Advisory Agreement, and as assisted by the advice of counsel, the Board concluded that approval of the SL Advisors Sub-Advisory Agreement was in the best interest of the Inflation Growth Fund and its future shareholders.
| RATIONAL FUNDS | |
| SUPPLEMENTAL INFORMATION (Continued) |
| December 31, 2021 | ANNUAL REPORT |
MFVIT Approvals for December 31, 2021 Annual Report
December 10 and 17, 2021 Approvals
Consideration and Renewal of Management Agreement between Mutual Fund and Variable Insurance Trust and Rational Advisors, Inc. with respect to Rational Equity Armor Fund, Rational Tactical Return Fund, Rational Dynamic Brands Fund, Rational Strategic Allocation Fund, Rational Special Situations Fund, Rational Pier 88 Fund, and Rational/ReSolve Adaptive Asset Allocation Fund, December 10 and 17, 2021
In connection with a telephonic meeting held on December 10 and 17, 2021, the Board of Trustees (the “Board” or the “Trustees”) of Mutual Fund and Variable Insurance Trust (the “Trust”), including a majority of the Trustees who are not “interested persons,” as that term is defined in the Investment Company Act of 1940, as amended, of the Trust, discussed the renewal of the management agreement between the Trust and Rational Advisors, Inc. (“Rational”) with respect to Rational Equity Armor Fund (the “Equity Armor Fund”), Rational Tactical Return Fund (the “Tactical Return Fund”), Rational Dynamic Brands Fund (the “Dynamic Brands Fund”), Rational Strategic Allocation Fund (the “Strategic Allocation Fund”), Rational Special Situations Fund (the “Special Situations Fund”), Rational Pier 88 Fund (the “Pier 88 Fund”), and Rational/ReSolve Adaptive Asset Allocation Fund (the “ReSolve Fund”), each a series of the Trust (collectively the “Renewal Funds”) (the “Management Agreement”).
The Board was assisted by legal counsel throughout the review process. The Board relied upon the advice of legal counsel and its own business judgment in evaluating the Management Agreement and the weight to be given to each factor considered. The conclusions reached by the Board were based upon a comprehensive evaluation and discussion of all the information provided for each Fund with respect to the approval of the Management Agreement and were not the result of any one factor. Moreover, each Trustee might have afforded different weight to the various factors in reaching his conclusions with respect to the Management Agreement. In connection with its deliberations regarding approval of the Management Agreement, the Board reviewed materials prepared by Rational (the “Rational 15(c) Response”) and considered the information presented at Board meetings throughout the year.
Review of Rational 15(c) Response
Nature, Extent, and Quality of Services. The Board reviewed the services provided by the team of professionals at Rational. The Board reviewed information concerning Rational’s resources, personnel, business operations, and culture of compliance. The Board reviewed Rational’s Form ADV as of April 27, 2021, and the firm’s balance sheet as of September 30, 2021. The Board noted that there were no new compliance or regulatory issues. After further discussion and review of the Rational 15(c) Response, the Board concluded that Rational had sufficient quality of personnel, resources, operations and compliance policies and procedures essential to performing its duties under the Management Agreement and that the nature, overall quality and extent of the advisory services provided to the Renewal Funds by Rational were acceptable.
| RATIONAL FUNDS | |
| SUPPLEMENTAL INFORMATION (Continued) |
| December 31, 2021 | ANNUAL REPORT |
Performance. The Board compared the returns of each Renewal Fund to those of its peer group, Morningstar category, and benchmarks for various periods ended September 30, 2021.
Equity Armor Fund. The Board considered that since Equity Armor began managing the Equity Armor Fund on December 13, 2019, through September 30, 2021, the Fund has outperformed the S&P 500 Value TR Index and underperformed the S&P 500 TR Index. The Fund outperformed the average returns of the Morningstar Options Trading category for the 1-, 3-, and 10-year periods and underperformed the category for the 5-year period. The Fund underperformed the average returns of the peer group, the Morningstar Large Value category, the S&P 500 Value TR Index, and the S&P 500 TR Index for the 1-, 3-, 5-, and 10-year periods. The Fund’s underperformance during the 1-year period was attributed to the performance of the Fund’s futures overlay during periods of increased market volatility. After further discussion, the Board determined that the Fund’s performance was acceptable.
Tactical Return Fund. The Board considered that the Tactical Return Fund outperformed the average returns of the peer group for the 3- and 5-year periods; underperformed the peer group average for the 1-year period; and underperformed the average returns of the Morningstar Options Trading Category and S&P 500 TR Index for the 1-, 3-, 5-, and 10-year periods. Rational noted that the Fund had achieved positive average annual returns despite several major market drawdown events since Warrington began managing the Fund, including the significant drawdowns in the fourth quarter of 2018 and the first quarter of 2020, with lower volatility than the S&P 500 TR Index. After further discussion, the Board determined that the Fund’s performance was acceptable.
Dynamic Brands Fund. The Board considered that since Accuvest began managing the Dynamic Brands Fund on October 17, 2017, through September 30, 2021, the Fund has outperformed the S&P 500 TR Index. The Fund outperformed the average returns of its peer group and Morningstar Large Growth category for the 3-year period; outperformed the S&P 500 TR Index for the 3- and 5-year periods; underperformed the peer group and Morningstar Large Growth category averages for the 1-, 5-, and 10-year periods; and underperformed the S&P 500 TR Index for the 1- and 10-year periods. After further discussion, the Board determined that the Fund’s performance was acceptable.
Strategic Allocation Fund. The Board considered that the Strategic Allocation Fund outperformed the average returns of its peer group, Morningstar Allocation 50-70% Equity category and the S&P 500 TR Index for the 1-year period; and underperformed the peer group and Morningstar category averages and the S&P 500 TR Index for the 3-, 5- , and 10-year periods. The Board noted that the Fund’s strategy was changed in December 2019. After further discussion, the Board determined that the Fund’s performance was acceptable.
Special Situations Fund. The Board considered that the Special Situations Fund outperformed the average returns of the Morningstar Nontraditional Bond category, the Bloomberg U.S. Aggregate Bond TR Index and the Bloomberg MBS TR Index for the 1-, 5-, and 10-year periods; outperformed the average returns of the peer group and the Morningstar Multisector Bond category for the 3-, 5-, and 10-year periods; and underperformed the peer group and Morningstar Multisector Bond averages for the 1-year period. After further discussion, the Board determined that the Fund’s performance was acceptable.
| RATIONAL FUNDS | |
| SUPPLEMENTAL INFORMATION (Continued) |
| December 31, 2021 | ANNUAL REPORT |
Pier 88 Fund. The Board considered that the Pier 88 Fund outperformed the Bloomberg U.S. Aggregate Bond TR Index for the 1- and 3-year periods and the period since inception on March 1, 2017; outperformed the ICE BofA IG US Convertible 5% Index for the 3-year period; underperformed the peer group and Morningstar Convertibles category averages for the 1- and 3-year periods and since inception; underperformed the ICE BofA IG US Convertible 5% Index for the 1-year and since inception periods; and underperformed the S&P 500 TR Index for the 1-, 3-and since inception periods. The Board discussed Rational’s explanation that the Fund trailed the peer group and Morningstar Convertibles category because of recent strong returns from the below investment grade convertible bonds and that the underperformance of the Fund’s convertible bond strategy relative to the S&P 500 TR Index is expected during a period of strong equity returns. After further discussion, the Board determined that the Fund’s performance was acceptable.
ReSolve Fund. The Board considered that the ReSolve Fund outperformed the Morningstar Macro Trading category average and the Barclay Hedged CTA Index for the 1-, 3-, 5-, and 10-year periods; outperformed the peer group average for the 1-, 3, and 10-year periods; underperformed the peer group average for the 5-year period; and underperformed the S&P 500 TR Index for the 1-, 3-, 5-, and 10-year periods. After further discussion, the Board determined that the Fund’s performance was acceptable.
Fees and Expenses. The Board compared each Renewal Fund’s management fees and net expenses to those of its peer group and Morningstar category.
Equity Armor Fund. The Board considered that the Equity Armor Fund’s assets had increased over the year ended September 30, 2021. The Board considered that Rational’s management fee for the Fund was lower than average and median advisory fees for the peer group and Morningstar Options Trading category, and higher than the average and median advisory fees for the Morningstar Large Value category, which includes funds with passive investment strategies in contrast with the Fund’s active investment strategy. After further discussion, the Board concluded that the management fees payable to Rational with respect to the Fund were reasonable.
The Board considered that the net expense ratio of the Equity Armor Fund’s Institutional shares was higher than the average and median net expense ratios of the peer group and both Morningstar categories. The Board considered the specialized nature of the Fund’s management, which included a futures overlay strategy. After further discussion, the Board concluded that the Fund’s net expenses were reasonable.
Tactical Return Fund. The Board considered that the Tactical Return Fund’s assets had increased over the year ended September 30, 2021. The Board considered that Rational’s management fee for the Fund was higher than the average and median advisory fees of the peer group and the Morningstar Options Trading category. The Board considered Rational’s statement that the Fund’s management fees were the same as those of two other funds with somewhat similar strategies in the Morningstar Options Trading category. The Board noted that with the contractual expense cap in place, Rational was waiving a portion of its fees with respect to the Fund. After further discussion, the Board concluded that the management fees payable to Rational with respect to the Fund were reasonable.
| RATIONAL FUNDS | |
| SUPPLEMENTAL INFORMATION (Continued) |
| December 31, 2021 | ANNUAL REPORT |
The Board considered that the net expense ratio of the Tactical Return Fund’s Institutional shares was higher than the average and median net expense ratios of the peer group and the Morningstar Options Trading category. After further discussion, the Board concluded that the Fund’s net expenses were reasonable.
Dynamic Brands Fund. The Board considered that the Dynamic Brands Fund’s assets had increased significantly over the year ended September 30, 2021. The Board considered that Rational’s management fee for the Fund was lower than the average and equal to the median advisory fees of the peer group; and higher than the average and median advisory fees of the Morningstar Large Growth category. The Board noted that with the contractual expense cap in place, Rational was waiving a portion of its fees with respect to the Fund. After further discussion, the Board concluded that the management fees payable to Rational with respect to the Fund were reasonable.
The Board considered that the net expense ratio of the Dynamic Brands Fund’s Institutional shares was higher than the average and median net expense ratios of the peer group and Morningstar Options Trading category. After further discussion, the Board concluded that the Fund’s net expenses were reasonable.
Strategic Allocation Fund. The Board considered that the Strategic Allocation Fund’s assets had increased over the year ended September 30, 2021. The Board considered that Rational’s management fee for the Fund was lower than the average and median advisory fees of the peer group and the Morningstar Allocation 50%-70% Equity category. The Fund’s management fee was within range of advisory fees paid by other funds of funds. The Board noted that with the contractual expense cap in place, Rational was waiving a portion of its fees with respect to the Fund. After further discussion, the Board concluded that the management fees payable to Rational with respect to the Fund were reasonable.
The Board considered that the net expense ratio of the Strategic Allocation Fund’s Institutional shares was higher than the average net expense ratios of the peer group and Morningstar category. After further discussion, the Board concluded that the Fund’s net expenses were reasonable.
Special Situations Fund. The Board considered that the Special Situations Fund’s assets had increased significantly over the year ended September 30, 2021. The Board considered that Rational’s management fee for the Fund was higher than the average advisory fees of the peer group, the Morningstar Non- Traditional Bond category, and the Morningstar Multisector Bond category, but lower than the highest advisory fee of the peer group and the Morningstar Non-Traditional Bond category. The Board considered the specialized nature of the Fund’s investment strategy, which involves investing in undervalued mortgage-backed securities and identifying special situations within the asset class that offer the potential for asymmetric upside returns. The Board noted that with the contractual expense cap in place, Rational was waiving a portion of its fees with respect to the Fund. After further discussion, the Board concluded that the management fees payable to Rational with respect to the Fund were reasonable.
The Board considered that the net expense ratio of the Special Situations Fund’s Institutional shares was higher than the average net expense ratios of the peer group and both Morningstar
| RATIONAL FUNDS | |
| SUPPLEMENTAL INFORMATION (Continued) |
| December 31, 2021 | ANNUAL REPORT |
categories. After further discussion, the Board concluded that the Fund’s net expenses were reasonable.
Pier 88 Fund. The Board considered that the Pier 88 Fund’s assets had increased over the year ended September 30, 2021. The Board considered that Rational’s management fee for the Fund was higher than the average and median advisory fees for the peer group and Morningstar Convertibles category, but lower than the highest advisory fee of either the peer group or the Morningstar category. The Board considered the specialized nature of the Fund’s investment strategy, which focuses on investing in convertible securities. The Board noted that with the contractual expense cap in place, Rational was waiving a portion of its fees with respect to the Fund. After further discussion, the Board concluded that the management fees payable to Rational with respect to the Fund were reasonable.
The Board considered that the net expense ratio of the Pier 88 Fund’s Institutional shares was lower than the average, but higher than the median, net expense ratio of the peer group and higher than the average and median for the Morningstar category. After further discussion, the Board concluded that the Fund’s net expenses were reasonable.
ReSolve Fund. The Board considered that the ReSolve Fund’s assets had increased over the year ended September 30, 2021. The Board considered that Rational’s management fee for the Fund was higher than the average and median advisory fees for the peer group and the Morningstar Macro Trading category. The Board considered the specialized nature of the Fund’s investment strategy, which uses a proprietary methodology to identify investment opportunities and utilizes futures contracts. The Board noted that with the contractual expense cap in place, Rational was waiving a portion of its fees with respect to the Fund. After further discussion, the Board concluded that the management fees payable to Rational with respect to the Fund were reasonable.
The Board considered that the net expense ratio of the ReSolve Fund’s Institutional shares was higher than the average and median net expense ratios of the peer group and the Morningstar category. After further discussion, the Board concluded that the Fund’s net expenses were reasonable.
Profitability. The Board reviewed a profitability analysis provided for each Renewal Fund. Rational realized profits from its management of the Tactical Return Fund, Dynamic Brands Fund, Pier 88 Fund, ReSolve Fund, and Special Situations Fund; and incurred losses with respect to the Equity Armor Fund and Strategic Allocation Fund. After further discussion, the Board concluded that the level of Rational’s profitability with respect to each Renewal Fund did not raise any concerns.
Economies of Scale. The Board noted that, except for the Equity Armor Fund and Dynamic Brands Fund, the Management Agreement did not contain breakpoints that reduce the fee rate on assets above specified levels. The Board agreed that establishing management fee breakpoints for other Renewal Funds might be an appropriate way for Rational to share its economies of if the Renewal Fund experienced significant growth in assets. After further discussion, the Board noted that no Renewal Fund had reached such levels and agreed to revisit the issue of breakpoints at the Management Agreement’s next renewal.
| RATIONAL FUNDS | |
| SUPPLEMENTAL INFORMATION (Continued) |
| December 31, 2021 | ANNUAL REPORT |
Conclusion. The Board considered many factors, and no single factor was determinative to the decision of the Board concerning the renewal of the Management Agreement with respect to the Renewal Funds. Having requested, reviewed, and discussed in depth such information from Rational as the Board believed to be reasonably necessary to evaluate the terms of the Management Agreement, and as assisted by the advice of counsel, the Board concluded the renewal of the Management Agreement was in the best interest of each Renewal Fund and its shareholders.
Consideration and Renewal of Sub-Advisory Agreements with respect to Rational Tactical Return Fund, Rational Dynamic Brands Fund, Rational Special Situations Fund, Rational/ReSolve Adaptive Asset Allocation Fund, Rational Pier 88 Convertible Securities Fund, and Rational Equity Armor Fund, December 10 and 17, 2021
In connection with a telephonic meeting held on December 10 and 17, 2021, the Board of Trustees (the “Board” or the “Trustees”) of Mutual Fund and Variable Insurance Trust (the “Trust”), including a majority of the Trustees who are not “interested persons,” as that term is defined in the Investment Company Act of 1940, as amended, of the Trust, discussed the renewal of sub-advisory agreements (each a “Sub-Advisory Agreement”) between Rational Advisors, Inc. (“Rational”) and certain sub-advisors with respect to the series of the Trust (each a “Fund”) shown in the following table.
| Sub-Advisor | Fund |
| Warrington Asset Management, LLC (“Warrington”) | Rational Tactical Return Fund (the “Tactical Return Fund”) |
| Accuvest Global Advisors (“Accuvest”) | Rational Dynamic Brands Fund (the “Dynamic Brands Fund”) |
| ESM Management, LLC (“ESM”) | Rational Special Situations Fund (the “Special Situations Fund”) |
| ReSolve Asset Management Inc. (“ReSolve Canada”) | Rational/ReSolve Adaptive Asset Allocation Fund (the “ReSolve Fund”) |
| Pier 88 Investment Partners (“Pier 88”) | Rational Pier 88 Convertible Securities Fund (the “Pier 88 Fund”) |
| Equity Armor, LLC (“Equity Armor”) | Rational Equity Armor Fund (the “Equity Armor Fund”) |
The Board was assisted by legal counsel throughout the review process. The Board relied upon the advice of counsel and its own business judgment in evaluating each Sub-Advisory Agreement and the weight to be given to each factor considered. The conclusions reached by the Board were based upon a comprehensive evaluation and discussion of all the information provided and were not the result of any one factor. Moreover, each Trustee might have afforded different weight to the various factors in reaching his conclusions with respect to each Sub- Advisory Agreement. The Board reviewed the materials prepared by the sub-advisors (each a “15(c) Response”) and Rational, and considered the information presented at Board meetings throughout the year.
| RATIONAL FUNDS | |
| SUPPLEMENTAL INFORMATION (Continued) |
| December 31, 2021 | ANNUAL REPORT |
Review of Warrington 15(c) Response
Nature, Extent, and Quality of Services. The Board reviewed the nature, extent, and quality of the services provided by the investment professionals at Warrington. The Board reviewed information concerning Warrington’s financial condition and resources; personnel, business; operations and compliance program. The Board considered that Warrington managed the Tactical Return Fund’s portfolio in accordance with its principal strategies in seeking to achieve the Fund’s investment objective. The Board reviewed a copy of Warrington’s Form ADV. After further discussion and review of the Warrington 15(c) Response, the Board concluded that Warrington would continue to provide an acceptable level of services to the Tactical Return Fund.
Performance. The Tactical Return Fund outperformed the average returns of the peer group for the 3- and 5-year periods; underperformed the peer group average for the 1-year period; and underperformed the average returns of the Morningstar Options Trading Category and S&P 500 TR Index for the 1-, 3-, 5-, and 10-year periods. Rational noted that the Fund had achieved positive average annual returns despite several major market drawdown events since Warrington began managing the Fund, including the significant drawdowns in the fourth quarter of 2018 and the first quarter of 2020, with lower volatility than the S&P 500 TR Index. After further discussion, the Board determined that the Tactical Return Fund’s performance was acceptable.
Fees and Expenses. The Board considered that the sub-advisory fee paid to Warrington with respect to the Tactical Return Fund was paid entirely by Rational. The sub-advisory fee payable to Warrington, 50% of the 1.75% fee charged by Rational, was lower than the fees that Warrington charged to separately managed accounts following a similar strategy. With the contractual expense cap in place, Rational and Warrington were waiving a portion of their fees. After further discussion, the Board concluded that the sub-advisory fees payable to Warrington with respect to the Tactical Return Fund were reasonable.
Profitability. The Board reviewed a profitability analysis provided by Warrington with respect to the Tactical Return Fund and noted that Warrington realized a profit from managing the Fund’s portfolio. After further discussion, the Board concluded that the level of Warrington’s profitability with respect to the Tactical Return Fund did not raise any concerns.
“Fall-out” Benefits. The Board considered fall-out benefits received by Warrington from its relationship with the Tactical Return Fund and the Trust.
Economies of Scale. The Board agreed that economies of scale are primarily an advisor-level issue and should be considered with respect to the overall Management Agreement, taking into consideration the impact of the sub-advisory expense.
Conclusion. The Board considered many factors, and no single factor was determinative to the decision of the Board concerning the renewal of the Warrington Sub-Advisory Agreement. Having requested, reviewed, and discussed in depth such information from Warrington as the Board believed to be reasonably necessary to evaluate the terms of the Warrington Sub-Advisory Agreement, and as assisted by the advice of counsel, the Board concluded that the renewal of the
| RATIONAL FUNDS | |
| SUPPLEMENTAL INFORMATION (Continued) |
| December 31, 2021 | ANNUAL REPORT |
Warrington Sub-Advisory Agreement was in the best interests of the Tactical Return Fund and its shareholders.
Review of Accuvest 15(c) Response
Nature, Extent, and Quality of Services. The Board reviewed the nature, extent, and quality of the services provided by the investment professionals at Accuvest. The Board reviewed information concerning Accuvest’s financial condition and resources; personnel, business; operations and compliance program. The Board considered that Accuvest managed the Dynamic Brands Fund’s portfolio in accordance with its principal strategies in seeking to achieve the Fund’s investment objective. The Board reviewed a copy of Accuvest’s Form ADV. After discussion and review of the Accuvest’s 15(c) Response, the Board concluded that Accuvest would continue to provide an acceptable level of services to the Dynamic Brands Fund.
Performance. Since Accuvest began managing the Dynamic Brands Fund on October 17, 2017, through September 30, 2021, the Fund has outperformed the S&P 500 TR Index. The Fund outperformed the average returns of its peer group and Morningstar Large Growth category for the 3-year period; outperformed the S&P 500 TR Index for the 3- and 5-year periods; underperformed the peer group and Morningstar Large Growth category averages for the 1-, 5-, and 10-year periods; and underperformed the S&P 500 TR Index for the 1- and 10-year periods. After further discussion, the Board determined that the Dynamic Brand Fund’s performance was acceptable.
Fees and Expenses. The Board considered that the sub-advisory fee paid to Accuvest pursuant to the Accuvest Sub-Advisory Agreement was paid entirely by Rational. The sub-advisory fee payable to Accuvest, 50% of the 0.75% fee charged by Rational, was lower than the fees that Accuvest receives for managing other funds and separately managed accounts following a similar strategy. After further discussion, the Board concluded that the sub-advisory fees payable to Accuvest with respect to the Dynamic Brands Fund were reasonable.
Profitability. The Board reviewed a profitability analysis provided by Accuvest with respect to the Dynamic Brands Fund and noted that Accuvest realized a profit from managing the Fund’s portfolio. After further discussion, the Board concluded that the level of Accuvest’s profitability with respect to the Dynamic Brands Fund did not raise any concerns.
“Fall-out” Benefits. The Board considered fall-out benefits received by Accuvest from its relationship with the Dynamic Brands Fund and the Trust.
Economies of Scale. The Board agreed that economies of scale are primarily an advisor-level issue and should be considered with respect to the overall Management Agreement, taking into consideration the impact of the sub-advisory expense.
Conclusion. The Board considered many factors, and no single factor was determinative to the decision of the Board concerning the renewal of the Accuvest Sub-Advisory Agreement. Having requested, reviewed, and discussed in depth such information from Accuvest, as the Board believed to be reasonably necessary to evaluate the terms of the Accuvest Sub-Advisory Agreement, and as assisted by the advice of counsel, the Board concluded that the renewal of the
| RATIONAL FUNDS | |
| SUPPLEMENTAL INFORMATION (Continued) |
| December 31, 2021 | ANNUAL REPORT |
Accuvest Sub -Advisory Agreement was in the best interests of the Dynamic Brands Fund and its shareholders.
Review of ESM 15(c) Response
Nature, Extent, and Quality of Services. The Board reviewed the nature, extent, and quality of the services provided by the investment professionals at ESM. The Board reviewed information concerning ESM’s financial condition and resources; personnel, business; operations and compliance program. The Board considered that ESM managed the Special Situations Fund’s portfolio in accordance with its principal strategies in seeking to achieve the Fund’s investment objective. The Board reviewed a copy of ESM’s Form ADV. After further discussion and review of the ESM 15(c) Response, the Board concluded that ESM would continue to provide an acceptable level of services to the Special Situations Fund.
Performance. The Special Situations Fund outperformed the average returns of the Morningstar Nontraditional Bond category, the Bloomberg U.S. Aggregate Bond TR Index and the Bloomberg MBS TR Index for the 1-, 3-, 5-, and 10-year periods; outperformed the average returns of the peer group and the Morningstar Multisector Bond category for the 3- , 5-, and 10- year periods; and underperformed the peer group and Morningstar Multisector Bond averages for the 1-year period. After further discussion, the Board determined that the Special Situations Fund’s performance was acceptable.
Fees and Expenses. The Board considered that the sub-advisory fee paid to ESM pursuant to the ESM Sub-Advisory Agreement was paid entirely by Rational. The sub-advisory fee payable to ESM, 50% of the 1.50% fee charged by Rational, was lower than the fees that ESM receives from separately managed accounts following a similar strategy. The Board noted that with the contractual expense cap in place, Rational and ESM were waiving a portion of their fees. After further discussion, the Board concluded that the sub-advisory fees payable to ESM with respect to the Special Situations Fund were reasonable.
Profitability. The Board reviewed a profitability analysis provided by ESM with respect to the Special Situations Fund and noted that ESM realized a profit from managing the Fund’s portfolio. After further discussion, the Board concluded that the level of ESM’s profitability with respect to the Special Situations Fund did not raise any concerns.
“Fall-out” Benefits. The Board considered fall-out benefits received by ESM from its relationship with the Special Situations Fund and the Trust.
Economies of Scale. The Board agreed that economies of scale are primarily an advisor-level issue and should be considered with respect to the overall Management Agreement, taking into consideration the impact of the sub-advisory expense.
Conclusion. The Board considered many factors, and no single factor was determinative to the decision of the Board concerning the renewal of the ESM Sub-Advisory Agreement. Having requested, reviewed, and discussed in depth such information from ESM, as the Board believed to be reasonably necessary to evaluate the terms of the ESM Sub-Advisory Agreement, and as
| RATIONAL FUNDS | |
| SUPPLEMENTAL INFORMATION (Continued) |
| December 31, 2021 | ANNUAL REPORT |
assisted by the advice of counsel, the Board concluded that the renewal of the ESM Sub -Advisory Agreement was in the best interests of the Special Situations Fund and its shareholders.
Review of ReSolve Canada 15(c) Response
Nature, Extent, and Quality of Services. The Board reviewed the nature, extent, and quality of the services provided by the investment professionals at ReSolve Canada. The Board reviewed information concerning the financial condition and resources, personnel, business operations, and compliance program of ReSolve Canada and its responsibilities with respect to managing the ReSolve Fund. The Board reviewed ReSolve Canada’s financial statements. The Board considered that ReSolve Canada manages the Fund’s portfolio in accordance with its principal strategies in seeking to achieve the Fund’s investment objective. The Board reviewed a copy of ReSolve Canada’s Form ADV. After discussion and review of the ReSolve Canada 15(c) Response, the Board concluded that ReSolve Canada would continue to provide an acceptable level of services to the Fund.
Performance. The ReSolve Fund outperformed the Morningstar Macro Trading category average and the Barclay Hedged CTA Index for the 1-, 3-, 5-, and 10-year periods; outperformed the peer group average for the 1-, 3, and 10-year periods; underperformed the peer group average for the 5-year period; and underperformed the S&P 500 TR Index for the 1-, 3-, 5-, and 10-year periods. After further discussion, the Board determined that the Fund’s performance was acceptable.
Fees and Expenses. The Board considered that the sub-advisory fee paid to Resolve Canada were paid entirely by Rational. The Board noted that the sub-advisory fee payable to ReSolve Canada, 12.5% of the 1.75% fee charged by Rational, , was lower than the fees that ReSolve Canada charged to separately managed accounts following a similar strategy. The Board noted that with the contractual expense cap in place, Rational and ReSolve Canada were waiving a portion of their fees. After further discussion, the Board concluded that the sub-advisory fees payable to ReSolve Canada with respect to the Fund were reasonable.
Profitability. The Board reviewed profitability analyses provided by ReSolve Canada with respect to the ReSolve Fund and noted that ReSolve Canada realized a loss from managing the Fund’s portfolio. After further discussion, the Board concluded that the level of ReSolve Canada’s profitability with respect to the Fund did not raise any concerns.
“Fall-out” Benefits. The Board considered fall-out benefits received by ReSolve Canada from its relationship with the ReSolve Fund and the Trust.
Economies of Scale. The Board agreed that economies of scale are primarily an advisor-level issue and should be considered with respect to the overall Management Agreement, taking into consideration the impact of the sub-advisory expense.
Conclusion. The Board considered many factors, and no single factor was determinative to the decision of the Board concerning the renewal of the ReSolve Canada Sub-Advisory Agreement. Having requested, reviewed, and discussed in depth such information from ReSolve Canada as the Board believed to be reasonably necessary to evaluate the terms of the ReSolve Canada Sub-
| RATIONAL FUNDS | |
| SUPPLEMENTAL INFORMATION (Continued) |
| December 31, 2021 | ANNUAL REPORT |
Advisory Agreement, and as assisted by the advice of counsel, the Board concluded that the renewal of the ReSolve Canada Sub-Advisory Agreement was in the best interests of the ReSolve Fund and its shareholders.
Review of Pier 88 15(c) Response
Nature, Extent, and Quality of Services. The Board reviewed the nature, extent, and quality of the services provided by the investment professionals at Pier 88. The Board reviewed information concerning Pier 88’s financial condition and resources; personnel, business; operations and compliance program. The Board considered that Pier 88 managed the Pier 88 Fund’s portfolio in accordance with its principal strategies in seeking to achieve the Fund’s investment objective. The Board reviewed a copy of Pier 88’s Form ADV. After further discussion and review of the Pier 88 15(c) Response, the Board concluded that Pier 88 would continue to provide an acceptable level of services to the Fund.
Performance. The Pier 88 Fund outperformed the Bloomberg U.S. Aggregate Bond TR Index for the 1- and 3-year periods and the period since inception on March 1, 2017; outperformed the ICE BofA IG US Convertible 5% Index for the 3-year period; underperformed the peer group and Morningstar Convertibles category averages for the 1- and 3-year periods and since inception; and underperformed the ICE BofA IG US Convertible 5% Index for the 1-year and since inception periods; and underperformed the S&P 500 TR Index for the 1-, 3- and since inception periods. The Board discussed Rational’s explanation that the Fund trailed the peer group and Morningstar Convertibles category because of recent strong returns from the below investment grade convertible bonds and that the underperformance of the Fund’s convertible bond strategy relative to the S&P 500 TR Index is expected during a period of strong equity returns. After further discussion, the Board determined that the Fund’s performance was acceptable.
Fees and Expenses. The Board considered that the sub-advisory fee paid to Pier 88 pursuant to the Pier 88 Sub- Advisory Agreement was paid entirely by Rational. The Board noted that the sub-advisory fee payable to Pier 88, 50% of the 0.85% fee charged by Rational, was lower than the fees that Pier 88 receives from separately managed accounts following a similar strategy. The Board noted that with the contractual expense cap in place, Rational and Pier 88 were waiving a portion of their fees. After further discussion, the Board concluded that the sub-advisory fees payable to Pier 88 with respect to the Pier 88 Fund were reasonable.
Profitability. The Board reviewed a profitability analysis provided by Pier 88 with respect to the Pier 88 Fund and noted that Pier 88 incurred a loss from managing the Fund’s portfolio. After further discussion, the Board concluded that the level of Pier 88’s profitability with respect to the Fund did not raise any concerns.
“Fall-out” Benefits. The Board considered fall-out benefits received by Pier 88 from its relationship with the Pier 88 Fund and the Trust.
Economies of Scale. The Board agreed that economies of scale are primarily an advisor-level issue and should be considered with respect to the overall Management Agreement, taking into consideration the impact of the sub-advisory expense.
| RATIONAL FUNDS | |
| SUPPLEMENTAL INFORMATION (Continued) |
| December 31, 2021 | ANNUAL REPORT |
Conclusion. The Board considered many factors, and no single factor was determinative to the decision of the Board concerning the renewal of the Pier 88 Sub-Advisory Agreement. Having requested, reviewed, and discussed such information from Pier 88 as the Board believed to be reasonably necessary to evaluate the terms of the Pier 88 Sub-Advisory Agreement, and as assisted by the advice of counsel, the Board concluded that renewal of the Pier 88 Sub-Advisory Agreement was in the best interests of the Pier 88 Fund and its shareholders.
Review of Equity Armor 15(c) Response
Nature, Extent, and Quality of Services. The Board reviewed the nature, extent, and quality of the services provided by the investment professionals at Equity Armor. The Board reviewed information concerning Equity Armor’s financial condition and resources; personnel, business; operations and compliance program. The Board considered that Equity Armor managed the Equity Armor Fund’s portfolio in accordance with its principal strategies in seeking to achieve the Fund’s investment objective. The Board reviewed a copy of Equity Armor’s Form ADV. After further discussion and review of the Equity Armor 15(c) Response, the Board concluded that Equity Armor would continue to provide an acceptable level of services to the Fund.
Performance. Since Equity Armor began managing the Equity Armor Fund on December 13, 2019, through September 30, 2021, the Fund has outperformed the S&P 500 Value TR Index and underperformed the S&P 500 TR Index. The Fund outperformed the average returns of the Morningstar Options Trading category for the 1-, 3-, and 10-year periods and underperformed the category for the 5-year period. The Fund underperformed the average returns of the peer group, the Morningstar Large Value category, the S&P 500 Value TR Index, and the S&P 500 TR Index for the 1-, 3-, 5-, and 10-year periods. The Fund’s underperformance during the 1-year period was attributed to the performance of the Fund’s futures overlay during periods of increased market volatility. After further discussion, the Board determined that the Fund’s performance was acceptable.
Fees and Expenses. The Board considered that the sub-advisory fee paid to Equity Armor pursuant to the Equity Armor Sub-Advisory Agreement was paid entirely by Rational. The Board considered that the sub-advisory fee paid to Equity Armor pursuant to the Equity Armor Sub-Advisory Agreement was paid entirely by Rational. The Board noted that the sub- advisory fee payable to Equity Armor, 50% of the 0.75% fee charged by Rational, was lower than the fees that Equity Armor receives from separately managed accounts following a similar strategy. After further discussion, the Board concluded that the sub-advisory fees payable to Equity Armor with respect to the Equity Armor Fund were reasonable.
Profitability. The Board reviewed a profitability analysis provided by Equity Armor with respect to the Equity Armor Fund and noted that Equity Armor incurred a loss from managing the Fund’s portfolio. After further discussion, the Board concluded that the level of Equity Armor’s profitability with respect to the Fund did not raise any concerns.
“Fall-out” Benefits. The Board considered fall-out benefits received by Equity Armor from its relationship with the Equity Armor Fund and the Trust.
| RATIONAL FUNDS | |
| SUPPLEMENTAL INFORMATION (Continued) |
| December 31, 2021 | ANNUAL REPORT |
Economies of Scale. The Board agreed that economies of scale are primarily an advisor-level issue and should be considered with respect to the overall Management Agreement, taking into consideration the impact of the sub-advisory expense.
Conclusion. The Board considered many factors, and no single factor was determinative to the decision of the Board concerning the renewal of the Equity Armor Sub-Advisory Agreement. Having requested, reviewed, and discussed in depth such information from Equity Armor as the Board believed to be reasonably necessary to evaluate the terms of the Equity Armor Sub-Advisory Agreement, and as assisted by the advice of counsel, the Board concluded that renewal of the Equity Armor Sub-Advisory Agreement was in the best interests of the Equity Armor Fund and its shareholders.
Consideration and Renewal of Trading Advisory Agreement between Rational and ReSolve Asset Management SEZC (Cayman) with respect to Rational/ReSolve Adaptive Asset Allocation Fund, December 10 and 17, 2021
In connection with a telephonic meeting held on December 10 and 17, 2021, the Board of Trustees (the “Board” or the “Trustees”) of Mutual Fund and Variable Insurance Trust (the “Trust”), including a majority of the Trustees who are not “interested persons,” as that term is defined in the Investment Company Act of 1940, as amended, of the Trust, discussed the renewal of the trading advisory agreement between Rational Advisors, Inc. (“Rational”) and ReSolve Asset Management SEZC (Cayman) (“ReSolve Global”), with respect to Rational/ReSolve Adaptive Asset Allocation Fund (the “ReSolve Fund”), a series of the Trust (the “ReSolve Global Trading Advisory Agreement”).
The Board was assisted by legal counsel throughout the review process. The Board relied upon the advice of counsel and its own business judgment in evaluating the ReSolve Global Trading Advisory Agreement and the weight to be given to each factor considered. The conclusions reached by the Board were based upon a comprehensive evaluation and discussion of all the information provided and were not the result of any one factor. Moreover, each Trustee might have afforded different weight to the various factors in reaching his conclusions with respect to the ReSolve Global Trading Advisory Agreement. The Board reviewed the materials prepared by ReSolve Global (the “ReSolve Global 15(c) Response”) and Rational, and considered the information presented at Board meetings throughout the year.
Review of ReSolve Global 15(c) Response
Nature, Extent, and Quality of Services. The Board reviewed the nature, extent, and quality of the services provided by the investment professionals at ReSolve Global. The Board reviewed information concerning the financial condition and resources, personnel, business operations, and compliance program of ReSolve Global and its responsibilities with respect to managing the ReSolve Fund. The Board reviewed ReSolve Global’s financial statements. The Board considered that ReSolve Global manages the Fund’s portfolio in accordance with its principal strategies in seeking to achieve the Fund’s investment objective. After discussion and review of the ReSolve Global 15(c) Response, the Board concluded that ReSolve Global would continue to provide an acceptable level of services to the Fund.
| RATIONAL FUNDS | |
| SUPPLEMENTAL INFORMATION (Continued) |
| December 31, 2021 | ANNUAL REPORT |
Performance. The ReSolve Fund outperformed the Morningstar Macro Trading category average and the Barclay Hedged CTA Index for the 1-, 3-, 5-, and 10-year periods; outperformed the peer group average for the 1-, 3, and 10-year periods; underperformed the peer group average for the 5-year period; and underperformed the S&P 500 TR Index for the 1-, 3-, 5-, and 10-year periods. After further discussion, the Board determined that the Fund’s performance was acceptable.
Fees and Expenses. The Board considered that the trading advisory fee paid to ReSolve Global was paid entirely by Rational. The Board noted that the trading advisory fee payable to ReSolve Global, 37.5% of the 1.75% fee charged by Rational, was lower than the fees that ReSolve Global charged to separately managed accounts following a similar strategy. The Board noted that with the contractual expense cap in place, Rational and ReSolve Global were waiving a portion of their fees. After further discussion, the Board concluded that the trading advisory fees payable to ReSolve Global with respect to the Fund were reasonable.
Profitability. The Board reviewed profitability analyses provided by ReSolve Global with respect to the ReSolve Fund and noted that ReSolve Global realized a profit from managing the Fund’s portfolio. After further discussion, the Board concluded that the level of ReSolve Global’s profitability with respect to the Fund did not raise any concerns.
“Fall-out” Benefits. The Board considered fall-out benefits received by ReSolve Global from its relationships with the ReSolve Fund and the Trust.
Economies of Scale. The Board agreed that economies of scale are primarily an advisor-level issue and should be considered with respect to the overall Management Agreement, taking into consideration the impact of the trading advisory expense.
Conclusion. The Board considered many factors, and no single factor was determinative to the decision of the Board concerning the renewal of the ReSolve Global Trading Advisory Agreement. Having requested, reviewed, and discussed in depth such information from ReSolve Global as the Board believed to be reasonably necessary to evaluate the terms of the ReSolve Global Trading Advisory Agreement, and as assisted by the advice of counsel, the Board concluded that the renewal of the ReSolve Global Trading Advisory Agreement was in the best interests of the ReSolve Fund and its shareholders.
| RATIONAL FUNDS |
| LIQUIDITY RISK MANAGEMENT PROGRAM (Unaudited) |
| December 31, 2021 |
The Funds have adopted and implemented a written liquidity risk management program as required by Rule 22e-4 (the “Liquidity Rule”) under the Investment Company Act. The program is reasonably designed to assess and manage each Fund’s liquidity risk, taking into consideration, among other factors, the respective Fund’s investment strategy and the liquidity of its portfolio investments during normal and reasonably foreseeable stressed conditions; its short and long-term cash flow projections; and its cash holdings and access to other funding sources.
During the fiscal year ended December 31, 2021, the Trust’s Liquidity Risk Management Program Committee (the “Committee”) reviewed each Fund’s investments and determined that the Funds held adequate levels of cash and highly liquid investments to meet shareholder redemption activities in accordance with applicable requirements. Accordingly, the Committee concluded that (i) the Funds’ liquidity risk management program is reasonably designed to prevent violations of the Liquidity Rule and (ii) the Funds’ liquidity risk management program has been effectively implemented.
| RATIONAL FUNDS | |
| Boards of Trustees and Trust Officers (Unaudited) |
| December 31, 2021 | ANNUAL REPORT |
Independent Trustees Background
Name,
Address and
Year of Birth | Position with
the Trust | Term of
Office and
Length of
Time Served* | Principal Occupation(s)
During Past 5 Years | Number of
Portfolios in
Fund
Complex
Overseen by
Trustee | Other Directorships
Held During Past 5 Years |
Tobias Caldwell Year of Birth:
1967 | Chairman of the Board and Trustee | Since 2016 | Managing Member, Genovese Family Enterprises, LLC (real estate firm), since 1999; Managing member, Bear Properties, LLC (real estate firm), since 2006; Managing member, PTL Real Estate, LLC (2000-2019) (real estate/investment firm). | 56 | Chairman of the Board, Strategy Shares, since 2016; Lead Independent Trustee and Chair of Audit Committee, Mutual Fund Series Trust, since 2006; Independent Trustee and Chair of Audit Committee, Variable Insurance Trust, since 2010; Trustee, IDX Funds (formerly M3 Sixty Funds Trust), since 2016; Chairman of the Board, AlphaCentric Prime Meridian Income Fund, since 2018. |
Stephen P.
Lachenauer Year of Birth:
1967 | Trustee and Chair of the Audit, Risk and Compliance, and Investment Committees | Trustee and Chair of Audit and Risk and Compliance Committees since 2016; Chair of Investment Committee since November 2020 | Attorney, private practice, since 2011. | 17 | Trustee and Chair of the Audit and Risk and Compliance Committees since 2016, and Chair of the Investment Committee since November 2020, Strategy Shares; Trustee, TCG Financial Series Trusts I-X since 2015; Trustee and Chair of the Audit and Risk and Compliance Committees since 2018, and Chair of the Investment Committee since November 2020, AlphaCentric Prime Meridian Income Fund. |
Donald McIntosh Year of Birth:
1967 | Trustee | Since 2016 | Credit risk review analyst, Santander Holdings USA, since 2015; Governance analyst, Santander Bank, 2011 - 2015. | 17 | Trustee, Strategy Shares, since 2016; Trustee, TCG Financial Series Trusts I-X since 2015; Trustee, AlphaCentric Prime Meridian Income Fund since 2018. |
| * | The term of office of each Trustee is indefinite. |
| RATIONAL FUNDS | |
| Boards of Trustees and Trust Officers (Unaudited) (Continued) |
| December 31, 2021 | ANNUAL REPORT |
Officers*
Name, Address,
Year of Birth | Position(s)
Held
with Registrant | Term and
Length
Served* | Principal Occupation(s)
During Past 5 Years |
Michael Schoonover
53 Palmeras St. Suite 601
San Juan, PR 00901 Year of Birth: 1983 | President | Since 2022 | Vice President of the Trust, 2018-2021; Chief Operating Officer (“COO”), Catalyst Capital Advisors LLC and Rational Advisors, Inc. since 2017; Portfolio Manager, Catalyst Capital Advisors LLC, 2013 - May 2021; President, MFund Distributors LLC since January 2020; COO, Catalyst International Advisors LLC, since 2019; COO, Insights Media LLC since 2019; COO, MFund Management LLC since 2019; COO, AlphaCentric Advisors LLC since January 2021; Portfolio Manager, Rational Advisors, Inc., 2016-2018. |
| | | | |
Erik Naviloff
4221 North 203rd Street,
Suite 100
Elkhorn, Nebraska, 68022 Year of Birth: 1968 | Treasurer | Since 2016 | Vice President - Fund Administration, Ultimus Fund Solutions, LLC, since 2012. |
| | | | |
Aaron Smith
4221 North 203rd Street,
Suite 100
Elkhorn, Nebraska, 68022 Year of Birth: 1974 | Assistant Treasurer | Since 2016 | Manager - Fund Administration, Ultimus Fund Solutions, LLC, since 2012. |
| | | | |
Frederick J. Schmidt Year of Birth: 1959 | Chief Compliance Officer | Since 2016 | Director, MFund Services LLC since 2015. |
| | | | |
Jennifer A. Bailey Year of Birth: 1968 | Secretary | Since 2016 | Director of Legal Services, MFund Services LLC, since 2012. |
| * | Officers do not receive any compensation from the Trust. |
PRIVACY NOTICE
Mutual Fund & Variable Insurance Trust
Rev. July 2017
| FACTS | WHAT DOES MUTUAL FUND & VARIABLE INSURANCE TRUST DO WITH YOUR PERSONAL INFORMATION? |
| Why? | Financial companies choose how they share your personal information. Federal law gives consumers the right to limit some, but not all sharing. Federal law also requires us to tell you how we collect, share, and protect your personal information. Please read this notice carefully to understand what we do. |
| What? | The types of personal information we collect and share depends on the product or service that you have with us. This information can include: ● Social Security number and wire transfer instructions ● account transactions and transaction history ● investment experience and purchase history When you are no longer our customer, we continue to share your information as described in this notice. |
| How? | All financial companies need to share customers’ personal information to run their everyday business. In the section below, we list the reasons financial companies can share their customers’ personal information; the reasons Mutual Fund & Variable Insurance Trust chooses to share; and whether you can limit this sharing. |
Reasons we can share your
personal information: | Does Mutual Fund &
Variable Insurance Trust
share information? | Can you limit this
sharing? |
| For our everyday business purposes - such as to process your transactions, maintain your account(s), respond to court orders and legal investigations, or report to credit bureaus. | YES | NO |
| For our marketing purposes - to offer our products and services to you. | NO | We don’t share |
| For joint marketing with other financial companies. | NO | We don’t share |
| For our affiliates’ everyday business purposes - information about your transactions and records. | NO | We don’t share |
| For our affiliates’ everyday business purposes - information about your credit worthiness. | NO | We don’t share |
| For our affiliates to market to you | NO | We don’t share |
| For non-affiliates to market to you | NO | We don’t share |
| QUESTIONS? | Call 1-800-253-0412 |
PRIVACY NOTICE
Mutual Fund & Variable Insurance Trust
| What we do: |
How does Mutual Fund & Variable Insurance Trust protect my personal information? | To protect your personal information from unauthorized access and use, we use security measures that comply with federal law. These measures include computer safeguards and secured files and buildings. Our service providers are held accountable for adhering to strict policies and procedures to prevent any misuse of your nonpublic personal information. |
How does Mutual Fund & Variable Insurance Trust collect my personal information? | We collect your personal information, for example, when you: ● open an account or deposit money ● direct us to buy securities or direct us to sell your securities ● seek advice about your investments We also collect your personal information from others, such as credit bureaus, affiliates, or other companies. |
Why can’t I limit all sharing? | Federal law gives you the right to limit only: ● sharing for affiliates’ everyday business purposes – information about your creditworthiness. ● affiliates from using your information to market to you. ● sharing for non-affiliates to market to you. State laws and individual companies may give you additional rights to limit sharing. |
| Definitions |
| Affiliates | Companies related by common ownership or control. They can be financial and non-financial companies. ● Mutual Fund & Variable Insurance Trust does not share with affiliates. |
| Non-affiliates | Companies not related by common ownership or control. They can be financial and non-financial companies. ● Mutual Fund & Variable Insurance Trust doesn’t share with non-affiliates so they can market to you. |
| Joint marketing | A formal agreement between nonaffiliated financial companies that together market financial products or services to you. ● Mutual Fund & Variable Insurance Trust doesn’t jointly market. |
A copy of the policies and procedures that the Funds use to determine how to vote proxies relating to securities held in the Funds’ portfolios, as well as a record of how the Funds voted any such proxies during the most recent 12-month period ended June 30, is available without charge and upon request by calling 800-253-0412. This information is also available from the EDGAR database on the SEC’s website at www.sec.gov.
Funds file a complete schedule of portfolio holdings with the Securities and Exchange Commission (the “SEC”) for the first and third quarters of each fiscal year as an exhibit to its reports on Form N-PORT, within sixty days after the end of the period. Form N-PORT reports are available at the SEC’s website at www.sec.gov.
Rational Advisors, Inc., serves as Investment Advisor to the Funds.
This report is authorized for distribution to prospective investors only when preceded or accompanied by a prospectus which contains facts concerning the Funds’ objectives and policies, management fees, expenses and other information.
Shareholder Services: 800-253-0412
Rational-AR21
(a) The Registrant has, as of the end of the period covered by this report, adopted a code of ethics that applies to the Registrant's principal executive officer, principal financial officer, and principal accounting officer or controller, or persons performing similar functions, regardless of whether these individuals are employed by the Registrant or a third party.
(b) During the period covered by this report, there were no amendments to any provision of the code of ethics.
(c) During the period covered by the report, with respect to the registrant’s code of ethics that applies to its Principal Executive Officer and Principal Financial Officer: there have been no amendments to a provision that relates to any element of the code of ethics definition enumerated in paragraph (b) of this Item 2.
| Item 3. | Audit Committee Financial Expert. |
3(a) The registrant’s board of trustees has determined that the registrant does not have an audit committee financial expert. The audit committee determined that, although none of its members meet the technical definition of an audit committee financial expert, the committee has sufficient financial expertise to adequately perform its duties under the Audit Committee Charter without the addition of a qualified expert.
| Item 4. | Principal Accountant Fees and Services. |
(a) Audit Fees. The aggregate fees billed for each of the last two fiscal years for professional services rendered by the registrant's principal accountant for the audit of the registrant's annual financial statements or services that are normally provided by the accountant in connection with statutory and regulatory filings or engagements for those fiscal years are as follows:
Fiscal year ended 2021: $106,000
Fiscal year ended 2020: $80,000
(b) Audit-Related Fees. There were no fees billed in each of the last two fiscal years for assurances and related services by the principal accountant that are reasonably related to the performance of the audit of the registrant’s financial statements and are not reported under paragraph (a) of this item.
Fiscal year ended 2021: $0
Fiscal year ended 2020: $0
(c) Tax Fees. The aggregate fees billed in each of the last two fiscal years for professional services rendered by the principal accountant for tax compliance are as follows:
Fiscal year ended 2021: $24,800
Fiscal year ended 2020: $17,500
(d) All other fees billed to the registrant by its principal accountants for the two most recent fiscal years:
Fiscal year ended 2021: $0
Fiscal year ended 2020: $0
(e)(1) The audit committee does not have pre-approval policies and procedures. Instead, the audit committee or audit committee chairman approves on a case-by-case basis each audit or non-audit service before the principal accountant is engaged by the Registrant.
(e)(2) There were no services described in each of paragraphs (b) through (d) of this Item that were approved by the audit committee pursuant to paragraph (c)(7)(i)(C) of Rule 2-01 of Regulation S-X. |
| (f) Not applicable. The percentage of hours expended on the principal accountant's engagement to audit the Registrant's financial statements for the most recent fiscal year that were attributed to work performed by persons other than the principal accountant's full-time, permanent employees was zero percent (0%). |
(g) All non-audit fees billed by the Registrant's principal accountant for services rendered to the Registrant for the fiscal years ended June 30, 2016 and 2015, respectively, are disclosed in (b)-(d) above. There were no audit or non-audit services performed by the Registrant's principal accountant for the Registrant's adviser.
Item 5. | Audit Committee of Listed Registrants.
|
Not applicable.
| Item 6. | Schedule of Investments. |
Included in annual report to shareholders filed under item 1 of this form.
| Item 7. | Disclosure of Proxy Voting Policies and Procedures for Closed-End Management Investment Companies. |
Not applicable.
| Item 8. | Portfolio Managers of Closed-End Management Investment Companies. |
Not applicable.
| Item 9. | Purchases of Equity Securities by Closed-End Management Investment Company and Affiliated Purchasers. |
Not applicable.
| Item 10. | Submission of Matters to a Vote of Security Holders. |
Not applicable.
| Item 11. | Controls and Procedures. |
(a) The registrant’s Principal Executive Officer and Principal Financial Officer, or persons performing similar functions, have concluded that the registrant’s disclosure controls and procedures (as defined in Rule 30a-3(c) under the Act) are effective in design and operation and are sufficient to form the basis of the certifications required by Rule 30a-2 under the Act, based on their evaluation of these disclosure controls and procedures within 90 days of the filing of this report on Form N-CSR.
(b) There were no changes in the registrant’s internal control over financial reporting (as defined in Rule 30a-3(d) under the Act (17 CFR 270.30a-3(d)) that occurred during the second fiscal quarter of the period covered by this report that have materially affected or are reasonably likely to materially affect, the registrant’s internal control over financial reporting.
Item 12. Disclosure of Securities Lending Activities for Closed-Ended Management Investment Companies
Not applicable.
(1) Code of Ethics for Principal Executive and Senior Financial Officers is attached hereto.
(2) Certifications pursuant to Section 302 of the Sarbanes-Oxley Act of 2002 are filed herewith.
(3) Certifications pursuant to Section 906 of the Sarbanes-Oxley Act of 2002 are filed herewith.
SIGNATURES
Pursuant to the requirements of the Securities Exchange Act of 1934 and the Investment Company Act of 1940, the registrant has duly caused this report to be signed on its behalf by the undersigned, thereunto duly authorized.
(Registrant) Mutual Fund and Variable Insurance Trust
| | | |
| By (Signature and Title) | | /s/ Michael Schoonover |
| | | Michael Schoonover, President and Principal Executive Officer |
| | | | |
| Date | | 3/8/22 | |
| | | | | | |
Pursuant to the requirements of the Securities Exchange Act of 1934 and the Investment Company Act of 1940, this report has been signed below by the following persons on behalf of the registrant and in the capacities and on the dates indicated.
| | | |
| By (Signature and Title) | | /s/ Michael Schoonover |
| | | Michael Schoonover, President and Principal Executive Officer |
| | | |
| By (Signature and Title) | | /s/ Erik Naviloff |
| | | Erik Naviloff, Treasurer and Principal Financial Officer |
| | | | |
| Date | | 3/8/22 | |
| | | | | | |