UNITED STATES
SECURITIES AND EXCHANGE COMMISSION
Washington, D.C. 20549
FORM N-CSR
CERTIFIED SHAREHOLDER REPORT OF REGISTERED
MANAGEMENT INVESTMENT COMPANIES
Investment Company Act file number 811-05010
Mutual Fund and Variable Insurance Trust
(Exact name of registrant as specified in charter)
36 North New York Avenue
Huntington, NY 11743
(Address of principal executive offices) (Zip code)
The Corporation Trust Company
Corporate Trust Center
1209 Orange Street
Wilmington, DE 19801
(Name and address of agent for service)
Registrant’s telephone number, including area code: 1-631-629-4237
Date of fiscal year end: December 31
Date of reporting period: December 31, 2022
| Item 1. | Reports to Shareholders. |

Annual Shareholder Report
December 31, 2022
INSTITUTIONAL SHARES
CLASS A SHARES
CLASS C SHARES

unaudited
December 31, 2022
Rational Equity Armor Fund (HDCAX, HDCEX, HDCTX)
Dear Fellow Shareholders,
The Rational Equity Armor Fund (the “Fund”) seeks total return on investment, with dividend income being an important component of that return. The Fund seeks to achieve this goal by investing in two baskets – a long equity portfolio and a volatility hedge overlay. The Fund seeks to achieve its investment objective by investing primarily in common stock of dividend paying companies included within the S&P 500 Index (the “S&P 500”). The Fund also invests a portion of its assets in exchange-traded volatility index futures contracts and in cash and cash equivalents as a hedge against the common stock held in the Fund’s portfolio.
In the past 50 years, the yield curve has inverted seven times. Seven out of seven times there was a recession. In 2022 we first saw the 2 year yield higher than the 10 year yield for the first time April, and the three-month over the ten-year in October, which were two signals of a recession and one of the main reasons stocks struggled in 2022. While stocks struggled, volatility as measured by the VIX Index and the SPIKES Volatility Index did not have its normal opposing run. This led to many hedged equity funds underperforming the S&P 500. During the reporting period, the Fund outperformed the S&P 500 and did so with lower volatility.
The Fund is long volatility and equities. In the first quarter of 2022, the VIX Index was up 19% while the S&P 500 was down 5%. This negative correlation allowed the Fund to have a positive first quarter, up 1%. Historically, the negative correlation provides a tailwind to the fund. The second, third, and fourth quarters of 2022 did not have a similar volatility peak, thus our fund experienced a headwind, overall a challenging environment for all hedged equity funds. The Fund still succeeded in those quarters, outperforming the S&P 500 by roughly 5% for the calendar year and doing so with lower volatility.
We enter 2023 full of uncertainties. Since the Great Financial Crisis, market participants have come to rely on extreme levels of liquidity supplied to the market by the Federal Reserve. This led to the inflation problem we saw dominate the market in 2022. This year, to the extent that inflation comes down, we believe that economic growth will slow down with it. If that economic slowdown occurs, the Fed will have fewer tools at its disposal to stimulate growth.
We at Equity Armor believe that this type of market environment is one where our team and asset allocation/trading strategy can create alpha for investors. In the last 10 years, we have observed that most asset classes have moved in unison with each other, particularly for most large equity-based indices. However, as liquidity is drawn out of the market, it is our view that there will be no rising tide to lift all boats. We believe that in this environment, stock picking and sector rotation will be key. In addition, with a return to a “normalized Fed” we expect a return to normalized volatility in the markets. Our strategy
is designed to harvest some of this normalized volatility in the market to help buffer the portfolio from market downturns and also to help provide an optimized hedge while continuing to be invested in the stock market.
We thank you for your trust in us as we strive to continue to deliver outstanding risk adjusted returns.
Sincerely,
Joe Tigay
Brian Stutland
Luke Rahbari

The Fund’s total annualized returns through December 31, 2022 as compared to the S&P 500 Value TR Index and S&P 500 TR Index were as follows:
| | 1 Year | 3 Years | 5 Years | 10 Years | Since
Inception* |
| Institutional Class* | -10.68 | 5.82 | 3.04 | 4.49 | 5.18 |
| Class A* | -10.86 | 5.59 | 2.79 | 4.23 | 4.93 |
| Class C** | -11.51 | 4.85 | 2.04 | 3.60 | 4.07 |
| Class A w/ Sales Charge* | -15.12 | 3.87 | 1.79 | 3.73 | 4.69 |
| S&P 500 Value TR Index (1) | -5.22 | 6.26 | 7.58 | 10.86 | 6.52 |
| S&P 500 TR Index (2) | -18.11 | 7.66 | 9.42 | 12.56 | 7.37 |
| ** | Class C Shares commenced operations on January 2, 2014. Returns prior to that date are of the Institutional Shares, adjusted for expenses of Class C Shares. Institutional Shares would have had substantially similar annual returns because the shares are invested in the same portfolio. |
The Fund’s maximum sales charge for Class “A” shares is 4.75%. Investments in mutual funds involve risks. Performance is historic and does not guarantee future results. Investment return and principal value will fluctuate with changing market conditions so that when redeemed, shares may be worth more or less than their original cost. Current performance may be lower or higher than the performance data quoted. To obtain the most recent month-end performance information or the Fund’s prospectus please call the Fund, toll free at 1-800-253-0412. You can also obtain a prospectus at www.RationalMF.com.
This report is intended for the Fund’s shareholders. It may not be distributed to prospective investors unless it is preceded or accompanied by the current Fund prospectus. To obtain a prospectus or other information about the Fund, please visit www.RationalMF.com or call 1-800-253-0412. Please read the prospectus carefully before investing.
| (1) | The S&P 500 Value Total Return Index® (“S&P 500 Value TR”) is an unmanaged market-capitalization weighted index consisting of those stocks within the S&P 500 that exhibit strong value characteristics. It uses a numerical ranking system based on four value factors and three growth factors to determine the constituents and their weightings. |
| (2) | The S&P 500 Total Return Index® (“S&P 500 TR”) is an unmanaged index generally representing the performance of the broad domestic economy through changes in the aggregate market value of 500 stocks representing all major industries. Indices are unmanaged and, unlike the Fund, are not affected by cash flows. It is not possible to invest directly in an Index. |
5169-NLD-01312023
Rational Equity Armor Fund
PORTFOLIO REVIEW (Unaudited)
December 31. 2022
The Fund’s performance figures* for each of the periods ended December 31, 2022, compared to its benchmarks:
| | | Annualized | Annualized | Annualized | Annualized |
| | 1 Year Return | 5 Year Return | 10 Year Return | Since Inception(a) | Since Inception(b) |
| Institutional | (10.68)% | 3.04% | 4.49% | 5.18% | N/A |
| Class A | (10.86)% | 2.79% | 4.23% | 4.93% | N/A |
| Class A with load | (15.12)% | 1.79% | 3.73% | 4.69% | N/A |
| Class C | (11.51)% | 2.04% | N/A | N/A | 1.97% |
| S&P 500 Value Total Return Index (c) | (5.22)% | 7.58% | 10.86% | 7.05% | 8.83% |
| S&P 500 Total Return Index (d) | (18.11)% | 9.42% | 12.56% | 7.37% | 7.05% |
| * | The performance data quoted here represents past performance. Current performance may be lower or higher than the performance data quoted above. Investment return and principal value will fluctuate, so that shares, when redeemed, may be worth more or less than their original cost. The returns shown do not reflect the deduction of taxes that a shareholder would pay on Fund distributions or on the redemptions of Fund shares. Past performance is no guarantee of future results. Performance figures for periods greater than 1 year are annualized. Per the fee table in the Fund’s May 1, 2022 prospectus, the total annual operating expense are 1.17% for Institutional shares, 1.42% for A shares and 2.17% for C shares before fee waivers and/or expense reimbursements, if any. See the financial highlights for current expense ratios. For performance information current to the most recent month-end, please call toll-free 1-800-253-0412. Class A shares are subject to a maximum load of 4.75%. |
Performance information for the period prior to December 13, 2019 does not reflect the Fund’s current strategy and the Fund’s portfolio was not managed by the Fund’s current Sub-Advisor.
| (a) | Inception date is March 1, 2001 for Class A, Institutional and the benchmarks. |
| (b) | Inception date is January 3, 2014 for Class C and the benchmarks. |
| (c) | The S&P 500 Value Total Return Index uses a numerical ranking system based on four value factors and three growth factors to determine the constituents and their weightings. Investors cannot invest directly in an Index. |
| (d) | The S&P 500 Total Return Index, a registered trademark of S&P Global., Inc., is a market capitalization-weighted index of 500 widely held common stocks. Investors cannot invest directly in an Index. |
Comparison of the Change in Value of a $10,000 Investment

| Top 10 Holdings by Industry ^ | | % of Net Assets | |
| Equity | | | 15.7 | % |
| Biotech & Pharma | | | 9.2 | % |
| Insurance | | | 7.7 | % |
| Heath Care Facilities & Services | | | 5.9 | % |
| Software | | | 4.7 | % |
| Electric Utilities | | | 3.8 | % |
| Technology Hardware | | | 3.5 | % |
| Retail - Consumer Staples | | | 3.4 | % |
| Aerospace & Defense | | | 3.3 | % |
| Beverages | | | 3.2 | % |
| Other/Short-Term Investments | | | 39.6 | % |
| | | | 100.0 | % |
| | | | | |
| ^ Does not include derivatives in which the Fund invests. | |
Please refer to the Schedule of Investments for a more detailed breakdown of the Fund’s assets.
unaudited
December 31, 2022
Rational Tactical Return Fund (HRSAX, HRSFX, HRSTX)
Dear Fellow Shareholders,
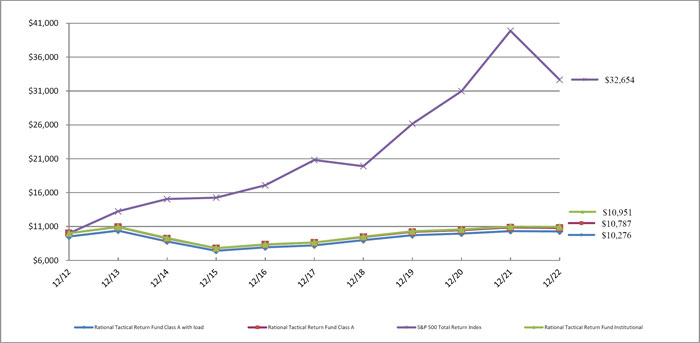
The Rational Tactical Return Fund (the “Fund”) seeks total return consisting of long-term capital appreciation and income by making investments in long and short call and put options on futures contracts on the S&P 500 Index, as well as cash and cash equivalents. For the year ended December 31, 2022, the Fund posted a -0.30% (Class I) return versus -18.11% for the S&P 500 TR Index (the “S&P 500 Index”).
Investment Strategy
Warrington Asset Management, LLC’s (the “Sub-Advisor”) strategy seeks to achieve the Fund’s investment objective in three ways: (1) Premium Collection – the Fund collects premiums on options it sells; (2) Volatility Trading – the Fund may enter into positions designed to hedge or profit from either an increase or a decrease in S&P 500 Index volatility; and (3) Trend Following – the Fund may increase or decrease the balance of puts and calls based on trending market direction. The Fund is designed to produce returns that are not correlated with equity market returns. The Fund employs strict risk management procedures, supported by both technical and fundamental analysis, that are intended to provide consistency of returns and to mitigate the extent of losses.
Fund Performance
While the Fund trades options on the S&P 500 Index, the Sub-Advisor’s goal is to have low correlation to that benchmark. In this regard, the Sub-Advisor’s objective is to provide positive, risk adjusted absolute returns to our investors. When those returns are additionally weighed against the volatility endured to produce such returns, with low standard deviation on a daily, monthly, and yearly timeframe, we believe the Fund has performed well and has achieved its objective.
The equity and fixed income markets performed poorly in 2022, highlighting the need for uncorrelated assets. While volatility, as measured by the VIX Index, was low throughout the year, the equity markets themselves presented extreme challenges for most market participants. We believe we were able to navigate these difficult markets and capture trading gains, where possible, while seeking to protect capital when opportunity sets were limited. In looking at the Morningstar ranking and return data for the category in which the Fund’s strategy is placed, “Options Trading,” we believe the category is extremely broad with all options traders, many of whom, in our view, take extreme risk collecting premiums during periods of positive index performance and may at times outperform, but underperform in periods of rising volatility. According to Morningstar, in 2022, the Fund finished in the top 4% of the 258 constituents, which we would attribute to our distinct investment approach. Additionally, since Sub-Advisor inception, the Fund’s Morningstar rating is now at four stars, which we believe is reflective of the Fund’s performance and minimal standard deviation (the five-year standard deviation for the Fund is 1.79 vs 9.85 for the Morningstar category). This wide disparity leads to a Sharpe ratio of 1.92 for the Fund vs. 0.27 for the Morningstar category, underscoring how we have sought to add significant shareholder value using our approach. The flexibility in the tactical trading methodology utilized for the Fund, coupled with stringent risk parameters, is designed to provide the ability to react quickly to an ever-changing market environment in search of profits while also remaining focused on avoiding potentially treacherous market conditions.
The Fund’s total annualized returns through December 31, 2022, as compared to the S&P 500 TR Index (S&P) benchmark were as follows:
| | 1 Year | 3 Years | 5 Years | Since
12/5/17 | 10 Years | Since
Inception
(05/01/07) * |
| Class I | -0.30% | 2.08% | 4.80% | 4.92% | 0.91% | -0.84% |
| Class A | -0.53% | 1.87% | 4.58% | 4.68% | 0.76% | -1.01% |
| Class C | -1.33% | 1.11% | 3.74% | 3.94% | n/a | 4.14% |
| Class A with Sales Charge | -5.28% | 0.24% | 3.57% | 3.68% | 0.27% | -1.32% |
| S&P 500 Total Return Index (1) | -18.11% | 7.66% | 9.42% | 9.67% | n/a** | n/a** |
| * | Inception: 05/01/2007 (Class A & Inst.), 05/31/2016 (Class C). Prior to 12/5/2017, the Rational Tactical Return Fund was named the Rational Real Strategies Fund, which was managed by a different sub-advisor and implemented a different investment strategy. |
| ** | S&P 500 TR Index not relevant to strategy prior to 12/5/2017 strategy change. |
The Fund’s maximum sales charge for Class “A” shares is 4.75%. Investments in mutual funds involve risks. Performance is historic and does not guarantee future results. Investment return and principal value will fluctuate with changing market conditions so that when redeemed, shares may be worth more or less than their original cost. Current performance may be lower or higher than the performance data quoted. To obtain the most recent month- end performance information or the Fund’s prospectus please call the Fund, toll free at 1-800-253-0412. You can also obtain a prospectus at www.RationalMF.com.
Summary
In another year as the Fund’s Sub Advisor, Warrington has continued to provide strong absolute and relative returns, while consistently managing market risks. We seek to continue asset growth as weak equity markets have highlighted the need for non-correlated assets. In volatile markets, Warrington ensures that risk management is paramount, while concurrently evaluating the risk/reward relationship of the opportunities presented by those volatile markets.
Sincerely,
Scott Kimple and Mark Adams
Portfolio Managers
This report is intended for the Fund’s shareholders. It may not be distributed to prospective investors unless it is preceded or accompanied by the current Fund prospectus. To obtain a prospectus or other information about the Fund, please visit www.RationalMF.com or call 1-800-253-0412. Please read the prospectus carefully before investing.
| 1 | The S&P 500 Total Return Index by Standard & Poor’s Corp. is a capitalization-weighted index comprising 500 issues listed on various exchanges, representing the performance of the stock market generally. Please note that indices do not take into account any fees and expenses of investing in the individual securities that they track, and individuals cannot invest directly in any index, although individuals may invest in exchange traded funds or other investment vehicles that attempt to track the performance of an index. The Rational Tactical Return Fund may or may not purchase the types of securities represented by the S&P 500 Total Return Index. |
5147-NLD-01262023
Rational Tactical Return Fund
PORTFOLIO REVIEW (Unaudited)
December 31. 2022
The Fund’s performance figures* for each of the periods ended December 31, 2022, compared to its benchmarks:
| | | Annualized | Annualized | Annualized | Annualized |
| | 1 Year Return | 5 Year Return | 10 Year Return | Since Inception(a) | Since Inception(b) |
| Institutional | (0.30)% | 4.80% | 0.91% | (0.84)% | N/A |
| Class A | (0.53)% | 4.58% | 0.76% | (1.01)% | N/A |
| Class A with load | (5.28)% | 3.57% | 0.27% | (1.32)% | N/A |
| Class C | (1.33)% | 3.74% | N/A | N/A | 4.14% |
| S&P 500 Total Return Index (c) | (18.11)% | 9.42% | 12.56% | 8.42% | 11.65% |
| * | The performance data quoted here represents past performance. Current performance may be lower or higher than the performance data quoted above. Investment return and principal value will fluctuate, so that shares, when redeemed, may be worth more or less than their original cost. The returns shown do not reflect the deduction of taxes that a shareholder would pay on Fund distributions or on the redemptions of Fund shares. Past performance is no guarantee of future results. Performance figures for periods greater than 1 year are annualized. Per the fee table in the Fund’s May 1, 2022 prospectus, the total annual operating expense are 2.10% for Institutional Class shares, 2.35% for Class A shares and 3.06% for Class C shares before fee waivers and/or expense reimbursements, if any. See the financial highlights for current expense ratios. For performance information current to the most recent month-end, please call toll-free 1-800-253-0412. Class A shares are subject to a maximum load of 4.75%. |
Performance information for the period prior to December 5, 2017 does not reflect the Fund’s current strategy and the Fund’s portfolio was not managed by the Fund’s current Sub-Advisor.
| (a) | Inception date is May 1, 2007 for Class A, Institutional and the benchmark. |
| (b) | Inception date is May 31, 2016 for Class C and the benchmark. |
| (c) | The S&P 500 Total Return Index, a registered trademark of S&P Global., Inc., is a market capitalization-weighted index of 500 widely held common stocks. Investors cannot invest directly in an Index. |
Comparison of the Change in Value of a $10,000 Investment
| Top Holdings by Asset Type ^ | | % of Net Assets | |
| U.S. Treasury Bills | | | 76.9 | % |
| Other/Cash & Equivalents | | | 23.1 | % |
| | | | 100.0 | % |
| | | | | |
| ^ Does not include derivatives in which the Fund invests. | |
Please refer to the Schedule of Investments for a more detailed breakdown of the Fund’s assets.
 | | |
| | Rational Advisors LLC | Ph: (646) 757-8063 |
| | | |
Investor Update Q4 2022: Rational Dynamic Brands Fund (HSUAX | HSUCX | HSUTX)
2022: The Year When Business Fundamentals Did Not Matter
Dear Investors,
2022 was a very difficult year for investors. The year was filled with fear, uncertainty, and doubt around geopolitics, Fed Policy, rising rates, and high inflation across wages, rents, energy, agriculture, food, and services. Cross-asset volatility was persistently high as investors and traders focused on the macro environment over each corporations’ micro fundamentals. For investors of high quality, profitable growth companies, it was even more difficult as multiples re-rated across the board.
The Dynamic Brands fund returned -35.41% for 2022, a return we are quite disappointed with but one we feel was completely disconnected from the fundamentals of the businesses we own. For comparison purposes, the S&P 500 return for the year was -18.17% and the Russell 1000 Growth Index return was -29.14%. The Brands fund is managed to look very different than the broad market. Over the long-term, the fund should be expected to have heavy exposure to two of the best performing sectors going back many decades, Consumer Discretionary & Technology. It’s these two sectors where the most dominant, growth-oriented brands live. The Tech sector index return for 2022 was -28.26% and the Consumer Discretionary index had a difficult year at -37.1%. In addition, our overweight position to Real Assets and Private Equity leaders Blackstone and KKR were big detractors to performance. That said, we could not be more bullish about their prospects going forward. These companies have roughly $300 billion of dry powder to put to work across the globe so any further distress will have them buying great assets at cheaper prices. Defensive brands generally held up much better than high quality growth-oriented brands as money rotated to the perceived safety of staples, healthcare, and energy stocks. As we begin 2023, most of these stocks are much more expensive than their growth counterparts, generate much less free cash, and grow at a fraction of the more cyclical brands in the portfolio.
We have preached “wide lens investing” since our team took over the fund on 10/17/2017. Our flexible mandate allows us to invest across style boxes and geographies. After a very difficult 2022, it is worth reviewing our most key investment thesis – consumption in the global economy. The global economy is driven by household consumption, at roughly 60% of world GDP. That’s over $40 trillion in annual household spending, making this theme an ideal core equity choice. To assume a difficult year in the stocks of great businesses implies the theme is not investable would be a mistake. For perspective, the Brands Fund from inception 10/17/2021 to the peak of the Funds NAV on November 16, 2021 significantly outperformed the broad market as measured by the S&P 500 by about 500bps annualized. The cumulative return for the fund over this period was 137.9% versus 97.29% (source Ycharts). The fund had strong returns for the first four years and a difficult one year in 2022. When looking back in time, underperforming years for the top consumer & consumer-related tech brands tend to be wonderful buying opportunities. More on that later in this note.
Ironically, the actual businesses of the companies we own turned in solid years. With few exceptions, if one looked at the business success of our companies, they would have expected the stocks to have had a strong year of performance. The market has clearly been looking forward to a slower economic environment, courtesy of the Federal Reserve and our man-made inflation. Historically speaking, rising rates are not generally a problem for stocks but when the trajectory of the rates rising is as steep as it was in 2022, stocks struggle mightily.
| | 36 N New York Avenue, Floor 3, Huntington, NY 11743 | Rationalmf.com |
| | |
| | Rational Advisors LLC | Ph: (646) 757-8063 |
| | | |
Over the long-term, equity markets are positive roughly 80% of the time. That is a statistic worthy of holding on to in our opinion. History shows those that are willing to look through short-term noise and take advantage of large sales tend to get rewarded over time.
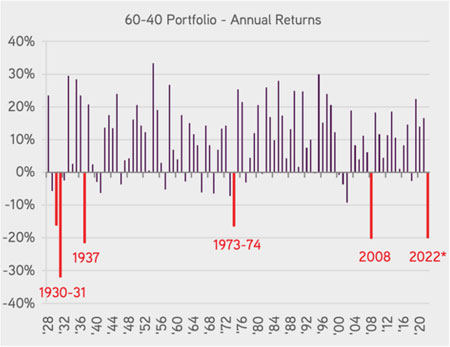
Consumer Sentiment has been poor the entire year. When the price of goods are higher than normal, that tends to happen. 2022 will go down as one of the worst years ever for 60/40 portfolios. Bonds and stocks were dreadful performers which means the average portfolio disappointed investors. As the chart below from KKR highlights, 2022 was on par with 2008 and the only back-to-back down year for the 60/40 portfolio was about 90 years ago (1930-1931).
 |
| |
| Before 1977: Using S&P500, and 50% US T.Bond and 50% Baa Corp Bond (NYU Stern) for bonds. After 1977: Using S&P 500, and Barclays U.S. Aggregate for bonds. Assuming yearly rebalancing. *2022 return corresponds to annualized YTD return. Data as at October 31, 2022. |
Though 2023 may continue to be volatile as project “Fed normalization” continues, we expect a much better portfolio outcome than what we experienced in 2022. Traditional fixed income offers attractive yields and the possibility of capital appreciation if a slowing economy brings down rates. High quality companies, with superior balance sheets and high operating margins are cheaper than they have been in a long time. As opportunists, we are excited to build bigger positions in our favorite global brands and we are increasingly comfortable navigating the inevitable volatility created by a Fed who has kept monetary policy easy for too long. Volatility is the friend of the long-term investor. This is not just an adage; it is timeless mental wiring for a successful investor.
To be clear, our crystal ball is no better than anyone else’s, and 2023 is different than 2019, the Fed is still not our friend, but they are moving much closer to the endpoint of their policy adjustments. With high inflation (coming down slowly), a historically hawkish Federal Reserve over-reacting, and the remnants of a 13 year “free money, zero interest rate” bonanza floating to the surface almost daily, why would anyone have a spring in their step and want to own stocks?
| | 36 N New York Avenue, Floor 3, Huntington, NY 11743 | Rationalmf.com |
| | |
| | Rational Advisors LLC | Ph: (646) 757-8063 |
| | | |
To answer that, I’ll use a quote from one of the most successful investors of all time, Stan Druckenmiller:
“It doesn’t matter what a company is earning today, or what they have earned in the past, you have to visualize the situation 18 months from now – that’s where the price will be.”
Dynamic Brands Take Advantage of Chaos.
Even the best public companies get dragged down when markets fall. Growth does not always happen in a linear fashion, sometimes the macro environment makes the growth a bit choppier. 2022 was the year where company multiples contracted because of higher rates and inflation. 2023 will be the year we all get to see who has a lasting and strong economic moat and who was simply riding a wave of free money and strong equity markets. As Buffet likes to say, we get to see who is naked when the tide goes out. The tide has been going out for a year now and we see zombie companies everywhere. When you traffic in high quality, profitable businesses, sleeping at night gets a lot easier.
When we look at our concentrated basket of top global brands, we feel confident in each business moat and in their ability to take market share because of strong balance sheets and high customer loyalty. Experiencing big drawdowns like we saw in 2022 is never fun, but it offers the opportunist a chance to build bigger positions in the highest conviction brands.
In our calls with our investors, one question rose to the top so we thought we would address it in the annual letter:
“Some of the most popular and best run brands have seen large drawdowns in 2022, has something changed or is this an opportunity?”
To answer this important question, one must separate the stock from the actual business. Public markets have become more casino-oriented than ever before so public market investors must stomach much more day-to-day volatility than the underlying businesses they own will ever experience. It’s during these times, when prices get disconnected from business fundamentals, that the opportunist must take advantage. In this spirit, I looked back at how some of the best brands in the world performed after a weak calendar performance to see if there were any patterns we could anchor to. As you might imagine, when great businesses have a big annual drawdown, generally, they tend to offer attractive returns for those that can stomach short-term volatility and who do not panic sell after the drawdown.
The Dynamic Brands Fund owns many of these great companies and we are analyzing a handful of others for future purchases.
We chose 20 popular, leading brands from the U.S. and other foreign markets for this exercise. The concept of buying more great companies when they go on sale is rewarded in most periods one could analyze. Here’s some data to back that thesis up:
| | 36 N New York Avenue, Floor 3, Huntington, NY 11743 | Rationalmf.com |
| | |
| | Rational Advisors LLC | Ph: (646) 757-8063 |
| | | |
| Brand | All-time
returns as of
12/31/2022 | S&P 500
Return Same
Period | 2022 Return | Avg. Return
in Negative
Years | Number of
Down Years
Total | Fwd. Avg.
Return Next 3
Cal. Years |
| Amazon | 85660% | 638% | -49.60% | -32.9% | 8 | 56.10% |
| Apple | 40840% | 2120% | -26.40% | -28.1% | 15 | 48.20% |
| Google (Alphabet) | 3420% | 414% | -39.09% | -20.3% | 4 | 36.17% |
| Estee Lauder | 3650% | 978% | -32.32% | -22.1% | 7 | 24.40% |
| Intuit | 16080% | 1400% | -39.11% | -36.0% | 5 | 29.57% |
| Nike | 21270% | 2110% | -29.04% | -26.1% | 9 | 32% |
| LVMH | 2690% | 534% | -10.87% | -16.0% | 6 | 26.50% |
| Lululemon | 2190% | 241% | -18.16% | -27.40% | 5 | 71.30% |
| Microsoft | 94470% | 2115% | -28.02% | -19.60% | 9 | 30% |
| Domino’s Pizza | 5320% | 399.70% | -37.88% | -35.0% | 3 | 38% |
| Costco | 6240% | 2124% | -19.06% | -21.0% | 8 | 13.50% |
| Target | 5240% | 2122% | -34.27% | -19.0% | 15 | 26.00% |
| Williams-Sonoma | 4680% | 2110% | -30.48% | -27.9% | 12 | 36.10% |
TenCent Holdings
China | 3002% | 436% | -25.31% | -20.0% | 4 | 38.00% |
Mercado Libre
Latin America | 2960% | 258% | -37.24% | -25.0% | 6 | 65% |
| Thermo Fisher | 6650% | 2110% | -17.30% | -22.50% | 15 | 33.40% |
| Lowe’s | 30230% | 2110% | -21.50% | -18.40% | 15 | 18.70% |
| Accenture | 1970% | 498% | -34.70% | -16.50% | 5 | 24.00% |
| Nvidia | 38720% | 380.60% | -50% | -39.70% | 7 | 49.70% |
| Netflix | 24550% | 428.20% | -51% | -35.60% | 5 | 68.70% |
Data source: Morningstar, Ycharts & Accuvest Global Advisors.
The green vertical column shows how each leader performed since going public. The next column shows how the S&P 500 performed over the same period. The next column shows the 2022 stock return. Moving right, the next column shows the average negative return in all years the stock had a negative calendar year. Next, we show how many negative calendar years each brand had since inception. The last column is the most important; we average the 3 calendar years following a negative year to highlight any potential opportunities after a poor return year. The future does not have to look like the past, but there seems to be a willingness on the part of buyers to step-in and own great companies after negative years. The most important thing to remember; even the greatest companies do not go up every year, sometimes they even go down two years in a row but for those with duration, big sale years have tended to offer strong buying opportunities. Exceptional long-term returns can only be created if investors stay the course. Their experience can be amplified when they become opportunists in a sea of pessimism.
The Brands Portfolio
The current Dynamic Brands portfolio continues to be described as a high conviction basket of iconic brands. In times of uncertainty, less companies will thrive, less companies have sustainable pricing power and less companies have strong end-demand. Being more concentrated in our investment process and using a scalpel versus a shovel continues to be warranted.
| | 36 N New York Avenue, Floor 3, Huntington, NY 11743 | Rationalmf.com |
| | |
| | Rational Advisors LLC | Ph: (646) 757-8063 |
| | | |
If markets get meaningfully weaker sometime in 2023, we expect to pivot from a more concentrated approach and into a more broadly diversified portfolio to gain more exposure to attractive sectors and industries on sale.
We have our wish list ready, and we will take advantage of irrational markets for the benefit of clients. Here’s a snapshot of the brands portfolio as we start 2023. The holdings can change without notice as general market conditions evolve:
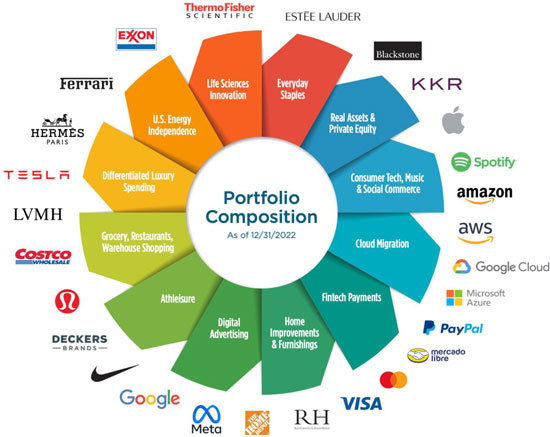
In aggregate, this continues to be a very high-quality portfolio with attractive sales and earnings growth projections and one that is filled with free cash flow generators that have strong histories of compounding those investments at a highly attractive rate. The portfolio of brands has strong pricing power, high brand love, and generates strong free cash flows, which can be used for buybacks, dividend payments, and future growth initiatives. As owners of this portfolio ourselves, we sleep very well at night no matter what the macro market brings.
We urge you to begin building your cost averaging strategy, the current opportunities are strong, and any further weakness simply offers wide-lens investors even better entry points.
| | 36 N New York Avenue, Floor 3, Huntington, NY 11743 | Rationalmf.com |
| | |
| | Rational Advisors LLC | Ph: (646) 757-8063 |
| | | |
We thank you for your loyalty to the Rational Dynamic Brands Fund and for appreciating the value of investing in the $40+ trillion global consumption theme through the brands that make a difference in all our lives. Investing in the brands that build innovative and necessity-based products and services is a timeless approach to long-term investing.
As of December 31, 2022, the Fund’s top 10 holdings were:
| Blackstone | 11.8% |
| KKR & Co | 9.1% |
| Lululemon | 5.0% |
| Visa | 4.9% |
| LVMH Moet Hennessy | 4.9% |
| Thermo Fisher Scientific | 4.8% |
| Mastercard | 4.5% |
| Nike | 4.2% |
| Microsoft | 4.0% |
| Apple | 4.0% |
Number of holdings: 27 Brands
% of assets in Top 10 holdings: 28.14%
Sector Allocations (vs. S&P500):
| Sector | HSUTX | SPY | +/- |
| Consumer Discretionary | 33.05 | 9.77 | 23.27 |
| Financials | 21.02 | 11.63 | 9.39 |
| Communication Services | 8.36 | 7.26 | 1.1 |
| Energy | 5.98 | 5.21 | 0.77 |
| Consumer Staples | 7.4 | 7.17 | 0.23 |
| Not Classified | 0.02 | 0.41 | -0.39 |
| Real Estate | 0 | 2.69 | -2.69 |
| Materials | 0 | 2.73 | -2.73 |
| Utilities | 0 | 3.17 | -3.17 |
| Information Technology | 19.27 | 25.66 | -6.39 |
| Industrials | 0 | 8.52 | -8.52 |
| Health Care | 4.9 | 15.77 | -10.87 |
| | 36 N New York Avenue, Floor 3, Huntington, NY 11743 | Rationalmf.com |
| | |
| | Rational Advisors LLC | Ph: (646) 757-8063 |
| | | |
YTD RETURNS
HSUTX: -35.41%
SPY (S&P500 ETF): -18.17%
XLY (S&P500 Consumer Discretionary ETF): -36.27%
TOP CONTRIBUTORS YTD:
| Brand | Average Weight % | Return | Contribution to Return |
| Exxon Mobil | 1.68% | 18.28% | 0.59% |
| Chevron | 1.52% | 14.16% | 0.43% |
| Mastercard | 2.52% | 1.89% | 0.25% |
| Meta Platforms | 0.19% | 12.76% | 0.11% |
| Booking Holdings | 0.02% | 7.09% | 0.07% |
| Domino’s Pizza | 0.37% | 5.64% | 0.07% |
| Thermo Fisher | 2.25% | 1.98% | 0.05% |
| Spotify | 0.09% | 11.12% | 0.05% |
| Ferrari | 0.50% | 1.34% | 0.04% |
| Deckers Outdoor | 0.13% | 4.09% | 0.04% |
TOP DETRACTORS YTD:
| | Average | | Contribution to |
| Brand | Weight % | Return | Return |
| Blackstone | 11.47% | -39.97% | -4.41% |
| Restoration Hardware | 4.12% | -50.15% | -3.65% |
| Netflix | 1.36% | -70.59% | -3.25% |
| KKR & Co | 6.92% | -37.01% | -2.20% |
| Expedia Group | 1.96% | -50.51% | -2.16% |
| Amazon.com | 4.21% | -49.62% | -2.13% |
| Alphabet | 4.07% | -39.09% | -1.61% |
| NVidia | 1.82% | -31.51% | -1.56% |
| Tesla | 2.08% | -58.46% | -1.47% |
| Nike | 4.23% | -29.04% | -1.38% |
PERFORMANCE ATTRIBUTION ANALYSIS:
Positive Attribution Effects (vs. S&P500):
| ● | Underweight Allocation to Technology |
| ● | Underweight Allocation to Communications |
| ● | Overweight Allocation to Cash |
| ● | Overweight Allocation to Financials |
| ● | Security Selection within Consumer Discretionary |
| ● | Security Selection within Energy |
| | 36 N New York Avenue, Floor 3, Huntington, NY 11743 | Rationalmf.com |
| | |
| | Rational Advisors LLC | Ph: (646) 757-8063 |
| | | |
Negative Attribution Effects:
| ● | Overweight Allocation to Consumer Discretionary |
| ● | Security Selection within Financials |
| ● | Underweight Allocation to Healthcare |
| ● | Underweight Allocation to Industrials |
| ● | Underweight Allocation to Energy |
| ● | Underweight Allocation to Materials |
| ● | Security Selection within Communications |
| ● | Security Selection within Technology |
Reminder: the holdings and allocation weights will change over time according to the opportunities we see in the marketplace. Fund holdings are subject to change and should not be considered investment advice.
Sincerely,
The Accuvest Dynamic Brands Team: Eric Clark, Dave Garff, James Calhoun
| Share Class/Benchmark | YTD | 1 Year | 3 Years | Since
10/16/171 | 5 Years | 10 Years | Since
Inception* |
| Class l | -35.41 | -35.41 | 2.56 | 7.48 | 6.66 | 7.07 | 9.40 |
| S&P 500 TR Index | -18.11 | -18.11 | 7.66 | 10.06 | 9.42 | 12.56 | 10.03 |
| Class A | -35.58 | -35.58 | 2.27 | 7.19 | 6.41 | 6.78 | 9.12 |
| Class Aw/ Sales Charge | -38.64 | -38.64 | 0.63 | 6.19 | 5.38 | 6.27 | 8.86 |
| |
| * Inception: 09/27/2002 |
The maximum sales charge for Class “A” Shares is 4.75%. In the case of investments of $1 million or more (where you do not pay an initial sales charge), a 1.00% contingent deferred sales charge (CDSC) may be assessed on shares redeemed within two years of purchase. The gross expense ratios were 1.75%, 2.69%, and 1.46% for the Class A, C, and I share, respectively per the recent prospectus. Performance is historic and does not guarantee future results. Investment return and principal value will fluctuate with changing market conditions so that when redeemed, shares may be worth more or less than their original cost. Current performance may be lower or higher than the performance data quoted. To obtain the most recent month end performance information or the Fund’s prospectus please call 800-253-0412 or visit www.RationalMF.com.
There is no assurance that the Fund will achieve its investment objective
Important Risk Considerations:
Investing in the Fund carries certain risks. The value of the Fund may decrease in response to the activities and financial prospects of an individual security in the Fund’s portfolio. These factors may
| | 36 N New York Avenue, Floor 3, Huntington, NY 11743 | Rationalmf.com |
| | |
| | Rational Advisors LLC | Ph: (646) 757-8063 |
| | | |
affect the value of your investment. Investments in international markets present special risks including currency fluctuation, the potential for diplomatic and political instability, regulatory and liquidity risks, foreign taxations and differences in auditing and other financial standards. Risks of foreign investing are generally intensified for investment in emerging markets. Emerging market securities tend to be more volatile and less liquid than securities traded in developed countries.
Investors should carefully consider the investment objectives, risks, charges and expenses of the Rational Funds. This and other important information about the Fund is contained in the prospectus, which can be obtained by calling (800) 253-0412 or at www.RationalMF.com. The prospectus should be read carefully before investing. The Rational Funds are distributed by Northern Lights Distributors, LLC member FINRA/SIPC. Rational Advisors, Inc. is not affiliated with Northern Lights Distributors, LLC.
1171-NLD-02032023
| | 36 N New York Avenue, Floor 3, Huntington, NY 11743 | Rationalmf.com |
Rational Dynamic Brands Fund
PORTFOLIO REVIEW (Unaudited)
December 31. 2022
The Fund’s performance figures* for each of the periods ended December 31, 2022, compared to its benchmarks:
| | | Annualized | Annualized | Annualized | Annualized |
| | 1 Year Return | 5 Year Return | 10 Year Return | Since Inception(a) | Since Inception(b) |
| Institutional | (35.41)% | 6.66% | 7.07% | 9.40% | N/A |
| Class A | (35.58)% | 6.41% | 6.78% | 9.12% | N/A |
| Class A with load | (38.64)% | 5.38% | 6.27% | 8.86% | N/A |
| Class C | (36.02)% | 5.63% | N/A | N/A | 4.15% |
| S&P 500 Total Return Index (c) | (18.11)% | 9.42% | 12.56% | 10.03% | 10.67% |
| * | The performance data quoted here represents past performance. Current performance may be lower or higher than the performance data quoted above. Investment return and principal value will fluctuate, so that shares, when redeemed, may be worth more or less than their original cost. The returns shown do not reflect the deduction of taxes that a shareholder would pay on Fund distributions or on the redemptions of Fund shares. Past performance is no guarantee of future results. Performance figures for periods greater than 1 year are annualized. Per the fee table in the Fund’s May 1, 2022 prospectus, the total annual operating expense are 1.10% for Institutional shares, 1.37% for Class A shares and 2.08% for Class C shares before fee waivers and/or expense reimbursements, if any. See the financial highlights for current expense ratios. For performance information current to the most recent month-end, please call toll-free 1-800-253-0412. Class A shares are subject to a maximum load of 4.75%. |
Performance information for the period prior to October 17, 2017 does not reflect the Fund’s current strategy and the Fund’s portfolio was not managed by the Fund’s current Sub-Advisor.
| (a) | Inception date is September 27, 2002, for Class A, Institutional and the benchmark. |
| (b) | Inception date is January 2, 2014 for Class C and the benchmark. |
| (c) | The S&P 500 Total Return Index, a registered trademark of S&P Global., Inc., is a market capitalization-weighted index of 500 widely held common stocks. Investors cannot invest directly in an Index. |
Comparison of the Change in Value of a $10,000 Investment
| Top 10 Holdings by Industry | | % of Net Assets | |
| Asset Management | | | 22.0 | % |
| Apparel & Textile Products | | | 13.3 | % |
| Retail - Discretionary | | | 11.5 | % |
| Technology Services | | | 11.4 | % |
| Internet Media & Services | | | 8.8 | % |
| Oil & Gas Producers | | | 6.3 | % |
| E-Commerce Discretionary | | | 5.6 | % |
| Medical Equipment & Devices | | | 5.1 | % |
| Technology Hardware | | | 4.5 | % |
| Software | | | 4.3 | % |
| Other/Short-Term Investments | | | 7.2 | % |
| | | | 100.0 | % |
Please refer to the Schedule of Investments for a more detailed breakdown of the Fund’s assets.
unaudited
December 31, 2022
Rational Strategic Allocation Fund (RHSAX, RHSCX, RHSIX)
Dear Fellow Shareholders,
The Rational Strategic Allocation Fund (the “Fund”) seeks current income and moderate appreciation of capital by implementing a distinct “index plus” strategy that provides investors exposure to a non-traditional fixed income portfolio with an S&P 500 Index equity overlay. During 2022, the Fund returned -28.04% for Class A compared to the S&P 500 Total Return Index 1 which returned -18.11%. Given the difficult market environment the Fund lagged as a result of its allocations to futures contracts on the S&P 500 Index and fixed income funds.
Investment Strategy
The Fund invests in a portfolio of futures contracts on the S&P 500 Index and income-oriented mutual funds typically representing non-traditional fixed income asset classes. We select underlying funds using a fundamental research process, including a top-down analysis of market conditions and investment category historical performance during various market conditions. We also perform a bottom-up analysis of each potential fund for investment, including investment allocations, investment valuations and characteristics, positioning, historical performance during various market conditions and each fund’s portfolio manager’s outlook. The Fund typically maintains 70% to 100% notional exposure to the S&P 500 Index and 70% to 100% notional exposure to the fixed income portfolio.
Fund Performance
During 2022, the Fund returned -28.04% (Class A) compared to -18.11% for the S&P 500 Total Return Index. The Fund performed in-line with our expectations in the volatile and adverse market conditions during the year. Our equity exposure obtained through allocations to futures contracts on the S&P 500 Index performed how we expected throughout the year. Our allocation to non-traditional fixed income funds was an additional source of negative performance and contributed to the Fund’s overall underperformance as compared to the S&P 500 TR Index. Throughout 2022, we were able to maintain our targeted notional exposure of 70% to 100% to the S&P 500 Index.
2022 was the worst performing year for the traditional “60/40” portfolio (60% in equities and 40% in bonds) in the last 45 years. In a year as difficult as 2022 where equities and fixed income were both down over double digits, this is how we would expect the Fund to perform. In looking a bit deeper into the two sections of the Fund, our S&P 500 futures contracts served its purpose and performed roughly in-line with the S&P 500 Total Return Index. In terms of the fixed income sleeve, our non-traditional holdings returned -7.12% in 2022, outperforming the Bloomberg U.S. Agg Index by close to over 580 bps.
The majority of the holdings performed to our expectations given the challenging market environment. The top performing funds held in the portfolio during 2022 were: Rational Special Situations Fund (RFXIX -0.85%) and Catalyst/CIFC Floating Rate Income Fund (CFRIX -2.34%). The weakest performing fund held in the portfolio during 2022 was: AlphaCentric Income Opportunities Fund (IOFIX -21.68%).
The Fund’s total annualized returns through December 31, 2022 as compared to the S&P 500 Total Return Index were as follows:
| | 1 Year | 3 Years | 5 Years | Since Inception
(07/30/09) |
| Class A | -28.04% | -2.45% | 0.25% | 4.29% |
| Class A with Sales Charge | -31.43% | -4.02% | -0.72% | 3.91% |
| S&P 500 Total Return Index (1) | -18.11% | 7.66% | 9.42% | 12.87% |
The Fund’s maximum sales charge for Class “A” shares is 4.75%. Investments in mutual funds involve risks. Performance is historic and does not guarantee future results. Investment return and principal value will fluctuate with changing market conditions so that when redeemed, shares may be worth more or less than their original cost. Current performance may be lower or higher than the performance data quoted. To obtain the most recent month-end performance information or the Fund’s prospectus please call the Fund, toll free at 1-800-253-0412. You can also obtain a prospectus at www.RationalMF.com.
The views expressed in this letter were those as of December 31, 2022 and may not necessarily reflect views on the date this letter is first published or anytime thereafter. These views are intended to help shareholders in understanding the Fund’s present investment methodology and do not constitute investment advice.
Sincerely,
David Miller
Portfolio Manager
This report is intended for the Fund’s shareholders. It may not be distributed to prospective investors unless it is preceded or accompanied by the current Fund prospectus. To obtain a prospectus or other information about the Fund, please visit www.RationalMF.com or call 1-800-253-0412. Please read the prospectus carefully before investing.
| 1 | The S&P 500 Total Return Index by Standard & Poor’s Corp. is a capitalization-weighted index comprising 500 issues listed on various exchanges, representing the performance of the stock market generally. Please note that indices do not take into account any fees and expenses of investing in the individual securities that they track, and individuals cannot invest directly in any index, although individuals may invest in exchange traded funds or other investment vehicles that attempt to track the performance of an index. The Rational Strategic Allocation Fund may or may not purchase the types of securities represented by the S&P 500 Total Return Index. |
5168-NLD-01312023
Rational Strategic Allocation Fund
PORTFOLIO REVIEW (Unaudited)
December 31. 2022
The Fund’s performance figures* for each of the periods ended December 31, 2022, compared to its benchmarks:
| | | Annualized | Annualized | Annualized | Annualized |
| | 1 Year Return | 5 Year Return | 10 Year Return | Since Inception(a) | Since Inception(b) |
| Institutional | (27.87)% | 0.48% | N/A | N/A | 2.87% |
| Class A | (28.04)% | 0.25% | 3.31% | 4.29% | N/A |
| Class A with load | (31.43)% | (0.72)% | 2.80% | 3.91% | N/A |
| Class C | (28.55)% | (0.51)% | N/A | N/A | 1.87% |
| S&P 500 Total Return Index (c) | (18.11)% | 9.42% | 12.56% | 12.87% | 11.65% |
| * | The performance data quoted here represents past performance. Current performance may be lower or higher than the performance data quoted above. Investment return and principal value will fluctuate, so that shares, when redeemed, may be worth more or less than their original cost. The returns shown do not reflect the deduction of taxes that a shareholder would pay on Fund distributions or on the redemptions of Fund shares. Past performance is no guarantee of future results. Performance figures for periods greater than 1 year are annualized. Per the fee table in the Fund’s May 1, 2022 prospectus, the total annual operating expense are 2.21% for Institutional shares, 2.57% for Class A shares and 3.34% for Class C shares before fee waivers and/or expense reimbursements, if any. See the financial highlights for current expense ratios. For performance information current to the most recent month-end, please call toll-free 1-800-253-0412. Class A shares are subject to a maximum load of 4.75%. |
Performance information for the period prior to December 13, 2019 does not reflect the Fund’s current strategy and the Fund’s portfolio was not managed by the Fund’s current Sub-Advisor.
| (a) | Inception date is July 30, 2009 for Class A and the benchmark. |
| (b) | Inception date is May 31, 2016 for Class C, Institutional and the benchmark. |
| (c) | The S&P 500 Total Return Index, a registered trademark of S&P Global., Inc., is a market capitalization-weighted index of 500 widely held common stocks. Investors cannot invest directly in an Index. |
Comparison of the Change in Value of a $10,000 Investment
| Top Holdings by Asset Type ^ | | % of Net Assets | |
| Fixed Income | | | 71.9 | % |
| Alternative | | | 11.7 | % |
| Other/Short-Term Investments | | | 16.4 | % |
| | | | 100.0 | % |
| | | | | |
| ^ Does not include derivatives in which the Fund invests. | |
Please refer to the Schedule of Investments for a more detailed breakdown of the Fund’s total investments.
unaudited
December 31, 2022
Rational/ReSolve Adaptive Asset Allocation Fund (RDMAX, RDMCX, RDMIX)
Dear Shareholders,
The Rational/ReSolve Adaptive Asset Allocation Fund (“the Fund”) commenced trading on March 16th, 2018, when ReSolve Asset Management officially replaced the previous manager as sub-advisor.
ReSolve’s Adaptive Asset Allocation1 methodology uses proprietary quantitative and machine learning innovations that emphasize characteristics such as, but not limited to, total return momentum, trends, seasonal patterns, carry measures, mean reversion and others, while simultaneously maximizing diversification based on changing estimates of volatility and correlations across a global universe of futures markets consisting of stock and bond indices, commodities, and currencies.
Portfolio Review
The strategy experienced two very distinct semesters in 2022, with strong returns between January and June, driven by the alpha portion of the strategy, offset by a challenging second half of the year for both the alpha and beta sleeves.
Energies provided the best source of positive returns, led by long positions in gasoline, heating oil, natural gas and diesel. Despite detracting from performance in the second semester, the sector sidestepped huge losses experienced in these markets via tight risk controls and agile portfolio rebalancing.
Metals also delivered important gains, stemming primarily from short exposure to copper. Silver offered opportunities for profits from both long and short positions, while long platinum also contributed to performance.
Grains were the other meaningful positive contributors, with longs in corn, soybeans and bean oil, and short wheat.
Bonds were by far the largest detractors, primarily from long exposure to the German sovereign complex (especially the long-duration Buxl), while short 5- and 10-year Treasuries offered important offsetting gains.
Softs also struggled, with losses from long coffee and cocoa, and cotton (both long and short).
Equity indices also contributed negatively, primarily from long positions in the Japanese Nikkei, Dutch AEX and Italian MIB. Profitable shorts in the S&P 500 and German DAX, and active trading in the British FTSE offered a partial counterbalance.
Currencies suffered in the second half from short exposure to the Japanese Yen, Australian Dollar, and Swiss Franc, though active trading in the Euro and long Kiwi Dollar provided some gains.
| 1 | An 11-year track record for the AAA methodology is available upon request. |
Figure 1. 2022 Return Attributions
| Sector | 1st Semester | 2nd Semester | 2022 |
| Bonds | -2.2% | -3.3% | -5.5% |
| Currencies | 0.5% | -2.5% | -2.1% |
| Energies | 7.6% | -1.4% | 6.0% |
| Grains | 2.0% | -1.2% | 0.8% |
| Indices | -0.8% | 0.1% | -0.8% |
| Volatility | -0.1% | -0.1% | -0.2% |
| Meats | 0.0% | 0.0% | 0.0% |
| Metals | 3.3% | -0.8% | 2.4% |
| Softs | -1.7% | -1.6% | -3.3% |
| | | | |
| Total | 8.6% | -10.8% | -3.1% |
Past performance is not indicative of future results.
Note: Results may differ due to rounding. Performance is expressed in USD. Strategy attribution is a best-efforts approximation, net of all applicable borrowing costs, fees and fund accruals for the period. Indicated returns of one year or more are annualized.
The Fund’s total annualized returns through December 31, 2022 as compared to the BarclayHedge CTA Index4 and the S&P 500 Total Return Index5 were as follows:
| | 1 Year | 3 Years | 5 Years | 10 Years | Since Inception 2 |
| Class I | -3.06% | 2.78% | 3.48% | 5.72% | 5.82% |
| BarclayHedge CTA Index 4 | 7.46% | 5.97% | 3.92% | 2.33% | 4.39% |
| S&P 500 Total Return Index 5 | -18.11% | 7.66% | 9.42% | 12.56% | 9.67% |
| Class A | -3.30% | 2.52% | 3.22% | 5.45% | 5.56% |
| Class C | -4.01% | 1.77% | 2.46% | 4.69% | 4.78% |
| Class A w/ Sales Charge | -8.84% | 0.52% | 2.01% | 5.45% | 5.56% |
The Fund’s maximum sales charge for Class “A” shares is 5.75%. Investments in mutual funds involve risks. Performance is historic and does not guarantee future results. Investment return and principal value will fluctuate with changing market conditions so that when redeemed, shares may be worth more or less than their original cost. Current performance may be lower or higher than the performance data quoted. To obtain the most recent month- end performance information please call the Fund, toll free at 1-800-253-0412.
The Fund acquired all of the assets and liabilities of Chesapeake Fund, LLC (the “Predecessor Fund”) in a tax free reorganization on September 30, 2016. In connection with this acquisition, shares of the Predecessor Fund were exchanged for Institutional Shares of the Fund. At the time of the reorganization, the Predecessor Fund had an investment objective and strategies that were, in all material respects, the same as those of the Fund, and was managed in a manner that, in all material respects, complied with the investment guidelines and restrictions of the Fund. Effective February 27, 2018, the Fund’s investment strategy changed, and a new Sub Advisor replaced the prior sub-advisor. Consequently, prior performance may not reflect the Fund’s current operations.
General Market Review
2022 was shaped by global tectonic shifts on several fronts including the economy, finance, geopolitics, and societies at large, in what many believe to be the early stages of a major paradigm shift which effects are likely to last several years. Led by the Federal Reserve, central banks around the world have begun to unwind their balance sheets and raise interest rates to fight inflationary pressures that reached multi-decade highs. Tightening liquidity led to the heaviest capital market losses since the 2007-2009 Great Financial Crisis, with an estimated USD $30 trillion3 wiped out across global stocks and bonds.
Global equities experienced huge losses, led by double-digit declines in major US equities. Sovereigns had their worst year in living memory, with the longest duration bonds falling between 20 and almost 40 percent on both sides of the
| 3 | https://www.ft.com/content/87ed8ea6-4913-4452-9135-498040ad338f |
Atlantic. The US dollar strengthened against its major peers but depreciated against some important emerging market currencies. Industrial metals fell, though precious metals proved more resilient, helped by a large rebound in December. Most energies, grains, and several soft commodities saw enormous price increases on extremely volatile trading: heating oil and gasoil practically doubled, while crude oil, RBOB, corn, milling wheat, soybeans, and sugar rose by double-digits.
The first semester was marked by the regrettable invasion of Ukraine by Russian forces in the final week of February, marking the start of the largest conflict on European soil in decades. Though many believed it would be a quick victory for the invading forces, they were met with fierce and heroic opposition by Ukrainian military and civilian forces. The U.S. and NATO allies responded with tens of billions of dollars in military and economic aid, as well as the largest sanctions in history against the Russian regime, including the freezing of approximately two-thirds of Russia’s central bank assets and cutting banks’ access to the international SWIFT system.
The first few months of the war also had profound consequences on commodity prices, from energies to crops such as corn, soybeans and especially wheat, as much of the fighting has taken place in a region commonly referred to as Europe’s breadbasket. In addition to worsening inflation across the globe, the conflict also continues to threaten the availability of fertilizers, with huge implications for food security – especially in poorer countries. As of this writing, neither side has signaled an intention to sue for peace, though a UN-brokered agreement has allowed grains to be shipped from ports in the Black Sea.
China’s zero-Covid policy was another important variable, disrupting the supply of large amounts of export goods and drastically curbing demand from one of the largest consumer markets. Following the reappointment of Xi Jinping to an unprecedented third term as president (essentially cementing lifetime leadership) and amid growing protests across many regions, the country began to relax restrictions and reopen its borders.
Outlook
The Bank of Japan’s decision to widen the interest rate band under its yield curve control (YCC) policy in December weighed on global markets and contributed to the cancellation of equities’ ‘Christmas rally’, increasing the opportunity cost for one of the world’s largest exporters of capital and further fueling a recent dynamic referred to by some as a ‘reverse currency war’. The European Central Bank warned of ’significantly’ more to come after raising interest rates once again in its latest meeting, likely setting the tone for the new year.
On the geopolitical front, a successful counteroffensive by Ukrainian forces recaptured large swathes of territory while raising fears that the conflict could escalate further (and even lead to the use of nuclear weapons). Deglobalization was one of the major themes of 2022, with several events compounding towards this dynamic: the weaponization of the U.S. dollar and other precedents set by sanctions; the U.S.’ decision to ban exports of advanced semiconductors (and the technology to produce them) to China; the ‘reshoring’ of critical supply-chains away from would-be adversaries; and the deterioration of U.S.-Saudi relationships stand out.
A new global order seems to be emerging, where U.S. hegemony gives way to a more fractured, multi-polar world. This would have profound implications for growth, inflation, liquidity, and by extension asset prices worldwide. It is likely that traditional stock-bond portfolios, which have thrived beyond most investors’ wildest dreams in the previous regime, will face great challenges in the coming years.
Sincerely,
ReSolve Asset Management SEZC (Cayman)
Trading Adviser
This report is intended for the Fund’s shareholders. It may not be distributed to prospective investors unless it is preceded or accompanied by the current Fund prospectus. To obtain a prospectus or other information about the Fund, please visit www.RationalMF.com or call 1-800-253-0412. Please read the prospectus carefully before investing.
| 2 | Inception: Institutional 02/01/1994, Class A & C 09/30/2016. Performance shown before 09/30/2016 is for the Fund’s predecessor, the Rational Dynamic Momentum Fund. |
| 4 | The Barclay Hedge CTA Index is a leading industry benchmark of representative performance of commodity trading advisors. There are currently 510 programs included in the calculation of the Barclay CTA Index for 2020. The Index is equally weighted and rebalanced at the beginning of each year. |
| 5 | The S&P 500 Total Return Index by Standard & Poor’s Corp. is a capitalization-weighted index comprising 500 issues listed on various exchanges, representing the performance of the stock market generally. Please note that indices do not take into account any fees and expenses of investing in the individual securities that they track, and individuals cannot invest directly in any index, although individuals may invest in exchange traded funds or other investment vehicles that attempt to track the performance of an index. The Rational Adaptive Asset Allocation Fund may or may not purchase the types of securities represented by the S&P 500 Total Return Index. |
6041-NLD-01312023
Rational/ReSolve Adaptive Asset Allocation Fund
PORTFOLIO REVIEW (Unaudited)
December 31. 2022
The Fund’s performance figures* for each of the periods ended December 31, 2022, compared to its benchmarks:
| | | Annualized | Annualized | Annualized | Annualized |
| | 1 Year Return | 5 Year Return | 10 Year Return | Since Inception(a) | Since Inception(b) |
| Institutional (c) | (3.06)% | 3.48% | 5.72% | N/A | 5.82% |
| Class A | (3.30)% | 3.22% | N/A | 2.68% | N/A |
| Class A with load | (8.84)% | 2.01% | N/A | 1.71% | N/A |
| Class C | (4.01)% | 2.46% | N/A | 1.95% | N/A |
| S&P 500 Total Return Index (d) | (18.11)% | 9.42% | 12.56% | 11.59% | 9.67% |
| Barclay Hedge CTA Index (e) | 7.55% | 3.93% | 2.34% | 3.05% | 4.39% |
| * | The performance data quoted here represents past performance. Current performance may be lower or higher than the performance data quoted above. Investment return and principal value will fluctuate, so that shares, when redeemed, may be worth more or less than their original cost. The returns shown do not reflect the deduction of taxes that a shareholder would pay on Fund distributions or on the redemptions of Fund shares. Past performance is no guarantee of future results. Performance figures for periods greater than 1 year are annualized. Per the fee table in the Fund’s May 1, 2022 prospectus, the total annual operating expense are 2.26% for Institutional shares, 2.45% for Class A shares and 3.27% for Class C shares before fee waivers and/or expense reimbursements, if any. See the financial highlights for current expense ratios. For performance information current to the most recent month-end, please call toll-free 1-800-253-0412. Class A shares are subject to a maximum load of 5.75%. |
Performance information for the period prior to February 27, 2018 does not reflect the Fund’s current strategy and the Fund’s portfolio was not managed by the Fund’s current Sub-Advisor.
| (a) | Inception date is September 30, 2016 for Class A, Class C and the benchmarks. |
| (b) | Inception date is February 28, 1994 for Institutional and the benchmarks. |
| (c) | The Fund acquired all of the assets and liabilities of Chesapeake Fund LLC (the “Predecessor Fund”) in a tax-free reorganization on September 30, 2016. In connection with this acquisition, shares of the Predecessor Fund were exchanged for Institutional shares of the Fund. At the time of the reorganization, the Fund’s investment objective, policies and guidelines were, in all material respects, equivalent to the Predecessor Fund’s investment objectives, policies and guidelines. The Predecessor Fund commenced operations on February 28,1994. Updated performance information is available at no cost by calling 1-800-253-0412 or visiting the Fund’s website at www.RationalMF.com. |
| (d) | The S&P 500 Total Return Index, a registered trademark of S&P Global., Inc., is a market capitalization-weighted index of 500 widely held common stocks. Investors cannot invest directly in an Index. |
| (e) | The Barclay Hedge CTA Index is a leading industry benchmark of representative performance of commodity trading advisors. |
Comparison of the Change in Value of a $10,000 Investment
| Holdings by Asset Type ^ | | % of Net Assets | |
| U.S. Treasury Bills | | | 64.1 | % |
| Other/Cash & Equivalents | | | 35.9 | % |
| | | | 100.0 | % |
| | | | | |
| ^ Does not include derivatives in which the Fund invests. | |
Please refer to the Consolidated Schedule of Investments for a more detailed breakdown of the Fund’s assets.
unaudited
December 31, 2022
Rational/Pier 88 Convertible Securities Fund (PBXAX, PBXCX, PBXIX)
Dear Fellow Shareholders,
2022 has been a challenging market for equity and bond investors. Throughout the year, corporate earnings reports were generally as expected across industries and market caps, but markets focused on inflation, rising interest rates, and heightened geopolitical risks. The recent volatility in the markets has showcased the need for rigorous risk management.
The Rational/Pier 88 Convertible Securities Fund (the “Fund”) seeks total return consisting of capital appreciation and income by investing primarily in convertible securities, which offer equity participation with the added benefit of a bond floor component. The Fund maintains an average investment grade rating with the goal of providing additional downside risk management. Solid risk management and diligent portfolio management helped the Fund mitigate some of the market volatility in 2022. The sell-off in growth stocks has resulted in the convertibles of many secular growth businesses trading below par, which we view as an opportunity for longer-term investors. Moreover, the Fund seeks to provide a way for investors to gain exposure to high quality secular growth companies with less downside than a traditional equity portfolio with similar names.
In our view, the Fund has proven more defensive than the equity markets during the year given that convertibles are higher in the capital structure for companies and offer some fixed income characteristics. Moreover, the Fund has outperformed the Morningstar Convertible Index and Morningstar Convertible Security Peers, which we would attribute to a strong risk management process, and a general focus on companies of higher credit quality.
In analyzing the risk appetite of investors, we think a review of fixed income returns is informative. The table below details year-to-date performance for a group of fixed income asset classes we routinely review.
| Ticker | Index | YTD Performance through 12/31/22 |
| LGTRTRUU Index | Global Aggregate - Treasuries | -17.4734% |
| LUMSTRUU Index | U.S. Mortgage Backed Securities | -11.8106% |
| LG30TRUU Index | Global High Yield | -12.7052% |
| LEGATRUU Index | Global Aggregate | -16.2485% |
| LF98TRUU Index | U.S. Corporate High Yield | -11.1886% |
| LD08TRUU Index | U.S. Aggregate: Government-Related | -11.0857% |
| LUATTRUU Index | U.S. Treasury | -12.4627% |
| LBEATREU Index | Euro-Aggregate | -17.1750% |
| LC07TRUU Index | U.S. Universal | -12.9924% |
| LBUSTRUU Index | U.S. Aggregate | -13.0103% |
| EMUSTRUU Index | EM USD Aggregate | -15.2612% |
| LP06TREU Index | Pan-Euro Aggregate | -18.9335% |
| LF94TRUU Index | Global Inflation- Linked | -22.9489% |
| LUGCTRUU Index | U.S. Gov/Credit | -13.5761% |
| LGDRTRUU Index | Global Aggregate - Credit | -16.9623% |
| LUACTRUU Index | U.S.Corporate Investment Grade | -15.7616% |
| VX5C Index | All US IG With Cap 5% | -6.2584% |
| VXAO Index | U.S. Conv Index | -18.7090% |
| | | |
| Source: Bloomberg | |
The Fund’s performance compares favorably to many of the above fixed income categories over the past year.
On a go forward basis, we believe that the Fund offers a compelling risk/reward from current levels as the convertible bonds of many growth companies are now trading below par and close to a theoretical bond floor.
The following chart of secular growth companies held in the Fund as of December 31, 222 is illustrative.
| Sector | Company Focus | % of Par |
| Technology | Big Data & Analytics | 83% |
| Technology | Document Management Software | 94% |
| Technology | Cyber Security | 83% |
| Technology | Real-time Pricing Software | 92% |
| Technology | Machine Learning & Artifical Intelligence | 84% |
| Fin Tech | Payments | 94% |
| Consumer | Digital Education | 78% |
| Consumer | E-commerce | 87% |
| Consumer | On-line Travel | 86% |
| Healthcare | Medical Device | 97% |
| | | |
| Source: Bloomberg & Pier 88 |
The chart details 10 convertible bonds of companies levered to multi-year secular growth opportunities in the Technology, Fin Tech, Consumer, and Healthcare sectors where the bonds are trading at a discount to par. Given the below par prices, we believe downside from current levels ought to be fairly limited, unless the companies experience dramatic deterioration of business fundamentals. Assuming the business trends remain stable, it is our view that each of the above bonds should trade at least back to par as the issues mature. If the market begins to favor growth stocks over value stocks and the equities re-rate higher, then we believe the convertible bonds of these companies can trade above par. In our view, convertible bonds, like the examples above, are a defensive way to gain exposure to secular growth companies.
Every industry sector has seen a decline in 2022, with the exception of Energy and Utilities. Energy stocks rallied as the price of oil increased due to numerous factors, including increased demand from a re-opening economy, a lack of refining capacity, the conflict in Ukraine and disruption of European energy markers, and supply shocks in the U.S. due to new Federal policies. Other than the Energy Sector, markets were volatile due to concerns over inflation and a possible recession. We remained underweight in these high premium names, as in our view, a recession would ultimately cause the Energy Sector to buckle as well. Utilities, known as a defensive sector, eked out modest gains this year as investors gravitated toward defensive business models with stable dividends. Other sectors did not fare so well.
The decline in equity prices weighed on the prices of convertible bonds which impacted the performance of positions in the Fund. Companies were not reporting poor fundamentals or missing numbers; rather, most of our companies delivered earnings and outlooks which met or exceeded Street expectations; nevertheless, many positions sold off, which we attribute to multiple compression.
The following breakdown of S&P sector performance is informative.
| 2022 S&P 500 Return Attribution |
| | Weight | | Basis points |
| | at start | 2022 | of S&P 500 |
| Sector | of 2022 | return | return |
| Energy | 3% | 66% | 176 bp |
| Utilities | 2 | 2 | 4 |
| Cons. Staples | 6 | (1) | (4) |
| Health Care | 13 | (2) | (26) |
| Materials | 3 | (12) | (31) |
| Industrials | 8 | (5) | (43) |
| Real Estate | 3 | (26) | (72) |
| Financials | 11 | (11) | (113) |
| Comm. Services | 10 | (40) | (405) |
| Cons. Discretionary | 13 | (37) | (464) |
| Info Tech | 29 | (28) | (822) |
| S&P 500 | 100% | (18)% | (1811) bp |
Source: Goldman Sachs; FactSet
As the chart above details, Energy was the one bright spot this year as fears of constrained supplies of oil helped drive up the price of oil and highly correlated stocks of energy companies. We think the performance of the Discretionary, Technology and Communication Services sectors is more telling. Recessionary-like price declines of these sectors happened without what we have historically viewed as a typical 30% corresponding decline in earnings. On the contrary, most of the companies in these sectors grew revenue and earnings this year. We believe the multiple compression is tied to a general fear of the prospect of future slower growth and negative revisions. The convertible bonds protected as the equities sold off.
Fixed income markets in general provided no safety as bonds sold off in response to inflation fears. Bonds typically are exposed to interest rate, credit, liquidity, and market risks. This year’s volatility was more a reflection of interest rate and market risk than credit risks. Convertibles and the Fund share risk of market exposure but our active management aims to mitigate credit and liquidity risk.
Pier 88 seeks to employ a “balanced” approach to managing the convertible bond asset class. We endeavor to take a balanced view of risk versus reward. The team is cognizant that all investments present a plethora of risk including macroeconomic, market and idiosyncratic. Our portfolio remains diversified from a sector, market cap, and style perspective. We remain bullish on the fundamentals underlying many of our companies; we believe our secular growth stories have years to expand their business, while our blue-chip franchises are well capitalized and possess the stability to fund their yields.
The Rational/Pier 88 Convertible Securities Fund delivered strong positive returns in 2020 and 2021 and has offered downside protection during the fixed income and equity market declines in 2022. On a multi-year basis, the Fund has outperformed the broad fixed income index (the Barclays US Aggregate Bond Index), as well as a variety of other fixed income categories and Morningstar Convertible Peers. The majority of the holdings performed to our expectations and the Fund benefitted from rigorous security selection and solid risk management. We believe investing on behalf of others is a privilege we must earn everyday through adherence to a disciplined investment process. Thank you for your support.
Sincerely,
Frank Timons
Portfolio Manager
The Fund’s total annualized returns through 12/31/22 as compared to its benchmark were as follows:
| | QTD | 1 Year | 3 Years | Since
Inception
(12/06/19) * |
| Class I | 4.35% | -10.82% | 4.79% | 7.21% |
| Class A | 4.28% | -11.04% | 4.60% | 6.98% |
| Class C | 4.19% | -11.63% | 3.90% | 6.22% |
| Class A with Sales Charge | -0.63% | -15.28% | 2.91% | 6.10% |
| S&P 500 TR Index | 7.56% | -18.11% | 7.66% | 10.64% |
| ICE BofA Investment Grade US Convertible 5% Constrained Index | 4.16% | -6.25% | 4.12% | 8.42% |
| Bloomberg US Aggregate TR Index (1) | 1.87% | -13.01% | -2.71% | 0.57% |
| * | Inception: 03/01/2017. The performance shown prior to December 6, 2019 is that of the Predecessor Fund, which reflects all of the Predecessor Fund’s actual fees and expenses adjusted to include any fees of each share class. |
S&P 500 is the primary benchmark.
Maximum sales charge for Class A is 4.75%. Maximum Deferred Sales Charge of 1.00% on Class C Shares applies to shares sold within 12 months of purchase. As of the Fund’s current prospectus dated May 1, 2022, the Fund’s Total Annual Fund Operating Expenses, before any fee waiver and/or expense reimbursement, are 1.17%, 1.35%, and 2.10% for I, A, and C shares, repsectively per the recent prospectus. The performance data quoted here represents past performance. Current performance may be lower or higher than the performance data quoted above. Investment return and principal value will fluctuate, so that shares, when redeemed, may be worth more or less than their original cost. Past performance is no guarantee of future results. Results shown reflect the waiver, without which the results could have been lower. A fund’s performance, especially for very short periods of time, should not be the sole factor in making your investment decisions. To obtain the most recent month end performance information or the Fund’s prospectus please call 800-253-0412 or visit www.RationalMF.com.
Past performance is not a guarantee of future results.
Investors should carefully consider the investment objectives, risks, charges and expenses of the Rational Funds. This and other important information about the Fund is contained in the prospectus, which can be obtained by calling (800) 253-0412 or at www.rationalmf.com. The prospectus should be read carefully before investing. The Rational Funds are distributed by Northern Lights Distributors, LLC member FINRA/ SIPC. Rational Advisors, Inc. is not affiliated with Northern Lights Distributors, LLC.
Risk Considerations
Investing in the Fund carries certain risks. The value of the Fund may decrease in response to the activities and financial prospects of an individual security in the Fund’s portfolio. Investors in the Fund bear the risk that the Fund may not be successful in implementing its investment strategies. The Fund is non-diversified and may invest a greater percentage of its assets in a particular issue and may own fewer securities than other mutual funds; the Fund is subject to concentration risk. Investments in convertible securities subject the Fund to the risks associated with both fixed-income securities, including credit risk and interest risk, and common stocks. A portion of the Fund’s convertible securities may be rated below investment grade. Exchangeable and synthetic convertible securities may be more volatile and less liquid than traditional convertible securities. In general, stock and other equity security values fluctuate, and sometimes widely fluctuate, in response to activities specific to the company as well as general market, economic and political conditions. Lower rated fixed-income securities are subject to greater risk of loss of income and principal than higher-rated securities. The prices of lower rated bonds are likely to be more sensitive to adverse economic changes or individual corporate developments. All fixed-income securities are subject to two types of risk: credit risk and interest rate risk. Interest rate risk is the risk that bond prices overall, including the prices of securities held by the Fund, will decline over short or even long periods of time due to rising interest rates. Bonds with longer maturities tend to be more sensitive to interest rates than bonds with shorter maturities. Lower-quality bonds, known as “high yield” or “junk” bonds, present greater risk than bonds of higher quality, including an increased risk of default. Credit risk is the risk that the issuer of a security will not be able to make principal and interest payments when due. These factors may affect the value of your investment.
The Fund commenced operations by acquiring all of the assets and liabilities of Lake Como Convertible Bond Fund, L.P. (the “Predecessor Fund”) in a tax-free reorganization on December 6, 2019 (the “Reorganization”). In connection with the Reorganization, investors in the Predecessor Fund received Institutional Shares of the Fund. The Fund’s investment
objectives, policies, guidelines and restrictions are, in all material respects, equivalent to those of the Predecessor Fund. However, the Predecessor Fund was not registered under the 1940 Act and, therefore, was not subject to certain investment restrictions, limitations and diversification requirements that are imposed by the 1940 Act or Subchapter M of the Internal Revenue Code that, if they had been applicable, might have adversely affected the Predecessor Fund’s performance. The Fund’s Sub-Advisor was the investment adviser to the Predecessor Fund.
| 1 | Bloomberg US Convertibles TR Index: An index used to represent the U.S. convertible bond asset class. |
1135-NLD-01272023
Rational/Pier 88 Convertible Securities Fund
PORTFOLIO REVIEW (Unaudited)
December 31. 2022
The Fund’s performance figures* for each of the periods ended December 31, 2022, compared to its benchmarks:
| | | Annualized | Annualized | Annualized |
| | 1 Year Return | 5 Year Return | Since Inception(a) | Since Inception(b) |
| Institutional (c) | (10.82)% | 6.97% | N/A | 7.21% |
| Class A | (11.04)% | 6.74% | 5.07% | N/A |
| Class A with load | (15.28)% | 5.70% | 3.41% | N/A |
| Class C | (11.63)% | 6.01% | 4.38% | N/A |
| S&P 500 Total Return Index (d) | (18.11)% | 9.42% | 8.46% | 10.38% |
| Bloomberg US Convertible TR Index (e) | (18.90)% | 8.90% | 9.12% | 9.51% |
| ICE BofA Investment Grade U.S. Convertible 5% Constrained Index (f) | 1.47% | 1.27% | 0.74% | 1.22% |
| * | The performance data quoted here represents past performance. Current performance may be lower or higher than the performance data quoted above. Investment return and principal value will fluctuate, so that shares, when redeemed, may be worth more or less than their original cost. The returns shown do not reflect the deduction of taxes that a shareholder would pay on Fund distributions or on the redemptions of Fund shares. Past performance is no guarantee of future results. Performance figures for periods greater than 1 year are annualized. Per the fee table in the Fund’s May 1, 2022 prospectus, the total annual operating expense are 1.17% for Institutional shares, 1.35% for Class A shares and 2.10% for Class C shares before fee waivers and/or expense reimbursements, if any. See the financial highlights for current expense ratios. For performance information current to the most recent month-end, please call toll-free 1-800-253-0412. Class A shares are subject to a maximum load of 4.75%. |
| (a) | Inception date is December 6, 2019 for Class A, Class C and the benchmark. |
| (b) | Inception date is March 1, 2017 for Institutional and the benchmark. |
| (c) | The Fund acquired all of the assets and liabilities of Lake Como Convertible Bond Fund L.P. (the “Predecessor Fund”) in a tax-free reorganization on December 6, 2019. In connection with this acquisition, shares of the Predecessor Fund were exchanged for Institutional shares of the Fund. The Fund’s investment objective, policies and guidelines are, in all material respects, equivalent to the Predecessor Fund’s investment objectives, policies and guidelines. The Predecessor Fund commenced operations on March 1, 2017. Updated performance information will be available at no cost by calling 1-800-253-0412 or visiting the Fund’s website at www.rationalmf.com. |
| (d) | The S&P 500 Total Return Index, a registered trademark of S&P Global., Inc., is a market capitalization-weighted index of 500 widely held common stocks. Investors cannot invest directly in an Index. |
| (e) | The Bloomberg US Convertible TR Index: An index used to represent the US convertible bond asset class |
| (f) | The ICE BofA Investment Grade U.S. Convertible 5% Constrained Index (VX5C) is a market-capitalization-weighted index of domestic corporate convertible securities. Bonds and preferred stocks must be convertible only to common stock, ADRs or cash equivalent and have a market value of at least $50 million. It includes Coupon, OID, or zero coupon convertible bonds rated by Moody’s and/or S&P with an average rating of Baa3/BBB- or higher. All positions are capped at 5% of market value. |
Comparison of the Change in Value of a $10,000 Investment
| Top 10 Holdings by Industry | | % of Net Assets | |
| Medical Equipment & Devices | | | 23.5 | % |
| Software | | | 14.7 | % |
| Banking | | | 9.1 | % |
| Asset Management | | | 5.4 | % |
| Electric Utilities | | | 5.2 | % |
| Gas & Water Utilities | | | 4.7 | % |
| Technology Services | | | 3.9 | % |
| Health Care Facilities & Services | | | 3.8 | % |
| Internet Media & Services | | | 3.5 | % |
| Technology Hardware | | | 3.4 | % |
| Other/Short-Term Investments | | | 22.8 | % |
| | | | 100.0 | % |
Please refer to the Schedule of Investments for a more detailed breakdown of the Fund’s assets.
Unaudited
December 31, 2022
Rational Special Situations Income Fund (RFXAX | RFXCX | RFXIX)
Dear Fellow Shareholders,
The Rational Special Situations Income Fund (the “Fund”) returned +0.90% for the month of December 2022, bringing its calendar year 2022 performance to -0.85% for Institutional Class. According to Bloomberg, the 10-year Treasury yield rose by 27 bps in December 2022 and by 236 bps for calendar year 2022. The Barclays U.S. Aggregate Bond Index returned - 0.45% for December 2022 and -13.01% for calendar year 2022. The Bloomberg Barclays U.S. Mortgage Backed Securities Index returned -0.44% and -11.81% for December 2022 and calendar year 2022, respectively.
We believe our outperformance relative to the Fund’s benchmarks and peers is because we stuck to our investment philosophy: minimize credit risk, minimize interest rate exposure, and seek uncorrelated profit (i.e. alpha) in bonds that have been overlooked, mismodeled, or misunderstood for some reason.
Disciplined Credit Management:
While we are always looking for strong returns, our focus is on senior bonds in structured credit products - primarily in pre-2008 residential mortgage-backed securities (“MBS”) and highly seasoned commercial MBS. We believe focusing on the senior tranches reduced our risk to fundamental credit shocks and made us relatively less exposed to widening credit spreads. When credit markets start to break down, it is the least creditworthy assets that widen out the most and the most quickly. While some managers specifically target lower tier bonds, many managers become tempted to move down the credit stack to find returns when yields are lower and markets appear stable. We felt that during both the pandemic drawdown in 2020 and the Fed hiking cycle in 2022, the downside risk of lower credit quality bonds was unacceptably high. As we face the possibility of a housing downturn following the rate shock last year, we still feel that way.
It is also worth noting that, in our view, remaining in senior bonds improves our portfolio liquidity. The structured credit markets may be considered esoteric, but the most senior bonds are viable investments for many diversified bond funds.
Minimized Interest Rate Exposure:
Another reason for our outperformance in 2022 was our relatively low interest rate exposure. The average duration of the Fund’s portfolio over the calendar year was around 1-1.5 years. We stay focused on keeping our interest rate exposure low by investing primarily in floating rate bonds or short-term bonds. Even through a sustained period of low rates, we did not seek to increase returns by increasing duration (which increases exposure to rate increases).
Predicting the course of interest rates is difficult, including the Federal Reserve. At the end of 2021, the Treasury curve had a 1-year rate 1 year forward of only about 1%. (In other words, the Treasury curve was pricing in a yield of 1% for a 1 year Treasury issued at the end of 2022.) But at the end of 2022, the 1-year rate hit 4.7%. In other words, the market completely failed to predict the large hike in rates.
If there is a reduction in rates over the next year, funds with longer duration may outperform. Our view is that inflation will moderate, the economy will slow significantly, and interest rates could come down, but we still plan to minimize our interest rate exposure.
Accordingly, if spreads and interest rates tighten significantly in 2023, we believe the Fund will do well in absolute terms, but our short-term relative performance versus our peers may suffer.
Uncorrelated Special Situations:
Lastly, our alpha comes from uncorrelated trade ideas. In a market like that of 2022, where all assets became more correlated, our strategy, while still posting a negative performance, outperformed the broader fixed income markets specifically because the majority of our special situation trades were not driven by any market
factors, but by our strategy to identify opportunities that other market participants either did not or cannot.
If we look roughly at the Fund’s performance over calendar year 2022, the Fund lost around 3.5% to wider credit spreads, 3% to higher risk-free rates (i.e. Treasuries rates), but made about 3% from yields, and 4.5% from special situation trades; after fees the net result was -0.85%.
Opportunity:
We are optimistic about our current portfolio, which we feel has a lot of potential. In addition, the opportunities we are seeing in the special situation space today are more plentiful than we have seen since 2020. This is a general pattern we have observed: When markets are disrupted, more opportunities present themselves. We believe that credit markets will be choppy for the foreseeable future and therefore there will be more opportunities to add special situation trades to the portfolio.
During 2022, we increased our exposure in the commercial MBS (“CMBS”) space. Most CMBS positions that we added or increased in 2022 fell into our special situation bucket. We are continuing to see opportunities in CMBS and we may continue to expand our exposure there. Other credit markets are starting to break down and we believe that there will be opportunities in those markets that could see us build exposures there as well.
We are entering 2023 with a baseline yield to maturity in the portfolio of approximately 8% and a duration of 1.7 years. About half of the portfolio has some special situation aspect to it. If nothing changes in credit spreads or interest rates, we think this baseline yield along with expected realization and/or appreciation of special situation trades currently held in the portfolio should deliver strong returns. As we’ve highlighted, the future paths of credit spreads and interest rates are difficult to predict. We are monitoring other structured credit markets for opportunities. As always, investments in these markets will follow our same investment theme - limited credit and interest rate risk and overlooked upside opportunity.
We thank you for your continued support.
Sincerely,
Dr. Eric S. Meyer and William Van de Water
Portfolio Managers
Performance (%): Ending December 31, 2022
Annualized if greater than a year
| Share Class/Benchmark | 1 Year | 3 Years | 5 Years | 10 Years | Since Inception* |
| Class 1 | -0.85 | 2.40 | 5.25 | 7.82 | 12.91 |
| Bloomberg US Agg TR Index | -13.01 | -2.71 | 0.02 | 1.06 | 2.56 |
| Bloomberg MBS TR Index | -11.81 | -3.22 | -0.53 | 0.74 | 1.94 |
| Class A | -1.10 | 2.14 | 4.97 | 7.54 | 12.64 |
| Class C | -1.78 | 1.39 | 4.20 | 6.75 | 11.80 |
| Class A w/ Load | -5.79 | 0.49 | 3.95 | 7.02 | 12.24 |
| * | Inception: 02/01/2009. The performance shown prior to July 17, 2019 is that of the Predecessor Fund, which reflects all of the Predecessor Fund’s actual fees and expenses adjusted to include any fees of each share class. |
Investment return and principal value will fluctuate, so that shares, when redeemed, may be worth more or less than their original cost. Past performance is no guarantee of future results. Results shown reflect the expense waiver, without which the results could have been lower. A fund’s performance, especially for very short periods of time, should not be the sole factor in
making your investment decisions. To obtain the most recent month end performance information please call 800-253-0412 or visit www.RationalMF.com.
Maximum sales charge for Class A is 4.75%. Maximum Deferred Sales Charge of 1.00% on Class C Shares applies to shares sold within 12 months of purchase. The performance data quoted here represents past performance. Current performance may be lower or higher than the performance data quoted above.
Investors should carefully consider the investment objectives, risks, charges and expenses of the Rational Funds. This and other important information about the Fund are contained in the prospectus, which can be obtained by calling (800) 253-0412 or at www.rationalmf.com. The prospectus should be read carefully before investing. The Rational Funds are distributed by Northern Lights Distributors, LLC member FINRA/SIPC. Rational Advisors, Inc. is not affiliated with Northern Lights Distributors, LLC.
Important Risk Information
Investing in the Fund carries certain risks. The value of the Fund may decrease in response to the activities and financial prospects of an individual security in the Fund’s portfolio. The Fund is non-diversified and may invest a greater percentage of its assets in a particular issue and may own fewer securities than other mutual funds; the Fund is subject to concentration risk. When the Fund invests in asset-backed securities and mortgage-backed securities, the Fund is subject to the risk that, if the underlying borrowers fail to pay interest or repay principal, the assets backing these securities may not be sufficient to support payments on the securities. Interest rate risk is the risk that bond prices overall, including the prices of securities held by the Fund, will decline over short or even long periods of time due to rising interest rates. Bonds with longer maturities tend to be more sensitive to interest rates than bonds with shorter maturities. Lower-quality bonds, known as “high yield” or “junk” bonds, present greater risk than bonds of higher quality, including an increased risk of default. Credit risk is the risk that the issuer of a security will not be able to make principal and interest payments when due. These factors may affect the value of your investment.
The Fund commenced operations by acquiring all of the assets and liabilities of ESM Fund I, L.P. (the “Predecessor Fund”) in a tax-free reorganization on July 17, 2019 (the “Reorganization”). In connection with the Reorganization, investors in the Predecessor Fund received Institutional Shares of the Fund. The Fund’s investment objectives, policies, guidelines and restrictions are, in all material respects, equivalent to those of the Predecessor Fund. However, the Predecessor Fund was not registered under the 1940 Act and, therefore, was not subject to certain investment restrictions, limitations and diversification requirements that are imposed by the 1940 Act or Subchapter M of the Internal Revenue Code, which, if they had been applicable, might have adversely affected the Predecessor Fund’s performance. The Fund’s Sub-Advisor was the investment adviser to the Predecessor Fund. The Fund’s fees and expenses are expected to be higher than those of the Predecessor Fund, so if the Fund’s expenses were applied to the Predecessor Fund’s performance, the performance would have been lower.
5143-NLD-01262023
Rational Special Situations Income Fund
PORTFOLIO REVIEW (Unaudited)
December 31. 2022
The Fund’s performance figures* for each of the periods ended December 31, 2022, compared to its benchmarks:
| | | Annualized | Annualized | Annualized | Annualized |
| | 1 Year Return | 5 Year Return | 10 Year Return | Since Inception(a) | Since Inception(b) |
| Institutional (c) | (0.85)% | 5.25% | 7.82% | N/A | 12.91% |
| Class A | (1.10)% | N/A | N/A | 2.36% | N/A |
| Class A with load | (5.79)% | N/A | N/A | 0.93% | N/A |
| Class C | (1.78)% | N/A | N/A | 1.62% | N/A |
| Bloomberg U.S. Aggregate Bond Index (d) | (13.01)% | 0.02% | 1.06% | (1.65)% | 2.56% |
| Bloomberg U.S. Mortgage Backed Securities Index (e) | (11.81)% | (0.53)% | 0.74% | (2.28)% | 1.94% |
| * | The performance data quoted here represents past performance. Current performance may be lower or higher than the performance data quoted above. Investment return and principal value will fluctuate, so that shares, when redeemed, may be worth more or less than their original cost. The returns shown do not reflect the deduction of taxes that a shareholder would pay on Fund distributions or on the redemptions of Fund shares. Past performance is no guarantee of future results. Performance figures for periods greater than 1 year are annualized. Per the fee table in the Fund’s May 1, 2022 prospectus, the total annual operating expense are 1.78% for Institutional shares, 2.04% for Class A shares and 2.75% for Class C shares before fee waivers and/or expense reimbursements, if any. See the financial highlights for current expense ratios. For performance information current to the most recent month-end, please call toll-free 1-800-253-0412. Class A shares are subject to a maximum load of 4.75%. |
| (a) | Inception date is July 17, 2019 for Class A, Class C and the benchmarks. |
| (b) | Inception date is February 1, 2009 for Institutional and the benchmarks. |
| (c) | The Fund acquired all of the assets and liabilities of ESM Fund I, L.P. (the “Predecessor Fund”) in a tax-free reorganization on July 17, 2019. In connection with this acquisition, shares of the Predecessor Fund were exchanged for Institutional shares of the Fund, so the Predecessor Fund became the Institutional shares of the Fund. The Fund’s investment objective, policies and guidelines are, in all material respects, equivalent to the Predecessor Fund’s investment objectives, policies and guidelines. The Predecessor Fund commenced operations in February 2009. Updated performance information will be available at no cost by calling 1-800-253-0412 or visiting the Fund’s website at www.RationalMF.com. |
| (d) | The Bloomberg U.S. Aggregate Bond Index is a market capitalization-weighted index that is designed to measure the performance of the U.S. investment grade bond market with maturities of more than one year. Investors cannot invest directly in an Index. |
| (e) | The Bloomberg U.S. Mortgage Backed Securities Index tracks agency mortgage pass-through securities. Investors cannot invest directly in an Index. |
Comparison of the Change in Value of a $10,000 Investment
| Holdings by Asset Type | | % of Net Assets | |
| Collateralized Mortgage Obligations | | | 31.3 | % |
| Non Agency CMBS | | | 17.2 | % |
| Home Equity | | | 12.7 | % |
| Insurance | | | 12.6 | % |
| Residential Mortgage | | | 11.1 | % |
| Manufactured Housing | | | 2.7 | % |
| Syndicated Loans | | | 1.7 | % |
| CDO | | | 1.6 | % |
| Specialty Finance | | | 1.2 | % |
| Banking | | | 0.8 | % |
| Other/Short-Term Investments | | | 7.1 | % |
| | | | 100.0 | % |
Please refer to the Schedule of Investments for a more detailed breakdown of the Fund’s assets.
unaudited
December 31, 2022
Rational Inflation Growth Fund (IGOAX, IGOCX, IGOIX)
Dear Fellow Shareholders,
The Rational Inflation Growth Fund (the “Fund”) seeks to achieve its investment objective by investing in securities that the Sub-Advisor expects to increase with elevated U.S. inflation or with expectations of higher U.S. inflation.
The Fund primarily invests in the common stock of domestic and foreign companies, including ADRs and REITs, with any market capitalization within sectors and/or asset classes that the Sub-Advisor believes to have a strong positive correlation to inflation or inflation expectations, including, but not limited to, real estate, infrastructure, energy, basic materials, financials, industrials, and commodities.
The Fund may also invest in ETFs to gain exposure to a sector or asset class when obtaining the desired exposure is not available through investment in common stocks or when investment indirectly through an ETF would otherwise be beneficial to the Fund.
Fund Performance
The Fund performed well vs its composite benchmark index (comprised of 60% S&P 500 Index and 40% Bloomberg US Aggregate Bond Index) during 2022 in a weak overall market. During this period, the Fund returned -1.1%, a +14.7% difference versus its composite benchmark index, which was -15.8%, and +17.0% better than the S&P500’s -18.1% return.
Longer term inflation expectations moderated throughout the year as markets priced in more hawkish Federal Reserve policy, but inflation remained elevated. This led some interest rate sensitive sectors to lag the broader market - such as Real Estate (as represented by the Real Estate Select Sector SPDR Fund), which was down -26.25% during the period. Other sectors benefited relatively from higher interest rates, such as the financial sector (as represented by the Financial Select Sector SPDR Fund), which outperformed the S&P 500 by +7.5%. Inflationary pressures such as higher energy prices over the course of the year due to chronic underinvestment in supply and the war in Ukraine helped the energy sector (as represented by the Energy Select Sector SPDR Fund) return +64.17%, outperforming the S&P 500 by 82.8%. Commodities had a decent year overall, returning +8.7% (as represented by the S&P GSCI) with a strong start to the year led by supply concerns and finished weak on concerns over an economic slowdown. Despite volatility in commodity markets and recession concerns, generally elevated commodity prices relatively benefited the basic materials sector, which returned -14.3% (as represented by the Materials Select Sector SPDR) outpacing the S&P500 by +3.8%.
Performance (%): Ending December 31, 2022
Annualized if less than a year
| | QTD | YTD | 1 Year | Inception* |
| Class I | 13.86 | -1.10 | -1.10 | -1.71 |
| 60% S&P 500 TR Index/40% Bloomberg US Agg Bond1 | 5.39 | -15.79 | -15.79 | -8.59 |
| Class A | 13.88 | -1.29 | -1.29 | -1.95 |
| Class C | 13.61 | -2.09 | -2.09 | -2.68 |
| Class A w/ Sales Charge | 7.29 | -6.99 | -6.99 | -6.10 |
Maximum sales charge for Class A is 5.75%. Maximum Deferred Sales Charge of 1.00% on Class C Shares applies to shares sold within 12 months of purchase As of the Fund’s current prospectus dated May 1, 2022, the Fund’s Total Annual Fund Operating Expenses, before any fee waiver and/or expense reimbursement, are 2.21%. 2.46%, and 3.21% for I, A, and C
shares, respectively per recent prospectus. The performance data quoted here represents past performance. Current performance may be lower or higher than the performance data quoted above. Investment return and principal value will fluctuate, so that shares, when redeemed, may be worth more or less than their original cost. Past performance is no guarantee of future results. To obtain the most recent month end performance information or the Fund’s prospectus please call 800-253-0412 or visit www.RationalMF.com.
Results shown reflect the any fee waiver and/or expense reimbursement, without which the results could have been lower. A fund’s performance, especially for very short periods of time, should not be the sole factor in making your investment decisions.
Summary
We remain confident that inflation is likely to remain persistently higher than the Federal Reserve’s long-term 2% target. The sub-advisor believes the Fund’s investments will deliver positive returns in such an outcome.
| Simon Lack | Henry Hoffman |
| Portfolio Manager | Portfolio Manager |
This report is intended for the Fund’s shareholders. It may not be distributed to prospective investors unless it is preceded or accompanied by the current Fund prospectus. To obtain a prospectus or other information about the Fund, please visit www.RationalMF.com or call 1-800-253-0412. Please read the prospectus carefully before investing.
| 1 | The 60% S&P 500 TR Index/40% LBUSTRUU Index represents a blended index consisting of 60% of returns generated from the S&P 500 TR Index and 40% of returns generated from the Bloomberg U.S. Aggregate Bond Index. |
Important Risk Information:
As with any mutual fund, there is no guarantee that the Fund will achieve its objective. Investment markets are unpredictable and there will be certain market conditions where the Fund will not meet its investment objective and will lose money. The Fund has a limited history of operations for investors to evaluate. If the Fund is unable to achieve an economic size, expenses will be higher than expected and the Fund might close, which could produce adverse tax consequences for shareholders.
There is no guarantee that the value of the Fund’s investments will increase with inflation or with the expectation of higher inflation in the future. It is possible that the Fund’s investments may be negatively correlated with inflation trends or show no such correlation at all, either because the estimate of correlation by the Sub-Advisor or its proprietary model was wrong or because the correlation in the market changed. Historic correlation is no guarantee of future correlation.
ADRs are subject to the same risks as direct investment in foreign companies discussed below and involve risks that are not found in investments in U.S. companies. ADRs may not track the price of the underlying foreign securities on which they are based, and their value may change materially at times when U.S. markets are not open for trading.
Like a mutual fund, the value of an ETF can fluctuate based on the prices of the securities owned by the ETF. Because the Fund may invest its assets in ETFs that have their own fees and expenses in addition to those charged directly by the Fund, the Fund may bear higher expenses than a fund that invests directly in individual securities.
The Fund’s investments in REITs are subject to the same risks as direct investments in real estate, including sensitivity to general economic downturns and the volatility of local real estate markets.
The Fund is distributed by Northern Lights Distributors, LLC. (Member FINRA) Rational Funds, the subadvisor and Northern Lights Distributors, LLC are separate and unaffiliated.
The views expressed in this letter were those as of December 31, 2022 and may not necessarily reflect views on the date this letter is first published or anytime thereafter. These views are intended to help shareholders in understanding the Fund’s present investment methodology and do not constitute investment advice.
1133-NLD-01272023
Rational Inflation Growth Fund
PORTFOLIO REVIEW (Unaudited)
December 31. 2022
The Fund’s performance figures* for each of the periods ended December 31, 2022, compared to its benchmarks:
| | 1 Year Return | Since Inception(a) |
| Institutional | (1.10)% | (1.71)% |
| Class A | (1.29)% | (1.95)% |
| Class A with load | (6.99)% | (6.10)% |
| Class C | (2.09)% | (2.68)% |
| 60% S&P 500/40% Bloomberg Barclays Aggregate Index (b) | (15.79)% | (8.59)% |
| S&P 500 Total Return Index (c) | (18.11)% | (8.05)% |
| Bloomberg U.S. Aggregate Bond Index (d) | (13.01)% | (10.20)% |
| * | The performance data quoted here represents past performance. Current performance may be lower or higher than the performance data quoted above. Investment return and principal value will fluctuate, so that shares, when redeemed, may be worth more or less than their original cost. The returns shown do not reflect the deduction of taxes that a shareholder would pay on Fund distributions or on the redemptions of Fund shares. Past performance is no guarantee of future results. Performance figures for periods greater than 1 year are annualized. Per the fee table in the Fund’s May 1, 2022 prospectus, the total annual operating expense are 2.21% for Institutional shares, 2.46% for Class A shares and 3.21% for Class C shares before fee waivers and/or expense reimbursements, if any. See the financial highlights for current expense ratios. For performance information current to the most recent month-end, please call toll-free 1-800-253-0412. Class A shares are subject to a maximum load of 5.75%. |
| (a) | Inception date is August 18, 2021 for Class A, Class C, Institutional and the benchmarks. |
| (b) | The 60% S&P 500/40% Bloomberg Aggregate Index is a hypothetical combination of unmanaged indices comprised of 60% S&P 500 Index and 40% Bloomberg U.S. Aggregate Bond Index. |
| (c) | The S&P 500 Total Return Index, a registered trademark of S&P Global., Inc., is a market capitalization-weighted index of 500 widely held common stocks. Investors cannot invest directly in an Index. |
| (d) | The Bloomberg U.S. Aggregate Bond Index is a market capitalization-weighted index that is designed to measure the performance of the U.S. investment grade bond market with maturities of more than one year. Investors cannot invest directly in an Index. |
Comparison of the Change in Value of a $10,000 Investment
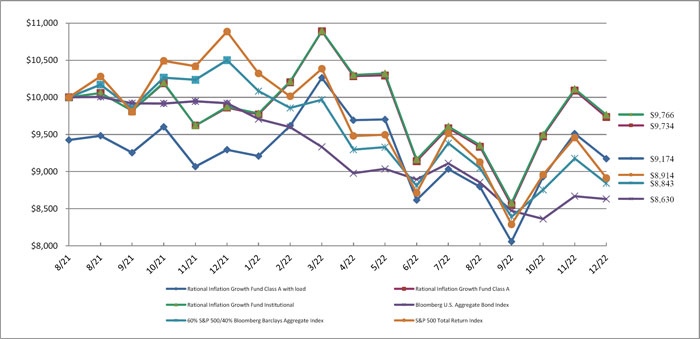
| Holdings by Asset Type | | % of Net Assets | |
| Oil & Gas Producers | | | 17.9 | % |
| Commodity | | | 14.5 | % |
| Metals & Mining | | | 13.4 | % |
| Insurance | | | 7.1 | % |
| Steel | | | 6.6 | % |
| Transportation & Logistics | | | 5.8 | % |
| Chemicals | | | 5.0 | % |
| Banking | | | 4.3 | % |
| Technology Services | | | 3.5 | % |
| Real Estate Investment Trusts | | | 3.2 | % |
| Other/Short-Term Investments | | | 18.7 | % |
| | | | 100.0 | % |
Please refer to the Schedule of Investments for a more detailed breakdown of the Fund’s assets.
| RATIONAL EQUITY ARMOR FUND |
| SCHEDULE OF INVESTMENTS |
| December 31, 2022 |
| Shares | | | | | Fair Value | |
| | | | | COMMON STOCKS — 70.2% | | | | |
| | | | | AEROSPACE & DEFENSE - 3.3% | | | | |
| | 2,834 | | | General Dynamics Corporation | | $ | 703,144 | |
| | 1,310 | | | Northrop Grumman Corporation | | | 714,749 | |
| | 8,186 | | | Raytheon Technologies Corporation | | | 826,130 | |
| | | | | | | | 2,244,023 | |
| | | | | BANKING - 1.5% | | | | |
| | 12,574 | | | Bank of America Corporation | | | 416,451 | |
| | 4,184 | | | JPMorgan Chase & Company | | | 561,074 | |
| | | | | | | | 977,525 | |
| | | | | BEVERAGES - 3.2% | | | | |
| | 8,001 | | | Anheuser-Busch InBev S.A. - ADR | | | 480,380 | |
| | 26,129 | | | Coca-Cola Company (The) | | | 1,662,066 | |
| | | | | | | | 2,142,446 | |
| | | | | BIOTECH & PHARMA - 9.2% | | | | |
| | 11,347 | | | AbbVie, Inc. | | | 1,833,789 | |
| | 2,085 | | | Eli Lilly and Company | | | 762,776 | |
| | 9,542 | | | Johnson & Johnson | | | 1,685,594 | |
| | 17,518 | | | Merck & Company, Inc. | | | 1,943,622 | |
| | | | | | | | 6,225,781 | |
| | | | | CHEMICALS - 1.2% | | | | |
| | 6,364 | | | Corteva, Inc. | | | 374,076 | |
| | 1,293 | | | Linde plc | | | 421,751 | |
| | | | | | | | 795,827 | |
| | | | | COMMERCIAL SUPPORT SERVICES - 2.1% | | | | |
| | 4,930 | | | Republic Services, Inc. | | | 635,921 | |
| | 4,835 | | | Waste Management, Inc. | | | 758,515 | |
| | | | | | | | 1,394,436 | |
| | | | | E-COMMERCE DISCRETIONARY - 1.1% | | | | |
| | 9,162 | | | Amazon.com, Inc.(a) | | | 769,608 | |
| | | | | | | | | |
| | | | | ELECTRIC UTILITIES - 3.8% | | | | |
| | 14,826 | | | Avangrid, Inc. | | | 637,221 | |
| | 15,096 | | | Exelon Corporation | | | 652,600 | |
| | 17,933 | | | NRG Energy, Inc. | | | 570,628 | |
See accompanying notes which are an integral part of these financial statements.
| RATIONAL EQUITY ARMOR FUND |
| SCHEDULE OF INVESTMENTS (Continued) |
| December 31, 2022 |
| Shares | | | | | Fair Value | |
| | | | | COMMON STOCKS — 70.2% (Continued) | | | | |
| | | | | ELECTRIC UTILITIES - 3.8% (Continued) | | | | |
| | 4,545 | | | Sempra Energy | | $ | 702,385 | |
| | | | | | | | 2,562,834 | |
| | | | | FOOD - 2.6% | | | | |
| | 7,552 | | | Hershey Company (The) | | | 1,748,817 | |
| | | | | | | | | |
| | | | | HEALTH CARE FACILITIES & SERVICES - 5.9% | | | | |
| | 5,409 | | | AmerisourceBergen Corporation | | | 896,325 | |
| | 2,877 | | | McKesson Corporation | | | 1,079,220 | |
| | 3,713 | | | UnitedHealth Group, Inc. | | | 1,968,559 | |
| | | | | | | | 3,944,104 | |
| | | | | HEALTH CARE REIT - 2.0% | | | | |
| | 46,934 | | | Omega Healthcare Investors, Inc. | | | 1,311,805 | |
| | | | | | | | | |
| | | | | HOUSEHOLD PRODUCTS - 1.1% | | | | |
| | 4,759 | | | Procter & Gamble Company (The) | | | 721,274 | |
| | | | | | | | | |
| | | | | INDUSTRIAL SUPPORT SERVICES - 0.9% | | | | |
| | 12,783 | | | Fastenal Company | | | 604,892 | |
| | | | | | | | | |
| | | | | INSTITUTIONAL FINANCIAL SERVICES - 1.8% | | | | |
| | 19,737 | | | Nasdaq, Inc. | | | 1,210,865 | |
| | | | | | | | | |
| | | | | INSURANCE - 7.7% | | | | |
| | 4,644 | | | Berkshire Hathaway, Inc., Class B(a) | | | 1,434,531 | |
| | 5,368 | | | Chubb Ltd. | | | 1,184,181 | |
| | 17,089 | | | MetLife, Inc. | | | 1,236,731 | |
| | 7,195 | | | Travelers Companies, Inc. (The) | | | 1,348,991 | |
| | | | | | | | 5,204,434 | |
| | | | | INTERNET MEDIA & SERVICES - 1.8% | | | | |
| | 13,086 | | | Alphabet, Inc., Class A(a) | | | 1,154,578 | |
| | | | | | | | | |
| | | | | MACHINERY - 1.4% | | | | |
| | 3,963 | | | Caterpillar, Inc. | | | 949,376 | |
See accompanying notes which are an integral part of these financial statements.
| RATIONAL EQUITY ARMOR FUND |
| SCHEDULE OF INVESTMENTS (Continued) |
| December 31, 2022 |
| Shares | | | | | Fair Value | |
| | | | | COMMON STOCKS — 70.2% (Continued) | | | | |
| | | | | OIL & GAS PRODUCERS - 3.2% | | | | |
| | 6,751 | | | ConocoPhillips | | $ | 796,618 | |
| | 8,853 | | | Exxon Mobil Corporation | | | 976,486 | |
| | 14,752 | | | Marathon Oil Corporation | | | 399,337 | |
| | | | | | | | 2,172,441 | |
| | | | | PUBLISHING & BROADCASTING - 0.5% | | | | |
| | 6,024 | | | Liberty Media Corp-Liberty Formula One - Series C(a) | | | 360,115 | |
| | | | | | | | | |
| | | | | RETAIL - CONSUMER STAPLES - 3.4% | | | | |
| | 2,897 | | | Costco Wholesale Corporation | | | 1,322,480 | |
| | 7,011 | | | Walmart, Inc. | | | 994,089 | |
| | | | | | | | 2,316,569 | |
| | | | | SOFTWARE - 4.7% | | | | |
| | 9,213 | | | Microsoft Corporation | | | 2,209,462 | |
| | 11,385 | | | Oracle Corporation | | | 930,610 | |
| | | | | | | | 3,140,072 | |
| | | | | SPECIALTY REITS - 1.5% | | | | |
| | 20,675 | | | Iron Mountain, Inc. | | | 1,030,649 | |
| | | | | | | | | |
| | | | | TECHNOLOGY HARDWARE - 3.5% | | | | |
| | 7,700 | | | Apple, Inc. | | | 1,000,461 | |
| | 28,457 | | | Cisco Systems, Inc. | | | 1,355,691 | |
| | | | | | | | 2,356,152 | |
| | | | | WHOLESALE - CONSUMER STAPLES - 2.8% | | | | |
| | 20,115 | | | Archer-Daniels-Midland Company | | | 1,867,678 | |
| | | | | | | | | |
| | | | | TOTAL COMMON STOCKS (Cost $42,496,991) | | | 47,206,301 | |
| | | | | | | | | |
| | | | | EXCHANGE-TRADED FUNDS — 15.7% | | | | |
| | | | | EQUITY - 15.7% | | | | |
| | 17,423 | | | iShares Russell 1000 Value ETF | | | 2,642,198 | |
| | 17,395 | | | iShares S&P 500 Value ETF | | | 2,523,493 | |
| | 41,814 | | | Schwab U.S. Large-Cap Value ETF | | | 2,760,560 | |
See accompanying notes which are an integral part of these financial statements.
| RATIONAL EQUITY ARMOR FUND |
| SCHEDULE OF INVESTMENTS (Continued) |
| December 31, 2022 |
| Shares | | | | | Fair Value | |
| | | | | EXCHANGE-TRADED FUNDS — 15.7% (Continued) | | | | |
| | | | | EQUITY - 15.7% (Continued) | | | | |
| | 66,810 | | | SPDR Portfolio S&P 500 Value ETF | | $ | 2,598,241 | |
| | | | | | | | 10,524,492 | |
| | | | | | | | | |
| | | | | TOTAL EXCHANGE-TRADED FUNDS (Cost $10,673,834) | | | 10,524,492 | |
| Contracts(b) | | | | | Broker/Counterparty | | Expiration Date | | Exercise Price | | | Notional Value | | | Fair Value | |
| | | | | FUTURE OPTIONS PURCHASED - 3.3% | | | | | | | | | | | | | | | | |
| | | | | CALL OPTIONS PURCHASED - 0.2% | | | | | | | | | | | | | | | | |
| | 250 | | | S&P Emini Future, Maturing January 2023 | | WED | | 01/20/2023 | | $ | 4,050 | | | $ | 50,625,000 | | | $ | 146,875 | |
| | | | | TOTAL CALL OPTIONS PURCHASED (Cost - $359,375) | | | | | | |
| | | | | | | | | | | | | | | | | | | | | |
| | | | | PUT OPTIONS PURCHASED - 3.1% | | | | | | | | | | | | | | | | |
| | 250 | | | S&P Emini Future, Maturing January 2023 | | WED | | 01/20/2023 | | $ | 3,700 | | | $ | 46,250,000 | | | $ | 312,500 | |
| | 250 | | | S&P Emini Future, Maturing January 2023 | | WED | | 01/20/2023 | | | 3,970 | | | | 49,625,000 | | | | 1,731,250 | |
| | | | | TOTAL PUT OPTIONS PURCHASED (Cost - $1,871,721) | | | | | | | 2,043,750 | |
| | | | | | | | | | | | | | | | | | | | | |
| | | | | TOTAL FUTURE OPTIONS PURCHASED (Cost - $2,231,096) | | | | | | | | | | | 2,190,625 | |
| | | | | | | | | | | | | | | | | | | | | |
| | | | | TOTAL INVESTMENTS — 89.2% (Cost $55,401,921) | | | | | | | | $ | 59,921,418 | |
| | | | | PUT OPTIONS WRITTEN - (2.7)% (Proceeds - $1,846,875) | | | | | | | | (1,781,250 | ) |
| | | | | OTHER ASSETS IN EXCESS OF LIABILITIES- 13.5% | | | | | | | | | 9,048,179 | |
| | | | | NET ASSETS - 100.0% | | | | | | | | $ | 67,188,347 | |
| Contracts(b) | | | | | Counterparty | | Expiration Date | | Exercise Price | | | Notional Value | | | Fair Value | |
| | | | | WRITTEN FUTURE OPTIONS - (2.7)% | | | | | | | | | | | | | | | | |
| | | | | PUT OPTIONS WRITTEN - (2.7)% | | | | | | | | | | | | | | | | |
| | 125 | | | S&P Emini Future, Maturing April 2023 | | WED | | 04/21/2023 | | $ | 3,700 | | | $ | 23,125,000 | | | $ | 735,938 | |
| | 375 | | | S&P 500 Emini Future, Maturing March 2023 | | WED | | 03/17/2023 | | | 3,550 | | | | 66,562,500 | | | | 1,045,312 | |
| | | | | TOTAL PUT OPTIONS WRITTEN (Proceeds - $1,846,875) | | | | | 1,781,250 | |
| | | | | | | | | | | | | | | | | | | | | |
| | | | | TOTAL FUTURE OPTIONS WRITTEN (Proceeds - $1,846,875) | | | | $ | 1,781,250 | |
See accompanying notes which are an integral part of these financial statements.
| RATIONAL EQUITY ARMOR FUND |
| SCHEDULE OF INVESTMENTS (Continued) |
| December 31, 2022 |
OPEN FUTURES CONTRACTS
| Number of | | | | | | | | | | Value and Unrealized | |
| Contracts | | | Open Long Futures Contracts | | Expiration | | Notional Amount(c) | | | Depreciation | |
| | 7 | | | CBOE Volatility Index Future | | 02/15/2023 | | $ | 171,817 | | | $ | (10,183 | ) |
| | 74 | | | CBOE Volatility Index Future | | 03/22/2023 | | | 1,875,937 | | | | (69,523 | ) |
| | | | | TOTAL OPEN LONG FUTURES CONTRACTS | | | | | | | | $ | (79,706 | ) |
OPEN FUTURES CONTRACTS
| Number of | | | | | | | | | | Value and Unrealized | |
| Contracts | | | Open Short Futures Contracts | | Expiration | | Notional Amount(c) | | | Appreciation | |
| | 19 | | | CBOE Volatility Index Future | | 01/18/2023 | | $ | 438,864 | | | $ | 41,456 | |
| | | | | | | | | | | | | | | |
| | | | | TOTAL OPEN SHORT FUTURES CONTRACTS | | | | | | | | $ | 41,456 | |
| ADR | - American Depositary Receipt |
| ETF | - Exchange-Traded Fund |
| PLC | - Public Limited Company |
| REIT | - Real Estate Investment Trust |
| SPDR | - Standard & Poor’s Depositary Receipt |
| (a) | Non-income producing security. |
| (b) | Each contract is equivalent to one futures contract. |
| (c) | The amounts shown are the underlying reference notional amounts to stock exchange indices and equities upon which the fair value of the futures contracts held by the Fund are based. Notional values do not represent the current fair value of, and are not necessarily indicative of the future cash flows of the Fund’s futures contracts. Further, the underlying price changes in relation to the variables specified by the notional values affects the fair value of these derivative financial instruments. The notional values as set forth within this schedule do not purport to represent economic value at risk to the Fund. |
See accompanying notes which are an integral part of these financial statements.
| RATIONAL TACTICAL RETURN FUND |
| SCHEDULE OF INVESTMENTS |
| December 31, 2022 |
| Principal | | | | | Discount Rate | | | | | |
| Amount ($) | | | | | (%) | | Maturity | | Fair Value | |
| | | | | U.S. GOVERNMENT & AGENCIES — 76.9% | | | | | | | | |
| | | | | U.S. TREASURY BILLS — 76.9% | | | | | | | | |
| | 15,000,000 | | | United States Treasury Bill (a) | | 3.4612 | | 02/02/23 | | $ | 14,952,408 | |
| | 20,000,000 | | | United States Treasury Bill (a) | | 4.0862 | | 03/23/23 | | | 19,813,852 | |
| | 20,000,000 | | | United States Treasury Bill (a) | | 4.2669 | | 04/20/23 | | | 19,739,247 | |
| | 15,000,000 | | | United States Treasury Bill (a) | | 4.4162 | | 05/18/23 | | | 14,746,066 | |
| | 20,000,000 | | | United States Treasury Bill (a)(b) | | 4.3718 | | 06/15/23 | | | 19,596,824 | |
| | 15,000,000 | | | United States Treasury Bill (a)(b) | | 4.4102 | | 07/13/23 | | | 14,643,506 | |
| | 20,000,000 | | | United States Treasury Bill (a) | | 4.3739 | | 08/10/23 | | | 19,460,550 | |
| | 20,000,000 | | | United States Treasury Bill (a)(b) | | 4.3250 | | 09/07/23 | | | 19,399,310 | |
| | 20,000,000 | | | United States Treasury Bill (a)(b) | | 4.3753 | | 10/05/23 | | | 19,324,264 | |
| | 5,000,000 | | | United States Treasury Bill (a) | | 4.4648 | | 11/02/23 | | | 4,810,246 | |
| | | | | TOTAL U.S. GOVERNMENT & AGENCIES (Cost $167,249,174) | | | | | | | 166,486,273 | |
| | | | | | | | | | | | | |
| | | | | TOTAL INVESTMENTS - 76.9% (Cost $167,249,174) | | | | | | $ | 166,486,273 | |
| | | | | OTHER ASSETS IN EXCESS OF LIABILITIES- 23.1% | | | | | | | 49,976,432 | |
| | | | | NET ASSETS - 100.0% | | | | | | $ | 216,462,705 | |
| (b) | All or a portion of this security is held as collateral. |
See accompanying notes which are an integral part of these financial statements.
| RATIONAL DYNAMIC BRANDS FUND |
| SCHEDULE OF INVESTMENTS |
| December 31, 2022 |
| Shares | | | | | Fair Value | |
| | | | | COMMON STOCKS — 104.5% | | | | |
| | | | | APPAREL & TEXTILE PRODUCTS - 13.3% | | | | |
| | 1,750 | | | Deckers Outdoor Corporation(a) | | $ | 698,530 | |
| | 6,300 | | | Hermes International - ADR | | | 975,209 | |
| | 15,100 | | | LVMH Moet Hennessy Louis Vuitton S.E. - ADR | | | 2,187,537 | |
| | 16,439 | | | NIKE, Inc., Class B | | | 1,923,527 | |
| | | | | | | | 5,784,803 | |
| | | | | ASSET MANAGEMENT - 22.0% | | | | |
| | 71,600 | | | Blackstone, Inc. | | | 5,312,004 | |
| | 90,000 | | | KKR & Company, Inc. | | | 4,177,800 | |
| | | | | | | | 9,489,804 | |
| | | | | AUTOMOTIVE - 2.4% | | | | |
| | 3,600 | | | Ferrari N.V. | | | 771,192 | |
| | 2,000 | | | Tesla, Inc.(a) | | | 246,360 | |
| | | | | | | | 1,017,552 | |
| | | | | E-COMMERCE DISCRETIONARY - 5.6% | | | | |
| | 20,720 | | | Amazon.com, Inc.(a) | | | 1,740,480 | |
| | 810 | | | MercadoLibre, Inc.(a) | | | 685,454 | |
| | | | | | | | 2,425,934 | |
| | | | | HOUSEHOLD PRODUCTS - 3.6% | | | | |
| | 6,300 | | | Estee Lauder Companies, Inc. (The), Class A | | | 1,563,093 | |
| | | | | | | | | |
| | | | | INTERNET MEDIA & SERVICES - 8.8% | | | | |
| | 18,750 | | | Alphabet, Inc., Class A(a) | | | 1,654,313 | |
| | 11,700 | | | Meta Platforms, Inc., Class A(a) | | | 1,407,978 | |
| | 9,000 | | | Spotify Technology S.A.(a) | | | 710,550 | |
| | | | | | | | 3,772,841 | |
| | | | | LEISURE FACILITIES & SERVICES - 1.6% | | | | |
| | 2,000 | | | Domino’s Pizza, Inc. | | | 692,800 | |
| | | | | | | | | |
| | | | | MEDICAL EQUIPMENT & DEVICES - 5.1% | | | | |
| | 4,020 | | | Thermo Fisher Scientific, Inc. | | | 2,213,774 | |
| | | | | | | | | |
| | | | | OIL & GAS PRODUCERS - 6.3% | | | | |
| | 6,200 | | | Chevron Corporation | | | 1,112,838 | |
See accompanying notes which are an integral part of these financial statements.
| RATIONAL DYNAMIC BRANDS FUND |
| SCHEDULE OF INVESTMENTS (Continued) |
| December 31, 2022 |
| Shares | | | | | Fair Value | |
| | | | | COMMON STOCKS — 104.5% (Continued) | | | | |
| | | | | OIL & GAS PRODUCERS - 6.3% (Continued) | | | | |
| | 14,400 | | | Exxon Mobil Corporation | | $ | 1,588,320 | |
| | | | | | | | 2,701,158 | |
| | | | | RETAIL - CONSUMER STAPLES - 4.1% | | | | |
| | 3,894 | | | Costco Wholesale Corporation | | | 1,777,611 | |
| | | | | | | | | |
| | | | | RETAIL - DISCRETIONARY - 11.5% | | | | |
| | 4,245 | | | Home Depot, Inc. (The) | | | 1,340,826 | |
| | 7,200 | | | Lululemon Athletica, Inc.(a) | | | 2,306,735 | |
| | 5,050 | | | RH(a) | | | 1,349,310 | |
| | | | | | | | 4,996,871 | |
| | | | | SOFTWARE - 4.3% | | | | |
| | 7,797 | | | Microsoft Corporation | | | 1,869,877 | |
| | | | | | | | | |
| | | | | TECHNOLOGY HARDWARE - 4.5% | | | | |
| | 14,801 | | | Apple, Inc. | | | 1,923,094 | |
| | | | | | | | | |
| | | | | TECHNOLOGY SERVICES - 11.4% | | | | |
| | 6,000 | | | Mastercard, Inc., Class A | | | 2,086,380 | |
| | 8,000 | | | PayPal Holdings, Inc.(a) | | | 569,760 | |
| | 10,828 | | | Visa, Inc., Class A | | | 2,249,625 | |
| | | | | | | | 4,905,765 | |
| | | | | | | | | |
| | | | | TOTAL COMMON STOCKS (Cost $46,264,414) | | | 45,134,977 | |
| | | | | | | | | |
| | | | | TOTAL INVESTMENTS - 104.5% (Cost $46,264,414) | | $ | 45,134,977 | |
| | | | | LIABILITIES IN EXCESS OF OTHER ASSETS - (4.5)% | | | (1,972,367 | ) |
| | | | | NET ASSETS - 100.0% | | $ | 43,162,610 | |
| ADR | - American Depositary Receipt |
| NV | - Naamioze Vennootschap |
| (a) | Non-income producing security. |
See accompanying notes which are an integral part of these financial statements.
| RATIONAL STRATEGIC ALLOCATION FUND |
| SCHEDULE OF INVESTMENTS |
| December 31, 2022 |
| Shares | | | | | Fair Value | |
| | | | | OPEN END FUNDS — 83.6% | | | | |
| | | | | ALTERNATIVE - 11.7% | | | | |
| | 95,940 | | | Catalyst Insider Income Fund, Class I ARS (a) | | $ | 829,957 | |
| | | | | | | | | |
| | | | | FIXED INCOME - 71.9% | | | | |
| | 36,557 | | | AlphaCentric Income Opportunities Fund, Class I ARS (a) | | | 331,652 | |
| | 137,375 | | | Catalyst Enhanced Income Strategy Fund, Class I ARS (a) | | | 1,321,644 | |
| | 93,531 | | | Catalyst/CIFC Floating Rate Income Fund, Class I ARS (a) | | | 833,440 | |
| | 72,453 | | | Rational Special Situations Income Fund, Institutional Class ARS (a) | | | 1,332,777 | |
| | 121,625 | | | Rational/Pier 88 Convertible Securities Fund, Institutional Class ARS (a) | | | 1,268,679 | |
| | | | | | | | 5,088,192 | |
| | | | | | | | | |
| | | | | TOTAL OPEN END FUNDS (Cost $6,164,202) | | | 5,918,149 | |
| | | | | | | | | |
| | | | | TOTAL INVESTMENTS — 83.6% (Cost $6,164,202) | | $ | 5,918,149 | |
| | | | | OTHER ASSETS IN EXCESS OF LIABILITIES- 16.4% | | | 1,157,955 | |
| | | | | NET ASSETS - 100.0% | | $ | 7,076,104 | |
OPEN FUTURES CONTRACTS
| Number of | | | | | | | | | | Value and Unrealized | |
| Contracts | | | Open Long Futures Contracts | | Expiration | | Notional Amount(b) | | | Depreciation | |
| | 37 | | | CME E-Mini Standard & Poor’s 500 Index Future | | 03/17/2023 | | $ | 7,142,850 | | | $ | (359,270 | ) |
| | | | | | | | | | | | | | | |
| | | | | TOTAL FUTURES CONTRACTS | | | | | | | | | | |
| (b) | The amounts shown are the underlying reference notional amounts to stock exchange indices and equities upon which the fair value of the futures contracts held by the Fund are based. Notional values do not represent the current fair value of, and are not necessarily indicative of the future cash flows of the Fund’s futures contracts. Further, the underlying price changes in relation to the variables specified by the notional values affects the fair value of these derivative financial instruments. The notional values as set forth within this schedule do not purport to represent economic value at risk to the Fund. |
See accompanying notes which are an integral part of these financial statements.
| RATIONAL/RESOLVE ADAPTIVE ASSET ALLOCATION FUND |
| CONSOLIDATED SCHEDULE OF INVESTMENTS |
| December 31, 2022 |
| Principal | | | | | Coupon Rate | | | | | |
| Amount ($) | | | | | (%) | | Maturity | | Fair Value | |
| | | | | U.S. GOVERNMENT & AGENCIES — 64.1% | | | | | | | | |
| | | | | U.S. TREASURY BILLS — 64.1% | | | | | | | | |
| | 37,300,000 | | | United States Treasury Bill(a) | | 3.0484 | | 01/19/23 | | $ | 37,239,989 | |
| | 37,300,000 | | | United States Treasury Bill(a) | | 3.5905 | | 02/09/23 | | | 37,151,192 | |
| | 34,200,000 | | | United States Treasury Bill(a) | | 4.0058 | | 03/14/23 | | | 33,922,195 | |
| | | | | TOTAL U.S. GOVERNMENT & AGENCIES (Cost $108,291,098) | | | | | | | 108,313,376 | |
| | | | | | | | | | | | | |
| Shares | | | | | | | | | | | |
| | | | | SHORT-TERM INVESTMENTS — 17.5% | | | | | | | | |
| | | | | MONEY MARKET FUNDS - 17.5% | | | | | | | | |
| | 40,539,786 | | | First American US Treasury Money Market Fund, Class Z, 3.95% (Cost $40,539,786)(b), (d) | | | 40,539,786 | |
| | | | | | | | | | | | | |
| | | | | TOTAL INVESTMENTS - 81.6% (Cost $148,830,884) | | $ | 148,853,162 | |
| | | | | OTHER ASSETS IN EXCESS OF LIABILITIES- 18.4% | | | 20,099,479 | |
| | | | | NET ASSETS - 100.0% | | $ | 168,952,641 | |
OPEN FUTURES CONTRACTS
| Number of | | | | | | | | | | Value and Unrealized | |
| Contracts | | | Open Long Futures Contracts | | Expiration | | Notional Amount(c) | | | Appreciation (Depreciation) | |
| | 233 | | | CBOT Corn Future(d) | | 03/14/2023 | | $ | 7,904,525 | | | $ | 334,325 | |
| | 129 | | | CBOT Soybean Future(d) | | 03/14/2023 | | | 9,829,800 | | | | 170,900 | |
| | 116 | | | CBOT Soybean Meal Future(d) | | 03/14/2023 | | | 5,463,600 | | | | 204,830 | |
| | 1 | | | CBOT US Long Bond Future | | 03/22/2023 | | | 125,344 | | | | (2,969 | ) |
| | 23 | | | CME Canadian Dollar Currency Future | | 03/14/2023 | | | 1,700,160 | | | | 6,795 | |
| | 3 | | | CME E-mini Russell 2000 Index Futures | | 03/17/2023 | | | 265,635 | | | | 3,865 | |
| | 13 | | | CME E-Mini Standard & Poor’s 500 Index Future | | 03/17/2023 | | | 2,509,650 | | | | 10,050 | |
| | 170 | | | CME Euro Foreign Exchange Currency Future | | 03/13/2023 | | | 22,852,250 | | | | 168,899 | |
| | 378 | | | CME New Zealand Dollar Currency Future | | 03/13/2023 | | | 23,980,320 | | | | (103,080 | ) |
| | 89 | | | CME Nikkei 225 Stock Index Future | | 03/09/2023 | | | 11,467,650 | | | | (818,150 | ) |
| | 70 | | | COMEX Silver Future(d) | | 03/29/2023 | | | 8,414,000 | | | | 43,225 | |
| | 21 | | | Eurex 10 Year Euro BUND Future | | 03/08/2023 | | | 2,989,110 | | | | (206,484 | ) |
| | 25 | | | Eurex 30 Year Euro BUXL Future | | 03/08/2023 | | | 3,620,302 | | | | (240,137 | ) |
| | 5 | | | Eurex DAX Index Future | | 03/17/2023 | | | 1,872,256 | | | | (8,732 | ) |
| | 225 | | | Eurex EURO STOXX 50 Future | | 03/17/2023 | | | 9,119,017 | | | | (329,518 | ) |
| | 4 | | | Euronext Amsterdam Index Future(d) | | 01/20/2023 | | | 590,770 | | | | (8,684 | ) |
| | 116 | | | Euronext CAC 40 Index Future | | 01/20/2023 | | | 8,037,028 | | | | (40,820 | ) |
| | 1,766 | | | Euronext Milling Wheat Future | | 03/10/2023 | | | 29,239,506 | | | | (261,883 | ) |
| | 13 | | | French Government Bond Futures | | 03/08/2023 | | | 1,772,031 | | | | (106,657 | ) |
| | 67 | | | FTSE 100 Index Future | | 03/17/2023 | | | 6,047,025 | | | | (24,848 | ) |
| | 56 | | | FTSE/MIB Index Future | | 03/17/2023 | | | 7,108,084 | | | | (44,918 | ) |
| | 16 | | | HKG Hang Seng Index Future | | 01/30/2023 | | | 2,041,107 | | | | 2,890 | |
| | 40 | | | ICE Brent Crude Oil Future(d) | | 01/31/2023 | | | 3,436,400 | | | | 100,820 | |
See accompanying notes which are an integral part of these consolidated financial statements.
| RATIONAL/RESOLVE ADAPTIVE ASSET ALLOCATION FUND |
| CONSOLIDATED SCHEDULE OF INVESTMENTS (Continued) |
| December 31, 2022 |
OPEN FUTURES CONTRACTS (Continued)
| Number of | | | | | | | | | | Value and Unrealized | |
| Contracts | | | Open Long Futures Contracts | | Expiration | | Notional Amount(c) | | | Appreciation (Depreciation) | |
| | 46 | | | ICE Gas Oil Future(d) | | 02/10/2023 | | $ | 4,167,600 | | | $ | (95,325 | ) |
| | 12 | | | Euro-BTP Italian Bond Futures | | 03/08/2023 | | | 1,399,550 | | | | (101,876 | ) |
| | 135 | | | Long Gilt Future | | 03/29/2023 | | | 16,303,402 | | | | (501,888 | ) |
| | 80 | | | MEFF Madrid IBEX 35 Index Future | | 01/20/2023 | | | 7,019,424 | | | | (64,932 | ) |
| | 54 | | | Montreal Exchange 10 Year Canadian Bond Future | | 03/22/2023 | | | 4,887,699 | | | | (25,504 | ) |
| | 9 | | | NYBOT CSC C Coffee Future(d) | | 03/21/2023 | | | 564,638 | | | | (17,588 | ) |
| | 1,684 | | | NYBOT CSC Number 11 World Sugar Future(d) | | 02/28/2023 | | | 37,797,043 | | | | 1,100,523 | |
| | 34 | | | NYMEX Light Sweet Crude Oil Future(d) | | 01/20/2023 | | | 2,728,840 | | | | 26,380 | |
| | 13 | | | NYMEX NY Harbor ULSD Futures(d) | | 01/31/2023 | | | 1,799,070 | | | | 75,755 | |
| | 58 | | | NYMEX Reformulated Gasoline Blendstock for Oxygen(d) | | 01/31/2023 | | | 6,037,139 | | | | 510,040 | |
| | 54 | | | SFE S&P ASX Share Price Index 200 Future | | 03/16/2023 | | | 6,426,033 | | | | (37,803 | ) |
| | 161 | | | SGX FTSE China A50 Futures Contract | | 01/30/2023 | | | 2,106,524 | | | | 36,227 | |
| | 47 | | | SGX Nifty 50 Index Futures | | 01/25/2023 | | | 1,712,962 | | | | 2,926 | |
| | 12 | | | SGX Nikkei 225 Stock Index Future | | 03/09/2023 | | | 1,188,243 | | | | (63,626 | ) |
| | 108 | | | TSE TOPIX (Tokyo Price Index) Future | | 03/09/2023 | | | 15,563,038 | | | | (443,477 | ) |
| | | | | TOTAL FUTURES CONTRACTS | | | | | | | | $ | (750,449 | ) |
| | | | | | | | | | | | | | | |
| OPEN FUTURES CONTRACTS | | | |
| | | | | | | | | | | | | | | |
| Number of | | | | | | | | | | Value and Unrealized | |
| Contracts | | | Open Short Futures Contracts | | Expiration | | Notional Amount(c) | | | Appreciation (Depreciation) | |
| | 33 | | | Carbon Emissions Future(d) | | 12/18/2023 | | $ | 2,967,138 | | | $ | 197,055 | |
| | 88 | | | CBOT 10 Year US Treasury Note | | 03/22/2023 | | | 9,882,136 | | | | 57,802 | |
| | 155 | | | CBOT 5 Year US Treasury Note | | 03/31/2023 | | | 16,729,150 | | | | 185,077 | |
| | 88 | | | CBOT Soybean Oil Future(d) | | 03/14/2023 | | | 3,382,896 | | | | 49,740 | |
| | 191 | | | CBOT Wheat Future(d) | | 03/14/2023 | | | 7,563,600 | | | | (183,125 | ) |
| | 228 | | | CME Australian Dollar Currency Future | | 03/13/2023 | | | 15,568,980 | | | | (86,016 | ) |
| | 182 | | | CME British Pound Currency Future | | 03/13/2023 | | | 13,745,550 | | | | (5,456 | ) |
| | 44 | | | CME E-Mini NASDAQ 100 Index Future | | 03/17/2023 | | | 9,699,624 | | | | 26,651 | |
| | 92 | | | CME Japanese Yen Currency Future | | 03/13/2023 | | | 8,863,050 | | | | (186,663 | ) |
| | 190 | | | CME Swiss Franc Currency Future | | 03/13/2023 | | | 25,892,250 | | | | (71,894 | ) |
| | 26 | | | COMEX Copper Future(d) | | 03/29/2023 | | | 2,476,825 | | | | 15,650 | |
| | 20 | | | COMEX Gold 100 Troy Ounces Future(d) | | 02/24/2023 | | | 3,652,400 | | | | (18,360 | ) |
| | 270 | | | Eurex 5 Year Euro BOBL Future | | 03/08/2023 | | | 33,464,504 | | | | 969,538 | |
| | 83 | | | KCBT Hard Red Winter Wheat Future(d) | | 03/14/2023 | | | 3,685,200 | | | | (69,550 | ) |
| | 26 | | | Montreal Exchange S&P/TSX 60 Index Future | | 03/16/2023 | | | 4,493,135 | | | | 135,197 | |
| | 90 | | | NYBOT CSC Cocoa Future(d) | | 03/16/2023 | | | 2,340,000 | | | | (10,550 | ) |
| | 27 | | | NYBOT CTN Number 2 Cotton Future(d) | | 03/09/2023 | | | 1,125,495 | | | | 1,720 | |
| | 81 | | | NYMEX Henry Hub Natural Gas Futures(d) | | 01/27/2023 | | | 3,624,750 | | | | 472,030 | |
| | 32 | | | NYMEX Platinum Future(d) | | 04/26/2023 | | | 1,732,640 | | | | (125,335 | ) |
| | | | | TOTAL FUTURES CONTRACTS | | | | | | | | $ | 1,353,511 | |
| (b) | Rate disclosed is the seven day effective yield as of December 31, 2022. |
| (c) | The amounts shown are the underlying reference notional amounts to stock exchange indices and equities upon which the fair value of the futures contracts held by the Fund are based. Notional values do not represent the current fair value of, and are not necessarily indicative of the future cash flows of the Fund’s futures contracts. Further, the underlying price changes in relation to the variables specified by the notional values affects the fair value of these derivative financial instruments. The notional values as set forth within this schedule do not purport to represent economic value at risk to the Fund. |
| (d) | All or a portion of this investment is a holding of the RDMF Fund Ltd. |
See accompanying notes which are an integral part of these consolidated financial statements.
| RATIONAL/PIER 88 CONVERTIBLE SECURITIES FUND |
| SCHEDULE OF INVESTMENTS |
| December 31, 2022 |
| Shares | | | | | | | | | Fair Value | |
| | | | | COMMON STOCKS — 6.5% | | | | | | | | |
| | | | | ENGINEERING & CONSTRUCTION - 3.1% | | | | | | | | |
| | 62,803 | | | KBR, Inc. | | | | | | $ | 3,315,999 | |
| | | | | | | | | | | | | |
| | | | | OIL & GAS PRODUCERS - 2.3% | | | | | | | | |
| | 11,000 | | | Pioneer Natural Resources Company | | | | | | | 2,512,290 | |
| | | | | | | | | | | | | |
| | | | | WHOLESALE - CONSUMER STAPLES - 1.1% | | | | | | | | |
| | 12,182 | | | Bunge Ltd. | | | | | | | 1,215,398 | |
| | | | | | | | | | | | | |
| | | | | TOTAL COMMON STOCKS (Cost $6,547,761) | | | | | | | 7,043,687 | |
| | | | | | | | | | | | | |
| | | | | | | Coupon Rate | | | | | | |
| | | | | | | (%) | | Maturity | | | | |
| | | | | PREFERRED STOCKS — 34.5% | | | | | | | | |
| | | | | ASSET MANAGEMENT — 2.3% | | | | | | | | |
| | 17,000 | | | AMG Capital Trust II | | 5.1500 | | 10/15/37 | | | 875,500 | |
| | 28,900 | | | KKR & Company, Inc. | | 6.0000 | | 09/15/23 | | | 1,654,525 | |
| | | | | | | | | | | | 2,530,025 | |
| | | | | BANKING — 9.1% | | | | | | | | |
| | 4,248 | | | Bank of America Corporation | | 7.1250 | | Perpetual | | | 4,927,680 | |
| | 4,183 | | | Wells Fargo & Company - Series L | | 7.5000 | | Perpetual | | | 4,956,855 | |
| | | | | | | | | | | | 9,884,535 | |
| | | | | ELECTRIC UTILITIES — 5.2% | | | | | | | | |
| | 85,000 | | | NextEra Energy, Inc. | | 6.2190 | | | | | 4,291,650 | |
| | 25,118 | | | NextEra Energy, Inc. | | 5.2790 | | 09/01/22 | | | 1,273,483 | |
| | | | | | | | | | | | 5,565,133 | |
| | | | | GAS & WATER UTILITIES — 4.7% | | | | | | | | |
| | 49,300 | | | NiSource, Inc. | | 7.7500 | | | | | 5,139,525 | |
| | | | | | | | | | | | | |
| | | | | MEDICAL EQUIPMENT & DEVICES — 13.2% | | | | | | | | |
| | 90,000 | | | Becton Dickinson and Company | | 6.0000 | | | | | 4,507,200 | |
| | 42,135 | | | Boston Scientific Corporation | | 5.5000 | | 06/01/23 | | | 4,839,308 | |
| | 3,645 | | | Danaher Corporation | | 5.0000 | | 04/01/23 | | | 4,947,452 | |
| | | | | | | | | | | | 14,293,960 | |
| | | | | | | | | | | | | |
| | | | | TOTAL PREFERRED STOCKS (Cost $38,402,657) | | | | | | | 37,413,178 | |
See accompanying notes which are an integral part of these financial statements.
| RATIONAL/PIER 88 CONVERTIBLE SECURITIES FUND |
| SCHEDULE OF INVESTMENTS (Continued) |
| December 31, 2022 |
| Principal | | | | | Coupon Rate | | | | | |
| Amount ($) | | | | | (%) | | Maturity | | Fair Value | |
| | | | | CONVERTIBLE BONDS — 49.6% | | | | | | | | |
| | | | | ASSET MANAGEMENT — 3.1% | | | | | | | | |
| | 3,170,000 | | | Ares Capital Corporation | | 4.6250 | | 03/01/24 | | $ | 3,362,181 | |
| | | | | | | | | | | | | |
| | | | | CONSUMER SERVICES — 1.5% | | | | | | | | |
| | 2,027,000 | | | Chegg, Inc.(a) | | 0.0000 | | 09/01/26 | | | 1,589,979 | |
| | | | | | | | | | | | | |
| | | | | E-COMMERCE DISCRETIONARY — 3.0% | | | | | | | | |
| | 3,900,000 | | | Etsy, Inc. | | 0.2500 | | 06/15/28 | | | 3,329,820 | |
| | | | | | | | | | | | | |
| | | | | HEALTH CARE FACILITIES & SERVICES — 3.8% | | | | | | | | |
| | 570,000 | | | Anthem, Inc. | | 2.7500 | | 10/15/42 | | | 4,168,239 | |
| | | | | | | | | | | | | |
| | | | | INTERNET MEDIA & SERVICES — 3.5% | | | | | | | | |
| | 4,395,000 | | | Expedia Group, Inc.(a) | | 0.0000 | | 02/15/26 | | | 3,827,731 | |
| | | | | | | | | | | | | |
| | | | | MEDICAL EQUIPMENT & DEVICES — 10.3% | | | | | | | | |
| | 4,990,000 | | | Dexcom, Inc. | | 0.2500 | | 11/15/25 | | | 5,426,625 | |
| | 2,220,000 | | | Insulet Corporation | | 0.3750 | | 09/01/26 | | | 3,134,640 | |
| | 2,670,000 | | | NuVasive, Inc. | | 1.0000 | | 06/01/23 | | | 2,613,263 | |
| | | | | | | | | | | | 11,174,528 | |
| | | | | SEMICONDUCTORS — 2.4% | | | | | | | | |
| | 1,930,000 | | | ON Semiconductor Corporation(a) | | 0.0000 | | 05/01/27 | | | 2,557,250 | |
| | | | | | | | | | | | | |
| | | | | SOFTWARE — 14.7% | | | | | | | | |
| | 3,640,000 | | | Alteryx, Inc. | | 1.0000 | | 08/01/26 | | | 3,021,200 | |
| | 3,345,000 | | | CyberArk Software Ltd.(a) | | 0.0000 | | 11/15/24 | | | 3,539,585 | |
| | 1,130,000 | | | DocuSign, Inc.(a) | | 0.0000 | | 01/15/24 | | | 1,062,200 | |
| | 979,000 | | | Okta, Inc. | | 0.3750 | | 06/15/26 | | | 822,360 | |
| | 2,970,000 | | | PROS Holdings, Inc. | | 1.0000 | | 05/15/24 | | | 2,747,136 | |
See accompanying notes which are an integral part of these financial statements.
| RATIONAL/PIER 88 CONVERTIBLE SECURITIES FUND |
| SCHEDULE OF INVESTMENTS (Continued) |
| December 31, 2022 |
| Principal | | | | | Coupon Rate | | | | | |
| Amount ($) | | | | | (%) | | Maturity | | Fair Value | |
| | | | | CONVERTIBLE BONDS — 49.6% (Continued) | | | | | | | | |
| | | | | SOFTWARE — 14.7% (Continued) | | | | | | | | |
| | 5,600,000 | | | Splunk, Inc. | | 1.1250 | | 06/15/27 | | $ | 4,725,280 | |
| | | | | | | | | | | | 15,917,761 | |
| | | | | TECHNOLOGY HARDWARE — 3.4% | | | | | | | | |
| | 3,913,080 | | | Western Digital Corporation B | | 1.5000 | | 02/01/24 | | | 3,727,209 | |
| | | | | | | | | | | | | |
| | | | | TECHNOLOGY SERVICES — 3.9% | | | | | | | | |
| | 4,470,928 | | | Euronet Worldwide, Inc. | | 0.7500 | | 03/15/49 | | | 4,227,821 | |
| | | | | | | | | | | | | |
| | | | | TOTAL CONVERTIBLE BONDS (Cost $54,744,034) | | | | | | | 53,882,519 | |
| | | | | | | | | | | | | |
| | | | | TOTAL INVESTMENTS — 90.6% (Cost $99,694,452) | | | | | | $ | 98,339,384 | |
| | | | | OTHER ASSETS IN EXCESS OF LIABILITIES- 9.4% | | | | | | | 10,182,251 | |
| | | | | NET ASSETS - 100.0% | | | | | | $ | 108,521,635 | |
See accompanying notes which are an integral part of these financial statements.
| RATIONAL SPECIAL SITUATIONS INCOME FUND |
| SCHEDULE OF INVESTMENTS |
| December 31, 2022 |
| Principal | | | | | | | Coupon Rate | | | | | |
| Amount ($) | | | | | Spread | | (%) | | Maturity | | Fair Value | |
| | | | | ASSET BACKED SECURITIES — 78.2% | | | | | | | | | | |
| | | | | AGENCY CMBS — 0.3% | | | | | | | | | | |
| | 28,408,610 | | | Ginnie Mae Strip (a) | | | | 1.4000 | | 09/16/45 | | $ | 2,235,956 | |
| | 1,413,967 | | | Government National Mortgage Association (a),(b) | | | | 0.0250 | | 08/16/48 | | | 883 | |
| | | | | | | | | | | | | | 2,236,839 | |
| | | | | AUTO LOAN — 0.6% | | | | | | | | | | |
| | 5,000,000 | | | CAL Receivables 2022-1, LLC (c),(d) | | SOFR30A + 4.350% | | 8.1570 | | 10/15/26 | | | 4,883,685 | |
| | | | | | | | | | | | | | | |
| | | | | CDO — 1.6% | | | | | | | | | | |
| | 169,806 | | | Ansonia CDO 2006-1 Ltd. (c),(d) | | US0001M + 0.300% | | 0.4090 | | 07/28/46 | | | 168,039 | |
| | 86,407 | | | Ansonia CDO 2006-1 Ltd. (c) | | | | 5.7020 | | 07/28/46 | | | 82,400 | |
| | 1,041,645 | | | Aspen Funding I Ltd. (c) (g) | | | | 9.0600 | | 07/10/37 | | | 1,045,350 | |
| | 10,000,000 | | | Bleecker Structured Asset Funding Ltd. (g) | | | | 4.6430 | | 04/01/35 | | | 726,020 | |
| | 7,884,958 | | | Capitalsource Real Estate Loan Trust (c),(d) | | US0003M + 0.650% | | 4.5590 | | 01/20/37 | | | 7,534,393 | |
| | 3,172,367 | | | Nomura CRE CDO 2007-2 Ltd. (c),(d) | | US0003M + 0.450% | | 0.0001 | | 05/21/42 | | | 681,424 | |
| | 2,000,000 | | | Taberna Preferred Funding II Ltd. (c),(d), (g) | | US0003M + 0.650% | | 5.1820 | | 11/05/35 | | | 1,318,360 | |
| | 417,788 | | | Wachovia Repackaged Asset Participating Securities (c),(d) | | US0003M + 0.550% | | 5.1000 | | 02/08/35 | | | 363,475 | |
| | 638,819 | | | Wachovia Repackaged Asset Participating Securities (c),(d) | | US0003M + 0.550% | | 5.1000 | | 02/08/35 | | | 491,891 | |
| | | | | | | | | | | | | | 12,411,352 | |
| | | | | COLLATERALIZED MORTGAGE OBLIGATIONS — 31.3% | | | | | | | | | | |
| | 130,708 | | | ABN Amro Mortgage Corporation | | | | 5.7500 | | 12/25/32 | | | 123,422 | |
| | 52,743 | | | ABN Amro Mortgage Corporation | | | | 5.7500 | | 02/25/33 | | | 49,366 | |
| | 41,890 | | | Adjustable Rate Mortgage Trust 2004-5 (b) | | | | 3.5130 | | 04/25/35 | | | 40,400 | |
| | 394,114 | | | Adjustable Rate Mortgage Trust 2005-10 (b) | | | | 3.1330 | | 01/25/36 | | | 356,643 | |
| | 153,550 | | | Adjustable Rate Mortgage Trust 2005-10 (b) | | | | 3.1330 | | 01/25/36 | | | 139,981 | |
| | 112,202 | | | Adjustable Rate Mortgage Trust 2005-10 (b) | | | | 3.8450 | | 01/25/36 | | | 96,724 | |
| | 123,931 | | | Adjustable Rate Mortgage Trust 2005-10 (d) | | US0001M + 0.540% | | 4.9290 | | 01/25/36 | | | 111,651 | |
| | 139,995 | | | Adjustable Rate Mortgage Trust 2005-2 (b) | | | | 3.8120 | | 06/25/35 | | | 130,928 | |
| | 76,372 | | | Adjustable Rate Mortgage Trust 2005-4 (b) | | | | 2.7570 | | 08/25/35 | | | 56,080 | |
| | 474,062 | | | Adjustable Rate Mortgage Trust 2005-5 (b) | | | | 3.3610 | | 09/25/35 | | | 398,058 | |
| | 225,324 | | | Adjustable Rate Mortgage Trust 2005-6A (d) | | US0001M + 0.520% | | 4.9090 | | 11/25/35 | | | 188,743 | |
| | 252,946 | | | Adjustable Rate Mortgage Trust 2005-6A (d) | | US0001M + 0.540% | | 4.9290 | | 11/25/35 | | | 211,593 | |
| | 11,936 | | | Alternative Loan Trust 2003-4CB | | | | 5.7500 | | 04/25/33 | | | 11,374 | |
See accompanying notes which are an integral part of these financial statements.
| RATIONAL SPECIAL SITUATIONS INCOME FUND |
| SCHEDULE OF INVESTMENTS (Continued) |
| December 31, 2022 |
| Principal | | | | | | | Coupon Rate | | | | | |
| Amount ($) | | | | | Spread | | (%) | | Maturity | | Fair Value | |
| | | | | ASSET BACKED SECURITIES — 78.2% (Continued) | | | | | | | | | | |
| | | | | COLLATERALIZED MORTGAGE OBLIGATIONS — 31.3% (Continued) | | | | | | | | | | |
| | 86,952 | | | Alternative Loan Trust 2003-J3 | | | | 5.2500 | | 11/25/33 | | $ | 83,676 | |
| | 503,651 | | | Alternative Loan Trust 2004-2CB | | | | 5.0000 | | 08/25/54 | | | 480,371 | |
| | 73,279 | | | Alternative Loan Trust 2005-17 (d) | | US0001M + 0.280% | | 4.9490 | | 07/25/35 | | | 45,798 | |
| | 541,832 | | | Alternative Loan Trust 2005-43 (b) | | | | 4.1490 | | 09/25/35 | | | 456,811 | |
| | 72,072 | | | Alternative Loan Trust 2005-51 (d) | | US0001M + 0.600% | | 4.9530 | | 11/20/35 | | | 64,072 | |
| | 30,888 | | | Alternative Loan Trust 2005-63 (b) | | | | 3.9390 | | 12/25/35 | | | 26,872 | |
| | 699,292 | | | Alternative Loan Trust 2006-32CB (a),(d) | | US0001M + 5.330% | | 0.9410 | | 11/25/36 | | | 55,660 | |
| | 421,260 | | | Alternative Loan Trust 2006-32CB (d) | | US0001M + 0.670% | | 5.0590 | | 11/25/36 | | | 221,035 | |
| | 1,583,064 | | | Alternative Loan Trust 2006-J6 (a),(d) | | US0001M + 5.500% | | 1.1110 | | 09/25/36 | | | 138,325 | |
| | 1,297,594 | | | Alternative Loan Trust 2006-J6 (d) | | US0001M + 0.500% | | 2.9040 | | 09/25/36 | | | 545,127 | |
| | 197,066 | | | Alternative Loan Trust 2006-OA7 (d) | | US0001M + 0.420% | | 4.8090 | | 06/25/46 | | | 138,489 | |
| | 20 | | | Alternative Loan Trust 2006-OC11(d) | | US0001M + 0.340% | | 4.7290 | | 01/25/37 | | | 3,009 | |
| | 310,515 | | | Alternative Loan Trust 2007-5CB (e) | | | | — | | 04/25/37 | | | 50,874 | |
| | 382,731 | | | Alternative Loan Trust 2007-5CB (a),(d) | | US0001M + 5.650% | | 1.2610 | | 04/25/37 | | | 48,579 | |
| | 394,890 | | | American Home Mortgage Assets Trust 2006-1 (d) | | US0001M + 0.190% | | 4.5790 | | 05/25/46 | | | 318,870 | |
| | 8,908 | | | American Home Mortgage Investment Trust 2004-1 (d) | | US0001M + 0.900% | | 5.2890 | | 04/25/44 | | | 8,804 | |
| | 26,138 | | | American Home Mortgage Investment Trust 2004-3 (d) | | US0006M + 1.500% | | 3.6040 | | 10/25/34 | | | 25,893 | |
| | 26,116 | | | American Home Mortgage Investment Trust 2004-4 (f) | | | | 6.0000 | | 02/25/45 | | | 25,436 | |
| | 24,035 | | | American Home Mortgage Investment Trust 2005-1 (d) | | US0006M + 2.000% | | 6.8750 | | 06/25/45 | | | 23,637 | |
| | 4,638,001 | | | American Home Mortgage Investment Trust 2005-2 (f) | | | | 5.8280 | | 09/25/35 | | | 3,480,080 | |
| | 910,722 | | | American Home Mortgage Investment Trust 2005-4 (d) | | US0006M + 1.750% | | 2.0380 | | 11/25/45 | | | 426,086 | |
| | 428,833 | | | American Home Mortgage Investment Trust 2006-2 (d) | | US0001M + 0.220% | | 0.9730 | | 06/25/36 | | | 56,141 | |
| | 549,758 | | | American Home Mortgage Investment Trust 2006-3 (d) | | US0001M + 0.380% | | 4.7690 | | 12/25/46 | | | 508,534 | |
| | 1,198,919 | | | American Home Mortgage Investment Trust 2007-1 (d) | | US0001M + 0.160% | | 4.5490 | | 05/25/47 | | | 784,722 | |
| | 618,408 | | | Banc of America Alternative Loan Trust 2006-4 (a),(d) | | US0001M + 5.150% | | 0.7610 | | 05/25/46 | | | 29,991 | |
| | 612,796 | | | Banc of America Alternative Loan Trust 2006-4 (d) | | US0001M + 0.850% | | 5.2390 | | 05/25/46 | | | 525,586 | |
| | 335,835 | | | Banc of America Alternative Loan Trust 2006-4 | | | | 6.0000 | | 05/25/46 | | | 268,899 | |
| | 271,021 | | | Banc of America Alternative Loan Trust 2006-4 | | | | 6.0000 | | 05/25/46 | | | 217,003 | |
| | 313,659 | | | Banc of America Alternative Loan Trust 2006-4 | | | | 6.0000 | | 05/25/46 | | | 251,143 | |
| | 463,547 | | | Banc of America Funding 2004-B Trust (b) | | | | 2.3120 | | 12/20/34 | | | 367,402 | |
See accompanying notes which are an integral part of these financial statements.
| RATIONAL SPECIAL SITUATIONS INCOME FUND |
| SCHEDULE OF INVESTMENTS (Continued) |
| December 31, 2022 |
| Principal | | | | | | | Coupon Rate | | | | | |
| Amount ($) | | | | | Spread | | (%) | | Maturity | | Fair Value | |
| | | | | ASSET BACKED SECURITIES — 78.2% (Continued) | | | | | | | | | | |
| | | | | COLLATERALIZED MORTGAGE OBLIGATIONS — 31.3% (Continued) | | | | | | | | | | |
| | 56,204 | | | Banc of America Funding 2005-8 Trust (e) | | | | — | | 01/25/36 | | $ | 36,176 | |
| | 183,212 | | | Banc of America Funding 2005-B Trust (b) | | | | 3.4260 | | 04/20/35 | | | 156,536 | |
| | 1,746,968 | | | Banc of America Funding 2005-E Trust (b) | | | | 3.2420 | | 05/20/35 | | | 1,510,877 | |
| | 122,549 | | | Banc of America Funding 2005-E Trust (d) | | COF 11 + 1.430% | | 3.4780 | | 06/20/35 | | | 90,162 | |
| | 1,582,382 | | | Banc of America Funding 2006-A Trust (b) | | | | 3.4260 | | 02/20/36 | | | 1,394,677 | |
| | 1,184,904 | | | Banc of America Funding 2006-A Trust (b) | | | | 3.7820 | | 02/20/36 | | | 954,985 | |
| | 178,291 | | | Banc of America Funding 2006-B Trust (b) | | | | 2.3710 | | 03/20/36 | | | 160,142 | |
| | 504,580 | | | Banc of America Funding 2006-B Trust (b) | | | | 2.6060 | | 03/20/36 | | | 413,603 | |
| | 142,280 | | | Banc of America Funding 2006-C Trust (b) | | | | 3.1620 | | 04/20/36 | | | 117,413 | |
| | 583,197 | | | Banc of America Funding 2006-D Trust (b) | | | | 3.4990 | | 05/20/36 | | | 500,379 | |
| | 473,222 | | | Banc of America Funding 2006-F Trust (b) | | | | 3.3090 | | 07/20/36 | | | 398,465 | |
| | 24,630 | | | Banc of America Funding 2006-G Trust (d) | | US0012M + 1.750% | | 7.3030 | | 07/20/36 | | | 23,882 | |
| | 99,737 | | | Banc of America Funding 2006-I Trust (b) | | | | 2.9170 | | 10/20/46 | | | 77,258 | |
| | 67,653 | | | Banc of America Funding 2007-4 Trust | | | | 5.5000 | | 11/25/34 | | | 59,660 | |
| | 74,610 | | | Banc of America Funding 2007-7 Trust (e) | | | | — | | 09/25/37 | | | 33,452 | |
| | 452,540 | | | Banc of America Funding 2007-8 Trust | | | | 6.0000 | | 01/25/23 | | | 227,595 | |
| | 94,831 | | | Banc of America Funding 2007-C Trust (d) | | US0001M + 0.540% | | 4.8930 | | 05/20/47 | | | 90,209 | |
| | 781,887 | | | Banc of America Funding 2016-R2 Trust (b),(c) | | | | 4.7000 | | 05/01/33 | | | 753,163 | |
| | 1,389,697 | | | Banc of America Funding Corporation (b) | | | | 4.0920 | | 09/25/48 | | | 1,313,071 | |
| | 49,939 | | | Banc of America Mortgage 2005-A Trust (b) | | | | 2.5420 | | 02/25/35 | | | 47,527 | |
| | 443,374 | | | Banc of America Mortgage 2005-G Trust (b) | | | | 3.7640 | | 08/25/35 | | | 394,228 | |
| | 518,406 | | | Banc of America Mortgage 2005-I Trust (b) | | | | 4.2250 | | 10/25/35 | | | 493,339 | |
| | 102,469 | | | Banc of America Mortgage 2006-A Trust (b) | | | | 3.3670 | | 02/25/36 | | | 84,495 | |
| | 76,854 | | | Banc of America Mortgage 2006-B Trust (b) | | | | 3.8730 | | 11/20/46 | | | 67,642 | |
| | 21,757 | | | Banc of America Mortgage Trust 2005-3 | | | | 5.5000 | | 03/25/35 | | | 18,612 | |
| | 178,992 | | | Bayview Commercial Asset Trust 2005-3 (c),(d) | | US0001M + 0.960% | | 5.3490 | | 11/25/35 | | | 159,728 | |
| | 2,203,552 | | | BCAP, LLC 2009-RR10 Trust (b),(c) | | | | 5.9960 | | 02/26/36 | | | 2,000,252 | |
| | 2,456,421 | | | BCAP, LLC 2010-RR11-I Trust (b),(c) | | | | 3.2190 | | 06/27/36 | | | 2,322,637 | |
| | 2,564,007 | | | BCAP, LLC 2011-RR4-I Trust (c) | | | | 5.2500 | | 04/26/37 | | | 1,508,997 | |
| | 4,203,428 | | | BCAP, LLC 2013-RR7 Trust (b),(c) | | | | 3.5800 | | 12/27/34 | | | 3,641,133 | |
| | 42,482 | | | BCAP, LLC Trust 2007-AA2 | | | | 6.0000 | | 01/25/23 | | | 41,871 | |
| | 161,782 | | | Bear Stearns ALT-A Trust 2004-12 (b) | | | | 3.6400 | | 01/25/35 | | | 146,475 | |
| | 9,425 | | | Bear Stearns ALT-A Trust 2004-9 (b) | | | | 4.8140 | | 09/25/34 | | | 9,100 | |
| | 100,164 | | | Bear Stearns ALT-A Trust 2005-10 (b) | | | | 3.6230 | | 01/25/36 | | | 90,524 | |
See accompanying notes which are an integral part of these financial statements.
| RATIONAL SPECIAL SITUATIONS INCOME FUND |
| SCHEDULE OF INVESTMENTS (Continued) |
| December 31, 2022 |
| Principal | | | | | | | Coupon Rate | | | | | |
| Amount ($) | | | | | Spread | | (%) | | Maturity | | Fair Value | |
| | | | | ASSET BACKED SECURITIES — 78.2% (Continued) | | | | | | | | | | |
| | | | | COLLATERALIZED MORTGAGE OBLIGATIONS — 31.3% (Continued) | | | | | | | | | | |
| | 4,835,168 | | | Bear Stearns ALT-A Trust 2005-10 (d) | | US0001M + 0.500% | | 4.8890 | | 01/25/36 | | $ | 6,182,633 | |
| | 49,919 | | | Bear Stearns ALT-A Trust 2005-4 (b) | | | | 3.2450 | | 05/25/35 | | | 47,631 | |
| | 2,918,015 | | | Bear Stearns ALT-A Trust 2006-1 (d) | | US0001M + 0.480% | | 4.8690 | | 02/25/36 | | | 2,837,008 | |
| | 1,830,092 | | | Bear Stearns ALT-A Trust 2006-2 (d) | | US0001M + 0.440% | | 4.8290 | | 04/25/36 | | | 2,502,729 | |
| | 93,229 | | | Bear Stearns ALT-A Trust 2006-3 (b) | | | | 3.2650 | | 05/25/36 | | | 67,095 | |
| | 447,204 | | | Bear Stearns ALT-A Trust 2006-3 (b) | | | | 3.3230 | | 05/25/36 | | | 256,011 | |
| | 194,637 | | | Bear Stearns ALT-A Trust 2006-3 (d) | | US0001M + 0.380% | | 4.7690 | | 05/25/36 | | | 209,252 | |
| | 41,216 | | | Bear Stearns ALT-A Trust II 2007-1 (b) | | | | 3.5760 | | 09/25/47 | | | 21,406 | |
| | 45,280 | | | Bear Stearns ARM Trust 2003-8 (b) | | | | 2.3200 | | 01/25/34 | | | 41,306 | |
| | 10,592 | | | Bear Stearns ARM Trust 2004-1 (b) | | | | 3.2570 | | 04/25/34 | | | 10,117 | |
| | 61,271 | | | Bear Stearns ARM Trust 2004-10 (b) | | | | 3.9650 | | 01/25/35 | | | 55,319 | |
| | 389,472 | | | Bear Stearns ARM Trust 2004-9 (b) | | | | 2.1580 | | 11/25/34 | | | 359,773 | |
| | 225,914 | | | Bear Stearns ARM Trust 2005-3 (b) | | | | 3.9330 | | 06/25/35 | | | 214,208 | |
| | 305,029 | | | Bear Stearns ARM Trust 2005-6 (b) | | | | 3.8840 | | 08/25/35 | | | 273,542 | |
| | 988,725 | | | Bear Stearns ARM Trust 2006-4 (b) | | | | 4.1300 | | 10/25/36 | | | 867,178 | |
| | 51,095 | | | Bear Stearns ARM Trust 2007-5 (b) | | | | 3.6890 | | 08/25/47 | | | 44,772 | |
| | 3,402,823 | | | Bear Stearns ARM Trust 2007-5 (b) | | | | 4.0260 | | 08/25/47 | | | 3,012,096 | |
| | 174,468 | | | Bear Stearns Asset Backed Securities I Trust (d) | | US0001M + 1.000% | | 5.3890 | | 08/25/35 | | | 121,096 | |
| | 11,137 | | | Bear Stearns Asset Backed Securities Trust (f) | | | | 5.2500 | | 10/25/33 | | | 10,780 | |
| | 29,304 | | | Bear Stearns Asset Backed Securities Trust (f) | | | | 5.7500 | | 10/25/33 | | | 29,556 | |
| | 858,692 | | | Bear Stearns Mortgage Funding Trust 2006-SL5 (d) | | US0001M + 0.300% | | 4.3160 | | 12/25/36 | | | 985,440 | |
| | 46,935 | | | Bear Stearns Mortgage Securities, Inc. (b) | | | | 6.4260 | | 03/25/31 | | | 46,251 | |
| | 8,019 | | | Bear Stearns Mortgage Securities, Inc. (b) | | | | 6.4260 | | 03/25/31 | | | 7,787 | |
| | 37,283,446 | | | CBASS 1248MKAB1 DEL TR 2011-1 (c),(d) | | US0001M + 0.460% | | 0.0860 | | 02/25/37 | | | 845,022 | |
| | 181,239 | | | Chase Mortgage Finance Trust | | | | 5.0000 | | 05/25/35 | | | 181,549 | |
| | 1,092,402 | | | ChaseFlex Trust Series 2005-2 | | | | 7.5000 | | 06/25/35 | | | 671,336 | |
| | 41,031 | | | CHL Mortgage Pass-Through Trust 2003-56 (b) | | | | 4.0890 | | 12/25/33 | | | 37,080 | |
| | 345,311 | | | CHL Mortgage Pass-Through Trust 2004-14 (b) | | | | 3.9150 | | 08/25/34 | | | 305,754 | |
| | 282,212 | | | CHL Mortgage Pass-Through Trust 2004-2 (b) | | | | 2.7470 | | 02/25/34 | | | 241,619 | |
| | 272,831 | | | CHL Mortgage Pass-Through Trust 2004-5 | | | | 5.0000 | | 05/25/34 | | | 262,277 | |
| | 1,532,349 | | | CHL Mortgage Pass-Through Trust 2004-7 (b) | | | | 0.4880 | | 05/25/34 | | | 281,163 | |
| | 89,275 | | | CHL Mortgage Pass-Through Trust 2004-7 (b) | | | | 3.1610 | | 06/25/34 | | | 82,269 | |
| | 45,701 | | | CHL Mortgage Pass-Through Trust 2004-8 (e) | | | | — | | 07/25/34 | | | 31,121 | |
| | 1,985 | | | CHL Mortgage Pass-Through Trust 2005-11 (d) | | US0001M + 0.320% | | 4.7090 | | 04/25/35 | | | 1,047 | |
See accompanying notes which are an integral part of these financial statements.
| RATIONAL SPECIAL SITUATIONS INCOME FUND |
| SCHEDULE OF INVESTMENTS (Continued) |
| December 31, 2022 |
| Principal | | | | | | | Coupon Rate | | | | | |
| Amount ($) | | | | | Spread | | (%) | | Maturity | | Fair Value | |
| | | | | ASSET BACKED SECURITIES — 78.2% (Continued) | | | | | | | | | | |
| | | | | COLLATERALIZED MORTGAGE OBLIGATIONS — 31.3% (Continued) | | | | | | | | | | |
| | 156,157 | | | CHL Mortgage Pass-Through Trust 2005-15 | | | | 5.1000 | | 08/25/35 | | $ | 147,448 | |
| | 1,881 | | | CHL Mortgage Pass-Through Trust 2005-7 (d) | | US0001M + 0.720% | | 6.7240 | | 03/25/35 | | | 616 | |
| | 126,920 | | | CHL Mortgage Pass-Through Trust 2005-HYB6 (b) | | | | 2.9640 | | 10/20/35 | | | 115,119 | |
| | 256,301 | | | CHL Mortgage Pass-Through Trust 2005-J2 | | | | 5.0000 | | 08/25/35 | | | 156,634 | |
| | 93,451 | | | Citicorp Mortgage Securities Trust Series 2006-1 | | | | 6.0000 | | 02/25/36 | | | 87,173 | |
| | 269,307 | | | Citicorp Mortgage Securities, Inc. | | | | 5.5000 | | 03/25/35 | | | 255,494 | |
| | 6,003 | | | Citigroup Global Markets Mortgage Securities VII (b) | | | | 4.6110 | | 10/25/23 | | | 5,922 | |
| | 113,583 | | | Citigroup Mortgage Loan Trust 2004-HYB2 (b) | | | | 2.9820 | | 03/25/34 | | | 102,231 | |
| | 30,676 | | | Citigroup Mortgage Loan Trust 2005-11 (d) | | H15T1Y + 2.400% | | 6.4700 | | 11/25/35 | | | 29,084 | |
| | 480,851 | | | Citigroup Mortgage Loan Trust 2006-AR2 (b) | | | | 2.9440 | | 03/25/36 | | | 444,782 | |
| | 99,786 | | | Citigroup Mortgage Loan Trust 2006-AR5 (b) | | | | 3.1990 | | 07/25/36 | | | 105,210 | |
| | 1,692,258 | | | Citigroup Mortgage Loan Trust 2008-RR1 (c),(d) | | US0001M + 0.070% | | 4.4590 | | 01/25/37 | | | 1,530,224 | |
| | 331,065 | | | Citigroup Mortgage Loan Trust 2009-4 (b),(c) | | | | 5.4760 | | 05/25/35 | | | 297,535 | |
| | 181,292 | | | Citigroup Mortgage Loan Trust 2010-8 (b),(c) | | | | 3.6730 | | 11/19/35 | | | 161,725 | |
| | 33,834 | | | Citigroup Mortgage Loan Trust 2013-8 (b),(c) | | | | 3.8490 | | 05/25/35 | | | 27,963 | |
| | 347,949 | | | Citigroup Mortgage Loan Trust 2013-8 (b),(c) | | | | 3.9910 | | 11/25/36 | | | 256,162 | |
| | 159,654 | | | Citigroup Mortgage Loan Trust 2019-E (c),(f) | | | | 6.2280 | | 11/25/70 | | | 157,361 | |
| | 819,638 | | | Citigroup Mortgage Loan Trust, Inc. (c),(d) | | US0001M + 0.400% | | 4.7890 | | 01/25/29 | | | 769,192 | |
| | 58,598 | | | Citigroup Mortgage Loan Trust, Inc. | | | | 8.0000 | | 08/25/34 | | | 58,455 | |
| | 1,023,050 | | | Citigroup Mortgage Loan Trust, Inc. | | | | 5.7500 | | 11/25/35 | | | 752,068 | |
| | 86,359 | | | CitiMortgage Alternative Loan Trust (e) | | | | — | | 01/25/37 | | | 49,070 | |
| | 176,051 | | | CitiMortgage Alternative Loan Trust (a),(d) | | US0001M + 5.400% | | 1.0110 | | 01/25/37 | | | 6,588 | |
| | 18,425 | | | CitiMortgage Alternative Loan Trust | | | | 6.0000 | | 01/25/37 | | | 16,209 | |
| | 31,827,712 | | | COMM 2007-C9 Mortgage Trust (a),(b),(c) | | | | 0.4330 | | 12/10/49 | | | 514,339 | |
| | 382,543 | | | Credit Suisse First Boston Mortgage Securities | | | | 5.5000 | | 08/25/25 | | | 311,128 | |
| | 259,169 | | | Credit Suisse First Boston Mortgage Securities(b) | | | | 8.1000 | | 09/25/31 | | | 248,366 | |
| | 285,666 | | | Credit Suisse First Boston Mortgage Securities (b),(c) | | | | 3.1830 | | 03/25/32 | | | 259,105 | |
| | 115,064 | | | Credit Suisse First Boston Mortgage Securities (b) | | | | 7.0000 | | 06/25/32 | | | 107,398 | |
| | 22,512 | | | Credit Suisse First Boston Mortgage Securities (b) | | | | 3.8330 | | 11/25/32 | | | 18,678 | |
| | 88,278 | | | Credit Suisse First Boston Mortgage Securities (b) | | | | 3.8330 | | 11/25/32 | | | 82,091 | |
| | 468,112 | | | Credit Suisse First Boston Mortgage Securities (b) | | | | 7.3530 | | 11/25/32 | | | 458,926 | |
| | 23,166 | | | Credit Suisse First Boston Mortgage Securities (b) | | | | 6.9280 | | 12/25/32 | | | 21,366 | |
| | 72,337 | | | Credit Suisse First Boston Mortgage Securities (b) | | | | 5.6670 | | 04/25/33 | | | 57,518 | |
See accompanying notes which are an integral part of these financial statements.
| RATIONAL SPECIAL SITUATIONS INCOME FUND |
| SCHEDULE OF INVESTMENTS (Continued) |
| December 31, 2022 |
| Principal | | | | | | | Coupon Rate | | | | | |
| Amount ($) | | | | | Spread | | (%) | | Maturity | | Fair Value | |
| | | | | ASSET BACKED SECURITIES — 78.2% (Continued) | | | | | | | | | | |
| | | | | COLLATERALIZED MORTGAGE OBLIGATIONS — 31.3% (Continued) | | | | | | | | | | |
| | 117,662 | | | Credit Suisse First Boston Mortgage Securities | | | | 6.5000 | | 04/25/33 | | $ | 114,207 | |
| | 29,642 | | | Credit Suisse First Boston Mortgage Securities | | | | 6.5000 | | 09/25/33 | | | 28,370 | |
| | 52,028 | | | Credit Suisse First Boston Mortgage Securities | | | | 5.0000 | | 09/25/34 | | | 44,023 | |
| | 836,709 | | | Credit Suisse First Boston Mortgage Securities | | | | 5.2500 | | 01/25/36 | | | 713,310 | |
| | 2,249 | | | CSFB Mortgage-Backed Pass-Through Certificates | | | | 5.0000 | | 11/25/28 | | | 2,058 | |
| | 595,015 | | | CSFB Mortgage-Backed Pass-Through Certificates | | | | 7.0000 | | 10/25/32 | | | 567,692 | |
| | 139,591 | | | CSFB Mortgage-Backed Pass-Through Certificates (d) | | US0001M + 2.900% | | 7.2890 | | 07/25/33 | | | 132,362 | |
| | 62,865 | | | CSFB Mortgage-Backed Pass-Through Certificates | | | | 5.5000 | | 11/25/33 | | | 60,794 | |
| | 211,367 | | | CSFB Mortgage-Backed Pass-Through Certificates | | | | 6.0000 | | 11/25/33 | | | 200,365 | |
| | 125,597 | | | CSFB Mortgage-Backed Pass-Through Certificates | | | | 6.5000 | | 12/25/33 | | | 116,162 | |
| | 12,064 | | | CSFB Mortgage-Backed Pass-Through Certificates (b) | | | | 3.5670 | | 01/25/34 | | | 11,630 | |
| | 75,839 | | | CSFB Mortgage-Backed Pass-Through Certificates (b) | | | | 2.6810 | | 06/25/34 | | | 75,179 | |
| | 7,187 | | | CSFB Mortgage-Backed Pass-Through Certificates (b) | | | | 3.4500 | | 06/25/34 | | | 6,886 | |
| | 690,649 | | | CSFB Mortgage-Backed Pass-Through Certificates (d) | | US0001M + 0.350% | | 4.7390 | | 10/25/35 | | | 578,593 | |
| | 7,659,480 | | | CSFB Mortgage-Backed Pass-Through Certificates | | | | 1.0590 | | 11/25/35 | | | 1,500,471 | |
| | 45,520 | | | CSFB Mortgage-Backed Trust (b) | | | | 3.9470 | | 10/25/34 | | | 45,087 | |
| | 2,085,918 | | | CSMC Mortgage-Backed Trust 2006-9 | | | | 6.5000 | | 11/25/36 | | | 1,420,160 | |
| | 553,503 | | | CSMC Mortgage-Backed Trust 2007-1 | | | | 6.0000 | | 02/25/37 | | | 331,438 | |
| | 970,151 | | | CSMC Mortgage-Backed Trust 2007-3 (b) | | | | 1.8070 | | 04/25/37 | | | 244,810 | |
| | 155,725 | | | CSMC Mortgage-Backed Trust 2007-3 (d) | | US0001M + 0.250% | | 4.6390 | | 04/25/37 | | | 124,561 | |
| | 196,083 | | | CSMC Mortgage-Backed Trust 2007-3 | | | | 5.0000 | | 04/25/37 | | | 160,992 | |
| | 2,301,713 | | | CSMC Mortgage-Backed Trust 2007-4 | | | | 0.9820 | | 06/25/37 | | | 349,482 | |
| | 190,716 | | | CSMC Mortgage-Backed Trust 2007-4 (d) | | US0001M + 0.400% | | 4.7890 | | 06/25/37 | | | 120,620 | |
| | 41,543 | | | CSMC Mortgage-Backed Trust 2007-5 | | | | 6.0000 | | 04/25/29 | | | 38,662 | |
| | 104,677 | | | CSMC Series 2011-6R (b),(c) | | | | 3.3230 | | 04/28/37 | | | 95,798 | |
| | 132,016 | | | CSMC Series 2014-4R (c),(d) | | US0001M + 0.200% | | 4.2640 | | 02/27/36 | | | 119,963 | |
| | 171,478 | | | Deutsche Alt-B Securities Inc Mortgage Loan Trust (b) | | | | 4.8370 | | 06/25/36 | | | 141,073 | |
| | 129,167 | | | Deutsche Alt-B Securities Mortgage Loan Trust (f) | | | | 6.3650 | | 02/25/36 | | | 119,483 | |
| | 33,848 | | | Deutsche Mortgage Sec Inc Mort Loan Tr Ser 2004-1 (b) | | | | 5.5000 | | 09/25/33 | | | 30,820 | |
| | 107,125 | | | Deutsche Mortgage Securities Inc Mortgage Loan (c),(d) | | US0001M + 0.280% | | 4.5980 | | 04/15/36 | | | 97,379 | |
See accompanying notes which are an integral part of these financial statements.
| RATIONAL SPECIAL SITUATIONS INCOME FUND |
| SCHEDULE OF INVESTMENTS (Continued) |
| December 31, 2022 |
| Principal | | | | | | | Coupon Rate | | | | | |
| Amount ($) | | | | | Spread | | (%) | | Maturity | | Fair Value | |
| | | | | ASSET BACKED SECURITIES — 78.2% (Continued) | | | | | | | | | | |
| | | | | COLLATERALIZED MORTGAGE OBLIGATIONS — 31.3% (Continued) | | | | | | | | | | |
| | 392,089 | | | Deutsche Mortgage Securities Inc Mortgage Loan (c),(d) | | US0001M + 0.280% | | 4.5980 | | 04/15/36 | | $ | 356,416 | |
| | 51,835 | | | Deutsche Mortgage Securities Inc Mortgage Loan (c),(d) | | US0001M + 0.290% | | 4.6080 | | 04/15/36 | | | 46,548 | |
| | 178,410 | | | DSLA Mortgage Loan Trust 2004-AR1 (d) | | US0001M + 0.840% | | 5.1790 | | 09/19/44 | | | 154,015 | |
| | 1,104,839 | | | DSLA Mortgage Loan Trust 2004-AR2 (d) | | US0001M + 0.800% | | 5.1390 | | 11/19/44 | | | 913,434 | |
| | 297,983 | | | DSLA Mortgage Loan Trust 2004-AR2 (d) | | US0001M + 0.800% | | 5.1390 | | 11/19/44 | | | 272,049 | |
| | 134,192 | | | DSLA Mortgage Loan Trust 2005-AR5 (d) | | US0001M + 0.660% | | 4.9990 | | 09/19/45 | | | 83,890 | |
| | 2,521,598 | | | DSLA Mortgage Loan Trust 2007-AR1 (d) | | US0001M + 0.140% | | 4.4790 | | 04/19/47 | | | 2,010,904 | |
| | 49,001 | | | Fannie Mae Interest Strip (a) | | | | 6.5000 | | 10/25/23 | | | 1,008 | |
| | 263,112 | | | Fannie Mae Interest Strip (a),(b) | | | | 3.5000 | | 04/25/27 | | | 9,648 | |
| | 159,318 | | | Fannie Mae Interest Strip (a) | | | | 6.0000 | | 01/25/35 | | | 29,532 | |
| | 355,151 | | | Fannie Mae Interest Strip (a) | | | | 4.5000 | | 08/25/35 | | | 55,189 | |
| | 223,620 | | | Fannie Mae Interest Strip (a),(b) | | | | 5.0000 | | 03/25/38 | | | 35,785 | |
| | 485,584 | | | Fannie Mae Interest Strip (a) | | | | 5.0000 | | 01/25/40 | | | 95,888 | |
| | 409,643 | | | Fannie Mae REMICS (a),(d) | | US0001M + 6.500% | | 2.1110 | | 05/25/40 | | | 6,631 | |
| | 354,212 | | | Fannie Mae REMICS (a),(d) | | US0001M + 6.150% | | 1.7610 | | 01/25/49 | | | 28,532 | |
| | 1,230,590 | | | Fannie Mae Trust 2003-W6 (a),(d) | | US0001M + 7.600% | | 3.2110 | | 09/25/42 | | | 123,542 | |
| | 168,597 | | | First Horizon Alternative Mortgage Securities (b) | | | | 3.9470 | | 12/25/34 | | | 155,751 | |
| | 373,857 | | | First Horizon Alternative Mortgage Securities (b) | | | | 3.5520 | | 02/25/35 | | | 319,457 | |
| | 31,902 | | | First Horizon Alternative Mortgage Securities (b) | | | | 3.6050 | | 03/25/35 | | | 19,962 | |
| | 899,456 | | | First Horizon Alternative Mortgage Securities (b) | | | | 4.3890 | | 05/25/35 | | | 489,592 | |
| | 251,775 | | | First Horizon Alternative Mortgage Securities (b) | | | | 4.7590 | | 07/25/35 | | | 169,574 | |
| | 1,112 | | | First Horizon Alternative Mortgage Securities (b) | | | | 0.0001 | | 07/25/36 | | | — | |
| | 653,902 | | | First Horizon Mortgage Pass-Through Trust (b) | | | | 4.6250 | | 01/25/36 | | | 445,870 | |
| | 24,431 | | | First Horizon Mortgage Pass-Through Trust 2000-H (b) | | | | 2.8260 | | 05/25/30 | | | 22,817 | |
| | 22,494 | | | First Horizon Mortgage Pass-Through Trust 2000-H (b) | | | | 3.2460 | | 05/25/30 | | | 20,642 | |
| | 169,897 | | | First Horizon Mortgage Pass-Through Trust 2004-FL1 (d) | | US0001M + 0.270% | | 4.6590 | | 02/25/35 | | | 144,690 | |
| | 220,434 | | | First Horizon Mortgage Pass-Through Trust 2005-AR4 (b) | | | | 3.9300 | | 10/25/35 | | | 204,728 | |
| | 56,924 | | | First Horizon Mortgage Pass-Through Trust 2007-AR2 (b) | | | | 3.8570 | | 07/25/37 | | | 37,289 | |
| | 352,693 | | | Freddie Mac REMICS (a),(d) | | US0001M + 6.000% | | 1.6820 | | 11/15/40 | | | 31,947 | |
| | 297,944 | | | Freddie Mac Strips (a) | | | | 6.0000 | | 06/15/39 | | | 65,514 | |
| | 331,617 | | | Freddie Mac Strips (a),(b) | | | | 4.5000 | | 05/15/49 | | | 71,354 | |
See accompanying notes which are an integral part of these financial statements.
| RATIONAL SPECIAL SITUATIONS INCOME FUND |
| SCHEDULE OF INVESTMENTS (Continued) |
| December 31, 2022 |
| Principal | | | | | | | Coupon Rate | | | | | |
| Amount ($) | | | | | Spread | | (%) | | Maturity | | Fair Value | |
| | | | | ASSET BACKED SECURITIES — 78.2% (Continued) | | | | | | | | | | |
| | | | | COLLATERALIZED MORTGAGE OBLIGATIONS — 31.3% (Continued) | | | | | | | | | | |
| | 3,122,821 | | | Freddie Mac Structured Pass-Through Certificates (a),(b) | | | | 0.5240 | | 05/25/43 | | $ | 64,448 | |
| | 586,011 | | | Global Mortgage Securitization Ltd. (c),(d) | | US0001M + 0.320% | | 4.7090 | | 11/25/32 | | | 565,011 | |
| | 170,330 | | | GMACM Mortgage Loan Trust 2004-J2 (e) | | | | — | | 06/25/34 | | | 137,340 | |
| | 1,874,097 | | | GMACM Mortgage Loan Trust 2005-AR4 (b) | | | | 3.7600 | | 07/19/35 | | | 1,554,913 | |
| | 477,849 | | | GMACM Mortgage Loan Trust 2005-AR6(b) | | | | 3.6000 | | 11/19/35 | | | 393,421 | |
| | 49,763 | | | GMACM Mortgage Loan Trust 2005-AR6 (b) | | | | 3.6730 | | 11/19/35 | | | 42,223 | |
| | 412,320 | | | Government National Mortgage Association (a),(f) | | | | 4.0000 | | 09/16/25 | | | 9,605 | |
| | 185,245 | | | Government National Mortgage Association (a),(d) | | US0001M + 7.550% | | 3.1970 | | 02/20/33 | | | 4,868 | |
| | 178,394 | | | Government National Mortgage Association (a) | | | | 5.0000 | | 05/20/34 | | | 24,394 | |
| | 180,567 | | | Government National Mortgage Association (a) | | | | 5.0000 | | 10/20/39 | | | 33,344 | |
| | 141,373 | | | Government National Mortgage Association (a),(d) | | US0001M + 5.400% | | 1.0470 | | 05/20/41 | | | 9,691 | |
| | 167,093 | | | Government National Mortgage Association (a),(d) | | US0001M + 5.450% | | 1.0970 | | 06/20/41 | | | 11,454 | |
| | 524,754 | | | GreenPoint Mortgage Funding Trust 2005-AR4 (d) | | US0001M + 0.520% | | 4.9090 | | 10/25/45 | | | 505,891 | |
| | 317,067 | | | GreenPoint Mortgage Funding Trust 2005-AR5 (d) | | US0001M + 0.540% | | 4.9290 | | 11/25/45 | | | 285,199 | |
| | 332,527 | | | GreenPoint Mortgage Funding Trust 2005-AR5 (d) | | US0001M + 0.560% | | 4.9490 | | 11/25/45 | | | 252,332 | |
| | 734,795 | | | GreenPoint Mortgage Funding Trust 2006-AR2 (d) | | 12MTA + 2.000% | | 3.6890 | | 03/25/36 | | | 695,014 | |
| | 71,840 | | | GreenPoint Mortgage Funding Trust 2006-AR3 (d) | | US0001M + 0.420% | | 4.8090 | | 04/25/36 | | | 59,432 | |
| | 585,570 | | | GreenPoint Mortgage Loan Trust 2004-1 (d) | | US0001M + 1.150% | | 5.5390 | | 10/25/34 | | | 461,965 | |
| | 375,984 | | | GreenPoint MTA Trust 2005-AR3 (d) | | US0001M + 0.480% | | 4.8690 | | 08/25/45 | | | 282,840 | |
| | 148,903 | | | GSMPS Mortgage Loan Trust (b),(c) | | | | 7.7500 | | 05/19/27 | | | 144,989 | |
| | 62,639 | | | GSMPS Mortgage Loan Trust (b),(c) | | | | 5.0250 | | 09/19/27 | | | 60,281 | |
| | 174,784 | | | GSMPS Mortgage Loan Trust (b),(c) | | | | 8.0000 | | 09/19/27 | | | 169,663 | |
| | 52,615 | | | GSMPS Mortgage Loan Trust (b),(c) | | | | 8.0000 | | 09/19/27 | | | 49,021 | |
| | 462,944 | | | GSMPS Mortgage Loan Trust 2001-2 (b),(c) | | | | 7.5000 | | 06/19/32 | | | 424,435 | |
| | 127,282 | | | GSR Mortgage Loan Trust 2003-1 (b) | | | | 2.8420 | | 03/25/33 | | | 115,600 | |
| | 14,920 | | | GSR Mortgage Loan Trust 2003-1 (d) | | H15T1Y + 1.750% | | 2.8800 | | 03/25/33 | | | 14,522 | |
| | 99,074 | | | GSR Mortgage Loan Trust 2003-3F (b) | | | | 5.9670 | | 04/25/33 | | | 93,597 | |
| | 114,534 | | | GSR Mortgage Loan Trust 2003-3F | | | | 6.0000 | | 04/25/33 | | | 110,169 | |
| | 185,209 | | | GSR Mortgage Loan Trust 2003-4F (b) | | | | 5.9150 | | 05/25/33 | | | 187,868 | |
| | 405,982 | | | GSR Mortgage Loan Trust 2003-9 (d) | | US0012M + 1.750% | | 7.1190 | | 08/25/33 | | | 374,677 | |
| | 857 | | | GSR Mortgage Loan Trust 2004-10F | | | | 4.5000 | | 09/25/34 | | | 852 | |
| | 15,281 | | | GSR Mortgage Loan Trust 2004-13F | | | | 6.0000 | | 11/25/34 | | | 14,551 | |
| | 204,969 | | | GSR Mortgage Loan Trust 2004-15F (d) | | US0001M + 0.300% | | 4.6890 | | 12/25/34 | | | 189,417 | |
| | 14,038 | | | GSR Mortgage Loan Trust 2004-8F | | | | 6.0000 | | 09/25/34 | | | 13,831 | |
See accompanying notes which are an integral part of these financial statements.
| RATIONAL SPECIAL SITUATIONS INCOME FUND |
| SCHEDULE OF INVESTMENTS (Continued) |
| December 31, 2022 |
| Principal | | | | | | | Coupon Rate | | | | | |
| Amount ($) | | | | | Spread | | (%) | | Maturity | | Fair Value | |
| | | | | ASSET BACKED SECURITIES — 78.2% (Continued) | | | | | | | | | | |
| | | | | COLLATERALIZED MORTGAGE OBLIGATIONS — 31.3% (Continued) | | | | | | | | | | |
| | 20,157 | | | GSR Mortgage Loan Trust 2005-5F | | | | 5.5000 | | 06/25/35 | | $ | 19,498 | |
| | 65,222 | | | GSR Mortgage Loan Trust 2005-7F | | | | 5.5000 | | 09/25/35 | | | 61,662 | |
| | 580,558 | | | GSR Mortgage Loan Trust 2005-8F | | | | 5.5000 | | 11/25/35 | | | 523,427 | |
| | 435,021 | | | GSR Mortgage Loan Trust 2005-8F | | | | 5.5000 | | 11/25/35 | | | 392,211 | |
| | 100,504 | | | GSR Mortgage Loan Trust 2005-8F | | | | 5.5000 | | 11/25/35 | | | 90,924 | |
| | 227,657 | | | GSR Mortgage Loan Trust 2005-AR5 (b) | | | | 3.3940 | | 10/25/35 | | | 205,418 | |
| | 11,156 | | | GSR Mortgage Loan Trust 2005-AR6 (b) | | | | 3.5050 | | 09/25/35 | | | 10,864 | |
| | 17,581 | | | GSR Mortgage Loan Trust 2005-AR6 (b) | | | | 3.6010 | | 09/25/35 | | | 16,274 | |
| | 323,888 | | | GSR Mortgage Loan Trust 2005-AR7 (b) | | | | 3.9850 | | 11/25/35 | | | 265,155 | |
| | 35,645 | | | GSR Mortgage Loan Trust 2005-AR7 (b) | | | | 4.0520 | | 11/25/35 | | | 32,541 | |
| | 958,557 | | | GSR Mortgage Loan Trust 2006-10F | | | | 5.7500 | | 12/25/36 | | | 2,119,974 | |
| | 1,012,366 | | | GSR Mortgage Loan Trust 2006-1F (d) | | US0001M + 0.950% | | 5.3390 | | 02/25/36 | | | 1,967,885 | |
| | 843,133 | | | GSR Mortgage Loan Trust 2006-1F | | | | 5.5000 | | 02/25/36 | | | 626,363 | |
| | 1,561,580 | | | GSR Mortgage Loan Trust 2006-2F | | | | 5.7500 | | 02/25/36 | | | 1,368,580 | |
| | 1,845,162 | | | GSR Mortgage Loan Trust 2006-2F | | | | 5.7500 | | 02/25/36 | | | 1,617,114 | |
| | 65,014,841 | | | GSR Mortgage Loan Trust 2006-4F | | | | 5.5000 | | 05/25/36 | | | 1,380,000 | |
| | 875,000 | | | GSR Mortgage Loan Trust 2006-4F | | | | 5.5000 | | 05/25/36 | | | 425,000 | |
| | 2,604,000 | | | GSR Mortgage Loan Trust 2006-4F | | | | 5.5000 | | 05/25/36 | | | 875,000 | |
| | 10,991 | | | GSR Mortgage Loan Trust 2006-7F | | | | 6.0000 | | 08/25/36 | | | 1,925,000 | |
| | 548,763 | | | GSR Mortgage Loan Trust 2007-1F | | | | 5.5000 | | 01/25/37 | | | 1,042,138 | |
| | 306,391 | | | GSR Mortgage Loan Trust 2007-1F | | | | 5.5000 | | 01/25/37 | | | 373,569 | |
| | 546,206 | | | GSR Mortgage Loan Trust 2007-1F | | | | 6.0000 | | 01/25/37 | | | 371,163 | |
| | 1,170,693 | | | GSR Mortgage Loan Trust 2007-3F | | | | 5.7500 | | 05/25/37 | | | 2,258,914 | |
| | 65,271 | | | GSR Mortgage Loan Trust 2007-4F | | | | 5.0000 | | 07/25/37 | | | 91,282 | |
| | 2,659,388 | | | GSR Mortgage Loan Trust 2007-4F | | | | 5.7500 | | 07/25/37 | | | 3,952,281 | |
| | 533,561 | | | GSR Mortgage Loan Trust 2007-AR1 (b) | | | | 3.3670 | | 03/25/37 | | | 465,303 | |
| | 76,443 | | | HarborView Mortgage Loan Trust 2003-1 (b) | | | | 3.3460 | | 05/19/33 | | | 57,920 | |
| | 308,052 | | | HarborView Mortgage Loan Trust 2004-1 (b) | | | | 3.6390 | | 04/19/34 | | | 228,936 | |
| | 1,454,183 | | | HarborView Mortgage Loan Trust 2004-8 (d) | | US0001M + 0.800% | | 5.1390 | | 11/19/34 | | | 1,227,767 | |
| | 100,236 | | | HarborView Mortgage Loan Trust 2004-9 (d) | | US0001M + 0.780% | | 5.1190 | | 12/19/34 | | | 86,776 | |
| | 3,429 | | | HarborView Mortgage Loan Trust 2005-1 (d) | | US0001M + 0.660% | | 4.9990 | | 03/19/35 | | | 2,395 | |
| | 25,839 | | | HarborView Mortgage Loan Trust 2005-14 (b) | | | | 3.8380 | | 12/19/35 | | | 17,938 | |
| | 194,686 | | | HarborView Mortgage Loan Trust 2005-14 (b) | | | | 3.9280 | | 12/19/35 | | | 181,696 | |
| | 946,953 | | | HarborView Mortgage Loan Trust 2005-16 (d) | | 12MTA + 2.000% | | 4.0480 | | 01/19/37 | | | 728,243 | |
See accompanying notes which are an integral part of these financial statements.
| RATIONAL SPECIAL SITUATIONS INCOME FUND |
| SCHEDULE OF INVESTMENTS (Continued) |
| December 31, 2022 |
| Principal | | | | | | | Coupon Rate | | | | | |
| Amount ($) | | | | | Spread | | (%) | | Maturity | | Fair Value | |
| | | | | ASSET BACKED SECURITIES 78.2% (Continued) | | | | | | | | | | |
| | | | | COLLATERALIZED MORTGAGE OBLIGATIONS — 31.3% (Continued) | | | | | | | | | | |
| | 2,300,503 | | | HarborView Mortgage Loan Trust 2005-2 (d) | | US0001M + 0.520% | | 1.2660 | | 05/19/35 | | $ | 774,781 | |
| | 55,362 | | | HarborView Mortgage Loan Trust 2005-4 (b) | | | | 3.4820 | | 07/19/35 | | | 54,150 | |
| | 20,187 | | | HarborView Mortgage Loan Trust 2005-8 (d) | | US0001M + 0.660% | | 4.9990 | | 09/19/35 | | | 14,491 | |
| | 27,432 | | | Impac CMB Trust Series 2003-11 (d) | | US0001M + 4.500% | | 8.8890 | | 10/25/33 | | | 25,415 | |
| | 1,767 | | | Impac CMB Trust Series 2003-8 (d) | | US0001M + 2.625% | | 7.0140 | | 10/25/33 | | | 1,733 | |
| | 3,215 | | | Impac CMB Trust Series 2003-8 (d) | | US0001M + 4.500% | | 8.8890 | | 10/25/33 | | | 3,105 | |
| | 149,926 | | | Impac CMB Trust Series 2004-10 (d) | | US0001M + 0.800% | | 5.1890 | | 03/25/35 | | | 135,157 | |
| | 37,852 | | | Impac CMB Trust Series 2004-10 (d) | | US0001M + 1.500% | | 5.8890 | | 03/25/35 | | | 34,086 | |
| | 176,402 | | | Impac CMB Trust Series 2004-10 (d) | | US0001M + 2.775% | | 7.1640 | | 03/25/35 | | | 165,039 | |
| | 223,205 | | | Impac CMB Trust Series 2005-4 (d) | | US0001M + 0.380% | | 5.1490 | | 05/25/35 | | | 180,959 | |
| | 1,012,763 | | | Impac CMB Trust Series 2005-4 (d) | | US0001M + 1.650% | | 6.8640 | | 05/25/35 | | | 884,327 | |
| | 252,399 | | | Impac Secured Assets CMN Owner Trust (b) | | | | 5.3030 | | 08/25/33 | | | 232,841 | |
| | 144,608 | | | Impac Secured Assets CMN Owner Trust (b) | | | | 3.5390 | | 07/25/35 | | | 123,849 | |
| | 32,516 | | | Impac Secured Assets Trust 2006-2 (d) | | US0001M + 1.650% | | 6.0390 | | 08/25/36 | | | 32,404 | |
| | 141,350 | | | IndyMac ARM Trust 2001-H1 (b) | | | | 3.1950 | | 08/25/31 | | | 71,246 | |
| | 80,109 | | | IndyMac IMSC Mortgage Loan Trust 2007-F3 (e) | | | | — | | 09/25/37 | | | 45,825 | |
| | 85,775 | | | IndyMac INDA Mortgage Loan Trust 2005-AR1 (b) | | | | 3.7020 | | 11/25/35 | | | 80,964 | |
| | 18,420 | | | IndyMac INDA Mortgage Loan Trust 2005-AR2 (b) | | | | 3.4280 | | 01/25/36 | | | 16,697 | |
| | 72,113 | | | IndyMac INDA Mortgage Loan Trust 2007-AR4 (b) | | | | 3.9560 | | 08/25/37 | | | 64,399 | |
| | 28,776 | | | IndyMac INDX Mortgage Loan Trust 2004-AR10 (d) | | US0001M + 0.920% | | 5.3090 | | 05/25/34 | | | 25,229 | |
| | 165,329 | | | IndyMac INDX Mortgage Loan Trust 2004-AR5 (d) | | US0001M + 0.860% | | 5.2490 | | 08/25/34 | | | 136,413 | |
| | 2,155,644 | | | IndyMac INDX Mortgage Loan Trust 2005-AR9 (b) | | | | 3.5650 | | 07/25/35 | | | 1,907,175 | |
| | 167,512 | | | IndyMac INDX Mortgage Loan Trust 2006-AR2 (d) | | US0001M + 0.420% | | 4.8090 | | 02/25/46 | | | 117,455 | |
| | 110,011 | | | IndyMac INDX Mortgage Loan Trust 2006-AR33 (b) | | | | 3.5400 | | 01/25/37 | | | 95,789 | |
| | 1,106,081 | | | Jefferies Resecuritization Trust 2009-R6 (b),(c) | | | | 3.8080 | | 08/26/35 | | | 1,023,662 | |
| | 652,441 | | | Jefferies Resecuritization Trust 2009-R7 (b),(c) | | | | 3.5780 | | 10/21/35 | | | 660,678 | |
| | 419,150 | | | JP Morgan Alternative Loan Trust | | | | 5.0000 | | 12/25/35 | | | 319,347 | |
| | 3,596,776 | | | JP Morgan Alternative Loan Trust (b) | | | | 3.1790 | | 03/25/36 | | | 3,362,286 | |
| | 57,257 | | | JP Morgan Alternative Loan Trust (f) | | | | 6.6900 | | 05/25/36 | | | 56,617 | |
| | 23,975 | | | JP Morgan Mortgage Trust 2004-S2 | | | | 5.5000 | | 11/25/24 | | | 23,804 | |
| | 502,943 | | | JP Morgan Mortgage Trust 2004-S2 (d) | | US0001M + 0.400% | | 4.7890 | | 11/25/34 | | | 458,117 | |
| | 231,346 | | | JP Morgan Mortgage Trust 2004-S2 | | | | 6.0000 | | 11/25/34 | | | 203,289 | |
| | 30,954 | | | JP Morgan Mortgage Trust 2005-A3 (b) | | | | 4.0110 | | 06/25/35 | | | 28,557 | |
See accompanying notes which are an integral part of these financial statements.
| RATIONAL SPECIAL SITUATIONS INCOME FUND |
| SCHEDULE OF INVESTMENTS (Continued) |
| December 31, 2022 |
| Principal | | | | | | | Coupon Rate | | | | | |
| Amount ($) | | | | | Spread | | (%) | | Maturity | | Fair Value | |
| | | | | ASSET BACKED SECURITIES — 78.2% (Continued) | | | | | | | | | | |
| | | | | COLLATERALIZED MORTGAGE OBLIGATIONS — 31.3% (Continued) | | | | | | | | | | |
| | 577,025 | | | JP Morgan Mortgage Trust 2005-A6 (b) | | | | 3.6080 | | 08/25/35 | | $ | 565,909 | |
| | 774,788 | | | JP Morgan Mortgage Trust 2005-A8 (b) | | | | 3.7590 | | 11/25/35 | | | 629,786 | |
| | 54,038 | | | JP Morgan Mortgage Trust 2007-A2 (b) | | | | 3.1040 | | 04/25/37 | | | 43,108 | |
| | 236,763 | | | JP Morgan Mortgage Trust 2007-S2 | | | | 6.0000 | | 06/25/37 | | | 234,240 | |
| | 832,963 | | | Lehman Mortgage Trust 2005-2 (d) | | US0001M + 0.900% | | 5.2890 | | 12/25/35 | | | 508,790 | |
| | 771,695 | | | Lehman Mortgage Trust 2005-2 (a) | | | | 5.5000 | | 12/25/35 | | | 125,691 | |
| | 134,133 | | | Lehman Mortgage Trust 2005-2 (d) | | US0001M + 28.060% | | 7.8720 | | 12/25/35 | | | 126,201 | |
| | 189,263 | | | Lehman Mortgage Trust 2006-4 | | | | 6.0000 | | 06/25/49 | | | 135,095 | |
| | 472,086 | | | Lehman Mortgage Trust 2006-7 (b) | | | | 1.6150 | | 09/25/36 | | | 132,663 | |
| | 237,828 | | | Lehman Mortgage Trust 2007-10 | | | | 2.0470 | | 01/25/38 | | | 78,699 | |
| | 128,567 | | | Lehman Mortgage Trust 2007-3 (e) | | | | — | | 03/25/37 | | | 88,211 | |
| | 1,414,921 | | | Lehman Mortgage Trust 2007-5 (a),(d) | | US0001M + 7.720% | | 3.3310 | | 08/25/36 | | | 292,911 | |
| | 1,398,012 | | | Lehman Mortgage Trust 2007-5 (d) | | US0001M + 0.280% | | 4.6690 | | 08/25/36 | | | 325,747 | |
| | 844,754 | | | Lehman XS Trust Series 2005-5N (d) | | US0001M + 0.360% | | 4.7490 | | 11/25/35 | | | 790,950 | |
| | 287,966 | | | Lehman XS Trust Series 2006-2N (d) | | US0001M + 0.520% | | 4.9090 | | 02/25/46 | | | 248,371 | |
| | 19,055 | | | Luminent Mortgage Trust 2006-7 (d) | | US0001M + 0.340% | | 4.7290 | | 12/25/36 | | | 16,275 | |
| | 298,457 | | | Luminent Mortgage Trust 2006-7 (d) | | US0001M + 0.360% | | 4.7490 | | 12/25/36 | | | 267,395 | |
| | 501,912 | | | Luminent Mortgage Trust 2007-2 (d) | | US0001M + 0.460% | | 4.8490 | | 05/25/37 | | | 439,245 | |
| | 474,500 | | | MASTR Adjustable Rate Mortgages Trust 2004-11 (d) | | US0001M + 2.250% | | 6.6390 | | 11/25/34 | | | 455,876 | |
| | 2,523,705 | | | MASTR Adjustable Rate Mortgages Trust 2004-14 (d) | | US0001M + 3.400% | | 7.7890 | | 01/25/35 | | | 1,999,684 | |
| | 1,055,876 | | | MASTR Adjustable Rate Mortgages Trust 2005-6 (b) | | | | 1.6320 | | 07/25/35 | | | 413,527 | |
| | 1,854,222 | | | MASTR Adjustable Rate Mortgages Trust 2005-6 (b) | | | | 1.6320 | | 07/25/35 | | | 709,008 | |
| | 3,940,302 | | | MASTR Adjustable Rate Mortgages Trust 2006-OA2 (d) | | 12MTA + 0.800% | | 2.8480 | | 12/25/46 | | | 2,852,370 | |
| | 352,312 | | | MASTR Adjustable Rate Mortgages Trust 2006-OA2 (d) | | 12MTA + 0.800% | | 2.8480 | | 12/25/46 | | | 269,942 | |
| | 2,443,861 | | | MASTR Adjustable Rate Mortgages Trust 2006-OA2 (d) | | 12MTA + 0.850% | | 2.8980 | | 12/25/46 | | | 2,064,473 | |
| | 1,458,597 | | | MASTR Adjustable Rate Mortgages Trust 2006-OA2 (d) | | 12MTA + 1.200% | | 3.2480 | | 12/25/46 | | | 1,234,921 | |
| | 3,256,685 | | | MASTR Adjustable Rate Mortgages Trust 2007-1 (b) | | | | 3.7840 | | 11/25/36 | | | 1,906,079 | |
| | 1,575,484 | | | MASTR Adjustable Rate Mortgages Trust 2007-1 (d) | | 12MTA + 0.740% | | 2.7880 | | 01/25/47 | | | 1,544,258 | |
| | 5,032 | | | MASTR Adjustable Rate Mortgages Trust 2007-1 (d) | | US0001M + 0.320% | | 4.7090 | | 01/25/47 | | | 4,927 | |
| | 300,000 | | | MASTR Adjustable Rate Mortgages Trust 2007-3 (d) | | US0001M + 0.680% | | 4.7240 | | 05/25/47 | | | 241,303 | |
| | 28,571 | | | MASTR Alternative Loan Trust 2003-4 | | | | 6.0000 | | 06/25/33 | | | 28,550 | |
| | 45,542 | | | MASTR Alternative Loan Trust 2003-5 | | | | 5.5000 | | 07/25/33 | | | 43,423 | |
See accompanying notes which are an integral part of these financial statements.
| RATIONAL SPECIAL SITUATIONS INCOME FUND |
| SCHEDULE OF INVESTMENTS (Continued) |
| December 31, 2022 |
| Principal | | | | | | | Coupon Rate | | | | | |
| Amount ($) | | | | | Spread | | (%) | | Maturity | | Fair Value | |
| | | | | ASSET BACKED SECURITIES — 78.2% (Continued) | | | | | | | | | | |
| | | | | COLLATERALIZED MORTGAGE OBLIGATIONS — 31.3% (Continued) | | | | | | | | | | |
| | 17,643 | | | MASTR Alternative Loan Trust 2003-7 | | | | 5.7500 | | 11/25/33 | | $ | 16,560 | |
| | 16,553 | | | MASTR Alternative Loan Trust 2004-10 | | | | 6.0000 | | 09/25/34 | | | 15,803 | |
| | 35,551 | | | MASTR Alternative Loan Trust 2004-11 (b) | | | | 5.8500 | | 10/25/34 | | | 33,513 | |
| | 18,856 | | | MASTR Alternative Loan Trust 2004-12 | | | | 5.5000 | | 12/25/34 | | | 18,094 | |
| | 545,628 | | | MASTR Alternative Loan Trust 2004-13 | | | | 5.5000 | | 01/25/35 | | | 302,697 | |
| | 54,010 | | | MASTR Alternative Loan Trust 2005-1 | | | | 6.0000 | | 02/25/35 | | | 52,623 | |
| | 57,394 | | | MASTR Alternative Loan Trust 2005-6 (e) | | | | — | | 12/25/35 | | | 19,737 | |
| | 37,056 | | | MASTR Alternative Loan Trust 2006-2 (e) | | | | — | | 03/25/36 | | | 14,940 | |
| | 50,958 | | | MASTR Asset Securitization Trust 2003-11 | | | | 5.2500 | | 12/25/33 | | | 47,578 | |
| | 952,174 | | | MASTR Asset Securitization Trust 2004-11 | | | | 5.7500 | | 12/25/34 | | | 860,860 | |
| | 107,983 | | | MASTR Asset Securitization Trust 2004-11 | | | | 5.7500 | | 12/25/34 | | | 96,107 | |
| | 2,482 | | | MASTR Asset Securitization Trust 2004-3 | | | | 5.2500 | | 03/25/24 | | | 2,399 | |
| | 22,338 | | | MASTR Asset Securitization Trust 2004-3 | | | | 5.2500 | | 03/25/24 | | | 21,712 | |
| | 88,587 | | | MASTR Asset Securitization Trust 2004-9 | | | | 5.2500 | | 07/25/34 | | | 80,153 | |
| | 1,482,396 | | | MASTR Reperforming Loan Trust 2005-1 (c) | | | | 7.5000 | | 08/25/34 | | | 1,187,920 | |
| | 63,506 | | | MASTR Seasoned Securitization Trust 2003-1 (d) | | US0001M + 0.400% | | 4.7890 | | 02/25/33 | | | 60,759 | |
| | 91,150 | | | Mellon Residential Funding Cor Mor Pas Thr Tr Ser (b),(c) | | | | 4.3920 | | 10/20/29 | | | 83,152 | |
| | 56,210 | | | Mellon Residential Funding Cor Mor Pas Thr Tr Ser (b),(c) | | | | 4.3920 | | 10/20/29 | | | 51,274 | |
| | 1,843,597 | | | MERIT Securities Corporation (c),(d) | | US0001M + 2.250% | | 6.6390 | | 09/28/32 | | | 1,646,645 | |
| | 152,000 | | | Merrill Lynch Alternative Note Asset Trust Series | | | | 5.7500 | | 05/25/37 | | | 141,853 | |
| | 333,272 | | | Merrill Lynch Mortgage Backed Securities Trust (b) | | | | 2.8610 | | 04/25/37 | | | 292,571 | |
| | 94,869 | | | Merrill Lynch Mortgage Investors Trust MLMI Series (b) | | | | 2.8180 | | 03/25/33 | | | 74,975 | |
| | 157,635 | | | Merrill Lynch Mortgage Investors Trust Series (e) | | | | — | | 08/25/36 | | | 12,537 | |
| | 77,148 | | | Merrill Lynch Mortgage Investors Trust Series MLCC (d) | | US0001M + 0.945% | | 5.3340 | | 08/25/28 | | | 67,432 | |
| | 58,219 | | | Merrill Lynch Mortgage Investors Trust Series MLCC (d) | | US0001M + 2.250% | | 6.6390 | | 08/25/28 | | | 49,957 | |
| | 235,162 | | | Merrill Lynch Mortgage Investors Trust Series MLCC (d) | | US0001M + 0.900% | | 5.2890 | | 10/25/28 | | | 213,316 | |
| | 147,774 | | | Merrill Lynch Mortgage Investors Trust Series MLCC (b) | | | | 3.2420 | | 06/25/37 | | | 143,427 | |
| | 1,209,777 | | | Merrill Lynch Mortgage Investors Trust Series MLMI (b) | | | | 2.1580 | | 09/25/35 | | | 972,756 | |
| | 179,290 | | | Morgan Stanley Dean Witter Capital I Inc Trust (b) | | | | 3.1240 | | 03/25/33 | | | 157,746 | |
| | 33,981 | | | Morgan Stanley Mortgage Loan Trust 2004-3 | | | | 6.0000 | | 04/25/34 | | | 32,714 | |
See accompanying notes which are an integral part of these financial statements.
| RATIONAL SPECIAL SITUATIONS INCOME FUND |
| SCHEDULE OF INVESTMENTS (Continued) |
| December 31, 2022 |
| Principal | | | | | | | Coupon Rate | | | | | |
| Amount ($) | | | | | Spread | | (%) | | Maturity | | Fair Value | |
| | | | | ASSET BACKED SECURITIES — 78.2% (Continued) | | | | | | | | | | |
| | | | | COLLATERALIZED MORTGAGE OBLIGATIONS — 31.3% (Continued) | | | | | | | | | | |
| | 776,605 | | | Morgan Stanley Mortgage Loan Trust 2005-10 | | | | 5.5000 | | 12/25/35 | | $ | 478,206 | |
| | 345,339 | | | Morgan Stanley Mortgage Loan Trust 2005-2AR (d) | | US0001M + 0.500% | | 4.8890 | | 04/25/35 | | | 239,451 | |
| | 187,511 | | | Morgan Stanley Mortgage Loan Trust 2005-4 | | | | 5.0000 | | 08/25/35 | | | 169,024 | |
| | 93,798 | | | Morgan Stanley Mortgage Loan Trust 2006-2 | | | | 5.2500 | | 01/25/23 | | | 81,464 | |
| | 117,291 | | | Morgan Stanley Mortgage Loan Trust 2006-7 | | | | 5.0000 | | 01/25/23 | | | 67,558 | |
| | 181,195 | | | Morgan Stanley Mortgage Loan Trust 2006-7 | | | | 6.0000 | | 06/25/31 | | | 117,119 | |
| | 20,477 | | | Morgan Stanley Re-REMIC Trust 2010-R7 (c) | | | | 5.5000 | | 11/26/34 | | | 18,571 | |
| | 1,113,653 | | | Morgan Stanley Resecuritization Trust 2014-R4 (b),(c) | | | | 3.9970 | | 11/21/35 | | | 955,438 | |
| | 10,974,313 | | | Mortgage Loan Resecuritization Trust (c),(d) | | US0001M + 0.340% | | 4.4600 | | 04/16/36 | | | 5,633,635 | |
| | 7,376,597 | | | Mortgage Loan Resecuritization Trust (c),(d) | | US0001M + 0.340% | | 4.4600 | | 04/16/36 | | | 6,876,234 | |
| | 2,847,595 | | | MortgageIT Mortgage Loan Trust 2006-1 (d) | | US0001M + 0.400% | | 4.7890 | | 04/25/36 | | | 2,044,580 | |
| | 160,543 | | | MortgageIT Mortgage Loan Trust 2006-1 (d) | | US0001M + 0.460% | | 4.8490 | | 04/25/36 | | | 146,632 | |
| | 298,533 | | | MortgageIT Trust 2004-1 (d) | | US0001M + 3.225% | | 7.6140 | | 11/25/34 | | | 280,891 | |
| | 338,798,775 | | | MortgageIT Trust 2005-2 (h) | | | | — | | 05/25/35 | | | 2,300,000 | |
| | 84,692 | | | MortgageIT Trust 2005-2 (d) | | US0001M + 1.425% | | 5.8140 | | 05/25/35 | | | 82,947 | |
| | 11,588,699 | | | New Residential Mortgage Loan Trust 2019-5 (a),(b),(c) | | | | 0.5000 | | 08/25/59 | | | 229,410 | |
| | 16,287,324 | | | New Residential Mortgage Loan Trust 2019-5 (a),(b),(c) | | | | 0.7500 | | 08/25/59 | | | 483,766 | |
| | 219,803 | | | New York Mortgage Trust 2006-1 (b) | | | | 3.0570 | | 05/25/36 | | | 186,238 | |
| | 25,158 | | | Nomura Asset Acceptance Corp Alternative Loan (f) | | | | 5.8030 | | 03/25/34 | | | 23,822 | |
| | 127,260 | | | Nomura Asset Acceptance Corp Alternative Loan (d) | | US0001M + 1.020% | | 5.4090 | | 08/25/34 | | | 120,284 | |
| | 9,441 | | | Nomura Asset Acceptance Corp Alternative Loan (f) | | | | 6.0710 | | 10/25/34 | | | 9,199 | |
| | 1,909,110 | | | Nomura Asset Acceptance Corp Alternative Loan (d) | | US0001M + 1.700% | | 6.0890 | | 10/25/34 | | | 1,839,323 | |
| | 1,119,015 | | | Nomura Asset Acceptance Corp Alternative Loan (d) | | US0001M + 1.500% | | 5.8890 | | 12/25/34 | | | 993,237 | |
| | 38,583 | | | Nomura Asset Acceptance Corp Alternative Loan (b) | | | | 5.6880 | | 07/25/35 | | | 37,219 | |
| | 456,193 | | | Nomura Asset Acceptance Corp Alternative Loan (b) | | | | 1.5360 | | 05/25/36 | | | 101,144 | |
| | 213,625 | | | Nomura Asset Acceptance Corp Alternative Loan (b) | | | | 4.2290 | | 06/25/36 | | | 158,221 | |
| | 401,831 | | | Nomura Asset Acceptance Corp Alternative Loan (b) | | | | 4.5700 | | 06/25/36 | | | 397,665 | |
| | 64,117 | | | Nomura Asset Acceptance Corp Alternative Loan (f) | | | | 5.9570 | | 03/25/47 | | | 59,584 | |
| | 815,125 | | | Nomura Asset Acceptance Corp Alternative Loan (f) | | | | 6.1380 | | 03/25/47 | | | 757,380 | |
See accompanying notes which are an integral part of these financial statements.
| RATIONAL SPECIAL SITUATIONS INCOME FUND |
| SCHEDULE OF INVESTMENTS (Continued) |
| December 31, 2022 |
| Principal | | | | | | | Coupon Rate | | | | | |
| Amount ($) | | | | | Spread | | (%) | | Maturity | | Fair Value | |
| | | | | ASSET BACKED SECURITIES — 78.2% (Continued) | | | | | | | | | | |
| | | | | COLLATERALIZED MORTGAGE OBLIGATIONS — 31.3% (Continued) | | | | | | | | | | |
| | 110,767 | | | NovaStar Mortgage Funding Trust (d) | | US0001M + 0.380% | | 0.4120 | | 09/25/46 | | $ | 104,542 | |
| | 121,099 | | | Ocwen Residential MBS Corporation (b),(c) | | | | 0.7430 | | 06/25/39 | | | 35,651 | |
| | 254,198 | | | PHHMC Series 2006-4 Trust (b) | | | | 6.2840 | | 12/18/36 | | | 238,499 | |
| | 74,786 | | | Popular A.B.S, Inc. (f) | | | | 7.2000 | | 12/25/29 | | | 68,560 | |
| | 184,457 | | | Prime Mortgage Trust 2004-1 | | | | 5.2500 | | 08/25/34 | | | 170,503 | |
| | 3,154 | | | Prime Mortgage Trust 2005-1 (c) | | | | 5.5000 | | 09/25/34 | | | 3,143 | |
| | 99,292 | | | Prime Mortgage Trust 2005-4 | | | | 5.2500 | | 01/25/23 | | | 89,121 | |
| | 13,329 | | | Prime Mortgage Trust 2005-4 | | | | 5.0000 | | 10/25/35 | | | 11,949 | |
| | 2,008,500 | | | Prime Mortgage Trust 2006-DR1 (c) | | | | 5.5000 | | 05/25/35 | | | 1,720,169 | |
| | 523,086 | | | Prime Mortgage Trust 2006-DR1 (c) | | | | 6.0000 | | 05/25/35 | | | 423,066 | |
| | 323,099 | | | RALI Series 2004-QA4 Trust (b) | | | | 4.0700 | | 09/25/34 | | | 296,010 | |
| | 404,507 | | | RALI Series 2004-QA4 Trust (b) | | | | 4.8030 | | 09/25/34 | | | 345,487 | |
| | 510,154 | | | RALI Series 2004-QA6 Trust (b) | | | | 3.3210 | | 12/26/34 | | | 444,502 | |
| | 645,940 | | | RALI Series 2004-QA6 Trust (b) | | | | 3.8240 | | 12/26/34 | | | 555,354 | |
| | 5,015,509 | | | RALI Series 2005-QA11 Trust (b) | | | | 1.6620 | | 10/25/35 | | | 1,709,315 | |
| | 827,718 | | | RALI Series 2005-QA11 Trust (b) | | | | 5.7960 | | 10/25/35 | | | 762,142 | |
| | 1,387,613 | | | RALI Series 2005-QA12 Trust (b) | | | | 4.6180 | | 12/25/35 | | | 1,211,782 | |
| | 1,824,830 | | | RALI Series 2005-QA2 Trust (b) | | | | 1.3230 | | 02/25/35 | | | 611,847 | |
| | 1,915,930 | | | RALI Series 2005-QA2 Trust (b) | | | | 3.4110 | | 02/25/35 | | | 1,216,405 | |
| | 191,300 | | | RALI Series 2005-QA2 Trust (b) | | | | 3.4290 | | 02/25/35 | | | 154,536 | |
| | 203,115 | | | RALI Series 2005-QA3 Trust (b) (h) | | | | — | | 03/25/35 | | | 63,106 | |
| | 63,811 | | | RALI Series 2005-QA3 Trust (b) | | | | 3.6020 | | 03/25/35 | | | 32,606 | |
| | 458,237 | | | RALI Series 2005-QA4 Trust (b) | | | | 3.6410 | | 04/25/35 | | | 413,444 | |
| | 167,945 | | | RALI Series 2005-QA4 Trust (b) | | | | 4.2570 | | 04/25/35 | | | 145,089 | |
| | 768,993 | | | RALI Series 2005-QA6 Trust (b) | | | | 3.8160 | | 05/25/35 | | | 395,506 | |
| | 79,198 | | | RALI Series 2005-QA8 Trust (b) | | | | 3.8350 | | 07/25/35 | | | 67,594 | |
| | 440,644 | | | RALI Series 2005-QA8 Trust (b) | | | | 4.1680 | | 07/25/35 | | | 250,646 | |
| | 2,634,572 | | | RALI Series 2005-QA9 Trust (b) | | | | 1.7240 | | 08/25/35 | | | 1,002,485 | |
| | 1,612,756 | | | RALI Series 2005-QA9 Trust (b) | | | | 3.9500 | | 08/25/35 | | | 1,463,950 | |
| | 614,502 | | | RALI Series 2005-QO4 Trust (d) | | US0001M + 0.560% | | 4.9490 | | 12/25/45 | | | 487,031 | |
| | 1,201,091 | | | RALI Series 2005-QS5 Trust | | | | 5.7000 | | 04/25/35 | | | 957,544 | |
| | 6,013 | | | RALI Series 2006-QA1 Trust (b) | | | | 5.2360 | | 01/25/36 | | | 6,408 | |
| | 138,588 | | | RALI Series 2006-QA2 Trust (b) | | | | 5.7500 | | 02/25/36 | | | 109,359 | |
| | 7,440,062 | | | RALI Series 2006-QS11 Trust | | | | 1.9640 | | 08/25/36 | | | 2,381,485 | |
See accompanying notes which are an integral part of these financial statements.
| RATIONAL SPECIAL SITUATIONS INCOME FUND |
| SCHEDULE OF INVESTMENTS (Continued) |
| December 31, 2022 |
| Principal | | | | | | | Coupon Rate | | | | | |
| Amount ($) | | | | | Spread | | (%) | | Maturity | | Fair Value | |
| | | | | ASSET BACKED SECURITIES — 78.2% (Continued) | | | | | | | | | | |
| | | | | COLLATERALIZED MORTGAGE OBLIGATIONS — 31.3% (Continued) | | | | | | | | | | |
| | 60,102 | | | RALI Series 2006-QS12 Trust | | | | 5.0000 | | 09/25/36 | | $ | 44,287 | |
| | 2,949,446 | | | RALI Series 2007-QO5 Trust (d) | | 12MTA + 3.120% | | 0.7790 | | 08/25/47 | | | 529,755 | |
| | 311,402 | | | RALI Series 2007-QS4 Trust | | | | 6.2500 | | 03/25/37 | | | 234,496 | |
| | 484,451 | | | RAMP Series 2003-SL1 Trust | | | | 8.0000 | | 04/25/31 | | | 458,811 | |
| | 376,455 | | | RAMP Series 2004-SL1 Trust | | | | 6.5000 | | 11/25/31 | | | 335,275 | |
| | 281,279 | | | RAMP Series 2004-SL4 Trust | | | | 2.9380 | | 07/25/32 | | | 121,733 | |
| | 393,932 | | | RAMP Series 2005-SL1 Trust | | | | 1.3190 | | 05/25/32 | | | 65,045 | |
| | 511,446 | | | RAMP Series 2005-SL1 Trust | | | | 8.0000 | | 05/25/32 | | | 337,971 | |
| | 218,150 | | | RAMP Series 2005-SL2 Trust | | | | 8.0000 | | 10/25/31 | | | 108,820 | |
| | 2,445,976 | | | RBSGC Mortgage Loan Trust 2005-A | | | | 6.0000 | | 04/25/35 | | | 2,115,146 | |
| | 640,899 | | | RBSGC Mortgage Loan Trust 2007-A | | | | 6.0000 | | 01/25/37 | | | 521,668 | |
| | 1,402,170 | | | RBSSP Resecuritization Trust 2009-6 (b),(c) | | | | 5.2020 | | 08/26/35 | | | 581,559 | |
| | 98,529 | | | Reperforming Loan REMIC Trust 2004-R1 (c) | | | | 6.5000 | | 11/25/34 | | | 88,698 | |
| | 602,693 | | | Reperforming Loan REMIC Trust 2005-R2 (a),(b),(c) | | | | 1.7710 | | 06/25/35 | | | 26,240 | |
| | 455,369 | | | Reperforming Loan REMIC Trust 2006-R2 (c),(d) | | US0001M + 0.420% | | 4.8090 | | 07/25/36 | | | 432,523 | |
| | 250,420 | | | Residential Asset Securitization Trust 2000-A6 | | | | 8.0000 | | 10/25/30 | | | 161,987 | |
| | 474,948 | | | Residential Asset Securitization Trust 2004-A2 (d) | | US0001M + 0.550% | | 4.9390 | | 05/25/34 | | | 465,618 | |
| | 23,160 | | | Residential Asset Securitization Trust 2004-A2 | | | | 5.2500 | | 05/25/34 | | | 21,422 | |
| | 228,804 | | | Residential Asset Securitization Trust 2006-A3CB (e) | | | | — | | 01/25/46 | | | 45,511 | |
| | 213,131 | | | Residential Asset Securitization Trust 2006-A3CB (a),(b) | | | | 6.0000 | | 01/25/46 | | | 48,089 | |
| | 1,372,396 | | | RFMSI Series 2005-SA1 Trust (b) | | | | 2.7050 | | 03/25/35 | | | 1,117,673 | |
| | 281,082 | | | RFMSI Series 2005-SA3 Trust (b) | | | | 3.8080 | | 08/25/35 | | | 229,712 | |
| | 843,262 | | | RFMSI Series 2005-SA5 Trust (b) | | | | 4.3020 | | 11/25/35 | | | 736,367 | |
| | 115,459 | | | RFMSI Series 2006-SA1 Trust (b) | | | | 5.2880 | | 02/25/36 | | | 95,359 | |
| | 341,923 | | | RFMSI Series 2006-SA2 Trust (b) | | | | 4.8750 | | 08/25/36 | | | 311,931 | |
| | 242,903 | | | RFMSI Series 2006-SA3 Trust (b) | | | | 4.6670 | | 09/25/36 | | | 203,885 | |
| | 137,439 | | | RFMSI Series 2006-SA4 Trust (b) | | | | 5.1580 | | 11/25/36 | | | 113,180 | |
| | 37,399 | | | Sequoia Mortgage Trust 2003-4 (b) | | | | 4.7220 | | 07/20/33 | | | 31,303 | |
| | 56,284 | | | Sequoia Mortgage Trust 2003-4 (b) | | | | 4.7220 | | 07/20/33 | | | 46,674 | |
| | 25,418 | | | Sequoia Mortgage Trust 2003-4 (b) | | | | 4.7220 | | 07/20/33 | | | 19,379 | |
| | 297,357 | | | Sequoia Mortgage Trust 2004-1 (d) | | US0001M + 0.825% | | 5.1780 | | 02/20/34 | | | 274,613 | |
| | 21,424 | | | Sequoia Mortgage Trust 2004-5 (d) | | US0001M + 0.720% | | 5.0730 | | 06/20/34 | | | 17,592 | |
| | 1,565 | | | Sequoia Mortgage Trust 2004-6 (d) | | US0001M + 0.750% | | 5.1030 | | 07/20/34 | | | 1,353 | |
See accompanying notes which are an integral part of these financial statements.
| RATIONAL SPECIAL SITUATIONS INCOME FUND |
| SCHEDULE OF INVESTMENTS (Continued) |
| December 31, 2022 |
| Principal | | | | | | | Coupon Rate | | | | | |
| Amount ($) | | | | | Spread | | (%) | | Maturity | | Fair Value | |
| | | | | ASSET BACKED SECURITIES — 78.2% (Continued) | | | | | | | | | | |
| | | | | COLLATERALIZED MORTGAGE OBLIGATIONS — 31.3% (Continued) | | | | | | | | | | |
| | 182,137 | | | Sequoia Mortgage Trust 2007-1 (b) | | | | 4.2010 | | 01/20/47 | | $ | 139,764 | |
| | 37,947 | | | Sequoia Mortgage Trust 2013-2 (b) | | | | 3.6230 | | 02/25/43 | | | 35,578 | |
| | 555,646 | | | Sequoia Mortgage Trust 4 (d) | | US0001M + 1.250% | | 5.2070 | | 04/22/25 | | | 467,277 | |
| | 71,114 | | | Sequoia Mortgage Trust 6 (d) | | US0001M + 1.050% | | 5.3890 | | 04/19/27 | | | 63,873 | |
| | 23,745 | | | Shellpoint Asset Funding Trust 2013-1 (b),(c) | | | | 3.8790 | | 07/25/43 | | | 22,936 | |
| | 41,877 | | | Sofi Mortgage Trust 2016-1 (b),(c) | | | | 3.0000 | | 11/25/46 | | | 37,855 | |
| | 51,220 | | | Structured Adjustable Rate Mortgage Loan Trust (b) | | | | 3.8920 | | 03/25/34 | | | 47,027 | |
| | 1,558,219 | | | Structured Adjustable Rate Mortgage Loan Trust (d) | | US0001M + 0.405% | | 4.7940 | | 06/25/34 | | | 1,381,575 | |
| | 261,127 | | | Structured Adjustable Rate Mortgage Loan Trust (d) | | US0001M + 0.310% | | 4.6990 | | 07/25/35 | | | 166,293 | |
| | 218,428 | | | Structured Adjustable Rate Mortgage Loan Trust (b) | | | | 3.3230 | | 04/25/47 | | | 197,769 | |
| | 1,675,193 | | | Structured Asset Investment Loan Trust 2003-BC10 (d) | | US0001M + 3.300% | | 7.6890 | | 10/25/33 | | | 1,705,122 | |
| | 252,203 | | | Structured Asset Mortgage Investments II Trust (b) | | | | 3.3330 | | 10/19/34 | | | 219,644 | |
| | 218,070 | | | Structured Asset Mortgage Investments II Trust (d) | | US0001M + 0.400% | | 4.7390 | | 02/19/35 | | | 192,827 | |
| | 1,221,193 | | | Structured Asset Mortgage Investments II Trust (d) | | US0001M + 0.400% | | 4.7890 | | 02/25/36 | | | 945,156 | |
| | 81,103 | | | Structured Asset Mortgage Investments II Trust (d) | | US0001M + 0.460% | | 4.8490 | | 02/25/36 | | | 69,963 | |
| | 382,691 | | | Structured Asset Mortgage Investments II Trust (d) | | US0001M + 0.460% | | 4.8490 | | 02/25/36 | | | 313,782 | |
| | 2,567,719 | | | Structured Asset Mortgage Investments II Trust (d) | | US0001M + 0.620% | | 5.0090 | | 02/25/36 | | | 2,424,335 | |
| | 4,768,222 | | | Structured Asset Mortgage Investments II Trust (b) | | | | 0.9410 | | 05/25/36 | | | 1,398,178 | |
| | 159,477 | | | Structured Asset Mortgage Investments II Trust (b) | | | | 3.1300 | | 05/25/36 | | | 86,771 | |
| | 62,071 | | | Structured Asset Mortgage Investments II Trust (d) | | US0001M + 0.150% | | 4.5390 | | 02/25/37 | | | 54,273 | |
| | 735,261 | | | Structured Asset Mortgage Investments II Trust (d) | | US0001M + 0.260% | | 2.1120 | | 03/25/37 | | | 243,617 | |
| | 1,637,829 | | | Structured Asset Mortgage Investments II Trust (d) | | US0001M + 0.420% | | 2.5540 | | 05/25/46 | | | 655,656 | |
| | 753,472 | | | Structured Asset Mortgage Investments II Trust (d) | | US0001M + 0.420% | | 4.8090 | | 05/25/46 | | | 477,605 | |
| | 499,339 | | | Structured Asset Mortgage Investments Trust (d) | | US0001M + 1.200% | | 5.5390 | | 05/19/33 | | | 442,628 | |
| | 43,263 | | | Structured Asset Mortgage Investments Trust 2001-4(b) | | | | 3.5250 | | 10/25/24 | | | 37,596 | |
| | 470,369 | | | Structured Asset Sec Corp Mort Pass Thr Certs | | | | 6.5000 | | 07/25/28 | | | 265,594 | |
| | 1,857,499 | | | Structured Asset Sec Corp Mort Passthr Certs Ser (b) | | | | 3.9820 | | 01/25/34 | | | 1,269,947 | |
| | 43,227 | | | Structured Asset Sec Mortgage Pass-Through (b) | | | | 4.3940 | | 11/25/32 | | | 41,446 | |
See accompanying notes which are an integral part of these financial statements.
| RATIONAL SPECIAL SITUATIONS INCOME FUND |
| SCHEDULE OF INVESTMENTS (Continued) |
| December 31, 2022 |
| Principal | | | | | | | Coupon Rate | | | | | |
| Amount ($) | | | | | Spread | | (%) | | Maturity | | Fair Value | |
| | | | | ASSET BACKED SECURITIES — 78.2% (Continued) | | | | | | | | | | |
| | | | | COLLATERALIZED MORTGAGE OBLIGATIONS — 31.3% (Continued) | | | | | | | | | | |
| | 130,260 | | | Structured Asset Securities Corp Assistance Loan(c) | | | | 3.3560 | | 01/25/31 | | $ | 67,861 | |
| | 1,337,419 | | | Structured Asset Securities Corp Mor Cer Ser (b) | | | | 4.0260 | | 10/25/33 | | | 1,141,880 | |
| | 86,514 | | | Structured Asset Securities Corp Mortgage (f) | | | | 3.7430 | | 08/25/33 | | | 86,108 | |
| | 523,981 | | | Structured Asset Securities Corp Mortgage (f) | | | | 4.9360 | | 06/25/34 | | | 491,456 | |
| | 508,696 | | | TBW Mortgage-Backed Pass-Through Certificates | | | | 6.5000 | | 04/25/36 | | | 326,854 | |
| | 1,246,966 | | | TBW Mortgage-Backed Trust 2006-6 (f) | | | | 1.2570 | | 01/25/37 | | | 322,224 | |
| | 483,804 | | | TBW Mortgage-Backed Trust | | | | 1.7900 | | 07/25/36 | | | 188,364 | |
| | 959,090 | | | Terwin Mortgage Trust 2006-9HGA (c),(d) | | US0001M + 0.560% | | 0.0001 | | 10/25/37 | | | 362,421 | |
| | 324,760 | | | Terwin Mortgage Trust 2007-6ALT (c),(d) | | US0001M + 0.600% | | 4.9890 | | 08/25/38 | | | 235,036 | |
| | 61,259 | | | Thornburg Mortgage Securities Trust 2005-1 (b) | | | | 2.4180 | | 04/25/45 | | | 57,098 | |
| | 140,347 | | | Thornburg Mortgage Securities Trust 2007-3 (d) | | US0012M + 1.250% | | 6.6660 | | 06/25/47 | | | 130,556 | |
| | 5,725,206 | | | Voyager CBASS Delaware Trust (b),(c) | | | | 0.0860 | | 02/26/37 | | | 82,617 | |
| | 15,541,485 | | | Voyager CBASS Delaware Trust (b),(c) | | | | 0.3110 | | 02/26/37 | | | 224,270 | |
| | 1,007,797 | | | Voyager CNTYW Delaware Trust (b),(c) | | | | 4.5680 | | 03/16/30 | | | 951,227 | |
| | 1,203,399 | | | Voyager CNTYW Delaware Trust (b),(c) | | | | 4.6180 | | 12/16/33 | | | 1,141,505 | |
| | 3,750,410 | | | Voyager CNTYW Delaware Trust (b),(c) | | | | 4.5580 | | 02/16/36 | | | 3,351,418 | |
| | 1,134,543 | | | Voyager CNTYW Delaware Trust (b),(c) | | | | 4.5580 | | 02/16/36 | | | 1,022,595 | |
| | 9,568,237 | | | Voyager CNTYW Delaware Trust (b),(c) | | | | 4.5180 | | 05/16/36 | | | 8,498,249 | |
| | 2,485,928 | | | Voyager OPTONE Delaware Trust (a),(b),(c) | | | | 1.1550 | | 02/25/38 | | | 688,810 | |
| | 1,638,403 | | | Wachovia Mortgage Loan Trust, LLC Series 2005-A (b) | | | | 3.4540 | | 08/20/35 | | | 1,461,082 | |
| | 301,526 | | | Wachovia Mortgage Loan Trust, LLC Series 2005-A (b) | | | | 3.5390 | | 08/20/35 | | | 281,729 | |
| | 52,218 | | | Wachovia Mortgage Loan Trust, LLC Series 2006-A (b) | | | | 2.8580 | | 05/20/36 | | | 47,781 | |
| | 559,033 | | | Wachovia Mortgage Loan Trust, LLC Series 2007-A (b) | | | | 3.2370 | | 03/20/37 | | | 490,829 | |
| | 33,110 | | | WaMu Mortgage Backed Pass Through Certificates (b),(c) | | | | 2.6530 | | 12/19/39 | | | 27,901 | |
| | 25,884 | | | WaMu Mortgage Backed Pass Through Certificates (b),(c) | | | | 2.6530 | | 12/19/39 | | | 18,331 | |
| | 129,391 | | | WaMu Mortgage Backed Pass Through Certificates (b) | | | | 2.6530 | | 12/19/39 | | | 116,733 | |
| | 44,129 | | | WaMu Mortgage Backed Pass Through Certificates (b),(c) | | | | 2.6530 | | 12/19/39 | | | 37,883 | |
| | 108,076 | | | WaMu Mortgage Pass-Through Certificates Series (b) | | | | 4.4950 | | 10/25/32 | | | 98,395 | |
| | 240,676 | | | WaMu Mortgage Pass-Through Certificates Series | | | | 5.7500 | | 01/25/33 | | | 221,904 | |
See accompanying notes which are an integral part of these financial statements.
| RATIONAL SPECIAL SITUATIONS INCOME FUND |
| SCHEDULE OF INVESTMENTS (Continued) |
| December 31, 2022 |
| Principal | | | | | | | Coupon Rate | | | | | |
| Amount ($) | | | | | Spread | | (%) | | Maturity | | Fair Value | |
| | | | | ASSET BACKED SECURITIES — 78.2% (Continued) | | | | | | | | | | |
| | | | | COLLATERALIZED MORTGAGE OBLIGATIONS — 31.3% (Continued) | | | | | | | | | | |
| | 451,118 | | | WaMu Mortgage Pass-Through Certificates Series (b) | | | | 3.0550 | | 02/25/33 | | $ | 413,693 | |
| | 29,427 | | | WaMu Mortgage Pass-Through Certificates Series (b) | | | | 3.2060 | | 06/25/33 | | | 27,253 | |
| | 164,352 | | | WaMu Mortgage Pass-Through Certificates Series (b) | | | | 3.4540 | | 06/25/33 | | | 151,449 | |
| | 1,059,615 | | | WaMu Mortgage Pass-Through Certificates Series (b) | | | | 4.7460 | | 06/25/33 | | | 507,390 | |
| | 107,221 | | | WaMu Mortgage Pass-Through Certificates Series (b) | | | | 4.1610 | | 08/25/33 | | | 101,241 | |
| | 158,863 | | | WaMu Mortgage Pass-Through Certificates Series (b) | | | | 4.1300 | | 09/25/33 | | | 121,830 | |
| | 780,481 | | | WaMu Mortgage Pass-Through Certificates Series (b) | | | | 5.8980 | | 01/25/34 | | | 713,031 | |
| | 77,403 | | | WaMu Mortgage Pass-Through Certificates Series | | | | 5.5000 | | 06/25/34 | | | 75,052 | |
| | 12,934 | | | WaMu Mortgage Pass-Through Certificates Series | | | | 5.5000 | | 07/25/34 | | | 12,469 | |
| | 54,591 | | | WaMu Mortgage Pass-Through Certificates Series (b) | | | | 3.7020 | | 10/25/36 | | | 46,775 | |
| | 249,725 | | | WaMu Mortgage Pass-Through Certificates Series (b) | | | | 2.2290 | | 11/25/41 | | | 204,311 | |
| | 90,390 | | | WaMu Mortgage Pass-Through Certificates Series (d) | | 12MTA + 1.400% | | 3.0890 | | 06/25/42 | | | 76,317 | |
| | 14,819 | | | WaMu Mortgage Pass-Through Certificates Series (c),(d) | | 12MTA + 1.400% | | 3.0890 | | 06/25/42 | | | 9,587 | |
| | 87,777 | | | WaMu Mortgage Pass-Through Certificates Series (d) | | 12MTA + 1.400% | | 3.0890 | | 06/25/42 | | | 75,357 | |
| | 175,160 | | | WaMu Mortgage Pass-Through Certificates Series (d) | | 12MTA + 1.400% | | 3.0890 | | 06/25/42 | | | 151,829 | |
| | 61,571 | | | WaMu Mortgage Pass-Through Certificates Series (d) | | 12MTA + 1.400% | | 3.0890 | | 08/25/42 | | | 55,675 | |
| | 15,020 | | | WaMu Mortgage Pass-Through Certificates Series (d) | | 12MTA + 1.400% | | 3.0890 | | 08/25/42 | | | 7,983 | |
| | 1,912,485 | | | WaMu Mortgage Pass-Through Certificates Series (d) | | 12MTA + 0.980% | | 2.6690 | | 07/25/46 | | | 1,622,647 | |
| | 17,003 | | | WaMu Pass Through Certificates Series 2002-AR12 (b) | | | | 4.3250 | | 10/25/32 | | | 15,426 | |
| | 10,518 | | | WaMu Pass Through Certificates Series 2002-AR12 (b) | | | | 4.3250 | | 10/25/32 | | | 9,221 | |
| | 1,348,519 | | | Washington Mutual Mortgage Pass-Through | | | | 5.5000 | | 03/25/35 | | | 1,068,867 | |
| | 83,968 | | | Washington Mutual Mortgage Pass-Through | | | | 5.5000 | | 03/25/35 | | | 74,099 | |
| | 1,945,576 | | | Washington Mutual Mortgage Pass-Through (d) | | US0001M + 0.500% | | 4.8890 | | 02/25/36 | | | 1,573,399 | |
| | 340,205 | | | Washington Mutual Mortgage Pass-Through | | | | 6.0000 | | 03/25/36 | | | 258,141 | |
| | 294,920 | | | Washington Mutual Mortgage Pass-Through | | | | 6.0000 | | 04/25/37 | | | 251,043 | |
| | 56,619 | | | Washington Mutual Mortgage Pass-Through (d) | | 12MTA + 0.940% | | 2.6290 | | 04/25/46 | | | 46,334 | |
| | 421,343 | | | Washington Mutual Mortgage Pass-Through (d) | | 12MTA + 0.940% | | 2.6290 | | 07/25/46 | | | 256,792 | |
| | 656,003 | | | Washington Mutual Mortgage Pass-Through (d) | | 12MTA + 0.960% | | 2.6490 | | 08/25/46 | | | 401,377 | |
| | 164,945 | | | Washington Mutual Mortgage Pass-Through (d) | | 12MTA + 0.850% | | 2.5390 | | 10/25/46 | | | 133,695 | |
| | 30,750 | | | Washington Mutual MSC Mortgage Pass-Through (c) | | | | 6.5000 | | 10/19/29 | | | 28,177 | |
| | 30,750 | | | Washington Mutual MSC Mortgage Pass-Through (c) | | | | 6.5000 | | 10/19/29 | | | 28,195 | |
| | 364,115 | | | Washington Mutual MSC Mortgage Pass-Through (b),(c) | | | | 0.0001 | | 02/25/33 | | | 66,311 | |
| | 38,687 | | | Washington Mutual MSC Mortgage Pass-Through (b) | | | | 3.2170 | | 02/25/33 | | | 36,411 | |
See accompanying notes which are an integral part of these financial statements.
| RATIONAL SPECIAL SITUATIONS INCOME FUND |
| SCHEDULE OF INVESTMENTS (Continued) |
| December 31, 2022 |
| Principal | | | | | | | Coupon Rate | | | | | |
| Amount ($) | | | | | Spread | | (%) | | Maturity | | Fair Value | |
| | | | | ASSET BACKED SECURITIES — 78.2% (Continued) | | | | | | | | | | |
| | | | | COLLATERALIZED MORTGAGE OBLIGATIONS — 31.3% (Continued) | | | | | | | | | | |
| | 40,303 | | | Washington Mutual MSC Mortgage Pass-Through | | | | 5.7500 | | 03/25/33 | | $ | 37,505 | |
| | 161,251 | | | Washington Mutual MSC Mortgage Pass-Through (b) | | | | 5.7500 | | 03/25/33 | | | 93,045 | |
| | 39,563 | | | Washington Mutual MSC Mortgage Pass-Through | | | | 7.5000 | | 04/25/33 | | | 39,001 | |
| | 673,555 | | | Washington Mutual MSC Mortgage Pass-Through (b) | | | | 3.2610 | | 05/25/33 | | | 605,816 | |
| | 685,704 | | | Washington Mutual MSC Mortgage Pass-Through (b) | | | | 7.0000 | | 07/25/33 | | | 559,077 | |
| | 39,099 | | | Wells Fargo Mortgage Backed Securities 2003-I (b) | | | | 4.0730 | | 09/25/33 | | | 29,700 | |
| | 46,565 | | | Wells Fargo Mortgage Backed Securities 2004-K (b) | | | | 3.6150 | | 07/25/34 | | | 47,465 | |
| | 28,066 | | | Wells Fargo Mortgage Backed Securities 2004-K (b) | | | | 3.6150 | | 07/25/34 | | | 28,646 | |
| | 1,347 | | | Wells Fargo Mortgage Backed Securities 2006-20 | | | | 5.5000 | | 01/25/23 | | | 1,340 | |
| | | | | | | | | | | | | | 241,435,506 | |
| | | | | HOME EQUITY — 12.7% | | | | | | | | | | |
| | 1,300,807 | | | ABFC 2002-WF2 Trust (h) | | | | — | | 11/25/29 | | | 1,248,779 | |
| | 133,053 | | | ABFS Mortgage Loan Trust 2000-3 (f) | | | | 8.1100 | | 09/15/31 | | | 114,563 | |
| | 2,624,857 | | | ABFS Mortgage Loan Trust 2002-1 (f) | | | | 7.0100 | | 12/15/32 | | | 2,207,517 | |
| | 922,317 | | | ABFS Mortgage Loan Trust 2003-1 (d) | | US0001M + 2.250% | | 6.5680 | | 08/15/33 | | | 889,301 | |
| | 375,167 | | | Accredited Mortgage Loan Trust 2004-3 (f) | | | | 6.0000 | | 10/25/34 | | | 310,506 | |
| | 892,823 | | | Accredited Mortgage Loan Trust 2005-1 (d) | | US0001M + 3.300% | | 5.0530 | | 04/25/35 | | | 891,660 | |
| | 15,560 | | | ACE Securities Corp Home Equity Loan Trust Series (d) | | US0001M + 1.275% | | 5.6640 | | 08/25/32 | | | 16,236 | |
| | 179,656 | | | ACE Securities Corp Home Equity Loan Trust Series (d) | | US0001M + 2.250% | | 6.6390 | | 12/25/33 | | | 180,213 | |
| | 528,589 | | | ACE Securities Corp Home Equity Loan Trust Series (c),(d) | | US0001M + 5.250% | | 9.6390 | | 07/25/34 | | | 370,394 | |
| | 1,531,310 | | | ACE Securities Corp Home Equity Loan Trust Series (d) | | US0001M + 3.500% | | 7.8890 | | 05/25/35 | | | 1,539,874 | |
| | 8,439 | | | ACE Securities Corp Home Equity Loan Trust Series (d) | | US0001M + 0.070% | | 1.9330 | | 11/25/36 | | | 3,616 | |
| | 218,714 | | | ACE Securities Corp Home Equity Loan Trust Series (d) | | US0001M + 0.180% | | 1.5350 | | 02/25/37 | | | 91,271 | |
| | 76,936 | | | ACE Securities Corp Home Equity Loan Trust Series (d) | | US0001M + 1.875% | | 6.2640 | | 11/25/50 | | | 78,510 | |
| | 482,688 | | | Aegis Asset Backed Securities Trust Mortgage (d) | | US0001M + 2.025% | | 6.4140 | | 10/25/34 | | | 457,856 | |
| | 370,110 | | | Aegis Asset Backed Securities Trust Mortgage Pass- (d) | | US0001M + 3.150% | | 7.5390 | | 09/25/34 | | | 330,958 | |
| | 40,334 | | | AFC Home Equity Loan Trust (d) | | US0001M + 0.720% | | 5.1090 | | 09/22/28 | | | 39,544 | |
| | 2,679,306 | | | AFC Trust Series 1999-3(d) | | US0001M + 0.790% | | 5.1790 | | 09/28/29 | | | 2,038,156 | |
| | 736,919 | | | AFC Trust Series 2000-2 (d) | | US0001M + 0.700% | | 5.0890 | | 06/25/30 | | | 618,405 | |
| | 1,040,914 | | | AFC Trust Series 2000-2 (d) | | US0001M + 0.790% | | 5.1790 | | 06/25/30 | | | 880,097 | |
| | 143,104 | | | AFC Trust Series 2000-3 (c),(d) | | US0001M + 0.640% | | 5.0290 | | 10/25/30 | | | 134,445 | |
| | 792,548 | | | AFC Trust Series 2000-3 (c),(d) | | US0001M + 0.750% | | 5.1390 | | 10/25/30 | | | 740,122 | |
| | 105,516 | | | Ameriquest Mort Sec Inc Asset Bckd Ps Thr Cert Ser (d) | | US0001M + 1.065% | | 3.5740 | | 09/25/32 | | | 100,774 | |
| | 1,064,144 | | | Ameriquest Mort Sec Inc Asset Bk Pass Thr Cert Ser (d) | | US0001M + 3.375% | | 4.4780 | | 11/25/32 | | | 1,024,912 | |
See accompanying notes which are an integral part of these financial statements.
| RATIONAL SPECIAL SITUATIONS INCOME FUND |
| SCHEDULE OF INVESTMENTS (Continued) |
| December 31, 2022 |
| Principal | | | | | | | Coupon Rate | | | | | |
| Amount ($) | | | | | Spread | | (%) | | Maturity | | Fair Value | |
| | | | | ASSET BACKED SECURITIES — 78.2% (Continued) | | | | | | | | | | |
| | | | | HOME EQUITY — 12.7% (Continued) | | | | | | | | | | |
| | 38,662 | | | Ameriquest Mortgage Securities Asset-Backed (d) | | US0001M + 2.850% | | 7.2390 | | 08/25/32 | | $ | 37,300 | |
| | 173,827 | | | Ameriquest Mortgage Securities Asset-Backed (d) | | US0001M + 4.500% | | 3.4230 | | 01/25/33 | | | 167,309 | |
| | 348,902 | | | Ameriquest Mortgage Securities Inc Asset-Backed (d) | | US0001M + 3.750% | | 3.0330 | | 02/25/33 | | | 313,116 | |
| | 815,024 | | | Amresco Residential Securities Corp Mort Loan (d) | | US0001M + 0.750% | | 5.6390 | | 11/25/29 | | | 766,363 | |
| | 28,970 | | | Amresco Residential Securities Corp Mortgage Loan (f) | | | | 7.4710 | | 10/25/27 | | | 28,759 | |
| | 762,597 | | | Argent Securities Inc Asset-Backed Pass-Through (d) | | US0001M + 5.625% | | 3.8530 | | 09/25/33 | | | 639,391 | |
| | 1,631,438 | | | Asset Backed Securities Corp Home Equity Loan (d) | | US0001M + 5.250% | | 9.5680 | | 01/15/33 | | | 1,489,043 | |
| | 7,488 | | | Asset Backed Securities Corp Home Equity Loan (d) | | US0001M + 0.080% | | 4.4690 | | 05/25/37 | | | 5,153 | |
| | 272,791 | | | Bayview Financial Asset Trust 2007-SSR1 (c),(d) | | US0001M + 0.800% | | 5.1890 | | 03/25/37 | | | 262,151 | |
| | 180,710 | | | Bayview Financial Asset Trust 2007-SSR1 (c),(d) | | US0001M + 0.900% | | 5.2890 | | 03/25/37 | | | 173,630 | |
| | 161,142 | | | Bayview Financial Asset Trust 2007-SSR1 (c),(d) | | US0001M + 1.150% | | 5.5390 | | 03/25/37 | | | 156,288 | |
| | 58,944 | | | Bayview Financial Mortgage Pass-Through (d) | | US0001M + 2.850% | | 7.2390 | | 08/28/44 | | | 59,029 | |
| | 4,460,371 | | | Bayview Financial Mortgage Pass-Through Trust (d) | | US0001M + 4.125% | | 8.5140 | | 04/28/39 | | | 4,446,820 | |
| | 343,215 | | | Bear Stearns Asset Backed Securities I Trust (d) | | US0001M + 1.755% | | 4.8890 | | 09/25/34 | | | 334,887 | |
| | 9,082,000 | | | Bear Stearns Asset Backed Securities I Trust (d) | | US0001M + 6.000% | | 10.3890 | | 10/25/34 | | | 9,023,574 | |
| | 148,848 | | | Bear Stearns Asset Backed Securities I Trust (d) | | US0001M + 4.650% | | 5.1870 | | 12/25/34 | | | 159,863 | |
| | 674,813 | | | Bear Stearns Asset Backed Securities I Trust (d) | | US0001M + 2.550% | | 4.7960 | | 05/25/35 | | | 651,669 | |
| | 3,547,332 | | | Bear Stearns Asset Backed Securities I Trust (c),(d) | | US0001M + 4.500% | | 4.7380 | | 08/25/35 | | | 3,597,033 | |
| | 1,519,655 | | | Bear Stearns Asset Backed Securities I Trust (d) | | US0001M + 0.615% | | 5.0040 | | 02/25/36 | | | 1,469,863 | |
| | 5,770,367 | | | Bear Stearns Asset Backed Securities I Trust (d) | | US0001M + 0.450% | | 4.8390 | | 06/25/36 | | | 4,892,314 | |
| | 279,434 | | | Bear Stearns Asset Backed Securities I Trust (d) | | US0001M + 0.270% | | 4.6590 | | 01/25/37 | | | 893,334 | |
| | 383,943 | | | Bear Stearns Second Lien Trust 2007-1 (d) | | US0001M + 0.190% | | 4.5790 | | 01/25/37 | | | 363,775 | |
| | 20,023 | | | Bear Stearns Second Lien Trust 2007-1 (d) | | US0001M + 0.440% | | 4.8290 | | 08/25/37 | | | 18,629 | |
| | 406,419 | | | Bond Securitization Trust 2003-1 (b) | | | | 0.0001 | | 10/25/34 | | | 359,681 | |
| | 133,786 | | | Centex Home Equity Loan Trust 2004-C (d) | | US0001M + 0.795% | | 4.1180 | | 06/25/34 | | | 124,167 | |
| | 332,914 | | | Centex Home Equity Loan Trust 2004-D (f) | | | | 6.0600 | | 09/25/34 | | | 318,707 | |
| | 458,170 | | | Citigroup Mortgage Loan Trust 2007-OPX1 (f) | | | | 0.0001 | | 01/25/37 | | | 181,373 | |
| | 2,301,000 | | | Citigroup Mortgage Loan Trust, Inc. (d) | | US0001M + 4.500% | | 8.8890 | | 12/25/33 | | | 2,357,865 | |
| | 86,261 | | | Contimortgage Home Equity Loan Trust 1996-4 (d) | | US0001M + 0.480% | | 4.7980 | | 01/15/28 | | | 74,429 | |
| | 163 | | | Countrywide Asset-Backed Certificates (b) | | | | 5.0910 | | 05/25/32 | | | 160 | |
| | 4 | | | Countrywide Asset-Backed Certificates (b) | | | | 5.8340 | | 07/25/34 | | | 4 | |
| | 38,953 | | | Countrywide Asset-Backed Certificates (f) | | | | 5.2520 | | 02/25/35 | | | 38,419 | |
| | 27,620 | | | Countrywide Home Equity Loan Trust (d) | | US0001M + 0.150% | | 4.4680 | | 11/15/36 | | | 24,761 | |
| | 603,680 | | | Countrywide Home Equity Loan Trust (d) | | US0001M + 0.150% | | 4.4680 | | 11/15/36 | | | 523,783 | |
See accompanying notes which are an integral part of these financial statements.
| RATIONAL SPECIAL SITUATIONS INCOME FUND |
| SCHEDULE OF INVESTMENTS (Continued) |
| December 31, 2022 |
| Principal | | | | | | | Coupon Rate | | | | | |
| Amount ($) | | | | | Spread | | (%) | | Maturity | | Fair Value | |
| | | | | ASSET BACKED SECURITIES — 78.2% (Continued) | | | | | | | | | | |
| | | | | HOME EQUITY — 12.7% (Continued) | | | | | | | | | | |
| | 701,452 | | | Credit Suisse First Boston Mortgage Securities (d) | | US0001M + 0.740% | | 3.9880 | | 08/25/32 | | $ | 658,941 | |
| | 578,775 | | | Credit Suisse First Boston Mortgage Securities (d) | | US0001M + 3.250% | | 3.5500 | | 04/25/34 | | | 518,400 | |
| | 76,279 | | | CWABS Revolving Home Equity Loan Trust Series (d) | | US0001M + 0.250% | | 4.5680 | | 03/15/30 | | | 72,701 | |
| | 72,806 | | | CWABS Revolving Home Equity Loan Trust Series (d) | | US0001M + 0.280% | | 4.5980 | | 02/15/34 | | | 69,990 | |
| | 19,842 | | | CWABS Revolving Home Equity Loan Trust Series (d) | | US0001M + 0.280% | | 4.5980 | | 02/15/34 | | | 19,699 | |
| | 2,084,219 | | | CWHEQ Home Equity Loan Trust Series 2006-S5 | | | | 6.1550 | | 06/25/35 | | | 2,491,860 | |
| | 238,869 | | | CWHEQ Home Equity Loan Trust Series 2006-S6 (b) | | | | 5.9620 | | 03/25/34 | | | 227,554 | |
| | 248,990 | | | CWHEQ Home Equity Loan Trust Series 2006-S7 (b) | | | | 5.9450 | | 11/25/35 | | | 242,396 | |
| | 61,385 | | | CWHEQ Revolving Home Equity Loan Trust Series (d) | | US0001M + 0.240% | | 4.5580 | | 12/15/35 | | | 60,246 | |
| | 587,844 | | | CWHEQ Revolving Home Equity Loan Trust Series (d) | | US0001M + 0.240% | | 4.5580 | | 02/15/36 | | | 557,599 | |
| | 750,435 | | | CWHEQ Revolving Home Equity Loan Trust Series (d) | | US0001M + 0.340% | | 4.6580 | | 02/15/36 | | | 709,511 | |
| | 1,596,495 | | | CWHEQ Revolving Home Equity Loan Trust Series (d) | | US0001M + 0.200% | | 4.5180 | | 05/15/36 | | | 1,501,924 | |
| | 56,425 | | | CWHEQ Revolving Home Equity Loan Trust Series (d) | | US0001M + 0.140% | | 4.4580 | | 01/15/37 | | | 51,797 | |
| | 310,911 | | | FirstCity Capital Home Equity Loan Trust 1998-2 (c),(d) | | US0001M + 0.800% | | 5.9890 | | 01/25/29 | | | 301,781 | |
| | 325,211 | | | FirstCity Capital Home Equity Loan Trust 1998-2 (c) | | | | 6.9900 | | 01/25/29 | | | 314,920 | |
| | 243,507 | | | Fremont Home Loan Trust 1999-3(d) | | US0001M + 0.710% | | 5.0990 | | 12/25/29 | | | 222,568 | |
| | 248,379 | | | Fremont Home Loan Trust 1999-3(d) | | US0001M + 0.790% | | 5.1790 | | 12/25/29 | | | 227,270 | |
| | 160,663 | | | GMACM Home Equity Loan Trust 2004-HE1 (d) | | US0001M + 0.500% | | 4.8890 | | 06/25/34 | | | 155,797 | |
| | 314,494 | | | GMACM Home Equity Loan Trust 2004-HE1 (c),(d) | | US0001M + 0.500% | | 4.8890 | | 06/25/34 | | | 304,969 | |
| | 117,412 | | | GMACM Home Equity Loan Trust 2004-HE3 (c),(d) | | US0001M + 0.500% | | 4.8890 | | 10/25/34 | | | 116,036 | |
| | 13,589 | | | GMACM Home Equity Loan Trust 2005-HE1 (c),(d) | | US0001M + 0.500% | | 4.8890 | | 08/25/35 | | | 8,435 | |
| | 1,175,325 | | | GMACM Home Equity Loan Trust 2007-HE2 (d) | | US0001M + 0.140% | | 4.5290 | | 12/25/37 | | | 1,132,446 | |
| | 891,846 | | | GMACM Home Equity Loan Trust 2007-HE2 (f) | | | | 7.4240 | | 12/25/37 | | | 894,488 | |
| | 545,344 | | | GMACM Mortgage Loan Trust 2004-GH1 (f) | | | | 5.5000 | | 07/25/35 | | | 322,601 | |
| | 83,532 | | | GreenPoint Mortgage Funding Trust 2005-HE3 (d) | | US0001M + 0.180% | | 4.4980 | | 09/15/30 | | | 81,294 | |
| | 14,172 | | | GSAA Home Equity Trust 2005-2 (d) | | US0001M + 2.175% | | 6.5640 | | 12/25/34 | | | 23,953 | |
| | 2,984,641 | | | GSAA Home Equity Trust 2005-5 (d) | | US0001M + 2.550% | | 6.9390 | | 02/25/35 | | | 2,609,868 | |
| | 14,824 | | | GSAA Trust 2004-3 (f) | | | | 6.7200 | | 04/25/34 | | | 14,228 | |
| | 38,898 | | | Home Equity Asset Trust (d) | | US0001M + 1.500% | | 5.8890 | | 03/25/33 | | | 37,757 | |
| | 160,222 | | | Home Equity Asset Trust (d) | | US0001M + 4.750% | | 9.1390 | | 06/25/33 | | | 1,176,831 | |
| | 96,264 | | | Home Equity Asset Trust (d) | | US0001M + 3.250% | | 7.6390 | | 04/25/34 | | | 141,947 | |
| | 18,412 | | | Home Equity Asset Trust 2002-2 (d) | | US0001M + 2.600% | | 6.6160 | | 06/25/32 | | | 29,656 | |
| | 204,944 | | | Home Equity Loan Trust 2006-HSA3 (d) | | US0001M + 0.130% | | 4.5190 | | 05/25/36 | | | 202,266 | |
| | 196,997 | | | Home Equity Mortgage Loan Asset-Backed Trust (d) | | US0001M + 1.425% | | 5.8140 | | 10/25/33 | | | 186,084 | |
See accompanying notes which are an integral part of these financial statements.
| RATIONAL SPECIAL SITUATIONS INCOME FUND |
| SCHEDULE OF INVESTMENTS (Continued) |
| December 31, 2022 |
| Principal | | | | | | | Coupon Rate | | | | | |
| Amount ($) | | | | | Spread | | (%) | | Maturity | | Fair Value | |
| | | | | ASSET BACKED SECURITIES — 78.2% (Continued) | | | | | | | | | | |
| | | | | HOME EQUITY — 12.7% (Continued) | | | | | | | | | | |
| | 82,066 | | | Home Equity Mortgage Loan Asset-Backed Trust (d) | | US0001M + 2.025% | | 3.6110 | | 07/25/34 | | $ | 78,519 | |
| | 565,928 | | | Home Equity Mortgage Trust 2007-1 (d) | | US0001M + 0.340% | | 4.3560 | | 05/25/37 | | | 537,310 | |
| | 590,201 | | | Imc Home Equity Loan Trust 1998-3 (f) | | | | 5.4320 | | 08/20/29 | | | 570,293 | |
| | 97,934 | | | IMC Home Equity Loan Trust 1998-5 (f) | | | | 5.7050 | | 12/20/29 | | | 93,548 | |
| | 50,117 | | | Irwin Home Equity Loan Trust 2004-1 (d) | | US0001M + 1.875% | | 6.2640 | | 12/25/34 | | | 49,453 | |
| | 780,897 | | | Irwin Home Equity Loan Trust 2006-P1 (c),(d) | | US0001M + 0.280% | | 4.2960 | | 12/25/36 | | | 746,333 | |
| | 662,097 | | | Irwin Home Equity Loan Trust 2006-P1 (c),(f) | | | | 6.3000 | | 06/25/37 | | | 649,110 | |
| | 7,210 | | | IXIS Real Estate Capital Trust 2005-HE4 (d) | | US0001M + 0.630% | | 5.0190 | | 02/25/36 | | | 7,565 | |
| | 214,858 | | | MAFI II Remic Trust 1999-A (b),(c) | | | | 8.0000 | | 03/20/25 | | | 199,592 | |
| | 217,493 | | | Mastr Asset Backed Securities Trust 2003-NC1 (d) | | US0001M + 5.250% | | 4.1260 | | 04/25/33 | | | 214,920 | |
| | 68,912 | | | Mastr Asset Backed Securities Trust 2003-WMC2 (d) | | US0001M + 2.475% | | 3.8960 | | 08/25/33 | | | 68,405 | |
| | 802,305 | | | Mastr Asset Backed Securities Trust 2005-NC2 (d) | | US0001M + 0.500% | | 4.8890 | | 11/25/35 | | | 457,230 | |
| | 1,284,453 | | | Mastr Asset Backed Securities Trust 2005-NC2 (d) | | US0001M + 0.700% | | 5.0890 | | 11/25/35 | | | 731,983 | |
| | 55,334 | | | Meritage Mortgage Loan Trust 2003-1 (d) | | US0001M + 2.325% | | 6.7140 | | 11/25/33 | | | 52,453 | |
| | 927,752 | | | Merrill Lynch Mortgage Investors Trust Series (d) | | US0001M + 3.075% | | 7.4640 | | 10/25/35 | | | 874,965 | |
| | 5,696,583 | | | Merrill Lynch Mortgage Investors Trust Series (c),(d) | | US0001M + 1.125% | | 5.5140 | | 08/25/36 | | | 6,268,955 | |
| | 107,787 | | | Morgan Stanley A.B.S Capital I Inc Trust 2003-NC8 (d) | | US0001M + 3.150% | | 7.5390 | | 09/25/33 | | | 108,587 | |
| | 2,115 | | | Morgan Stanley A.B.S Capital I Inc Trust 2007-HE4 (d) | | US0001M + 0.110% | | 1.3510 | | 02/25/37 | | | 699 | |
| | 50,900 | | | Morgan Stanley Dean Witter Capital I Inc Trust (d) | | US0001M + 2.100% | | 6.4890 | | 02/25/32 | | | 50,770 | |
| | 112,851 | | | Morgan Stanley Dean Witter Capital I Inc Trust (d) | | US0001M + 3.300% | | 7.6890 | | 02/25/32 | | | 483,736 | |
| | 1,642,789 | | | Morgan Stanley Dean Witter Capital I Inc Trust (d) | | US0001M + 5.625% | | 10.0140 | | 02/25/33 | | | 1,655,724 | |
| | 45,375 | | | Morgan Stanley Dean Witter Capital I Inc Trust (d) | | US0001M + 5.625% | | 10.0140 | | 02/25/33 | | | 627,249 | |
| | 180,307 | | | Morgan Stanley Mortgage Loan Trust 2005-8SL (d) | | US0001M + 0.735% | | 5.1240 | | 11/25/35 | | | 364,099 | |
| | 104,089 | | | Morgan Stanley Mortgage Loan Trust 2006-16AX (d) | | US0001M + 0.340% | | 0.9590 | | 11/25/36 | | | 31,737 | |
| | 4,469,863 | | | Morgan Stanley Mortgage Loan Trust 2007-8XS (b) | | | | 6.0000 | | 04/25/37 | | | 2,868,457 | |
| | 406,077 | | | New Century Home Equity Loan Trust 2003-6 (d) | | US0001M + 1.080% | | 5.4690 | | 01/25/34 | | | 393,786 | |
| | 3,438 | | | New Century Home Equity Loan Trust Series 2003-5 (b) | | | | 4.8330 | | 11/25/33 | | | 3,316 | |
| | 1,522 | | | New Century Home Equity Loan Trust Series 2003-5 (f) | | | | 6.0000 | | 11/25/33 | | | 1,312 | |
| | 648,751 | | | NovaStar Mortgage Funding Trust Series 2003-2 (d) | | US0001M + 2.775% | | 7.1640 | | 09/25/33 | | | 652,518 | |
| | 140,560 | | | Option One Mortgage Loan Trust 2004-1 (d) | | US0001M + 1.650% | | 6.0390 | | 01/25/34 | | | 134,010 | |
| | 178,972 | | | Option One Mortgage Loan Trust 2004-1 (d) | | US0001M + 2.475% | | 6.8640 | | 01/25/34 | | | 149,578 | |
| | 251,359 | | | Option One Mortgage Loan Trust 2004-2 (d) | | US0001M + 1.575% | | 5.9640 | | 05/25/34 | | | 267,419 | |
| | 104,819 | | | Option One Mortgage Loan Trust 2004-2 (d) | | US0001M + 3.000% | | 7.3890 | | 05/25/34 | | | 101,712 | |
| | 965,504 | | | Option One Mortgage Loan Trust 2007-FXD1 (f) | | | | 5.8660 | | 01/25/37 | | | 780,571 | |
See accompanying notes which are an integral part of these financial statements.
| RATIONAL SPECIAL SITUATIONS INCOME FUND |
| SCHEDULE OF INVESTMENTS (Continued) |
| December 31, 2022 |
| Principal | | | | | | | Coupon Rate | | | | | |
| Amount ($) | | | | | Spread | | (%) | | Maturity | | Fair Value | |
| | | | | ASSET BACKED SECURITIES — 78.2% (Continued) | | | | | | | | | | |
| | | | | HOME EQUITY — 12.7% (Continued) | | | | | | | | | | |
| | 350,992 | | | Option One Mortgage Loan Trust 2007-FXD2 (f) | | | | 6.1020 | | 03/25/37 | | $ | 326,909 | |
| | 114,095 | | | RAAC Series 2004-SP1 Trust (f) | | | | 6.1180 | | 03/25/34 | | | 110,343 | |
| | 4,773 | | | RASC Series 2003-KS4 Trust (f) | | | | 4.6700 | | 06/25/33 | | | 4,754 | |
| | 2,742,835 | | | RASC Series 2004-KS11 Trust (d) | | US0001M + 1.000% | | 5.8890 | | 12/25/34 | | | 2,667,580 | |
| | 67,659 | | | Renaissance Home Equity Loan Trust 2002-4 (f) | | | | 7.5720 | | 03/25/33 | | | 10,966 | |
| | 137,582 | | | Renaissance Home Equity Loan Trust 2004-3 (f) | | | | 5.3240 | | 11/25/34 | | | 126,619 | |
| | 192,004 | | | Renaissance Home Equity Loan Trust 2005-4 (f) | | | | 5.8250 | | 02/25/36 | | | 178,809 | |
| | 16,318 | | | Saco I Trust 2007-1 (d) | | US0001M + 0.320% | | 4.7090 | | 01/25/37 | | | 16,093 | |
| | 35,386 | | | Saco I Trust 2007- (d) | | US0001M + 0.320% | | 4.7090 | | 02/25/37 | | | 34,985 | |
| | 2,131,276 | | | Saxon Asset Securities Trust 2001-2 (d) | | US0001M + 0.795% | | 5.1840 | | 03/25/31 | | | 1,798,564 | |
| | 31,201,035 | | | Soundview Home Loan Trust 2007-OPT4 (a),(b) | | | | 0.5800 | | 09/25/37 | | | 867,900 | |
| | 378,419 | | | Structured Asset Securities Corp Mortgage Pass | | | | 3.3750 | | 08/25/31 | | | 373,738 | |
| | 352,586 | | | Terwin Mortgage Trust 2004-1HE (c),(d) | | US0001M + 2.475% | | 6.8640 | | 02/25/34 | | | 312,444 | |
| | 2,299,763 | | | Terwin Mortgage Trust 2004-21HE (c),(d) | | US0001M + 2.625% | | 7.0140 | | 12/25/34 | | | 2,269,939 | |
| | 4,351,275 | | | Truman Capital Mortgage Loan Trust (c),(d) | | US0001M + 4.650% | | 9.0390 | | 11/25/32 | | | 3,666,707 | |
| | 12,926 | | | United National Home Loan Owner Trust 1999-1 (f) | | | | 6.9100 | | 03/25/25 | | | 12,859 | |
| | 29,513 | | | Wells Fargo Home Equity Asset-Backed Securities (b) | | | | 4.9800 | | 04/25/34 | | | 28,864 | |
| | 109,690 | | | Wells Fargo Home Equity Asset-Backed Securities (d) | | US0001M + 2.820% | | 7.2090 | | 10/25/34 | | | 108,126 | |
| | 693,175 | | | Wells Fargo Home Equity Asset-Backed Securities (d) | | US0001M + 2.550% | | 6.9390 | | 04/25/35 | | | 673,677 | |
| | | | | | | | | | | | | | 97,813,954 | |
| | | | | MANUFACTURED HOUSING — 2.7% | | | | | | | | | | |
| | 416,168 | | | ACE Securities Corp Manufactured Housing Trust (c),(e) | | | | — | | 08/15/30 | | | 367,514 | |
| | 2,152,514 | | | BCMSC Trust 1998-C (b) | | | | 7.5100 | | 01/15/29 | | | 1,939,975 | |
| | 731,888 | | | BCMSC Trust 1999-B (b) | | | | 1.2920 | | 12/15/29 | | | 100,261 | |
| | 611,382 | | | BCMSC Trust 1999-B (b) | | | | 1.2920 | | 12/15/29 | | | 86,214 | |
| | 4,944,914 | | | BCMSC Trust 1999-B (b) | | | | 1.2920 | | 12/15/29 | | | 722,560 | |
| | 737,790 | | | BCMSC Trust 1999-B (b) | | | | 1.2920 | | 12/15/29 | | | 113,748 | |
| | 1,936,475 | | | Conseco Finance Corporation (b) | | | | 7.0200 | | 10/15/27 | | | 1,795,322 | |
| | 279,028 | | | Conseco Finance Corporation (b) | | | | 7.5300 | | 03/15/28 | | | 261,975 | |
| | 2,324,675 | | | Conseco Finance Corporation (b) | | | | 7.5400 | | 06/15/28 | | | 2,283,575 | |
| | 3,496,655 | | | Conseco Finance Corporation (b) | | | | 7.2400 | | 11/15/28 | | | 3,302,909 | |
| | 360,170 | | | Conseco Finance Corporation (b) | | | | 6.9400 | | 12/01/28 | | | 331,632 | |
| | 2,902,363 | | | Conseco Finance Corporation (b) | | | | 3.7840 | | 03/01/30 | | | 1,183,658 | |
| | 140,816 | | | Deutsche Financial Capital Securitization, LLC | | | | 6.8000 | | 04/15/28 | | | 139,936 | |
See accompanying notes which are an integral part of these financial statements.
| RATIONAL SPECIAL SITUATIONS INCOME FUND |
| SCHEDULE OF INVESTMENTS (Continued) |
| December 31, 2022 |
| Principal | | | | | | | Coupon Rate | | | | | |
| Amount ($) | | | | | Spread | | (%) | | Maturity | | Fair Value | |
| | | | | ASSET BACKED SECURITIES — 78.2% (Continued) | | | | | | | | | | |
| | | | | MANUFACTURED HOUSING — 2.7% (Continued) | | | | | | | | | | |
| | 2,211,650 | | | Deutsche Financial Capital Securitization, LLC | | | | 7.2750 | | 04/15/28 | | $ | 2,024,526 | |
| | 7,953 | | | MERIT Securities Corporation Series 12-1 1M1(f) | | | | 7.6300 | | 07/28/33 | | | 7,886 | |
| | 1,019,094 | | | Morgan Stanley Resecuritization Trust 2015-R7 (b),(c) | | | | 7.0600 | | 02/26/29 | | | 947,263 | |
| | 9,091 | | | Oakwood Mortgage Investors, Inc. | | | | 7.7500 | | 08/15/27 | | | 8,571 | |
| | 621,088 | | | Oakwood Mortgage Investors, Inc. (b) | | | | 7.3250 | | 02/15/28 | | | 599,423 | |
| | 1,185,496 | | | Oakwood Mortgage Investors, Inc. (c) | | | | 7.4150 | | 01/15/29 | | | 1,128,484 | |
| | 1,090,174 | | | Oakwood Mortgage Investors, Inc. | | | | 8.4900 | | 10/15/30 | | | 1,013,107 | |
| | 152,900 | | | Oakwood Mortgage Investors, Inc. (b) | | | | 4.6700 | | 08/15/31 | | | 74,256 | |
| | 27,349 | | | Oakwood Mortgage Investors, Inc. (b) | | | | 5.1900 | | 06/15/32 | | | 27,052 | |
| | 1,894,931 | | | Origen Manufactured Housing Contract Trust 2006-A (b) | | | | 5.4000 | | 10/15/37 | | | 1,717,613 | |
| | 1,006,416 | | | Origen Manufactured Housing Contract Trust 2007-A (b) | | | | 6.2570 | | 04/15/37 | | | 924,387 | |
| | | | | | | | | | | | | | 21,101,847 | |
| | | | | NON AGENCY CMBS — 17.2% | | | | | | | | | | |
| | 3,562,470 | | | BAMLL Re-REMIC Trust 2016-RRGG10 (b),(c) | | | | 3.4370 | | 08/10/45 | | | 895,476 | |
| | 643,656 | | | Banc of America Commercial Mortgage Trust 2006-4 (b) | | | | 5.7540 | | 07/10/46 | | | 585,402 | |
| | 7,091,994 | | | Banc of America Commercial Mortgage Trust 2007-1 (b) | | | | 5.5230 | | 01/15/49 | | | 3,302,880 | |
| | 236,051 | | | Bayview Commercial Asset Trust 2004-2 (c),(d) | | US0001M + 0.645% | | 5.0340 | | 08/25/34 | | | 235,539 | |
| | 33,710 | | | Bayview Commercial Asset Trust 2004-3 (c),(d) | | US0001M + 1.500% | | 5.8890 | | 01/25/35 | | | 33,657 | |
| | 304,286 | | | Bayview Commercial Asset Trust 2005-3 (c),(d) | | US0001M + 1.650% | | 6.0390 | | 11/25/35 | | | 276,451 | |
| | 136,815 | | | Bayview Commercial Asset Trust 2006-2 (c),(d) | | US0001M + 1.305% | | 5.6940 | | 07/25/36 | | | 125,504 | |
| | 246,048 | | | Bear Stearns Asset Backed Securities Trust 2003-3 (d) | | US0001M + 1.230% | | 5.6190 | | 06/25/43 | | | 247,659 | |
| | 10,991 | | | Bear Stearns Commercial Mortgage Securities Trust (b) | | | | 5.5660 | | 01/12/45 | | | 10,609 | |
| | 1,710,577 | | | CD 2007-CD5 Mortgage Trust (b),(c) | | | | 6.3690 | | 11/15/44 | | | 1,696,836 | |
| | 3,401,495 | | | CG-CCRE Commercial Mortgage Trust 2014-FL1 (c),(d) | | US0001M + 1.150% | | 5.4680 | | 06/15/31 | | | 3,374,055 | |
| | 4,500,000 | | | CG-CCRE Commercial Mortgage Trust 2014-FL1 (c),(d) | | US0001M + 2.750% | | 7.0680 | | 06/15/31 | | | 3,352,500 | |
| | 33,357,611 | | | Citigroup Commercial Mortgage Trust 2014-GC23 (a),(b) | | | | 0.9040 | | 07/10/47 | | | 364,222 | |
| | 1,539,889 | | | COMM 2010-C1 Mortgage Trust (b),(c) | | | | 5.7920 | | 07/10/46 | | | 1,491,761 | |
| | 11,793 | | | COMM 2012-LC4 Mortgage Trust (b) | | | | 4.9340 | | 12/10/44 | | | 11,771 | |
| | 3,000,000 | | | COMM 2012-LC4 Mortgage Trust (b),(c) | | | | 5.2980 | | 12/10/44 | | | 2,130,133 | |
| | 13,577,001 | | | COMM 2013-CCRE11 Mortgage Trust(a),(b) | | | | 0.8970 | | 08/10/50 | | | 43,144 | |
| | 108,610,000 | | | COMM 2014-CCRE19 Mortgage Trust (a),(b),(c) | | | | 0.0001 | | 08/10/47 | | | 41,826 | |
| | 20,679,880 | | | COMM 2015-LC21 Mortgage Trust (a),(b) | | | | 0.6550 | | 07/10/48 | | | 263,348 | |
| | 3,716,234 | | | Commercial Mortgage Pass Through Certificates (c) | | | | 3.4000 | | 10/05/30 | | | 3,187,207 | |
| | 2,935,145 | | | CSMC 2014-USA OA, LLC (a),(b),(c) | | | | 0.5400 | | 09/15/37 | | | 33,454 | |
| | 2,236,410 | | | DBUBS 2011-LC3 Mortgage Trust (b),(c) | | | | 5.3610 | | 08/10/44 | | | 1,881,452 | |
See accompanying notes which are an integral part of these financial statements.
| RATIONAL SPECIAL SITUATIONS INCOME FUND |
| SCHEDULE OF INVESTMENTS (Continued) |
| December 31, 2022 |
| Principal | | | | | | | Coupon Rate | | | | | |
| Amount ($) | | | | | Spread | | (%) | | Maturity | | Fair Value | |
| | | | | ASSET BACKED SECURITIES — 78.2% (Continued) | | | | | | | | | | |
| | | | | NON AGENCY CMBS — 17.2% (Continued) | | | | | | | | | | |
| | 1,433,590 | | | Greenwich Capital Commercial Mortgage Trust (b),(c) | | | | 5.9280 | | 03/18/49 | | $ | 714,071 | |
| | 3,421,775 | | | GS Mortgage Securities Corporation II (c),(d) | | US0001M + 1.550% | | 6.1180 | | 09/15/31 | | | 2,867,147 | |
| | 1,838,294 | | | GS Mortgage Securities Corporation II (c),(d) | | US0001M + 2.750% | | 7.3180 | | 09/15/31 | | | 1,319,537 | |
| | 261,214 | | | GS Mortgage Securities Trust 2010-C1 (c) | | | | 5.1480 | | 08/10/43 | | | 257,765 | |
| | 3,000,000 | | | GS Mortgage Securities Trust 2010-C1 (b),(c) | | | | 5.6350 | | 08/10/43 | | | 2,931,476 | |
| | 13,558,000 | | | GS Mortgage Securities Trust 2010-C1 (b),(c) | | | | 6.3550 | | 08/10/43 | | | 10,510,841 | |
| | 546,000 | | | GS Mortgage Securities Trust 2011-GC5 (b),(c) | | | | 5.1540 | | 08/10/44 | | | 229,394 | |
| | 861,173 | | | GS Mortgage Securities Trust 2011-GC5 (b),(c) | | | | 5.1540 | | 08/10/44 | | | 845,760 | |
| | 1,000,000 | | | Harvest Commercial Capital Loan Trust 2020-1 (b),(c) | | | | 5.9640 | | 04/25/52 | | | 884,826 | |
| | 242,038 | | | Impac CMB Trust Series 2004-8 (d) | | US0001M + 1.575% | | 5.9640 | | 08/25/34 | | | 204,483 | |
| | 10,919,503 | | | JP Morgan Chase Commercial Mortgage Securities (c) | | | | 3.9100 | | 05/05/30 | | | 8,737,258 | |
| | 2,100,000 | | | JP Morgan Chase Commercial Mortgage Securities (b),(c) | | | | 5.7670 | | 11/15/43 | | | 1,745,386 | |
| | 7,400,327 | | | JP Morgan Chase Commercial Mortgage Securities (b),(c) | | | | 5.7670 | | 11/15/43 | | | 7,124,464 | |
| | 1,530,202 | | | JP Morgan Chase Commercial Mortgage Securities (b) | | | | 5.4890 | | 12/12/43 | | | 1,045,913 | |
| | 580,058 | | | JP Morgan Chase Commercial Mortgage Securities (b),(c) | | | | 4.9640 | | 05/15/45 | | | 433,488 | |
| | 1,246,105 | | | JP Morgan Chase Commercial Mortgage Securities (b),(c) | | | | 5.0130 | | 02/15/46 | | | 1,192,205 | |
| | 8,255,000 | | | JP Morgan Chase Commercial Mortgage Securities (b),(c) | | | | 5.3600 | | 02/15/46 | | | 7,701,882 | |
| | 5,378,000 | | | JP Morgan Chase Commercial Mortgage Securities (b),(c) | | | | 5.5250 | | 02/15/46 | | | 3,943,430 | |
| | 107,000 | | | JP Morgan Chase Commercial Mortgage Securities (b) | | | | 4.2310 | | 04/15/46 | | | 91,145 | |
| | 13,135,603 | | | JP Morgan Chase Commercial Mortgage Securities | | | | 5.3370 | | 05/15/47 | | | 12,249,457 | |
| | 4,000,000 | | | JP Morgan Chase Commercial Mortgage Securities (b),(c) | | | | 0.0001 | | 02/15/51 | | | 1,704,800 | |
| | 35,263 | | | JP Morgan Chase Commercial Mortgage Securities (b) | | | | 6.5140 | | 02/15/51 | | | 30,928 | |
| | 11,461,870 | | | JP Morgan Chase Commercial Mortgage Securities (b) | | | | 6.8240 | | 02/15/51 | | | 10,765,338 | |
| | 4,355,000 | | | LBSBC NIM Company 2005-2 (c) | | | | 5.5000 | | 09/27/30 | | | 4,337,576 | |
| | 58,547 | | | LBSBC NIM Company 2005-2 (c) | | | | 7.8600 | | 09/27/30 | | | 58,419 | |
| | 100 | | | LBSBN 2005-2A PS (h) | | | | — | | 09/27/30 | | | 2,350,000 | |
| | 9,517,029 | | | LB-UBS Commercial Mortgage Trust 2006-C6 (b) | | | | 5.4520 | | 09/15/39 | | | 4,161,863 | |
| | 2,856 | | | Merrill Lynch Mortgage Investors Trust Series (b),(c) | | | | 6.2500 | | 11/15/26 | | | 2,854 | |
| | 66,303 | | | Merrill Lynch Mortgage Trust 2005-CKI1 (b),(c) | | | | 5.1690 | | 11/12/37 | | | 35,970 | |
| | 278,799 | | | Merrill Lynch Mortgage Trust 2006-C1 (b) | | | | 6.4100 | | 05/12/39 | | | 259,037 | |
| | 568,336 | | | ML-CFC Commercial Mortgage Trust 2007-9 (b) | | | | 6.1930 | | 09/12/49 | | | 537,145 | |
| | 257,691 | | | ML-CFC Commercial Mortgage Trust 2007-9 (b) | | | | 6.2220 | | 09/12/49 | | | 243,542 | |
| | 545,000 | | | Morgan Stanley Capital I Trust 2011-C2 (b),(c) | | | | 5.2110 | | 06/15/44 | | | 326,589 | |
| | 131,281 | | | Morgan Stanley Capital I Trust 2011-C2 (b),(c) | | | | 5.2110 | | 06/15/44 | | | 123,139 | |
See accompanying notes which are an integral part of these financial statements.
| RATIONAL SPECIAL SITUATIONS INCOME FUND |
| SCHEDULE OF INVESTMENTS (Continued) |
| December 31, 2022 |
| Principal | | | | | | | Coupon Rate | | | | | |
| Amount ($) | | | | | Spread | | (%) | | Maturity | | Fair Value | |
| | | | | ASSET BACKED SECURITIES — 78.2% (Continued) | | | | | | | | | | |
| | | | | NON AGENCY CMBS — 17.2% (Continued) | | | | | | | | | | |
| | 991,000 | | | Morgan Stanley Capital I Trust 2011-C3 (b),(c) | | | | 5.0830 | | 07/15/49 | | $ | 955,080 | |
| | 2,799,000 | | | Morgan Stanley Capital I Trust 2011-C3 (b),(c) | | | | 5.0830 | | 07/15/49 | | | 2,386,131 | |
| | 1,787,950 | | | Morgan Stanley Capital I Trust 2011-C3 (b),(c) | | | | 5.0830 | | 07/15/49 | | | 1,121,042 | |
| | 1,714,000 | | | Morgan Stanley Capital I Trust 2011-C3 (b),(c) | | | | 5.0830 | | 07/15/49 | | | 941,254 | |
| | 3,000,000 | | | ReadyCap Commercial Mortgage Trust 2018-4 (b),(c) | | | | 5.2170 | | 02/27/51 | | | 2,382,195 | |
| | 8,000,000 | | | TMSQ 2014-1500 Mortgage Trust (a),(b),(c) | | | | 0.1550 | | 10/10/36 | | | 20,376 | |
| | 22,807 | | | UBS Commercial Mortgage Trust 2012-C1 (b),(c) | | | | 6.4460 | | 05/10/45 | | | 21,806 | |
| | 265,000 | | | UBS-Citigroup Commercial Mortgage Trust 2011-C1 (b),(c) | | | | 0.0001 | | 01/10/45 | | | 114,968 | |
| | 237,915 | | | UBS-Citigroup Commercial Mortgage Trust 2011-C1 (b),(c) | | | | 6.4610 | | 01/10/45 | | | 199,056 | |
| | 1,441,368 | | | Wachovia Bank Commercial Mortgage Trust Series (b),(c) | | | | 5.3100 | | 01/15/41 | | | 1,406,810 | |
| | 1,236,701 | | | Wachovia Bank Commercial Mortgage Trust Series (b),(c) | | | | 5.1010 | | 10/15/44 | | | 1,045,012 | |
| | 1,479,000 | | | WFRBS Commercial Mortgage Trust 2011-C4 (b),(c) | | | | 4.8440 | | 06/15/44 | | | 1,322,816 | |
| | 225,000 | | | WFRBS Commercial Mortgage Trust 2013-C11 (b),(c) | | | | 4.2480 | | 03/15/45 | | | 207,068 | |
| | 547,000 | | | WFRBS Commercial Mortgage Trust 2013-UBS1 (b),(c) | | | | 5.0240 | | 03/15/46 | | | 519,517 | |
| | 3,899,924 | | | WFRBS Commercial Mortgage Trust 2014-C19 (a),(b) | | | | 0.9630 | | 03/15/47 | | | 30,023 | |
| | 3,555,000 | | | X-Caliber Funding, LLC(c),(d) | | | | 13.0000 | | 05/15/25 | | | 3,594,653 | |
| | 3,000,000 | | | X-Caliber Funding, LLC (c),(d) | | US0001M + 3.000% | | 6.7680 | | 01/06/26 | | | 2,915,470 | |
| | | | | | | | | | | | | | 132,735,291 | |
| | | | | OTHER ABS — 0.4% | | | | | | | | | | |
| | 94,974 | | | AFC Trust Series 2000-4 (c),(d) | | US0001M + 0.770% | | 5.1590 | | 01/25/31 | | | 90,229 | |
| | 1,196,151 | | | Legal Fee Funding 2006-1, LLC (c) | | | | 8.0000 | | 07/20/36 | | | 1,196,151 | |
| | 146,591 | | | Oakwood Mortgage Investors, Inc. (b),(c) | | | | 8.4500 | | 10/15/26 | | | 145,172 | |
| | 1,504,031 | | | PEAR 2020-1, LLC (c) | | | | 3.7500 | | 12/15/32 | | | 1,471,626 | |
| | | | | | | | | | | | | | 2,903,178 | |
| | | | | RESIDENTIAL MORTGAGE — 11.1% | | | | | | | | | | |
| | 992,136 | | | Ameriquest Mortgage Securities Asset-Backed (d) | | US0001M + 2.760% | | 7.1490 | | 05/25/34 | | | 869,174 | |
| | 313,435 | | | Amortizing Residential Collateral Trust(d) | | US0001M + 0.290% | | 4.6560 | | 10/25/31 | | | 285,474 | |
| | 446,263 | | | Bear Stearns Asset Backed Securities Trust (d) | | US0001M + 0.900% | | 5.2890 | | 12/25/33 | | | 420,352 | |
| | 1,788,000 | | | Bear Stearns Asset Backed Securities Trust (d) | | US0001M + 2.250% | | 6.6390 | | 04/25/36 | | | 1,717,983 | |
| | 24,811 | | | Bear Stearns Asset Backed Securities Trust (b) | | | | 3.4890 | | 07/25/36 | | | 24,452 | |
| | 49,333 | | | Bear Stearns Asset Backed Securities Trust | | | | 5.5000 | | 08/25/36 | | | 48,904 | |
| | 331,786 | | | Bear Stearns Asset Backed Securities Trust (d) | | 12MTA + 0.980% | | 1.1740 | | 10/25/36 | | | 121,495 | |
| | 348,440 | | | Bear Stearns Asset Backed Securities Trust | | | | 6.0000 | | 10/25/36 | | | 188,172 | |
| | 277,237 | | | Bear Stearns Asset Backed Securities Trust (d) | | US0001M + 3.150% | | 7.5390 | | 11/25/39 | | | 265,838 | |
See accompanying notes which are an integral part of these financial statements.
| RATIONAL SPECIAL SITUATIONS INCOME FUND |
| SCHEDULE OF INVESTMENTS (Continued) |
| December 31, 2022 |
| Principal | | | | | | | Coupon Rate | | | | | |
| Amount ($) | | | | | Spread | | (%) | | Maturity | | Fair Value | |
| | | | | ASSET BACKED SECURITIES — 78.2% (Continued) | | | | | | | | | | |
| | | | | RESIDENTIAL MORTGAGE — 11.1% (Continued) | | | | | | | | | | |
| | 902,000 | | | Bear Stearns Asset Backed Securities Trust (d) | | US0001M + 3.150% | | 7.5390 | | 12/25/42 | | $ | 930,281 | |
| | 550,000 | | | Bear Stearns Asset Backed Securities Trust (d) | | US0001M + 3.150% | | 7.5390 | | 12/25/42 | | | 574,245 | |
| | 34,843 | | | Bear Stearns Asset Backed Securities Trust (e) | | | | | | 09/25/46 | | | 24,456 | |
| | 169,399 | | | Bear Stearns Asset Backed Securities Trust | | | | 5.5000 | | 09/25/46 | | | 147,213 | |
| | 2,987,000 | | | Bear Stearns Asset Backed Securities Trust 2006-2 (d) | | US0001M + 2.625% | | 7.0140 | | 07/25/36 | | | 2,927,033 | |
| | 48,471 | | | Carrington Mortgage Loan Trust Series 2005-FRE1 (d) | | US0001M + 0.705% | | 5.0940 | | 12/25/35 | | | 48,300 | |
| | 53,898 | | | Chase Funding Trust Series 2003-6 (f) | | | | 4.8740 | | 11/25/34 | | | 52,993 | |
| | 677,553 | | | Chase Funding Trust Series 2003-6 (d) | | US0001M + 0.750% | | 5.1390 | | 11/25/34 | | | 689,464 | |
| | 379 | | | Citicorp Residential Mortgage Trust Series 2007-2 (f) | | | | 4.7290 | | 06/25/37 | | | 375 | |
| | 4,888 | | | Citigroup Mortgage Loan Trust, Inc. (f) | | | | 6.0300 | | 11/25/34 | | | 4,863 | |
| | 146,393 | | | Citigroup Mortgage Loan Trust, Inc. (d) | | US0001M + 2.625% | | 7.0140 | | 11/25/34 | | | 817,507 | |
| | 452,008 | | | Countrywide Asset-Backed Certificates (d) | | US0001M + 2.625% | | 7.0140 | | 10/25/33 | | | 448,928 | |
| | 1,068,823 | | | Countrywide Asset-Backed Certificates (d) | | US0001M + 0.660% | | 5.0490 | | 11/25/33 | | | 991,808 | |
| | 23,047 | | | Countrywide Asset-Backed Certificates (c),(f) | | | | 5.5000 | | 08/25/35 | | | 22,736 | |
| | 665,509 | | | Countrywide Asset-Backed Certificates (f) | | | | 4.0110 | | 01/25/37 | | | 526,028 | |
| | 972,529 | | | Countrywide Asset-Backed Certificates (d) | | US0001M + 0.500% | | 4.8890 | | 05/25/37 | | | 758,113 | |
| | 9,359 | | | Credit-Based Asset Servicing and Securitization (b),(c) | | | | 4.7040 | | 02/03/29 | | | 7,186 | |
| | 7,568 | | | Credit-Based Asset Servicing and Securitization (d) | | US0001M + 2.850% | | 7.2390 | | 06/25/32 | | | 7,552 | |
| | 133,917 | | | Credit-Based Asset Servicing and Securitization (d) | | US0001M + 2.100% | | 4.0320 | | 12/25/33 | | | 132,526 | |
| | 294,430 | | | Credit-Based Asset Servicing and Securitization (f) | | | | 3.0240 | | 12/25/36 | | | 230,768 | |
| | 727,319 | | | Credit-Based Asset Servicing and Securitization (c),(d) | | US0001M + 0.460% | | 4.8490 | | 02/25/37 | | | 568,472 | |
| | 456,498 | | | Credit-Based Asset Servicing and Securitization (c),(f) | | | | 4.7180 | | 12/25/37 | | | 476,738 | |
| | 1,564,462 | | | Credit-Based Asset Servicing and Securitization (c),(d) | | US0001M + 3.000% | | 7.3890 | | 05/25/50 | | | 1,584,921 | |
| | 553,042 | | | CSFB Mortgage-Backed Pass-Through Certificates (d) | | US0001M + 4.000% | | 8.3890 | | 02/25/32 | | | 553,403 | |
| | 306,809 | | | CWABS Asset-Backed Certificates Trust 2004-13 (b) | | | | 5.5680 | | 01/25/35 | | | 193,160 | |
| | 40,779 | | | CWABS Asset-Backed Certificates Trust 2005-16 (b) | | | | 4.3410 | | 05/25/36 | | | 39,917 | |
| | 282,171 | | | CWABS Asset-Backed Certificates Trust 2005-17 (f) | | | | 3.8140 | | 05/25/36 | | | 225,230 | |
| | 323,911 | | | Equity One Mortgage Pass-Through Trust 2002-1 (b) | | | | 6.2820 | | 08/25/32 | | | 302,953 | |
| | 1,079,981 | | | Fannie Mae Grantor Trust 2004-T5 (b) | | | | 4.3200 | | 05/28/35 | | | 978,922 | |
| | 209,469 | | | Finance America Mortgage Loan Trust 2004-3 (d) | | US0001M + 0.945% | | 5.3340 | | 11/25/34 | | | 179,709 | |
| | 195,762 | | | Finance America Mortgage Loan Trust 2004-3 (d) | | US0001M + 1.020% | | 5.4090 | | 11/25/34 | | | 167,408 | |
| | 198,463 | | | First Franklin Mortgage Loan Trust 2003-FFB (b) | | | | 0.0001 | | 02/25/33 | | | 200,000 | |
| | 157,074 | | | First Franklin Mortgage Loan Trust 2004-FF2 (d) | | US0001M + 1.500% | | 5.8890 | | 03/25/34 | | | 142,341 | |
| | 592,880 | | | First Franklin Mortgage Loan Trust 2004-FFA (c) (h) | | | | | | 03/25/24 | | | 590,000 | |
See accompanying notes which are an integral part of these financial statements.
| RATIONAL SPECIAL SITUATIONS INCOME FUND |
| SCHEDULE OF INVESTMENTS (Continued) |
| December 31, 2022 |
| Principal | | | | | | | Coupon Rate | | | | | |
| Amount ($) | | | | | Spread | | (%) | | Maturity | | Fair Value | |
| | | | | ASSET BACKED SECURITIES — 78.2% (Continued) | | | | | | | | | | |
| | | | | RESIDENTIAL MORTGAGE — 11.1% (Continued) | | | | | | | | | | |
| | 1,924,911 | | | Fremont Home Loan Trust 2002-2 (d) | | US0001M + 1.725% | | 6.1140 | | 10/25/33 | | $ | 1,922,066 | |
| | 35,506 | | | Fremont Home Loan Trust 2004-B (d) | | US0001M + 3.000% | | 7.3890 | | 05/25/34 | | | 32,744 | |
| | 24,475 | | | Fremont Home Loan Trust 2005-A (d) | | US0001M + 0.735% | | 5.1240 | | 01/25/35 | | | 23,519 | |
| | 36,637 | | | GSAMP Trust 2003-SEA2 (f) | | | | 5.4210 | | 07/25/33 | | | 33,500 | |
| | 98,070 | | | GSAMP Trust 2004-HE1 (d) | | US0001M + 0.825% | | 5.2140 | | 05/25/34 | | | 87,136 | |
| | 4,459,473 | | | GSAMP Trust 2006-S6(d) | | US0001M + 0.200% | | 0.0040 | | 10/25/36 | | | 46,110 | |
| | 12,940,262 | | | GSAMP Trust 2006-S6(d) | | US0001M + 0.460% | | 0.0050 | | 10/25/36 | | | 133,519 | |
| | 33,060,729 | | | GSAMP Trust 2006-S6(f) | | | | 0.0230 | | 10/25/36 | | | 246,577 | |
| | 356,937 | | | GSRPM Mortgage Loan Trust Series 2004-1 (c),(d) | | US0001M + 3.750% | | 8.1390 | | 09/25/42 | | | 354,170 | |
| | 564,822 | | | Lehman XS Trust 2007-3 (d) | | US0001M + 0.320% | | 4.7090 | | 03/25/37 | | | 444,135 | |
| | 3,582,089 | | | Lehman XS Trust Series 2005-4 (d) | | US0001M + 0.750% | | 5.1390 | | 10/25/35 | | | 3,663,140 | |
| | 4,624,284 | | | Long Beach Mortgage Loan Trust 2005-WL1 (d) | | US0001M + 0.975% | | 5.3640 | | 06/25/45 | | | 4,517,498 | |
| | 25,423,727 | | | Long Beach Mortgage Loan Trust 2006-A(d) | | US0001M + 0.180% | | 0.0450 | | 05/25/36 | | | 579,849 | |
| | 16,454,079 | | | Long Beach Mortgage Loan Trust 2006-A(d) | | US0001M + 0.400% | | 0.0560 | | 05/25/36 | | | 379,464 | |
| | 1,772,639 | | | Merrill Lynch Mortgage Investors Trust Series (d) | | US0001M + 4.275% | | 8.6640 | | 02/25/34 | | | 1,507,788 | |
| | 1,826,230 | | | Morgan Stanley A.B.S Capital I Inc Trust 2005-WMC2 (d) | | US0001M + 0.705% | | 5.0940 | | 02/25/35 | | | 1,771,224 | |
| | 2,169,980 | | | Ownit Mortgage Loan Trust Series 2005-4 (d) | | US0001M + 0.825% | | 5.2140 | | 08/25/36 | | | 1,939,345 | |
| | 1,763,508 | | | Park Place Securities Inc Asset-Backed (d) | | US0001M + 1.650% | | 6.0390 | | 12/25/34 | | | 1,771,277 | |
| | 129,354 | | | PFCA Home Equity Investment Trust (b),(c) | | | | 4.4890 | | 01/22/35 | | | 119,164 | |
| | 204,461 | | | PFCA Home Equity Investment Trust (b),(c) | | | | 3.4150 | | 08/25/35 | | | 175,026 | |
| | 3,080,000 | | | RAAC Series 2005-RP2 Trust (c),(d) | | US0001M + 2.000% | | 6.3890 | | 06/25/35 | | | 3,077,874 | |
| | 8,156,982 | | | RAAC Series 2005-SP3 Trust (h) | | | | | | 12/25/35 | | | 5,600,000 | |
| | 8,554,000 | | | RAAC Series 2006-RP1 Trust (c),(d) | | US0001M + 1.850% | | 6.2390 | | 10/25/45 | | | 8,461,808 | |
| | 2,759,324 | | | RAAC Series 2006-RP1 Trust (c),(d) | | US0001M + 1.875% | | 6.2640 | | 10/25/45 | | | 2,745,148 | |
| | 4,000,000 | | | RAAC Series 2006-RP4 Trust (d) | | US0001M + 1.500% | | 5.8890 | | 01/25/46 | | | 3,820,754 | |
| | 4,638,000 | | | RAAC Series 2006-RP4 Trust (d) | | US0001M + 2.000% | | 6.3890 | | 01/25/46 | | | 4,327,066 | |
| | 1,648,949 | | | RAAC Series 2006-SP1 Trust (d) | | US0001M + 0.825% | | 5.2140 | | 09/25/45 | | | 1,135,112 | |
| | 1,630,421 | | | RAAC Series 2006-SP4 Trust(d) | | US0001M + 2.400% | | 6.7890 | | 11/25/36 | | | 1,797,135 | |
| | 384,275 | | | RAMP Series 2003-RS10 Trust (d) | | US0001M + 1.700% | | 4.3860 | | 11/25/33 | | | 359,335 | |
| | 650,166 | | | RAMP Series 2003-RS7 Trust (d) | | US0001M + 1.800% | | 4.3960 | | 08/25/33 | | | 602,576 | |
| | 590,794 | | | RAMP Series 2004-SL3 Trust | | | | 8.5000 | | 12/25/31 | | | 291,066 | |
| | 176,762 | | | RAMP Series 2006-RS6 Trust (d) | | US0001M + 0.540% | | 4.9290 | | 11/25/36 | | | 147,235 | |
| | 696,533 | | | RFSC Series 2002-RP2 Trust (c),(d) | | US0001M + 1.500% | | 5.8890 | | 10/25/32 | | | 684,851 | |
| | 239,854 | | | RFSC Trust Series 2002-RP1 A1(c),(d) | | US0001M + 0.860% | | 5.2490 | | 03/25/33 | | | 233,902 | |
See accompanying notes which are an integral part of these financial statements.
| RATIONAL SPECIAL SITUATIONS INCOME FUND |
| SCHEDULE OF INVESTMENTS (Continued) |
| December 31, 2022 |
| Principal | | | | | | | Coupon Rate | | | | | |
| Amount ($) | | | | | Spread | | (%) | | Maturity | | Fair Value | |
| | | | | ASSET BACKED SECURITIES — 78.2% (Continued) | | | | | | | | | | |
| | | | | RESIDENTIAL MORTGAGE — 11.1% (Continued) | | | | | | | | | | |
| | 71,796 | | | SACO I Trust 2005-WM2 (d) | | US0001M + 0.825% | | 5.2140 | | 07/25/35 | | $ | 70,362 | |
| | 48,196 | | | SACO I Trust 2006-6 (d) | | US0001M + 0.260% | | 4.6490 | | 06/25/36 | | | 46,948 | |
| | 576,011 | | | Sail Net Interest Margin Notes (c) | | | | 7.0000 | | 07/27/33 | | | 1,728,033 | |
| | 3,199,947 | | | SASCO ARC NIM 2003-5 20330627(c) | | | | 6.0000 | | 06/27/33 | | | 3,118,694 | |
| | 192,165 | | | Soundview Home Loan Trust 2004-1 (d) | | US0001M + 1.020% | | 5.4090 | | 07/25/34 | | | 188,154 | |
| | 95,493 | | | Soundview Home Loan Trust 2004-1 (d) | | US0001M + 2.925% | | 7.3140 | | 07/25/34 | | | 77,579 | |
| | 930,065 | | | Soundview Home Loan Trust 2004-1 (d) | | US0001M + 4.875% | | 9.2640 | | 07/25/34 | | | 740,761 | |
| | 2,878,885 | | | Structured Asset Investment Loan Trust 2004-8 (d) | | US0001M + 3.750% | | 8.1390 | | 09/25/34 | | | 2,685,810 | |
| | 396,745 | | | Structured Asset Securities Corp Mortgage (f) | | | | 6.0500 | | 03/25/34 | | | 389,644 | |
| | 47,081 | | | Structured Asset Securities Corp Mortgage Loan (d) | | US0001M + 1.500% | | 5.2680 | | 02/25/35 | | | 46,367 | |
| | 475,439 | | | Structured Asset Securities Corp Mortgage Loan (d) | | US0001M + 0.630% | | 5.0190 | | 05/25/35 | | | 461,529 | |
| | 470,541 | | | Structured Asset Securities Corp Mortgage Loan (d) | | US0001M + 0.945% | | 5.3340 | | 05/25/35 | | | 440,789 | |
| | 357,135 | | | Structured Asset Securities Corp Mortgage Loan (d) | | US0001M + 0.990% | | 5.3790 | | 05/25/35 | | | 330,310 | |
| | 145,141 | | | Structured Asset Securities Corp Mortgage Loan (d) | | US0001M + 1.650% | | 6.0390 | | 05/25/35 | | | 135,920 | |
| | 7,134 | | | Structured Asset Securities Corp Mortgage Loan (d) | | US0001M + 0.435% | | 4.8240 | | 06/25/35 | | | 7,104 | |
| | 3,719,058 | | | Washington Mutural Asset-Backed Certificates WMABS (d) | | US0001M + 0.155% | | 3.9390 | | 10/25/36 | | | 2,770,268 | |
| | | | | | | | | | | | | | 85,756,778 | |
| | | | | TO BE CLASSIFIED — 0.2% | | | | | | | | | | |
| | 675,000 | | | Genesis Private Label Amortizing Trust 2020-1 (c) | | | | 9.7600 | | 07/20/30 | | | 660,122 | |
| | 708,108 | | | GSR Mortgage Loan Trust 2007-AR1(b) | | | | 3.1110 | | 03/25/37 | | | 428,582 | |
| | | | | | | | | | | | | | 1,088,704 | |
| | | | | WHOLE BUSINESS — 0.1% | | | | | | | | | | |
| | 2,000,000 | | | LOANME TRUST SBL 2019-1 (c),(f) | | | | 11.5000 | | 08/15/30 | | | 700,056 | |
| | | | | | | | | | | | | | | |
| | | | | TOTAL ASSET BACKED SECURITIES (Cost $646,116,962) | | | | | | | | | 603,067,190 | |
| | | | | | | | | | | | | | | |
| | | | | CORPORATE BONDS — 16.4% | | | | | | | | | | |
| | | | | BANKING — 0.5% | | | | | | | | | | |
| | 3,410,000 | | | Southern Financial | | | | 10.6000 | | 09/07/30 | | | 3,447,966 | |
See accompanying notes which are an integral part of these financial statements.
| RATIONAL SPECIAL SITUATIONS INCOME FUND |
| SCHEDULE OF INVESTMENTS (Continued) |
| December 31, 2022 |
| Principal | | | | | | | Coupon Rate | | | | | |
| Amount ($) | | | | | Spread | | (%) | | Maturity | | Fair Value | |
| | | | | CORPORATE BONDS — 16.7% (Continued) | | | | | | | | | | |
| | | | | INSURANCE — 12.6% | | | | | | | | | | |
| | 53,493,780 | | | Ambac Assurance Corporation(c) (h) | | | | — | | 06/07/69 | | $ | 74,891,293 | |
| | 6,740,089 | | | AMBAC Assurance Corporation(c) | | | | 8.5000 | | 02/12/55 | | | 6,335,683 | |
| | 10,652,561 | | | MBIA Global Funding, LLC(c),(e) | | | | — | | 12/15/31 | | | 4,474,076 | |
| | 34,994,582 | | | MBIA Global Funding, LLC(e) (g) | | | | — | | 12/15/33 | | | 11,198,266 | |
| | | | | | | | | | | | | | 96,899,318 | |
| | | | | SPECIALTY FINANCE — 1.2% | | | | | | | | | | |
| | 2,000,000 | | | OWS Cre Funding I, LLC(c),(d) | | US0001M + 4.900% | | 9.0200 | | 09/15/23 | | | 1,909,889 | |
| | 2,000,000 | | | PDOF MSN Issuer, LLC(c) | | SOFRRATE + 4.500% | | 8.8000 | | 03/01/25 | | | 1,958,139 | |
| | 1,000,000 | | | US Capital Funding II Ltd. Capital Funding II(c),(d) (g) | | US0003M + 1.650% | | 6.0900 | | 08/01/34 | | | 813,800 | |
| | 4,000,000 | | | X-Caliber Funding, LLC(c) | | | | 5.0000 | | 09/24/24 | | | 3,577,401 | |
| | 1,275,000 | | | X-Caliber Funding, LLC(c) | | | | 11.0000 | | 09/24/24 | | | 1,230,967 | |
| | | | | | | | | | | | | | 9,490,196 | |
| | | | | SYNDICATED LOANS — 1.7% | | | | | | | | | | |
| | 8,472,191 | | | MSP DEER FINANCE SYNDICATED LOAN | | | | 17.0000 | | 04/09/25 | | | 8,472,191 | |
| | 4,801,926 | | | WATTS GUERRA 005-A DEER FINANCE SYNDICATE LOAN | | | | 15.5000 | | 10/30/25 | | | 4,801,926 | |
| | | | | | | | | | | | | | 13,274,117 | |
| | | | | TRANSPORTATION & LOGISTICS — 0.4% | | | | | | | | | | |
| | 2,906,116 | | | American Airlines 2013-1 Class A Pass Through | | | | 4.0000 | | 01/15/27 | | | 2,521,006 | |
| | 100,691 | | | American Airlines 2013-2 Class A Pass Through | | | | 4.9500 | | 01/15/23 | | | 100,554 | |
| | 624,026 | | | US Airways 2013-1 Class A Pass Through Trust | | | | 3.9500 | | 11/15/25 | | | 567,179 | |
| | | | | | | | | | | | | | 3,188,739 | |
| | | | | | | | | | | | | | | |
| | | | | TOTAL CORPORATE BONDS (Cost $127,867,274) | | | | | | | | | 126,300,336 | |
| | | | | | | | | | | | | | | |
| | | | | PREFERRED STOCK — 0.3% | | | | | | | | | | |
| | 252,709 | | | CIB Marine (e) | | | | 0.0000 | | 06/01/35 | | | 159,206 | |
| | 3,212,202 | | | CIB Marine (e) | | | | 0.0000 | | 06/01/35 | | | 2,023,688 | |
| | | | | TOTAL PREFERRED STOCK (Cost $2,065,953) | | | | | | | | | 2,182,894 | |
| | | | | | | | | | | | | | | |
| | | | | TOTAL INVESTMENTS — 94.9% (Cost $776,050,189) | | | | | | | | $ | 731,550,420 | |
| | | | | OTHER ASSETS IN EXCESS OF LIABILITIES- 5.1% | | | | | | | | | 39,067,260 | |
| | | | | NET ASSETS - 100.0% | | | | | | | | $ | 770,617,680 | |
See accompanying notes which are an integral part of these financial statements.
| RATIONAL SPECIAL SITUATIONS INCOME FUND |
| SCHEDULE OF INVESTMENTS (Continued) |
| December 31, 2022 |
| LLC | - Limited Liability Company |
| REMIC | - Real Estate Mortgage Investment Conduit |
| 12MTA | Federal Reserve US 12 Month Cumulative Avg 1 Year CMT |
| COF 11 | Cost of Funds for the 11th District of San Francisco |
| H15T1Y | US Treasury Yield Curve Rate T Note Constant Maturity 1 Year |
| SOFR30A | United States 30 Day Average SOFR Secured Overnight Financing Rate |
| SOFRRATE | United States SOFR Secured Overnight Financing Rate |
| US0001M | ICE LIBOR USD 1 Month |
| US0003M | ICE LIBOR USD 3 Month |
| US0006M | ICE LIBOR USD 6 Month |
| US0012M | ICE LIBOR USD 12 Month |
| (a) | Interest only securities. |
| (b) | Variable or floating rate security, the interest rate of which adjusts periodically based on changes in current interest rates and prepayments on the underlying pool of assets. |
| (c) | Security exempt from registration under Rule 144A or Section 4(2) of the Securities Act of 1933. The security may be resold in transactions exempt from registration, normally to qualified institutional buyers. As of December 31, 2022, the total market value of 144A securities is $315,344,929 or 40.9% of net assets. |
| (d) | Variable rate security; the rate shown represents the rate on December 31, 2022. |
| (f) | Step bond. Coupon rate is fixed rate that changes on a specified date. The rate shown is the current rate at December 31, 2022. |
| (g) | Illiquid security. At December 31, 2022, the total market value of illiquid securities is $15,101,796 or 1.96% of net assets. |
| (h) | Amount is less than 0.00005%. |
See accompanying notes which are an integral part of these financial statements.
| RATIONAL INFLATION GROWTH FUND |
| SCHEDULE OF INVESTMENTS |
| December 31, 2022 |
| Shares | | | | | Fair Value | |
| | | | | COMMON STOCKS — 81.6% | | | | |
| | | | | AEROSPACE & DEFENSE - 2.7% | | | | |
| | 247 | | | Boeing Company (The)(a) | | $ | 47,051 | |
| | 538 | | | Raytheon Technologies Corporation | | | 54,295 | |
| | | | | | | | 101,346 | |
| | | | | ASSET MANAGEMENT - 1.3% | | | | |
| | 773 | | | Apollo Global Management, Inc. | | | 49,310 | |
| | | | | | | | | |
| | | | | BANKING - 4.3% | | | | |
| | 1,158 | | | Bank of America Corporation | | | 38,353 | |
| | 790 | | | Citigroup, Inc. | | | 35,732 | |
| | 330 | | | JPMorgan Chase & Company | | | 44,253 | |
| | 1,001 | | | Wells Fargo & Company | | | 41,331 | |
| | | | | | | | 159,669 | |
| | | | | BEVERAGES - 1.3% | | | | |
| | 748 | | | Coca-Cola Company (The) | | | 47,580 | |
| | | | | | | | | |
| | | | | CHEMICALS - 5.0% | | | | |
| | 186 | | | Air Products and Chemicals, Inc. | | | 57,337 | |
| | 245 | | | Ecolab, Inc. | | | 35,662 | |
| | 155 | | | Linde plc | | | 50,558 | |
| | 170 | | | Sherwin-Williams Company (The) | | | 40,346 | |
| | | | | | | | 183,903 | |
| | | | | DIVERSIFIED INDUSTRIALS - 1.3% | | | | |
| | 233 | | | Honeywell International, Inc. | | | 49,932 | |
| | | | | | | | | |
| | | | | ENTERTAINMENT CONTENT - 1.4% | | | | |
| | 1,462 | | | Paramount Global, Class B | | | 24,679 | |
| | 330 | | | Walt Disney Company (The)(a) | | | 28,670 | |
| | | | | | | | 53,349 | |
| | | | | INDUSTRIAL REIT - 1.0% | | | | |
| | 338 | | | Prologis, Inc. | | | 38,103 | |
| | | | | | | | | |
| | | | | INSURANCE - 7.1% | | | | |
| | 365 | | | Allstate Corporation (The) | | | 49,494 | |
| | 163 | | | Berkshire Hathaway, Inc., Class B(a) | | | 50,351 | |
See accompanying notes which are an integral part of these financial statements.
| RATIONAL INFLATION GROWTH FUND |
| SCHEDULE OF INVESTMENTS (Continued) |
| December 31, 2022 |
| Shares | | | | | Fair Value | |
| | | | | COMMON STOCKS — 81.6% (Continued) | | | | |
| | | | | INSURANCE - 7.1% (Continued) | | | | |
| | 37 | | | Markel Corporation(a) | | $ | 48,747 | |
| | 473 | | | Progressive Corporation (The) | | | 61,353 | |
| | 276 | | | Travelers Companies, Inc. (The) | | | 51,747 | |
| | | | | | | | 261,692 | |
| | | | | LEISURE FACILITIES & SERVICES - 2.7% | | | | |
| | 199 | | | McDonald’s Corporation | | | 52,442 | |
| | 489 | | | Starbucks Corporation | | | 48,509 | |
| | | | | | | | 100,951 | |
| | | | | METALS & MINING - 13.4% | | | | |
| | 888 | | | Agnico Eagle Mines Ltd. | | | 46,167 | |
| | 2,421 | | | Barrick Gold Corporation | | | 41,593 | |
| | 5,652 | | | Cia de Minas Buenaventura S.A.A - ADR | | | 42,107 | |
| | 2,326 | | | Cleveland-Cliffs, Inc.(a) | | | 37,472 | |
| | 4,171 | | | First Majestic Silver Corporation | | | 34,786 | |
| | 342 | | | Franco-Nevada Corporation | | | 46,676 | |
| | 1,254 | | | Freeport-McMoRan, Inc. | | | 47,652 | |
| | 8,558 | | | Hecla Mining Company | | | 47,582 | |
| | 797 | | | Newmont Corporation | | | 37,618 | |
| | 1,979 | | | Pan American Silver Corporation | | | 32,337 | |
| | 2,743 | | | SSR Mining, Inc. | | | 42,983 | |
| | 1,155 | | | Wheaton Precious Metals Corporation | | | 45,137 | |
| | | | | | | | 502,110 | |
| | | | | OIL & GAS PRODUCERS - 17.9% | | | | |
| | 4,748 | | | Antero Midstream Corporation | | | 51,231 | |
| | 389 | | | Chevron Corporation | | | 69,822 | |
| | 633 | | | ConocoPhillips | | | 74,694 | |
| | 1,173 | | | Enbridge, Inc. | | | 45,864 | |
| | 6,419 | | | EnLink Midstream, LLC | | | 78,953 | |
| | 521 | | | EOG Resources, Inc. | | | 67,480 | |
| | 701 | | | Exxon Mobil Corporation | | | 77,320 | |
| | 2,811 | | | Kinder Morgan, Inc. | | | 50,823 | |
| | 798 | | | ONEOK, Inc. | | | 52,429 | |
| | 953 | | | TC Energy Corporation | | | 37,987 | |
See accompanying notes which are an integral part of these financial statements.
| RATIONAL INFLATION GROWTH FUND |
| SCHEDULE OF INVESTMENTS (Continued) |
| December 31, 2022 |
| Shares | | | | | Fair Value | |
| | | | | COMMON STOCKS — 81.6% (Continued) | | | | |
| | | | | OIL & GAS PRODUCERS - 17.9% (Continued) | | | | |
| | 1,691 | | | Williams Companies, Inc. (The) | | $ | 55,634 | |
| | | | | | | | 662,237 | |
| | | | | OIL & GAS SERVICES & EQUIPMENT - 2.0% | | | | |
| | 1,417 | | | Schlumberger N.V. | | | 75,753 | |
| | | | | | | | | |
| | | | | REAL ESTATE INVESTMENT TRUSTS - 3.2% | | | | |
| | 184 | | | American Tower Corporation | | | 38,982 | |
| | 268 | | | Crown Castle, Inc. | | | 36,352 | |
| | 65 | | | Equinix, Inc. | | | 42,577 | |
| | | | | | | | 117,911 | |
| | | | | SELF-STORAGE REIT - 1.1% | | | | |
| | 142 | | | Public Storage | | | 39,787 | |
| | | | | | | | | |
| | | | | STEEL - 6.6% | | | | |
| | 434 | | | Nucor Corporation | | | 57,206 | |
| | 307 | | | Reliance Steel & Aluminum Company | | | 62,149 | |
| | 740 | | | Steel Dynamics, Inc. | | | 72,297 | |
| | 2,060 | | | United States Steel Corporation | | | 51,603 | |
| | | | | | | | 243,255 | |
| | | | | TECHNOLOGY SERVICES - 3.5% | | | | |
| | 125 | | | Mastercard, Inc., Class A | | | 43,466 | |
| | 572 | | | PayPal Holdings, Inc.(a) | | | 40,738 | |
| | 211 | | | Visa, Inc., Class A | | | 43,838 | |
| | | | | | | | 128,042 | |
| | | | | TRANSPORTATION & LOGISTICS - 5.8% | | | | |
| | 610 | | | Canadian Pacific Railway Ltd. | | | 45,499 | |
| | 1,271 | | | CSX Corporation | | | 39,376 | |
| | 163 | | | Norfolk Southern Corporation | | | 40,166 | |
| | 208 | | | Union Pacific Corporation | | | 43,071 | |
| | 246 | | | United Parcel Service, Inc., Class B | | | 42,765 | |
| | | | | | | | 210,877 | |
| | | | | | | | | |
| | | | | TOTAL COMMON STOCKS (Cost $3,039,552) | | | 3,025,807 | |
See accompanying notes which are an integral part of these financial statements.
| RATIONAL INFLATION GROWTH FUND |
| SCHEDULE OF INVESTMENTS (Continued) |
| December 31, 2022 |
| Shares | | | | | Fair Value | |
| | | | | EXCHANGE-TRADED FUNDS — 14.5% | | | | |
| | | | | COMMODITY - 14.5% | | | | |
| | 3,220 | | | abrdn Bloomberg All Commodity Strategy K-1 Free | | $ | 71,033 | |
| | 2,823 | | | Direxion Auspice Broad Commodity Strategy ETF | | | 83,053 | |
| | 2,439 | | | GraniteShares Bloomberg Commodity Broad Strategy | | | 54,853 | |
| | 2,998 | | | Invesco DB Commodity Index Tracking Fund, N(a) | | | 73,901 | |
| | 4,772 | | | Invesco Optimum Yield Diversified Commodity | | | 70,530 | |
| | 1,896 | | | iShares GSCI Commodity Dynamic | | | 53,448 | |
| | 3,223 | | | iShares S&P GSCI Commodity Indexed Trust(a) | | | 68,424 | |
| | 1,755 | | | KraneShares Global Carbon Strategy ETF(a) | | | 64,005 | |
| | | | | | | | 539,247 | |
| | | | | | | | | |
| | | | | TOTAL EXCHANGE-TRADED FUNDS (Cost $624,033) | | | 539,247 | |
| | | | | | | | | |
| | | | | TOTAL INVESTMENTS — 96.1% (Cost $3,663,585) | | $ | 3,565,054 | |
| | | | | OTHER ASSETS IN EXCESS OF LIABILITIES — 3.9% | | | 142,599 | |
| | | | | NET ASSETS - 100.0% | | $ | 3,707,653 | |
| ADR | - American Depositary Receipt |
| ETF | - Exchange-Traded Fund |
| LLC | - Limited Liability Company |
| NV | - Naamioze Vennootschap |
| PLC | - Public Limited Company |
| REIT | - Real Estate Investment Trust |
| (a) | Non-income producing security. |
See accompanying notes which are an integral part of these financial statements.
| RATIONAL FUNDS |
| Statements of Assets and Liabilities |
| December 31, 2022 |
| | | Rational | | | Rational | | | Rational | | | Rational | |
| | | Equity Armor | | | Tactical Return | | | Dynamic Brands | | | Strategic Allocation | |
| | | Fund | | | Fund | | | Fund | | | Fund | |
| ASSETS: | | | | | | | | | | | | | | | | |
| Investments in Unaffiliated securities, at cost | | $ | 55,401,921 | | | $ | 167,249,174 | | | $ | 46,264,414 | | | $ | — | |
| Investments in Affiliated securities, at cost | | | — | | | | — | | | | — | | | | 6,164,202 | |
| Total Securities at Cost | | $ | 55,401,921 | | | $ | 167,249,174 | | | $ | 46,264,414 | | | $ | 6,164,202 | |
| | | | | | | | | | | | | | | | | |
| Investments in Unaffiliated securities, at value | | $ | 59,921,418 | | | $ | 166,486,273 | | | $ | 45,134,977 | | | $ | — | |
| Investments in Affiliated securities, at value | | | — | | | | — | | | | — | | | | 5,918,149 | |
| Total Securities at Value | | $ | 59,921,418 | | | $ | 166,486,273 | | | $ | 45,134,977 | | | $ | 5,918,149 | |
| Cash | | | 5,419,946 | | | | 6,526,628 | | | | 565 | | | | 243,764 | |
| Deposits with Brokers for futures and options | | | 3,644,705 | | | | 44,092,397 | | | | — | | | | 1,287,208 | |
| Receivable for securities sold | | | — | | | | — | | | | 328,028 | | | | — | |
| Receivable for Fund shares sold | | | — | | | | 203,286 | | | | 7,661 | | | | — | |
| Futures unrealized appreciation | | | 41,456 | | | | — | | | | — | | | | — | |
| Dividends and interest receivable | | | 78,161 | | | | 30,778 | | | | 14,168 | | | | 10,990 | |
| Due from Advisor | | | — | | | | — | | | | — | | | | 8,885 | |
| Prepaid expenses and other assets | | | 42,960 | | | | 30,633 | | | | 38,946 | | | | 6,967 | |
| Total Assets | | | 69,148,646 | | | | 217,369,995 | | | | 45,524,345 | | | | 7,475,963 | |
| | | | | | | | | | | | | | | | | |
| LIABILITIES: | | | | | | | | | | | | | | | | |
| Options written (premiums received $1,846,875, $0, $0, $0) | | | 1,781,250 | | | | — | | | | — | | | | — | |
| Line of Credit | | | — | | | | — | | | | 18,000 | | | | — | |
| Payable for securities purchased | | | — | | | | — | | | | 321,390 | | | | 9,693 | |
| Management fees payable | | | 43,421 | | | | 316,283 | | | | 29,995 | | | | — | |
| Futures unrealized depreciation | | | 79,706 | | | | — | | | | — | | | | 359,270 | |
| Payable for Fund shares redeemed | | | 14,300 | | | | 483,079 | | | | 1,938,312 | | | | 660 | |
| Payable to related parties | | | 5,081 | | | | 20,936 | | | | 6,009 | | | | 2,591 | |
| Shareholder services fees payable | | | 7,184 | | | | 35,480 | | | | 8,712 | | | | 802 | |
| Accrued 12b-1 fees | | | 3,192 | | | | 19,920 | | | | 13,876 | | | | 2,718 | |
| Trustee fees payable | | | 4,105 | | | | 4,107 | | | | 4,098 | | | | 4,057 | |
| Accrued expenses and other liabilities | | | 22,060 | | | | 27,485 | | | | 21,343 | | | | 20,068 | |
| Total Liabilities | | | 1,960,299 | | | | 907,290 | | | | 2,361,735 | | | | 399,859 | |
| | | | | | | | | | | | | | | | | |
| Net Assets | | $ | 67,188,347 | | | $ | 216,462,705 | | | $ | 43,162,610 | | | $ | 7,076,104 | |
| | | | | | | | | | | | | | | | | |
| NET ASSETS CONSIST OF: | | | | | | | | | | | | | | | | |
| Paid in capital | | $ | 69,506,026 | | | $ | 218,595,077 | | | $ | 62,474,944 | | | $ | 9,908,056 | |
| Accumulated earnings (deficits) | | | (2,317,679 | ) | | | (2,132,372 | ) | | | (19,312,334 | ) | | | (2,831,952 | ) |
| Net Assets | | $ | 67,188,347 | | | $ | 216,462,705 | | | $ | 43,162,610 | | | $ | 7,076,104 | |
| | | | | | | | | | | | | | | | | |
| Institutional Shares | | | | | | | | | | | | | | | | |
| Net Assets | | $ | 55,862,072 | | | $ | 199,785,981 | | | $ | 28,642,960 | | | $ | 1,027,206 | |
| Shares of beneficial interest outstanding (a) | | | 7,006,724 | | | | 11,754,618 | | | | 785,768 | | | | 150,149 | |
| Net asset value per share | | $ | 7.97 | | | $ | 17.00 | | | $ | 36.45 | | | $ | 6.84 | |
| | | | | | | | | | | | | | | | | |
| Class A Shares | | | | | | | | | | | | | | | | |
| Net Assets | | $ | 9,716,506 | | | $ | 8,868,450 | | | $ | 11,667,646 | | | $ | 6,048,138 | |
| Shares of beneficial interest outstanding (a) | | | 1,221,344 | | | | 521,180 | | | | 526,504 | | | | 879,363 | |
| Net asset value and redemption price per share | | $ | 7.96 | | | $ | 17.02 | | | $ | 22.16 | | | $ | 6.88 | |
| Maximum offering price per share (b) | | $ | 8.36 | | | $ | 17.87 | | | $ | 23.27 | | | $ | 7.22 | |
| | | | | | | | | | | | | | | | | |
| Class C Shares | | | | | | | | | | | | | | | | |
| Net Assets | | $ | 1,609,769 | | | $ | 7,808,274 | | | $ | 2,852,004 | | | | 760 | |
| Shares of beneficial interest outstanding (a) | | | 204,070 | | | | 476,777 | | | | 155,796 | | | | 111 | |
| Net asset value, offering price and redemption price per share (c) | | $ | 7.89 | | | $ | 16.38 | | | $ | 18.31 | | | $ | 6.83 | (d) |
| (a) | Unlimited number of shares of no par value beneficial interest authorized. |
| (b) | There is a maximum front-end sales charge (load) of 4.75% imposed on purchases of Class A shares for each Fund. |
| (c) | A contingent deferred sales charge (“CDSC”) of 1.00% may be charged on shares held less than 12 months. |
| (d) | Does not calculate due to rounding. |
See accompanying notes which are an intergral part of these consolidated financial statements.
| RATIONAL FUNDS |
| Statements of Assets and Liabilities (Continued) |
| December 31, 2022 |
| | | Rational/ | | | Rational/Pier 88 | | | Rational | | | Rational | |
| | | ReSolve Adaptive | | | Convertible Securities | | | Special Situations | | | Inflation Growth | |
| | | Asset Allocation Fund | | | Fund | | | Income Fund | | | Fund | |
| | | (Consolidated) | | | | | | | | | | | | | |
| ASSETS: | | | | | | | | | | | | | | | | |
| Total Securities at Cost | | $ | 148,830,884 | | | $ | 99,694,452 | | | $ | 776,050,189 | | | $ | 3,663,585 | |
| Total Securities at Value | | $ | 148,853,162 | | | $ | 98,339,384 | | | $ | 731,550,420 | | | $ | 3,565,054 | |
| Cash | | | — | | | | 9,468,989 | | | | 38,032,741 | | | | 155,289 | |
| Deposits with Brokers for futures | | | 11,203,110 | | | | — | | | | — | | | | — | |
| Unrealized appreciation from open futures contracts | | | 4,908,910 | | | | — | | | | — | | | | — | |
| Foreign cash deposits with brokers for futures (Cost $9,011,529, $0, $0, $0) | | | 8,988,539 | | | | — | | | | — | | | | — | |
| Receivable for securities sold | | | — | | | | — | | | | 214,756 | | | | — | |
| Dividends and interest receivable | | | 139,978 | | | | 330,215 | | | | 4,318,723 | | | | 3,657 | |
| Receivable for Fund shares sold | | | 1,305,670 | | | | 500,000 | | | | 971,475 | | | | — | |
| Due from Advisor | | | — | | | | — | | | | — | | | | 3,840 | |
| Prepaid expenses and other assets | | | 42,568 | | | | 20,682 | | | | 55,292 | | | | 8,689 | |
| Total Assets | | | 175,441,937 | | | | 108,659,270 | | | | 775,143,407 | | | | 3,736,529 | |
| | | | | | | | | | | | | | | | | |
| LIABILITIES: | | | | | | | | | | | | | | | | |
| Payable for securities purchased | | | — | | | | — | | | | 2,287,500 | | | | — | |
| Unrealized depreciation from open futures contracts | | | 4,305,848 | | | | — | | | | — | | | | — | |
| Management fees payable | | | 233,916 | | | | 57,920 | | | | 958,981 | | | | — | |
| Payable for Fund shares redeemed | | | 1,893,530 | | | | 33,737 | | | | 993,151 | | | | 3,081 | |
| Payable to related parties | | | 11,456 | | | | 10,403 | | | | 62,353 | | | | 1,281 | |
| Accrued 12b-1 fees | | | 5,277 | | | | 2,442 | | | | 102,451 | | | | 196 | |
| Shareholder services fees payable | | | 14,425 | | | | 8,614 | | | | 57,672 | | | | 194 | |
| Trustee fees payable | | | 4,123 | | | | 4,044 | | | | 4,076 | | | | 4,110 | |
| Accrued expenses and other liabilities | | | 20,721 | | | | 20,475 | | | | 59,543 | | | | 20,014 | |
| Total Liabilities | | | 6,489,296 | | | | 137,635 | | | | 4,525,727 | | | | 28,876 | |
| | | | | | | | | | | | | | | | | |
| Net Assets | | $ | 168,952,641 | | | $ | 108,521,635 | | | $ | 770,617,680 | | | $ | 3,707,653 | |
| | | | | | | | | | | | | | | | | |
| NET ASSETS CONSIST OF: | | | | | | | | | | | | | | | | |
| Paid in capital | | $ | 177,255,227 | | | $ | 115,656,358 | | | $ | 825,150,193 | | | $ | 3,913,726 | |
| Accumulated earnings (deficits) | | | (8,302,586 | ) | | | (7,134,723 | ) | | | (54,532,513 | ) | | | (206,073 | ) |
| Net Assets | | $ | 168,952,641 | | | $ | 108,521,635 | | | $ | 770,617,680 | | | $ | 3,707,653 | |
| | | | | | | | | | | | | | | | | |
| Institutional Shares | | | | | | | | | | | | | | | | |
| Net Assets | | $ | 162,983,467 | | | $ | 106,362,322 | | | $ | 666,041,851 | | | $ | 2,887,092 | |
| Shares of beneficial interest outstanding (a) | | | 7,431,385 | | | | 10,196,197 | | | | 36,317,866 | | | | 299,040 | |
| Net asset value per share | | $ | 21.93 | | | $ | 10.43 | | | $ | 18.34 | | | $ | 9.65 | |
| | | | | | | | | | | | | | | | | |
| Class A Shares | | | | | | | | | | | | | | | | |
| Net Assets | | $ | 3,642,626 | | | $ | 1,860,941 | | | $ | 70,120,876 | | | $ | 787,620 | |
| Shares of beneficial interest outstanding (a) | | | 167,781 | | | | 178,180 | | | | 3,827,998 | | | | 81,674 | |
| Net asset value and redemption price per share | | $ | 21.71 | | | $ | 10.44 | | | $ | 18.32 | | | $ | 9.64 | |
| Maximum offering price per share (b) | | $ | 23.03 | | | $ | 10.96 | | | $ | 19.23 | | | $ | 10.23 | |
| | | | | | | | | | | | | | | | | |
| Class C Shares | | | | | | | | | | | | | | | | |
| Net Assets | | $ | 2,326,548 | | | $ | 298,372 | | | $ | 34,454,953 | | | $ | 32,941 | |
| Shares of beneficial interest outstanding (a) | | | 111,099 | | | | 28,755 | | | | 1,885,928 | | | | 3,445 | |
| Net asset value, offering price and redemption price per share (c) | | $ | 20.94 | | | $ | 10.38 | | | $ | 18.27 | | | $ | 9.56 | |
| (a) | Unlimited number of shares of no par value beneficial interest authorized. |
| (b) | There is a maximum front-end sales charge (load) of 4.75% imposed on purchases of Class A shares for each Fund except Resolve Adaptive Asset Allocation Fund and Inflation Growth Fund whose maximum front-end sales charge (load) is 5.75%. |
| (c) | A contingent deferred sales charge (“CDSC”) of 1.00% may be charged on shares held less than 12 months. |
See accompanying notes which are an intergral part of these consolidated financial statements.
| RATIONAL FUNDS |
| Statements of Operations |
| For the Year Ended December 31, 2022 |
| | | Rational | | | Rational | | | Rational | | | Rational | |
| | | Equity Armor | | | Tactical Return | | | Dynamic Brands | | | Strategic Allocation | |
| | | Fund | | | Fund | | | Fund | | | Fund | |
| Investment Income: | | | | | | | | | | | | | | | | |
| Dividend income | | $ | 1,309,906 | | | $ | — | | | $ | 666,934 | | | $ | — | |
| Interest income | | | 78,191 | | | | 3,098,446 | | | | 15,501 | | | | 6,497 | |
| Dividend income - affiliated companies (Note 3) | | | — | | | | — | | | | — | | | | 356,282 | |
| Foreign tax withheld | | | (655 | ) | | | — | | | | (7,981 | ) | | | — | |
| Total Investment Income | | | 1,387,442 | | | | 3,098,446 | | | | 674,454 | | | | 362,779 | |
| | | | | | | | | | | | | | | | | |
| Operating Expenses: | | | | | | | | | | | | | | | | |
| Investment management fees | | | 521,483 | | | | 4,829,049 | | | | 485,826 | | | | 8,616 | |
| 12b-1 Fees - Class A Shares | | | 26,602 | | | | 29,401 | | | | 37,715 | | | | 18,534 | |
| 12b-1 Fees - Class C Shares | | | 16,995 | | | | 91,591 | | | | 35,580 | | | | 9 | |
| Shareholder Services Fees - Institutional Shares | | | 55,575 | | | | 277,322 | | | | 42,664 | | | | — | |
| Shareholder Services Fees - Class A Shares | | | 11,423 | | | | 14,178 | | | | 16,026 | | | | 7,280 | |
| Shareholder Services Fees - Class C Shares | | | 781 | | | | 6,230 | | | | 2,529 | | | | — | |
| Administration fees | | | 55,485 | | | | 157,995 | | | | 50,756 | | | | 23,652 | |
| Registration fees | | | 51,819 | | | | 70,423 | | | | 56,135 | | | | 10,846 | |
| Management Service Fees | | | 24,653 | | | | 96,179 | | | | 23,575 | | | | 4,077 | |
| Legal fees | | | 42,958 | | | | 25,655 | | | | 25,882 | | | | 25,738 | |
| Audit fees | | | 13,600 | | | | 14,822 | | | | 13,774 | | | | 14,785 | |
| Compliance officer fees | | | 13,569 | | | | 19,018 | | | | 14,152 | | | | 6,859 | |
| Printing expense | | | 6,339 | | | | 25,121 | | | | 9,100 | | | | 1,071 | |
| Trustees’ fees | | | 15,362 | | | | 15,348 | | | | 15,348 | | | | 15,309 | |
| Custody fees | | | 10,224 | | | | 12,451 | | | | 5,861 | | | | 4,214 | |
| Insurance expense | | | 2,826 | | | | 11,705 | | | | 3,662 | | | | 425 | |
| Interest expense | | | 3,173 | | | | 4,647 | | | | 6,930 | | | | 1,001 | |
| Miscellaneous expenses | | | 2,732 | | | | 2,402 | | | | 2,605 | | | | 2,391 | |
| Total Operating Expenses | | | 875,599 | | | | 5,703,537 | | | | 848,120 | | | | 144,807 | |
| Less: Expenses waived/reimbursed by Advisor | | | — | | | | (91,334 | ) | | | — | | | | (86,462 | ) |
| Net Operating Expenses | | | 875,599 | | | | 5,612,203 | | | | 848,120 | | | | 58,345 | |
| | | | | | | | | | | | | | | | | |
| Net Investment Income (Loss) | | | 511,843 | | | | (2,513,757 | ) | | | (173,666 | ) | | | 304,434 | |
| | | | | | | | | | | | | | | | | |
| Realized and Unrealized Gain (Loss) on Investments: | | | | | | | | | | | | | | | | |
| Net Realized Gain (Loss) from: | | | | | | | | | | | | | | | | |
| Investments | | | 1,315,067 | | | | 2,709 | | | | (17,352,970 | ) | | | — | |
| Affiliated companies | | | — | | | | — | | | | — | | | | (540,856 | ) |
| Options purchased | | | (17,372,693 | ) | | | 437,383 | | | | — | | | | — | |
| Options written | | | 9,988,391 | | | | 2,418,787 | | | | — | | | | — | |
| Futures | | | 3,751,143 | | | | (783,794 | ) | | | — | | | | (1,586,800 | ) |
| Net Realized Gain (Loss) | | | (2,318,092 | ) | | | 2,075,085 | | | | (17,352,970 | ) | | | (2,127,656 | ) |
| | | | | | | | | | | | | | | | | |
| Net Change in Unrealized Appreciation (Depreciation) on Investments | | | | | | | | | | | | | | | | |
| Investments | | | (6,402,607 | ) | | | (762,901 | ) | | | (16,361,624 | ) | | | — | |
| Affiliated companies | | | — | | | | — | | | | — | | | | (575,157 | ) |
| Options purchased | | | (463,284 | ) | | | — | | | | — | | | | — | |
| Options written | | | 130,937 | | | | — | | | | — | | | | — | |
| Futures | | | 350,080 | | | | — | | | | — | | | | (584,830 | ) |
| Net Change in Unrealized Appreciation (Depreciation) on Investments | | | (6,384,874 | ) | | | (762,901 | ) | | | (16,361,624 | ) | | | (1,159,987 | ) |
| | | | | | | | | | | | | | | | | |
| Net Realized and Unrealized Gain(Loss) on Investments | | | (8,702,966 | ) | | | 1,312,184 | | | | (33,714,594 | ) | | | (3,287,643 | ) |
| | | | | | | | | | | | | | | | | |
| Net Decrease in Net Assets Resulting From Operations | | $ | (8,191,123 | ) | | $ | (1,201,573 | ) | | $ | (33,888,260 | ) | | $ | (2,983,209 | ) |
See accompanying notes which are an intergral part of these consolidated financial statements.
| RATIONAL FUNDS |
| Statements of Operations |
| For the Year Ended December 31, 2022 |
| | | Rational/ | | | Rational/ Pier 88 | | | Rational | | | Rational | |
| | | ReSolve Adaptive | | | Convertible Securities | | | Special Situations | | | Inflation Growth | |
| | | Asset Allocation Fund | | | Fund | | | Income Fund | | | Fund | |
| | | (Consolidated) | | | | | | | | | | |
| Investment Income: | | | | | | | | | | | | | | | | |
| Dividend income | | $ | — | | | $ | 3,179,052 | | | $ | — | | | $ | 145,600 | |
| Interest income | | | 2,394,290 | | | | 64,642 | | | | 53,671,384 | | | | 1,041 | |
| Foreign tax withheld | | | — | | | | — | | | | — | | | | (1,464 | ) |
| Total Investment Income | | | 2,394,290 | | | | 3,243,694 | | | | 53,671,384 | | | | 145,177 | |
| | | | | | | | | | | | | | | | | |
| Operating Expenses: | | | | | | | | | | | | | | | | |
| Investment management fees | | | 2,483,255 | | | | 984,143 | | | | 12,009,249 | | | | 43,257 | |
| 12b-1 Fees - Class A Shares | | | 5,315 | | | | 5,160 | | | | 161,839 | | | | 2,192 | |
| 12b-1 Fees - Class C Shares | | | 8,901 | | | | 2,963 | | | | 355,702 | | | | 311 | |
| Shareholder Services Fees - Institutional Shares | | | 136,109 | | | | 113,502 | | | | 673,619 | | | | 905 | |
| Shareholder Services Fees - Class A Shares | | | 2,613 | | | | 2,215 | | | | 71,087 | | | | 824 | |
| Shareholder Services Fees - Class C Shares | | | 388 | | | | 160 | | | | 22,688 | | | | 100 | |
| Administrative fees | | | 90,094 | | | | 80,264 | | | | 685,347 | | | | 20,186 | |
| Management Service Fees | | | 48,990 | | | | 40,473 | | | | 276,367 | | | | 2,422 | |
| Registration fees | | | 41,385 | | | | 29,673 | | | | 139,024 | | | | 10,467 | |
| Printing expenses | | | 7,661 | | | | 76 | | | | 53,552 | | | | 1,497 | |
| Legal fees | | | 48,826 | | | | 30,077 | | | | 183,789 | | | | 26,390 | |
| Audit fees | | | 14,103 | | | | 13,600 | | | | 37,624 | | | | 13,642 | |
| Compliance officer fees | | | 15,670 | | | | 14,584 | | | | 32,141 | | | | 10,490 | |
| Custody fees | | | 8,301 | | | | 7,607 | | | | 69,948 | | | | 7,979 | |
| Trustees’ fees | | | 15,354 | | | | 15,294 | | | | 15,328 | | | | 15,378 | |
| Insurance Expense | | | 3,324 | | | | 5,207 | | | | 29,493 | | | | 84 | |
| Interest expense | | | 824 | | | | 824 | | | | 824 | | | | 45 | |
| Miscellaneous expense | | | 2,385 | | | | 2,539 | | | | 2,861 | | | | 5,464 | |
| Total Operating Expenses | | | 2,933,498 | | | | 1,348,361 | | | | 14,820,482 | | | | 161,633 | |
| Less: Expenses waived/reimbursed by Advisor | | | (117,342 | ) | | | (193,523 | ) | | | (152,205 | ) | | | (107,456 | ) |
| Net Operating Expenses | | | 2,816,156 | | | | 1,154,838 | | | | 14,668,277 | | | | 54,177 | |
| | | | | | | | | | | | | | | | | |
| Net Investment Income (Loss) | | | (421,866 | ) | | | 2,088,856 | | | | 39,003,107 | | | | 91,000 | |
| | | | | | | | | | | | | | | | | |
| Realized and Unrealized Gain (Loss) on Investments: | | | | | | | | | | | | | | | | |
| Net Realized Gain (Loss) from: | | | | | | | | | | | | | | | | |
| Investments | | | — | | | | (5,114,933 | ) | | | 5,050,143 | | | | (130,689 | ) |
| Futures | | | (16,085,027 | ) | | | — | | | | — | | | | (6,306 | ) |
| Foreign currency translations | | | 19,278 | | | | — | | | | — | | | | — | |
| Net Realized Gain (Loss) | | | (16,065,749 | ) | | | (5,114,933 | ) | | | 5,050,143 | | | | (136,995 | ) |
| | | | | | | | | | | | | | | | | |
| Net Change in Unrealized Appreciation/(Depreciation) on Investments | | | | | | | | | | | | | | | | |
| Investments | | | 22,278 | | | | (10,880,343 | ) | | | (55,884,040 | ) | | | (81,345 | ) |
| Futures | | | 239,504 | | | | — | | | | — | | | | — | |
| Foreign currency translations | | | (14,642 | ) | | | — | | | | — | | | | — | |
| Net Change in Unrealized Appreciation/(Depreciation) on Investments | | | 247,140 | | | | (10,880,343 | ) | | | (55,884,040 | ) | | | (81,345 | ) |
| | | | | | | | | | | | | | | | | |
| Net Realized and Unrealized Gain (Loss) on Investments | | | (15,818,609 | ) | | | (15,995,276 | ) | | | (50,833,897 | ) | | | (218,340 | ) |
| | | | | | | | | | | | | | | | | |
| Net Decrease in Net Assets Resulting From Operations | | $ | (16,240,475 | ) | | $ | (13,906,420 | ) | | $ | (11,830,790 | ) | | $ | (127,340 | ) |
See accompanying notes which are an intergral part of these consolidated financial statements.
| RATIONAL FUNDS |
| Statements of Changes in Net Assets |
| | | Rational Equity Armor Fund | | | Rational Tactical Return Fund | | | Rational Dynamic Brands Fund | |
| | | | | | | | | | | | | | | | | | | |
| | | Year Ended | | | Year Ended | | | Year Ended | | | Year Ended | | | Year Ended | | | Year Ended | |
| | | December 31, 2022 | | | December 31, 2021 | | | December 31, 2022 (a) | | | December 31, 2021 | | | December 31, 2022 | | | December 31, 2021 | |
| Operations: | | | | | | | | | | | | | | | | | | | | | | | | |
| Net investment income (loss) | | $ | 511,843 | | | $ | 502,503 | | | $ | (2,513,757 | ) | | $ | (5,078,323 | ) | | $ | (173,666 | ) | | $ | (732,771 | ) |
| Net realized gain (loss) on investments, futures and options | | | (2,318,092 | ) | | | 4,454,297 | | | | 2,075,085 | | | | 14,329,482 | | | | (17,352,970 | ) | | | 10,553,826 | |
| Net change in unrealized appreciation (depreciation) on investments, foreign currency, options and futures | | | (6,384,874 | ) | | | 3,914,247 | | | | (762,901 | ) | | | (33,266 | ) | | | (16,361,624 | ) | | | 1,313,165 | |
| Net increase/(decrease) in net assets resulting from operations | | | (8,191,123 | ) | | | 8,871,047 | | | | (1,201,573 | ) | | | 9,217,893 | | | | (33,888,260 | ) | | | 11,134,220 | |
| | | | | | | | | | | | | | | | | | | | | | | | | |
| Distributions to Shareholders from: | | | | | | | | | | | | | | | | | | | | | | | | |
| Total Distributions : | | | | | | | | | | | | | | | | | | | | | | | | |
| Institutional | | | (422,776 | ) | | | (695,718 | ) | | | (587,657 | ) | | | (9,695,970 | ) | | | (1,638,210 | ) | | | (6,392,799 | ) |
| Class A | | | (59,377 | ) | | | (124,680 | ) | | | (25,092 | ) | | | (708,470 | ) | | | (973,247 | ) | | | (2,707,366 | ) |
| Class C | | | (2,599 | ) | | | (4,952 | ) | | | (23,129 | ) | | | (350,842 | ) | | | (285,413 | ) | | | (663,584 | ) |
| | | | | | | | | | | | | | | | | | | | | | | | | |
| Total distributions to shareholders | | | (484,752 | ) | | | (825,350 | ) | | | (635,878 | ) | | | (10,755,282 | ) | | | (2,896,870 | ) | | | (9,763,749 | ) |
| | | | | | | | | | | | | | | | | | | | | | | | | |
| Share Transactions of Beneficial Interest: | | | | | | | | | | | | | | | | | | | | | | | | |
| Net proceeds from shares sold | | | | | | | | | | | | | | | | | | | | | | | | |
| Institutional | | | 21,027,361 | | | | 20,865,224 | | | | 87,740,700 | | | | 136,008,323 | | | | 5,680,529 | | | | 42,502,657 | |
| Class A | | | 304,693 | | | | 650,739 | | | | 6,155,633 | | | | 15,876,211 | | | | 764,212 | | | | 5,544,410 | |
| Class C | | | 283,227 | | | | 750,631 | | | | 748,138 | | | | 1,641,657 | | | | 323,999 | | | | 3,236,037 | |
| Reinvestment of distributions | | | | | | | | | | | | | | | | | | | | | | | | |
| Institutional | | | 329,729 | | | | 412,310 | | | | 559,987 | | | | 8,992,274 | | | | 1,511,755 | | | | 6,017,286 | |
| Class A | | | 54,332 | | | | 113,225 | | | | 24,328 | | | | 683,615 | | | | 945,925 | | | | 2,626,558 | |
| Class C | | | 1,989 | | | | 3,648 | | | | 21,828 | | | | 336,130 | | | | 275,353 | | | | 651,676 | |
| Cost of shares redeemed | | | | | | | | | | | | | | | | | | | | | | | | |
| Institutional | | | (17,315,530 | ) | | | (15,151,537 | ) | | | (151,499,329 | ) | | | (79,268,838 | ) | | | (35,122,033 | ) | | | (20,674,521 | ) |
| Class A | | | (1,194,230 | ) | | | (2,487,456 | ) | | | (15,688,159 | ) | | | (5,207,000 | ) | | | (4,581,709 | ) | | | (2,949,599 | ) |
| Class C | | | (231,797 | ) | | | (312,522 | ) | | | (2,258,373 | ) | | | (1,569,740 | ) | | | (600,543 | ) | | | (173,601 | ) |
| Net increase (decrease) in net assets from share transactions of beneficial interest | | | 3,259,774 | | | | 4,844,262 | | | | (74,195,247 | ) | | | 77,492,632 | | | | (30,802,512 | ) | | | 36,780,903 | |
| | | | | | | | | | | | | | | | | | | | | | | | | |
| Total Increase/(Decrease) in Net Assets | | | (5,416,101 | ) | | | 12,889,959 | | | | (76,032,698 | ) | | | 75,955,243 | | | | (67,587,642 | ) | | | 38,151,374 | |
| | | | | | | | | | | | | | | | | | | | | | | | | |
| Net Assets: | | | | | | | | | | | | | | | | | | | | | | | | |
| Beginning of year | | | 72,604,448 | | | | 59,714,489 | | | | 292,495,403 | | | | 216,540,160 | | | | 110,750,252 | | | | 72,598,878 | |
| End of year | | $ | 67,188,347 | | | $ | 72,604,448 | | | $ | 216,462,705 | | | $ | 292,495,403 | | | $ | 43,162,610 | | | $ | 110,750,252 | |
| | | | | | | | | | | | | | | | | | | | | | | | | |
| Share Activity: | | | | | | | | | | | | | | | | | | | | | | | | |
| Institutional Class | | | | | | | | | | | | | | | | | | | | | | | | |
| Shares Sold | | | 2,423,532 | | | | 2,444,483 | | | | 5,155,027 | | | | 23,387,599 | | | | 120,318 | | | | 676,341 | |
| Shares Reinvested | | | 39,490 | | | | 47,844 | | | | 32,979 | | | | 1,580,365 | | | | 41,463 | | | | 104,015 | |
| Shares Redeemed | | | (2,018,009 | ) | | | (1,769,592 | ) | | | (8,911,139 | ) | | | (13,692,687 | ) | | | (764,698 | ) | | | (336,584 | ) |
| Net increase (decrease) in shares of Beneficial interest | | | 445,013 | | | | 722,735 | | | | (3,723,133 | ) | | | 11,275,277 | | | | (602,917 | ) | | | 443,772 | |
| | | | | | | | | | | | | | | | | | | | | | | | | |
| Class A | | | | | | | | | | | | | | | | | | | | | | | | |
| Shares Sold | | | 36,260 | | | | 77,811 | | | | 361,310 | | | | 2,711,661 | | | | 26,807 | | | | 136,048 | |
| Shares Reinvested | | | 6,484 | | | | 13,173 | | | | 1,431 | | | | 119,722 | | | | 42,667 | | | | 72,079 | |
| Shares Redeemed | | | (142,455 | ) | | | (292,475 | ) | | | (919,797 | ) | | | (894,523 | ) | �� | | (161,949 | ) | | | (72,785 | ) |
| Net increase (decrease) in shares of Beneficial interest | | | (99,711 | ) | | | (201,491 | ) | | | (557,056 | ) | | | 1,936,860 | | | | (92,475 | ) | | | 135,342 | |
| | | | | | | | | | | | | | | | | | | | | | | | | |
| Class C | | | | | | | | | | | | | | | | | | | | | | | | |
| Shares Sold | | | 32,576 | | | | 88,587 | | | | 45,273 | | | | 288,092 | | | | 12,719 | | | | 91,014 | |
| Shares Reinvested | | | 239 | | | | 426 | | | | 1,333 | | | | 60,673 | | | | 15,030 | | | | 21,117 | |
| Shares Redeemed | | | (27,194 | ) | | | (37,918 | ) | | | (137,503 | ) | | | (276,848 | ) | | | (26,291 | ) | | | (4,946 | ) |
| Net increase (decrease) in shares of Beneficial interest | | | 5,621 | | | | 51,095 | | | | (90,897 | ) | | | 71,917 | | | | 1,458 | | | | 107,185 | |
| (a) | Effective April 21, 2022, the Fund had a three-for-one reverse stock split. Per share amounts for the period have been adjusted to give effect to the three-for-one stock split. |
See accompanying notes which are an intergral part of these consolidated financial statements.
| RATIONAL FUNDS |
| Statements of Changes in Net Assets (Continued) |
| | | | | | | | | Rational/ReSolve Adaptive | |
| | | Rational Strategic Allocation Fund | | | Asset Allocation Fund | |
| | | | | | | | | (Consolidated) | |
| | | | | | | | | | | | | |
| | | Year Ended | | | Year Ended | | | Year Ended | | | Year Ended | |
| | | December 31, 2022 | | | December 31, 2021 | | | December 31, 2022 | | | December 31, 2021 | |
| Operations: | | | | | | | | | | | | | | | | |
| Net investment income (loss) | | $ | 304,434 | | | $ | 293,287 | | | $ | (421,866 | ) | | $ | (1,280,542 | ) |
| Distribution of realized gains by investment companies | | | — | | | | 42,742 | | | | — | | | | — | |
| Net realized gain (loss) on investments, affiliated companies foreign currency transactions and futures | | | (2,127,656 | ) | | | 2,203,605 | | | | (16,065,749 | ) | | | 10,002,958 | |
| Net change in unrealized appreciation (depreciation) on investments, affiliated companies, foreign currency transactions and futures | | | (1,159,987 | ) | | | 21,331 | | | | 247,140 | | | | (2,141,146 | ) |
| Net increase (decrease) in net assets resulting from operations | | | (2,983,209 | ) | | | 2,560,965 | | | | (16,240,475 | ) | | | 6,581,270 | |
| | | | | | | | | | | | | | | | | |
| Distributions to Shareholders: | | | | | | | | | | | | | | | | |
| Total Distributions Paid : | | | | | | | | | | | | | | | | |
| Institutional | | | (83,338 | ) | | | (80,151 | ) | | | (651,751 | ) | | | (8,743,313 | ) |
| Class A | | | (458,652 | ) | | | (1,355,722 | ) | | | (13,452 | ) | | | (84,747 | ) |
| Class C | | | (55 | ) | | | (171 | ) | | | (7,002 | ) | | | (37,149 | ) |
| | | | | | | | | | | | | | | | | |
| Total distributions to shareholders | | | (542,045 | ) | | | (1,436,044 | ) | | | (672,205 | ) | | | (8,865,209 | ) |
| | | | | | | | | | | | | | | | | |
| Share Transactions of Beneficial Interest: | | | | | | | | | | | | | | | | |
| Net proceeds from shares sold | | | | | | | | | | | | | | | | |
| Institutional | | | 1,002,000 | | | | 250,000 | | | | 187,098,307 | | | | 32,962,809 | |
| Class A | | | 222,827 | | | | 854,083 | | | | 4,552,296 | | | | 107,690 | |
| Class C | | | — | | | | — | | | | 2,286,395 | | | | 3,600 | |
| Reinvestment of distributions | | | | | | | | | | | | | | | | |
| Institutional | | | 112 | | | | — | | | | 536,624 | | | | 7,186,351 | |
| Class A | | | 439,821 | | | | 1,239,373 | | | | 12,890 | | | | 84,747 | |
| Class C | | | — | | | | — | | | | 6,448 | | | | 9,973 | |
| Cost of shares redeemed | | | | | | | | | | | | | | | | |
| Institutional | | | — | | | | — | | | | (73,170,887 | ) | | | (35,187,481 | ) |
| Class A | | | (1,413,314 | ) | | | (1,080,494 | ) | | | (1,153,274 | ) | | | (338,550 | ) |
| Class C | | | — | | | | — | | | | (40,396 | ) | | | (11,100 | ) |
| Net increase in net assets from share transactions of beneficial interest | | | 251,446 | | | | 1,262,962 | | | | 120,128,403 | | | | 4,818,039 | |
| | | | | | | | | | | | | | | | | |
| Total Increase (Decrease) in Net Assets | | | (3,273,808 | ) | | | 2,387,883 | | | | 103,215,723 | | | | 2,534,100 | |
| | | | | | | | | | | | | | | | | |
| Net Assets: | | | | | | | | | | | | | | | | |
| Beginning of year | | | 10,349,912 | | | | 7,962,029 | | | | 65,736,918 | | | | 63,202,818 | |
| End of year | | $ | 7,076,104 | | | $ | 10,349,912 | | | $ | 168,952,641 | | | $ | 65,736,918 | |
| | | | | | | | | | | | | | | | | |
| Share Activity: | | | | | | | | | | | | | | | | |
| Institutional Class | | | | | | | | | | | | | | | | |
| Shares Sold | | | 99,464 | | | | 22,935 | | | | 7,677,669 | | | | 1,306,885 | |
| Shares Reinvested | | | 16 | | | | — | | | | 24,315 | | | | 317,980 | |
| Shares Redeemed | | | — | | | | — | | | | (3,127,828 | ) | | | (1,383,853 | ) |
| Net increase in shares of Beneficial interest | | | 99,480 | | | | 22,935 | | | | 4,574,156 | | | | 241,012 | |
| | | | | | | | | | | | | | | | | |
| Class A | | | | | | | | | | | | | | | | |
| Shares Sold | | | 22,829 | | | | 77,863 | | | | 190,471 | | | | 4,194 | |
| Shares Reinvested | | | 61,865 | | | | 123,693 | | | | 590 | | | | 3,780 | |
| Shares Redeemed | | | (159,887 | ) | | | (105,419 | ) | | | (50,209 | ) | | | (13,923 | ) |
| Net increase/(decrease) in shares of Beneficial interest | | | (75,193 | ) | | | 96,137 | | | | 140,852 | | | | (5,949 | ) |
| | | | | | | | | | | | | | | | | |
| Class C | | | | | | | | | | | | | | | | |
| Shares Sold | | | — | | | | — | | | | 101,635 | | | | 147 | |
| Shares Reinvested | | | — | | | | — | | | | 306 | | | | 458 | |
| Shares Redeemed | | | — | | | | — | | | | (1,837 | ) | | | (487 | ) |
| Net increase in shares of Beneficial interest | | | — | | | | — | | | | 100,104 | | | | 118 | |
See accompanying notes which are an intergral part of these consolidated financial statements.
| RATIONAL FUNDS |
| Statements of Changes in Net Assets (Continued) |
| | | Rational/ Pier 88 Convertible Securities Fund | | | Rational Special Situations Income Fund | | | Rational Inflation Growth Fund (a) | |
| | | | | | | | | | | | | | | | | | | |
| | | Year Ended | | | Year Ended | | | Year Ended | | | Year Ended | | | Year Ended | | | Period Ended | |
| | | December 31, 2022 | | | December 31, 2021 | | | December 31, 2022 | | | December 31, 2021 | | | December 31, 2022 | | | December 31, 2021 | |
| Operations: | | | | | | | | | | | | | | | | | | | | | | | | |
| Net investment income | | $ | 2,088,856 | | | $ | 1,067,346 | | | $ | 39,003,107 | | | $ | 20,797,489 | | | $ | 91,000 | | | $ | 40,140 | |
| Net realized gain (loss) on investments | | | (5,114,933 | ) | | | 6,743,996 | | | | 5,050,143 | | | | 5,986,376 | | | | (136,995 | ) | | | (72,692 | ) |
| Net change in unrealized appreciation (depreciation) on investments | | | (10,880,343 | ) | | | 1,436,227 | | | | (55,884,040 | ) | | | 559,952 | | | | (81,345 | ) | | | (17,186 | ) |
| Net increase/(decrease) in net assets resulting from operations | | | (13,906,420 | ) | | | 9,247,569 | | | | (11,830,790 | ) | | | 27,343,817 | | | | (127,340 | ) | | | (49,738 | ) |
| | | | | | | | | | | | | | | | | | | | | | | | | |
| Distributions to Shareholders: | | | | | | | | | | | | | | | | | | | | | | | | |
| From return of capital: | | | | | | | | | | | | | | | | | | | | | | | | |
| Institutional Class | | | — | | | | — | | | | — | | | | (20,093 | ) | | | — | | | | — | |
| Class A | | | — | | | | — | | | | — | | | | (2,024 | ) | | | — | | | | — | |
| Class C | | | — | | | | — | | | | — | | | | (1,059 | ) | | | — | | | | — | |
| Total Distributions : | | | | | | | | | | | | | | | | | | | | | | | | |
| Institutional | | | (2,415,541 | ) | | | (8,210,628 | ) | | | (41,509,648 | ) | | | (24,923,652 | ) | | | (11,474 | ) | | | (10,107 | ) |
| Class A | | | (38,397 | ) | | | (348,029 | ) | | | (3,784,353 | ) | | | (2,364,197 | ) | | | (2,216 | ) | | | (5,164 | ) |
| Class C | | | (3,981 | ) | | | (15,734 | ) | | | (1,766,515 | ) | | | (1,074,235 | ) | | | (19 | ) | | | (191 | ) |
| | | | | | | | | | | | | | | | | | | | | | | | | |
| Total distributions to shareholders | | | (2,457,919 | ) | | | (8,574,391 | ) | | | (47,060,516 | ) | | | (28,385,260 | ) | | | (13,709 | ) | | | (15,462 | ) |
| | | | | | | | | | | | | | | | | | | | | | | | | |
| Share Transactions of Beneficial Interest: | | | | | | | | | | | | | | | | | | | | | | | | |
| Net proceeds from shares sold | | | | | | | | | | | | | | | | | | | | | | | | |
| Institutional | | | 22,415,513 | | | | 45,959,654 | | | | 379,860,402 | | | | 444,790,373 | | | | 1,749,359 | | | | 1,384,379 | |
| Class A | | | 692,894 | | | | 5,031,959 | | | | 34,926,155 | | | | 35,690,230 | | | | 618,606 | | | | 728,711 | |
| Class C | | | 149,625 | | | | 182,100 | | | | 9,059,946 | | | | 23,289,704 | | | | 10,000 | | | | 25,149 | |
| Reinvestment of distributions | | | | | | | | | | | | | | | | | | | | | | | | |
| Institutional | | | 812,123 | | | | 2,931,508 | | | | 36,584,265 | | | | 21,004,850 | | | | 6,367 | | | | 6,483 | |
| Class A | | | 38,397 | | | | 314,092 | | | | 3,470,184 | | | | 2,001,003 | | | | 1,970 | | | | 4,525 | |
| Class C | | | 3,981 | | | | 15,734 | | | | 1,426,394 | | | | 882,571 | | | | 5 | | | | 7 | |
| Cost of shares redeemed | | | | | | | | | | | | | | | | | | | | | | | | |
| Institutional | | | (19,170,407 | ) | | | (5,230,173 | ) | | | (368,917,493 | ) | | | (147,524,386 | ) | | | (145,932 | ) | | | (2,193 | ) |
| Class A | | | (806,978 | ) | | | (3,402,079 | ) | | | (21,945,600 | ) | | | (16,690,058 | ) | | | (472,721 | ) | | | — | |
| Class C | | | (62,808 | ) | | | — | | | | (8,894,259 | ) | | | (2,702,773 | ) | | | (813 | ) | | | — | |
| Net increase in net assets from share transactions of beneficial interest | | | 4,072,340 | | | | 45,802,795 | | | | 65,569,994 | | | | 360,741,514 | | | | 1,766,841 | | | | 2,147,061 | |
| | | | | | | | | | | | | | | | | | | | | | | | | |
| Total Increase/(Decrease) in Net Assets | | | (12,291,999 | ) | | | 46,475,973 | | | | 6,678,688 | | | | 359,700,071 | | | | 1,625,792 | | | | 2,081,861 | |
| | | | | | | | | | | | | | | | | | | | | | | | | |
| Net Assets: | | | | | | | | | | | | | | | | | | | | | | | | |
| Beginning of year | | | 120,813,634 | | | | 74,337,661 | | | | 763,938,992 | | | | 404,238,921 | | | | 2,081,861 | | | | — | |
| End of year | | $ | 108,521,635 | | | $ | 120,813,634 | | | $ | 770,617,680 | | | $ | 763,938,992 | | | $ | 3,707,653 | | | $ | 2,081,861 | |
| | | | | | | | | | | | | | | | | | | | | | | | | |
| Share Activity: | | | | | | | | | | | | | | | | | | | | | | | | |
| Institutional | | | | | | | | | | | | | | | | | | | | | | | | |
| Shares Sold | | | 2,003,460 | | | | 3,747,781 | | | | 20,024,080 | | | | 22,491,468 | | | | 174,869 | | | | 138,301 | |
| Shares Reinvested | | | 77,374 | | | | 247,587 | | | | 1,961,926 | | | | 1,064,410 | | | | 688 | | | | 663 | |
| Shares Redeemed | | | (1,781,095 | ) | | | (427,027 | ) | | | (19,716,230 | ) | | | (7,459,838 | ) | | | (15,257 | ) | | | (224 | ) |
| Net increase in shares of Beneficial interest | | | 299,739 | | | | 3,568,341 | | | | 2,269,776 | | | | 16,096,040 | | | | 160,300 | | | | 138,740 | |
| | | | | | | | | | | | | | | | | | | | | | | | | |
| Class A | | | | | | | | | | | | | | | | | | | | | | | | |
| Shares Sold | | | 63,854 | | | | 417,885 | | | | 1,847,038 | | | | 1,806,173 | | | | 61,605 | | | | 70,656 | |
| Shares Reinvested | | | 3,668 | | | | 26,625 | | | | 186,613 | | | | 101,502 | | | | 213 | | | | 463 | |
| Shares Redeemed | | | (75,713 | ) | | | (286,961 | ) | | | (1,163,524 | ) | | | (845,343 | ) | | | (51,263 | ) | | | — | |
| Net increase (decrease) in shares of Beneficial interest | | | (8,191 | ) | | | 157,549 | | | | 870,127 | | | | 1,062,332 | | | | 10,555 | | | | 71,119 | |
| | | | | | | | | | | | | | | | | | | | | | | | | |
| Class C | | | | | | | | | | | | | | | | | | | | | | | | |
| Shares Sold | | | 13,173 | | | | 14,914 | | | | 476,926 | | | | 1,181,532 | | | | 911 | | | | 2,623 | |
| Shares Reinvested | | | 385 | | | | 1,340 | | | | 76,805 | | | | 44,876 | | | | 1 | | | | 1 | |
| Shares Redeemed | | | (5,735 | ) | | | — | | | | (477,681 | ) | | | (137,204 | ) | | | (91 | ) | | | — | |
| Net increase in shares of Beneficial interest | | | 7,823 | | | | 16,254 | | | | 76,050 | | | | 1,089,204 | | | | 821 | | | | 2,624 | |
| (a) | The Rational Inflation Growth Fund launched August 18, 2021. |
See accompanying notes which are an intergral part of these consolidated financial statements.
| RATIONAL FUNDS |
| Rational Equity Armor Fund |
| Financial Highlights |
| |
| For a Share Outstanding Throughout Each Year |
| | | Institutional | |
| | | For the | | | For the | | | For the | | | For the | | | For the | |
| | | Year Ended | | | Year Ended | | | Year Ended | | | Year Ended | | | Year Ended | |
| | | December 31, | | | December 31, | | | December 31, | | | December 31, | | | December 31, | |
| | | 2022 | | | 2021 | | | 2020 | | | 2019 | | | 2018 | |
| Net asset value, beginning of year | | $ | 8.99 | | | $ | 7.96 | | | $ | 6.94 | | | $ | 6.58 | | | $ | 8.02 | |
| | | | | | | | | | | | | | | | | | | | | |
| INCOME (LOSS) FROM INVESTMENT OPERATIONS: | | | | | | | | | | | | | | | | | | | | |
| Net investment income (A) | | | 0.07 | | | | 0.07 | | | | 0.08 | | | | 0.22 | | | | 0.34 | |
| Net realized and unrealized gain (loss) on investments | | | (1.03 | ) | | | 1.07 | | | | 1.03 | | | | 0.51 | | | | (1.26 | ) |
| Total from investment operations | | | (0.96 | ) | | | 1.14 | | | | 1.11 | | | | 0.73 | | | | (0.92 | ) |
| | | | | | | | | | | | | | | | | | | | | |
| LESS DISTRIBUTIONS: | | | | | | | | | | | | | | | | | | | | |
| From net investment income | | | (0.06 | ) | | | (0.11 | ) | | | (0.09 | ) | | | (0.37 | ) | | | (0.52 | ) |
| From net realized gains on investments | | | — | | | | — | | | | — | | | | — | | | | — | |
| Total distributions | | | (0.06 | ) | | | (0.11 | ) | | | (0.09 | ) | | | (0.37 | ) | | | (0.52 | ) |
| | | | | | | | | | | | | | | | | | | | | |
| Net asset value, end of year | | $ | 7.97 | | | $ | 8.99 | | | $ | 7.96 | | | $ | 6.94 | | | $ | 6.58 | |
| | | | | | | | | | | | | | | | | | | | | |
| Total return (B) | | | (10.68 | )% | | | 14.37 | % (E) | | | 16.00 | % | | | 11.32 | % | | | (11.96 | )% |
| | | | | | | | | | | | | | | | | | | | | |
| RATIOS/SUPPLEMENTAL DATA: | | | | | | | | | | | | | | | | | | | | |
| Net assets, end of year (in 000’s) | | $ | 55,862 | | | $ | 58,975 | | | $ | 46,451 | | | $ | 7,155 | | | $ | 4,940 | |
| Ratios to average net assets (including interest expense) | | | | | | | | | | | | | | | | | | | | |
| Expenses, before waiver and reimbursement (C) | | | 1.20 | % | | | 1.15 | % | | | 1.32 | % | | | 1.75 | % | | | 1.58 | % |
| Expenses, net waiver and reimbursement (C) | | | 1.20 | % | | | 1.10 | % | | | 1.01 | % | | | 1.00 | % | | | 1.00 | % |
| Net investment income | | | 0.80 | % | | | 0.80 | % | | | 1.10 | % | | | 3.12 | % | | | 4.32 | % |
| Portfolio turnover rate | | | 281 | % | | | 239 | % | | | 480 | % | | | 394 | % | | | 307 | % |
| | | | | | | | | | | | | | | | | | | | | |
| | | Class A | |
| | | For the | | | For the | | | For the | | | For the | | | For the | |
| | | Year Ended | | | Year Ended | | | Year Ended | | | Year Ended | | | Year Ended | |
| | | December 31, | | | December 31, | | | December 31, | | | December 31, | | | December 31, | |
| | | 2022 | | | 2021 | | | 2020 | | | 2019 | | | 2018 | |
| Net asset value, beginning of year | | $ | 8.98 | | | $ | 7.95 | | | $ | 6.93 | | | $ | 6.57 | | | $ | 8.01 | |
| | | | | | | | | | | | | | | | | | | | | |
| INCOME (LOSS) FROM INVESTMENT OPERATIONS: | | | | | | | | | | | | | | | | | | | | |
| Net investment income (A) | | | 0.04 | | | | 0.05 | | | | 0.04 | | | | 0.20 | | | | 0.32 | |
| Net realized and unrealized gain (loss) on investments | | | (1.01 | ) | | | 1.07 | | | | 1.05 | | | | 0.51 | | | | (1.26 | ) |
| Total from investment operations | | | (0.97 | ) | | | 1.12 | | | | 1.09 | | | | 0.71 | | | | (0.94 | ) |
| | | | | | | | | | | | | | | | | | | | | |
| LESS DISTRIBUTIONS: | | | | | | | | | | | | | | | | | | | | |
| From net investment income | | | (0.05 | ) | | | (0.09 | ) | | | (0.07 | ) | | | (0.35 | ) | | | (0.50 | ) |
| From net realized gains on investments | | | — | | | | — | | | | — | | | | — | | | | — | |
| Total distributions | | | (0.05 | ) | | | (0.09 | ) | | | (0.07 | ) | | | (0.35 | ) | | | (0.50 | ) |
| | | | | | | | | | | | | | | | | | | | | |
| Net asset value, end of year | | $ | 7.96 | | | $ | 8.98 | | | $ | 7.95 | | | $ | 6.93 | | | $ | 6.57 | |
| | | | | | | | | | | | | | | | | | | | | |
| Total return (B) | | | (10.86 | )% | | | 14.11 | % | | | 15.74 | % | | | 11.03 | % | | | (12.22 | )% |
| | | | | | | | | | | | | | | | | | | | | |
| RATIOS/SUPPLEMENTAL DATA: | | | | | | | | | | | | | | | | | | | | |
| Net assets, end of year (in 000’s) | | $ | 9,717 | | | $ | 11,858 | | | $ | 12,099 | | | $ | 11,462 | | | $ | 12,629 | |
| Ratios to average net assets (including interest expense) | | | | | | | | | | | | | | | | | | | | |
| Expenses, before waiver and reimbursement (D) | | | 1.46 | % | | | 1.40 | % | | �� | 1.69 | % | | | 2.00 | % | | | 1.82 | % |
| Expenses, net waiver and reimbursement (D) | | | 1.46 | % | | | 1.35 | % | | | 1.26 | % | | | 1.25 | % | | | 1.25 | % |
| Net investment income | | | 0.53 | % | | | 0.55 | % | | | 0.58 | % | | | 2.90 | % | | | 4.17 | % |
| Portfolio turnover rate | | | 281 | % | | | 239 | % | | | 480 | % | | | 394 | % | | | 307 | % |
| | | | | | | | | | | | | | | | | | | | | |
| (A) | Per share amounts calculated using average shares method, which more appropriately presents the per share data for the year. |
| (B) | Total return in the above table represents the rate that the investor would have earned or lost on an investment in the Fund assuming reinvestment of dividends and does not reflect the impact of sales charges. Had the Advisor not waived its fees and reimbursed expenses, total return would have been lower. |
| (C) | Ratios to average net assets (excluding interest expense) |
| Expenses, before waiver and reimbursement | | | 1.19 | % | | | 1.15 | % | | | 1.31 | % | | | 1.75 | % | | | 1.58 | % |
| Expenses, net waiver and reimbursement | | | 1.19 | % | | | 1.10 | % | | | 1.00 | % | | | 1.00 | % | | | 1.00 | % |
| | | | | | | | | | | | | | | | | | | | | |
| (D) | Ratios to average net assets (excluding interest expense) |
| Expenses, before waiver and reimbursement | | | 1.45 | % | | | 1.40 | % | | | 1.68 | % | | | 2.00 | % | | | 1.82 | % |
| Expenses, net waiver and reimbursement | | | 1.45 | % | | | 1.35 | % | | | 1.25 | % | | | 1.25 | % | | | 1.25 | % |
| | | | | | | | | | | | | | | | | | | | | |
| (E) | Includes adjustments in accordance with accounting principles generally accepted in the United States and, consequently, the net asset value for financial reporting purposes and the returns based upon those net asset values may differ from the net asset values and returns for shareholder transactions. |
See accompanying notes which are an integral part of these financial statements.
| RATIONAL FUNDS |
| Rational Equity Armor Fund (Continued) |
| Financial Highlights |
| |
| For a Share Outstanding Throughout Each Year |
| | | Class C | |
| | | For the | | | For the | | | For the | | | For the | | | For the | |
| | | Year Ended | | | Year Ended | | | Year Ended | | | Year Ended | | | Year Ended | |
| | | December 31, | | | December 31, | | | December 31, | | | December 31, | | | December 31, | |
| | | 2022 | | | 2021 | | | 2020 | | | 2019 | | | 2018 | |
| Net asset value, beginning of year | | $ | 8.93 | | | $ | 7.90 | | | $ | 6.91 | | | $ | 6.55 | | | $ | 7.99 | |
| | | | | | | | | | | | | | | | | | | | | |
| INCOME (LOSS) FROM INVESTMENT OPERATIONS: | | | | | | | | | | | | | | | | | | | | |
| Net investment income (loss) (A) | | | (0.01 | ) | | | (0.01 | ) | | | (0.01 | ) | | | 0.15 | | | | 0.27 | |
| Net realized and unrealized gain (loss) on investments | | | (1.02 | ) | | | 1.07 | | | | 1.04 | | | | 0.51 | | | | (1.27 | ) |
| Total from investment operations | | | (1.03 | ) | | | 1.06 | | | | 1.03 | | | | 0.66 | | | | (1.00 | ) |
| | | | | | | | | | | | | | | | | | | | | |
| LESS DISTRIBUTIONS: | | | | | | | | | | | | | | | | | | | | |
| From net investment income | | | (0.01 | ) | | | (0.03 | ) | | | (0.04 | ) | | | (0.30 | ) | | | (0.44 | ) |
| From net realized gains on investments | | | — | | | | — | | | | — | | | | — | | | | — | |
| Total distributions | | | (0.01 | ) | | | (0.03 | ) | | | (0.04 | ) | | | (0.30 | ) | | | (0.44 | ) |
| | | | | | | | | | | | | | | | | | | | | |
| Net asset value, end of year | | $ | 7.89 | | | $ | 8.93 | | | $ | 7.90 | | | $ | 6.91 | | | $ | 6.55 | |
| | | | | | | | | | | | | | | | | | | | | |
| Total return (B) | | | (11.51 | )% | | | 13.40 | % | | | 14.88 | % | | | 10.23 | % (C) | | | (12.92 | )% (C) |
| | | | | | | | | | | | | | | | | | | | | |
| RATIOS/SUPPLEMENTAL DATA: | | | | | | | | | | | | | | | | | | | | |
| Net assets, end of year (in 000’s) | | $ | 1,610 | | | $ | 1,771 | | | $ | 1,164 | | | $ | 1,252 | | | $ | 1,664 | |
| Ratios to average net assets (including interest expense) | | | | | | | | | | | | | | | | | | | | |
| Expenses, before waiver and reimbursement (D) | | | 2.15 | % | | | 2.15 | % | | | 2.39 | % | | | 2.75 | % | | | 2.59 | % |
| Expenses, net waiver and reimbursement (D) | | | 2.15 | % | | | 2.06 | % | | | 2.01 | % | | | 2.00 | % | | | 1.90 | % |
| Net investment income (loss) | | | (0.15 | )% | | | (0.16 | )% | | | -0.18 | % | | | 2.16 | % | | | 3.52 | % |
| Portfolio turnover rate | | | 281 | % | | | 239 | % | | | 480 | % | | | 394 | % | | | 307 | % |
| | | | | | | | | | | | | | | | | | | | | |
| (A) | Per share amounts calculated using average shares method, which more appropriately presents the per share data for the year. |
| (B) | Total return in the above table represents the rate that the investor would have earned or lost on an investment in the Fund assuming reinvestment of dividends. Had the Advisor not waived its fees and reimbursed expenses, total return would have been lower. |
| (C) | Includes adjustments in accordance with accounting principles generally accepted in the United States and, consequently, the net asset value for financial reporting purposes and the returns based upon those net asset values may differ from the net asset values and returns for shareholder transactions. |
| (D) | Ratios to average net assets (excluding interest expense) |
| Expenses, before waiver and reimbursement | | | 2.14 | % | | | 2.14 | % | | | 2.38 | % | | | 2.75 | % | | | 2.59 | % |
| Expenses, net waiver and reimbursement | | | 2.14 | % | | | 2.06 | % | | | 2.00 | % | | | 2.00 | % | | | 1.90 | % |
| | | | | | | | | | | | | | | | | | | | | |
| (E) | Amount is less than $0.005. |
See accompanying notes which are an integral part of these financial statements.
| RATIONAL FUNDS |
| Rational Tactical Return Fund |
| Financial Highlights |
| |
| For a Share Outstanding Throughout Each Year |
| | | Institutional | |
| | | For the | | | For the | | | For the | | | For the | | | For the | |
| | | Year Ended | | | Year Ended | | | Year Ended | | | Year Ended | | | Year Ended | |
| | | December 31, | | | December 31, | | | December 31, | | | December 31, | | | December 31, | |
| | | 2022(A) | | | 2021(A) | | | 2020(A) | | | 2019(A) | | | 2018(A) | |
| Net asset value, beginning of year | | $ | 17.10 | | | $ | 17.07 | | | $ | 16.98 | | | $ | 16.20 | | | $ | 14.97 | |
| | | | | | | | | | | | | | | | | | | | | |
| INCOME (LOSS) FROM INVESTMENT OPERATIONS: | | | | | | | | | | | | | | | | | | | | |
| Net investment income (loss) (B) | | | (0.09 | ) | | | (0.33 | ) | | | (0.27 | ) | | | (0.03 | ) | | | (0.18 | ) |
| Net realized and unrealized gain on investments | | | 0.04 | | | | 0.99 | | | | 0.72 | | | | 1.38 | | | | 1.65 | |
| Total from investment operations | | | (0.05 | ) | | | 0.66 | | | | 0.45 | | | | 1.35 | | | | 1.47 | |
| | | | | | | | | | | | | | | | | | | | | |
| LESS DISTRIBUTIONS: | | | | | | | | | | | | | | | | | | | | |
| From net investment income | | | — | | | | — | | | | — | | | | — | | | | (0.03 | ) |
| From net realized gains on investments | | | (0.05 | ) | | | (0.63 | ) | | | (0.36 | ) | | | (0.57 | ) | | | (0.21 | ) |
| Total distributions | | | (0.05 | ) | | | (0.63 | ) | | | (0.36 | ) | | | (0.57 | ) | | | (0.24 | ) |
| | | | | | | | | | | | | | | | | | | | | |
| Net asset value, end of year | | $ | 17.00 | | | $ | 17.10 | | | $ | 17.07 | | | $ | 16.98 | | | $ | 16.20 | |
| | | | | | | | | | | | | | | | | | | | | |
| Total return (C) | | | (0.30 | )% | | | 3.94 | % | | | 2.65 | % | | | 8.35 | % | | | 9.66 | % |
| | | | | | | | | | | | | | | | | | | | | |
| RATIOS/SUPPLEMENTAL DATA: | | | | | | | | | | | | | | | | | | | | |
| Net assets, end of year (in 000’s) | | $ | 199,786 | | | $ | 264,557 | | | $ | 199,987 | | | $ | 151,070 | | | $ | 18,333 | |
| Ratios to average net assets (including interest expense) | | | | | | | | | | | | | | | | | | | | |
| Expenses, before waiver and reimbursement (E) | | | 2.02 | % | | | 2.04 | % | | | 2.05 | % | | | 2.15 | % | | | 3.16 | % |
| Expenses, net waiver and reimbursement (E) | | | 1.99 | % | | | 1.99 | % | | | 1.99 | % | | | 1.99 | % | | | 1.99 | % |
| Net investment income (loss) | | | (0.86 | )% | | | (1.98 | )% | | | (1.54 | )% | | | (0.15 | )% | | | (1.20 | )% |
| Portfolio turnover rate | | | 0 | % | | | 0 | % | | | 0 | % | | | 0 | % | | | 0 | % |
| | | | | | | | | | | | | | | | | | | | | |
| | | Class A | |
| | | For the | | | For the | | | For the | | | For the | | | For the | |
| | | Year Ended | | | Year Ended | | | Year Ended | | | Year Ended | | | Year Ended | |
| | | December 31, | | | December 31, | | | December 31, | | | December 31, | | | December 31, | |
| | | 2022(A) | | | 2021(A) | | | 2020(A) | | | 2019(A) | | | 2018(A) | |
| | | $ | 17.16 | | | $ | 17.16 | | | $ | 17.10 | | | $ | 16.35 | | | $ | 15.12 | |
| Net asset value, beginning of year | | | | | | | | | | | | | | | | | | | | |
| | | | | | | | | | | | | | | | | | | | | |
| INCOME (LOSS) FROM INVESTMENT OPERATIONS: | | | | | | | | | | | | | | | | | | | | |
| Net investment income (loss) (B) | | | (0.12 | ) | | | (0.39 | ) | | | (0.27 | ) | | | (0.06 | ) | | | (0.21 | ) |
| Net realized and unrealized gain on investments | | | 0.03 | | | | 1.02 | | | | 0.69 | | | | 1.38 | | | | 1.65 | |
| Total from investment operations | | | (0.09 | ) | | | 0.63 | | | | 0.42 | | | | 1.32 | | | | 1.44 | |
| | | | | | | | | | | | | | | | | | | | | |
| LESS DISTRIBUTIONS: | | | | | | | | | | | | | | | | | | | | |
| From net investment income | | | — | | | | — | | | | — | | | | — | | | | 0.00 | (D) |
| From net realized gains on investments | | | (0.05 | ) | | | (0.63 | ) | | | (0.36 | ) | | | (0.57 | ) | | | (0.21 | ) |
| Total distributions | | | (0.05 | ) | | | (0.63 | ) | | | (0.36 | ) | | | (0.57 | ) | | | (0.21 | ) |
| | | | | | | | | | | | | | | | | | | | | |
| Net asset value, end of year | | $ | 17.02 | | | $ | 17.16 | | | $ | 17.16 | | | $ | 17.10 | | | $ | 16.35 | |
| | | | | | | | | | | | | | | | | | | | | |
| Total return (C) | | | (0.53 | )% | | | 3.75 | % | | | 2.45 | % | | | 8.09 | % | | | 9.45 | % |
| | | | | | | | | | | | | | | | | | | | | |
| RATIOS/SUPPLEMENTAL DATA: | | | | | | | | | | | | | | | | | | | | |
| Net assets, end of year (in 000’s) | | $ | 8,868 | | | $ | 18,494 | | | $ | 7,423 | | | $ | 15,097 | | | $ | 18,327 | |
| Ratios to average net assets (including interest expense) | | | | | | | | | | | | | | | | | | | | |
| Expenses, before waiver and reimbursement (F) | | | 2.29 | % | | | 2.29 | % | | | 2.33 | % | | | 2.51 | % | | | 3.50 | % |
| Expenses, net waiver and reimbursement (F) | | | 2.24 | % | | | 2.24 | % | | | 2.24 | % | | | 2.24 | % | | | 2.24 | % |
| Net investment income (loss) | | | (1.28 | )% | | | (2.23 | )% | | | (1.64 | )% | | | (0.31 | )% | | | (1.20 | )% |
| Portfolio turnover rate | | | 0 | % | | | 0 | % | | | 0 | % | | | 0 | % | | | 0 | % |
| | | | | | | | | | | | | | | | | | | | | |
| (A) | Effective April 22, 2022, the Fund had a one-to-three reverse stock split. Per Share amounts for the periods have been adjusted to give effect to the one-to-three stock split. |
| (B) | Per share amounts calculated using average shares method, which more appropriately presents the per share data for the year. |
| (C) | Total return in the above table represents the rate that the investor would have earned or lost on an investment in the Fund assuming reinvestment of dividends and does not reflect the impact of sales charges. Had the Advisor not waived its fees and reimbursed expenses, total return would have been lower. |
| (D) | Amount is less than $0.005. |
| (E) | Ratios to average net assets (excluding interest expense) |
| Expenses, before waiver and reimbursement | | | 2.02 | % | | | 2.04 | % | | | 2.05 | % | | | 2.51 | % | | | 3.50 | % |
| Expenses, net waiver and reimbursement | | | 1.99 | % | | | 1.99 | % | | | 1.99 | % | | | 2.24 | % | | | 2.24 | % |
| | | | | | | | | | | | | | | | | | | | | |
| (F) | Ratios to average net assets (excluding interest expense) |
| Expenses, before waiver and reimbursement | | | 2.29 | % | | | 2.29 | % | | | 2.33 | % | | | 2.51 | % | | | 3.50 | % |
| Expenses, net waiver and reimbursement | | | 2.24 | % | | | 2.24 | % | | | 2.24 | % | | | 2.24 | % | | | 2.24 | % |
| | | | | | | | | | | | | | | | | | | | | |
See accompanying notes which are an integral part of these financial statements.
| RATIONAL FUNDS |
| Rational Tactical Return Fund (Continued) |
| Financial Highlights |
| |
| For a Share Outstanding Throughout Each Year |
| | | Class C | |
| | | For the | | | For the | | | For the | | | For the | | | For the | |
| | | Year Ended | | | Year Ended | | | Year Ended | | | Year Ended | | | Year Ended | |
| | | December 31, | | | December 31, | | | December 31, | | | December 31, | | | December 31, | |
| | | 2022(A) | | | 2021(A) | | | 2020(A) | | | 2019(A) | | | 2018(A) | |
| Net asset value, beginning of year | | $ | 16.65 | | | $ | 16.80 | | | $ | 16.86 | | | $ | 16.29 | | | $ | 15.18 | |
| | | | | | | | | | | | | | | | | | | | | |
| INCOME (LOSS) FROM INVESTMENT OPERATIONS: | | | | | | | | | | | | | | | | | | | | |
| Net investment loss (B) | | | (0.19 | ) | | | (0.51 | ) | | | (0.42 | ) | | | (0.21 | ) | | | (0.36 | ) |
| Net realized and unrealized gain (loss) on investments | | | (0.03 | ) (C) | | | 0.99 | | | | 0.72 | | | | 1.35 | | | | 1.68 | |
| Total from investment operations | | | (0.22 | ) | | | 0.48 | | | | 0.30 | | | | 1.14 | | | | 1.32 | |
| | | | | | | | | | | | | | | | | | | | | |
| LESS DISTRIBUTIONS: | | | | | | | | | | | | | | | | | | | | |
| From net investment income | | | — | | | | — | | | | — | | | | — | | | | — | |
| From net realized gains on investments | | | (0.05 | ) | | | (0.63 | ) | | | (0.36 | ) | | | (0.57 | ) | | | (0.21 | ) |
| Total distributions | | | (0.05 | ) | | | (0.63 | ) | | | (0.36 | ) | | | (0.57 | ) | | | (0.21 | ) |
| | | | | | | | | | | | | | | | | | | | | |
| Net assets, end of year (in 000’s) | | $ | 16.38 | | | $ | 16.65 | | | $ | 16.80 | | | $ | 16.86 | | | $ | 16.29 | |
| | | | | | | | | | | | | | | | | | | | | |
| Total return (D) | | | (1.33 | )% | | | 2.94 | % | | | 1.77 | % | | | 7.01 | % | | | 8.62 | % |
| | | | | | | | | | | | | | | | | | | | | |
| RATIOS/SUPPLEMENTAL DATA: | | | | | | | | | | | | | | | | | | | | |
| Net assets, end of year (in 000’s) | | $ | 7,808 | | | $ | 9,444 | | | $ | 9,130 | | | $ | 6,453 | | | $ | 1 | |
| Ratios to average net assets (including interest expense) | | | | | | | | | | | | | | | | | | | | |
| Expenses, before waiver and reimbursement (E) | | | 2.99 | % | | | 3.00 | % | | | 3.04 | % | | | 3.11 | % | | | 4.16 | % |
| Expenses, net waiver and reimbursement (E) | | | 2.99 | % | | | 2.99 | % | | | 2.99 | % | | | 2.99 | % | | | 2.99 | % |
| Net investment loss | | | (1.85 | )% | | | (2.98 | )% | | | (2.54 | )% | | | (1.18 | )% | | | (2.34 | )% |
| Portfolio turnover rate | | | 0 | % | | | 0 | % | | | 0 | % | | | 0 | % | | | 0 | % |
| | | | | | | | | | | | | | | | | | | | | |
| (A) | Effective April 22, 2022, the Fund had a one-to-three reverse stock split. Per Share amounts for the periods have been adjusted to give effect to the one-to-three stock split. |
| (B) | Per share amounts calculated using average shares method, which more appropriately presents the per share data for the year. |
| (C) | As required by SEC standard per share data calculation methodology, this represents a balancing figure derived from the other amounts in the financial highlights tables that captures all other changes affecting net asset value per share. This per share gain amount |
| (D) | Total return in the above table represents the rate that the investor would have earned or lost on an investment in the Fund assuming reinvestment of dividends. Had the Advisor not waived its fees and reimbursed expenses, total return would have been lower. |
| (E) | Ratios to average net assets (excluding interest expense) |
| Expenses, before waiver and reimbursement | | | 2.99 | % | | | 3.00 | % | | | 3.04 | % | | | 3.11 | % | | | 4.16 | % |
| Expenses, net waiver and reimbursement | | | 2.99 | % | | | 2.99 | % | | | 2.99 | % | | | 2.99 | % | | | 2.99 | % |
| | | | | | | | | | | | | | | | | | | | | |
See accompanying notes which are an integral part of these financial statements.
| RATIONAL FUNDS |
| Rational Dynamic Brands Fund |
| Financial Highlights |
| |
| For a Share Outstanding Throughout Each Year |
| | | Institutional | |
| | | For the | | | For the | | | For the | | | For the | | | For the | |
| | | Year Ended | | | Year Ended | | | Year Ended | | | Year Ended | | | Year Ended | |
| | | December 31, | | | December 31, | | | December 31, | | | December 31, | | | December 31, | |
| | | 2022 | | | 2021 | | | 2020 | | | 2019 | | | 2018(A) | |
| Net asset value, beginning of year | | $ | 59.52 | | | $ | 56.20 | | | $ | 43.30 | | | $ | 34.20 | | | $ | 34.90 | |
| | | | | | | | | | | | | | | | | | | | | |
| INCOME (LOSS) FROM INVESTMENT OPERATIONS: | | | | | | | | | | | | | | | | | | | | |
| Net investment income (loss) (B) | | | (0.07 | ) | | | (0.41 | ) | | | (0.33 | ) | | | (0.14 | ) | | | 0.16 | |
| Net realized and unrealized gain (loss) on investments | | | (21.01 | ) | | | 8.68 | | | | 19.98 | | | | 9.38 | | | | 0.07 | (D) |
| Total from investment operations | | | (21.08 | ) | | | 8.27 | | | | 19.65 | | | | 9.24 | | | | 0.23 | |
| | | | | | | | | | | | | | | | | | | | | |
| LESS DISTRIBUTIONS: | | | | | | | | | | | | | | | | | | | | |
| From net investment income | | | — | | | | — | | | | — | | | | — | | | | (0.09 | ) |
| From net realized gains on investments | | | (1.99 | ) | | | (4.95 | ) | | | (6.75 | ) | | | (0.14 | ) | | | (0.84 | ) |
| Total distributions | | | (1.99 | ) | | | (4.95 | ) | | | (6.75 | ) | | | (0.14 | ) | | | (0.93 | ) |
| | | | | | | | | | | | | | | | | | | | | |
| Net assets, end of year (in 000’s) | | $ | 36.45 | | | $ | 59.52 | | | $ | 56.20 | | | $ | 43.30 | | | $ | 34.20 | |
| | | | | | | | | | | | | | | | | | | | | |
| Total return (C) | | | (35.41 | )% | | | 14.97 | % | | | 45.28 | % | | | 27.03 | % | | | 0.72 | % |
| | | | | | | | | | | | | | | | | | | | | |
| RATIOS/SUPPLEMENTAL DATA: | | | | | | | | | | | | | | | | | | | | |
| Net assets, end of year (in 000’s) | | $ | 28,643 | | | $ | 82,648 | | | $ | 53,102 | | | $ | 21,627 | | | $ | 16,725 | |
| Ratios to average net assets (including interest expense) | | | | | | | | | | | | | | | | | | | | |
| Expenses, before waiver and reimbursement (E) | | | 1.20 | % | | | 1.10 | % | | | 1.25 | % | | | 1.45 | % | | | 1.67 | % |
| Expenses, net waiver and reimbursement (E) | | | 1.20 | % | | | 1.14 | % | | | 1.24 | % | | | 1.17 | % | | | 1.00 | % |
| Net investment income (loss) | | | (0.16 | )% | | | (0.65 | )% | | | (0.56 | )% | | | (0.36 | )% | | | 0.42 | % |
| Portfolio turnover rate | | | 154 | % | | | 225 | % | | | 320 | % | | | 220 | % | | | 411 | % |
| | | | | | | | | | | | | | | | | | | | | |
| | | Class A | |
| | | For the | | | For the | | | For the | | | For the | | | For the | |
| | | Year Ended | | | Year Ended | | | Year Ended | | | Year Ended | | | Year Ended | |
| | | December 31, | | | December 31, | | | December 31, | | | December 31, | | | December 31, | |
| | | 2022 | | | 2021 | | | 2020 | | | 2019 | | | 2018(A) | |
| Net asset value, beginning of year | | $ | 37.49 | | | $ | 37.16 | | | $ | 30.27 | | | $ | 24.00 | | | $ | 24.70 | |
| | | | | | | | | | | | | | | | | | | | | |
| INCOME (LOSS) FROM INVESTMENT OPERATIONS: | | | | | | | | | | | | | | | | | | | | |
| Net investment income (loss) (B) | | | (0.11 | ) | | | (0.41 | ) | | | (0.28 | ) | | | (0.16 | ) | | | 0.02 | |
| Net realized and unrealized gain (loss) on investments | | | (13.23 | ) | | | 5.69 | | | | 13.92 | | | | 6.57 | | | | 0.12 | (D) |
| Total from investment operations | | | (13.34 | ) | | | 5.28 | | | | 13.64 | | | | 6.41 | | | | 0.14 | |
| | | | | | | | | | | | | | | | | | | | | |
| LESS DISTRIBUTIONS: | | | | | | | | | | | | | | | | | | | | |
| From net investment income | | | — | | | | — | | | | — | | | | — | | | | — | |
| From net realized gains on investments | | | (1.99 | ) | | | (4.95 | ) | | | (6.75 | ) | | | (0.14 | ) | | | (0.84 | ) |
| Total distributions | | | (1.99 | ) | | | (4.95 | ) | | | (6.75 | ) | | | (0.14 | ) | | | (0.84 | ) |
| | | | | | | | | | | | | | | | | | | | | |
| Net assets, end of year (in 000’s) | | $ | 22.16 | | | $ | 37.49 | | | $ | 37.16 | | | $ | 30.27 | | | $ | 24.00 | |
| | | | | | | | | | | | | | | | | | | | | |
| Total return (C) | | | (35.58 | )% | | | 14.59 | % | | | 44.91 | % | | | 26.72 | % | | | 0.63 | % |
| | | | | | | | | | | | | | | | | | | | | |
| RATIOS/SUPPLEMENTAL DATA: | | | | | | | | | | | | | | | | | | | | |
| Net assets, end of year (in 000’s) | | $ | 11,668 | | | $ | 23,205 | | | $ | 17,972 | | | $ | 12,387 | | | $ | 11,154 | |
| Ratios to average net assets (including interest expense) | | | | | | | | | | | | | | | | | | | | |
| Expenses, before waiver and reimbursement (F) | | | 1.47 | % | | | 1.37 | % | | | 1.52 | % | | | 1.74 | % | | | 2.05 | % |
| Expenses, net waiver and reimbursement (F) | | | 1.47 | % | | | 1.47 | % | | | 1.49 | % | | | 1.41 | % | | | 1.25 | % |
| Net investment income (loss) | | | (0.41 | )% | | | (1.00 | )% | | | (0.82 | )% | | | (0.59 | )% | | | 0.08 | % |
| Portfolio turnover rate | | | 154 | % | | | 225 | % | | | 320 | % | | | 220 | % | | | 411 | % |
| | | | | | | | | | | | | | | | | | | | | |
| (A) | Effective September 21, 2018, the Fund had a one-to-ten reverse stock split. Per Share amounts for the periods have been adjusted to give effect to the one-to-ten stock split. |
| (B) | Per share amounts calculated using average shares method, which more appropriately presents the per share data for the year. |
| (C) | Total return in the above table represents the rate that the investor would have earned or lost on an investment in the Fund assuming reinvestment of dividends and does not reflect the impact of sales charges |
| (D) | As required by SEC standard per share data calculation methodology, this represents a balancing figure derived from the other amounts in the financial highlights tables that captures all other changes affecting net asset value per share. This per share gain amount does not correlate to the aggregate of the net realized and unrealized loss in the Statement of Operations for the year ended December 31, 2018, primarily due to the timing of sales and repurchases of the Fund’s shares in relation to fluctuating market values of the Fund’s portfolio. |
| (E) | Ratios to average net assets (excluding interest expense) |
| Expenses, before waiver and reimbursement | | | 1.19 | % | | | 1.10 | % | | | 1.25 | % | | | 1.45 | % | | | 1.67 | % |
| Expenses, net waiver and reimbursement | | | 1.19 | % | | | 1.14 | % | | | 1.24 | % | | | 1.17 | % | | | 1.00 | % |
| | | | | | | | | | | | | | | | | | | | | |
| (F) | Ratios to average net assets (excluding interest expense) |
| Expenses, before waiver and reimbursement | | | 1.46 | % | | | 1.37 | % | | | 1.52 | % | | | 1.74 | % | | | 2.05 | % |
| Expenses, net waiver and reimbursement | | | 1.46 | % | | | 1.47 | % | | | 1.49 | % | | | 1.41 | % | | | 1.25 | % |
| | | | | | | | | | | | | | | | | | | | | |
See accompanying notes which are an integral part of these financial statements.
| RATIONAL FUNDS |
| Rational Dynamic Brands Fund (Continued) |
| Financial Highlights |
| |
| For a Share Outstanding Throughout Each Year |
| | | Class C | |
| | | For the | | | For the | | | For the | | | For the | | | For the | |
| | | Year Ended | | | Year Ended | | | Year Ended | | | Year Ended | | | Year Ended | |
| | | December 31, | | | December 31, | | | December 31, | | | December 31, | | | December 31, | |
| | | 2022 | | | 2021 | | | 2020 | | | 2019 | | | 2018(A) | |
| Net asset value, beginning of year | | $ | 31.73 | | | $ | 32.34 | | | $ | 27.15 | | | $ | 21.70 | | | $ | 22.60 | |
| | | | | | | | | | | | | | | | | | | | | |
| INCOME (LOSS) FROM INVESTMENT OPERATIONS: | | | | | | | | | | | | | | | | | | | | |
| Net investment loss (B) | | | (0.26 | ) | | | (0.58 | ) | | | (0.50 | ) | | | (0.32 | ) | | | (0.14 | ) |
| Net realized and unrealized gain (loss) on investments | | | (11.17 | ) | | | 4.92 | | | | 12.44 | | | | 5.91 | | | | 0.08 | (E) |
| Total from investment operations | | | (11.43 | ) | | | 4.34 | | | | 11.94 | | | | 5.59 | | | | (0.06 | ) |
| | | | | | | | | | | | | | | | | | | | | |
| LESS DISTRIBUTIONS: | | | | | | | | | | | | | | | | | | | | |
| From net investment income | | | — | | | | — | | | | — | | | | — | | | | — | |
| From net realized gains on investments | | | (1.99 | ) | | | (4.95 | ) | | | (6.75 | ) | | | (0.14 | ) | | | (0.84 | ) |
| Total distributions | | | (1.99 | ) | | | (4.95 | ) | | | (6.75 | ) | | | (0.14 | ) | | | (0.84 | ) |
| | | | | | | | | | | | | | | | | | | | | |
| Net assets, end of year (in 000’s) | | $ | 18.31 | | | $ | 31.73 | | | $ | 32.34 | | | $ | 27.15 | | | $ | 21.70 | |
| | | | | | | | | | | | | | | | | | | | | |
| Total return (C) | | | (36.02 | )% | | | 13.85 | % | | | 43.80 | % | | | 25.78 | % (D) | | | (0.20 | )% (D) |
| | | | | | | | | | | | | | | | | | | | | |
| RATIOS/SUPPLEMENTAL DATA: | | | | | | | | | | | | | | | | | | | | |
| Net assets, end of year (in 000’s) | | $ | 2,852 | | | $ | 4,898 | | | $ | 1,525 | | | $ | 184 | | | $ | 214 | |
| Ratios to average net assets (including interest expense) | | | | | | | | | | | | | | | | | | | | |
| Expenses, before waiver and reimbursement (F) | | | 2.18 | % | | | 2.08 | % | | | 2.41 | % | | | 2.68 | % | | | 2.73 | % |
| Expenses, net waiver and reimbursement (F) | | | 2.18 | % | | | 2.12 | % | | | 2.24 | % | | | 2.15 | % | | | 1.91 | % |
| Net investment loss | | | (1.12 | )% | | | (1.62 | )% | | | (1.54 | )% | | | (1.30 | )% | | | (0.59 | )% |
| Portfolio turnover rate | | | 154 | % | | | 225 | % | | | 320 | % | | | 220 | % | | | 411 | % |
| | | | | | | | | | | | | | | | | | | | | |
| (A) | Effective September 21, 2018, the Fund had a one-to-ten reverse stock split. Per Share amounts for the periods have been adjusted to give effect to the one-to-ten stock split. |
| (B) | Per share amounts calculated using average shares method, which more appropriately presents the per share data for the year. |
| (C) | Total return in the above table represents the rate that the investor would have earned or lost on an investment in the Fund assuming reinvestment of dividends and does not reflect the impact of sales charges |
| (D) | Includes adjustments in accordance with accounting principles generally accepted in the United States and, consequently, the net asset value for financial reporting purposes and the returns based upon those net asset values may differ from the net asset values and returns for shareholder transactions. |
| (E) | As required by SEC standard per share data calculation methodology, this represents a balancing figure derived from the other amounts in the financial highlights tables that captures all other changes affecting net asset value per share. This per share gain amount does not correlate to the aggregate of the net realized and unrealized loss in the Statement of Operations for the year ended December 31, 2018, primarily due to the timing of sales and repurchases of the Fund’s shares in relation to fluctuating market values of the Fund’s portfolio. |
| (F) | Ratios to average net assets (excluding interest expense) |
| Expenses, before waiver and reimbursement | | | 2.17 | % | | | 2.08 | % | | | 2.41 | % | | | 2.68 | % | | | 2.73 | % |
| Expenses, net waiver and reimbursement | | | 2.17 | % | | | 2.12 | % | | | 2.24 | % | | | 2.15 | % | | | 1.91 | % |
| | | | | | | | | | | | | | | | | | | | | |
See accompanying notes which are an integral part of these financial statements.
| RATIONAL FUNDS |
| Rational Strategic Allocation Fund |
| Financial Highlights |
| |
| For a Share Outstanding Throughout Each Year |
| | | Institutional | |
| | | For the | | | For the | | | For the | | | For the | | | For the | |
| | | Year Ended | | | Year Ended | | | Year Ended | | | Year Ended | | | Year Ended | |
| | | December 31, | | | December 31, | | | December 31, | | | December 31, | | | December 31, | |
| | | 2022 | | | 2021 | | | 2020 | | | 2019 | | | 2018 | |
| Net asset value, beginning of year | | $ | 10.24 | | | $ | 8.94 | | | $ | 9.58 | | | $ | 9.12 | | | $ | 10.02 | |
| | | | | | | | | | | | | | | | | | | | | |
| INCOME (LOSS) FROM INVESTMENT OPERATIONS: | | | | | | | | | | | | | | | | | | | | |
| Net investment income (A) | | | 0.31 | | | | 0.40 | | | | 0.27 | | | | 0.36 | | | | 0.39 | |
| Net realized and unrealized gain (loss) on investments | | | (3.16 | ) | | | 2.54 | | | | (0.61 | ) | | | 0.79 | | | | (0.67 | ) |
| Total from investment operations | | | (2.85 | ) | | | 2.94 | | | | (0.34 | ) | | | 1.15 | | | | (0.28 | ) |
| | | | | | | | | | | | | | | | | | | | | |
| LESS DISTRIBUTIONS: | | | | | | | | | | | | | | | | | | | | |
| From net investment income | | | (0.18 | ) | | | (0.36 | ) | | | (0.28 | ) | | | (0.41 | ) | | | (0.36 | ) |
| From net realized gains on investments | | | (0.37 | ) | | | (1.28 | ) | | | — | | | | (0.22 | ) | | | (0.26 | ) |
| From Return of capital | | | — | | | | — | | | | (0.02 | ) | | | (0.06 | ) | | | — | |
| Total distributions | | | (0.55 | ) | | | (1.64 | ) | | | (0.30 | ) | | | (0.69 | ) | | | (0.62 | ) |
| | | | | | | | | | | | | | | | | | | | | |
| Net asset value, end of year | | $ | 6.84 | | | $ | 10.24 | | | $ | 8.94 | | | $ | 9.58 | | | $ | 9.12 | |
| | | | | | | | | | | | | | | | | | | | | |
| Total return (B) | | | (27.87 | )% | | | 33.94 | % | | | (3.19 | )% | | | 12.64 | % | | | (2.81 | )% |
| | | | | | | | | | | | | | | | | | | | | |
| RATIOS/SUPPLEMENTAL DATA: | | | | | | | | | | | | | | | | | | | | |
| Net assets, end of year (in 000’s) | | $ | 1,027 | | | $ | 519 | | | $ | 248 | | | $ | 266 | | | $ | 253 | |
| Ratios to average net assets (including interest expense) | | | | | | | | | | | | | | | | | | | | |
| Expenses, before waiver and reimbursement (C,E) | | | 1.39 | % | | | 1.11 | % | | | 1.31 | % | | | 0.98 | % | | | 1.04 | % |
| Expenses, net waiver and reimbursement (C,E) | | | 0.46 | % | | | 0.46 | % | | | 0.45 | % | | | 0.45 | % | | | 0.45 | % |
| Net investment income (C,D) | | | 3.82 | % | | | 3.78 | % | | | 3.26 | % | | | 3.67 | % | | | 3.91 | % |
| Portfolio turnover rate | | | 27 | % | | | 2 | % | | | 89 | % | | | 62 | % | | | 53 | % |
| | | | | | | | | | | | | | �� | | | | | | | |
| | | Class A | |
| | | For the | | | For the | | | For the | | | For the | | | For the | |
| | | Year Ended | | | Year Ended | | | Year Ended | | | Year Ended | | | Year Ended | |
| | | December 31, | | | December 31, | | | December 31, | | | December 31, | | | December 31, | |
| | | 2022 | | | 2021 | | | 2020 | | | 2019 | | | 2018 | |
| Net asset value, beginning of year | | $ | 10.30 | | | $ | 8.99 | | | $ | 9.63 | | | $ | 9.15 | | | $ | 10.05 | |
| | | | | | | | | | | | | | | | | | | | | |
| INCOME (LOSS) FROM INVESTMENT OPERATIONS: | | | | | | | | | | | | | | | | | | | | |
| Net investment income (A) | | | 0.29 | | | | 0.34 | | | | 0.25 | | | | 0.32 | | | | 0.33 | |
| Net realized and unrealized gain (loss) on investments | | | (3.17 | ) | | | 2.59 | | | | (0.61 | ) | | | 0.82 | | | | (0.63 | ) |
| Total from investment operations | | | (2.88 | ) | | | 2.93 | | | | (0.36 | ) | | | 1.14 | | | | (0.30 | ) |
| | | | | | | | | | | | | | | | | | | | | |
| LESS DISTRIBUTIONS: | | | | | | | | | | | | | | | | | | | | |
| From net investment income | | | (0.17 | ) | | | (0.34 | ) | | | (0.26 | ) | | | (0.38 | ) | | | (0.34 | ) |
| From net realized gains on investments | | | (0.37 | ) | | | (1.28 | ) | | | — | | | | (0.22 | ) | | | (0.26 | ) |
| From Return of capital | | | — | | | | — | | | | (0.02 | ) | | | (0.06 | ) | | | — | |
| Total distributions | | | (0.54 | ) | | | (1.62 | ) | | | (0.28 | ) | | | (0.66 | ) | | | (0.60 | ) |
| | | | | | | | | | | | | | | | | | | | | |
| Net assets, end of year (in 000’s) | | $ | 6.88 | | | $ | 10.30 | | | $ | 8.99 | | | $ | 9.63 | | | $ | 9.15 | |
| | | | | | | | | | | | | | | | | | | | | |
| Total return (B) | | | (28.04 | )% | | | 33.57 | % | | | (3.42 | )% | | | 12.49 | % | | | (3.05 | )% |
| | | | | | | | | | | | | | | | | | | | | |
| RATIOS/SUPPLEMENTAL DATA: | | | | | | | | | | | | | | | | | | | | |
| Net assets, end of year (in 000’s) | | $ | 6,048 | | | $ | 9,830 | | | $ | 7,713 | | | $ | 9,395 | | | $ | 9,842 | |
| Ratios to average net assets (including interest expense) | | | | | | | | | | | | | | | | | | | | |
| Expenses, before waiver and reimbursement (C,F) | | | 1.72 | % | | | 1.47 | % | | | 1.65 | % | | | 1.35 | % | | | 1.37 | % |
| Expenses, net waiver and reimbursement (C,F) | | | 0.71 | % | | | 0.71 | % | | | 0.70 | % | | | 0.70 | % | | | 0.70 | % |
| Net Investment income (C,D) | | | 3.48 | % | | | 3.30 | % | | | 2.98 | % | | | 3.25 | % | | | 3.25 | % |
| Portfolio turnover rate | | | 27 | % | | | 2 | % | | | 89 | % | | | 62 | % | | | 53 | % |
| | | | | | | | | | | | | | | | | | | | | |
| (A) | Per share amounts calculated using average shares method, which more appropriately presents the per share data for the year. |
| (B) | Total return in the above table represents the rate that the investor would have earned or lost on an investment in the Fund assuming reinvestment of dividends and does not reflect the impact of sales charges. Had the Advisor not waived its fees and reimbursed expenses, total return would have been lower. |
| (C) | The ratios of expenses to average net assets and net investment income (loss) to average net assets do not reflect the expenses of the underlying investment companies in which the Fund invests. |
| (D) | Recognition of net investment income (loss) is affected by the timing and declaration of dividends by the underlying investment companies in which the Fund invests. |
| (E) | Ratios to average net assets (excluding interest expense) |
| Expenses, before waiver and reimbursement | | | 1.38 | % | | | 1.10 | % | | | 1.31 | % | | | 0.98 | % | | | 1.04 | % |
| Expenses, net waiver and reimbursement | | | 0.45 | % | | | 0.45 | % | | | 0.45 | % | | | 0.45 | % | | | 0.45 | % |
| | | | | | | | | | | | | | | | | | | | | |
| (F) | Ratios to average net assets (excluding interest expense) |
| Expenses, before waiver and reimbursement | | | 1.71 | % | | | 1.46 | % | | | 1.65 | % | | | 1.35 | % | | | 1.37 | % |
| Expenses, net waiver and reimbursement | | | 0.70 | % | | | 0.70 | % | | | 0.70 | % | | | 0.70 | % | | | 0.70 | % |
| | | | | | | | | | | | | | | | | | | | | |
See accompanying notes which are an integral part of these financial statements.
| RATIONAL FUNDS |
| Rational Strategic Allocation Fund (Continued) |
| Financial Highlights |
| |
| For a Share Outstanding Throughout Each Year |
| | | Class C | |
| | | For the | | | For the | | | For the | | | For the | | | For the | |
| | | Year Ended | | | Year Ended | | | Year Ended | | | Year Ended | | | Year Ended | |
| | | December 31, | | | December 31, | | | December 31, | | | December 31, | | | December 31, | |
| | | 2022 | | | 2021 | | | 2020 | | | 2019 | | | 2018 | |
| Net asset value, beginning of year | | $ | 10.25 | | | $ | 8.95 | | | $ | 9.58 | | | $ | 9.11 | | | $ | 10.03 | |
| | | | | | | | | | | | | | | | | | | | | |
| INCOME (LOSS) FROM INVESTMENT OPERATIONS: | | | | | | | | | | | | | | | | | | | | |
| Net investment income (A) | | | 0.23 | | | | 0.26 | | | | 0.19 | | | | 0.26 | | | | 0.29 | |
| Net realized and unrealized gain (loss) on investments | | | (3.16 | ) | | | 2.58 | | | | (0.61 | ) | | | 0.80 | | | | (0.67 | ) |
| Total from investment operations | | | (2.93 | ) | | | 2.84 | | | | (0.42 | ) | | | 1.06 | | | | (0.38 | ) |
| | | | | | | | | | | | | | | | | | | | | |
| LESS DISTRIBUTIONS: | | | | | | | | | | | | | | | | | | | | |
| From net investment income | | | (0.12 | ) | | | (0.26 | ) | | | (0.19 | ) | | | (0.31 | ) | | | (0.28 | ) |
| From net realized gains on investments | | | (0.37 | ) | | | (1.28 | ) | | | — | | | | (0.22 | ) | | | (0.26 | ) |
| From Return of capital | | | — | | | | — | | | | (0.02 | ) | | | (0.06 | ) | | | — | |
| Total distributions | | | (0.49 | ) | | | (1.54 | ) | | | (0.21 | ) | | | (0.59 | ) | | | (0.54 | ) |
| | | | | | | | | | | | | | | | | | | | | |
| Net asset value, end of year | | $ | 6.83 | | | $ | 10.25 | | | $ | 8.95 | | | $ | 9.58 | | | $ | 9.11 | |
| | | | | | | | | | | | | | | | | | | | | |
| Total return (B) | | | (28.55 | )% | | | 32.60 | % | | | (4.13 | )% | | | 11.61 | % | | | (3.83 | )% |
| | | | | | | | | | | | | | | | | | | | | |
| RATIOS/SUPPLEMENTAL DATA: | | | | | | | | | | | | | | | | | | | | |
| Net assets, end of year (in 000’s) | | $ | 1 | | | $ | 1 | | | $ | 1 | | | $ | 1 | | | $ | 1 | |
| Ratios to average net assets (including interest expense) | | | | | | | | | | | | | | | | | | | | |
| Expenses, before waiver and reimbursement (C,E) | | | 2.37 | % | | | 2.24 | % | | | 2.33 | % | | | 2.02 | % | | | 1.92 | % |
| Expenses, net waiver and reimbursement (C,E) | | | 1.46 | % | | | 1.46 | % | | | 1.45 | % | | | 1.45 | % | | | 1.45 | % |
| Net investment income (C,D) | | | 2.78 | % | | | 2.53 | % | | | 2.26 | % | | | 2.65 | % | | | 2.89 | % |
| Portfolio turnover rate | | | 27 | % | | | 2 | % | | | 89 | % | | | 62 | % | | | 53 | % |
| | | | | | | | | | | | | | | | | | | | | |
| (A) | Per share amounts calculated using average shares method, which more appropriately presents the per share data for the year. |
| (B) | Total return in the above table represents the rate that the investor would have earned or lost on an investment in the Fund assuming reinvestment of dividends and does not reflect the impact of sales charges. Had the Advisor not waived its fees and reimbursed expenses, total return would have been lower. |
| (C) | The ratios of expenses to average net assets and net investment income (loss) to average net assets do not reflect the expenses of the underlying investment companies in which the Fund invests. |
| (D) | Recognition of net investment income (loss) is affected by the timing and declaration of dividends by the underlying investment companies in which the Fund invests. |
| (E) | Ratios to average net assets (excluding interest expense) |
| Expenses, before waiver and reimbursement | | | 2.36 | % | | | 2.23 | % | | | 2.33 | % | | | 2.02 | % | | | 1.92 | % |
| Expenses, net waiver and reimbursement | | | 1.45 | % | | | 1.45 | % | | | 1.45 | % | | | 1.45 | % | | | 1.45 | % |
| | | | | | | | | | | | | | | | | | | | | |
See accompanying notes which are an integral part of these financial statements.
| RATIONAL FUNDS |
| Rational/ReSolve Adaptive Asset Allocation Fund |
| Financial Highlights (Consolidated) |
| |
| For a Share Outstanding Throughout Each Year |
| | | Institutional | |
| | | For the | | | For the | | | For the | | | For the | | | For the | |
| | | Year Ended | | | Year Ended | | | Year Ended | | | Year Ended | | | Year Ended | |
| | | December 31, | | | December 31, | | | December 31, | | | December 31, | | | December 31, | |
| | | 2022 | | | 2021 | | | 2020 | | | 2019 | | | 2018 | |
| Net asset value, beginning of year | | $ | 22.71 | | | $ | 23.77 | | | $ | 23.73 | | | $ | 23.10 | | | $ | 25.25 | |
| | | | | | | | | | | | | | | | | | | | | |
| INCOME (LOSS) FROM INVESTMENT OPERATIONS: | | | | | | | | | | | | | | | | | | | | |
| Net investment loss (A) | | | (0.07 | ) | | | (0.50 | ) | | | (0.37 | ) | | | (0.02 | ) | | | (0.04 | ) |
| Net realized and unrealized gain (loss) on investments | | | (0.62 | ) | | | 3.16 | | | | 0.52 | | | | 4.32 | | | | (1.89 | ) |
| Total from investment operations | | | (0.69 | ) | | | 2.66 | | | | 0.15 | | | | 4.30 | | | | (1.93 | ) |
| | | | | | | | | | | | | | | | | | | | | |
| LESS DISTRIBUTIONS: | | | | | | | | | | | | | | | | | | | | |
| From net investment income | | | (0.09 | ) | | | (3.72 | ) | | | (0.08 | ) | | | (0.69 | ) | | | — | |
| From net realized gains on investments | | | — | | | | — | | | | — | | | | (2.94 | ) | | | (0.22 | ) |
| Total distributions | | | (0.09 | ) | | | (3.72 | ) | | | (0.11 | ) | | | (3.67 | ) | | | (0.22 | ) |
| | | | | | | | | | | | | | | | | | | | | |
| Net asset value, end of year | | $ | 21.93 | | | $ | 22.71 | | | $ | 23.77 | | | $ | 23.73 | | | $ | 23.10 | |
| | | | | | | | | | | | | | | | | | | | | |
| Total return (B) | | | (3.06 | )% | | | 11.28 | % | | | 0.65 | % | | | 18.32 | % | | | (7.64 | )% |
| | | | | | | | | | | | | | | | | | | | | |
| RATIOS/SUPPLEMENTAL DATA: | | | | | | | | | | | | | | | | | | | | |
| Net assets, end of year (in 000’s) | | $ | 162,983 | | | $ | 64,890 | | | $ | 62,176 | | | $ | 51,221 | | | $ | 27,460 | |
| Ratios to average net assets (including interest expense) | | | | | | | | | | | | | | | | | | | | |
| Expenses, before waiver and reimbursement (C) | | | 2.05 | % | | | 2.17 | % | | | 2.18 | % | | | 2.32 | % | | | 2.90 | % |
| Expenses, net waiver and reimbursement (C) | | | 1.97 | % | | | 1.98 | % | | | 1.97 | % | | | 1.97 | % | | | 1.97 | % |
| Net investment loss | | | (0.30 | )% | | | (1.95 | )% | | | (1.61 | )% | | | (0.06 | )% | | | (0.17 | )% |
| Portfolio turnover rate | | | 0 | % | | | 0 | % | | | 0 | % | | | 0 | % | | | 0 | % |
| | | | | | | | | | | | | | | | | | | | | |
| | | Class A | |
| | | For the | | | For the | | | For the | | | For the | | | For the | |
| | | Year Ended | | | Year Ended | | | Year Ended | | | Year Ended | | | Year Ended | |
| | | December 31, | | | December 31, | | | December 31, | | | December 31, | | | December 31, | |
| | | 2022 | | | 2021 | | | 2020 | | | 2019 | | | 2018 | |
| Net asset value, beginning of year | | $ | 22.53 | | | $ | 23.61 | | | $ | 23.52 | | | $ | 22.96 | | | $ | 25.16 | |
| | | | | | | | | | | | | | | | | | | | | |
| INCOME (LOSS) FROM INVESTMENT OPERATIONS: | | | | | | | | | | | | | | | | | | | | |
| Net investment loss (A) | | | (0.04 | ) | | | (0.55 | ) | | | (0.36 | ) | | | (0.10 | ) | | | (0.11 | ) |
| Net realized and unrealized gain (loss) on investments | | | (0.70 | ) | | | 3.13 | | | | 0.45 | | | | 4.30 | | | | (1.87 | ) |
| Total from investment operations | | | (0.74 | ) | | | 2.58 | | | | 0.09 | | | | 4.20 | | | | (1.98 | ) |
| | | | | | | | | | | | | | | | | | | | | |
| LESS DISTRIBUTIONS: | | | | | | | | | | | | | | | | | | | | |
| From net investment income | | | (0.08 | ) | | | (3.66 | ) | | | — | | | | (0.66 | ) | | | — | |
| From net realized gains on investments | | | — | | | | — | | | | — | | | | (2.94 | ) | | | (0.22 | ) |
| Total distributions | | | (0.08 | ) | | | (3.66 | ) | | | — | | | | (3.64 | ) | | | (0.22 | ) |
| | | | | | | | | | | | | | | | | | | | | |
| Net asset value, end of year | | $ | 21.71 | | | $ | 22.53 | | | $ | 23.61 | | | $ | 23.52 | | | $ | 22.96 | |
| | | | | | | | | | | | | | | | | | | | | |
| Total return (B) | | | (3.30 | )% | | | 10.99 | % | | | 0.38 | % | | | 18.01 | % | | | (7.87 | )% (E) |
| | | | | | | | | | | | | | | | | | | | | |
| RATIOS/SUPPLEMENTAL DATA: | | | | | | | | | | | | | | | | | | | | |
| Net assets, end of year (in 000’s) | | $ | 3,643 | | | $ | 607 | | | $ | 776 | | | $ | 5,425 | | | $ | 2,169 | |
| Ratios to average net assets (including interest expense) | | | | | | | | | | | | | | | | | | | | |
| Expenses, before waiver and reimbursement (D) | | | 2.33 | % | | | 2.36 | % | | | 2.47 | % | | | 2.60 | % | | | 3.14 | % |
| Expenses, net waiver and reimbursement (D) | | | 2.22 | % | | | 2.23 | % | | | 2.22 | % | | | 2.22 | % | | | 2.22 | % |
| Net investment loss | | | (0.18 | )% | | | (2.10 | )% | | | (1.43 | )% | | | (0.39 | )% | | | (0.45 | )% |
| Portfolio turnover rate | | | 0 | % | | | 0 | % | | | 0 | % | | | 0 | % | | | 0 | % |
| | | | | | | | | | | | | | | | | | | | | |
| (A) | Per share amounts calculated using average shares method, which more appropriately presents the per share data for the year. |
| (B) | Total return in the above table represents the rate that the investor would have earned or lost on an investment in the Fund assuming reinvestment of dividends and does not reflect the impact of sales charges. Had the Advisor not waived its fees and reimbursed expenses, total return would have been lower. |
| (C) | Ratios to average net assets (excluding interest expense) |
| Expenses, before waiver and reimbursement | | | 2.05 | % | | | 2.16 | % | | | 2.18 | % | | | 2.32 | % | | | 2.90 | % |
| Expenses, net waiver and reimbursement | | | 1.97 | % | | | 1.97 | % | | | 1.97 | % | | | 1.97 | % | | | 1.97 | % |
| | | | | | | | | | | | | | | | | | | | | |
| (D) | Ratios to average net assets (excluding interest expense) |
| Expenses, before waiver and reimbursement | | | 2.33 | % | | | 2.35 | % | | | 2.47 | % | | | 2.60 | % | | | 3.14 | % |
| Expenses, net waiver and reimbursement | | | 2.22 | % | | | 2.22 | % | | | 2.22 | % | | | 2.22 | % | | | 2.22 | % |
| | | | | | | | | | | | | | | | | | | | | |
| (E) | Includes adjustments in accordance with accounting principles generally accepted in the United States and, consequently, the net asset value for financial reporting purposes and the returns based upon those net asset values may differ from the net asset values and returns for shareholder transactions. |
See accompanying notes which are an integral part of these financial statements.
| RATIONAL FUNDS |
| Rational/ReSolve Adaptive Asset Allocation Fund (Continued) |
| Financial Highlights (Consolidated) |
| |
| For a Share Outstanding Throughout Each Year |
| | | Class C | |
| | | For the | | | For the | | | For the | | | For the | | | For the | |
| | | Year Ended | | | Year Ended | | | Year Ended | | | Year Ended | | | Year Ended | |
| | | December 31, | | | December 31, | | | December 31, | | | December 31, | | | December 31, | |
| | | 2022 | | | 2021 | | | 2020 | | | 2019 | | | 2018 | |
| Net asset value, beginning of year | | $ | 21.88 | | | $ | 23.03 | | | $ | 23.11 | | | $ | 22.61 | | | $ | 24.96 | |
| | | | | | | | | | | | | | | | | | | | | |
| INCOME (LOSS) FROM INVESTMENT OPERATIONS: | | | | | | | | | | | | | | | | | | | | |
| Net investment loss (A) | | | (0.15 | ) | | | (0.72 | ) | | | (0.57 | ) | | | (0.26 | ) | | | (0.31 | ) |
| Net realized and unrealized gain (loss) on investments | | | (0.73 | ) | | | 3.05 | | | | 0.49 | | | | 4.20 | | | | (1.82 | ) |
| Total from investment operations | | | (0.88 | ) | | | 2.33 | | | | (0.08 | ) | | | 3.94 | | | | (2.13 | ) |
| | | | | | | | | | | | | | | | | | | | | |
| LESS DISTRIBUTIONS: | | | | | | | | | | | | | | | | | | | | |
| From net investment income | | | (0.06 | ) | | | (3.48 | ) | | | — | | | | (0.46 | ) | | | — | |
| From net realized gains on investments | | | — | | | | — | | | | — | | | | (2.94 | ) | | | (0.22 | ) |
| From Return of capital | | | — | | | | — | | | | — | | | | (0.04 | ) | | | — | |
| Total distributions | | | (0.06 | ) | | | (3.48 | ) | | | — | | | | (3.44 | ) | | | (0.22 | ) |
| | | | | | | | | | | | | | | | | | | | | |
| Net asset value, end of year | | $ | 20.94 | | | $ | 21.88 | | | $ | 23.03 | | | $ | 23.11 | | | $ | 22.61 | |
| | | | | | | | | | | | | | | | | | | | | |
| Total return (B) | | | (4.01 | )% | | | 10.18 | % | | | (0.35 | )% | | | 17.15 | % | | | (8.53 | )% |
| | | | | | | | | | | | | | | | | | | | | |
| RATIOS/SUPPLEMENTAL DATA: | | | | | | | | | | | | | | | | | | | | |
| Net assets, end of year (in 000’s) | | $ | 2,327 | | | $ | 241 | | | $ | 250 | | | $ | 438 | | | $ | 322 | |
| Ratios to average net assets (including interest expense) | | | | | | | | | | | | | | | | | | | | |
| Expenses, before waiver and reimbursement (C) | | | 3.00 | % | | | 3.18 | % | | | 3.35 | % | | | 3.37 | % | | | 4.65 | % |
| Expenses, net waiver and reimbursement (C) | | | 2.97 | % | | | 2.98 | % | | | 2.97 | % | | | 2.97 | % | | | 2.97 | % |
| Net investment loss | | | (0.66 | )% | | | (2.95 | )% | | | (2.51 | )% | | | (1.04 | )% | | | (1.24 | )% |
| Portfolio turnover rate | | | 0 | % | | | 0 | % | | | 0 | % | | | 0 | % | | | 0 | % |
| | | | | | | | | | | | | | | | | | | | | |
| (A) | Per share amounts calculated using average shares method, which more appropriately presents the per share data for the year. |
| (B) | Total return in the above table represents the rate that the investor would have earned or lost on an investment in the Fund assuming reinvestment of dividends and does not reflect the impact of sales charges. Had the Advisor not waived its fees and reimbursed expenses, total return would have been lower. |
| (C) | Ratios to average net assets (excluding interest expense) |
| Expenses, before waiver and reimbursement | | | 3.00 | % | | | 3.17 | % | | | 3.35 | % | | | 3.37 | % | | | 4.65 | % |
| Expenses, net waiver and reimbursement | | | 2.97 | % | | | 2.97 | % | | | 2.97 | % | | | 2.97 | % | | | 2.97 | % |
| | | | | | | | | | | | | | | | | | | | | |
See accompanying notes which are an integral part of these financial statements.
| RATIONAL FUNDS |
| Rational/Pier 88 Convertible Securities Fund |
| Financial Highlights |
| |
| For a Share Outstanding Throughout Each Year/Period |
| | | Institutional | |
| | | For the | | | For the | | | For the | | | For the | |
| | | Year Ended | | | Year Ended | | | Year Ended | | | Period Ended | |
| | | December 31, | | | December 31, | | | December 31, | | | December 31, | |
| | | 2022 | | | 2021 | | | 2020 | | | 2019(A) | |
| Net asset value, beginning of year/period | | $ | 11.96 | | | $ | 11.69 | | | $ | 10.17 | | | $ | 10.00 | |
| | | | | | | | | | | | | | | | | |
| INCOME FROM INVESTMENT OPERATIONS: | | | | | | | | | | | | | | | | |
| Net investment income (B) | | | 0.20 | | | | 0.13 | | | | 0.17 | | | | 0.03 | |
| Net realized and unrealized gain (loss) on investments | | | (1.49 | ) | | | 1.04 | | | | 1.56 | | | | 0.14 | |
| Total from investment operations | | | (1.29 | ) | | | 1.17 | | | | 1.73 | | | | 0.17 | |
| | | | | | | | | | | | | | | | | |
| LESS DISTRIBUTIONS: | | | | | | | | | | | | | | | | |
| From net investment income | | | (0.20 | ) | | | (0.17 | ) | | | (0.20 | ) | | | — | |
| From net realized gains on investments | | | (0.04 | ) | | | (0.73 | ) | | | (0.01 | ) | | | — | |
| Total distributions | | | (0.24 | ) | | | (0.90 | ) | | | (0.21 | ) | | | — | |
| | | | | | | | | | | | | | | | | |
| Net asset value, end of year/period | | $ | 10.43 | | | $ | 11.96 | | | $ | 11.69 | | | $ | 10.17 | |
| | | | | | | | | | | | | | | | | |
| Total return (C) | | | (10.82 | )% | | | 10.21 | % | | | 17.08 | % | | | 1.70 | % (D) |
| | | | | | | | | | | | | | | | | |
| RATIOS/SUPPLEMENTAL DATA: | | | | | | | | | | | | | | | | |
| Net assets, end of year/period (in 000’s) | | $ | 106,362 | | | $ | 118,333 | | | $ | 73,946 | | | $ | 5,707 | |
| Ratios to average net assets (including interest expense) | | | | | | | | | | | | | | | | |
| Expenses, before waiver and reimbursement (G) | | | 1.16 | % | | | 1.17 | % | | | 1.25 | % | | | 7.22 | % (E) |
| Expenses, net waiver and reimbursement (G) | | | 0.99 | % | | | 0.99 | % | | | 0.99 | % | | | 0.99 | % (E) |
| Net investment income | | | 1.81 | % | | | 1.07 | % | | | 1.62 | % | | | 4.22 | % (E) |
| Portfolio turnover rate | | | 116 | % | | | 130 | % | | | 140 | % | | | 5 | % (D) |
| | | | | | | | | | | | | | | | | |
| | | Class A | |
| | | For the | | | For the | | | For the | | | For the | |
| | | Year Ended | | | Year Ended | | | Year Ended | | | Period Ended | |
| | | December 31, | | | December 31, | | | December 31, | | | December 31, | |
| | | 2022 | | | 2021 | | | 2020 | | | 2019(A) | |
| Net asset value, beginning of year/period | | $ | 11.97 | | | $ | 11.69 | | | $ | 10.17 | | | $ | 10.00 | |
| | | | | | | | | | | | | | | | | |
| INCOME FROM INVESTMENT OPERATIONS: | | | | | | | | | | | | | | | | |
| Net investment income (B) | | | 0.17 | | | | 0.11 | | | | 0.39 | | | | 0.02 | |
| Net realized and unrealized gain (loss) on investments | | | (1.49 | ) | | | 1.03 | | | | 1.33 | | | | 0.15 | |
| Total from investment operations | | | (1.32 | ) | | | 1.14 | | | | 1.72 | | | | 0.17 | |
| | | | | | | | | | | | | | | | | |
| LESS DISTRIBUTIONS: | | | | | | | | | | | | | | | | |
| From net investment income | | | (0.17 | ) | | | (0.13 | ) | | | (0.19 | ) | | | — | |
| From net realized gains on investments | | | (0.04 | ) | | | (0.73 | ) | | | (0.01 | ) | | | — | |
| Total distributions | | | (0.21 | ) | | | (0.86 | ) | | | (0.20 | ) | | | — | |
| | | | | | | | | | | | | | | | | |
| Net asset value, end of year/period | | $ | 10.44 | | | $ | 11.97 | | | $ | 11.69 | | | $ | 10.17 | |
| | | | | | | | | | | | | | | | | |
| Total return (C) | | | (11.04 | )% | | | 9.97 | % | | | 16.97 | % | | | 1.70 | % (D) |
| | | | | | | | | | | | | | | | | |
| RATIOS/SUPPLEMENTAL DATA: | | | | | | | | | | | | | | | | |
| Net assets, end of year/period (in 000’s) | | $ | 1,861 | | | $ | 2,231 | | | $ | 337 | | | $ | 0 | (F) |
| Ratios to average net assets (including interest expense) | | | | | | | | | | | | | | | | |
| Expenses, before waiver and reimbursement (H) | | | 1.41 | % | | | 1.35 | % | | | 1.40 | % | | | 7.47 | % (E) |
| Expenses, net waiver and reimbursement (H) | | | 1.24 | % | | | 1.24 | % | | | 1.24 | % | | | 1.24 | % (E) |
| Net investment income | | | 1.55 | % | | | 0.88 | % | | | 3.50 | % | | | 3.17 | % (E) |
| Portfolio turnover rate | | | 116 | % | | | 130 | % | | | 140 | % | | | 5 | % (D) |
| | | | | | | | | | | | | | | | | |
| (A) | The Rational/Pier 88 Convertible Securities Fund Institutional Class, Class A and Class C Shares commenced operations December 6, 2019. |
| (B) | Per share amounts calculated using average shares method, which more appropriately presents the per share data for the period. |
| (C) | Total return in the above table represents the rate that the investor would have earned or lost on an investment in the Fund assuming reinvestment of dividends and does not reflect the impact of sales charges. |
| (F) | Amount is less than $1000. |
| (G) | Ratios to average net assets (excluding interest expense) |
| Expenses, before waiver and reimbursement | | | 1.16 | % | | | 1.17 | % | | | 1.25 | % | | | 7.22 | % (E) |
| Expenses, net waiver and reimbursement | | | 0.99 | % | | | 0.99 | % | | | 0.99 | % | | | 0.99 | % (E) |
| | | | | | | | | | | | | | | | | |
| (H) | Ratios to average net assets (excluding interest expense) |
| Expenses, before waiver and reimbursement | | | 1.41 | % | | | 1.35 | % | | | 1.40 | % | | | 7.47 | % (E) |
| Expenses, net waiver and reimbursement | | | 1.24 | % | | | 1.24 | % | | | 1.24 | % | | | 1.24 | % (E) |
| | | | | | | | | | | | | | | | | |
See accompanying notes which are an integral part of these financial statements.
| RATIONAL FUNDS |
| Rational/Pier 88 Convertible Securities Fund (Continued) |
| Financial Highlights |
| |
| For a Share Outstanding Throughout Each Year/Period |
| | | Class C | |
| | | For the | | | For the | | | For the | | | For the | |
| | | Year Ended | | | Year Ended | | | Year Ended | | | Period Ended | |
| | | December 31, | | | December 31, | | | December 31, | | | December 31, | |
| | | 2022 | | | 2021 | | | 2020 | | | 2019(A) | |
| Net asset value, beginning of year/period | | $ | 11.90 | | | $ | 11.66 | | | $ | 10.17 | | | $ | 10.00 | |
| | | | | | | | | | | | | | | | | |
| INCOME (LOSS) FROM INVESTMENT OPERATIONS: | | | | | | | | | | | | | | | | |
| Net investment income (B) | | | 0.10 | | | | 0.02 | | | | 0.32 | | | | 0.02 | |
| Net realized and unrealized gain (loss) on investments | | | (1.48 | ) | | | 1.02 | | | | 1.34 | | | | 0.15 | |
| Total from investment operations | | | (1.38 | ) | | | 1.04 | | | | 1.66 | | | | 0.17 | |
| | | | | | | | | | | | | | | | | |
| LESS DISTRIBUTIONS: | | | | | | | | | | | | | | | | |
| From net investment income | | | (0.10 | ) | | | (0.07 | ) | | | (0.16 | ) | | | — | |
| From net realized gains on investments | | | (0.04 | ) | | | (0.73 | ) | | | (0.01 | ) | | | — | |
| Total distributions | | | (0.14 | ) | | | (0.80 | ) | | | (0.17 | ) | | | — | |
| | | | | | | | | | | | | | | | | |
| Net asset value, end of year/period | | $ | 10.38 | | | $ | 11.90 | | | $ | 11.66 | | | $ | 10.17 | |
| | | | | | | | | | | | | | | | | |
| Total return (C) | | | (11.63 | )% | | | 9.11 | % | | | 16.33 | % | | | 1.70 | % (D) |
| | | | | | | | | | | | | | | | | |
| RATIOS/SUPPLEMENTAL DATA: | | | | | | | | | | | | | | | | |
| Net assets, end of year/period (in 000’s) | | $ | 298 | | | $ | 249 | | | $ | 55 | | | $ | 0 | (F) |
| Ratios to average net assets (including interest expense) | | | | | | | | | | | | | | | | |
| Expenses, before waiver and reimbursement (G) | | | 2.11 | % | | | 2.10 | % | | | 2.13 | % | | | 8.22 | % (E) |
| Expenses, net waiver and reimbursement (G) | | | 1.99 | % | | | 1.99 | % | | | 1.99 | % | | | 1.99 | % (E) |
| Net investment income | | | 0.93 | % | | | 0.17 | % | | | 2.87 | % | | | 3.17 | % (E) |
| Portfolio turnover rate | | | 116 | % | | | 130 | % | | | 140 | % | | | 5 | % (D) |
| | | | | | | | | | | | | | | | | |
| (A) | The Rational/Pier 88 Convertible Securities Fund Institutional Class, Class A and Class C Shares commenced operations December 6, 2019. |
| (B) | Per share amounts calculated using average shares method, which more appropriately presents the per share data for the period. |
| (C) | Total return in the above table represents the rate that the investor would have earned or lost on an investment in the Fund assuming reinvestment of dividends and does not reflect the impact of sales charges. |
| (F) | Amount is less than $1000. |
| (G) | Ratios to average net assets (excluding interest expense) |
| Expenses, before waiver and reimbursement | | | 2.11 | % | | | 2.10 | % | | | 2.13 | % | | | 8.22 | % (E) |
| Expenses, net waiver and reimbursement | | | 1.99 | % | | | 1.99 | % | | | 1.99 | % | | | 1.99 | % (E) |
| | | | | | | | | | | | | | | | | |
See accompanying notes which are an integral part of these financial statements.
| RATIONAL FUNDS |
| Rational Special Situations Income Fund |
| Financial Highlights |
| |
| For a Share Outstanding Throughout Each Year/Period |
| | | Institutional | |
| | | For the | | | For the | | | For the | | | For the | |
| | | Year Ended | | | Year Ended | | | Year Ended | | | Period Ended | |
| | | December 31, | | | December 31, | | | December 31, | | | December 31, | |
| | | 2022 | | | 2021 | | | 2020 | | | 2019(A) | |
| Net asset value, beginning of year/period | | $ | 19.69 | | | $ | 19.66 | | | $ | 20.10 | | | $ | 20.00 | |
| | | | | | | | | | | | | | | | | |
| INCOME FROM INVESTMENT OPERATIONS: | | | | | | | | | | | | | | | | |
| Net investment income (B) | | | 0.93 | | | | 0.74 | | | | 0.43 | | | | 0.32 | |
| Net realized and unrealized gain (loss) on investments | | | (1.16 | ) | | | 0.28 | | | | 0.11 | | | | 0.06 | |
| Total from investment operations | | | (0.23 | ) | | | 1.02 | | | | 0.54 | | | | 0.38 | |
| | | | | | | | | | | | | | | | | |
| LESS DISTRIBUTIONS: | | | | | | | | | | | | | | | | |
| From net investment income | | | (1.12 | ) | | | (0.99 | ) | | | (0.93 | ) | | | (0.25 | ) |
| From net realized gains on investments | | | — | | | | — | | | | — | | | | (0.03 | ) |
| From Return of capital | | | — | | | | (0.00 | ) (C) | | | (0.05 | ) | | | — | |
| Total distributions | | | (1.12 | ) | | | (0.99 | ) | | | (0.98 | ) | | | (0.28 | ) |
| | | | | | | | | | | | | | | | | |
| Net asset value, end of year/period | | $ | 18.34 | | | $ | 19.69 | | | $ | 19.66 | | | $ | 20.10 | |
| | | | | | | | | | | | | | | | | |
| Total return (D) | | | (1.12 | )% (I) | | | 5.30 | % | | | 2.83 | % | | | 1.91 | % (E) |
| | | | | | | | | | | | | | | | | |
| RATIOS/SUPPLEMENTAL DATA: | | | | | | | | | | | | | | | | |
| Net assets, end of year/period (in 000’s) | | $ | 666,042 | | | $ | 670,278 | | | $ | 352,892 | | | $ | 76,833 | |
| Ratios to average net assets (including interest expense) | | | | | | | | | | | | | | | | |
| Expenses, before waiver and reimbursement (G) | | | 1.79 | % | | | 1.77 | % | | | 1.80 | % | | | 2.06 | % (F) |
| Expenses, net waiver and reimbursement (G) | | | 1.76 | % | | | 1.75 | % | | | 1.75 | % | | | 1.75 | % (F) |
| Net investment income | | | 4.93 | % | | | 3.75 | % | | | 2.17 | % | | | 3.48 | % (F) |
| Portfolio turnover rate | | | 27 | % | | | 37 | % | | | 4 | % | | | 14 | % (E) |
| | | | | | | | | | | | | | | | | |
| | | Class A | |
| | | For the | | | For the | | | For the | | | For the | |
| | | Year Ended | | | Year Ended | | | Year Ended | | | Period Ended | |
| | | December 31, | | | December 31, | | | December 31, | | | December 31, | |
| | | 2022 | | | 2021 | | | 2020 | | | 2019(A) | |
| Net asset value, beginning of year/period | | $ | 19.66 | | | $ | 19.64 | | | $ | 20.08 | | | $ | 20.00 | |
| | | | | | | | | | | | | | | | | |
| INCOME FROM INVESTMENT OPERATIONS: | | | | | | | | | | | | | | | | |
| Net investment income (B) | | | 0.88 | | | | 0.72 | | | | 0.37 | | | | 0.30 | |
| Net realized and unrealized gain (loss) on investments | | | (1.15 | ) | | | 0.24 | | | | 0.13 | | | | 0.05 | |
| Total from investment operations | | | (0.27 | ) | | | 0.96 | | | | 0.50 | | | | 0.35 | |
| | | | | | | | | | | | | | | | | |
| LESS DISTRIBUTIONS: | | | | | | | | | | | | | | | | |
| From net investment income | | | (1.07 | ) | | | (0.94 | ) | | | (0.89 | ) | | | (0.24 | ) |
| From net realized gains on investments | | | — | | | | — | | | | — | | | | (0.03 | ) |
| From Return of capital | | | — | | | | (0.00 | ) (C) | | | (0.05 | ) | | | — | |
| Total distributions | | | (1.07 | ) | | | (0.94 | ) | | | (0.94 | ) | | | (0.27 | ) |
| | | | | | | | | | | | | | | | | |
| Net asset value, end of year/period | | $ | 18.32 | | | $ | 19.66 | | | $ | 19.64 | | | $ | 20.08 | |
| | | | | | | | | | | | | | | | | |
| Total return (D) | | | (1.31 | )% (I) | | | 5.00 | % | | | 2.60 | % | | | 1.74 | % (E) |
| | | | | | | | | | | | | | | | | |
| RATIOS/SUPPLEMENTAL DATA: | | | | | | | | | | | | | | | | |
| Net assets, end of year/period (in 000’s) | | $ | 70,121 | | | $ | 58,164 | | | $ | 37,224 | | | $ | 5,449 | |
| Ratios to average net assets (including interest expense) | | | | | | | | | | | | | | | | |
| Expenses, before waiver and reimbursement (H) | | | 2.05 | % | | | 2.03 | % | | | 2.10 | % | | | 2.21 | % (F) |
| Expenses, net waiver and reimbursement (H) | | | 2.02 | % | | | 2.00 | % | | | 2.00 | % | | | 2.00 | % (F) |
| Net investment income | | | 4.69 | % | | | 3.67 | % | | | 1.88 | % | | | 3.22 | % (F) |
| Portfolio turnover rate | | | 27 | % | | | 37 | % | | | 4 | % | | | 14 | % (E) |
| | | | | | | | | | | | | | | | | |
| (A) | The Rational Special Situations Income Fund Institutional Class, Class A and Class C Shares commenced operations July 17, 2019. |
| (B) | Per share amounts calculated using average shares method, which more appropriately presents the per share data for the year/period. |
| (C) | Represents an amount less than $0.01 per share. |
| (D) | Total return in the above table represents the rate that the investor would have earned or lost on an investment in the Fund assuming reinvestment of dividends and does not reflect the impact of sales charges. |
| (G) | Ratios to average net assets (excluding interest expense) |
| Expenses, before waiver and reimbursement | | | 1.79 | % | | | 1.77 | % | | | 1.80 | % | | | 2.06 | % (F) |
| Expenses, net waiver and reimbursement | | | 1.76 | % | | | 1.75 | % | | | 1.75 | % | | | 1.75 | % (F) |
| | | | | | | | | | | | | | | | | |
| (H) | Ratios to average net assets (excluding interest expense) |
| Expenses, before waiver and reimbursement | | | 2.05 | % | | | 2.03 | % | | | 2.10 | % | | | 2.21 | % (F) |
| Expenses, net waiver and reimbursement | | | 2.02 | % | | | 2.00 | % | | | 2.00 | % | | | 2.00 | % (F) |
| | | | | | | | | | | | | | | | | |
| (I) | Includes adjustments in accordance with accounting principles generally accepted in the United States and, consequently, the net asset value for financial reporting purposes and the returns based upon those net asset values may differ from the net asset values and returns for shareholder transactions. |
See accompanying notes which are an integral part of these financial statements.
| RATIONAL FUNDS |
| Rational Special Situations Income Fund (Continued) |
| Financial Highlights |
| |
| For a Share Outstanding Throughout Each Year/Period |
| | | Class C | |
| | | For the | | | For the | | | For the | | | For the | |
| | | Year Ended | | | Year Ended | | | Year Ended | | | Period Ended | |
| | | December 31, | | | December 31, | | | December 31, | | | December 31, | |
| | | 2022 | | | 2021 | | | 2020 | | | 2019(A) | |
| Net asset value, beginning of year/period | | $ | 19.61 | | | $ | 19.60 | | | $ | 20.06 | | | $ | 20.00 | |
| | | | | | | | | | | | | | | | | |
| INCOME FROM INVESTMENT OPERATIONS: | | | | | | | | | | | | | | | | |
| Net investment income (B) | | | 0.74 | | | | 0.48 | | | | 0.21 | | | | 0.23 | |
| Net realized and unrealized gain (loss) on investments | | | (1.15 | ) | | | 0.33 | | | | 0.14 | | | | 0.05 | |
| Total from investment operations | | | (0.41 | ) | | | 0.81 | | | | 0.35 | | | | 0.28 | |
| | | | | | | | | | | | | | | | | |
| LESS DISTRIBUTIONS: | | | | | | | | | | | | | | | | |
| From net investment income | | | (0.93 | ) | | | (0.80 | ) | | | (0.76 | ) | | | (0.19 | ) |
| From net realized gains on investments | | | — | | | | — | | | | — | | | | (0.03 | ) |
| From Return of capital | | | — | | | | (0.00 | ) (C) | | | (0.05 | ) | | | — | |
| Total distributions | | | (0.93 | ) | | | (0.80 | ) | | | (0.81 | ) | | | (0.22 | ) |
| | | | | | | | | | | | | | | | | |
| Net asset value, end of year/period | | $ | 18.27 | | | $ | 19.61 | | | $ | 19.60 | | | $ | 20.06 | |
| | | | | | | | | | | | | | | | | |
| Total return (D) | | | (2.05 | )% (H) | | | 4.22 | % | | | 1.82 | % | | | 1.43 | % (E) |
| | | | | | | | | | | | | | | | | |
| RATIOS/SUPPLEMENTAL DATA: | | | | | | | | | | | | | | | | |
| Net assets, end of year/period (in 000’s) | | $ | 34,455 | | | $ | 35,497 | | | $ | 14,123 | | | $ | 1,289 | |
| Ratios to average net assets (including interest expense) | | | | | | | | | | | | | | | | |
| Expenses, before waiver and reimbursement (G) | | | 2.76 | % | | | 2.74 | % | | | 2.77 | % | | | 2.97 | % (F) |
| Expenses, net waiver and reimbursement (G) | | | 2.76 | % | | | 2.75 | % | | | 2.75 | % | | | 2.75 | % (F) |
| Net investment income | | | 3.95 | % | | | 2.46 | % | | | 1.05 | % | | | 2.47 | % (F) |
| Portfolio turnover rate | | | 27 | % | | | 37 | % | | | 4 | % | | | 14 | % (E) |
| | | | | | | | | | | | | | | | | |
| (A) | The Rational Special Situations Income Fund Institutional Class, Class A and Class C Shares commenced operations July 17, 2019. |
| (B) | Per share amounts calculated using average shares method, which more appropriately presents the per share data for the year/period. |
| (C) | Represents an amount less than $0.01 per share. |
| (D) | Total return in the above table represents the rate that the investor would have earned or lost on an investment in the Fund assuming reinvestment of dividends and does not reflect the impact of sales charges. |
| (G) | Ratios to average net assets (excluding interest expense) |
| Expenses, before waiver and reimbursement | | | 2.75 | % | | | 2.74 | % | | | 2.77 | % | | | 2.97 | % (F) |
| Expenses, net waiver and reimbursement | | | 2.75 | % | | | 2.75 | % | | | 2.75 | % | | | 2.75 | % (F) |
| | | | | | | | | | | | | | | | | |
| (H) | Includes adjustments in accordance with accounting principles generally accepted in the United States and, consequently, the net asset value for financial reporting purposes and the returns based upon those net asset values may differ from the net asset values and returns for shareholder transactions. |
See accompanying notes which are an integral part of these financial statements.
| RATIONAL FUNDS |
| Rational Inflation Growth Fund |
| Financial Highlights |
| |
| For a Share Outstanding Throughout Each Year/Period |
| | | Institutional | | | Class A | | | Class C | |
| | | For the | | | For the | | | For the | | | For the | | | For the | | | For the | |
| | | Year Ended | | | Period Ended | | | Year Ended | | | Period Ended | | | Year Ended | | | Period Ended | |
| | | December 31, | | | December 31, | | | December 31, | | | December 31, | | | December 31, | | | December 31, | |
| | | 2022 | | | 2021(A) | | | 2022 | | | 2021(A) | | | 2022 | | | 2021(A) | |
| Net asset value, beginning of year/period | | $ | 9.80 | | | $ | 10.00 | | | $ | 9.79 | | | $ | 10.00 | | | $ | 9.77 | | | $ | 10.00 | |
| | | | | | | | | | | | | | | | | | | | | | | | | |
| INCOME (LOSS) FROM INVESTMENT OPERATIONS: | | | | | | | | | | | | | | | | | | | | | | | | |
| Net investment income (B) | | | 0.27 | | | | 0.25 | | | | 0.21 | | | | 0.49 | | | | 0.16 | | | | 0.70 | |
| Net realized and unrealized loss on investments | | | (0.37 | ) | | | (0.38 | ) | | | (0.33 | ) | | | (0.63 | ) | | | (0.36 | ) | | | (0.86 | ) |
| Total from investment operations | | | (0.10 | ) | | | (0.13 | ) | | | (0.12 | ) | | | (0.14 | ) | | | (0.20 | ) | | | (0.16 | ) |
| | | | | | | | | | | | | | | | | | | | | | | | | |
| LESS DISTRIBUTIONS: | | | | | | | | | | | | | | | | | | | | | | | | |
| From net investment income | | | (0.04 | ) | | | (0.07 | ) | | | (0.02 | ) | | | (0.07 | ) | | | — | | | | (0.07 | ) |
| From net realized gains on investments | | | (0.01 | ) | | | — | | | | (0.01 | ) | | | — | | | | (0.01 | ) | | | — | |
| Total distributions | | | (0.05 | ) | | | (0.07 | ) | | | (0.03 | ) | | | (0.07 | ) | | | (0.01 | ) | | | (0.07 | ) |
| | | | | | | | | | | | | | | | | | | | | | | | | |
| Net asset value, end of year/period | | $ | 9.65 | | | $ | 9.80 | | | $ | 9.64 | | | $ | 9.79 | | | $ | 9.56 | | | $ | 9.77 | |
| | | | | | | | | | | | | | | | | | | | | | | | | |
| Total return (C) | | | (1.10 | )% | | | (1.26 | )% (D) | | | (1.29 | )% | | | (1.39 | )% (D) | | | (2.09 | )% | | | (1.60 | )% (D) |
| | | | | | | | | | | | | | | | | | | | | | | | | |
| RATIOS/SUPPLEMENTAL DATA: | | | | | | | | | | | | | | | | | | | | | | | | |
| Net assets, end of year/period (in 000’s) | | $ | 2,887 | | | $ | 1,360 | | | $ | 788 | | | $ | 697 | | | $ | 33 | | | $ | 26 | |
| Ratios to average net assets | | | | | | | | | | | | | | | | | | | | | | | | |
| Expenses, before waiver and reimbursement (G) | | | 4.56 | % | | | 12.47 | % (E) | | | 4.91 | % (E) | | | 12.72 | % (E) | | | 5.89 | % (E) | | | 13.47 | % (E) |
| Expenses, net waiver and reimbursement (G) | | | 1.49 | % | | | 1.49 | % (E) | | | 1.74 | % (E) | | | 1.74 | % (E) | | | 2.49 | % (E) | | | 2.49 | % (E) |
| Net investment income | | | 2.82 | % | | | 6.83 | % (E) | | | 2.11 | % (E) | | | 13.23 | % (E) | | | 1.67 | % (E) | | | 19.41 | % (E) |
| Portfolio turnover rate | | | 18 | % | | | 0 | % (D) | | | 18 | % (D) | | | 0 | % (D) | | | 18 | % (D) | | | 0 | % (D) |
| | | | | | | | | | | | | | | | | | | | | | | | | |
| (A) | The Rational Inflation Growth Fund commenced operations August 18, 2021. |
| (B) | Per share amounts calculated using average shares method, which more appropriately presents the per share data for the period. |
| (C) | Total return in the above table represents the rate that the investor would have earned or lost on an investment in the Fund assuming reinvestment of dividends and does not reflect the impact of sales charges. |
| (G) | Ratios to average net assets (excluding interest expense) |
| Expenses, before waiver and reimbursement | | | 4.56 | % | | | 12.47 | % (E) | | | 4.91 | % | | | 12.72 | % (E) | | | 5.89 | % | | | 13.47 | % (E) |
| Expenses, net waiver and reimbursement | | | 1.49 | % | | | 1.49 | % (E) | | | 1.74 | % | | | 1.74 | % (E) | | | 2.49 | % | | | 2.49 | % (E) |
| | | | | | | | | | | | | | | | | | | | | | | | | |
See accompanying notes which are an integral part of these financial statements.
| RATIONAL FUNDS |
| CONSOLIDATED NOTES TO FINANCIAL STATEMENTS |
| December 31, 2022 | ANNUAL REPORT |
| | |
(1) ORGANIZATION AND SIGNIFICANT ACCOUNTING POLICIES
The Mutual Fund and Variable Insurance Trust (the “Trust”) was organized as a Delaware statutory trust on June 23, 2006. The Trust is registered under the Investment Company Act of 1940, as amended (the “1940 Act”), as an open-end management investment company. As of December 31, 2022, the Trust operated 8 separate series, or mutual funds, each with its own investment objective and strategy. This report contains financial statements and financial highlights of the funds listed below (individually referred to as a “Fund”, or collectively as the “Funds”):
| Fund | Sub-Advisor | Primary Objective |
| Rational Equity Armor Fund (“Equity Armor”) | Equity Armor Investments, LLC | Total return on investment, with dividend income an important component of that return. |
| Rational Tactical Return Fund (“Tactical Return”) | Warrington Asset Management, LLC | Total return consisting of long-term capital appreciation and income. |
| Rational Dynamic Brands Fund (“Dynamic Brands”) | Accuvest Global Advisors, Inc. | Long-term capital appreciation. |
| Rational Strategic Allocation Fund (“Strategic Allocation”) | | Current income and moderate appreciation of capital. |
| Rational/ReSolve Adaptive Asset Allocation Fund (“ReSolve Adaptive”) | ReSolve Asset Management, Inc. | Long-term capital appreciation. |
| Rational/Pier 88 Convertible Securities Fund (“Pier 88”) | Pier 88 Investment Partners, LLC | Total return consisting of capital appreciation and income. |
| Rational Special Situations Income Fund (“Special Situations”) | ESM Management, LLC | Total return consisting of capital appreciation and income. |
| Rational Inflation Growth Fund (“Inflation Growth”) | SL Advisors, LLC | Long-term capital appreciation. |
| | | |
The Funds are classified as diversified funds under the 1940 Act, except Pier 88 and Inflation Growth, which are classified as non-diversified funds.
Currently, all Funds offer Class A, Class C and Institutional shares. Each class of shares for each Fund has identical rights and privileges except with respect to distribution (12b-1) and service fees, if any, voting rights on matters affecting a single class of shares, exchange privileges of each class of shares and sales charges. The price at which the Funds will offer or redeem shares is the net asset value (“NAV”) per share next determined after the order is considered received, subject to any applicable front end or contingent deferred sales charges. Class A shares have a maximum sales charge on purchases of 5.75% for ReSolve Adaptive and Inflation Growth and 4.75% for all other Funds as a percentage of the original purchase price. Class C shares have a contingent deferred sales charge of 1.00% on shares sold within one year of purchase. Each Fund’s prospectus provides a description of the Fund’s investment objectives, policies and strategies along with information on the classes of shares currently being offered.
(2) SIGNIFICANT ACCOUNTING POLICIES
The following is a summary of significant accounting policies consistently followed by the Funds and are in accordance with accounting principles generally accepted in the United States of America (“GAAP”). Each Fund is an investment company and accordingly follows the investment company accounting and reporting guidance of the Financial Accounting Standards Board (“FASB”) Accounting Standard Codification Topic 946 Financial Services – Investment Companies.
The preparation of financial statements in conformity with GAAP requires management to make estimates and assumptions that affect the amounts of assets, liabilities, and disclosure of contingent assets and liabilities at the date of the financial statements and the reported amounts increases and decreases in net assets resulting from operations during the period. Actual results could differ from those estimates.
A. Investment Valuations
All investments in securities are recorded at their estimated fair value. In computing the NAV of the Funds, fair value is based on market valuations with respect to portfolio securities for which market quotations are readily available. Pursuant to valuation procedures approved by the Board of Trustees of the Trust (the “Board” or “Trustees”), the Trust relies on certain security pricing services to provide the current market value of securities. Those security pricing services value
| RATIONAL FUNDS |
| CONSOLIDATED NOTES TO FINANCIAL STATEMENTS (Continued) |
| December 31, 2022 | ANNUAL REPORT |
| | |
equity securities (including foreign equity securities, exchange-traded funds and closed-end funds) traded on a securities exchange at the last reported sales price on the principal exchange. Equity securities quoted by NASDAQ are valued at the NASDAQ official closing price. If there is no reported sale on the principal exchange, and in the case of over-the counter securities, equity securities are valued at a bid price estimated by the security pricing service. Debt securities (other than short-term obligations) are valued each day by an independent pricing service in accordance with valuation procedures approved by the Board using methods which include current market quotations from a major market maker in the securities and based on methods which include the consideration of yields or prices of securities of comparable quality, coupon, maturity and type. Option contracts are generally valued at the close. If the close price is outside the bid and the ask price; the quote closest to the close is used. When there is no trading volume the mean of the bid and ask is used. Foreign securities quoted in foreign currencies are translated into U.S. dollars at the foreign exchange rate in effect as of the close of the NYSE. Investments in open-end investment companies (except for exchange-traded funds) are valued at their respective net asset value as reported by such companies. Futures, which are traded on an exchange, are valued at the settlement price determined by the exchange. Options are valued at their closing price on the exchange they are traded on. When no closing price is available, options are valued at their mean price. Short-term debt obligations having 60 days or less remaining until maturity, at time of purchase, may be valued at amortized cost.
Securities for which market quotations are not readily available are valued at fair value under Trust procedures approved by the Board. In these cases, a valuation designee, determines in good faith, subject to Trust procedures, the fair value of portfolio securities held by a Fund (“good faith fair valuation”). When a good faith fair valuation of a security is required, consideration is generally given to a number of factors including, but not limited to the following: dealer quotes, published analyses by dealers or analysts regarding the security, transactions which provide implicit valuation of the security (such as a merger or tender offer transaction), the value of other securities or contracts which derive their value from the security at issue, and the implications of any other circumstances which have caused trading in the security to halt. With respect to certain categories of securities, the procedures utilized by the valuation designee detail specific valuation methodologies to be applied in lieu of considering the aforementioned list of factors.
Fair valuation procedures are also used when a significant event affecting the value of a portfolio security is determined to have occurred between the time when the price of the portfolio security is determined and the close of trading on the NYSE, which is when each Fund’s NAV is computed. An event is considered significant if there is both an affirmative expectation that the security’s value will change in response to the event and a reasonable basis for quantifying the resulting change in value. Significant events include significant securities’ market movements occurring between the time the price of the portfolio security is determined and the close of trading on the NYSE. For securities normally priced at their last sale price in a foreign market, such events can occur between the close of trading in the foreign market and the close of trading on the NYSE.
In some cases, events affecting the issuer of a portfolio security may be considered significant events. Examples of potentially significant events include announcements concerning earnings, acquisitions, new products, management changes, litigation developments, a strike or natural disaster affecting the company’s operations or regulatory changes or market developments affecting the issuer’s industry occurring between the time when the price of the portfolio security is determined and the close of trading on the NYSE. For securities of foreign issuers, such events could also include political or other developments affecting the economy or markets in which the issuer conducts its operations or its securities are traded.
There can be no assurance that a Fund could purchase or sell a portfolio security at the price used to calculate the Fund’s NAV. In the case of good faith fair valued portfolio securities, lack of information and uncertainty as to the significance of information may lead to a conclusion that a prior valuation is the best indication of a portfolio security’s present value. Good faith fair valuations generally remain unchanged until new information becomes available. Consequently, changes in good faith fair valuation of portfolio securities may be less frequent and of greater magnitude than changes in the price of portfolio securities valued at their last sale price, by an independent pricing service, or based on market quotations.
| RATIONAL FUNDS |
| CONSOLIDATED NOTES TO FINANCIAL STATEMENTS (Continued) |
| December 31, 2022 | ANNUAL REPORT |
| | |
Valuation of Fund of Funds – The Funds may invest in portfolios of open-end or closed-end investment companies (the “Underlying Funds”). Open-end investment companies are valued at their respective net asset values as reported by such investment companies. The shares of many closed-end investment companies, after their initial public offering, frequently trade at a price per share, which is different than the net asset value per share. The difference represents a market premium or market discount of such shares. There can be no assurances that the market discount or market premium on shares of any closed-end investment company purchased by the Funds will not change.
The Trust calculates the NAV for each of the Funds by valuing securities held based on fair value. Fair value is defined as the price that would be received to sell an asset or paid to transfer a liability in an orderly transaction between market participants at the measurement date. The valuation techniques described below maximize the use of observable inputs and minimize the use of unobservable inputs in determining fair value. The inputs used for valuing the Funds’ investments are summarized in the three broad levels listed below:
| ● | Level 1 – unadjusted quoted prices in active markets for identical investments and/or registered investment companies where the value per share is determined and published and is the basis for current transactions for identical assets or liabilities at the valuation date. |
| ● | Level 2 – other significant observable inputs (including quoted prices for similar securities, interest rates, prepayment speeds, credit risk, etc.). |
| ● | Level 3 – significant unobservable inputs (including the Funds’ own assumptions in determining the fair value of investments). |
Changes in valuation techniques may result in transfers in or out of an assigned level within the disclosure hierarchy. The inputs or methodology used for valuing investments is not necessarily an indication of the risk associated with investing in those investments.
The inputs or methodology used for valuing securities are not necessarily an indication of the risk associated with investing in those securities. The following tables summarize the inputs used as of December 31, 2022, for each Fund’s assets and liabilities measured at fair value:
Equity Armor
| Assets* | | Level 1 | | | Level 2 | | | Level 3 | | | Total | |
| Common Stocks | | $ | 47,206,301 | | | $ | — | | | $ | — | | | $ | 47,206,301 | |
| Exchange Traded Funds | | | 10,524,492 | | | | — | | | | — | | | | 10,524,492 | |
| Derivatives | | | | | | | | | | | | | | | | |
| Purchased Options | | $ | 2,190,625 | | | $ | — | | | $ | — | | | $ | 2,190,625 | |
| Futures Contracts | | | 41,456 | | | | — | | | | — | | | | 41,456 | |
| Total Assets | | $ | 59,962,874 | | | $ | — | | | $ | — | | | $ | 59,962,874 | |
| Liabilities* | | | | | | | | | | | | | | | | |
| Derivatives | | | | | | | | | | | | | | | | |
| Written Options | | $ | 1,781,250 | | | $ | — | | | $ | — | | | $ | 1,781,250 | |
| Futures Contracts | | | 79,706 | | | | — | | | | — | | | | 79,706 | |
| Total Liabilities | | $ | 1,860,956 | | | $ | — | | | $ | — | | | $ | 1,860,956 | |
Tactical Return
| Assets* | | Level 1 | | | Level 2 | | | Level 3 | | | Total | |
| U.S. Treasury Bills | | $ | — | | | $ | 166,486,273 | | | $ | — | | | $ | 166,486,273 | |
| Total Assets | | $ | — | | | $ | 166,486,273 | | | $ | — | | | $ | 166,486,273 | |
| RATIONAL FUNDS |
| CONSOLIDATED NOTES TO FINANCIAL STATEMENTS (Continued) |
| December 31, 2022 | ANNUAL REPORT |
| | |
Dynamic Brands
| Assets* | | Level 1 | | | Level 2 | | | Level 3 | | | Total | |
| Common Stocks | | $ | 45,134,977 | | | $ | — | | | $ | — | | | $ | 45,134,977 | |
| Total Assets | | $ | 45,134,977 | | | $ | — | | | $ | — | | | $ | 45,134,977 | |
Strategic Allocation
| Assets* | | Level 1 | | | Level 2 | | | Level 3 | | | Total | |
| Open End Funds | | $ | 5,918,149 | | | $ | — | | | $ | — | | | $ | 5,918,149 | |
| Total Assets | | $ | 5,918,149 | | | $ | — | | | $ | — | | | $ | 5,918,149 | |
| Liabilities | | | | | | | | | | | | | | | | |
| Derivatives | | | | | | | | | | | | | | | | |
| Futures Contracts | | $ | 359,270 | | | $ | — | | | $ | — | | | $ | 359,270 | |
| Total Liabilities | | $ | 359,270 | | | $ | — | | | $ | — | | | $ | 359,270 | |
ReSolve Adaptive
| Assets* | | Level 1 | | | Level 2 | | | Level 3 | | | Total | |
| U.S. Treasury Bills | | $ | — | | | $ | 108,313,376 | | | $ | — | | | $ | 108,313,376 | |
| Short-Term Investments | | | 40,539,786 | | | | — | | | | — | | | | 40,539,786 | |
| Derivatives | | | | | | | | | | | | | | | | |
| Futures Contracts | | | 4,908,910 | | | | — | | | | — | | | | 4,908,910 | |
| Total Assets | | $ | 45,448,696 | | | $ | 108,313,376 | | | $ | — | | | $ | 153,762,072 | |
| Liabilities* | | | | | | | | | | | | | | | | |
| Derivatives | | | | | | | | | | | | | | | | |
| Futures Contracts | | $ | 4,305,850 | | | $ | — | | | $ | — | | | $ | 4,305,850 | |
| Total Liabilities | | $ | 4,305,850 | | | $ | — | | | $ | — | | | $ | 4,305,850 | |
Pier 88
| Assets* | | Level 1 | | | Level 2 | | | Level 3 | | | Total | |
| Common Stocks | | $ | 7,043,687 | | | $ | — | | | $ | — | | | $ | 7,043,687 | |
| Preferred Stocks | | | 37,413,178 | | | | — | | | | — | | | | 37,413,178 | |
| Convertible Bonds | | | — | | | | 53,882,519 | | | | — | | | | 53,882,519 | |
| Total Assets | | $ | 44,456,865 | | | $ | 53,882,519 | | | $ | — | | | $ | 98,339,384 | |
Special Situations
| Assets* | | Level 1 | | | Level 2 | | | Level 3 | | | Total | |
| Asset Backed Securities | | $ | — | | | $ | 603,067,190 | | | $ | — | | | $ | 603,067,190 | |
| Corporate Bonds | | | — | | | | 126,300,336 | | | | — | | | | 126,300,336 | |
| Preferred Stocks | | | — | | | | 2,182,894 | | | | — | | | | 2,182,894 | |
| Total Assets | | $ | — | | | $ | 731,550,420 | | | $ | — | | | $ | 731,550,420 | |
| RATIONAL FUNDS |
| CONSOLIDATED NOTES TO FINANCIAL STATEMENTS (Continued) |
| December 31, 2022 | ANNUAL REPORT |
| Inflation Growth |
| |
| Assets* | | Level 1 | | | Level 2 | | | Level 3 | | | Total | |
| Common Stocks | | $ | 3,025,807 | | | $ | — | | | $ | — | | | $ | 3,025,807 | |
| Exchange-Traded Funds | | | 539,247 | | | | — | | | | — | | | | 539,247 | |
| Total Assets | | $ | 3,565,054 | | | $ | — | | | $ | — | | | $ | 3,565,054 | |
| * | Refer to the Schedule of Investments for industry classifications. |
There were no level 3 securities held during the year for any Fund.
Consolidation of Subsidiaries – The consolidated financial statements of ReSolve Adaptive include the accounts of RDMF Fund Ltd. (“RDMF” or “CFC”), a wholly-owned and controlled foreign subsidiary. All inter-company accounts and transactions have been eliminated in consolidation.
ReSolve Adaptive may invest up to 25% of its total assets in a controlled foreign corporation (“CFC”), which acts as an investment vehicle in order to effect certain investments consistent with ReSolve Adaptive’s investment objectives and policies.
| | Inception Date of
CFC | CFC Net Assets as of
December 31, 2022 | % of Net Assets as of
December 31, 2022 |
| RDMF Fund, Ltd. | 8/5/2016 | $ 21,865,136 | 12.94% |
For tax purposes, the CFC is an exempted Cayman investment company. The CFC has received an undertaking from the Government of the Cayman Islands exempting it from all local income, profits and capital gains taxes. No such taxes are levied in the Cayman Islands at the present time. For U.S. income tax purposes, a CFC is a Controlled Foreign Corporation which generates and is allocated no income which is considered effectively connected with U.S. trade or business and as such is not subject to U.S. income tax. However, as a wholly-owned Controlled Foreign Corporation, RDMF’s net income and capital gain, to the extent of its earnings and profits, will be included each year in the ReSolve Adaptive’s investment company taxable income.
B. Foreign Currency Translation
The accounting records of the Funds are maintained in U.S. dollars. Foreign currency amounts are translated into U.S. dollars at the current rate of exchange each business day to determine the value of investments, and other assets and liabilities. Purchases and sales of foreign securities, and income and expenses, are translated at the prevailing rate of exchange on the respective date of these transactions. The Funds do not isolate that portion of the results of operations resulting from changes in foreign exchange rates on investments from fluctuation arising from changes in market prices of securities held. These fluctuations are included with the net realized and unrealized gain or loss from investments and foreign currency transactions.
Reported net realized foreign exchange gains or losses arise from sales of portfolio securities; sales and maturities of short term securities; sales of foreign currencies; currency gains or losses realized between the trade and settlement dates on securities transactions; and the difference between the amounts of dividends, interest, and foreign withholding taxes recorded on the Funds’ books and the U.S. dollar equivalent of the amounts actually received or paid. Net unrealized foreign exchange gains and losses arise from changes in the values of assets and liabilities, including investments in securities at fiscal period-end, resulting from changes in the exchange rate.
C. Derivative Instruments
Certain of the Funds may be subject to equity price risk, commodity risk, interest rate risk and foreign currency exchange risk in the normal course of pursuing their investment objectives. Certain of the Funds may invest in various financial instruments including positions in foreign currency contracts, written and purchased option contracts and futures contracts to gain exposure to or hedge against changes in the value of equities or foreign currencies. The following is a description of
| RATIONAL FUNDS |
| CONSOLIDATED NOTES TO FINANCIAL STATEMENTS (Continued) |
| December 31, 2022 | ANNUAL REPORT |
| | |
the derivative instruments utilized by the Funds, including the primary underlying risk exposure related to each instrument type.
Futures Contracts – Certain of the Funds may purchase and sell futures contracts. A Fund may use futures contracts to gain exposure to, or hedge against changes in the value of underlying reference assets, such as equities, interest rates, commodities prices or foreign currencies. Upon entering into a contract, the Fund deposits and maintains as collateral such initial margin as required by the exchange on which the transaction is affected. Pursuant to the contract, the Fund agrees to receive from or pay to the broker an amount of cash equal to the daily fluctuation in value of the contract. Such receipts or payments are known as “variation margin” and are recorded by the Fund as unrealized gains and losses. When the contract is closed, the Fund records a realized gain or loss equal to the difference between the value of the contract at the time it was opened and the value at the time it was closed.
Options Contracts – Certain Funds may purchase put and call options and write put and call options. The premium paid for a purchased put or call option plus any transaction costs will reduce the benefit, if any, realized by a Fund upon exercise of the option, and, unless the price of the underlying security rises or declines sufficiently, the option may expire worthless to the Funds. In addition, in the event that the price of the security in connection with which an option was purchased moves in a direction favorable to the Funds, the benefits realized by the Funds as a result of such favorable movement will be reduced by the amount of the premium paid for the option and related transaction costs.
When a Fund writes an option, an amount equal to the premium received by the Fund is recorded as a liability and is subsequently adjusted to the current fair value of the option written. Premiums received from writing options that expire unexercised are treated by the Funds on the expiration date as realized gains from investments. The difference between the premium and the amount paid on effecting a closing purchase transaction, including brokerage commissions, is also treated as a realized gain, or, if the premium is less than the amount paid for the closing purchase transaction, as a realized loss. If a call option is exercised, the premium is added to the proceeds from the sale of the underlying security or currency in determining whether the Funds have realized gains or losses. If a put option is exercised, the premium reduces the cost basis of the securities purchased by the Funds.
Written and purchased options are non-income producing securities. With options, there is minimal counterparty risk to the Funds since these options are exchange traded and the exchange’s clearinghouse acts as counterparty to all exchange traded options and guarantees against a possible default. Initial margin deposits required upon entering into options contracts are satisfied by the deposits of cash as collateral for the account of the broker (the Fund’s agent in acquiring the options).
Convertible Securities – Pier 88 invests in convertible securities, which include fixed income securities that may be exchanged or converted into a predetermined number of shares of the issuer’s underlying common stock at the option of the holder during a specified period. Convertible securities may take the form of convertible preferred stock, convertible bonds or debentures, units consisting of “usable” bonds and warrants or a combination of the features of several of these securities. The investment characteristics of each convertible security vary widely, which allows convertible securities to be employed for a variety of investment strategies. The Fund will exchange or convert the convertible securities held in its portfolio into shares of the underlying common stock when, in the Advisor’s or Sub-Advisor’s opinion, the investment characteristics of the underlying common shares will assist the Fund in achieving its investment objective. Otherwise, the Fund may hold or trade convertible securities.
| RATIONAL FUNDS |
| CONSOLIDATED NOTES TO FINANCIAL STATEMENTS (Continued) |
| December 31, 2022 | ANNUAL REPORT |
| | |
The derivatives are not accounted for as hedging instruments under GAAP. The effect of derivative instruments on the Statements of Assets and Liabilities and Consolidated Statements of Assets and Liabilities at December 31, 2022, were as follows:
| | | | | | | Location of derivatives on Statements | | Fair value of asset/liability | |
| Fund | | Derivative | | Risk Type | | of Assets and Liabilities | | derivatives | |
| Equity Armor | | | | | | | | |
| | | Futures | | Equity | | Futures unrealized appreciation | | $ | 41,456 | |
| | | | | | | Futures unrealized depreciation | | | (79,706 | ) |
| | | | | | | Totals | | $ | (38,250 | ) |
| | | | | | | | | | | |
| | | Options | | Equity | | Options Purchased | | $ | 2,190,625 | |
| | | | | | | Options Written | | | 1,781,250 | |
| | | | | | | Totals | | $ | 3,971,875 | |
| Strategic Allocation | | | | | | | | |
| | | Futures | | Equity | | Futures unrealized depreciation | | $ | (359,270 | ) |
| | | | | | | Totals | | $ | (359,270 | ) |
| ReSolve Adaptive | | | | | | | | |
| | | Futures | | Equity | | Futures unrealized appreciation | | $ | 82,609 | |
| | | | | | | Futures unrealized depreciation | | | (1,442,032 | ) |
| | | | | Commodity | | Futures unrealized appreciation | | | 3,302,994 | |
| | | | | | | Futures unrealized depreciation | | | (781,716 | ) |
| | | | | Currency | | Futures unrealized appreciation | | | 175,694 | |
| | | | | | | Futures unrealized depreciation | | | (453,109 | ) |
| | | | | Interest | | Futures unrealized appreciation | | | 1,347,613 | |
| | | | | | | Futures unrealized depreciation | | | (1,628,991 | ) |
| | | | | | | Totals | | $ | 603,062 | |
| RATIONAL FUNDS |
| CONSOLIDATED NOTES TO FINANCIAL STATEMENTS (Continued) |
| December 31, 2022 | ANNUAL REPORT |
| | |
The effect of derivative instruments on the Statements of Operations and Consolidated Statements of Operations for the Funds, for the year ended December 31, 2022, were as follows:
| | | | | | | | | Realized and unrealized gain | |
| Fund | | Derivative | | Risk Type | | Location of gain (loss) on derivatives | | (loss) on derivatives | |
| Equity Armor | | | | | | | | |
| | | Options Purchased | | Equity | | Net realized loss from options purchased | | $ | (17,372,693 | ) |
| | | Options Written | | Equity | | Net realized gain from options written | | | 9,988,391 | |
| | | Futures | | Equity | | Net realized gain from futures | | | 3,751,143 | |
| | | | | | | | | $ | (3,633,159 | ) |
| | | | | | | | | | | |
| | | Options Purchased | | Equity | | Net change in unrealized depreciation on options purchased | | $ | (463,284 | ) |
| | | Options Written | | Equity | | Net change in unrealized appreciation on options written | | | 130,937 | |
| | | Futures | | Equity | | Net change in unrealized appreciation on futures | | | 350,080 | |
| | | | | | | | | $ | 17,733 | |
| Tactical Return | | | | | | | | |
| | | Options Purchased | | Equity | | Net realized gain from options purchased | | $ | 437,383 | |
| | | Options Written | | Equity | | Net realized gain from options written | | | 2,418,787 | |
| | | Futures | | Equity | | Net realized loss from futures | | | (783,794 | ) |
| | | | | | | | | | | |
| Strategic Allocation | | | | | | | | |
| | | Futures | | Equity | | Net realized loss from futures | | $ | (1,586,800 | ) |
| | | | | | | | | | | |
| | | Futures | | Equity | | Net change in unrealized depreciation on futures | | | (584,830 | ) |
| | | | | | | | | $ | (2,171,630 | ) |
| ReSolve Adaptive | | | | | | | | |
| | | Futures | | Equity | | Net realized gain from futures | | $ | 1,110,944 | |
| | | | | Commodity | | Net realized loss from futures | | | (3,035,378 | ) |
| | | | | Currency | | Net realized loss from futures | | | (4,228,331 | ) |
| | | | | Interest | | Net realized loss from futures | | | (9,932,262 | ) |
| | | | | | | Totals | | $ | (16,085,027 | ) |
| | | | | | | | | | | |
| | | Futures | | Equity | | Net change in unrealized depreciation on futures | | $ | (1,701,604 | ) |
| | | | | Commodity | | Net change in unrealized appreciation on futures | | | 2,214,081 | |
| | | | | Currency | | Net change in unrealized depreciation on futures | | | (340,996 | ) |
| | | | | Interest | | Net change in unrealized appreciation on futures | | | 68,023 | |
| | | | | | | Totals | | $ | 239,504 | |
| | | | | | | | | | | |
| Inflation Growth | | | | | | | | |
| | | Futures | | Equity | | Net realized loss from futures | | $ | (6,306 | ) |
| | | | | | | | | | | |
The value of derivative instruments outstanding as of December 31, 2022 as disclosed in the Schedules of Investments (Consolidated Schedule of Investments for ReSolve Adaptive) and the amounts of realized and changes in unrealized gains and losses on derivative instruments during the period as disclosed above and within the Statements of Operations (Consolidated Statements of Operations for ReSolve Adaptive) serve as indicators of the volume of derivative activity for the Funds.
| RATIONAL FUNDS |
| CONSOLIDATED NOTES TO FINANCIAL STATEMENTS (Continued) |
| December 31, 2022 | ANNUAL REPORT |
| | |
Balance Sheet Offsetting Information
The following table provides a summary of offsetting financial assets and liabilities derivatives and the effect of the derivative instruments on the Statements of Assets and Liabilities and Consolidated Statements of Assets and Liabilities as of December 31, 2022:
| | | | | | | | | | | | Gross Amounts of Assets resented in the | | | | |
| | | | | | Gross Amounts | | | | | | (Consolidated) Statement of Assets & Liabilities | | | | |
| | | | | | Net Amounts | | | | | | | | | | | | | |
| | | Gross Amounts | | | Offset in the | | | Presented in the | | | | | | | | | | |
| | | Recognized in the | | | (Consolidated) | | | (Consolidated) | | | | | | | | | | |
| | | (Consolidated) | | | Statements of | | | Statements of | | | | | | | | | | |
| | | Statements of Assets | | | Assets and | | | Assets and | | | Financial | | | Cash Collateral | | | | |
| | | and Liabilities | | | Liabilities | | | Liabilities | | | Instruments | | | Pledged/Received (1) | | | Net Amount | |
| Equity Armor | | | | | | | | | | | | | | | | | | | | | | | | |
| Description of Asset: | | | | | | | | | | | | | | | | | | | | | | | | |
| Futures Contracts | | $ | 41,456 | | | $ | — | | | $ | 41,456 | | | $ | (41,456 | ) | | $ | — | | | $ | — | |
| Description of Liability: | | | | | | | | | | | | | | | | | | | | | | | | |
| Futures Contracts | | $ | 79,706 | | | $ | — | | | $ | 79,706 | | | $ | (41,456 | ) | | $ | 38,250 | | | $ | — | |
| Strategic Allocation | | | | | | | | | | | | | | | | | | | | | | | | |
| Description of Liability: | | | | | | | | | | | | | | | | | | | | | | | | |
| Futures Contracts | | $ | 359,270 | | | $ | — | | | $ | 359,270 | | | $ | — | | | $ | 359,270 | | | $ | — | |
| ReSolve Adaptive | | | | | | | | | | | | | | | | | | | | | | | | |
| Description of Asset: | | | | | | | | | | | | | | | | | | | | | | | | |
| Futures Contracts | | $ | 4,908,910 | | | $ | — | | | $ | 4,908,910 | | | $ | (4,305,848 | ) | | $ | — | | | $ | 603,062 | |
| Description of Liability: | | | | | | | | | | | | | | | | | | | | | | | | |
| Futures Contracts | | $ | 4,305,848 | | | $ | — | | | $ | 4,305,848 | | | $ | (4,305,848 | ) | | $ | — | | | $ | — | |
| | | | | | | | | | | | | | | | | | | | | | | | | |
| (1) | The amount is limited to the derivative liability balance and accordingly does not include excess collateral pledged. |
D. Security Transactions and Related Income
During the period, investment transactions are accounted for no later than the first calculation of the NAV on the business day following the trade date. For financial reporting purposes, however, security transactions are accounted for on the trade date on the last business day of the reporting period. Discounts and premiums on securities purchased are accreted and amortized over the lives of the respective securities using the effective interest method. For convertible securities, premiums attributable to the conversion feature are not amortized. Securities gains and losses are calculated on the identified cost basis. Interest income and expenses are accrued daily. Dividends, less foreign tax withholding (if any), are recorded on the ex-dividend date. Withholding taxes and capital gains on foreign dividends have been provided for in accordance with the Funds’ understanding of the applicable country’s tax rules and rates.
E. Dividends and Distributions to Shareholders
The amount of dividends from net investment income and net realized gains recorded on the ex-dividend date are determined in accordance with the federal income tax regulations, which may differ from GAAP and are recorded on ex-date. These “book/tax” differences are either considered temporary or permanent in nature. To the extent these differences are permanent in nature (e.g. tax treatment of foreign currency gain/loss, non-deductible stock issuance costs, distributions and income received from pass through investments and net investment loss adjustments), such amounts are reclassified within the capital accounts based on their nature for federal income tax purposes; temporary differences do not require reclassification. Temporary differences are primarily due to market discounts, capital loss carryforwards and losses deferred due to wash sales, straddles and return of capital from investments. Dividends are declared separately for each class. No class has preferential rights; differences in per share dividend rates are generally due to differences in separate class expenses.
| RATIONAL FUNDS |
| CONSOLIDATED NOTES TO FINANCIAL STATEMENTS (Continued) |
| December 31, 2022 | ANNUAL REPORT |
| Fund | | Income Dividends | | Capital Gains |
| Equity Armor | | Monthly | | Annually |
| Tactical Return | | Annually | | Annually |
| Dynamic Brands | | Annually | | Annually |
| Strategic Allocation | | Quarterly | | Annually |
| ReSolve Adaptive | | Annually | | Annually |
| Pier 88 | | Quarterly | | Annually |
| Special Situations | | Monthly | | Annually |
| Inflation Growth | | Quarterly | | Annually |
| | | | | |
Certain Funds may own shares of real estate investments trusts (“REITs”) which report information on the source of their distributions annually. Distributions received from investments in REITs in excess of income from underlying investments are recorded as realized gain and/or as a reduction to the cost of the individual REIT, when such information is available.
F. Allocation of Expenses, Income, and Gains and Losses
Expenses directly attributable to a Fund are charged to that Fund. Expenses not directly attributable to a Fund are allocated proportionally among various Funds or all Funds within the Trust in relation to the net assets of each Fund or on another reasonable basis. Income, non-class specific expenses and realized/unrealized gains or losses are allocated to each class based on relative net assets. Distribution fees are charged to each respective share class in accordance with the distribution plan.
G. Federal Income Taxes
It is the policy of each Fund to qualify or continue to qualify as a regulated investment company by complying with the provisions available to certain investment companies, as defined in applicable sections of the Internal Revenue Code, and to make distributions of net investment income and net realized capital gains sufficient to relieve it from all, or substantially all, federal income taxes.
The Funds recognize the tax benefits of uncertain tax positions only where the position is “more likely than not” to be sustained assuming examination by tax authorities. Management has analyzed each Fund’s tax positions and has concluded that no liability for unrecognized tax benefits should be recorded related to uncertain tax positions taken on returns filed for open tax years ended December 31, 2019 to December 31, 2021 (as applicable), or expected to be taken in the Funds’ December 31, 2022 year-end tax returns. Each Fund identifies its major tax jurisdictions as U.S. Federal, and foreign jurisdictions where the Funds make significant investments; however the Funds are not aware of any tax positions for which it is reasonably possible that the total amounts of unrecognized tax benefits will change materially in the next twelve months. The Funds recognize interest and penalties, if any, related to unrecognized tax benefits, as income tax expenses in the Statements of Operations. As of December 31, 2022, the Funds did not incur any interest or penalties.
H. Indemnification
The Trust indemnifies its Officers and Trustees for certain liabilities that may arise from the performance of their duties to the Trust. Additionally, in the normal course of business, the Funds enter into contracts that contain a variety of representations and warranties and which provide general indemnities. The Funds’ maximum exposure under these arrangements is unknown, as this would involve future claims that may be made against the Funds that have not yet occurred. However, based on experience, the risk of loss due to these warranties and indemnities appears to be remote.
I. Market Risk
Overall market risks may also affect the value of a Fund. The market values of securities or other investments owned by a Fund will go up or down, sometimes rapidly or unpredictably. Factors such as economic growth and market conditions, interest rate levels, exchange rates and political events affect the securities markets. Changes in market conditions and interest rates generally do not have the same impact on all types of securities and instruments. Unexpected local, regional or global events and their aftermath, such as war; acts of terrorism; financial, political or social disruptions; natural, environmental or man-made disasters; the spread of infectious illnesses or other public health issues; recessions and depressions; or other tragedies, catastrophes and events could have a significant impact on a Fund and its investments and
| RATIONAL FUNDS |
| CONSOLIDATED NOTES TO FINANCIAL STATEMENTS (Continued) |
| December 31, 2022 | ANNUAL REPORT |
| | |
could result in increased premiums or discounts to the Fund’s net asset value, and may impair market liquidity, thereby increasing liquidity risk. Such events can cause investor fear and panic, which can adversely affect the economies of many companies, sectors, nations, regions and the market in general, in ways that cannot necessarily be foreseen. A Fund could lose money over short periods due to short-term market movements and over longer periods during more prolonged market downturns. During a general market downturn, multiple asset classes may be negatively affected. In times of severe market disruptions, you could lose your entire investment.
The global outbreak of COVID-19 caused adverse effects on many companies, sectors, nations, regions and the markets in general, and these effects may continue for an unpredictable duration. The effects of this pandemic may materially impact the value and performance of a Fund, its ability to buy and sell fund investments at appropriate valuations and its ability to achieve its investment objective.
(3) FEES AND OTHER TRANSACTIONS WITH AFFILIATES AND OTHER SERVICE PROVIDERS
Investment Advisory Fee— Rational Advisors, Inc., (the “Advisor”) serves as the Funds’ investment adviser. Under the terms of the Advisory Agreement, the Advisor manages the investment operations of the Funds in accordance with each Fund’s respective investment policies and restrictions. The Funds’ sub-advisors are responsible for the day-to-day management of each Fund’s portfolios. The Advisor provides the Funds with investment advice and supervision and furnishes an investment program for the Funds. For its investment management services, the Funds pay to the Advisor, as of the last day of each month, an annualized fee as shown in the below table, such fees to be computed daily based upon daily average net assets of the Funds. The Funds’ sub-advisors are paid by the Advisor, not the Funds.
| Fund | | Advisory Fee Tiered Annual Rate |
| | | Rate for the First $500 Million | | Rate for the Next $500 Million | | Rate for Excess Over $1 Billion |
| Equity Armor | | 0.75% | | 0.70% | | 0.65% |
| Dynamic Brands | | 0.75% | | 0.70% | | 0.65% |
| | | | | | | |
| | | Advisory Fee Annual Rate | | | | |
| Tactical Return | | 1.75% | | | | |
| Strategic Allocation | | 0.10% | | | | |
| ReSolve Adaptive | | 1.75% | | | | |
| Pier 88 | | 0.85% | | | | |
| Special Situations | | 1.50% | | | | |
| Inflation Growth | | 1.25% | | | | |
| RATIONAL FUNDS |
| CONSOLIDATED NOTES TO FINANCIAL STATEMENTS (Continued) |
| December 31, 2022 | ANNUAL REPORT |
The Advisor has contractually agreed to waive all or a portion of its investment advisory fee (based on average daily net assets) and/or reimburse certain operating expenses of each Fund (other than Equity Armor) to the extent necessary in order to limit each Fund’s total annual fund operating expenses (exclusive of acquired fund fees and expenses, brokerage commissions and trading costs, interest (including borrowing costs and overdraft charges), taxes, short sale dividends and interest expenses, non-routine or extraordinary expenses (such as litigation or reorganizational costs), and with respect to Special Situations only, costs and expenses of litigation or claims on behalf of Special Situations regarding portfolio investments initiated (or threatened) by the investment advisor or sub-advisor, as listed below:
| | | Expense Caps | | Expiration |
| Fund | | Institutional Class Shares | | Class A Shares | | Class C Shares | | |
| Tactical Return | | 1.99% | | 2.24% | | 2.99% | | April 30, 2023 |
| Dynamic Brands | | 1.24% | | 1.49% | | 2.24% | | April 30, 2023 |
| Strategic Allocation | | 0.45% | | 0.70% | | 1.45% | | April 30, 2023 |
| ReSolve Adaptive | | 1.97% | | 2.22% | | 2.97% | | April 30, 2023 |
| Pier 88 | | 0.99% | | 1.24% | | 1.99% | | April 30, 2023 |
| Special Situations | | 1.75% | | 2.00% | | 2.75% | | April 30, 2023 |
| Inflation Growth | | 1.49% | | 1.74% | | 2.49% | | April 30, 2023 |
| | | | | | | | | |
Amounts waived or reimbursed in the contractual period may be recouped by the Advisor within three years of the waiver and/or reimbursement. As of December 31, 2022, the following amounts have been waived or reimbursed by the Advisor and are subject to repayment by the respective Fund:
| Fund | | Reimbursed | | | December 31, | |
| Equity Armor | | $ | 135,785 | | | | 2023 | |
| | | | 38,723 | | | | 2024 | |
| | | | — | | | | 2025 | |
| Tactical Return | | | 127,155 | | | | 2023 | |
| | | | 104,062 | | | | 2024 | |
| | | | 91,334 | | | | 2025 | |
| Dynamic Brands | | | — | | | | 2023 | |
| | | | — | | | | 2024 | |
| | | | — | | | | 2025 | |
| Strategic Allocation | | | 72,877 | | | | 2023 | |
| | | | 67,124 | | | | 2024 | |
| | | | 86,462 | | | | 2025 | |
| ReSolve Adaptive | | | 137,538 | | | | 2023 | |
| | | | 125,327 | | | | 2024 | |
| | | | 117,342 | | | | 2025 | |
| Pier 88 | | | 155,789 | | | | 2023 | |
| | | | 174,835 | | | | 2024 | |
| | | | 193,523 | | | | 2025 | |
| Special Situations | | | 159,379 | | | | 2023 | |
| | | | 119,447 | | | | 2024 | |
| | | | 152,205 | | | | 2025 | |
| Inflation Growth | | | — | | | | 2023 | |
| | | | 52,120 | | | | 2024 | |
| | | | 107,456 | | | | 2025 | |
| | | | | | | | | |
The Independent Trustees are paid a quarterly retainer, and receive compensation for each committee meeting, telephonic Board meeting, and special in-person Board meeting attended. Officers receive no compensation from the Trust. The Trust reimburses each of the Independent Trustees for travel and other expenses incurred in connection with attendance at such meetings. The Trust has no retirement or pension plans. Additional information regarding the Trust’s Trustees is available in the Funds’ Statement of Additional Information.
| RATIONAL FUNDS |
| CONSOLIDATED NOTES TO FINANCIAL STATEMENTS (Continued) |
| December 31, 2022 | ANNUAL REPORT |
The Board has adopted the Trust’s Distribution Plan (the “12b-1 Plan”) which allows each Fund to pay fees up to 0.25% for Class A shares and up to 1.00% for Class C shares based on average daily net assets of each class to financial intermediaries (which may be paid through the Funds’ distributor) for the sale and distribution of these shares. Pursuant to the 12b-1 Plan, the Funds may finance from their assets certain activities or expenses that are intended primarily to result in the sale of Fund shares and to reimburse Northern Lights Distributors, LLC., the Funds’ distributor (the “Distributor or NLD”), and the Advisor for distribution related expenses. For the year ended December 31, 2022, the amounts accrued by the Funds were as follows:
| | | 12b-1 Fees | |
| Fund | | Class A | | | Class C | |
| Equity Armor | | $ | 26,602 | | | $ | 16,995 | |
| Tactical Return | | | 29,401 | | | | 91,591 | |
| Dynamic Brands | | | 37,715 | | | | 35,580 | |
| Strategic Allocation | | | 18,534 | | | | 9 | |
| ReSolve Adaptive | | | 5,315 | | | | 8,901 | |
| Pier 88 | | | 5,160 | | | | 2,963 | |
| Special Situations | | | 161,839 | | | | 355,702 | |
| Inflation Growth | | | 2,192 | | | | 311 | |
| | | | | | | | | |
Shareholder Servicing Fees – The Trust has adopted a Shareholder Services Plan pursuant to which the Funds may pay Shareholder Services Fees up to 0.25% of the average daily net assets to financial intermediaries for providing shareholder assistance, maintaining shareholder accounts and communicating or facilitating purchases and redemptions of shares for Institutional, Class A and Class C Shares.
In addition, certain affiliates of the Distributor provide services to the Funds as follows:
Ultimus Fund Solutions, LLC (“UFS”) – UFS, an affiliate of the Distributor, provides administrative, fund accounting, and transfer agency services to the Funds pursuant to agreements with the Trust, for which it receives from each Fund the greater of an annual minimum fee or an asset based fee, which scales downward based upon net assets for fund administration, fund accounting and transfer agency services and are reflected as such on the Statements of Operations. The Funds also pay UFS for any out-of-pocket expenses. Officers of the Trust are also employees of UFS and are not paid any fees directly by the Trust for serving in such capacity.
Blu Giant, LLC (“Blu Giant”) – Blu Giant, an affiliate of UFS and the Distributor, provides EDGAR conversion and filing services as well as print management services for the Funds on an ad-hoc basis. For the provision of these services, Blu Giant receives customary fees from the Funds, which are included in printing expenses on the Statements of Operations.
Pursuant to the Management Services Agreement between the Trust and MFund Services LLC (“MFund”), an affiliate of the Advisor, MFund provides the Funds with various management and legal administrative services (“Management Services Agreement”). For these services, the Funds pay MFund as of the last day of each month an annualized asset-based fee which scales downward based upon net assets. Prior to April 1, 2022, the Funds also paid an annual base fee per Fund. In addition, the Funds reimburse MFund for any reasonable out-of-pocket expenses incurred in the performance of its duties under the Management Services Agreement. The amounts due to MFund for the Management Services Agreement are listed in the Statements of Assets and Liabilities under “Payable to related parties” and the amounts accrued for the year are shown in the Statements of Operations under “Management service fees.”
Pursuant to the Compliance Services Agreement, MFund, an affiliate of the Advisor, provides chief compliance officer services to the Funds. For these services, the Funds pay MFund as of the last day of each month an annualized base fee plus an annualized asset-based fee based upon net assets. In addition, the Funds reimburse MFund for any reasonable out-of-pocket expenses incurred in the performance of its duties under the Compliance Services Agreement. The amounts due to MFund for chief compliance officer are listed in the Statements of Assets and Liabilities under “Payable to related parties” and the amounts accrued for the year are shown in the Statements of Operations under “Compliance officer fees.”
| RATIONAL FUNDS | |
| CONSOLIDATED NOTES TO FINANCIAL STATEMENTS (Continued) |
| December 31, 2022 | ANNUAL REPORT |
Affiliated Funds — Affiliated companies are mutual funds that are advised by Catalyst Capital Advisors, AlphaCentric Advisors, LLC or Rational Advisors, Inc. Companies that are affiliates of the Funds at December 31, 2022, are noted in Strategic Allocation’s Schedule of Investments. A summary of these investments in affiliated funds is set forth below:
| | | Shares Balance | | | | | | | | | Shares Balance | | | | | | Change in | | | Dividends | | | Amount of Gain | |
| | | December 31, | | | | | | | | | December 31, | | | | | | Unrealized | | | Credited to | | | (Loss) Realized on | |
| Fund | | 2021 | | | Purchases | | | Sales | | | 2022 | | | Fair Value | | | Gain/(Loss) | | | Income | | | Sale of Shares | |
| AlphaCentric Income Opportunities Fund, Inst. Sh. | | | 43,779 | | | | 5,798 | | | | 13,020 | | | | 36,557 | | | $ | 331,652 | | | $ | (120,237 | ) | | $ | 9,667 | | | $ | 11,608 | |
| Catalyst Enhanced Income Strategy Fund, Inst. Sh. | | | 160,742 | | | | 38,853 | | | | 62,220 | | | | 137,375 | | | | 1,321,644 | | | | (151,403 | ) | | | 91,718 | | | | (38,942 | ) |
| Catalyst Insider Income Fund Inst. Sh. | | | 103,185 | | | | 31,565 | | | | 38,810 | | | | 95,940 | | | | 829,957 | | | | (88,435 | ) | | | 34,983 | | | | (28,012 | ) |
| Catalyst/CIFC Floating Rate Income Fund | | | 105,601 | | | | 30,090 | | | | 42,160 | | | | 93,531 | | | | 833,440 | | | | (54,333 | ) | | | 44,731 | | | | (13,812 | ) |
| Catalyst Interest Rate Opportunity Fund, Inst. Sh. | | | 96,310 | | | | 27,039 | | | | 123,349 | | | | — | | | | — | | | | 80,068 | | | | 58,659 | | | | (381,320 | ) |
| Rational Special Situations Income Fund, Inst. Sh. | | | 90,146 | | | | 18,437 | | | | 36,130 | | | | 72,453 | | | | 1,332,776 | | | | (76,955 | ) | | | 88,102 | | | | (40,551 | ) |
| Rational/Pier 88 Convertible Securities Fund CL. I | | | 138,101 | | | | 28,254 | | | | 44,730 | | | | 121,625 | | | | 1,268,679 | | | | (163,862 | ) | | | 28,422 | | | | (49,827 | ) |
| Total | | | 737,864 | | | | 180,036 | | | | 360,419 | | | | 557,481 | | | $ | 5,918,148 | | | $ | (575,157 | ) | | $ | 356,282 | | | $ | (540,856 | ) |
| (4) | INVESTMENT TRANSACTIONS |
For the year ended December 31, 2022, aggregate purchases and proceeds from sales of investment securities (excluding short-term investments) for the Funds were as follows:
| Fund | | Purchases | | | Sales | |
| Equity Armor | | $ | 166,854,359 | | | $ | 168,037,358 | |
| Tactical Return | | | — | | | | — | |
| Dynamic Brands | | | 100,378,095 | | | | 132,618,782 | |
| Strategic Allocation | | | 1,893,144 | | | | 3,385,654 | |
| ReSolve Adaptive | | | — | | | | — | |
| Pier 88 | | | 126,227,560 | | | | 128,520,406 | |
| Special Situations | | | 270,232,799 | | | | 200,347,595 | |
| Inflation Growth | | | 2,361,382 | | | | 597,996 | |
In accordance with its investment objectives and through its exposure to futures contracts, each of Equity Armor, Strategic Allocation, ReSolve Adaptive and Inflation Growth may have increased or decreased exposure to one or more of the following risk factors defined below:
Commodity Risk – Commodity risk relates to the change in value of commodities or commodity indexes as they relate to increases or decreases in the commodities market. Commodities are physical assets that have tangible properties. Examples of these types of assets are crude oil, heating oil, metals, livestock, and agricultural products.
Foreign Exchange Rate Risk – Foreign exchange rate risk relates to the change in the U.S. dollar value of a security held that is denominated in a foreign currency. The U.S. dollar value of a foreign currency denominated security will decrease as the dollar appreciates against the currency, while the U.S. dollar value will increase as the dollar depreciates against the currency.
Interest Rate Risk – Interest rate risk refers to the fluctuations in value of fixed-income securities resulting from the inverse relationship between price and yield. For example, an increase in general interest rates will tend to reduce the market value of already issued fixed-income investments, and a decline in general interest rates will tend to increase their value. In addition, debt securities with longer maturities, which tend to have higher yields, are subject to potentially greater fluctuations in value from changes in interest rates than obligations with shorter maturities.
Volatility Risk – Volatility risk refers to the magnitude of the movement, but not the direction of the movement, in a financial instrument’s price over a defined time period. Large increases or decreases in a financial instrument’s price over a relative time period typically indicate greater volatility risk, while small increases or decreases in its price typically indicate lower volatility risk.
| RATIONAL FUNDS | |
| CONSOLIDATED NOTES TO FINANCIAL STATEMENTS (Continued) |
| December 31, 2022 | ANNUAL REPORT |
In accordance with its investment objectives and through its exposure to options, Tactical Return and Equity Armor may have increased or decreased exposure to Option Risk factors defined below:
Options Risk – Tactical Return and Equity Armor are subject to equity price risks in the normal course of pursuing their investment objective and may purchase or sell options. The seller (writer) of a call option which is covered (e.g., the writer holds the underlying security) assumes the risk of a decline in the market price of an underlying security below the purchase price of an underlying security less the premium received and gives up the opportunity for gain on the underlying security above the exercise price of the option. The seller of an uncovered call option assumes the risk of a theoretical unlimited increase in the market price of an underlying security above the exercise price of the option. The securities necessary to satisfy the exercise of the call option may be unavailable for purchase except at much higher prices. Purchasing securities to satisfy the exercise of the call option can itself cause the price of securities to rise further, sometimes by a significant amount, thereby exacerbating the loss. The buyer of a call option assumes the risk of losing its entire premium invested in the call option. The seller (writer) of a put option which is covered (e.g., the writer has a short position in the underlying security) assumes the risk of an increase in the market price of the underlying security above the sales price (in establishing the short position) of the underlying security plus the premium received and gives up the opportunity for gain on the underlying security below the exercise price of the option. The seller of an uncovered put option assumes the risk of a decline in the market price of the underlying security below the exercise price of the option. The buyer of a put option assumes the risk of losing his entire premium invested in the put option.
Activist Strategies Risk – As part of Special Situation’s principal investment strategy, the Sub-Advisor seeks to identify “special situations” where it can seek to remedy legal, technical or structural issues it has identified in the securities held by the Fund through activist strategies, including through litigation or the threat of litigation. Such activist strategies may not be successful and may have a negative impact on the Fund, including causing the Fund to incur legal related costs and expenses and portfolio turnover if the Sub-Advisor determines to sell such securities.
Please refer to the Funds’ prospectus for a full listing of risks associated with these investments.
| (6) | AGGREGATE UNREALIZED APPRECIATION AND DEPRECIATION – TAX BASIS |
The identified cost of investments in securities owned by each Fund for federal income tax purposes (including options written), and its respective gross unrealized appreciation and depreciation at December 31, 2022, were as follows:
| | | | | | Gross | | | Gross | | | Net Unrealized | |
| | | Tax | | | Unrealized | | | Unrealized | | | Appreciation/ | |
| | | Cost | | | Appreciation | | | Depreciation | | | (Depreciation) | |
| Equity Armor | | $ | 55,036,075 | | | $ | 5,520,202 | | | $ | (2,416,109 | ) | | $ | 3,104,093 | |
| Tactical Return | | | 167,249,174 | | | | — | | | | (762,901 | ) | | | (762,901 | ) |
| Dynamic Brands | | | 46,403,228 | | | | 4,485,411 | | | | (5,753,662 | ) | | | (1,268,251 | ) |
| Strategic Allocation | | | 6,176,613 | | | | 104,185 | | | | (362,648 | ) | | | (258,463 | ) |
| ReSolve Adaptive | | | 148,830,884 | | | | 1,366,212 | | | | (2,148,791 | ) | | | (782,579 | ) |
| Pier 88 | | | 101,535,960 | | | | 2,996,931 | | | | (6,193,507 | ) | | | (3,196,576 | ) |
| Special Situations | | | 776,264,731 | | | | 17,434,764 | | | | (62,149,075 | ) | | | (44,714,311 | ) |
| Inflation Growth | | | 3,655,788 | | | | 278,056 | | | | (368,790 | ) | | | (90,734 | ) |
| RATIONAL FUNDS | |
| CONSOLIDATED NOTES TO FINANCIAL STATEMENTS (Continued) |
| December 31, 2022 | ANNUAL REPORT |
| (7) | DISTRIBUTIONS TO SHAREHOLDERS AND TAX COMPONENTS OF CAPITAL |
The tax character of fund distributions paid for the year ended December 31, 2022 and December 31, 2021 was as follows:
| For fiscal year ended | | Ordinary | | | Long-Term | | | Return of | | | | |
| December 31, 2022 | | Income | | | Capital Gains | | | Capital | | | Total | |
| Equity Armor | | $ | 484,752 | | | $ | — | | | $ | — | | | $ | 484,752 | |
| Tactical Return | | | 59,296 | | | | 576,582 | | | | — | | | | 635,878 | |
| Dynamic Brands | | | 2,896,870 | | | | — | | | | — | | | | 2,896,870 | |
| Strategic Allocation | | | 306,907 | | | | 235,138 | | | | — | | | | 542,045 | |
| ReSolve Adaptive | | | 672,205 | | | | — | | | | — | | | | 672,205 | |
| Pier 88 | | | 2,457,919 | | | | — | | | | — | | | | 2,457,919 | |
| Special Situations | | | 47,060,516 | | | | — | | | | — | | | | 47,060,516 | |
| Inflation Growth | | | 11,627 | | | | 2,082 | | | | — | | | | 13,709 | |
| | | | | | | | | | | | | | | | | |
| For fiscal year ended | | Ordinary | | | Long-Term | | | Return of | | | | |
| December 31, 2021 | | Income | | | Capital Gains | | | Capital | | | Total | |
| Equity Armor | | $ | 825,350 | | | $ | — | | | $ | — | | | $ | 825,350 | |
| Tactical Return | | | 170,878 | | | | 10,584,404 | | | | — | | | | 10,755,282 | |
| Dynamic Brands | | | 6,465,633 | | | | 3,298,116 | | | | — | | | | 9,763,749 | |
| Strategic Allocation | | | 681,214 | | | | 754,830 | | | | — | | | | 1,436,044 | |
| ReSolve Adaptive | | | 8,865,209 | | | | — | | | | — | | | | 8,865,209 | |
| Pier 88 | | | 5,673,975 | | | | 2,900,416 | | | | — | | | | 8,574,391 | |
| Special Situations | | | 28,362,084 | | | | — | | | | 23,176 | | | | 28,385,260 | |
| Inflation Growth | | | 15,445 | | | | 17 | | | | — | | | | 15,462 | |
As of December 31, 2022, the components of accumulated earnings/(deficit) on a tax basis were as follows:
| | | Undistributed | | | Undistributed | | | Post October Loss | | | Capital Loss | | | Other | | | Unrealized | | | Total | |
| | | Ordinary | | | Long-Term | | | and | | | Carry | | | Book/Tax | | | Appreciation/ | | | Distributable Earnings/ | |
| | | Income | | | Capital Gains | | | Late Year Loss | | | Forwards | | | Differences | | | (Depreciation) | | | (Accumulated Deficits) | |
| Equity Armor | | $ | 40,314 | | | $ | — | | | $ | (1,462,288 | ) | | $ | (3,999,798 | ) | | $ | — | | | $ | 3,104,093 | | | $ | (2,317,679 | ) |
| Tactical Return | | | — | | | | 630,340 | | | | — | | | | (1,999,811 | ) | | | — | | | | (762,901 | ) | | | (2,132,372 | ) |
| Dynamic Brands | | | — | | | | — | | | | (720,827 | ) | | | (17,323,256 | ) | | | — | | | | (1,268,251 | ) | | | (19,312,334 | ) |
| Strategic Allocation | | | 130,215 | | | | — | | | | (434,576 | ) | | | (2,269,128 | ) | | | — | | | | (258,463 | ) | | | (2,831,952 | ) |
| ReSolve Adaptive | | | — | | | | — | | | | (7,070,133 | ) | | | (426,884 | ) | | | — | | | | (805,569 | ) | | | (8,302,586 | ) |
| Pier 88 | | | 254,979 | | | | — | | | | (493,741 | ) | | | (3,699,385 | ) | | | — | | | | (3,196,576 | ) | | | (7,134,723 | ) |
| Special Situations | | | 2,741,738 | | | | — | | | | — | | | | (12,559,940 | ) | | | — | | | | (44,714,311 | ) | | | (54,532,513 | ) |
| Inflation Growth | | | 13,941 | | | | — | | | | (103,771 | ) | | | (25,509 | ) | | | — | | | | (90,734 | ) | | | (206,073 | ) |
The difference between book basis and tax basis unrealized appreciation (depreciation), undistributed ordinary income (loss) and accumulated net realized gain (loss) from investments is primarily attributable to the tax deferral of losses on wash sales, mark-to-market on open futures and Section 1256 option contracts, and adjustments for C-Corporation return of capital distributions, partnerships and perpetual bonds, trust preferred securities, income on contingent convertible debt securities, and Section 305(c) deemed dividend distributions. The unrealized appreciation (depreciation) in the table above includes unrealized foreign currency losses of $22,990 for the Resolve Adaptive Asset Allocation Fund.
| RATIONAL FUNDS | |
| CONSOLIDATED NOTES TO FINANCIAL STATEMENTS (Continued) |
| December 31, 2022 | ANNUAL REPORT |
Capital losses incurred after October 31 within the fiscal year are deemed to arise on the first business day of the following fiscal year for tax purposes. The Funds incurred and elected to defer such capital losses as follows:
| | | Post October | |
| | | Losses | |
| Equity Armor | | $ | 1,462,288 | |
| Tactical Return | | | — | |
| Dynamic Brands | | | 720,827 | |
| Strategic Allocation | | | 434,576 | |
| ReSolve Adaptive | | | 7,070,133 | |
| Pier 88 | | | 493,741 | |
| Special Situations | | | — | |
| Inflation Growth | | | 103,771 | |
At December 31, 2022, the Funds had capital loss carry forwards for federal income tax purposes available to offset future capital gains, along with capital loss carry forwards utilized in the current year as follows:
| | | | | | | | | | | | Capital Loss Carry | |
| | | Short-Term | | | Long-Term | | | Total | | | Forwards Utilized | |
| Equity Armor | | $ | 3,999,798 | | | $ | — | | | $ | 3,999,798 | | | $ | 57,539 | |
| Tactical Return* | | | 249,992 | | | | 1,749,819 | | | | 1,999,811 | | | | 92,691 | |
| Dynamic Brands | | | 16,407,467 | | | | 915,789 | | | | 17,323,256 | | | | — | |
| Strategic Allocation | | | 914,075 | | | | 1,355,053 | | | | 2,269,128 | | | | — | |
| ReSolve Adaptive | | | 426,884 | | | | — | | | | 426,884 | | | | 2,979,792 | |
| Pier 88 | | | 3,699,385 | | | | — | | | | 3,699,385 | | | | — | |
| Special Situations | | | 11,748,235 | | | | 811,705 | | | | 12,559,940 | | | | — | |
| Inflation Growth | | | 23,844 | | | | 1,665 | | | | 25,509 | | | | — | |
| * | The Rational Tactical Return Fund experienced a shareholder change in ownership resulting in an annual limitation on the amount of pre-change capital loss carry forwards available to be recognized in each year. Due to IRC Section 382 limitations, utilization of these carry forwards is limited to a maximum of $92,691 per year. |
Permanent book and tax differences, primarily attributable to the book/tax basis treatment of net operating losses, non-deductible expenses, distributions in excess, and adjustments for the Resolve Adaptive Asset Allocation Fund’s wholly owned subsidiary, which has a November 30 tax year end, resulted in reclassifications for the Funds for the fiscal year ended December 31, 2022 as follows:
| | | Paid In | | | Accumulated | |
| | | Capital | | | Earnings (Deficit) | |
| Equity Armor | | $ | — | | | $ | — | |
| Tactical Return | | | (1,738,285 | ) | | | 1,738,285 | |
| Dynamic Brands | | | (166,753 | ) | | | 166,753 | |
| Strategic Allocation | | | — | | | | — | |
| ReSolve Adaptive | | | (12,121,791 | ) | | | 12,121,791 | |
| Pier 88 | | | — | | | | — | |
| Special Situations | | | — | | | | — | |
| Inflation Growth | | | (176 | ) | | | 176 | |
| RATIONAL FUNDS | |
| CONSOLIDATED NOTES TO FINANCIAL STATEMENTS (Continued) |
| December 31, 2022 | ANNUAL REPORT |
Effective December 8, 2022, the Trust has a $100,000,000 uncommitted line of credit provided by U.S. Bank National Association (the “Bank”) under an agreement (the “Uncommitted Line”). Any advance under the Uncommitted Line is contemplated primarily for temporary or emergency purposes, including the meeting of redemption requests that otherwise might require the untimely disposition of securities. Interest on borrowings is payable on a monthly basis. The Uncommitted Line is not a “committed” line of credit, which is to say that the Bank is not obligated to lend money to the Funds. Accordingly, it is possible that the Funds may wish to borrow money for a temporary or emergency purpose but may not be able to do so.
During the year ended December 31, 2022, the average amount of borrowings outstanding based on days borrowed was as follows:
| | | Average | | | Maximum | | | | | | Average | | | Current | |
| | | borrowings | | | Outstanding | | | Interest | | | borrowings | | | Interest | |
| Fund | | outstanding | | | balance | | | Expense* | | | rate | | | Rate | |
| Equity Armor | | $ | 263,875 | | | $ | 610,000 | | | $ | 191 | | | | 3.25 | % | | | | |
| Dynamic Brands | | | 349,890 | | | | 3,206,000 | | | | 6,098 | | | | 4.30 | % | | | 7.50 | % ** |
| Strategic Allocation | | | 105,800 | | | | 108,000 | | | | 51 | | | | 3.50 | % | | | | |
| * | Includes interest expenses for borrowings on the line of credit and may not agree to the Statement of Operations, which may include overdraft fees, line of credit fees and broker interest. |
| ** | Fund has Borrowings of $18,000 as of 12/31/22. |
The beneficial ownership, either directly or indirectly, of more than 25% of the voting securities of a fund creates a presumption of control of the fund, under Section 2(a)(9) of the 1940 Act. As of December 31, 2022, the companies that held more than 25% of the voting securities of the Funds, and may be deemed to control each respective Fund, are as follows:
| | | Equity | | | Tactical | | | Dynamic | | | Strategic | | | ReSolve | | | Pier | | | Inflation | |
| | | Armor | | | Return | | | Brands | | | Allocation | | | Adaptive | | | 88 | | | Growth | |
| Jerry and Isobel Szilagyi | | | — | | | | — | | | | — | | | | — | | | | — | | | | — | | | | 32.98 | % |
| NFS LLC(1) | | | 35.18 | % | | | — | | | | 29.11 | % | | | 82.45 | % | | | 30.27 | % | | | 77.29 | % | | | — | |
| Charles Schwab(1) | | | — | | | | — | | | | — | | | | — | | | | 39.25 | % | | | — | | | | — | |
| LPL Financial(1) | | | — | | | | 30.60 | % | | | — | | | | — | | | | — | | | | — | | | | — | |
| TD Ameritrade | | | — | | | | — | | | | — | | | | — | | | | — | | | | — | | | | — | |
| Pershing | | | — | | | | — | | | | — | | | | — | | | | — | | | | — | | | | 30.22 | % |
| (1) | This owner is comprised of multiple investors and accounts. |
Subsequent events after the date of the Statements of Assets and Liabilities have been evaluated through the date the financial statements were issued. Management has determined that no events or transactions occurred requiring adjustment or disclosure in the financial statements.

REPORT OF INDEPENDENT REGISTERED PUBLIC ACCOUNTING FIRM
To the Shareholders of Rational Equity Armor Fund, Rational Tactical Return Fund, Rational Dynamic Brands Fund, Rational Strategic Allocation Fund, Rational/ReSolve Adaptive Asset Allocation Fund, Rational/Pier 88 Convertible Securities Fund, Rational Special Situations Income Fund, and Rational Inflation Growth Fund and
Board of Trustees of Mutual Fund and Variable Insurance Trust
Opinion on the Financial Statements
We have audited the accompanying statements of assets and liabilities, including the schedules of investments, of the funds listed below (the “Funds”), each a series of Mutual Fund and Variable Insurance Trust, as of December 31, 2022, the related statements of operations, the statements of changes in net assets, the related notes, and the financial highlights for each of the periods indicated below (collectively referred to as the “financial statements”). In our opinion, the financial statements present fairly, in all material respects, the financial position of each of the Funds as of December 31, 2022, the results of their operations, the changes in net assets, and the financial highlights for each of the periods indicated below in conformity with accounting principles generally accepted in the United States of America.
| Fund Name | Statements of
Operations | Statements of
Changes in Net
Assets | Financial Highlights |
| Rational Equity Armor Fund, Rational Tactical Return Fund, Rational Dynamic Brands Fund, Rational Strategic Allocation Fund, and Rational/ReSolve Adaptive Asset Allocation Fund* | For the year ended December 31, 2022 | For the years ended December 31, 2022 and 2021 | For the years ended December 31, 2022, 2021, 2020, 2019, and 2018 |
| Rational/Pier 88 Convertible Securities Fund | For the year ended December 31, 2022 | For the years ended December 31, 2022 and 2021 | For the years ended December 31, 2022, 2021, 2020, and for the period from December 6, 2019 (commencement of operations) through December 31, 2019 |
| Rational Special Situations Income Fund | For the year ended December 31, 2022 | For the years ended December 31, 2022 and 2021 | For the years ended 2022, 2021, 2020, and for the period from July 17, 2019 (commencement of operations) through December 31, 2019 |
| Rational Inflation Growth Fund | For the year ended December 31, 2022 | For the year ended December 31, 2022 and for the period from August 18, 2021 (commencement of operations) through December 31, 2021 |
| * | The financial statements referred to above are Consolidated Financial Statements. |
COHEN & COMPANY, LTD.
800.229.1099 | 866.818.4538 fax | cohencpa.com
Registered with the Public Company Accounting Oversight Board
Basis for Opinion
These financial statements are the responsibility of the Funds’ management. Our responsibility is to express an opinion on the Funds’ financial statements based on our audits. We are a public accounting firm registered with the Public Company Accounting Oversight Board (United States) (“PCAOB”) and are required to be independent with respect to the Funds in accordance with the U.S. federal securities laws and the applicable rules and regulations of the Securities and Exchange Commission and the PCAOB.
We conducted our audits in accordance with the standards of the PCAOB. Those standards require that we plan and perform the audit to obtain reasonable assurance about whether the financial statements are free of material misstatement whether due to error or fraud.
Our audits included performing procedures to assess the risks of material misstatement of the financial statements, whether due to error or fraud, and performing procedures that respond to those risks. Such procedures included examining, on a test basis, evidence regarding the amounts and disclosures in the financial statements. Our procedures included confirmation of securities owned as of December 31, 2022, by correspondence with the custodians and brokers; when replies were not received from brokers, we performed other auditing procedures. Our audits also included evaluating the accounting principles used and significant estimates made by management, as well as evaluating the overall presentation of the financial statements. We believe that our audits provide a reasonable basis for our opinion.
We have served as the Funds’ auditor since 2016.

COHEN & COMPANY, LTD.
Cleveland, Ohio
March 1, 2023
| RATIONAL FUNDS | |
| Supplemental Information (Unaudited) |
| December 31, 2022 | ANNUAL REPORT |
Renewal of Management Agreement between Mutual Fund and Variable Insurance Trust and Rational Advisors, Inc. with respect to Rational Equity Armor Fund, Rational Tactical Return Fund, Rational Dynamic Brands Fund, Rational Strategic Allocation Fund, Rational Special Situations Income Fund, Rational/Pier 88 Convertible Securities Fund, Rational/ReSolve Adaptive Asset Allocation Fund, and Rational Inflation Growth Fund
At a telephonic meeting held on December 9, 2022, the Board of Trustees (the “Board” or the “Trustees”) of Mutual Fund and Variable Insurance Trust (the “Trust”), including a majority of the Trustees who are not “interested persons,” as that term is defined in the Investment Company Act of 1940, as amended, of the Trust, discussed the renewal of the management agreement (the “Management Agreement”) between the Trust and Rational Advisors, Inc. (“Rational”) with respect to Rational Equity Armor Fund (the “Equity Armor Fund”), Rational Tactical Return Fund (the “Tactical Return Fund”), Rational Dynamic Brands Fund (the “Dynamic Brands Fund”), Rational Strategic Allocation Fund (the “Strategic Allocation Fund”), Rational Special Situations Income Fund (the “Special Situations Fund”), Rational/Pier 88 Convertible Securities Fund (the “Pier 88 Fund”), Rational/ReSolve Adaptive Asset Allocation Fund (the “ReSolve Fund”), and Rational Inflation Growth Fund (the “Inflation Growth Fund”), each a series of the Trust (collectively the “Renewal Funds”).
The Board reviewed the completed contract renewal questionnaire submitted by Rational in connection with the proposed renewal of the Management Agreement with respect to the Trust (the “Rational 15(c) Response”), a copy of which was included in the Materials. The Board was assisted by legal counsel throughout the review process. The Board relied upon the advice of legal counsel and its own business judgment in evaluating the Management Agreement and the weight to be given to each factor considered. The conclusions reached by the Board were based upon a comprehensive evaluation and discussion of all the information provided for each Fund with respect to the approval of the Management Agreement and were not the result of any one factor. Moreover, each Trustee might have afforded different weight to the various factors in reaching his conclusions with respect to the Management Agreement. In connection with its deliberations regarding approval of the Management Agreement, the Board reviewed materials prepared by Rational and considered the information presented at Board meetings throughout the year.
Review of Rational 15(c) Response
Nature and Extent of Services. The Board reviewed the consistent services provided by the team of qualified professionals at Rational. The Board reviewed information concerning the resources; personnel; and business operations. The Board considered Rational’s oversight of the Funds’ investment strategy, including derivative risk management and fair valuation. The Board reviewed the ADV for Rational. The Board discussed the financial health of Rational and reviewed its balance sheet as of September 30, 2022. The Board considered that MFund, an affiliate of Rational, provides the Funds with certain management, legal administrative and compliance services including providing the Trust’s CCO. The Board reviewed Rational’s compliance program, including its business continuity and cybersecurity programs, and its oversight of Funds’ sub-advisors’ compliance programs. After further discussion and review of the Rational 15(c) Response, the Board concluded that Rational had sufficient quality of personnel, resources,
| RATIONAL FUNDS | |
| Supplemental Information (Unaudited) (Continued) |
| December 31, 2022 | ANNUAL REPORT |
operations and compliance policies and procedures essential to performing its duties under the Management Agreement and that the nature, overall quality and extent of the advisory services provided to the Renewal Funds by Rational were acceptable.
Performance. The Board reviewed the performance of each Renewal Fund relative to a peer group, its respective Morningstar category and benchmark index for various periods ended September 30, 2022.
Equity Armor Fund. The Board found that for the one- and three-year periods, the Equity Armor Fund outperformed its peer group, the Morningstar Large Value category, the S&P 500 Value TR and S&P 500 TR Index. The Board further found that for the five- and ten- year periods, the Fund underperformed each metric except the Morningstar Option Trading category, which the Fund outperformed over all periods. Effective December 13, 2019, the current sub-advisor was appointed to manage the Fund’s portfolio and the Fund’s investment strategy was changed. The Board considered the performance for the one- and three-year periods are more relevant as these timeframes reflect the performance of the current sub-advisor and investment strategy.
Tactical Return Fund. The Trustees noted that the Tactical Return Fund outperformed the Morningstar Options Trading category and its peer group for the one-, three-, and five-year periods, and outperformed the S&P 500 TR Index for the one-year period. It was also noted that the Fund trailed the S&P 500 TR Index for the three and five-year periods and underperformed each metric for the ten-year period. Effective December 15, 2017, the current sub-advisor was appointed to manage the Fund’s portfolio and the Fund’s investment strategy was changed. Rational reported that since December 15, 2017, the Fund underperformed the S&P 500 TR Index and explained that the Fund’s strategy is not expected to produce the types of strong returns witnessed in the equity markets during the three- and five-year periods, as the Fund does not maintain any long equity exposure.
Dynamic Brands Fund. The Trustees noted Dynamic Brands Fund underperformed its peer group, the Morningstar Large Growth category and the S&P 500 TR Index for the one-, three- and five-ten-year periods. The Board considered Rational’s explanation that the Fund’s investment focus includes many high-growth companies which have been out of favor recently and that, for this reason, the Fund is trailing all of its performance benchmarks for each of these periods.
Strategic Allocation Fund. The Board considered that the Strategic Allocation Fund had underperformed its peer group, Morningstar Allocation 30-50% Equity category and the S&P 500 TR Index for the one-, three- and five- ten-year periods. The Board recognized that the strategy of the Fund was changed on December 13, 2019 and the relevant performance periods are the one-and three-year periods. The Trustees noted that Rational attributed the Fund’s underperformance relative to all of its performance benchmarks for the one-year period to the Fund’s high notional exposure to both bonds and equities which performed similarly, and that the Fund’s underperformance for the trailing one-year period led to underperformance of all performance benchmarks for the three-year period as well.
| RATIONAL FUNDS | |
| Supplemental Information (Unaudited) (Continued) |
| December 31, 2022 | ANNUAL REPORT |
Special Situations Fund. The Board considered the Special Situations Fund outperformed its peer group, the Morningstar Nontraditional Bond and Multisector Bond categories, the Bloomberg Aggregate Bond TR and MBS TR Indexes for each the one-, three-, five- and ten-year periods.
Pier 88 Fund. The Board considered that the Pier 88 Fund outperformed its peer group for the one- and five-year periods and since inception (March 1, 2017); outperformed the Bloomberg Aggregate Bond Index for all periods; underperformed the ICE BofA Investment Grade US Convertible Index for the one- and five-year periods, as well as the since inception period, but slightly outperformed this index for the three-year period; and outperformed the S&P 500 TR Index for the one-year period but has underperformed this index for the remaining periods. The Board considered Rational’s explanation that the Fund’s performance lagged the ICE BofA Investment Grade US Convertible Index for the one-year period because the Fund does not invest in certain sectors that have performed well during the year and that the Fund’s trailing performance relative to the S&P 500 TR Index was due to its exposure to convertible bonds during a period of strong equity returns.
ReSolve Fund. The Board considered that the Fund underperformed its peer group for the three-year period, but outperformed the peer group for the one-, five- and ten-year periods; outperformed the Morningstar Macro Trading category for all periods; underperformed the Barclay CTA Index for the one- and three-year periods, but outperformed this index for the five- and ten-year periods; and outperformed the S&P 500 TR Index for the one-year period, but underperformed this index for all other periods. The Board noted that, prior to March 1, 2018, the Fund’s portfolio was sub-advised by a different manager and implemented a different strategy, and that the one- and three-year performance is reflective of the Fund’s current sub-advisor and investment strategy. Rational explained that, due to the uncorrelated nature of its strategy, the Fund outperformed the S&P 500 TR Index for the one-year period, a period of equity market turmoil, but underperformed the Index for the three-year period which was primarily characterized by a strong bull market. With respect to the Barclay CTA Index, the Board noted that Fund underperformed the index for the one- and three-year periods and recognized that the index consists of a number of trend-following strategies, which had an exceptional year.
Inflation Growth Fund. The Board considered the Inflation Growth Fund underperformed the peer group for the one-year and since inception (August 18, 2021), but outperformed the Morningstar Allocation 50% to 70% Equity category, the 60% S&P 500 TR Index/40% Bloomberg Aggregate Bond Index and the S&P 500 TR Index for both time periods.
Fees and Expenses. The Board reviewed the advisory fees and the net expenses for each Renewal Fund as compared to its peer group and Morningstar category.
Equity Armor Fund. The Board considered the advisory fee for Equity Armor Fund and found it lower than the average and equal to the median advisory fees of the peer group and Morningstar Options Trading category. The Board found the Fund’s advisory fee to be higher than the average and median advisory fees of the Morningstar Large Value category, but within the range of fees for the category, and noted Rational’s explanation that the category includes a number of funds
| RATIONAL FUNDS | |
| Supplemental Information (Unaudited) (Continued) |
| December 31, 2022 | ANNUAL REPORT |
that are passively managed and that the peer group is a more appropriate comparison for an actively managed equity strategy with a hedging overlay.
The Board reviewed the net expense ratio of the Fund and found it to be higher than the median and average net expenses of the peer group and each Morningstar category. The Board noted the net expenses were within the range of net expenses of its peer group and each Morningstar category.
Tactical Return Fund. The Board reviewed the Total Return Fund’s advisory fee and found it above the average and median of advisory fees of its peer group and the Morningstar Options Trading category. The Trustees considered Rational’s representation that the Fund offers a distinct strategy that has proven to perform well during a challenging investing environment. The Board also considered that only a few unaffiliated funds in the Morningstar Options Trading category have somewhat similar strategies to the Fund and that two of them have the same 1.75% advisory fee as the Fund, which is the highest for the category and peer group.
The Board found Tactical Return Fund’s net expense ratio higher than its peer group and Morningstar Options Trading category average and median, but is within range of net expense ratios of both.
Dynamic Brands Fund. The Board reviewed the advisory fee for Dynamic Brands Fund and found it to be slightly below the average and equal to the median of advisory fees of its peer group, while above the Morningstar Large Growth category’s average and median advisory fees. Rational noted that the Fund’s advisory fee is competitive relative to the peer group and other funds in the Morningstar category that implement a more active approach.
The Board considered the Fund’s net expense ratio, which was above its peer group and Morningstar category averages and medians, but within the range of net expense ratio of the peer group and the Morningstar category.
Strategic Allocation Fund. The Board considered the Fund’s advisory fee was lower than average and median advisory fees for its peer group average and the Morningstar Allocation 30%-50% Equity category. Rational stated that the advisory fee for the Strategic Allocation Fund was comparable to other funds that implement fund-of-funds strategies.
The Board considered that the net expense ratio of the Fund is above the average and median expense ratio of its peer group average and Morningstar Allocation 30%-50% Equity average, but within the range of net expenses of the funds within both peer group and Morningstar category.
Special Situations Fund. The Board reviewed the advisory fee for Special Situations Fund and found it higher than the average and median of the peer group and the Morningstar Non-Traditional Bond and Multisector Bond categories, while within range of advisory fees of each. The Board considered the highly specialized nature of the Fund and the expertise necessary to execute the Fund’s strategy.
| RATIONAL FUNDS | |
| Supplemental Information (Unaudited) (Continued) |
| December 31, 2022 | ANNUAL REPORT |
A review by the Board of the Special Situation Fund’s net expenses found the Fund’s net expenses above average and median of the peer group and both Morningstar categories, while within the range of net expenses of each.
Pier 88 Fund. The Board reviewed the advisory fee for Pier 88 Fund and found it above the average and median of its peer group and the Morningstar Convertibles category, while well within the range of advisory fees for both. The Trustees considered the reasonableness of the advisory fee in light of the unique nature of the Fund’s investment strategy.
The Board considered the net expense ratio of the Fund and found it below the peer group average, although above the median, while above the Morningstar Convertible category average and median.
ReSolve Fund. The Board acknowledged that the Fund’s advisory fee was higher than the average and median advisory fees of the peer group and Morningstar Macro Trading category and was above the highest advisory fee of the peer group and was equal to the highest advisory fee of the Morningstar category. The Board considered Rational’s explanation that the Fund’s advisory fee is reasonable based on the specialized nature of the Fund’s investment strategy; and the experience and performance results of the sub-adviser within the strategy; and the experience and capabilities of Rational in monitoring the Fund’s complex strategies.
The Board reviewed the net expense ratio of the Fund and found it higher than the average and median of its peer group and Morningstar Macro Trading category, while within the range of net expenses for both.
Inflation Growth Fund. The Board reviewed the advisory fee for Inflation Growth Fund and noted that it was it above the average and median advisory fee of the peer group and the Morningstar Allocation 50% to 70% Equity category. The Board further noted that the advisory fee is at the high end of the range of advisory fees of Morningstar category and the highest fee in the peer group’s range of advisory fees. The Board considered the reasonableness of the Fund’s advisory fee in light of its alternative and active investment strategy which tend to have higher advisory fees.
The Board noted the Fund’s net expense ratio was above the peer group and Morningstar average and median, while within the range of net expenses of both.
The Board discussed the allocation of fees between Rational and the respective sub-advisors of Equity Armor Fund, Tactical Return Fund, Dynamic Brands Fund, Special Situations Fund, Pier 88 Fund, ReSolve Fund, and Inflation Growth Fund relative to its respective duties and other factors. The Board agreed that the allocation of fees between Rational and each sub-adviser was acceptable.
| RATIONAL FUNDS | |
| Supplemental Information (Unaudited) (Continued) |
| December 31, 2022 | ANNUAL REPORT |
In considering the investment strategy, range of fees within each peer group and category, the size of each Renewal Fund, and in recognition of the unique strategies offered by many of the Renewal Funds, the Board determined that the advisory fees and net expenses in each Renewal Fund were acceptable.
Profitability. The Board reviewed a profitability analysis provided for each Renewal Fund. The Trustees noted that Rational realized a loss in connection with its relationship with Strategic Allocation Fund and Inflation Growth Fund, low profits with respect to Equity Armor and Pier 88 Fund and modest profits with respect to the Dynamic Brands Fund, Tactical Return Fund, Special Situations Fund and ReSolve Fund. The Board noted that when taking into account the salaries of key personnel, Rational’s profits would be lower. After consideration, the Board concluded that the profitability from Rational’s relationship with each of the Renewal Funds was not excessive.
Economies of Scale. Rational and the Board discussed the potential for economies of scale at larger asset levels. The Board considered that breakpoints in advisory fees were included for Equity Armor Fund and Dynamic Brands Fund for assets over $500 million to $1 billion, and for assets over $1 billion. Rational and the Board agreed that establishing breakpoints would be an appropriate way for Rational to share its economies of scale if assets of the Renewal Funds continue to increase. After further discussion, the Board agreed to continue monitoring the Renewal Funds regarding the issue of economies of scale and potential future breakpoints.
Conclusion. The Board considered many factors, and no single factor was determinative to the decision of the Board concerning the renewal of the Management Agreement with respect to the Renewal Funds. Having requested, reviewed, and discussed in depth such information from Rational as the Board believe to be reasonably necessary to evaluate the terms of the Management Agreement, and as assisted by the advice of counsel, the Board concluded the renewal of the Management Agreement was in the best interest of each of the Renewal Funds and its respective shareholders.
| RATIONAL FUNDS | |
| Supplemental Information (Unaudited) (Continued) |
| December 31, 2022 | ANNUAL REPORT |
Consideration and Renewal of Sub-Advisory Agreements for Rational Tactical Return Fund, Rational Dynamic Brands Fund, Rational Special Situations Income Fund, Rational/ReSolve Adaptive Asset Allocation Fund , Rational/Pier 88 Convertible Securities Fund, Rational Equity Armor Fund, and Rational Inflation Growth Fund (“Inflation Growth Fund”)
At a telephonic meeting held on December 9, 2022, the Board of Trustees (the “Board” or the “Trustees”) of Mutual Fund and Variable Insurance Trust (the “Trust”), including a majority of the Trustees who are not “interested persons”, as that term is defined in the Investment Company Act of 1940, as amended, of the Trust discussed the renewal of sub-advisory agreements with Warrington Asset Management, LLC (“Warrington”) pertaining to Rational Tactical Return Fund (“Tactical Return Fund”); with Accuvest Global Advisors (“Accuvest”) pertaining to Rational Dynamic Brands Fund (“Dynamic Brands Fund”); with ESM Management, LLC (“ESM”) pertaining to Rational Special Situations Income Fund (“Special Situations Fund”); with ReSolve Asset Management, Inc. (“ReSolve Canada”) pertaining to Rational/ReSolve Adaptive Asset Allocation Fund (“ReSolve Fund”); with Pier 88 Investment Partners, LLC (“Pier 88”) pertaining to Rational/Pier 88 Convertible Securities Fund (“Pier 88 Fund”); with Equity Armor Investments, LLC (“Equity Armor”) pertaining to Rational Equity Armor Fund (“Equity Armor Fund”); and with SL Advisors, LLC (“SL Advisors”) pertaining to Rational Inflation Growth Fund (“Inflation Growth Fund”) altogether the “Sub-Advisory Agreements”); and a trading advisory agreement between Rational and ReSolve Asset Management SEZC (“ReSolve Cayman”) pertaining the ReSolve Fund (the “Trading Advisory Agreement”).
The Board reviewed the completed contract renewal questionnaires submitted by each sub-advisor in connection with the proposed renewal of the Sub-Advisory Agreements with respect to the Trust (each, a “15(c) Response”). The Board was assisted by legal counsel throughout the review process. The Board relied upon the advice of counsel and its own business judgment in evaluating the Sub-Advisory Agreements and the weight to be given to each of the factors considered. The conclusions reached by the Board were based upon a comprehensive evaluation and discussion of all the information provided and were not the result of any one factor. Moreover, each Trustee might have afforded different weight to the various factors in reaching his conclusions with the Sub-Advisory Agreements. The Board reviewed the materials prepared by Rational Advisors, Inc. (“Rational”) and each sub-advisor and considered the information presented at Board meetings throughout the year during which management of the sub-advisor had participated.
Review of Warrington 15(c) Response
Nature, Extent & Quality of Services. The Board reviewed the nature, extent and quality of the services provided by the investment professionals at Warrington. The Board reviewed information concerning Warrington’s resources, business operations, and compliance program. The Board considered Warrington’s management of the Tactical Return Fund’s portfolio and acknowledged the expertise of the portfolio management team. The Board reviewed a copy of Warrington’s Form ADV, including its compliance program, and its business continuity and cybersecurity components. After discussion and review of the Warrington 15(c) Response, the Board concluded that Warrington had sufficient personnel, resources, operations and compliance policies and
| RATIONAL FUNDS | |
| Supplemental Information (Unaudited) (Continued) |
| December 31, 2022 | ANNUAL REPORT |
procedures essential to perform its duties under the Warrington Sub-Advisory Agreement and that the nature, extent and quality of services provided to the Tactical Return Fund were acceptable.
Performance. The Trustees noted that the Tactical Return Fund outperformed the Morningstar Options Trading category and its peer group for the one-, three-, and five-year periods, and outperformed the S&P 500 TR Index for the one-year period. It was also noted that the Fund trailed the S&P 500 TR Index for the three and five-year periods and underperformed each metric for the ten-year period. Effective December 15, 2017, the current sub-advisor was appointed to manage the Fund’s portfolio and the Fund’s investment strategy was changed. Rational reported that since December 15, 2017, the Fund underperformed the S&P 500 TR Index and explained that the Fund’s strategy is not expected to produce the types of strong returns witnessed in the equity markets during the three- and five-year periods, as the Fund does not maintain any long equity exposure.
Fees & Expenses. The Board considered that the sub-advisory fees are paid entirely by Rational. The Board found the sub-advisor fee lower than the fees Warrington receives for managing other pooled investment vehicles and/or Separately Managed Accounts (“SMAs”), some of which include performance fees. The Board considered the respective duties of Rational and Warrington and analyzed how fees were allocated. After further discussion, the Board concluded that the sub-advisory fees payable to Warrington with respect to the Tactical Return Fund were reasonable.
Profitability. The Board reviewed the profitability of Warrington from sub-advising the Fund and noted that Warrington is making a profit. The Board discussed the profit is further reduced, after adjusting for salaries of the specialized team for their time and efforts in managing the Tactical Return Fund. Warrington stated that initially, the fee split was not enough to cover operational expenses; however, the current revenues afford the Fund the opportunity to be profitable. The Board concluded that there was no cause for concern of excessive profitability at this time, but it will continue to monitor the profitability of Warrington related to its services provided to the Fund.
“Fall-out” Benefits. The Board considered fall-out benefits received by Warrington and its relationship with Tactical Return Fund.
Economies of Scale. Rational and the Board agreed to continue evaluating economies of scale with respect to the investment advisory relationship overall, taking into consideration the impact of the sub-advisory expense.
Conclusion. The Board considered many factors, and no single factor was determinative to the decision of the Board concerning the renewal of the Warrington Sub-Advisory Agreement. Having requested, reviewed, and discussed in dept such information from Warrington as the Board believed to be reasonably necessary to evaluate the terms of the Warrington Sub-Advisory Agreement, and as assisted by the advice of counsel, the Board concluded that renewal of the Warrington Sub-Advisory Agreement was in the best interests of the Tactical Return Fund and its shareholders.
| RATIONAL FUNDS | |
| Supplemental Information (Unaudited) (Continued) |
| December 31, 2022 | ANNUAL REPORT |
Review of Accuvest 15(c) Response
Nature, Extent & Quality of Services. The Board reviewed the nature, extent and quality of the services provided by the investment professionals at Accuvest. The Board reviewed information concerning Accuvest’s resources, operations and compliance program. The Board considered Accuvest’s management of the Dynamic Brands Fund’s investment strategy including Accuvest’s extensive research into the companies that comprise the top holdings of the Fund. The Board analyzed the financial condition of Accuvest and reviewed a copy of Accuvest’s Form ADV. After discussion and review of Accuvest’s 15(c) Response, including details of Accuvest’s compliance program, including its business continuity and cybersecurity programs, the Board concluded that Accuvest had sufficient quality of personnel, resources, operations and compliance policies and procedures essential to perform its duties under the Accuvest Sub-Advisory Agreement and that the nature, overall quality and extent of the sub-advisory services provided to the Dynamic Brands Fund by Accuvest were acceptable.
Performance. The Trustees noted Dynamic Brands Fund underperformed its peer group, the Morningstar Large Growth category and the S&P 500 TR Index for the one-, three- and five- ten-year periods. The Board considered Rational’s explanation that the Fund’s investment focus includes many high-growth companies which have been out of favor recently and that, for this reason, the Fund is trailing all of its performance benchmarks for each of these periods.
Fees & Expenses. The Board considered that the sub-advisory fees are paid entirely by Rational. The Board considered that the sub-advisory fee was lower than the fees Accuvest receives for managing other pooled investment vehicles and/or SMA accounts. The Board considered the respective duties of Rational and Accuvest and analyzed how fees were allocated. After consideration and discussion, the Board concluded that the sub-advisory fees payable to Accuvest with respect to the Dynamic Brands Fund were reasonable.
Profitability. The Board reviewed the profitability of Accuvest from sub-advising Dynamic Brands Fund and noted that Accuvest is operating at a loss. The Board concluded that it will continue to monitor the profitability of Accuvest related to its services provided to the Fund going forward.
“Fall-out” Benefits. The Board considered fall-out benefits received by Accuvest and its relationship with Dynamic Brands Fund.
Economies of Scale. Rational and the Board agreed to continue evaluating economies of scale with respect to the investment advisory relationship overall, taking into consideration the impact of the sub-advisory expense. The Board noted that at the advisory fee level, the Dynamic Brands Fund includes breakpoints for assets over $500 million to $1 billion range and for assets over $1 billion.
| RATIONAL FUNDS | |
| Supplemental Information (Unaudited) (Continued) |
| December 31, 2022 | ANNUAL REPORT |
Conclusion. The Board considered many factors, and no single factor was determinative to the decision of the Board concerning the renewal of the Accuvest Sub- Advisory Agreement. Having requested, reviewed, and discussed in depth such information from Accuvest, as the Board believed to be reasonably necessary to evaluate the terms of the Accuvest Sub-Advisory Agreement, and as assisted by the advice of counsel, the Board concluded that renewal of the Accuvest Sub-Advisory Agreement was in the best interests of the Fund and its shareholders.
Review of ESM 15(c) Response
Nature, Extent & Quality of Services. The Board reviewed the nature, extent and quality of the services provided by the investment professionals at ESM. The Board reviewed information concerning ESM’s resources, personnel, operations, and compliance program. The Board considered that ESM oversees the Fund’s investment objective, ensuring that appropriate positions are traded and that the Fund’s investment program records are appropriately maintained. The Board analyzed the financial position of ESM and reviewed a copy of ESM’s Form ADV. After discussion and review of the ESM’s 15(c) Response, including details of ESM’s compliance program, including its business continuity and cybersecurity programs, the Board concluded that ESM had sufficient quality of personnel, resources, operations and compliance policies and procedures essential to perform its duties under the ESM Sub-Advisory Agreement and that the nature, overall quality and extent of the sub-advisory services provided to the Special Situations Fund by ESM were acceptable.
Performance. The Board considered the Special Situations Fund outperformed its peer group, the Morningstar Nontraditional Bond and Multisector Bond categories, the Bloomberg Aggregate Bond TR and MBS TR Indexes for each the one-, three-, five- and ten-year periods.
Fees & Expenses. The Board considered that the sub-advisory fees paid to ESM are paid entirely by Rational. The Board found the sub-advisory fee paid to ESM was lower than the fees ESM receives from separately managed accounts for providing the same investment strategy. The Board discussed the sophisticated strategy of the Fund and that retail investors usually would not have access to a Fund with this strategy. The Board considered the respective duties of Rational and ESM and analyzed how fees were allocated. After further discussion, the Board concluded that the sub-advisory fees payable to ESM with respect to the Special Situations Fund were reasonable.
Profitability. The Board reviewed the profitability analysis provided by ESM and reflected that after compensation to key personnel, ESM was operating at a profit in providing management to the Fund. After discussion, the Board concluded that there was no cause for concern of excessive profitability of ESM with regards to the Fund.
“Fall-out” Benefits. The Board considered fall-out benefits received by ESM and its relationship with Special Situations Fund.
Economies of Scale. Rational and the Board agreed to continue evaluating economies of scale with respect to the investment advisory relationship overall, taking into consideration the impact of sub-advisory expenses.
| RATIONAL FUNDS | |
| Supplemental Information (Unaudited) (Continued) |
| December 31, 2022 | ANNUAL REPORT |
Conclusion. The Board considered many factors, and no single factor was determinative to the decision of the Board concerning the renewal of the ESM Sub-Advisory Agreement. Having requested, reviewed, and discussed in depth such information from ESM, as the Board believed to be reasonably necessary to evaluate the terms of the ESM Sub-Advisory Agreement, and as assisted by the advice of counsel, the Board concluded that renewal of the ESM Sub-Advisory Agreement was in the best interests of the Special Situations Fund and its shareholders.
Review of ReSolve Canada 15(c) Response
Nature, Extent & Quality of Services. The Board reviewed the nature, extent and quality of the services provided by the investment professionals at ReSolve Canada. The Board reviewed information concerning ReSolve Canada’s resources, personnel, operations, and compliance program and its responsibilities with respect to the management of the ReSolve Fund’s portfolio. The Board considered that ReSolve Canada oversees the Fund’s investment objective, including maintaining books and records, compliance procedures and selecting and supervision of trading counterparties. The Board analyzed the financial position of ReSolve Canada and reviewed a copy of ReSolve Canada’s Form ADV. After discussion and review of ReSolve Canada’s 15(c) Response, including details of its compliance, business continuity and cybersecurity programs, the Board concluded that ReSolve Canada had sufficient quality of personnel, resources, operations and compliance policies and procedures essential to perform its duties under the Sub-Advisory Agreement and that the nature, overall quality and extent of the sub-advisory services provided to the ReSolve Fund by ReSolve Canada were acceptable.
Performance. The Board considered that the Fund underperformed its peer group for the three-year period, but outperformed the peer group for the one-, five- and ten-year periods; outperformed the Morningstar Macro Trading category for all periods; underperformed the Barclay CTA Index for the one- and three-year periods, but outperformed this index for the five- and ten-year periods; and outperformed the S&P 500 TR Index for the one-year period, but underperformed this index for all other periods. The Board noted that, prior to March 1, 2018, the Fund’s portfolio was sub-advised by a different manager and implemented a different strategy, and that the one- and three-year performance is reflective of the Fund’s current sub-advisor and investment strategy. Rational explained that, due to the uncorrelated nature of its strategy, the Fund outperformed the S&P 500 TR Index for the one-year period, a period of equity market turmoil, but underperformed the Index for the three-year period which was primarily characterized by a strong bull market. With respect to the Barclay CTA Index, the Board noted that Fund underperformed the index for the one- and three-year periods and recognized that the index consists of a number of trend-following strategies, which had an exceptional year.
| RATIONAL FUNDS | |
| Supplemental Information (Unaudited) (Continued) |
| December 31, 2022 | ANNUAL REPORT |
Fees & Expenses. The Board considered that the sub-advisory fees are paid by Rational to ReSolve Canada pursuant to the Sub-Advisory Agreement. The Board considered the respective duties of Rational, ReSolve Canada and ReSolve Cayman, and analyzed how fees were allocated. The Board also considered ReSolve Canada’s position that the Fund’s highly sophisticated investment strategy is accessible to investors who would not normally have access to the strategy in a different investment vehicle. After further discussion, the Board concluded that the sub-advisory fee payable to ReSolve Canada with respect to the Fund were reasonable.
Profitability. The Board reviewed the profitability analysis provided by ReSolve Canada with respect to the Fund, and found that ReSolve Canada operated at a loss in providing services to the ReSolve Fund. The Board considered that this was after the allocation of expenses attributable to the Fund. The Board concluded that there was no cause for concern of excessive profitability of ReSolve Canada with regards to the Fund.
“Fall-out” Benefits. The Board considered fall-out benefits received by ReSolve Canada from relationship with ReSolve Fund.
Economies of Scale. Rational and the Board agreed to continue evaluating economies of scale with respect to the investment advisory relationship overall, taking into consideration the impact of the sub-advisory and trading advisory expenses.
Conclusion. The Board considered many factors, and no single factor was determinative to the decision of the Board concerning the renewal of the ReSolve Sub-Advisory Agreement. Having requested, reviewed, and discussed in depth such information from ReSolve Canada as the Trustees believed to be reasonably necessary to evaluate the terms of the ReSolve Sub-Advisory Agreement, and as assisted by the advice of Counsel, the Board concluded that renewal of the Sub-Advisory Agreement with ReSolve Canada was in the best interests of the ReSolve Fund and its shareholders.
Review of ReSolve Cayman 15(c) Response
Nature, Extent & Quality of Services. The Board reviewed the nature, extent and quality of the services provided by the investment professionals at ReSolve Cayman. The Board reviewed information concerning ReSolve Cayman’s resources, personnel, operations, and compliance program and discussed the trading advisory services provided by the firm. The Board noted that while ReSolve Cayman is not registered under the 1940 Act, its personnel has experience with the operations and regulatory requirements that the Fund is subjected to as a regulated investment company. The Board analyzed the financial position of ReSolve Cayman. After discussion and review of Resolve Cayman’s 15(c) Response, including details of its compliance, business continuity and cybersecurity programs, the Board concluded that ReSolve Cayman had sufficient quality of personnel, resources, operations and compliance policies and procedures essential to perform its duties under the Trading Advisory Agreement and that the nature, overall quality and extent of the trading advisory services provided to the ReSolve Fund by ReSolve Cayman were acceptable.
Performance. The Board considered that the Fund underperformed its peer group for the three-year period, but outperformed the peer group for the one-, five- and ten-year periods; outperformed the Morningstar Macro Trading category for all periods; underperformed the Barclay CTA Index for the one- and three-year periods, but outperformed this index for the five- and ten-year periods; and outperformed the S&P 500 TR Index for the one-year period, but underperformed this index for all other periods. The Board noted that, prior to March 1, 2018, the Fund’s portfolio was sub-advised by a different manager and implemented a different strategy, and that the one- and three-year performance is reflective of the Fund’s current sub-advisor and investment strategy. Rational explained that, due to the uncorrelated nature of its strategy, the Fund outperformed the S&P 500 TR Index for the one-year period, a period of equity market turmoil, but underperformed the Index for the three-year period which was primarily characterized by a strong bull market. With respect to the Barclay CTA Index, the Board noted that Fund underperformed the index for the one- and three-year periods and recognized that the index consists of a number of trend-following strategies, which had an exceptional year.
Fees & Expenses. The Board considered that the trading advisory fees are paid by Rational to ReSolve Cayman pursuant to the Trading Advisory Agreement. The Board considered the respective duties of Rational, ReSolve Canada and ReSolve Cayman and analyzed how fees were allocated. The Board also considered ReSolve Cayman’s use of its proprietary methodology to create the portfolio of securities across global asset classes including commodities and currencies. After further discussion, the Board concluded that the trading advisory fee payable to ReSolve Cayman with respect to the Fund were reasonable.
Profitability. The Board reviewed the profitability analysis provided by ReSolve Cayman with respect to the Fund, and found that ReSolve Cayman operated at a loss in providing services to the ReSolve Fund during the 12-month period ended September 30, 2022. The Board considered that this was after the allocation of expenses attributable to the Fund. The Board concluded that there was no cause for concern of excessive profitability of ReSolve Cayman with regards to the Fund.
“Fall-out” Benefits. The Board considered fall-out benefits received by ReSolve Cayman from relationship with ReSolve Fund.
Economies of Scale. Rational and the Board agreed to continue evaluating economies of scale with respect to the investment advisory relationship overall, taking into consideration the impact of the sub-advisory and trading advisory expenses.
Conclusion. The Board considered many factors, and no single factor was determinative to the decision of the Board concerning the renewal of the Trading Advisory Agreement. Having requested, reviewed, and discussed in depth such information from ReSolve Cayman as the Trustees believed to be reasonably necessary to evaluate the terms of the Trading Advisory Agreement, and as assisted by the advice of Counsel, the Board concluded that renewal of the Trading Advisory Agreement with ReSolve Cayman was in the best interests of the ReSolve Fund and its shareholders.
Review of Pier 88 15(c) Response
Nature, Extent & Quality of Services. The Board reviewed the nature, extent and quality of the services provided by the investment professionals at Pier 88. The Board reviewed information concerning Pier 88’s resources, personnel, operations, and compliance program. The Board considered that Pier 88 oversees the Fund’s investment objective, ensuring that the investment program enacts appropriate risk management and compliance controls. The Board analyzed the financial position of Pier 88 and reviewed a copy of Pier 88’s Form ADV. After discussion and review of the Pier 88’s 15(c) Response, including details of Pier 88’s compliance program, including its business continuity and cybersecurity programs, the Board concluded that Pier 88 had sufficient quality of personnel, resources, operations and compliance policies and procedures essential to perform its duties under the Pier 88 Sub-Advisory Agreement and that the nature, overall quality and extent of the sub-advisory services provided to the Pier 88 Fund by Pier 88 were acceptable.
| RATIONAL FUNDS | |
| Supplemental Information (Unaudited) (Continued) |
| December 31, 2022 | ANNUAL REPORT |
Performance. The Board considered that the Pier 88 Fund outperformed its peer group for the one- and five-year periods and since inception (March 1, 2017); outperformed the Bloomberg Aggregate Bond Index for all periods; underperformed the ICE BofA Investment Grade US Convertible Index for the one- and five-year periods, as well as the since inception period, but slightly outperformed this index for the three-year period; and outperformed the S&P 500 TR Index for the one-year period but has underperformed this index for the remaining periods. The Board considered Rational’s explanation that the Fund’s performance lagged the ICE BofA Investment Grade US Convertible Index for the one-year period because the Fund does not invest in certain sectors that have performed well during the year and that the Fund’s trailing performance relative to the S&P 500 TR Index was due to its exposure to convertible bonds during a period of strong equity returns.
Fees & Expenses. The Board considered that the sub-advisory fees paid to Pier 88 are entirely paid by Rational. The Board considered that the sub-advisory fees paid to Pier 88 were lower than the fees which Pier 88 receives for managing other accounts with a similar strategy. The Board considered the respective duties of Rational and Pier 88 and how fees were allocated between them. After further discussion, the Board concluded that the sub-advisory fees payable to Pier 88 with respect to the Pier 88 Fund were reasonable.
Profitability. The Board reviewed the profitability analysis provided by Pier 88 and noted that Pier 88 was operating at a profit. The Board considered the sophistication of the investment strategy of the Fund and the availability of the strategy from other managers. After discussion, the Board concluded that there was no cause for concern of excessive profitability of Pier 88 with respect to the Fund.
“Fall-out” Benefits. The Board considered fall-out benefits received by Pier 88 and its relationship with the Pier 88 Fund.
Economies of Scale. Rational and the Board agreed to continue evaluating economies of scale with respect to the investment advisory relationship overall, taking into consideration the impact of the sub-advisory expense., taking into consideration the impact of the sub-advisory expense.
Conclusion. The Board considered many factors, and no single factor was determinative to the decision of the Board concerning the renewal of the Pier 88 Sub-Advisory Agreement. Having requested, reviewed, and discussed such information from Pier 88 as the Board believed to be reasonably necessary to evaluate the terms of the Pier 88 Sub-Advisory Agreement, and as assisted by the advice of counsel, the Board concluded that renewal of the Pier 88 Sub-Advisory Agreement was in the best interests of the Fund and its shareholders.
| RATIONAL FUNDS | |
| Supplemental Information (Unaudited) (Continued) |
| December 31, 2022 | ANNUAL REPORT |
Review of Equity Armor 15(c) Response
Nature, Extent & Quality of Services. The Board reviewed the nature, extent and quality of the services provided by the investment professionals at Equity Armor. The Board reviewed information concerning Equity Armor’s resources, personnel, operations, and compliance program. The Board considered that Equity Armor oversees the Fund’s investment objective, ensuring that the investment program is properly executed. The Board analyzed the financial position of Equity Armor and reviewed Equity Armor’s Form ADV. After discussion and review of the Equity Armor’s 15(c) Response and compliance program, including its business continuity and cybersecurity programs, the Board concluded that Equity Armor had sufficient quality of personnel, resources, operations and compliance policies and procedures essential to perform its duties under the Equity Armor Sub-Advisory Agreement and that the nature, overall quality and extent of the sub-advisory services provided to the Equity Armor Fund by Equity Armor were acceptable.
Performance. The Board found that for the one- and three-year periods, the Equity Armor Fund outperformed its peer group, the Morningstar Large Value category, the S&P 500 Value TR and S&P 500 TR Index. The Board further found that for the five- and ten- year periods, the Fund underperformed each metric except the Morningstar Option Trading category, which the Fund outperformed over all periods. Effective December 13, 2019, the current sub-advisor was appointed to manage the Fund’s portfolio and the Fund’s investment strategy was changed. The Board considered the performance for the one- and three-year periods are more relevant as these timeframes reflect the performance of the current sub-advisor and investment strategy.
Fees & Expenses. The Board considered that the sub-advisory fees paid are entirely paid by Rational. The Board found the sub-advisory fees low relative to other actively managed funds that use derivatives or volatility products or are actively managed, and lower than the fees Equity Armor receives from separately managed accounts following a similar strategy. The Board considered the respective duties of Rational and Equity Armor and analyzed how fees were allocated between Rational and Equity Armor. After further discussion, the Board concluded that the sub-advisory fees payable to Equity Armor with respect to the Equity Armor Fund were reasonable.
Profitability. The Board reviewed the profitability analysis provided by Equity Armor and noted that Equity Armor was operating at a profit from managing the Fund. After discussion, the Board concluded that there was no cause for concern of excessive profitability of Equity Armor with respect to the Fund.
“Fall-out” Benefits. The Board considered fall-out benefits received by Equity Armor and its relationship with Equity Armor Fund.
| RATIONAL FUNDS | |
| Supplemental Information (Unaudited) (Continued) |
| December 31, 2022 | ANNUAL REPORT |
Economies of Scale. Rational and the Board agreed to continue evaluating economies of scale with respect to the investment advisory relationship overall, taking into consideration the impact of the sub-advisory expense. The Board noted that at the advisory fee level, the Equity Armor Fund includes breakpoints for assets over $500 million to $1 billion range and for assets over $1 billion.
Conclusion. The Board considered many factors, and no single factor was determinative to the decision of the Board concerning the renewal of the Equity Armor Sub-Advisory Agreement. Having requested, reviewed, and discussed such information from Equity Armor as the Board believed to be reasonably necessary to evaluate the terms of the Equity Armor Sub-Advisory Agreement, and as assisted by the advice of counsel, the Board concluded that renewal of the Equity Armor Sub-Advisory Agreement was in the best interests of the Equity Armor Fund and its shareholders.
Review of SL Advisors 15(c) Response
Nature, Extent & Quality of Services. The Board reviewed the nature, extent and quality of the services provided by the investment professionals at SL Advisors. The Board reviewed information concerning SL Advisors’ resources, personnel, operations, and compliance program. The Board considered that SL Advisors oversees the Fund’s investment objective, ensuring that the investment program is properly executed and additionally provides marketing support to the Fund. The Board analyzed the financial position of SL Advisors and reviewed a copy of SL Advisors’ Form ADV. After discussion and review of the SL Advisors’ 15(c) Response, including details of SL Advisors’ compliance program, including its business continuity and cybersecurity programs, the Board concluded that SL Advisors’ had sufficient quality of personnel, resources, operations and compliance policies and procedures essential to perform its duties under the SL Advisors Sub-Advisory Agreement and that the nature, overall quality and extent of the sub-advisory services provided to the Inflation Growth Fund by SL Advisors were acceptable.
Performance. The Board considered the Inflation Growth Fund underperformed the peer group for the one-year and since inception (August 18, 2021) but outperformed the Morningstar Allocation 50% to 70% Equity category, the 60% S&P 500 TR Index/40% Bloomberg Aggregate Bond Index and the S&P 500 TR Index for both time periods.
Fees & Expenses. The Board considered that the sub-advisory fees paid to SL Advisors pursuant to the SL Advisors Sub-Advisory Agreement were entirely paid by Rational. The Board found the fees which SL Advisors receives were lower than fees charged for managing other accounts. The Board considered the respective duties of Rational and SL Advisors and analyzed how fees were allocated between Rational and SL Advisors. The Board discussed the Fund’s expense cap in place and noted that both Rational and SL Advisors are waiving a portion of their fees, and reimbursement expenses under the contractual expense limitation agreement. After further discussion, the Board concluded that the sub-advisory fees payable to SL Advisors with respect to the Fund were reasonable.
| RATIONAL FUNDS | |
| Supplemental Information (Unaudited) (Continued) |
| December 31, 2022 | ANNUAL REPORT |
Profitability. The Board reviewed the profitability analysis provided by SL Advisors and noted that SL Advisors was operating at a loss in providing management to the Fund. After further discussion, the Board concluded that the level of SL Advisors’ expected profitability with respect to the Fund did not raise any concerns.
“Fall-out” Benefits. The Board considered fall-out benefits received by SL Advisors and its relationship with Inflation Growth Fund.
Economies of Scale. Rational and the Board agreed to continue evaluating economies of scale with respect to the investment advisory relationship overall, taking into consideration the impact of the sub-advisory expense.
Conclusion. The Board considered many factors, and no single factor was determinative to the decision of the Board concerning the renewal of the SL Advisors Sub-Advisory Agreement. Having requested, reviewed, and discussed such information from SL Advisors as the Board believed to be reasonably necessary to evaluate the terms of the SL Advisors Sub-Advisory Agreement, and as assisted by the advice of counsel, the Board concluded that renewal of the SL Advisors Sub-Advisory Agreement was in the best interests of the Inflation Growth Fund and its shareholders.
| RATIONAL FUNDS |
| INFORMATION ABOUT YOUR FUNDS’ EXPENSES (Unaudited) |
As a shareholder of the Fund(s), you incur two types of costs: (1) transaction costs, including sales charges (loads) on purchase payments; and (2) ongoing costs, including management fees, distribution and/or service (12b-1) fees; and other Fund expenses. The example below is intended to help you understand your ongoing costs (in dollars) of investing in the Funds and to compare these costs with the ongoing costs of investing in other mutual funds.
The example below illustrates an investment of $1,000 invested at the beginning of the period 07/01/22 and held for the entire period through 12/31/22.
Actual Expenses
The first section of each table below provides information about actual account values and actual expenses. You may use the information in these sections, together with the amount you invested, to estimate the expenses that you paid over the period. Simply divide your account value by $1,000 (for example, an $8,600 account value divided by $1,000 = 8.6), then multiply the result by the number in the first row under the heading entitled “Expenses Paid During Period” to estimate the expenses you paid on your account during this period.
Hypothetical Example for Comparison Purposes
The second section of each table provides information about the hypothetical account values and hypothetical expenses based on each Fund’s actual expense ratio and an assumed rate of return of 5% per year before expenses, which is not the Funds’ actual return. The hypothetical account values and expenses may not be used to estimate the actual ending account balance or expenses you paid for the period. You may use this information to compare the ongoing costs of investing in the Funds and other funds. To do so, compare this 5% hypothetical example with the 5% hypothetical examples that appear in the shareholder reports of the other funds.
Please note that the expenses shown in the table are meant to highlight your ongoing costs only and do not reflect any transactional costs, such as sales charges (loads) or exchange fees. Therefore, the second section of the table is useful in comparing ongoing costs only, and will not help you determine the relative total costs of owning different funds. In addition, if these transactional costs were included, your costs would have been higher. For more information on transactional costs, please refer to the Funds’ prospectus.
| | | | | | | | | | | | | | Hypothetical | |
| | | | | | | | Actual | | | (5% return before expenses) | |
| | | Fund’s | | Beginning | | | Ending | | | | | | Ending | | | | |
| | | Annualized | | Account Value | | | Account Value | | | Expenses Paid | | | Account Value | | | Expenses Paid | |
| | | Expense Ratio | | 07/01/2022 | | | 12/31/2022 | | | During Period * | | | 12/31/2022 | | | During Period * | |
| Rational Equity Armor Fund - Class A ** | | 1.45% | | $ | 1,000.00 | | | $ | 886.80 | | | $ | 6.90 | | | $ | 1,017.90 | | | $ | 7.37 | |
| Rational Equity Armor Fund - Class C ** | | 2.14% | | | 1,000.00 | | | | 884.20 | | | | 10.16 | | | | 1,014.42 | | | | 10.87 | |
| Rational Equity Armor Fund - Institutional ** | | 1.19% | | | 1,000.00 | | | | 888.80 | | | | 5.67 | | | | 1,019.21 | | | | 6.06 | |
| Rational Tactical Return Fund - Class A ** | | 2.24% | | | 1,000.00 | | | | 1,010.60 | | | | 11.35 | | | | 1,013.91 | | | | 11.37 | |
| Rational Tactical Return Fund - Class C ** | | 2.99% | | | 1,000.00 | | | | 1,029.40 | | | | 15.29 | | | | 1,010.13 | | | | 15.15 | |
| Rational Tactical Return Fund - Institutional ** | | 1.99% | | | 1,000.00 | | | | 992.40 | | | | 9.99 | | | | 1,015.17 | | | | 10.11 | |
| Rational Dynamic Brands Fund - Class A | | 1.45% | | | 1,000.00 | | | | 642.80 | | | | 6.00 | | | | 1,017.90 | | | | 7.37 | |
| Rational Dynamic Brands Fund - Class C | | 2.17% | | | 1,000.00 | | | | 640.70 | | | | 8.97 | | | | 1,014.27 | | | | 11.02 | |
| Rational Dynamic Brands Fund - Institutional | | 1.18% | | | 1,000.00 | | | | 643.70 | | | | 4.89 | | | | 1,019.26 | | | | 6.01 | |
| Rational Strategic Allocation Fund - Class A | | 0.70% | | | 1,000.00 | | | | 738.40 | | | | 3.07 | | | | 1,021.68 | | | | 3.57 | |
| Rational Strategic Allocation Fund - Class C | | 1.45% | | | 1,000.00 | | | | 736.30 | | | | 6.35 | | | | 1,017.90 | | | | 7.37 | |
| Rational Strategic Allocation Fund - Insitutional | | 0.45% | | | 1,000.00 | | | | 739.80 | | | | 1.97 | | | | 1,022.94 | | | | 2.29 | |
| Rational/ReSolve Adaptive Asset Allocation Fund - Class A | | 2.22% | | | 1,000.00 | | | | 1,085.20 | | | | 11.67 | | | | 1,014.01 | | | | 11.27 | |
| Rational/ReSolve Adaptive Asset Allocation Fund - Class C | | 2.97% | | | 1,000.00 | | | | 1,080.90 | | | | 15.58 | | | | 1,010.23 | | | | 15.05 | |
| Rational/ReSolve Adaptive Asset Allocation Fund - Institutional | | 1.97% | | | 1,000.00 | | | | 1,086.30 | | | | 10.36 | | | | 1,015.27 | | | | 10.01 | |
| Rational Special Situations Income Fund - Class A | | 2.02% | | | 1,000.00 | | | | 953.40 | | | | 9.95 | | | | 1,015.02 | | | | 10.26 | |
| Rational Special Situations Income Fund - Class C | | 2.75% | | | 1,000.00 | | | | 949.80 | | | | 13.52 | | | | 1,011.34 | | | | 13.94 | |
| Rational Special Situations Income Fund - Institutional | | 1.76% | | | 1,000.00 | | | | 954.10 | | | | 8.67 | | | | 1,016.33 | | | | 8.94 | |
| Rational/Pier 88 Convertible Securities Fund - Class A | | 1.24% | | | 1,000.00 | | | | 953.40 | | | | 6.11 | | | | 1,018.95 | | | | 6.31 | |
| Rational/Pier 88 Convertible Securities Fund - Class C | | 1.99% | | | 1,000.00 | | | | 949.80 | | | | 9.78 | | | | 1,015.17 | | | | 10.11 | |
| Rational/Pier 88 Convertible Securities Fund - Institutional ** | | 0.99% | | | 1,000.00 | | | | 954.10 | | | | 4.88 | | | | 1,020.21 | | | | 5.04 | |
| Rational Inflation Growth Fund - Class A | | 1.74% | | | 1,000.00 | | | | 953.40 | | | | 8.57 | | | | 1,016.43 | | | | 8.84 | |
| Rational Inflation Growth Fund - Class C | | 2.49% | | | 1,000.00 | | | | 949.80 | | | | 12.24 | | | | 1,012.65 | | | | 12.63 | |
| Rational Inflation Growth Fund - Institutional | | 1.49% | | | 1,000.00 | | | | 954.10 | | | | 7.34 | | | | 1,017.69 | | | | 7.58 | |
| * | Expenses are equal to the Funds’ annualized expense ratios multiplied by the average account value over the period, multiplied by 184/365 to reflect the one-half year period. |
| ** | Annualized expense ratio does not include interest expenses or dividend expenses. |
| RATIONAL FUNDS |
| LIQUIDITY RISK MANAGEMENT PROGRAM (Unaudited) |
| December 31, 2022 |
The Funds have adopted and implemented a written liquidity risk management program as required by Rule 22e-4 (the “Liquidity Rule”) under the Investment Company Act. The program is reasonably designed to assess and manage each Fund’s liquidity risk, taking into consideration, among other factors, the respective Fund’s investment strategy and the liquidity of its portfolio investments during normal and reasonably foreseeable stressed conditions; its short and long-term cash flow projections; and its cash holdings and access to other funding sources.
During the year ended December 31, 2022, the Trust’s Liquidity Risk Management Program Committee (the “Committee”) reviewed the report of the Trust’s Liquidity Risk Management (“LRM”) Program prepared by the Trust’s LRM Program Administrator. In connection with its review of the report, the Board reviewed each Fund’s investments and determined that the Funds held adequate levels of cash and highly liquid investments to meet shareholder redemption activities in accordance with applicable requirements. Accordingly, the Committee concluded that (i) the Funds’ liquidity risk management program is reasonably designed to prevent violations of the Liquidity Rule and (ii) the Funds’ liquidity risk management program has been effectively implemented.
| RATIONAL FUNDS | |
| Boards of Trustees and Trust Officers (Unaudited) |
| December 31, 2022 | ANNUAL REPORT |
Independent Trustees Background
Name, Address
and Year of
Birth | Position with
the Trust | Term of Office
and
Length of Time
Served* | Principal Occupation(s)
During Past 5 Years | Number of
Portfolios in
Fund
Complex
Overseen by
Trustee | Other Directorships
Held During Past 5 Years |
Tobias Caldwell
Year of Birth:
1967 | Chairman of the Board and Trustee | Since 2016 | Managing Member, Genovese Family Enterprises, LLC (real estate firm), since 1999; Managing member, Bear Properties, LLC (real estate firm), since 2006; Managing member, PTL Real Estate, LLC (2000–2019) (real estate/investment firm). | 54 | Chairman of the Board, Strategy Shares, since 2016; Lead Independent Trustee and Chair of Audit Committee, Mutual Fund Series Trust, since 2006; Independent Trustee and Chair of Audit Committee, Variable Insurance Trust, since 2010; Trustee, IDX Funds (formerly M3Sixty Funds Trust), since 2016; Chairman of the Board, AlphaCentric Prime Meridian Income Fund, since 2018. |
Stephen P. Lachenauer
Year of Birth:
1967 | Trustee and Chair of the Audit, Risk and Compliance, and Investment Committees | Trustee and Chair of Audit and Risk and Compliance Committees since 2016; Chair of Investment Committee since November 2020 | Attorney, private practice, since 2011. | 54 | Trustee and Chair of the Audit and Risk and Compliance Committees since 2016, and Chair of the Investment Committee since November 2020, Strategy Shares; Trustee, TCG Financial Series Trusts I-X since 2015; Trustee and Chair of the Audit and Risk and Compliance Committees since 2018, and Chair of the Investment Committee since November 2020, AlphaCentric Prime Meridian Income Fund; Trustee, Mutual Fund Series Trust since April 2022. |
Donald McIntosh
Year of Birth:
1967 | Trustee | Since 2016 | Credit risk review analyst, Santander Holdings USA, since 2015; Governance analyst, Santander Bank, 2011 – 2015. | 16 | Trustee, Strategy Shares, since 2016; Trustee, TCG Financial Series Trusts I-X since 2015; Trustee, AlphaCentric Prime Meridian Income Fund since 2018. |
| * | The term of office of each Trustee is indefinite. |
| RATIONAL FUNDS | |
| Boards of Trustees and Trust Officers (Unaudited) (Continued) |
| December 31, 2022 | ANNUAL REPORT |
Officers*
Name, Address,
Year of Birth | Position(s)
Held with
Registrant | Term and
Length
Served* | Principal Occupation(s)
During Past 5 Years |
Michael Schoonover
53 Palmeras St. Suite 601
San Juan, PR 00901
Year of Birth: 1983 | President | Since 2022 | Vice President of the Trust, 2018-2021; Chief Operating Officer (“COO”), Catalyst Capital Advisors LLC and Rational Advisors, Inc. since 2017; Portfolio Manager, Catalyst Capital Advisors LLC, 2013 – May 2021; President, MFund Distributors LLC since January 2020; COO, Catalyst International Advisors LLC, since 2019; COO, Insights Media LLC since 2019; COO, MFund Management LLC since 2019; COO, AlphaCentric Advisors LLC since January 2021; Portfolio Manager, Rational Advisors, Inc., 2016–2018. |
Alex Merino
53 Palmeras St. Suite 601
San Juan, PR 00901
Year of Birth: 1985 | Vice President | Since 2022 | Investment Operations Manager, MFund Management LLC since 2022; Investment Operations Analyst, MFund Management LLC, 2020—2021; Tax Senior Associate, PwC Asset & Wealth Management NY Metro, 2016— 2019. |
Erik Naviloff
4221 North 203rd Street,
Suite 100
Elkhorn, Nebraska, 68022
Year of Birth: 1968 | Treasurer | Since 2016 | Vice President—Fund Administration, Ultimus Fund Solutions, LLC since 2012. |
Frederick J. Schmidt
Year of Birth: 1959 | Chief Compliance | Since 2016 | Director, MFund Services LLC since 2015. |
Jennifer A. Bailey
Year of Birth: 1968 | Officer Secretary | Since 2016 | Director of Legal Services, MFund Services LLC since 2012. |
| * | Officers do not receive any compensation from the Trust. |
The Funds’ SAI includes additional information about the Trustees and is available free of charge, upon request, by calling toll-free at 1-800-253-0412.
PRIVACY NOTICE
Mutual Fund & Variable Insurance Trust
Rev. July 2017
| FACTS | WHAT DOES MUTUAL FUND & VARIABLE INSURANCE TRUST DO WITH YOUR PERSONAL INFORMATION? |
| Why? | Financial companies choose how they share your personal information. Federal law gives consumers the right to limit some, but not all sharing. Federal law also requires us to tell you how we collect, share, and protect your personal information. Please read this notice carefully to understand what we do. |
| What? | The types of personal information we collect and share depends on the product or service that you have with us. This information can include: ● Social Security number and wire transfer instructions ● account transactions and transaction history ● investment experience and purchase history When you are no longer our customer, we continue to share your information as described in this notice. |
| How? | All financial companies need to share customers’ personal information to run their everyday business. In the section below, we list the reasons financial companies can share their customers’ personal information; the reasons Mutual Fund & Variable Insurance Trust chooses to share; and whether you can limit this sharing. |
Reasons we can share your
personal information: | Does Mutual Fund &
Variable Insurance Trust
share information? | Can you limit this
sharing? |
| For our everyday business purposes - such as to process your transactions, maintain your account(s), respond to court orders and legal investigations, or report to credit bureaus. | YES | NO |
| For our marketing purposes - to offer our products and services to you. | NO | We don’t share |
| For joint marketing with other financial companies. | NO | We don’t share |
| For our affiliates’ everyday business purposes - information about your transactions and records. | NO | We don’t share |
| For our affiliates’ everyday business purposes - information about your credit worthiness. | NO | We don’t share |
| For our affiliates to market to you | NO | We don’t share |
| For non-affiliates to market to you | NO | We don’t share |
| QUESTIONS? | Call 1-800-253-0412 |
PRIVACY NOTICE
Mutual Fund & Variable Insurance Trust
| What we do: |
How does Mutual Fund & Variable Insurance Trust protect my personal information? | To protect your personal information from unauthorized access and use, we use security measures that comply with federal law. These measures include computer safeguards and secured files and buildings. Our service providers are held accountable for adhering to strict policies and procedures to prevent any misuse of your nonpublic personal information. |
How does Mutual Fund & Variable Insurance Trust collect my personal information? | We collect your personal information, for example, when you: ● open an account or deposit money ● direct us to buy securities or direct us to sell your securities ● seek advice about your investments We also collect your personal information from others, such as credit bureaus, affiliates, or other companies. |
Why can’t I limit all sharing? | Federal law gives you the right to limit only: ● sharing for affiliates’ everyday business purposes – information about your creditworthiness. ● affiliates from using your information to market to you. ● sharing for non-affiliates to market to you. State laws and individual companies may give you additional rights to limit sharing. |
| Definitions |
| Affiliates | Companies related by common ownership or control. They can be financial and non-financial companies. ● Mutual Fund & Variable Insurance Trust does not share with affiliates. |
| Non-affiliates | Companies not related by common ownership or control. They can be financial and non-financial companies. ● Mutual Fund & Variable Insurance Trust doesn’t share with non-affiliates so they can market to you. |
| Joint marketing | A formal agreement between nonaffiliated financial companies that together market financial products or services to you. ● Mutual Fund & Variable Insurance Trust doesn’t jointly market. |
A copy of the policies and procedures that the Funds use to determine how to vote proxies relating to securities held in the Funds’ portfolios, as well as a record of how the Funds voted any such proxies during the most recent 12-month period ended June 30, is available without charge and upon request by calling 800-253-0412. This information is also available from the EDGAR database on the SEC’s website at www.sec.gov.
Funds file a complete schedule of portfolio holdings with the Securities and Exchange Commission (the “SEC”) for the first and third quarters of each fiscal year as an exhibit to its reports on Form N-PORT, within sixty days after the end of the period. Form N-PORT reports are available at the SEC’s website at www.sec.gov.
Rational Advisors, Inc., serves as Investment Advisor to the Funds.
This report is authorized for distribution to prospective investors only when preceded or accompanied by a prospectus which contains facts concerning the Funds’ objectives and policies, management fees, expenses and other information.
Shareholder Services: 800-253-0412
Rational-AR22
(a) The Registrant has, as of the end of the period covered by this report, adopted a code of ethics that applies to the Registrant's principal executive officer, principal financial officer, and principal accounting officer or controller, or persons performing similar functions, regardless of whether these individuals are employed by the Registrant or a third party.
(b) During the period covered by this report, there were no amendments to any provision of the code of ethics.
(c) During the period covered by the report, with respect to the registrant’s code of ethics that applies to its Principal Executive Officer and Principal Financial Officer: there have been no amendments to a provision that relates to any element of the code of ethics definition enumerated in paragraph (b) of this Item 2.
| Item 3. | Audit Committee Financial Expert. |
3(a) The registrant’s board of trustees has determined that the registrant does not have an audit committee financial expert. The audit committee determined that, although none of its members meet the technical definition of an audit committee financial expert, the committee has sufficient financial expertise to adequately perform its duties under the Audit Committee Charter without the addition of a qualified expert.
| Item 4. | Principal Accountant Fees and Services. |
(a) Audit Fees. The aggregate fees billed for each of the last two fiscal years for professional services rendered by the registrant's principal accountant for the audit of the registrant's annual financial statements or services that are normally provided by the accountant in connection with statutory and regulatory filings or engagements for those fiscal years are as follows:
Fiscal year ended 2022: $111,500
Fiscal year ended 2021: $106,000
(b) Audit-Related Fees. There were no fees billed in each of the last two fiscal years for assurances and related services by the principal accountant that are reasonably related to the performance of the audit of the registrant’s financial statements and are not reported under paragraph (a) of this item.
Fiscal year ended 2022: $0
Fiscal year ended 2021: $0
(c) Tax Fees. The aggregate fees billed in each of the last two fiscal years for professional services rendered by the principal accountant for tax compliance are as follows:
Fiscal year ended 2022: $20,800
Fiscal year ended 2021: $20,800
(d) All other fees billed to the registrant by its principal accountants for the two most recent fiscal years:
Fiscal year ended 2022: $0
Fiscal year ended 2021: $0
(e)(1) The audit committee does not have pre-approval policies and procedures. Instead, the audit committee or audit committee chairman approves on a case-by-case basis each audit or non-audit service before the principal accountant is engaged by the Registrant.
(e)(2) There were no services described in each of paragraphs (b) through (d) of this Item that were approved by the audit committee pursuant to paragraph (c)(7)(i)(C) of Rule 2-01 of Regulation S-X. |
| (f) Not applicable. The percentage of hours expended on the principal accountant's engagement to audit the Registrant's financial statements for the most recent fiscal year that were attributed to work performed by persons other than the principal accountant's full-time, permanent employees was zero percent (0%). |
(g) All non-audit fees billed by the Registrant's principal accountant for services rendered to the Registrant for the fiscal years ended June 30, 2016 and 2015, respectively, are disclosed in (b)-(d) above. There were no audit or non-audit services performed by the Registrant's principal accountant for the Registrant's adviser.
Item 5. | Audit Committee of Listed Registrants.
|
Not applicable.
| Item 6. | Schedule of Investments. |
Included in annual report to shareholders filed under item 1 of this form.
| Item 7. | Disclosure of Proxy Voting Policies and Procedures for Closed-End Management Investment Companies. |
Not applicable.
| Item 8. | Portfolio Managers of Closed-End Management Investment Companies. |
Not applicable.
| Item 9. | Purchases of Equity Securities by Closed-End Management Investment Company and Affiliated Purchasers. |
Not applicable.
| Item 10. | Submission of Matters to a Vote of Security Holders. |
Not applicable.
| Item 11. | Controls and Procedures. |
(a) The registrant’s Principal Executive Officer and Principal Financial Officer, or persons performing similar functions, have concluded that the registrant’s disclosure controls and procedures (as defined in Rule 30a-3(c) under the Act) are effective in design and operation and are sufficient to form the basis of the certifications required by Rule 30a-2 under the Act, based on their evaluation of these disclosure controls and procedures within 90 days of the filing of this report on Form N-CSR.
(b) There were no changes in the registrant’s internal control over financial reporting (as defined in Rule 30a-3(d) under the Act (17 CFR 270.30a-3(d)) that occurred during the second fiscal quarter of the period covered by this report that have materially affected or are reasonably likely to materially affect, the registrant’s internal control over financial reporting.
Item 12. Disclosure of Securities Lending Activities for Closed-Ended Management Investment Companies
Not applicable.
(a)(1) Code of Ethics filed herewith.
(a)(2) Certifications required by Section 302 of the Sarbanes-Oxley Act of 2002 (and Item 11(a)(2) of Form N-CSR) are filed herewith.
(a)(3) Not applicable for open-end investment companies.
(b) Certifications required by Section 906 of the Sarbanes-Oxley Act of 2002 (and Item 11(b) of Form N-CSR) are filed herewith.
SIGNATURES
Pursuant to the requirements of the Securities Exchange Act of 1934 and the Investment Company Act of 1940, the registrant has duly caused this report to be signed on its behalf by the undersigned, thereunto duly authorized.
(Registrant) Mutual Fund and Variable Insurance Trust
| | | |
| By (Signature and Title) | | /s/ Michael Schoonover |
| | | Michael Schoonover, President and Principal Executive Officer |
| | | | |
| Date | | 3/7/23 | |
| | | | | | |
Pursuant to the requirements of the Securities Exchange Act of 1934 and the Investment Company Act of 1940, this report has been signed below by the following persons on behalf of the registrant and in the capacities and on the dates indicated.
| | | |
| By (Signature and Title) | | /s/ Michael Schoonover |
| | | Michael Schoonover, President and Principal Executive Officer |
| | | |
| By (Signature and Title) | | /s/ Erik Naviloff |
| | | Erik Naviloff, Treasurer and Principal Financial Officer |
| | | | |
| Date | | 3/7/23 | |
| | | | | | |